production of heavy-media-quality …etd.lib.metu.edu.tr/upload/12611830/index.pdf · figure 3.1...
TRANSCRIPT

i
PRODUCTION OF HEAVY-MEDIA-QUALITY MAGNETITE
CONCENTRATE FROM KESĐKKÖPRÜ IRON ORE TAILINGS
A THESIS SUBMITTED TO THE GRADUATE SCHOOL OF NATURAL AND APPLIED SCIENCES
OF MIDDLE EAST TECHNICAL UNIVERSITY
BY
KAZIM GÜNGÖR
IN PARTIAL FULFILLMENT OF THE REQUIREMENTS FOR
THE DEGREE OF MASTER OF SCIENCE IN
MINING ENGINEERING
MAY 2010

ii
Approval of the thesis:
PRODUCTION OF HEAVY-MEDIA-QUALITY MAGNETITE
CONCENTRATE FROM KESĐKKÖPRÜ IRON ORE TAILINGS
Submitted by KAZIM GÜNGÖR in partial fulfillment of the requirements for the degree of Master of Science in Mining Engineering Department, Middle East Technical University by,
Prof. Dr. Canan Özgen Dean, Graduate School of Natural and Applied Sciences Prof. Dr. Ali Đhsan Arol Head of Department, Mining Engineering Prof. Dr. M. Ümit Atalay Supervisor, Mining Engineering Department, METU Examining Committee Members Prof. Dr. Gülhan Özbayoğlu Atılım University Prof. Dr. M. Ümit Atalay Mining Engineering Dept., METU Prof. Dr. Ali Đhsan Arol Mining Engineering Dept., METU Prof. Dr. Çetin Hoşten Mining Engineering Dept., METU Prof. Dr. Özcan Gülsoy Mining Engineering Dept., HU
Date :

iii
I hereby declare that all information in this document has been obtained and presented in accordance with academic rules and ethical conduct. I also declare that, as required by these rules and conduct, I have fully cited and referenced all material and results that are not original to this work.
Name, Last Name : Kazım Güngör Signature :
iv
ABSTRACT
PRODUCTION OF HEAVY-MEDIA-QUALITY MAGNETITE
CONCENTRATE FROM KESĐKKÖPRÜ IRON ORE TAILINGS
Güngör, Kazım
M. Sc. Department of Mining Engineering
Supervisor: Prof. Dr. M. Ümit Atalay
May 2010, 91 pages
The aim of this research was to investigate the possibility of the production of a
magnetite concentrate which is suitable for preparation of heavy media from iron
ore tailings of Güncem Mining Company magnetic separation facility.
During the study, three different tailings named as low grade, medium grade and
high grade with 5.91 % Fe3O4, 19.06 % Fe3O4 and 37.06 % Fe3O4, respectively,
were used. Mineralogical analyses of test samples showed that magnetite and
hematite were the major ore minerals while pyrite and chalcopyrite were found in
trace amounts. Actimolite, tremolite, epidote, chlorite, quartz, calcite, and
dolomite were the gangue minerals. The effects of feed particle size and applied
magnetic field intensity on the Fe3O4 grade and recovery of concentrate were
examined throughout magnetic concentration tests. The highest grade magnetite
concentrate with 79.98% Fe3O4 content was obtained with 65.42% recovery from
100% -75 µm size feed at 1000 Gauss magnetic field intensity from high grade
tailing.
Key words : Magnetite, Magnetic separation, Heavy media
v
ÖZ
KESĐKKÖPRÜ DEMĐR CEVHERĐ ARTIKLARINDAN AĞIR ORTAM
KALĐTESĐNDE MANYETĐT KONSANTRESĐ ÜRETĐMĐ
Güngör, Kazım
Yüksek Lisans, Maden Mühendisliği Bölümü
Tez Yöneticisi: Prof. Dr. M. Ümit Atalay
Mayıs 2010, 91 sayfa
Bu araştırmada Güncem Madencilik Şirketine ait manyetik ayırma tesis
artıklarından ağır ortam hazırlamaya uygun manyetit konsantresi üretimi
amaçlanmıştır.
Çalışma sırasında düşük tenörlü, orta tenörlü ve yüksek tenörlü olarak adlandırılan
ve sırasıyla % 5.91 Fe3O4, %19.06 Fe3O4 ve %37.06 Fe3O4 içeren artık
numuneleri kullanılmıştır.
Deney örneklerinin minerolojik analizi, manyetit ve hematit’in esas cevher
mineralleri olduğunu, pirit ve kalkopirit’in az miktarda bulunduğunu, aktimolit,
tremolit, epidot, klorit, kuvars, kalsit ve dolomitin değersiz mineralleri
oluşturduğunu göstermiştir. Manyetik zenginleştirme testleri sırasında, besleme
tane boyu ve manyetik alan şiddetinin konsantrenin Fe3O4 tenörü ve verimi
üzerindeki etkileri araştırılmıştır. En yüksek tenörlü konsantre %79.98 Fe3O4
içeriği ve %65.42 verimle, yüksek tenörlü artığın %100’ünün 75 µm altına
öğütülüp 1000 Gauss’luk bir manyetik alandan geçirilmesiyle elde edilmiştir.
Anahtar Kelimeler : Manyetit, Manyetik ayırma, Ağır ortam

vi
To My Family

vii
ACKNOWLEDGEMENTS
I kindly would like to express my sincere thanks and appreciation to my
supervisor, Prof. Dr. Ümit Atalay for his supervision, guidance, criticism, advice,
support and encouragement throughout thesis study.
Research assistant Osman Sivrikaya is gratefully acknowledged for his comments
and help during the study.
Acknowledgement is also made to technician Aytekin Aslan for his help during
experimental part of the study.
Finally, I am deeply grateful to my family and my wife Nurdan Güngör for their
support.
viii
TABLE OF CONTENTS
ABSTRACT ............................................................................................................ iv
ÖZ ...................................................................................................................... v
DEDICATIONS ...................................................................................................... vi
ACKNOWLEDGEMENTS .................................................................................... vii
TABLE OF CONTENTS ....................................................................................... viii
LIST OF TABLES ................................................................................................... xi
LIST OF FIGURES ................................................................................................ xii
LIST OF SYMBOLS AND ABBREVIATIONS ..................................................... xv
CHAPTERS
1. INTRODUCTION ............................................................................................ 1
1.1 General Remarks........................................................................................ 1
1.2 Objective of the Thesis............................................................................... 5
2. LITERATURE REVIEW ................................................................................. 6
2.1 Dense Medium Separation ......................................................................... 6
2.1.1 History of Dense Medium Separation ................................................. 7
2.1.2 Types of Dense Medium ..................................................................... 7
2.1.3 Standards for Magnetite Heavy Media .............................................. 10
2.1.4 Heavy Medium Separators (Dense Medium Separators) ................... 14
2.1.4.1 Gravitational Type Heavy Medium Separators .......................... 14
2.1.4.1.1 Drum Separators ................................................................ 15

ix
2.1.4.1.2 Drewboy Separators........................................................... 16
2.1.4.1.3 Cone Separators ................................................................. 17
2.1.4.1.4 Norwalt Separators ............................................................ 18
2.1.4.2 Centrifugal Type Heavy Medium Separators ............................. 18
2.1.4.2.1 DSM Cyclones .................................................................. 19
2.1.4.2.2 Vorsyl Separators .............................................................. 19
2.1.4.2.3 Larcodems Separators ........................................................ 20
2.1.4.2.4 Dyna Whirlpool Separator ................................................. 21
2.1.4.2.5 Tri-flo Separator ................................................................ 22
2.1.4.2.6 Water-only Cyclone ........................................................... 23
2.1.5 Heavy Medium Regeneration Circuit ................................................ 24
2.1.6 Magnetite Consumption .................................................................... 25
2.2 Mineralogical Properties and Uses of Magnetite ....................................... 26
2.2.1 Iron Ore Deposits of Turkey ............................................................. 26
2.3 Concentration of Magnetite with Low Intensity Magnetic Separator ........ 29
3. MATERIAL AND METHODS ...................................................................... 35
3.1 Materials .................................................................................................. 35
3.1.1 Characterization of Samples ............................................................. 35
3.1.2 Chemical Characterization of Samples .............................................. 43
3.2. Methods .................................................................................................. 45
4. RESULTS AND DISCUSSION ..................................................................... 47
4.1 Concentration Studies of Low Grade Tailing ............................................ 47
4.2 Concentration Studies of Medium Grade Tailing ...................................... 53
4.3 Concentration Studies of High Grade Tailing ........................................... 59

x
4.3.1 Regrinding of Rougher Concentrate .................................................. 65
5. CONCLUSION .............................................................................................. 68
REFERENCES ....................................................................................................... 70
APPENDICES
A. TABLES FOR LOW GRADE TAILINGS .................................................... 74
B. TABLES FOR MEDIUM GRADE TAILINGS ............................................. 80
C. TABLES FOR HIGH GRADE TAILINGS .................................................... 86

xi
LIST OF TABLES
TABLES
Table 1.1 Partial list of HMS processing plants (Bhappu and Highttower, 2003). ...... 2
Table 1.2 Examples of coal cleaning plants with HMS process (Arslan, 2010) .......... 4
Table 2.1 Heavy liquids used in laboratories ............................................................. 8
Table 2.2 Coal-cleaning dense-medium magnetite specifications (Osborne, 1988) .. 12
Table 2.3 Methods used in the determination of the physical properties of
magnetite (Osborne, 1988) .............................................................................. 14
Table 2.4 The minable iron ore deposits of Turkey (Yıldız, 2009). .......................... 28
Table 2.5 Kesikköprü region iron ore deposits* ...................................................... 29
Table 2.6 Magnetic intensities for recovery of minerals (Wills, 1977) ..................... 30
Table 2.7 Relative magnetic attractability of some minerals (Taggart, 1954) ........... 31
Table 3.1 Chemical analyses of low, medium and high grade tailings. .................... 43
Table 3.2 Size distribution, Fe3O4 and Fe analysis for low grade tailing .................. 43
Table 3.3 Size distribution, Fe3O4 and Fe analysis for medium grade tailing ........... 44
Table 3.4 Size distribution, Fe3O4 and Fe analysis for high grade tailing ................. 44
Table 3.5 Induced magnetic field intensities versus applied electrical currents ........ 46
Table 4.1 Chemical analysis of the final clean concentrate. ..................................... 65

xii
LIST OF FIGURES
FIGURES
Figure 2.1 (a) Single compartment drum separator (b) Two compartment drum
separator (Wills,1985) .......................................................................... 16
Figure 2.2 Drewboy separator (Wills, 1985) ............................................................ 17
Figure 2.3 Cone separator ....................................................................................... 17
Figure 2.4 Norwalt separator (Wills, 1985) ............................................................. 18
Figure 2.5 DSM Cyclone (Wills, 1985) ................................................................... 19
Figure 2.6 Vorsyl separator (Wills, 1985) ............................................................... 20
Figure 2.7 Larcodems separator (Wills, 1985) ......................................................... 21
Figure 2.8 Dyna Whirlpool separator (Wills, 1985) ................................................. 22
Figure 2.9 Tri-flo separator (Wills, 1985) ................................................................ 23
Figure 2.10 Water-only cyclone (www.flsmidthminerals.com) ................................ 24
Figure 2.11 HMS circuit with regeneration unit (Wills, 1985) ................................. 25
Figure 2.12 Iron ore deposits of Turkey (Yıldız, 2009) ............................................ 27
Figure 2.13 Low intensity dry drum type magnetic separator (Svoboda, 1987) ........ 32
Figure 2.14 Concurrent magnetic separator (Svoboda, 1987) .................................. 33
Figure 2.15 Counter-rotation magnetic separator (Svoboda, 1987) .......................... 33
Figure 2.16 Counter-current magnetic separator (Svoboda, 1987) ........................... 34
Figure 3.1 Satmagan (saturation magnetic analyzer) ............................................... 36
Figure 3.2 Interlocked magnetite (M) crystals turned to the hematite (H) along
their margins. Gangue (G) minerals are actinolite-tremolite. ................. 37
Figure 3.3 Magnetite (M) crystals are observed as disseminations in the gangue
(G) minerals of actionolite-tremolite and epidotes. ............................... 37
Figure 3.4 Pyrite (P) and chalcopyrite (C) are infilling the fractures of magnetite
(M) Gangue (G) minerals are composed of actinolite-tremolite,
epidote and chlorite............................................................................... 38
Figure 3.5 Fine grained magnetite (M) is disseminated in the gangue (G) minerals
and seen locally as martite; in other words, turned to hematite (H). ....... 38

xiii
Figure 3.6 Magnetite (M) is intensively altered to martite (H: turned to hematite)
Gangue minerals calcite and quartz. ...................................................... 39
Figure 3.7 Magnetite (M) has cataclastic texture. Interlocked magnetite crystals
are intensively martized (H). Gangue (G) minerals are calcite and
quartz. .................................................................................................. 39
Figure 3.8 Pyrite (P) is observed in the fracture of martized magnetite (H). ............ 40
Figure 3.9 The crystals of euhedral and interlocked magnetite (M) are intensively
altered to martite (H). Gangue (G) minerals are quartz and calcite. ....... 40
Figure 3.10 XRD pattern of high grade tailing ........................................................ 41
Figure 3.11 XRD pattern of medium grade tailing ................................................... 42
Figure 3.12 XRD pattern of low grade tailing.......................................................... 42
Figure 3.13 Laboratory type Davis tube magnetic concentrator ............................... 45
Figure 4.1 Results of the magnetic concentration test for -1000 micron material
(App. A, Table A.1) .............................................................................. 48
Figure 4.2 Results of the magnetic concentration test for -833 micron material
(App. A, Table A.2) .............................................................................. 48
Figure 4.3 Results of the magnetic concentration test for -500 micron material
(App. A, Table A.3) .............................................................................. 49
Figure 4.4 Results of the magnetic concentration test for -250 micron material
(App. A, Table A.4) .............................................................................. 49
Figure 4.5 Results of the magnetic concentration test for -106 micron material
(App. A, Table A.5) .............................................................................. 50
Figure 4.6 Results of the magnetic concentration test for -75 micron material
(App. A, Table A.6) .............................................................................. 50
Figure 4.7 Recovery of Fe3O4% versus magnetic field intensity for low grade
tailing ................................................................................................... 51
Figure 4.8 Grade of Fe3O4% versus magnetic field intensity for low grade tailing .. 51
Figure 4.9 Results of the magnetic concentration test for -1000 micron material
(App. B, Table B.1) .............................................................................. 54
Figure 4.10 Results of the magnetic concentration test for -833 micron material
(App. B, Table B.2) .............................................................................. 54

xiv
Figure 4.11 Results of the magnetic concentration test for -500 micron material
(App. B, Table B.3) .............................................................................. 55
Figure 4.12 Results of the magnetic concentration test for -250 micron material
(App. B, Table B.4) .............................................................................. 55
Figure 4.13 Results of the magnetic concentration test for -106 micron material
(App. B, Table B.5) .............................................................................. 56
Figure 4.14 Results of the magnetic concentration test for -75 micron material
(App. B, Table B.6) .............................................................................. 56
Figure 4.15 Recovery of Fe3O4% versus magnetic field intensity for medium
grade tailing .......................................................................................... 57
Figure 4.16 Grade of Fe3O4% versus magnetic field intensity for medium grade
tailing ................................................................................................... 57
Figure 4.17 Results of the magnetic concentration test for -1000 micron material
(App. C, Table C.1) .............................................................................. 59
Figure 4.18 Results of the magnetic concentration test for -833 micron material
(App. C, Table C.2) .............................................................................. 60
Figure 4.19 Results of the magnetic concentration test for -500 micron material
(App. C, Table C.3) .............................................................................. 60
Figure 4.20 Results of the magnetic concentration test for -250 micron material
(App. C, Table C.4) .............................................................................. 61
Figure 4.21 Results of the magnetic concentration test for -106 micron material
(App. C, Table C.5) .............................................................................. 61
Figure 4.22 Results of the magnetic concentration test for -75 micron material
(App. C, Table C.6) .............................................................................. 62
Figure 4.23 Recovery of Fe3O4% versus magnetic field intensity for high grade
tailing ................................................................................................... 62
Figure 4.24 Grade of Fe3O4% versus magnetic field intensity for high grade
tailing ................................................................................................... 63
Figure 4.25 Low intensity wet magnetic drum separator. ......................................... 64
Figure 4.26 Flowsheet followed during the cleaning of magnetite preconcentrate ... 67
xv
LIST OF SYMBOLS AND ABBREVIATIONS
Abbreviations Description
HMS Heavy Medium Separation
DMS Dense Medium Separation
Units Description
cm Centimeter
mm Millimeter
µm Micrometer
g Gram
kg Kilogram
g/cm3 Gram/Cubic centimeter
Symbols Description
Σ Cumulative

1
CHAPTER 1
INTRODUCTION
1.1. General Remarks
Dense medium separation (DMS) process, also referred to as heavy medium
separation (HMS), is one of the most widely applied and efficient gravity
concentration method for demineralization (removal of ash forming minerals) of
coal and preconcentration of large variety of minerals. According to a survey
(Kempnich, 2003), nearly 55% of the cleaned coal in preparation plants
worldwide is treated in DMS units. Dense medium circuits presently account for
approximately 65% of the installed capacity in the United States (Luttrel et al.,
2003) and is responsible for the production of nearly 250 million tons of clean
coal from the 413 million tons processed coal annually (Honaker and Patwardhan,
2006). The partial list of commercial applications of the HMS concept for
processing industrial minerals over the last 25 years is listed in Table 1.1 (Bhappu
and Highttower, 2003).

2
Table 1.1 Partial list of HMS processing plants (Bhappu and Highttower, 2003).
The HMS process is one of the cheapest methods of mineral preconcentration, due
to its simplicity of operation and equipment. Preconcentration is carried out at a
fairly coarse size without grinding which is the most expensive step in the
concentration operation. In the heavy medium separation process, the separation
of coal from ash forming minerals or the separation of dense valuable minerals
from light gangue minerals is achieved by preparing a medium having a density
between the solid densities of the two products being separated. The medium is
formed by suspending fine dense particles in a medium of water. The most widely
used materials to prepare suspension in commercial application for metaliferrous
ore is now ferrosilicon, while magnetite is used in cleaning of coal.
3
Turkey has lignite reserve over 10.4 billion tons with low calorific value and high
ash content. Important portion of coal to be used for industrial and heating
purposes need cleaning process to minimize environmental problems of
combustion of low quality coals. The number of coal cleaning plants with heavy
medium circuits has increased significantly in recent years. Important coal
cleaning plants of Turkey with heavy medium circuits are tabulated in Table 1.2.
The growing demand for magnetite coupled with a decrease in the availability of
high grade magnetite ores makes it necessary to develop the technology needed
for recovering magnetite from tailings. As a result, magnetite presently used for
heavy medium is a product of existing iron ore mine. By utilizing low intensity
magnetic separation in combination with selective flocculation, a concentrate with
67.6% Fe and 87.1% Fe3O4 was obtained from fine tailings of Divriği
Concentrator with 70.7% recovery (Başaran, 1988). Concentration possibilities of
C-Placer and B-Body ores fines from Divriği iron mines was studied by Akdoğan
in 1987. By using the combination of jigging and shaking table concentration
methods, concentrates containing 64.4% Fe and 62.4% Fe were obtained with
81.3% and 77% recovery from C-Placer and B-Body ore fines, respectively.

4
Table 1.2 Examples of coal cleaning plants with HMS process (Arslan, 2010)
Plant Name Capacity (tph)
Coarse Circuits Fine Circuits
Çiftay Mining Co.(Soma) 800 Drum separator Dense medium cyclone
TKĐ (Tuçbilek) 700 Drum separator Dense medium cyclone
TKĐ (Tuçbilek-Ömerler) 600 Drum separator Dense medium cyclone
Đmbat Mining Co. (Soma) 500 Drewboy Dense medium cyclone
Soma Coal Mining Co. (Soma) 350 Drewboy+Drum Dense medium cyclone
Park Teknik Co. (Çayırhan) 300 Drewboy Dense medium cyclone
Park Teknik Co. (Seyitömer) 300 Drewboy Dense medium cyclone
Park Mining Co. (Kozlu-Zonguldak) 300 Drewboy Dense medium cyclone
Park Mining Co. (Üzülmez-Zonguldak) 300 Drewboy Dense medium cyclone
TKĐ (Yeniköy-Muğla) 220 Drum separator Dense medium cyclone
Amasra 210 Drum separator Dense medium cyclone
De-Ka Mining Co. (Zonguldak) 200 Drewboy Dense medium cyclone
Çelikler Mining Co. (Çorum) 175 Drewboy Dense medium cyclone
Eski Çeltek Mining Co. (Suluova) 175 Drewboy Dense medium cyclone
Uysal Mining Co. (Tekirdağ) 175 Drewboy Dense medium cyclone
Zirve Mining Co. (Zonguldak) 175 Drewboy Dense medium cyclone
Ortur Mining Co. (Balıkesir) 150 Drum separator Dense medium cyclone
Hema Coal Mining Co. (Kandilli) 150 Drewboy Dense medium cyclone
Milten Mining Co. (Đstanbul) 150 Drewboy Dense medium cyclone
Polat Mining Co. (Balıkesir) 125 Drum separator Dense medium cyclone
Özerdemler Mining Co. (Kütahya) 120 Drum separator Dense medium cyclone
Kartalkaya Mining Co. (Azdavay) 120 Drewboy Dense medium cyclone
Eli Deniş Washery 100 Drewboy Dense medium cyclone
Özçevreci Mining Co. (Balıkesir) 100 Drum separator Dense medium cyclone
Enerji Mining Co. (Kepsut) 100 Drum separator Dense medium cyclone
De-Ka Mining Co. (Azdavay) 100 Drewboy Dense medium cyclone
Đbrice Mining Co. (Tekirdağ) 100 Drum separator Dense medium cyclone
TKĐ (Merdivenli-Muğla) 100 Drum separator Dense medium cyclone
Çelikler Mining Co. (Dodurga) 75 Drewboy Dense medium cyclone
Forbes Mining Co. 75 Drewboy Dense medium cyclone
Volkar Energy Co. (Tekirdağ) 75 Drewboy Dense medium cyclone
Arılar Mining Co. (Zonguldak) 60 Drewboy Dense medium cyclone
Bahadır Mining Co. (Zonguldak) 60 Drewboy Dense medium cyclone
Yılmazlar Coal Mining Co. (Zonguldak) 60 Drewboy Dense medium cyclone
Tuncerler Mining Co. 50 Drum separator Dense medium cyclone
Yeni Çeltek Coal Co. (Merzifon) 50 Drum separator Dense medium cyclone

5
1.2. Objective of the Thesis
The objective of the thesis is to investigate the possibility of magnetite recovery
from the iron ore tailings with the final intention of using it in heavy media
separation. Three iron ore tailing samples having different Fe3O4 content were
selected and concentration tests were performed with Davis tube magnetic
separator. The effect of particle size and induced magnetic field intensity were
investigated with regard to Fe3O4 grade and recovery of the magnetite
concentrate.

6
CHAPTER 2
LITERATURE REVIEW
2.1 Dense Medium Separation
Dense medium separation (DMS) or heavy medium separation (HMS) is the most
widely applied gravity concentration process for coal preparation. In the process,
the separation of coal from the ash forming mineral matter is achieved by
preparing a medium having a density between the densities of the two materials
being separated. As a result, the coal particles float while the heavier mineral
matter sinks through the medium. The most relevant advantages of dense medium
separation process are as follows (Bhappu and Higttower, 2003, Wills, 1997,
Palowitch and Deurbrouck, 1968).
� DMS has the ability to make sharp separations at any required density.
� It has high efficiency in the presence of high amount of near gravity
material
� The density of separation can be closely controlled
� The separating density can be changed very quickly to meet the varying
conditions
� Ability to handle a wide range of sizes
� Relatively low capital and operating costs when considered in terms of
high capacity and small space requirement
7
2.1.1 History of Dense Medium Separation
Historical information was summarized in the following sentences (Pryor, 1974.,
Palowitch and Deurbrouck, 1968, Erten, 1964). Henry Bessemer was the first
person to patent the use of solutions of the chlorides of iron, manganese, barium
and calcium. In 1911 Du Pont developed the use of chlorinated hydrocarbons to
obtain high densities. The first important success was achieved by the Chance
process patented in 1917, using a mixture of sand and water. The first plant was
erected in 1921 for cleaning anthracite. In 1925 the process was used for cleaning
bituminous coal. In 1928 Lessing re-developed the use of calcium-chloride
solution as a dense medium bath of 1.35 g/cm3 density. In 1931 clay, gypsum and
pyrite were used for preparation of heavy medium. In 1932 G.J. de Vooys
established a coal-cleaning process based on use of a barite-clay medium. In 1935,
the use of suspension of finely ground galena in water was investigated. This
method was successfully applied at the lead mine in Wales, England. The tromp
process, developed in 1938, was the first to employ magnetite medium
commercially. The “heavy media separation” process, originally developed for the
concentration of ore, was introduced by the American Cynamid Company for
cleaning of coal in about 1940. The process used magnetite as the medium.
Through the use of instrumentation and process controls, today highly automated
dense medium plants are capable of high throughput and result in a separation of
raw coal into clean coal.
2.1.2 Types of Dense Medium
Organic liquids, solutions of salts in water and suspensions of solids are the three
main types of dense media. Autogeneous media, provided by the coal itself is also
rarely used as heavy media in some heavy medium separators.
8
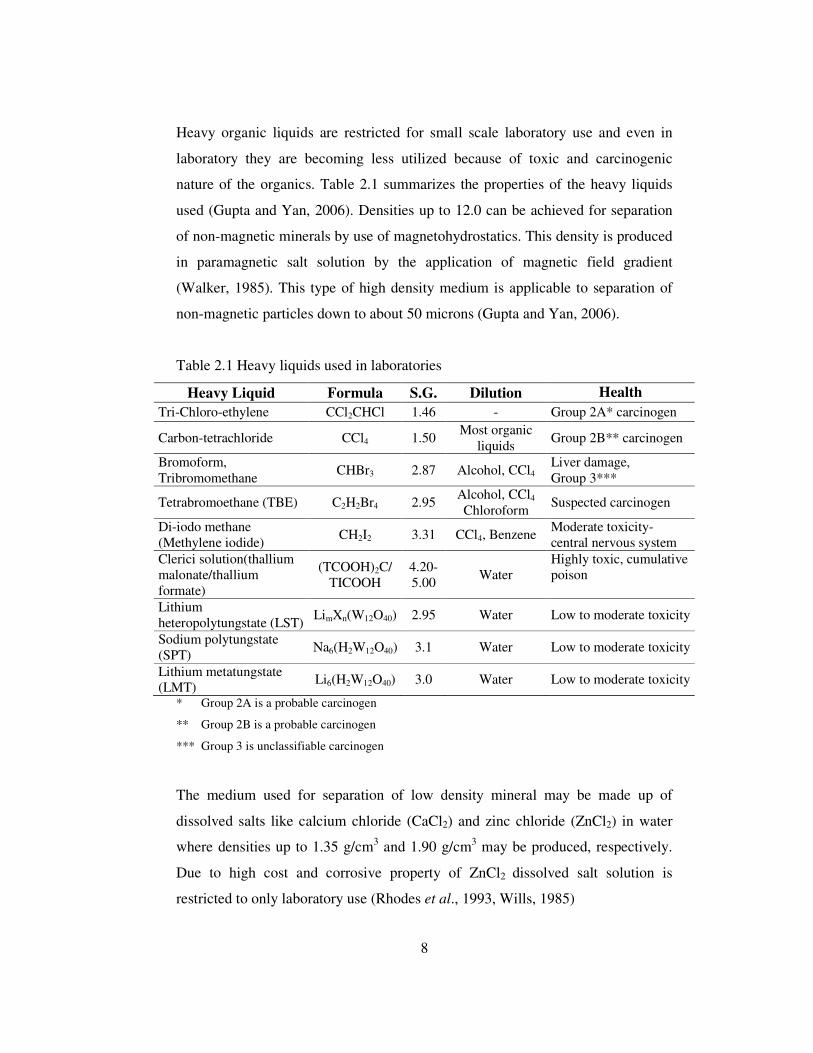
Heavy organic liquids are restricted for small scale laboratory use and even in
laboratory they are becoming less utilized because of toxic and carcinogenic
nature of the organics. Table 2.1 summarizes the properties of the heavy liquids
used (Gupta and Yan, 2006). Densities up to 12.0 can be achieved for separation
of non-magnetic minerals by use of magnetohydrostatics. This density is produced
in paramagnetic salt solution by the application of magnetic field gradient
(Walker, 1985). This type of high density medium is applicable to separation of
non-magnetic particles down to about 50 microns (Gupta and Yan, 2006).
Table 2.1 Heavy liquids used in laboratories
Heavy Liquid Formula S.G. Dilution Health Tri-Chloro-ethylene CCl2CHCl 1.46 - Group 2A* carcinogen
Carbon-tetrachloride CCl4 1.50 Most organic
liquids Group 2B** carcinogen
Bromoform, Tribromomethane
CHBr3 2.87 Alcohol, CCl4 Liver damage, Group 3***
Tetrabromoethane (TBE) C2H2Br4 2.95 Alcohol, CCl4
Chloroform Suspected carcinogen
Di-iodo methane (Methylene iodide)
CH2I2 3.31 CCl4, Benzene Moderate toxicity- central nervous system
Clerici solution(thallium malonate/thallium formate)
(TCOOH)2C/ TICOOH
4.20- 5.00
Water Highly toxic, cumulative poison
Lithium heteropolytungstate (LST)
LimXn(W12O40) 2.95 Water Low to moderate toxicity
Sodium polytungstate (SPT)
Na6(H2W12O40) 3.1 Water Low to moderate toxicity
Lithium metatungstate (LMT)
Li6(H2W12O40) 3.0 Water Low to moderate toxicity
*111Group 2A is a probable carcinogen
**11Group 2B is a probable carcinogen
***1Group 3 is unclassifiable carcinogen
The medium used for separation of low density mineral may be made up of
dissolved salts like calcium chloride (CaCl2) and zinc chloride (ZnCl2) in water
where densities up to 1.35 g/cm3 and 1.90 g/cm3 may be produced, respectively.
Due to high cost and corrosive property of ZnCl2 dissolved salt solution is
restricted to only laboratory use (Rhodes et al., 1993, Wills, 1985)

9
When high medium densities are required, the suspensions of finely divided high
density particles in water (pseudo liquids) are used. In the 1930’s the Barvoys
process was developed in Holland, which used a mixture of clay (specific gravity
2.3) and finely ground barites (specific gravity 4.2) in a ratio of 2:1 which gave a
density up to 1.8 g/cm3. Froth flotation was used to regenerate the fouled dense-
media by removing the fine coal. The process was abandoned owing to the high
regeneration cost with flotation. Galena (specific gravity 7.5) was also used
initially as medium. The high cost of cleaning of contaminated medium with
flotation, oxidizing and sliming tendency of galena which impairs the flotation
efficiency prevented the use of finely ground galena suspended in water. Studies
have been performed to evaluate the potential of alternative materials that can be
used to generate a dense medium for coal cleaning application. Waste steel slags,
fine sands, blast furnace flue dust and autogeneous reject material were tested.
Compared to other medium types, steel slag and blast furnace flue dust provided
the most stable suspensions (Honaker and Bimpong, 2009., Sripriya et al, 2003).
The most widely used medium for metalliferrous ores is now ferrosilicon, whilst
the magnetite is used for coal preparation.
Both magnetite and ferrosilicon have the following characteristics:
� They don’t have tendency to slime easily.
� They have chemical stability. They are not corrosive and they do not react
with minerals or coal.
� They show slow settling at reasonable viscosity. They form a fairly stable
suspension without having to be ground very fine.
� They have high enough specific gravity to give the required bath density at
low % solids.
� They are easily removed from the mineral surfaces or coal surfaces by
washing.
10
� They are easily regenerated from the contaminated medium by magnetic
separation.
Ferrosilicon which meets the above specifications (specific gravity 6.7 – 6.9) is an
alloy of iron and silicon. It’s iron content should be greater than 82% while silicon
is in the range of 15 – 16%. If ferrosilicon contains more than 16% Si in it, its
magnetic susceptibility will decrease and its regeneration with magnetic
separation will become difficult, less than 15% silicon will cause corrosion of
ferrosilicon alloys. At 15% silicon, the density of ferrosilicon is 6.8 gr/cm3 and a
medium of 3.2 gr/cm3 can be prepared. Magnetite which is the most widely used
medium for coal cleaning will be examined in more details in the following
section.
2.1.3 Standards for Magnetite Heavy Media
Separation efficiency of heavy medium process depends upon the rheology and
stability of magnetite media. This is more important for the dense medium
cyclone which gives a sharper separation than the other types of coal washing
equipment. The flow behavior in dense medium cyclone is quite complex. There
is an extensive literature on particle separation for dense medium cyclones.
A detailed in-plant evaluation of the dense medium process employed in an
operating dense medium cyclone was conducted to determine the relationship
between apparent separation density and the medium density and to quantify the
process efficiency. The separation density was found to be about 0.08 to 0.03 RD
(relative density) greater than the medium density range of 1.35 to 1.50 RD. 300%
decrease in separation efficiency was observed as a result of increasing medium
density over the same range. The Ep values increased from about 0.02 to 0.06.
The decline in efficiency was a result of increase in the recovery of particles
having density slightly greater than the separation density to the clean coal
product (Honaker and Patwardhan, 2006).

11
A mathematical approach was proposed to describe the flow in an industrial dense
medium cyclone. It is found that as the medium density increases, the pressure
drop increases, resulting in a high pressure gradient force on coal particles and
reduced separating efficiencies. The segregation of magnetite particles becomes
serious as magnetite particle size increases (Wang et al., 2009).
A complete mass balance of magnetite and coal in various parts of a dense
medium cyclone (DMC) circuit was determined and fractional size distribution of
magnetite and coal were analyzed for the circuit. The DMC overflow product
contained 71.34% of feed coal, whereas 88.35% of the feed magnetite was
reported to DMC underflow (Çelik, 2009).
An attempt has been made to study the magnetite medium stability behavior
inside the heavy medium cyclone (HMC) and Vorsyl separator (VS). It is found
that, at any operating condition, the difference between the underflow and
overflow slurry density is always less in VS than HMC. This signifies that
magnetite medium is more stable in VS than in HMC (Majumder et al., 2006)
The effect of size distribution of the magnetite in HMC has been fully studied.
The ultra-fine magnetite sizes (2 – 7 microns) are distributed uniformly
throughout the cyclone. As the size of magnetite increases, more segregations of
magnetite occur close to the wall. By using X-Ray tomography highest-slurry
density was detected in apex region (Narasimha et al, 2007).
An extensive separation test was carried out on a 6-inch dense medium cyclone by
changing the magnetic particle size and medium density. It was found that, while
the separation efficiency and cut point shift for coarse particles (>2.0 mm) were
mainly determined by the medium stability, the separation performance of fine
particles (<0.5 mm) was more sensitive to the change in medium rheology (He
and Laskowski, 1994).

12
Physical properties used to specify the quality and suitability of a particular source
of magnetite must be assessable by standard techniques. Several countries have
been actively involved in establishing magnetite specifications for heavy medium
applications (Mikhail and Osborne, 1990., Osborne, 1988).
The general specifications for magnetite based on the British coal mining
industry:
a) Particle size distribution : Maximum 5% by weight larger than 45 µm
and 30% by weight smaller than 10 µm
b) Relative density : 4.9 – 5.2 g/cm3
c) Magnetite content : not less than 95% by weight
Table 2.2 gives working specifications of magnetite for worldwide usage
(Osborne, 1988)
Table 2.2 Coal-cleaning dense-medium magnetite specifications (Osborne, 1988)
Country Moisture
content (%) Size
(microns) Magnetics
content (%) Relative density
g/cm3 Canada <10 <5%, +45 >95 >4.8
United States <10 <5%, +45 >95 >4.8
South Africa <10 <5%, +45
<30%, -10 >95 4.9 – 5.2
Australia <10 <5%, +45
<30%, -10 >95 >4.8

13
On the other hand General Directorate of Turkish Coal Works accepted the
following specifications for magnetite concentrate :
a) Particle size distribution : 95% (min) -45 µm, and 5%(max) + 45 µm
b) Iron content : 60 – 67 % Fe
c) Magnetite content : 90% Fe3O4
d) Density : 4.1 – 4.9 g/cm3
e) Moisture Content : 7 – 12 %
Industrial experience and practices by several coal producing countries have been
used to develop standard procedures to test magnetite for coal preparation
purposes. The international standard ISO 8813 specifies the following properties
for testing :
a) Moisture content
b) Particle size distribution
c) Magnetic content
d) Relative density
Physical properties used to specify the quality and suitability of a particular source
of magnetite must be assessable by standard techniques. Several recognized
procedures and equipment are used in the determination of physical properties of
magnetite. These are summarized in Table 2.3.

14
Table 2.3 Methods used in the determination of the physical properties of
magnetite (Osborne, 1988)
Property Method or equipment
Limitations
Particle size
Dry screening Wet screening Cyclosizer Coulter method Sedigraph or other sedimentation analyser Bahco or Haultain: pneumatic classification Microtrac or other microscopic methods Optical sizing
Valid only above 53 µm Many variables introduced Time consuming; only limited points obtained Sensitive to auto-coagulating properties High density of particles causes rapid settling Time consuming; potential high loss of very fine material Irregular shapes may introduce bias Sophisticated equipment needed
Magnetic content
Davis tube ISO apparatus Magnetic chute Hand magnet
Many variables Simple method with good reproducibility Variable magnetic field Accuracy depends on operator; only approximate
Density Beckman pycnometer Density bottle
Slightly operator dependent Often difficult with fine powders
2.1.4 Heavy Medium Separators (Dense Medium Separators)
Heavy medium separators generally produce two products. A float product of
lower density and a sink product of higher density than the medium. In some
separators a third, middling product is also produced. Heavy medium separators
are classified into gravitational type heavy medium (bath or through) separators
and centrifugal type heavy medium separators.
2.1.4.1 Gravitational Type Heavy Medium Separators
The crushed ore or coal and dense medium are fed into the tank of trough of the
medium. The floating material overflows or is removed from the bath by scrapers
or paddles while the sink material which falls to the bottom of tank is removed by

15
some means. Since the coal separation has a very high float content in the feed,
the separator will need a high float capacity whereas separators for the mineral
industry may require a high sink capacity. Drum separator, Cone separator,
Drewboy and Norwalt separator are the examples of gravitational type heavy
medium separators.
2.1.4.1.1 Drum Separators
Consisting of a cylindrical rotating drum, they are used for mineral and coal
separation (Figure 2.1). The size of the drums ranges up to about 4.6 m diameter
and by 7.0 m length, with capacities up to 800 t/h. The drums may consist of a
single compartment, producing two products from a single dense medium
suspension or consist of two compartments with two baths of different density to
produce three of four products. Drum feed size ranges from 6 mm to 30 cm
(Wills, 1985).

16
Figure 2.1 (a) Single compartment drum separator
(b) Two compartment drum separator (Wills,1985)
2.1.4.1.2 Drewboy Separators
Drewboy separator is used widely for cleaning of coal (Figure 2.2). It has high
float capacity and handles a feed size from 12 mm to 600 mm at up to 820 t/h
capacity for 4 m diameter bath. The coal is fed into the separator at one end, and
floats are discharged from the opposite end while the sinks are lifted out from the
bottom of the bath by the vanes of a slowly revolving inclined wheel. (Wills,
1985)

17
Figure 2.2 Drewboy separator (Wills, 1985)
2.1.4.1.3 Cone Separators
Cone separators are widely used for ore concentration, and they have high sink
capacities (Figure 2.3). Cone separator with 6 m diameter has a capacity of up to
500 t/h for feed up to 10 cm size. The feed is introduced on to the surface of the
medium; the float fraction overflows the weir, whilst the sinks are removed by
pump or external or internal air lift. (Osborne, 1988.,Wills, 1985)
Figure 2.3 Cone separator

18
2.1.4.1.4 Norwalt Separators
Norwalt separator was developed in South Africa (Figure 2.4). Raw coal is
introduced centrally. The floats are carried round by the stirrers and are
discharged over the weir while the sinks are dragged along by scrapers attached to
the bottom of the stirring arms. (Wills, 1985)
Figure 2.4 Norwalt separator (Wills, 1985)
2.1.4.2 Centrifugal Type Heavy Medium Separators
Centrifugal type heavy medium separators are widely used in the treatment of ores
and coal. They provide a high centrifugal force and a low viscosity in the medium,
enabling a finer separation than in gravitational separators. DSM (Dutch State
Mine) cyclones, Vorsyl separator, Larcodems separator, Dyna Whirlpool
separator, Tri-flo separators and water-only cyclones are the widely used
centrifugal type heavy medium separators.

19
2.1.4.2.1 DSM Cyclones
DSM cyclones are used to treat ores and coals in the size range of 40 – 0.5 mm
(Figure 2.5). The feed is suspended in a very fine medium of magnetite of
ferrosilicon and is introduced tangentially to the cyclone under pressure. The sink
product leaves via apex nozzle while float product is discharged through vortex
finder. (Osborne, 1988., Wills, 1985)
Figure 2.5 DSM Cyclone (Wills, 1985)
2.1.4.2.2 Vorsyl Separators
Vorsyl separator is used for the cleaning of fine coal sizes up to 50 mm (Figure
2.6). The feed together with the medium is introduced tangentially at the
cylindrical separating chamber under pressure. Clean coal particles are discharged
from the vortex finder, while reject product moves to the wall of vessel and is
discharged from a second shallow chamber known as vortex tractor (Wills, 1985).

20
Figure 2.6 Vorsyl separator (Wills, 1985)
2.1.4.2.3 Larcodems Separators
Larcodems separator is used for treatment of coal up to 100 mm (Figure 2.7). It
consists of a cylindrical vessel at inclined position. Medium is introduced under
pressure at the lower end. Coal is fed into the separator at the top end. After
separation clean coal is discharged through the bottom outlet while reject
materials are removed through the outlet of the vortex tractor. The capacity of the
separator can be as high as 250 t/h (Osborne, 1988., Wills, 1985).

21
Figure 2.7 Larcodems separator (Wills, 1985)
2.1.4.2.4 Dyna Whirlpool Separator
Dyna Whirlpool separator consists of a cylindrical vessel at inclined position
(Figure 2.8). Medium is pumped under pressure from the lower inlet. Raw feed
enters the separation chamber from the upper vortex tube. The floats are
discharged from the lower vortex outlet tube while sinks are discharged through
the upper outlet. It is used for treatment of coal as well as minerals in the size
range 0.5 – 30 mm with capacities up to 100 t/h (Wills, 1985).
22
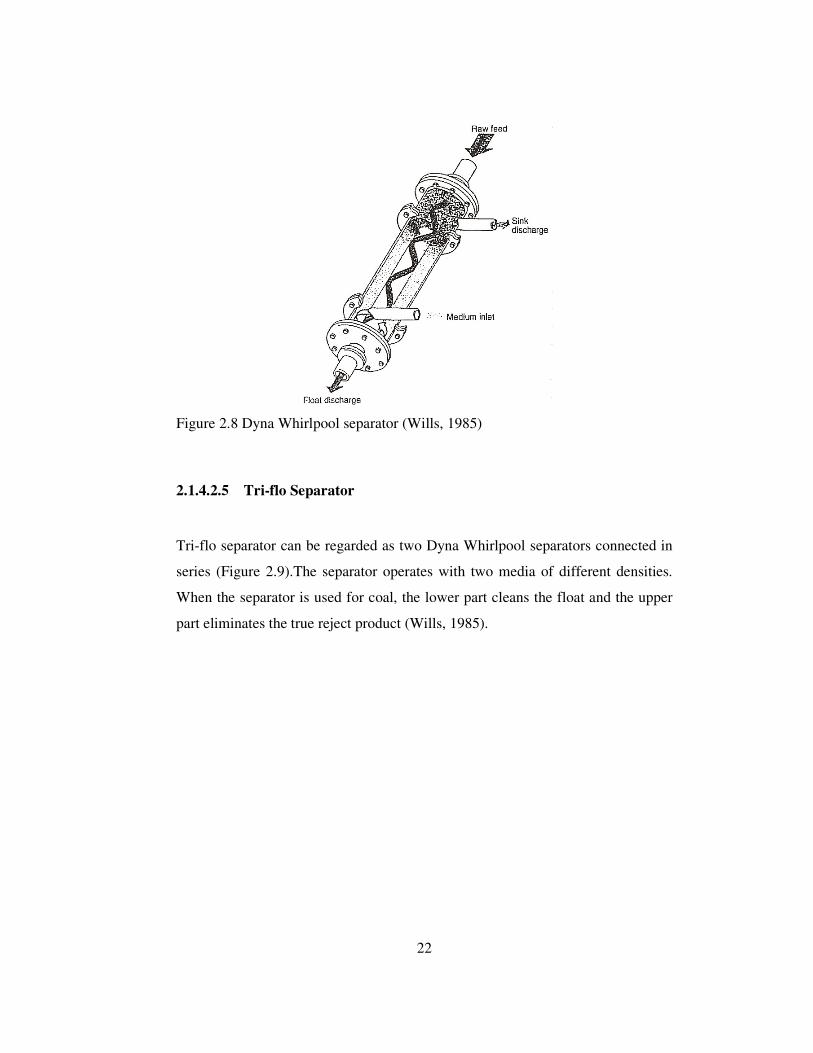
Figure 2.8 Dyna Whirlpool separator (Wills, 1985)
2.1.4.2.5 Tri-flo Separator
Tri-flo separator can be regarded as two Dyna Whirlpool separators connected in
series (Figure 2.9).The separator operates with two media of different densities.
When the separator is used for coal, the lower part cleans the float and the upper
part eliminates the true reject product (Wills, 1985).

23
Figure 2.9 Tri-flo separator (Wills, 1985)
2.1.4.2.6 Water-only Cyclone
The water-only cyclone is used in coal cleaning of the -0.6mm coal (Figure 2.10).
It does not need dense medium. Medium is developed from the coal feed. These
cyclones have a larger cone angle up to 120o and longer vortex finder.

24
Figure 2.10 Water-only cyclone (www.flsmidthminerals.com)
2.1.5 Heavy Medium Regeneration Circuit
The biggest portion of the operating cost of heavy medium separation process
comes from recovery and cleaning of the medium which leaves the separator with
sink and float products. A typical circuit for regeneration of medium is given in
Figure 2.11. More than 90% of the medium in the separator products is recovered
with drainage screens and is pumped directly to the medium sump of the
separator. The products then pass on to washing screens, where under washing
spray, complete medium and adhered fines removal is accomplished. The
undersize product of washing screens is treated in low intensity magnetic
separator to recover magnetic medium from non-magnetic fines. Cleaned medium
is then thickened to the required density by the densifier. The densified medium
passes through demagnetizing coil to prevent flocculation of magnetic particles
and to maintain suspension in the separator.

25
Figure 2.11 HMS circuit with regeneration unit (Wills, 1985)
2.1.6 Magnetite Consumption
The magnetite losses commonly encountered in modern plants will normally
range from 0.5 to 3.0 kg/ton, quoted in tones of feed to the dense medium section
of the plant (Osborne.1988, Mikhail and Osborne, 1990). The consumption of
magnetite is governed by several factors, of which the most important are;
a) The fineness of the magnetite
b) The fineness of the coal being treated
c) The efficiency of magnetic separator
d) The design of the magnetite regeneration circuit
e) Poor operation and maintenance
26
2.2 Mineralogical Properties and Uses of Magnetite
Magnetite (Fe3O4) is one of the most common oxide minerals and also one of the
most common iron minerals with 72.4% theoretical iron content. The formula of
magnetite may also be written as FeO.Fe2O3, which is one part wüstite (FeO) and
one part hematite (Fe2O3). It is black, opaque, submetallic to metallic mineral with
hardness between 5.5 and 6.5 (http://geology.com, Hurlbut, 1959).
It is the most widely found magnetic mineral in nature. Lodestone is a form of
magnetite that acts a natural magnet. Normally magnetite is attracted by a magnet
but lodestone acts as a magnet, attracting iron particles. Weathering of magnetite
to hematite with cubic crystalline shape results in a new mineral named martite.
Most of the magnetite mineral mined is used as an ore of iron. Iron extracted from
the ore is usually used to make steel. Powdered magnetite is often mixed with
water for use as heavy media. Some synthetic emery is produced by mixing
magnetite with aluminum oxides. Magnetite powder efficiently removes As (III)
and As (V) from water. Other uses of magnetite include: as a toner in
electrophotocopy, as a micronutrient in fertilizers, as a pigment in paints, as
ballast in elevators and washing machines and as an aggregate in high-density
concrete. The magnetite ore tailing can be used as materials for the preparation of
cementations material. The obtained cement has the mechanical properties
comparable with Portland cement (Chao et al., 2010).
2.2.1 Iron Ore Deposits of Turkey
Although the iron ore deposits of Turkey are distributed through the Anatolia,
region of Sivas, Malatya and Erzincan provinces have bigger ore reserves (Figure
2.12).

27
Figure 2.12 Iron ore deposits of Turkey (Yıldız, 2009)
Table 2.4 show the minable iron ore deposits with possible and proven ore
reserves as cited by Yıldız, 2009.

28
Table 2.4 The minable iron ore deposits of Turkey (Yıldız, 2009).
The test sample of this study belongs to the iron ore deposits of Kesikköprü,
Ankara. Regarding the origin of iron ore deposits of Kesikköprü area, there are
two different ideas (Wondemagegnehu, 1990): some workers argue that these
deposits originated from the nearby basic rocks which are subjected to a strong
leaching by hydrothermal fluids that originated from the magma while the others
say iron can be remobilized from any rock that has been traversed by the
hydrothermal fluids as it is a contact metasomatic ore. Table 2.5 show the list of
Kesikköprü region iron ore deposits with their proven, possible and probable ore
reserves.

29
Table 2.5 Kesikköprü region iron ore deposits*
Deposit Proven reserve
(ton)
Possible reserve
(ton)
Probable reserve
(ton)
Total reserve
(ton)
Average Fe grade
(%) Madentepe + Büyükocak 1.294.060 213.400 272.476 1.779.936 48 - 57 Maden geçidi 814.310 167.900 - 982.210 50 – 55 Yeni maden 1.065.511 153.253 - 1.218.764 45 – 55 Sulu ocak 160.264 53.652 - 213.916 48 – 55 Çataldere 134.568 11.546 - 146.132 30 – 50 Boyal in - 384.840 - 384.840 45 – 55 Other locations - 150.000 150.000 40 – 50 Total 3.468.713 1.134.591 272.476 4.875.798 * Source : Güncem Mining Company
The run of mined iron ore of Güncem Mining Company is first crushed and then
concentrated by low intensity magnetic separator and concentrate is sent to
Karabük Iron and Steel Works, where tailings of magnetic separator are stored in
different dumps regarding the grade of tailings.
2.3 Concentration of Magnetite with Low Intensity Magnetic Separator
Low intensity magnetic separators are used to treat ferromagnetic minerals like
magnetite and some highly paramagnetic minerals like maghemite, pyrrhoite,
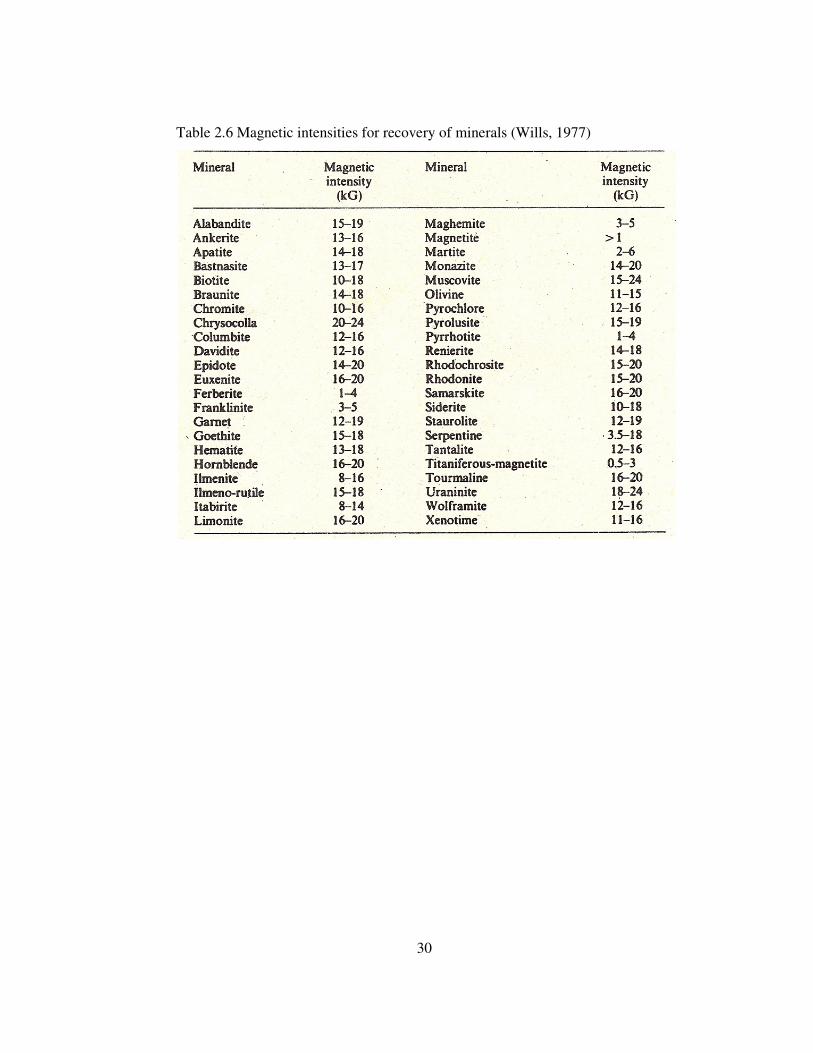
martite, and franklinite. Table 2.6 shows the range of magnetic intensity required
for the extraction of minerals while attractability of some minerals are tabulated in
Table 2.7
30
Table 2.6 Magnetic intensities for recovery of minerals (Wills, 1977)

31
Table 2.7 Relative magnetic attractability of some minerals (Taggart, 1954)
Substances Relative
attractability
Iron (taken as standard) Magnetite Franklinite Ilmenite Pyrhotite Siderite Hematite Zircon Limonite Corundum Pyrolusite Manganite Garnet Quartz Rutile Cerussite Pyrite Sphelarite Molibden Dolomite Talc Magnesite Chalcopyrite Gypsium Fluorite Galena Calcite
100.00 40.18 35.38 24.70 6.69 1.82 1.32 1.01 0.84 0.83 0.71 0.52 0.40 0.37 0.37 0.30 0.23 0.23 0.23 0.22 0.15 0.15 0.14 0.12 0.11 0.04 0.00
Depending on the feed size, low intensity magnetic separator may be used in dry
or wet conditions. Dry low intensity magnetic separation is confined mainly to the
concentration of coarse sands that are strongly magnetic, the process being known
as “cobbing”. Drum type dry low intensity separators are the most common
separators in current use (Figure 2.13).

32
Figure 2.13 Low intensity dry drum type magnetic separator (Svoboda, 1987)
Drum type low intensity wet magnetic separators are the most common separators
in current use for concentration of magnetite. Drum with non-magnetic shell
consists of three to seven fixed poles which alternate in polarity and which are
either electromagnets or permanent magnets. The design of the separator tank is
very important. There are three types based on the pulp flow, as follows :
a) Concurrent
b) Counter-rotation
c) Counter-current
The concurrent tank design is shown in Figure 2.14. The feed flow is in the
direction of drum rotation. Magnetic particles are picked up by the magnet and
non-magnetic particles are discharged at the bottom through the tailing discharge
opening. This design is most effective for producing an extremely clean magnetic
concentrate from relatively coarse particle size and is widely used in dense
medium regeneration systems.

33
Figure 2.14 Concurrent magnetic separator (Svoboda, 1987)
In counter-rotation design of the tank (Figure 2.15) the feed is introduced through
a special feed box to the drum which rotates in the opposite direction of pulp flow.
Magnetic particles are picked up by the drum and discharged almost immediately.
Very high recoveries can thus be achieved with this design.
Figure 2.15 Counter-rotation magnetic separator (Svoboda, 1987)

34
The counter-current tank shown in Figure 2.16, is mostly used for finishing where
very clean concentrate is required. The term “counter-current” derives from the
fact that the tailings must flow counter to the rotation of the drum when leaving
the separator. Magnetic particles are picked up by the drum and agitated as they
are carried through wash water jets. Tailings flow from the opposite end of the
tank.
Figure 2.16 Counter-current magnetic separator (Svoboda, 1987)

35
CHAPTER 3
MATERIAL AND METHODS
3.1 Materials
During this study, tailings of magnetic separation facility of Güncem Mining
Company were used. Three different types of samples with varying iron grade
were taken from different sites of tailings dump. These samples were named as
low grade, medium grade and high grade. Nearly 50 kg of sample from each
quality were brought to mineral processing laboratory of METU Mining
Engineering Department. Hand specimens were taken for microscopical
examination. The remaining part was crushed to -5 mm by jaw crusher and then
ground by roll crusher to –1 mm. Then, representative test samples were obtained
from ground ores via ore sampling method of riffling.
3.1.1 Characterization of Samples
The mineralogical and chemical characterization of samples were accomplished
using microscopical analysis, XRD (X-Ray Diffraction spectrometry) analysis and
XRF (X-Ray Fluorescence Spectrometry) method, while magnetite (Fe3O4)
content of samples were determined by Satmagan (saturation magnetic analyzer)
(Figure 3.1).

36
Figure 3.1 Satmagan (saturation magnetic analyzer)
For the mineralogical analysis of the samples, a number of polished sections were
prepared from selected hand specimens and they were examined through optical
microscope by Dr. Ahmet Çağatay.
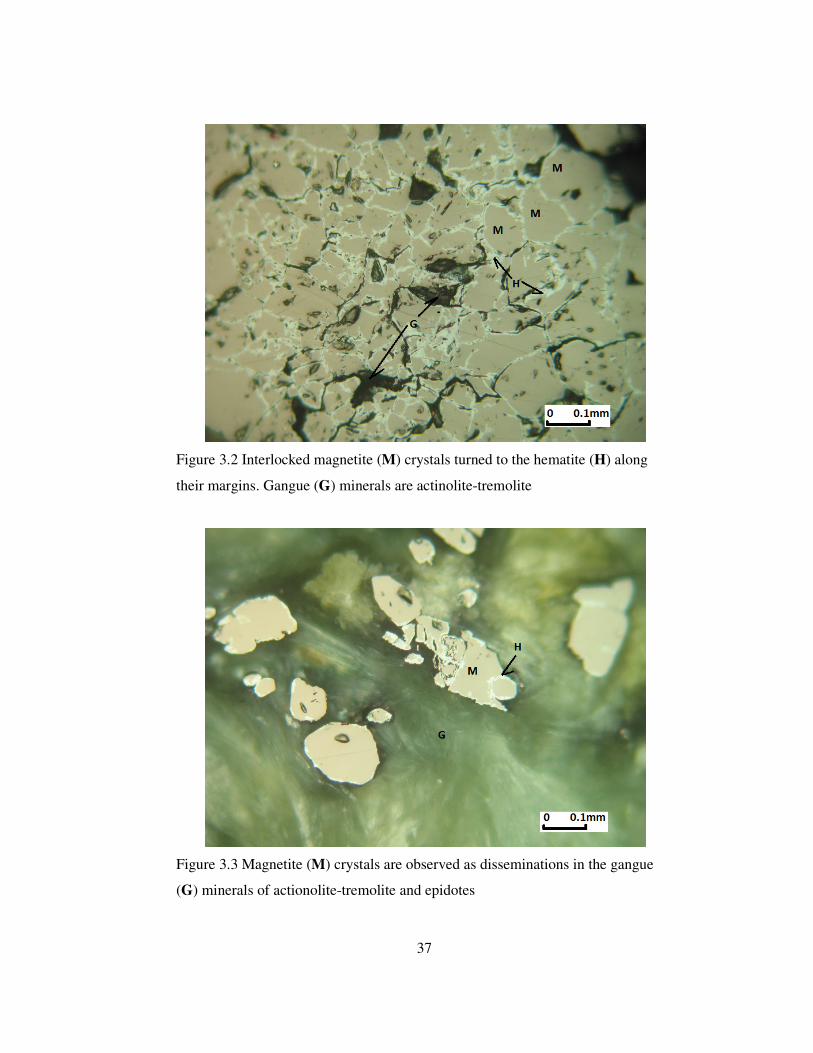
Mineralogical examination of samples under microscope indicated the presence of
magnetite, hematite, chalcopyrite and pyrite as ore minerals while quartz, calcite,
dolomite, epidote, chlorite, actinolite and tremolite were the gangue minerals.
Figure 3.2 - Figure 3.9. show the polished-section photographs of samples taken
with 10X-magnified ocular and 32X-magnified oil objectives.
37
Figure 3.2 Interlocked magnetite (M) crystals turned to the hematite (H) along
their margins. Gangue (G) minerals are actinolite-tremolite
Figure 3.3 Magnetite (M) crystals are observed as disseminations in the gangue
(G) minerals of actionolite-tremolite and epidotes

38
Figure 3.4 Pyrite (P) and chalcopyrite (C) are infilling the fractures of magnetite
(M). Gangue (G) minerals are composed of actinolite-tremolite, epidote and
chlorite
Figure 3.5 Fine grained magnetite (M) is disseminated in the gangue (G) minerals
and seen locally as martite; in other words, turned to hematite (H)

39
Figure 3.6 Magnetite (M) is intensively altered to martite (H: turned to hematite)
Gangue minerals calcite and quartz
Figure 3.7 Magnetite (M) has cataclastic texture. Interlocked magnetite crystals
are intensively martized (H). Gangue (G) minerals are calcite and quartz

40
Figure 3.8 Pyrite (P) is observed in the fracture of martized magnetite (H)
Figure 3.9 The crystals of euhedral and interlocked magnetite (M) are intensively
altered to martite (H). Gangue (G) minerals are quartz and calcite
41
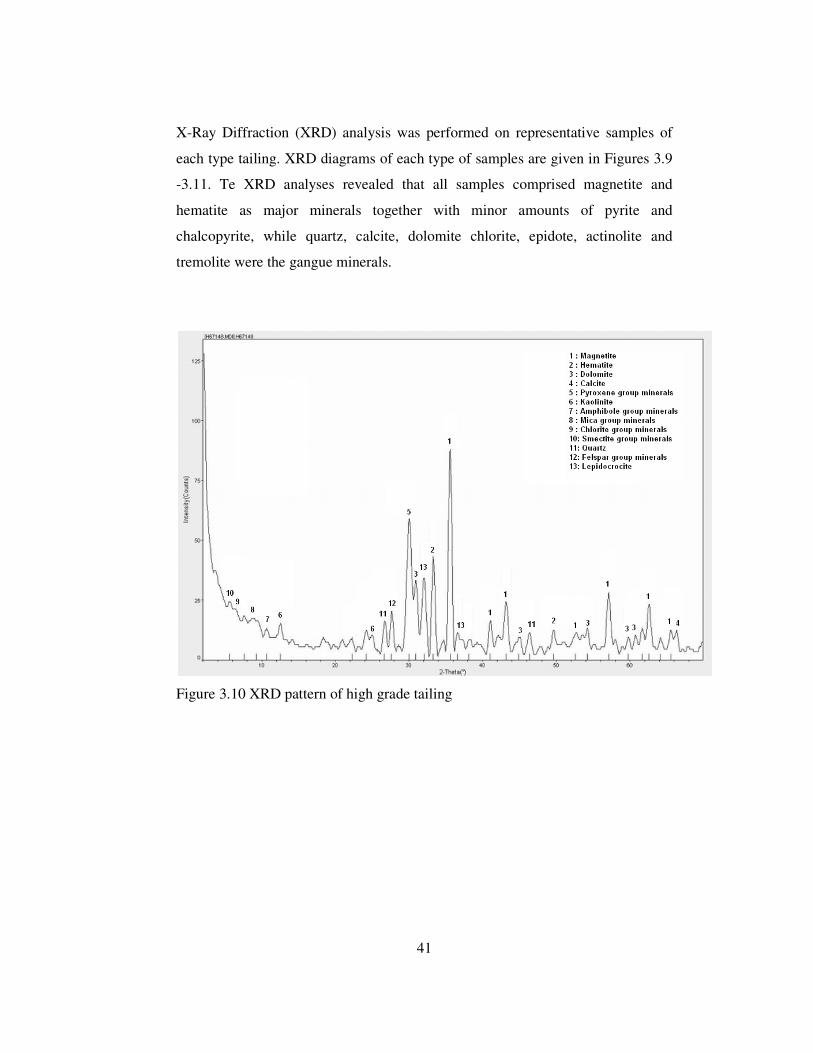
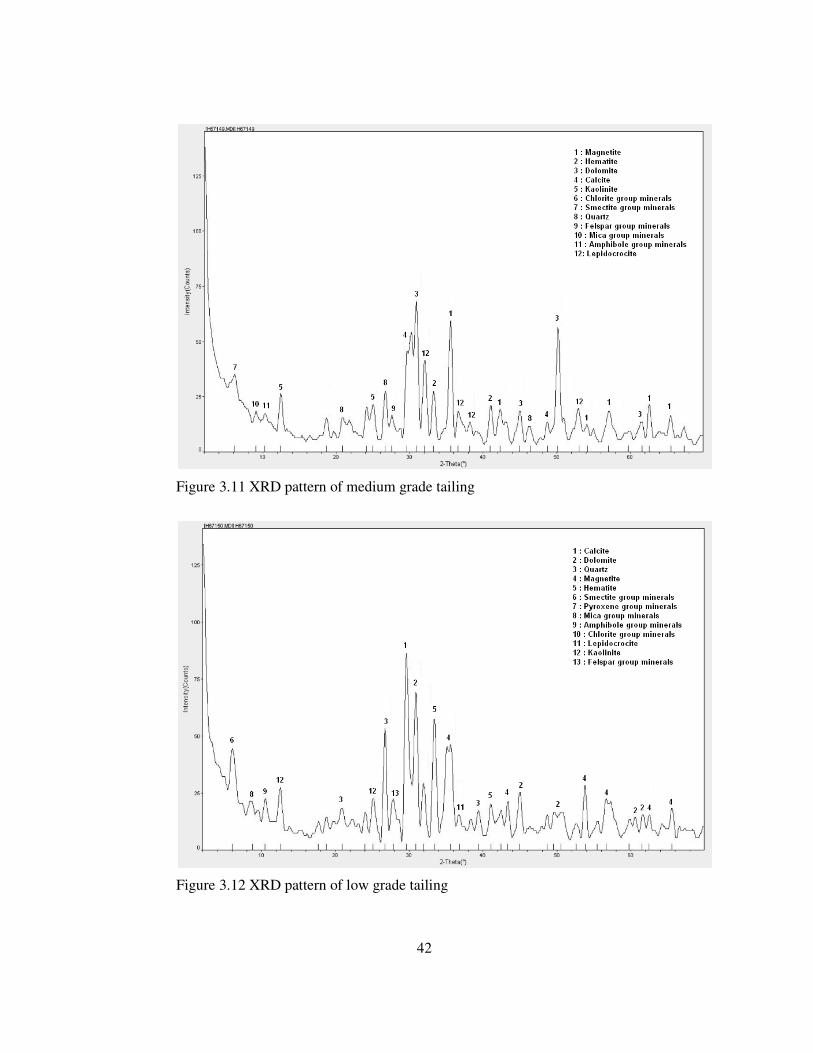
X-Ray Diffraction (XRD) analysis was performed on representative samples of
each type tailing. XRD diagrams of each type of samples are given in Figures 3.9
-3.11. Te XRD analyses revealed that all samples comprised magnetite and
hematite as major minerals together with minor amounts of pyrite and
chalcopyrite, while quartz, calcite, dolomite chlorite, epidote, actinolite and
tremolite were the gangue minerals.
Figure 3.10 XRD pattern of high grade tailing
42
Figure 3.11 XRD pattern of medium grade tailing
Figure 3.12 XRD pattern of low grade tailing

43
3.1.2. Chemical Characterization of Samples
Chemical compositions of the representative samples were determined with X-ray
fluorescence method. Results of complete analyses are given in Table 3.1.
Table 3.1 Chemical analyses of low, medium and high grade tailings.
Tailing Grades
Total Fe %
SiO2 %
Al2O3
% CaO %
MgO %
Na2O %
K2O %
S %
TiO2 %
Low 16.54 27.57 3.99 18.00 6.56 0.23 0.19 0.13 0.16
Medium 30.18 23.09 1.47 11.24 5.39 0.15 0.14 0.09 0.11
High 41.40 19.05 1.40 9.20 4.50 0.03 0.03 0.02 0.10
The distribution of iron with respect to particle size was also examined. The
combined results of sieve analysis of each size fraction were tabulated in Table
3.2, Table 3.3 and Table 3.4.
Table 3.2 Size distribution, Fe3O4 and Fe analysis for low grade tailing
Particle Size (µm)
Weight (%)
ΣΣΣΣ Retained Weight
(%)
Fe3O4 (%)
Fe (%)
Fe3O4 Distribution
(%)
ΣΣΣΣ Fe3O4
Distribution (%)
-1000+833 15.46 15.46 5.36 14.21 14.03 14.03 -833+500 34.19 49.65 5.46 14.82 31.60 45.63 -500+250 21.11 70.76 6.12 17.75 21.87 67.50 -250+106 14.99 85.75 6.93 20.14 17.59 85.09 -106-75 5.57 91.32 6.91 19.89 6.51 91.60 -75+45 2.67 93.99 6.13 18.12 2.78 94.38 -45 6.01 100.00 5.53 15.43 5.62 100.00
Total 100.00 5.91 16.55 100.00

44
Table 3.3 Size distribution, Fe3O4 and Fe analysis for medium grade tailing
Table 3.4 Size distribution, Fe3O4 and Fe analysis for high grade tailing
As it can be seen from Table 3.2, Table 3.3 and Table 3.4, although there are some
differences in Fe3O4 and Fe grade of each fraction, there is no noticeable increase
or decrease with size. Therefore, physical concentrations of samples by screening
were found to be not possible.
Particle Size (µm)
Weight (%)
ΣΣΣΣ Retained Weight
(%)
Fe3O4 (%)
Fe (%)
Fe3O4 Distribution
(%)
ΣΣΣΣ Fe3O4
Distribution (%)
-1000+833 15.94 15.94 18.20 31.21 15.22 15.22 -833+500 28.31 44.26 18.56 31.72 27.57 42.80 -500+250 21.77 66.02 19.65 32.15 22.44 65.24 -250+106 16.94 82.96 20.50 32.41 18.22 83.46 -106-75 6.57 89.52 21.05 32.63 7.25 90.71 -75+45 3.30 92.82 19.75 32.25 3.42 94.12 -45 7.18 100.00 15.60 29.04 5.88 100.00
Total 100.00 19.06 31.73 100.00
Particle Size (µm)
Weight (%)
ΣΣΣΣ Retained Weight
(%)
Fe3O4 (%)
Fe (%)
Fe3O4 Distribution
(%)
ΣΣΣΣ Fe3O4
Distribution (%)
-1000+833 11.45 11.45 36.83 41.02 11.38 11.38 -833+500 32.18 43.62 36.05 40.12 31.30 42.68 -500+250 22.52 66.15 36.54 40.56 22.21 64.89 -250+106 17.23 83.38 39.63 41.66 18.43 83.31 -106-75 5.92 89.30 42.71 42.05 6.83 90.14 -75+45 2.90 92.21 39.74 41.69 3.11 93.25 -45 7.79 100.00 32.08 38.96 6.75 100.00
Total 100.00 37.06 40.66 100.00

45
3.2. Methods
Magnetic concentration tests with laboratory type Davis tube apparatus were
carried out for the separation of magnetite mineral from the test samples. Davis
tube is a test apparatus designed to separate the magnetite mineral from a small
amount of test sample (Figure 3.12). It is widely used to check the suitability of an
ore to magnetic separation. The cylindrical glass separation tube of the apparatus
was placed at an inclined position between the conical electromagnet poles. The
distance between the electromagnet poles was nearly 15 mm. Before each test, the
glass separation tube was filled with water up to 5 cm below the feed end. The
side inlet at the upper part of glass tube was connected to tap water with a flexible
tube. By using the clamp on the flexible tube for water supply and clamp on the
flexible tube connected to discharge end, a constant water level was kept in the
glass tube. During the tests a 200 cc pulp with 10% solid by weight was
introduced in to glass tube gradually with tap water.
Figure 3.13 Laboratory type Davis tube magnetic concentrator

46
While the particles in the pulp are settling in the glass tube, the magnetics are held
in the induced magnetic field zone between the electromagnet poles. During the
feeding of pulp a reciprocating motion was also given to the glass tube. The
magnetic field between the electromagnet poles was adjusted by changing the
electrical current on coils of electromagnet.
Table 3.5 shows the relation between applied current intensity (Ampere) and
induced magnetic field intensity measured by Gaussmeter between electromagnet
poles. The reciprocating motion of glass tube and addition of wash water were
stopped when solid free water was discharged from the discharge end of glass
tube. After the removal of magnetic field by switching of electricity, the magnetic
particles collected between the poles were washed down into concentrate
container by opening the discharge clamp.
After drying and weighing, products were analyzed for Fe3O4 content by
Satmagan (Saturated Magnetite Analyzer) and total Fe content by XRF (X-ray
Fluorescence)
Table 3.5 Induced magnetic field intensities versus applied electrical currents
Electric current (Ampere)
Induced magnetic field intensity (Gauss)
0.10 400
0.25 1000
0.50 2000
0.75 3000
1.00 4000
1.25 5000
1.50 6000

47
CHAPTER 4
RESULTS AND DISCUSSION
The effect of feed particle size and effect of applied field intensity on iron and
magnetite grade and their respective recoveries were examined throughout the
study.
4.1. Concentration Studies of Low Grade Tailing
A series of magnetic separation tests were carried out separately for 100% -1000,
-833, -500, -250, -106 and -75 µm size feed material at different magnetic field
intensities ranging from 400 Gauss to 6000 Gauss. The effect of particle size on
concentration of iron and magnetite grade and respective recoveries are shown in
Figures 4.1- 4.8 and in Table A1-A8 in Appendix A.
48
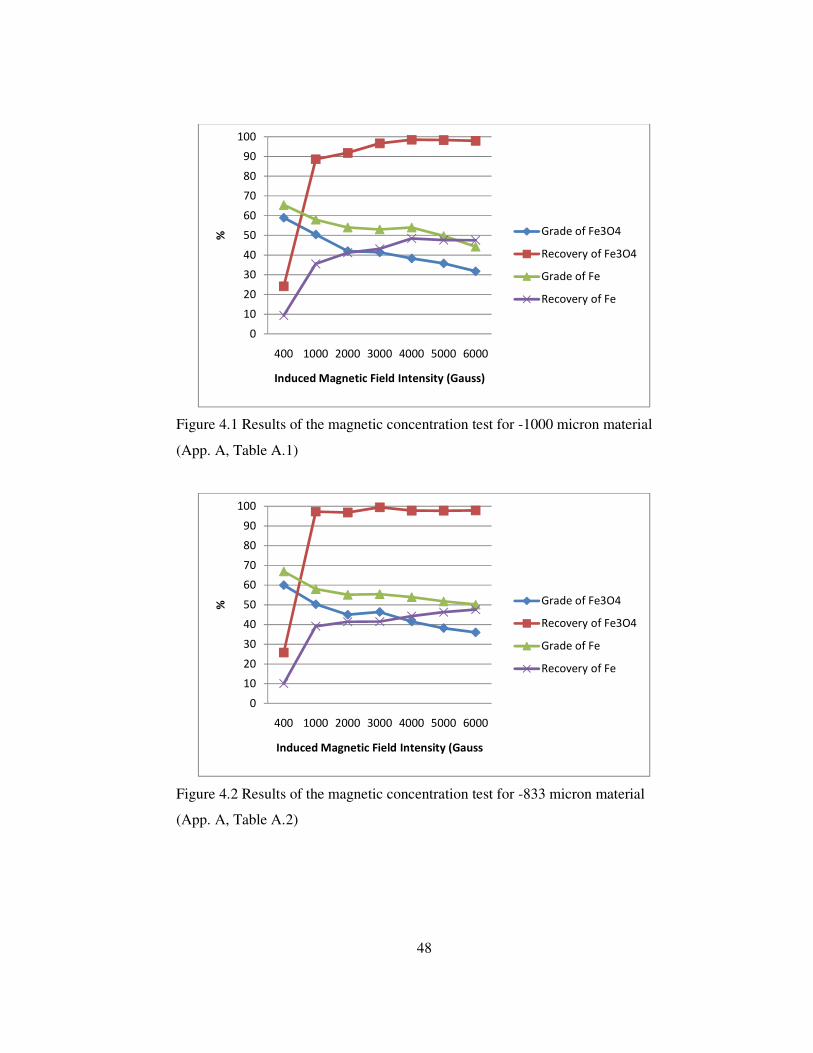
Figure 4.1 Results of the magnetic concentration test for -1000 micron material
(App. A, Table A.1)
Figure 4.2 Results of the magnetic concentration test for -833 micron material
(App. A, Table A.2)
0
10
20
30
40
50
60
70
80
90
100
400 1000 2000 3000 4000 5000 6000
%
Induced Magnetic Field Intensity (Gauss)
Grade of Fe3O4
Recovery of Fe3O4
Grade of Fe
Recovery of Fe
0
10
20
30
40
50
60
70
80
90
100
400 1000 2000 3000 4000 5000 6000
%
Induced Magnetic Field Intensity (Gauss
Grade of Fe3O4
Recovery of Fe3O4
Grade of Fe
Recovery of Fe

49
Figure 4.3 Results of the magnetic concentration test for -500 micron material
(App. A, Table A.3)
Figure 4.4 Results of the magnetic concentration test for -250 micron material
(App. A, Table A.4)
0
10
20
30
40
50
60
70
80
90
100
400 1000 2000 3000 4000 5000 6000
%
Induced Magnetic Field Intensity (Gauss)
Grade of Fe3O4
Recovery of Fe3O4
Grade of Fe
Recovery of Fe
0
10
20
30
40
50
60
70
80
90
100
400 1000 2000 3000 4000 5000 6000
%
Induced Magnetic Field Intensity (Gauss)
Grade of Fe3O4
Recovery of Fe3O4
Grade of Fe
Recovery of Fe

50
Figure 4.5 Results of the magnetic concentration test for -106 micron material
(App. A, Table A.5)
Figure 4.6 Results of the magnetic concentration test for -75 micron material
(App. A, Table A.6)
0
10
20
30
40
50
60
70
80
90
100
400 1000 2000 3000 4000 5000 6000
%
Induced Magnetic Field Intensity (Gauss)
Grade of Fe3O4
Recovery of Fe3O4
Grade of Fe
Recovery of Fe
0
10
20
30
40
50
60
70
80
90
100
400 1000 2000 3000 4000 5000 6000
%
Induced Magnetic Field Intensity (Gauss)
Grade of Fe3O4
Recovery of Fe3O4
Grade of Fe
Recovery of Fe

51
Figure 4.7 Recovery of Fe3O4% versus magnetic field intensity for low grade
tailing
Figure 4.8 Grade of Fe3O4% versus magnetic field intensity for low grade tailing
As seen from Figures 4.1 - 4.7, the concentrate with maximum Fe3O4 grade was
obtained at a magnetic field intensity of 400 Gauss for all sizes ranges of feed.
Both Fe3O4 and Fe grades of concentrate decreased with increasing magnetic field
intensity. At low magnetic field intensity only the particles with very high
0
10
20
30
40
50
60
70
80
90
100
400 1000 2000 3000 4000 5000 6000
Re
cov
ery
of
Fe
3O
4,
%
Induced Magnetic Field Intensity (Gauss)
-1000 micron
-833 micron
-500 micron
-250 micron
-106 micron
-75 micron
0
10
20
30
40
50
60
70
80
90
100
400 1000 2000 3000 4000 5000 6000
Gra
de
of
Fe
3O
4,
%
Induced Magnetic Field Intensity (Gauss)
-1000 micron
-833 micron
-500 micron
-250 micron
-106 micron
-75 micron

52
magnetic susceptibility were captured by the pole of electromagnet. It is also well
known phenomena that when the particle with high magnetic susceptibility is
introduced into a magnetic field, the particle gains magnetism and behaves as a
magnet, and thus attracts each other. Attraction of particles causes agglomeration
of particles which is called magnetic flocculation. The decrease in Fe3O4 content
at a higher field intensity was due to magnetic flocculation which caused the
entrainment of non-magnetic minerals between magnetic particles. On the other
hand, minerals considered as nonmagnetic may be rendered to magnetic by
elemental substitution of a small amount of a magnetic element in their crystal
lattice. Such particles are easily attracted by electromagnet pole and mix with pure
magnetite particles and decrease the Fe3O4 grade of concentrate.
As illustrated in the same Figures, the recovery of Fe and Fe3O4 increases with
increasing magnetic field intensity. This increase was very sharp up to 1000 Gauss
magnetic field intensity, and above this value, recovery of Fe3O4 and Fe continued
to increase but gradually.
Under the constant magnetic field intensity, the Fe3O4 and Fe grade of concentrate
increases with decreasing feed size while recoveries of Fe and Fe3O4 decreases
slightly. The increase in grade could be explained with higher degree of liberation
of particles. On the other hand, the hydrodynamic drag force of flowing water
prevents the catching of very fine magnetic particles in the magnetic field zone
produced by the conical poles of Davis tube. During the reciprocation of glass
tube in inclined position, certain portion of very fine magnetite particles was
discarded as waste together with wash water discharged from the lower end of
glass tube. In this way, losses of very fine magnetite particles occurred during the
concentration of fine size feed. Flocculation and coagulation of very fine
magnetite particles were investigated as size enlargement process of recovering
magnetite by magnetic separation (Aydoğan, 1994). Results indicated that
recovery was increased by applying low intensity wet magnetic separation in
combination with flocculation and coagulation process.

53
By using the low intensity magnetic concentration method for the low grade
tailing with 6.12% Fe3O4 and 17.75% Fe content, a concentrate containing
65.95% Fe3O4 was obtained from 100% -106 microns feed with 86.21% Fe3O4
recovery at 1000 Gauss magnetic field intensity. Fe grade and recovery were
67.00% and 30.20%, respectively for the same concentrate.
Results of the test-work carried out with low grade tailing showed that it was not
possible to produce a magnetite concentrate which will meet the specifications of
magnetite concentrate suitable for preparation of dense medium regarding Fe3O4
content. This concentrate meets the specifications of feed for pelletizing.
4.2. Concentration Studies of Medium Grade Tailing
A series of magnetic separation tests were carried out for medium grade tailing at
the same operating conditions followed during the concentration of low grade
tailings. The effect of particle size and magnetic field intensities on Fe3O4 and Fe
grade of concentrate and respective recoveries are shown in Figure 4.9 - 4.16 and
in Tables B1 - B6 as shown in Appendix B.

54
Figure 4.9 Results of the magnetic concentration test for -1000 micron material
(App. B, Table B.1)
Figure 4.10 Results of the magnetic concentration test for -833 micron material
(App. B, Table B.2)
0
10
20
30
40
50
60
70
80
90
100
400 1000 2000 3000 4000 5000 6000
%
Induced Magnetic Field Intensity (Gauss)
Grade of Fe3O4
Recovery of Fe3O4
Grade of Fe
Recovery of Fe
0
10
20
30
40
50
60
70
80
90
100
400 1000 2000 3000 4000 5000 6000
%
Induced Magnetic Field Intensity (Gauss
Grade of Fe3O4
Recovery of Fe3O4
Grade of Fe
Recovery of Fe

55
Figure 4.11 Results of the magnetic concentration test for -500 micron material
(App. B, Table B.3)
Figure 4.12 Results of the magnetic concentration test for -250 micron material
(App. B, Table B.4)
0
10
20
30
40
50
60
70
80
90
100
400 1000 2000 3000 4000 5000 6000
%
Induced Magnetic Field Intensity (Gauss)
Grade of Fe3O4
Recovery of Fe3O4
Grade of Fe
Recovery of Fe
0
10
20
30
40
50
60
70
80
90
100
400 1000 2000 3000 4000 5000 6000
%
Induced Magnetic Field Intensity (Gauss)
Fe3O4
Recovery of Fe3O4
Fe
Recovery of Fe
56
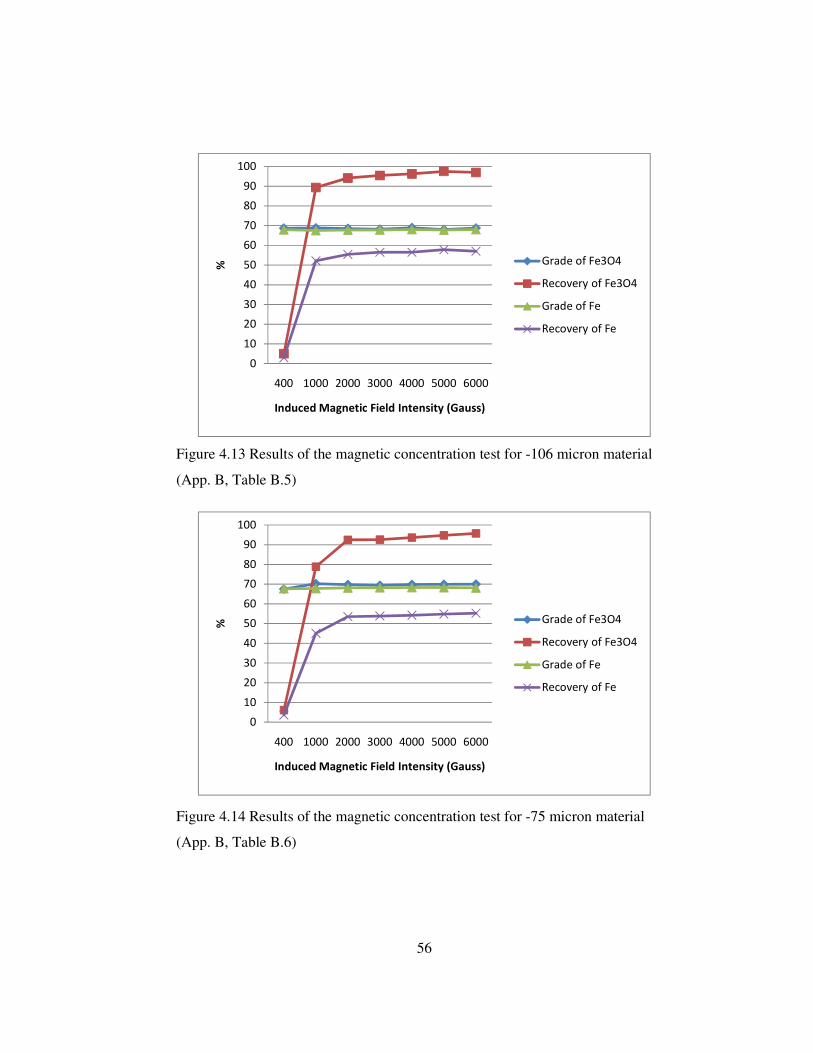
Figure 4.13 Results of the magnetic concentration test for -106 micron material
(App. B, Table B.5)
Figure 4.14 Results of the magnetic concentration test for -75 micron material
(App. B, Table B.6)
0
10
20
30
40
50
60
70
80
90
100
400 1000 2000 3000 4000 5000 6000
%
Induced Magnetic Field Intensity (Gauss)
Grade of Fe3O4
Recovery of Fe3O4
Grade of Fe
Recovery of Fe
0
10
20
30
40
50
60
70
80
90
100
400 1000 2000 3000 4000 5000 6000
%
Induced Magnetic Field Intensity (Gauss)
Grade of Fe3O4
Recovery of Fe3O4
Grade of Fe
Recovery of Fe

57
Figure 4.15 Recovery of Fe3O4% versus magnetic field intensity for medium
grade tailing
Figure 4.16 Grade of Fe3O4% versus magnetic field intensity for medium grade
tailing
As seen from Figures 4.8 - 4.16, similar relations were observed between the Fe
and Fe3O4 grades and respective recoveries and operating parameters of
concentration process namely feed size and induced magnetic field intensity.
0
10
20
30
40
50
60
70
80
90
100
400 1000 2000 3000 4000 5000 6000
Re
cov
ery
of
Fe
3O
4,
%
Induced Magnetic Field Intensity (Gauss)
-1000 micron
-833 micron
-500 micron
-250 micron
-106 micron
-75 micron
0
10
20
30
40
50
60
70
80
90
100
400 1000 2000 3000 4000 5000 6000
Gra
de
of
Fe
3O
4,
%
Induced Magnetic Field Intensity (Gauss)
-1000 micron
-833 micron
-500 micron
-250 micron
-106 micron
-75 micron

58
The concentrate with maximum Fe3O4 content was obtained at magnetic field
intensity of 400 Gauss. The decrease in both Fe3O4 and Fe grade with increased
magnetic field intensity were due to magnetic flocculation of magnetic particles
which causes entrainment of particles other than magnetic particles. Presence of
intimately interlocked hematite and magnetite particles also resulted in a decrease
in Fe3O4 grade of concentrate. The increase in grade with decreasing particle size
was due to better liberation of minerals at finer sizes. The slight decrease in
recovery of magnetite minerals was due to hydrodynamic drag force of flowing
water. This drag force has a negative effect on capturing of fine magnetite
particles by the magnetic poles of Davis Tube.
By using the magnetic concentration method for the medium grade tailing with
18.85% Fe3O4 and 31.82% Fe content, a concentrate containing 70.23% Fe3O4
was obtained from 100% -75 microns feed with 78.87% recovery at 1000 Gauss
magnetic field intensity. Fe grade and recovery were 67.80% and 45.11%
respectively for the same concentrate.
Results of the test-work carried out with medium grade tailing show that it was
not possible to produce a magnetite concentrate which will meet the specifications
of magnetite concentrate suitable for preparation of dense medium. The grade and
size of concentrate was suitable for production of magnetite pellets.

59
4.3. Concentration Studies of High Grade Tailing
A series of magnetic separation tests were carried out for high grade tailing at the
same operating conditions followed during the concentration of both low and
medium grade tailings. The effect of particle size and magnetic field intensities on
Fe3O4 and Fe grade of concentrate and respective recoveries are shown in Figure
4.17-4.24 and in Tables C1-C6 as shown in Appendix C.
Figure 4.17 Results of the magnetic concentration test for -1000 micron material
(App. C, Table C.1)
0
10
20
30
40
50
60
70
80
90
100
400 1000 2000 3000 4000 5000 6000
%
Induced Magnetic Field Intensity (Gauss)
Grade of Fe3O4
Recovery of Fe3O4
Grade of Fe
Recovery of Fe

60
Figure 4.18 Results of the magnetic concentration test for -833 micron material
(App. C, Table C.2)
Figure 4.19 Results of the magnetic concentration test for -500 micron material
(App. C, Table C.3)
0
10
20
30
40
50
60
70
80
90
100
400 1000 2000 3000 4000 5000 6000
%
Induced Magnetic Field Intensity (Gauss
Grade of Fe3O4
Recovery of Fe3O4
Grade of Fe
Recovery of Fe
0
10
20
30
40
50
60
70
80
90
100
400 1000 2000 3000 4000 5000 6000
%
Induced Magnetic Field Intensity (Gauss)
Grade of Fe3O4
Recovery of Fe3O4
Grade of Fe
Recovery of Fe

61
Figure 4.20 Results of the magnetic concentration test for -250 micron material
(App. C, Table C.4)
Figure 4.21 Results of the magnetic concentration test for -106 micron material
(App. C, Table C.5)
0
10
20
30
40
50
60
70
80
90
100
400 1000 2000 3000 4000 5000 6000
%
Induced Magnetic Field Intensity (Gauss)
Grade of Fe3O4
Recovery of Fe3O4
Grade of Fe
Recovery of Fe
0
10
20
30
40
50
60
70
80
90
100
400 1000 2000 3000 4000 5000 6000
%
Induced Magnetic Field Intensity (Gauss)
Grade of Fe3O4
Recovery of Fe3O4
Grade of Fe
Recovery of Fe

62
Figure 4.22 Results of the magnetic concentration test for -75 micron material
(App. C, Table C.6)
Figure 4.23 Recovery of Fe3O4% versus magnetic field intensity for high grade
tailing
0
10
20
30
40
50
60
70
80
90
100
400 1000 2000 3000 4000 5000 6000
%
Induced Magnetic Field Intensity (Gauss)
Grade of Fe3O4
Recovery of Fe3O4
Grade of Fe
Recovery of Fe
0
10
20
30
40
50
60
70
80
90
100
400 1000 2000 3000 4000 5000 6000
Re
cov
ery
of
Fe
3O
4,
%
Induced Magnetic Field Intensity (Gauss)
-1000 micron
-833 micron
-500 micron
-250 micron
-106 micron
-75 micron

63
Figure 4.24 Grade of Fe3O4% versus magnetic field intensity for high grade
tailing
As seen from Figures 4.17 - 4.24, similar relations as for low grade and medium
grade tailings were observed between the Fe and Fe3O4 grades and respective
recoveries and operating parameters of concentration process namely feed size
and induced magnetic field intensity.
The concentrate with maximum Fe3O4 content was obtained at magnetic field
intensity of 400 Gauss. The decrease in both Fe3O4 and Fe grade with increased
magnetic field intensity were due to magnetic flocculation of magnetite particles
which causes entrainment of particles other than magnetite particles. Presence of
intimately interlocked hematite and magnetite particles also resulted in a decrease
in Fe3O4 grade of concentrate. The increase in grade with decreasing particle size
was due to better liberation of minerals at finer sizes. The slight decrease in
recovery of magnetite minerals was due to hydrodynamic drag force of flowing
water. This drag force has a negative effect on capturing of fine magnetite
particles by the magnetic poles of Davis Tube.
0
10
20
30
40
50
60
70
80
90
100
400 1000 2000 3000 4000 5000 6000
Gra
de
of
Fe
3O
4,
%
Induced Magnetic Field Intensity (Gauss)
-1000 micron
-833 micron
-500 micron
-250 micron
-106 micron
-75 micron

64
By using the magnetic concentration method for the high grade tailing with
35.70% Fe3O4 and 39.90% Fe content, a concentrate containing 79.98% Fe3O4
was obtained from 100% -75 microns feed with 65.42% recovery at 1000 Gauss
magnetic field intensity. Fe grade and recovery were 68.40% and 50.06%
respectively for the same concentrate. At the same operating conditions a
concentrate containing 76.5% Fe3O4 was obtained with 96.6% recovery by using a
low intensity wet magnetic drum separator. The separator was constructed with a
permanent magnet and manufactured by Boxmag Rapid Limited, England and the
dimensions of the drum 19 * 19 cm (Figure 4.25).
Results of the test-work carried out with medium grade tailing show that it was
not possible to produce a magnetite concentrate which will meet the specifications
of magnetite concentrate suitable for preparation of dense medium. The grade and
size of concentrate was suitable for production of magnetite pellets.
Figure 4.25 Low intensity wet magnetic drum separator

65
4.3.1 Regrinding of Rougher Concentrate
The rougher concentrate obtained from the feed of -75 µm size was subjected to
another magnetic separation after regrinding the material to -45 µm. By following
the flowsheet given in Figure 4.26, the final clean concentrate with 82.00% Fe3O4
content was obtained with 61.94% Fe3O4 recovery. The complete chemical
analysis of this final concentrate was given in Table 4.1. The decrease in recovery
was due to effect of hydrodynamic drag force of flowing water on very fine
magnetite particles. Further increase in the grade of concentrate was not possible
due to mineralogical texture of test sample. Microscopical examination of final
magnetite concentrate indicated that there were no free hematite or gangue
mineral particles. All particles were either free magnetite particle or intimately
interlocked particle of magnetite and hematite. The measured specific gravity 4.97
of the final magnetite concentrate confirms these findings.
Although the magnetite content (Fe3O4) of produced concentrate was less than
90%, all particles in the concentrate will behave like a magnetite particle at low
magnetic field intensity due to their mineralogical texture and will not create
problem during their regeneration in heavy medium separation circuit. Therefore,
to reach a final decision about the suitability of produced concentrate as
suspension solid for heavy media, a pilot scale test should be carried out.
Table 4.1 Chemical analysis of the final clean concentrate
Total Fe %
SiO2 %
Al2O3
% CaO %
MgO %
Na2O %
K2O %
S %
TiO2 %
68.44 0.70 0.10 0.25 0.25 0.02 0.02 0.005 <0.05
Size reduction (crushing + grinding) cost will be the main component of operating
cost of magnetite concentrate from the iron ore tailings. The required energy for
the size reduction operation from 80% passing from 10 cm to 80% passing 35 µm
(100% -45 µm) can be calculated by using Bond index equation of

66
� � �� � �� � � �√ � �
√� � �. �
Where;
W : Work input in kWh/ton
wi : Work index value of ore (for iron ore 15.44 kWh/ston)
P : The particles size which 80% of the product passes from 35 µm
F : The particles size which 80% of the feed passes from 10 cm (=100000 µm)
� � �� � ��. �� � � �√�� � �
√������� � �. �
� � �� � ��. �� � � ��.���� � �
���.����� � �. �
� � �� � ��. �� � ��. ����� � �. �
� � ��. �� ���/� !
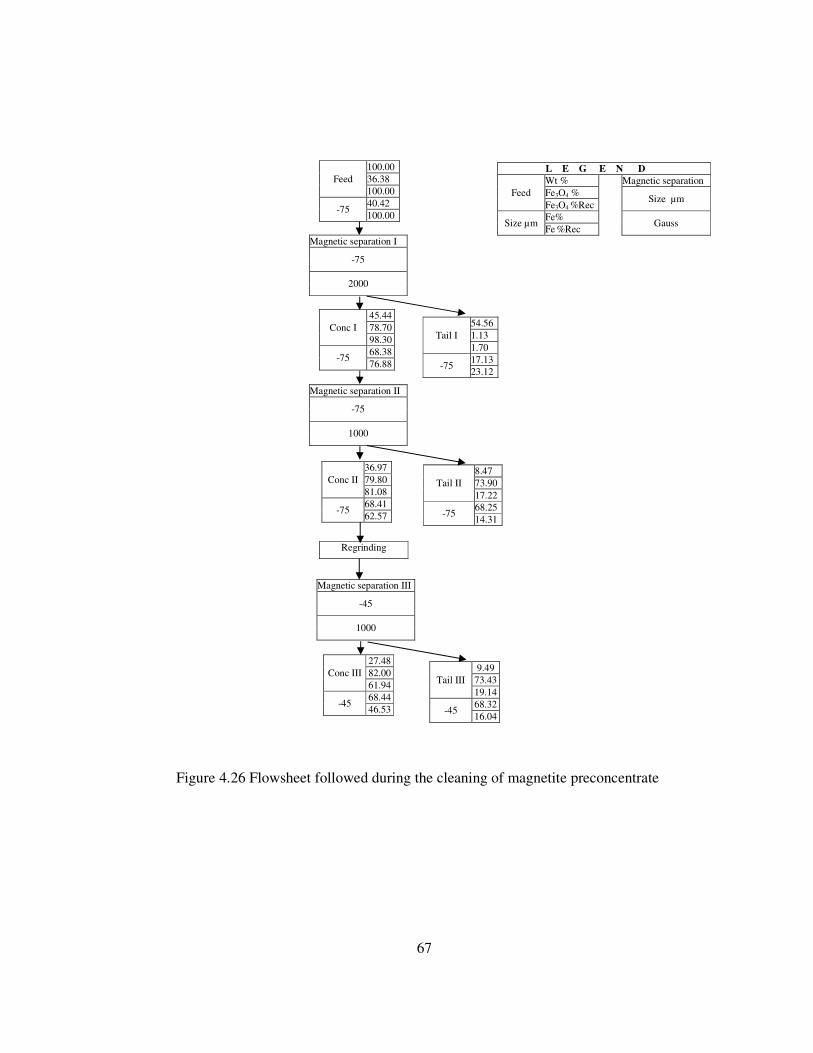
67
Figure 4.26 Flowsheet followed during the cleaning of magnetite preconcentrate
L E G E N D
Feed Wt % Magnetic separation Fe3O4 %
Size µm Fe3O4 %Rec
Size µm Fe%
Gauss Fe %Rec
Feed 100.00 36.38 100.00
-75 40.42 100.00
Magnetic separation I
-75
2000
Conc I 45.44 78.70 98.30
-75 68.38 76.88
Tail I 54.56 1.13 1.70
-75 17.13 23.12
Magnetic separation II
-75
1000
Tail II 8.47 73.90 17.22
-75 68.25 14.31
Conc II 36.97 79.80 81.08
-75 68.41 62.57
Regrinding
Magnetic separation III
-45
1000
Tail III 9.49
73.43 19.14
-45 68.32 16.04
Conc III 27.48 82.00 61.94
-45 68.44 46.53

68
CHAPTER 5
CONCLUSION
In view of the results obtained in this research the following conclusions are
derived;
• Mineralogical analysis of test samples showed that magnetite and hematite
were the major ore minerals while pyrite and chalcopyrite were found in trace
amounts. Actimolite, tremolite, epidote, chlorite, quartz, calcite, and dolomite
were the gangue minerals in all test samples.
• A concentrate with 65.95% Fe3O4 grade with 86.21% recovery was obtained
from 100% -106 µm size feed of low grade tailing at 1000 Gauss magnetic
field intensity. Therefore low grade iron ore tailing was not suitable for the
production of magnetite concentrate which will be used in preparation of
heavy medium. This concentrate was suitable for production of magnetite
pellets.
• A concentrate with 70.23% Fe3O4 content was obtained with 78.87% recovery
from 100% -75 µm size feed of medium grade iron ore tailings at 1000 Gauss
magnetic field intensity. Magnetite concentrate with this grade was not
suitable for preparation of heavy medium. This concentrate was suitable for
production of magnetite pellets.

69
• A concentrate with 79.98% Fe3O4 was obtained with 65.42% recovery from
100% -75 µm size feed of high grade iron ore tailings at 1000 Gauss magnetic
field intensity. Magnetite concentrate with this grade was not suitable for
preparation of heavy medium. This concentrate was suitable for production of
magnetite pellets.
• Final concentrate with 82.00% Fe3O4 content was obtained with 61.94%
Fe3O4 recovery from high grade iron ore tailings at 1000 Gauss magnetic field
intensity after re-grinding of magnetite pre-concentrate to minus 45 µm. This
concentrate was suitable for the production of magnetite pellets. Decision
should be given about the suitability of produced concentrate as suspension
solid for heavy media preparation after carrying out a pilot scale test.

70
REFERENCES
Akdoğan, G., “Benefication of Divriği iron ore fines”, A Master’s Thesis in
Mining Engineering, METU; p. 72, 1987.
Arslan, V., “Türkiye’de kömür hazırlama tesisleri, performans ölçümünün önemi
ve bir örnek uygulama”, 16. Kömür Kongresi, 2010 (Accapted paper)
Aydoğan , A., “Enhancement possibilities of recovery of very fine magnetite
particle in magnetic separation”, A Master’s Thesis in Mining Engineering,
METU; p.144, 1987.
Başaran, G., “Benefication studies on the fine iron ore tailings of Divriği
Concentrator”, A Master’s Thesis in Mining Engineering, METU; p. 64, 1988.
Bhappu, B.R. and Hightower, J.D., “Heavy media separation (HMS) revisited”
Advances in Graviy concentration, SME, edited by Honaker R.Q. and Forrest
W.R., pp. 143-153, 2003.
Chao, L., Henghu, S., Zhonghi, Y. and Longtu, L., “Innovative methodology for
compressive utilization of iron ore tailings” Journal of Hazardous material,
Volume 174, Issue 1-3, pp. 78-83, 2010.
Çelik, H., “An analysis of mass balance and fractional particle size distributions of
coal and magnetite in a dense medium cyclone circuit”, International Journal of
Coal Prepartion and Utilization, Volume 29, 2, pp. 68-83, 2009.

71
Erten, M.H., “Investigation of the effects of magnetization and demagnetization on
the settling rate and viscosity of magnetite medium used in dense-medium coal
washeries” A Habilitation Thesis to the Faculty of Engineering of METU, 1964.
Gupta, A., and Yan, D.S., “Mineral processing design and operations an
introductions”, Elesevier, Netherlands, p. 693, 2006.
He, Y.B. and Laskowsk,i J.S., “Effect of dense medium properties on separation
performance of dense medium cyclone” Minerals Engineering, Volume 7, Issue
2-3, pp. 209-221, 1994.
Honaker, R.Q. and Patwardhan, A., “In-plant evaluation of dense medium process
performances” International Journal of Coal Preparation and Utilization,
Volume 26 pp. 149-164, 2006.
Honaker, R.Q. and Bimpong, C., “Alternative materials for dense medium
separation”, International Journal of Coal Preparation and Utilization, Volume
29, Issue 4, pp. 173-191, 2009.
http://geology.com, “Magnetite and rodastone, mineral uses and properties” last
visited on April 2010.
http://www.flsmidthminerals.com, “Water only Cyclone”, last visited on April
2010.
Gupta, A and Yan, D.S. “Mineral Processing Design and Operations An
Introduction”, Elsevier, p. 693, 2006.
Hurlbut, C.S.,” Dana’s manual of mineralogy”, John Wiley and Son’s, Inc.,
London, p. 609, 1959.

72
Luttrell, G.H., Barbee, C.J. and Stanley, F.L., “Optimum cutpoints of heavy
medium separations”, Advances in Graviy concentration, SME, edited by R.Q.
Honaker and W.R. Forrest, pp. 81-9,12003.
Majumder, A.K. Shah, H. and Barnwall, J.P., “Comparative study om magnetite
medium stability in a Vorsyl separator and in a heavy medium cyclone”,
International Journal of Coal Preparation and Utilization, Volume 26, 3, pp.
165-179, 2006.
Mikhail, N.W. and Osborne, D.G., “Magnetite heavy media: Standards and testing
procedures” International Journal of Coal Preparation and Utilization, Volume 8
pp. 111-12, 1990.
Narasimha, M., Brennon, M., Holtham, P.N., “Prediction of magnetite segregation
in dense medium cyclone using computational fluid dynamic technique”,
International Journal of Mineral Processing, Volume 82, Issue 1, pp. 41-56,
2006.
Osborne, D.G., “Coal Preparation Technology”, London, Graham &Trotman,
1988.
Palowitch, E.R. and Deubrouck, A.W., “Dense medium separation” Coal
Preparation, Editors leonard, J.W. Mitchel, D.R. p. 9-3, 9-91, 1968.
Pryor, E.J., “Mineral Processing”, 3rd edition, Applied Science Publisher Limited,
London, p. 844, 1974.
Rhodes, D., Hall, S.T. and Miles, N.J., “Density separations in heavy inorganic
liquid suspensions”, XVII International Mineral Processing Congress, 23-28
May, Sdyney, Australia, Volume 2, pp. 375-377, 1993.

73
Sripriya, R., Rao, P., Bapat, J.P., Singh, N.P. and Das, P., International Journal of
Mineral Processing, Volume 71, pp. 55-71, 2003.
Svoboda, J., “Magnetic Methods for the treatment of Minerals”, Elsevier, 1987.
Taggart, A.F., “Handbook of Mineral Dressing - Ores and Industrial Minerals”,
John Wiley & Sons, Inc, 1954.
T.C. Başbakanlık Devlet Planlama Teşkilatı, “Sekizinci Beş Yıllık Kalkınma
Planı”, Madencilik Özel Đhtisas Komisyonu, Metal Madenler Alt Komisyonu
Demir Çalışma Grubu Raporu, Ankara, 2001.
Walker, M.S., “A new method for the commercial separation of particles of
differing densities using magnetic fluids” XVth International Mineral Processing
Congress, Cannes, 1, pp. 307-312, 1985.
Wang, B., Chu, K.W., Yu, A.B and Vince, A., “Numerical studies of the effects of
medium properties in dense medium cyclone operations”, Minerals Engineering,
Volume 22, pp. 931-943, 2009.
Wills, B.A., “Mineral Processing Technology”, 3rd Edition, Oxford, Butterworth
Heinemann, 1977.
Wills, B.A., “Mineral Processing Technology”, 6th Edition, Butterworth
Heinemann, Oxford p. 486, 1985.
Wondemagegnehu, W.T., “Mineralogy, chemistry and physical properties of the
magnetite ore deposit around Kesikköprü Village and surrounding areas”, M. Sc.
Thesis, METU, Geological Engineering Department, p. 128, 1990.
Yıldız Necati, Demir Raporu, TMMOB Maden Mühendisleri Odası, p. 80, 2009.

74
APPENDIX A
TABLES FOR LOW GRADE TAILINGS
Table A.1 Results of the magnetic concentration for -1000 µm
Particle Size (µm)
Magnetic Field
Intensity (Gauss)
Products Weight
(%) Fe3O4 (%)
Recovery of Fe3O4
(%)
Fe (%)
Recovery of Fe (%)
-1000
400 Concentrate 2.44 58.90 24.15 65.40 9.35 Tailing 97.56 4.63 75.85 15.85 90.65 Feed 100.00 5.95 100.00 17.06 100.00
1000 Concentrate 10.46 50.41 88.62 57.96 35.54 Tailing 89.54 0.76 11.38 12.28 64.46 Feed 100.00 5.95 100.00 17.06 100.00
2000 Concentrate 13.01 42.00 91.84 54.00 41.18 Tailing 86.99 0.56 8.16 11.54 58.82 Feed 100.00 5.95 100.00 17.06 100.00
3000 Concentrate 13.89 41.40 96.65 53.02 43.17 Tailing 86.11 0.23 3.35 11.26 56.83 Feed 100.00 5.95 100.00 17.06 100.00
4000 Concentrate 15.31 38.28 98.50 54.00 48.46 Tailing 84.69 0.11 1.50 10.38 51.54 Feed 100.00 5.95 100.00 17.06 100.00
5000 Concentrate 16.34 35.80 98.31 49.72 47.62 Tailing 83.66 0.12 1.69 10.68 52.38 Feed 100.00 5.95 100.00 17.06 100.00
6000 Concentrate 18.33 31.80 97.97 44.25 47.54 Tailing 81.67 0.15 2.03 10.96 52.46
Feed 100.00 5.95 100.00 17.06 100.00

75
Table A.2 Results of the magnetic concentration for -833 µm
Particle Size (µm)
Magnetic Field
Intensity (Gauss)
Products Weight
(%) Fe3O4 (%)
Recovery of Fe3O4
(%)
Fe (%)
Recovery of Fe (%)
-833
400 Concentrate 2.60 60.00 25.83 66.95 10.06 Tailing 97.40 4.60 74.17 15.97 89.94 Feed 100.00 6.04 100.00 17.30 100.00
1000 Concentrate 11.68 50.30 97.27 58.00 39.16 Tailing 88.32 0.19 2.73 11.92 60.84 Feed 100.00 6.04 100.00 17.30 100.00
2000 Concentrate 13.00 45.00 96.85 55.10 41.40 Tailing 87.00 0.22 3.15 11.65 58.60 Feed 100.00 6.04 100.00 17.30 100.00
3000 Concentrate 12.95 46.40 99.48 55.46 41.51 Tailing 87.05 0.04 0.52 11.62 58.49 Feed 100.00 6.04 100.00 17.30 100.00
4000 Concentrate 14.22 41.53 97.77 53.93 44.33 Tailing 85.78 0.16 2.23 11.23 55.67 Feed 100.00 6.04 100.00 17.30 100.00
5000 Concentrate 15.47 38.17 97.76 51.76 46.28 Tailing 84.53 0.16 2.24 10.99 53.72 Feed 100.00 6.04 100.00 17.30 100.00
6000 Concentrate 16.42 36.00 97.87 50.14 47.59 Tailing 83.58 0.15 2.13 10.85 52.41 Feed 100.00 6.04 100.00 17.30 100.00

76
Table A.3 Results of the magnetic concentration for -500 µm
Particle Size (µm)
Magnetic Field
Intensity (Gauss)
Products Weight
(%) Fe3O4 (%)
Recovery of Fe3O4
(%)
Fe (%)
Recovery of Fe (%)
-500
400 Concentrate 2.86 59.50 28.36 66.39 11.04 Tailing 97.14 4.42 71.64 15.75 88.96 Feed 100.00 6.00 100.00 17.20 100.00
1000 Concentrate 11.40 50.20 95.38 57.91 38.38 Tailing 88.60 0.31 4.62 11.96 61.62 Feed 100.00 6.00 100.00 17.20 100.00
2000 Concentrate 12.58 45.57 95.55 55.26 40.42 Tailing 87.42 0.31 4.45 11.72 59.58 Feed 100.00 6.00 100.00 17.20 100.00
3000 Concentrate 12.56 46.86 98.09 56.10 40.97 Tailing 87.44 0.13 1.91 11.61 59.03 Feed 100.00 6.00 100.00 17.20 100.00
4000 Concentrate 14.46 40.27 97.05 52.60 44.22 Tailing 85.54 0.21 2.95 11.22 55.78 Feed 100.00 6.00 100.00 17.20 100.00
5000 Concentrate 14.34 40.83 97.58 54.39 45.35 Tailing 85.66 0.17 2.42 10.97 54.65 Feed 100.00 6.00 100.00 17.20 100.00
6000 Concentrate 16.10 36.64 98.32 51.08 47.81 Tailing 83.90 0.12 1.68 10.70 52.19 Feed 100.00 6.00 100.00 17.20 100.00
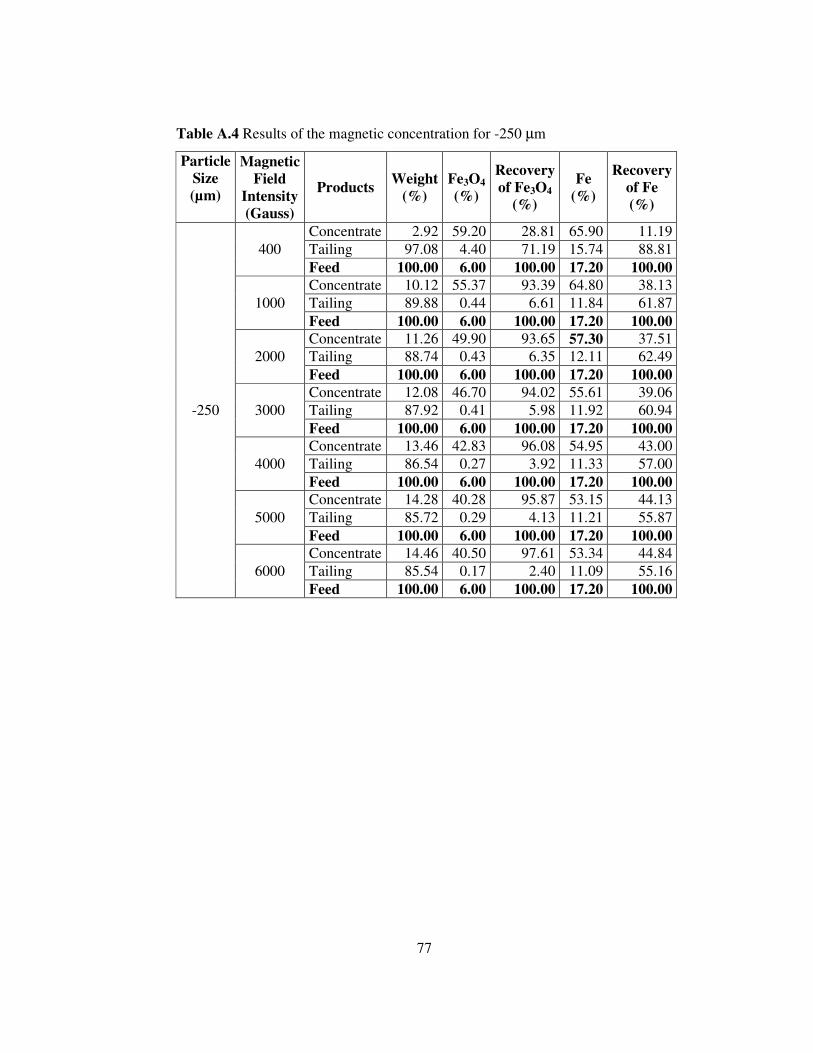
77
Table A.4 Results of the magnetic concentration for -250 µm
Particle Size (µm)
Magnetic Field
Intensity (Gauss)
Products Weight
(%) Fe3O4 (%)
Recovery of Fe3O4
(%)
Fe (%)
Recovery of Fe (%)
-250
400 Concentrate 2.92 59.20 28.81 65.90 11.19 Tailing 97.08 4.40 71.19 15.74 88.81 Feed 100.00 6.00 100.00 17.20 100.00
1000 Concentrate 10.12 55.37 93.39 64.80 38.13 Tailing 89.88 0.44 6.61 11.84 61.87 Feed 100.00 6.00 100.00 17.20 100.00
2000 Concentrate 11.26 49.90 93.65 57.30 37.51 Tailing 88.74 0.43 6.35 12.11 62.49 Feed 100.00 6.00 100.00 17.20 100.00
3000 Concentrate 12.08 46.70 94.02 55.61 39.06 Tailing 87.92 0.41 5.98 11.92 60.94 Feed 100.00 6.00 100.00 17.20 100.00
4000 Concentrate 13.46 42.83 96.08 54.95 43.00 Tailing 86.54 0.27 3.92 11.33 57.00 Feed 100.00 6.00 100.00 17.20 100.00
5000 Concentrate 14.28 40.28 95.87 53.15 44.13 Tailing 85.72 0.29 4.13 11.21 55.87 Feed 100.00 6.00 100.00 17.20 100.00
6000 Concentrate 14.46 40.50 97.61 53.34 44.84 Tailing 85.54 0.17 2.40 11.09 55.16 Feed 100.00 6.00 100.00 17.20 100.00

78
Table A.5 Results of the magnetic concentration for -106 µm
Particle Size (µm)
Magnetic Field
Intensity (Gauss)
Products Weight
(%) Fe3O4 (%)
Recovery of Fe3O4
(%)
Fe (%)
Recovery of Fe (%)
-106
400 Concentrate 2.43 66.10 26.25 67.44 9.23 Tailing 97.57 4.63 73.75 16.51 90.77 Feed 100.00 6.12 100.00 17.75 100.00
1000 Concentrate 8.00 65.95 86.21 67.00 30.20 Tailing 92.00 0.92 13.79 13.47 69.80 Feed 100.00 6.12 100.00 17.75 100.00
2000 Concentrate 9.36 60.20 92.07 67.17 35.42 Tailing 90.64 0.54 7.93 12.65 64.58 Feed 100.00 6.12 100.00 17.75 100.00
3000 Concentrate 9.93 57.25 92.89 65.57 36.68 Tailing 90.07 0.48 7.11 12.48 63.32 Feed 100.00 6.12 100.00 17.75 100.00
4000 Concentrate 11.43 50.24 93.83 58.11 37.42 Tailing 88.57 0.43 6.17 12.54 62.58 Feed 100.00 6.12 100.00 17.75 100.00
5000 Concentrate 11.57 50.11 94.73 57.96 37.78 Tailing 88.43 0.36 5.27 12.49 62.22 Feed 100.00 6.12 100.00 17.75 100.00
6000 Concentrate 11.50 49.50 93.01 56.89 36.86 Tailing 88.50 0.48 6.99 12.66 63.14 Feed 100.00 6.12 100.00 17.75 100.00

79
Table A.6 Results of the magnetic concentration for -75 µm
Particle Size (µm)
Magnetic Field
Intensity (Gauss)
Products Weight
(%) Fe3O4 (%)
Recovery of Fe3O4
(%)
Fe (%)
Recovery of Fe (%)
-75
400 Concentrate 1.97 65.30 21.99 66.47 7.81 Tailing 98.03 4.66 78.01 15.77 92.19 Feed 100.00 5.85 100.00 16.77 100.00
1000 Concentrate 7.43 63.30 80.40 67.34 29.84 Tailing 92.57 1.24 19.60 12.71 70.16 Feed 100.00 5.85 100.00 16.77 100.00
2000 Concentrate 8.10 60.00 83.08 66.95 32.34 Tailing 91.90 1.08 16.92 12.35 67.66 Feed 100.00 5.85 100.00 16.77 100.00
3000 Concentrate 9.17 55.10 86.37 63.87 34.92 Tailing 90.83 0.88 13.63 12.01 65.08 Feed 100.00 5.85 100.00 16.77 100.00
4000 Concentrate 9.57 52.60 86.05 62.43 35.63 Tailing 90.43 0.90 13.95 11.94 64.37 Feed 100.00 5.85 100.00 16.77 100.00
5000 Concentrate 9.90 51.50 87.15 60.88 35.94 Tailing 90.10 0.83 12.85 11.92 64.06 Feed 100.00 5.85 100.00 16.77 100.00
6000 Concentrate 10.10 50.00 86.32 57.84 34.84 Tailing 89.90 0.89 13.68 12.16 65.16 Feed 100.00 5.85 100.00 16.77 100.00

80
APPENDIX B
TABLES FOR MEDIUM GRADE TAILINGS
Table B.1 Results of the magnetic concentration for -1000 µm
Particle Size (µm)
Magnetic Field
(Gauss) Products
Weight (%)
Fe3O4 (%)
Recovery of Fe3O4
(%)
Fe (%)
Recovery of Fe (%)
-1000
400 Concentrate 3.57 57.80 10.79 65.28 7.26 Tailing 96.43 17.70 89.21 30.87 92.74 Feed 100.00 19.13 100.00 32.10 100.00
1000 Concentrate 32.43 50.45 85.53 59.20 59.81 Tailing 67.57 4.10 14.47 19.09 40.19 Feed 100 19.13 100.00 32.10 100.00
2000 Concentrate 38.87 47.60 96.72 57.85 70.05 Tailing 61.13 1.03 3.28 15.73 29.95 Feed 100.00 19.13 100.00 32.10 100.00
3000 Concentrate 41.17 45.16 97.19 54.63 70.07 Tailing 58.83 0.91 2.81 16.33 29.93 Feed 100.00 19.13 100.00 32.10 100.00
4000 Concentrate 45.73 39.52 94.47 53.01 75.52 Tailing 54.27 1.95 5.53 14.48 24.48 Feed 100.00 19.13 100.00 32.10 100.00
5000 Concentrate 48.00 37.95 95.22 53.42 79.88 Tailing 52.00 1.76 4.78 12.42 20.12 Feed 100.00 19.13 100.00 32.10 100.00
6000 Concentrate 49.57 37.70 97.69 51.40 79.37 Tailing 50.43 0.88 2.31 13.13 20.63 Feed 100.00 19.13 100.00 32.10 100.00

81
Table B.2 Results of the magnetic concentration for -833 µm
Particle Size (µm)
Magnetic Field
(Gauss) Products
Weight (%)
Fe3O4 (%)
Recovery of Fe3O4
(%)
Fe (%)
Recovery of Fe (%)
-833
400 Concentrate 5.57 59.50 17.44 66.39 11.57 Tailing 94.43 16.61 82.56 29.92 88.43 Feed 100.00 19.00 100.00 31.95 100.00
1000 Concentrate 32.00 52.00 87.58 64.16 64.26 Tailing 68.00 3.47 12.42 16.79 35.74 Feed 100.00 19.00 100.00 31.95 100.00
2000 Concentrate 36.67 49.60 95.73 58.53 67.18 Tailing 63.33 1.28 4.27 16.56 32.82 Feed 100.00 19.00 100.00 31.95 100.00
3000 Concentrate 40.00 46.00 96.84 56.24 70.41 Tailing 60.00 1.00 3.16 15.76 29.59 Feed 100.00 19.00 100.00 31.95 100.00
4000 Concentrate 41.67 44.00 96.50 53.82 70.19 Tailing 58.33 1.14 3.50 16.33 29.81 Feed 100.00 19.00 100.00 31.95 100.00
5000 Concentrate 42.00 44.20 97.71 54.22 71.28 Tailing 58.00 0.75 2.29 15.82 28.72 Feed 100.00 19.00 100.00 31.95 100.00
6000 Concentrate 43.33 43.15 98.40 53.62 72.72 Tailing 56.67 0.53 1.60 15.38 27.28 Feed 100.00 19.00 100.00 31.95 100.00

82
Table B.3 Results of the magnetic concentration for -500 µm
Particle Size (µm)
Magnetic Field
(Gauss) Products
Weight (%)
Fe3O4 (%)
Recovery of Fe3O4
(%)
Fe (%)
Recovery of Fe (%)
-500
400 Concentrate 6.30 59.70 19.74 66.94 13.17 Tailing 93.70 16.32 80.26 29.66 86.83 Feed 100.00 19.05 100.00 32.01 100.00
1000 Concentrate 32.5 53.35 91.02 64.72 65.71 Tailing 67.50 2.54 8.98 16.26 34.29 Feed 100.00 19.05 100.00 32.01 100.00
2000 Concentrate 35.60 51.10 95.49 58.53 65.09 Tailing 64.40 1.33 4.51 17.35 34.91 Feed 100.00 19.05 100.00 32.01 100.00
3000 Concentrate 37.68 48.74 96.41 58.19 69.25 Tailing 62.32 1.10 3.59 15.62 30.75 Feed 100.00 19.05 100.00 31.66 32.01
4000 Concentrate 39.15 47.42 97.45 57.04 69.76 Tailing 60.85 0.80 2.55 15.91 30.24 Feed 100.00 19.05 100.00 32.01 100.00
5000 Concentrate 39.98 46.36 97.30 56.64 70.74 Tailing 60.02 0.86 2.70 15.60 29.26 Feed 100.00 19.05 100.00 32.01 100.00
6000 Concentrate 40.69 45.66 97.53 55.43 70.46 Tailing 59.31 0.79 2.47 15.94 29.54 Feed 100.00 19.05 100.00 32.01 100.00

83
Table B.4 Results of the magnetic concentration for -250 µm
Particle Size (µm)
Magnetic Field
(Gauss) Products
Weight (%)
Fe3O4 (%)
Recovery of Fe3O4
(%)
Fe (%)
Recovery of Fe (%)
-250
400 Concentrate 12.53 58.70 38.51 65.83 25.73 Tailing 87.47 13.43 61.49 27.22 74.27 Feed 100.00 19.10 100.00 32.06 100.00
1000 Concentrate 30.33 58.1 92.26 65.55 62.01 Tailing 69.67 2.12 7.74 17.48 37.99 Feed 100.00 19.10 100.00 32.06 100.00
2000 Concentrate 32.27 56.75 95.88 65.00 65.43 Tailing 67.73 1.16 4.12 16.37 34.57 Feed 100.00 19.10 100.00 32.06 100.00
3000 Concentrate 32.83 56.18 96.56 64.86 66.42 Tailing 67.17 0.98 3.44 16.03 33.58 Feed 100.00 19.10 100.00 32.06 100.00
4000 Concentrate 33.97 55.00 97.82 64.79 68.65 Tailing 66.03 0.63 2.18 15.22 31.35 Feed 100.00 19.10 100.00 32.06 100.00
5000 Concentrate 34.17 54.85 98.13 64.75 69.01 Tailing 65.83 0.54 1.87 15.09 30.99 Feed 100.00 19.10 100.00 32.06 100.00
6000 Concentrate 34.77 53.60 97.57 64.74 69.05 Tailing 65.23 0.71 2.43 15.47 30.95 Feed 100.00 19.10 100.00 32.60 100.00

84
Table B.5 Results of the magnetic concentration for -106 µm
Particle Size (µm)
Magnetic Field
(Gauss) Products
Weight (%)
Fe3O4 (%)
Recovery of Fe3O4
(%)
Fe (%)
Recovery of Fe (%)
-106
400 Concentrate 1.40 68.70 5.05 67.90 2.97 Tailing 98.60 18.35 94.95 31.50 97.03 Feed 100.00 19.05 100.00 32.01 100.00
1000 Concentrate 24.73 68.83 89.35 67.50 52.15 Tailing 75.27 2.69 10.65 20.35 47.85 Feed 100.00 19.05 100.00 32.01 100.00
2000 Concentrate 26.17 68.53 94.14 67.75 55.39 Tailing 73.83 1.51 5.86 19.34 44.61 Feed 100.00 19.05 100.00 32.01 100.00
3000 Concentrate 26.67 68.18 95.45 67.78 56.47 Tailing 73.33 1.18 4.55 19.00 43.53 Feed 100.00 19.05 100.00 32.01 100.00
4000 Concentrate 26.60 68.93 96.25 68.00 56.51 Tailing 73.40 0.97 3.75 18.97 43.49 Feed 100.00 19.05 100.00 32.01 100.00
5000 Concentrate 27.30 68.03 97.49 67.76 57.79 Tailing 72.70 0.66 2.51 18.59 42.21 Feed 100.00 19.05 100.00 32.01 100.00
6000 Concentrate 26.87 68.75 96.97 67.95 57.04 Tailing 73.13 0.79 3.03 18.80 42.96 Feed 100.00 19.05 100.00 32.01 100.00

85
Table B.6 Results of the magnetic concentration for -75 µm
Particle Size (µm)
Magnetic Field
(Gauss) Products
Weight (%)
Fe3O4 (%)
Recovery of Fe3O4
(%)
Fe (%)
Recovery of Fe (%)
-75
400 Concentrate 1.70 67.50 6.09 67.70 3.62 Tailing 98.30 18.01 93.91 31.20 96.38 Feed 100.00 18.85 100.00 31.82 100.00
1000 Concentrate 21.17 70.23 78.87 67.80 45.11 Tailing 78.83 5.05 21.13 22.16 54.89 Feed 100.00 18.85 100.00 31.82 100.00
2000 Concentrate 25.00 69.73 92.48 68.10 53.50 Tailing 75.00 1.89 7.52 19.73 46.50 Feed 100.00 18.85 100.00 31.82 100.00
3000 Concentrate 25.13 69.40 92.52 68.20 53.86 Tailing 74.87 1.88 7.48 19.61 46.14 Feed 100.00 18.85 100.00 31.82 100.00
4000 Concentrate 25.27 69.83 93.61 68.30 54.24 Tailing 74.73 1.61 6.39 19.48 45.76 Feed 100.00 18.85 100.00 31.82 100.00
5000 Concentrate 25.57 69.87 94.78 68.25 54.84 Tailing 74.43 1.32 5.22 19.30 45.16 Feed 100.00 18.85 100.00 31.82 100.00
6000 Concentrate 25.80 69.98 95.78 68.15 55.26 Tailing 74.20 1.07 4.22 19.19 44.74 Feed 100.00 18.85 100.00 31.82 100.00

86
APPENDIX C
TABLES FOR HIGH GRADE TAILINGS
Table C.1 Results of the magnetic concentration for -1000 µm
Particle Size (µm)
Magnetic Field
(Gauss) Products
Weight (%)
Fe3O4 (%)
Recovery of Fe3O4
(%)
Fe (%)
Recovery of Fe (%)
-1000
400 Concentrate 18.10 68.90 33.67 64.30 28.11 Tailing 81.90 30.00 66.33 36.34 71.89 Feed 100.00 37.04 100.00 41.40 100.00
1000 Concentrate 57.77 62.78 97.92 60.80 84.84 Tailing 42.23 1.83 2.08 14.86 15.16 Feed 100.00 37.04 100.00 41.40 100.00
2000 Concentrate 59.73 61.62 99.37 59.68 86.10 Tailing 40.27 0.58 0.63 14.29 13.90 Feed 100.00 37.04 100.00 41.40 100.00
3000 Concentrate 61.07 60.40 99.58 58.50 86.29 Tailing 38.93 0.39 0.42 14.58 13.71 Feed 100.00 37.04 100.00 41.40 100.00
4000 Concentrate 61.13 60.42 99.72 58.51 86.39 Tailing 38.87 0.27 0.28 14.49 13.61 Feed 100.00 37.04 100.00 41.40 100.00
5000 Concentrate 62.60 59.02 99.75 57.16 86.43 Tailing 37.40 0.25 0.25 15.02 13.57 Feed 100.00 37.04 100.00 41.40 100.00
6000 Concentrate 63.03 58.73 99.94 56.88 86.60 Tailing 36.97 0.06 0.06 15.01 13.40 Feed 100.00 37.04 100.00 41.40 100.00

87
Table C.2 Results of the magnetic concentration for -833 µm
Particle Size (µm)
Magnetic Field
(Gauss) Products
Weight (%)
Fe3O4 (%)
Recovery of Fe3O4
(%)
Fe (%)
Recovery of Fe (%)
-833
400 Concentrate 19.13 70.65 36.51 65.96 30.59 Tailing 80.87 29.06 63.49 35.40 69.41 Feed 100.00 37.02 100.00 41.25 100.00
1000 Concentrate 58.53 62.80 99.29 60.82 86.30 Tailing 41.47 0.63 0.71 13.63 13.70 Feed 100.00 37.02 100.00 41.25 100.00
2000 Concentrate 59.07 61.94 98.83 59.99 85.91 Tailing 40.93 1.06 1.17 14.20 14.09 Feed 100.00 37.02 100.00 41.25 100.00
3000 Concentrate 59.53 61.76 99.31 59.81 86.31 Tailing 40.47 0.63 0.69 13.95 13.69 Feed 100.00 37.02 100.00 41.25 100.00
4000 Concentrate 60.02 61.42 99.58 59.48 86.55 Tailing 39.98 0.39 0.42 13.88 13.45 Feed 100.00 37.02 100.00 41.25 100.00
5000 Concentrate 60.98 60.60 99.82 58.69 86.76 Tailing 39.02 0.17 0.18 13.99 13.24 Feed 100.00 37.02 100.00 41.25 100.00
6000 Concentrate 60.89 60.60 99.67 58.69 86.63 Tailing 39.11 0.31 0.33 14.10 13.37 Feed 100.00 37.02 100.00 41.25 100.00

88
Table C.3 Results of the magnetic concentration for -500 µm
Particle Size (µm)
Magnetic Field
(Gauss) Products
Weight (%)
Fe3O4 (%)
Recovery of Fe3O4
(%)
Fe (%)
Recovery of Fe (%)
-500
400 Concentrate 14.97 70.00 28.32 65.35 23.77 Tailing 85.03 31.19 71.68 36.89 76.23 Feed 100.00 37.00 100.00 41.15 100.00
1000 Concentrate 53.40 65.78 94.94 63.57 82.49 Tailing 46.60 4.02 5.06 15.46 17.51 Feed 100.00 37.00 100.00 41.15 100.00
2000 Concentrate 55.23 65.68 98.04 63.47 85.19 Tailing 44.77 1.62 1.96 13.62 14.81 Feed 100.00 37.00 100.00 41.15 100.00
3000 Concentrate 55.93 65.18 98.53 63.24 85.95 Tailing 44.07 1.24 1.47 13.12 14.05 Feed 100.00 37.00 100.00 41.15 100.00
4000 Concentrate 57.37 64.28 99.67 62.43 87.04 Tailing 42.63 0.29 0.33 12.51 12.96 Feed 100.00 37.00 100.00 41.15 100.00
5000 Concentrate 58.30 63.10 99.43 61.61 87.29 Tailing 41.70 0.51 0.57 12.55 12.71 Feed 100.00 37.00 100.00 41.15 100.00
6000 Concentrate 58.60 63.02 99.81 62.02 88.32 Tailing 41.40 0.17 0.19 11.61 11.68 Feed 100.00 37.00 100.00 41.15 100.00

89
Table C.4 Results of the magnetic concentration for -250 µm
Particle Size (µm)
Magnetic Field
(Gauss) Products
Weight (%)
Fe3O4 (%)
Recovery of Fe3O4
(%)
Fe (%)
Recovery of Fe (%)
-250
400 Concentrate 10.50 70.00 19.97 65.35 16.82 Tailing 89.50 32.91 80.03 37.92 83.18 Feed 100.00 36.80 100.00 40.80 100.00
1000 Concentrate 50.00 68.36 92.88 64.27 78.76 Tailing 50.00 5.24 7.12 17.33 21.24 Feed 100.00 36.80 100.00 40.80 100.00
2000 Concentrate 53.17 67.62 97.70 64.18 83.64 Tailing 46.83 1.81 2.30 14.25 16.36 Feed 100.00 36.80 100.00 40.80 100.00
3000 Concentrate 54.02 67.70 99.38 64.24 85.06 Tailing 45.98 0.50 0.62 13.26 14.94 Feed 100.00 36.80 100.00 40.80 100.00
4000 Concentrate 54.10 67.94 99.88 65.81 87.26 Tailing 45.90 0.10 0.12 11.32 12.74 Feed 100.00 36.80 100.00 40.80 100.00
5000 Concentrate 54.63 67.26 99.85 64.18 85.94 Tailing 45.37 0.12 0.15 12.65 14.06 Feed 100.00 36.80 100.00 40.80 100.00
6000 Concentrate 55.03 66.76 99.83 64.18 86.56 Tailing 44.97 0.14 0.17 12.19 13.44 Feed 100.00 36.80 100.00 40.80 100.00

90
Table C.5 Results of the magnetic concentration for -106 µm
Particle Size (µm)
Magnetic Field
(Gauss) Products
Weight (%)
Fe3O4 (%)
Recovery of Fe3O4
(%)
Fe (%)
Recovery of Fe (%)
-106
400 Concentrate 3.67 75.60 7.64 67.45 6.13 Tailing 96.33 34.82 92.36 39.36 93.87 Feed 100.00 36.32 100.00 40.39 100.00
1000 Concentrate 37.40 77.68 79.99 68.70 63.61 Tailing 62.60 11.61 20.01 23.48 36.39 Feed 100.00 36.32 100.00 40.39 100.00
2000 Concentrate 45.59 77.04 96.70 68.50 77.32 Tailing 54.41 2.20 3.30 16.84 22.68 Feed 100.00 36.32 100.00 40.39 100.00
3000 Concentrate 47.17 76.22 98.99 67.98 79.39 Tailing 52.83 0.69 1.01 15.76 20.61 Feed 100.00 36.32 100.00 40.39 100.00
4000 Concentrate 47.30 76.76 99.97 68.37 80.07 Tailing 52.70 0.02 0.03 15.28 19.93 Feed 100.00 36.32 100.00 40.39 100.00
5000 Concentrate 47.13 76.96 99.87 68.43 79.85 Tailing 52.87 0.09 0.13 15.39 20.15 Feed 100.00 36.32 100.00 40.39 100.00
6000 Concentrate 47.33 76.40 99.56 68.24 79.97 Tailing 52.67 0.30 0.44 15.36 20.03 Feed 100.00 36.32 100.00 40.39 100.00

91
Table C.6 Results of the magnetic concentration for -75 µm
Particle Size (µm)
Magnetic Field
(Gauss) Products
Weight (%)
Fe3O4 (%)
Recovery of Fe3O4
(%)
Fe (%)
Recovery of Fe (%)
-75
400 Concentrate 1.37 78.80 3.02 68.44 2.35
Tailing 98.63 35.10 96.98 39.50 97.65
Feed 100.00 35.70 100.00 39.90 100.00
1000 Concentrate 29.20 79.98 65.42 68.40 50.06
Tailing 70.80 17.44 34.58 28.15 49.94
Feed 100.00 35.70 100.00 39.90 100.00
2000 Concentrate 42.97 79.88 96.15 68.40 73.66
Tailing 57.03 2.41 3.85 18.43 26.34
Feed 100.00 35.70 100.00 39.90 100.00
3000 Concentrate 44.43 79.08 98.42 68.41 76.18
Tailing 55.57 1.02 1.58 17.11 23.82
Feed 100.00 35.70 100.00 39.90 100.00
4000 Concentrate 45.00 79.06 99.66 68.42 77.17
Tailing 55.00 0.22 0.34 16.57 22.83
Feed 100.00 35.70 100.00 39.90 100.00
5000 Concentrate 45.63 78.06 99.77 68.55 78.39
Tailing 54.37 0.15 0.23 15.86 21.61
Feed 100.00 35.70 100.00 39.90 100.00
6000 Concentrate 45.30 78.72 99.89 68.48 77.75
Tailing 54.70 0.07 0.11 16.23 22.25
Feed 100.00 35.70 100.00 39.90 100.00