production of precipitated calcium carbonate from marble...
TRANSCRIPT

PRODUCTION OF PRECIPITATED CALCIUM CARBONATE FROM MARBLE
WASTES
A THESIS SUBMITTED TO
THE GRADUATE SCHOOL OF NATURAL AND APPLIED SCIENCES
OF
MIDDLE EAST TECHNICAL UNIVERSITY
BY
NURETTİN SEZER
IN PARTIAL FULFILLMENT OF THE REQUIREMENTS
FOR
THE DEGREE OF MASTER OF SCIENCE
IN
MINING ENGINEERING
SEPTEMBER 2013


Approval of the thesis:
PRODUCTION OF PRECIPITATED CALCIUM CARBONATE FROM MARBLE
WASTES
submitted by NURETTİN SEZER in partial fulfillment of the requirements for the
degree of Master of Science in Mining Engineering Department, Middle East
Technical University by,
Prof. Dr. Canan Özgen
Dean, Graduate School of Natural and Applied Sciences
Prof. Dr. Ali İhsan Arol
Head of Department, Mining Engineering
Prof. Dr. Ali İhsan Arol
Supervisor, Mining Engineering Dept., METU
Examining Committee Members:
Prof. Dr. Özcan Y. Gülsoy
Mining Engineering Dept, HU
Prof. Dr. Ali İhsan Arol
Mining Engineering Dept., METU
Prof. Dr. Gülhan Özbayoğlu
Faculty of Engineering, ATU
Prof. Dr. M. Ümit Atalay
Mining Engineering Dept., METU
Asst. Prof. Dr. Nuray Demirel
Mining Engineering Dept., METU
Date: 26/08/2013

iv
I hereby declare that all information in this document has been obtained and presented
in accordance with academic rules and ethical conduct. I also declare that, as required
by these rules and conduct, I have fully cited and referenced all material and results
that are not original to this document.
Name, Last name: Nurettin, Sezer
Signature:

v
ABSTRACT
PRODUCTION OF PRECIPITATED CALCIUM CARBONATE FROM
MARBLE WASTES
Sezer, Nurettin
M. Sc., Department of Mining Engineering
Supervisor: Prof. Dr. Ali İhsan Arol
September 2013, 42 pages
The aim of this study was to investigate the production of precipitated calcium carbonate
from marble wastes. Limestone is used as the source for the production of precipitated
calcium carbonate. Marble wastes primarily constitute of CaCO3. As the major content of the
marble waste and limestone are the same, marble wastes can be used as an alternative source
for the production of precipitated calcium carbonate. By this way, both the adverse
environmental effects of marble wastes can be prevented and the wastes can be used as a
cheaper source for precipitated calcium carbonate manufacturing industry. Waste samples
were dissolved in pure water in an autoclave of 1 liter capacity by addition of CO2 gas.
Contained aqueous carbonates were precipitated by evaporation of the CO2 in the solution.
Concentration of dissolved carbonate species was examined for each test. Microstructure of
the marble wastes used in the experiments and the precipitated calcium carbonate obtained
from the experiments was investigated by Scanning Electron Microscopy, and their chemical
analyses were carried out. The results of the chemical analysis were comparatively
evaluated. The studies revealed that the precipitated calcium carbonate can be produced from
marble wastes. By the experimental studies, the required conditions for production have been
determined. In general, the experimental results in different conditions revealed that high
CO2 pressure, lower ambient temperature and high stirring speed had positive effect in the
dissolution of waste samples. The best result was obtained as 4.73 g/L dissolved CaCO3
under the conditions of -250 +106 µm particle size, 1400 rpm stirring speed, at 2 h, 8 °C and
10 atm CO2 pressure. The study recommends marble wastes as an alternative resource to
manufacture precipitated calcium carbonate with sufficient quality to meet the industrial
requirements.

vi
Keywords: Marble wastes, carbonate-water system, calcium carbonate dissolution,
precipitated calcium carbonate (PCC).

vii
ÖZ
MERMER ATIKLARINDAN ÇÖKTÜRÜLMÜŞ KALSİYUM
KARBONAT ÜRETİMİ
Sezer, Nurettin
Yüksek lisans, Maden Mühendisliği Bölümü
Tez Yöneticisi: Prof. Dr. Ali İhsan Arol
Eylül 2013, 42 sayfa
Bu çalışmanın amacı mermer atıklarından çöktürülmüş kalsiyum karbonat üretiminin
araştırılmasıdır. Çöktürülmüş kalsiyum karbonat üretiminde hammadde olarak kireçtaşı
kullanılmaktadır. Mermer atıklarının ana içeriği kalsiyum karbonattır. Mermer atıklarının ve
kireçtaşının ana içeriği aynı oluduğundan mermer atıkları, çöktürülmüş kalsiyum karbonat
üretiminde alternatif hammadde olarak kullanılabilir. Böylelikle hem mermer atıklarının
çevresel olumsuz etkileri önlenebilir, hem de bu atıklar çöktürülmüş kalsiyum karbonat
üretiminde daha ucuz kaynak olarak kullanılabilir. Yapılan deneysel çalışmalarda atık
numuneleri CO2 gazı ilavesiyle, 1 litre kapasiteli bir otoklav hücresinde saf su içinde farklı
koşullarda çözündürülmüştür. Hücredeki çözünmüş karbonatlar çözeltide çözünmüş CO2
gazının buharlaştırılması ile çöktürülmüştür. Her deneyde çözünmüş karbonat türlerinin
derişimi hesaplanmıştır. Deneylerde kullanılan mermer atık numunelerinin ve deneylerden
elde edilen çöktürülmüş kalsiyum karbonatın kimyasal analizleri yapılıp karşılaştırmalı
olarak değerlendirilmiş ve mikro ölçekli yapıları Taramalı elektron mikroskobu ile
incelenmiştir. Çalışmalar mermer atıklarından çöktürülmüş kalsiyum karbonatın
üretilebileceğini ortaya koymuştur. Yapılan deneyler ile üretim için gerekli koşullar
belirlenmiştir. Farklı koşullarda gerçekleştirilen deney sonuçları genel anlamda yüksek CO2
basıncı, düşük sıcaklık ve yüksek karıştırma hızının atık numunelerinin çözünmesini pozitif
yönde etkilediğini ortaya koymuştur. En iyi sonuç, -250 +106 µm tane boyu, 1400 rpm
karıştırma hızı, 2 saat süre, 8 °C sıcaklık ve 10 atm CO2 basıncında 4.73 g/L çözünmüş
CaCO3 olarak elde edilmiştir. Çalışmalar endüstride istenen kaliteye sahip çöktürülmüş
kalsiyum karbonat üretimi için mermer atıklarının alternatif kaynak olarak
kullanılabileceğini ortaya koymuştur.

viii
Anahtar kelimeler: Mermer atıkları, karbonat-su sistemi, kalsiyum karbonat çözünümü,
çöktürülmüş kalsiyum karbonat (PCC).

ix
DEDICATION
To My Family

x
ACKNOWLEDGEMENT
I would like to express my special thanks to my advisor Prof. Dr. Ali İhsan Arol for his
enthusiastic guidance and patience throughout this study. I am also so grateful to my advisor
for encouraging me in this fascinating field and for letting me benefit from his profound
mind and knowledge.
I would like to thank technical staff of the department, especially, Tahsin Işıksal, Caner
Baytar, and Aytekin Arslan for their support, research assistants in Mining Engineering
Department, especially Mustafa Çırak for their technical support in experimental period of
this thesis.
I also wish to express my gratitude to my family especially, to my parents Gülseven and
Mustafa Sezer, whom I can not thank enough for their patience, support, and encouragement
to finish master of science study and this thesis.
Lastly, my greatest gratitude goes to my dear wife Büşra Sezer for her unbelievable patience,
support, and love while I was writing this thesis.

xi
TABLE OF CONTENTS
ABSTRACT .............................................................................................................................. v
ÖZ ........................................................................................................................................... vii
ACKNOWLEDGEMENT ........................................................................................................ x
TABLE OF CONTENTS ......................................................................................................... xi
LIST OF TABLES ................................................................................................................. xiii
LIST OF FIGURES ............................................................................................................... xiv
CHAPTERS
1 INTRODUCTION ................................................................................................................ 1
1.1 Limestone ................................................................................................................. 2
1.2 Marble ...................................................................................................................... 2
1.3 Marble Wastes ......................................................................................................... 4
1.4 Precipitated Calcium Carbonate ............................................................................... 9
1.4.1 Synthetic PCC Production Methods .............................................................. 13
1.4.1.1 Lime Soda Process (Kraft pulping method) .................................................. 14
1.4.1.2 Calcium Chloride Process (Mixing of Solutions) .......................................... 15
1.4.1.3 Carbonation Process...................................................................................... 15
1.5 Dissolution Chemistry of CaCO3 in CaCO3-H2O System with Externally Fixed
Pressure of CO2 .................................................................................................................. 17
1.6 Possible Production Route of PCC from Marble Wastes ....................................... 18

xii
1.7 Aim of This Study .................................................................................................. 22
2 MATERIALS AND METHODS ........................................................................................ 25
2.1 Materials ................................................................................................................. 25
2.2 Methods .................................................................................................................. 26
2.2.1 Sample Preparation ......................................................................................... 26
3 RESULTS AND DISCUSSION ......................................................................................... 29
3.1 Effect of Time on Dissolution ................................................................................ 29
3.3 Effect of CO2 Pressure on Dissolution ................................................................... 31
3.5 Effect of Temperature on Dissolution .................................................................... 33
3.6 Morphological Study .............................................................................................. 34
4 CONCLUSIONS & RECOMMENDATIONS ................................................................... 37
4.1 Conclusion .............................................................................................................. 37
4.2 Recommendations .................................................................................................. 38
REFERENCES ....................................................................................................................... 39

xiii
LIST OF TABLES
TABLES
Table 1 Physical properties of a marble slurry [13] ................................................................ 6
Table 2 Chemical analysis of a marble slurry [13].................................................................. 6
Table 3 Particle size distribution of a marble slurry [13] ........................................................ 7
Table 4 PCC global consumption rates [19] ........................................................................... 9
Table 5 Typical chemical specifications of a PCC product [23] ........................................... 12
Table 6 Typical physical properties of a PCC product [23] .................................................. 13
Table 7 Equilibriums and equilibrium constant values for carbonate systems [31] .............. 21
Table 8 ICP analysis results of marble waste sample............................................................ 25
Table 9 ICP analysis results of PCC product ........................................................................ 36
xiv
LIST OF FIGURES
FIGURES
Figure 1 Rock fragments deriving by cutting and sawing of stone [13] ................................. 4
Figure 2 Shapeless blocks deriving by quarrying operation [13] ............................................ 5
Figure 3 Muds produced by sawing and polishing operations on slabs (Air dried filter-
pressed mud) [13] ..................................................................................................................... 5
Figure 4 Examples to views of marble waste piles [13] .......................................................... 8
Figure 5 Crystal structure of calcite [25] ............................................................................... 10
Figure 6 Some of the PCC production methods and their final products [26] ...................... 14
Figure 7 Dependency of calcination reaction on temperature - pressure values [27] ............ 15
Figure 8 Concentrations of calcium and carbonate species in the solution originated from
CaCO3 as a function of the partial pressure of CO2 [32] ....................................................... 19
Figure 9 Concentrations of calcium and carbonate species in the solution originated from
CaCO3 as a function of the partial pressure of CO2 including complexes and ion pairs [32]
................................................................................................................................................ 20
Figure 10 A hypothetical flowsheet of the PCC production process ..................................... 23
Figure 11 Experimental set up for a batch run ...................................................................... 27
Figure 12 The autoclave and the CO2 cylinder connected to it ............................................. 28
Figure 13 CaCO3 formation as a function of time ................................................................. 30
Figure 14 CaCO3 formation as a function of particle size of starting material ..................... 31
Figure 15 CaCO3 formation as a function of CO2 pressure ................................................... 32
Figure 16 CaCO3 formation as a function of stirring speed .................................................. 33
Figure 17 CaCO3 formation as a function of temperature ..................................................... 34

xv
Figure 18 SEM images of the waste sample ......................................................................... 35
Figure 19 SEM images of the PCC sample obtained at 8 ºC ................................................ 35


1
CHAPTER 1
INTRODUCTION
The most common organic compound, accounting for more than 4 % of the earth’s crust is
calcium carbonate (CaCO3). It occurs in three crystal forms as calcite, aragonite and vaterite
and they are among the most important rock forming minerals. CaCO3 is found in varieties
of places like sea shells, calcitic rocks, coral reefs, stalactites and stalagmites formations in
the caves. These natural resources are linked by calcium carbonate cycle [1].
Dissolved CaCO3 is absorbed by animals and plants in water. These living creatures use
CaCO3 to build up their skeletons and shells. After their death, mussels, corals, algae, and
coccoliths form sedimentary deposits on sea beds. Thus, the rock forming process starts. The
first stage is the sedimentation process, from which chalk or limestone originates. If the
process occurs in magnesium containing water, dolomitization may result and lead to
formation of dolomite [1].
CaCO3 rocks occur throughout the world and are readily available. But, the required qualities
of the CaCO3 are different according to variouss industries. For the production of top quality
natural CaCO3, the purity, whiteness and homogeneity of the rock should be appropriate and
even then intensive treatment may be required. Precipitated CaCO3 is a synthetic CaCO3,
which is produced industrially by recarbonization [1].
CaCO3 is an important chemical compound in several industries. Construction industry is the
major CaCO3 consumer, which use the CaCO3 as a building material; the iron industry use it
for purification; the oil industry uses CaCO3 as an ingredient in drilling fluid. CaCO3
neutralizes stomach acid, it is also used for neutralizing the acidic soil and water [2].
CaCO3 is used as filling agents. Ground and precipitated CaCO3 are used as fillers in the
papermaking industries. High quality papers are manufactured by using CaCO3 products as
fillers. CaCO3 is also used in other industries as a filler, including sealant, plastic and paint
[2].

2
1.1 Limestone
Limestone is a common type of sedimentary rock which primarily constitute of CaCO3.
Limestone is formed by the accumulation of sea animal shells or by crystallization from
water. In the seas, when the shelled animals died, they fall to the bottom of the sea. Because
these shells are composed of CaCO3, in time, thick layers of CaCO3 are formed and
transformed to solid rocks at the bottom of the seas. Crystallization process occurs by
combination of calcium ions in the water with CO2 dissolved in water or from the
atmosphere to produce insoluble CaCO3. Then the CaCO3 precipitates down in the water. By
this process, calcium carbonate layers are formed in thousands of years. These layers are
transformed to solid rocks through compression generated by overlying materials [3].
If the compression, which the CaCO3 layers are exposed to, is high, then the crystallization
process is better and limestone is formed. If it is poor, little crystallization occurs and soft
chalk results [3].
Pure calcite, dolomite, and aragonite present in the limestone are white in color. With
impurities, the color of limestone can change from white to tan or gray. High pressure, heat
and time cause limestone to metamorphosis. As a result of this process, marbles with
different colors and characteristics are formed [3].
Limestone and marble are widely used for constructions, in different forms, such as
dimensional stone, crushed stone or aggregate for building, in roadbeds and as a component
in concrete, respectively. At elevated temperatures, limestone decomposes into CaO (lime)
and CO2 gas. CaO has a wide use area in industry, including precipitated calcium carbonate
production [3].
Limestone is also the source of ground CaCO3. Ground CaCO3 can be in different size
ranges. They can be manufactured from 1- 2 mm down to 1 to 5 µm particle size intervals in
accordance with industrial demands [3].
1.2 Marble
Marble is a term derived from “marmaros” meaning shining stone. It is a metamorphic rock
formed by the alteration of limestone or dolomite rock by heat and pressure, over thousands
of years. Due to the subduction of a limestone, heating may be regional or it may be
originated from contact metamorphism where the magma intrudes into a limestone, resulting
in partial melting [4]. As a result of this process, marble stones with a very tight crystalline
structure and small but definite porosity are formed [5].
Marbles have high reactivity with acids so they readily decompose in contact with even
weak acids, and will strongly boil in the presence of strong acids. Marble is also a relatively
soft rock, having a hardness degree of 3 in Mohs hardness scale, it can be scratched by most
of the materials [4].

3
Marble is made of more than 90 % calcite (calcium carbonate). It is the remaining
percentage of "impurities" which give many different varieties of colors and characteristics
to marbles. Marble can be translucent, white, brown, red, green, grey and even black. It can
have a uniform color and texture or have spots, swirls or veins [6]. Marbles can be used for
statuary, ornamental and architectural purposes, based on the aforementioned properties.
One of the important properties of marble is its ability to achieve a natural glasslike polish
without the need of waxes or any other chemical compounds. Marble is polished only by
abrasion and it eventually reaches its natural glossy luster. And as long as it is well cared for,
this luxurious finish can last even for centuries [6]. Marble is proven to be the most heat
resistant natural material available on the earth [7]. Owing to this, it is a natural air
conditioner when used in the houses.
Many famous monuments all over the world like Taj Majal and el Alhambra were built by
using marble. In Greek architecture, marble had a great importance and was the principal
building material for the Parthenon and the Acropolis [6].
Many rich marble deposits in countries like Portugal, Spain, Italy, Greece, Turkey, Iran and
Pakistan are all located in Alpine-Himalayan belt. As a result of its geological location,
Turkey has very rich and natural stone reserves in wide variety of colours and patterns [8].
Types of marble produced in Turkey and well known in international markets are, Suprene,
Elazığ Cherry, Akşehir Black, Manyas White, Bilecik Beige, Tiger Hide, Denizli Travertine,
Aegean Burgundy, Milas Lilac, Gemlik Diabase and Afyon Sugar [8].
In Turkey, there are 2100 marble mines, 1500 plants in small and medium scale and 7500
workshops where nearly 250000 individuals are employed, in the marble sector. Almost all
of the production is made by the private sector. While the production of natural stone in
Turkey in 2009 was nearly 4 million m3 in 2010 nearly 5 million m
3 production was carried
out and the existing processing facilities have a total plate production capacity of 6.5 million
m3. In 2009, Turkey is ranked as the 3rd in the marble and travertine production in the world
[9].
Marble is exported either in blocks or cut and polished material. In natural stone exports, the
products with the highest added value have always been processed marble and travertine.
The export potential of the sector is developing quickly parallel to investments. Between
2004 and 2010, our exports of natural stone had rised from 2.6 million tons to 6.6 million
tons, displayed an increase by 154 %. By this way, export income increased by 152 % from
621 million dollars to 1568 million dollars. Majority of the 2010 natural stone exports
consists of processed products [9].

4
1.3 Marble Wastes
One of the most extensively used aesthetic stones is marble [10]. Turkey has approximately
3872 million m3 of worthful marble reserve [8]. On the other hand, marble manufacturing
industry produces high amount of waste [11]. Waste generation continues from mining
process to finished product and is about 50% of marble mined [12].
The process of quarrying the marble stones is performed in order to produce slabs and tiles,
which are widely used in the construction industry for high quality flooring and wall
cladding purposes. In the process of converting in-situ stone deposits to the final product,
significant amount of waste is generated in both the mine site and processing and polishing
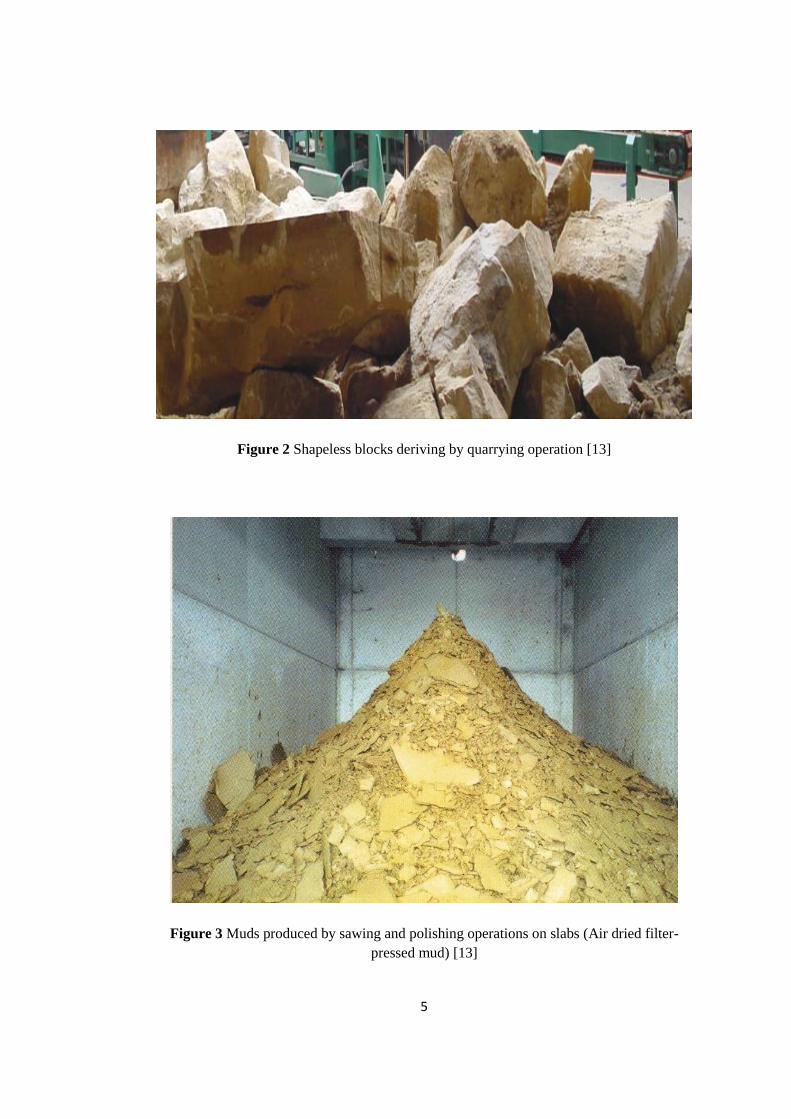
plant. The waste is generated at two stages, first is in the form of fragments, Figure 1, and
shapeless blocks, Figure 2, which have no commercial value. Second is generated in the
form of fine powder during cutting of in-situ stone and the production of polished slabs and
tiles from commercial sized blocks Figure 3.
Figure 1 Rock fragments deriving by cutting and sawing of stone [13]
5
Figure 2 Shapeless blocks deriving by quarrying operation [13]
Figure 3 Muds produced by sawing and polishing operations on slabs (Air dried filter-
pressed mud) [13]

6
During the processing of marble, the raw stone block is cut to desired dimensions either into
tiles or slabs of various thicknesses (usually 2 or 4cm), by using synthetic diamond blades.
Water is sprayed on blades while stone blocks are cut into sheets to cool the blades and
absorbs the dust produced during the cutting operation. The amount of waste water from this
operation is rather great. It is not recycled as the water so highly alkaline that, if re-used, it
can dim the slabs to be polished [14]. In large factories, where the blocks are cut into slabs,
the cooling water is stored in pits until the suspended particles settle (sedimentation tanks),
then the slurry is collected in trucks and disposed of on the ground and left to dry. This water
carries large amounts of stone powder. Eventually, the sludge dries in the sun and its
particles become airborne [14]. This causes air pollution problems for the surrounding area.
Another solid waste generated by the marble units is the cutting waste which results from
cutting slabs into the required dimensions [14]. Chemical analysis, physical properties and
particle size distribution of a marble slurry are specified in Tables 1 - 3.
Table 1 Physical properties of a marble slurry [13]
Property Result
Bulk Density (g/cm3) 1.3 - 1.5
Specific Gravity 2.83 - 2.87
Particle size (µm) Less than 363.5
Table 2 Chemical analysis of a marble slurry [13]
Test Carried Out Test Value %
CaO 49.07
SiO2 1.69
Al2O3 1.04
Fe2O3 0.21
MgO 4.47
Na2CO3 Less than 0.01
K2SO4 Less than 0.01
Loss on ignition 43.46

7
Table 3 Particle size distribution of a marble slurry [13]
Particle Size (m) % Finer by Volume
- 363.1 100
193.0 - 205.8 90
130 - 140 80
81.0 - 94.7 70
54.5 - 62.51 60
37.5 - 43.1 50
23.9 - 28.1 40
14.24 - 15.2 30
5.9 - 7.15 20
1.23 - 1.69 10
0.321 0.00
Unless stored properly in sedimentation tanks, the fine particles can cause more pollution
than other forms of marble waste. The fine particles can be easily dispersed after losing
humidity, under atmospheric conditions, such as wind and rain. The white dust particles
usually contain CaCO3, thus it can visually pollute the environment [14].
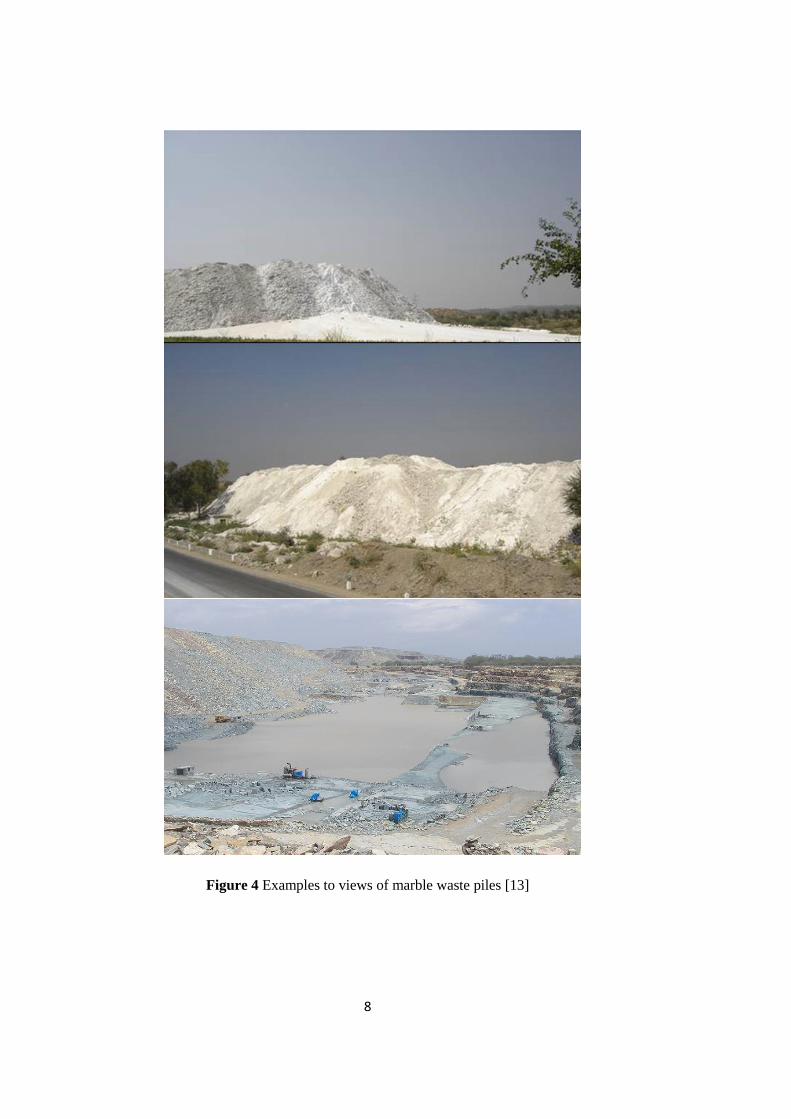
Waste piles are usually used to store all the marble wastes of large and small sizes generated
during quarrying and fabrication, Figure 4. They alter topography, occupy land, degrade
surface and subterranean water, pollute the environment visually and the air and they have
negative impact on the agriculture and health [8]. These wastes also cause certain economic
losses. Consequently, utilization of the marble wastes; i.e. slurry, powder, rock fragments,
shapeless blocks has many benefits on the protection of the environment and will contribute
economically.
There have been various studies on utilization of marble wastes. Some of them are; as a filler
material for roads and embankments, for bricks manufacturing, for the manufacture of
portland cement and ceramic tiles [13]. The primary aim of all these studies were to
eliminate the adverse environmental effect of marble wastes.
8
Figure 4 Examples to views of marble waste piles [13]

9
1.4 Precipitated Calcium Carbonate
Calcium carbonate (CaCO3) is aboundantly present on the earth. Natural, ground or synthetic
CaCO3 is widely used in various industries. The product, produced by a controlled synthesis
to fulfill the desired properties is called precipitated calcium carbonate (PCC). It is also
called as synthetic, refined or purified CaCO3. PCCs have the same chemical formula as of
its natural resources limestone, chalk and marble; CaCO3. PCCs gain advantages over natural
and ground CaCO3 with their unique properties of submicron particle size, regular crystal
shape, narrow particle size distribution and high purity. Unlike ground CaCO3, PCCs can be
produced in different crystal shapes and in ultrafine particle sizes. PCC is increasingly used
in industries such as paper, rubber, paint, textile, plastic, sealant, cosmetic, tooth paste and
food mainly as a filler product, Table 4, [15-17].
Commercial PCCs have been produced since 1841 [18]. PCC was first produced by an
English company, John E. Sturge Ltd., by treating the residual CaCl2 from their KClO3
production unit with Na2CO3 and CO2 to produce PCC. In 1898, the first milk of lime
process was practised in Birmingham [18].
Table 4 PCC global consumption rates [19]
Industry Consumption %
Paper 72.0
Paints 8.0
Plastics 5.0
Rubber 4.5
Food, cosmetics and
pharmaceuticals 4.0
Textile packing 2.5
Putties, caulks, sealants 2.5
Adhesives 1.0
Printing ink 0.5

10
In 2011, filler grade PCC consumption was 14 million tonnes in the world, with Asia
account for more than 50 % of the total consumption. The largest markets for CaCO3 are the
paper and plastics industry. They constitute 26 % of total PCC consumption in 2011 [19].
The major benefit of paper made by adding PCC is the expectancy of much longer life than
that of traditionally manufactured paper, i.e. more than 1000 years for the best paper and 500
years for average life time [20].
PCC can be obtained in three main crystal polymorphs: calcite (rhombohedral), aragonite
(orthorhombic), and vaterite (hexagonal) depending on the reaction conditions and impurities
in the process. Of these, calcite, which forms rhombohedral crystals, Figure 5, is the most
thermodynamically stable under ambient conditions [22]. Aragonite is more soluable and
denser than calcite. Aragonite usually forms needle-like orthorhombic crystals and is
favoured at high temperatures and pressures. It is metastable, converting slowly to calcite
[22]. Vaterite is the thermodynamically least stable polymorph, and its hexagonal crystals
are rarely seen in the naturally occurring mineral [22]. Since different polymorphs impart
different properties, control over the crystal form is important to end users [22]. Typical
product specifications of a PCC product is given in Tables 5 - 6, but the desired properties of
it generally varies according to its field of application.
Figure 5 Crystal structure of calcite [25]

11
In paper, PCCs enhances the smoothness, brightness, and opacity of paper. It also increases
receptivity of the ink [21]. In paint, CaCO3 is used as the primary extender compound to
reduce consumption of higher cost pigments, like TiO2. Fine sized and narrowly ranged PCC
grains provide gaps among TiO2 particles and improve their hiding power [19]. By this
extension, the opacity is improved. CaCO3 consumption in this market was 8.8 Mt in 2011,
with GCC accounting for 7 Mt and PCC for 1.8 Mt [19].
The usual product specifications for PCC is purity of more than 99 %, density of 2.7 g/cm3,
particle size for filler pigments of 70 % < 2 µm, and the specific surface area of about 10
m2/g. The particle size has a significant effect on smoothness, gloss and printing
characteristics of the paper. Characteristics of printing are also in relation to the particle size
range and particle shape of PCC, which also directly affects the consumption of chemical
additives in papermaking. The brightness of the PCC filler pigments should be higher than
93 %, and the pH of 1 mol of PCC in 1 L solution should be 9. Average particle size of PCCs
as coating pigment should be in 0.4 to 2 µm size range, refraction index of 1.49 – 1.67 and a
specific surface area of 4 – 11 m2/g. Narrower particle size ranges and higher refraction
indexes of PCCs improves light scattering of the sheets. The ISO standards for brightness of
PCCs as a coating pigment is 95 %, which necessitates a CaCO3 source with a high purity in
order to be used as a raw material [27].
For PCC manufacturing industry, raw material should contain low manganese and iron as
mineral impurities because these elements have detrimental effects on the brightness of the
product [27].

12
Table 5 Typical chemical specifications of a PCC product [23]
Chemical Properties
Color Bright White
Hunter Whiteness 97 % Min.
CaCO3 % by Weight 98.5 Min.
Lead as Pb Traces
Copper as Cu Negligible
Arsenic as As NIL
Sulphate as SO4 0.2 % Max.
Soluble alkali as Na2O 0.15 % Max.
Silica as SiO2 0.07 % Max.
Iron as Fe 0.01 % Max.
pH 9.0 to 10.5
Phosphate as PO4 0.05 % Max.
Chloride as Cl Traces
Magnesium as MgO 0.7 % Max.
Flouride as F Traces
Manganese (Mn) 0.005 % Max.
Solution in 5N HCL Clear
Aluminum, Iron, Phosphate and other matter
insoluble in HCL – IS 918/1985 0.5 % Max.

13
Table 6 Typical physical properties of a PCC product [23]
Physical Properties
Crystal Structure Calcitic
Water Absorption 80 to 85 ml/100 g
Oil Absorption 60 to 65 ml/100 g
Loss on Drying at 105 ºC 0.8 % Max.
Specific Gravity 2.6 to 2.7
Bulk Density 0.45 to 0.50 g/cm3
Average Particle Size 3 to 5 μm
Residue on 300 mesh 0.2 % Max.
PCC exhibits a regular and controlled crystalline shape and ultrafine particle size, and also
synthetic PCCs gain advantages in point of narrowness of particle size distribution and high
purity (since impurities are removed in the production process) over natural and ground
calcium carbonates (GCC). Therefore, in the literature, the CaCO3 precipitation methods
have attracted great attention [24].
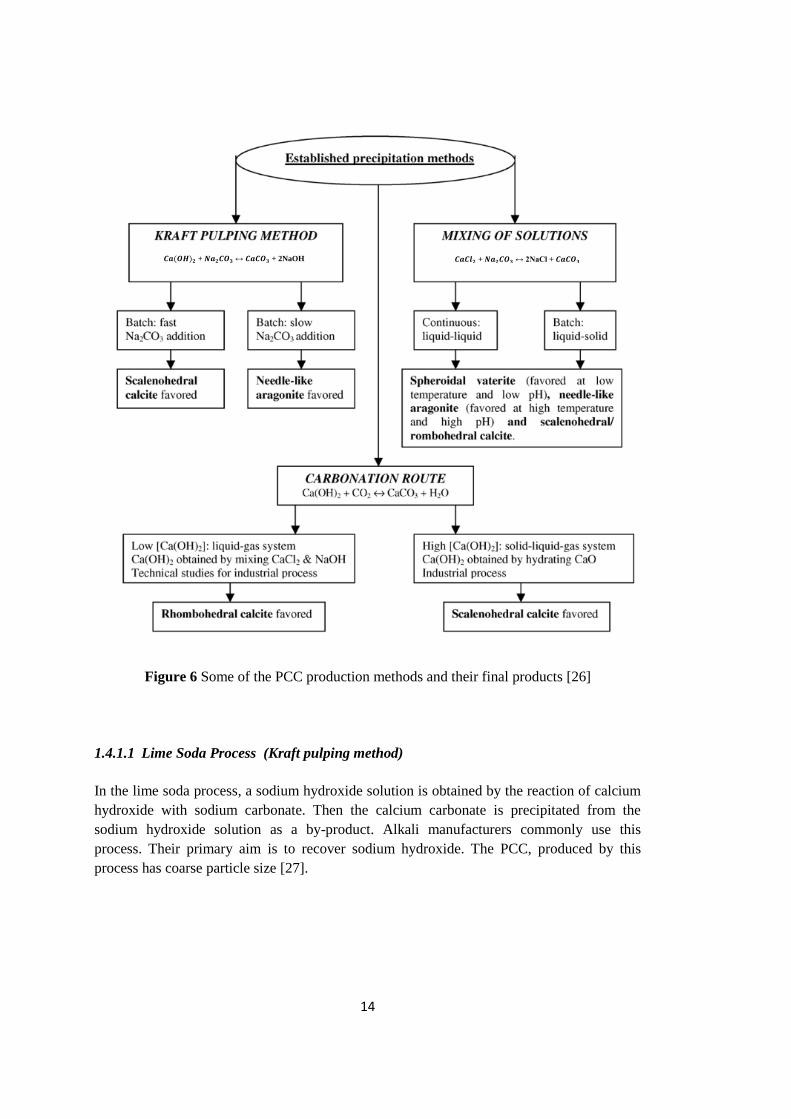
1.4.1 Synthetic PCC Production Methods
There are three common processes for the production of synthetic PCC:
Lime soda process (Kraft pulping method);
Calcium chloride process (Mixing of solutions);
Carbonation process.
These methods are outlined in Figure 6 and explained in the following sections.
14
Figure 6 Some of the PCC production methods and their final products [26]
1.4.1.1 Lime Soda Process (Kraft pulping method)
In the lime soda process, a sodium hydroxide solution is obtained by the reaction of calcium
hydroxide with sodium carbonate. Then the calcium carbonate is precipitated from the
sodium hydroxide solution as a by-product. Alkali manufacturers commonly use this
process. Their primary aim is to recover sodium hydroxide. The PCC, produced by this
process has coarse particle size [27].
+ ↔ 2NaCl +
+ ↔ + 2NaOH

15
1.4.1.2 Calcium Chloride Process (Mixing of Solutions)
In the calcium chloride process, ammonia gas and calcium chloride solution are obtained by
the reaction of calcium hydroxide with ammonium chloride. After purification stage, calcium
carbonate precipitate and sodium chloride solution are formed by the reaction of calcium
chloride solution with sodium carbonate. This method is the simplest one but it necessitates
calcium chloride source with a low cost in order to be economically feasible [27].
1.4.1.3 Carbonation Process
Carbonation process is the most widely used process because it uses relatively cheap
material; limestone as a source of raw materials. In the carbonation process, limestone lumps
are burned in a lime kiln at 1000 °C for calcination purpose. To provide a grade of high
purity, the calcination process is practised using natural gas. In the kiln, lime decomposes
into calcium oxide (solid) and carbon dioxide (gas). Calcination becomes possible when the
temperature reaches over 894 °C for 1 bar CO2. Figure 7 presents the calcination reaction as
a function of temperature and CO2 pressure. This reaction is given in Equation 1 [27]. In the
kiln, the temperature, flow rate of fresh air and natural gas has to be strictly controlled to
ensure the high quality solid CaO .
Figure 7 Dependency of calcination reaction on temperature - pressure values [27]

16
CaCO3(s) → CaO(s) + CO2(g) ΔH (1000 °C) = 165.54 kJ/mol (1)
Dry solid calcium oxide is slaked (hydrated) by water at temperatures of 30 - 50 °C and a
Ca(OH)2 slurry is obtained. In industry, slurry formation is provided in slake making tanks,
which have agitators, provided by mixing of lime and water at desired temperature. Equation
2 shows this reaction [24].
CaO(s) + H2O(l) → Ca(OH)2(s) ΔH (35 °C) = -65.47 kJ/mol (2)
Slaked slurry (milk of lime) is first screened to remove unburnt and overburnt lime and
impurities originated from limestone for purification. Then the slurry is fed to the stirred
reactors, where it reacts with CO2 for carbonation purpose. In industry, carbonation is carried
out by bubbling CO2 through Ca(OH)2 suspension. This reaction is given in the Equation 3
[24].
Ca(OH)2(s) + CO2(g) → CaCO3(s) + H2O(l) ΔH (45 °C) = -112.48 kJ/mol (3)
In the carbonation process, calcium carbonate precipitate is formed. By controlling the
operational parameters, PCCs with desired chemical and physical properties can be obtained.
Crystal shape of the PCCs can be controlled by setting the temperature to a required value at
carbonation stage. Cool temperatures favor particles to crystallize in rhombohedral (blocky)
shape, while warm temperatures favor scalenohedral (rosette-shaped) shape.
In the PCC manufacturing process, CO2 is used for carbonation purpose. Carbonation is
practised by injecting CO2 gas through the solution, this process is also called as bubbling.
CO2 gas continuosly flows through the solution. Some of the CO2 is consumed in solution
and the remaining bubbles burst when reached to the top of the solution which is open to the
atmosphere. Therefore in the carbonation step, there is a considerable amount of CO2
emission to the environment. CO2 is one of the primary greenhouse gases, abundance of
which influences the greenhouse effect and the quality of breathing air.
Recently, there have been some studies on PCC production from waste materials in order to
reduce the adverse affects of industrial wastes. Mattila et al. has studied PCC production

17
from calcium containing steel-converter slags in two steps and constructed a chemical
kinetic model [28].
1.5 Dissolution Chemistry of CaCO3 in CaCO3-H2O System with Externally
Fixed Pressure of CO2
An alternative to the established PCC production methods could be direct dissolution of
CaCO3 in water with externally fixed pressure of CO2. In this section, theoretical explanation
of dissolution and precipitation of CaCO3 is presented.
Dissolution and precipitation of CaCO3 is controlled by the reactions taking place among a
three phase ternary system H2O – CO2 – CaCO3. In the case of a CaCO3 – H2O system with
externally fixed CO2 pressure, the following chemical reactions are responsible for the
dissolution and precipitation of CaCO3:
H2O ↔ + (4a)
CO2 + H2O ↔ ↔ + (4b)
CO2 + ↔ (4c)
↔ +
(4d)
CaCO3 + ↔ + (4e)
CaCO3 + H2CO3 ↔ + (4f)
CaCO3 + H2O ↔ + + H2O (4g)
CaCO3 + H2O ↔ + + (4h)
In the first reaction (4a), the dissociation of water into hydrogen and hydroxyl ions is shown.
The second reaction (4b) presents CO2 dissolution in pure water. In reactions 4b - 4c, CO2
transforms to bicarbonate and hydrogen dependent on the pH of the solution. In reaction 4d,
bicarbonate dissociates into hydrogen and carbonate ions and the rest of the reactions (4e –
4h) are responsible for the dissolution of CaCO3 [30]. The equilibriums and equilibrium
constant values for these reactions are presented in Table 7.
18
The steps mentioned in equations 4a-4h can be summarized as equation 5:
CaCO3 + CO2 + H2O ↔ + 2 (5)
1.6 Possible Production Route of PCC from Marble Wastes
In the Section 1.5, the dissolution and precipitation mechanism of the CaCO3 is explained. In
this section, how much CaCO3 can be dissolved under the conditions of 25 °C and 10 atm
CO2 pressure is explained.
The equation for electro-neutrality is shown in Equation 6 [31].
2 + = 2 +
+ (6)
Five equations in Table 7 are given to enable calculations for concentration of ionic species,
and then to put these derived values into equation 6 in order to calculate the dissolution rate
of CaCO3, theoretically. Effects of the partial pressure of CO2 on the concentrations of all the
ionic species in the solution are presented in Figure 8-9. Increase in the partial pressure of
CO2 enables dissolution of more CO2 gas in the water, thus results in increase of carbonic
acid (H2CO3) concentration in the solution. Then the concentration of H+ and
ions
increase and pH of the solution decreases.

19
Figure 8 Concentrations of and carbonate species in the solution originated from
CaCO3 as a function of [32]

20
Figure 9 Concentrations of and carbonate species in the solution originated from
CaCO3 as a function of including complexes and ion pairs [32]
21
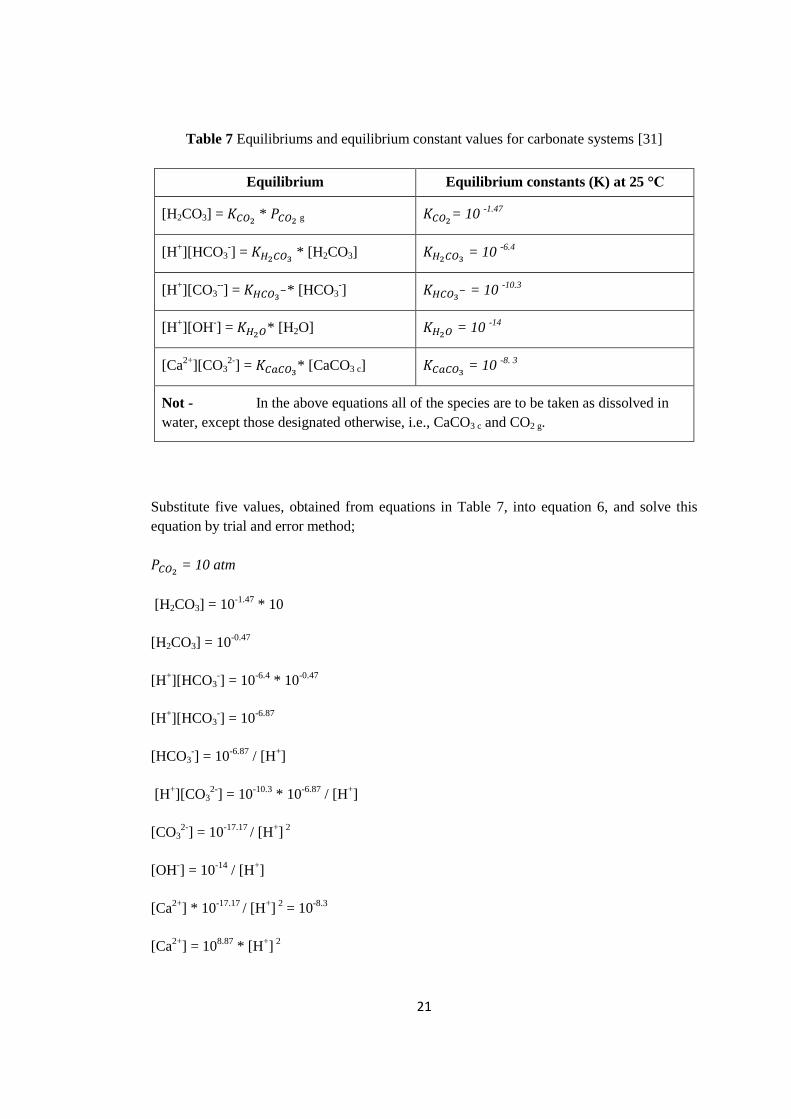
Table 7 Equilibriums and equilibrium constant values for carbonate systems [31]
Equilibrium Equilibrium constants (K) at 25 °C
[H2CO3] = * g
= 10 -1.47
[H+][HCO3
-] =
* [H2CO3] = 10
-6.4
[H+][CO3
--] =
* [HCO3-]
= 10 -10.3
[H+][OH
-] = * [H2O] = 10
-14
[Ca2+
][CO32-
] = * [CaCO3 c]
= 10 -8. 3
Not - In the above equations all of the species are to be taken as dissolved in
water, except those designated otherwise, i.e., CaCO3 c and CO2 g.
Substitute five values, obtained from equations in Table 7, into equation 6, and solve this
equation by trial and error method;
= 10 atm
[H2CO3] = 10-1.47
* 10
[H2CO3] = 10-0.47
[H+][HCO3
-] = 10
-6.4 * 10
-0.47
[H+][HCO3
-] = 10
-6.87
[HCO3-] = 10
-6.87 / [H
+]
[H+][CO3
2-] = 10
-10.3 * 10
-6.87 / [H
+]
[CO32-
] = 10-17.17
/ [H+]
2
[OH-] = 10
-14 / [H
+]
[Ca2+
] * 10-17.17
/ [H+]
2 = 10
-8.3
[Ca2+
] = 108.87
* [H+]
2

22
Substituting the values into equation 6;
2*108.9
* [H+]
2 + [H
+] =2*10
-17.2 / [H
+]
2 + 10
-6.9 / [H
+] + 10
-14 / [H
+]
[H+] = 10
-5.18
[Ca2+
] = 0.0347 mole/L
[Ca2+
] = 1.3869 g/L
1 mole of Ca is 40 g and CaCO3 is 100 g, so;
[CaCO3] = 1.3869 * 100/40 (g/L)
[CaCO3] = 3.4673 g/L.
Theoretically it is possible to dissolve 3.47 g/L CaCO3 in CaCO3-H2O system under the
conditions of 25 °C and 10 atm CO2 pressure.
1.7 Aim of This Study
The purpose of this study was to investigate the production of precipitated calcium carbonate
from marble wastes. Marble stone quarrying and processing industries generate a great
amount of waste in various forms and these wastes are known to have negative impacts on
the environment. In addition to the more common utilization routes of marble wastes, it
could be useful to utilize these wastes for the production of PCC. The study was focused on
determining the most suitable conditions for the parameters, such as particle size,
temperature, CO2 pressure, stirring speed etc. which affect the dissolution rate of CaCO3.
There are various studies on utilization of marble wastes by using in different fields and
there are also studies on alternative sources like steelmaking slags for producing PCC. But
the study in this thesis is unique with regard to use of marble wastes as a source for
production of PCC with sufficient quality to meet the industrial requirements.
In industry, most widely used method for production of CaCO3 precipitate is the carbonation
of slaked lime. In this method, mostly the limestones are used as a source of raw material. In
our system, to contribute economically and to make it environmentally friendly, the lime
calcination and slaking stages were eliminated and marble wastes were used as the source of
raw material. Recycling the CO2 gas in the production stages was proposed to prevent CO2
emmission to the environment and so greenhouse effect.
23
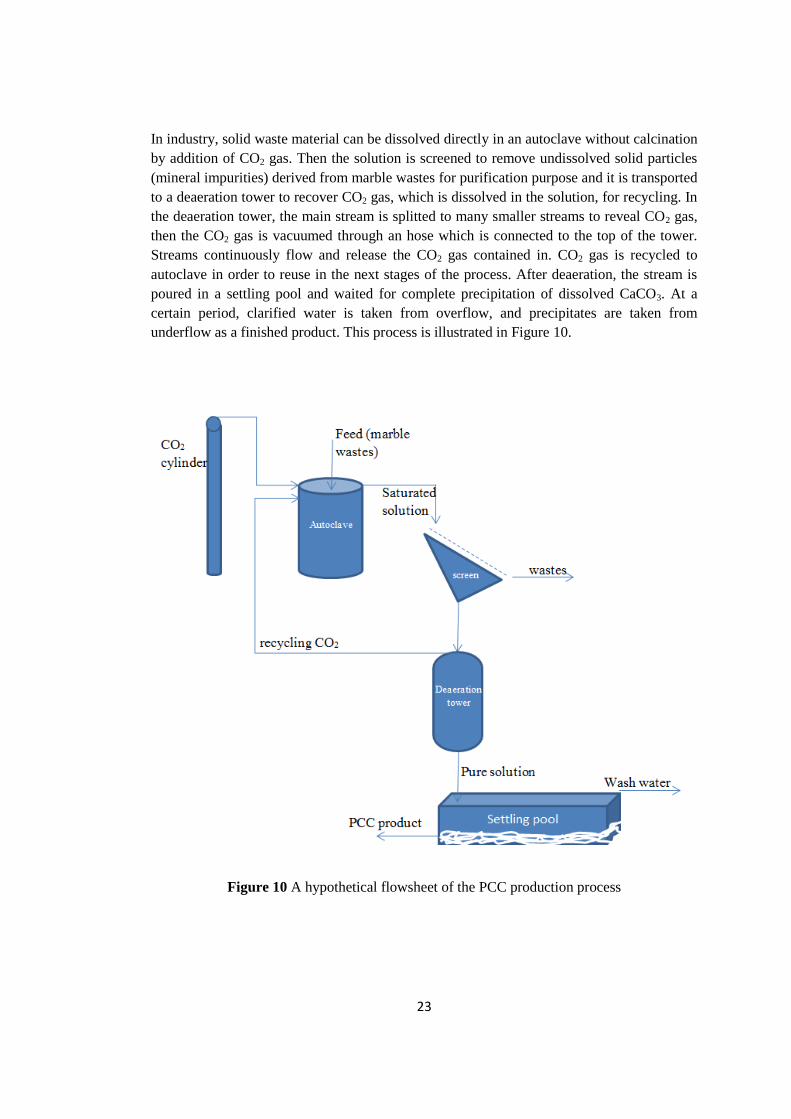
In industry, solid waste material can be dissolved directly in an autoclave without calcination
by addition of CO2 gas. Then the solution is screened to remove undissolved solid particles
(mineral impurities) derived from marble wastes for purification purpose and it is transported
to a deaeration tower to recover CO2 gas, which is dissolved in the solution, for recycling. In
the deaeration tower, the main stream is splitted to many smaller streams to reveal CO2 gas,
then the CO2 gas is vacuumed through an hose which is connected to the top of the tower.
Streams continuously flow and release the CO2 gas contained in. CO2 gas is recycled to
autoclave in order to reuse in the next stages of the process. After deaeration, the stream is
poured in a settling pool and waited for complete precipitation of dissolved CaCO3. At a
certain period, clarified water is taken from overflow, and precipitates are taken from
underflow as a finished product. This process is illustrated in Figure 10.
Figure 10 A hypothetical flowsheet of the PCC production process

24

25
CHAPTER 2
MATERIALS AND METHODS
2.1 Materials
Marble lump wastes from Oğuz Marble Ind. Trade. Co. Ltd. waste storage areas were used
as raw material.
CaCO3 content of marble waste samples was determined by wet analysis. According to the
analysis result, the waste contains ≥ 99.5 % CaCO3.
Chemical analyses were carried out on the raw material (marble wastes) and the PCC
product. Samples were prepared to -53 µm particle size. Because the samples were oxidised,
they were digested in aqua regia on the hot plate. Then the undissolved solid particles were
separated by filter papers. The contents of the solutions were measured by ICP- AES. The
analyses results of marble waste and the PCC product are given in Table 8 and Table 9,
respectively.
Table 8 ICP analysis results of marble waste sample
Element Na P Pb S Al As Cu Mg Mn Fe
Unit % % ppm % % ppm ppm % ppm %
Detection Limit 0.01 0.01 2 0.01 0.01 3 0.01 0.01 2 0.01
Marble Wastes < 0.01 < 0.01 < 2 < 0.01 < 0.01 < 3 0.02 0.13 23 0.02

26
2.2 Methods
In this study, a laboratory scale autoclave was used. It had a Teflon cell with 1 liter capacity.
A CO2 cylinder was directly connected to it. It had gauges for monitoring both the
temperature and pressure.
A hot plate was used to evaporate H2O in order to determine the concentration of dissolved
CaCO3 in the solution samples taken from the autoclave cell by a time period of half an hour
in a 10 ml beaker during the experiments.
In each test, 50 g ground marble wastes were used. In the tests, effects of time, particle size,
CO2 pressure, stirring speed and temperature on dissolution rate of marble waste were
examined.
In each test, 10ml samples were collected in a 10 ml glass beaker after each half an hour time
cycle from sample collection port of the autoclave. Then they were placed on hot plate at 135
°C to evaporate CO2 and precipitate CaCO3 contained in the solution. The amount of PCC
produced was determined from dry matter remaining in the beaker.
2.2.1 Sample Preparation
Samples were blended and then divided into 8 parts by using a laboratory riffle. 5 of the 8
parts were crushed and ground separately to the required particle sizes by a jaw crusher and a
roller mill. After size reduction, the material was dried at 70 °C in an electrical furnace.
Crushed, ground and dried material was sieved to obtain required size ranges for the
experiments. Raw material was classified to the following size ranges:
+ 500 µm - 2 mm;
+ 250 µm - 500 µm;
+ 106 µm - 250 µm;
+ 75 µm - 106 µm;
- 75 µm.
For each size interval, 50 grams of ground waste samples were prepared and packed and they
were kept for the experiments.

27
2.2.2 Test Apparatus
In this study, a laboratory scale autoclave of 1 L capacity was used. Figure 11 shows the
experimental set up. A CO2 gas cylinder was connected to the autoclave, Figure 12, in order
to give required CO2 pressure to the cell. CO2 pressure of the gas cylinder was manually
controlled and monitored by a valve and a manometer, respectively. Materials were stirred in
the cell by a speed-controlled motor drive, actuating mechanism of which was consisted of a
belt and pulley system. Different stirring speeds were attained by controlling the speed of the
motor. Low temperatures were achieved by cooling the autoclave cell through an external
system which consist of a container, filled with cold water and a recirculating pump in it. To
examine the effect of temperature on dissolution, cold water was continuously recirculated
through the autoclave in a spiral tube immersed into the teflon cell. By this way temperatures
of 18 °C, 12 °C and 8 °C were achieved, separately.
Figure 11 Experimental set up for a batch run. A vessel of teflon (1) is sealed by a lid (2).
The lid carries a pulley which is connected to the motor (3) by a belt (4). The pulley has a
shaft and a stirrer (5) on it. Teflon cell can be cooled by recycling a cool water in the spiral
(6) immersed in this vessel. CO2 gas is given to the system by a hose (7) which is connected
to the autoclave. Temperature inside the closed vessel is measured by a thermometer (8)
immersed in the cell and the product samples are taken from the sampling discharge (9) of
the unit

28
Figure 12 The autoclave and the CO2 cylinder connected to it
SEM analysis was carried out to observe the crystal shapes and sizes of the marble wastes
sample and the PCC product. For the analysis of marble waste and the PCC product,
NANOSEM 430 was used at 10 kV. Firstly, the samples were coated under vacuum by
platinum of 10 nm thickness. Then the microstructural images of the samples were taken.

29
CHAPTER 3
RESULTS AND DISCUSSION
In order to investigate the effects of conditions on the dissolution of marble wastes, a series
of tests were conducted. Systematically, first the required time, and then particle size, CO2
pressure, stirring speed and temperature were determined, respectively.
In the experiments, two steps were followed which are dissolution followed by precipitation.
After dissolution, the quantity of dissolved species was determined by complete drying of
samples withdrawn from the autoclave on a hot plate. Particular attention was given to the
dissolution stage to produce as much CaCO3 as possible.
3.1 Effect of Time on Dissolution
In the experiment, time from 1 h to 9 h was allowed to investigate the change in the
concentration of dissolved species in water with time, Figure 13, under the conditions of
particle size: - 250 + 106 µm; : 10 atm; stirring speed: 1400 rpm; temperature: 25 °C. It
was found that the amount of dissolved CaCO3 reached to 2.9 g/L in 15 min. and did not
change much thereafter in 2 h. At the end of 9 h, the dissolution was 3.2 g/L. This indicated
that 1 to 2 h dissolution time is enough to dissolve CaCO3. Based on this objective,
maximum duration for dissolution was kept constant at 2 h in the following experiments.

30
Figure 13 CaCO3 formation as a function of time, under the conditions: particle size: - 250 +
106 µm; : 10 atm; stirring speed: 1400 rpm; temperature: 25 °C
3.2 Effect of Particle Size on Dissolution
In order to investigate the influence of particle size on dissolution, tests were conducted on
wastes of different particle sizes under the conditions of : 10 atm; stirring speed: 1400
rpm; temperature: 25 °C. Raw materials (marble wastes samples) sieved to five different size
intervals, from 2 mm down to 75 µm, were dissolved separately in the autoclave. Samples
were collected for half an hour at each test and contained water was evaporated to precipitate
dissolved species in the sample. Concentrations of dissolved ions were calculated.
Concentrations versus time curves were plotted for each experimental group. Results are
shown in Figure 14. The experimental results show that, as expected, the dissolution rate, at
constant temperature, CO2 pressure and stirring speed, increases with decreased particle size.
This is because solid CaCO3 particles with wider surface areas get more chance to come in
contact with CO2 and H2O in the system, therefore the dissolution rate of CaCO3 increased
with decreasing the size of the particles. At the end of 2 h, minimum dissolution was
observed in – 2 mm + 500 µm size interval which was notably different from the others,
whereas maximum was in - 106 + 75 µm. – 500 + 250 µm sample has shown the greatest
increase in dissolution from 2.09 g/L to 3.36 g/L through the experiment. In the size range of
– 250 + 106 µm, dissolution rate was not changed so much through the experiment. – 250 +
106 µm size interval was chosen as the most favored size to continue the experiments at
constant size range.
0
1
2
3
4
0 2 4 6 8 10
Dis
solv
ed C
aC
O3 (
g/L
)
Time (h)

31
Figure 14 CaCO3 formation as a function of particle size of starting material, under the
conditions: : 10 atm; stirring speed: 1400 rpm; temperature: 25 °C
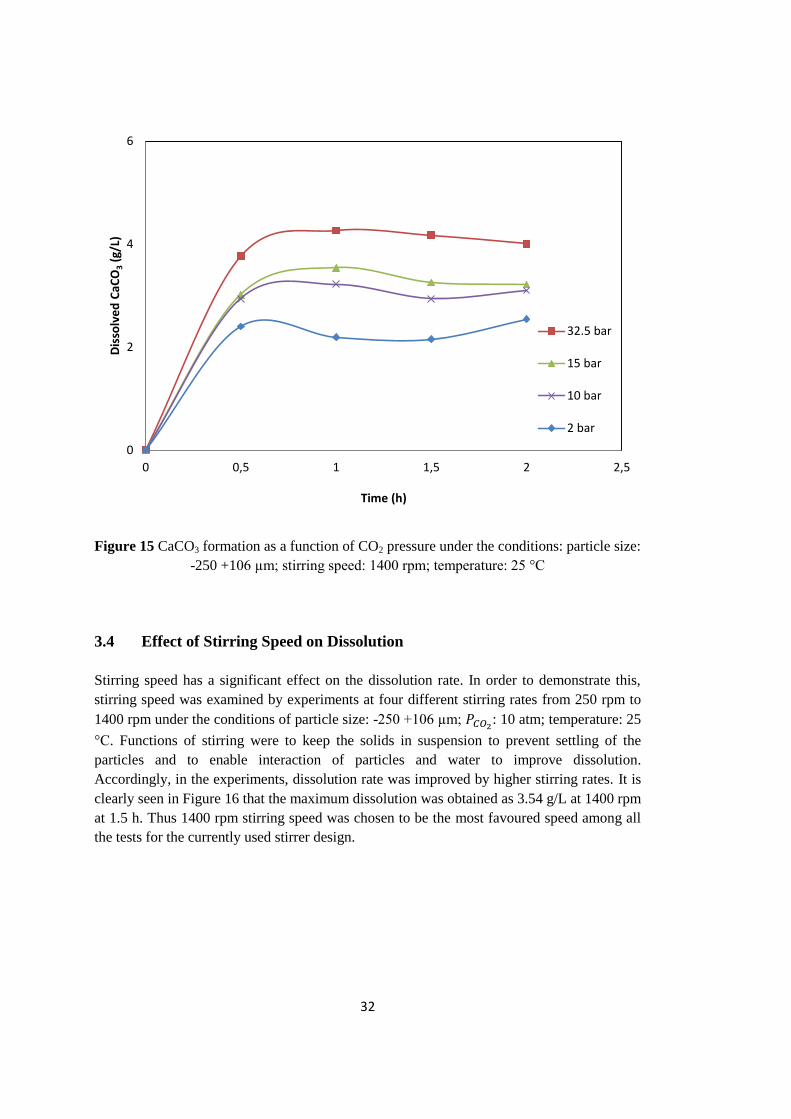
3.3 Effect of CO2 Pressure on Dissolution
It is known that increased partial pressure of CO2 increases the amount of CO2 dissolved in
water, so increasing the solubility of CaCO3. Although, pressure alone does not affect the
solubility of CaCO3 as much as the effect of temperature [29]. In the experiment, CO2 gas
with a constant pressure was given to the system. Four experiments were conducted at CO2
pressures of 2 atm , 10 atm, 15 atm and 32.5 atm under the conditions of particle size: -250
+106 µm; stirring speed: 1400 rpm; temperature: 25 °C. The experimental result shows that,
as expected, the dissolution rate, at constant particle size, temperature and stirring speed,
increases with increased CO2 pressure, Figure 15. The concentrations were not changed in
two hours, significantly. In practice, it could be difficult to achieve high pressures, higher
than 10 atm, economically therefore 10 atm CO2 pressure was chosen as a favorable value.
0
1
2
3
4
0 0,5 1 1,5 2 2,5
Dis
solv
ed
CaC
O3
(g/L
)
Time (h)
- 75 µm
- 106 + 75 µm
- 250 + 106 µm
- 500 + 250 µm
-2 mm+ 500 µm
32
Figure 15 CaCO3 formation as a function of CO2 pressure under the conditions: particle size:
-250 +106 µm; stirring speed: 1400 rpm; temperature: 25 °C
3.4 Effect of Stirring Speed on Dissolution
Stirring speed has a significant effect on the dissolution rate. In order to demonstrate this,
stirring speed was examined by experiments at four different stirring rates from 250 rpm to
1400 rpm under the conditions of particle size: -250 +106 µm; : 10 atm; temperature: 25
°C. Functions of stirring were to keep the solids in suspension to prevent settling of the
particles and to enable interaction of particles and water to improve dissolution.
Accordingly, in the experiments, dissolution rate was improved by higher stirring rates. It is
clearly seen in Figure 16 that the maximum dissolution was obtained as 3.54 g/L at 1400 rpm
at 1.5 h. Thus 1400 rpm stirring speed was chosen to be the most favoured speed among all
the tests for the currently used stirrer design.
0
2
4
6
0 0,5 1 1,5 2 2,5
Dis
solv
ed
CaC
O3
(g/L
)
Time (h)
32.5 bar
15 bar
10 bar
2 bar

33
Figure 16 CaCO3 formation as a function of stirring speed, under the conditions: particle
size: -250 +106 µm; : 10 atm; temperature: 25 °C
3.5 Effect of Temperature on Dissolution
Effects of temperature on dissolution were investigated by conducting experiments at
standard and lower temperatures. In most cases, solubility of the minerals typically increases
with increase of temperature. In contrast to this, many carbonate minerals get more soluble
in cold water. For example, the Ksp value for calcite at 0 °C and 50 °C is 10 -8.02
and 10 -8.63
respectively. This is because the dissolution reaction of the carbonate minerals is exothermic,
which results in higher temperatures favoring the solid phase over dissolved ions [29]. Four
temperature levels were investigated to observe the influence of temperature on dissolution
rate of CaCO3 under the conditions of particle size: -250 +106 µm; : 10 atm; stirring
speed: 1400 rpm. The first was performed at room temperature (25 °C). Other three
experiments were conducted by cooling the system. By this system, temperatures of 18 °C,
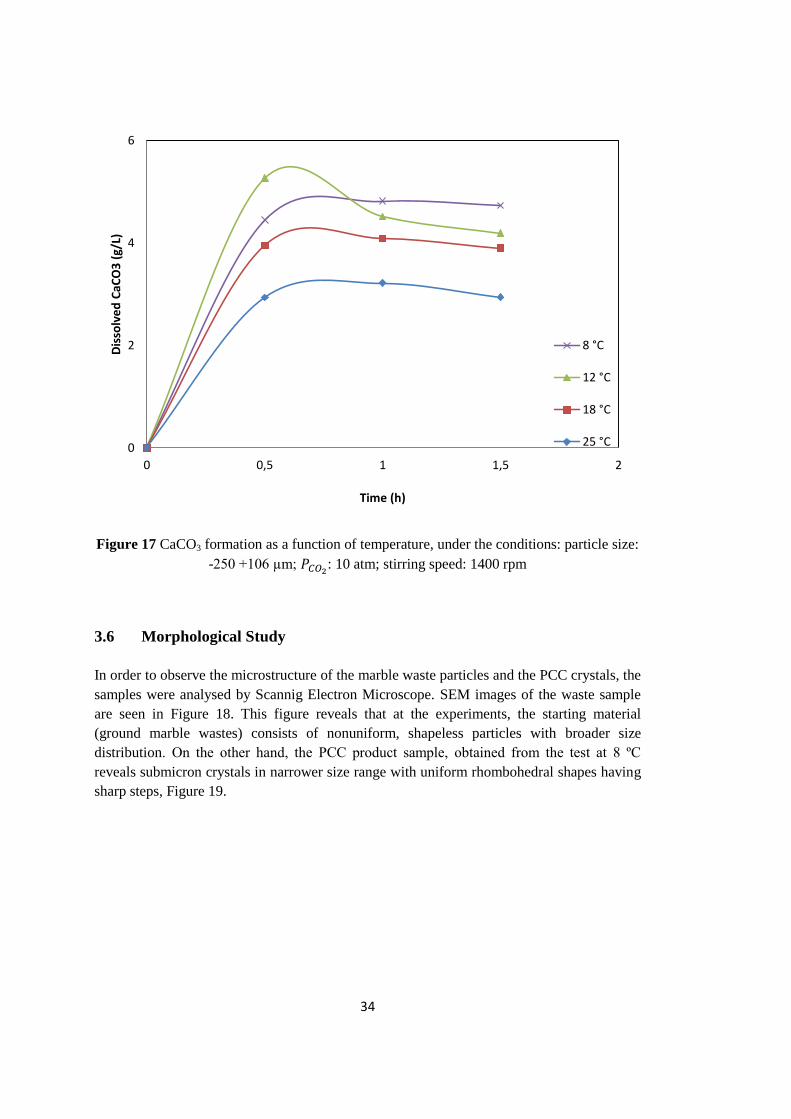
12 °C and 8 °C were achieved, separately. As can be clearly seen in Figure 17, concentration
of dissolved CaCO3 increased with decreasing temperature. Maximum dissolution was
achieved as 4.73 g/L in the experiment conducted at 8 °C, at the end of 2 h.
0
1
2
3
4
0 0,5 1 1,5 2 2,5
Dis
solv
ed
CaC
O3 (
g/L)
Time (h)
1400 rpm
1000 rpm
500 rpm
250 rpm
34
Figure 17 CaCO3 formation as a function of temperature, under the conditions: particle size:
-250 +106 µm; : 10 atm; stirring speed: 1400 rpm
3.6 Morphological Study
In order to observe the microstructure of the marble waste particles and the PCC crystals, the
samples were analysed by Scannig Electron Microscope. SEM images of the waste sample
are seen in Figure 18. This figure reveals that at the experiments, the starting material
(ground marble wastes) consists of nonuniform, shapeless particles with broader size
distribution. On the other hand, the PCC product sample, obtained from the test at 8 ºC
reveals submicron crystals in narrower size range with uniform rhombohedral shapes having
sharp steps, Figure 19.
0
2
4
6
0 0,5 1 1,5 2
Dis
solv
ed
CaC
O3
(g/
L)
Time (h)
8 °C
12 °C
18 °C
25 °C

35
Figure 18 SEM images of the waste sample
Figure 19 SEM images of the PCC sample obtained at 8 ºC

36
3.7 Chemical Analysis of the PCC Product
In order to evaluate the chemical content of the PCC product, ICP analysis was carried out.
In the analysis, 10 elements were measured to characterize the samples, Table 8. The results
show that 5 elements; phosphor, lead, sulphur, aluminium and arsenic are out of the given
detection limits, 3 elements; sodium, copper and iron are near the lower detection limits and
the remaining 2 elements are magnesium and manganese. Because 3 elements are near the
lower detection limits, it is possible that they were misread. The iron content should be lower
than 0.01 % in PCC product. In the analyses, the lower detection limit for iron was 0.01 and
the samples were measured as containing 0.02 % Fe. Because the measured values were too
close with the lower detection limit, it may be an experimental error, otherwise further works
should be carried out to reduce the iron content in the PCC product. Another possibility in
the presence of these elements in the PCC product is that, the cooling system in the
experimental set up is made of metal, thus the acidic environment during experiments can
cause dissolution of little amount of metallic ions and transfer of them into the solution.
According to the ICP results, copper, manganese and magnesium contents are below the
allowable limits for PCC. In summary, preliminary investigation shows that the PCC product
obtained in this study confirms the PCC specifications, except iron. This matter has to be
further studied in detail.
Table 9 ICP analysis results of PCC product
Element Na P Pb S Al As Cu Mg Mn Fe
Unit % % ppm % % ppm ppm % ppm %
Acceptable
Limit 0.15 0.05 Traces 0.2 0.5 NIL Negligible 0.7 50 0.01
PCC Product 0.01 <
0.01 < 2
<
0.01
<
0.01 < 3 0.02 0.12 16 0.02

37
CHAPTER 4
CONCLUSIONS & RECOMMENDATIONS
4.1 Conclusion
Studies on “utilization of marble wastes” were conducted to investigate possibilities of PCC
production from marble wastes under different conditions and the following conclusions can
be drawn from this study:
Decreasing the particle size has positive effect on dissolution rate of CaCO3, but it is
unnecessary to achieve particle sizes below 106 µm. Because even smaller sizes
cannot be cost effective and their effect on dissolution is insufficient.
Increasing the CO2 pressure has positive impact on dissolution, however, in practice;
it is advisable to work up to 10 atm CO2 pressure.
Stirring speeds lower than 1000 rpm cause sharp decrease in concentration of
dissolved species in the solution. Working at 1000 – 1400 rpm stirring speeds are
both practically and economically significant.
Temperature has a detrimental effect on waste dissolution. Materials were dissolved
more readily at lower temperatures. Cooling the solution seems to be very
advantageous, from the point of rate of dissolution. It has to be evaluated for its
application on the side of economy and applicability in industry.
Result of the studies demonstrate that utilization of marble wastes for the production of PCC
may be an alternative route by introducing the wastes with pressurized CO2 gas has benefits
for removing the negative impact of marble wastes to the environment and supplying
cheaper raw material to the PCC manufacturing industry. Also this novel PCC production
method combined and eliminated some of the conventional PCC production process steps.
38
4.2 Recommendations
In order to produce a PCC product in commercially acceptable limits, mineral impurities
should be eliminated to the acceptable limits during production cycle. Further works should
be carried out to investigate the dissolution and precipitation of mineral impurities derived
from marble wastes, thus present in the solution, in PCC production cycle. To evaluate the
feasibility of the given production method for PCC in industry, a continuous production
cycle should be studied in a lab scale set up. PCC product obtained from the experimental
studies should be further analysed to evaluate its suitability to the industrial requirements,
such as, opacity, brightness, whiteness, specific surface area, specific gravity, particle size
distribution, refraction index, etc. Lastly, lower temperatures should be attempted to further
investigate the increase in the dissolution rate of CaCO3 with decreasing temperatures.
39
REFERENCES
[1] Calcium Carbonate, from
http://www.omya.com/C125728900639D06/direct/calciumcarbonate-dolomite, last visited
on 23 September 2013.
[2] What are the different uses of calcium carbonate?, from
http://www.wisegeekhealth.com/what-are-the-different-uses-of-calcium-
carbonate.htm#slideshow, last visited on 23 September 2013,.
[3] What is Ground Calcium Carbonate (GCC) or Limestone?, from
http://www.specialtyminerals.com/our-minerals/what-is-gcc-limestone/, last visited on 20
September 2013.
[4] About marble, from http://www.galleries.com/rocks/marble.htm, last visited on 10 July
2013.
[5] Marble: Characteristics, Uses And Problems, from
http://www.gsa.gov/portal/content/111858, last visited on 06 August 2013.
[6] Marble, from http://www.alicantemarble.com, last visited on 18 July 2013.
[7] Marble and its uses in construction, from
http://elegantnatural.hubpages.com/hub/Marble-and-Its-uses-in-Construction, last visited on
18 July 2013, .
[8] Çelik, M. Y. and Sabah, E., “Geological and Technical Characterisation of Iscehisar
(Afyon-Turkey) Marble Deposits and the Impact of Marble Waste on Environmental
Pollution”, Journal of Environmental Management, Volume 87, Issue 1, 2007, Pages 106-
116.

40
[9]Marble,from
http://www.enerji.gov.tr/index.php?dil=en&sf=webpages&b=mermer_EN&bn=230&hn=&n
m=40718&id=40741, last visited on 06 August 2013.
[10] Sarkar, R., Das S. K., Mandal, P. K. and Maiti, H. S., “Phase and Microstructure
Evolution During Hydrothermal Solidification of Clay-Quartz Mixture with Marble Dust
Source of Reactive Lime”, Journal of the Europian Ceramic Society, Volume 26, 2006,
Pages 297–304.
[11] Akbulut, H. and Gurer, C., “Use of Aggregates Produced From Marble Quarry Waste in
Asphalt Pavements”, Building and Environment, Volume 42, 2007, Pages 1921–1930.
[12] Aruntas, H. Y., Gürü, M., Dayı, M. and Tekin, İ., “Utilization of Waste Marble Dust as
an Additive in Cement Production”, Materials and Design, Volume 31, 2010, Pages 4039–
4042.
[13] Vijayalakshmi, V., Singh, S. and Bhatnagar, D., “Developmental Efforts in R & D for
Gainful Utilization of Marble Slurry in India”, Centre for Development of Stones, 2003,
from http://www.cdos-india.com/CDOS/Downloads.html, last visited on 29 July 2010.
[14] Hamza, R. A., El-Haggar, S. and Khedr, S., “Marble and Granite Waste:
Characterization and Utilization in Concrete Bricks”, International Journal of Bioscience,
Biochemistry and Bioinformatics, Volume 1, Issue 4, 2011, Pages 286-291.
[15] Kim, J., Han, G., Lim, M., You, K., Ryu, M., Ahn, W., Fujita, T. and Kim, H. “Effect of
Hydraulic Activity on Crystallization of Precipitated Calcium Carbonate (PCC) for Eco-
Friendly Paper”, International Journal of Molecular Sciences, Volume 10, 2009, Pages
4954–4962.
[16] Wang, C., Piao, C., Zhai, X., Hickman, F. N. and Li, J., “Synthesis and Characterization
of Hydrophobic Calcium Carbonate Particles via v Dodecanoic Acid Inducing Process”,
Powder Technology, Volume 198, Issue 1, 2010, Pages 131–134.
[17] Lina, Z., Jingdong, F. and Zichen, W., “In Situ Synthesis and Modification of Calcium
Carbonate Nanoparticles via a Bobbling Method”, Science in China Series B: Chemistry,
Volume 52, Issue 7, 2009, Pages 924–929.

41
[18] What is PCC?, from http://www.specialtyminerals.com/our-minerals/what-is-pcc/, last
visited on 06 August 2013.
[19] Ground & Precipitated Calcium Carbonate: Global Industry Markets & Outlook, 1st
edition 2012, from http://www.roskill.com/reports/industrial-minerals/ground-and-
precipitated-calcium-carbonate-1, last visited on 20 July 2013.
[20] Lundeen, G.W., “Preservation of Paper Based Materials: Present and Future Research
and Developments in the Paper Industry”, Graduate School of Library and Information
Science, University of Illinois at Urbana-Champaign, Illinois, USA, 1983, Pages 73–88.
[21] Solvay Chemicals, from
http://www.solvaychemicals.com/SiteCollectionDocuments/PCC/Solvay%20PCC%20Appli
cations.pdf, last visited on 11 August 2013.
[22] Pişkin, S. and Özdemir, Ö. D., “Effect of Process Conditions on Crystal Structure of
Precipitated Calcium Carbonate (CaCO3) From Fly Ash: Na2CO3 Preparation Conditions”,
International Journal of Biological, Ecological and Environmental Sciences, Volume 1, Issue
6, 2012, Pages 192-195.
[23] Calcium Carbonate Paper Industry, from http://www.yamunacalcium.in/html/calcium-
carbonate-paper-industry.html, last visited on 06 August 2013.
[24] Gao, C., Dong, Y., Zhang, H. and Zhang, J., “Utilization of Distiller Waste and
Residual Mother Liquor to Prepare Precipitated Calcium Carbonate”, Journal of Cleaner
Production, Volume 15, Issue 15, 2007, Pages 1419-1425.
[25] Crystal structure of calcite mineral, from http://media-2.web.britannica.com/eb-
media/78/2678-004-81079487.gif, last visited on 06 August 2013.
[26] Domingo, C., Loste, E., Gomez-Morales, J., Garcıa-Carmona, J. and Fraile, J., “Calcite
Precipitation by a High-Pressure CO2 Carbonation Route”, Journal of Supercritical Fluids,
Volume 36, 2006, Pages 202–215.

42
[27] Teir, S., Eloneva, S. and Zevenhoven, R., “Production of Precipitated Calcium
Carbonate from Calcium Silicates and Carbon Dioxide”, Energy Conversion and
Management, Volume 46, Issues 18-19, 2005, Pages 2954-2979.
[28] Mattila, H., Grigaliunatie, I. and Zevenhoven, R., “Chemical kinetics modeling and
process parameter sensitivity for precipitated calcium carbonate production from
steelmaking slags”, Chemical Engineering Journal, Volume 192, 2012, Pages 77-89.
[29] Carbonate Geochemistry, from
http://comp.uark.edu/~ksteele/gochemfiles/SteeleCarbonatePC-762.htm, last visited on 06
August 2013.
[30] Kaufmann, G. and Dreybrodt, W., “Calcite Dissolution Kinetics in the System CaCO3–
H2O–CO2 at High Undersaturation”, Geochimica et Cosmochimica Acta, Volume 71, 2007,
Pages 1398–1410.
[31] Garrels, M. R. and Christ, C. L., “Solutions, Minerals and Equilibria”, 1965, Pages 74-
92.
[32] Carbonate equilibria, from http://lawr.ucdavis.edu/classes/ssc102/Section5.pdf, last
visited on 23 September 2013.