productivity, economy, and role of engineers and how to business in asia
TRANSCRIPT

Presentation for
Students of
Graduate School of Engineering
Yokohama National University
1
K D Bhardwaj Asian Productivity Organization
Yokohama, 21 April 2015

PART 1
APO and APO Activities
1

APO History
Envisioned in the Asian Round Table Productivity
Conference held in Tokyo in1959 as a regional
intergovernmental organization for productivity

1
What is Productivity
Business Excellence
Productivity Measurement
System
Efficiency (Doing the right things)
Effectiveness (Doing the things right)
Productivity
Mind-set
Productivity Management System

5
What is the APO?
The APO is a regional intergovernmental organization and
is nonpolitical, nonprofit, and nondiscriminatory.
When was the APO established?
It was established on 11 May 1961.
What does the APO do?
The APO promotes productivity among its members in the
industry, service, and agriculture sectors, and in doing so it
partners mainly with NPOs and other international
organizations.

6
Why does the APO promote productivity?
The APO promotes productivity because it is one of the keys to
achieving sustainable socioeconomic development.
How does the APO promote productivity?
The APO carries out capacity-building activities for NPOs and
undertakes projects for human resources development such as
training courses, research, and publications.
Where does the APO obtain its funding?
Funding mainly depends on annual membership contributions
supplemented by special cash and project implementation
grants from the governments of APO members.

Membership
20 member economies
• Bangladesh (1982)
• Cambodia (2004)
• Republic of China (1961)
• Fiji (1984)
• Hong Kong (1963)
• India (1961)
• Indonesia (1968)
• Islamic Republic of Iran (1965)
• Japan (1961)
• Republic of Korea (1961)
• Lao PDR (2002)
• Malaysia (1983)
• Mongolia (1992)
• Nepal (1961)
• Pakistan (1961)
• Philippines (1961)
• Singapore (1969)
• Sri Lanka (1966)
• Thailand (1961)
• Vietnam (1996)
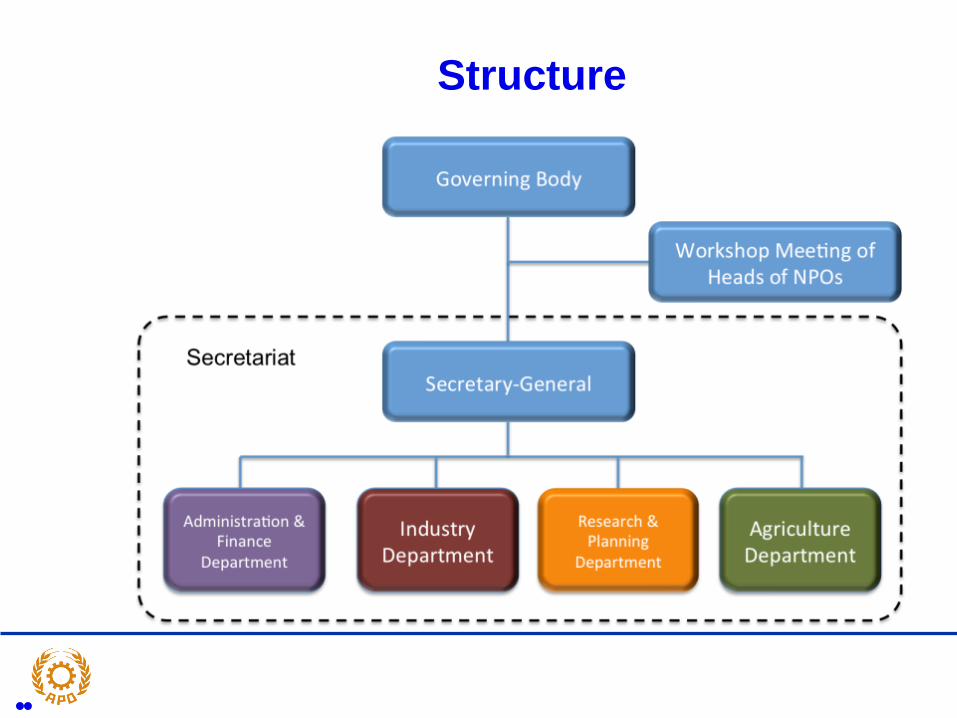
Structure

APO Secretariat: Departments
Administration & Finance Department
The Administration and Finance (A&F) Department provides organizational, financial, and personnel management support to all Secretariat departments.
Research & Planning Department
The Research and Planning (R&P) Department is the think tank and regional advisory body within the APO.
Industry Department
The Industry Department conducts training and human resources development projects focusing on the manufacturing and service sectors as well as Green Productivity (GP)-related issues.
Agriculture Department
Agriculture, including fisheries, forestry, and related subsectors, plays an important role in the socioeconomic development of many APO members.

Roles of APO

Our Vision and Mission

• Focus of the NPO
To promote and develop national productivity movement.
conducting research studies to address current and
emerging issues, and publish and disseminate information
on productivity.
• NPO Institutional set-up
Statutory bodies (ROC, Fiji, India, ROK, Malaysia,
Pakistan, Philippines, Singapore, Thailand, and Vietnam)
Government Department (Bangladesh, Cambodia,
Indonesia, IR Iran, Lao PDR, and Sri Lanka)
Private Bodies (Japan, Mongolia, Nepal)
12
National Productivity Organizations
(NPOs)

NPO Projects APO
Secretariat
Membership contributions, special grants
Request, suggestions, Evaluation
Deputation of experts, sponsoring individual-country study mission
Research reports, publications and audio-visual training materials
Industries
Academia
Labor Unions Others
Government
Member Countries
Sending participants Hosting projects
Planning Organiz -
ation
Seminars
Symposia Training Courses
Study meetings
Surveys
Study missions
Environment
Agriculture Dept.
Administrative and Finance
Dept.
Industry Dept.
Information and Public Relations
Research and Planning Dept.
Agricultural Organization
Projects in Collaboration with NPOs
Dept. Dept.
Three Types
A. Multi
B. Limited
C. Individual

PART 2
Asia’s Economy Trends, Business,
and Productivity
1

Asian Economy
Share of Asian Population in the World
APO2035%
Asia2956%
US5%
EU156%EU27
7%
Others28%
2012
Other Asia 4%
Asia 60%

Asian Economy
Share of Asia in World GDP in 2012 and
Projections for 2019
APO2021%
Asia2938%
ASIA41%
US20%
EU1517%
EU2719%
Others21%
2012
Other Asia 3%
APO2022%
Asia2943%
ASIA46%
US18%
EU1514%
EU2717%
Others20%
2019
Other Asia 3%
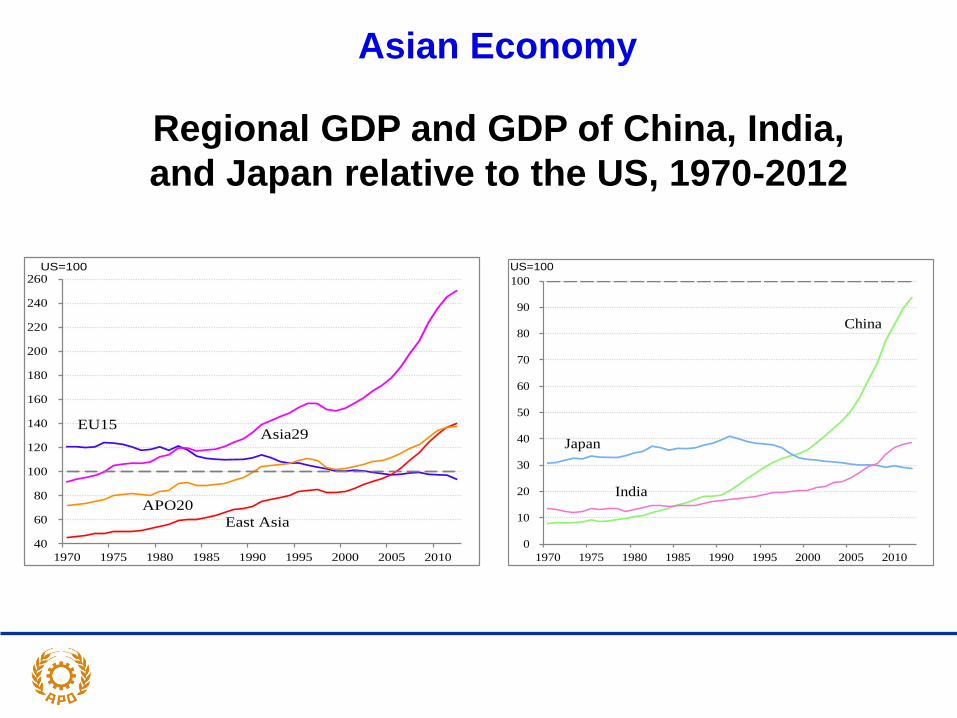
Asian Economy
Regional GDP and GDP of China, India,
and Japan relative to the US, 1970-2012
40
60
80
100
120
140
160
180
200
220
240
260
1970 1975 1980 1985 1990 1995 2000 2005 2010
EU15Asia29
East Asia
APO20
US=100
0
10
20
30
40
50
60
70
80
90
100
1970 1975 1980 1985 1990 1995 2000 2005 2010
China
Japan
India
US=100

Asian Economy
GDP Growth of Asia, the EU, Japan, and the US,
1970-2012 ―Annual growth rate of GDP at
constant market prices
-6
-4
-2
0
2
4
6
8
10
1970 1975 1980 1985 1990 1995 2000 2005 2010
Japan US
Asia29 EU15
%

Asian Economy
GDP Growth of Asia, the EU, Japan, and the US,
1970-2012 ―Annual growth rate of GDP at
constant market prices
-6
-4
-2
0
2
4
6
8
10
1970 1975 1980 1985 1990 1995 2000 2005 2010
Japan US
Asia29 EU15
%
1970 (%) 1990 (%) 2000 (%) 2010 (%) 2011 (%) 2012 (%)
Japan 209 100.0 Japan 3,097 100.0 Japan 4,741 100.0 China 5,931 100.0 China 7,322 100.0 China 8,221 100.0
China 92 43.9 China 390 12.6 China 1,198 25.3 Japan 5,507 92.9 Japan 5,919 80.8 Japan 5,951 72.4
India 61 29.0 India 322 10.4 Korea 533 11.3 India 1,649 27.8 India 1,857 25.4 India 1,823 22.2
Pakistan 12 5.8 Korea 270 8.7 India 468 9.9 Korea 1,015 17.1 Korea 1,114 15.2 Korea 1,130 13.7
Iran 11 5.4 ROC 165 5.3 ROC 326 6.9 Indonesia 719 12.1 Indonesia 858 11.7 Indonesia 889 10.8
Indonesia 10 4.7 Indonesia 127 4.1 Saudi Arabia 190 4.0 Saudi Arabia 531 8.9 Saudi Arabia 674 9.2 Saudi Arabia 739 9.0
Bangladesh 10 4.7 Saudi Arabia 118 3.8 Hong Kong 169 3.6 Iran 467 7.9 Iran 637 8.7 Iran 617 7.5
Korea 9 4.3 Iran 94 3.0 Indonesia 168 3.5 ROC 428 7.2 ROC 465 6.4 ROC 475 5.8
Thailand 7 3.5 Thailand 88 2.9 Thailand 126 2.7 Thailand 339 5.7 Thailand 367 5.0 Thailand 393 4.8
Philippines 7 3.2 Hong Kong 77 2.5 Iran 110 2.3 UAE 294 5.0 UAE 356 4.9 UAE 392 4.8
ROC 6 2.7 UAE 51 1.7 UAE 105 2.2 Malaysia 239 4.0 Malaysia 279 3.8 Malaysia 293 3.6
Saudi Arabia 5 2.6 Pakistan 48 1.5 Singapore 94 2.0 Singapore 233 3.9 Singapore 272 3.7 Singapore 284 3.5
Malaysia 4 1.9 Philippines 46 1.5 Malaysia 94 2.0 Hong Kong 224 3.8 Hong Kong 244 3.3 Hong Kong 258 3.1
Hong Kong 4 1.8 Malaysia 45 1.5 Philippines 81 1.7 Philippines 199 3.4 Philippines 224 3.1 Philippines 250 3.0
Kuwait 3 1.4 Singapore 39 1.3 Pakistan 72 1.5 Pakistan 176 3.0 Pakistan 211 2.9 Pakistan 224 2.7
Myanmar 3 1.3 Bangladesh 29 0.9 Bangladesh 46 1.0 Qatar 127 2.1 Qatar 174 2.4 Qatar 195 2.4
Sri Lanka 3 1.2 Kuwait 19 0.6 Kuwait 38 0.8 Kuwait 123 2.1 Kuwait 164 2.2 Kuwait 187 2.3
Singapore 2 0.9 Oman 12 0.4 Vietnam 33 0.7 Vietnam 117 2.0 Vietnam 137 1.9 Vietnam 157 1.9
Vietnam 1 0.6 Sri Lanka 8 0.3 Oman 20 0.4 Bangladesh 100 1.7 Bangladesh 108 1.5 Bangladesh 113 1.4
UAE 1 0.5 Qatar 7 0.2 Qatar 18 0.4 Oman 59 1.0 Oman 70 1.0 Oman 79 1.0
Nepal 1 0.5 Vietnam 7 0.2 Sri Lanka 17 0.4 Sri Lanka 50 0.8 Sri Lanka 59 0.8 Sri Lanka 60 0.7
Cambodia 1 0.4 Myanmar 5 0.2 Bahrain 8 0.2 Myanmar 42 0.7 Myanmar 56 0.8 Myanmar 60 0.7
Qatar 1 0.3 Bahrain 5 0.1 Myanmar 7 0.2 Bahrain 26 0.4 Bahrain 29 0.4 Bahrain 30 0.4
Bahrain 0 0.2 Nepal 4 0.1 Nepal 6 0.1 Nepal 19 0.3 Nepal 21 0.3 Nepal 20 0.2
Oman 0 0.1 Brunei 3 0.1 Brunei 6 0.1 Brunei 14 0.2 Brunei 17 0.2 Brunei 17 0.2
Fiji 0 0.1 Cambodia 2 0.1 Cambodia 4 0.1 Cambodia 11 0.2 Cambodia 13 0.2 Cambodia 14 0.2
Brunei 0 0.1 Fiji 1 0.0 Fiji 2 0.0 Lao PDR 7 0.1 Mongolia 9 0.1 Mongolia 10 0.1
Mongolia 0 0.1 Mongolia 1 0.0 Lao PDR 2 0.0 Mongolia 6 0.1 Lao PDR 8 0.1 Lao PDR 9 0.1
Lao PDR 0 0.0 Lao PDR 1 0.0 Mongolia 1 0.0 Fiji 3 0.1 Fiji 4 0.1 Fiji 4 0.0
(regrouped) (regrouped) (regrouped) (regrouped) (regrouped) (regrouped)
APO20 357 170.9 APO20 4,473 144.4 APO20 7,092 149.6 APO20 11,509 194.1 APO20 12,806 174.9 APO20 12,974 157.8
Asia23 451 216.1 Asia23 4,872 157.3 Asia23 8,304 175.2 Asia23 17,495 295.0 Asia23 20,201 275.9 Asia23 21,272 258.8
Asia29 462 221.2 Asia29 5,083 164.1 Asia29 8,684 183.2 Asia29 18,654 314.5 Asia29 21,668 295.9 Asia29 22,894 278.5
East Asia 319 152.8 East Asia 4,001 129.2 East Asia 6,969 147.0 East Asia 13,111 221.1 East Asia 15,073 205.9 East Asia 16,045 195.2
South Asia 86 41.3 South Asia 412 13.3 South Asia 609 12.8 South Asia 1,993 33.6 South Asia 2,257 30.8 South Asia 2,239 27.2
ASEAN 35 16.6 ASEAN 363 11.7 ASEAN 614 13.0 ASEAN 1,920 32.4 ASEAN 2,230 30.5 ASEAN 2,367 28.8
ASEAN6 30 14.4 ASEAN6 349 11.3 ASEAN6 569 12.0 ASEAN6 1,743 29.4 ASEAN6 2,017 27.5 ASEAN6 2,127 25.9
CLMV 5 2.2 CLMV 14 0.5 CLMV 45 1.0 CLMV 177 3.0 CLMV 213 2.9 CLMV 240 2.9
GCC 11 5.1 GCC 211 6.8 GCC 380 8.0 GCC 1,159 19.5 GCC 1,467 20.0 GCC 1,622 19.7
(reference) (reference) (reference) (reference) (reference) (reference)
US 1,038 497.6 US 5,801 187.3 US 9,952 209.9 US 14,499 244.5 US 15,076 205.9 US 15,775 191.9
EU15 1,209 579.5 EU15 6,155 198.7 EU15 9,571 201.9 EU15 14,051 236.9 EU15 14,636 199.9 EU15 14,925 181.5
EU27 0 0.0 EU27 0 0.0 EU27 10,637 224.4 EU27 16,124 271.9 EU27 16,840 230.0 EU27 17,215 209.4
Australia 45 21.6 Australia 322 10.4 Australia 406 8.6 Australia 1,277 21.5 Australia 1,516 20.7 Australia 1,558 19.0
Turkey 24 11.5 Turkey 200 6.5 Turkey 267 5.6 Turkey 734 12.4 Turkey 778 10.6 Turkey 791 9.6

Asian Economy
Country Contributions to Regional GDP Growth
-0.8
0.0
0.1
0.1
0.1
0.2
0.2
0.2
0.2
0.3
0.4
0.5
0.6
0.7
1.1
1.6
1.7
1.8
2.6
3.1
3.4
3.4
4.1
5.2
6.4
7.7
10.7
16.2
28.3
-10 0 10 20 30
KuwaitFiji
Lao PDRCambodiaMongolia
BahrainNepal
MyanmarBrunei
QatarBangladesh
Sri LankaVietnam
OmanSingapore
Hong KongMalaysia
PhilippinesPakistan
UAEROC
ThailandIran
KoreaSaudi Arabia
IndonesiaIndia
ChinaJapan
1970-1990
0.0
0.0
0.0
0.1
0.1
0.1
0.2
0.3
0.5
0.6
0.8
0.8
0.8
0.9
1.1
1.3
1.3
1.3
1.8
1.8
2.5
2.5
3.0
3.4
4.1
4.1
5.5
16.0
45.0
0 10 20 30 40 50
FijiMongolia
BruneiLao PDR
CambodiaBahrain
NepalOman
Sri LankaMyanmar
QatarKuwait
Hong KongBangladesh
SingaporePhilippines
VietnamUAE
MalaysiaPakistan
ROCThailand
Saudi ArabiaIran
JapanKorea
IndonesiaIndia
China1990-2012

Global Competitiveness Index,
APO member rankings Country
APO
Ranking
World
Ranking
Singapore 1 2
Hong Kong 2 7
Japan 3 9
Republic of China 4 12
Malaysia 5 24
Korea, Republic 6 25
Thailand 7 37
Indonesia 8 38
Philippine 9 59
India 10 60
Sri Lanka 11 65
Vietnam 12 70
Lao PDR 13 81
Iran 14 82
Cambodia 15 88
Mongolia 16 107
Bangladesh 17 110
Nepal 18 117
Pakistan 19 133
Fiji No Data
Top 10 Countries
Country World
Ranking
Switzerland 1
Singapore 2
Finland 3
Germany 4
United States 5
Sweden 6
Hong Kong 7
Netherlands 8
Japan 9
UK 10
148 countries assessed, The Global Competitiveness Report 2013 - 2014

The Global Innovation Index,
APO member rankings Country
APO
Ranking
World
Ranking
Hong Kong 1 7
Singapore 2 8
Korea, Republic 3 18
Japan 4 22
Malaysia 5 32
Thailand 6 57
India 7 66
Mongolia 8 72
Vietnam 9 76
Indonesia 10 85
Philippine 11 90
Fiji 12 97
Sri Lanka 13 98
Cambodia 14 110
Iran 15 113
Nepal 16 128
Bangladesh 17 130
Pakistan 18 137
Lao PDR No Data
Republic of China No Data
Top 10 Countries
Country World
Ranking
Switzerland 1
Sweden 2
United Kingdom 3
Netherlands 4
United States 5
Finland 6
Hong Kong 7
Singapore 8
Denmark 9
Ireland 10
142 countries assessed, INSEAD Global Innovation Index 2013

Asian Productivity
Productivity performance is crucial to a country’s future
economic prospects
Labor and capital devoted to production cannot increase
indefinitely, therefore productivity gains, which enable an
economy to produce more for the same amount of inputs,
are the only route to sustainable economic growth.
Productivity is a ratio of an output volume measure to an
input volume measure.

Asian Productivity
4.6
4.6
6.0
6.7
7.8
7.9
7.9
11.9
12.2
13.9
14.7
16.9
17.4
18.9
19.0
20.0
20.3
21.4
21.6
22.9
23.3
24.0
25.4
46.6
48.3
54.8
66.9
67.1
74.0
83.0
83.8
96.9
102.6
114.4
0 40 80 120
CambodiaNepal
BangladeshMyanmar
CLMVLao PDRVietnam
IndiaSouth Asia
PakistanPhilippines
ChinaFiji
ASEANMongoliaIndonesia
Asia23APO20Asia29
ThailandSri LankaASEAN6East AsiaMalaysia
TurkeyKoreaJapan
IranEU15
AustraliaROC
Hong KongUS
Singapore
Thousands of US dollars (as of 2012)
Labor
Productivity
by Per-
Worker
GDP

Asian Productivity
Labor Productivity Trends in Japan and the Asian
Tigers
0
10
20
30
40
50
1970 1975 1980 1985 1990 1995 2000 2005 2010
ROC
Hong Kong
Japan
Korea
Singapore
Thousands of US dollars (as of 2012)

Asian Productivity Labor Productivity Growth
China 10.6 China 7.1 China 8.6 China 9.5 China 8.9 China 9.1
Thailand 7.4 Vietnam 6.6 Vietnam 6.7 India 7.0 Vietnam 5.7 India 5.2
Indonesia 6.4 Korea 4.9 Cambodia 4.0 Sri Lanka 5.2 Korea 5.2 Vietnam 4.5
Malaysia 6.0 ROC 4.5 Korea 4.0 Cambodia 4.4 ROC 5.0 Cambodia 4.2
Korea 5.5 Singapore 3.2 Iran 3.7 Korea 3.6 Thailand 3.9 Korea 3.8
Cambodia 5.4 Philippines 3.0 Singapore 3.5 Indonesia 3.5 Singapore 3.3 Sri Lanka 3.7
ROC 5.4 India 2.5 Indonesia 3.3 ROC 3.0 Malaysia 3.3 Indonesia 3.4
Vietnam 4.7 Bangladesh 2.5 Hong Kong 3.1 Vietnam 2.9 India 3.0 Iran 3.2
Hong Kong 4.6 Japan 2.0 ROC 3.0 Iran 2.8 Sri Lanka 2.8 ROC 3.0
Sri Lanka 4.2 Cambodia 1.7 Malaysia 3.0 Philippines 2.8 Cambodia 2.7 Hong Kong 2.9
India 3.6 Sri Lanka 1.4 Thailand 2.9 Hong Kong 2.8 Hong Kong 2.4 Thailand 2.5
Singapore 3.5 Iran 0.7 India 2.7 Bangladesh 2.3 Bangladesh 2.2 Malaysia 2.3
Pakistan 3.2 Malaysia 0.7 Pakistan 2.3 Thailand 2.2 Japan 2.1 Philippines 2.2
Japan 2.3 Pakistan 0.6 Japan 1.7 Malaysia 1.8 Indonesia 2.0 Singapore 1.8
Bangladesh 1.9 Thailand 0.4 Sri Lanka 1.7 Japan 0.9 Pakistan 1.9 Pakistan 1.4
Iran 1.4 Hong Kong 0.2 Philippines 1.3 Pakistan 0.8 Philippines 1.7 Japan 1.2
Philippines 0.4 Indonesia -2.4 Bangladesh -0.5 Singapore 0.6 Iran 1.1 Bangladesh 1.1Fiji 0.0Fiji 0.0
(reference) (reference) (reference) (reference) (reference) (reference)
US 1.4 US 2.3 US 2.4 US 1.2 US 1.9 US 1.7
EU15 0.0 EU15 1.8 EU15 1.3 EU15 0.7 EU15 1.8 EU15 0.9
Australia 2.1 Australia 2.2 Australia 1.9 Australia 1.1 Australia 2.1 Australia 1.4
Turkey 1.2 Turkey 2.8 Turkey 5.9 Turkey 1.3 Turkey 2.0 Turkey 3.3
2000-20121990-1995 1995-2000 2000-2005 2005-2012 1990-2000

Asian Productivity
Labor Productivity is only a one-factor or partial-factor
productivity and does not provide a full perspective of
production.
That is why economists analyze Total Factor Productivity
(TFP), which is GDP per unit of combined inputs to arrive at
a more complete picture of a country’s production
efficiency.

Asian Productivity
TFP Growth
4.4
2.6 2.6 2.5
2.1
1.7 1.6 1.4
1.3 1.2 1.0 1.0 0.9
0.8 0.7 0.5 0.5 0.5 0.4
-1.5
0.0
1.5
3.0
4.5
Chin
a
India
Sri L
anka
Vie
tnam
Mongolia
Kore
a
Iran
RO
C
Pakis
tan
Thaila
nd
Sin
gapore
Philip
pin
es
US
Hong K
ong
Indonesia
Fiji
Bangla
desh
Mala
ysia
Japan
1990-2012%
3.1
1.9 1.9 1.7 1.6 1.6 1.5 1.5 1.5
1.1 0.9 0.9
0.7 0.5 0.5 0.3 0.3
0.2 0.1
-1.5
0.0
1.5
3.0
4.5
Chin
a
Thaila
nd
Sri L
anka
Vie
tnam
Hong K
ong
Kore
a
RO
C
India
Pakis
tan
Mongolia
Indonesia
US
Japan
Mala
ysia
Sin
gapore
Philip
pin
es
Bangla
desh
Iran
Fiji
1970-2012%
2.8 2.6
1.7 1.7 1.6 1.5
1.1 1.1 0.9 0.9 0.8
0.6
0.3 0.1
0.0 -0.1 -0.3 -0.3
-1.4
-1.5
0.0
1.5
3.0
4.5
Thaila
nd
Hong K
ong
Chin
a
Pakis
tan
RO
C
Kore
a
Sri L
anka
Indonesia
Japan
Vie
tnam
US
Mala
ysia
India
Bangla
desh
Mongolia
Sin
gapore
Fiji
Philip
pin
es
Iran
1970-1990%

PART 3
Role of Engineers and General Tips
for How to do Business in Asia
1
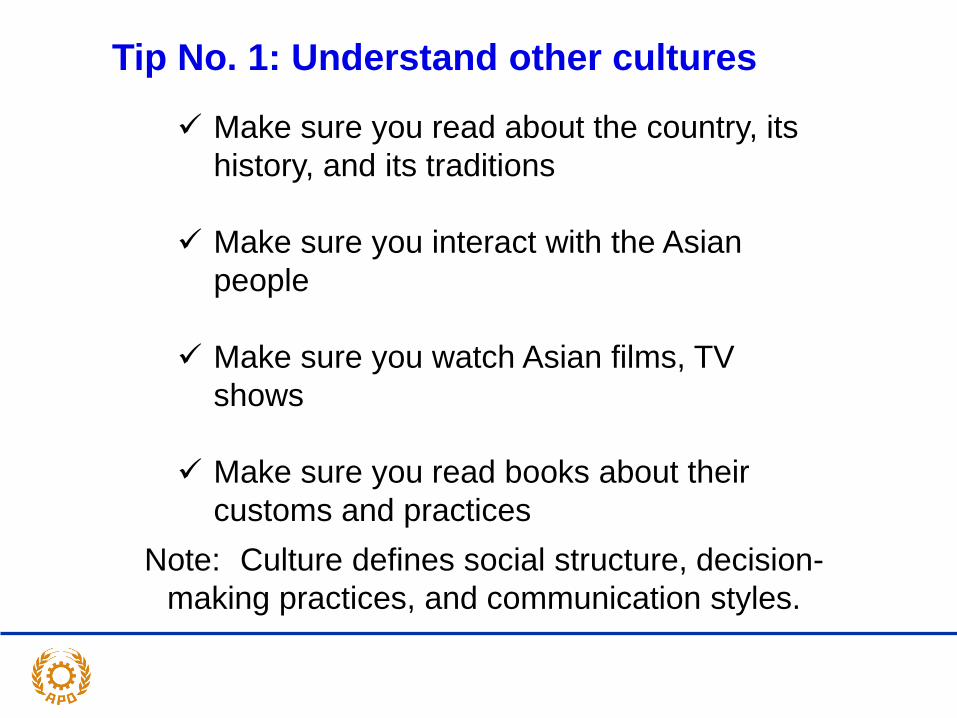
Tip No. 1: Understand other cultures
Make sure you read about the country, its
history, and its traditions
Make sure you interact with the Asian
people
Make sure you watch Asian films, TV
shows
Make sure you read books about their
customs and practices
Note: Culture defines social structure, decision-
making practices, and communication styles.

Tip No. 2: Understand the differences in
cultures
Professor Geert Hofstede conducted one of the
most comprehensive studies of how values in the
workplace are influenced by culture.
This website provides you with insights on
Hofstede's research into national and
organizational culture.
http://geert-hofstede.com/
Dimensions:
Power Distance (PDI), Individualism Vs Collectivism (IDV),
Masculinity Vs Femininity (MAS), Uncertainty Avoidance (UAI),
Long-term Vs Short-term Orientation (LTO), Indulgence Vs
Restraint (IVR)

Tip No. 3: Appreciate their religious
faiths
Religions define cultures and beliefs
Religions also define business ethics (For
eg. no alcoholic gifts for Muslims)
Understanding religion enhances
understanding of people
It will bring you closer to them quickly and
you will be able to appreciate their
traditions and behaviors faster

Tip No. 4: Believe that you are not
dealing with your country men
Do not expect them to behave like you
Do not be offended if you find them impolite
as compared to your standards
Observe their behavior closely and adjust
your style
Keep in mind that you want to do business
with them in their countries

Tip No. 5: Make friends and firm
relationships
Laugh out loud, crack jokes, and accept
humor
Answer personal questions and ask
personal questions, this enhances trust
If necessary, share personal contact
information and talk about families
Personal commitments and inter-personal
relationships are more important than
official ones.

Tip No. 6: Be prepared for
uncertainties
Accept that uncertainties are part of life
and learn to be adaptive
Please do not be upset at the changes,
delays (smile and move on)
Rather expect uncertainties/changes and
learn to be prepared for them
Always keep ready your plan B and plan C

Tip No. 7: Develop flexible mindset
Flexibility makes you more acceptable
Rules are there as the basis but business
relations can not be governed 100 % by
rules
Look at bigger picture; be ready to attend a
meeting without having a complete agenda.
Sky will not fall.
Make suggestions and accept suggestions

Tip No. 8: No need to be formal all the
time
Too much formalities confuse people
Too much formalities create distance
Being oneself enhances mutual trust,
understanding and relations
Depending upon the circumstances, being
informal and conversational can get closer to
anyone in the world

Tip No. 9: Do not be shy
Shyness reduces your potential by half
Take initiative to speak first, give your ideas
freely
Feel free to speak to others, ask questions,
and accept questions
Nobody is judging you rather everyone
wants to know your real self.
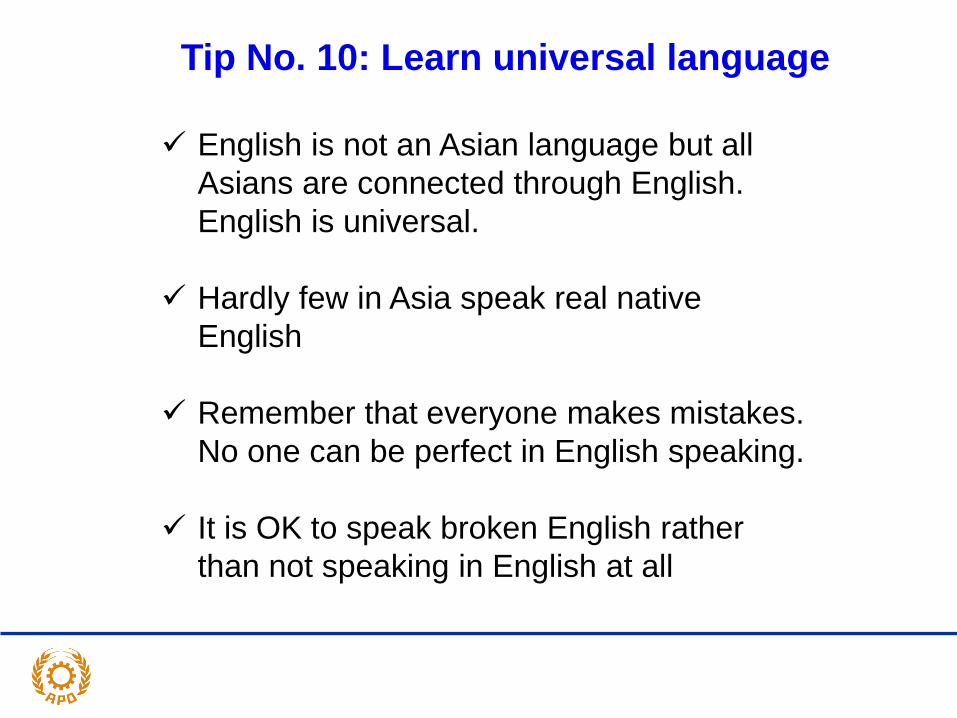
Tip No. 10: Learn universal language
English is not an Asian language but all
Asians are connected through English.
English is universal.
Hardly few in Asia speak real native
English
Remember that everyone makes mistakes.
No one can be perfect in English speaking.
It is OK to speak broken English rather
than not speaking in English at all

Tip No. 11: Communicate clearly
Speak direct and straight, not round about
Express your opinion freely, don’t withhold
Learn to negotiate, when you communicate,
and interrupt if necessary
Learn to use body language to make your
point

Tip No. 12: Understand body
language
Closely observe body language of other
people
Body language fills the communication gap
Learn to take note of their body posture,
gestures, facial expressions, and eye
movements
Listen and observe. You will understand.

Tip No. 13: It is a high context society
in Asia
If you are dealing with high context society in
other countries, expect a big communication gap
Try to understand their context
Feel free to ask questions, seek clarifications,
and take notes in business meetings
Spend more off-business time with them to
understand their context, when you are in their
countries. Mingle with them. Eat food out in their
restaurants. Talk to people, wherever you go.
Note: Most of Asian countries are high context

Tip No. 14: Know monochronic or
polychronic culture
Monochronic culture: Clocks, agendas,
calendars, and deadlines determine what and
when things are done, and time is a limited
commodity that must be carefully managed.
Polychronic cultures: Time stands in the
background; and relationships and immediate
needs usually determine what and when things
are done.
Source: Global Etiquette Guide to Mexico and Latin America
Note: Most of the Asian countries are
polychronic

Tip No. 15: Remember this thumb rule
Everyone in Asia respects all cultures,
discipline, and politeness
BUT
Every Asian expects you to be Asian when
you do business in Asia.
Try it, I am sure you will see the difference
Good Luck to all of you.
