productivity growth in grain production in the united states, 1840 … · 2015-03-25 · grain...
TRANSCRIPT

This PDF is a selection from an out-of-print volume from the NationalBureau of Economic Research
Volume Title: Output, Employment, and Productivity in the UnitedStates after 1800
Volume Author/Editor: Dorothy S. Brady, ed.
Volume Publisher: NBER
Volume ISBN: 0-870-14186-4
Volume URL: http://www.nber.org/books/brad66-1
Publication Date: 1966
Chapter Title: Productivity Growth in Grain Production in the UnitedStates, 1840–60 and 1900–10
Chapter Author: William N. Parker, Judith L. V. Klein
Chapter URL: http://www.nber.org/chapters/c1577
Chapter pages in book: (p. 523 - 582)

Productivity Growth in GrainProduction in the United States,
1840—60 and 1900—10
WILLIAM N. PARKERAND
JUDITH L. V. KLEINYALE UNIVERSITY
In nineteenth century America, productivity growth in grain productionderived largely from two characteristic features of the century's history:westward expansion and technological change. We know that produc-tivity increased and we know that both westward expansion and techno-logical change occurred. By averaging the dispersed and fragmentarydata we may even guess at the extent of the productivity increase—atleast in the use of labor. Can we also assess the relative importance ofthe factors which produced this effect? This paper contains the resultsof an effort to do this, for the two elements just mentioned and for thethree major grain crops: wheat, oats, and corn. These crops accountedfor about 55 per cent of the land harvested for crops in the United Statesin 1910.'
To estimate the effect of one factor in history is an exercise in imagina-tion controlled and guided by the available data. It requires a mental
Nom: This study is one of a series carried out under the auspices of the Inter-University Project for American Economic History. Financial help was provided byThe Ford Foundation through the Inter-University Project and through other avenues.Resources for the Future, Inc., the University of North Carolina, and the Social ScienceResearch Council also gave financial support. Library space and facilities were gener-ously furnished by the National Agricultural Library (U.S. Department of Agriculture)and The Brookings Institution. Our efforts were assisted by a staff at Washingtonand at regional libraries which included from time to time Martin, Max, and MarlenePrimack, Chaplain W. Morrison, Fred Bateman, Jr., Don C. Schilling, Mary LeeSpence, Miles F. Frost, Diane Light, and Mary G. Bullock. Studies on Cotton, hay,corn fodder, and dairy and meat products are now in preparation.
Historical Statistics of the United States, Colonial Times to 1957, U.S. Bureau ofthe Census, Washington, 1960, Series K-98, K-265, K-269, K-274.

524 SOURCES OF PRODUCTIVITY CHANGE
experiment in which one tries to conceive how the history would havedeveloped if one element in a situation had varied while the othersremained unchanged. In this study the effort is made to conceive howproductivity would have moved from the levels of 1840, if westwardmovement had taken place without technological change, and if techno-logical change had occurred without westward movement. The principaldifficulty encountered arises from the fact—common enough in thenineteenth century economy—that while production was shifting westwardand techniques were changing, total output was undergoing an enormousexpansion. To do our work completely, then, we should like to knowhow productivity would have moved in the East under the same demandpressures for output expansion which in fact found their outlet in thewestern development. To estimate this, however, we would need data onthe shape of the supply curve of the eastern regions at those levels ofoutput which were in fact never attained. A close enough investigationinto the production conditions in the East might permit such curves tobe estimated, but such an effort lies far beyond the data and researchresources at our disposal. As will appear in the course of the report,the interpretation of the indexes developed here is restricted by thisdeficiency.2.
Even within these limits, a question arises about the independence ofthe two variables whose influence is under examination. Would movementinto the Middle West and the shift in grain production which accompaniedit have occurred without the improvements in farm machinery? Andwould those improvements, so well adapted to western conditions, havebeen available in the East, if the stimulus to invention offered by labor"scarcity" and abundant land in the West had not appeared? Suchquestions go behind the immediate influences on productivity to the causesof the changes from which productivity growth was produced. Theevidence developed in this paper is designed to throw light on first-ordercauses of the productivity growth; the causes of those causes are left tofurther investigation.
Against these limitations may be set one opportunity that our data andtechnique appear to offer. That great, half-inbred family of ideas knownas technological change has affected production conditions in agriculturethrough two main lines of descent. The succession of mechanical inven-tions—from simple tools to complex power-driven machinery in the fieldand barn—has affected most directly the changes in labor inputs in the
2 A second deficiency in this study is the neglect of capital inputs and, with it, thelack of a production function and of a measure of total factor productivity. Themeasurement of agricultural capital is so uncertain that an attempt to include it would,in our opinion, add more to the study's range of error than to its completeness orprecision.

GRAIN PRODUCTION, 1840—60 AND 1900—10 525
operations on the soil or in the handling and processing of the crop. Ata given level of mechanical techniques, however, the operations on thesoil—plowing, sowing, and harrowing—use labor in a relatively fixedproportion to the area under cultivation. The productivity of this labor,measured in man-hours per bushel of harvested grain, depends then uponthe yields of land, and these in turn are influenced less by mechanicaltechniques than by another branch of technology, agricultural chemistryand plant biology. Invention in biology and chemistry was, by modernstandards, far less advanced in the nineteenth century than invention ofmechanical equipment; and the levels of practice both in the developmentof seeds and in the management of the land depended less upon organizedexperiment than upon the process of natural selection, both in natureamong plants and in the economy among innovating farmers. Themovements of land yields reflect both the margin of cultivation and theresults of the social processes of invention in this area, while the move-ments of labor inputs per acre are most strongly affected by the use ofmechanical equipment.3 These two results of the two compartments oftechnology—land yields and labor per acre—are available separately inthe data here, and our analysis can consider the effect of holding oneconstant while varying the other by the same statistical operation as thatby which the independent effect of the interregional shifts is identified.
Quantitative methods of a limited and partial character, such as thoseused in this study, veer rather rapidly into nonsensical results. Yet, usedwith sufficient caution they may yield meaningful statements about thecauses or mechanisms of historical change and indicate where importantlines of further investigation may lie. In the present study, thanks tomuch generous assistance, they have the advantage of being based upona rather wide survey of the remaining quantitative materials from nine-teenth century sources. They represent an effort to make precise, throughnumerical estimates, those general impressions about productivity andits sources which a reading of the history inevitably gives.
Definitions and AssumptionsThe variables whose separate influences on labor productivity are assessedin this study are:
1. The weights of regions in total acreage and output, weights whoseshifts form part of what the historian knows as westward movement.
The correspondence of these two variables to the two types of technological changeis not complete, of course. Use of mechanical equipment affects yields per acre, anda chemical invention such as fertilizer requires a large per acre labor input. Thesecross-effects do not appear to be strongly present in our period, and we have omittedlabor in manuring from the calculations.

526 SOURCES OF PRODUCTIVITY CHANGE
2. The mode of carrying out operations on the soil and on the standingand harvested crop, whose improvement reflects mechanical inventionand changes in the amount and form of capital.
3. The choice of soils and plant strains, the timing of operations, andother bits of biological and chemical knowledge, mostly not incorporatedinto mechanical equipment and affecting the yield of the land.
The technique used here—essentially the "partitioning" techniquefamiliar from the studies of Kuznets, Abramovitz, and Denison—hasbeen selected with an eye both to the objective of exposing the influence ofthese variables and to the severe limitations of the available numericaldata. To derive conclusions from the data by this technique requirescertain definitions and assumptions.
First, we define the two periods of study: period 1, 1839, and period 2,1907—11. These are terminal periods, so the study is confined to a com-parison of two benchmarks. The periods are set by the availability ofCensus production data from the first agricultural Census, 1840, and thepossibility of a five-year average of the Department of Agriculture's revisedestimates of acreage and output around 1909. Data on labor inputsmust be gathered over a somewhat wider period. For period 1 inputs,sources from the 1830's to the 1860's were used, and for period 2, reportsfrom the late 1890's to mid-1910's. Production conditions are not uniformwithin either of these wider terminal periods. In the first period, ruralsettlement between the Ohio and the Mississippi rivers, begun forty yearsearlier, is intensified and the Mississippi is crossed. After 1845 themechanical reaper begins to be sold, and used in the 1850's in significantnumbers, and the horse- or mule-drawn cultivator in corn assumesincreasing importance. Still, in comparison with the shifts to the GreatPlains between 1860 and 1900 the movement—both geographical andtechnological—is relatively small. Data were selected from the earlierperiod to represent production conditions around 1840, and the estimateof yields and acreage distribution is taken as of 1839. In the 1907—ilperiod, both the westward movement and the development of the horse-drawn mechanical technology are almost complete. Between theseterminal dates it has not seemed possible to assemble sufficient evidenceon the diffusion of the mechanical techniques to permit labor inputestimates to be drawn up.
The use of 1839 as the initial date is of course partly determined by theavailability of the Census production data, in addition, it has the advan-tage that the West, by that time, was a distinct region and had achievedsubstantial development. In wheat and oats, on the basis of homogeneityin land yields, the United States appears to fall into two great regions:North and South. But in the North, labor inputs per acre in period 1 may
GRAIN PRODUCTION, 1840—60 AND 1900—10 527
be divided between the Northwest, with inputs resembling those of theSouth, and the Northeast, with higher levels of labor cost. Combiningland yields and labor inputs per acre, then, gives three regions as follows:
Wheat and Oats Output Labor InputPer Acre Per Acre
Northeast high highWest high lowSouth low low
In corn, the border states separate from both North and South on thebasis of land yields, and, with the division between Northeast and Weston the basis of labor inputs, four regions may be delineated. The statisticalbasis for defining these regions is described more fully in Appendix A.To permit comparison, the same regions must be retained in period 2.However, for grains the effective boundary of the West in period 2 isextended from the Mississippi to the Pacific Ocean. The impact of thelarge intraregional shift within this extended West is analyzed separately(in the next to last section of this study).
In addition to period and region, it has been necessary to group thelabor-using agricultural operations into the three customary groups:those on the soil before harvest, those on the standing crop (harvesting,including shocking of wheat), and those on the cut crop (threshing andshelling). The shelling of corn, as well as the transport of all the crops tothe barn and to market, has been omitted from the calculation. Thesethree groups of operations correspond to three engineering problemsinventors faced in the effort to mechanize. The preharvest operations,involving contact of a tool with the soil (except for broadcast seeders),required knowledge of the soil's physical characteristics and the relationof plant growth to them. It required also the invention of implements—plows, cultivators, and harrows—to produce the required tilth, and theiradaptation to soils of varying composition. This problem was especiallyacute as the prairie soils came under the plow. The harvest operation inwheat, handling not the soil but the unthreshed crop, required the appro-priate adaptations of mowing and raking tools. In the humid areas itinvolved also the problem, never satisfactorily solved by mechanical meansin this period, of protecting, ripening, and drying the crop between reapingand threshing. The postharvest (threshing) operation in wheat involved,when mechanized, the substitution of the beating motion of the flail or thehoof by a stripping motion not unlike that of the cotton gin. In corn, theproblem of mechanical harvesting was never satisfactorily solved duringthis period. In the first two groups of operations movement over the fieldwas required, and so they were suitable to improvement by animal power

528 SOURCES OF PRODUCTIVITY CHANGE
or self-propelled engine. In the second and third groups, mechanizationrequired power transmission and the activation of movable parts.
These engineering requirements gave the production function in eachgroup of operations its economic characteristics. In the first group for allthe crops, under any technique, labor time varied with the character ofthe soil and the area planted. The yield of the land may depend partlyon the care, timing, and skill in the operations—particularly in corn wherecultivation is required. Rich land and hot weather grow weeds as wellas crops and the tasks of hoeing and cultivating are heavier. But theconnection between cultivation and yield in corn was not known in anyscientific sense, and opinions on this relation were almost as numerousas the farmers holding them. The functional relation between yield andtillage as actually practiced cannot be defined, while the variation withacreage at any level of cultivation is quite apparent. In harvesting, timespent by laborers in travel over the fields depends partly on the areaharvested and partly on the thickness of the stand. But in addition totravel time, the time in place during the gathering of the crop varies withthe kind of crop and the yield. In wheat and oats it is secondary to thetravel time; a thick crop can be reaped almost as fast as a thin one. Incorn, a heavier crop involves larger ears as well as closer planting. Hence,in the grains, harvest labor is assumed to be proportional to acreage. Theoperations then are grouped as follows:
Preharvest (assumed fixed per acre)Wheat and Oats Corn
Plowing Field preparationaSowing PlantingHarrowing Cultivating
Hoeing
Harvest (assumed fixed per acre)Wheat and Oats Corn
Reaping Picking or huskingRakingBindingShocking
Postharvest (assumed fixed per bushel)Wheat and Oats Corn
Threshing ShellingWinnowinga Depending on regional variations in practices.b Not included in this study.

GRAIN PRODUCTION, 1840—60 AND 1900—10 529
The Statistical TechniqueFor each region (as defined above), and at each of the two periods, anestimate of average labor input is made for each of the three groups ofoperations. For groups 1 and 2, these estimates are made in man-hoursper acre, and divided by an estimate of average regional yield to giveman-hours per bushel. This estimate is then added to the estimate ofman-hours per bushel in group 3 to give the total labor input per bushel.These estimates for each region are weighted by regional output to givenational averages at each period. The productivity change is then the changein this national estimate (or rather in its reciprocal) between the two dates.
Symbols and the formulas are as follows:L1 = Preharvest labor (man-hours)L2 = Harvest labor (man-hours)L3 = Postharvest labor (man-hours)
= NortheastR2 = South (wheat and oats)
R2a = Middle east (corn)R2b = South (corn)R3 = West
0=
C =1
2=
Area (acres planted)Output (bushels of threshed grain)L1/A y = 0/AL2/A v = 0/EQL3/0 w=A/EAperiod 1 (1839period 2 (1907—11
))
+ c.'Iv = national average labor input per bushelR1\y /To analyze the effect of change in regional weights, labor inputs, and
land yields, it is possible to calculate an index with changes in the sub-scripts of the variables v, abc, and y. Indexes which use the formula withperiod 1 labor inputs as a base, and with numerators in which the sub-scripts of the variables are changed one at a time from 1 to 2, show theeffect of the change, of each variable in isolation. Change in the subscriptsin groups of two at a time shows the effect of combined changes in thevariables. For the three variables there is thus generated a family of eightindexes on the period 1 base as follows: v2abc2y2; v2abc2y1; v2abc1y2;v2abc1y1; v1abc2y2; v1abc2y1; v1abc1y1. If we then consider

530 SOURCES OF PRODUCTIVITY CHANGE
each variable and each grouping of variables as a factor with measurableindependent effect, a plausible solution to the index-number problemmay be found by representing the relative effects of the factors by therelative algebraic sums of the rows of indexes with signs indicated in thefollowing matrix:
Factors v2abc2y2 v1abc1y1 v2abciy1 v1abc2y1 v1abciy2 v2abc2y1 v2abciy2 v1abc2y2V + — + — — + + —
abc + + + +y + — + — +v(abc) + + + + —Vy + + + — + —(abc)y + + + — — — +v(abc)y + — + + +
The source of this method and the formulas to prove the signs of theindexes are shown in Appendix C.
Our principal conclusions are obtained by applying this technique tothe three variables just cited. It may also be applied within the variablesv (regional weights) and abc (labor inputs) to indicate the relative impor-tance of factors working in and through them. The change in regionalweights has an effect on labor inputs, both directly in the differing laborinputs per acre of the period 1 regions, and indirectly through the differentland yields of the period 1 regions; the relative importance of the effectthrough each of these channels can be calculated. Within labor inputs,too, indexes may be computed for wheat and oats, which vary each of thethree groups of labor separately and in combination, while holding yieldsand regional weights at their period 1 levels. Both these subsidiaryfamilies of indexes were computed and the importance of the factorsassessed, as shown above. Finally, indexes were computed using theperiod 2 subregional values of that portion of the western region includedin the period 1 West. This was done to show the effect on the indexesof the intraregional shift from the old Northwest to the Plains and PacificCoast states. A separate index showing the effect of the intraregionalshift within the South was computed for corn.
The DataSome understanding of the data for this study is necessary for a sym-pathetic—or an unsympathetic—appraisal of the conclusions. These dataare presented in summary fashion in Appendixes B and D, and whatfollows here is only a general discussion of their sources and relia-bility.

GRAIN PRODUCTION, 1840—60 AND 1900—10 531
The most dubious use of the data lies in the combination of the estimatesof land yields by state, based on the USDA revised estimates, with anaverage of labor inputs per acre derived from a sample of contemporaryevidence which, particularly for the early period, is drawn largely fromthe most productive farms. The labor data for period 1 are drawn largelyfrom premium reports to state agricultural societies in the Northeast and,in the South, from the records of plantations. There is reason, however,to argue that labor inputs on such farms are less biased than a similarsample of yields would be. For one thing, if bias exists, it is not certainwhich way it would run. Are the premium farms and record-keepingplantations those which use more labor per acre to get higher yields, orless labor because of greater efficiency? Furthermore, in wheat and oats,the case is particularly strong since high yields are obtained by superiorseed, soil, and skill rather than by the labor-intensive operations of weedingand cultivating. In plowing and planting, there is no clear reason thatlabor input should vary with yield, while in the harvest and postharvestoperations it has been generally possible to take account of the techniquesemployed. In the few cases where a statement about average conditionsor from a professedly average farm is obtained, the figure falls well withinthe range of the distribution.
The data for labor inputs by region in period 2 are much more plentifuland specific than those for the mid-nineteenth century. They were drawnfrom cost studies of the USDA and the Agricultural Experiment Stationsand from a retrospective study in the 1930's by the WPA, NationalResearch Project (NRP).
With respect to the two kinds of data, the usual—but perhaps not morethan the usual—uncertainties appear. For land yields, the USDA esti-mates for 1866—75 were projected back by state to 1839, without allowancefor trend. This procedure was thought to be justified in view of the smalltrend in the state series throughout the whole half-century after 1866.However, for grains in the Ohio Valley states, these levels differ from thehigher contemporary estimates for the 1840's and 1850's, and an alternateestimate of all the indexes, based on a higher set of yields for these statesin this period, is presented in Appendix B. In the data on labor inputsby operation and region, the variety of sources and the numerous quali-fying considerations to individual• figures make summary statementdifficult. The scatter is greatest in the period 1 estimates for plowing, asmight be expected, and the cases are least numerous for the West inperiod 1. In each case, the regional data have been examined to seewhether a significant difference in the means is present and, where thisis not the case, data for regions have been combined. Similarly, in a few

532 SOURCES OF PRODUCTIVITY CHANGE
cases it has been possible to combine data for the same operation inwheat and oats. In general, data have been collected to the limit of thetime and resources of money and patience available to the project and—unlike the agricultural operations which are the subject of this paper—itwas apparent at several points that diminishing returns had set in.
The averages and dispersion of the data, and count of cases, are shown inAppendix D.
The Princ-ipal Findings
LABOR INPUTS, LAND YIELDS, AND REGIONAL WEIGHTS
Table 1 shows averages of land yields and labor inputs for each of theregions at the two periods of this study, with national averages determinedby the output weights of the regions. From these data the principalconclusions about the extent and sources of the productivity increase are
TABLE 1
LABOR I LAM) VIEWS, ANt) PERIODS 1 AM). 2
Region
a
1 2 1
b
2
y
1 2
0
1 2
V
1 2
W
1 2
WHE&T
R1 19.1 11.6 15.0 3.0 14.5 17.5 .73 .19 .334 .046 .259 .037
R2 11.3 10.7 12.5 3.0 8.4 12.3 .73 .29 .342 .075 .459 .085
R3* 12.6 4.7 15.0 2.3 13.0 14.0 .73 .19 .324 .879 .282 .878
U.s. 13.6 5.5 13.9 2.4 11.3 14.0 .73 .20
OATS
R1 14.3 9.3 12.8 3.4 28.5 29.7 .40 .23 .422 .087 .316 .077
R2 8.8 9.5 11.0 4.5 13.9 17.0 .40 .24 .332 .044 .506 .068
R3* 8.8 3.9 12.8 2.6 29.3 26.5 .40 .10 .246 .869 .855
U.s. 10.5 4.7 11.9 2.8 21.3 26.1 .40 .12
CORN
R1 98.3 46.4 13.0 13.0 33.5 36.8 .097 .029 .057 .020
52.0 26.7 10.1 10.1 21.8 24.4 .344 .099 .310 .106
2b67.3 21.3 4.3 4.3 11.8 16.1 .279 .175 .465 .285
462 14.2 13.0 7.6 32.7 31.0 .280 .697 .168 .589
u.S. 60.8 18.2 8.1 7.0 19.6 26.2
Note: See text for explanation of the symbols.Source: v, w, y: Table 1.0 below, and sources listed there.
a, b, o: Appendix D.AAppendix B contains alternate yields for period 1 for all crops in the west-
ern region and for corn in the South and Middle East.

GRAIN PRODUCTION, 1840-60 AND 1900-10 533
derived by the indexes of Table 2. The first, and most apparent, conclusionis the index of labor productivity for each crop: wheat, 417; oats, 363;corn, 365. In Table 2, this total index is shown as one of the family ofindexes generated by combining the three main variables, using all possiblecombinations of period 1 and period 2 values. From this it is apparent thatmechanization, in combination with the regional shift (i6), is responsiblefor nearly the whole effect in wheat and corn, and more than the wholeeffect in oats, and that even leaving the distribution of production in itsperiod 1 proportions, mechanization within each region taken aloneproduces an effect which is large (i3). Applying the technique describedabove, values indicating relative importance of the factors are derived asfollows:
Wheat Oats Cornv .170 .287 .207abc .598 .506 .562y .082 .005 .084v(abc) .158 .234 .120vy —.049 —.026 —.007(abc)y .046 .004 .032v(abc)y —.005 —.010 .002
The economic meaning to be given to these results is discussed in theconcluding section of this paper.
TABLE 2
LABOR REQUIREMENTS (U.S. AVERAGE INDEXES) AS AFFECTED BY INTER-REGIONAL SHIFTS, REGIONAL YIELDS, AND REGIONAL LABOR INPUTS PER ACRE
Period'
Valuesforof
Labor Require(LfO)*
ment Productivity (OIL) Index(i1/i x 100)
Wheat
(1)
Oats(2)
Corn
(3)
Index V y.
aba Wheat Oats Corn(4) (5) (6)
1 1 1 3.17 1.45 3.50 100 100 100
2 1
1 2 1.29 0.78 1.54 245.7 185.9 227.3
i•4 2 1. 1 2.90 1.18 2.70, 109.3 122.9 129.6
t5 1 2 2 1.05 0.72 1.32 302.1 201.2 265.2
2 1 2 0.84 0.39 1.06 377.3 371.7 330.2
v 2 2 1 2.69 1.23 2.45 117.8 117.9 142.9
2 2 2 0.76 0.40 0.96 416.7 362.6 364.6
*E
(a -r LI + a) v.y

534 SOURCES OF PRODUCTIVITY CHANGE
TYPES OF MECHANIZATION
The effect of mechanization alone (Table 2, i3) can be broken down intoits effects on each of the three groups of operations in each region. Theaverages derived from our data for this calculation are given in Table 1.Here the relatively greater importance of the mechanization in harvestingand threshing, as compared with that of the improvements in power andimplements in plowing and planting, is clear. By a similar calculationto that for Table 2, we produce for wheat and oats the indexes of Table 3in which, at the land yields and distributions of period 1, each element isvaried independently and in conjunction with each of the others. In corn,the lack of significant mechanization in harvest and postharvest operationsmakes such a calculation of no importance. The values indicating therelative importance of the factors are as follows:
Wheat Oatsa .165 .126b .384 .456c .214 .250ab .074 .045ac .043 .026bc .093 .086abc .026 .011
TABLE 3
LABOR (U.S. AVERAGE AI.V UDEXES) AS AFFECTEDBY IN REGIONAL LABOR INPUTS
Index
PeriodValues
a b
forof
a
Labor Requirement(L/O)*
Productivity
(j1/j
(OIL) Indexx 100)
Wheat OatsWheat Oats(1) (2) (3) (4)
i1
2
1
1
3.17 1.45
2.19 1.08
100
144.7
100
134.2
1.3 1 1 2 2.66 1.26 119.2 115.11.4 2 1 1 2.79 1,36 113.6 106.7
2 2
2 1 2
2 2 1
2 2 2 1.29 0.78 245.7 185.9
* ,a+bZ i. +c)v,.
y1

GRAIN PRODUCTION, 1840-60 AND 1900—10 535
THE TWO EFFECTS OF REGIONAL SHIFTS
The regions of our study are defined with respect both to labor per acreand to the yields of land. This definition of regions is discussed in AppendixA. It is apparent that interregional shifts will affect average labor perbushel through an effect on the national average labor input per acreand on the average yield in bushels per acre. It is possible then to breakdown the effect shown in Table 2 into an effect by way of each of thesecomponents. Moreover, the effect through labor per acre is furtherdivisible into an effect by way of each type of labor input which showsinterregional differences in period 1. In Table 4, these subsidiary indexesare given, holding the values of labor inputs and yields at the period 1level, but weighting them by acreage rather than output weights to permitvariation of the weights of yield and labor input variables independently.
TABLE
LABOR REQU!RE?iEt'ITS (U.S. AVERAGE AND IlDEXES) AS AFFECTEDBY INTERREGIONAL SHIFTS
Index
PeriodValues
forof
Labor Requir(L/O)*
ément Productivity (OIL) Index(i1fi x lOG)
a1t, b1wWheat Oats Corn Wheat Oats Corn
(1) (2) (3) (4) (5) (6)
i1 1 1 1 3.17 1.45 3.50 100 100 100
2 1 1 3.07 1.39 3.15 103.3 104.3 111.1
t3 1 2 1 3.25 1.49 3.61 97.6 97.3 97.0
1 1 2 2.90 1.20 2.69 109.3 120.8 130.1
1
2 2 2.82 1.15 2.42 112.4 126.1 144.6
v7 1 2 2 2.97 1.22 2.77 106.7 118.9 126.4
'82 2 2 2.89 1.18 2.50 109.6 122.9 140.0
* E a1w +E
+ For corn, o = 0. For i1, this reduces toy1
the of Table 2.
In traregional ShNearly all of the acreage increase between 1840 and 1910 occurred in theregion we have labeled West. In wheat, this expansion occurred in the1860's, 1870's, and 1890's; in oats, in the 1880's; in corn, in the 1850's

536 SOURCES OF PRODUCTIVITY CHANGE
and 1870's. Acreage of wheat and oats remained fairly steady in theother two major regions of period 1, and their acreage and output weights(Table 1) had all fallen to less than 10 per cent in period 2. The behaviorof the yields and labor-per-acre coefficients for the western region is thusof decisive importance in controlling the average productivity change inthe nation as a whole. As might be expected from the changes in theregional weights, the western region exhibits a sharper fall in labor peracre than the other regions do (Table 1), and the enormous expansiondoes not seriously affect the level of land yields.
In the foregoing sections, the three regions have been treated as if eachwere a homogeneous unit whose yields and labor input coefficients changedonly as a result of technical change. The stability of land yields in thepresence of absolute changes of acreage was taken as evidence for thisassumption. Within each region, however, it is possible that the stabilityof yields and the fall in labor costs per acre were due in part to intraregionalshifts to acres of similar yield, but of a physical aspect more favorable tofarming. A study of labor costs in land clearing shows, for example, thatthe shift from forested area to prairie was a major factor in saving laborin those operations.4 In the Northeast and South, the period 2 weightsfor wheat and oats are too small to make further intraregional analysisuseful. But for the West, and, in the case of corn in the South, a closerlook at the yields and labor coefficients of the major geographic subregionsmust be obtained.
For this purpose, the West may be divided in period 2 into the majorsubregions used in the basic NRP reports of the WPA. These subregionswith their output and acreage weights are shown in Table 5. The period2 subregional weights show where the great acreage expansions in theWest occurred. For wheat, the growth of the "small grain" tier of states(Montana, the Dakotas, Nebraska, and Kansas) was the most importantdevelopment, but the secondary growth of acreage on the West Coast(Northwest and California), the Great Lakes states (WD) and in the cornbelt (C) accounted together for an almost equally large new acreage. Ofa 38-million-acre expansion in the West, about 20 million is accountedfor by the new acreage in the small grain subregion. In oats, the expansionwas more heavily concentrated in the corn belt and the western dairystates. For corn, as might be expected, almost 60 per cent of the acreageincrease in the West was concentrated in the corn belt, and only 33 per centin the small grain subregion. The differentials among these subregions inperiod 2 labor inputs are thus of considerable interest. If these differentials
M. Primack, "Land Clearing under Nineteenth Century Techniques: Some Pre-liminary Calculations," Journal of Economic History, XXI, 1962, pp. 484—497.

GRAIN PRODUCTION, 1840-60 AND 1900—10 537
TABLE 5
AND ACREAGE WEIGHTS OF WESTERN SUBREGIONS, PERIOD 2
Subregions
Output(0/1.0)
AcreageC4/L4)
Wheat Oats CornWheat Oats Corn
W .879 .869 .697 .878 .855 .589
W:C .235 .413 .490 .207 .379 .359
W:WDW:SG +
.108.408
.190
.212
.051 .098
.477
.185
.249
.042181a
WiR .020 .015 .015 .012
W:NW + Cal .108 .079.005
.081 .030.007
Source: USDA, revised estimates, 1907—11.Key: W — West; W:C corn belt; W:WD — western dairy; W:SC —
small grain; W:WC western cotton; W:R — range; W:NW — North-west; W:Cal California. See Appendix D for states included ineach subregion.
a
W:SG only.
are large, much of the productivity improvement attributed above tomechanization might instead be attributed simply to the intraregional shiftwithin the West.
In Table 6, the period 2 yields and labor inputs for the subregions ofthe West are compared. The region labeled W :C includes the stateswithin whose limits most of the West's acreage of period 1 appears. Theother subregions were almost wholly untouched in the 1840's. With
TABLE 6
YIELDS LABOR II\I'UTS IN THE WESTERN SUBREGIONS, PERIOD 2
Yialds (y)
LABOR INPUTS
Preharvest (a) Harvest (b) Postharvest (o)
Subregions Wheat Oats Corn Wheat Oats Corn Wheat Oats Corn Wheat Oats Corn
VWtCw:WDW:SC +W:RW:NW + Cal
14.0 26.515.8 28.4
15.3 26.812.0 22.218.6 32.719.4 33.8
31.035.831.7219a
4.7 3.95.5 3.3
6.1 6.1
4.2 3.06.0 7.6
3.2 3.2
14.215.217.3114a
2.3 2.63.0 2.63.0 3.51.8 1.77.5 8.32.0 2.0
7.67.4
13.068a
.193 .098
.224 .092
.165 .108
.190 .094
.226 .129
.165 .095
0
0
0
0
Source: Yields, from USDA, revised estimates. For labor inputs, see AppendixTables D—lO, D—l2, D—13, fl—IS, fl—li, D—18. For explanation of subregion symbols, seeTable 5.
a
W:SC only.

538 SOURCES OF PRODUCTIVITY CHANGE
respect to land yields, it is apparent that the new subregions W :WD andW :SG were lower, and the northwestern coastal regions higher, than theold Northwest. That the lower level of W :WD was not a persistent trendis shown in Table 11 below; in previous decades and—in wheat—undersomewhat larger acreages, the yields in the western dairy states (W :WD)were as high as, or higher than, those in the older states to the south ofthem (W:C). In the small grain states (W:SG) the yields in 1909 weremuch lower relative to the other subregions than in earlieE years, and thisis partly accounted for by the rapid rise in the subregion's• acreage in thedecade 1899—1909. The movement to W:SG did tend to depress yieldsin the West; for wheat this is partly balanced in the regional average bysome rises in intrasubregional yields in the and for all crops by thegrowth in the other, somewhat higher yielding regions. However, in thesmall grain subregion of the West, somewhat lower yields were balanced byeasier conditions of cultivation and harvesting. This differential, shownin Table 6, is clearly significant for harvesting wheat and oats, where thedry weather at harvest time permitted the labor of binding and shockingto be eliminated on a large portion of the acreage. But it is also largefor corn, where the simpler harvesting method of husking from thestanding stalk was universally used (Appendix Table D-10).
To indicate the net effect of this intraregional shift within the West onthe indexes calculated in Table 2, one may assume that the westwardmovement took place under the period 2 yields and labor inputs, shownfor the period 1 western region (W:C in period 2). The effect of replacingthe period 2 W values by W:C values may be seen by comparing thefirst two lines of Table 6 and by the calculations of Table 7. In all ourindexes where Y2 values appear, the replacement would raise the produc-tivity index by less than 10 per cent, and the portion of the rise attributedto intraregional changes in land yields would be raised. The differencebetween this index and the one calculated in Table 2 is a measure of thedepressing effect of intraregional shifts on productivity in the West by wayof their effect on land yields. In wheat, the replacement of W by W:Cvalues for labor inputs would reduce the productivity index by about
per cent, and reduce the portion to be attributed to mechanicalimprovements within the regions. In oats the reverse would be true andin corn the change would be negligible. The net effect on labor per bushelin the West is shown in Table 7; the indexes of Table 2, with the W valuesaltered to W:C values in period 2, are shown in Table 8. From thecomparison it appears that in wheat the total productivity index (i8) isdepressed by about 8 per cent because of the higher labor inputs inW:C (13) and especially through the interaction of this with the regional

GRAIN PRODUCTION, 1840—60 AND 1900—10 539
TABLE 7
PERIOD 2 VALUES OF CORN BELT WEST COMPARED
Variables
Whe
W:C
at
W
Oats
W:C W
Corn
W:C W
a 5.5 4•7 3.3 3.9 15.2 14.2
b 3.0 2.3 2.6 2.6 7.4 7.6
a + b 8.5 7.0 5.9 6.5 22.6 21.8
y 15.8 14.0 28.4 26.5 35.8 31.0
a + b 0.538 0.500 0.208 0.245 0.631 0.703
yo 0.224 0.193 0.092 0.098 0 0
a + b + 0.762 0.693 0.300 0.343 0.631 0.703
Sources Table 6.
shift (i6). In oats the index is raised about 10 per cent largely through theinteraction between the small reduction in labor inputs per acre and themassive interregional shift (i6). In corn, the rise of about 5 per cent in
caused by the substitution of the W :C values for the W values comesfrom the effect on land yields in conjunction with the regional shift (17).It is evident then that the indexes would not have been strongly affectedif the intraregional shifts within the West—which permitted the growth
TABLE 8
EFFECT ON TABLE 2 IlDEXES OF SUBSTITUTION OF CORN BELT FOR WEST
Index V
PeriodValues
y
forof
aba
Wheat Oats Corn
Table 2 W=W:C Table 2 Table 2
1 1 1 100 100 100 100 100 100
2 1
1 1 2 246 236 186 189 227 226
v4 2 1 1 109 109 123 124 130 130
i5 1 2 2 302 297 201 207 265 270
V6 2 1 2 377 326 372 400 330 324
i7 2 2 1 118 127 118 123 143 154
• 2 2 2 417 385 363 403 365 385

540 SOURCES OF PRODUCTIVITY CHANGE
TABLE 9
OUTPUT WEIGKTS, ACREAGE WEIGI-ffS, YIELDS LABOR INPUTSFOR CORN IN TPE SOUTHERN SUBREGIONS, PERIOD 2
VariablesSouth
(S)
EasternCotton(S:EC)
DeltaCotton(S:DC)
WesternCotton
A/TA 0.285 0.112 0.062 0.11101W 0.175 0.058 0.041 0.076Yields (y) 16.1 13.7 17.1 18.1Labor
Preharvest (a) 21.3 24.75 28.0 10.2Harvest (b) 4.3 4.3
04.3 4.3
Postharvest (c) 0 0 0
a + b ÷ C 1.590 2.120 1.888 0.801
Source: Yields from USDA, revised estimates. For labor in-puts1 see Appendix Tables D—1O, D—12, D—14.
of output to occur—had taken place under conditions similar to those onthe acreage under wheat in period 2 in the corn belt.
In the case of corn, significant intraregional occurred among thesouthern as well as the western subregions. The relevant data for thesouthern subregions are shown in Table 9. Recalculation of the indexes,as shown in Table 2, substituting the S :EC values for the South affectsthe indexes as follows:
Table 2OIL Index S S:EC
/i 100 100
119 111
227 215
14 130 130
15 265 239
16 330 315
17 143 135
365 331
It will be noted that this substitution reduces index i8 by about 10 per cent,whereas the calculation in Table 8 substituting the W :C data for the Westraises the final index by about 5 per cent. The combined effect of bothsubstitutions would thus be less significant than that of either one takenalone.

GRAIN PRODUCTION, 1840—60 AND 1900—10 541
Conclusions and SpeculationsOver the seventy years between 1839 and 1907—11, output of wheat,
oats and corn in the United States each increased about times, andacreage between 5 and 6 times. The growth of the West relative to thelow-yield border states of the upper South raised average land yieldsabout 25 per cent. Within the West, the relative growth of the plainsstates between 1890 and 1910 exercised a downward pressure on regionalyields, balanced by yield rises in the other major western subregions(Table 11). Otherwise, taking the regions individually, the yields of landgiven in Table 10 showed no marked or continuous trend. Acreagesplanted in the Northeast and—for wheat and oats—in the South alsochanged very little. Nearly the whole rise in acreage and output in wheatand oats was accounted for by the expansion North and West of the OhioRiver, where the share of national output rose from 32 per cent in wheatand 25 per cent in oats in 1839 to about 87 per cent in both crops in1907—11. In corn, about two-thirds of the acreage rise occurred in theWest and about one-quarter in the South. Rising yields in the South werea result of the rapid growth of the western cotton subregion (Table 12).
Even before the Civil War, the West had some advantage over the Southin land yields and over the Northeast in labor costs per acre. Table 13shows the extent of this advantage with the techniques prevailing in thatperiod. At these differentials, the rise in the West's share to its period 2level, without changes in yields or labor inputs per acre within the regions,would have raised productivity only 9 per cent in wheat, 23 per cent inoats, and 30 per cent in corn (Table 2, index 14). Table 4 indexes 14 andi5 show that most of this improvement would have been attributable tothe shift from the relatively lower yielding lands of the South. Had theland yield changes within each region occurred simultaneously with theregional shifts, the improvement would have been a bit more in wheatand corn (Table 2, index i7) but less in oats.5 On the other hand, if the landyield changes had not occurred, but if the regional shifts had been accom-panied by improvements in labor input per acre (Table 2, index i6),resulting largely from mechanization, virtually the whole productivitychange in both crops would have been achieved without change in averageyields of land. Alternatively, if the mechanical equipment of 1900—10could have been used in the output of 1840, then labor in wheat and corn
The lower level of the oats index, with yield changes (Table 2, indexes 17 andcompared with i4 and i6), is a result of the unusually low western yield in 1907—11. Atthe levels around 1900, this result would not be obtained.

542 SOURCES OF PRODUCTIVITY CHANGE
TABLE 10
ACREAGES AND YIELDS, BY RBION, 1839—1909(acres in millions and yields in bushels per acre)
Northeast Middle East South West
Acres Yield Acres Yield Acres Yield Acres Yield(A) (0/A) (A) (0/A) (A) (0/A) (A) (0/A)
WHEA,T
1839 2.0 14.5 3.5 8.4 2.1 13.01849 2.2 14.4 2.8 8.8 3.5 12.81859 1.7 14.3 5.3 8.4 8.2 12.71869 2.2 15.0 3.7 8.6 14.1 13.41879 2.4 15.8 5.9 8.2 26.0 13.7
1889 2.1 16.1 5.2 9.9 29.8 14.2
1899 2.1 16.4 6.5 11.5 40.6 14.01909 1.7 17.5 3.9 12.3 40.2 14.0
OATS
1839 1.8 28.5 2.9 13.9 1.0 29.31849 2.1 28.5 3.2 13.7 1.4 30.01859 2.7 28.5 2.1 14.0 2.2 30.6
1869 2.6 28.6 2.1 14.5 4.9 32.11879 3.0 29.1 3.6 13.0 9.4 31.71889 3.1 26.2 4.0 12.9 20,6 29.91899 2.8 27.3 2.6 15.4 24.4 30.01909 2.7 29.7 2.4 17.0 30.4 26.5
CORN
1839 1.1 33.5 5.9 21.8 8.9 11.8 3.2 32.7
1849 1.7 33,3 7.3 22.1 12.6 12.2 6.8 32.5
1859 2.0 334 7.8 22.1 15.0 12.8 12.6 32.3
1869 2.5 33.2 7.1 21.9 10.0 13.4 17.1 33.8
1879 2.7 31.4 9.0 20.7 14.5 13.2 35.1 31.1
1889 2.8 34.6 9.8 22.3 17.0 14.7 46.9 31.2
1899 2.9 35.2 3.0.2 22.1 22.8 14.7 56.4 29.61909a
1.9 36.8 10.1 24.4 27.1 16.1 56.0 31.0
Source: 1839, 1849, and 1859, based on 1866—75 average yield by stateand census production data. 1869—1909, USDA, revised estimates.
a
Total acreage reduced by 3.9 per cent to allow for corn grown for silage.Estimates for regions and subregions on the basis of 1919 ratios are as fol-lows: Northeast, 29 per cent; Corn belt (W:C), 4 per cent; Western dairy(W:WD), 25 per cent; Small grain (W:SG), 2 per cent. (See USDA—AIfS Crop Re-porting Board, Corn Acreage, YiGid and Production, June 1954, and USDAMonthly Crop Report, July 15, 1915.)

GRAIN PRODUCTION, 1840-60 AND 1900-10 543
TABLE 11
ACRE.AGES VIEWS IN MAJOR WESTERN SUBREGIONS, 1839—1909(acres in millions and yields in bushels per acre)
w:C
Acres
W:WD
Yields
W:SC
Acres Yields Acres Yields
C4) (0/A) (A) (0/A) (A) (0/A)
WHEAT
1839 2.0 12.8 0.2 14.4
1849 2.8 12.4 0.7 13.91859 5.7 12.1 1.9 13.81869 8.8 12.8 3.8 14.3 0.3 12.91879 13.1 14.0 6.5 13.8 3.4 11.01889 10.8 14.4 6.2 14.5 8.5 13.31899 10.5 14.1 8.1 14.2 14.8 12.71909 9.5 15.8 4.5 153 20.1 12.0
OAT S
1839 1.0 29.1 0.1 32.31849 1.2 29.3 0.2 32.51859 1.5 30.0 0.5 32.91869 3.6 31.4 1.1 34.4 0.2 31.81879 6.1 31.6 2.2 34.7 0.6 27.71889 11.4 30.2 4.2 31.8 4.0 27.61899 12.4 32.1 5.5 32.3 4.6 25.91909 13.5 28.4 6.6 26.8 7.6 22.1
CORN
1839 3.2 32.7 0.1 33.2
1849 6.6 32.6 0.2 33.11859 11.6 32.4 0.7 32.8 0.3 29.71869 15.2 33.8 1.3 34.4 0.6 33.41879 27.5 31.2 2.4 33.5 5.0 29.81889 31.4 32.6 3.2 30.2 12.1 27.91899 35.4 32.9 4.5 32.5 16.3 21,8190? 34.2 35.8 4.0 31.7 17.2 21.9
Source: See source to Table 10.a
See note a to Table 10.
would have been more than twice—and labor in oats just under twice—asproductive as it was (Table 2, index 13).
Mechanization, then, was the strongest direct cause of the productivitygrowth in the production of these grains. It accounted directly for overhalf the improvement, according to the values derived from Table 2(wheat, .598; oats, .506; corn, .562). The effects of mechanical harvestingand threshing were felt with equal strength in all the regions, as the averagesof Table 1, columns b and c, indicate. In the operations of plowing,harrowing, and planting, improvements were relatively less effective in

544 SOURCES OF PRODUCTIVITY CHANGE
the East and South, but were strongly felt in the West. Hence, a significantinteraction appears between the interregional shifts in acreage weightsand the changes in labor inputs per acre. The values following Table 3,showing the relative importance of the different types of mechanization,indicate that the traditional emphasis on the reaper and the thresher isnot misplaced. Alone or in interaction, these accounted for over 80per cent of the improvement due to mechanization in both wheat and oats.In corn, on the other hand, nearly all of the fall in labor inputs per acre,shown in Table 1, occurred in preharvest operations, principally from theabandonment of hoe cultivation. In view of these different sources of
TABLE 12
CORN ACREAGES YIELDS IN THE SOUTHERN SUBREGIONS, 1839—1909
Eastern Cotton(S:EC)
Delta Cotton(S:DC)
Western Cotton(S:WC)
Acres Yield Acres Yield Acres Yield(A) (0/A) (A) (0/A) (A) (0/A)
1839 7.3 11.1 1.6 14.91849 9.5 11.1 2.8 15.0 0.3 20.61859 10.1 11.1 4.2 15.3 0.8 20.61869 6.6 11.2 2.4 16.3 0.9 21.51879 8.3 10.7 3.6 15.6 2.5 18.31889 9.4 11.6 4.2 16.6 3.4 21.01899 10.9 11.2 5.6 15.5 6.3 20.01909 10.7 13.7 5.9 17.1 10.5 18.1
Source: See source to Table 10,
the productivity growth in the crops, it is interesting to note bow close theproductivity indexes in corn come to those in wheat and oats.
Mechanization had a direct effect, appearing at once in the statisticalevidence. The influence of improvements in nonmechanical technologyare more deeply hidden—although not for that reason more fundamental.In these crops, the most important contribution of nonmechanicaltechnology lay in the adaptation of practices and seed to the new conditionsof soil and climate in the West. Little is known about the causes of thestability of land yields in the East. Some intraregional shifting of the cropswas involved, and some benefits were obtained from the proliferationof varieties of improved seed. It seems likely, however, that a satisfactoryset of practices for maintaining yields in these crops had been evolvedin the East by the mid-nineteenth century, and little may have been addedto this knowledge until the rises in yields in the late 1930's. But howmight techniques have altered to maintain yields and reduce labor costs

GRAIN PRODUCTION, 1840—60 AND 1900—10 545
in the East under the pressure of a growing demand, if the western landshad not been available? To answer this question requires, first, a guessas to the shape of cost curves in the East under rapidly growing output,and then, an inquiry into, the feed-back from rising costs to technologicalchange.
TABLE 13
LABOR ' PUTS AN) LAM) YIELDS, PER IOD I
Preharvest and
Region
Harvest Labor PostharvestLabor
(L/0)
(4)
Total(L/0)
(5)L/A(1)
0/A(2)
Lb(3)
WHEAT
Northeast 34,1 14.5 2.35 0.73 3.08South 23.8 8.4 2.83 0.73 3.56
West 27.4 13.0 2.11 0.73 2.84
U.s. 27.5 11.3 2.44 0.73 3.17
OATS
Northeast 27.1 28.5 0.95 0.40 1.35
South 19.8 13.9 1,42 0.40 1.82
West 21,6 29.3 0.74 0.40 1.14
U.S. 22.4 21.3 1.05 040 1.45
CORN
Northeast 111.3 33,5 3.32 0 3.32
Middle east 62,1 21.8 2.85 0 2.85South 71.6 11.8 6.07 0 6.07West 59.2 32.7 1.81 0 1,81
U.S. 68.8 19.6 3.51 0 3.51
SourceCol. 1: Table 1.Col. 2: Output from U.S. Census of 1840. Acreage obtained by
dividing 1839 state output by estimated state yield. Yields,by state, estimated at 1866—75 average in esti-mates. For alternative yield estimates, see Appendix B.
Col. 3: Column 1 divided by column 2.Col. 4: See discussion in Appendix 0, "Period 1, Postharvest
Labor."Col. 5: Sum of columns 3 and 4.
One may indeed speculate more broadly on alternative growth pathsfor the American economy in the nineteenth century. Our statisticalanalysis takes us a short direction along three such paths: (1) westwardmovement without technological change; (2) technological change withoutwestward movement; (3) westward movement and technological change,as they actually occurred.

546 SOURCES OF PRODUCTIVITY CHANGE
Without technological change, westward expansion would have beenaccompanied by very little rise in productivity in agriculture. Shipmentof crops and movements of population away from farms would perforcehave been less rapid and less complete. The effects on economic welfarewould have depended strongly upon the effects of a growing density ofrural settlement upon the rate of rural population growth. The secondalternative, technological change without westward movement, mighthave occurred under different political arrangements or land policiesbeyond the Appalachians. Confined to an eastern region with sharplydifferent factor proportions, technology might have appeared quite adifferent animal from the labor-saving, land-using creature that emergesin our statistics. Could the land-saving developments in agriculturalchemistry and biology that have raised yields since 1940 have emergeda century earlier in place of the labor-saving cultivator, reaper, and thresher?Even a passing look at the state of scientific knowledge in the fields ofmechanical and chemical invention casts great doubt upon the plausibilityof such an alternative. Despite the external economy of transport deriv-able from a less extensive agriculture, neither alternative appears likely tohave produced by itself any large portion of the productivity gain actuallyachieved. The great opportunity for American agriculture, and theeconomy growing from it in the nineteenth century, derived from thesimultaneous presence of many factors—technological change, emptylands, a growing population, a means of increase in the capital stock,improvements in transport, and the expansion of markets. Nor is the taskof economic history finished with a simple suggestion of the relativeweights of these factors, even if the suggestion be accompanied by azealous use of quantitative data and techniques of measurement. Thecrucial question is: why did all these opportunities appear so close to oneanother in time? One is led thus, by all routes, out of factorial analysisback to examination of the complicated process of change in socialbehavior, of which these specific developments—great as they are—aremanifestations. Scientific historiography has substituted the mind of manfor the mind of God in which the ultimate explanations of an earlier agecould come to rest. The substitution has not made the work simpler or thefinal end less elusive.
Appendix Definition of the RegionsThe definition of a region required for the analysis of the effect ofinterregional shifts on productivity is implicit in the choice of variablesmeasured. For these purposes, a region is an area over which man-hours

GRAIN PRODUCTION, 1840—60 AND 1900—10 547
per output unit, under the techniques of period 1, remain groupe,cl in astable distribution around a constant mean, distinct from that of othersimilarly defined regions during rather wide variations in acreage. Onthis definition, a region forms, on the curve relating productivity andacreage for the country as a whole, a plateau over which output mayexpand or contract at more or less constant per unit labor costs.Such statistical plateaus are not, of course, necessarily geographically con-tiguous pieces of land. Ideally, we should define labor costs underthe given technique for every acre on which a grain might be produced, andgroup together those, wherever located, with a common cost coefficient.
In practice, the only bases for such regionalization in the mid-nineteenthcentury are the series of land yields by state, beginning in 1866 in the USDArevised estimates, and the labor input data presented in this study. TheUSDA estimates are given for each state and year from 1866 on, and theiraverages by state for the earliest ten years (1866—75) are arrayed as shownin Table A-i. We can break these series between North and South, and,moving Delaware and Maryland below the line in the wheat series, weproduce the same two major regions for all three crops on the basis ofyield. In corn, another break occurs between the so-called "border"states and the lower South.
To regionalize on the basis of the labor/output relation, it is necessarynext to examine the variation within the yield regions with respect tolabor per acre in various operations. The labor data are too scarce andtoo variable to define regions even as roughly as the land yield data can do.However, we observe that in period 2 (1895—1915) those northern statesproducing corn, wheat, and oats in period 1 are divided into two regions:a northeast region, including New England, New York, and Pennsylvania;and a western region, including Missouri and the states north and westof the Ohio River.6
Our period 1 labor data do appear good enough to test whether thesedivisions, as well as the North-South division made for land yields, aresignificant at mid-century. In Appendix D the labor data are arrayedfor major prebarvest operations, singly and together, and for harvestingin three regions for wheat and oats, and in four for corn. Table A-2 givesmeans of these distributions for preharvest and harvest labor totals.Perceptible differences occur between the means of the series for preharvestlabor between the Northeast and the other northern region, and thedifferences in a given operation among the three crops in each regionprobably reflect differences in practice. In the harvest operations, our
0 These period 2 divisions are adopted from the WPA/NRP report (see Appendix F,U.S. Document 5).

TAB
LE A
-iAVERAGE YIELDS
BY
STATE, 1866—75
Wheat
First
Oats
First
Corn
First
Yield
Differ—
Yield
Differ—
Yield
Differ—
State
(0/A)
ence
State
(0/A)
ence
State
(0/A)
ence
Connecticut
17.2
Iowa
34,4
New Hampshire
37.6
Massachusetts
17.0
0.2
Vermont
334
1.0
Vermont
37.4
0.2
Vermont
16.7
0.3
Wisconsin
33.0
0.4
Iowa
37.3
0.1
New York
16.1
0.6
Michigan
32.0
1.0
Ohio
35.7
1.6
New Hampshire
16.1
0New Hampshire
31.1
0.9
Massachusetts
34.8
0.9
Michigan
14.6
1.5
Illinois
30.5
0.6
Pennsylvania
34.7
0.1
New Jersey
14.1
0.5
New York
29.9
0.6
Connecticut
33.7
1.0
Maine
13.6
0.5
Ohio
29.8
0.1
Indiana
33.5
0.2
Ohio
13.4
0.2
Connecticut
28.8
1.0
Michigan
33.3
0.2
Pennsylvania
13.2
0.2
Rhode Island
28.2
0.6
Wisconsin
32.7
0.6
Wisconsin
13.1
0.1
Massachusetts
28.2
0New York
32.1
0.6
Missouri
12.4
0.7
Pennsylvania
27.4
0.8
New Jersey
31.7
0.4
Indiana
12.2
0.2
Indiana
27.3
0.1
Rhode Island
31.5
0.2
Maryland
12.1
0.1
Maine
26.9
0.4
Nebraska
31.1
0.4
Iowa
12.1
0Missouri
26.8
0.1
Minnesota
31.0
0.1
Delaware
12.0
0.1
New Jersey
23.9
2.9
Illinois
30.6
0.4
Illinois
11.3
0.7
Delaware
19.1
4.8
Maine
30.2
0.4
Virginia—
Maryland
18.6
0.5
Kansas
29.4
0.8
West Virginia
9.5
1.8
Kentucky
17.7
0.9
Missouri
29.2
0.2
Kentucky
9.2
0.3
Arkansas
17.6
0.1
Kentucky
25.1
4.1
Arkansas
9.2
0Tennessee
15.6
2.0
Maryland
22.8
2.3
Tennessee
7.4
1.8
Louisiana
14.2
1.4
Tennessee
21.6
1.2
Mississippi
7.3
0.1
Virginia—
Virginia—
Alabama
6.7
0.6
West Virginia
12.3
1.9
West Virginia
19.0
1.6
North Carolina
6.3
0.4
Mississippi
12.1
0.2
Arkansas
18.9
0.1
Georgia
6.0
0.3
11.9
0.2
Delaware
18.6
0.2
South Carolina
5.7
0.3
North Carolina
11.8
0.1
Louisiana
14.8
3.8
Alabama
11.6
0.2
Mississippi
13.9
0.9
South Carolina
10.9
0.7
North Carolina
12.4
1.5
Florida
10.3
0.6
Alabama
12.3
0.1
Georgia
9.9
2.4
Florida
9.9
0
South Carolina
9.8
0.1
Source:
USDA, revised estimates (see Appendix E below, U.S. Documents 7, 8, 9).

GRAIN PRODUCTION, 1840-60 AND 1900—10 549TABLE A—2
LABOR DPUT COEFFICIENTS: PREHARVEST AI1) HARVEST LAB(R FOR PERIOD 1
Northeast Middle East South West
Nà.of Man—Hours Noof Man—Hours No.of Man—Hours No.of Man—HoursCases Per Acre Cases Per Acre Cases Per Acre Cases Per Acre
WheatPreharvestHarvest
3240a
1.91.15.0
43
b
11.312.5
21.4Q5
1.2.4
15.0
OatsPreharvestHarvest
25 1.4312.8
51C
b8.8
11.0
sic
17a8.8
12.8
Cornd
Preharvest 98.3 52.0 67.3 46.2Harvest 13.0 10.1 4.3 13.0
Sources Appendix D. Praharveat labor, Tables D—i, D—la; harvest labor, TablesD—8, D—9, D—10 and notes.
aNortheast and West treated as a single region.
Appendix 0, period 1, harvest labor1 fot derivation of this figure.
and West treated as a single region.
number of cases, see Appendix 0,
data for the southern region are deficient but the differences between thetwo northern regions do not appear significant.
On the basis of these considerations, we may separate Northeast fromthe rest of the North as defined by land yields, and produce the regionsshown in the text.
Appendix B: Alternative Land Yield Estimatesand Indexes
The average land yields shown in Table A-i are taken from the 1866—75USDA revised series, by state. Period 1, defined by our output and laborinput data, however, relates to the period around 1839. Can the USDA1866—75 state average yields be extrapolated back to the antebellumdecades without allowance for trend? Shifts in the distribution of acreagebetween states of differing average yields within each region imply thatextrapolation of regional averages might involve avoidable error. But therelative absence of strong trends in the state data from 1866—96 suggeststhat extrapolation by state may be justified. Fortunately, the AnnualReports of the Commissioner of Patents for the years 1843—55 containestimates of county yields at several points within many of the states,and in a few states, state censuses provide similar information. Table B-icompares these estimates, in summary form, with the average 1866—75USDA revised estimate. Except in the frontier stateè, where acreages

TABLE B—i
ESTIMATES OF CWNTY LAI() YIELDS, At'I) USDA AVERAGE, 1866—75
(bushels per acre)
State orRegion
County 1843—55USDA 1866—75State Average
(4)
Number
(1)
Range(2)
Median
(3)
WHEAT
New England 20 10—25 15 16New York 23 10—25 18 18Pennsylvania 22 8—30 15 13Delaware 6 14—20 15 12
New Jersey 5 12—30 20 14
Maryland 4 6—20 15 12
13 8—15 9 9
South 17 5—20 10 7
Ohio 18 10—35 15 13
Michigan 8 12—30 21 15
Wisconsin 12 12—40 20 13
Illinois 14 10—20 16 11
Indiana 16 9—25 16 12
Iowa—Missouri 9 10—20 15 12
OATS
New England 31 17—50 30 30
New York 19 28—50 35 30
Jersey 13 30—50 40 26
Delaware—Maryland 8 9—50 20 19Virginia 6 10—28 16 12
12 12—60 16 14
Ohio, Indiana,Illinois, Iowa 14 20—55 40 30
Michigan—Wisconsin 13 30—60 40 33
CORN
New England 36 20—50 35
New york 28 25—50 30 32
New Jersey 3 35—50 45 32
Ohio 22 25—60 39 36
Pennsylvania 12 30—50 38 35
Indiana 17 30—60 40 34
Michigan 9 15—40 30 34
Wiscopsin 6 25—50 45 33
Iowa 7 22—40 35 37
Illinøis 8 40—50 43 31
Missouri 7 30—60 40 29
Kentucky 5 40—60 50 25
Maryland 1 30 23
Tennessee 3 30—35 35 22
Texas 8 30—70 50 21
Virginia 21 10—40 20 19
Delaware 6 22—50 35 19
Arkansas 1 20 19
Louisiana 4 10—50 30 15
Mississippi 7 15—50 25 14
Alabama 6 20—37 30 12
North Carolina 4 10—20 15 12
Georgia 5 5—40 18 10
South Carolina 3 15—50 25 10
Source: Cole. 1—3, Annual Report: Agriculture, U.S. Commissioner
of Patents, 1843—56; co]. 4, USDA, revised estimates.
south of Ohio and Maryland, except Virginia.

GRAIN PRODUCTION, 1840—60 AND 1900—10 551
are small in any case and yields high for a few years, the median of the1843—55 county reports, by state, taken without regard to year, fallssurprisingly close to the 1866—75 USDA state average.7 The state estimatesfrom contemporary sources shown in Table B-2 also fall close to the 1866—75 USDA state averages. It is probably justifiable then to extrapolatethe state averages back to the 1840—60 period. Taking these yields, wecalculate acreages by state from the Census production data for 1840,1850, and 1860, and produce regional average yields (shown in Table 1).
Such extrapolation does indeed result in yields in the western region(Re) decidedly below those shown in Tables B-I and B-2. We have there-fore prepared a set of alternative indexes based on an assumption ofwestern yields (0/A) in 1839 (with a corresponding reduction in theregional acreage estimate) as follows:
Wheat Oats CornOhio 15 40 40Indiana 16 40 40Illinois 16 40 40Iowa 15 40 38Missouri 15 40 40Michigan 21 40 33Wisconsin 20 40 40Minnesota 20 40 40
For corn, the presumption of higher yields arising from the newnessof the region exists in the South and border states as well. In the Southeast,there is also the possibility that yields were abnormally depressed duringthe "reconstruction" period. On the basis of Table B-2, it seems desirableto allow for yields in the South and middle-east regions 50 per cent higherthan the 1866—75 state averages.
These assumptions produce a set of regional yields in period 1 whichcompare with those of text Table 1 as follows:
Wheat Oats Corn
Table 1 Alternative Table 1 Alternative Table 1 AlternativeR1 14.5 14.5 28.5 28.5 33.5 33.5
8.4 8.4 13.9 13.9 21.8 32.6R2b1 11.8 17.7
13.0 15.3 29.3 40.0 32.7 39.8
Surprise is reduced and confidence in the result perhaps raised, if we consider thatthe USDA series was itself derived from county crop reporters, though the number ofsuch reporters was greater and the data supplied more explicit after 1870 than underthe Patent Office.

552 SOURCES OF PRODUCTIVITY CHANGE
TABLE 8—2
ESTIMATES OF STATE LAID YIELDS, 18k4—62, COUNTY LANDYIELDS, 18L+3_56, USDA 1866—75.
(bushels per acre)
1866—75 USDA 1843—56 Median 1844—62 State Land—State Revised Series County Estimates Yield Estimates
(1) (2) (3)
United States 1842 15—201845 18
Massachusetts 17 15 1853 17
1855 15New York 16 18 1844 14
1854 11Virginia 9 9 1847 8—10Tennessee 7 11 1849 15Ohio 13 15 1845 13
1850—57 8—17Michigan 15 21 1845—49 15—20Indiana 12 16 1844—48 20
OATS
United States 1845 35Northeast 1847 30—40Northwest 1847 30South 1847 10Massachusetts 28 30 1847 35
1853 301855 211861 26
New York 30 35 1844 261854 20
Delaware 19 20 1848 26Georgia 12 1848 12—15Tennessee 16 16 1848 25—30Wisconsin 33 40 1849 35Michigan 32 40 1848 40
1849 35CORN
New England 35 35 1847 25—30New Hampshire 38 1862 38Vermont 37 1862 35Massachusetts 35 1854 25
1855 291862 37
Connecticut 34 1862 32Rhode Island 32 1862 37New York 32 30 1844 25
1845 241855 211862 35
New Jersey 32 45 1862 37Pennsylvania 35 38 1847 25—30
1862 36
(continued)

GRAIN PRODUCTION, 1840—60 AND 1900—10 553
TABLE B—2 (concluded)
1866—75 USDA 1843—56 Median 1844—62 State Land—State Revised Series County Estimates Yield Estimates
(1) (2) (3)
Ohio 36 39 1847 431845—48 38(average)1850 36
1852 34
1853 401854 26
1855 40
1856 28
1857 37
1858 281862 33
Indiana 34 40 1862 42
Illinois 31 43 1848 40—50(prairie)1862 40
Michigan 33 30 1847 401854 23
1856 18
Wisconsin 33 45 1860 40Iowa 38 35 1862 38
Minnesota 31 1862 45Missouri 29 40 1862 38Kentucky 25 50 1847 30—40Delaware 19 35 1862 20
Louisiana 15 30 1854 15—25Alabama 12North Carolina 12 15 1847 20—35Georgia 10 18 1
SourceCols 1 and 2: Table 3.Col. Annual Report: Agriculture, U.S. Commissioner of Patents,
1844—62; and, for New York, State Censuses of 1845 and 1855; Ohio,1850—58 from State Censuses of Agriculture; Massachusetts, 1855State Census.
Since the period 1 acreage weights in Table I are derived by dividingestimated yields into Census production data for 1839, change in theyield estimate alters acreage weights as follows:
Wheat Oats Corn
Table 1 Alternative Table 1 Alternative Table 1 Alternative.259 .273 .316 .331 .057 .080.459 .482 .509 .521 .310 .291
R2b1, .465 .435
R9 .282 .246 .178 .138 .168 .194

554 SOURCES OF PRODUCTIVITY CHANGE
TABLE 5—3
PRODUCTIVITY INDEXES BASED ON ALTERNATIVE ESTIMATESOF WESTERN VIEWS IN PERIOD 1
Text a Text b TextTable 2, Table 3, Table 4,Estimate Variant Estimate Variant Estimate Variant
i1 10040 100.0 100.0 100.0 100.0 100.0
118.3 113.8 144.7 143.3 103.3 103.1
245.7 242.1 119.2 119.6 97.6 97.1
109.3 117.8 113.6 112.5 109.3 118.6
15 302.1 290.7 188.7 188.3 100.6 100.3
377.3 401.6 139.1 138.7 112.4 122.5
117.8 113.4 176.1 172.4 106.7 115.1
416.7 401.6 245.7 242.1 109.6 119.2
OAT S
il 100.0 100.0 100.0 100.0 100.0 100.0
105.8 102.9 134.2 134.2 104.3 105.3
185.9 185.5 115.1 116.1 97.3 97.9
122.9 139.7 106.7 106.8 120.8 141.0
201.2 195.7 164.7 165.8 101.4 102.1
t6 371.7 414.9 125.0 125.9 126.1 146.8
117.9 114.7 147.9 146.8 118.9 138.3
362.6 352.1 185.9 185.5 122.9 142.5
CORN
il 100.0 100.0 100.0 100.0
.v2 119.0 85.7 111.1 112.2
227.3 226.4 97.0 96.1
129.6 124.3 130..1 118.0
2.5 265.2 191.6 107.4 107.3330.2 316.4 144.6 132.4
2.7 142.9 103.0 126.4 113.7
1.8364.6 261.6 140.0 127.0
Sources See text accompanying Tables 2, 3, and 4.
aSee cola. 4, 5, and 6 of Table 2, for wheat, oats, and corn,respectively.
bsee cols. 2, and 4 of Table 3 for wheat and oats, respectively.
CSee cols. 4, 5, and 6 of Table 4 for wheat, oats, and corn,respectively.

GRAIN PRODUCTION, 1840—60 AND 1900—10 555
The productivity (O/L) indexes derived by inserting those values in theformulas of Tables 2, 3, and 4 are shown, with the text indexes for com-parison, in Table B-3. It is apparent that the levels and relative valuesof the indexes are not strongly affected by this alternative assumption.
Appendix C. Measurement of Relative Importanceof the Factors
The assessment of the relative importance of a factor is derived from Yates(see Appendix E, book 9). Gratitude is owed to Leo Katz of MichiganState University for calling attention to the method, though he bears noresponsibility for the transfer of it to the present context. To derivethe signs shown in the matrix in the text, let the variables of Table 2(v, abc, y) be represented by a, b, c (period 1 values) and A, B, C (period 2values). Then the independent effect of A is taken as the mean differencebetween the indexes where it appears in a period 2 value (A) and thosewhere it appears in a period 1 value (a). The independent effect of ABis the sum of two differences (ABC — abC) + (ABc — abc), with eachreduced by the indexes of the independent effects of the other period 2values occurring in them. The whole equation is
AB — (ABC — abC) — [(AbC — abC) + (aBC — abC)]+ (ABc — abc) — [(Abc — abc) + (aBc — abc)].
The independent effect of ABC takes the whole difference ABC — abcless a similar allowance for the effects of the other indexes.
(ABC — abc) — [(ABc — abc) — [(Abc — abc) + (aBc — abc)]— [(aBC — abc) — [(aBc — abc) + (abC — abc)]— [(AbC — abc) — [(Abc — abc) + (abC — abc)]— (Abc — abc) — (aBc — abc) — (abC — abc)
These formulas reduce to the terms with their signs shown in the textmatrix.
Appendix D: Summary Tables for LaborRequirements by Type of Operation
The tables are in four groups: period 1, preharvest; period 1, harvestand postharvest; period 2, preharvest and harvest; period 2, postharvest.
SYMBOLS
n = number of cases; arithmetic mean; M = median; i = standarddeviation; s = standard error of the mean.

556 SOURCES OF PRODUCTIVITY CHANGE
REGIONAL ABBREVIATIONS AND DEFINITIONS
NE, Northeast (Pa., N.J., N.Y., Vt., N.H., Mass., Conn., Me., R.I.)
Middle east (Md., Del., Va., Ky., W.Va., Tenn., Ark.)Eastern cotton (N.C., S.C., Ga., Fla., Ala.)Delta cotton (Miss., La.)
Corn (Ohio, md., Ill., Mo., Iowa)Western dairy (Mich., Wis., Minn.)Small grain (Nebr., Kans., S.Dak., N.Dak., Mont.)Western cotton (Tex., Okia.)Range (N.Mex., Ariz., Cob., Utah, Nev., Wyo.)Northwest (Idaho, Ore., Wash.)Calif.
PERIOD 1: PREHARVEST LABOR, CORN
For period 1, total preharvest labor for each region is composed of thesum of the average man-hours per acre for the standard operations asfollows:R1 Plowing, harrowing, planting, cultivating, and hoeingR2a Plowing, harrowing, running off rows, planting, cultivating, and hoeingR2b Clearing and cutting stalks, plowing, running off rows, planting,
cultivating, and hoeingR3 Plowing, harrowing, planting, cultivating and hoeing.For all regions except R2a (middle east), there were also a number ofcases where complete preharvest totals were available (see Table D-l). Inthe case of the Northeast and the West, these were remarkably close tothe totals obtained by the above method which is based on the prevailingtechniques within each region (Table D-la). Where our data indicatedthat time differences for the same operation were insignificant, regionalaverages were combined. In the case of "running off rows," regions R2aand R2b (middle east and South) were combined, and for cultivating andhoeing, middle eastern and western regional averages were combined. Inaddition, an allowance for cutting and clearing stalks in Tennessee wasmade by weighting the R2b labor coefficient for this operation by Tennessee'sacreage weight in the R2a region. This was due to the fact that the cornwas harvested in Tennessee by the southern method of pulling off the
8 For corn, the middle east (S :ME) becomes a separate region (ME) and the South(S) includes the eastern cotton (S :EC), delta cotton (S :DC), and western cotton (S :WC)regions, with Arkansas included in the delta cotton states.
S, South8S:ME, South:S:EC, South:S:DC, South:
W, WestW:C, West:W :WD, West:W:SG, West:W:WC, West:W:R, West:W:NW, West:W:Cal., West:

GRAIN PRODUCTION, 1840-60 AND 1900—10 557
TABLE 0—1
PERIOD 1: LABOR, TOTAL
NE S:ME S:EC S:DC S W:C W:WD W
W}IEA.T
n 32.0 36.0 7.0 43.0 21.0
19.1 11.3 10.9 11.3 12.4M 20.0 10.2 11.6 10.2 10.9a 7.3 4.1 2,3 3.8 . 7.2
a 1.3 0.7 0.94 0.6 1.6
n 25.0 23.0 11.0
OAT S
7.0 41.0 10.0
14.3 9.4 7.2 10.5 908 87a
M 13.7 9.0 7.1 10.5 8.6 7.9
a 3.7 2.4 2.4 1.9 2.6 1.9
8 0.75 0.5 0.76 0.84
CORN
0.4 0.63
n 61.0 28.0 6.0 34.0 19.0 2.0 21.0
K 97.8 55.0 68.2 57.3 48.4 47.5 48.3
M 88.0 54,3 68.9 56.7 42.0 42.0
a 42.5 23.9 8.0 22.5 18.0 18.0
a 5.5 4.6 3.5 3.9 4.3 4.0
a single region for Table 1.
TABLE 0—la
PERIOD 1: LABOR FOR CORN, BY OPERATION
NE ME S W
Clearing and cutting stalksPlowing 11.9 7.4 8.9 7.5Narrowing 5.4 1.2 2.9Running off rows 3.5 3.5Planting 14.5 7.5 8.8 5.9Cultivating 14.7 12.0 17.8 12.0Ibeing 51.8 17.9 20.8 17.9
Totals 98.3 52.0 67.3 46.2
Source: Tables D—2 to D—7, and Appendix D text.aAllowance for cutting and clearing stalks in Tennessee.

558 SOURCES OF PRODUCTIVITY CHANGE
TABLE D—2
PERIOD 1: LABOR,
NE S:M? S W
WHEAT
n 32.0 24.0 3.0 27.0 22.0
X 12.4 6.3 7.3 6.4 6.5M 10.0 5.8 5.6 60 5.7
a 6.7 2.1 2.1 2.8
8 1.2 0.45 0.4 0.62
n 25,0 12.0 1.0
OAT S
7.0 20.0 10.0
X 7.1 5.7 7.27 7.0 6.2 5.4
U 7,1 5.6 6.7 6.1 5.0
a 22 2.1 1.5 1.8 1.2
8 0.45
-
0.64 0.6
CORN
0.41 0.41
a 72.0 12.0 29.0 12.0 41.0 44.0 4.0 48.0
X 11.9 7.4 7.9 11.4 8.9 7.5 6.9 7.5
M 10.0 6.3 7.5 9.5 8.0 7.1 6.5 7.1
a 5.2 4.8 4,14 5.1 4.7 2.9 2.2 2.81
8 0.62 1.5 0.8 1.6 0.75 0.4 1.27 0.40
torn, the region is ME.

GRAIN PRODUCTION, 1840—60 AND 1900—10 559
TABLE D—3
PERIOD 1: PREIIARVEST LABOR, KARROWING
NE S:MEa S:EC S:DC S W:C W:WD W
WHEAT
n 32.0 26,0 2,0 28.0 23,0
X 6.2 3.0 2.8 3.0 4.9
H 5.0 2.5 2.8 2.5 3.3
a 3.4 1.5 1.5 3.4
a 0.61 0.31 0.28 0.71
OAT S
n 22.0 13.0 1.0 1.0 15.0 11.0
X 4.7 2.0 11.1 5.0 2.8 2.3
M 5.0 1.8 1.8 2.5
a 2.0 0.9 2.5 1.0
8 0.44 0.27 0.67 0.32
CORN
n 44.0 5.0 27.0 2.0 29.0
I 5.4 1.2 2.8 3.75 2.9
H 5.0 1.0 2.5 2.5
a 3.7 0.5 1.8 1.79
8 0.6 0.25 0.3 0.34
aFor corn, the region is HE.

560 SOURCES OF PRODUCTIViTY CHANGE
TABLE D—'+
PERIOD 1: PREHARVEST LABOR,
S W
WHEAT
n 9.0 11.0 1.0 12.0
X 168 1.5 Id 1.2M 1.65 1.5 1.3
a 0.6 0.34 0.55
8 0.21 0.1]. 0.17
OATS
n 9.0 4.0 1,0
12 1.5 1.42M 1.0 1.5
0.6 0.268 0.21 0.15
CORN
n 68.0 23.0 40.0 23.0 63.0 40.0 6.0 46.0
X 14.5 7.5 8.8 8.6 8.8 5.6 7.5 5.914 12.5 7.7 8.66 7.0 7.9 5.0 5.6 5.0a 9.7 2.9 4.7 5.0 4.9 3.8 5.8 4.1
8 1.2 0,62 0,76 1.1 0.62 0.6 2.59 0,62
apor corn, the region is NE.

TABLE D—5
PERIOD 1: PREI-IARVEST LABOR, CORN
NE ME StEC S:DC S W:C W:WD W
n 44,0 16.0 41.0 11.0 52.0 41.0 2.0 43.0
X 14.7 12.1 18.5 15.3 17.8 11.7 16.0 11.9
M 12.0 11.9 16.7 14.8 16.4 10.0 10.0
9.9 3.8 9.6 6.3 9.1 6.9 6.9
8 1.5 0.975
PERIOD 1:
1.5 2.0 1.3
TABLE 0—6
LABOR, CORN
1.1
I-OEIF'C
1.1
NE ME S$EC S:DC S W:C W:WD W
n 48.0 8.0 37.0 10.0 47.0 19.0 2.0 21.0
51.8 11.5 20.0 23.7 20.8 23.1 17.5 20.4
M 48.0 10.8 14.25 21.3 16.5 20.0 20.0
30.7 5.64 20.68 10.6 19.1 14.7 13.9
8 4.5 2.1 3,4 3,5 2.8 3.5 3.1
TABLE 0—7
PERIOD 1: LABOR FOR CORN, MISCELLANBDUS OPERATIONS
ME S:EC S:DC S ME+S
CLEARING AND CUTTING STALKS
n 11.0
7.5
M 2.3
a 8.4
8 2.65
RIDGING, OR FURROWING
n 150 1.0 16.0
8.0 3.9 7.8
M 7.06 6.9
o 4.3 4.3
8 1.1 1.1
RUNNING OFF ROWS
ii 3.0 17.0 3.0 20.0 23.0
X 4.4 3.0 5.5 3.37 3.5
M 6.0 2.25 5.4 3.65 3.8
o 1.73 1.0 1.9 1.97
8 0.43 0.7 0.4 0.42

562 SOURCES OF PRODUCTIVITY CHANGE
ears, necessitating the removal of stalks the following spring before landcould be plowed.
We have assumed that plowing was standard practice in all regions,although in the South, the cornfield was frequently ridged or beddedinstead. Sixteen cases for this operation gave us an average of 7.8 man-hours per acre, which is somewhat less than the plowing average of8.9 man-hours per acre obtained from forty-one cases, and almost thesame as the plowing time for the eastern cotton area (twenty-nine cases,7.9 man-hours per acre) from which fifteen of our sixteen cases originated.It therefore did not appear necessary to make an allowance for thealternative operation.
In the Northeast, instead of being harrowed, the field was occasionallydragged or rolled. In only two cases out of ten was rolling carried outin addition to harrowing, but in both cases the combined time was lessthan the regional average for harrowing. Four cases gave a combinedfigure for rolling, dragging, and harrowing, of which two were below theregional average. It would appear that either the cornfield was harrowedor dragged and rolled, but that harrowing was the usual operation. Inthe South the harrow was rarely used before planting, although occasionallya harrow was used to "cover" after planting or for the first cultivation.In place of harrowing, we find that "running off rows" precedes planting.This appears to be a somewhat more elaborate operation than "marking"in the Northeast and West before the days of the corn planter. Butwhereas "marking" time was included with planting in those tworegions, running off rows was taken into account separately in theSouth, and, combined with the three middle-eastern cases, applied toboth regions.
The planting operation in alt regions includes an allowance for replant-ing, where the records show that this was done. No allowance has beenmade for manuring.
PERIOD 1: HARVEST LABOR, WHEAT AND OATS
To estimate harvest labor requirements in period 1, we have three bodiesof evidence: (1) a number of cases for total harvest labor in the Northand for reaping alone in the South; (2) a few cases for individual opera-tions in the North and operations other than reaping in the South;(3) Rogin's estimates (Appendix E, book 7), based on a few cases of laborin each operation by various techniques.
From (1), shown in Table D-8, we derive an average figure for Northeast

GRAIN PRODUCTION, 1840-60 AND 1900—10 563
and West, in the same way as for preharvest operations. Since theaverages for each region are close to one another, the two are combinedinto a single sample (col. 3). This is the more plausible since harvestlabor is affected less by natural conditions, other than yield and regionaldifferences in farm practice, than the preharvest operations are. Thelower figure for oats, despite very high yields in many cases, is probablydue to less careful handling of the crop after cutting.
The problem then is to derive a figure for the South based on thereaping data, summarized in Table D-8, and the few figures on otheroperations shown in Table D-9. These scattered figures may be summarizedas follows:
Operation Wheat Oats
Reap- Rak- Bind- Taking Setting Shock- Stack- — —
ing ing ing Up Up ing ing Total X n I n
1. x x x 7.2 5 10.0 3
2. x x 4.3 1 5.0 1
3. x 3.5 3
4. x 5.8 2 9.0 3
5. x x x 5.316. x x 11.3 3
7. x 3.3 1
8. x x 5.3 5
9. x x 6.0110. x 12.2 8 11.0 3
The estimates for wheat (12.5) and oats (11.0) in Table 1 in the textare derived from these .data in several ways. For wheat, the estimatesare as follows:
1. 12.2, the total figure (line 10). This, however, is a simple averageof four figures from region S:EC (10.0) and region S:ME (14.4) and somay be too low.
2. 12.7, the average of line 1 (7.2) plus the average of lines 4 and 5(5.5).
3. 12.3, the sum of the estimate for reaping, Table D-8 (3.6) plus line 2(4.3) plus average of lines 3 and 4 (4.4).
4. Rogin's estimate of 11.0—13.5. This estimate appears a little toolow for the North, and Rogin states that binding labor was probably

564 SOURCES OF PRODUCTIVITY CHANGE
higher in proportion to cradling in Virginia than in the West. The loweryields of the South, however, make a lower total figure plausible.
For oats, the figure in Table 1 is derived from these data by severalroutes:
1. 11.1, reaping (4.0), Table D-8, plus line 2 (5.0) plus 2.0 for shocking,estimated from the Northeast figures of Table D-9.
2. 12.0, line 1 plus 2.0 for shocking.3. 11.0, line 10.4. 11.3, line 8 pIus line 9, as a maximum, with "taking up" double-
counted.
TABLE D—8
PER TOO 1: HARVEST LABOR FOR WHEAT AND OATS
harvesting, TotalReaping
NE andNE W W S
(1) (2) (3) (4)
WHEAT
n 21.0 19.0 40.0 48.0X 15.3 14.8 15.0 3.6M 14.6 13.3 13.7 3.25
7.2 5.6 6.4 1.3
8 1.6 1.3 1.03 0.19
OATS
n 12.0 5.0 17.0 36.0
7 13.1 12.1 12.8 4.1
M 12.5 10.0 12.5 4.14
0 3.3 3.1 3.3 1.4
a 0.99 2.3 0.81 0.23
Other combinations of the data, involving the high stacking figure foroats (line 4), would yield higher estimates. But these three cases are allfrom one Virginia plantation in one year and it is not clear what the termstacking here means. The small differences between oats and wheat areexplainable in the same terms in the South as in the North, and betweensouthern and northern oats in the same terms as for wheat. That yieldsaffect both the wheat and oats figures is indicated by the relatively lowreaping figure for the South compared with Rogin's estimate of 5.0 forcradling.

TAB
LE D
—9
PER
IOD
1:
M(SCELLANEOUS
1-IA
RV
ESTI
NG
FIG
UR
ES F
ORWHEAT
PND
OA
TS(m
an—
hour
s per
acr
e)
PAR
T A
.W
HEA
T
Reaping,
Raking,
Rak
ing
Bin
ding
,Binding
:
and
and
Setti
ngan
dan
dTo
tal
Region
Reaping
Binding
Binding
Up
Shocking
Stacking
Shocking
Stacking
Harvest
NE
5.0
15.3
S:M
E3.
64.
32.8
5.3
10.0
.8.
46.
37.
75.7
8.1
4.5
3.1
17.5
14.5
15.6
S:EC
4.8
6.8
8.6
16.2
9.1
8.3
9.0
9.9
13.1
W15
.04.
75.
214
.8US (Rogin)
5.0
5.0—7.5
1.0
11.0—13.5
PART B.
OATS
Reg
ion
Rea
ping
Reaping,
Raking,
and
Bin
ding
Rak
ing
and
Bin
ding
Setti
ngU
pSh
ocki
ngSt
acki
ng
Taki
ngU
p an
dSt
acki
ng
Rea
ping
and
Taki
ng U
p
Reaping,
Binding,
Taki
ng U
p,an
d Sh
ocki
ngTo
tal
Har
vest
NE S:M
E
5.0 41a
8.8
8.6
5.0
5.0
2.5
2.2
2.1
10.3
2.5
13.1
S10.0
12.1
US (Rogin)
5.0
5.0—7.5
1.0
11.0—U.S
Sour
ce:
Italic
ized
figu
res a
re a
vera
ges,
deriv
ed fr
om T
able
D—
8.Th
eR
ogin
figu
re is
the
sum
mar
y es
timat
e fr
om R
ogin
(App
endi
x E,
B—
7),
pp. 1
25—
37.
The
sour
ce o
f the
oth
er fi
gure
s is g
iven
in A
ppen
dix
Tabl
esS—
25and S—26 (not nhown).
S:EC region.
CFi
gure
s fro
m G
eorg
ia.
bpig
ures
from North Carolina.
dFigures from Mississippi.
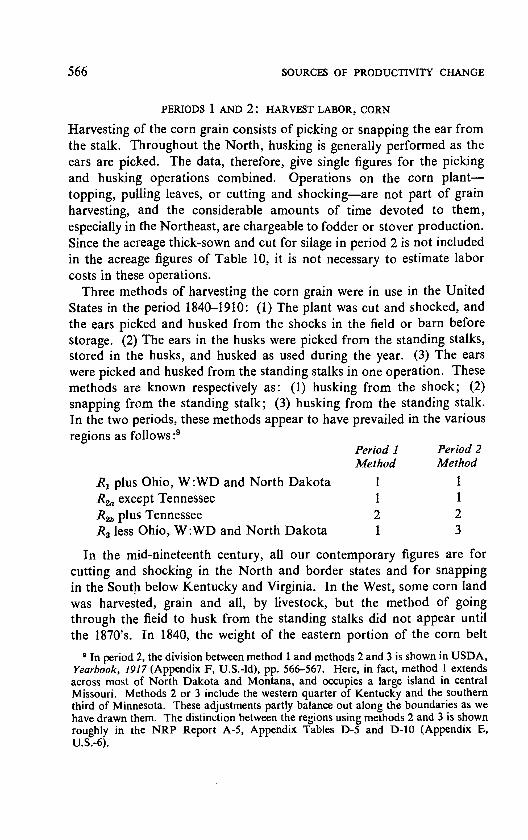
566 SOURCES OF PRODUCTIVITY CHANGE
PERIODS 1 AND 2: HARVEST LABOR, CORN
Harvesting of the corn grain consists of picking or snapping the ear fromthe stalk. Throughout the North, husking is generally performed as theears are picked. The data, therefore, give single figures for the pickingand husking operations combined. Operations on the corn plant—topping, pulling leaves, or cutting and shocking—are not part of grainharvesting, and the considerable amounts of time devoted to them,especially in the Northeast, are chargeable to fodder or stover production.Since the acreage thick-sown and cut for silage in period 2 is not includedin the acreage figures of Table 10, it is not necessary to estimate laborcosts in these operations.
Three methods of harvesting the corn grain were in use in the UnitedStates in the period 1840—1910: (1) The plant was cut and shocked, andthe ears picked and husked from the shocks in the field or barn beforestorage. (2) The ears in the husks were picked from the standing stalks,stored in the husks, and husked as used during the year. (3) The earswere picked and husked from the standing stalks in one operation. Thesemethods are known respectively as: (1) husking from the shock; (2)snapping from the standing stalk; (3) husking from the standing stalk.In the two periods, these methods appear to have prevailed in the variousregions as follows
Period 1 Period 2Method Method
R1 plus Ohio, W:WD and North Dakota 1 1
R2a except Tennessee 1 1
R2b plus Tennessee 2 2R3 less Ohio, W:WD and North Dakota 1 3
In the mid-nineteenth century, all our contemporary figures are forcutting and shocking in the North and border states and for snappingin the South below Kentucky and Virginia. In the West, some corn landwas harvested, grain and all, by livestock, but the method of goingthrough the field to husk from the standing stalks did not appear untilthe 1870's. In 1840, the weight of the eastern portion of the corn belt
In period 2, the division between method I and methods 2 and 3 is shown in USDA,Yearbook, 1917 (Appendix F, U.S.-Id), pp. 566—567. Here, in fact, method 1 extendsacross most of North Dakota and Montana, and occupies a large island in centralMissouri. Methods 2 or 3 include the western quarter of Kentucky and the southernthird of Minnesota. These adjustments partly balance out along the boundaries as wehave drawn them. The distinction between the regions using methods 2 and 3 is shownroughly in the NRP Report A-5, Appendix Tables D-5 and D-lO (Appendix E,U.S.-6).

GRAIN PRODUCTION, 1840—60 AND 1900—10 567
where cutting and shocking were universal, and the evident predominanceof the practice even in Illinois, justifies the use of the method 1 figurefor the region as a whole.
For methods 1 and 3, a basic source is USDA, Bulletin 3, 1913 (seeAppendix F, U.S.-lb), giving results for an extensive survey and indicatingstandard coefficients for the United States in these operations as follows:
Yield in Bushels perMethod Bushels of Ears 9k-hour day
1 1—40 3541-60 42
61 and over 50
3 1—40 6041—60 70
61 and over 75
Taking two bushels of husked ears as the equivalent of one bushel ofshelled corn, it appears that the yields in the North—25—35 bushels peracre—would require 10—14 hours per acre by method 1, and 7—9 hoursper acre by method 3. These results, however, are based on returnsheavily weighted from the North Central states and "adjusted" arbitrarilyby the compilers to compensate for assumed biases in the farmers' reports.
For method 1, several pieces of evidence indicate that the estimateshould be placed at the upper limit of Bulletin 3's range of 10—14 man-hoursper acre. For western New York, a survey reported in USDA, Bulletin412, 1913 (see Appendix F, U.S.-lb) indicates a range of 12—14 man-hoursper acre for a 30-bushel (shelled) yield. A similar survey in 1915, forChester County, Pennsylvania,'0 also yields an estimate of 13.5 man-hoursper acre for a yield of 50 bushels.
In West Virginia, in 1913—15, a survey of fifteen to thirty farms in eachof twelve counties" gave an average of 15.6 man-hours per acre for anaverage yield of 40 bushels, with a county range of 13.2—17.7. Finally,in two counties in Minnesota, estimates of 12.8 and 14.0 were obtainedas an average during the 1910's.'2 The figure used in Table 1, therefore,is taken to indicate conditions outside the corn belt, for the range ofyields in the states where method 1 was prevalent.
The Bulletin 3 range for method 3, on the other hand, appears a littlehigh on the basis of other evidence. Here the sources of evidence are:
1. NRP, Report A-5, giving county estimates for sixteen countiesscattered through the central West.
10 USDA, Bulletin 528, 1915, p. 13 (Appendix F, U.S.-lb).West Virginia AES Bulletin 163, 1917, p. 6 (Appendix F, S-23).Minnesota AES Bulletin 179, p. 31, and Bulletin 157, p. 29 (Appendix F, S.-12).

568 SOURCES OF PRODUCTIVITY CHANGE
2. Illinois AES Bulletin 50, 1896 (Appendix F, S.-6), p. 50, givingfigures for 16,600 acres, including a sampling of every county in the state.
3. A survey of several thousand acres in Iowa, Illinois, and Indiana(USDA, Bulletin 1,000, 1919, pp. 5—11; see Appendix F, U.S.-lb).
4. Scattered reports (five) given by farmers.By averaging these data taken by counties or region and omitting the
scattered reports, the following values are obtained (see Table D- 15):
n X a s
28 6.67 1.6 0.31
The labor time required in method 2 is less than that in method 1largely because time is not used in pulling the shock apart to get to theears of corn. In method 2, husking time is not included in our data, sincethe corn is husked as used over the year. Storing corn in the husks in theSouth is said to help protect it against insect damage.'3 In any case, thehusking time must be accounted negligible. The labor at odd momentsover the year has little value, the husks are thoroughly dried, and therather small variation of labor time in methods 1 and 3 with yield peracre indicates that even when the corn is only partially dried, huskingitself takes only a small part of the time spent in moving over the field,finding and pulling the ears from the plant. The omission of the huskingoperation and the much lower yields of shelled corn in the South, reducethe harvesting time in method 2 below the western (method 3) standard.The average of thirteen NRP sample counties in the cotton region14 shows(see Table D-15):
n s
13 4.3 0.6 0.2
In Table D-10, the period 2 coefficients are used without change forthe regions to which the methods apply in period 1. Hence, the onlyimprovement shown is the substitution of method 3 for method 1 in theWest between the two periods. Even this improvement is partly offsetin our figures by inclusion of a cost item for clearing the field of stalks inmethod 3, while this operation in method 1 is charged to the value of
USDA Office of Experiment Stations, Bulletin173, p. 33 (Appendix F, U.S.-ik)."USDA, Bulletin 1181, 1924, p. 15 (Appendix F, U.S.-lb), gives a higher figure
(6.1 as an average of seven counties) for a standardized yield of 25 bushels per acre inArkansas in 1924, but the higher yield and restricted area of this study indicate that itshould not be included in our data.

GRAIN PRODUCTION, 1840—60 AND
1
1 2
Per Per Acre
R1
R2 (exci. Tennessee)Tennessee
1.
12
13.013.04.3
1
12
13.013.04.3
R3 (excl. Ohio, W:WD,and North Dakota)
2
1
4.3
13.0
2
3
4.3
6.7
Ohio, andNorth Dakota 1 13.0 1 13.0
aThe harvest labor coefficients 1, in Table 1 for R2a in periods
1 and 2 and for R3 in period 2 are the weighted regional averages.
bMethod 1, husked from shock; method 2, snapped; method 3,husked from standing stalk.
fodder production. The direct data from period 1 for the Northeast givemuch higher figures per acre, but include hauling and housing, and insome cases probably cutting and shocking as well. They are based largelyon premium reports with yields two to four times the regional average.In Maryland and Tennessee, seven cases from plantation manuscripts showcosts of 0.8 to 1.8 man-hours per bushel for unknown yields, presumablyfor harvesting from the shock, and probably including hauling.
In the eastern cotton region, thirty-two manuscript cases for the opera-tion of "gathering" or picking give an average of 6.6 man-hours per acre(Table D-l 1), including in at least one case, and probably in others,hauling and housing.
TABLE 0—11
PERIOD 1: LABOR, CORN
ME S:DC W:C
n 2.0 32.0 2.0 14.0
X 20.1 6.6 31.5 11.3
M 6.1 11.6
a 3.02 3.7a 0.54 1.03

570 SOURCES OF PRODUCTIVITY CHANGE
In the corn region of the West, fourteen cases from contemporarysources designated harvesting, gathering, or husking (including haulingand cribbing in some cases) average 11.3 man-hours per acre. The methodof harvesting is not known, and seven extreme cases of 20—40 man-hoursper acre are omitted. Yields in all these cases run two to four times theregional average.
PERIOD 1: POSTHARVEST LABOR, WHEAT AND OATS
In postharvest labor (threshing) only the size of the crop and method ofthreshing affect labor cost. For threshing, the flail, the treading floor,and small hand- or horse-powered machines were all in common use. For1838—61, our contemporary sources for wheat, based largely on Virginiaand Illinois manuscripts, yield a bimodal series of fifteen items bunchedbetween 0.47—0.74 and 1.00—1.50 man-hours per bushel. If these twogroups correspond to the ranges of treading floor and machine techniques,or the hand method, then the median (0.73) is the upper limit of methods15other than flail and winnowing sheet.
For oats, the mix of techniques may have been somewhat less labor-saving since a portion was grown for feed on farms which grew no wheat.But the lighter weight and larger grain of oats make it easier to threshby any technique. One source for the flail and sheet method gives thesame labor for an acre of oats at 40 bushels per acre as for an acre ofwheat at 20 bushels.'6 On this basis, an estimate of 0.40 man-hours perbushel for oats appears to be comparable to one of 0.73 for wheat.
Though stated somewhat unclearly, Rogin's data appear to yield the followingrough estimates for the various techniques:
Technique Man-Hours Per Bushel of Wheat
Threshing Winnowing Threshing Winnowing Total1. flail sheet 1.00 0.30 1.30
2. flail hand-mill 1.00 0.06 1.06
3. treading sheet 0.37 0.30 0.67
4. treading hand-mill 0.37 0.06 0.43
5. machine-horsepowered 0.30
6. machine-horsepowered 0.11
Source: Rogin (See Appendix F, B-7), pp. 176—191.The figure 0.73 is just the midpoint of the range of techniques I to 5, as estimated byRogin.
16 Source: See Appendix E, U.S.-4, Vol. II, pp. 446, 470. The estimate used here forwinnowing with a sheet is considered high by Rogin.

GRAIN PRODUCTION, 1840—60 AND 1900—10 571
TABLE 0—12
PERIOD 2: PREI-iARVEST LABOR FOR AM) CORN
W:SG W:NW W1NW
+b + +NE ME W:C W:WD WiR Cal. Cal.
4.0 9.0 14.0 10.0 78,0 7,0 23.0
X 11.6 10.7 5.5 6.1 4.2 6.0 3.1
M 12.5 10.0 6.2 4.1 5.7
a 2.2 2.8 1.7 1.5 1.6 1.7l.lc
8 1.2 0.97 0.47 0.49 0.19 0.7O.2c
OATS
n 10.0 10.0 15.0 15.0 12.0 8.0 6.0
X 9.3 9.5 3.3 6.1 3.0 7.6 4.3
M 9.8 9.3 2.7 6.0 2.95 7.8 -
a 1.8 2.4 1.9 1.8 0.9 2.3
a 0.6 0.8 0.5 0.47 0.27 0.86
CORN
n 34.0 12.0 10.0 11.0 8.0 56.0 18.0 21.0
x 46.4 26.7 26.9. 29.1 11.4 15.2 17.3 11.4
14 344 25.6 24.75 28.0 10.2 13.75 14.75 9.5
a 30.9 5.6 5.0 4.8 4.6 4.9 5.8 5.3
8 5.4 1.7 1.7 1.5 1.7 0.6 1.4 1.2
aFor corn, the region is SsWC.
corn, the region is W:SG.
wheat and oats combined.
TABLE D—13
PERIOD 2: ANt) I-MVEST LABOR, DERIVATION OF W WESTERN SUBREGIONS
Wheat Oats Corn
Preharvest Harvest Preharvest Harvest Preharvestw a b w a b w a
Subregion (Ar/Aw) (L/A) (L/A) CL/A) (L/A) (Ar lAw) CL/A)
W:C 0.236 5.5 3.0 0.443 3.3 2.6 0610 15.2
WaWD 0.112 6.1 3.0 0.216 6.1 3.5 0.072 17.3
+ 0.543 4.2 1.8 0.291 3.0 1.7 0.307 11.4
WsR 0.017 6.0 7.5 0.014 7.6 8.3)\0.011
W:NW + Cal. 0.092 3.2 2.0 0.035 3.2 2.05
West (Yaw) 4.66 3.88 14.2
(Zbw) 2.33 2.5
Source: Weights, from USDA, revised estimates; labor requirements fromTables D—12, D—15.
8For corn, W:SC only.
data available. W:SG figure.

572 SOURCES OF PRODUCTIVITY CHANGE
TABLE 0—14
PERIOD 2: LABOR FOR DERIVA-TION OF S FROM SOUTHERN SUBREGION
SubregionU
(Ar lAw)a
(L/A)
S:EC 0.393 26.9S:DC 0.218 29.1
0.389 11.4South (raw) 21.3
Source: Weights, from USDA, revised es-timates; labor requirements, from Table D—12.
TABLE 0—15
PERIOD 2: NARVEST LABOR
NE S W:C .W:WD1-
W:WCa W:R
W:NW+
Cal.
.
n 7.0 8.0 21.0 10.0 44.0 70 10.0
3.0 3.0 3.0 3.0 1.8 7.5 2.0M 2.9 3.2 2.7 2.1 1.7 8.2 1.9
0.8 1.5 1.0 1.5 0.8 2.1 0.88 0.26 0.59 0.23 0.5
OAT S
0.12 0.85 0.26
n 10.0 10.0 14.0 15.0 11.0 9.0 10.0
X 3•4 4.5 2.6 3.5 1.7 8.3 2.0M 2.9 4.4 2.2 2.6 1.4 8.3 1.9a 1.4 1.9 0.9 2.0 0.5 1,4 0.8a 035 0.64 0.25 0.53
CORN
0.17 0.5 0.26
130b 28.Oc
4.3 6.7M 4.3 6.2
0.6 1.68 0.2 0.3
aFor corn, the region is W:C + W:SG.
2.
CNthd 3. See notes on period 1 harvest labor.

GRAIN PRODUCTION, 1840—60 AND 1900—10 573
PERIOD 2: POSTHARVEST LABOR, WHEAT AND OATS
The estimates of labor per acre, shown in Table D-16, present somesuperficial anomalies. In wheat, the lower average for W:SG + W:WCthan for the eastern regions is due to the lower yield and to a numberof cases where threshing was done from the header stack rather than theshock. The NRP sample cases (Appendix B, U.S.-5) show nearly uniformuse of the header in western Kansas and a noticeable proportion (10—30per cent) throughout W :SG and west of it. Technical manuals disagreeon whether grain harvested by a header threshes more easily than reapedgrain, but the AES studies seem unmistakable. Though methods are notstated, the use of the header in Minnesota probably accounts for the lowfigure in W:WD. Use of the combine in wheat is confined largely to aportion of W:NW, and is neglected in these estimates. In W:R, the highfigure is not easy to explain, but the weight is negligible.
In oats, the higher figure for NE is due largely to use of NRP figuresbased on barn threshing. If, as seems likely, that was a common practicein this region, it would seem desirable to charge the labor time in storingthe grain to this operation. In the South, barn threshing was the majortechnique in the two NRP survey counties, but the lower yields maypartly account for the lower per acre figure.
The use of regional average yields with per acre figures from samplestudies is a weak feature of these estimates. To check them, we havecompared them with three other estimates:
1. Average labor per bushel, by region, in those of our cases whereboth yield and labor per acre are given.
2. NRP reports of data by county, divided by counties' "normal yield."3. NRP estimates by region, based on its cases, divided by regional
yield.The results were as follows:
Wheat Oats
W:SG W:NW W:SG+ + +
NE S W:C W:WC Cal. NE W:C W:WCTable D-17,
line 3 0.195 0.287 0.224 0.189 0.165 0.234 0.092 0.094
1. 0.075 0.230 0.215 0.125
2. 0.334 0.256 0.221 0.195 0.110 0.258 0.116 0.085
3.. 0.334 0.256 0.219 0.213 0.092 0.250 0.103 0.078

574 SOURCES OF PRODUCTIVITY CHANGE
TABLE 0—16
PERIOD 2: LABOR PER ACRE
NE S W:C
W:SG+
W:WI) W:R
W:NW+
Cal.
WHEAT
n 5.0 8.0 20.0 8.0 31.0 1.0 7.03.42 3.59 3.54 2.53 2.28 4.2 3.21
N 3.3 3.5 3.4 2.4 2.1 3.9a 0.9 1,1 1.1 0.5 0.9 1.18 0.45 0.41 0.25 0.12 0.16 0.46
OATS
n 6.0 8,0 9.0 11.0 8.0 1.0 a
6.96 4.07 2.62 2.91 2.35 4.23
M 7.5 3.95 2.5 3.2 2.4
a 1.9 1.5 1.0 0.8 0.8
8 0.87 0.55 0.35 0.26 0.34
figures available. Wheat figure used in our calculations.
TABLE D—17
PERIOD 2: LABOR, DERIVATION OF L/0
W:SG+
W:NW+
NE S W:C W:WD W:WC WZR
WHEAT
Cal.
L/A 3.42 3.59 3.54 2.53 2.28 4.20 3.21
0/A 17.5 12.3 15.8 15.3 12.0 18.6 19.4
L/O 0.195 0.292 0.224 0.165 0.190 0.226 0.165
L/A 6.96 4.07 2.62
OATS
2.91 2.35 4.23 3.21
0/A 29.7 17.0 28.4 26.8 22.2 32.7 33.8
Lb 0.234 0.239 0.092 0.108 0.094 0.129 0.095
Source: L/A, Table D—l6. 0/A, USDA, revised estimates, 1907—11.
L/01. LI/I * 0/4.

GRAIN PRODUCTION, 1840—60 AND 1900—10 575
TABLE D—18
PERIOD 2: POSTI-jARVEST LABOR, DERIVATION OF WESTERNREGION FROM SUBRB IONS
Region
Wheat Oats
V C(I/O)
V C(I/O)
W:C 0.267 0.224 0,475 0.092
W2WD 0.123 0.165 0.219 0.108
W:SG + 0.465 0.190 0.244 0.094
W:R 0.023 0.226 0.017 0.129
W — (Zcv) 0,193 0.098
Source: V1 USDA, revised estimates, 1907—11.o, Table D—17.
Except for the first column, our estimates are not implausible, consideringthe small number of cases and the possibilities of variation. In the firstcolumn, the NRP figure (lines 2 and 3) is based on cases from a singlecounty (Lancaster County, Pennsylvania) and may be disregarded.
Appendix E: Source Bibliography for Period 1U.S. DOCUMENTS
1. Commissioner of Patents, Annual Report, "Agriculture," Washington,1841—61.
2. Commissioner of Agriculture, Annual Report, Washington, 1862—81.3. Dept. of Agriculture, Annual Report, Washington, 1882.4. Commissioner of Labor, 13th Annual Report, Washington, 1898.5. Works Progress Administration, National Research Project (NRP), Changes
in Technology and Labor Requirements in Crop Production, Report AlO,Wheat and Oats, Phila., Apr. 1939.
6. Idem., Report AS, Corn, Phila., June, 1938.7. Dept. of Agriculture, Bureau of Agricultural Economics, Revised Estimates
of Wheat Acreage, Yield and Production, 1866—1929, Washington, July 1934.8. Idem., Revised Estimates of Oats Acreage, Yield and Production, 1866—1929,
Washington, July 1934.9. Idem., Revised Estimates of Corn Acreage, Yield and Production, 1866—1929,
Washington, May 1934.10. Censuses of Agriculture, 1840—1910, Washington.

576 SOURCES OF PRODUCTIVITY CHANGE
STATE DOCUMENTS
1. Illinois: Transactions, Ill. State Agricultural Society, Springfield, 1853—60.2. Indiana: Annual Report, md. State Board of Agriculture, Indianapolis,
1848—60.3. Maine: 1853—55, Transactions, Agricultural Societies in the State of Maine,
Augusta.1856—75, Annual Report, Secretary of the Maine Board of Agriculture,"Abstract of Returns of Agricultural Societies."
4. Massachusetts: 1837, Report on the Agriculture of Massachusetts, Boston;1853—75, Annual Report, Secretary of the Board of with Reportsof Committees Appointed to yisit the County Societies.
5. Michigan: Transactions, Mich. State Agricultural Society, Lansing, 1849—61.6. New York: Transactions, N.Y. State Agricultural Society, Albany, 1842—75.7. Ohio: 1850—56, Annual Report, Board of Agriculture; 1856—75, Annual
Report, Board of Agriculture, with an abstract of Proceedings, CountyAgricultural Societies, Columbus.
8. Tennessee: Biennial Report, State Agricultural Bureau, Nashville, 1855—58;Transactions, 1854—59.
PERIODICALS
(1) Agriculturist, Nashville; (2) American Farmer, Baltimore; (3) CarolinaPlanter, Columbia (S.C.); (4) Country Gentleman, Albany; (5) Cultivator,Albany; (6) Farmer and Gardener, Baltimore; (7) Farmer and Planter, Pendle-ton; (8) Farmers' Cabinet, Philadelphia; (9) Illinois Farmer, Chicago; (10) Jour-nal of Agriculture, St. Louis; (11) Maine Farmer, Augusta; (12) New GeneseeFarmer, Rochester; (13) Pennsylvania Farm Journal, Lancaster; (14) PrairieFarmer, Chicago; (15) Soil of the South, Columbus (Ga.); (16) SouthernAgriculturist, Laurensville (S.C.); (17) Southern Cultivator, Columbia (Tenn.);(18) Southern Planter, Richmond; (19) Tennessee Farmer, Jonesborough(Tenn.);(20) Union Agriculturist, Chicago; (21) Valley Farmer, St. Louis; (22) WesternFarmer, Cincinnati.
MANUSCRIPTS
Library Title County and State1. Virginia Historical Soci- Diary of Robert Henderson
ety, Richmond Allen Lunenburg, Va.2. Southern Historical Col-
lection, Univ. of N.C., Plantation Journal of John D. Anderson andChapel Hill Ashmore Sumter, S.C.
3. Department of Archives,Louisiana State Univ., Eli J. Capell Plantation.Baton Rouge Diaries and Record Books Amite, Miss.
4. Maryland Historical So- H. D. G. Carroll, "The Perryciety, Baltimore Hall Farm Journal" Baltimore, Md.
5. Virginia Historical Soci- Papers of Phillip St. Georgeety, Richmond Cocke, "Belmead Planta-
tion" Powhatan, Va.

Library6. Univ. of Georgia, Athens
7. Univ. of Illinois, Urbana8. Louisiana State Univ.,
Baton Rouge9. South Carolina Library,
University of S.C.,Columbia
10. College of William andMary, Williamsburg,
11. Maryland Historical So-ciety, Baltimore
12. Georgia Dept. of Ar-chives and History,Atlanta
13. Univ. of Georgia, Athens
14. Louisiana StateBaton Rouge
15. Louisiana StateBaton Rouge
16. Southern Historical Col-lection, Univ. of N.C.,Chapel Hill
17. Virginia State Library,Richmond
18. The Filson Club,Louisville
19. Southern Historical Col-lection, Univ. of N.C.,Chapel Hill
20. Library of Congress,Washington, D.C.
21. Univ. of Maryland, Col-lege Park
22. Virginia State Library,Richmond
23. The Filson Club, Louis-ville, Ky.
24. Hall of Records, Aima-polis, Md.
25. The Filson Club,Louisville
26. National Agricultural Li-brary (USDA), Wash-ington
27. Virginia State Library,Richmond
28. Georgia Dept.chives and
of Ar-History,
TitleWm. J. Dickey Diaries, "Bird-
song Plantation"M. L. Dunlap's Ledger
Ferchaud Papers
Samuel P. Gaillard PlantationJournal
James Gait: Diary and Plan-tation Memoranda
Gittings Account Book,"Roslin Farm"
Seaborn Hawks Farm Journal
John B. Lamar PlantationBook
Liddell Plantation Book,"Lianada Plantation"
The Marston (Henry W. andfamily) Papers, PlantationDiary
Farm Journal of NicholasMassenburg
Farm Journal of WilliamMassie
The Howard Miller Diary
The Norfleet Diaries
The Physick Family PapersThe John Piper Family Record
and Time Book
The Ruffin Papers
Robert W. Scott Diary
John H. Seliman DiaryDeacon's Journal of the
Shaker Community
E. J. Tayloe AgriculturalJournal
L. W. Tazewell PlantationBook
Diary, Ledger, and AccountBook of James WashingtonWatts
577
County and State
Hancock, Ga.Cook, Ill.
St. James Parish, La.
Sumter, S.C.
Fluvanna, Va.
Baltimore, Md.
Jasper, Ga.
Sumter, Ga.Concordia
Parish, La.
Feliciana Parish, La.
Franklin, N.C.
Nelson, Va.
Jefferson, Ky.
Bertie, N.C.
Cecil, Md.
Allegany, Md.
Hanover, Va.
Franklin, Ky.
Anne Arundel, Md.
Mercer, Ky.
King George, Va.James City, Norfolk,
Northampton, Va.
Bartow (formerlyCass), Ga.
GRAIN PRODUCTION, 1840—60 AND 1900—10
Va.
Univ.,
Univ.,
Atlanta

578 SOURCES OF PRODUCTIVITY CHANGE
BOOKS
1. John Spencer Bassett (ed.), "The Westover Journal of John A. Seldon, Esq., 1858—1862," Smith College Studies in History, Vol. VI, No.4, Northampton, Mass., July1921.
2. P. D. Coburn, Swine Husbandry, New York, 1877.3. Edwin A. Davis, "Plantation Life in the Florida Parishes of Louisiana, 1836—1846
as Reflected in the Diary of Bennet H. Barrow," New York: Columbia UniversityPress, 1943.
4. F. Gerhard, illinois as It Is, Chicago, Philadelphia, 1857.5. George N. Lamphere, "History of Wheat Raising in the Red River Valley,"
Minnesota Historical Society Collections, Vol. 10, pt. 1, St. Paul, 1905.6. Frank L. Riley (ed.), "Diary of a Mississippi Planter," Publications of the Mississippi
Historical Society, X, Oxford, 1909.7. Leo Rogin, The introduction of Farm Machinery in its Relation to the Productivity of
Labor in the Agriculture of the United States during the Nineteenth Century, Univ. ofCalifornia Publications in Economics, Vol. 9, Berkeley, Univ. of California Press,1931.
8. Edmund Ruffin, Essays and Notes on Agriculture, Richmond, 1855.9. F. Yates, The and Analysis of Factorial Experiments, Imperial Institute of
Soil Science, Technical Communication 35, Harpenden, Eng., 1937.
Appendix F: Source Bibliography for Period 2U.S. DOCUMENTS
1. Department of Agriculturea. Department Circular 183, Washington, 1922.b. Department Bulletins 3, 214, 218, 219, 412, 482, 528, 595, 757, 814, 917,
943, 961, 1000, 1181, 1198, 1296, 1421, 1446, Washington.c. Bureau of Agricultural Economics, Divisions of Cost of Production and
of Farm Management, Preliminary Report, Cost of Wheat Production andincomes for Farming, Washington, 1923.
d. Yearbook, 1917, 1923, Washington.e. Division of Statistics, Bulletin 20, Washington, 1901.f. Office of Farm Management, Farm Management Monthly, Vol. II,
Washington, 1914.g. Office of Farm Management, Farm Management Circular 3, Washington,
1919.h. Special Report 40, Washington, 1882.i. Agricultural Marketing Service, Crop Reporting Board, Corn Acreage,
Yield and Production, Washington, 1954.j. Monthly Crop Report, Washington, 1915.k. Office of Experiment Stations, Bulletin 173, Washington, 1907.
2. WPA-NRP: See Appendix E, items U.S.-5, and U.S.-6.3. Commissioner of Labor, 13th Annual Report, Washington, 1898.4. Hearings Before the Senate Committee on Agriculture and Forestry, 65th
Cong., 2d Sess., Washington, 1918.5. Hearings Before the Joint Commission of Agricultural Inquiry, 67th Cong.,
1st Sess., Washington, 1922.
GRAIN PRODUCTION, 1840—60 AND 1900—10 579
STATE DOCUMENTS
1. Alabama: Alabama Polytechnic Institute Extension Service, Circular 33,Auburn.
2. California: Univ. of California, College of Agriculture Agronomy Project337, Berkeley.
3. Colorado: State Agricultural College of Colorado, AES Bulletins, FortCollins.
4. Georgia: Georgia State College of Agriculture, Extension Division,Bulletins 270, 273, and 428, Athens.
5. Idaho: Univ. of Idaho, AES Bulletins 123 and 195, Moscow.6. Illinois: Univ. of Illinois, AES Bulletins 50 and 277, Urbana.7. Iowa: (1) Iowa Department of Agriculture, Sixth Annual Iowa Year Book
of Agriculture, Des Moines, 1905. (2) Iowa AES Bulletin 16, Ames. (3) IowaBureau of Labor Statistics, Fourth Biennial Report of the Commissioner ofLabor, Des Moines, 1891.
8. Kansas: (1) Report, State Board of Agriculture, Topeka, 1920. (2) NinthAnnual Report, Bureau of Labor Statistics, Topeka, 1893.
9. Maine: (1) Maine Board of Agriculture, Twenty-Second Annual Report ofthe Secretary, Augusta. (2) Univ. of Maine, College of Agriculture, M.D.Jones, The Cost of Producing Sweet Corn, Orono, 1920.
10. Massachusetts: Massachusetts State Board of Agriculture, Abstract ofReturns of the Agricultural Societies of Massachusetts with the Twenty-Eighth Annual Report of the Secretary, Boston, 1880.
11. Michigan: 19th and 27th Annual Report, State Board of Agriculture,Lansing.
12. Minnesota: Univ. of Minnesota, AES Bulletins 157 and 179, St. Paul.13. Missouri: Univ. of Missouri, AES Bulletins 125 and 165; Research
Bulletin 6; Circular 100, Columbia.14. Montana: (1) Univ. of Montana, AES Bulletins 116 and 122, Bozeman.
(2) Montana Extension Service in Agriculture and Home Economics,Bulletin 71, Bozeman.
15. Nebraska: Univ. of Nebraska, AES Bulletin 29, Lincoln.16. New Jersey: (1) Thirty-Third Annual Report, New Jersey State AES, Union
Hill, 1912. (2) New Jersey AES Bulletin 312, New Brunswick.17. New York: (1) State College of Agriculture, Experiment Station Bulletins,
Cornell Station, 377, 414, and 475, Ithaca. (2) New York State College ofAgriculture, Dept. of Agricultural Economics and Farm Management,Farm Cost Accounting Project, Tthaca, 1931. (3) New York Dept. ofAgriculture, Bulletin 86, Albany.
18. North Dakota: (1) North Dakota Agricultural College, AES Bulletins 142and 144, Agricultural College. (2) Third Biennial Report, Commissioner ofAgriculture and Labor, Bismarck.
19. Ohio: (1) Ohio State Univ. Agriculture Extension Service, Vol. 18, No. 5,Colombus. (2) Ohio ABS Bulletin 266, Wooster. (3) AES BimonthlyBulletin, Vol. 12. (4) Monthly Bulletin Vol. 3,'Wooster.

580 SOURCES OF PRODUCTIVITY CHANGE
20. South Carolina: South Carolina Agricultural Experiment Station ofClemson College, Bulletin 221, Clemson.
21. Utah: Utah Agricultural College Experiment Station, Bulletin 165, Logan.22. Washington: State College of Washington, AES Bulletins 175 and 244,
Pullman.23. West Virginia: West Virginia AES Bulletins 163 and 187, Morgantown.24. Wisconsin: Bureau of Labor and Industrial Statistics, 9th Biennial Report,
1897—98, Madison.PERIODICALS
(1) Atlantic Monthly, Boston; (2) Breeders Gazette, Spencer, Indiana; (3) In-diana Farmer, Huntington, Indiana; (4) National Stockman and Farmer,Pittsburgh, Buffalo; (5) Orange Judd Farmer, Chicago; (6) Pennsylvania Farmer,Mercer, Philadelphia, Pittsburgh; (7) Practical Farmer, Camden, New Jersey;(8) Rural New Yorker, New York; (9) Southern Planter, Richmond; (10) Tri-bune Farmer, New York; (11) Utah Farmer, Salt Lake City; (12) Wallace'sFarmer, Des Moines, Ames, Iowa.
BOOKS
1. North Dakota State Historical Society Collections, Vol. III, Bismarck, 1910.2. Howard M. Eliot, The Elementary Principles of Farm Management, Ann
Arbor, Mich., 1923.3. Melville L. Bowman and Bruce W. Crossley, Corn, Ames, Iowa, 1908.4. George D. Leavens, Corn, New York, 1915.5. Herbert Myrick, The Book of Corn, New York, Chicago, 1903.
COMMENT
Glen T. Barton, U.S. Department of AgricultureOutput per man-hour in the production of wheat and oats in the early1900's was about four times as great as in the 1840's. In their paper theauthors set as their objective the allocation of this increase in laborproductivity among three broad sources: (1) westward movement of thecrop; (2) changes inyields per acre; and (3) improvements in mechaniza-tion and other practices which reduce labor inputs per acre. Three broadregions, the Northeast, South, and West, were delineated for the analysis.The authors concluded that the bulk of the rise in labor productivity wasdue to mechanization of harvesting operations in all the producing regionsand that very little improvement resulted from westward movement ofthe crop or from change in yields.
I have no major quarrel with the authors' conclusions. They are to becomplimented on their careful, painstaking analysis, and especially for
NOTE: This comment was prepared for an earlier version of the Parker paper inwhich the data on corn were omitted.

GRAIN PRODUCTION, 1840—60 AND 1900—10 581
the development of methodology which should prove useful to otherresearch workers.
Study of the paper raised several points in my mind, some by way ofconstructive criticism of the paper per Se, others regarding degree ofemphasis or points made by the authors and, perhaps most important,facets omitted or not developed fully by the authors.
1. Despite the careful and thorough assembly of data and the rigorof the authors' analysis, quantitative conclusions reached in the papershould be regarded as broad indications, rather than as precise measure-ments. As the authors recognize, the basic data used, especially those onlabor inputs per acre for wheat and oats, leave much to be desired. Thereis a strong suspicion that the labor coefficients assembled generally reflectoperations on farms with above-average management practices. Also,it is generally recognized that estimates of acreage and yield of the twograin crops in the early part of the period studied are not as accurate asmost of our agricultural data today.
2. From a statistical point of view, the authors are quite correct inconcluding that little change occurred in yields of the two grains duringthe period of analysis. However, I want to give even more emphasisthan they did to the importance of technological improvement in cropsduring the period. Even today, the small grain crops pointedly illustratethe crucial importance of variety improvements in preventing sharpreductions in yields because of persistent, potential ravage by diseases andinsects.
3. In view of my own research background in the field of "productivity"measurement, I believe the authors were somewhat hasty in their readyacceptance of average labor productivity as a measuring device. Admit-tedly, lack of data would have prevented any major attempt to examinechanges in output-input ratios of other factors of production. The authors'conclusion that mechanization of harvest operations was by far thedominant influence in raisIng production of wheat and oats per man-hourdirectly implies that substitution of capital for labor may have been animportant influence during the period analyzed.
4. The authors rigidly adhered to their stated purpose of measuringsources of improvement in labor productivity in small grain production.However, I wish they had engaged in some speculation as to causes ofthese changes in terms of probable economic, social, and institutionalfactors. This observation leads me to my final point.
5. Granting the authors' thorough and workmanlike job of data collec-tion and analysis and the general accuracy of their conclusions, just whatdoes the paper contribute to our body of useful economic intelligence?

582 SOURCES OF PRODUCTIVITY CHANGE
More attention to causes of changes in labor productivity might haveprovided some basis for projections of what lay ahead in the twentiethcentury. Data available in the Economic Research Service, for example,indicate that production per man-hour of wheat in 1961-62 was 9 timesthat prevailing in 1910—14. Present-day output of oats per man-hour is5,5 times that of the early 1900's. These improvements in production perman-hour are substantially greater than those that occurred from the1840's to the early 1900's.
If as a result of our analysis of given historical periods we can developbetter frameworks for looking ahead, both economists and historianscan better serve their function as social scientists. Such analysis alsoshould contribute to a more complete understanding of the forces behindeconomic growth. Obviously, contributions of this sort are badly neededin providing better guidelines for policy decisions in the many under-developed and developing economies throughout the world.