productivity in ireland: trends and issues · pdf fileproductivity in ireland: trends and ......
TRANSCRIPT

Quarterly Bulletin Spring 2004
83
Productivity in Ireland:Trends and Issuesby Mark Cassidy1
ABSTRACT
This paper provides a review of aggregate and sectoral trends in Ireland’shistorical and more recent productivity performance. It shows thataggregate productivity growth has been quite strong, on average, over thepast forty years with an acceleration in the growth rate during the 1990s.This pick-up in growth was primarily driven by the performance of a smallnumber of foreign dominated high-technology sectors; productivity growthin the more traditional manufacturing sectors and the services sector wasmore modest. The paper also examines Ireland’s medium term productivitypotential in the context of some generally accepted determinants ofproductivity including macroeconomic stability, a favourable regulatoryenvironment, good access to risk capital and other forms of finance, higheducational standards and conditions favourable to innovation and R&Dactivity.
Section 1. IntroductionFor a mature economy like Ireland, with employment levels closeto those of developed economies generally, productivitydevelopments are the key to future growth potential. This is notto dismiss the importance of more traditional determinants ofgrowth, namely increasing the usage of labour and capitalresources. However, when an economy is operating at close tofull employment conditions, the potential for further growth fromthis source is inevitably more limited.
An increase in productivity means the ability to produce morefrom a given set of inputs. This can come about, for example,through improvements in organisational and working practicesand technological know-how. Generally speaking, improvementsin productivity are realized at the level of the firm; economywide productivity levels (growth rates) are, therefore, primarilyan aggregation of the productivity levels (growth rates) ofindividual firms. It is difficult, therefore, for Government andpolicy makers to have a direct impact upon productivitydevelopments, except through efficiency improvements in theprovision of public services. However, by ensuring thatinstitutional structures and policy settings are supportive ofinvestment, entrepreneurship and innovation, economic policycan have a central role in determining the productivity potentialof an economy.
1 The author is an Economist in the Economic Analysis, Research and PublicationsDepartment. The views expressed in this article are the personal responsibility of the authorand are not necessarily those held by the CBFSAI. The author would like to thank TomO’Connell, Michael Casey and Maurice McGuire for helpful comments.

Quarterly Bulletin Spring 2004
84
Ireland’s productivity performance over the past forty years hasbeen reasonably good by international standards, coinciding withthe opening up of the economy from the late 1950s. This partlyreflects ‘‘catch up’’ factors as productivity and per-capita outputlevels converged with the EU average. As a result of very strongproductivity growth during the late 1990s, Irish labourproductivity levels have risen substantially such that GNP perworker is now roughly equal to the EU average. Strongproductivity growth during this period was largely driven bysubstantial foreign direct investment inflows from the UnitedStates and sectoral change in industry — i.e. a continuing shift ofcapital and labour from agriculture and relatively low productivitymanufacturing towards high-technology sectors includingchemicals and ICT sectors — and was facilitated by macro andmicro-economic reforms implemented since the late 1980s,favourable exchange rate and international economicdevelopments, increased European integration and theavailability of a young, relatively well-educated workforce.
Productivity growth, however, weakened since 2001, in line withthe economic slowdown experienced in most developedeconomies. This is partly a cyclical phenomenon; productivitychanges are well known to be pro-cyclical picking up strongly inthe early stages of an economic upturn and tending to weakenin a downturn; this reflects the slow lagged response ofemployment to output changes. If and when the domesticeconomy recovers from the current slowdown, it is unlikely, fora number of reasons, that labour productivity growth can recoverto the very high rates of the late 1990s. Nevertheless, theprospects for future productivity growth remain reasonablyfavourable so long as appropriate economic conditions can beensured. This would include a sound macroeconomicenvironment, flexible labour and product markets, well-developed financial markets and institutional structures andpolicy supportive of the accumulation of physical and humancapital, entrepreneurship and research and development activity.
This paper explores some of the issues relating to productivity inIreland. The following section introduces the concept ofproductivity and provides a general overview of some of themain determinants of productivity growth. Section 3 reviewssome historical and sectoral trends in Ireland’s productivityperformance while an assessment of the economy’s mediumterm productivity potential, in the context of the generaldeterminants of productivity growth outlined in Section 2, isprovided in Section 4. Section 5 concludes.
Section 2. Determinants of Productivity GrowthAs the key determinant of long-run economic growth, measuresof productivity constitute core economic indicators. There are

Quarterly Bulletin Spring 2004
85
two generally accepted measures of productivity: labourproductivity and total factor productivity. Whereas labourproductivity measures economic output per unit of labour, totalfactor productivity relates output to the combined usage of factorinputs, namely labour and capital. There is a clear relationshipbetween the two concepts in that changes in labour productivitycan be decomposed into three components: (i) the quantity andquality of physical capital, (ii) the quality of labour input(i.e. educational attainment, skills and experience of theworkforce) and (iii) total factor productivity. Total factorproductivity, therefore, is the part of output growth that cannotbe explained by changes in the quantity or quality of factorinputs; instead it reflects changes in technology, knowledge,organization and efficiency.2
As an important determinant of competitiveness, living standardsand potential output, the concept of labour productivity is ofsignificant policy relevance. It is also intuitively appealing andeasier to measure than total factor productivity. The proximatecauses of labour productivity growth include investment inhuman, physical and knowledge capital. Going beyond theseproximate causes are the economic conditions that support highproductivity levels or strong, long-term productivity growth rates.Among the most important considerations in this regard,identified by international institutions such as the OECD, IMFand European Commission, are sound macroeconomicfundamentals, a regulatory environment favourable to businessand entrepreneurship, good access to risk capital, the skills,knowledge and educational attainment of the workforce andconditions favourable to R&D activity. A wide range of empiricalstudies by these institutions has confirmed the importance ofthese factors.3
(i) Macroeconomic Policy
Empirical evidence from OECD countries suggests that a soundmacroeconomic environment, including well-managed publicfinances, not too large a government sector and price stability,can contribute to raising trend productivity growth in themedium term through a positive impact on confidence and bypromoting efficient resource allocation.4
In particular, the variability of inflation appears to be an importantnegative influence on output per capita, supporting thehypothesis that uncertainty about price developments affectsgrowth via its impact on economic efficiency. The effect of the
2 As they are calculated as a residual, estimates of total factor productivity growth also includeany measurement errors.
3 For an overview of these studies see, for example, EU Commission (2003) and OECD(2003).
4 OECD, 2003, chapter 2.
Quarterly Bulletin Spring 2004
86
level of inflation is somewhat less clear cut — perhaps because ofthe low levels of inflation currently observed across most OECDcountries.5 However, high inflation usually goes hand-in-handwith more variable inflation. Moreover, high inflation, even if notsubject to substantial variability, can have negative growth effectsin so far as it leads to shortening of time horizons which isinimical to long-term investment, distorts the true measure ofprofit and can have disincentive effects if the tax regime is notindexed.
The size of government is also thought to have an impact ongrowth. The overall tax burden, if pushed beyond a certain limit,is estimated to have a negative effect on output per capita whilepublic investment can ‘‘crowd out’’ private investment throughhigher real interest rates. In addition to the size effect, theliterature also suggests specific effects stemming from thefinancing and composition of public expenditure. A particularlynegative effect is found for tax structures with a heavy weight ondistortionary taxes, which affect the choices of households andfirms with respect to the level and composition of their (humanand physical) capital investment and discourageentrepreneurship. Direct taxes, including taxation on income andprofits, are generally considered more distortionary than lumpsum taxes or taxes on goods and services — although indirecttaxes can also have an impact on cost competitiveness. Thecomposition of public expenditure also appears to be importantwith a greater positive impact for productive investment,including expenditure on infrastructure, and investment ineducation than for expenditures not directly related to growthincluding inefficient systems of subsidies and transfers.
(ii) Regulation
Excessive regulation and administrative burdens can hinderentrepreneurship and business development. Improvements inthe regulatory environment, therefore, can have a positive effecton productivity growth. Related to this, greater competition,leading to more efficient and flexible markets, can enable firmsto achieve higher productivity growth through organisationalchange and less slack in the use of inputs. By contrast, anuncompetitive environment results in prices being higher thanthey would otherwise be and output and employment being lessthan is socially optimal. In addition to static gains in productivitylevels, dynamic gains can also be realized if increasedcompetition requires firms to continue to innovate and developnew products.6 It has been estimated, for example, that structuralreforms implemented in OECD countries during 1985 to 1995,
5 Further reductions in inflation, when inflation is already low, may have negative effectsthrough nominal wage rigidities creating market inefficiencies. A more significant impact ofthe level of inflation would likely be found in a study including high-inflation countries.
6 For an overview of the empirical analysis, see, for example, Bassanini and Ernst (2002),Scarpetta and Tressel (2002), Salgado (2002).
Quarterly Bulletin Spring 2004
87
including lowering regulatory burdens and increasing standardsof competition, increased total factor productivity growth by 0.2to 0.3 percentage points on average.7 By increasing the efficiencyand flexibility of markets, economic reform can also leave theeconomy better able to deal with economic shocks, an issuewhich is of particular relevance for countries participating in EMUwhich no longer have recourse to independent monetary orexchange rate policies.
Flexible labour markets can also be productivity enhancing if theyallow for a more efficient (re) allocation of existing labourresources. For example, flexible labour markets can help ensurethat expanding businesses in innovative sectors can be matchedwith appropriately skilled workers. OECD studies find that overlystrict employment protection legislation, by reducingemployment turnover, may in a number of circumstances leadto lower productivity performance and discourage the entry andexpansion of firms.8 There is also evidence that strict employmentprotection legislation and certain industrial relations regimes canhave a detrimental effect on R&D activity.
(iii) Financial Markets and Access to Risk Capital
A financial system that supports risk takers and new enterprisescan have a positive impact on innovation and productivity. Thereare risks, however, for financial institutions investing in start-upfirms or innovative activities which are, by their nature, risky.New or developing businesses, therefore, often find it difficult toobtain external financing. This is of particular importance sincenew firms are often the most dynamic and the ones with greatestpotential for high productivity growth. Hence, it is important thatthe conditions exist whereby financial markets are gearedtowards the provision of alternative forms of financing, includingventure capital and equity financing, as well as providing financeto more established firms. Among the conditions identified in therecently published Sapir Report for the existence of a suitableventure capital market were the existence of a sufficient quantityof start-up projects so that risks are diversified, an adequate exitroute for investors in the form of secondary stock markets,knowledgeable fund managers who can provide significant non-financial assistance to their clients and a willingness on the partof entrepreneurs to share control in exchange for fastergrowth.9
(iv) Educational Attainment
Educational attainment is a key determinant of human capital,which is an important driver of labour productivity. Increasing aneconomy’s skill base can also have a positive impact on total
7 Salgado (2002).8 Nicoletti et al. (2001).9 The Sapir Report (2003: p. 38).

Quarterly Bulletin Spring 2004
88
factor productivity growth by facilitating structural change andtechnological improvements. The key requirement for developedeconomies in this regard is higher education. This is particularlyso because of the complementary effects between educationand more skilled activities including R&D activities. Both arecrucial in enhancing the level of technology, while theproductivity of R&D requires high standards of knowledge in theeconomy. Education is also an important variable in terms ofattracting inward foreign direct investment flows, which isparticularly important for small open economies like Ireland.Research suggests that internationally mobile capital seeks higheducation environments as well as other factors such asfavourable tax structures, a competitive cost base and lowregulation.
The value of human capital can also be affected by the agedistribution of the population. Ireland has a relatively youngpopulation relative to other EU countries. This can have apositive impact on the dynamism, adaptability and ability toinnovate of the workforce. In this respect, the current age profilein Ireland is more conducive to strong productivity growth thanmany other European countries.
(v) Research and Development Activity
Empirical evidence indicates a positive and robust relationshipbetween R&D activity, particularly in the private sector, andproductivity growth. Indeed, this link appears to havestrengthened during the 1990s with the expansion of theknowledge intensive ICT-producing sector. Not only are ICTproducts generally associated with high productivity growthrates, but they can also be a tool for increasing productivitygrowth in other (ICT-using) sectors. The EU, for example, haslower R&D activity, a lower concentration of high-technologyindustries and lower ICT penetration rates than the US and thisseems to have contributed to the widening productivity gapbetween the two regions during the second half of the 1990s.This is an area of policy relevance since it is generally acceptedthat free markets may fail to provide the socially optimal leveland direction of R&D activity because of the positive externalities(or spillover effects) from innovation.
R&D can boost productivity either directly through theinnovation it produces or more indirectly through the adoptionof technologies developed elsewhere. In order to create asupportive framework for R&D activity, an economy needs awell-developed risk capital market, a good system to protectintellectual property rights and good education and researchsupport systems. Small open economies, exposed to foreign R&D through trade, migration and FDI flows, are not necessarilydependent upon domestic R&D activity. In this case, other

Quarterly Bulletin Spring 2004
89
framework conditions might include those associated withmaking the economy an attractive location for inward investmentin R&D intensive sectors and ensuring that the economy cancapture some of the R&D activity in those sectors, rather thansimply being a location for more basic manufacturing activities.As an economy becomes more technologically advanced,however, domestic innovation as opposed to imitation increasesin importance.
Section 3. Trends in Irish Productivity3.1 Aggregate Trends
Irish output and productivity growth rates have, on average, beenquite high over the past forty years. Since 1960 real GDP growthhas averaged around 43⁄4 per cent per annum. This compareswith growth of around 3 per cent and 31⁄2 per cent in the EU andUS, respectively. Table 1 presents a decomposition of economicgrowth, both GDP and GNP, into employment growth andlabour productivity growth during a range of sub-periodsbetween 1961 and 2002. Taking this long-term perspectiveshows that employment growth in Ireland was very weak before1990, in line with the experience of the rest of Europe and incontrast to the superior employment performance of the UnitedStates. During the 1980s, employment actually made a negativecontribution to growth in Ireland. This changed substantiallyduring the 1990s when quite strong employment growth wasrecorded, particularly during the second half of the decade.
Table 1: Economic Growth, Employment and LabourProductivity Growth Rates (%)
GDP GNP Employment GDP per GNP per(numbers worker (per worker (peremployed) hour in hour in
parenthesis) parenthesis)
1961-2002 4.8 4.0 1.1 3.6 2.81961-70 4.0 3.8 0.0 4.0 3.81971-80 4.3 3.9 1.0 3.3 2.91981-90 3.3 1.9 −0.2 3.5 2.11991-95 4.7 4.5 2.0 2.7(3.6) 2.5 (3.5)1996-2002 8.9 6.9 4.3 4.5(5.1) 2.5(3.7)
Labour productivity growth has been consistently strong sincethe 1960s, averaging around 31⁄2 per cent per annum whenmeasured as GDP per worker, the most common measure usedfor long-term international comparisons. Since this is a measureof labour productivity rather than total factor productivity it alsoreflects capital deepening (i.e. changes in capital per worker),changes in the quality of the workforce and any measurementerrors. The corresponding growth rates for the EU and US werearound 23⁄4 per cent and 13⁄4 per cent, respectively. For Ireland itis generally accepted that GNP measures of productivity are amore meaningful measure of domestic economic performance

Quarterly Bulletin Spring 2004
90
because they exclude the substantial profit outflows of foreign-owned firms. Real GNP per worker increased at an annualaverage rate of around 23⁄4 per cent between 1961 and 2002,which is broadly similar to the average for the EU-15 over thesame period.10 This largely reflects the extremely high labourproductivity growth rates in the EU during the 1960s, averagingaround 41⁄2 per cent per annum. Since 1980, Irish GNP perworker has increased at an annual rate of around 21⁄4 per centcompared with around 13⁄4 per cent in the EU.
Changes in real GNP per person employed also constitute asomewhat imperfect measure of labour productivity growth inthe Irish economy because they fail to account for the significantdrop in average hours worked — a shorter working week — inrecent years. A more appropriate measure, therefore, is an indexof GNP per hour worked, which is probably the most meaningfulmeasure of underlying labour productivity growth in the Irisheconomy. Growth rates in GNP per hour since 1990 areincluded, in parenthesis, in Table 1 while Figure 1 below showsa comparison of hourly labour productivity growth rates acrossEU countries since 1980. As can be seen, Irish labourproductivity growth rates measured using GNP per hour workedwere substantially above the European average during the 1980s,and the highest in Europe during the 1990s.
0
1
2
3
4
5
6
1996-20021991-951981-90
Italy
Net
herla
nds
EU-1
5
Fran
ce
UK
Ger
man
y
Den
mar
k
Belg
ium
US
Swed
en
Aus
tria
Port
ugal
Finl
and
Gre
ece
Spai
n
Irel
and
(GN
P)
Irel
and
(GD
P)
Figure 1: Labour Productivity Growth Rates (Hourly),Average Annual % Changes
Source: EU Commission (2003) p.73. GNP figures for Ireland added by the author.
10 In this paper Irish GNP data are compared with GDP figures for other countries.International GNP data are not readily available for many other countries but this is notproblematic as there is not the same difference between GDP and GNP in the comparatorcountries.

Quarterly Bulletin Spring 2004
91
As a result of strong output and productivity growth rates duringthe late 1990s, Irish living standards and labour productivitylevels have risen relative to the European average such that GNPper capita and GNP per worker are now roughly equal to theEuropean average and about 70 per cent of those in the US.11
This compares with the situation in 1970 when Irish GNP percapita was around 62 per cent of the EU average and onlyaround 42 per cent of US GDP per capita (Table 2). Productivitylevels in Ireland have also increased relative to the EU averageover the past thirty years, with a particularly significant increaseduring the second half of the 1990s. However, while GNP perworker is now roughly equal to the EU average, the level of GNPper hour was still around 7 per cent lower than the EU averagein 2000. This reflects the fact that, despite the recent drop,average hours worked per employee in Ireland are above theEuropean average. The Irish employment rate, meanwhile, notincluded in Table 2, is around 1 per cent higher than the EUaverage but still around 11 per cent lower than in the US.
Table 2: GDP per capita/per hour (in PPS) US = 100
GDP per capita GDP per hour Working hours perperson employed
1970 2000 1970 2000 1970 2000
Austria 65.2 79.3 53.7 95.7 101.6 80.8Belgium 68.3 75.3 66.2 113.7 107.5 82.7Denmark 84.6 83.9 77.2 95.5 87.3 82.0Finland 61.6 73.2 52.9 91.9 93.8 87.1France 73.2 70.7 73.2 105.2 99.4 82.0Germany 78.7 74.2 70.8 93.4 100.9 81.6Greece 42.8 47.6 42.9 60.3 112.4 103.5Ireland 41.9 81.7 39.2 97.7 116.2 90.5Ireland (GNP) 42.6 70.0 39.9 84.2Italy 65.0 73.5 74.7 104.0 97.9 87.0Netherlands 76.3 79.4 74.8 104.9 93.5 71.7Portugal 34.7 51.6 24.8 54.1 107.7 93.5Spain 49.8 57.5 47.1 73.2 105.8 97.1Sweden 83.8 71.0 76.4 83.1 89.5 86.4UK 70.8 70.2 58.7 80.3 103.5 88.0EU-15 69.0 70.3 64.8 90.7 101.0 85.6USA 100 100 100 100 100 100
Source: EU Commission Sapir Report (2003) p.23. GNP figures for Ireland added by the author.
3.2 Sectoral Trends
Sectoral productivity trends are difficult to assess accurately.Although, internationally, productivity growth in services tendsto be quite weak, there is evidence that this can be linked tomeasurement problems — particularly in terms of calculating thereal value of services output.12 For Ireland there are alsodifficulties associated with calculating an appropriate value oflabour input due to the lack of a consistent series of hoursworked for service sub-sectors. As a result, productivity growth
11 It is necessary to exercise caution when comparing EU and US productivity because ofmethodological problems that can arise related to, for example, problems of deflation ofgoods with rapid changes in quality and difficulties in choosing the appropriate exchangerate or purchasing power parity. For an overview of the measurement problems associatedwith comparing productivity growth across countries see, for example, Ahmad et al. (2003).
12 See, for example, Wolfl (2003).

Quarterly Bulletin Spring 2004
92
in services is often measured as output per worker, which wouldimply an understatement of underlying productivity growthbecause no account is taken of the substantial reduction inaverage hours worked in many service sectors during the 1990s.
Productivity trends in Irish manufacturing industries are alsosubject to measurement difficulties. It is now generally acceptedthat productivity levels are inflated to a significant extent by theoperations of foreign multinationals in Ireland. The very highvalues of output per worker in certain foreign-dominated, high-technology sectors, particularly chemicals and pharmaceuticals,suggest that they may include returns to ‘intangible factors’ likeresearch and development and marketing activities which areundertaken mainly outside Ireland.13 These do not represent areturn to domestic factors of production and should morecorrectly be attributed as a return to factors in the country ofownership. It also seems likely that productivity data for someforeign-owned multinational firms are artificially inflated bytransfer pricing activities. These measurement difficulties shouldbe kept in mind when assessing sectoral productivitydevelopments.
At a broad sectoral level, productivity growth in the labour-intensive market services and construction sectors wassignificantly slower than in the more capital-intensive industrialsectors during the 1990s (Table 3).14 Employment growth in themarket services and construction sectors was extremely strongover the period 1991-2002, accounting for around 86 per centof total non-agricultural business sector employment growthcompared to a contribution from industry of around 14 per cent.However, industrial output growth was extremely strong andaccounted for around 57 per cent of total growth in non-agricultural business sector output, which explains the verystrong productivity growth figures in the broad industrial sector.The strong productivity performance of the agricultural sectorduring this period primarily reflects the decline in agriculturalemployment. Agricultural output growth has been quite weaksince 1991.
Table 3: Sectoral Productivity Growth Rates 1991-2002,Average Annual % Changes (1995 prices)
Market Services Industry Construction Agriculture
1991-2002 1.9 8.9 −1.0 3.11991-1995 0.4 6.4 1.9 2.61996-2002 2.9 10.7 −3.0 3.5
Note: Productivity is here measured as output per worker
13 Honohan, Maιtre and Conroy (1998).14 Market services exclude education, health, public administration and defence. It is
appropriate to exclude these sectors from the analysis because of the difficulties associatedwith measuring the output of the public sector.

Quarterly Bulletin Spring 2004
93
A recent EU Commission study compares hourly labourproductivity growth in the business sector across EU countriesfor the period 1996-2000. The results, shown for selectedcountries in Table 4, confirm the strong aggregate productivityperformance of the Irish economy during the late 1990s and alsothe fact that this performance was driven mainly bydevelopments in the manufacturing sector. While thecontribution to growth in percentage points from private serviceswas above the European average, it was less than in someindividual countries. Even taking into account the fact thatproductivity in service sectors is generally weaker than inmanufacturing and the measurement difficulties discussed above,the productivity differential between services and manufacturingin Ireland during the late 1990s appears particularly large.
Table 4: Hourly Labour Productivity Growth in the BusinessSector (%) 1996-2000 (Contributions frommanufacturing and private services)
Total Business Contribution Contribution Residual TermSector from from (Shift and
Manufacturing Private Services interactioneffects)15
France 1.3 0.8 0.5 0.0Germany 2.3 0.6 1.6 0.1Ireland 8.4 7.3 1.8 −0.7Italy 0.6 0.3 0.1 0.2Spain 0.0 0.2 −0.2 0.0UK 2.6 0.8 1.9 −0.1EU-15 1.7 0.7 1.0 0.0USA 3.1 1.2 2.0 −0.1
Source: EU Commission (2003) p.86.
Ireland’s superior productivity performance in manufacturing hasbeen largely a consequence of two factors, namely higherproductivity growth in the high-technology sectors than theEuropean average and also a greater degree of specialisation inthese sectors. These sectors include chemicals, publishing andprinting (which includes manufacture of software products) andelectrical and optical equipment (essentially ICT products). Thecorollary of this is that many indigenous manufacturingenterprises have not realized the same productivity gains overthis period and consequently have much lower levels ofproductivity than the average for the aggregate manufacturingsector.
15 The residual term reflects the impact on aggregate productivity growth of the shifting oflabour between sectors. The negative value of this figure for Ireland indicates that therelative shift in employment towards the lower productivity services sectors has had somenegative impact on aggregate productivity — although this is far exceeded by theproductivity gains within both manufacturing and services which are reflected in the middletwo columns. In other words, if employment in manufacturing had maintained its share oftotal employment over this period, aggregate productivity growth would have been slightlyhigher because of the higher productivity growth rate experienced in manufacturing.
Quarterly Bulletin Spring 2004
94
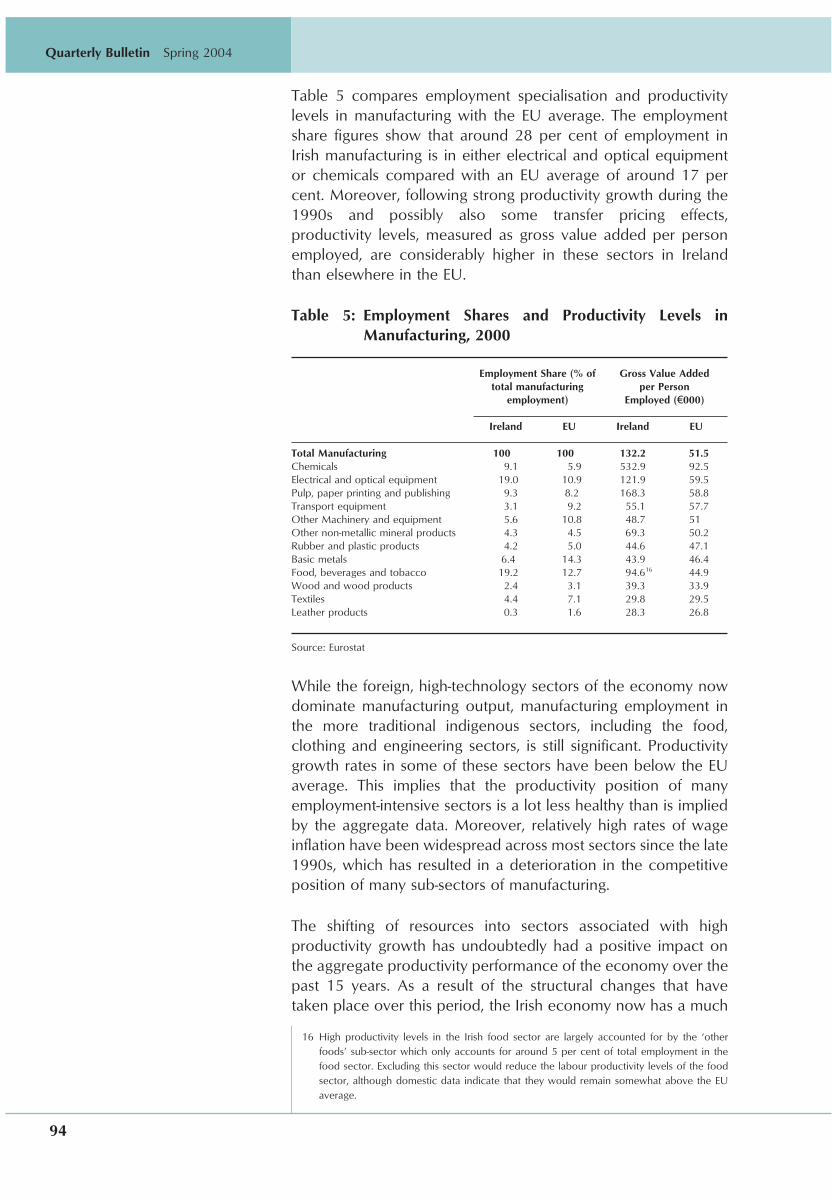
Table 5 compares employment specialisation and productivitylevels in manufacturing with the EU average. The employmentshare figures show that around 28 per cent of employment inIrish manufacturing is in either electrical and optical equipmentor chemicals compared with an EU average of around 17 percent. Moreover, following strong productivity growth during the1990s and possibly also some transfer pricing effects,productivity levels, measured as gross value added per personemployed, are considerably higher in these sectors in Irelandthan elsewhere in the EU.
Table 5: Employment Shares and Productivity Levels inManufacturing, 2000
Employment Share (% of Gross Value Addedtotal manufacturing per Person
employment) Employed (\000)
Ireland EU Ireland EU
Total Manufacturing 100 100 132.2 51.5Chemicals 9.1 5.9 532.9 92.5Electrical and optical equipment 19.0 10.9 121.9 59.5Pulp, paper printing and publishing 9.3 8.2 168.3 58.8Transport equipment 3.1 9.2 55.1 57.7Other Machinery and equipment 5.6 10.8 48.7 51Other non-metallic mineral products 4.3 4.5 69.3 50.2Rubber and plastic products 4.2 5.0 44.6 47.1Basic metals 6.4 14.3 43.9 46.4Food, beverages and tobacco 19.2 12.7 94.616 44.9Wood and wood products 2.4 3.1 39.3 33.9Textiles 4.4 7.1 29.8 29.5Leather products 0.3 1.6 28.3 26.8
Source: Eurostat
While the foreign, high-technology sectors of the economy nowdominate manufacturing output, manufacturing employment inthe more traditional indigenous sectors, including the food,clothing and engineering sectors, is still significant. Productivitygrowth rates in some of these sectors have been below the EUaverage. This implies that the productivity position of manyemployment-intensive sectors is a lot less healthy than is impliedby the aggregate data. Moreover, relatively high rates of wageinflation have been widespread across most sectors since the late1990s, which has resulted in a deterioration in the competitiveposition of many sub-sectors of manufacturing.
The shifting of resources into sectors associated with highproductivity growth has undoubtedly had a positive impact onthe aggregate productivity performance of the economy over thepast 15 years. As a result of the structural changes that havetaken place over this period, the Irish economy now has a much
16 High productivity levels in the Irish food sector are largely accounted for by the ‘otherfoods’ sub-sector which only accounts for around 5 per cent of total employment in thefood sector. Excluding this sector would reduce the labour productivity levels of the foodsector, although domestic data indicate that they would remain somewhat above the EUaverage.

Quarterly Bulletin Spring 2004
95
higher share of total manufacturing output and employmentconcentrated in high-technology sectors than any other EUcountry. Ireland also has a greater degree of productivespecialisation and, consequently, less diversity in itsmanufacturing sector than any other EU country.17 There is a riskthat the high degree of productive specialisation might leave theeconomy somewhat exposed to sector specific shocks, as wasevident during the recent slowdown in the global ICT sector.Moreover, in Ireland the high-technology sectors are dominatedby foreign multinationals, which are potentially mobile and notas embedded in the domestic economy as indigenous firms. Inorder to limit the economy’s exposure to the risk of sectorspecific shocks, it would appear unwise for industrial policy tofocus exclusively on attempting to shift resources into high value-added sectors. Instead the emphasis should be on improving theproductivity performance of all sectors of the economy, while atthe same time facilitating structural changes that are taking place.
A shift-share analysis of US and EU productivity growth rates overthe past twenty years provides useful insight into how aggregateproductivity growth can be decomposed into within-industryeffects (i.e. changes in the productivity growth rates of individualsectors) and structural change effects (i.e. changes in productivitygrowth arising from sectoral reallocations). EU Commissionanalysis shows that during this period the bulk of productivitygrowth has come from within-industry effects, accounting forbetween 80-95 per cent of aggregate productivity growth in thecase of the EU and from 100-120 per cent of the change in theUS.18 In other words, the shifting of resources between sectorsin the US has actually had a negative impact on aggregateproductivity growth — since workers have on average beenmoving into lower productivity service sectors. Despite this,productivity growth has been stronger in the US than in the EUsince the mid-1990s. This reflects stronger productivity growth inthe US within certain industries, particularly the ICT-producingsectors and ICT-using service sectors including wholesale andretail trade and financial intermediation. This again highlights theneed for policy settings and institutional structures that not onlyfacilitate the transfer of resources towards more productivesectors but also support productivity growth across all sectors,including the more traditional manufacturing sectors and thenon-traded service sectors.
3.3 Summary
In summary, aggregate productivity growth in Ireland has beenquite strong over the past 40 years, particularly during thesecond half of the 1990s. Since 1960, GNP per person employedhas increased at around 23⁄4 per cent per annum, around three
17 For an overview of sectoral specialisation in Irish manufacturing see the Central BankAutumn Bulletin 2003, Box A.
18 EU Commission (2003) pp. 75-77.

Quarterly Bulletin Spring 2004
96
quarters of a percentage point less than growth in GDP perperson employed. Since 1996, GNP per person employed hasincreased at an annual rate of around 21⁄2 per cent. While thismight seem relatively low in the context of GNP growth ofalmost 7 per cent over the same period, it has been noted thatunderlying labour productivity growth, measured as GNP perhour worked, was around 33⁄4 per cent which was very high byinternational standards. While the level of Irish GDP per workeris now second only to Luxembourg in the European Union, GNPper worker is roughly equal to the EU average. However, thismeans that productivity levels, measured as GNP per hourworked, are still somewhat below the EU average because of thehigher average hours worked per employee in Ireland. Thiswould suggest that there is still scope for Irish productivity levelsto improve relative not only to the US but also relative to someof the higher productivity EU countries.
Sectoral trends indicate that aggregate productivity growthduring the 1990s was mainly driven by the performance of thehigh-technology manufacturing sectors. A number of reasonswhy these trends ought to be interpreted with caution werenoted, including difficulties associated with the measurement ofoutput and labour input in the services sectors and difficultiesin interpreting the very high productivity levels in some foreign-dominated high technology sectors. Notwithstanding theseconsiderations, it seems clear that the very high aggregateproductivity levels and growth rates in manufacturing concealconsiderable divergence across sub-sectors of manufacturing.Most importantly, it is evident that many traditional, labourintensive sectors have not enjoyed the same high productivitygrowth rates in recent years. This has implications for thecompetitiveness of many of these sectors given that many ofthem have been associated with high rates of wage inflationsince the mid 1990s. This underlines the importance of focussingon the productivity performance of all sectors of the economy inthe years ahead, as well as ensuring that economic structuresfacilitate sectoral reallocations into expanding sectors.
Section 4. Productivity Issues for the IrishEconomy
A number of factors explain Ireland’s strong productivityperformance over the past forty years and also the accelerationin productivity growth during the second half of the 1990s.Physical capital, technology transfer and productivity have beenboosted by high-tech foreign direct investment inflows from theUS, sectoral shifts in industry towards high-technology sectors,investment in human capital and infrastructural improvements.Productivity growth has been facilitated in more recent years bymacroeconomic stability, including fiscal stabilisation, increasedEuropean integration and structural reform of product, labourand capital markets.

Quarterly Bulletin Spring 2004
97
The recent slowdown in labour productivity growth was largely aconsequence of cyclical (demand-side) considerations. However,even if and when the economy recovers, it is unlikely that labourproductivity growth can recover to the very high rates of thelate 1990s. Experience from other countries suggests that theadditional impact of new foreign direct investment eventuallybegins to decline. Moreover, as the economy develops andconsumer incomes increase, the composition of Irish output islikely to show a shift from manufacturing to lower-productivityservice sectors.
Notwithstanding these considerations, the prospects for futureproductivity growth remain reasonably favourable. This sectionexamines these prospects in the context of the underlyingframework conditions for strong productivity growth identified inSection 2.
Macroeconomic Conditions
The European Central Bank’s commitment to low inflation andthe fiscal requirements of the Stability and Growth Pact providea framework for macroeconomic stability in the euro area. TheIrish experience of recent years, however, shows that inflationdifferentials can persist for a period within a monetary union.Moreover, individual countries within EMU are still vulnerable tocountry specific shocks or can be affected in different ways bysymmetric euro area shocks, which cannot be addressed by thesingle monetary policy. In this case, economic stability requiresappropriate national non-monetary policy measures to deal withsuch shocks. This is particularly relevant for the Irish economy fortwo reasons. First, Ireland still has a high share of its trade withnon-euro area countries, which makes the economy moreexposed to exchange rate volatility, particularly against sterling.Any decision in the future by the UK to join EMU wouldobviously reduce the potential economic dislocation from thissource. Second, the Irish economy is the least diversified in theeuro area, with a particular concentration in some volatile high-technology sectors, which increases the likelihood of sectoralshocks having potentially widespread macroeconomic effects.
On a more positive note, there appears to have been someconvergence towards more common business cyclecharacteristics across euro area countries, including Ireland, inrecent years. This is beneficial because it enhances theeffectiveness and appropriateness of a single (euro area)monetary policy. At a national level, adjustment to country-specific shocks can also involve counter-cyclical demandmeasures through implementation of fiscal policy. In order to bein a position to stabilise output through fiscal expansion duringan economic slowdown, while adhering to the terms of theStability and Growth Pact, it is necessary that appropriate fiscalpolicy be implemented during periods of strong economic

Quarterly Bulletin Spring 2004
98
expansion (i.e. slightly restrictive policy) so that the budgetbalances on average over the business cycle.
Turning to the microeconomics of budgetary policy, the size andcomposition of government expenditure and taxation can alsohave an effect on economic growth. Ireland has a relatively lowlevel of tax incidence and government expenditure, as apercentage of GDP, compared with the EU average. The Irisheconomy also performs well in terms of the composition of taxrevenues with a very low corporation tax rate, now standardisedat 12.5 per cent across all sectors, and a reasonably low incometax rate by international standards. Low direct taxes of this typecan have a positive incentive effect on labour supply, enterpriseand innovation. The composition of public expenditure can alsoimpact on productivity growth. Strong public capital investmentduring the late 1990s went some way towards redressing theinadequacies in the economy’s physical infrastructure which hadbecome evident during the ‘Celtic Tiger’ years. Over the pasttwo years, the balance of public expenditure growth has shiftedsomewhat from capital to current spending, as a means offinancing, first, higher employment and, more recently, higherwages including benchmarking in the public sector. Given theinfrastructure deficit that still exists, it would appear as if a gradualshift in the balance back towards capital expenditure and otherproductive expenditure, with due consideration to the qualityand value of public investment and the need to adhere to theterms of the Stability and Growth pact, could provide a boost toproductivity growth in the medium term. This is likely to behelped by the recent relaxation of EU rules on private sectorinvestment in Government projects.
Regulation
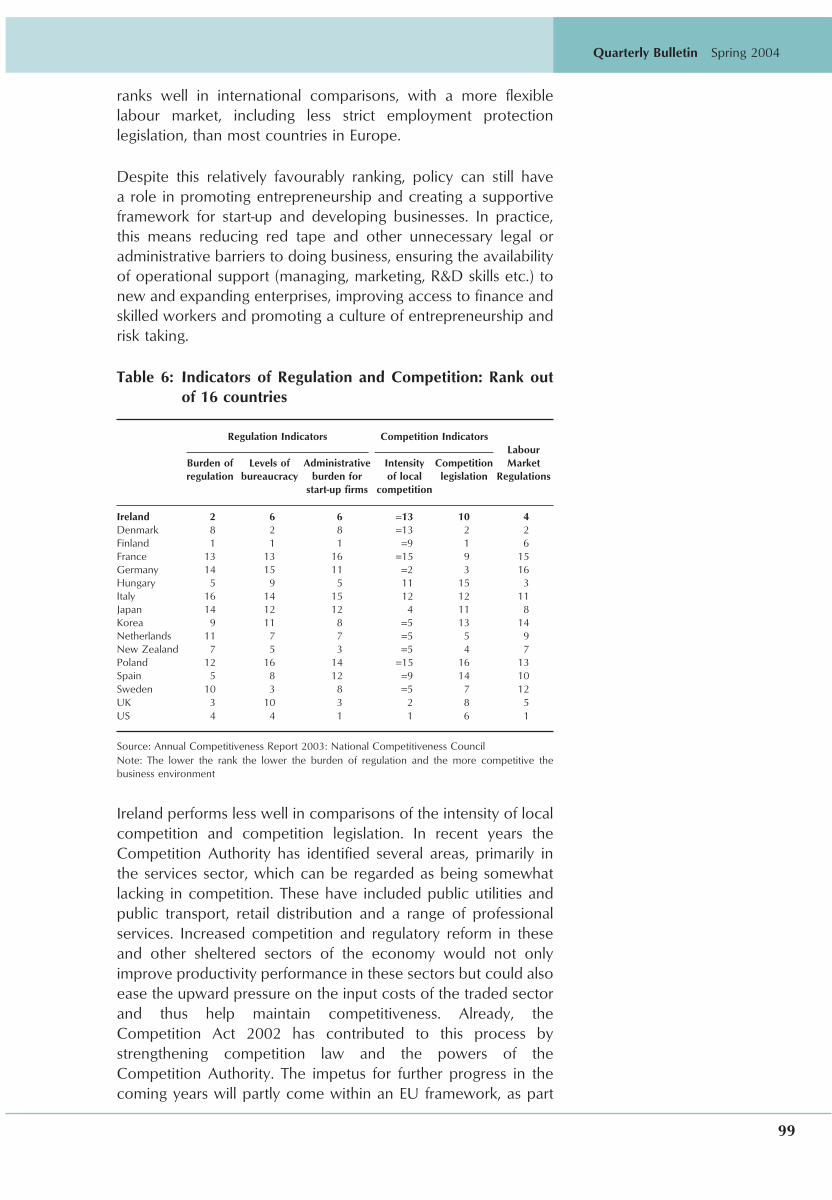
Well-functioning product and labour markets are important inproviding the degree of wage and price flexibility that is requiredto ensure macroeconomic stability. Flexible markets also have adirect impact upon productivity growth, as was noted in Section2. Ireland is one of the less regulated countries in the OECDwith a regulatory environment that is reasonably favourable toenterprise, in terms of barriers to entry, market openness, profittax rates and the flexibility of the labour market. In its AnnualCompetitiveness Report (2003), the National CompetitivenessCouncil published a range of comparative competitivenessindicators, compiled from a variety of sources including theWorld Economic Forum, the IMD World CompetitivenessYearbook and Forfas/OECD Science and Technology indicators.Some of these are reproduced in Table 6, ranked out of 16countries, where the lower the ranking the lower the burden ofregulation and the more competitive the business environment.Ireland performs quite well in terms of the regulatory burden,levels of bureaucracy and the administrative burden on start-upenterprises. In terms of labour market regulation, Ireland also
Quarterly Bulletin Spring 2004
99
ranks well in international comparisons, with a more flexiblelabour market, including less strict employment protectionlegislation, than most countries in Europe.
Despite this relatively favourably ranking, policy can still havea role in promoting entrepreneurship and creating a supportiveframework for start-up and developing businesses. In practice,this means reducing red tape and other unnecessary legal oradministrative barriers to doing business, ensuring the availabilityof operational support (managing, marketing, R&D skills etc.) tonew and expanding enterprises, improving access to finance andskilled workers and promoting a culture of entrepreneurship andrisk taking.
Table 6: Indicators of Regulation and Competition: Rank outof 16 countries
Regulation Indicators Competition IndicatorsLabour
Burden of Levels of Administrative Intensity Competition Marketregulation bureaucracy burden for of local legislation Regulations
start-up firms competition
Ireland 2 6 6 =13 10 4Denmark 8 2 8 =13 2 2Finland 1 1 1 =9 1 6France 13 13 16 =15 9 15Germany 14 15 11 =2 3 16Hungary 5 9 5 11 15 3Italy 16 14 15 12 12 11Japan 14 12 12 4 11 8Korea 9 11 8 =5 13 14Netherlands 11 7 7 =5 5 9New Zealand 7 5 3 =5 4 7Poland 12 16 14 =15 16 13Spain 5 8 12 =9 14 10Sweden 10 3 8 =5 7 12UK 3 10 3 2 8 5US 4 4 1 1 6 1
Source: Annual Competitiveness Report 2003: National Competitiveness CouncilNote: The lower the rank the lower the burden of regulation and the more competitive thebusiness environment
Ireland performs less well in comparisons of the intensity of localcompetition and competition legislation. In recent years theCompetition Authority has identified several areas, primarily inthe services sector, which can be regarded as being somewhatlacking in competition. These have included public utilities andpublic transport, retail distribution and a range of professionalservices. Increased competition and regulatory reform in theseand other sheltered sectors of the economy would not onlyimprove productivity performance in these sectors but could alsoease the upward pressure on the input costs of the traded sectorand thus help maintain competitiveness. Already, theCompetition Act 2002 has contributed to this process bystrengthening competition law and the powers of theCompetition Authority. The impetus for further progress in thecoming years will partly come within an EU framework, as part

Quarterly Bulletin Spring 2004
100
of the Lisbon Agenda. However, the speed of progress and theextent of the application of policy will largely be determined ata national level and, consequently, domestic policy action canhave a role in ensuring more effective competition in previouslysheltered sectors of the economy.
Financial Markets/Access to Risk Capital
Greater competition in the financial sector can increase accessto and reduce the cost of finance for business. In recent yearsthe Competition Authority has been engaged in a study ofcompetition in the banking sector in Ireland, including the marketfor loans to small and medium enterprises. As noted in Section2, there is also a need for alternative forms of financing for newbusinesses, apart from banks, including seed, venture and equitycapital. In this respect policy can have a role in promotinginvestments in risky or innovative projects. In Ireland, theBusiness Expansion Scheme and the associated Seed CapitalScheme give fiscal incentives to investors in new and expandingbusinesses; in Budget 2004 both schemes were extended untilend-2006. However, survey evidence suggests that Irishentrepreneurs still find it difficult to obtain adequate funding,particularly seed capital (Global Entrepreneurship Monitor 2002).
The supply of venture capital in Ireland increased substantiallyduring the late 1990s under the EU Seed and Venture CapitalProgramme 1994-1999. However, the capital raised wasprimarily for projects based in Dublin and also primarily insoftware related projects. An important element of the Seed andVenture Capital Programme 2000-2006 will be to reduce anyregional or sectoral imbalances in the raising of venture capitaland also to target funds towards small and medium sizedenterprises at their early stage of development.19 This isparticularly important in the current entrepreneurial climate sincenew businesses often have to compete on international marketsat an early stage of their development. The new programme isalso being implemented in a very difficult environment since,internationally, venture and seed capital is in short supply,following the downturn in the ICT sector and the slowdown ingrowth across most developed countries from 2001. Thisunderlines the importance of setting the appropriate policyframework to support start-up businesses and also thedevelopment of businesses during periods of expansion.
Education and Human Capital
As the importance of innovation and technological progress hasincreased, so too has the premium on higher education. The Irisheconomy performs well in this regard with a high share of itspopulation having completed higher education. Indeed, OECDdata indicate that the share of the population that has completed
19 Enterprise Ireland: Seed and Venture Capital Programme 2000-2006.

Quarterly Bulletin Spring 2004
101
third-level education is the highest in the EU and not far belowthe share in the US (Table 7). Ireland also ranks well in terms ofscience and engineering graduates; a recent EuropeanCommission report placed Ireland highest in terms of the numberper thousand of population, among 12 countries including theUS, UK and the larger European countries. Given the importanceof innovation and R&D, there are also benefits to be derivedfrom ensuring close linkages between the business sector,research institutes and the third level education system.
On the other hand, Ireland also has a relatively high share ofits population that has not completed secondary education. Thissuggests a potential role for policy in reducing the number ofstudents leaving school before finishing secondary education,particularly in economically disadvantaged areas, and also in there-training of workers who have already left school early and donot have skills that are in demand in the workplace. Fiscalincentives and a more flexible third level system might have apositive effect in terms of encouraging workers to improve theirskills through part time education. The National CompetitivenessCouncil has also identified science, mathematics, modernlanguages and ICT as subjects that are particularly relevant in thecurrent enterprise environment and which should, therefore, bepromoted in primary and secondary school curricula. All levelsof the education system can also play a role in fostering a cultureof entrepreneurship and supporting potential entrepreneurs.
Table 7: Educational Attainment of the Population aged 25-64years (%) 2000
Below upper Upper secondary Tertiarysecondary and
post-secondary
Austria 24.3 61.8 13.9Belgium 41.5 31.4 27.1Denmark 19.8 53.7 26.5Finland 26.2 41.5 32.3France 36.1 40.6 23.0Germany 17.4 59.4 23.2Greece 48.6 33.6 17.8Ireland 42.4 22.0 35.6Italy 56.7 33.2 10.0Luxembourg 47.3 34.6 18.1Netherlands 45.0 32.0 22.2Portugal 80.1 10.8 9.0Spain 59.7 16.2 23.6Sweden 19.4 49.0 31.6United Kingdom 37.1 36.9 26.1EU-15 38.9 37.3 23.8USA 12.3 50.3 37.3
Source: OECD, ‘‘Education at a Glance’’, as referenced in Sapir Report (2003) p31.
Innovation/Research and Development
As an economy matures, the extra benefits from macroeconomicand structural reforms can diminish and innovation andtechnological change become increasingly important as a
Quarterly Bulletin Spring 2004
102
determinant of productivity growth. While the Irish economyalready has a relatively skilled and well-educated work force anda high concentration of output and employment in high-technology sectors, available evidence suggests that the amountof innovative activity carried out in this country is relatively low.In the past the economy has benefited through internationaltechnology transfers from, in particular, the US which is the mainsource of foreign direct investment into Ireland. While theeconomy will continue to benefit in this way, domesticinnovation and diffusion of new technologies will also becomemore important.
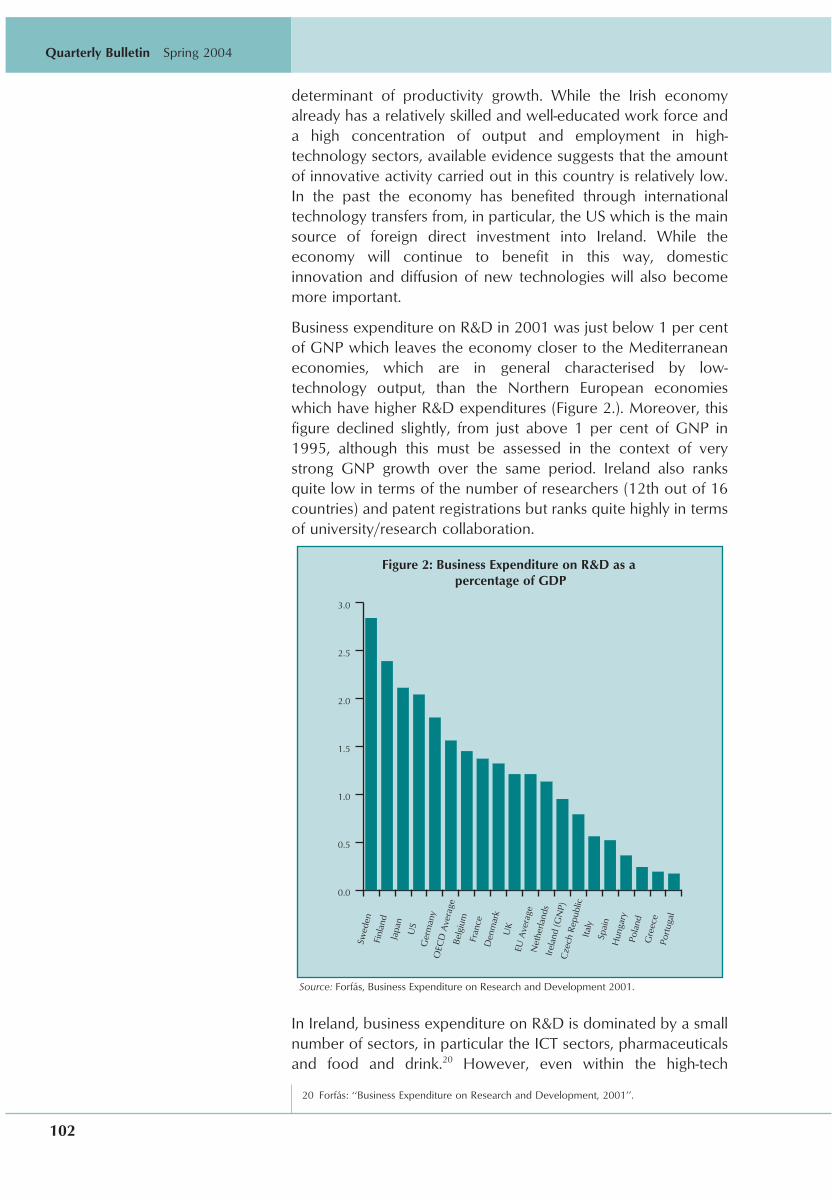
Business expenditure on R&D in 2001 was just below 1 per centof GNP which leaves the economy closer to the Mediterraneaneconomies, which are in general characterised by low-technology output, than the Northern European economieswhich have higher R&D expenditures (Figure 2.). Moreover, thisfigure declined slightly, from just above 1 per cent of GNP in1995, although this must be assessed in the context of verystrong GNP growth over the same period. Ireland also ranksquite low in terms of the number of researchers (12th out of 16countries) and patent registrations but ranks quite highly in termsof university/research collaboration.
0.0
0.5
1.0
1.5
2.0
2.5
3.0
Port
ugal
Gre
ece
Pola
nd
Hun
gary
Spai
n
Italy
Cze
ch R
epub
lic
Irel
and
(GN
P)
Net
herla
nds
EU A
vera
ge
UK
Den
mar
k
Fran
ce
Belg
ium
OEC
D A
vera
ge
Ger
man
y
US
Japa
n
Finl
and
Swed
en
Figure 2: Business Expenditure on R&D as a percentage of GDP
Source: Forfás, Business Expenditure on Research and Development 2001.
In Ireland, business expenditure on R&D is dominated by a smallnumber of sectors, in particular the ICT sectors, pharmaceuticalsand food and drink.20 However, even within the high-tech
20 Forfas: ‘‘Business Expenditure on Research and Development, 2001’’.

Quarterly Bulletin Spring 2004
103
sectors, R&D intensity is low by international standards whichsuggests that foreign multinationals do not carry out a significantshare of their R&D activity in Ireland. Despite this, foreign ownedenterprises accounted for 65 per cent of business R&D in 2001.This clearly indicates a low R&D intensity for indigenous firms. Ina recent survey of Irish firms, lack of financing and relatively highinnovation costs were ranked as the greatest barriers toinnovation in both manufacturing and services sectors.21
Innovation is not necessarily wholly dependent upon domesticR&D activities in small open economies which are not quite atthe technological frontier. Such economies can also benefit frominternational spillovers and technology transfers, and animportant channel for this is the presence of high-technology, R&D intensive multinational firms.22 However, productivity growthin countries close to the technology frontier is largely driven bytheir capacity to innovate. As technology levels in Irelandimprove, innovation rather than imitation will assume a greaterrole in ensuring faster productivity growth rates which underlinesthe importance of increasing domestic R&D activity. It is nowgenerally accepted that policy can have an important role insupporting R&D activity. Tax credits have been introduced inmany countries as a fiscal incentive preferable to direct grants.23
In Budget 2004, a tax credit for incremental R&D expenditure,above a baseline of \50,000, was announced, which wasgenerally well received by the business community. However,such is the importance of innovation and technology in themodern enterprise environment that efforts to create anenvironment that encourages enterprise, risk taking andproductive R&D activity ought to be intensified.
Section 5. Concluding RemarksAs the Irish economy develops, traditional factors behind stronggrowth will remain important. In particular, these include theefficient utilisation of labour and capital in order to keep theeconomy operating at close to its potential.
In the longer term, however, the key to economic growth will beproductivity. Aggregate productivity growth depends upon theproductivity of individual firms in the economy which, in the longrun, is largely beyond the direct control of policy makers. Froma policy perspective, the key is to ensure institutional structuresand policy settings that are supportive of investment,entrepreneurship and risk taking, innovation and efficientworking and managerial practices. Five important considerationswere discussed in this paper, namely: sound macroeconomic
21 Community Innovation Survey (2000).22 See, for example, World Economic Forum (2003).23 Among the advantages of tax credits over direct grants are that they require less
administration, they reward success because only profitable companies can use the credit,they are less liable to capture by lobbying on behalf of special interests and they do notrely on bureaucrats to pick winners (Sapir Report, 2003, p.33.)

Quarterly Bulletin Spring 2004
104
fundamentals, a regulatory environment favourable to businessand entrepreneurship, good access to risk capital, educationalattainment of the workforce and conditions favourable to R&Dactivity. More specific measures for the Irish economy, relatingto these priorities, include:
• Maintaining a prudent fiscal stance in order to limit theeconomy’s vulnerability to asymmetric shocks and, moregenerally, to maintain macroeconomic stability;
• Improving the quantity and quality of public investmentin the economic infrastructure, including roads, publictransportation, telecommunications and energy;
• Increasing standards of competition in certain non-tradedsectors of the economy;
• Improving the skills base of the economy through acommitment to increase participation in formaleducation and encourage lifelong learning among theworkforce;
• Other measures to promote enterprise includingfostering a culture supportive of entrepreneurship andrisk taking, reducing red tape and other administrativeand regulatory barriers to doing business and ensuringthe availability of operational support and finance to newand developing enterprises;
• Ensuring an environment favourable to R&D activity. Thismight include increased incentives for R&D activity,creating an environment supportive of innovation andrisk taking, promoting research collaborations betweenindustry and third level institutions and measures aimedat increasing the effectiveness and productivity of R&D.
ReferencesAhmad, N., F. Lequiller, P. Marianna, D. Pilat, P. Schreyer and A.
Wolfl (2003), ‘‘Comparing Labour Productivity Growth in theOECD Area: The Role of Measurement’’, OECD StatisticsWorking Paper 2003/5, Paris: December 2003.
Bassanini, A. and E. Ernst, (2002), ‘‘Labour Market Institutions,Product Market Regulation and Innovation: Cross CountryEvidence’’, OECD Economics Department Working Paper No.316, Paris: January 2002.
Enterprise Ireland (2003), ‘‘Seed and Venture Capital Programme2000-2006: 2002 Report’’, Dublin.
EU Commission (2003), ‘‘Drivers of Productivity Growth: AnEconomy-Wide and Industry Level Perspective’’, in The EUEconomy 2003 Review, Brussels: November 2003 pp 63-118.

Quarterly Bulletin Spring 2004
105
Forfas (2003), ‘‘Business Expenditure on Research andDevelopment, 2001’’, Dublin: September 2003.
Global Entrepreneurship Monitor (2002), ‘‘The Irish Report: HowEntrepreneurial is Ireland?’’ prepared by P. Fitzsimons, C.O’Gorman and F. Roche, Dublin: Department of BusinessAdministration, University College Dublin.
Honohan P., B Maιtre, and C Conroy, (1998), ‘‘Invisible EntrepotActivity in Irish Manufacturing’’, Irish Banking Review, Dublin:Summer 1998.
National Competitiveness Council (2003), ‘‘AnnualCompetitiveness Report 2003’’, Dublin: November 2003.
Nicoletti, G., A. Bassanini, E. Ernst, S. Jean, P. Santiago and P.Swaim, (2001), ‘‘Product and Labour Market Interactions inOECD Countries’’, OECD Economics Department WorkingPaper No. 38, Paris: December 2001.
OECD, (2003), The Sources of Economic Growth in OECDCountries, Paris.
Salgado, R. (2002), ‘‘Impact of Structural Reforms on ProductivityGrowth in Industrial Countries’’, IMF Working Paper 02/10,Washington: January 2002.
The Sapir Report, (2003), ‘‘An Agenda for a Growing Europe:Making the EU Economic System Deliver’’, Brussels: July 2003.
Scarpetta, T. and T. Tressel, (2002), ‘‘Productivity andConvergence in a Panel of OECD Industries: Do Regulationsand Institutions Matter?’’ OECD Economics DepartmentWorking Paper No. 342, Paris: September 2002.
Wolfl, A. (2003), ‘‘Productivity Growth in Service Industries: AnAssessment of Recent Patterns and the Role of Measurement’’,OECD Economic Analysis and Statistics Division, WorkingPaper 2003/7, Paris.
World Economic Forum (2004) ‘‘Global Competitiveness Report2003-2004’’, Oxford University Press: January 2004.
