prof. javier gozálvez sempere - umhdspace.umh.es/bitstream/11000/1895/1/td baldomero coll...
TRANSCRIPT

Universidad Miguel Hernández de Elche
Departamento de Ciencia de Materiales, Óptica y Tecnología Electrónica
Mobile Relaying and Opportunistic
Networking in Multi‐Hop
Cellular Networks
Baldomero Coll‐Perales
Director: Prof. Javier Gozálvez Sempere
Thesis for the degree of PhD
July 2015


Dª PIEDAD NIEVES DE AZA MOYA, Directora del Departamento de Ciencia de
Materiales, Óptica y Tecnología Electrónica de la Universidad Miguel Hernández
de Elche,
INFORMA
que la Tesis Doctoral titulada “Mobile Relaying and Opportunistic Networking in
Multi‐Hop Cellular Networks”, ha sido realizada por Don Baldomero Coll‐Perales,
Ingeniero de Telecomunicación, bajo la inmediata dirección y supervisión del Dr.
Javier Gozálvez Sempere, y da su conformidad para que sea presentada ante la
Comisión de Doctorado.
Para que conste y surta los efectos oportunos, firma el presente informe en
Elche, a de de 2015.
Fdo. Dª Piedad Nieves de Aza Moya
Directora del Departamento de Ciencia de Materiales, Óptica y Tecnología
Electrónica
Departamento de Ciencia de Materiales, Óptica y Tecnología Electrónica
Universidad Miguel Hernández de Elche
Campus de Elche – Edificio Torrevaillo
Avda. Universidad, s/n‐ 03202, Elche (Alicante), ESPAÑA
Tel.: +34 96 665 8498 Fax: +34 96 665 8497
E‐mail: [email protected]


JAVIER GOZÁLVEZ SEMPERE, Doctor Ingeniero, y Profesor Titular de Universidad
por el Área de Teoría de la Señal y Comunicaciones de la Universidad Miguel
Hernández de Elche,
HACE CONSTAR
que el presente trabajo, titulado “Mobile Relaying and Opportunistic Networking
in Multi‐Hop Cellular Networks”, ha sido realizado bajo mi dirección y recoge
fielmente la labor realizada por Don Baldomero Coll‐Perales, Ingeniero de
Telecomunicación, para optar al grado de Doctor. Las investigaciones reflejadas
en la Tesis se han desarrollado en el Laboratorio UWICORE del Departamento de
Ingeniería de Comunicaciones de la Universidad Miguel Hernández de Elche.
El que suscribe considera que el trabajo reúne las condiciones de originalidad y
rigor metodológico necesario para memoria de Tesis Doctoral, y de este modo
puede ser presentado a la lectura y discusión ante tribunal en la Universidad
Miguel Hernández de Elche. Y para que así conste, firma el presente certificado.
Elche, a de de 2015.
Fdo. Javier Gozálvez Sempere


vii
This work was supported in part by the Spanish Ministry of Economy and
Competitiveness and FEDER funds under the project TEC2011‐26109, the Spanish
Ministry of Science and Innovation under the project TEC2008‐06728, and the
Generalitat Valenciana under research grants ACIF/2010/161 and BEFPI/2012/065.

ix
Abstract
Cellular systems have significantly evolved over the past decades through the
introduction of novel radio access technologies designed to increase capacity and
support higher data rates. The evolution has mainly focused around the traditional cell‐
centric approach where each mobile station directly communicates with the base
station. Traditional cellular communications experience difficulties in providing high and
homogeneous Quality of Service (QoS) levels throughout the cell (in particular at cell
edges) due to the signal attenuation produced by obstacles and distance. In this context,
a paradigm‐shift is sought for the design of future mobile communications systems (5G
networks) that will be required to efficiently support varying QoS and Quality of
Experience (QoE) requirements of the exponentially increasing mobile data traffic. This
thesis advocates for the need to explore and evolve from current cell‐centric
architectures to device‐centric architectures which exploit the intelligence,
communications and computing resources of smart mobile devices. One approach to do
so is by exploiting Device‐to‐Device (D2D) communications and Multi‐hop Cellular
Networks (MCNs). In device‐centric MCNs, smart mobile devices become prosumers of
wireless connectivity and act as a bridge between the cellular infrastructure and other
devices. Previous studies have demonstrated that MCNs can significantly improve the
capacity and energy consumption, and provide higher and more homogeneous QoS and
QoE levels. However, to date, most of these studies have remained analytical or
simulation‐based and hence there is the need to experimentally demonstrate the
benefits of MCN technologies. In this context, one first and significant contribution of
this thesis is the experimental evaluation of the performance of MCN through field tests
using commercial live cellular networks. The conducted field tests are aimed at
validating and quantifying the benefits that MCNs using mobile relays can provide over
traditional cellular systems. To this aim, a unique hardware testbed has been designed
and implemented together with the necessary software tools to monitor the operation,
QoS and benefits of MCNs, and investigate the conditions under which such benefits can

Abstract
x
be obtained. Using the data obtained from the field test measurements, the thesis then
proposes a unique set of empirical models that characterize the communications
performance of MCNs, and that can help design, test and optimize communications and
networking protocols tailored for MCNs in analytical and simulation‐based studies.
Complementary to these studies, this thesis proposes to improve the transmission
efficiency of delay‐tolerant data traffic by integrating opportunistic networking
principles into MCNs. Opportunistic networking can exploit the delay tolerance
characteristic of relevant data traffic services in order to search for the most efficient
transmission conditions in MCNs. In this context, this thesis first derives an analytical
framework for opportunistic MCNs designed to identify their optimum configuration in
terms of energy efficiency. Using this reference configuration, this thesis then proposes
a set of opportunistic forwarding policies that exploit context information provided by
the cellular network, and that demonstrate their potential to significantly contribute
towards achieving the capacity and energy‐efficiency gains sought for 5G networks.

xi
Resumen
Los sistemas de comunicaciones móviles han experimentado una notable evolución
en las últimas décadas con la aparición de nuevas tecnologías de acceso radio diseñadas
para incrementar la capacidad del sistema y soportar mayores tasas de transmisión. Esta
evolución se ha centrado principalmente en el marco del concepto tradicional de
arquitectura celular centrada en infraestructura en la que cada estación móvil comunica
directamente con la estación base. Las comunicaciones celulares tradicionales
experimentan dificultades para proveer niveles de calidad de servicio (Quality of Service,
QoS) elevados y homogéneos en toda la celda (en particular en los límites de la celda)
debido a la atenuación que sufre la señal con la distancia y la presencia de obstáculos.
En este contexto, un cambio en el paradigma es perseguido en el diseño de los futuros
sistemas de comunicaciones móviles (los sistemas 5G) que deberán soportar de una
manera eficiente los diversos requisitos de QoS y calidad de experiencia (Quality of
Experience, QoE) del tráfico de datos de las redes móviles que crece a tasas
exponenciales. Esta tesis defiende la necesidad de explorar y evolucionar desde las
actuales arquitecturas celulares centradas en la infraestructura a tecnologías
inalámbricas centradas en los dispositivos que sacan provecho de la inteligencia, y los
recursos de comunicación y computación de los dispositivos móviles inteligentes. Una
forma de conseguir estos objetivos es explotando las comunicaciones dispositivo a
dispositivo (Device‐to‐Device, D2D) y las redes celulares multi‐salto (Multi‐hop Cellular
Networks, MCNs). En las redes MCNs, los dispositivos móviles pasan a ser
productores/consumidores de conectividad inalámbrica actuando como pasarela entre
la infraestructura celular y otros dispositivos. Estudios anteriores han demostrado el
potencial de las redes MCNs para conseguir importantes beneficios de capacidad y
eficiencia energética, a la vez que proveen de mayores y más homogéneos niveles de
QoS y QoE. Sin embargo, hasta el momento, las investigaciones realizadas se han
limitado generalmente a estudios analíticos y de simulación, y existe por lo tanto la
necesidad de demostrar los beneficios de las redes MCNs de manera experimental. En
este contexto, una primera y significativa contribución de esta tesis es la evaluación
experimental del rendimiento de las redes MCNs a través de pruebas de campo en redes
Resumen
xii
celulares comerciales. Las pruebas de campo llevadas a cabo persiguen validar y
cuantificar los beneficios que las redes MCNs utilizando retransmisores móviles pueden
proporcionar sobre los sistemas celulares tradicionales. Para ello, esta tesis ha diseñado
e implementado una plataforma hardware con las herramientas software necesarias
para monitorizar la operación y la QoS de los procesos de retransmisión en los enlaces
multi‐salto, y que permite investigar los beneficios de las redes MCNs y las condiciones
en los que estos beneficios pueden obtenerse. Utilizando los datos obtenidos de las
medidas de campo, esta tesis extrae un conjunto único de modelos empíricos que
caracterizan el rendimiento de las comunicaciones MCN, y que pueden ayudar al diseño,
testeo y optimización de protocolos de comunicación y de red para redes MCNs en
estudios analíticos y de simulación. De manera complementaria a estos estudios, esta
tesis propone mejorar la eficiencia en la transmisión del tráfico de datos tolerante a
retardos por medio de la integración de técnicas de red oportunistas en las redes MCNs.
Los mecanismos oportunistas explotan la tolerancia al retardo que caracteriza a alguno
de los servicios de datos más relevantes para buscar las condiciones de transmisión más
eficientes en las redes MCNs. En este contexto, esta tesis desarrolla primero un entorno
analítico para redes MCNs oportunistas diseñado para identificar la configuración
óptima en términos de eficiencia energética. Utilizando esta configuración óptima como
referencia, esta tesis propone entonces un conjunto de mecanismos oportunistas que
explotan información de contexto proporcionada por la red celular y que demuestran su
potencial para contribuir de manera notable a alcanzar los requisitos de capacidad y
eficiencia energética perseguidos en las redes 5G.

xiii
Acknowledgements
With thanks to:
Prof. Javier Gozalvez for supervising this thesis, for his continuous comments and
suggestions that have significantly contributed to the quality of this thesis, for giving me
the opportunity to join the UWICORE laboratory and for passing me on his passion to
research.
UWICORE lab members (current and former) for their help, for their laughs and tears,
for their coffee/lunch/dinner‐breaks, and for doing this period unforgettable.
Prof. Vasilis Friderikos and people at CTR lab in King’s College London for accepting me
in this intense and live visiting period.
Dr. Miguel Sepulcre, Dr. Mari Carmen Lucas, Dr. Alberto Rodriguez‐Mayol, Prof. Joaquín
Sanchez‐Soriano, Dr. Oscar Lázaro, Alejandro Moraleda‐Soler, Juan Ramón Gutierrez‐
Agulló and Jónatan Muñoz Gelde (in addition to Prof. Javier Gozalvez and Prof. Vasilis
Friderikos) for being co‐authors of the publications produced in this thesis.
The Communications Engineering Department at UMH.
My sister and my brother for their continuous support. Thanks also to the rest of my
family and family in law.
YOU for your love, patience and comprehension. Thanks for your differences that
complement my life.
My friends for being always there when I needed them most.
Those who passed away that are the reason why I always try to do my best.
My mother for dedicating her life to doing mine easier.


xv
Contents
ListofPublications...........................................................................................................xix
ListofAcronyms..............................................................................................................xxv
ListofFigures...................................................................................................................xxix
ListofTables...................................................................................................................xxxv
1 Introduction..................................................................................................................1
1.1 ObjectivesandContributions...................................................................................4
1.2 Outline................................................................................................................................6
2 Multi‐hopCellularNetworks................................................................................11
2.1 Cell‐CentricCellularSystems.................................................................................12
2.2 Device‐to‐DeviceCommunications.....................................................................14
2.2.1 LTE‐basedD2Dcommunications............................................................15
2.2.2 IEEE802.11‐basedD2D/Ad‐hocCommunications.........................16
2.3 Multi‐hopCellularNetworks.................................................................................21
2.4 MobileRelayingStandardizationActivities....................................................24
2.5 5GWirelessNetworks..............................................................................................27
2.5.1 ChallengesandRequirements..................................................................28
2.5.2 EnablerTechnologiesfor5G.....................................................................29
2.6 Summary........................................................................................................................31
3 mHOP:ExperimentalMCNTestbed...................................................................33
3.1 Multi‐hopNetworkingPlatforms.........................................................................34
3.2 mHOPResearchTestbed.........................................................................................36
3.2.1 CellularConnectivity....................................................................................37
3.2.2 Ad‐hocD2DConnectivity............................................................................41
3.3 TestbedConfigurationandSet‐Up......................................................................48

Contents
xvi
3.3.1 SynchronizationofmHOPDevices.........................................................48
3.3.2 ConfigurationoftheHybridMN..............................................................48
3.3.3 ConfigurationoftheMobileRelays........................................................50
3.3.4 ConfigurationoftheDestinationMN....................................................51
3.4 SummaryandDiscussion........................................................................................51
4 ExperimentalEvaluationofMulti‐hopCellularNetworks........................53
4.1 TestingConditionsandMetrics............................................................................54
4.1.1 PerformanceMetric......................................................................................55
4.2 ExperimentalMCNPerformanceEvaluation...................................................57
4.2.1 Handover..........................................................................................................57
4.2.2 QoSatLargeDistancestotheServingBS............................................66
4.2.3 CoverageExtension......................................................................................69
4.2.4 IndoorQoS........................................................................................................72
4.2.5 QoSunderNLOSConditions.....................................................................74
4.2.6 EnergyEfficiency...........................................................................................78
4.3 SummaryandDiscussion........................................................................................80
5 EmpiricalModelsoftheMCNCommunicationsPerformance..................81
5.1 ExperimentalConditions.........................................................................................82
5.1.1 TestingEnvironment...................................................................................82
5.1.2 PerformanceMetric......................................................................................83
5.2 Two‐HopMCNCommunications..........................................................................84
5.2.1 FieldTests........................................................................................................84
5.2.2 ModelingFunctions......................................................................................86
5.2.3 Least‐SquaresParametersEstimation.................................................88
5.2.4 LinearProgramming....................................................................................91
5.2.5 Two‐hopMCNPerformanceModelsandValidationTests..........93
5.2.6 D2DLinkLevelModelinginMCNCommunications.......................97
5.3 Three‐HopMCNCommunications....................................................................102
5.3.1 FieldTests......................................................................................................102
5.3.2 Three‐hopMCNPerformanceModels................................................105
5.4 x‐HopMCNCommunications..............................................................................107
5.4.1 Four‐hop and Five‐hop MCN Field Tests and Performance
Models.......................................................................................................................110
5.5 SummaryandDiscussion.....................................................................................112
6 OpportunisticMulti‐hopCellularNetworks................................................113
6.1 OpportunisticNetworkinginMulti‐hopCellularNetworks..................114

Contents
xvii
6.2 DelayTolerantMobileTrafficServices..........................................................115
6.3 OpportunisticForwardinginMulti‐hopCellularNetworks..................118
6.3.1 ProblemFormulation................................................................................119
6.4 OptimumConfigurationofOpportunisticForwardinginMCN............123
6.4.1 EvaluationScenario...................................................................................123
6.4.2 NumericalEvaluation................................................................................126
6.5 Influence of Traffic Characteristics on the Energy Consumption of
OpportunisticMCN.................................................................................................131
6.5.1 MobileVideoTraffic...................................................................................137
6.6 SummaryandDiscussion.....................................................................................139
7 Context‐AwareOpportunisticForwardinginMCN....................................141
7.1 Context‐AwarenessinMCNs..............................................................................142
7.2 Time‐dependentOpportunisticForwarding:DELAY...............................143
7.2.1 UniformDistributionofNodeswithintheCell...............................145
7.2.2 Non‐uniformDistributionofNodeswithintheCell.....................146
7.3 Space‐dependentOpportunisticForwarding:AREA................................148
7.3.1 UniformDistributionofNodeswithintheCell...............................149
7.3.2 Non‐uniformDistributionofNodeswithintheCell.....................150
7.4 PerformanceComparisonoftheDELAYandAREAproposals.............151
7.4.1 WorstCaseConditions..............................................................................151
7.4.2 EnergyEfficiency.........................................................................................159
7.4.3 NetworkCapacity........................................................................................166
7.5 SummaryandDiscussion.....................................................................................168
8 Conclusions..............................................................................................................171
8.1 ExperimentalEvaluationofMulti‐hopCellularNetworks.....................172
8.2 ModelingthePerformanceofMulti‐hopCellularNetworks.................173
8.3 OpportunisticForwardinginMulti‐hopCellularNetworks..................174
8.4 FutureWork..............................................................................................................175
AnnexA. Configuration of Opportunistic Forwarding using HSPA
Technology...............................................................................................................187
a. EvaluationScenario................................................................................................188
b. OptimumConfiguration........................................................................................189
c. Context‐AwareOpportunisticForwardinginMCN...................................194
AnnexB. Configuration of Context‐Aware Opportunistic MCN under
WorstCaseConditions.........................................................................................199

Contents
xviii
a. ConfigurationofDELAY........................................................................................199
b. ConfigurationofAREA...........................................................................................203
Bibliography.....................................................................................................................207

xix
ListofPublications
To date, the work reported in this thesis has produced the following publications.
Publications in international peer‐reviewed journals:
B. Coll‐Perales, J. Gozalvez, O. Lazaro and M. Sepulcre, “Opportunistic
Multihopping for Energy Efficiency: Opportunistic Multihop Cellular Networking
for Energy‐Efficient Provision of Mobile Delay Tolerant Services”, IEEE Vehicular
Technology Magazine, vol. 10, no. 2, pp. 93‐101, Jun. 2015. DOI:
10.1109/MVT.2015.2411414.
B. Coll‐Perales, J. Gozalvez and V. Friderikos, “Energy‐efficient Opportunistic
Forwarding in Multi‐hop Cellular Networks using Device‐to‐Device
Communications”, Wiley Transactions on Emerging Telecommunications
Technologies, published online on Wiley Online Library, Aug. 2014. DOI:
10.1002/ett.2855.
J. Gozalvez and B. Coll‐Perales, “Experimental Evaluation of Multihop Cellular
Networks Using Mobile Relays”, IEEE Communications Magazine, vol. 51, no. 7,
pp. 122‐129, Jul. 2013. DOI: 10.1109/MCOM.2013.6553688.
Publications under review in international peer‐reviewed journals:
B. Coll‐Perales, J. Gozalvez and V. Friderikos, “Context‐Aware Opportunistic
Networking in Multi‐Hop Cellular Networks”, under review.
B. Coll‐Perales, J. Gozalvez and M. Sepulcre, “Empirical Models of the
Communications Performance of Multi‐hop Cellular Networks using D2D”, under
review.

List of Publications
xx
Publications in international conferences with peer‐review process of the full paper:
B. Coll‐Perales, J. Gozalvez and V. Friderikos, “Opportunistic Networking for
Improving the Energy Efficiency of Multi‐hop Cellular Networks”, Proceedings of
the 11th Annual IEEE Consumer Communications & Networking Conference
(CCNC 2014), pp. 569‐574, Las Vegas, Nevada (USA), 10‐13 Jan. 2014. DOI:
10.1109/CCNC.2014.6866628.
B. Coll‐Perales, J. Gozalvez and V. Friderikos, “Store, Carry and Forward for
Energy Efficiency in Multi‐hop Cellular Networks with Mobile Relays”,
Proceedings of the IEEE/IFIP Wireless Days Conference 2013 (WD 2013), pp. 1‐6,
Valencia (Spain), 13‐15 Nov. 2013. DOI: 10.1109/WD.2013.6686490.
B. Coll‐Perales, J. Gozalvez and J. Sánchez‐Soriano, “Empirical Performance
Models for P2P and Two Hops Multi‐hop Cellular Networks with Mobile Relays”,
Proceedings of the 8th ACM Workshop on Performance Monitoring,
Measurements and Evaluation of Heterogeneous Wireless and Wired Networks
(PM2HW2N‐2013), pp. 21‐28, Barcelona (Spain), 3‐8 Nov. 2013. DOI:
10.1145/2512840.2512844.
B. Coll‐Perales, J. Gozalvez and V. Friderikos, “Context‐Based Opportunistic
Forwarding in Multi‐hop Cellular Networks using Mobile Relays”, Proceedings of
the 2nd ACM/IEEE Workshop on High Performance Mobile Opportunistic
Systems (HP‐MOSys 2013), pp. 23‐30, Barcelona (Spain), 3‐8 Nov. 2013. DOI:
10.1145/2507908.2507914.
B. Coll‐Perales and J. Gozalvez, "On the Capability of Multi‐hop Cellular
Networks with Mobile Relays to Improve Handover Performance", Proceedings
of the 8th IEEE International Symposium on Wireless Communication Systems
2011 (ISWCS 2011), pp. 207‐211, Aachen (Germany), 6‐9 Nov. 2011. DOI:
10.1109/ISWCS.2011.6125339.
J. Muñoz, B. Coll‐Perales and J. Gozalvez, "Research Testbed for Field Testing of
Multi‐hop Cellular Networks using Mobile Relays", Proceedings of the 35th IEEE
Conference on Local Computer Networks (LCN), pp. 304‐307, Denver, Colorado
(USA), 11‐14 Oct. 2010. DOI: 10.1109/LCN.2010.5735728.

List of Publications
xxi
Publications in national conferences with peer‐review process of the full paper:
B. Coll‐Perales, J. Gozalvez and O. Lazaro, “Eficiencia Energética a través de
Procesos Oportunistas en Redes Multi‐hop Celular”, Libro de Actas del XXIX
Simpósium Nacional de la Unión Científica Internacional de Radio (URSI), pp. 1‐4,
Valencia (Spain), 3‐5 Sept. 2014.
B. Coll‐Perales, J. Gozalvez and V. Friderikos, "Comunicaciones Oportunistas y
Contextuales para Redes Multi‐hop Celular con Retransmisores Móviles", Libro
de Actas de las XI Jornadas de Ingeniería Telemática (Jitel 2013), pp. 1‐8,
Granada (Spain), 28‐30 Oct. 2013.
Publication selected among the top 4 out of the 80 papers published in the
conference proceedings.
B. Coll‐Perales, J. Gozalvez and V. Friderikos, "Energy Efficiency in Multi‐hop
Cellular Networks with Mobile Relays", Libro de Actas del XXVIII Simpósium
Nacional de la Unión Científica Internacional de Radio (URSI), pp. 1‐4, Santiago
de Compostela (Spain), 11‐13 Sept. 2013.
B. Coll‐Perales and J. Gozalvez, "Modelo Empírico de Comunicaciones Multi‐hop
Celular con Retransmisores Móviles", Libro de Actas del XXVII Simpósium
Nacional de la Unión Científica Internacional de Radio (URSI), pp. 1‐4, Elche
(Spain), 12‐14 Sept. 2012.
B. Coll‐Perales, J. Muñoz and J. Gozalvez, "Plataforma Experimental y Estudio de
la Calidad de Servicio en Redes Multi‐hop Celulares con Retransmisores
Móviles", Libro de Actas del XXV Simpósium Nacional de la Unión Científica
Internacional de Radio (URSI), pp. 1‐4, Bilbao (Spain), 15‐17 Sept. 2010.
Publication selected among the top 5 candidates for the best young scientist
award.
B. Coll‐Perales, J.R. Gutierrez, J. Muñoz, J. Gozalvez, M.A. Marhuenda and A.
Rodriguez, "Plataformas Hardware para el Análisis de Redes Cooperativas Muti‐
hop Cellular Basadas en Retransmisores Móviles", Libro de Actas de las XX
Jornadas de Telecom I+D, pp. 1‐6, Valladolid (Spain), 27‐29 Sept. 2010.
List of Publications
xxii
Related research publications:
B. Coll‐Perales and J. Gozalvez, “Contextual Optimization of Location‐based
Routing Protocols for Multi‐hop Cellular Networks using Mobile Relays”,
Springer Telecommunication Systems, accepted Mar. 2015. DOI:
10.1007/s11235‐015‐0036‐3.
J. Gozalvez, B. Coll‐Perales, A. Rodriguez‐Mayol and M.C. Lucas‐Estañ, "Multi‐
hop Cellular Networks based on Mobile Relays: Capabilities and Enabling
Technologies", IEEE E‐Letter of Multimedia Communications Technical
Committee, vol. 6, no. 3, pp. 45‐49, Mar. 2011.
A. Moraleda‐Soler, B. Coll‐Perales and J. Gozalvez. “Link‐Aware Opportunistic
D2D Communications: Open Source Test‐bed and Experimental Insights into
their Energy, Capacity and QoS Benefits”, Proceedings of the 11th IEEE
International Symposium on Wireless Communication Systems 2014 (ISWCS
2014), pp. 606‐610, Barcelona (Spain), 26‐29 August 2014. DOI:
10.1109/ISWCS.2014.6933425.
M.C. Lucas‐Estañ, J. Gozalvez, B. Coll‐Perales, “Mode Selection for Mobile
Opportunistic Multi‐hop Cellular Networks", Proceedings of the 79th IEEE
Vehicular Technology Conference (VTC2014‐Spring), pp. 1‐5, Seoul (Korea), 18‐21
May 2014. DOI: 10.1109/VTCSpring.2014.7022988.
J.R. Gutierrez‐Agullo, B. Coll‐Perales and J. Gozalvez, "An IEEE 802.11 MAC
Software Defined Radio Implementation for Experimental Wireless
Communications and Networking Research", Proceedings of the 2010 IFIP/IEEE
Wireless Days (WD'10), pp. 1‐5, Venice (Italy), 20‐22 Oct. 2010. DOI:
10.1109/WD.2010.5657724.
A. Moraleda‐Soler, B. Coll‐Perales, J. Gozalvez and O. Lázaro. “Comunicaciones
D2D Oportunistas: Evaluación Experimental del rendimiento en términos de
Energía, Capacidad y QoS”, Libro de Actas del XXIX Simpósium Nacional de la
Unión Científica Internacional de Radio (URSI), pp. 1‐4, Valencia (Spain), 3‐5
Sept. 2014.
List of Publications
xxiii
J.R. Gutierrez‐Agullo, B. Coll‐Perales and J. Gozalvez, "Plataforma Hardware
Reconfigurable para el Estudio de Comunicaciones 802.11 Multi‐hop", Libro de
Actas del XXVII Simpósium Nacional de la Unión Científica Internacional de Radio
(URSI), pp. 1‐4, Elche (Spain), 12‐14 Sept. 2012.
Related education publications:
B. Coll‐Perales, M. Sepulcre and J. Gozalvez, “Monitoring the Performance and
Operation of Cellular Radio Interfaces using Professional Measurement Tools”,
Ed. Universidad Miguel Hernández de Elche, Nov. 2014.
B. Coll‐Perales, M. Sepulcre and J. Gozalvez, “Monitoring and Analysis Tools for
Mobile Communications Laboratory”, Ed. Limencop, S. L., Mar. 2013.
B. Coll‐Perales, M. Sepulcre and J. Gozalvez, “Innovative Mobile Communications
Engineering Teaching Laboratory using Professional Network Testing Tools”,
Proceedings of the 3rd Annual International Conference on Education and New
Learning Technologies (EDULEARN’11), pp. 5531‐5535, Barcelona (Spain), 4‐6
Jul. 2011.
B. Coll‐Perales, M. Sepulcre and J. Gozalvez, "Uso de Herramientas Profesionales
para una Docencia Práctica de Sistemas de Ingeniería de Telecomunicación",
Libro de Actas del XX Congreso Universitario de Innovación Educativa en las
Enseñanzas Técnicas (CUIEET), pp. 1‐7, Las Palmas de Gran Canaria (Spain), 18‐
20 Jul. 2012.


xxv
ListofAcronyms
3GPP 3rd Generation Partnership Project
1G – 5G First Generation – Fifth Generation
5G PPP 5G Infrastructure Public Private Partnership
ACK Acknowledgement
AMC Adaptive Modulation and Coding
AODV Ad‐hoc On‐demand Distance Vector
AP Access Point
ARQ Automatic Repeat Request
ASA Authorized Shared Access
BLER Block Error Rate
BO Back‐Off
BPSK Binary Phase Shift Keying
BS Base Station
C Control plane
CCK Complementary Code Keying
CoMP Coordinated Multipoint Processing
CPICH Common Pilot Channel
CQI Channel Quality Indicator
CSMA/CA Carrier Sense Multiple Access/Collision Avoidance
CTS Clear To Send
CW Contention Window
D‐MN Destination Mobile Node
D2D Device‐to‐Device
DCF Distributed Coordination Function
DIFS DCF Inter‐Frame Space
DL Down Link
DRAM Dynamic Random Access Memory
DSP Digital Signal Processor
DSSS Direct Sequence Spread Spectrum

List of Acronyms
xxvi
DTN Delay/Disruption Tolerant Network
EcNo Energy per chip to Noise ratio
ESCC Enhanced Serving Cell Changed
FDD Frequency Division Duplex
FHSS Frequency Hopping Spread Spectrum
FPGA Field Programmable Gate Array
FTP File Transfer Protocol
GPS Global Positioning System
GPRS General Packet Radio Service
GSM Global System for Mobile communications
H‐MN Hybrid Mobile Node
HetNet Heterogeneous Network
HHO Hard Handover
HO Handover
HSDPA High Speed Downlink Packet Access
HSPA High Speed Packet Access
HSUPA High Speed Uplink Packet Access
HTML HyperText Markup Language
HTTP HyperText Transfer Protocol
IBSS Independent Basic Service Set
IEEE Institute of Electrical and Electronics Engineers
IMT International Mobile Telecommunications
ISM Industrial Scientific and Medical
KPI Key Performance Indicator
LOS Line Of Sight
LSA Licensed Shared Access
LTE Long Term Evolution
LTE‐A Long Term Evolution‐Advanced
MAC Medium Access Control
MANETs Mobile Ad‐hoc Networks
MCN Multi‐hop Cellular Network
MCS Modulation and Coding Scheme
MIMO Multiple‐Input Multiple‐Output
MMR Mobile Multi‐hop Relaying
MMS Multimedia Messaging System
MN Mobile Node
MR Mobile Relay

List of Acronyms
xxvii
MRN Moving/Mobile relay node
MS Mobile Station
NACK Non‐Acknowledgement
NAND Negated AND
NAV Network Allocation Vector
NLOS Non‐Line Of Sight
NTP Network Time Protocol
ODMA Opportunity Driven Multiple Access
OFDM Orthogonal Frequency Division Multiplexing
PCF Point Coordination Function
PDU Packet Data Unit
PER Packet Error Ratio
PHY Physical
PLAID Packet Link Adaptation Information for Downlink
PLAIU Packet Link Adaptation Information for Uplink
PRB Physical Resource Block
ProSe Proximity Service
QAM Quadrature Amplitude Modulation
QoE Quality of Experience
QoS Quality of Service
QPSK Quadrature Phase Shift Keying
RNC Radio Network Controller
RS Relay Station
RSCP Receive Signal Code Power
RSSI Received Signal Strength Indication
RTS Request To Send
RXPC Reception Power Control
SCR Scrambling Code
SDK Software Development Kit
SDN Software Defined Network
SDR Software Defined Radio
SHO Soft Handover
SIFS Short Inter‐Frame Space
SIR Signal to Interference Ratio
SMS Short Message Service
SON Self‐Organized Network
SSID Service Set Identifier
List of Acronyms
xxviii
TBS Transport Block Size
TCP Transmission Control Protocol
TDD Time Division Duplexing
TDMA Time Division Multiple Access
TTI Time Transmission Interval
TTT Time To Trigger
TXPC Transmission Power Control
U User plane
UARFCN UMTS Terrestrial Radio Access Absolute Radio Frequency
UDP User Datagram Protocol
UE User Equipment
UL UpLink
UMTS Universal Mobile Telecommunications System
USB Universal Serial Bus
VANETs Vehicular Ad‐hoc Networks
WAP Wireless Application Protocol
Wi‐Fi Wireless Fidelity
WiMAX Worldwide Interoperability for Microwave Access
xxix
ListofFigures
Figure 2‐1. 3GPP’s use case that describes network‐assisted IEEE 802.11‐based D2D
communications [9]. ............................................................................................ 17
Figure 2‐2. IEEE 802.11 basic medium access mechanism. .............................................. 19
Figure 2‐3. IEEE 802.11 mechanism to indicate positive acknowledgement of a frame.
The figure also illustrates that the SIFS is shorter than the DIFS. ........................ 20
Figure 2‐4. Representation of the hidden‐station problem in IEEE 802.11. ..................... 21
Figure 2‐5. Multi‐hop cellular networks. .......................................................................... 22
Figure 2‐6. ODMA operation [67]. .................................................................................... 25
Figure 2‐7. Mobile relay node scenario for LTE‐Advanced and WiMAX. .......................... 26
Figure 2‐8. Emergency MS relay for IMT‐Advanced [71]. ................................................. 26
Figure 2‐9. 5G as an integrated set of technologies addressing a wide variety of use cases
and requirements [74]. ........................................................................................ 27
Figure 3‐1. mHOP architecture. ........................................................................................ 37
Figure 3‐2. mHOP platform. .............................................................................................. 37
Figure 3‐3. Two examples of the real‐time capabilities of Nemo Handy to monitor the
HSPA performance. .............................................................................................. 38
Figure 3‐4. Example of network parameters monitored by the Nemo Handy application.
.............................................................................................................................. 41
Figure 3‐5. Example of data packets captured using the virtual interface of the wireless
ExpressCard at the destination MN of a two‐hop MCN communication. ........... 45
Figure 3‐6. Example of beacon packets captured using the virtual interface of the
wireless ExpressCard at the destination MN of a two‐hop MCN communication.
.............................................................................................................................. 46
List of Figures
xxx
Figure 3‐7. Example of data packets captured using the built‐in wireless interface at the
hybrid MN of a two‐hop MCN communication. ................................................... 46
Figure 3‐8. Example of data packets captured using the virtual interface of the wireless
ExpressCard at the hybrid MN of a two‐hop MCN communication. .................... 46
Figure 3‐9. Example of GPS information captured at mobile relay nodes. ....................... 47
Figure 3‐10. Example of Nemo Handy views when the mobile terminal is locked to a
specific radio access technology and BS. ............................................................. 49
Figure 4‐1. Cellular performance as a function of the distance to the serving BS. ........... 56
Figure 4‐2. Messages exchanged in the HSDPA‐release 5 handover process. .................. 58
Figure 4‐3. CPICH Ec/NO example. .................................................................................... 61
Figure 4‐4. Handover field testing environment. .............................................................. 62
Figure 4‐5. Measured CQI for the HSDPA cellular link. ..................................................... 64
Figure 4‐6. MS transmission power for the HSDPA cellular link. ...................................... 64
Figure 4‐7. BLER for the HSDPA cellular link. .................................................................... 65
Figure 4‐8. MCN capacity to improve QoS in handover areas. ......................................... 65
Figure 4‐9. QoS at large distances ‐ field testing environment. ........................................ 67
Figure 4‐10. MCN capacity to improve QoS at large distances from the serving BS. ....... 69
Figure 4‐11. Coverage extension – field testing environment. ......................................... 70
Figure 4‐12. MCN capacity to extend the radio coverage. ............................................... 71
Figure 4‐13. Field testing environment for indoor QoS provisioning using MCNs (example
of 4hops‐75m MCN link configuration). ............................................................... 72
Figure 4‐15. MCN capacity to improve indoor QoS levels. ............................................... 74
Figure 4‐14. Cellular carrier RSSI as the user walks inside the shopping center. .............. 74
Figure 4‐16. QoS under NLOS conditions ‐ field testing environment. ............................. 76
Figure 4‐17. A cellular carrier RSSI level experienced by the MS as it walks from LOS to
NLOS conditions with the BS. ............................................................................... 77
Figure 4‐18. MCN capacity to improve NLOS QoS levels. ................................................. 78
Figure 4‐19. Field testing environment for the experimental demonstration of the energy
efficiency benefits of MCNs using mobile relays. ................................................ 79

List of Figures
xxxi
Figure 4‐20. MCN capacity to reduce energy consumption. ............................................ 80
Figure 5‐1. Testing environment for two‐hop MCN communications. ............................. 84
Figure 5‐2. Two‐hop MCN throughput at the mobile DN with HN located 200 (left) and
500 (right) meters away from the BS. .................................................................. 85
Figure 5‐3. LSPE fitting of the two‐hop MCN throughput measured at the mobile DN as it
moves away from the location of the HN under LOS (left) and NLOS (right)
conditions. ............................................................................................................ 89
Figure 5‐4. HSPA throughput. ........................................................................................... 90
Figure 5‐5. Two‐hop MCN throughput measured at the DN as it moves away from the
location of the HN under LOS (a) and NLOS (b) conditions. The measurements
were obtained using a different serving BS as that used for Figure 5‐2. The HN
was located 200 meters away from the BS. The figure also shows the Sig
functions derived using LSPE and min‐mul LP schemes. ...................................... 93
Figure 5‐6. Two‐hop MCN throughput models at the DN with fixed IEEE 802.11g
transmission modes for LOS and NLOS conditions and a transmission power of
19 dBm. The figure shows for each configuration the fitting parameters and the
average residue (p1, p2, ⟨e⟩). ............................................................................... 96
Figure 5‐7. IEEE 802.11g data rate. ................................................................................... 98
Figure 5‐8. IEEE 802.11g PER. ......................................................................................... 100
Figure 5‐9. IEEE 802.11g RSSI. ......................................................................................... 101
Figure 5‐10. Testing environment for three‐hop MCN communications. ...................... 102
Figure 5‐11. MCN throughput measured at the IN under a three‐hop MCN configuration,
and considering LOS (a) and NLOS (b) conditions between the HN and IN. The DN
maintains a separation distance of 30 meters under LOS conditions with the IN.
The HN is located 500 meters away from the BS. The figure also shows the three‐
hop MCN throughput model at IN (Section 5.3.2). The throughput is modeled
using the Sig function with the LPSE fitting parameters and residue plotted in the
figures. ................................................................................................................ 103
Figure 5‐12. Three‐hop MCN throughput measured at the DN when the IN‐DN link
experiences LOS (left) and NLOS (right) conditions. The IN remains static and
under LOS conditions with the HN. The HN‐IN distance is 50 (a) or 175 (b)
meters. The HN is located 500 m away from the BS. ......................................... 104
List of Figures
xxxii
Figure 5‐13. Three‐hop MCN throughput models at the DN when the IN‐DN D2D link
experiences LOS and NLOS conditions, and for HN‐IN distances smaller (50 m)
and higher (175 m) than the IN critical distance. The models are derived with IN
static and under LOS conditions with the HN. ................................................... 107
Figure 5‐14. MCN throughput model at the DN under a four‐hop MCN configuration, and
considering LOS and NLOS condition between IN2 and DN. .............................. 111
Figure 5‐15. MCN throughput model at the DN under a five‐hop MCN configuration, and
considering LOS and NLOS conditions between IN3 and DN. ............................. 111
Figure 6‐1. YouTube screenshot ‐ example of delay tolerant traffic. ............................. 116
Figure 6‐2. Two‐hop opportunistic MCN scenario. ......................................................... 119
Figure 6‐3. Transition states of the storage units as a function of the time when the data
is transferred from DRAM to FLASH, and sent back to DRAM [123]. ................ 123
Figure 6‐4. Optimum configuration of two‐hop opportunistic MCN communications: D2D
transmission. ...................................................................................................... 127
Figure 6‐5. Optimum configuration of two‐hop opportunistic MCN communications:
Store and Carry (SC). .......................................................................................... 127
Figure 6‐6. Optimum configuration of two‐hop opportunistic MCN communications:
cellular transmission........................................................................................... 129
Figure 6‐7. Optimum configuration of two‐hop opportunistic MCN communications:
Total energy consumption. ................................................................................ 130
Figure 6‐8. SN distance to the BS from which two‐hop opportunistic MCN
communications are more energy efficient than single‐hop cellular
communications. The distance is depicted as a function of the size of the
message to be transmitted (F) and the traffic‐dependent deadline (T). ........... 132
Figure 6‐9. Total energy consumption as a function of the distance between SN and BS
when F=5 MB and T=150 seconds. ..................................................................... 133
Figure 6‐10. Optimum MR location that minimizes the total energy consumption for
opportunistic MCN communications. The MR location is shown as a function of
the distance between SN and BS and varying service characteristics (F and T). 136
Figure 6‐11. Average energy consumption to transmit a 7.6 MB video file. Video content
fragments of 1 MB, 2 MB, 3 MB and 4 MB (equivalent to 10 s, 20 s, 30 s and 40 s
of playback) are grouped in the case of opportunistic MCN. ............................ 137

List of Figures
xxxiii
Figure 7‐1. A graphical representation of two‐hop opportunistic MCN communications
for the optimum configuration and the DELAY proposal. .................................. 144
Figure 7‐2. Discretization of the truncated Normal distribution into many Poisson
distributions. ...................................................................................................... 148
Figure 7‐3. Two‐hop opportunistic MCN communications for the optimum configuration
and the AREA proposal. ..................................................................................... 149
Figure 7‐4. Comparison of the DELAY and AREA energy consumption (uniform
distribution of nodes within the cell, v=2 m/s, T=60 s, F=10 Mb, μ/R=0.03
MRs/m)............................................................................................................... 153
Figure 7‐5. Total energy consumption (uniform distribution of nodes within the cell, v=2
m/s, T=60 seconds, F=10 Mb, μ/R=0.03 MRs/m). .............................................. 154
Figure 7‐6. Total energy consumption (uniform distribution of nodes within the cell). 155
Figure 7‐7. Total energy consumption (non‐uniform distribution of nodes within the cell,
v=2 m/s, T=60 s, F=10 Mb, μ/R=0.03 MRs/m). .................................................. 156
Figure 7‐8. Total energy consumption (non‐uniform distribution of nodes within the
cell). .................................................................................................................... 158
Figure A.1. Optimum configuration of two‐hop opportunistic MCN communications
using HSPA for the cellular transmission: D2D transmission. ............................ 190
Figure A.2. Optimum configuration of two‐hop opportunistic MCN communications
using HSPA for the cellular transmission: Store and Carry (SC). ........................ 190
Figure A.3. Optimum configuration of 2‐hop opportunistic MCN communications using
HSPA for the cellular transmission: Cellular transmission. ................................ 191
Figure A.4. Total energy consumption (the schemes use HSPA for the cellular
transmission). ..................................................................................................... 192
Figure A.5. Percentage of transmissions established using two‐hop MCN connections as
a function of the distance from SN to the BS (μ/R=0.05 MRs/m, δ=0.9). .......... 197
Figure B.1. Delay time t in the D2D transmission to guarantee the arrival of at least one
MR at the identified optimum MR location with δ equal to 0.8. ....................... 200
Figure B.2. DELAY: Time the MR stores and carries the information towards the BS. ... 201
Figure B.3. DELAY: Time the MR requires to transmit the data to the BS. ..................... 202

List of Figures
xxxiv
Figure B.4. Radius around the optimum MR location to guarantee the presence of at
least one MR within the search area with δ equal to 0.8. ................................. 204
Figure B.5. AREA: Time the MR stores and carries the info towards the BS. .................. 205
Figure B.6. AREA: Time the MR requires to transmit the data to the BS. ....................... 205
xxxv
ListofTables
Table 2‐1. IEEE 802.11g transmission modes. .................................................................. 18
Table 3‐1. Hardware characteristics of the cellular mobile node. .................................... 39
Table 3‐2. Hardware characteristics of mHOP’s mobile relays. ........................................ 42
Table 4‐1. Cellular QoS at three different distances to the BS. ........................................ 68
Table 5‐1. Two‐hop MCN LSPE (p1, p2) as a function of LOS/NLOS conditions and distance
of HN to the Serving BS (in meters). .................................................................... 90
Table 5‐2. Two‐hop MCN LSPE (p1, p2) as a function of LOS/NLOS conditions. ................ 91
Table 5‐3. Two‐hop MCN LP (p1, p2) as a function of LOS/NLOS conditions. .................... 92
Table 5‐4. LSPE and LP Comparison. ................................................................................. 95
Table 5‐5. PER and RSSI (p1, p2) parameters with fixed IEEE 802.11g transmission modes
for LOS and NLOS conditions and transmission power of 19dBm. .................... 101
Table 5‐6. Average processing delay at the intermediate IN node. ............................... 109
Table 6‐1. Evaluation parameters. .................................................................................. 124
Table 6‐2. Average energy reduction (in %) of opportunistic MCN communications
compared to single‐hop cellular communications for different values of T and F=
10 MB. ................................................................................................................ 135
Table 7‐1. Evaluation parameters. .................................................................................. 152
Table 7‐2. Reduction (in percentage) of the total average energy consumption compared
to single‐hop cellular communications. ............................................................. 162
Table 7‐3. Hit rate: percentage of SN‐BS links established using two‐hop opportunistic
MCN communications. ....................................................................................... 164

List of Tables
xxxvi
Table 7‐4. Reduction (in percentage) of the total average energy consumption compared
to single‐hop cellular communications (only two‐hop opportunistic MCN
transmissions). ................................................................................................... 165
Table 7‐5. Capacity gains with respect to single‐hop cellular communications. ............ 167
Table 7‐6. Capacity gains with respect to single‐hop cellular communications (only two‐
hop opportunistic MCN transmissions). ............................................................. 168
Table A.1. Evaluation parameters. .................................................................................. 189
Table A.2. Average energy reduction (in %) compared to single‐hop cellular
communications. The schemes use HSPA for the cellular transmission. ........... 196
Table A.3. Hit Rate: percentage of SN‐BS transmissions established using two‐hop MCN
communications. The schemes use HSPA for the cellular transmission. ........... 197
1
1 Introduction
Cellular networks face significant capacity and energy challenges as a result of the
continuous and exponential growth of cellular data traffic. The widespread adoption of
smartphones and their pervasive use, along with the popularity of mobile video, web
browsing and social networking applications among others, have been the main factors
behind the significant increase in mobile data traffic. These growth levels are predicted
to be maintained in the next decade, and Fifth Generation (5G) networks will be
required to efficiently support them. The estimated growth in mobile data traffic (by a
factor of 500 to 1000) is to a large extent expected to come from a 10 times increase in
broadband mobile subscribers, and 50‐100 times higher traffic per user [1]. Leading
international organizations also expect that 5G networks should support, compared to
current Fourth Generation (4G) networks, 10 to 100 times more connected devices, 10
to 100 times higher user data rates, and 5 times smaller end‐to‐end latency. All this
should be achieved while saving up to 90% of energy per provided service [1]. A relevant
contribution to the exponential growth of cellular data traffic will be the emergence and
widespread adoption of Internet of Things (IoT), Machine‐to‐Machine (M2M) and
connected vehicles applications. These applications have different characteristics and
requirements than traditional cellular applications [2]. Industry and academia agree in
that we have only yet begun the transition into a fully connected, networked society
where everything that can benefit from a wireless connection will be connected [2]. The
vision of the future is a networked society with unconstrained access to information and

Chapter 1. Introduction
2
sharing of data available anywhere and anytime to anyone and anything. In this context,
future wireless networks should be able to handle diverse requirements and
characteristics in an efficient way.
Current expectations and forecasts have launched the race towards the definition
and design of efficient future 5G networks by 2020. Relevant efforts currently focus on
the use of millimeter‐wave (mmWave) frequency bands (i.e., tens of gigahertz and
beyond), the (ultra)dense deployment of small cells and the design of advanced
transmission technologies [3]. The motivation for these 5G research efforts includes the
abundance of large spectrum blocks in the mmWave band, the proliferation of areas
where extremely high data rates and/or extreme traffic capacity is required, and the
need to provide higher system capacity and spectrum efficiency, respectively. On the
other hand, key technological challenges and drawbacks are yet to be addressed
including concerns regarding short‐range and Non‐Line‐Of‐Sight (NLOS) coverage issues
due to propagation challenges, ensuring low‐cost deployment and management despite
a very large number of deployed nodes, and reducing complexity and computation
resources for efficient transmission techniques. Traditional cell‐centric solutions can
though inherit the limitations to provide high and homogeneous Quality of Service (QoS)
levels thorough the coverage area due to the signal attenuation with the distance in
direct communications between the mobile station and the Base Station (BS). In this
context, there is a trend in the research community [4] to explore and evolve from
current solely cell‐centric architectures to device‐centric (or user‐centric, machine‐
centric) architectures that exploit the intelligence, communications and computing
resources of smart mobile devices. This trend will also lead to the design of device‐
centric networking schemes that aim to support efficient communications in dynamic
wireless environments by exploiting the role that end users may have in the networking
process by sharing network services and resources [5]. This device‐centric perspective
has been lately fostered by the identified benefits from Device‐to‐Device (D2D)
communications that facilitate new value added services (including proximity based
services), support critical public safety applications, help offload cellular traffic from the
BSs, and increase the spatial frequency reuse and therefore the overall capacity of
cellular networks [6]‐[9].
In future device‐centric wireless networks, smart mobile devices will provide wireless
connectivity to other devices and will hence act as a bridge with the cellular
infrastructure. The integration of cellular and ad‐hoc or D2D communications is referred
to as Multi‐hop Cellular Networks (MCNs) using mobile relays or device‐centric MCNs

Chapter 1. Introduction
3
[10]‐[11]. This thesis will refer to MCNs using mobile relays as MCNs for simplification;
actually the term MCNs may also refer to the use of fixed relay stations. MCNs (both
fixed‐ and mobile‐relay based) are capable of increasing and providing more
homogeneous QoS levels by substituting long‐distance (and generally NLOS) direct links
between mobile users and the BS by various shorter links with improved link budgets
using intermediate nodes. MCNs initially focused on the use of fixed relays [12].
However, MCNs that use mobile relays and D2D communications are characterized by a
lower implementation cost, but a higher management complexity due to the
participation of mobile terminals. In this context, the possibility to exploit the increasing
processing power and communication/networking capabilities of mobile terminals in a
decentralized and distributed manner increases the potential and future perspectives of
MCNs using mobile relays and D2D communications. MCNs using mobile relays will
transform mobile devices into prosumers of wireless connectivity in an underlay
network that if efficiently coordinated with the cellular network has the potential for
significant capacity, energy‐efficiency and QoS benefits [11].
MCNs can increase QoS and network capacity, and reduce energy consumption by
exploiting the communications, computing and networking capabilities of smart devices.
MCNs can also benefit from the mobility and storing capacity of mobile devices to
implement opportunistic networking schemes that exploit the store, carry and forward
paradigm and obtain additional capacity and energy‐efficiency gains [13].Traditionally,
opportunistic networking has been proposed for disconnected networks that cannot
always reliably ensure real‐time end‐to‐end connections [13]. However, opportunistic
networking can also be exploited in networks without disconnections (for example, in
urban environments) in order to enhance the efficiency of device‐centric wireless
transmissions (whether D2D or MCN). In this case, two devices might not initiate a
transmission (or even establish a connection) if such transmission is not sufficiently
efficient, e.g. because of a low received signal level that would result in a high number of
retransmissions and the use of low data rate transmission modes. Devices could hence
benefit from the node’s mobility and the store, carry and forward paradigm to establish
communication links between mobile relays based on contact opportunities and waiting
for more efficient transmission conditions to start their transmission. In this case,
devices will reduce their energy consumption, while also improving the capacity of the
network since less wireless resources will be needed to transmit a given amount of data.
This opportunistic networking approach could result in some transmission delays,
although it is not always the case as demonstrated in [14]. In any case, and according to
Cisco estimates [15], delay tolerant services (including mobile video, social networking
Chapter 1. Introduction
4
services, emails, software/firmware updates, data metering, goods tracking, cloud
services, and file sharing, among others) will represent a non‐negligible portion of the
expected mobile data traffic volume in the years to come. For example, Cisco estimates
that mobile video will represent 72% of the mobile data traffic by 2019 [15]. The delay
tolerance of certain services can then be exploited by opportunistic schemes to search
for efficient contact opportunities, and thereby reduce energy consumption without
reducing the end‐user QoS. In this context, efficiency‐driven opportunistic networking
principles could be designed for delay tolerant mobile data traffic, and integrated into
device‐centric wireless networks in order to enhance the efficiency and capacity of
future 5G wireless networks.
1.1 ObjectivesandContributions
This thesis is aimed at investigating device‐centric multi‐hop cellular
communications. Recent studies have investigated the benefits that the integration of
cellular and D2D or ad‐hoc networking technologies can provide over traditional cell‐
centric architectures in terms of capacity improvement [16]‐[17], cell coverage [17],
network scalability [17], infrastructure deployment cost [17], power consumption [18]
and energy efficiency [19]. However, these studies are generally analytical or simulation‐
based and the challenges resulting from the use of mobile devices require empirical
solid evidences of the performance benefits and the design of novel communication and
networking solutions. In this context, it is important to highlight that the research
studies conducted within this thesis have devoted significant efforts to demonstrate
through field tests and using hardware platforms the potential benefits of MCNs. In fact,
this thesis’ contributions start with the report of the first experimental field tests over
commercial live cellular networks that validate and quantify the benefits that MCNs
using mobile relays and D2D communications can provide over traditional cellular
systems. The first contributions can be summarized as follows:
This thesis develops the first testbed with the necessary software tools to obtain
real traces of the multi‐hop connectivity in MCN systems, and investigate the
performance improvements that can be achieved with MCN networks using
mobile relays and D2D communications, and the operating conditions under
which such improvements can be achieved.
In addition, this thesis presents the first results of an extensive field test
campaign that verify the performance benefits of MCN networks. The
measurement campaign is aimed at analyzing the connectivity of MCN systems

Chapter 1. Introduction
5
in order to determine under which conditions it would be feasible to consider
MCN transmissions and their QoS improvement with regards to traditional
single‐hop cellular communications.
The conducted field tests have provided very valuable data to evaluate and
characterize the performance of MCNs using D2D communications. Field test
measurements can also be used to characterize the multi‐hop connectivity under
various operating conditions. In this context, additional contributions of this thesis are:
This thesis presents a unique set of empirical models of the communications
performance of MCN systems that utilize D2D communications and take into
account the impact of distance, propagation/visibility conditions, number of
hops and communication settings.
Using the measurements obtained for MCN communications, the thesis also
reports D2D link‐level models derived as function of the distance between
communicating nodes.
A large portion of the cellular data traffic (present and future) can be deemed delay
tolerant. In this context, this thesis investigates how to exploit this delay tolerance to
further increase the MCN benefits through the integration of opportunistic networking
policies. In particular, the main contributions of this thesis in this field are:
The study of the energy and capacity benefits that can be obtained from the
efficient integration of opportunistic networking mechanisms into MCNs that
utilize D2D communications for delay tolerant services.
An analytical framework for opportunistic MCNs that can be used to identify the
optimal design of opportunistic MCNs with respect to energy efficiency.
The study of the impact of the traffic characteristics of delay tolerant services on
the energy‐efficiency gains that can be achieved with opportunistic MCN
communications, and how opportunistic MCN communications should be
configured to exploit traffic characteristics in order to reduce the energy
consumption.
The proposal of a set of context‐aware realistic opportunistic forwarding
schemes for MCNs that exploit context data provided by the cellular
infrastructure to significantly reduce the energy consumption compared to
traditional single‐hop cellular communications.
Chapter 1. Introduction
6
The demonstration of how using context information per ring rather than per
cell can further reduce the energy consumption of the proposed context‐aware
opportunistic schemes under non‐uniform distribution of users per cell.
1.2 Outline
The outline of this thesis is as follows. Chapter 2 presents a brief overview of the
evolution of traditional cell‐centric cellular systems (Section 2.1). Device‐centric
solutions, including D2D and MCNs, are emerging alternatives to traditional cell‐centric
solutions that are being considered as part of the 5G ecosystem. This chapter hence
presents the benefits and current state of the art in D2D communications (Section 2.2)
considering cellular (Section 2.2.1) and IEEE 802.11 (Section 2.2.2) technologies. This
thesis focuses on IEEE 802.11‐based D2D communications (for experimental reasons),
and hence a comprehensive description of the IEEE 802.11’s physical (PHY) and Medium
Access Control (MAC) layers is provided. This chapter presents then the benefits arising
from the integration of cellular and ad‐hoc or D2D technologies, usually referred to as
MCNs, and reviews the studies conducted to demonstrate their capability to contribute
towards overcoming certain limitations of traditional cell‐centric architectures (Section
2.3). The standardization activities in the field of MCNs are summarized in Section 2.4,
and Section 2.5 reviews current requirements and technical approaches that are being
considered for the definition of future 5G networks and technologies1.
The performance improvements that MCNs can achieve over traditional cellular
systems have been empirically demonstrated in this thesis. Chapter 3 presents the
experimental testbed for field testing of MCNs using mobile relays and D2D
communications that has been implemented in this thesis. This chapter first presents
the state of the art of recent research activities conducted to develop advanced multi‐
hop networking testbeds (Section 3.1). A detailed description of mHOP –the MCN
research platform implemented in this thesis– is presented in Section 3.2. The platform
integrates different types of mobile nodes, and the necessary software tools to monitor
the operation of the cellular and ad‐hoc multi‐hop forwarding processes. The chapter
also provides instructions on how to configure the mHOP testbed for field testing
(Section 3.3). The testbed configuration includes: synchronization of mHOP devices
(Section 3.3.1), configuration of the hybrid mobile node that acts as a bridge between
1 The state of the art for the various research topics addressed in this thesis is included in
each of the related chapters rather than in a single introductory chapter.
Chapter 1. Introduction
7
the cellular and ad‐hoc networks (Section 3.3.2), configuration of the mobile relay nodes
that forwards the data traffic to the destination mobile node (Section 3.3.3), and the
configuration of the destination mobile node that executes the file download and
receives the data (Section 3.3.4).
Chapter 4 presents the results of the field testing campaign that verifies and
quantifies the benefits that MCNs using mobile relays and D2D communications can
provide over traditional single‐hop cellular systems. The field testing environment,
including the configuration of mobile nodes, the employed technologies, localization of
base stations and visibility conditions, etc., is described in Section 4.1. This chapter also
presents how the performance of MCN communications is measured at the mobile
destination node in order to minimize the impact of the radio resource management
policies implemented by mobile network operators (Section 4.1.1). The experimental
evaluation of the MCN performance is then presented in Section 4.2. This section
focuses on the capacity of MCN technologies to increase the QoS while crossing
handover areas (Section 4.2.1) and at large distances to the serving base station (Section
4.2.2), to extend the cellular radius (Section 4.2.3) and the outdoor QoS levels to indoor
environments (Section 4.2.4), and to increase QoS under NLOS conditions to the BS
(Section 4.2.5). The conducted field tests have also demonstrated the capacity of MCNs
using mobile relays and D2D communications to reduce the energy consumption
compared to traditional single‐hop cellular communications (Section 4.2.6).
Chapter 5 exploits the valuable data obtained during the field tests measurements to
characterize and model the communications performance of MCN using D2D. The
experimental environment (Section 5.1.1) and considered performance metric (Section
5.1.2) are first presented. The chapter then presents the proposed models for two‐hop
MCN communications (Section 5.2). To this aim, the chapter presents first field tests
measurements of the performance experienced at the destination node when the D2D
link is characterized by LOS and NLOS conditions and for various distances between the
hybrid mobile node and the base station (Section 5.2.1). The functions that best fit the
performance measured at the mobile destination node are then identified (Section
5.2.2). Two different curve fitting methods, Least‐Squares Parameter Estimation (Section
5.2.3) and Linear Programming (Section 5.2.4), are then used to derive the fitting
parameters that best fit the selected functions to the communications performance of
MCN measured at the destination mobile node. Performance models for 2‐hop MCN
communications are derived and validated in a different location with a different serving
base station (Section 5.2.5). The two‐hop MCN measurements are also used to derive

Chapter 1. Introduction
8
D2D link level models of the IEEE 802.11 communication between the hybrid node and
the destination node (Section 5.2.6). MCN communications models are then presented
for an increasing number of hops. In particular, this chapter presents new models
derived for three‐hop MCN connections that introduce an additional mobile node
located between the hybrid node and the destination node (called intermediate node).
The conducted field tests for three‐hop MCN communications (Section 5.3.1) evaluate
both the MCN performance at the intermediate node and the destination node, and the
derived models are then presented in Section 5.3.2. This chapter finally presents, and
justifies, MCN performance models for four‐hop and five‐hop MCN communications.
The benefits of integrating opportunistic networking principles into MCNs are
analyzed in Chapter 6. This chapter first reviews related studies (Section 6.1) and then
introduces some of the most relevant delay tolerant services that are driving the growth
in cellular traffic data (Section 6.2). These services show the possibility to manage the
tolerable delay towards an efficient integration of opportunistic networking and MCNs
at no cost to the perceivable QoE. The study conducted in this chapter examines this
possibility for a two‐hop MCN scenario in which a static Source Node (SN) wants to
transmit information to a Base Station (BS) using a Mobile Relay (MR) with store, carry
and forward capabilities (Section 6.3). To this aim, the study first derives an analytical
framework (Section 6.3.1) to identify the optimum MR location and the location at
which the relay node needs to start forwarding the information to the cellular network
in order to minimize the overall energy consumption (Section 6.4). Finally, this chapter
analyzes the impact of the traffic characteristics on the energy efficiency and
configuration of two‐hop opportunistic MCN communications (Section 6.5); particular
attention is paid to mobile video traffic given its large share over the total volume of
cellular data traffic (Section 6.5.1).
Using the optimum configuration of opportunistic MCN communications derived in
Chapter 6, Chapter 7 introduces novel context‐aware opportunistic forwarding schemes
for MCNs that exploit context information provided by the cellular infrastructure. First,
related studies that highlight the important benefits that can be achieved using context
information are presented (Section 7.1). The proposed opportunistic forwarding MCN
schemes delay the start of the D2D communications (Section 7.2) or increase the search
area where to look for potential mobile relays (Section 7.3) in order to increase their
feasibility when no mobile relays are found at the identified optimum location and time
instant. The operation of the two opportunistic MCN proposals require probabilistically
estimating the time to delay the D2D transmission until an MR is found at the identified

Chapter 1. Introduction
9
optimum location and the radius of the search area around the optimum MR location
that guarantees the presence of at least one mobile node; these estimations have been
done for uniform and non‐uniform distribution of nodes within the cell. This chapter
also compares the performance of the two proposals (Section 7.4) under worst‐case
conditions (Section 7.4.1), and in terms of energy‐efficiency (Section 7.4.2) and network
capacity (7.4.3).
Finally, Chapter 8 summarizes the main conclusions that can be extracted from this
thesis, and provides indications about possible future research directions.


11
2 Multi‐hopCellularNetworks
Cellular systems have significantly evolved over the past decades with the emergence
of new and efficient radio access technologies, and the implementation of advanced
techniques to support the increased network capacity and the high data rates
demanded by novel applications. The evolution has mainly focused around the
traditional cell‐centric approach where each Mobile Station (MS) directly communicates
with the Base Station (BS). Despite the considerable efforts made in the research
community, this approach is still challenged to provide high and homogeneous Quality
of Service (QoS) levels throughout the cell area, in particular at the cell edges, due to the
strong signal attenuation with the increasing distance and the highly variable
propagation conditions caused by the presence of obstacles and interferers. These signal
degradations result in that mobile users located at the cell boundaries experience poor
QoS levels. This problem could be partially overcome by augmenting the number of BSs,
although provisioning additional infrastructure bears significant costs at the deployment
and management phases, and it has also a social cost. So, this solution in isolation might
not be able to meet the data capacity demand for current and future networks. Other
emerging alternatives currently being considered as part of Fifth Generation (5G)
network evolution include the direct communication between devices, which is referred
to as Device‐to‐Device (D2D) communications, and the integration of cellular, Wi‐Fi and
ad‐hoc or D2D communications into what is referred to as Multi‐hop Cellular Networks

Chapter 2. Multi‐hop Cellular Networks
12
(MCNs). The increasing processing power and networking capabilities of smartphones
provide significant opportunities for the use of mobile relays in MCNs. MCNs substitute
a direct MS‐BS link by multiple hops, which reduces the path‐loss and increases the link
budget compared to long‐distance single‐hop cellular links. Despite the resulting
management complexity, the implementation of MCNs using mobile relays and D2D
communications could represent a significant technology breakthrough that could help
progress from current cell‐centric systems towards device‐centric systems that exploit
collaboratively the communication and computing resources available at mobile
terminals. In this context, Section 2.1 summarizes the evolution of traditional cell‐centric
cellular systems, and highlights their main limitations to efficiently support the expected
capacity demand of future 5G networks. Section 2.2 presents the two 3rd Generation
Partnership Project (3GPP) variants for D2D communications that consider cellular (e.g.
Long Term Evolution‐Direct, LTE‐Direct) as well as IEEE 802.11 technologies. Section 2.3
provides a comprehensive description of the benefits of MCNs in device‐centric wireless
networks, and summarizes prior and current standardization activities in this field.
Finally, Section 2.5 summarizes the challenges and requirements for 5G networks along
with key disruptive technologies that are being considered as part of the 5G ecosystem.
2.1 Cell‐CentricCellularSystems
Cellular systems have significantly evolved over the past decades. Second generation
(2G) systems were developed to overcome First Generation (1G) limitations by means of
the introduction of digital traffic channels, encryption, error detection and correction,
and advanced channel access mechanisms among others. The objective of the Third
Generation (3G) of cellular networks was to provide fairly high‐speed wireless
communications to support not only voice and Short‐Messages Services (SMS), but also
multimedia, data and video [20]. A significant breakthrough in mobile communications
systems has been achieved with the introduction of 3.5G and Fourth Generation (4G)
systems that have led to the emergence of new radio access techniques, and the
implementation of advanced techniques designed to increase capacity and spectral
efficiency, and the support of higher data rates. These (radio access) techniques include
among others carrier aggregation, advanced smart antenna techniques, enhanced
Multiple‐Input Multiple‐Output (MIMO), fast channel dependent scheduling, adaptive
coding and modulation, and Coordinated Multipoint Processing (CoMP). Using these
techniques, 3.5G and 4G systems offer high peak data rates in ideal conditions.
However, the network capacity is not evenly distributed since the cell edge users
Chapter 2. Multi‐hop Cellular Networks
13
experience worse throughput levels than cell center users [21]. The introduction of 3.5G
and 4G systems has also resulted in the modification of the cellular architecture.
However, the introduced changes have generally been done in the framework of the
traditional cell‐centric architecture concept where each MS directly communicates with
the BS. Under this cell‐centric approach, and considering the fundamental limits of
communication technologies and radio propagation, the transmit power of a data link
increases with the data rate when a specific link quality is maintained. Consequently,
and independently of the 3.5G or 4G radio interfaces being employed, data rates in a
traditional cell‐centric cellular architecture decrease with the distance to the serving BS.
In this context, traditional cellular systems based on cell‐centric architectures are likely
to experience difficulties in providing high and homogeneous QoS levels throughout the
cell area (in particular at the cell edge). This is mainly due to the singal attenuation with
increasing distances, but also because of the highly variable propagation conditions
caused by the presence of obstacles and interferers. Providing high and homogeneous
QoS levels, as requested by future 5G systems (further deails on the 5G requirements
and chellenges can be found in Section 2.5), would require to considerably increase the
transmission power levels, or to limit the link to short distances between the MS and the
BS which will in turn increase the number of BSs to be deployed. However, increasing
the number of deployed BSs results in additional deployment and operational costs. It is
also important to note that increasing the number of BSs has a social cost due to the
social reaction against BSs.
A relevant novelty was introduced with the integration of relaying techniques into
cellular systems. This new operational framework introduces new technical challenges
to be solved, but represents a significant step towards overcoming the fundamental
communication and radio propagation limits of traditional cellular architectures that
difficult the provision of homogenous and high QoS levels across a coverage area. The
integration of relaying techniques into cellular standards has initially focused on fixed
relaying solutions. In fact, fixed relaying is part of both LTE‐Advanced [22] and IEEE
802.16j [23]. Fixed relaying techniques are expected to significantly improve the system
capacity and user‐perceived QoS by means of serving user located close to the cell edge.
Fixed relays are part of the network infrastructure, and have then to be considered
during the network planning, design and deployment. Relevant field trials conducted at
the Berlin LTE‐Advanced testbed have experimentally demonstrated the benefits of
fixed relaying in terms of cellular coverage and capacity [24]. Indoor coverage extension
is also demonstrated in [25] using the EASY‐C LTE‐Advanced testbed. The benefits of
fixed relaying solutions are obtained at the expense of an infrastructure deployment

Chapter 2. Multi‐hop Cellular Networks
14
cost, and the need to strategically locate fixed relays at the cell edge under LOS
conditions with the BS in order to maximize capacity and end‐user QoS.
2.2 Device‐to‐DeviceCommunications
There is a common view in that future 5G systems will be accomplished through a
group of radio technologies and advanced architectures that complement each other
[26]. Several 5G research trends can be identified. On the one hand, relevant efforts
focus on the use of higher frequency bands, the dense deployment of small cells, and
the design of advanced transmission techniques [3]. These approaches build from
traditional cell‐centric architectures. On the other hand, there is a significant belief in
the community [4] that future wireless networks need to explore and evolve from
current cell‐centric architectures to device‐centric architectures that exploit the
intelligence, increasing capabilities, communications and computing resources of smart
mobile devices. This includes the offloading of cellular data traffic to Device‐to‐Device
(D2D) connections [4]. D2D communications facilitate new value added services
(including proximity based services), support critical public safety applications, help
offload cellular traffic from the base stations, and increase the spatial frequency reuse
and therefore the capacity of cellular networks [6]‐[9].
D2D communications have received significant research attention during the last few
years at the research (e.g. European research projects such as METIS ‐Mobile and
wireless communications Enablers for the Twenty‐twenty Information Society‐ [27] and
MOTO ‐Evolving mobile internet with innovative terminal‐to‐terminal offloading
technologies‐ [28]) and standardization levels (3GPP is already working on D2D
communications in Release 12 [9], [29]‐[34]). D2D communications have been proposed
as a means of taking advantage of the physical proximity of communicating devices.
Several technologies have been used for this purpose in the past, e.g. Bluetooth, Ultra‐
wideband (UWB), IEEE 802.15.4 (or Zigbee) and IEEE 802.11 (or Wi‐Fi‐Direct). Research
efforts have been now mostly devoted to add cellular technologies (in particular LTE) to
support D2D communications. The use of licensed bands and the provision of partial or
total control of D2D links to the cellular network operator can increase the reliability and
QoS levels of D2D communications. It is worth though noticing that 3GPP actually
considers IEEE 802.11 technologies as well as cellular technologies (e.g. LTE‐Direct) for
the direct over‐the‐air data exchange between devices.

Chapter 2. Multi‐hop Cellular Networks
15
2.2.1 LTE‐basedD2Dcommunications
D2D communications underlaying cellular networks will allow proximity users to
communicate directly without having to be directed through the BS [35]. D2D
communications may generate interference into the existing cellular network if not
designed properly. Thus, interference management is one of the most critical issues for
D2D underlaying cellular networks where D2D and cellular communications co‐exist.
Current solutions based on LTE focus on network‐assisted approaches that target an
interference‐free integration of D2D communications within existing cellular networks.
This co‐existence is typically addressed by means of novel resource allocation schemes
designed with the objective of maximizing the overall network capacity while
guaranteeing the QoS requirements for both D2D users and traditional cellular users
[36]. Approaches to limit the interference to the existing cellular users include restricting
the transmission power of D2D links and the distance between the D2D users [37]. The
aforementioned interference issues between D2D and existing cellular users can be also
solved by dedicating part of the cellular spectrum to D2D communications, which is
referred to as overlay in‐band D2D communications [38]. Another alternative is to adopt
out‐band (i.e. a non‐cellular portion of the spectrum, e.g. ISM –Industrial Scientific and
Medical– bands) rather than in‐band D2D communications in cellular networks. Hence,
the D2D communications take place using a different radio interface than the cellular
one, typically an IEEE 802.11 one (Section 2.2.2 is dedicated to IEEE 802.11‐based D2D
communications). In this context, the potential of D2D communications for enhancing
the network performance and increasing the spectral efficiency is subject to an efficient
management of the spectrum bands including the exploitation of licensed and
unlicensed bands.
Another important issue to efficiently integrate D2D communications into the
existing cellular networks is to detect nearby devices. To this aim, Qualcomm proposed
LTE‐Direct2 that enables always‐on discovery of devices in proximity (and their services),
in a privacy sensitive and battery efficient way [39]‐[41]. LTE‐Direct uses radio signals –
called expressions– that are (periodically) sent by the mobile devices showing the users
profiles/preferences (privacy settings determine whether transmissions are targeted for
private or public audience). LTE‐Direct keeps discovery mechanisms on the device rather
than in the network despite using licensed spectrum which is another example of the
expected impact of device‐centric solutions on future 5G wireless cellular networks.
2 LTE‐Direct is the basis of the 3GPP work item on D2D communications that is known as
Proximity Services (ProSe).
Chapter 2. Multi‐hop Cellular Networks
16
LTE‐based D2D communications have shown to possess unique capabilities that could
lead to disruptive design changes towards the definition of future 5G cellular networks.
However, it is important to highlight that the research conducted in this thesis is not
focused on LTE‐based D2D communications. This is motivated by the importance placed
in this thesis not only to theoretical and simulation analyses, but most importantly to
experimental validation through real‐time hardware testbed. At the time this study was
conducted, no D2D platforms based on LTE were available in commercial off‐the‐shelf
mobile devices. The requested D2D platform should also allow its integration with
cellular technologies and has to possess software tools to monitor the operation and
QoS of the multi‐hop forwarding processes, as it will be shown in Chapter 3. An
interesting development is the Qualcomm’s FlashLinQ solution [42] enabling mobile
devices to discover automatically neighboring terminals and communicate with them
with limited infrastructure support. FlashLinQ is implemented over licensed spectrum on
a Digital Signal Processor (DSP)/Field Programmable Gate Array (FPGA) platform that
enables distributed channel‐aware spatial resource allocation in coordination with the
cellular providers. All in all, FlashLinQ targets device‐to‐device communications, and not
multi‐hop cellular communications that is the focus of this thesis. FlashLinQ is now
developed as LTE‐Direct, and only a Software Development Kit (SDK) to develop
proximal discovery solutions and proximity services has been recently released. This
certainly represents an interesting progress towards the study of MCNs using LTE‐based
D2D communications that could be considered as future research.
2.2.2 IEEE802.11‐basedD2D/Ad‐hocCommunications
IEEE 802.11‐based ad‐hoc wireless networking has also received significant research
attention as a technology alternative enabling nodes to form an infrastructureless
network. Its capacity to enable high bit rates and provide multi‐hop communications has
fueled the emergence of novel solutions such as Mobile Ad‐hoc Networks (MANETs),
Vehicular Ad‐hoc Networks (VANETs) and MCNs (Section 2.3). The success and
penetration/availability of IEEE 802.11 technologies coincides with the increase of
mobile data traffic. Offloading mobile data traffic to IEEE 802.11 networks has hence
become an attractive solution to tackle the capacity challenge cellular networks are
currently facing [43][44]. As cellular data traffic keeps on rising, it has been identified
the need to further integrate cellular and IEEE 802.11 technologies. In fact, 3GPP is
already working on the use of IEEE 802.11 technologies to support D2D communications
and proximity services (ProSe) in cellular networks [9]. Figure 2‐1 illustrates a specific
use case scenario that is being considered within 3GPP where the integration between
IEEE 802.11 and cellular technologies can help alleviate the cellular traffic load. In this

Chapter 2. Multi‐hop Cellular Networks
17
scenario, cellular networks do not only exploit IEEE 802.11‐based technologies to offload
cellular data traffic, but also have the capability to control and configure the
establishment of the IEEE 802.11 network and IEEE 802.11‐based D2D communications.
Pre-Conditions - Bob and John are subscribers to a mobile data service from an MNO
(Mobile Network Operator); - Bob and John both carry UEs (User Equipments) that have IEEE 802.11
capabilities; - Both UEs are enabled for ProSe (ProximityServices) Discovery and
Communication; - Bob and John use ProSe-enabled applications on their UEs; - The 3GPP network has the capability to provide IEEE 802.11
configuration information to ProSe-enabled UEs; - Bob has clicked the ProSe-enabled UE to send an HD (High-
Definition) video to John. Service Flows
- The 3GPP EPC (Evolved Packet Core) determines proximity of Bob’s and John’s UEs and provides them with IEEE 802.11 configuration information to assist with IEEE 802.11 direct connection establishment.
- Bob’s and John’s UEs use the configuration information to verify feasibility of the IEEE 802.11 direct connection and establish ProSe-assisted IEEE 802.11 direct communications.
- The ProSe-enabled application on Bob’s UE streams the HD video to the ProSe-enabled application on John’s UE using the established IEEE 802.11 connection.
Post-Conditions - John has received Bob’s HD video via the ProSe-enabled application
on his UE.
Figure 2‐1. 3GPP’s use case that describes network‐assisted IEEE 802.11‐based D2D
communications [9].
2.2.2.1 PhysicalLayer
The original IEEE 802.11 standard specified the use of three different PHY layers: (i)
infrared, (ii) Frequency Hopping Spread Spectrum (FHSS) at 2.4 GHz, and (iii) Direct
Sequence Spread Spectrum (DSSS) at 2.4 GHz [45]. The original goal was to achieve data
rates of 2 Mbps which was only possible with DSSS. The DSSS PHY divided the available
80 MHz band at the 2.4 GHz range into three non‐overlapping channels, each of them
having around 20 MHz of bandwidth. This enabled the interference‐free operation of
three different ad‐hoc networks/D2D links in the same spatial area. Revised
amendments of the original IEEE 802.11 standard were released with the requirement
of higher data rates. The goal of the IEEE 802.11b amendment was to increase the
maximum data rate in the 2.4 GHz band up to 11 Mbps using Complementary Code
Keying (CCK) at the PHY layer.

Chapter 2. Multi‐hop Cellular Networks
18
A significant breakthrough was achieved with the release of IEEE 802.11a at 5 GHz
band, and especially with the introduction of Orthogonal Frequency Division
Multiplexing (OFDM) at the PHY layer. IEEE 802.11a provides data rates of up to 54
Mbps (with fall‐back rates of 48, 36, 24, 18, 12, 9 and 6 Mbps) using 8 non‐overlapping
channels of 20 MHz each (compared to three with IEEE 802.11b). With OFDM, the signal
to be transmitted is modulated over several frequency carriers. In IEEE 802.11a, the 20
MHz bandwidth channel is divided into 52 subcarriers, each 312.5 KHz wide, that are
modulated using Binary Phase Shift Keying (BPSK), Quadrature Phase Shift Keying
(QPSK), 16‐Quadrature Amplitude Modulation (16‐QAM) or 64‐QAM. Forward error
correction coding (convolutional coding) is used with a coding rate of 1/2, 2/3, or 3/4.
IEEE 802.11g introduces the adoption of the OFDM technology at the 2.4 GHz band
and thus enables transmission data rates of up to 54 Mbps, while it retains
interoperability with IEEE 802.11b using DSSS and CCK (Table 2‐1 summarizes the
transmission modes defined for IEEE 802.11g and the resulting data rates). Since IEEE
802.11g operates at 2.4 GHz, it has the three‐channel restriction of the original IEEE
802.11 standard giving its 20 MHz channel bandwidth.
Table 2‐1. IEEE 802.11g transmission modes.
Data Rate [Mbps] Modulation Coding rate
1 DSSS‐DBPSK ‐
2 DSSS‐DQPSK ‐
5.5 CCK‐ 4 chipping seq. ‐
11 CCK – 64 chipping seq. ‐
6 OFDM‐BPSK 1/2
9 OFDM‐BPSK 3/4
12 OFDM‐QPSK 1/2
18 OFDM‐QPSK 3/4
24 OFDM‐16‐QAM 1/2
36 OFDM‐16‐QAM 3/4
48 OFDM‐64‐QAM 2/3
54 OFDM‐64‐QAM 3/4
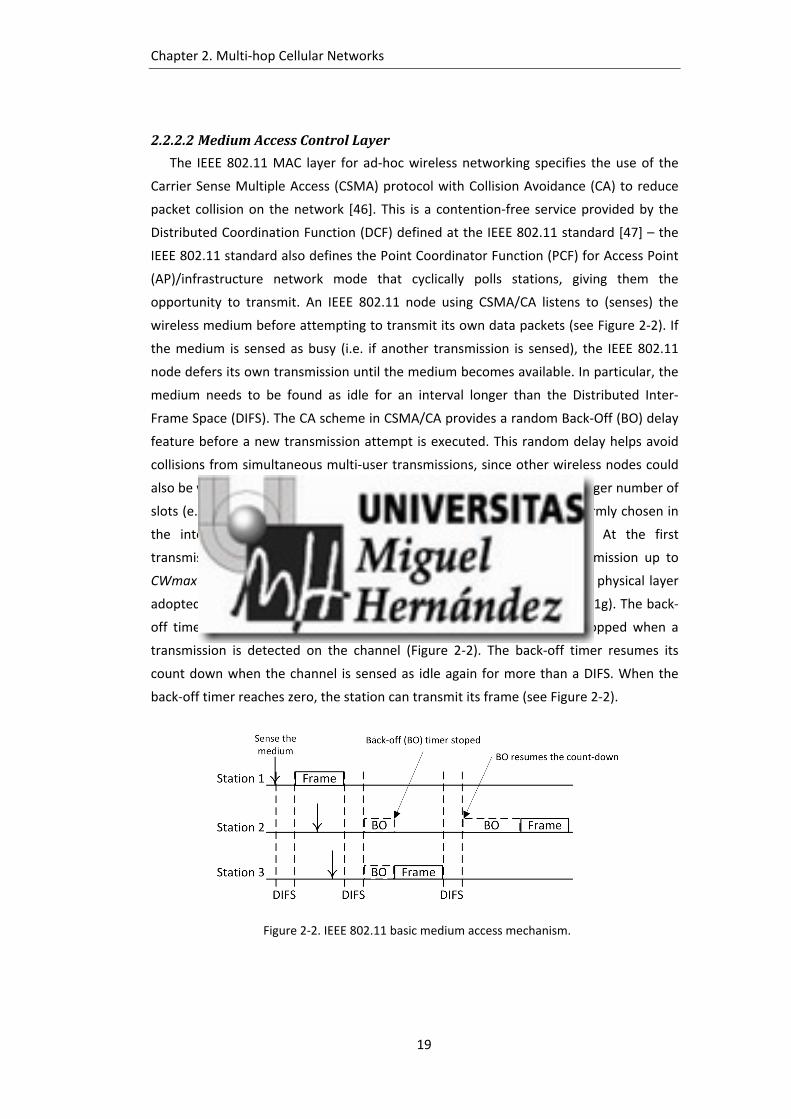
Chapter 2. Multi‐hop Cellular Networks
19
2.2.2.2 MediumAccessControlLayer
The IEEE 802.11 MAC layer for ad‐hoc wireless networking specifies the use of the
Carrier Sense Multiple Access (CSMA) protocol with Collision Avoidance (CA) to reduce
packet collision on the network [46]. This is a contention‐free service provided by the
Distributed Coordination Function (DCF) defined at the IEEE 802.11 standard [47] – the
IEEE 802.11 standard also defines the Point Coordinator Function (PCF) for Access Point
(AP)/infrastructure network mode that cyclically polls stations, giving them the
opportunity to transmit. An IEEE 802.11 node using CSMA/CA listens to (senses) the
wireless medium before attempting to transmit its own data packets (see Figure 2‐2). If
the medium is sensed as busy (i.e. if another transmission is sensed), the IEEE 802.11
node defers its own transmission until the medium becomes available. In particular, the
medium needs to be found as idle for an interval longer than the Distributed Inter‐
Frame Space (DIFS). The CA scheme in CSMA/CA provides a random Back‐Off (BO) delay
feature before a new transmission attempt is executed. This random delay helps avoid
collisions from simultaneous multi‐user transmissions, since other wireless nodes could
also be waiting to send data over the network. The back‐off time is an integer number of
slots (e.g. the slot duration – tslot – is equal to 9 µs in IEEE 802.11g) uniformly chosen in
the interval (0, CW‐1), where CW stands for Contention Window. At the first
transmission attempt, CW = CWmin, and it is doubled at each retransmission up to
CWmax. In the IEEE standard, CWmin and CWmax values depend on the physical layer
adopted (e.g. CWmin and CWmax are equal to 15 and 1023 in IEEE 802.11g). The back‐
off timer is decreased as long as the medium is sensed as idle, but stopped when a
transmission is detected on the channel (Figure 2‐2). The back‐off timer resumes its
count down when the channel is sensed as idle again for more than a DIFS. When the
back‐off timer reaches zero, the station can transmit its frame (see Figure 2‐2).
Figure 2‐2. IEEE 802.11 basic medium access mechanism.

Chapter 2. Multi‐hop Cellular Networks
20
It may happen that two or more stations start transmitting simultaneously and a
collision occurs. The IEEE 802.11 MAC layer defines then a mechanism to ascertain the
correct reception of a frame. This mechanism is based on the transmission of an
immediate positive acknowledgement frame (ACK) upon correct reception of a data
frame. The ACK frame is transmitted by the destination station after a time interval
called the Short InterFrame Space (SIFS). As depicted in Figure 2‐3, the SIFS is shorter
than the DIFS (e.g. SIFS is equal to 10 µs for IEEE 802.11g while DIFS is equal to SIFS+2∙
tslot, i.e. 28 µs) in order to give priority to the receiving station over other possible
stations waiting for transmission (Figure 2‐3). If the ACK is not received by the
transmitter station, the data frame is presumed to have been lost, and a retransmission
is scheduled.
Figure 2‐3. IEEE 802.11 mechanism to indicate positive acknowledgement of a frame. The figure
also illustrates that the SIFS is shorter than the DIFS.
In addition, the IEEE 802.11 MAC layer defines the virtual carrier sensing mechanism
to alleviate the problem known as hidden‐station (Figure 2‐4). The hidden‐station
problem occurs when a station (for example, station B) is in the transmitting range of
two other stations (stations A and C), but stations A and C cannot hear each other. If
station C has a frame to be transmitted to station B, it senses the medium and finds it
free/idle because it is not able to hear station A’s transmissions. Therefore, it starts
transmitting the frame but this transmission will result in a collision at the station B if
station A is also transmitting to B. The virtual carrier sensing mechanism is proposed to
solve this issue. It is based on two control frames: Request To Send (RTS) and Clear To
Send (CTS). Station A would then transmit a RTS frame to the receiving station B
announcing the upcoming frame transmission. Upon receiving the RTS frame, station B
replies by sending a CTS frame to indicate that it is ready to receive the data frame. Both
the RTS and the CTS frames contain the total duration of the transmission (including the
related ACK frame). This information can be also heard by any surrounding station (like
station C) that uses this information to set up a timer called Network Allocation Vector
(NAV) that indicates the remaining time the station must refrain from accessing the

Chapter 2. Multi‐hop Cellular Networks
21
wireless medium. Using the RTS/CTS mechanism, stations may become aware of
transmissions from hidden stations, and learn how long the channel will be used for
these transmissions.
Figure 2‐4. Representation of the hidden‐station problem in IEEE 802.11.
2.3 Multi‐hopCellularNetworks
MCNs are being considered as one of the alternative technology solutions for the
future 5G ecosystems. MCNs integrate cellular with ad‐hoc relaying technologies to
substitute long‐distance and NLOS cellular links for multiple hops with LOS propagation
conditions and improved link budgets. MCNs use either fixed relays or mobile relays to
reduce the communications distance and signal loss in each hop, and thereby offer the
possibility to increase the overall multi‐hop transmission rate. In this context, MCNs
preserve the benefit of using a communications infrastructure while overcoming the
limitations of cellular networks to provide homogeneous high bit rates over large areas
through the use of multi‐hop transmissions over short distances. The multi‐hop
operation in MCNs results in significant reductions in the transmit power requirements
for the relay stations and in improved spectral efficiency per unit area of coverage [55].
As the relays can work in a decode‐and‐regenerate mode, they could also provide extra
link gains by effectively reducing noise accumulation and bit error rates. Figure 2‐5
illustrates the operation of MCNs for the cases that the multi‐hop link between the MS
and the BS uses Fixed Relays (FR) – Figure 2‐5.a – or Mobile Relays (MR) – Figure 2‐5.b.
The figures show that the use of relaying nodes in MCNs can help replacing (NLOS) long‐
distance links between MS and BS with multiple hops with LOS propagation conditions
and improved signal quality. On the other hand, MCNs using fixed relays (Figure 2‐5.a)
require that additional infrastructure elements are strategically deployed in order to
ensure LOS conditions both with the MS and the BS. MCNs using mobile relays (Figure
2‐5.b) do not require such deployment costs, but are characterized by a higher
management complexity due to the participation of mobile terminals. While it has been
suggested that introducing relaying capabilities can increase a mobile terminal’s cost
and complexity, [56] suggested that the required functionality for a mobile station to
support relaying has a negligible impact on the terminal’s cost. In addition, it has been
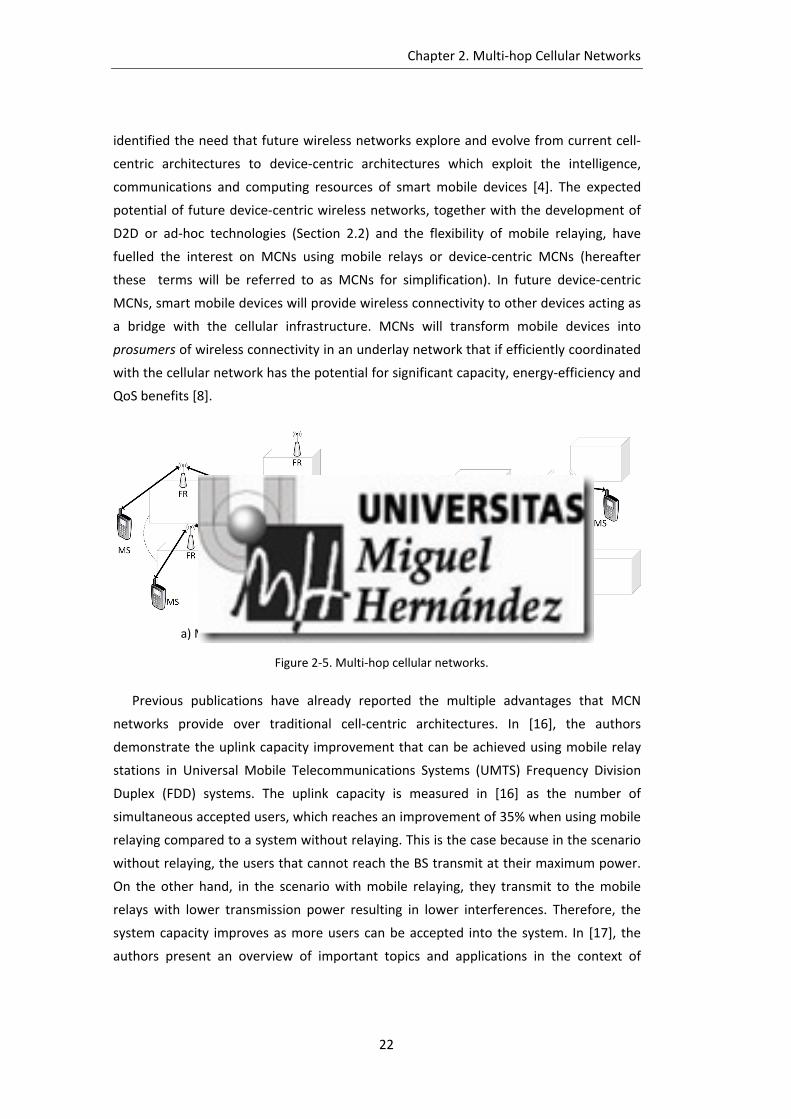
Chapter 2. Multi‐hop Cellular Networks
22
identified the need that future wireless networks explore and evolve from current cell‐
centric architectures to device‐centric architectures which exploit the intelligence,
communications and computing resources of smart mobile devices [4]. The expected
potential of future device‐centric wireless networks, together with the development of
D2D or ad‐hoc technologies (Section 2.2) and the flexibility of mobile relaying, have
fuelled the interest on MCNs using mobile relays or device‐centric MCNs (hereafter
these terms will be referred to as MCNs for simplification). In future device‐centric
MCNs, smart mobile devices will provide wireless connectivity to other devices acting as
a bridge with the cellular infrastructure. MCNs will transform mobile devices into
prosumers of wireless connectivity in an underlay network that if efficiently coordinated
with the cellular network has the potential for significant capacity, energy‐efficiency and
QoS benefits [8].
a) MCNs with fixed relays b) MCNs with mobile relays
Figure 2‐5. Multi‐hop cellular networks.
Previous publications have already reported the multiple advantages that MCN
networks provide over traditional cell‐centric architectures. In [16], the authors
demonstrate the uplink capacity improvement that can be achieved using mobile relay
stations in Universal Mobile Telecommunications Systems (UMTS) Frequency Division
Duplex (FDD) systems. The uplink capacity is measured in [16] as the number of
simultaneous accepted users, which reaches an improvement of 35% when using mobile
relaying compared to a system without relaying. This is the case because in the scenario
without relaying, the users that cannot reach the BS transmit at their maximum power.
On the other hand, in the scenario with mobile relaying, they transmit to the mobile
relays with lower transmission power resulting in lower interferences. Therefore, the
system capacity improves as more users can be accepted into the system. In [17], the
authors present an overview of important topics and applications in the context of
Chapter 2. Multi‐hop Cellular Networks
23
relaying. This work covers different approaches to exploiting the benefits of multi‐hop
communications via relays, such as solutions for radio range extension in mobile and
wireless broadband cellular networks, and to combat shadowing at high radio
frequencies. Furthermore, [17] presents multi‐hop relaying as a means to reduce
infrastructure deployment costs and enhance the capacity in cellular networks by
exploiting spatial diversity. The capacity of MCNs using mobile relays to reduce the
energy consumption was first highlighted in [18]. This study divided cells into concentric
rings, and showed that the overall energy consumption can be reduced if only mobile
relays located at the inner‐most ring are allowed to directly transmit data to the cellular
BS. On the other hand, users located in outer rings should find relays located at inner
rings to reach the BS. Under the considered scenario and operating conditions, [18]
shows a 20 dB energy reduction of multi‐hop cellular communications using mobile
relays compared with single‐hop cellular communications. In addition, the study
conducted in [18] demonstrates that the consumed energy decreases with the increase
in number of hops until a certain number of hops (around 7 hops); with higher number
of hops the energy saved in transmission does not compensate the increase in the
energy consumption at intermediate nodes due to the forwarding operation. In [19], the
authors demonstrate that multi‐hop wireless networks can further reduce the total
energy consumed by means of macro diversity (i.e. signals are jointly transmitted by two
or more mobile terminals). In [57], the authors propose a mode selection scheme that
decides whether to establish a single‐hop or a multi‐hop connection between a mobile
user and the BS based on the signal strength of the pilot symbols from the BS. The study
presented in [58] extends the mode selection alternatives to include connections that
integrate opportunistic networking into MCNs. In this study, the mode selection
criterion is partly based on the probability to find adequate mobile relays that provide
the higher expected performance. It is also important to note that MCNs using D2D
communications can provide a more efficient use of radio resources and increase the
system’s robustness by retransmitting combined data using network coding [59].
The consideration of mobile relays in MCN offers a plethora of novel communications
possibilities by exploiting the resources of deployed mobile devices in an opportunistic
and collaborative operational framework. MCNs that utilize mobile relays and D2D
communications base their operation on the establishment of multi‐hop paths to route
the information from source to destination. To this aim, it is crucial the design of both
adequate neighbor selection techniques and efficient multi‐hop networking protocols
that choose the most appropriate nodes over which to route the information and
reduce the terminal’s energy consumption. Various studies (e.g. [60]) have
Chapter 2. Multi‐hop Cellular Networks
24
demonstrated the importance and impact of the neighbor selection on the operation
and performance of multi‐hop wireless networks, including MCNs. Initial proposals to
select the neighbor devices used selection criteria based on the received signal level
from neighboring nodes [61], or the nodes proximity [62]. These proposals did not
consider the particular characteristics of urban environments where non uniform
density distributions of nodes and NLOS propagation conditions are frequent. In this
case, an adequate selection of neighbor mobile nodes is even more crucial to increase
the nodes connectivity and ensure that a multi‐hop routing path from source to
destination can be established. In this context, [63] proposed a set of neighbor selection
techniques tailored for multi‐hop wireless mesh networks (i.e. IEEE 802.11s), and that
could be adequate for MCNs using D2D and mobile relays. The proposed schemes
exploit spatial diversity to improve the performance and operation of multi‐hop wireless
networks. In particular, the proposals avoid selecting all neighbor devices in the same
direction or closely located since they would not provide the multi‐hop route diversity
that is expected to improve the operation and performance of MCNs. The authors also
proposed a set of novel multi‐hop routing protocols that exploit the knowledge of the BS
location to reduce network signaling and overall energy consumption [64]. The proposal
is based on the reactive Ad‐hoc On Demand Distance Vector (AODV) routing protocol
[65], but modifies the route search process to reduce network flooding by ensuring that
each hop progresses towards the destination node. This work is then extended in [66] to
analyze the impact of the operating environment and the location of the source node
within the cell on the optimum setting of the multi‐hop routing protocol proposal.
2.4 MobileRelayingStandardizationActivities
A first attempt to include mobile relaying into cellular telecommunications networks
was presented in 1996 with the name of Opportunistic Driven Multiple Access (ODMA)
[67]. ODMA initially represented an enhancement for TDD‐based UMTS technology,
although some efforts were also devoted to examine its application to FDD‐based UMTS
technology [67]. The main purposes of ODMA were to reduce power consumption of
User Equipments (UEs), to extend the base station’s coverage area, and to support
higher user data rates. To this aim, ODMA proposed to substitute large paths between
the UE and the Base Station (BS) for smaller hops using the communication capabilities
of intermediate mobile devices (Figure 2‐6). In this context, user data was exchanged
between the sending UE and the BS using other intermediate UEs. It should be noted
that UEs located in the “Low Bit Rate Data TDD Coverage” area are those that benefit

Chapter 2. Multi‐hop Cellular Networks
25
from the ODMA operation since they communicate with the BS through UEs located in
“High Bit Rate Data TDD Coverage” area. As the ODMA standard claims [67], in general,
UEs located within the BS coverage area (i.e. UEs that receive layer 1 synchronization
information) can be used as relays, even for those UEs located in the “Border Region –
NO Coverage” area. The sending UE should establish a path through the intermediate
UEs to BS prior to data exchange. One of the key objectives in ODMA was to efficiently
route data in such multi‐hop system without incurring in high overhead [68]. Unlike
traditional MANETs where the communication generally occurs between any pair of
nodes, ODMA exploited for this purpose the fact that a sending UE always
communicates with the BS. ODMA standardization activities were finally dropped as a
result of concerns over complexity, battery life of users on standby, and signaling
overhead issues. However, it laid some foundations that are now re‐appearing under
device‐centric 5G wireless proposals [69].
ODMATERMINAL
High BitRate Data
TDDCoverage
Low BitRate Data
TDDCoverage
TDD ODMA
High Bit Rate
TDD ODMA
High Bit Rate
BorderRegion
NOcoverage
Layer 1 SynchInformation
Figure 2‐6. ODMA operation [67].
Other standardization efforts considering (mobile) relays took place between 2007
and 2009 for 3GPP LTE‐Advanced [22] and WiMAX (through the established Mobile
Multi‐hop Relaying –MMR– IEEE 802.16j task group) [23] technologies. Relay Stations
(RS) help to forward user information from mobile stations to a local BS. In addition to
the fixed relay solutions already introduced in Section 2.1, LTE‐Advanced and WiMAX
also consider moving/mobile relay nodes (MRNs). However, such MRNs are dedicated
terminals tailored to serve users inside public transportation vehicles (e.g. trains and
buses) as illustrated in Figure 2‐7. MRN‐based systems face a number of challenges,
including the user mobility management. Current standardization activities are to a large
extent dealing with these issues, but still lack of many critical control management and

Chapter 2. Multi‐hop Cellular Networks
26
architectural aspects [70]. Their progress will though represent clear advances towards
the definition of future 5G device‐centric wireless networks.
Figure 2‐7. Mobile relay node scenario for LTE‐Advanced and WiMAX.
The interest in using mobile terminals as relay nodes was already noted during the
development of the LTE‐Advanced standard and International Mobile
Telecommunications (IMT)‐Advanced, when Samsung considered this possibility initially
for emergency calls when users were located in shadow areas or outside the coverage
area of BSs [71], as depicted in Figure 2‐8. 3GPP recent activities also focus on the
definition of proximity‐based services (ProSe) using D2D communications and mobile
relays ([9], [29]‐[34]) as part of 3GPP Release 12. The current 3GPP study activities cover
the identification of use cases and potential requirements for operator‐controlled
discovery and communications between UEs that are in proximity, under continuous
network control, and are under network coverage for commercial/social use, network
offloading and public safety. Additionally, 3GPP is analyzing use cases and identifying
potential requirements for public safety in case of absence of network coverage. For
these purposes, 3GPP identifies potential benefits such as range extension via UE‐to‐UE
relaying and self‐organizing out‐of‐coverage D2D communications. The two basic
functions for supporting 3GPP ProSe are D2D discovery and communications. D2D
MS
Coverage hole
MS_R1
MS_R1
Figure 2‐8. Emergency MS relay for IMT‐Advanced [71].
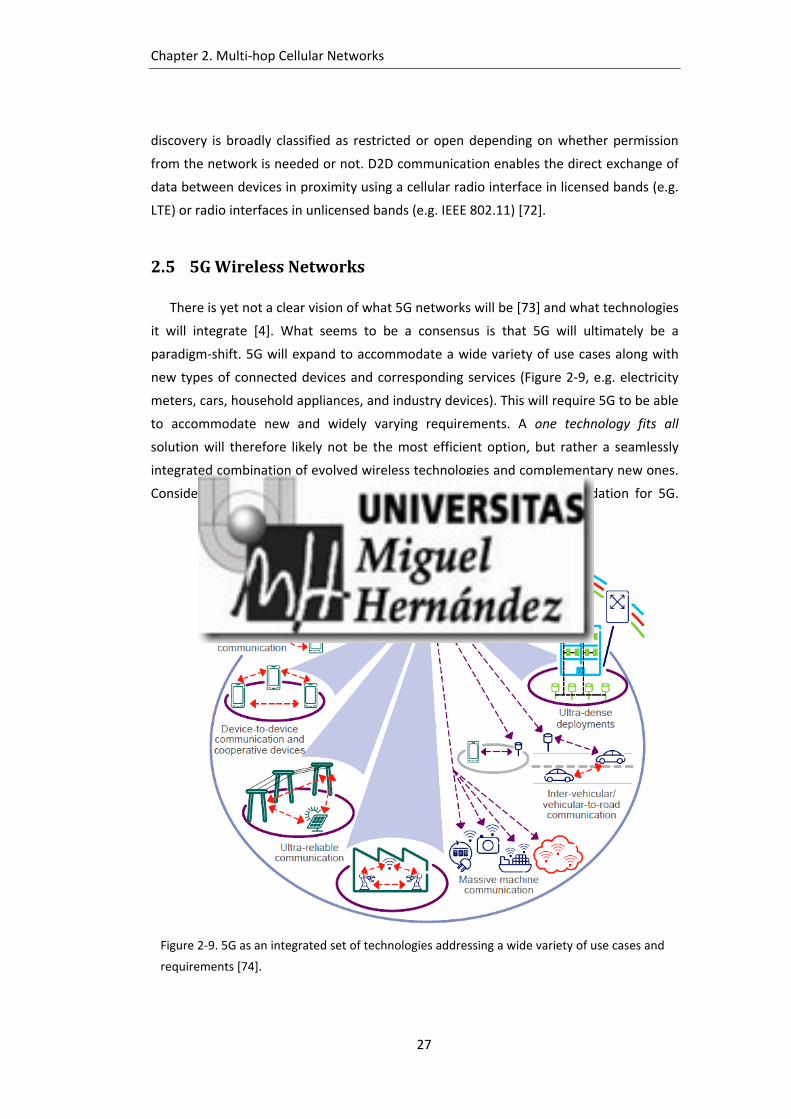
Chapter 2. Multi‐hop Cellular Networks
27
discovery is broadly classified as restricted or open depending on whether permission
from the network is needed or not. D2D communication enables the direct exchange of
data between devices in proximity using a cellular radio interface in licensed bands (e.g.
LTE) or radio interfaces in unlicensed bands (e.g. IEEE 802.11) [72].
2.5 5GWirelessNetworks
There is yet not a clear vision of what 5G networks will be [73] and what technologies
it will integrate [4]. What seems to be a consensus is that 5G will ultimately be a
paradigm‐shift. 5G will expand to accommodate a wide variety of use cases along with
new types of connected devices and corresponding services (Figure 2‐9, e.g. electricity
meters, cars, household appliances, and industry devices). This will require 5G to be able
to accommodate new and widely varying requirements. A one technology fits all
solution will therefore likely not be the most efficient option, but rather a seamlessly
integrated combination of evolved wireless technologies and complementary new ones.
Considerable efforts are then being devoted to lay the base and foundation for 5G.
Figure 2‐9. 5G as an integrated set of technologies addressing a wide variety of use cases and
requirements [74].

Chapter 2. Multi‐hop Cellular Networks
28
These actions include for example the creation of the 5G Infrastructure Public Private
Partnership (5G PPP) that is composed of leading EU industry manufacturers,
telecommunications operators, service providers, Small Medium Enterprises (SMEs) and
researchers. 5G PPP has set that the goal is to provide an initial 5G deployment by 2020.
In fact, this coincides with the NTT DOCOMO’s wish to showcase initial 5G progresses at
the 2020 Olympic Games in Tokyo [75].
2.5.1 ChallengesandRequirements
The first step in the definition of 5G has been to identify its requirements. Different
applications will place different requirements on the performance; for example,
multimedia applications may have more relaxed latency and reliability requirements
than connected vehicles or public safety applications that do not necessarily require
very high bit rates. The massive growth in the number of connected devices and their
traffic volume, along with the requirements for affordability and energy efficiency,
represent the most important challenges for the design of future mobile wireless
networks. 5G networks will face significant challenges to support the expected growth
(by a factor of 500 to 1000) in mobile traffic in the next decade [1]. These growth levels
are expected to come from a 10 times increase in broadband mobile subscribers, and
50‐100 times higher traffic per user. 5G networks should also support, compared to
current 4G networks, 10 to 100 times more connected devices, 10 to 100 times higher
user data rates, and 5 times smaller end‐to‐end latency. All this should be achieved
while saving up to 90% of energy per provided service [1]. All in all, the following 5G
performance and system‐level challenges have been identified [76].
Performance challenges:
Capacity: provide 1000x more available throughput in aggregate, as well as 10x
to 100x more speed to individual users.
Latency: provide service‐level latency down to about 1 ms (i.e. 5x reduction end‐
to‐end latency) when needed.
Energy efficiency: reduce by 90% the energy consumption per provided service
compared to 2010 levels.
Battery lifetime: provide 10x better battery lifetime for low throughput services.
Coverage: provide seamless extension of 5G services anywhere anytime.

Chapter 2. Multi‐hop Cellular Networks
29
System‐level challenges:
Quality of Service/Experience: provide differentiated services with different
requirements in terms of throughput, latency, resilience, and cost per bit.
Versatility: support a significant diverse range of uses cases.
Density: increase number of diverse devices connected in proximity.
Scalability: provide ability to support a wide range of requirements regardless of
whether a large or low amount of traffic is present.
Mobility: support for unlimited seamless mobility across all
networks/technologies.
Location and context: provide positioning and context capabilities in the sub‐
meter range in order to enable advanced (networking) solutions.
Manageability: improve the manageability of networks in order to reduce the
need for manual management and reduce the human intervention.
Resource management: provide access agnostic control, policy and charging
mechanisms and protocols for dynamic establishment, configuration,
reconfiguration and release of any type of resource, for any type of device, and
for any type of service.
Flexibility: devise truly flexible control mechanisms and protocols for relocating
functions, protocol entities and corresponding states in a truly end‐to‐end
manner, leveraging programmable network technologies.
2.5.2 EnablerTechnologiesfor5G
In addition to technologies such as D2D (Section 2.2) and MCN (Section 2.3), other
technologies are currently being investigated to be part of the 5G ecosystem [77]:
Ultra dense deployments and small cells (HetNets). As the demand for higher
data rates increases, one of the solutions available to operators is to reduce the
size of the cell. By reducing the size of the cell, area spectral efficiency is
increased through higher frequency reuse, and the transmission power levels
can be reduced. Additionally, coverage can be improved by deploying small cells
indoors where reception may not be good. Small cells also help offloading traffic
from macro cells when necessary. The concurrent operation of different classes
of base stations (e.g. macro‐, pico‐, and femto‐ base stations) is known as
heterogeneous networks (or HetNets).
Chapter 2. Multi‐hop Cellular Networks
30
Separation of user and control planes (phantom cells). The Control (C) plane
provides the connectivity and mobility while the User (U) plane provides the
data transport. In a possible envisioned C‐/U‐split scenario (which is also
referred to as phantom cells), the mobile station will maintain connection with
two different base stations (i.e. HetNets), a macro and a small cell,
simultaneously. The macro cell will maintain connectivity and mobility (control
plane) using lower frequency bands, while the small cell provides high
throughput data transport using higher frequency bands. The macro cells will
provide the signaling information, while the small cells can deliver data at higher
spectrum efficiency, throughput, and energy savings. Additionally, small cells
can be switched off when there is no data to transmit. The C‐/U‐split
architecture can also provide additional benefits such as lower interference and
improved cell edge user throughput.
Self‐Organized Networks (SONs). SONs are the first step towards the automation
of (mobile) networks operation and management tasks, introducing closed
control loop functions dedicated to self‐configuration, self‐optimization, and
self‐healing. A long‐lasting dilemma has been to find the right balance between
centralized controls versus distributed SONs. SONs imply cognitive processes
(i.e. involve thinking, reasoning and remembering) and learning capabilities in
order to achieve end‐to‐end goals.
Software defined cellular networks (network virtualization). In parallel with the
development of Software Defined Radio (SDR) in wireless communications,
Software Defined Networking (SDN) has gained significant research attention.
SDN enables abstraction of low level networking functionality into virtual
services. In this way, the control plane can be decoupled from the user plane (C‐
/U‐split architectures), which significantly simplifies network management and
facilitates the introduction of new services or changes in configuration into the
network. By means of SDN, network operators can dynamically configure,
manage, and optimize network resources and adjust traffic flows to meet
changing needs quickly via dynamic and automated SDN programs. SDN may
help cellular operators simplify their network management and enable new
services to support the exponential traffic growth envisaged for 5G networks.
The flexibility offered by SDN can enable fine‐grained resource control (e.g.
based on subscriber/application attributes) to enhance user QoE while
maximizing network utilization.

Chapter 2. Multi‐hop Cellular Networks
31
Millimeter‐wave (mmWave). A way to increase the throughput is by extending
the allocated bandwidth. Since the available bandwidth below 6GHz is limited,
significant research efforts are looking at exploring the millimeter‐wave
frequencies (i.e., tens of gigahertz and beyond) to evaluate their feasibility for
future 5G wireless networks.
Massive antenna (MIMO beamforming). Multi‐antenna transmission/reception
is now an established technology component. Current schemes can be extended
towards massive multi‐antenna configurations (in the extreme case consisting of
several hundred antennas). Massive Multiple‐Input Multiple‐Output (MIMO)
proposes multiplexing messages for several devices on each time‐frequency
resource, focusing the radiated energy towards the intended directions (i.e.
beamforming) while minimizing intra‐ and intercell interferences. The use of
massive MIMO technology is a potential solution to exploit higher frequency
bands (mmWave) that allow reducing the antennas size.
Smarter spectrum management (Licensed Shared Access – LSA, and Authorized
Shared Access –ASA). Spectrum sharing between different technologies has long
been seen as one way to increase the maximum contiguous chunks of spectrum
available for mobile services. The objective behind spectrum sharing is to
develop techniques that efficiently use the underutilized spectrum in many
bands, and share it among different services and service providers. Research is
focusing in providing a way in which all communication services can
opportunistically use any portion of non‐used available spectrum. The
opportunistic use will led to maximum efficiency of spectrum use, and will
require users to implement software defined radios. Regulatory concerns
regarding the opportunistic use of licensed spectrum are also being considered
under the Licensed Shared Access (LSA) and Authorized Shared Access (ASA)
concepts.
2.6 Summary
Future wireless networks will be required to efficiently provide high and
homogeneous QoS levels thorough the cell for the exponentially increasing data traffic
and connected devices. Leading international organizations, as well as research experts
from industry and academia, agree to recognize that the expectations and requirements
are so high that it might be necessary to complement traditional cell‐centric
architectures with novel device‐centric solutions. Current solutions that are being

Chapter 2. Multi‐hop Cellular Networks
32
considered as part of the 5G ecosystem include D2D communications and MCNs. These
device‐centric solutions exploit the intelligence, processing power and networking
capabilities of smart mobile devices to create an underlay network that if efficiently
coordinated with the cellular network has the potential for significant capacity, energy‐
efficiency, and QoS benefits. However, these benefits need yet to be demonstrated
through experimental hardware testbeds and field trials. In this context, this thesis will
help towards a better understanding of the real performance of MCNs using mobile
relays and D2D communications. In addition, the integration of opportunistic
networking into MCNs when dealing with relevant mobile delay tolerant services can
significantly contribute towards achieving the capacity and energy efficiency gains
sought for 5G networks, as it will be also demonstrated in this thesis.

33
3 mHOP:Experimental
MCNTestbed
Multi‐hop Cellular Networks (MCNs) are attracting significant research attention due
to the multiple advantages that the integration of cellular and Device‐to‐Device (D2D) or
ad‐hoc networking technologies can provide over traditional cellular architectures.
Section 2.2 has reviewed previous publications that demonstrate the benefits of MCNs
using mobile relays over traditional single‐hop cellular architectures in terms of capacity
[16]‐[17], radio cell extension [17], lower infrastructure deployment cost [17], power
saving [18] and energy efficiency [19], among others. Despite their significant value,
these studies are either analytical or based on simulations, and there is yet the need to
validate the potential of multi‐hop cellular networking through experimental field trials.
To this aim, this thesis has designed and implemented what, to the author’s knowledge,
is the first MCN testbed developed to investigate the performance improvements that
can be achieved with MCNs using mobile relays and D2D communications, and the
operating conditions under which such improvements can be achieved. The testbed
developed in this thesis is an improved version of an initial work conducted by Jónatan
Muñoz and Baldomero Coll‐Perales. This testbed is presented and described in detail in
this chapter. The chapter starts with a review of recent research activities focused on
the development of advanced multi‐hop networking testbeds (Section 3.1). Then, the
chapter provides a comprehensive description of mHOP, the novel research hardware

Chapter 3. mHOP: Experimental MCN Testbed
34
platform presented in this thesis for the study of MCNs using mobile relays (Section 3.2).
The description of mHOP includes both the hardware equipment (requirements,
devices, design, etc.) and the specific software tools that have been developed with the
purpose of monitoring and geo‐referencing the multi‐hop links’ performance. Finally,
Section 3.3 presents a generic description of the steps needed to configure the mHOP
testbed for conducting field tests.
3.1 Multi‐hopNetworkingPlatforms
There is a growing interest in the research community to design and develop
hardware platforms to investigate the potential, performance and operation of multi‐
hop communication systems. Most of the activities focus around IEEE 802.11 networks
and the study of cooperative mechanisms in multi‐hop ad‐hoc communications. A
practical demonstration of the potential of cooperative networks is shown in [78],
where the authors implement the Cooperative Medium Access Control (MAC) protocol
(CoopMAC); firstly presented in [79]. CoopMAC is a cross‐layer mechanism for IEEE
802.11 that allows selecting neighboring helper stations for MAC layer forwarding. The
implementation is performed in two programmable cooperative communication
testbeds using open‐source platforms (i.e. open‐source drivers and software defined
radio). The results shown in [78] suggest that cooperative techniques perform more
efficiently than legacy IEEE 802.11 networks. The work reported in [80] presents the
MadMAC platform that was developed for building reconfigurable MAC protocols in
commodity IEEE 802.11x hardware. The platform was then used to develop a Time
Division Multiple Access (TDMA)‐based MAC protocol that, according to the tests carried
out by the authors, improves (20% throughput improvement) the performance of the
Carrier Sense Multiple Access (CSMA) protocol proposed in the IEEE 802.11 standard
under the considered scenario. Another interesting multi‐hop networking testbed was
developed in [81] to investigate the impact of adjacent channel interference on the
multi‐hop QoS achieved with legacy IEEE 802.11 nodes. The paper also proposes
practical solutions (e.g. channel separation, antenna distance) to mitigate the effects of
such interference that considerably improve the multi‐hop performance.
These studies have demonstrated the feasibility of cooperative multi‐hop ad‐hoc
communications, and therefore represent a significant encouragement for the
experimental investigation of MCN networks using mobile relays. However, few
activities to develop hybrid cellular and ad‐hoc networking research platforms can yet
be found in the literature. Although not focused on MCN using mobile relays, an

Chapter 3. mHOP: Experimental MCN Testbed
35
interesting research is that reported in [82], where the authors study the performance
of mixed cellular and IEEE 802.11 architectures. In particular, [82] introduces the Cool‐
Tether platform that provides Internet access to laptop clients using cellular handsets as
Internet gateways, thereby creating Wi‐Fi hotspots on‐the‐fly. The reverse
infrastructure‐mode adopted in Cool‐Tether defines that one of the laptop clients must
act as Access Point (AP). As a result, the coordination processes are carried out by this
laptop and the energy consumption of mobile stations is minimized. Considering the
Cool‐Tether topology, it is important to note that the QoS that Internet users will
experience will be highly dependent on the cellular link quality of the mobile station
acting as gateway. This quality will be in turn influenced by the distance to the base
station and the Line‐of‐Sight (LOS)/Non‐LOS (NLOS) propagation conditions of the
cellular link. The work presented in [83] progresses towards the integration of cellular
and ad‐hoc networking technologies. In [83], the authors develop a hardware node that
integrates a Global System for Mobile communications (GSM)/General Packet Radio
Service (GPRS) wireless modem module and a Bluetooth module into a Linux embedded
platform (S3C2410 microprocessor). The nodes also implement an on‐demand routing
protocol that enables multi‐hop communications. Static field trials conducted in indoor
environments validate the implementation, but reveal that the experimental studies
that can be conducted with this testbed are limited mainly due to the Bluetooth’s
bandwidth constraint.
It is also important to highlight the activities conducted to develop LTE‐Advanced
hardware testing platforms; these activities are focused on fixed relaying solutions. The
work reported in [24] presents a prototype (Berlin LTE‐Advanced testbed) installed in
the center of Berlin that consists of three LTE base stations and a fixed relay node. The
fixed relay node is placed inside a measurement van in order to test different locations.
The measurement results reported in [24] demonstrate that relaying techniques have a
high impact on the coverage (they allow extending the radio range) and on the capacity
of cellular systems by means of delivering high date rates to the cell‐edge. Indoor
coverage extension is also demonstrated in [25] using the EASY‐C LTE‐Advanced testbed.
These two LTE‐Advanced platforms corroborate the benefits that fixed relaying schemes
can achieve at the expense of an infrastructure deployment cost, and the need to
strategically locate the relay nodes at the cell edge in LOS conditions to the BS in order
to achieve the maximum capacity and end‐user QoS. Another interesting development is
the release of Qualcomm’s FlashLinQ solution [42]. FlashLinQ is a synchronous (time‐
slotted) Orthogonal Frequency Division Multiplexing (OFDM)‐based system that enables
node discovery, channel allocation, and link scheduling with power control with limited

Chapter 3. mHOP: Experimental MCN Testbed
36
infrastructure support. Through simulation and experimental studies, FlashLinQ has
demonstrated its capability to increase system performance. FlashLinQ is being
standardized as LTE‐Direct (or ProSe) as part of 3GPP Release 12 (see Section 2.2) with
the main aim of achieving battery efficient and privacy sensitive always‐on proximal
discovery solutions. However, FlashLinQ and LTE‐Direct target device‐to‐device
communications, and not multi‐hop cellular communications.
This section has reviewed relevant initiatives to create hardware platforms over
which to investigate cooperative multi‐hop and relaying‐based communications.
However, to the author’s knowledge, no MCN testbed using mobile relays has yet been
reported in the literature. In this context, this thesis presents mHOP, a novel research
platform designed to experimentally investigate the operation, performance and
benefits of MCNs using mobile relays and D2D communications.
3.2 mHOPResearchTestbed
The mHOP testbed has been designed with the objective to investigate the
performance benefits of MCNs using mobile relays over traditional cellular systems, and
the conditions under which such benefits can be obtained. As a result, the platform
includes MCN and conventional single‐hop cellular links. Figure 3‐1 illustrates the mHOP
architecture, and shows how the destination Mobile Node (MN) can be reached through
a single‐hop cellular connection or an MCN connection. The platform focuses on
downlink transmissions, although uplink transmissions can also be performed. The MCN
connection requires access to the cellular infrastructure through a hybrid MN capable of
forwarding cellular data in real‐time to the destination MN without downgrading the
overall network performance. In particular, the hybrid MN forwards the data to the
destination node using other mobile relay nodes and D2D communications. The nodes
that integrate the mHOP platform should also have the capability to continuously
monitor their radio performance, and their design should guarantee the platform’s
scalability and capacity to integrate an increasing number of mobile nodes. Their
configuration should also ensure the flexibility to investigate various communication
settings, such as advanced multi‐hop routing protocols, different IEEE 802.11 standards,
frequencies, etc.

Chapter 3. mHOP: Experimental MCN Testbed
37
INTERNET
Cellular access network(UMTS/HSPA)
Applications(e.g. FTP)
GPS
MCN connectionSingle-hop cellular connection
Hybrid MN
Destination MN
Mobile RelaysD2D comms
Figure 3‐1. mHOP architecture.
The implemented mHOP platform integrates three different types of MNs, with
different connectivity capabilities: the hybrid and destination MNs with cellular and ad‐
hoc D2D connectivity, and the mobile relays with ad‐hoc D2D connectivity. Figure 3‐2
shows the fully equipped mobile nodes that integrate the mHOP testbed.
Hybrid MN Mobile relay Destination MN
MIMO antennas Nokia 6720c with Nemo
Built-in wirelessWireless
ExpressCardBluetooth GPS receiver
Figure 3‐2. mHOP platform.
3.2.1 CellularConnectivity
The mHOP platform includes cellular connectivity into the hybrid MN and the
destination MN using a Nokia 6720c handset. The Symbian‐based terminal supports the
radio access technologies shown in Table 3‐1 and that include GSM/GPRS and Universal
Mobile Telecommunications System (UMTS)/High Speed Packet Access (HSPA) – HSPA
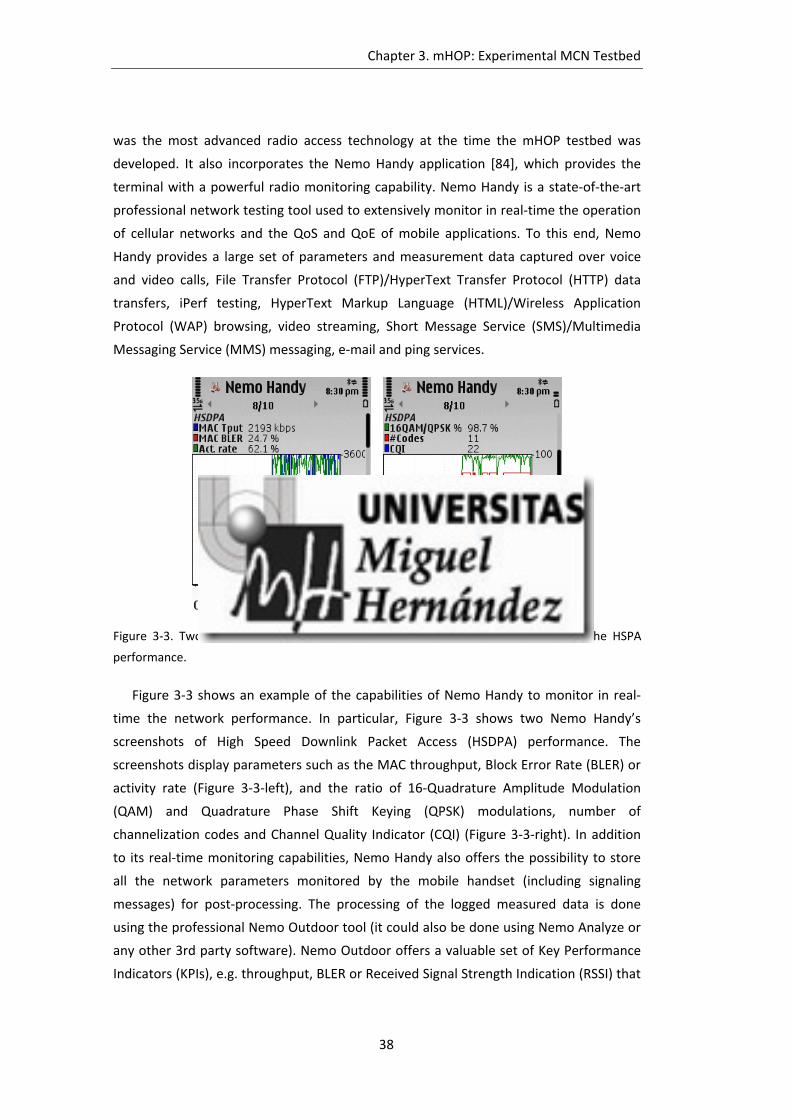
Chapter 3. mHOP: Experimental MCN Testbed
38
was the most advanced radio access technology at the time the mHOP testbed was
developed. It also incorporates the Nemo Handy application [84], which provides the
terminal with a powerful radio monitoring capability. Nemo Handy is a state‐of‐the‐art
professional network testing tool used to extensively monitor in real‐time the operation
of cellular networks and the QoS and QoE of mobile applications. To this end, Nemo
Handy provides a large set of parameters and measurement data captured over voice
and video calls, File Transfer Protocol (FTP)/HyperText Transfer Protocol (HTTP) data
transfers, iPerf testing, HyperText Markup Language (HTML)/Wireless Application
Protocol (WAP) browsing, video streaming, Short Message Service (SMS)/Multimedia
Messaging Service (MMS) messaging, e‐mail and ping services.
Figure 3‐3. Two examples of the real‐time capabilities of Nemo Handy to monitor the HSPA
performance.
Figure 3‐3 shows an example of the capabilities of Nemo Handy to monitor in real‐
time the network performance. In particular, Figure 3‐3 shows two Nemo Handy’s
screenshots of High Speed Downlink Packet Access (HSDPA) performance. The
screenshots display parameters such as the MAC throughput, Block Error Rate (BLER) or
activity rate (Figure 3‐3‐left), and the ratio of 16‐Quadrature Amplitude Modulation
(QAM) and Quadrature Phase Shift Keying (QPSK) modulations, number of
channelization codes and Channel Quality Indicator (CQI) (Figure 3‐3‐right). In addition
to its real‐time monitoring capabilities, Nemo Handy also offers the possibility to store
all the network parameters monitored by the mobile handset (including signaling
messages) for post‐processing. The processing of the logged measured data is done
using the professional Nemo Outdoor tool (it could also be done using Nemo Analyze or
any other 3rd party software). Nemo Outdoor offers a valuable set of Key Performance
Indicators (KPIs), e.g. throughput, BLER or Received Signal Strength Indication (RSSI) that
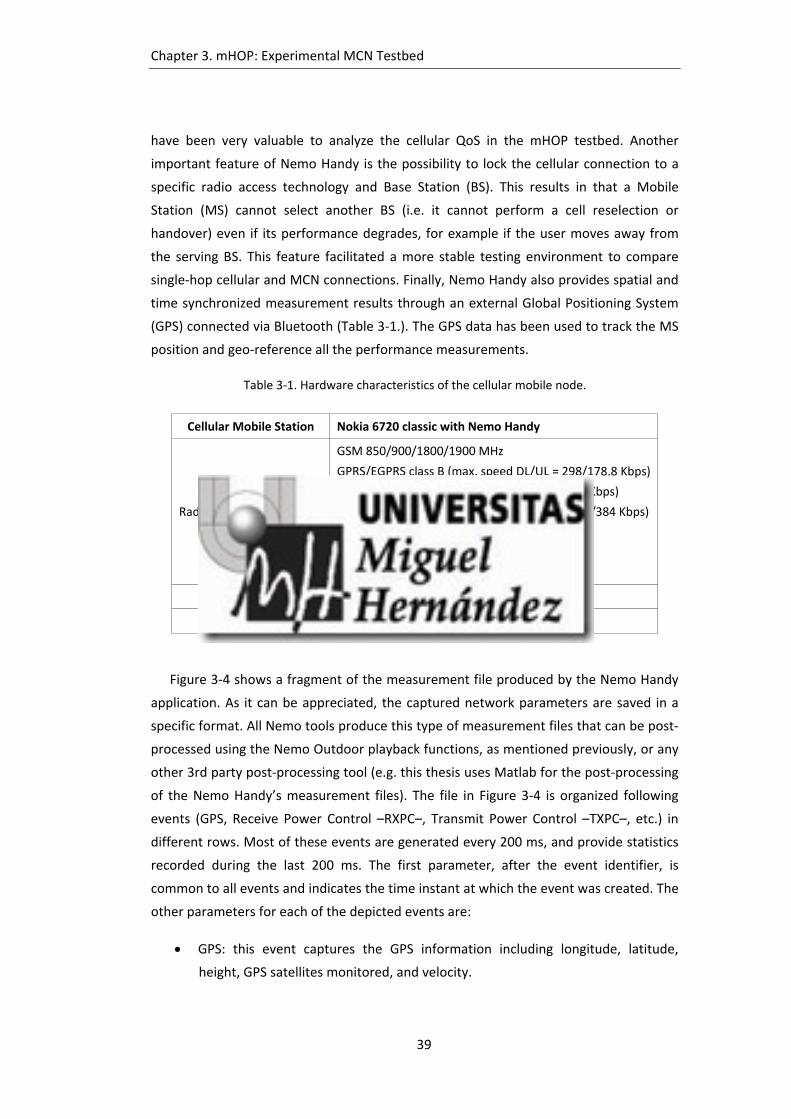
Chapter 3. mHOP: Experimental MCN Testbed
39
have been very valuable to analyze the cellular QoS in the mHOP testbed. Another
important feature of Nemo Handy is the possibility to lock the cellular connection to a
specific radio access technology and Base Station (BS). This results in that a Mobile
Station (MS) cannot select another BS (i.e. it cannot perform a cell reselection or
handover) even if its performance degrades, for example if the user moves away from
the serving BS. This feature facilitated a more stable testing environment to compare
single‐hop cellular and MCN connections. Finally, Nemo Handy also provides spatial and
time synchronized measurement results through an external Global Positioning System
(GPS) connected via Bluetooth (Table 3‐1.). The GPS data has been used to track the MS
position and geo‐reference all the performance measurements.
Table 3‐1. Hardware characteristics of the cellular mobile node.
Cellular Mobile Station Nokia 6720 classic with Nemo Handy
Radio Access Technologies
GSM 850/900/1800/1900 MHz
GPRS/EGPRS class B (max. speed DL/UL = 298/178.8 Kbps)
EDGE class A (max. speed DL/UL =178.8/118.2 Kbps)
UMTS FDD 2100 MHz (max. speed DL/UL = 384/384 Kbps)
HSDPA category 9 (max. speed DL = 10.2 Mbps)
HSUPA category 5 (max. speed UL = 2 Mbps)
Bluetooth v.2.0 Enhanced Data Rate
Memory 2GB MicroSD Card
Accessories GPS Bluetooth RoyalTek
Figure 3‐4 shows a fragment of the measurement file produced by the Nemo Handy
application. As it can be appreciated, the captured network parameters are saved in a
specific format. All Nemo tools produce this type of measurement files that can be post‐
processed using the Nemo Outdoor playback functions, as mentioned previously, or any
other 3rd party post‐processing tool (e.g. this thesis uses Matlab for the post‐processing
of the Nemo Handy’s measurement files). The file in Figure 3‐4 is organized following
events (GPS, Receive Power Control –RXPC–, Transmit Power Control –TXPC–, etc.) in
different rows. Most of these events are generated every 200 ms, and provide statistics
recorded during the last 200 ms. The first parameter, after the event identifier, is
common to all events and indicates the time instant at which the event was created. The
other parameters for each of the depicted events are:
GPS: this event captures the GPS information including longitude, latitude,
height, GPS satellites monitored, and velocity.
Chapter 3. mHOP: Experimental MCN Testbed
40
RXPC: this event shows information related to the power control mechanism in
reception, and it includes parameters such as the target Signal to Interference
Ratio (SIR), measured SIR and number or percentage of power up/down
commands in the downlink.
TXPC: this event shows information related to the power control mechanism in
transmission, and it includes parameters such as the MS’s total transmitted
power, transmit power control step size, and number or percentage of power
up/down commands in the uplink.
PLAIU: the Packet Link Adaptation Info for Uplink (PLAIU) event contains
statistical information on the usage of the uplink link adaptation. It includes
parameters such as the High Speed Uplink Packet Access (HSUPA) throughput,
HSUPA modulation, HSUPA transport block size, HSUPA spreading and
channelization codes, and HSUPA retransmission rate, among others.
PLAID: the Packet Link Adaptation Info for Downlink (PLAID) event contains
statistical information on the usage of the downlink link adaptation. It includes
parameters such as the HSDPA throughput, HSDPA modulation, HSDPA effective
coding, HSDPA transport block size, HSDPA channelization codes and HSDPA
MAC‐hs BLER, among others.
CQI: this event indicates the distribution of HSDPA CQI transmitted from the MS
to the network. It includes information such as the HSDPA physical layer
requested throughput, the HSDPA CQI value and the percentage of this CQI
value from the total sampling duration. It is important to note that the Nemo
Handy’s event is generated every 200 ms, whereas the HSDPA Time
Transmission Interval (TTI) is 2 ms. Therefore, each CQI event contains
information of 100 TTIs.
MACRATE: this event is related to the MAC layer throughput and contains
information such as the HSDPA MAC‐hs throughput, HSDPA MAC‐hs block rate,
and HSDPA MAC‐hs 1st, 2nd and 3rd retransmission rates.
MACBLER: this event is related to the MAC layer block error rate and contains
information such as the HSDPA MAC‐hs Acknowledgement (ACK)/Non‐ACK
(NACK) count, HSDPA MAC‐hs block error rate in the downlink and the number
of HSDPA MAC‐hs data block transferred.

Chapter 3. mHOP: Experimental MCN Testbed
41
CELLMEAS: the cell measurement event contains information such as the
channel number, carrier RSSI, band, Energy chip on the Noise spectral density
(Ec/No), Receive Signal Code Power (RSCP) of the active cell(s), and the criterion
established to perform a cell reselection.
Figure 3‐4. Example of network parameters monitored by the Nemo Handy application.
3.2.2 Ad‐hocD2DConnectivity
3.2.2.1 MobileRelayNodes
mHOP mobile relay nodes consist of conventional laptops transmitting over IEEE
802.11. In addition to their built‐in wireless interface, the laptops have been equipped
with a wireless ExpressCard integrating the AR9280 Atheros chipset. Table 3‐2
summarizes the hardware characteristics of the mHOP’s mobile relays. The wireless
ExpressCard interface was chosen due to its outdoor range, data rate, reliability and
capacity to operate under ad‐hoc mode using IEEE 802.11a/b/g/n. The laptops use their
wireless ExpressCard for the ad‐hoc D2D communications, and they monitor the
transmitted and received packets using both their built‐in wireless interface and a virtual
interface created using the wireless ExpressCard (see below the explanation for the
need of the two interfaces to capture the IEEE 802.11 traffic). This monitoring capability
allows continuously evaluating the performance of the ad‐hoc IEEE 802.11 D2D links. As
shown in Table 3‐2, the laptops have also been equipped with a Universal Serial Bus
(USB) GPS receiver that, together with the Network Time Protocol (NTP), allows time‐
synchronizing all mHOP devices. In addition, the GPS is used to geo‐reference all the
logged radio measurements.
… GPS,10:45:49.708,,-0.686620,38.273712,96,0,1,7,0 RXPC,10:45:49.767,,5,,8.0,,1,119,0.8, TXPC,10:45:49.767,,5,-36.0,0,1.0,0,59,61,49.2 PLAIU,10:45:49.817,,5,7,200,3720,,,,,,2,8,90.0,,,,,,,,10.0,1,372,4,4,0.0,21,13.0 … PLAID,10:45:49.828,,5,3,200,6653245,0.0,26,13,5.0,,,,,,,0,,,,,1,1.0,1,0.35,1356,6,4,0.0,1,… CQI,10:45:49.828,,5,5,200,8589405,1,2,,6,5,1.0,24,2,,1,10.0,26,2,,1,16.0,27,2,,1,38.0,28,2,,1,25.0,29,2,,1,10.0,30,2,,1 MACRATE,10:45:49.828,,5,0,1,8,,3,5867685,95,11.6,0.0,0.0,0.0 MACBLER,10:45:49.828,,5,0,1,6,,3,95,10.5,85,0.0 … CELLMEAS,10:45:49.862,,5,0,1,2,10688,-46.9,1,17,0,50001,10688 ,186,-6.4,,-53.5,,,,,,,,, , …
Chapter 3. mHOP: Experimental MCN Testbed
42
The mobile relay nodes operate under Linux using the Ubuntu distribution. This
solution was chosen due to the need to configure parameters of the IEEE 802.11
physical (PHY) and MAC layers, and the availability of open tools to configure such
parameters under the Linux operating system. In particular, mHOP uses the Backports
and iw packages to configure the wireless interfaces. The Backports package includes
the Ath9k driver used to control the wireless ExpressCard. Using the iw package, it is
possible to configure: the operation channel (channel) or frequency (freq), the
transmission power (txpower) –including the power save mode–, the data rate
(bitrates), the size of the smallest packet to send a Request To Send (RTS) message (rts),
the maximum size of the transmitted packets without fragmentation (frag), the
transmission modulation (modulation), the encryption type (enc), or the number of
allowed retries (retry) of the wireless ExpressCard. The iw package is also used to
configure the wireless ExpressCard in ad‐hoc mode, create virtual wireless interfaces,
and configure the built‐in and virtual wireless interfaces in monitor mode. The iw
package is used to create the ad‐hoc network that mHOP’s mobile relays will join to
establish the MCN end‐to‐end connection.
Table 3‐2. Hardware characteristics of mHOP’s mobile relays.
Mobile relay nodes HP Compaq 6730s
Operating system Ubuntu
Built‐in wireless interface
Intel® Wifi Link 5100 AGN
Wireless ExpressCard Ubiquiti SR71‐X IEEE 802.11a/b/g/n MIMO with Atheros AR9280 chipset
USB GPS receiver GlobalSat ND‐100 GPS USB Dongle with NMEA 0183v3 protocol
The mobile relays also incorporate a packet sniffer software developed in this thesis
to capture the IEEE 802.11 traffic through the laptop’s built‐in and virtual wireless
interfaces operating in monitor mode. The sniffer uses the open source libpcap library
provided by Linux and employed in tools such as Wireshark/T‐Shark [85] or Kismet [86].
Having access to the raw captured packets allows a much faster and customized filtering
and post‐processing than using certain network testing tools. Figure 3‐5 illustrates an
example of the captured packets using the virtual interface of the wireless ExpressCard.
Each row corresponds to a captured packet, and the columns contain the following
information:
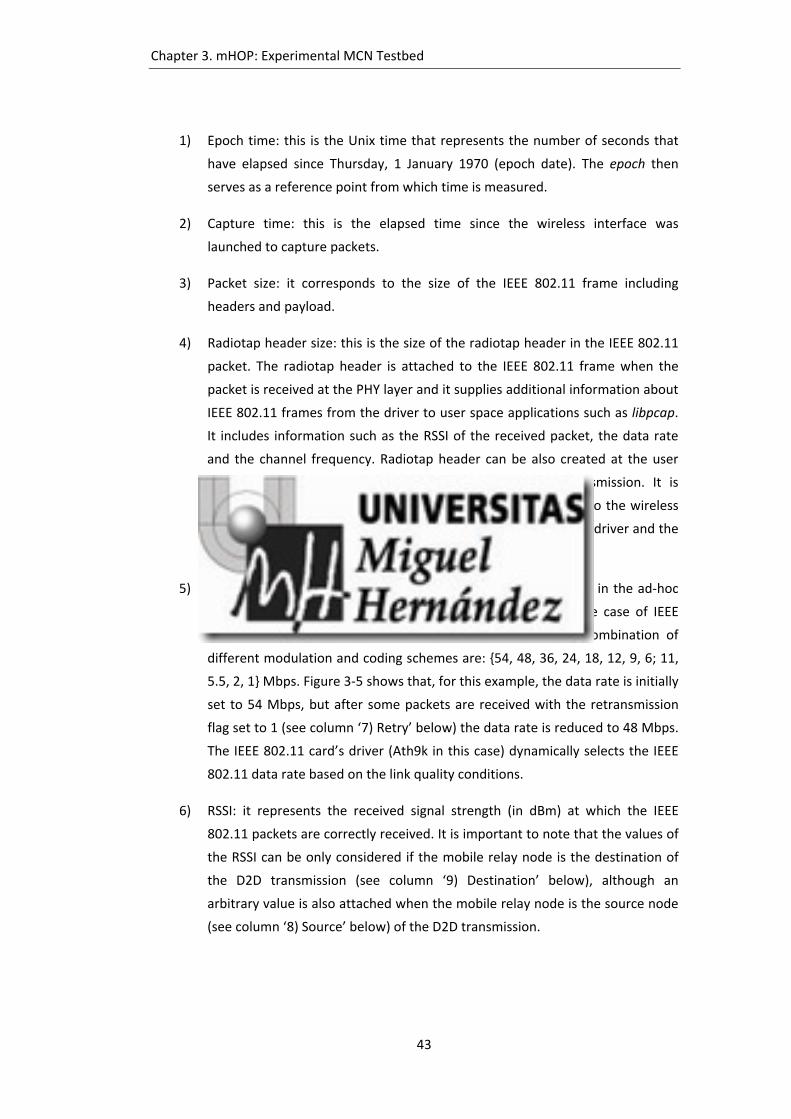
Chapter 3. mHOP: Experimental MCN Testbed
43
1) Epoch time: this is the Unix time that represents the number of seconds that
have elapsed since Thursday, 1 January 1970 (epoch date). The epoch then
serves as a reference point from which time is measured.
2) Capture time: this is the elapsed time since the wireless interface was
launched to capture packets.
3) Packet size: it corresponds to the size of the IEEE 802.11 frame including
headers and payload.
4) Radiotap header size: this is the size of the radiotap header in the IEEE 802.11
packet. The radiotap header is attached to the IEEE 802.11 frame when the
packet is received at the PHY layer and it supplies additional information about
IEEE 802.11 frames from the driver to user space applications such as libpcap.
It includes information such as the RSSI of the received packet, the data rate
and the channel frequency. Radiotap header can be also created at the user
space to include information useful for the driver for transmission. It is
important to note that the radiotap header is not transmitted to the wireless
air interface; it is only used to transfer information between the driver and the
user space.
5) Data rate: it indicates the data rate or transmission mode used in the ad‐hoc
D2D communication between the IEEE 802.11 devices. For the case of IEEE
802.11g, the twelve possible data rates resulting from the combination of
different modulation and coding schemes are: {54, 48, 36, 24, 18, 12, 9, 6; 11,
5.5, 2, 1} Mbps. Figure 3‐5 shows that, for this example, the data rate is initially
set to 54 Mbps, but after some packets are received with the retransmission
flag set to 1 (see column ‘7) Retry’ below) the data rate is reduced to 48 Mbps.
The IEEE 802.11 card’s driver (Ath9k in this case) dynamically selects the IEEE
802.11 data rate based on the link quality conditions.
6) RSSI: it represents the received signal strength (in dBm) at which the IEEE
802.11 packets are correctly received. It is important to note that the values of
the RSSI can be only considered if the mobile relay node is the destination of
the D2D transmission (see column ‘9) Destination’ below), although an
arbitrary value is also attached when the mobile relay node is the source node
(see column ‘8) Source’ below) of the D2D transmission.

Chapter 3. mHOP: Experimental MCN Testbed
44
7) Retry: this parameter indicates whether the IEEE 802.11 received packet has
been retransmitted before (‘1’) or not (‘0’). A data packet retransmission is
required if the transmitter does not receive an ACK from the destination (see
Section 2.2.2). This can be caused by an error in the transmission of the data
packet from the transmitter to the destination, or an error in the ACK sent
from the destination to the transmitter. It is important to note that the
destination cannot know how many times the packet has been retransmitted
because this information is not attached in the packet/headers. In addition,
the number of retransmissions can be configured. In the mHOP platform, the
built‐in wireless interface is used to log the retransmitted packets. Figure 3‐7
illustrates, for the example shown in Figure 3‐5, the packets that were
captured in the built‐in wireless interface of the hybrid MN (for the example,
the hybrid MN would be the transmitter and the destination MN the
destination). Figure 3‐5 shows that a packet identified by the sequence
number 16 (see column ’10) Sequence number’ below) is received at the
destination MN (see column ‘9) Destination’ below) with the flag indicating
that the packet is a retransmission (column 7). The captured packets at the
hybrid MN using the built‐in wireless interface (Figure 3‐7) show that the
packet identified with the sequence number 16 was first transmitted by the
hybrid MN (see column ‘8) Source’ below) with the retransmission flag set to 0
(column 7), and after with the flag set to 1. The captured packets in Figure 3‐7
also show that the packet identified with the sequence number 17 was
retransmitted twice. To illustrate the need of the built‐in wireless interface to
monitor the retransmitted packets, Figure 3‐8 shows the captured packets by
the virtual interface of the wireless ExpressCard at the hybrid MN (the
transmitter in this example). It can be appreciated that packets with different
sequence number (column 10) are only captured once with the retransmission
flag set to 0 (column 7). This is the case because packet retransmissions are
carried out at a very low level (out of the action range of the libpacp library)
and therefore they cannot be logged using the virtual interface of the wireless
ExpressCard. mHOP testbed then uses the built‐in wireless interface in the
same node (i.e. the hybrid MN) to capture through the air interface the
retransmissions conducted by the wireless ExpressCard interface (Figure 3‐7).
8) Source: it indicates (‘1’) whether the wireless ExpressCard interface that
captures the IEEE 802.11 packet is the origin of the D2D transmission or not
(‘0’).
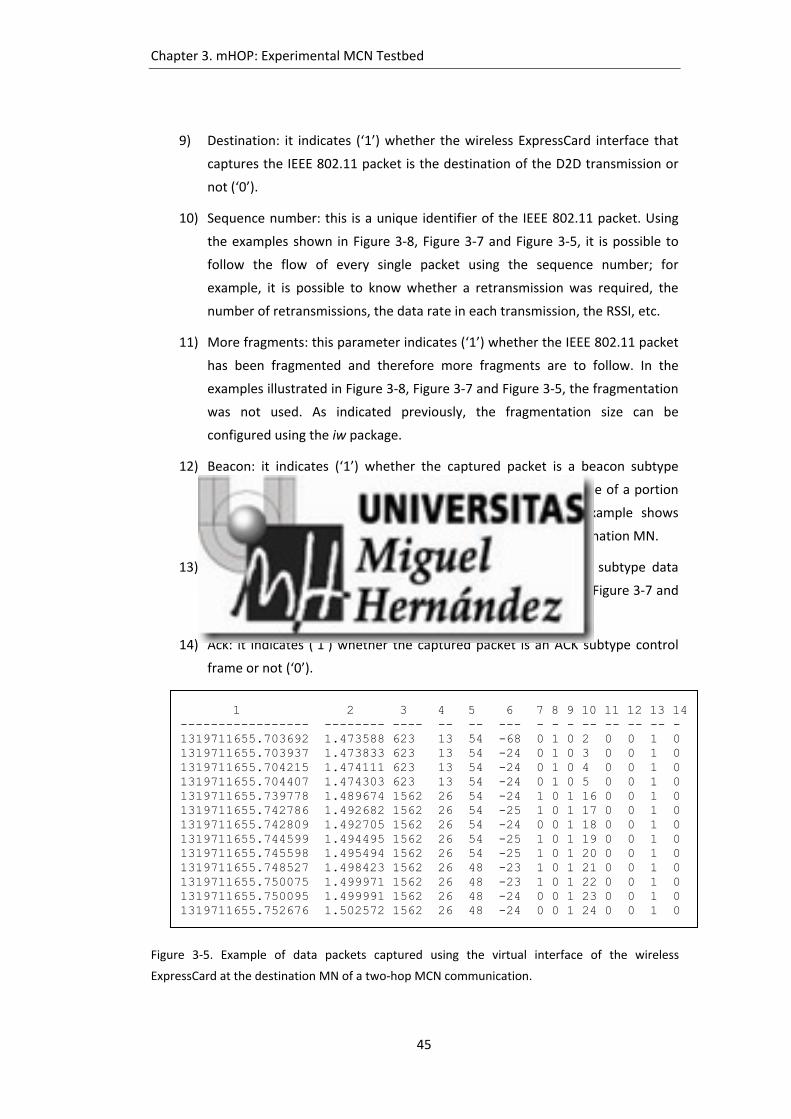
Chapter 3. mHOP: Experimental MCN Testbed
45
9) Destination: it indicates (‘1’) whether the wireless ExpressCard interface that
captures the IEEE 802.11 packet is the destination of the D2D transmission or
not (‘0’).
10) Sequence number: this is a unique identifier of the IEEE 802.11 packet. Using
the examples shown in Figure 3‐8, Figure 3‐7 and Figure 3‐5, it is possible to
follow the flow of every single packet using the sequence number; for
example, it is possible to know whether a retransmission was required, the
number of retransmissions, the data rate in each transmission, the RSSI, etc.
11) More fragments: this parameter indicates (‘1’) whether the IEEE 802.11 packet
has been fragmented and therefore more fragments are to follow. In the
examples illustrated in Figure 3‐8, Figure 3‐7 and Figure 3‐5, the fragmentation
was not used. As indicated previously, the fragmentation size can be
configured using the iw package.
12) Beacon: it indicates (‘1’) whether the captured packet is a beacon subtype
management frame or not (‘0’). Figure 3‐6 illustrates an example of a portion
of beacon packets captured at the destination MN. The example shows
beacons transmitted (column 8)/received (column 9) at the destination MN.
13) Data: it indicates (‘1’) whether the captured packet is a data subtype data
frame or not (‘0’). The IEEE 802.11 packets shown in Figure 3‐5, Figure 3‐7 and
Figure 3‐8 correspond to data packets.
14) Ack: it indicates (‘1’) whether the captured packet is an ACK subtype control
frame or not (‘0’).
Figure 3‐5. Example of data packets captured using the virtual interface of the wireless
ExpressCard at the destination MN of a two‐hop MCN communication.
1 2 3 4 5 6 7 8 9 10 11 12 13 14 ----------------- -------- ---- -- -- --- - - - -- -- -- -- - 1319711655.703692 1.473588 623 13 54 -68 0 1 0 2 0 0 1 0 1319711655.703937 1.473833 623 13 54 -24 0 1 0 3 0 0 1 0 1319711655.704215 1.474111 623 13 54 -24 0 1 0 4 0 0 1 0 1319711655.704407 1.474303 623 13 54 -24 0 1 0 5 0 0 1 0 1319711655.739778 1.489674 1562 26 54 -24 1 0 1 16 0 0 1 0 1319711655.742786 1.492682 1562 26 54 -25 1 0 1 17 0 0 1 0 1319711655.742809 1.492705 1562 26 54 -24 0 0 1 18 0 0 1 0 1319711655.744599 1.494495 1562 26 54 -25 1 0 1 19 0 0 1 0 1319711655.745598 1.495494 1562 26 54 -25 1 0 1 20 0 0 1 0 1319711655.748527 1.498423 1562 26 48 -23 1 0 1 21 0 0 1 0 1319711655.750075 1.499971 1562 26 48 -23 1 0 1 22 0 0 1 0 1319711655.750095 1.499991 1562 26 48 -24 0 0 1 23 0 0 1 0 1319711655.752676 1.502572 1562 26 48 -24 0 0 1 24 0 0 1 0
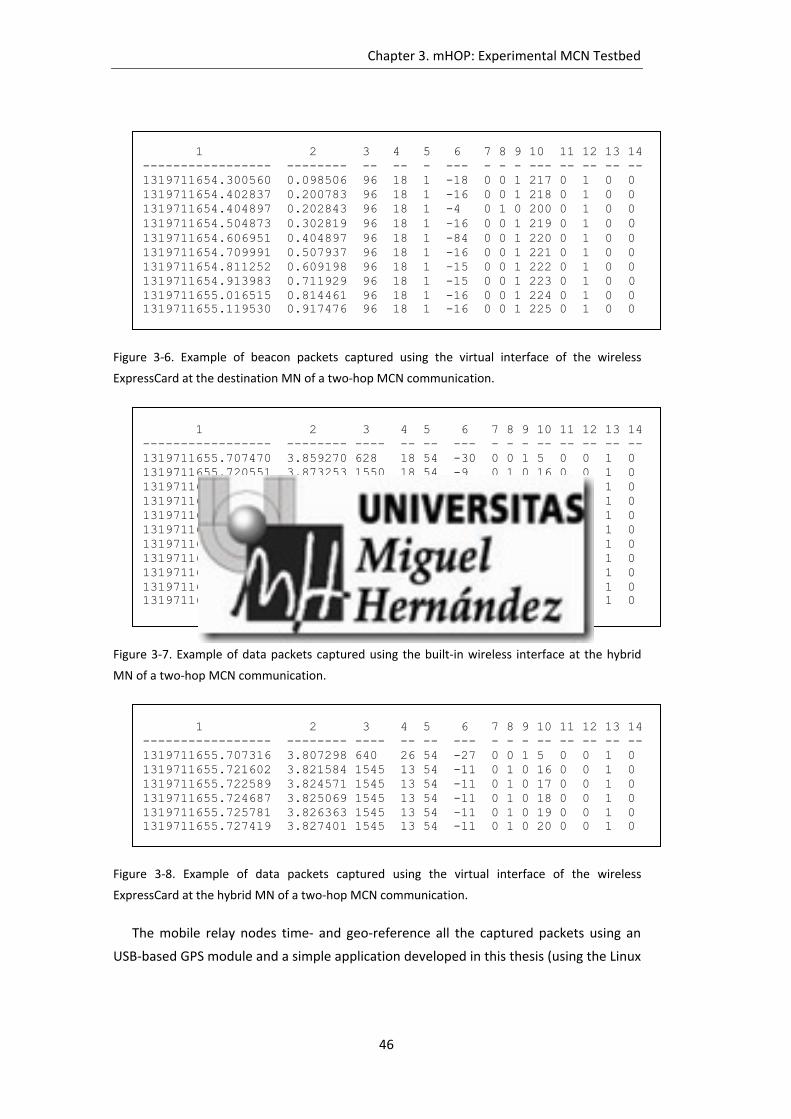
Chapter 3. mHOP: Experimental MCN Testbed
46
Figure 3‐6. Example of beacon packets captured using the virtual interface of the wireless
ExpressCard at the destination MN of a two‐hop MCN communication.
Figure 3‐7. Example of data packets captured using the built‐in wireless interface at the hybrid
MN of a two‐hop MCN communication.
Figure 3‐8. Example of data packets captured using the virtual interface of the wireless
ExpressCard at the hybrid MN of a two‐hop MCN communication.
The mobile relay nodes time‐ and geo‐reference all the captured packets using an
USB‐based GPS module and a simple application developed in this thesis (using the Linux
1 2 3 4 5 6 7 8 9 10 11 12 13 14 ----------------- -------- -- -- - --- - - - --- -- -- -- -- 1319711654.300560 0.098506 96 18 1 -18 0 0 1 217 0 1 0 0 1319711654.402837 0.200783 96 18 1 -16 0 0 1 218 0 1 0 0 1319711654.404897 0.202843 96 18 1 -4 0 1 0 200 0 1 0 0 1319711654.504873 0.302819 96 18 1 -16 0 0 1 219 0 1 0 0 1319711654.606951 0.404897 96 18 1 -84 0 0 1 220 0 1 0 0 1319711654.709991 0.507937 96 18 1 -16 0 0 1 221 0 1 0 0 1319711654.811252 0.609198 96 18 1 -15 0 0 1 222 0 1 0 0 1319711654.913983 0.711929 96 18 1 -15 0 0 1 223 0 1 0 0 1319711655.016515 0.814461 96 18 1 -16 0 0 1 224 0 1 0 0 1319711655.119530 0.917476 96 18 1 -16 0 0 1 225 0 1 0 0
1 2 3 4 5 6 7 8 9 10 11 12 13 14 ----------------- -------- ---- -- -- --- - - - -- -- -- -- -- 1319711655.707316 3.807298 640 26 54 -27 0 0 1 5 0 0 1 0 1319711655.721602 3.821584 1545 13 54 -11 0 1 0 16 0 0 1 0 1319711655.722589 3.824571 1545 13 54 -11 0 1 0 17 0 0 1 0 1319711655.724687 3.825069 1545 13 54 -11 0 1 0 18 0 0 1 0 1319711655.725781 3.826363 1545 13 54 -11 0 1 0 19 0 0 1 0 1319711655.727419 3.827401 1545 13 54 -11 0 1 0 20 0 0 1 0
1 2 3 4 5 6 7 8 9 10 11 12 13 14 ----------------- -------- ---- -- -- --- - - - -- -- -- -- -- 1319711655.707470 3.859270 628 18 54 -30 0 0 1 5 0 0 1 0 1319711655.720551 3.873253 1550 18 54 -9 0 1 0 16 0 0 1 0 1319711655.721453 3.873253 1550 18 54 -9 1 1 0 16 0 0 1 0 1319711655.723073 3.874873 1550 18 54 -10 0 1 0 17 0 0 1 0 1319711655.723975 3.875775 1550 18 54 -10 1 1 0 17 0 0 1 0 1319711655.725482 3.877282 1550 18 54 -10 1 1 0 17 0 0 1 0 1319711655.725983 3.877783 1550 18 54 -9 0 1 0 18 0 0 1 0 1319711655.726375 3.879077 1550 18 54 -10 0 1 0 19 0 0 1 0 1319711655.727277 3.879077 1550 18 54 -10 1 1 0 19 0 0 1 0 1319711655.727846 3.879646 1550 18 54 -10 0 1 0 20 0 0 1 0 1319711655.728287 3.880087 1550 18 54 -9 1 1 0 20 0 0 1 0

Chapter 3. mHOP: Experimental MCN Testbed
47
libgps library) to collect the time, latitude and longitude with a refresh periodicity of 1
Hz. Figure 3‐9 illustrates an example of the information collected from the GPS at each
mobile node. Each row corresponds to an event, and the columns contain the following
information:
1) Reference: this is an identifier of the number of GPS events collected.
2) Epoch time: this is the Unix time that represents the number of seconds that
have elapsed since Thursday, 1 January 1970 (epoch date). Having this epoch
time in the GPS information and in the captured packets (see above) allows
geo‐referencing the captured IEEE 802.11 data packets.
3) Latitude: this is the geographic latitude coordinate.
4) Longitude: this is the geographic longitude coordinate.
Figure 3‐9. Example of GPS information captured at mobile relay nodes.
3.2.2.2 HybridMobileNode
The hybrid MN is a mobile relay node that also acts as a gateway between the
cellular and IEEE 802.11 ad‐hoc D2D links. To this aim, the hybrid MN is also
implemented on a laptop with all previously described IEEE 802.11 features and ad‐hoc
D2D connectivity functions, and uses a Nokia 6720c terminal as modem to provide the
cellular link required in MCN connections. To allow for the real‐time forwarding of
information from the cellular to the multi‐hop ad‐hoc D2D links, the hybrid MN’s routing
table has been modified (detailed information on how the routing table is modified is
presented in Section 3.3). Finally, the hybrid MN includes two GPS receivers and the
cellular and ad‐hoc D2D software monitoring tools previously described.
1 2 3 4 -- ----------------- --------- --------- 73, 1319711655.764811, 38.273810, -0.686597 74, 1319711656.464675, 38.273795, -0.686610 75, 1319711657.464920, 38.273780, -0.686627 76, 1319711658.468783, 38.273780, -0.686627 77, 1319711659.468700, 38.273780, -0.686627 78, 1319711660.468861, 38.273780, -0.686627 79, 1319711661.769092, 38.273775, -0.686640 80, 1319711662.468765, 38.273775, -0.686640 81, 1319711663.472637, 38.273775, -0.686640 82, 1319711664.469107, 38.273770, -0.686670 83, 1319711665.473371, 38.273757, -0.686692 84, 1319711666.476775, 38.273757, -0.686692 85, 1319711666.777136, 38.273748, -0.686713 86, 1319711667.472718, 38.273750, -0.686735
Chapter 3. mHOP: Experimental MCN Testbed
48
3.3 TestbedConfigurationandSet‐Up
The mHOP tested has been implemented to demonstrate through field tests the
conditions under which MCNs using mobile relays can overcome the limitations of
traditional cellular architectures. To this aim, field trials need to be conducted at
different locations and under different configurations. As it will be shown in Chapters 4
and 5, the site selection and mHOP testbed configuration (including number of hops in
the MCN connection, hop distance, mobility pattern, traffic configuration, etc.) are
carefully chosen based on the test requirements and the conditions under which it is
intended to verify the capabilities of MCN technologies to overcome the limitations of
single‐hop cellular systems. This section presents then a generic example of the steps
needed to configure the mHOP testbed for conducting field tests.
3.3.1 SynchronizationofmHOPDevices
An adequate post‐processing of the data obtained from the field measurements
requires all mHOP devices to be perfectly synchronized. This is the case because
measurement files from different devices are gathered together when the field tests
finish for post‐processing. This requires all the mHOP devices to use the same time
reference for the proper post‐processing of the measurements. To this aim, all mHOP
devices execute the command <ntpdate pool.ntp.org> to synchronize their
internal clocks over the Internet using the Network Time Protocol (NTP). The epoch
times that all mHOP devices save in the measurement files of the IEEE 802.11 packets
(Figure 3‐5) and GPS (Figure 3‐9) are then synchronized.
3.3.2 ConfigurationoftheHybridMN
The configuration of the Hybrid MN starts with the execution of the Nemo Handy
application. Some field tests may require the cellular link of the MCN connection to be
locked to a specific radio access technology and BS (it allows a more stable testing since
it prevents the cell‐reselection and handover execution). If this is the case, Nemo Handy
is used to force the carrier, using the UARFCN (UTRA –UMTS Terrestrial Radio Access–
Absolute Radio Frequency Channel Number) parameter, and the scrambling code of the
cellular link. Figure 3‐10 illustrates an example of the views in Nemo Handy to force the
cellular link of the hybrid MN to an UMTS/HSPA BS characterized by the UARFCN 10663
and scrambling code 26. The Nemo Handy terminal is then configured to start logging
data, and it is connected to the Hybrid MN through an USB cable. Using the Ubuntu’s
network‐manager functionality, a mobile broadband connection is then activated in the
laptop to enable the HSPA cellular link.

Chapter 3. mHOP: Experimental MCN Testbed
49
The configuration of the IEEE 802.11 ad‐hoc network in the hybrid MN node starts by
setting the wireless ExpressCard interface as ad‐hoc or Independent Basic Service Set
(IBSS) type (<iw dev $wlanext set type ibss>); ‘$wlanext’ refers to the
MAC address of the wireless ExpressCard interface. Then, this IBSS‐type interface is used
to create the ad‐hoc network that the rest of mHOP’s mobile nodes will join to establish
the MCN end‐to‐end connection (<iw dev $wlanext ibss join $SSID
$freq fixed-freq $ap>). The command used to configure the ad‐hoc network
includes the frequency/channel ($freq) where the ad‐hoc D2D communications will
operate, and the name of the IBSS network ($SSID). The configuration of the IBSS‐type
interface in the Hybrid MN also includes the selection of the transmission power (<iw
dev $wlanext set txpower auto>)3, and the data rate (<iw dev $wlanext
set bitrates legacy-2.4 12 18 24>)4. Using the command <iw dev
$wlanext interface add $wlanextmon type monitor>, we create the
virtual interface of the wireless ExpressCard that is configured in monitor mode. Using
the command <iw dev $wlanint set type monitor>, the built‐in wireless
interface is also configured in monitor mode to capture the IEEE 802.11 traffic. The
3 In the command used as example the transmission power is set automatic (”auto”). This
means that the Ath9k driver will automatically select the transmission power based on the radio
channel conditions.
4 By default the data rate is set automatically, i.e. dynamically modified based on the link
quality conditions and the adaptive mechanisms implemented in the Ath9k driver. However, as
shown in the command used as example, the data rate can be set to vary among specific values
(in the example 12, 18, 24 Mbps).
Figure 3‐10. Example of Nemo Handy views when the mobile terminal is locked to a specific radio
access technology and BS.
Chapter 3. mHOP: Experimental MCN Testbed
50
forwarding of packets is activated by setting ‘1’ in the file ‘ip_forward’ within the folder
‘/proc/sys/net/ipv4’. The hybrid MN is assigned an IP address by using the command
<ifconfig $wlanext 192.168.1.1>, and its routing table is modified to enable
the real‐time data forwarding from/to the cellular link (<route add default dev
ppp0>) to/from the IEEE 802.11 ad‐hoc network (<route add -host
192.168.1.2 dev $wlanext> and <route add -net 192.168.1.0/24
gw 192.168.1.2>). Finally, the GPS application is executed to track the location of
the hybrid MN and the packet‐sniffer software to capture the IEEE 802.11 traffic through
both the built‐in and virtual interfaces configured in monitor mode.
3.3.3 ConfigurationoftheMobileRelays
The mobile relay nodes are located between the hybrid MN and the destination MN.
These nodes act as relays of the IEEE 802.11 traffic (they do not have a cellular link to
the BS), and therefore their configuration starts by setting the wireless ExpressCard
interface in IBSS mode (<iw dev $wlanext set type ibss>). In the conducted
field tests, the multi‐hop path is predefined at the start of each field trial. To this aim,
the mobile relay nodes (first the one closer to the hybrid MN) join the ad‐hoc network
created by the hybrid MN. This is done using the command <iw dev $wlanext
ibss join $SSID $freq fixed-freq $ap> and indicating the same
parameters for the SSID ($SSID), frequency ($freq) and AP identifier ($ap) as the
ones used by the hybrid MN. The mobile relay nodes can also configure their
transmission power and data rates using the commands presented previously in the
configuration of the hybrid MN. The mobile relay nodes also create the virtual interface
of the wireless ExpressCard, and configure this virtual interface and the built‐in wireless
interface in monitor mode. The forwarding of packets is also activated in the mobile
relay nodes by setting ‘1’ in the file ‘ip_forward’ within the folder ‘/proc/sys/net/ipv4’.
Then, a different IP address is assigned to each of the mobile relay nodes’ wireless
ExpressCard (<ifconfig $wlanext 192.168.1.$node>, where $node varies
depending on the location of the mobile relay. $node will be equal to 2 for the mobile
relay that is located closer to the hybrid MN, and an increasing number is set as mobile
nodes are closer to the destination MN). Once the IP address is assigned, the routing
table of the mobile relays is modified to establish that the wireless ExpressCard is used
to reach the precursor and successor mobile relay nodes (<route add -host
192.168.1.$[$node+1] dev $wlanext> and route add -host
192.168.1.$[$node-1] dev $wlanext>). New entries are also added to the
routing table to indicate that the traffic targeted to the destination MN is routed via the
successor mobile relay (<route add -host 192.168.1.$nodes gw

Chapter 3. mHOP: Experimental MCN Testbed
51
192.168.1.$[$node+1]>) and the traffic that goes to Internet –default traffic– is
routed via the precursor mobile relay towards the hybrid MN (<route add
default gw 192.168.1.$[$node-1]>). $nodes refers to the number of hops
in the end‐to‐end MCN connection. Finally, the GPS application is executed to track the
location of the mobile relay nodes, and the packet‐sniffer software is configured in
monitor mode.
3.3.4 ConfigurationoftheDestinationMN
The configuration of the destination MN is similar to that described above for the
hybrid MN and mobile relay nodes. If the field tests involve simultaneous downloads
through both the MCN connection and the single‐hop cellular connection to the
destination MN, the configuration of the destination MN starts by connecting the Nemo
Handy terminal to the PC and activating the mobile broadband connection. Then, the
wireless ExpressCard of the destination MN joins the ad‐hoc network, and the virtual
and built‐in wireless interfaces are set in monitor mode. The destination MN’s routing
table needs also to be modified to indicate the path that the traffic (cellular, IEEE 802.11
or both) will follow. For example, in the case of the MCN connection it has to be added
an entry in the routing table to indicate that the traffic goes via the successor MN
towards the hybrid MN using the wireless ExpressCard (<route add -host
192.168.1.$[$node-1] dev $wlanext>). The destination MN also has to
activate the GPS application and execute the packet sniffer software.
At this point in time, the mHOP testbed is configured and ready to start a field test.
The test starts when the destination MN launches a script that executes the download
of the traffic from the server. A server located at the UWICORE laboratory has been
used for the field tests. The server is configured to allow for an unlimited number of
users, and it has no limit in the download speed. In addition, the flexibility of the mHOP
platform allows testing a wide range of traffic applications including UDP and TCP traffic,
ping, web browsing, FTP downloads and iPerf.
3.4 SummaryandDiscussion
This chapter has introduced the mHOP testbed, the first research platform designed
and implemented to investigate the performance benefits of MCNs using mobile relays
compared to traditional single‐hop cellular communications, and to analyze the
conditions under which such benefits can be obtained. The testbed will allow
complementing current analytical or simulation‐based MCN research studies with field

Chapter 3. mHOP: Experimental MCN Testbed
52
trials. Field trials are not constrained by simplifications or assumptions usually made in
analytical or simulation studies.
The mHOP platform includes a single‐hop cellular connection and a MCN connection
to allow for their performance comparison. In addition, it is fully equipped with the
software tools necessary to monitor and evaluate the performance of the cellular and
multi‐hop links, and with GPS receivers that allow time and geo‐reference all the
performance measurements. The design of the mHOP platform also guarantees the
platform’s scalability and flexibility to investigate various communications settings.
These mHOP functionalities are exploited in the experimental MCN evaluation
presented in Chapter 4 and the MCN performance modeling described in Chapter 5.
These chapters do not only verify the performance benefits of MCNs, but also the
potential of the implemented mHOP testbed to conduct advanced research on multi‐
hop cellular networking.
53
4 ExperimentalEvaluationof
Multi‐hopCellularNetworks
Future 5G wireless networks are expected to support high bandwidth multimedia
services in extended areas with homogeneous QoS levels. Conventional single‐hop
cellular architectures might not be able to satisfy these requirements due to the effect
of surrounding obstacles and the signal attenuation with distance, in particular at large
distances and under NLOS propagation conditions. MCNs are expected to significantly
improve the system capacity and user‐perceived QoS through the substitution of long‐
distance (and generally NLOS) cellular links by various multi‐hop links with improved link
budgets. Although there are still significant challenges to be solved, MCNs represent a
significant step towards overcoming the fundamental communication and radio
propagation limits of traditional single‐hop cellular architectures. Several analytical and
simulation‐based studies have proved the benefits that MCNs using mobile relays can
provide in terms of capacity, cell coverage, network scalability, infrastructure
deployment cost, power consumption and energy efficiency. This thesis complements
this study, and this chapter reports the first experimental field trials that validate and
quantify the benefits that MCNs using mobile relays and D2D communications can
provide over traditional cellular systems. The field trials have been conducted using the
mHOP testbed presented in Chapter 3. Section 4.1 describes the testing conditions and
metrics, and the configuration of the mHOP testbed. Section 4.2 provides a

Chapter 4. Experimental Evaluation of Multi‐hop Cellular Networks
54
comprehensive description of the obtained experimental results that demonstrate the
scenarios and conditions under which MCNs using mobile relays outperform traditional
single‐hop cellular communications.
4.1 TestingConditionsandMetrics
The field trials presented in this chapter were conducted over commercial live
cellular networks. Orange Labs in Spain supported the field trials conducted over
different locations in the city of Elche (Spain). The locations were carefully chosen to
identify and evaluate the conditions under which MCN technologies using mobile relays
and D2D communications can overcome the limitations of traditional single‐hop cellular
systems. Additional details about the locations where the field trials were conducted are
provided in Section 4.2 for each of the scenarios.
The field trials consider downlink transmissions of long‐size files using the mHOP
platform (Chapter 3, Figure 3‐1) from a local FTP server located at the UWICORE
Laboratory. The configuration of the server allows an unlimited number of users, and
has no limit in the download speed. The cellular links are configured to operate over
HSPA, and the ad‐hoc D2D links over IEEE 802.11g at 2.4 GHz that provides a theoretical
maximum bit rate of 54 Mbps and established a maximum transmit power of 27 dBm.
IEEE 802.11g was selected over IEEE 802.11a to benefit from the better propagation
conditions experienced at 2.4 GHz compared to 5 GHz [87]5. The IEEE 802.11 data rate
and the transmission power at which the mobile relay nodes operate are dynamically
modified based on the link quality conditions as implemented by the network driver
(Ath9k). In the tests, the IEEE 802.11 transmission power of the mobile relay nodes has
been limited to a maximum of 19 dBm in compliance with the Spanish regulations (limit
is established at 20 dBm).
The field trials have been carried out under diverse configurations combining
different number of hops and hop distances. For example, a 3hops‐40m configuration
refers to an MCN connection composed of one cellular link and two IEEE 802.11g ad‐hoc
D2D links with a distance between Mobile Nodes (MNs) of 40 meters. If the tests involve
mobility, the MNs approximately maintain the distance during the route. The tests start
when the destination MN launches a script that executes a file download through the
MCN link. The MCN link requires that the hybrid MN transforms the transport blocks
5 Ath9k is not yet providing a stable operation in ad‐hoc mode for the IEEE 802.11n variant.

Chapter 4. Experimental Evaluation of Multi‐hop Cellular Networks
55
received through the cellular link to IEEE 802.11g Packet Data Units (MAC PDU); the
MAC PDU size has been set to 1564 bytes. As a result, the hybrid MN stores the cellular
transport blocks in a buffer until an IEEE 802.11g MAC PDU is filled. Once the IEEE
802.11g packet is formed, the hybrid MN transmits the MAC PDU to the next mobile
node using its IEEE 802.11g wireless ExpressCard interface. Mobile nodes located
between the hybrid MN and the destination MN act as relays with the multi‐hop path
being predefined at the start of each field trial following the configuration steps
described in Section 3.3.
4.1.1 PerformanceMetric
The MCN performance is measured in terms of the throughput experienced by the
destination MN. The throughput is commonly used as a performance indicator in cellular
systems6. In the case of single‐hop cellular transmissions, it would have been reasonable
to expect that as the destination MN moves away from the BS and the link quality
degrades (measured in HSPA through the CQI parameter), the throughput decreases.
However, it is important to note that the testing BSs are not barred, and therefore other
users might be active. Although this configuration guarantees realistic operating
conditions, it requires a careful treatment to adequately interpret the field
measurements. Initial tests showed that the operator’s radio resource management
policy compensates link degradations with more HSPA radio resources (Figure 4‐1).
Figure 4‐1 depicts the QoS experienced by a single‐hop cellular user as a function of the
distance to its serving BS; the results are shown as relative performance since the actual
measurements have been divided by the maximum value experienced for each
parameter during the test. The dotted line represents the percentage of time that the
user was assigned radio resources (usage), and the dash‐dotted line represents the
user’s CQI. The HSPA standard uses CQI estimates to provide an indication of the
channel quality and recommend transmission modes (transport block size, number of
parallel codes, modulation scheme, etc.). High CQI values indicate good channel quality
conditions. Figure 4‐1 shows that the CQI decreases with the increasing distance to the
serving BS. However, the user throughput (dashed line in Figure 4‐1) remains relatively
constant despite the degradation of the channel quality conditions. This is the case
because the network detects the channel degradation and compensates it by increasing
6 Other metrics such as the delay or the energy efficiency might have been used to measure
the MCN performance. However, since the field trials consider downlink transmissions they
would require access to the operational BSs which was not possible for the authors at the time
this study was conducted.
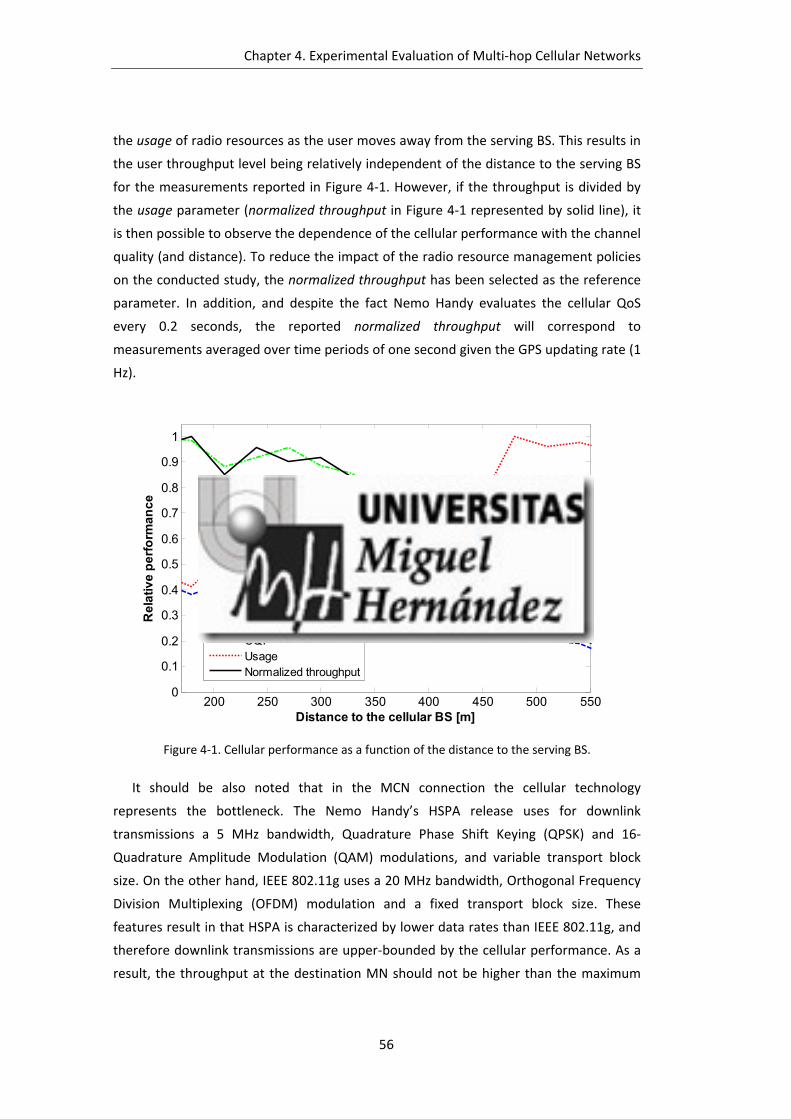
Chapter 4. Experimental Evaluation of Multi‐hop Cellular Networks
56
the usage of radio resources as the user moves away from the serving BS. This results in
the user throughput level being relatively independent of the distance to the serving BS
for the measurements reported in Figure 4‐1. However, if the throughput is divided by
the usage parameter (normalized throughput in Figure 4‐1 represented by solid line), it
is then possible to observe the dependence of the cellular performance with the channel
quality (and distance). To reduce the impact of the radio resource management policies
on the conducted study, the normalized throughput has been selected as the reference
parameter. In addition, and despite the fact Nemo Handy evaluates the cellular QoS
every 0.2 seconds, the reported normalized throughput will correspond to
measurements averaged over time periods of one second given the GPS updating rate (1
Hz).
200 250 300 350 400 450 500 5500
0.1
0.2
0.3
0.4
0.5
0.6
0.7
0.8
0.9
1
Distance to the cellular BS [m]
Re
lati
ve
pe
rfo
rma
nc
e
User throughputCQIUsageNormalized throughput
Figure 4‐1. Cellular performance as a function of the distance to the serving BS.
It should be also noted that in the MCN connection the cellular technology
represents the bottleneck. The Nemo Handy’s HSPA release uses for downlink
transmissions a 5 MHz bandwidth, Quadrature Phase Shift Keying (QPSK) and 16‐
Quadrature Amplitude Modulation (QAM) modulations, and variable transport block
size. On the other hand, IEEE 802.11g uses a 20 MHz bandwidth, Orthogonal Frequency
Division Multiplexing (OFDM) modulation and a fixed transport block size. These
features result in that HSPA is characterized by lower data rates than IEEE 802.11g, and
therefore downlink transmissions are upper‐bounded by the cellular performance. As a
result, the throughput at the destination MN should not be higher than the maximum
Chapter 4. Experimental Evaluation of Multi‐hop Cellular Networks
57
theoretical cellular data rates. If the throughput at the destination MN was normalized
considering the IEEE 802.11g resources (time and frequency), normalized throughput
values higher than the maximum theoretical HSPA data rates could be obtained which is
not realistic. However, it is possible that the operating conditions make the IEEE 802.11g
ad‐hoc performance decreases significantly and becomes the bottleneck of the MCN
connection (for example when the IEEE 802.11 ad‐hoc D2D links experience NLOS
conditions). Independently of which technology (HSPA or IEEE 802.11) represents the
bottleneck of the MCN connection, the normalization process considering the usage
parameter is valid since the MCN throughput is normalized only considering the cellular
radio resources assigned to the hybrid MN; these resources do not depend on the
performance of the IEEE 802.11 ad‐hoc D2D link. This procedure results in that any
performance degradation in the IEEE 802.11 ad‐hoc link will also represent a reduction
of the MCN normalized throughput. In this context, and following the observations
derived from Figure 4‐1, the MCN throughput is here reported as the ratio between the
MCN user throughput measured at the destination MN and the usage of the cellular link
experienced by the hybrid MN. For simplification, the normalized throughput at the
destination MN of the MCN connection will be hereafter referred to as throughput.
4.2 ExperimentalMCNPerformanceEvaluation
This section describes the field tests conducted to evaluate the performance of MCNs
using mobile relays, and the conditions under which MCNs can help overcome the
limitations of traditional single‐hop cellular networks. The field tests have been
conducted under different operating conditions (e.g. NLOS and large distances to the
serving BS) and scenarios, including handover or cell overlaid areas and indoor
environments.
4.2.1 Handover
MCN technologies using mobile relays and D2D communications could help improve
the cellular QoS experienced in handover (HO) areas. In cellular systems, a handover
process is launched when the quality of a cellular connection with a given cell degrades,
and other nearby cells can provide better quality levels. To this aim, mobile terminals
perform continuous measurements of the serving cell and the neighboring cells’ signal
quality, and report the results to the Radio Network Controller (RNC). Using the
reported measurements, the RNC decides whether a handover is executed based on
pre‐established network policies. UMTS allows for both Hard Handover (HHO) and Soft
Handover (SHO) mechanisms. In HHO, the connection with the serving BS is released

Chapter 4. Experimental Evaluation of Multi‐hop Cellular Networks
58
before establishing a new connection with the target BS. On the other hand, SHO allows
for mobile terminals to be simultaneously connected to the serving and target BSs.
HSDPA does not support SHO. This is the case because HSDPA introduces a number of
enhancements for faster packet scheduling and retransmission that require data packets
to be buffered in the BS. In this case, multiple BSs cannot transmit simultaneously to a
mobile terminal.
The first release of HSDPA (3GPP Release 5) only allows performing a handover
between cells belonging to the mobile user’s active set as shown in Figure 4‐2. In the
illustrated example, a mobile station (MS) is conducting a HSDPA file download through
BS1 (identified with scrambling code SCR1). During the file download, the MS executes a
number of measurements of the active cell (SCR1) and the monitored cells (Figure 4‐2
assumes that the monitored set only includes BS2 identified with SCR2). When the signal
level from BS2 increases, the MS sends a measurement report to the RNC through its
serving BS indicating that BS2 fulfills the criteria for being added to the active set (event
1A). Once this process is completed, the RNC sends the ACTIVE_SET_UPDATE message
including BS2 in the active set, and the MS acknowledges the receipt of this message by
MS BS1
SCR1
BS2
SCR2
Scr_active : SCR1
Scr_monitored : SCR2
HSDPA serving scr : SCR1
Scr_active: SCR1, SCR2
Scr_monitored:HSDPA serving scr: SCR1
Scr_active: SCR1, SCR2
Scr_monitored:HSDPA serving scr: SCR2
Figure 4‐2. Messages exchanged in the HSDPA‐release 5 handover process.

Chapter 4. Experimental Evaluation of Multi‐hop Cellular Networks
59
replying with the ACTIVE_SET_UPDATE_COMPLETE message. The active set process is
completed with the establishment of the physical channel (PHY_CHANNEL_RECONF).
Although BS2 belongs now to the MS’s active set, the file download is still conducted
through BS1. When the criteria to perform a handover are fulfilled, the RNC sends the
RADIO_BEARER_RECONF message that contains the new configuration parameters for
the radio bearer and the lower layers. The reconfiguration procedure, including the
change of serving cell, is completed when the MS acknowledges the receipt of this
message.
In 3GPP Release 6, the active set update procedure also allows carrying out a HSDPA
serving cell change. However, to increase reliability, 3GPP Release 8 introduces the
Enhanced Serving Cell Changed (ESCC) procedure [88]. In ESCC, mobile terminals receive
the signaling message to change the HSDPA serving cell through the target cell. This has
been done in order to exploit the stronger signal strength of the target cell, and thereby
increase the reliability with which key signaling messages are exchanged. The
communications between the MS and the target cell is possible thanks to the
configuration information received by the MS during the active set update procedure.
Independently of which 3GPP release is being considered, the RNC decides whether a
handover should be triggered or not based on the measurement reports sent by the
MSs; these reports contain the Common Pilot Channel (CPICH) strength of the active and
monitored cells. It is important to note that handover algorithms are not specified in the
standards, and are proprietary to each operator. However, a possible method to decide
whether a handover procedure should be triggered is by comparing the CPICH strength
of the active and monitored cells. In order to avoid frequent changes of serving cell,
handover algorithms use a hysteresis (H) parameter that identifies the required CPICH
power difference between the target cell and the serving cell that must be experienced
in order to trigger a handover. In addition, the reliability of the handover procedure is
enhanced through the Time To Trigger (TTT) parameter, which defines the
uninterrupted period of time during which the target cell’s CPICH strength has to fulfill
the hysteresis condition to trigger the handover. The H and TTT parameters are critical
factors to guarantee high performance and avoid frequent connection outages during
the serving cell change procedure. If these parameters are not adequately optimized,
the HSDPA throughput and user‐perceived QoS may significantly decrease. In fact,
previous studies have analyzed how to optimize HSDPA performance in cell overlaid
areas. The work reported in [89] studies two different handover methodologies. The
first one simply changes the HSDPA serving cell when entering the handover area (i.e.
Chapter 4. Experimental Evaluation of Multi‐hop Cellular Networks
60
HHO). On the other hand, the second method implies switching from HSDPA to UMTS
when the MS moves into the handover area (active set size is larger than one), and then
switches back again to HSDPA when the MS leaves the handover area. This method was
proposed to exploit UMTS macro diversity capability during the handover procedure (i.e.
SHO). The results obtained in [89] indicate that switching to UMTS is not an optimum
solution, whereas minimizing the handover area (using small H and TTT parameters)
results in a higher data rate and a lower connection outage probability. However, the
results reported in [90] show that very low values for H and TTT decrease the user‐
perceived QoS because of frequent handovers in the cell overlaid area. The studies
conducted in [90] also demonstrate that the optimization of handover parameters is not
easy, and that a trade‐off exists between the H and TTT parameters based on the mobile
user’s speed.
The benefits of using MCNs to enhance the handover procedure have been
previously highlighted in the literature [91]. Multi‐hop handover conditions and the
necessary signaling messages are being defined in the baseline documents for standards
such as IEEE 802.16j and LTE‐Advanced [92]. The efforts focus initially on fixed relay
solutions, and only a few studies have slightly addressed the handover issues from the
mobile relay point of view [93][94]. In this context, this thesis discusses a proposal on
how to conduct handovers exploiting the features of MCNs using mobile relays and D2D
communications. The proposal discussed in this thesis concentrates on downlink
transmissions, and thereby will be compared with the HSDPA handover management.
In a traditional HSDPA single‐hop cellular network, the decisions to trigger a
handover can be based on the measurement reports sent by the MS to the RNC. These
reports contain the CPICH signal strength of the monitored and active cells. Based on
these measurements, the RNC can dynamically compare the signal strength of the
serving HSDPA BS and the potential BS candidates. Figure 4‐3 shows an example of the
monitored CPICH Energy per chip over the Noise (Ec/NO) parameter for an HSDPA
serving BS (source cell), and the target BS (target cell) over which a handover is to be
conducted. This example has been obtained during some field tests conducted using
Orange’s HSDPA network (implemented 3GPP Release 5 at the time of the
measurements) at the city of Elche in Spain. The pre‐established network policies to
decide the H and TTT values that trigger the handover process are not standardized, and
the operator fixes them according to the characteristics of the cellular environment. In
this case, the specific algorithm used by Orange to decide and execute handovers was
not public. However, using the monitoring capabilities of Nemo Handy (described in

Chapter 4. Experimental Evaluation of Multi‐hop Cellular Networks
61
Section 3.2.1), it has been possible to determine the moment at which Orange’s
handover algorithm decides to transfer the active connection from the HSDPA source
cell to the target cell (depicted in Figure 4‐3 with the vertical arrow ). The Nemo
Handy monitoring tool has also allowed measuring the time between the moments at
which the target cell’s CPICH Ec/NO is better than the one measured at the source cell
and the handover is executed (TTT), and the CPICH Ec/NO difference (H) between the
source cell and the target cell.
0 10 20 30 40 50 60-22
-20
-18
-16
-14
-12
-10
-8
-6
Time [s]
CP
ICH
Ec
/NO
[d
B]
Source Cell
Target CellHybrid Node-Source Cell
TTTH
H
TTT
2
3
1
Figure 4‐3. CPICH Ec/NO example.
Although the destination MN is the end‐point of the MCN link, it is important to note
that the cellular transmission in a MCN connection is actually conducted through the
hybrid MN and not the destination MN. Since the cellular link represents the QoS
bottleneck in a MCN connection, the quality experienced at the hybrid MN can be
extended to the destination node through the MCN link. In this context, an unresolved
question is how and when to launch a cellular handover process in MCN transmissions. If
such process was to be launched based on the (single‐hop) cellular link quality
experienced at the destination MN, the handover of the MCN connection would take
place at the same distance to the BS as the handover in traditional single‐hop cellular
networks. On the other hand, this thesis proposes to execute MCN handovers (i.e.
changing the serving cellular BS in a MCN link) at the RNC based on the comparison of
the destination MN’s cellular signal quality with the target BS (labeled ‘Target Cell’ in
Figure 4‐3), and the hybrid MN’s cellular signal quality with the serving BS (labeled

Chapter 4. Experimental Evaluation of Multi‐hop Cellular Networks
62
‘Hybrid Node‐Source Cell’ in Figure 4‐3). Although the cellular transmission in a MCN
connection is conducted through the hybrid MN, the destination MN also sends
periodically its measurements reports to the BS. As a result, the RNC can execute the
proposed MCN handover process by comparing the signal quality for the link destination
MN‐target BS and the link hybrid MN‐source BS. Using the example reported in Figure
4‐3, it is then possible to identify the times at which the MCN handover process would
be executed following this thesis’ proposal. The vertical arrow represents the time at
which the MCN handover would be conducted if the handover was based on the TTT
parameter. If the handover was based on the measured H parameter, vertical arrow
would represent the time at which the MCN handover would be executed. It is
important to note that in both cases, the MCN handover will significantly improve the
end‐user QoS. This is the case because the destination node leaves the source cell with
higher signal strength than in a traditional single‐hop cellular architecture, and it also
perceives a stronger signal when it connects to the target cell. The impact of this MCN
handover process in the end‐user performance (estimated by means of the throughput)
has been illustrated through field test measurements.
4.2.1.1 TestingEnvironment
Urban field trials have been conducted in the scenario shown in Figure 4‐4 in order to
demonstrate how MCN technologies could help improve the QoS in HO areas. Figure 4‐4
illustrates the location of the serving BS and the target BS, and the initial position of the
hybrid MN (H‐MN) and the destination MN (D‐MN) which are placed linearly under LOS
conditions. One MCN configuration with 2 hops and a distance between the hybrid MN
and the destination MN equal to 40 meters is tested (i.e. 2hops‐40m MCN link). In this
scenario, MNs move from one cell to a neighboring cell in order to force a handover (in
this case, Nemo Handy did not lock to a specific BS). Figure 4‐4 represents the HO area
as the area with cellular coverage from the two cells.
HO AreaServing BS
Target BS
H-MN D-MN
Figure 4‐4. Handover field testing environment.

Chapter 4. Experimental Evaluation of Multi‐hop Cellular Networks
63
4.2.1.2 FieldTestResults
The HSDPA performance strongly depends on the implemented radio resource
management algorithms. HSDPA adapts its operation to the link quality through the use
of mechanisms such as Adaptive Modulation and Coding (AMC) and Hybrid‐Automatic
Repeat Request (ARQ). These mechanisms require the mobile terminal to transmit
estimates of the experienced channel quality conditions in the uplink direction; the
channel quality is measured in HSDPA through the CQI parameter. Based on such
estimates, the BS will modify its transmission parameters to ensure a certain QoS target.
In this context, it is important to note that the lower the channel quality, the higher the
number of resources needed to achieve a QoS target.
Figure 4‐5 represents the CQI measurements reported by a MS while it moves from
the serving cell to the target cell and forces the handover execution (Figure 4‐4). As
expected, the channel quality significantly degrades in the HO area, which thereby
requires a significant increase of the mobile terminal’s transmission power in order to
communicate with the BS and send its CQI reports (Figure 4‐6). HSDPA’s link adaptation
mechanism aims at maintaining a BLER between 10% and 20% [20]. Based on the uplink
CQI reports (Figure 4‐5), the HSDPA BS adjusts the transmission power and transmission
mode (modulation, transport block size and number of parallel codes) to guarantee that
the downlink performance is within the target limits. Figure 4‐7 shows that the link
adaptation algorithm implemented in Orange’s network is able to achieve the BLER
target outside the HO area. On the other hand, the worse propagation conditions and
higher interference levels experienced in the HO area difficult the adaptation of the
transmission parameters and results in higher BLER values. As a consequence of the low
channel quality conditions (Figure 4‐5) and the resulting high BLER (Figure 4‐7), the
HSDPA throughput significantly degrades in the HO area (Figure 4‐8). Figure 4‐8 shows
the throughput measured in the case of a single‐hop HSDPA cellular link as the MS
moves from the source cell to the target cell. As shown in Figure 4‐8, the performance
significantly degrades (60‐70% on average) in the HO area due to the lower signal level.
The performance improves rapidly when the HO process ends and the MS connects to
the target cell offering better signal quality.
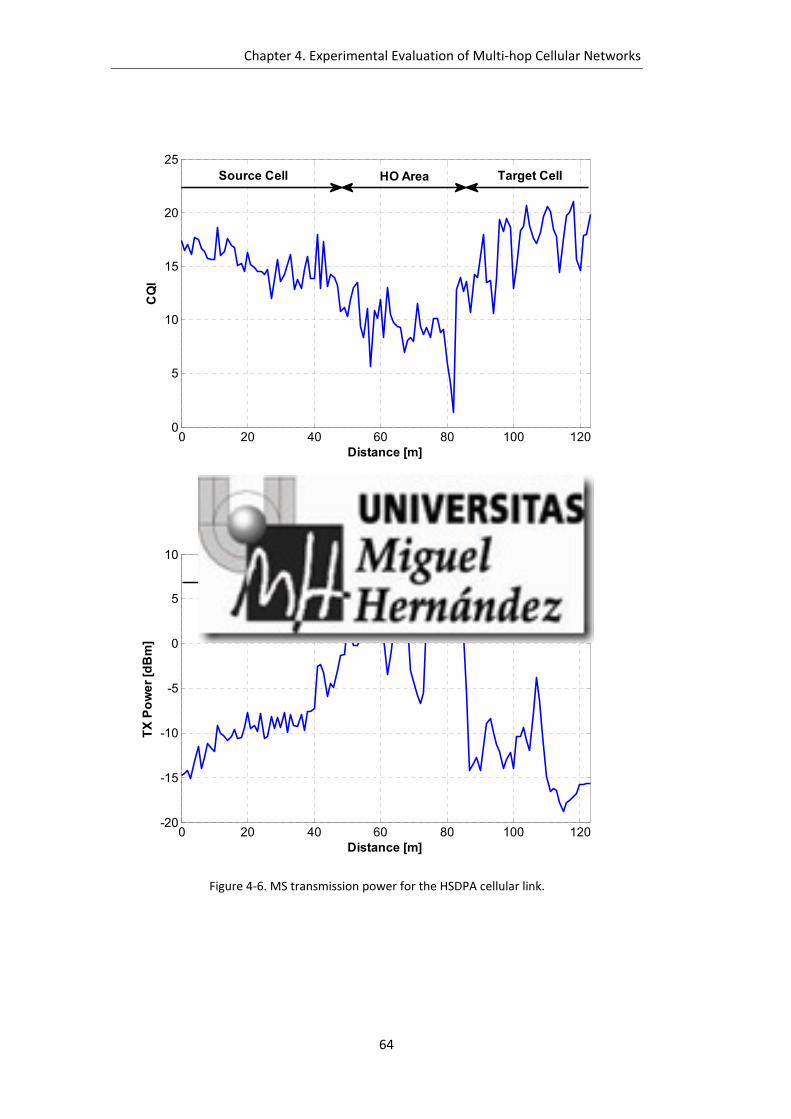
Chapter 4. Experimental Evaluation of Multi‐hop Cellular Networks
64
0 20 40 60 80 100 1200
5
10
15
20
25
Distance [m]
CQ
I
Source Cell HO Area Target Cell
Figure 4‐5. Measured CQI for the HSDPA cellular link.
0 20 40 60 80 100 120-20
-15
-10
-5
0
5
10
Distance [m]
TX
Po
we
r [d
Bm
]
Source Cell HO Area Target Cell
Figure 4‐6. MS transmission power for the HSDPA cellular link.

Chapter 4. Experimental Evaluation of Multi‐hop Cellular Networks
65
0 20 40 60 80 100 1200
10
20
30
40
50
60
Distance [m]
BL
ER
DL
[%
]Source Cell HO Area Target Cell
Figure 4‐7. BLER for the HSDPA cellular link.
0 20 40 60 80 100 1200
1
2
3
4
5
Distance [m]
Th
rou
gh
pu
t [M
bp
s]
Single-hop cellular link
2hops-40m MCN link
Target CellSource Cell HO Area
Figure 4‐8. MCN capacity to improve QoS in handover areas.
MCN technologies can help improve the QoS during a HO by replacing the single‐hop
cellular connection when the MS enters the HO area with an MCN connection using a
hybrid MN located outside the HO area and with good propagation conditions to the
destination node (for example, a hybrid MN located in the same street). This scenario

Chapter 4. Experimental Evaluation of Multi‐hop Cellular Networks
66
was reproduced in the conducted field tests using a hybrid MN that is 40 meters closer
to the serving BS than the destination node. The throughput as the destination MN
crosses the HO area is significantly higher than in the case of a single‐hop cellular link
(Figure 4‐8). It is important to note that the destination MN is connected to the serving
BS through the hybrid MN, and that the distance between the destination and hybrid
MNs was selected so that the hybrid MN does not enter the HO area during the test.
This results in that the MCN connection is capable of guaranteeing to the destination
MN the same quality in the HO area as experienced by the hybrid MN outside the HO
area. Based on the throughput measurements reported in Figure 4‐8, the adoption of
the MCN handover strategy discussed in Section 4.2.1 would then result in that the
destination MN is capable of experiencing a high throughput performance even in the
HO area. In fact, the MCN handover will not be triggered until the hybrid MN reaches
the HO area. If the distance between the hybrid and destination MNs is adequately
selected, the MCN handover would then be triggered when the destination MN has left
the HO area and entered the target cell area, which would again guarantee a high
throughput level when the handover is executed. These unique experimental results
show that MCN technologies could significantly improve the QoS as mobile nodes cross
HO areas in comparison to traditional single‐hop cellular communications.
4.2.2 QoSatLargeDistancestotheServingBS
A major motivation behind the development of relaying techniques in cellular
systems is the possibility to provide the same QoS experienced by users close to a BS to
users at larger distances across the cell area. This can be done by substituting long‐
distance and NLOS single‐hop cellular links by MCN connections using mobile relays and
D2D communications. To extend the QoS experienced close to the BS to larger distances
from the serving BS, multi‐hop MCN links need to experience good LOS conditions
and/or shorter distances among the communicating nodes.
4.2.2.1 TestingEnvironment
The field measurements were carried out in the scenario illustrated in Figure 4‐9. In
this scenario, three different MCN configurations composed of 2, 3 and 4 hops with
increasing distances between mobile relay nodes (from 60 to 120 meters) were tested.
Figure 4‐9 depicts one example of each of these configurations. Figure 4‐9.a corresponds
to the 2hops‐60m MCN link configuration; there is one cellular link and one IEEE 802.11g
ad‐hoc D2D link, and the distance between the destination MN (D‐MN) and the hybrid
MN (H‐MN) is 60 meters. Figure 4‐9.b and Figure 4‐9.c show two examples of the 3hops
and 4hops MCN links configurations with separation distances between MNs of 90
meters and 120 meters, respectively. As it can be appreciated from the examples, the

Chapter 4. Experimental Evaluation of Multi‐hop Cellular Networks
67
location of the destination MN was always fixed at 780 meters distance to the BS. On
the other hand, the location of the hybrid MN and intermediate mobile relay nodes vary
depending on the MCN configuration. Figure 4‐9 shows that the higher the number of
hops, the closer is the hybrid MN to the BS. The D2D links between mobile relay nodes
are characterized by LOS conditions with pedestrians continuously crossing over. In this
scenario, Nemo Handy was locked to the Serving BS in order to prevent cellular
handovers.
4.2.2.2 FieldTestResults
Figure 4‐10 represents the throughput experienced by a single‐hop cellular link and
MCN links under various configurations in the scenario shown in Figure 4‐9. The solid
line in Figure 4‐10 represents the throughput experienced by a single‐hop cellular user
walking away from the BS. As demonstrated in Section 4.2.1 for the Handover scenario,
the cellular QoS decreases with the distance as a result of the higher signal losses and
lower link quality. The cellular HSDPA link can reach data rates above 10 Mbps using
various channelization codes (up to a maximum of 15) and the 16QAM modulation.
Serving BS
D-MNH-MN
a) 2hops‐60m MCN link
Serving BS
D-MNH-MN
b) 3hops‐90m MCN link
Serving BS
D-MNH-MN
c) 4hops‐120m MCN link
Figure 4‐9. QoS at large distances ‐ field testing environment.

Chapter 4. Experimental Evaluation of Multi‐hop Cellular Networks
68
However, the HSDPA performance depends on the link quality conditions, and thereby
on the distance between the cellular user and its serving BS. This can be appreciated in
Table 4‐1 that shows the usage percentage (‘%’) of modulation schemes (‘Modulation’)
and number of channelization codes (‘# Ch. Codes’) at three different locations: close to
the BS (Table 4‐1.a), at an intermediate location (Table 4‐1.b) and at the cell edge (Table
4‐1.c). These measurements correspond to three different samples of Nemo Handy that
evaluates the cellular QoS every 200 ms. Since the HSDPA’s TTI is equal to 2 ms, Nemo
Handy’s samples correspond to 100 TTIs. When the user was located close to the BS
(Table 4‐1.a), the MS used 16QAM and 10 channelization codes in 79 out of the 100 TTIs.
At the intermediate location (Table 4‐1.b), 91 out of the 100 TTIs used QPSK, and at the
cell edge (Table 4‐1.c) more than 50 TTIs used 2 or fewer channelization codes. On
average, the cellular link used the high level modulation mode (i.e. 16QAM) and 10
channelization codes close to the BS. As the user walked away from the BS and the
channel conditions degraded, the cellular link was characterized by a more robust
modulation scheme (i.e. QPSK) and a lower number of channelization codes.
Figure 4‐10 also depicts the throughput measured at the destination MN of the three
MCN configurations. As previously explained, the measured MCN performance is
generally upper‐bounded by the cellular QoS given the lower HSDPA data rates
compared to IEEE 802.11g (this was actually the case for the measurements reported in
Figure 4‐10). As a result, the destination MN achieved the same throughput as the
hybrid MN for all the analyzed MCN configurations. The throughput of the destination
node is therefore depicted at the position at which the hybrid MN was located. For
example, the destination MN located 780 meters away from the BS achieved a
throughput of approximately 4.2 Mbps when operating an MCN link with 4 hops and
distances among mobile relay nodes of 120 meters (i.e. 4hops‐120m MCN
Table 4‐1. Cellular QoS at three different distances to the BS.
a) Close to the BS b) Intermediate location c) Cell edge
% Modulation # Ch. Codes % Modulation # Ch. Codes % Modulation # Ch. Codes
79 16QAM 10 2 16QAM 10 5 QPSK 6
1 QPSK 6 2 QPSK 10 28 QPSK 4
20 n/a n/a 5 QPSK 8 48 QPSK 2
15 QPSK 6 9 QPSK 1
22 QPSK 4 10 n/a n/a
42 QPSK 2
5 QPSK 1
7 n/a n/a

Chapter 4. Experimental Evaluation of Multi‐hop Cellular Networks
69
configuration). This performance is reduced to 3.5 Mbps if the distance among mobile
relay nodes decreases to 90 meters (i.e. 4hops‐90m MCN configuration) since the hybrid
MN is further away from the BS compared to the case in which the distance between
mobile relay nodes is equal to 120 meters. These experimental results clearly show that
MCN technologies using mobile relays and D2D communications can provide nodes
located at large distances from the serving BS with high QoS levels close to those
perceived by nodes located at shorter distances to the serving BS. This will in turn result
in a more efficient use of the radio resources.
4.2.3 CoverageExtension
MCNs allow distant nodes to connect to a cellular BS through other relaying mobile
nodes using D2D communications. This feature can facilitate extending the radio cell
coverage area compared to single‐hop cellular networks, which can be attractive to
provide service in shadow areas or disaster areas where part of the infrastructure is
temporarily unavailable. The MCN cell extension capability could also be beneficial to
balance traffic among neighboring BSs under traffic congestion scenarios. For example, a
node located under a congested cell could connect to the cellular network using a hybrid
mobile relay node located at the cell edge of a less congested neighboring cell.
350 400 450 500 550 600 650 700 750 7800
0.5
1
1.5
2
2.5
3
3.5
4
4.5
5
5.5
6
Distance to the cellular BS [m]
Th
rou
gh
pu
t [M
bp
s]
Single-hop cellular link2hops MCN link3hops MCN link4hops MCN link
2hops-90m
3hops-60m
4hops-90m
4hops-120m
3hops-120m
4hops-60m3hops-90m
2hops-120m
2hops-60m
Figure 4‐10. MCN capacity to improve QoS at large distances from the serving BS.
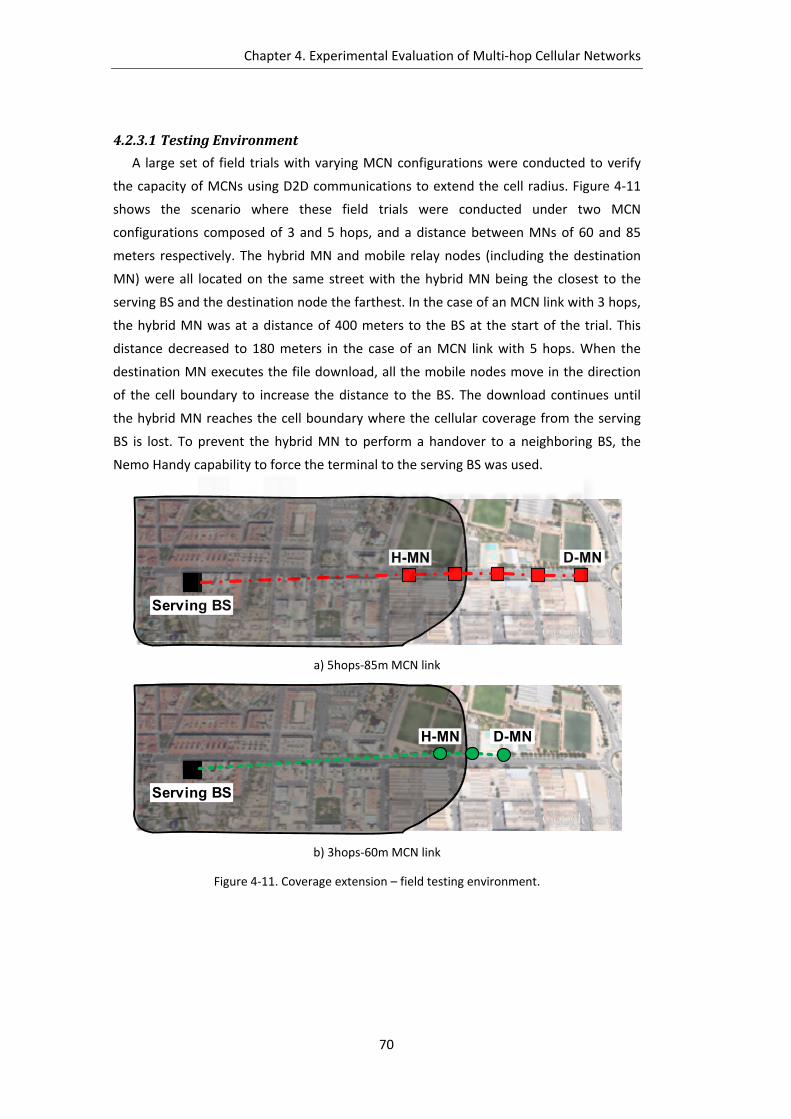
Chapter 4. Experimental Evaluation of Multi‐hop Cellular Networks
70
4.2.3.1 TestingEnvironment
A large set of field trials with varying MCN configurations were conducted to verify
the capacity of MCNs using D2D communications to extend the cell radius. Figure 4‐11
shows the scenario where these field trials were conducted under two MCN
configurations composed of 3 and 5 hops, and a distance between MNs of 60 and 85
meters respectively. The hybrid MN and mobile relay nodes (including the destination
MN) were all located on the same street with the hybrid MN being the closest to the
serving BS and the destination node the farthest. In the case of an MCN link with 3 hops,
the hybrid MN was at a distance of 400 meters to the BS at the start of the trial. This
distance decreased to 180 meters in the case of an MCN link with 5 hops. When the
destination MN executes the file download, all the mobile nodes move in the direction
of the cell boundary to increase the distance to the BS. The download continues until
the hybrid MN reaches the cell boundary where the cellular coverage from the serving
BS is lost. To prevent the hybrid MN to perform a handover to a neighboring BS, the
Nemo Handy capability to force the terminal to the serving BS was used.
Serving BS
D-MNH-MN
a) 5hops‐85m MCN link
Serving BS
D-MNH-MN
b) 3hops‐60m MCN link
Figure 4‐11. Coverage extension – field testing environment.
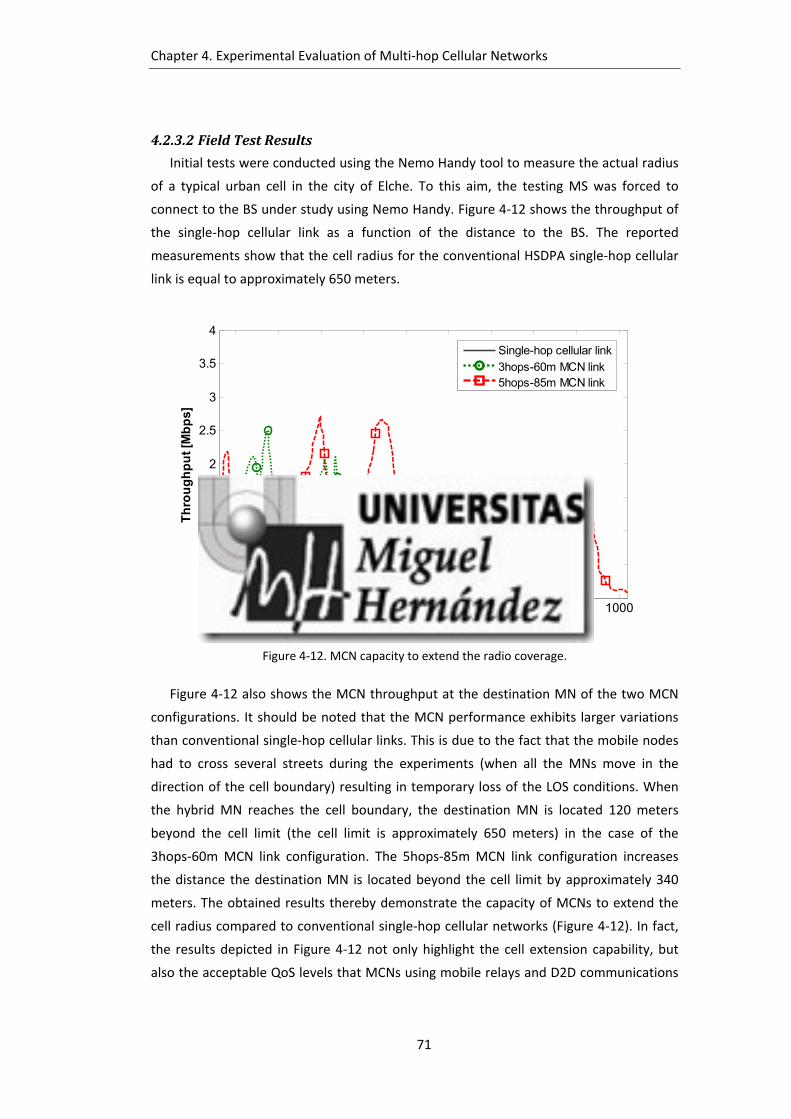
Chapter 4. Experimental Evaluation of Multi‐hop Cellular Networks
71
4.2.3.2 FieldTestResults
Initial tests were conducted using the Nemo Handy tool to measure the actual radius
of a typical urban cell in the city of Elche. To this aim, the testing MS was forced to
connect to the BS under study using Nemo Handy. Figure 4‐12 shows the throughput of
the single‐hop cellular link as a function of the distance to the BS. The reported
measurements show that the cell radius for the conventional HSDPA single‐hop cellular
link is equal to approximately 650 meters.
550 600 650 700 750 800 850 900 950 10000
0.5
1
1.5
2
2.5
3
3.5
4
Distance to the cellular BS [m]
Th
rou
gh
pu
t [M
bp
s]
Single-hop cellular link
3hops-60m MCN link5hops-85m MCN link
Figure 4‐12. MCN capacity to extend the radio coverage.
Figure 4‐12 also shows the MCN throughput at the destination MN of the two MCN
configurations. It should be noted that the MCN performance exhibits larger variations
than conventional single‐hop cellular links. This is due to the fact that the mobile nodes
had to cross several streets during the experiments (when all the MNs move in the
direction of the cell boundary) resulting in temporary loss of the LOS conditions. When
the hybrid MN reaches the cell boundary, the destination MN is located 120 meters
beyond the cell limit (the cell limit is approximately 650 meters) in the case of the
3hops‐60m MCN link configuration. The 5hops‐85m MCN link configuration increases
the distance the destination MN is located beyond the cell limit by approximately 340
meters. The obtained results thereby demonstrate the capacity of MCNs to extend the
cell radius compared to conventional single‐hop cellular networks (Figure 4‐12). In fact,
the results depicted in Figure 4‐12 not only highlight the cell extension capability, but
also the acceptable QoS levels that MCNs using mobile relays and D2D communications

Chapter 4. Experimental Evaluation of Multi‐hop Cellular Networks
72
can provide over the extended coverage areas. As previously discussed, the lower
cellular performance typically results in the QoS level experienced by the destination
node being similar to that experienced by the hybrid MN. The hybrid MN is closer to the
BS in the case of the five‐hop MCN link than in the case of the three‐hop one. As a
result, the 5hops‐85m MCN link configuration provides higher QoS levels than the
conventional single‐hop cellular link and the 3hops‐60m MCN link configuration.
4.2.4 IndoorQoS
Traditional single‐hop cellular transmissions served by outdoor BSs can experience a
notable QoS degradation when entering indoor environments. Cellular operators
therefore have to consider hybrid deployments of macro and small cells. Such hybrid
deployments result in several issues including interference, mobility management and
energy efficiency [95]. In addition, it is required to plan where to strategically place the
small cells based on coverage and capacity needs. An alternative that can help increase
indoor QoS is the use of MCN connections that utilize D2D communications to extend
outdoor QoS levels to indoor environments through the use of mobile relaying nodes.
4.2.4.1 TestingEnvironment
Field trials have been conducted in a shopping center of Elche (Figure 4‐13). The
outdoor cellular BS used for the experiments was located at 500 meters to the entrance
of the shopping center under LOS conditions.
Serving BSD-MN H-MN
Shopping Center
Figure 4‐13. Field testing environment for indoor QoS provisioning using MCNs (example of
4hops‐75m MCN link configuration).
Three different MCN configurations with 2, 3 and 4 hops, and a distance between
MNs of 75 meters were tested. Figure 4‐13 shows an example of the 4hops‐75m MCN
link configuration. At the start of the tests, the hybrid MN (H‐MN) is located outside the
shopping center (75 meters away from the entrance), while the mobile relay nodes and

Chapter 4. Experimental Evaluation of Multi‐hop Cellular Networks
73
the destination MN (D‐MN) are located inside. The distance of the destination node to
the entrance of the shopping center increases with the number of intermediate mobile
nodes in the MCN configuration. When the destination node executes the file download,
all the MNs move 75 meters inward (the hybrid MN ends up just inside the shopping
center). Indoor markers using Nemo Handy were necessary to measure distances due to
the poor indoor GPS signal. At the time of the experiments, the shopping center was
crowded and people were continuously blocking the LOS conditions between the D2D
links.
4.2.4.2 FieldTestResults
Figure 4‐14 shows the RSSI level experienced by a conventional single‐hop HSDPA
connection as the MS walks inside the shopping center and is locked to the outdoor BS
(the negative distances represent the distance to the shopping center entrance). The
conducted experiments show how the RSSI levels sharply decrease as the user walks
inside the shopping centre. The signal attenuation as the user walks inside the shopping
center also results in the rapidly decrease of the throughput experienced by the single‐
hop HSDPA connection depicted in Figure 4‐15. Figure 4‐15 shows that the single‐hop
HSDPA connection is able to maintain the outdoor QoS next to the entrance, but not
inside the shopping center. The obtained results also show that the single‐hop cellular
connectivity is lost (the throughput value is equal to 0) when the MS moves 175 meters
inwards. On the other hand, the results depicted in Figure 4‐15 show that MCN
technologies are capable of increasing indoor QoS performance to levels close to that
experienced in outdoor conditions with better cellular signal quality. For example, Figure
4‐15 shows that the 2hops‐75m MCN link configuration can provide QoS levels close to
those experienced outdoor when the D‐MN is 75 meters inwards. Figure 4‐15 also
shows that the higher number of hops in the MCN configuration results in better QoS
levels at inner regions in the shopping center. The 4hops‐75m MCN link configuration
increases the distance at which outdoor QoS levels can be provided to 225 meters
inwards. The capacity to extend the cellular radio coverage is also observed in the
results depicted in Figure 4‐15 since MCNs are capable of maintaining active
communication links at higher distances than single‐hop cellular systems.

Chapter 4. Experimental Evaluation of Multi‐hop Cellular Networks
74
-75 -50 -25 0 25 50 75 100 125 150 175 200 2250
0.5
1
1.5
2
2.5
3
3.5
4
4.5
5
Distance to the entrance [m]
Th
rou
gh
pu
t [M
bp
s]
Single-hop cellular link2hops-75m MCN link3hops-75m MCN link4hops-75m MCN link
Outdoor Indoor
Figure 4‐15. MCN capacity to improve indoor QoS levels.
4.2.5 QoSunderNLOSConditions
The presence of obstacles can significantly attenuate wireless signals and result in
shadow areas that can prevent providing homogeneous QoS levels across a cell. The
field experiments reported in [24] for LTE‐Advanced with fixed relays showed that the
use of relay nodes can help reduce the disadvantages experienced under single‐hop
-75 -50 -25 0 25 50 75 100 125 150
-75
-70
-65
-60
-55
-50
Distance to the entrance [m]
Ca
rrie
r R
SS
I [d
BM
]Outdoor Indoor
Figure 4‐14. Cellular carrier RSSI as the user walks inside the shopping center.

Chapter 4. Experimental Evaluation of Multi‐hop Cellular Networks
75
cellular NLOS conditions. To do so, relaying technologies, including MCNs, should
replace large‐distance NLOS single‐hop cellular links by shorter‐distance LOS multi‐hop
communications. In this context, the aim of this section is to complement the
conclusions reported in [24], and demonstrate that MCNs using mobile relays and D2D
communications can also enhance the single‐hop cellular performance when a MS
operates under NLOS conditions.
4.2.5.1 TestingEnvironment
The field trials have been conducted in a typical urban cell in the city of Elche with
the destination node turning around an intersection corner (Figure 4‐16). This setting
allows reproducing the traditional signal attenuation experienced when passing from
LOS to NLOS conditions. To do so, the cellular link is locked to the same BS providing
service under LOS conditions, i.e. a cellular handover is not allowed when turning
around the corner. The MCN performance has been analyzed under two different multi‐
hop configurations. Both of them consider a hybrid MN (H‐MN), two mobile relay nodes,
and a destination MN (D‐MN), but with different distances among the mobile nodes (40
and 50 meters). At the start of the experiments (Figure 4‐16.a), the hybrid, mobile relays
and destination MNs are placed linearly under LOS conditions with the serving BS. Once
the file download is executed, the MNs walk towards the intersection corner, with the
destination node being the first to turn around the corner (Figure 4‐16.b). As the file
download continues the mobile relay nodes and finally the hybrid MN reach the corner
(Figure 4‐16.c).
4.2.5.2 FieldTestResults
Figure 4‐17 shows the RSSI levels experienced by a single‐hop cellular link when
experiencing LOS and NLOS conditions as the MS turns around the intersection corner.
The negative distances represent the distance to the corner under LOS conditions, and
the positive ones the NLOS distances after turning the corner. The reported
measurements show how the single‐hop RSSI levels maintain an acceptable level under
LOS conditions, but rapidly decrease after turning around the corner and the MS enters
NLOS conditions with the serving BS. The low RSSI levels after the MS enters NLOS
conditions result in the low throughput measurements reported in Figure 4‐18. The
obtained measurements show that the single‐hop cellular QoS cannot be maintained
under NLOS conditions.

Chapter 4. Experimental Evaluation of Multi‐hop Cellular Networks
76
Serving BS
D-MN H-MN
NLOS
LOS
a) Initial deployment with all MNs under LOS conditions
Serving BS
D-MN
H-MN
b) The D‐MN reaches the intersection corner and experiment
NLOS conditions with its precursor mobile node
Serving BS
D-MN
H-MN
c) The H‐MN reaches the intersection corner and experiences
NLOS conditions with the BS
Figure 4‐16. QoS under NLOS conditions ‐ field testing environment.
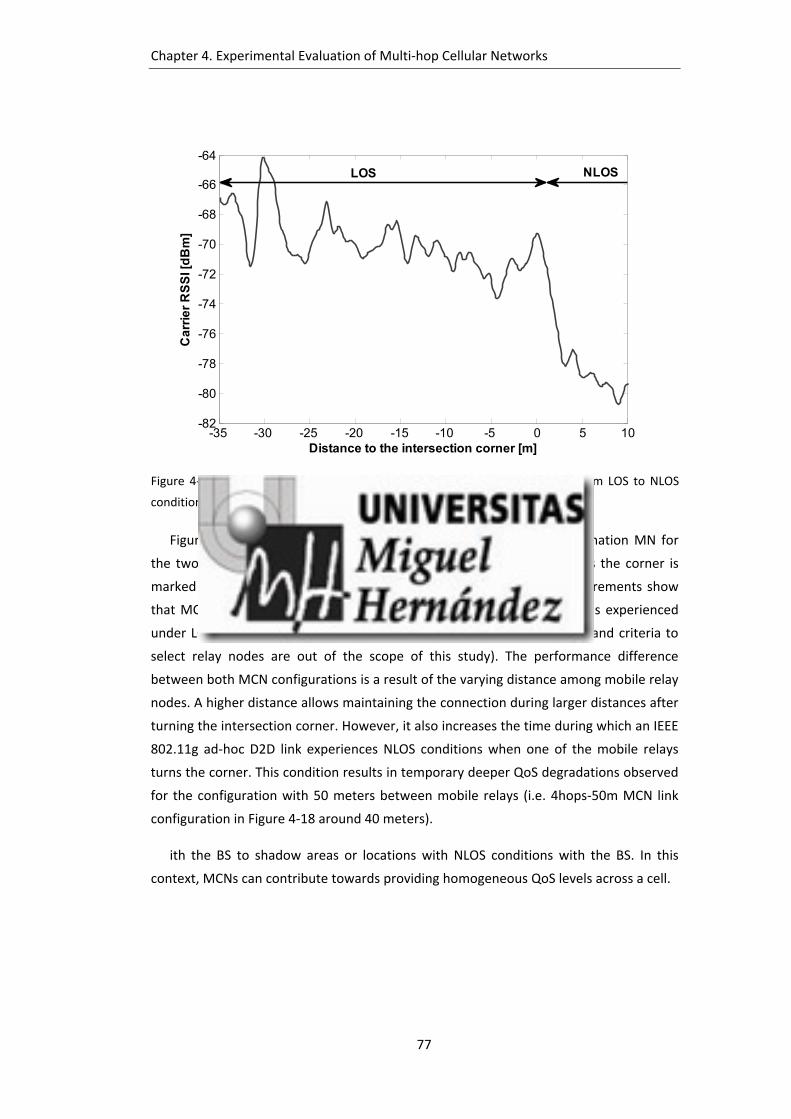
Chapter 4. Experimental Evaluation of Multi‐hop Cellular Networks
77
-35 -30 -25 -20 -15 -10 -5 0 5 10-82
-80
-78
-76
-74
-72
-70
-68
-66
-64
Distance to the intersection corner [m]
Ca
rrie
r R
SS
I [d
Bm
]LOS NLOS
Figure 4‐17. A cellular carrier RSSI level experienced by the MS as it walks from LOS to NLOS
conditions with the BS.
Figure 4‐18 also represents the throughput experienced at the destination MN for
the two MCN configurations. The point at which the hybrid MN reaches the corner is
marked in Figure 4‐18 for each MCN configuration. The reported measurements show
that MCN technologies can improve the NLOS QoS performance to levels experienced
under LOS when adequately selecting the relay nodes (the mechanisms and criteria to
select relay nodes are out of the scope of this study). The performance difference
between both MCN configurations is a result of the varying distance among mobile relay
nodes. A higher distance allows maintaining the connection during larger distances after
turning the intersection corner. However, it also increases the time during which an IEEE
802.11g ad‐hoc D2D link experiences NLOS conditions when one of the mobile relays
turns the corner. This condition results in temporary deeper QoS degradations observed
for the configuration with 50 meters between mobile relays (i.e. 4hops‐50m MCN link
configuration in Figure 4‐18 around 40 meters).
ith the BS to shadow areas or locations with NLOS conditions with the BS. In this
context, MCNs can contribute towards providing homogeneous QoS levels across a cell.

Chapter 4. Experimental Evaluation of Multi‐hop Cellular Networks
78
-25 0 25 50 75 100 125 1500
0.5
1
1.5
2
2.5
3
3.5
4
4.5
5
Distance to the intersection corner [m]
Th
rou
gh
pu
t [M
bp
s]
Single-hop celllular link4hops-40m MCN link4hops-50m MCN link
NLOSLOS
Figure 4‐18. MCN capacity to improve NLOS QoS levels.
4.2.6 EnergyEfficiency
Previous analytical and simulation‐based studies (e.g. [18] and [96]) emphasized the
possible energy consumption benefits of MCN communications. To experimentally
evaluate this benefit, additional field tests have been conducted. These tests
concentrate on uplink transmissions since energy gains for downlink transmissions are
expected from the power management and saving techniques implemented at BSs. To
measure such gains in downlink transmissions, access to operational BSs would have
been necessary which was not possible for the authors at the time this study was
conducted.
4.2.6.1 TestingEnvironment
The field tests conducted at the Miguel Hernández University of Elche compare the
energy consumed by a single‐hop uplink HSUPA cellular connection with that consumed
by a two‐hop MCN connection (Figure 4‐19). In the case of the single‐hop uplink HSUPA
connection, the MS was static and located inside a building (the MS was 30 meters away
from the entrance of the building). The serving cellular BS was located 200 meters away
from the entrance of the building. The BS had LOS conditions with the entrance of the
building and NLOS conditions with the MS. In the case of the two‐hop MCN connection,
the destination MN is located at the same location than the MS in the single‐hop uplink
HSUPA connection. It is important to note that the destination MN (D‐MN in Figure
4‐19) is actually the source of information since the field tests concentrates on uplink
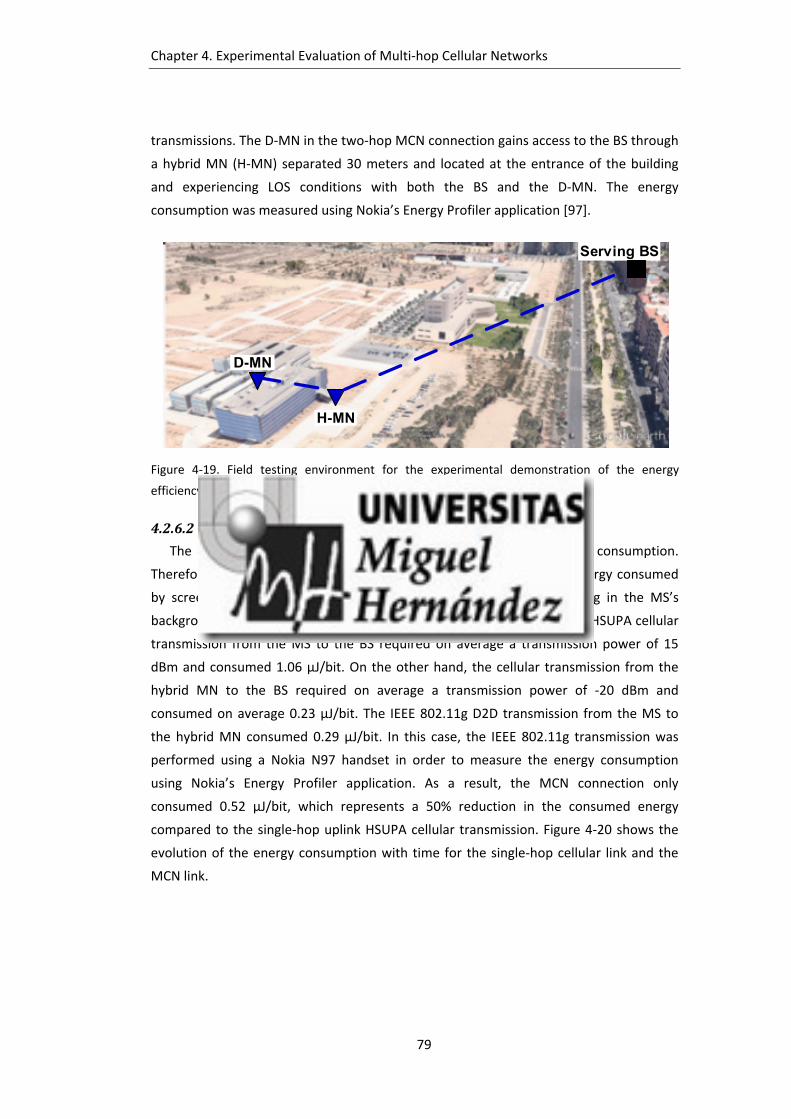
Chapter 4. Experimental Evaluation of Multi‐hop Cellular Networks
79
transmissions. The D‐MN in the two‐hop MCN connection gains access to the BS through
a hybrid MN (H‐MN) separated 30 meters and located at the entrance of the building
and experiencing LOS conditions with both the BS and the D‐MN. The energy
consumption was measured using Nokia’s Energy Profiler application [97].
Serving BS
D-MN
H-MN
Figure 4‐19. Field testing environment for the experimental demonstration of the energy
efficiency benefits of MCNs using mobile relays.
4.2.6.2 FieldTestResults
The conducted field tests aim at measuring the transmission energy consumption.
Therefore, the measured energy consumption does not consider the energy consumed
by screen‐backlight, Bluetooth and other applications/processes running in the MS’s
background. The conducted field tests showed that the single‐hop uplink HSUPA cellular
transmission from the MS to the BS required on average a transmission power of 15
dBm and consumed 1.06 µJ/bit. On the other hand, the cellular transmission from the
hybrid MN to the BS required on average a transmission power of ‐20 dBm and
consumed on average 0.23 µJ/bit. The IEEE 802.11g D2D transmission from the MS to
the hybrid MN consumed 0.29 µJ/bit. In this case, the IEEE 802.11g transmission was
performed using a Nokia N97 handset in order to measure the energy consumption
using Nokia’s Energy Profiler application. As a result, the MCN connection only
consumed 0.52 µJ/bit, which represents a 50% reduction in the consumed energy
compared to the single‐hop uplink HSUPA cellular transmission. Figure 4‐20 shows the
evolution of the energy consumption with time for the single‐hop cellular link and the
MCN link.

Chapter 4. Experimental Evaluation of Multi‐hop Cellular Networks
80
0 50 100 150 2000
0.2
0.4
0.6
0.8
1
1.2
1.4
1.6
1.8
2
Time [s]
En
erg
y c
on
su
mp
tio
n [
J/b
it]
Single-hop cellular link
2hops-30m MCN link
Figure 4‐20. MCN capacity to reduce energy consumption.
4.3 SummaryandDiscussion
Multi‐hop cellular networks have been proposed to overcome certain limitations of
conventional cellular architectures in terms of QoS, capacity and energy consumption
among others. However, to date, no study had ever experimentally evaluated the QoS
benefits of multi‐hop cellular networking using mobile relays. In this context, this thesis
has presented the results of an extensive field testing campaign conducted to evaluate
the performance of MCN networks, and the conditions under which they can overcome
the limitations of conventional single‐hop cellular systems. These results represent
therefore the first field trials measurements that validate the potential of MCNs using
mobile relays and D2D communications. The study has been conducted using HSPA and
IEEE 802.11g for the cellular and D2D links of the MCN connection. However, the
reported trends with regards to the benefits of MCNs with respect to single‐hop cellular
systems are likely to be maintained using different radio access technologies, as long as
the MCN connection is upper‐bounded by the cellular link between the H‐MN and the
BS. In particular, the conducted field tests have experimentally proved the capacity of
MCN technologies to increase the QoS while crossing handover areas and at large
distances to the serving BS. The obtained results have also demonstrated that the use of
mobile relays and D2D communications in MCNs can help extend the cellular coverage
area beyond its physical limits and from outdoor to indoor environments. Finally, the
conducted field tests have also experimentally demonstrated the capacity of MCN
networks using mobile relays to reduce the energy consumption.

81
5 EmpiricalModelsoftheMCN
CommunicationsPerformance
The field tests reported in Chapter 4 have provided very valuable data to evaluate
and characterize the performance of MCNs using D2D communications. Field test
measurements can also be used to derive models useful to the community. In this
context, this thesis presents a unique set of empirical models of the communications
performance achieved with MCNs that utilize D2D communications. The models take
into account the impact of distance, propagation/visibility conditions, number of hops
and communication settings. The proposed models can help design, test and optimize in
analytical and simulation studies, novel communications and networking protocols
tailored for MCNs. For example, the derived models could help design:
Techniques to integrate MCNs in heterogeneous wireless networks. Future
cellular/wireless ecosystems will be characterized by the coexistence of multiple
but complementary radio access technologies [58]. Mechanisms are necessary
to select the most adequate technology at each point in time. The inclusion of
MCNs in heterogeneous wireless networks needs to take into account both their
benefit (e.g. QoS, capacity, and energy‐efficiency) and cost (e.g. communications
overhead). In this context, the models here presented could help identify the
conditions under which MCNs would be a viable communications alternative in
heterogeneous wireless networks.

Chapter 5. Empirical Models of the MCN Communications Performance
82
Routing protocols for MCNs using D2D communications. MCNs networks utilizing
D2D communications require establishing a path between source and
destination using intermediate mobile devices to forward the information [64],
[98]. The selection of forwarding nodes can strongly influence the end‐to‐end
performance. The proposed models could help select relay nodes that ensure
reliable routes that guarantee the target end‐to‐end performance. The models
can also be used to compare the performance of different routing protocols.
Opportunistic networking in MCNs using D2D communications. Opportunistic
networking mechanisms can be designed to exploit the delay tolerance of
mobile data services in order to reduce the energy consumption and improve
the network’s capacity [99], [100]. These mechanisms need to determine the
conditions and time instant at which mobile devices storing information could
forward it to the final destination. The proposed models can be used to identify
the conditions under which opportunistic networking schemes can help improve
the operation and performance of MCNs.
The rest of this chapter is organized as follows. Section 5.1 describes the conditions
under which the field trials used to derive the empirical models have been conducted.
Section 5.2 proposes an empirical model for the communications performance of two‐
hop MCNs using D2D communications. The modeling process is then extended to a
larger number of hops in Sections 5.3 and 5.4.
5.1 ExperimentalConditions
5.1.1 TestingEnvironment
The field tests have been conducted in the city of Elche (Spain) using Orange’s live
network and the mHOP testbed. The field tests analyze the impact of propagation
conditions, distance and number of hops, and communication settings on the
performance of MCNs using D2D communications. Tests are conducted for different
distances between the Hybrid Mobile Node (HN) and the Base Station (BS). During the
tests, the mobile relays and the Destination Mobile Node (DN) vary their locations
depending on the number of hops and the conditions under study. The field tests were
conducted in a long and straight four‐lane avenue close to the Miguel Hernandez
University of Elche. The avenue ensured LOS conditions between the HN and the mobile
relays when they were located at the same side of the avenue. The NLOS conditions
were achieved locating the HN and the mobile relay nodes in opposite sidewalks of the
Chapter 5. Empirical Models of the MCN Communications Performance
83
avenue, with vehicles continuously crossing over and dense vegetation in the avenue’s
median.
The tests start when all nodes execute a script that establishes the cellular
connection from the HN to its serving BS, and the D2D links between the mobile relay
nodes (see Section 3.3). During the tests, the iperf network testing tool [101] is used to
transfer UDP packets from a server located at the UWICORE lab to the mobile DN. UDP
traffic was used since it allows identifying the radio link that represents the bottleneck
of a multi‐hop transmission. This feature was very valuable to analyze separately the
performance of various links of a MCN connection. Iperf allows specifying the size of the
UDP packets that were set to the largest allowed Ethernet size at the network layer, i.e.
1548 bytes including headers. The cellular connection uses HSPA7. D2D links are
established using IEEE 802.11g. This technology was selected over IEEE 802.11a to
benefit from the better propagation conditions experienced at 2.4 GHz compared to 5
GHz [87]. IEEE 802.11g provides a theoretical maximum bit rate of 54 Mbps and defines
a maximum transmission power of 27 dBm. However, the transmission power was
limited to 19 dBm in compliance with the Spanish regulations (limit is established at 20
dBm). Unless otherwise specified, the data rate and transmission power in D2D links
were dynamically modified based on the link quality conditions and the adaptive
mechanisms implemented in the IEEE 802.11 cards’ driver. Additional field tests were
conducted fixing the data rate and the transmission power.
5.1.2 PerformanceMetric
The communications performance of the single‐hop and MCN connections is
measured in terms of the throughput experienced at the mobile DN. As it has been
described in Section 4.1.1, the throughput performance (whether single‐hop cellular or
MCN) is here computed as the ratio between the measured throughput and the usage
parameter in order to reduce the impact of the radio resource management policies on
the conducted study. The selected metric results in that the MS located close to the BS
would experience a higher throughput than the MS located at the cell edge (the
empirical demonstration is presented in Section 4.1.1).
7 LTE was not available in Elche at the time these field tests were conducted. The study defines
the conditions to extend the derived models to other cellular technologies.
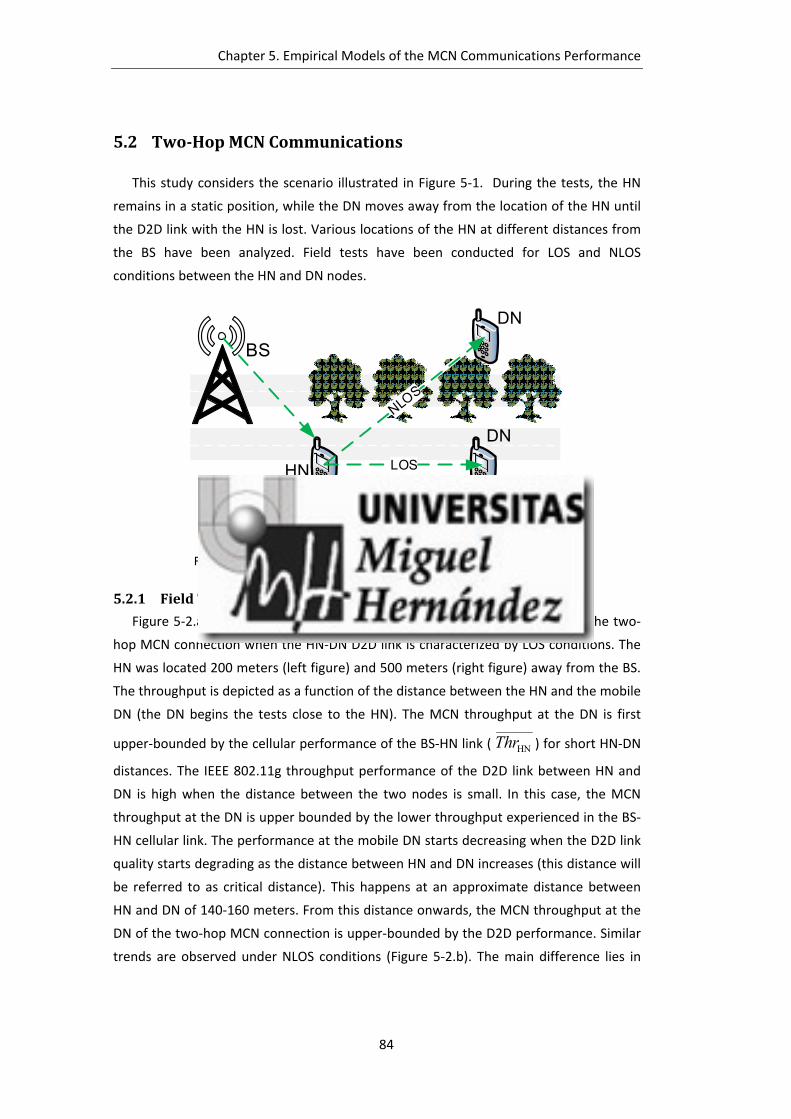
Chapter 5. Empirical Models of the MCN Communications Performance
84
5.2 Two‐HopMCNCommunications
This study considers the scenario illustrated in Figure 5‐1. During the tests, the HN
remains in a static position, while the DN moves away from the location of the HN until
the D2D link with the HN is lost. Various locations of the HN at different distances from
the BS have been analyzed. Field tests have been conducted for LOS and NLOS
conditions between the HN and DN nodes.
LOS
Distance BS – HN Distance HN – DN
BS
HN
DN
DN
Figure 5‐1. Testing environment for two‐hop MCN communications.
5.2.1 FieldTests
Figure 5‐2.a shows two examples of throughput experienced at the DN for the two‐
hop MCN connection when the HN‐DN D2D link is characterized by LOS conditions. The
HN was located 200 meters (left figure) and 500 meters (right figure) away from the BS.
The throughput is depicted as a function of the distance between the HN and the mobile
DN (the DN begins the tests close to the HN). The MCN throughput at the DN is first
upper‐bounded by the cellular performance of the BS‐HN link ( HNThr ) for short HN‐DN
distances. The IEEE 802.11g throughput performance of the D2D link between HN and
DN is high when the distance between the two nodes is small. In this case, the MCN
throughput at the DN is upper bounded by the lower throughput experienced in the BS‐
HN cellular link. The performance at the mobile DN starts decreasing when the D2D link
quality starts degrading as the distance between HN and DN increases (this distance will
be referred to as critical distance). This happens at an approximate distance between
HN and DN of 140‐160 meters. From this distance onwards, the MCN throughput at the
DN of the two‐hop MCN connection is upper‐bounded by the D2D performance. Similar
trends are observed under NLOS conditions (Figure 5‐2.b). The main difference lies in
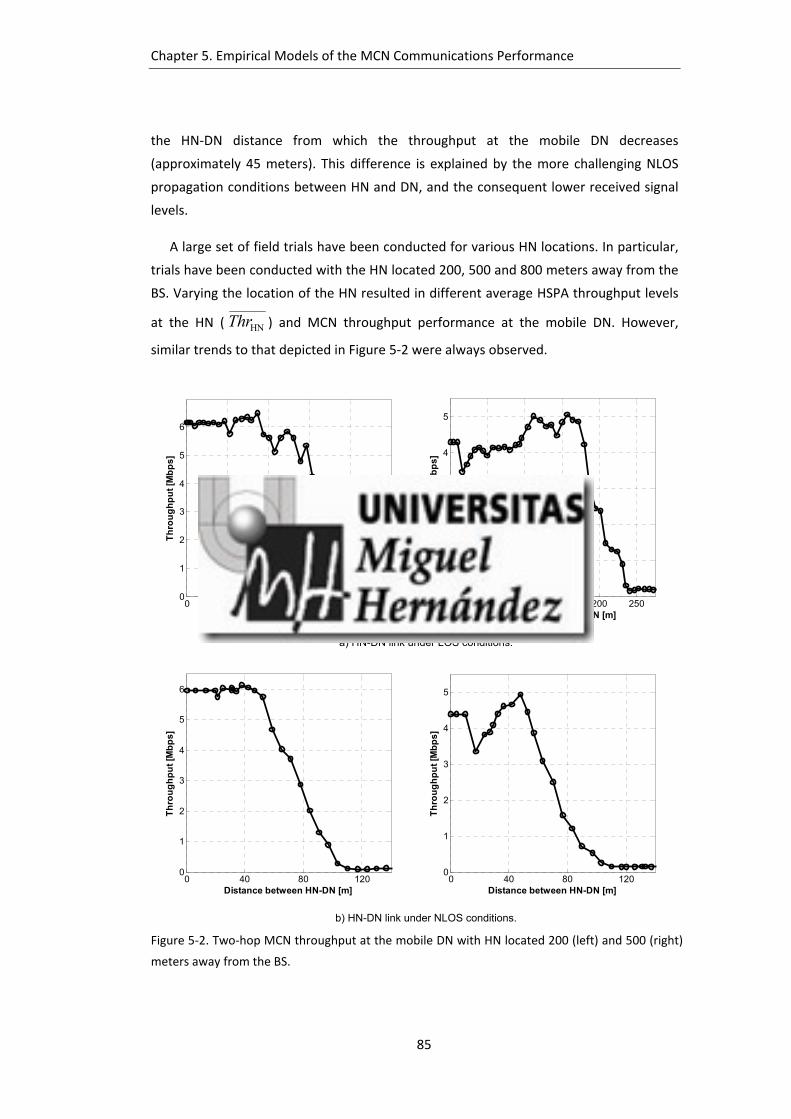
Chapter 5. Empirical Models of the MCN Communications Performance
85
the HN‐DN distance from which the throughput at the mobile DN decreases
(approximately 45 meters). This difference is explained by the more challenging NLOS
propagation conditions between HN and DN, and the consequent lower received signal
levels.
A large set of field trials have been conducted for various HN locations. In particular,
trials have been conducted with the HN located 200, 500 and 800 meters away from the
BS. Varying the location of the HN resulted in different average HSPA throughput levels
at the HN ( HNThr ) and MCN throughput performance at the mobile DN. However,
similar trends to that depicted in Figure 5‐2 were always observed.
0 50 100 150 2000
1
2
3
4
5
6
Distance between HN-DN [m]
Th
rou
gh
pu
t [M
bp
s]
0 50 100 150 200 2500
1
2
3
4
5
Distance between HN-DN [m]
Th
rou
gh
pu
t [M
bp
s]
a) HN-DN link under LOS conditions.
0 40 80 1200
1
2
3
4
5
6
Distance between HN-DN [m]
Th
rou
gh
pu
t [M
bp
s]
0 40 80 1200
1
2
3
4
5
Distance between HN-DN [m]
Th
rou
gh
pu
t [M
bp
s]
b) HN-DN link under NLOS conditions.
Figure 5‐2. Two‐hop MCN throughput at the mobile DN with HN located 200 (left) and 500 (right)
meters away from the BS.
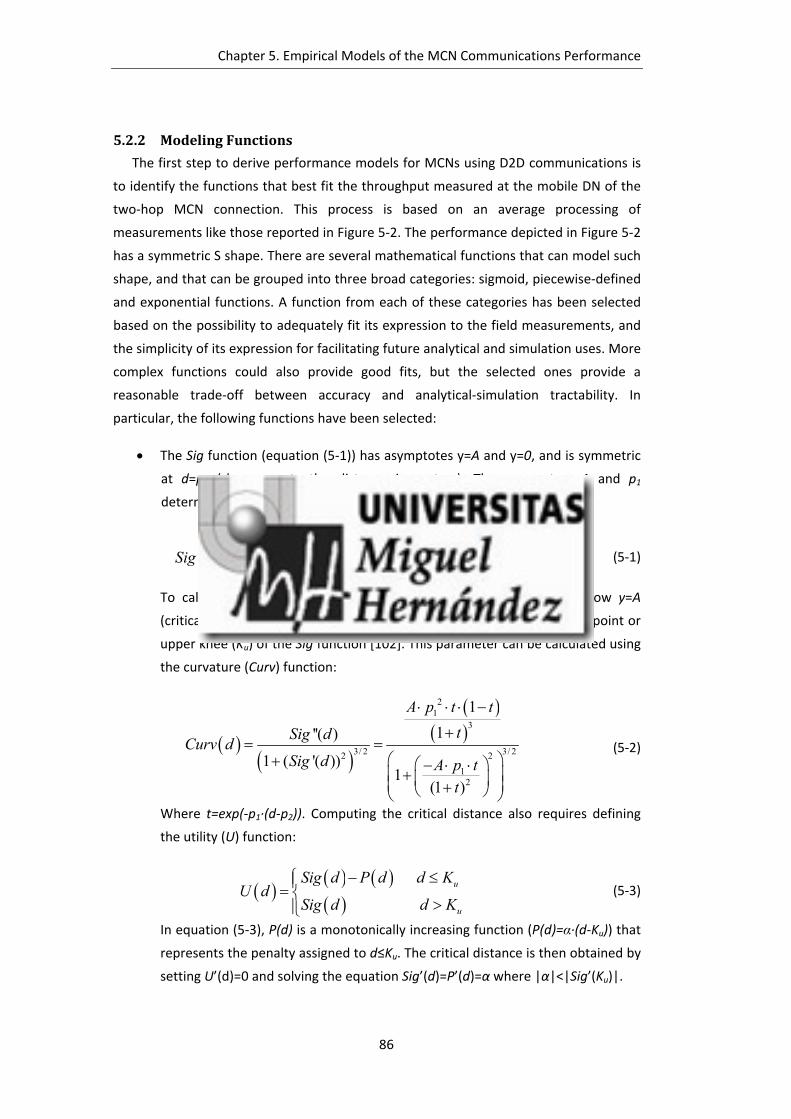
Chapter 5. Empirical Models of the MCN Communications Performance
86
5.2.2 ModelingFunctions
The first step to derive performance models for MCNs using D2D communications is
to identify the functions that best fit the throughput measured at the mobile DN of the
two‐hop MCN connection. This process is based on an average processing of
measurements like those reported in Figure 5‐2. The performance depicted in Figure 5‐2
has a symmetric S shape. There are several mathematical functions that can model such
shape, and that can be grouped into three broad categories: sigmoid, piecewise‐defined
and exponential functions. A function from each of these categories has been selected
based on the possibility to adequately fit its expression to the field measurements, and
the simplicity of its expression for facilitating future analytical and simulation uses. More
complex functions could also provide good fits, but the selected ones provide a
reasonable trade‐off between accuracy and analytical‐simulation tractability. In
particular, the following functions have been selected:
The Sig function (equation (5‐1)) has asymptotes y=A and y=0, and is symmetric
at d=p2 (d represents the distance in meters). The parameters A and p1
determine the maximum slope (A∙p1/4) of the Sig function at d=p2.
1 21 2
1, , 1 , 0,...,
1p d p
Sig p p d A d Me
(5‐1)
To calculate the distance d at which the Sig function decreases below y=A
(critical distance), it is first necessary to define the maximum curvature point or
upper knee (Ku) of the Sig function [102]. This parameter can be calculated using
the curvature (Curv) function:
21
3
3/ 2 3/ 222
12
1
1''( )
1 ( '( ))1
(1 )
A p t t
tSig dCurv d
Sig d A p tt
(5‐2)
Where t=exp(‐p1∙(d‐p2)). Computing the critical distance also requires defining
the utility (U) function:
u
u
Sig d P d d KU d
Sig d d K
(5‐3)
In equation (5‐3), P(d) is a monotonically increasing function (P(d)=α∙(d‐Ku)) that
represents the penalty assigned to d≤Ku. The critical distance is then obtained by
setting U’(d)=0 and solving the equation Sig’(d)=P’(d)=α where |α|<|Sig’(Ku)|.

Chapter 5. Empirical Models of the MCN Communications Performance
87
The Part function (equation (5‐4)) is defined by the asymptotes y=A and y=0
when d is smaller than p1 and higher than p2 respectively. Otherwise, Part
function is characterized by a slope equal to (‐A/(p2‐p1)). The Part function is
symmetric in d=(p2‐p1)/2 and its critical distance is located at p1.
1
1 2 1 22
2
1 1, , , 0,...,
0
A d p
Part p p d k p d p d Md p
p d
(5‐4)
where k=A/(1/p1‐1/p2).
The Exp function (equation (5‐5)) is defined as:
2
11 2, , , 0,...,
pp dExp p p d A e d M
(5‐5)
Following a similar analysis to that conducted for the Sig function, it is possible
to determine the critical distance for the Exp function.
The three selected functions are defined by the parameters d, A, p1 and p2. When
applied to modeling the throughput of the MCN connection, d is defined as the distance
between the HN and the mobile DN. A represents the average cellular throughput
measured at the HN ( HNThr ) for distances smaller than the critical distance. Finally, p1
and p2 are the variables or fitting parameters that modify the characteristics of the S‐
shaped functions:
Length of the upper asymptote, i.e. the distance at which the MCN throughput
starts decreasing or critical distance.
Slope of the curve, i.e. how fast the MCN throughput decreases with the distance
from the critical distance point.
The start of the lower asymptote, i.e. the distance at which the MCN throughput
is negligible because the D2D connectivity is lost.
Curve fitting is one of the common techniques used to derive the fitting parameters
of a modeling function from empirical data. This method seeks minimizing the
residue/difference between the measured data and the proposed modeling function.
Different estimators can be used to calculate the residue. The least‐squares estimator
produces the maximum‐likelihood estimate of the parameters when the errors are
distributed along the modeling function [103], which is actually the case for the MCN
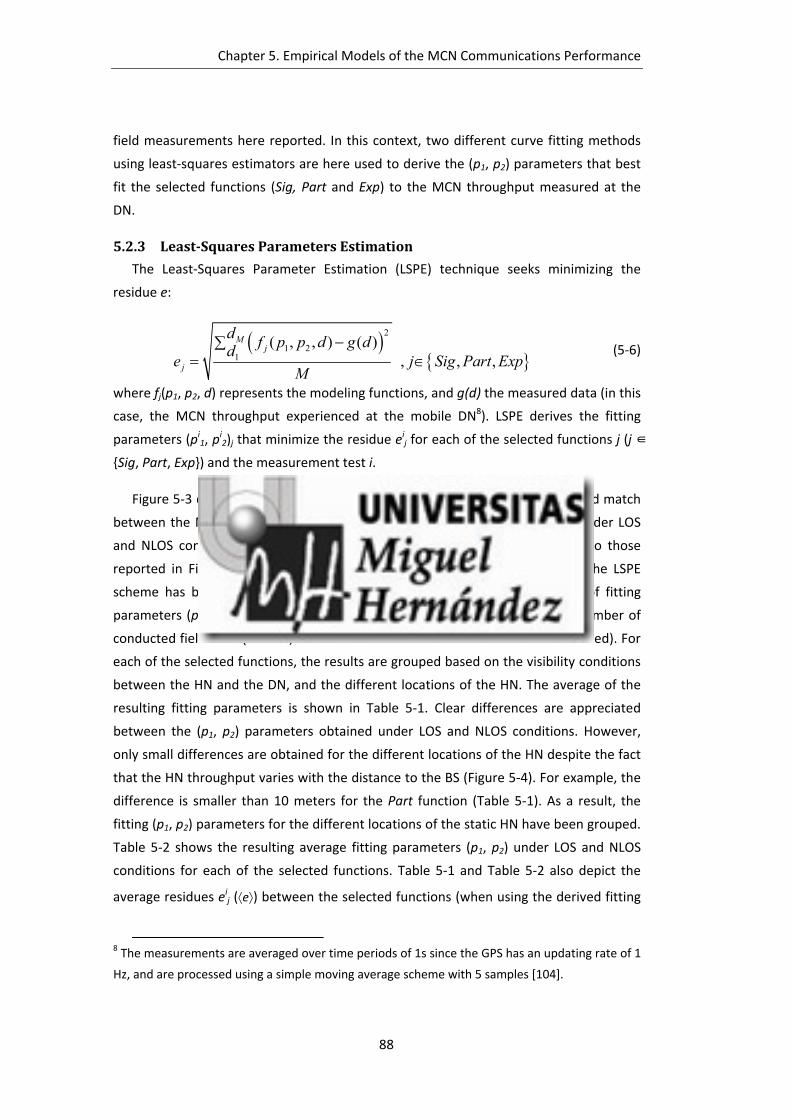
Chapter 5. Empirical Models of the MCN Communications Performance
88
field measurements here reported. In this context, two different curve fitting methods
using least‐squares estimators are here used to derive the (p1, p2) parameters that best
fit the selected functions (Sig, Part and Exp) to the MCN throughput measured at the
DN.
5.2.3 Least‐SquaresParametersEstimation
The Least‐Squares Parameter Estimation (LSPE) technique seeks minimizing the
residue e:
2
1 21
( , , ) ( ), , ,
Mj
j
df p p d g d
de j Sig Part Exp
M
(5‐6)
where fj(p1, p2, d) represents the modeling functions, and g(d) the measured data (in this
case, the MCN throughput experienced at the mobile DN8). LSPE derives the fitting
parameters (pi1, pi2)j that minimize the residue eij for each of the selected functions j (j ∈
{Sig, Part, Exp}) and the measurement test i.
Figure 5‐3 depicts an example showing that LSPE is capable to achieve a good match
between the MCN throughput at the mobile DN and the selected functions under LOS
and NLOS conditions. The measurements analyzed in Figure 5‐3 correspond to those
reported in Figure 5‐2 with the HN located 200 meters away from the BS. The LSPE
scheme has been applied to all field measurements, which results in a set of fitting
parameters (pi1, pi2)j and residues e
ij (∀ i ∈ {1, …,T}, with T representing the number of
conducted field tests (in total, more than 100 field measurements were conducted). For
each of the selected functions, the results are grouped based on the visibility conditions
between the HN and the DN, and the different locations of the HN. The average of the
resulting fitting parameters is shown in Table 5‐1. Clear differences are appreciated
between the (p1, p2) parameters obtained under LOS and NLOS conditions. However,
only small differences are obtained for the different locations of the HN despite the fact
that the HN throughput varies with the distance to the BS (Figure 5‐4). For example, the
difference is smaller than 10 meters for the Part function (Table 5‐1). As a result, the
fitting (p1, p2) parameters for the different locations of the static HN have been grouped.
Table 5‐2 shows the resulting average fitting parameters (p1, p2) under LOS and NLOS
conditions for each of the selected functions. Table 5‐1 and Table 5‐2 also depict the
average residues eij (⟨e⟩) between the selected functions (when using the derived fitting
8 The measurements are averaged over time periods of 1s since the GPS has an updating rate of 1
Hz, and are processed using a simple moving average scheme with 5 samples [104].

Chapter 5. Empirical Models of the MCN Communications Performance
89
0 50 100 150 2000
1
2
3
4
5
6
7
Distance between HN-DN [m]
Th
rou
gh
pu
t [M
bp
s]
LSPE-Exp
MCN
0 40 80 1200
1
2
3
4
5
6
7
Distance between HN-DN [m]
Th
rou
gh
pu
t [M
bp
s]
LSPE-Exp
MCN
a) LSPE fitting with Exp function.
0 50 100 150 2000
1
2
3
4
5
6
7
Distance between HN-DN [m]
Th
rou
gh
pu
t [M
bp
s]
LSPE-Part
MCN
0 40 80 1200
1
2
3
4
5
6
7
Distance between HN-DN [m]
Th
rou
gh
pu
t [M
bp
s]
LSPE-Part
MCN
b) LSPE fitting with Part function.
0 50 100 150 2000
1
2
3
4
5
6
7
Distance between HN-DN [m]
Th
rou
gh
pu
t [M
bp
s]
LSPE-SigMCN
0 40 80 1200
1
2
3
4
5
6
7
Distance between HN-DN [m]
Th
rou
gh
pu
t [M
bp
s]
LSPE-Sig
MCN
c) LSPE fitting with Sig function.
Figure 5‐3. LSPE fitting of the two‐hop MCN throughput measured at the mobile DN as it moves
away from the location of the HN under LOS (left) and NLOS (right) conditions.
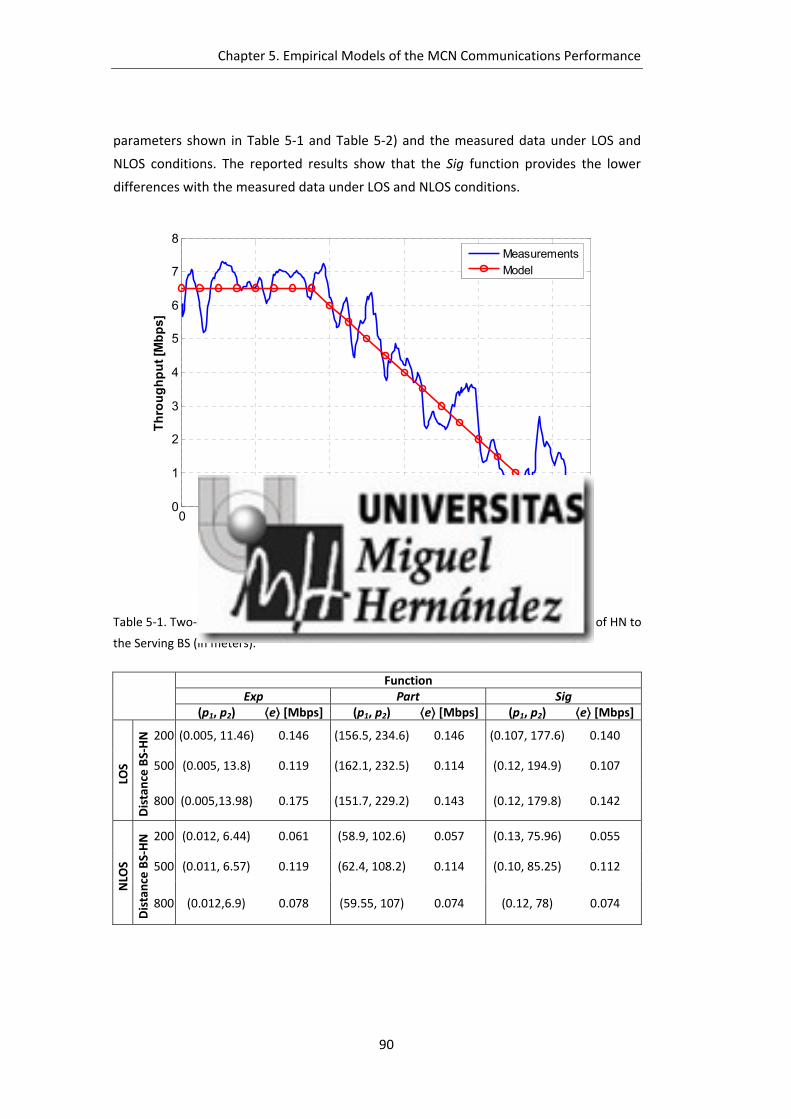
Chapter 5. Empirical Models of the MCN Communications Performance
90
parameters shown in Table 5‐1 and Table 5‐2) and the measured data under LOS and
NLOS conditions. The reported results show that the Sig function provides the lower
differences with the measured data under LOS and NLOS conditions.
0 200 400 600 800 10000
1
2
3
4
5
6
7
8
Distance to the cellular BS [m]
Th
rou
gh
pu
t [M
bp
s]
Measurements
Model
Figure 5‐4. HSPA throughput.
Table 5‐1. Two‐hop MCN LSPE (p1, p2) as a function of LOS/NLOS conditions and distance of HN to
the Serving BS (in meters).
Function Exp Part Sig (p1, p2) ⟨e⟩ [Mbps] (p1, p2) ⟨e⟩ [Mbps] (p1, p2) ⟨e⟩ [Mbps]
LOS
Distance BS‐HN
200 (0.005, 11.46) 0.146 (156.5, 234.6) 0.146 (0.107, 177.6) 0.140
500 (0.005, 13.8) 0.119 (162.1, 232.5) 0.114 (0.12, 194.9) 0.107
800 (0.005,13.98) 0.175 (151.7, 229.2) 0.143 (0.12, 179.8) 0.142
NLO
S
Distance BS‐HN 200 (0.012, 6.44) 0.061 (58.9, 102.6) 0.057 (0.13, 75.96) 0.055
500 (0.011, 6.57) 0.119 (62.4, 108.2) 0.114 (0.10, 85.25) 0.112
800 (0.012,6.9) 0.078 (59.55, 107) 0.074 (0.12, 78) 0.074
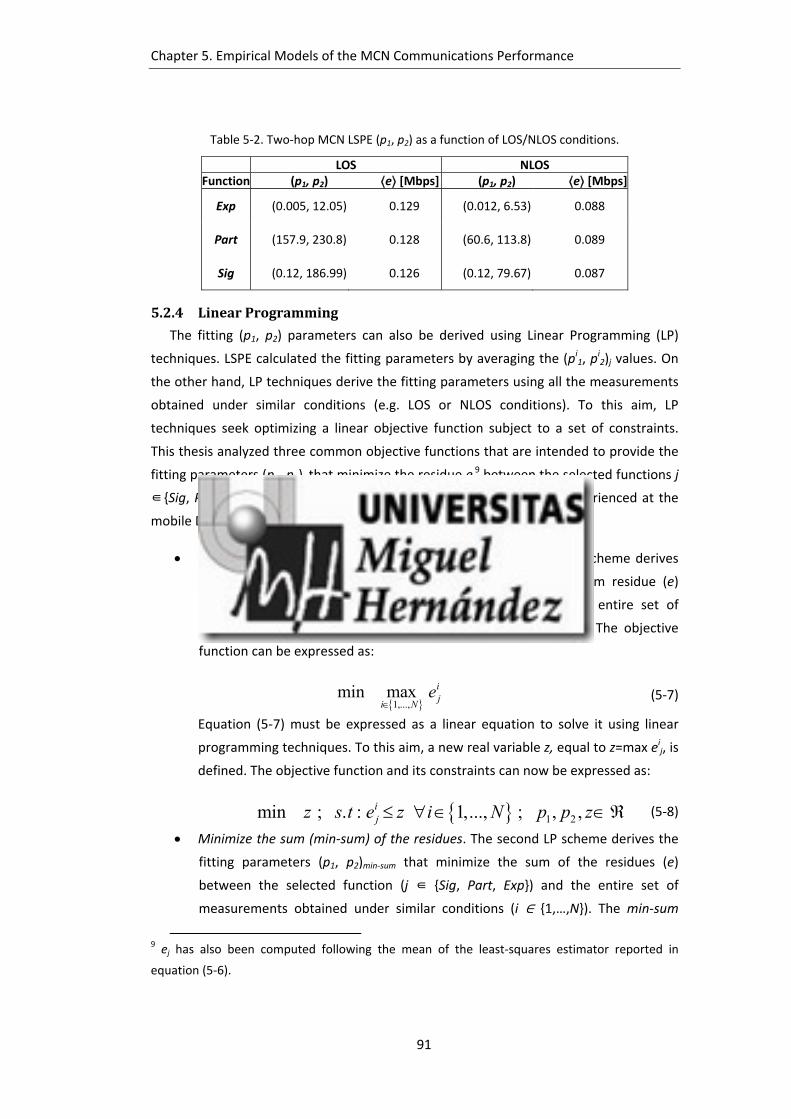
Chapter 5. Empirical Models of the MCN Communications Performance
91
Table 5‐2. Two‐hop MCN LSPE (p1, p2) as a function of LOS/NLOS conditions.
LOS NLOSFunction (p1, p2) ⟨e⟩ [Mbps] (p1, p2) ⟨e⟩ [Mbps]
Exp (0.005, 12.05) 0.129 (0.012, 6.53) 0.088
Part (157.9, 230.8) 0.128 (60.6, 113.8) 0.089
Sig (0.12, 186.99) 0.126 (0.12, 79.67) 0.087
5.2.4 LinearProgramming
The fitting (p1, p2) parameters can also be derived using Linear Programming (LP)
techniques. LSPE calculated the fitting parameters by averaging the (pi1, pi2)j values. On
the other hand, LP techniques derive the fitting parameters using all the measurements
obtained under similar conditions (e.g. LOS or NLOS conditions). To this aim, LP
techniques seek optimizing a linear objective function subject to a set of constraints.
This thesis analyzed three common objective functions that are intended to provide the
fitting parameters (p1, p2)j that minimize the residue ej9 between the selected functions j
∈ {Sig, Part, Exp} and the measured data (i.e. the MCN throughput experienced at the
mobile DN):
Minimize the maximum (min‐max) of the residues. The first LP scheme derives
the fitting parameters (p1, p2)min‐max that minimize the maximum residue (e)
between the selected function (j ∈ {Sig, Part, Exp}) and the entire set of
measurements obtained under similar conditions (i ∈ {1,…,N}). The objective
function can be expressed as:
1,...,min max i
ji N
e
(5‐7)
Equation (5‐7) must be expressed as a linear equation to solve it using linear
programming techniques. To this aim, a new real variable z, equal to z=max eij, is
defined. The objective function and its constraints can now be expressed as:
1 2min ; . : 1,..., ; , ,ijz s t e z i N p p z (5‐8)
Minimize the sum (min‐sum) of the residues. The second LP scheme derives the
fitting parameters (p1, p2)min‐sum that minimize the sum of the residues (e)
between the selected function (j ∈ {Sig, Part, Exp}) and the entire set of
measurements obtained under similar conditions (i ∈ {1,…,N}). The min‐sum
9 ej has also been computed following the mean of the least‐squares estimator reported in
equation (5‐6).

Chapter 5. Empirical Models of the MCN Communications Performance
92
objective function shown in equation (5‐9) is already linear, and no additional
changes are required.
1 21
min ; . : ,N
ij
ie s t p p
(5‐9)
Minimize the multiplication (min‐mul) of the residues. The third LP scheme
computes the fitting parameters (p1, p2)min‐mul that minimize the multiplication of
the residues (e) between the selected function (j ∈ {Sig, Part, Exp}) and the
entire set of measurements obtained under similar conditions (i ∈ {1,…,N}). In
this case, the objective function is expressed as:
1
minN
ij
ie
(5‐10)
Since equation (5‐10) is not a linear equation, the following equivalent objective
function is selected:
1 21
min ln 1 ; . : ,N
ij
ie s t p p
(5‐11)
Table 5‐3 shows the (p1, p2) parameters obtained using the min‐max, min‐sum and
min‐mul LP techniques. The results only differentiate between LOS and NLOS conditions
between the HN and the mobile DN following the observations reported in the LSPE
analysis. Table 5‐3 also shows the average residues eij (⟨e⟩) obtained with each of the LP
schemes. The depicted results show that the Sig function minimizes ⟨e⟩ in most cases.
Table 5‐3. Two‐hop MCN LP (p1, p2) as a function of LOS/NLOS conditions.
Function LOS NLOS
(p1, p2) ⟨e⟩ [Mbps] (p1, p2) ⟨e⟩ [Mbps]
min‐m
ax Exp (0.0047, 4.2) 0.174 (0.011, 4.6) 0.105
Part (153.5, 251) 0.174 (59, 144.5) 0.113
Sig (0.03, 194) 0.174 (0.06, 85) 0.108
min‐sum Exp (0.0051, 5.6) 0.137 (0.012, 5.2) 0.093
Part (141.5, 244.5) 0.138 (56, 113) 0.094
Sig (0.05, 180.5) 0.136 (0.09, 77.5) 0.091
min‐m
ul Exp (0.0053, 6) 0.126 (0.012, 5.2) 0.083
Part (141, 240.5) 0.128 (56, 111.5) 0.084
Sig (0.05, 177) 0.125 (0.11, 77) 0.081
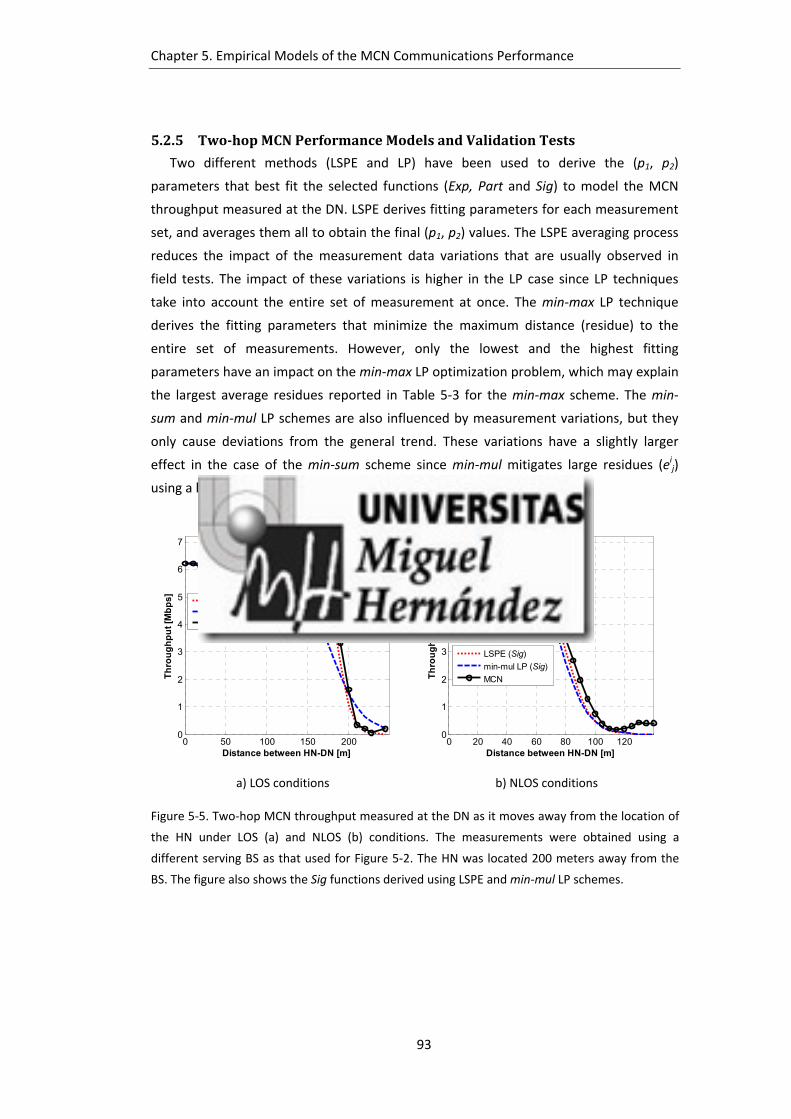
Chapter 5. Empirical Models of the MCN Communications Performance
93
5.2.5 Two‐hopMCNPerformanceModelsandValidationTests
Two different methods (LSPE and LP) have been used to derive the (p1, p2)
parameters that best fit the selected functions (Exp, Part and Sig) to model the MCN
throughput measured at the DN. LSPE derives fitting parameters for each measurement
set, and averages them all to obtain the final (p1, p2) values. The LSPE averaging process
reduces the impact of the measurement data variations that are usually observed in
field tests. The impact of these variations is higher in the LP case since LP techniques
take into account the entire set of measurement at once. The min‐max LP technique
derives the fitting parameters that minimize the maximum distance (residue) to the
entire set of measurements. However, only the lowest and the highest fitting
parameters have an impact on the min‐max LP optimization problem, which may explain
the largest average residues reported in Table 5‐3 for the min‐max scheme. The min‐
sum and min‐mul LP schemes are also influenced by measurement variations, but they
only cause deviations from the general trend. These variations have a slightly larger
effect in the case of the min‐sum scheme since min‐mul mitigates large residues (eij)
using a logarithmic function in its objective function.
0 50 100 150 2000
1
2
3
4
5
6
7
Distance between HN-DN [m]
Th
rou
gh
pu
t [M
bp
s]
LSPE(Sig)min-mul LP (Sig)MCN
0 20 40 60 80 100 1200
1
2
3
4
5
6
7
Distance between HN-DN [m]
Th
rou
gh
pu
t [M
bp
s]
LSPE (Sig)
min-mul LP (Sig)
MCN
a) LOS conditions b) NLOS conditions
Figure 5‐5. Two‐hop MCN throughput measured at the DN as it moves away from the location of
the HN under LOS (a) and NLOS (b) conditions. The measurements were obtained using a
different serving BS as that used for Figure 5‐2. The HN was located 200 meters away from the
BS. The figure also shows the Sig functions derived using LSPE and min‐mul LP schemes.

Chapter 5. Empirical Models of the MCN Communications Performance
94
The results reported in Table 5‐2 and Table 5‐3 show that the Sig function minimizes
the average residue ⟨e⟩ for the LSPE and LP techniques under LOS and NLOS conditions10.
The min‐mul LP scheme results in the lower residue. Additional tests were carried out
due to the small differences observed between LSPE and LP schemes (except for min‐
max). The additional tests were carried out in a different location with a different
serving BS. Figure 5‐5 shows examples of the two‐hop MCN throughput measurements
obtained at DN in these additional tests (the HN was located 200 meters away from the
BS in these examples; additional tests with the HN located at different distances to the
BS were also conducted). Figure 5‐5 also compares the measured throughput with the
Sig models obtained using the fitting parameters derived using the LSPE and min‐mul LP
schemes. The figure shows that the Sig functions provide a good fit with the measured
performance despite changing locations and serving BS. Table 5‐4 compares the average
residue ei (⟨e⟩) obtained with the LSPE and min‐mul LP schemes for all the additional
tests conducted with a different serving BS. The reported ⟨e⟩ values for LSPE are in line
with those listed in Table 5‐2. However, Table 5‐4 shows that min‐mul LP derived fitting
parameters perform worse when using a different BS. This can be appreciated when
comparing the reported ⟨e⟩ values in Table 5‐3 and Table 5‐4. As a result, this study
proposes to model the two‐hop MCN throughput performance experienced at a mobile
DN using the Sig function in equation (5‐12) with the LPSE fitting parameters reported in
Table 5‐2 for LOS and NLOS conditions:
1 2 HN2-hop DN1 2
1MCN-MR , , 1
1Thr p p d Thr
p d pe
(5‐12)
where d represents the HN‐DN separation distance. For these fitting parameters, the
critical distance is 156 meters and 52 meters under LOS and NLOS conditions
respectively. The HNThr parameter represents the average HSPA throughput measured
at the HN. Figure 5‐4 reports HSPA throughput measurements at a node located at
different distances to the BS. The throughput depends on the actual position of the HN.
Using this figure, it is possible to model the HNThr throughput parameter as follows:
HN
6.5 350( )
0.01 10 350
d mThr d
d d m
(5‐13)
10 The only exception is the min‐max LP scheme, but this scheme is discarded since it results in
the higher residue values.
Chapter 5. Empirical Models of the MCN Communications Performance
95
with d representing the distance between the HN and the serving BS. Those interested
in using the two‐hop MCN throughput performance model proposed in equation (5‐12)
could use the HNThr measurements depicted in Figure 5‐4 and modeled in equation
(5‐13), or use their own cellular measurements. It is important emphasizing that the
derived model can be used for different locations of the HN since as previously
discussed the (p1, p2) parameters do not depend on HNThr .
Table 5‐4. LSPE and LP Comparison.
Function ⟨e⟩ [Mbps]
LOS NLOS
LSPE (Sig) 0.132 0.102
min‐mul LP (Sig) 0.158 0.110
5.2.5.1 IEEE802.11gFixedTransmissionMode
The previous models were obtained using the default configuration of the IEEE
802.11g cards used in the mHOP testbed. This configuration adapts the transmission
parameters (data rate and transmission power) based on the experienced link quality
conditions. The operation of these adaptive mechanisms is driver‐dependent (the
employed IEEE 802.11g cards use the Ath9k driver), and detailed information about their
implementation is generally not provided. In this context, it is of interest checking
whether the two‐hop MCN throughput performance models follow similar trends when
operating with fixed transmission power levels and data rates. Additional field tests have
therefore been conducted under similar conditions as those reported in previous
sections and illustrated in Figure 5‐2. The HN remains static (again, different locations of
the HN were also tested with similar results), while the DN moves away from the
location of the HN under LOS and NLOS conditions. The IEEE 802.11g transmission
power was fixed to 19 dBm (19 dBm was previously the power limit, but the actual
transmission power was dynamically modified by the IEEE 802.11 cards). The tests were
conducted using the 54 Mbps and 48 Mbps IEEE 802.11g data rates. The obtained
measurements showed indeed similar trends as those observed when the IEEE 802.11g
adaptive scheme was active. As a result, the same LPSE curve fitting process using the
Sig function has been applied to these measurements. Figure 5‐6 represents the derived
model with the obtained fitting parameters and the average residue (p1, p2, ⟨e⟩) for
each plotted configuration. The MCN throughput curves have been obtained using the
model presented in equation (5‐12). Following the procedure described in Section 5.2.2,
it is possible to calculate the critical distance, or distance at which the MCN throughput

Chapter 5. Empirical Models of the MCN Communications Performance
96
operates below the HNThr . The analysis reveals that when the mobile nodes
communicate using the 54 Mbps data rate, the critical distance is equal to 125 (LOS) and
50 (NLOS) meters. The 48 Mbps data rate increments the critical distance to 143 (LOS)
and 65 (NLOS) meters. In addition, the decreasing slope of the MCN throughput at the
DN (related with the p1 parameter) is greater when the mobile nodes use the 54 Mbps
data rate than when using the 48 Mbps one. This is due to the more robust modulation
and coding scheme used by the 48 Mbps data rate. When activating the IEEE 802.11g
adaptive schemes, the critical distance was equal to 156 meters and 52 meters for the
LSPE Sig function under LOS and NLOS conditions respectively. It is interesting noting
that the critical distance with active adaptive schemes is higher for LOS conditions than
when using the 48 Mbps data rate, but is smaller under NLOS conditions. The different
pattern could be due to the challenging NLOS propagation conditions that difficult a
successful operation of the IEEE 802.11g adaptive schemes.
0 50 100 150 2000
Distance between HN-DN [m]
Th
rou
gh
pu
t [M
bp
s]
54Mbps 48Mbps
(0.07, 195.45, 0.134)
(0.15, 78.93, 0.089)
(0.13, 98.5, 0.075)
(0.12, 156.01, 0.127)
NLOS LOS
Figure 5‐6. Two‐hop MCN throughput models at the DN with fixed IEEE 802.11g transmission
modes for LOS and NLOS conditions and a transmission power of 19 dBm. The figure shows for
each configuration the fitting parameters and the average residue (p1, p2, ⟨e⟩).

Chapter 5. Empirical Models of the MCN Communications Performance
97
5.2.6 D2DLinkLevelModelinginMCNCommunications
The communications performance of MCN systems has been shown to strongly
depend on the conditions experienced between mobile relays. It is therefore of interest
to analyze and characterize the D2D communications between the HN and the DN in the
two‐hop MCN scenario illustrated in Figure 5‐1. The conducted field tests focused on
downlink MCN transmissions from the BS to the DN. In this context, it is important
remembering that the MCN performance is upper‐bounded by the cellular throughput,
and so is the D2D IEEE 802.11 throughput performance. The D2D communications
characterization and modeling focuses then on the IEEE 802.11g Data Rate, Packet Error
Ratio (PER) and Receive Signal Strength Indicator (RSSI). Other studies have previously
modeled different aspects of IEEE 802.11 communications. For example, [105]
characterizes the performance of Minstrel (the algorithm implemented on the mHOP
IEEE 802.11 nodes to select the data rate) for different transmission power
configurations and fixed separation distances between the IEEE 802.11g devices. PER
and RSSI IEEE 802.11 models can be found in the literature, although PER models are
mainly derived as a function of the packet‐length and/or physical‐level metrics (e.g.
Signal to Noise Ratio –SNR) [106][107]. The IEEE 802.11 D2D models here presented
complement existing models by modeling IEEE 802.11 D2D communications as a
function of the distance between mobile relays. Characterizing the D2D communications
as a function of the distance between mobile relays can facilitate the use of the models
in analytical and simulation‐based studies.
5.2.6.1 D2DIEEE802.11gDataRate
The IEEE 802.11g data rate represents the transmission mode used in the ad‐hoc D2D
communication between the static HN and the mobile DN. IEEE 802.11g defines twelve
possible combinations of modulation and coding schemes that result in the following set
of eligible data rates: {54, 48, 36, 24, 18, 12, 9, 6; 11, 5.5, 2, 1} Mbps. As previously
mentioned, the IEEE 802.11 card’s Ath9k driver dynamically selects the IEEE 802.11g
data rate based on the link quality conditions. Figure 5‐7 shows, for one of the
conducted tests, the measured data rate when the IEEE 802.11g D2D link between the
HN and mobile DN operates under LOS and NLOS conditions. The data rate is depicted as
a function of the distance between the HN and the mobile DN. The depicted results
show that the IEEE 802.11g data rate is initially set to 54 Mbps. However, more robust
transmission modes are used with the increasing distance between the HN and the DN.
The more challenging NLOS propagation conditions result in the adaptation of the data
rate at smaller distances, which is consistent with the earlier MCN throughput reduction
depicted in Figure 5‐2 under NLOS conditions. The extracted measurements show

Chapter 5. Empirical Models of the MCN Communications Performance
98
similar properties to the S‐shaped mathematical functions used to model the
communications performance of two‐hop MCNs that utilize D2D communications. As a
result, the LSPE curve fitting process using the Exp, Part and Sig functions has also been
applied to derive the IEEE 802.11g data rate models for D2D communications. The
smoother pass from the upper asymptote to the slope of the curve (Figure 5‐7.b) results
in that the Sig function provides the best match with the IEEE 802.11g data rate under
NLOS conditions. The IEEE 802.11g data rate model for D2D communications is
therefore represented in equation (5‐14) with the fitting (p1, p2) parameters equal to
(0.076, 63.97) (resulting in an average residue equal to 1.3 Mbps). The measurements
reported in Figure 5‐7.a for LOS conditions were better fitted with the Part function. As
a result, the IEEE 802.11g data rate under LOS conditions is modeled by equation (5‐15),
with the fitting parameters being equal to (78.47, 270.85) (resulting in an average
residue equal to 3.95 Mbps). In both models (equations (5‐14) and (5‐15)), d represents
the distance between the HN and the DN, and the upper asymptote (A) is set to 54
Mbps. The derived models are also depicted in Figure 5‐7 showing an adequate match
with the measurements.
1 21 2
1, , 54 1
1NLOSDataRate p p d
p d pe
(5‐14)
0 50 100 150 200 250
6
12
18
24
36
48
54
Distance between HN-DN [m]
Da
ta R
ate
[M
bp
s]
Measured
Model
0 50 100 150
6
12
18
24
36
48
54
Distance between HN-DN [m]
Da
ta R
ate
[M
bp
s]
Measured
Model
a) LOS conditions between HN‐DN b) NLOS conditions between HN‐DN
Figure 5‐7. IEEE 802.11g data rate.

Chapter 5. Empirical Models of the MCN Communications Performance
99
1
1 2 1 22
2
541 1
, ,
0
LOS
d p
DataRate p p d k p d pd p
p d
(5‐15)
5.2.6.2 D2DIEEE802.11gPacketErrorRatio
The PER has been measured in the HN as the ratio between the data packets
retransmitted and the total number of data packets transmitted (including
retransmissions) [106]. A data packet retransmission is required if the HN does not
receive an ACK from the DN. This can be caused by an error in the transmission of the
data packet from the HN to the DN or an error in the ACK sent from the DN to the HN.
An example of the PER measured at the HN as a function of the separation distance
between the HN and DN is shown in Figure 5‐8. The obtained measurements show that
the PER augments with the distance (both for LOS and NLOS conditions) even if more
robust data rates are being used with increasing distances (Figure 5‐7). The upper PER
limit is reached at the distance at which the MCN throughput measured at the DN is
negligible (Figure 5‐2). The PER modeling analysis has considered the original (not
symmetric) S shape of the Sig, Part and Exp functions and the LSPE curve fitting
technique. The conducted fitting process resulted in the Sig function providing the lower
error between the theoretical functions and the measured data both under LOS and
NLOS conditions. The PER is therefore model as shown in equation (5‐16). The fitting (p1,
p2) parameters are equal to (0.019, 115.15) under LOS conditions (resulting in an
average residue of 9.58%) and equal to (0.0475, 54.38) under NLOS conditions (resulting
in an average residue of 5.01%). The d parameter in equation (5‐16) represents the
distance between the HN and the mobile DN. The measured upper PER limit/asymptote
(UPER) is on average 75% both under LOS and NLOS conditions. The derived models are
also depicted in Figure 5‐8. The worse IEEE 802.11g D2D performance under NLOS
conditions is highlighted by the higher value of p1 and the lower value of p2. This fact
also explains the lower critical distance of the MCN throughput under NLOS conditions.
1 21 2
, ,1
PERUPER p p d
p d pe
(5‐16)
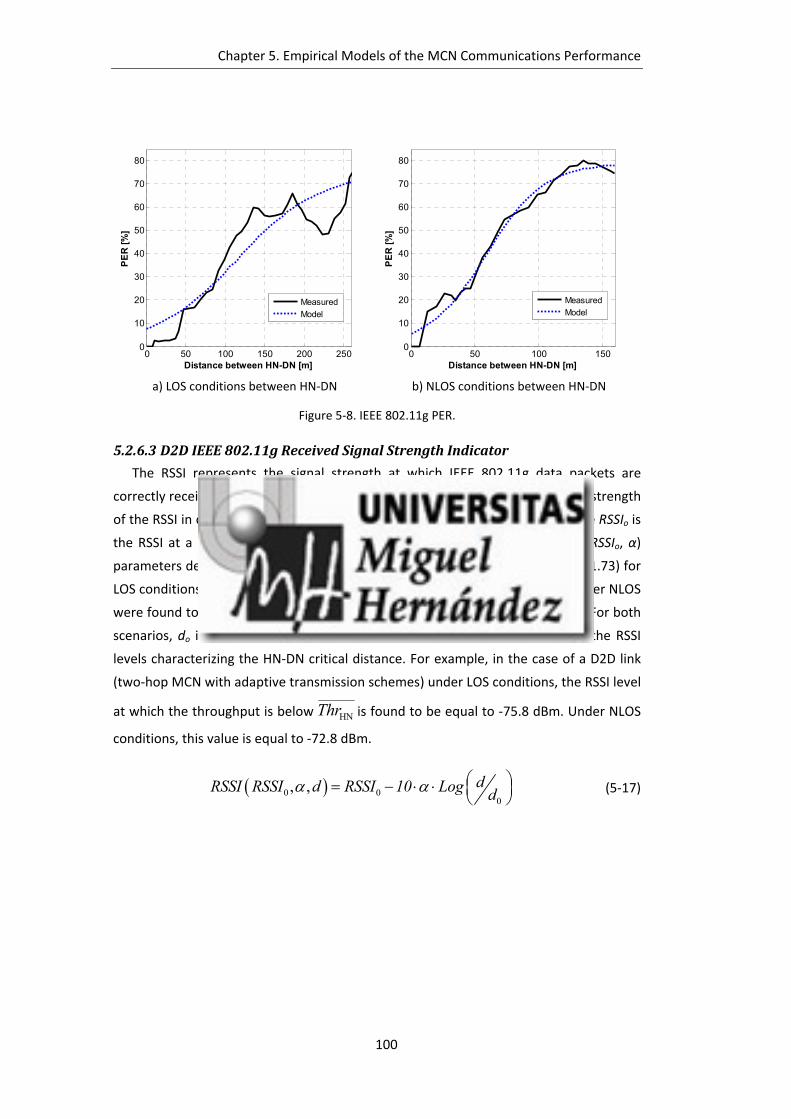
Chapter 5. Empirical Models of the MCN Communications Performance
100
0 50 100 150 200 2500
10
20
30
40
50
60
70
80
Distance between HN-DN [m]
PE
R [
%]
Measured
Model
0 50 100 1500
10
20
30
40
50
60
70
80
Distance between HN-DN [m]
PE
R [
%]
Measured
Model
a) LOS conditions between HN‐DN b) NLOS conditions between HN‐DN
Figure 5‐8. IEEE 802.11g PER.
5.2.6.3 D2DIEEE802.11gReceivedSignalStrengthIndicator
The RSSI represents the signal strength at which IEEE 802.11g data packets are
correctly received at the DN (Figure 5‐9). It is common to represent the average strength
of the RSSI in dBm as a log‐distance function (equation (5‐17)) [107][108], where RSSIo is
the RSSI at a reference distance (do) and α is the RSSI exponent. The fitting (RSSIo, α)
parameters derived using the LSPE curve fitting technique are equal to (‐37.95, 1.73) for
LOS conditions, with an average residue of 4.07 dBm. The fitting parameters under NLOS
were found to be equal to (‐34.88, 2.21), with an average residue of 3.95 dBm. For both
scenarios, do is set to 1 meter. Using equation (5‐17), it is possible to detect the RSSI
levels characterizing the HN‐DN critical distance. For example, in the case of a D2D link
(two‐hop MCN with adaptive transmission schemes) under LOS conditions, the RSSI level
at which the throughput is below HNThr is found to be equal to ‐75.8 dBm. Under NLOS
conditions, this value is equal to ‐72.8 dBm.
0 00
, , dRSSI RSSI d RSSI 10 Log d
(5‐17)
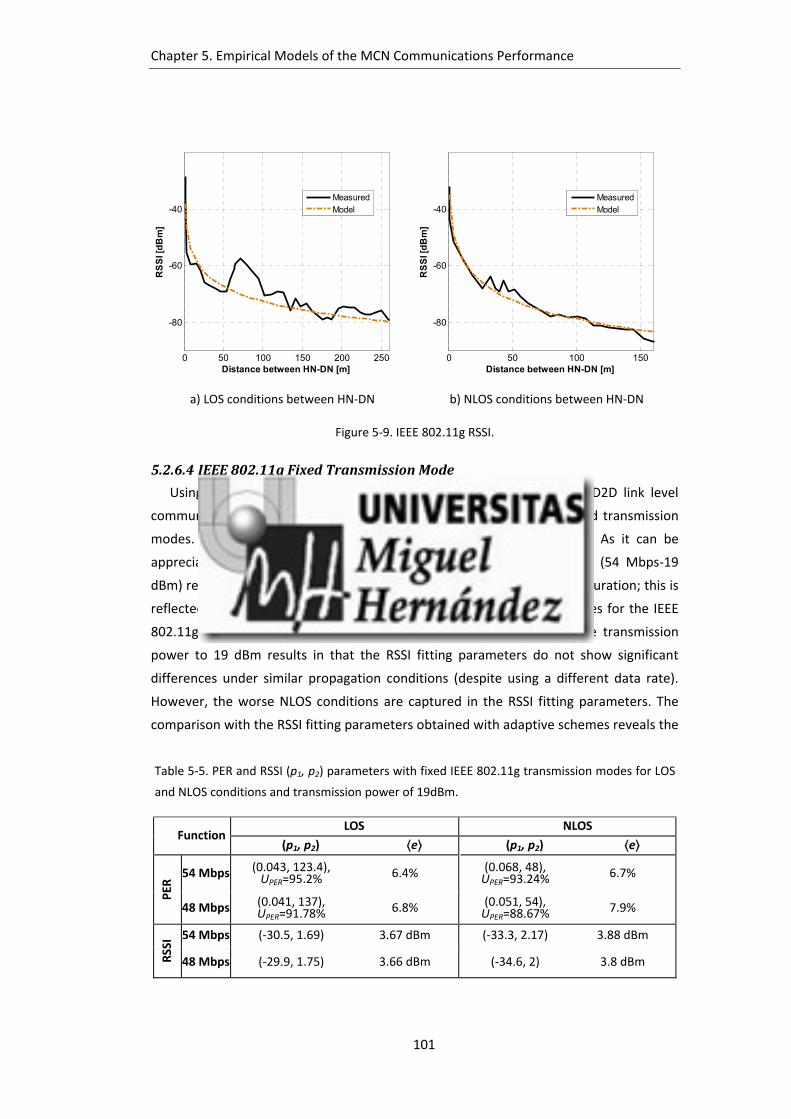
Chapter 5. Empirical Models of the MCN Communications Performance
101
0 50 100 150 200 250
-80
-60
-40
Distance between HN-DN [m]
RS
SI [
dB
m]
Measured
Model
0 50 100 150
-80
-60
-40
Distance between HN-DN [m]
RS
SI [
dB
m]
Measured
Model
a) LOS conditions between HN‐DN b) NLOS conditions between HN‐DN
Figure 5‐9. IEEE 802.11g RSSI.
5.2.6.4 IEEE802.11gFixedTransmissionMode
Using equations (5‐16) and (5‐17), it is also possible to model the D2D link level
communications for a two‐hop MCN connection using IEEE 802.11g fixed transmission
modes. The resulting model parameters are summarized in Table 5‐5. As it can be
appreciated, using the data rate and transmission power configuration (54 Mbps‐19
dBm) results in higher PER values than using the (48 Mbps‐19 dBm) configuration; this is
reflected in the higher values of UPER and p1. The use of adaptive schemes for the IEEE
802.11g D2D connection results in lower UPER and p1 values. Fixing the transmission
power to 19 dBm results in that the RSSI fitting parameters do not show significant
differences under similar propagation conditions (despite using a different data rate).
However, the worse NLOS conditions are captured in the RSSI fitting parameters. The
comparison with the RSSI fitting parameters obtained with adaptive schemes reveals the
Table 5‐5. PER and RSSI (p1, p2) parameters with fixed IEEE 802.11g transmission modes for LOS
and NLOS conditions and transmission power of 19dBm.
Function LOS NLOS
(p1, p2) ⟨e⟩ (p1, p2) ⟨e⟩
PER
54 Mbps (0.043, 123.4), UPER=95.2%
6.4% (0.068, 48), UPER=93.24%
6.7%
48 Mbps (0.041, 137), UPER=91.78%
6.8% (0.051, 54), UPER=88.67%
7.9%
RSSI 54 Mbps (‐30.5, 1.69) 3.67 dBm (‐33.3, 2.17) 3.88 dBm
48 Mbps (‐29.9, 1.75) 3.66 dBm (‐34.6, 2) 3.8 dBm

Chapter 5. Empirical Models of the MCN Communications Performance
102
higher signal strength levels measured when fixing the transmission power to 19 dBm.
Although 19 dBm is the power limit when using adaptive schemes, the transmission
power is dynamically modified based on the link quality conditions.
5.3 Three‐HopMCNCommunications
This section derives models of the communications performance of three‐hop MCN
in the scenario illustrated in Figure 5‐10. The 3‐hops scenario considers the presence of
an additional mobile node (Intermediate Node, IN) located between the HN and the DN.
The mobile IN acts as a relay and forwards the packets coming from the HN to the DN
through its IEEE 802.11g D2D link. The HN‐IN and IN‐DN IEEE 802.11g D2D links have
been set up by modifying the routing tables of each mobile node. The HN remains in a
static position during the tests, whereas the DN is a mobile node. The IN would be either
static or mobile. The three‐hop MCN communication models need to take into account
the possibility that the HN‐IN and IN‐DN links operate under LOS or NLOS conditions.
LOS
Distance BS – HN Distance HN – IN
BS
HN
DN
DNIN
IN
Distance IN – DN
Figure 5‐10. Testing environment for three‐hop MCN communications.
5.3.1 FieldTests
The three‐hop MCN performance observed at the DN does not only depend on the
real‐time data forwarding process from the HN to the IN, but also on the forwarding
capability of the IN. In this context, it is important that the field tests, and consequent
communications performance models, thoroughly analyze the impact of the mobile IN
on the end‐to‐end MCN performance. To this aim, this section analyzes the MCN
performance at the IN and the DN under different configurations varying the
propagation conditions (LOS and NLOS) and the distance between mobile nodes.

Chapter 5. Empirical Models of the MCN Communications Performance
103
5.3.1.1 MCNThroughputattheIN
The first tests analyzed the MCN performance at the IN under LOS and NLOS
conditions with the HN. During the tests, the DN is located in the same sidewalk as the
IN and they both move away from the location of the HN while maintaining a separation
distance of approximately 30 meters. This short separation distance was selected to
minimize the impact of the IN‐DN D2D link on the performance measured at the IN (the
D2D connection experienced negligible PER levels and used consistently a 54 Mbps data
rate). Figure 5‐11 shows an example of the MCN throughput measured at the IN with
the HN located 500 meters away from the BS (additional field tests were conducted for
different distances between BS and HN). The measurements reported in Figure 5‐11
show that the MCN throughput measured at the IN initially exhibits similar performance
levels to those experienced by the HN. As the IN walks away from the location of the HN
and the HN‐IN link quality degrades, the MCN throughput at the IN decreases. As
expected, the throughput degradation starts at smaller distances to the HN under NLOS
conditions than under LOS conditions. The distance at which the degradation starts is
the IN critical distance. For the measurements reported in Figure 5‐11, the IN critical
distance at which the IN performance decreases below the throughput performance at
the HN is 154 and 54 meters under LOS and NLOS conditions respectively. Figure 5‐11
does not represent the throughput measured at the DN. However, the throughput was
0 50 100 150 200 2500
1
2
3
4
Distance between HN-IN [m]
Th
rou
gh
pu
t [M
bp
s]
Model Thr3-hop IN
MCN at IN
(0.13, 179.3, 0.139)
0 40 80 1200
1
2
3
4
Distance between HN-IN [m]
Th
rou
gh
pu
t [M
bp
s]
Model Thr3-hop IN
MCN at IN
(0.12, 84.74, 0.091)
a) LOS conditions b) NLOS conditions
Figure 5‐11. MCN throughput measured at the IN under a three‐hop MCN configuration, and
considering LOS (a) and NLOS (b) conditions between the HN and IN. The DN maintains a
separation distance of 30 meters under LOS conditions with the IN. The HN is located 500
meters away from the BS. The figure also shows the three‐hop MCN throughput model at IN
(Section 5.3.2). The throughput is modeled using the Sig function with the LPSE fitting
parameters and residue plotted in the figures.
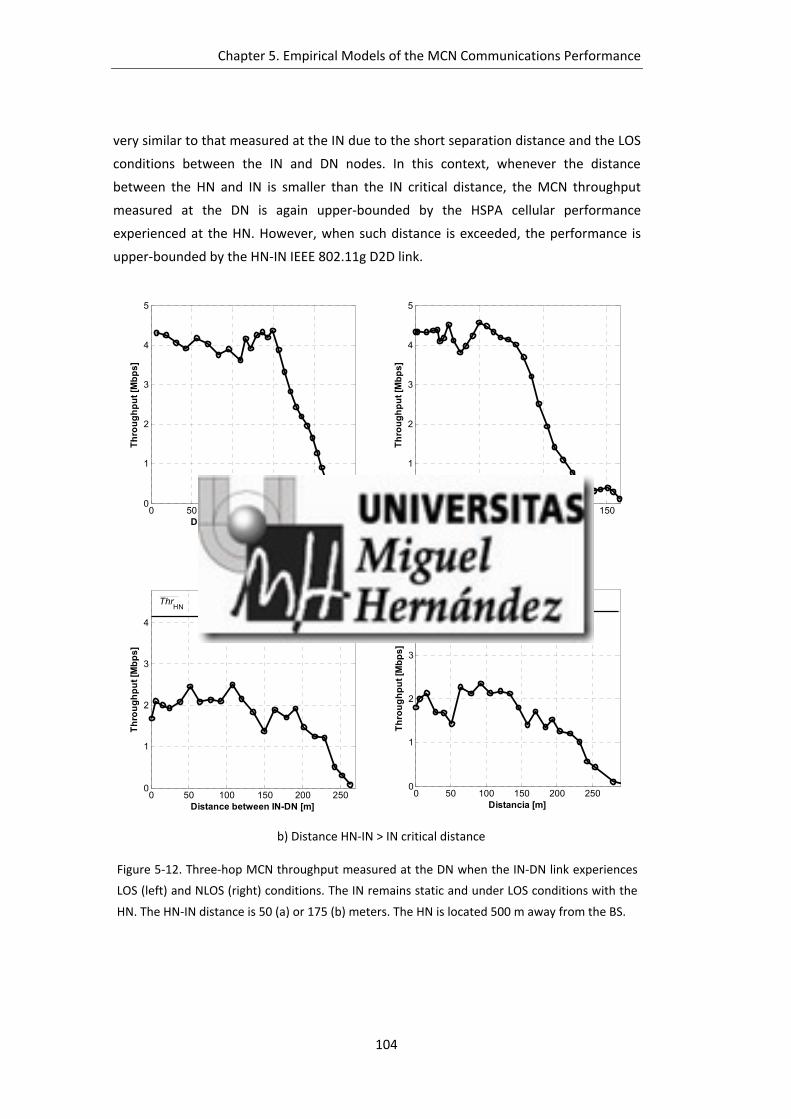
Chapter 5. Empirical Models of the MCN Communications Performance
104
very similar to that measured at the IN due to the short separation distance and the LOS
conditions between the IN and DN nodes. In this context, whenever the distance
between the HN and IN is smaller than the IN critical distance, the MCN throughput
measured at the DN is again upper‐bounded by the HSPA cellular performance
experienced at the HN. However, when such distance is exceeded, the performance is
upper‐bounded by the HN‐IN IEEE 802.11g D2D link.
0 50 100 150 2000
1
2
3
4
5
Distance between IN-DN [m]
Th
rou
gh
pu
t [M
bp
s]
0 50 100 1500
1
2
3
4
5
Distance between IN-DN [m]
Th
rou
gh
pu
t [M
bp
s]
a) Distance HN‐IN < IN critical distance
0 50 100 150 200 2500
1
2
3
4
Distance between IN-DN [m]
Th
rou
gh
pu
t [M
bp
s]
ThrHN
0 50 100 150 200 2500
1
2
3
4
Distancia [m]
Th
rou
gh
pu
t [M
bp
s]
Thr
HN
b) Distance HN‐IN > IN critical distance
Figure 5‐12. Three‐hop MCN throughput measured at the DN when the IN‐DN link experiences
LOS (left) and NLOS (right) conditions. The IN remains static and under LOS conditions with the
HN. The HN‐IN distance is 50 (a) or 175 (b) meters. The HN is located 500 m away from the BS.

Chapter 5. Empirical Models of the MCN Communications Performance
105
5.3.1.2 MCNThroughputattheDN
Additional field tests were conducted to analyze the MCN performance at the DN. In
this case, the HN and IN nodes remain static and under LOS conditions, with their
separation distance being equal to 50 or 175 meters. These two values were selected to
consider scenarios where the separation distance is above or below the IN critical
distance. During the tests, the DN moves away from the location of the IN under LOS or
NLOS conditions until the IEEE 802.11g D2D link is lost. The results depicted in Figure
5‐12.a show that when the HN‐IN distance is shorter than the IN critical distance, the
MCN throughput measured at the DN follows similar patterns as those discussed in the
two‐hop scenario (Figure 5‐2). On the other hand, when the HN‐IN distance is above the
IN critical distance, the IN performance is seriously degraded (Figure 5‐11), and so is the
MCN throughput measured at the DN. Figure 5‐12.b shows that, in this case, the MCN
throughput experienced at the DN is not limited by the average HSPA throughput
measured at the HN ( HNThr ), but by the MCN throughput measured at the IN.
However, it can further decrease as the distance between the IN and DN increases.
Then, the MCN throughput measured at the DN is upper‐bounded by the IN‐DN IEEE
802.11g D2D link11.
5.3.2 Three‐hopMCNPerformanceModels
The models of the three‐hop MCN throughput performance experienced at the DN
have been derived using the Sig function and the LSPE scheme described in Section
5.2.3. These models are represented in Figure 5‐13 together with the fitting parameters
and average residue values (p1, p2, ⟨e⟩). The three‐hop MCN throughput at the DN has
been modeled as follows:
HN1 2
1 2 3-hop DN
3-hop IN1 2
11 HN-IN dist < IN critical dist
1MCN , ,
1MCN 1 HN-IN dist IN critical dist
1
Thr ifp d p
eThr p p d
Thr ifp d p
e
(5‐18)
11 As the number of hops increases, MCN connections would be mainly attractive if good link
quality conditions can be guaranteed for the D2D links (further details are provided in Section
5.4). As a result, field tests with the HN‐IN link under NLOS conditions were not conducted.
Anyway, similar trends to those reported for the HN‐IN link under LOS conditions (with the HN‐IN
distance shorter/above the IN critical distance) are likely to be observed.
Chapter 5. Empirical Models of the MCN Communications Performance
106
where d represents the distance between IN and DN, and (p1, p2) are the fitting
parameters shown in Figure 5‐13.
Previous results have shown that the MCN throughput measured at the DN is upper‐
bounded by the average HSPA throughput at the HN ( HNThr ) when the separation
distance between the HN and IN nodes is smaller than the IN critical distance. When the
HN‐IN separation distance is higher than the IN critical distance, the MCN throughput at
the DN is upper‐bounded by the MCN throughput at the IN (MCN Thr3‐hop IN) that can be
computed as follows:
1 2 HN3-hop IN1 2
1MCN , , 1
1Thr p p d Thr
p d pe
(5‐19)
where d represents the distance between HN and IN, (p1, p2) the fitting parameters
reported in Figure 5‐11, and HNThr the average HSPA throughput at the HN that can be
derived from the measurements reported in Figure 5‐4 and modeled in equation (5‐13).
For these fitting parameters, the IN critical distance at which the IN performance
decreases below HNThr is 154 and 54 meters under LOS and NLOS conditions
respectively.
The conducted study has shown that when the distance between HN and IN is
smaller than the IN critical distance, the three‐hop MCN performance at the DN is not
significantly influenced by the presence of the IN node. In fact, the fitting (p1, p2)
parameters for the MCN throughput at the DN are similar to those derived for two‐hop
MCN communications (Table 5‐2). Using the two‐hop MCN fitting parameters to model
three‐hop MCN communications when the HN‐IN distance is smaller than the IN critical
distance will only marginally increase the average residue (approximately 7%). On the
other hand, when the distance between HN and IN is larger than the IN critical distance,
the fitting parameters significantly differ, in particular under LOS conditions. An analysis
of the measurements suggests that the main reason for the lower p1 (related to the
slope of the curve) and higher p2 parameters (related to the distance at which the curve
is symmetric) is the challenging HN‐IN link quality conditions that result in the IN using
more robust transmission modes. Under NLOS conditions, the adaptive link level
techniques do not perform as well as under LOS conditions, which results in the NLOS
fitting (p1, p2) parameters being similar to those derived for the two‐hop MCN
communications.

Chapter 5. Empirical Models of the MCN Communications Performance
107
0 50 100 150 200 2500
Distance between IN-DN [m]
Th
rou
gh
pu
t [M
bp
s]
Dist HN-IN < IN critical dist Dist HN-IN > IN critical dist
(0.11, 93.98, 0.099) (0.12, 192.66, 0.139)
(0.09, 233.3, 0.135)(0.14, 82, 0.187)
NLOS LOS
Figure 5‐13. Three‐hop MCN throughput models at the DN when the IN‐DN D2D link experiences
LOS and NLOS conditions, and for HN‐IN distances smaller (50 m) and higher (175 m) than the IN
critical distance. The models are derived with IN static and under LOS conditions with the HN.
5.4 x‐HopMCNCommunications
The previous sections have derived MCN performance models for likely deployment
scenarios with 2 and 3 hops. A higher number of hops would increase the probability to
have an unstable MCN connection as a result of a higher probability that at least one of
the D2D links experiences bad link quality conditions [109]. MCN connections with a
high number of hops would hence be mainly attractive if good link quality conditions can
be guaranteed for the D2D links. In fact, the previous sections showed that if the
distance between relay nodes was shorter than their critical distance, the HN‐IN and IN‐
DN D2D performance was superior to the HSPA cellular performance measured at the
HN. In this case, the MCN performance at the DN would be at its highest level and would
be upper‐bounded by the cellular performance12. It is then of interest analyzing whether
this performance level and model could be extended to a larger number of hops, and
the conditions under which such extension would be feasible. In this context, it is
important to note that even if the D2D link quality is good, the processing at each
12 In addition, the results showed than in this scenario the three‐hop MCN performance at the DN
can be modeled using the two‐hop MCN model and its fitting parameters, with a small residue.
Chapter 5. Empirical Models of the MCN Communications Performance
108
intermediate relay decreases the multi‐hop D2D performance, which could actually
decrease below the cellular performance at the HN. It is then of interest determining the
maximum number of hops that would guarantee that the multi‐hop ad‐hoc D2D
performance (and thereby the end‐to‐end MCN performance) is upper‐bounded by the
cellular performance at the HN. To this aim, we can use the channel efficiency E of an
IEEE 802.11 ad‐hoc D2D link defined in [110] as follows:
d
cont d ack
tE =
DIFS+t t SIFS t (5‐20)
where td, tcont and tack represent the transmission time of the data packet, the contention
period and the transmission time of the ACK frame, respectively. Distributed
Coordination Function Inter Frame Space (DIFS) represents the period of time that the
wireless channel has to be sensed as idle to initiate the transmission. Short Inter Frame
Space (SIFS) represents the time interval between the reception of the data frame and
the transmission of the ACK. DIFS and SIFS are equal to 28 µs and 10 µs for IEEE 802.11g
(additional details can be found in Section 2.2.2). The value of tcont has been set to 67.5
µs following the indications reported in [110].
Let’s suppose that the IEEE 802.11g D2D links operate with the 54 Mbps data rate13,
and the size of the data packets and the ACK frame14 is 1548 bytes and 14 bytes
respectively. In this case, the efficiency E of an D2D link would be equal to 0.675, which
results in a maximum throughput for a single hop IEEE 802.11g D2D link of 36.48 Mbps.
We can then extend the efficiency computation to various hops Enhops. In this case, it
would be possible to identify the maximum number of hops that guarantees an end‐to‐
end multi‐hop performance higher than the cellular performance at the HN. To estimate
the efficiency of a multi‐hop (n‐hop) ad‐hoc D2D link, we assume that nodes cannot
transmit simultaneously over the link15. In this case, the Enhops efficiency needs to
consider the processing time introduced by intermediate relay nodes (tpro). Such time
has been extracted from the three‐hop MCN trials that included the intermediate IN
node. tpro measures the time difference at the IN between the reception (from the HN)
13 In this case, the efficiency would represent the best case scenario. However, as previously
discussed, MCN connections with a high number of hops should try guaranteeing good link
quality conditions for D2D connections. When this was the case, the measurements showed that
the D2D links mainly operated with the 54 Mbps data rate. 14 In the conducted measurements, the ACK was transmitted at 24 Mbps. 15 This assumption results in a lower‐bound of the multi‐hop channel efficiency since a single data
packet can be transmitted at each point in time over the multi‐hop D2D link.

Chapter 5. Empirical Models of the MCN Communications Performance
109
and the transmission (to the DN) of IEEE 802.11 data packets. Table 5‐6 summarizes the
obtained results considering the LOS or NLOS conditions experienced at the IN‐DN link.
The results differentiate the measurements obtained when the HN‐IN distance was
higher or smaller than the IN critical distance. Several reasons explain the higher
processing delay at the IN when the distance was above the IN critical distance: lower
data rates, higher retransmission rates, an increase in the back‐off/contention timers at
the MAC layer, and the overflow of the transmission/reception buffers, among others.
The channel efficiency of n multi‐hop ad‐hoc D2D links (Enhops) can be computed as
follows:
1d
nhopscont d ack pro
tE =
DIFS+t t SIFS t n t (5‐21)
Assuming that the distance between nodes is shorter than their critical distance, and
using the average processing time values reported in Table 5‐6, the channel efficiency is
equal to Enhops=0.2255 for a two‐hop IEEE 802.11g D2D link (three‐hop MCN),
Enhops=0.1353 for a three‐hop IEEE 802.11g D2D link, and Enhops=0.0967 for a four‐hop
IEEE 802.11g D2D link. This results in a maximum throughput for a two‐hop IEEE 802.11g
D2D link of 12.17 Mbps, a maximum throughput for a three‐hop IEEE 802.11g D2D link
of 7.31 Mbps, and a maximum throughput for a four‐hop IEEE 802.11g D2D link of 5.22
Mbps. The HSPA throughput measurements showed maximum values between 5 and
6.5 Mbps. In this case, a MCN connection with up to 4 IEEE 802.11 D2D hops could be
upper‐bounded by the HSPA cellular performance at the HN. Taking into account this
result, and the fact that a higher number of hops can result in unstable MCN
connections, this section analyzes and models the performance of 4 and 5 hops MCN
connections with the separation distance between the relay nodes being shorter than
their critical distance.
Table 5‐6. Average processing delay at the intermediate IN node.
IN‐DN link under LOS IN‐DN link under NLOS
HN‐IN dist < IN critical dist HN‐IN dist > IN critical dist HN‐IN dist < IN critical dist HN‐IN dist > IN critical dist
0.67 ms 8.6 ms 0.77 ms 7.2 ms
Chapter 5. Empirical Models of the MCN Communications Performance
110
5.4.1 Four‐hopandFive‐hopMCNFieldTestsandPerformanceModels
The performance of four‐hop and five‐hop MCN connections has been tested under
similar conditions to those described for the two‐hop and three‐hop MCN scenarios. In
the case of the four‐hop MCN connection, two intermediate MNs (IN1 and IN2) are
located between the HN and the DN. Three INs (IN1, IN2 and IN3) are needed for the five‐
hop MCN connection. The HN and INs remain static during the field tests, and they
maintain a separation distance of 50 meters16 under LOS conditions (this distance is
below the critical distance of each D2D link). The DN moves away from the location of its
closer IN (IN2 for four‐hop MCN and IN3 for five‐hop MCN) under LOS or NLOS
conditions. The obtained results showed similar trends to that analyzed previously for
two‐hop and three‐hop MCN communications. The four‐hop and five‐hop MCN
performance models have hence been derived using the Sig function and the LSPE fitting
process, and can be expressed as:
1 2 HN4-hop or 5-hop DN1 2
1MCN , , 1
1Thr p p d Thr
p d pe
(5‐22)
where d represents the distance between IN2 and DN for the four‐hop scenario, and the
distance between IN3 and DN for the five‐hop scenario. The models together with the
fitting parameters and average residues (p1, p2, ⟨e⟩) for the two scenarios are plotted in
Figure 5‐14 and Figure 5‐15 respectively. The average residues for four‐hop MCN
communications increase about 17% and 25% under LOS and NLOS conditions compared
to the average residues obtained for two‐hop MCN communications. The increment for
the five‐hop MCN scenario compared to the two‐hop MCN one is equal to 25% and 30%
under LOS and NLOS. The obtained results show that MCN connections with a high
number of hops can still be attractive if good link quality conditions are guaranteed for
the D2D links. In fact, the average residues for four‐hop and five‐hop MCN
communications are smaller under the considered conditions than with the three‐hop
MCN scenario when the distance between IN and DN was higher than the IN critical
distance.
16 The scenario where the distance between relay nodes is higher than their critical distance has
not been reproduced for four‐hop and five‐hop MCN communications. This was decided
following the discussion about the need to guarantee D2D links with good link quality conditions
in order to ensure stable multi‐hop MCN connections.

Chapter 5. Empirical Models of the MCN Communications Performance
111
0 50 100 150 200 250Distance between DN-IN
2 [m]
Th
rou
gh
pu
t [M
bp
s]
(0.086, 82.33, 0.109) (0.09, 195.2, 0.148)
NLOS LOS
Figure 5‐14. MCN throughput model at the DN under a four‐hop MCN configuration, and
considering LOS and NLOS condition between IN2 and DN.
0 50 100 150 200 250Distance between DN-IN
3 [m]
Th
rou
gh
pu
t [M
bp
s]
NLOS LOS
(0.07, 82.67, 0.113) (0.08, 208.1, 0.155)
Figure 5‐15. MCN throughput model at the DN under a five‐hop MCN configuration, and
considering LOS and NLOS conditions between IN3 and DN.
Chapter 5. Empirical Models of the MCN Communications Performance
112
5.5 SummaryandDiscussion
This chapter has presented novel and unique models for the communications
performance of MCNs using mobile relays and D2D communications. The proposed
models can be significantly valuable to support the design, test and optimization of
novel communications and networking protocols tailored for MCNs. The models have
been obtained following a large field testing campaign using an active cellular network in
the city of Elche in Spain. The reported models represent the MCN throughput
experienced at a mobile destination node as a function of the distance,
propagation/visibility conditions, number of hops and communication settings. The
performance metric was selected with the objective to reduce the impact of cellular
resource management policies that may vary from operator to operator. The MCN
throughput performance has been modeled with a sigmoid function that is a function of
the cellular throughput experienced at the hybrid or gateway mobile node. The models’
fitting parameters have been shown to depend on key factors such as the propagation
conditions and number of hops. The models have been derived considering HSPA
cellular transmissions and IEEE 802.11g D2D communications. Extending the models to
other cellular technologies could be feasible as long as the MCN performance is upper‐
bounded by the cellular link between the BS and the hybrid mobile node. Using the MCN
measurements, this chapter also reports D2D link‐level models derived as function of
the distance between communicating nodes.

113
6 Opportunistic
Multi‐hopCellularNetworks
Cellular networks face significant capacity and energy challenges as cellular data
keeps on rising. Cellular data traffic is significantly growing with the pervasive use of
smartphones and the popularity of mobile video, web browsing and social networking
applications among others. This trend will keep on exponentially growing with the
adoption of Machine‐to‐Machine (M2M), Internet of Things (IoT) and connected
vehicles applications, among others [2]. As experimentally demonstrated in Chapter 4,
Multi‐hop Cellular Networks (MCNs) can help address the increasing capacity and energy
constraints of traditional cellular systems through the integration of cellular and ad‐hoc
or D2D communications. MCNs can also benefit from the adoption of opportunistic
networking solutions. Opportunistic schemes exploit the nodes’ mobility and the store,
carry and forward paradigm to establish communication links between mobile relays
when favorable communication conditions are found [13]. Opportunistic schemes can
then reduce the overall energy consumption [111], but can result in possible end‐to‐end
transmission delays and their use should concentrate on delay tolerant services. The
integration of opportunistic networking and MCNs represents then an interesting option
to provide quality of service while improving energy‐efficiency by taking advantage of
the delay tolerance or non‐real‐time properties of certain traffic services, e.g. email, file
sharing, social networking, software/firmware updates, mobile video, cloud services,

Chapter 6. Opportunistic Multi‐hop Cellular Networks
114
data metering, goods tracking; according to the Cisco’s global mobile data traffic
forecast for 2014‐2019 [15], these services represent some of the most popular
applications driving the mobile data growth. In this context, this chapter investigates the
capacity of opportunistic store, carry and forward techniques in MCNs to exploit the
data delivery margins offered by delay tolerant services to improve the energy‐efficiency
of cellular networks.
Section 6.1 reviews related studies and Section 6.2 introduces the most popular
delay tolerant applications. Section 6.3 presents a detailed mathematical framework for
the study and design of energy‐efficient opportunistic MCN communications. Section 6.4
derives the optimum configuration of opportunistic forwarding in a two‐hop MCN
scenario, including the identification of the optimum mobile relay location, and the
location at which the relay needs to start forwarding the information to the cellular
network in order to minimize the overall energy consumption. Finally, Section 6.5
analyzes the impact of traffic characteristics of delay tolerant services on the energy
gains that can be reached with opportunistic MCN communications, and how
opportunistic MCN communications should be configured to exploit traffic
characteristics in order to reduce the energy consumption.
6.1 OpportunisticNetworkinginMulti‐hopCellularNetworks
MCNs using mobile relays and D2D communications possess unique capabilities to
overcome the limitations of traditional single‐hop cellular communications by means of
exploiting the communications, computing and networking capabilities of smart devices.
MCNs can also benefit from the mobility and storing capacity of mobile devices to
implement opportunistic networking schemes that exploit the store, carry and forward
paradigm. Opportunistic networking was initially proposed for disconnected wireless
networks. In the absence of forwarding opportunities, mobile nodes could store the
message and carry it until they can forward it to other nodes. Opportunistic networking
can reduce the energy consumption [111] at the cost of possible higher transmission
delays [112]‐[113]. For example, the study reported in [114] investigates the problem of
optimal opportunistic forwarding for Delay/Disruption‐Tolerant Networks (DTNs) under
energy constraints (the study considers that the energy for transmitting a message is
limited). To maximize the delivery probability while satisfying the energy constraint, the
study controls the probability of transmitting a message upon the opportunistic
connectivity between devices. A similar approach is presented in [115], where the
forwarding probability between encountering nodes is determined by the node density
Chapter 6. Opportunistic Multi‐hop Cellular Networks
115
estimation. When the density is high, the forwarding probability is reduced to avoid
excessive simultaneous message copy transmissions. Important efforts have also been
devoted to estimate the periodicity in the encounters between mobile nodes [116], as
well as the duration of opportunistic connections and the nodes’ inter‐contact time
[117]‐[118]. These studies have been further extended to consider the impact of duty‐
cycle operation that results in that nodes can miss contact opportunities when they
operate under sleep state for saving energy [119].
Opportunistic networking principles can be extended to networks that do not suffer
frequent disconnections. In fact, opportunistic networking can be utilized for searching
for the most efficient transmission conditions between devices. For example, the
adoption of opportunistic networking principles has been proposed to extend the
coverage of cellular networks, offload cellular traffic using D2D communications, or
increase the capacity [117]. The studies reported in [120] and [121] show that
opportunistic policies can significantly enhance the efficiency of D2D transmissions by
pausing communications under unreliable and low efficiency link‐quality conditions, and
re‐starting them when channel conditions improve. This feature was proven in [122]
using queuing theory, and has been recently experimentally demonstrated in [14].
Opportunistic networking can also help offloading data traffic from cellular networks to
metropolitan Wi‐Fi access points without degrading the QoS [43]. The benefits of
integrating opportunistic networking and MCNs was first discussed in [99], where the
authors present novel routing policies that use information about the relays’ mobility to
reduce energy consumption, increase spatial capacity, reduce co‐channel interference,
balance the load across cells, and switch‐off low‐utilization base stations. To do so, the
authors formulate a finite space‐time network graph that includes all possible routes for
forwarding information towards a cellular BS. Such graph is constructed taking into
account the delay tolerance acceptable for different services. The vertexes of the graph
represent the location of the mobile relays with time, and the edges the transmission
links. The authors claim that using the graph, a BS can identify end‐to‐end opportunistic
forwarding paths to achieve an established QoS target. The study was then extended in
[123] where the authors highlight the importance of considering the power
consumption of storage units in mobile relays when studying opportunistic networking.
6.2 DelayTolerantMobileTrafficServices
Cisco estimates that mobile video represented 55% of the mobile data traffic by the
end of 2014. This percentage is expected to increase to 72% by 2019. Even uplink mobile

Chapter 6. Opportunistic Multi‐hop Cellular Networks
116
video traffic is increasing thanks to the popularity of applications such as Ustream [124],
Bambuser [125] or Livestream [126] that allow users to broadcast live events using their
mobile devices. Mobile video content delivery technologies currently utilize Adaptive
Streaming (AS) schemes that divide video content into fragments. These fragments are
delivered to the user on demand to ensure that sufficient content (in the order of tens
of seconds) is constantly buffered at the user device ahead of playback time. This
buffering policy avoids freezing of video streaming, thereby improving the user’s Quality
of Experience (QoE). The study in [127] showed that YouTube adaptive streaming
delivers approximately 1 Megabyte (MB) of data to the user’s player every 10 seconds,
with the data being received in multiple fragments. However, video content fragments
could also be grouped to postpone their transmission at no cost to the perceivable QoE
as long as the playback is not interrupted [128]. The work presented in [128] utilizes
mobility information to control the download rate of video content fragments and
thereby the amount of fragments in the user’s buffer. When the mobile user is far away
from the BS, the buffer size is maintained at a minimum level (only a few seconds ahead
of playback time) in order to minimize the radio transmissions conducted under low QoS
levels. On the other hand, the content is aggressively downloaded when the mobile
station is close to the BS and the link quality conditions are good. The scheme proposed
in [128] has shown to considerably reduce the energy consumption compared to
traditional mobile video content deliver schemes in high mobility networks. However,
videos are not always watched from start to finish (actually 80% of video sessions are
interrupted [129]) and therefore downloading all the video data, even at good channel
conditions, might be inefficient (considerable resources are wasted in the case that user
Figure 6‐1. YouTube screenshot ‐ example of delay tolerant traffic.
50s

Chapter 6. Opportunistic Multi‐hop Cellular Networks
117
decides not to watch part or the whole media file after it has been downloaded). In this
context, the adoption of opportunistic forwarding schemes in MCNs represents an
interesting alternative to provide quality of service while improving energy‐efficiency for
mobile video traffic. Figure 6‐1 illustrates a real example of the buffering policy
implemented on YouTube. In this case, the buffered data is equivalent to 50 seconds of
playback. Therefore, the download of the remaining data could be postponed/delayed
at no cost to the user’s QoE as long as the playback time does not pass the buffered
data.
Mobile email is another example of popular service that can tolerate certain
transmission delay. Mobile email data traffic has increased over the last years due to the
availability of renewed email client applications on mobile devices and smartphones that
have improved the user experience. Based on Cisco’s estimates, email traffic will grow at
a compound annual growth rate of 39 percent from 2014 to 2019 in mobile networks
[15]. Email traffic (in general) does not require synchronous end‐to‐end communications
and can tolerate delays (>>10 s) according to the International Telecommunication
Union (ITU) QoS classification [130]. The delay tolerance is expected from the polling
frequency at which email clients check for emails at servers. For example, Gmail clients
check for emails approximately once per hour and the polling frequency reduces as long
as emails are found on the server; the polling interval can be reduced to approximately 5
minutes intervals. Gmail has also recently released an application that is intended to let
users use email service offline. This Gmail Offline application stores messages created
offline to be sent when the connectivity opportunities arise. Microsoft Outlook also
allows configuring when to schedule an automatic send/receive command. The
minimum send/receive schedule is 1 minute and the maximum is 1440 minutes (1 day).
Social networks and messaging applications generate a significant amount of photo
sharing and messaging (text and multimedia) traffic. For example, recent figures
published in [131] show that more than 250 billion photos have been uploaded to
Facebook since the site was launched, and more than 350 million photos are uploaded
every day on average. It is also worth noting the recent WhatsApp figures: users are
sending 19 billion messages a day and sharing 600 million photos every 24 hours.
Uploading photos to social networks is not necessarily an instantaneous process, and
can be configured considering factors such as the synchronization frequency, battery
level and technology (e.g. synchronizing over WiFi and cellular network, or over WiFi
only). Mobile messaging applications (e.g. WhatsApp, Line [132], Viber [133] or HeyTell
[134]) require a data connection at the transmitter and receiver for the exchange of
Chapter 6. Opportunistic Multi‐hop Cellular Networks
118
messages. Mobile messaging applications are delay tolerant from their design since they
postpone the transmission or reception of the messages if such connections are not
available.
Other relevant delay tolerant applications include Over‐The‐Air (OTA) updating and
cloud file hosting services. OTA updating services are becoming increasingly popular in
smartphones and tablets for updating applications, software or firmware as well as
configuration settings on mobile devices [135]. These services are delay tolerant in
nature since software updates are generally delivered to the users gradually once
released. Therefore, OTA updating services can be designed to exploit connectivity and
offloading opportunities. Cloud file hosting services allow (mobile) users to store
content in the cloud and access it at any time and place using different (mobile)
devices/platforms. These services can be configured to automatically upload files of any
type for backup or just for sharing with other users and platforms (e.g. files, photos or
videos). This process can again be configured to exploit the characteristics and efficiency
of connectivity conditions. The possibility to optimize the configuration of mobile
uploading processes is also present in the vehicular environment. For example, car
insurance companies are introducing pay‐as‐you‐drive policies that calculate the drivers’
insurance premiums based on the vehicle usage (speed, acceleration, time of day, type
of road, and milestone). Vehicles are equipped with an accelerometer and a GPS to track
the vehicle location/acceleration, and a cellular modem to collect the measurements at
the control center. The frequency with which the vehicle uploads the information is
managed at the control center [136]. Therefore, the upload of information from the
vehicle can be deemed as delay tolerant.
6.3 OpportunisticForwardinginMulti‐hopCellularNetworks
The services introduced in Section 6.2 offer the possibility to manage the tolerable
delay towards a desired outcome at no cost to the perceivable QoE. This can be of
particular interest for the integration design of opportunistic networking into MCNs
since delay tolerant mobile traffic services offer the possibility for mobile devices to
delay the transmission of the information to the base station. In the case of this thesis,
the desired outcome for the integration of opportunistic store, carry and forward
mechanisms in MCNs is to reduce the total energy consumption.
The study conducted in this thesis considers a two‐hop MCN scenario in which a
static Source Node (SN) wants to transmit information to a Base Station (BS) using a

Chapter 6. Opportunistic Multi‐hop Cellular Networks
119
Mobile Relay (MR) with store, carry and forward capabilities (Figure 6‐2). To start with,
the study does not focus on any particular delay tolerant service but a generic one that
requires the information to be transmitted to the BS within a time T. The time needed to
transmit the information from SN to BS is computed taking into account: 1) the time
needed for the D2D transmission from SN to MR (D2D tx), 2) the time that the MR stores
and carries the information (Store and carry), and 3) the time needed by the MR to
transmit the information to the BS (Cellular tx). As depicted in Figure 6‐2, estimating the
time needed for each one of these processes requires determining the MR location at
which the D2D transmission should start (Opt_Xi), and the MR location at which the
cellular transmission should start (Opt_Yi). This section focuses then on estimating these
two locations with the final objective to reduce the total energy consumption.
MRSN
1
2
3
BS
MR
Store and Carry
D2D tx
Cellular tx
Opt_Yi Opt_Xi
Figure 6‐2. Two‐hop opportunistic MCN scenario.
6.3.1 ProblemFormulation
A multi‐objective constrained optimization problem is defined to identify the
optimum MR location and the location at which the relay needs to start forwarding the
information to the cellular network in order to minimize the overall energy consumption
(equations (6‐1) to (6‐4)). The objective function shown in equation (6‐1) has been
defined together with two constraints (equations (6‐2) and (6‐3)), and the requirement
that the BS receives the information before a service‐dependent deadline T (equation
(6‐4)). This deadline T is discretized in the optimization framework as {τ0, τ1… τГ}.
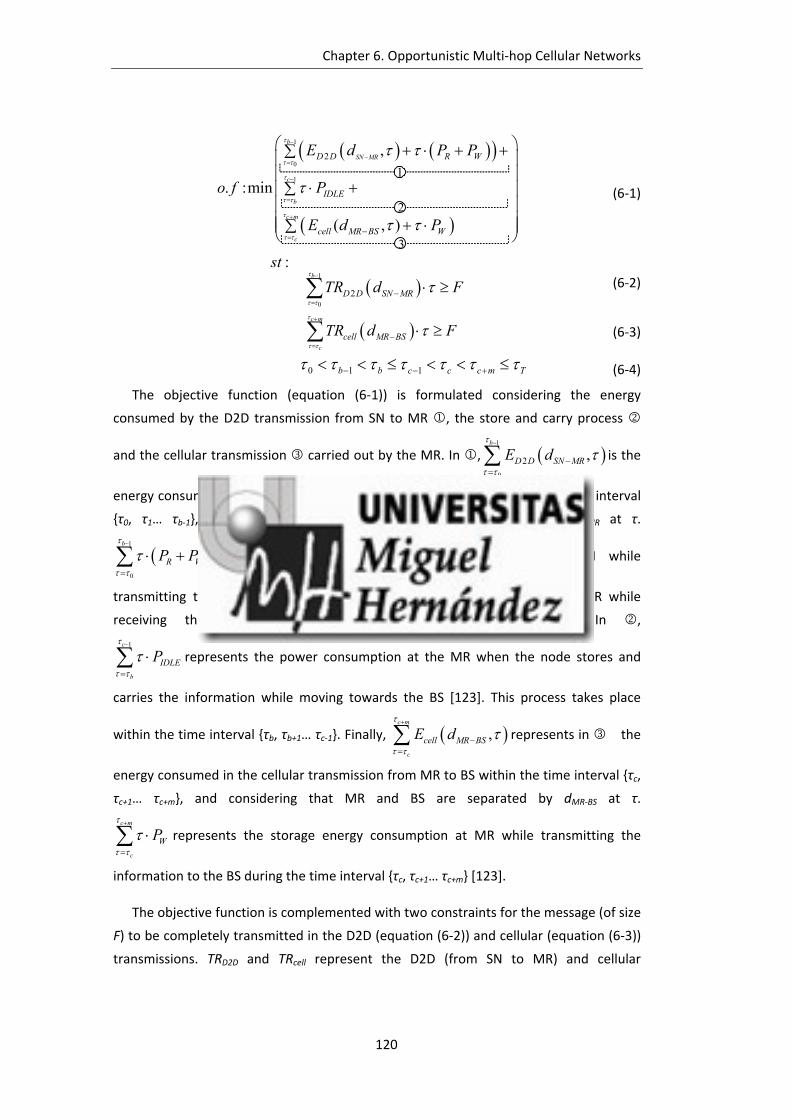
Chapter 6. Opportunistic Multi‐hop Cellular Networks
120
1
0
1
2 ,
. :min
( , )
b
SN MR
c
b
c m
c
D D R W
IDLE
cell MR BS W
E d P P
o f P
E d P
(6‐1)
1
0
2
:b
D D SN MR
st
TR d F
(6‐2)
c m
c
cell MR BSTR d F
(6‐3)
0 1 1b b c c c m T (6‐4)
The objective function (equation (6‐1)) is formulated considering the energy
consumed by the D2D transmission from SN to MR , the store and carry process
and the cellular transmission carried out by the MR. In , 1
0
2 ,b
D D SN MRE d
is the
energy consumed in the D2D transmission between SN and MR within the time interval
{τ0, τ1… τb‐1}, and considering that SN and MR are separated by dSN‐MR at τ.
1
0
b
R WP P
represents the storage power consumption at the SN while
transmitting the information, and the storage power consumption at the MR while
receiving the information during the D2D transmission [123]. In ,
1c
b
IDLEP
represents the power consumption at the MR when the node stores and
carries the information while moving towards the BS [123]. This process takes place
within the time interval {τb, τb+1… τc‐1}. Finally, ,c m
c
cell MR BSE d
represents in the
energy consumed in the cellular transmission from MR to BS within the time interval {τc,
τc+1… τc+m}, and considering that MR and BS are separated by dMR‐BS at τ.
c m
c
WP
represents the storage energy consumption at MR while transmitting the
information to the BS during the time interval {τc, τc+1… τc+m} [123].
The objective function is complemented with two constraints for the message (of size
F) to be completely transmitted in the D2D (equation (6‐2)) and cellular (equation (6‐3))
transmissions. TRD2D and TRcell represent the D2D (from SN to MR) and cellular
1
2
3
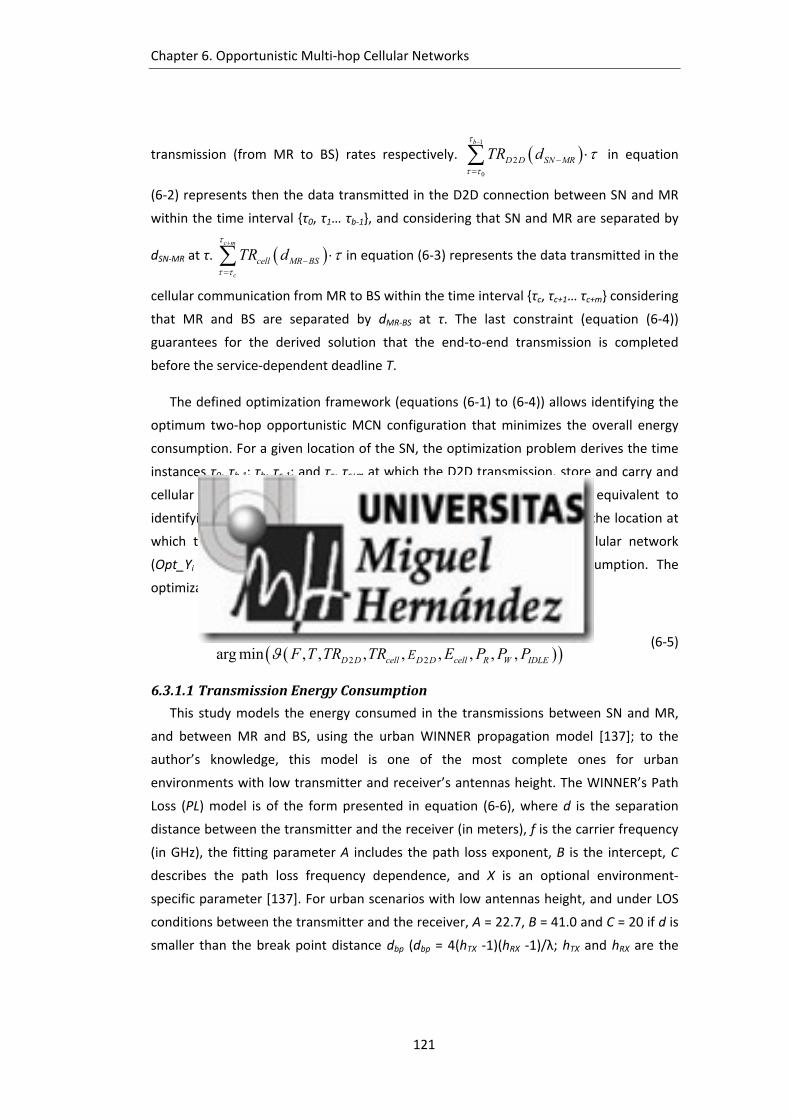
Chapter 6. Opportunistic Multi‐hop Cellular Networks
121
transmission (from MR to BS) rates respectively. 1
0
2
b
D D SN MRTR d
in equation
(6‐2) represents then the data transmitted in the D2D connection between SN and MR
within the time interval {τ0, τ1… τb‐1}, and considering that SN and MR are separated by
dSN‐MR at τ. c m
c
cell MR BSTR d
in equation (6‐3) represents the data transmitted in the
cellular communication from MR to BS within the time interval {τc, τc+1… τc+m} considering
that MR and BS are separated by dMR‐BS at τ. The last constraint (equation (6‐4))
guarantees for the derived solution that the end‐to‐end transmission is completed
before the service‐dependent deadline T.
The defined optimization framework (equations (6‐1) to (6‐4)) allows identifying the
optimum two‐hop opportunistic MCN configuration that minimizes the overall energy
consumption. For a given location of the SN, the optimization problem derives the time
instances τ0, τb‐1; τb, τc‐1; and τc, τc+m at which the D2D transmission, store and carry and
cellular transmission processes take place, respectively. This is in fact equivalent to
identifying the optimum mobile relay location (Opt_Xi in Figure 6‐2) and the location at
which the relay needs to start forwarding the information to the cellular network
(Opt_Yi in Figure 6‐2) in order to minimize the overall energy consumption. The
optimization process (represented by ϑ) can then be expressed as follows:
0 1 1
2 2
, , , , , ; _ , _
arg min , , , , , , , ,
b b c c c m i i
D D cell D D cell R W IDLEE
Opt X Opt Y
F T TR TR E P P P
(6‐5)
6.3.1.1 TransmissionEnergyConsumption
This study models the energy consumed in the transmissions between SN and MR,
and between MR and BS, using the urban WINNER propagation model [137]; to the
author’s knowledge, this model is one of the most complete ones for urban
environments with low transmitter and receiver’s antennas height. The WINNER’s Path
Loss (PL) model is of the form presented in equation (6‐6), where d is the separation
distance between the transmitter and the receiver (in meters), f is the carrier frequency
(in GHz), the fitting parameter A includes the path loss exponent, B is the intercept, C
describes the path loss frequency dependence, and X is an optional environment‐
specific parameter [137]. For urban scenarios with low antennas height, and under LOS
conditions between the transmitter and the receiver, A = 22.7, B = 41.0 and C = 20 if d is
smaller than the break point distance dbp (dbp = 4(hTX ‐1)(hRX ‐1)/λ; hTX and hRX are the
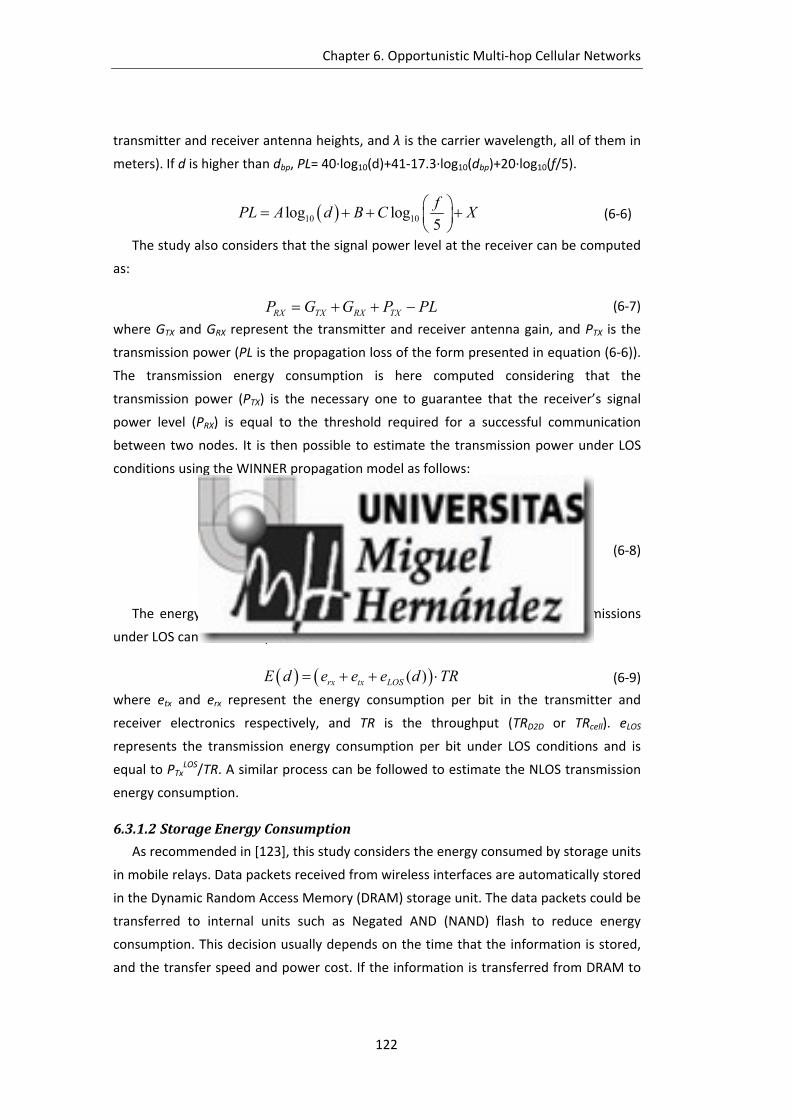
Chapter 6. Opportunistic Multi‐hop Cellular Networks
122
transmitter and receiver antenna heights, and λ is the carrier wavelength, all of them in
meters). If d is higher than dbp, PL= 40∙log10(d)+41‐17.3∙log10(dbp)+20∙log10(f/5).
10 10log log5
fPL A d B C X
(6‐6)
The study also considers that the signal power level at the receiver can be computed
as:
RX TX RX TXP G G P PL (6‐7)
where GTX and GRX represent the transmitter and receiver antenna gain, and PTX is the
transmission power (PL is the propagation loss of the form presented in equation (6‐6)).
The transmission energy consumption is here computed considering that the
transmission power (PTX) is the necessary one to guarantee that the receiver’s signal
power level (PRX) is equal to the threshold required for a successful communication
between two nodes. It is then possible to estimate the transmission power under LOS
conditions using the WINNER propagation model as follows:
24.12.7
24.14
1.73
10 / 5
( )10 / 5
RXbp
TX RXLOSTX
RXbp
TX RX bp
P fd if d d
G GP d
P fd if d d
G G d
(6‐8)
The energy consumed in the D2D (ED2D) and MR to BS cellular (Ecell) transmissions
under LOS can then be expressed as:
( )rx tx LOSE d e e e d TR (6‐9)
where etx and erx represent the energy consumption per bit in the transmitter and
receiver electronics respectively, and TR is the throughput (TRD2D or TRcell). eLOS
represents the transmission energy consumption per bit under LOS conditions and is
equal to PTxLOS/TR. A similar process can be followed to estimate the NLOS transmission
energy consumption.
6.3.1.2 StorageEnergyConsumption
As recommended in [123], this study considers the energy consumed by storage units
in mobile relays. Data packets received from wireless interfaces are automatically stored
in the Dynamic Random Access Memory (DRAM) storage unit. The data packets could be
transferred to internal units such as Negated AND (NAND) flash to reduce energy
consumption. This decision usually depends on the time that the information is stored,
and the transfer speed and power cost. If the information is transferred from DRAM to
Chapter 6. Opportunistic Multi‐hop Cellular Networks
123
NAND, it must be transferred back to the DRAM when the mobile device decides to start
any transmission process (D2D transmission or cellular transmission). This work
considers that the information is always transferred from DRAM to NAND flash (it is out
of the scope of this study to determine when it is worth transferring data from DRAM to
NAND). As a result, the power state transitions of the two storage units needs to be
considered when computing the storage energy consumption. These state transitions
are depicted in Figure 6‐3 [123]. PR includes the power consumed by the DRAM and
NAND flash when these storage units Read (R) and Write (W) the information, as well as
the power consumed for transferring the information from DRAM to NAND flash at
speed Transf_DF. PIDLE includes the power consumed by the NAND flash that is storing
the information in Idle state, and the power consumed by the DRAM that is in Idle_self‐
refresh state. Finally, PW is the power consumed by the two storage units when they
transfer the information back to the DRAM for transmission at speed Transf_FD.
R/W W/RIdle_self-refresh
IdleRead Write
DRAM
NAND flash
Rx Tx
PR PIDLE PW
Transf_DF Transf_FD
time
Figure 6‐3. Transition states of the storage units as a function of the time when the data is
transferred from DRAM to FLASH, and sent back to DRAM [123].
6.4 OptimumConfigurationofOpportunisticForwardinginMCN
Considering the optimization framework presented in Section 6.3, this section
derives optimum configurations of opportunistic forwarding in MCNs that identify for a
two hop scenario the optimum mobile relay location and the location from which the
mobile relay should start forwarding the information to the cellular base station in order
to minimize the overall energy consumption.
6.4.1 EvaluationScenario
The numerical resolution of the analytical framework described in the previous
section is done considering the parameters summarized in Table 6‐1. The evaluation

Chapter 6. Opportunistic Multi‐hop Cellular Networks
124
considers LTE at 2 GHz for the cellular transmissions, and IEEE 802.11g at 2.4 GHz for the
D2D transmissions17. These technologies have been selected based on the availability of
the necessary models. In any case, the conclusions reported in this study are not
dependent on the selected radio access technologies. In fact, the analysis has been
replicated considering HSPA for the cellular radio access, and the same conclusions have
been observed (see Annex A). Following the model reported in [138], the LTE
throughput for the cellular link between MR and BS can be approximated as:
, 1 ,cell PRB MCS BLER PRB MCSTR d r N l p N l (6‐10)
where r(NPRB, lMCS) is defined in [138] as the maximum instantaneous data rate
achievable by the user on a frequency chunk of size NPRB Physical Resource Blocks (PRB),
and modulation and coding scheme (MCS) index lMCS. NPRB has been set to 6 as in [139]
and following the 3GPP guidelines in [140]. In addition, pBLER(NPRB, lMCS) is the Block Error
Rate (BLER) experienced for an allocation size of NPRB and MCS index lMCS. As established
in [138], this study considers a target BLER of 10% that coincides with that for the
17 It is important to recall that 3GPP considers IEEE 802.11 technologies as well as cellular
technologies (e.g. LTE‐Direct) for device‐to‐device communications [9].
Table 6‐1. Evaluation parameters.
Parameter Description Value
R Cell radius 1000 m
v Mobile nodes’ speed 2 m/s
F File size 10 Mb
T Transmission deadline 100 s
GTX, GRX Transmitter and receiver antenna gain 1
etx, erx Energy consumed per bit by the transmitter/receiver
50 x 10‐9 J/b
PRX Power reception threshold ‐62 dBm
hSN, hMR, hBS Antenna height of SN, MR and BS 1.5 m, 1.5 m, 10 m
DRAM PR, PW, PIdle_self‐refresh
DRAM power consumed for Reading, Writing and in Idle_self‐refresh state
252 mW, 252 mW, 1.35 mW
NAND EffRead, EffWrite, PIdle
NAND efficiency for Reading and Writing, and Power consumed in Idle state
1.83 nJ/b, 11.92 nJ/b, 0.4 mW
Transf_DF, Transf_FD
Transfer speed from the DRAM to the NAND flash and vice versa
4.85 MiB/s, 927.1 KiB/s

Chapter 6. Opportunistic Multi‐hop Cellular Networks
125
reported CQI values as described in the 3GPP physical layer procedures [141]; pBLER(NPRB,
lMCS) is hence set to 0.1 in equation (6‐10). This study considers 15 MCS indexes
(coinciding with the available CQI indexes in LTE) that are set according to the distance
(d) between the MR and the BS (more robust MCS are needed as the distance to the
serving BS increases). The cell is hence divided into 15 equally spaced and concentric
rings identified by the MCS indexes. MCS indexes for the allocated NPRB are finally
mapped to the Transport Block Size (TBS) indexes (lTBS) using the table reported in [141].
The r(NPRB, lMCS) used in equation (6‐10) can then be calculated as:
,PRB MCSTBS
TBSr N l T (6‐11)
where TTBS is the TBS duration which is equal to 0.5 ms in LTE, and TBS is the size of the
transport block associated with lTBS.
Using the model reported in [110], the IEEE 802.11g throughput for the D2D link
between SN and MR can be expressed as follows:
2 ( ) 1D DTR d DataRate d Eff PER d (6‐12)
where DataRate, PER and Eff represent the IEEE 802.11g transmission mode, Packet
Error Ratio and channel efficiency, respectively. d is the distance between the
transmitter and receiver (in meters). IEEE 802.11g defines twelve possible combinations
of modulation and coding schemes that result in the set of data rates: {54, 48, 36, 24, 18,
12, 9, 6; 11, 5.5, 2, 1} Mbps. The data rate control algorithm dynamically selects the IEEE
802.11g data rate based on the link quality conditions. The IEEE 802.11g DataRate
model used in this study is the one empirically derived by this thesis in Section 5.2.6:
54 78.47
54 1 178.47 270.85
1 1 270.8578.47 270.850 270.85
d m
DataRate d m d md
m d
(6‐13)
Equation (6‐13) indicates that the IEEE 802.11g DataRate is set to 54 Mbps at short
distances. More robust data rates are then used with increasing distances between SN
and MR. The IEEE 802.11g PER model is also derived empirically in this thesis and has
been presented in Section 5.2.6:
0.019 115.15
0.75
1 dPER d
e
(6‐14)
Equation (6‐14) indicates that the PER augments with the distance (d, in meters)
between transmitter and receiver (despite using more robust modulation and coding

Chapter 6. Opportunistic Multi‐hop Cellular Networks
126
schemes as shown in equation (6‐13)), although an upper PER limit (0.75) is reached.
The IEEE 802.11g channel efficiency (Eff) represents the effective time that the IEEE
802.11g channel is used to transmit data, and depends on the transmission time of data
packets (td) and ACK packets (tack), the contention period (tcont), and the inter‐frame
guard times (DIFS and SIFS)[110]:
d
cont d ack
tEff =
DIFS+t t SIFS t (6‐15)
The energy consumption values for the DRAM and NAND flash storage units have
been obtained from [142] and [143] respectively. The energy consumed per bit in the
transmitter and receiver electronics (etx and erx), and the power reception threshold
(PRx), have been obtained from [123]. The scenario considers the MR is in line with the
SN, and moving towards the BS with a speed v of 2 m/s. The considered pedestrian
scenario represents a worst‐case scenario. This is the case because the faster the MR
moves towards the BS, the closer to the BS will start the cellular transmission, which will
result in higher cellular data rates and lower energy consumption. The SN needs to
transmit to the BS a 10 Mb (F) file before a 100 seconds deadline T [99].
6.4.2 NumericalEvaluation
The optimization problem presented in Section 6.3 has been implemented in Matlab.
Brute force has been used to solve the optimization problem for all possible distances
between SN and BS. Figure 6‐4.a shows the optimum MR location at which to start the
D2D transmission as a function of the distance between SN and BS (labeled ‘Optimum’).
The MR location is represented by means of the distance between SN and MR. For
example, if SN is located 400 meters away from the BS, the MR should be ideally located
50 meters away from the SN in the direction of the BS in order to minimize the total
energy consumption. Figure 6‐4.a shows that the distance between SN and the optimum
MR that minimizes the energy consumption increases with the distance between SN and
BS. This is to reduce the distance at which the MR starts forwarding the information
towards the BS (and therefore the cellular transmission energy consumption). The peaks
shown in Figure 6‐4.a correspond to the case when the SN selects an MR closer to the BS
and that could reach a ring with higher cellular data rate; the use of higher data rates
reduces the cellular transmission energy consumption. However, the D2D transmission
energy consumption increases as the MR is selected closer to the BS. As a result, the
distance between SN and the optimum MR location only increases when the energy
saving of the store and carry process (that allows reducing the cellular transmission
distance from MR to BS) can compensate the increase in the D2D transmission energy
consumption. Figure 6‐4.a shows a small increase in the MR location when the SN is

Chapter 6. Opportunistic Multi‐hop Cellular Networks
127
located very close to the BS. This is because the optimum MR does not store and carry
the information when the SN is close to the BS (further details are provided below), and
therefore the SN selects an MR as close as possible to the BS. The energy consumption
levels for the D2D transmission from SN to the optimum MR location are reported in
Figure 6‐4.b in logarithmic scale as a function of the distance between SN and BS. The
increasing distances between SN and the optimum MR location (Figure 6‐4.a) result in
that the D2D transmission energy consumption levels increase with the distance
between SN and BS.
0 200 400 600 8000
50
100
150
200
SN distance to the BS [m]
SN
-MR
dis
tan
ce [m
]
OptimumMR closest to BS
0 200 400 600 80010
-5
10-4
10-3
10-2
10-1
100
SN distance to the BS [m]
D2
D t
x en
erg
y c
on
sum
pti
on
[KJ]
Optimum
MR closest to BS
a) Optimum MR location b) D2D transmission energy consumption
Figure 6‐4. Optimum configuration of two‐hop opportunistic MCN communications: D2D
transmission.
0 200 400 600 8000
20
40
60
80
SN distance to the BS [m]
Tim
e t
he
MR
SC
th
e in
fo [
s]
OptimumMR closest to BS
0 200 400 600 800
10-3
10-2
SN distance to the BS [m]
SC
en
erg
y co
nsu
mp
tio
n [
KJ
]
OptimumMR closest to BS
a) Time the MR stores and carries the
information while moving towards the BS
b) Store and Carry energy consumption
Figure 6‐5. Optimum configuration of two‐hop opportunistic MCN communications: Store and
Carry (SC).
Chapter 6. Opportunistic Multi‐hop Cellular Networks
128
To demonstrate how important is to adequately select the MR, Figure 6‐4 also shows
the results obtained with a greedy forwarding scheme in which the SN selects the MR
that is located closest to the BS [144]. This scheme is referred to as ‘MR closest to BS’ in
this study. For a fair comparison, a similar optimization process to that reported in
Section 6.3 is conducted for the ‘MR closest to BS’ scheme. In particular, the
optimization process derives for this scheme the MR location that provides the highest
progress towards the BS and still allows the MR to upload the information to the BS
before the deadline T. The location at which the MR should start forwarding the
information to the BS is also derived in the optimization problem. In this case, if the SN
is located 400 meters away from the BS, the MR should be located 230 meters away
from the SN in the direction towards the BS (Figure 6‐4.a). The higher D2D transmission
distances of the ‘MR closest to BS’ scheme with respect to the ‘Optimum’ proposal
(Figure 6‐4.a) result in the significant increase in the D2D transmission energy
consumption depicted in Figure 6‐4.b.
Once the D2D transmission from SN to the optimum MR is completed, the MR needs
to store and carry the information towards the BS from the location identified in Figure
6‐4.a. Figure 6‐5.a shows the time that the optimum MR stores and carries (SC) the
information in order to minimize the total energy consumption (‘Optimum’ in Figure
6‐5). Figure 6‐5.a shows that if an SN is located 500 meters away from the BS, the
optimum MR needs to store and carry the information for 96 seconds before
transmitting it to the BS using cellular communications. The obtained results indicate
that when the SN is close to the BS, the optimum MR does not need to store and carry
the information. The MR should instead forward it to the BS as soon as received from
the SN. This is because the energy consumption of the store and carry process does not
compensate the energy savings resulting from forwarding the information at distances
closer to the BS. Despite the fact that the optimum MR does not store and carry the
information, the results depicted in Figure 6‐5.b show non null SC energy consumption
levels when SN is close to the BS. This is because the SC energy consumption also
includes the storage energy consumption at SN and MR while transmitting and receiving
the information (PR and PW in Figure 6‐3). As the distance from SN to the BS increases,
the optimum MR needs to store and carry the information so that its cellular
transmission starts closer to the BS where higher cellular data rates are possible.
However, for high distances between SN and BS, the time the MR stores and carries the
information to minimize the total energy consumption slightly decreases. The results
depicted in Figure 6‐5.b also show that the SC energy consumption levels increase with
the distance between SN and BS. These two effects are due to the increase in the time

Chapter 6. Opportunistic Multi‐hop Cellular Networks
129
needed to complete the D2D (Figure 6‐4.a) and cellular transmissions (Figure 6‐6.a).
Figure 6‐6.a shows the time the optimum MR needs to transmit the information to the
BS using its cellular radio interface, while Figure 6‐6.b reports the resulting cellular
transmission energy consumption levels. The results depicted in Figure 6‐6.a also show
that an optimum configuration of opportunistic forwarding reduces the time needed to
complete the MR‐BS cellular transmission compared to the time needed by traditional
single‐hop cellular communications to complete the SN‐BS cellular transmission (‘1‐hop
cellular’). This actually demonstrates that the use of opportunistic MCN communications
can also provide significant capacity gains at the network level.
0 200 400 600 8000
10
20
30
SN distance to the BS [m]
Ce
llula
r tx
tim
e [s
]
OptimumMR closest to BS1-hop cellular1-hop Direct-contact
0 200 400 600 800
10-4
10-3
10-2
10-1
SN distance to the BS [m]
Ce
llula
r tx
en
erg
y c
on
su
mp
tio
n [
KJ]
Optimum
MR closest to BS
a) Time the MR requires to transmit the data to
the BS
b) Cellular transmission energy consumption
Figure 6‐6. Optimum configuration of two‐hop opportunistic MCN communications: cellular
transmission.
The impact of selecting the MR that provides the highest progress towards the BS
(‘MR closest to BS’ in Figure 6‐5) on the store and carry process is twofold. First, the
time the MR stores and carries the information (Figure 6‐5.a) is reduced compared with
the optimum configuration (‘Optimum’). For example, if SN is located 500 meters away
from the BS, the time the MR stores and carries the information is reduced to 78
seconds. Second, the SC energy consumption levels (Figure 6‐5.b) increase compared to
the optimum configuration despite reducing the time the MR stores and carries the
information (Figure 6‐5.a). These two trends are observed because of the higher time
necessary for finishing the D2D transmission from SN to MR when MR is selected as
close as possible to the BS (Figure 6‐4.a). This reduces the time needed to upload the
information to the BS (Figure 6‐6.a), and therefore the cellular transmission energy

Chapter 6. Opportunistic Multi‐hop Cellular Networks
130
consumption (Figure 6‐6.b). However, it also results in shorter times available for the
MR to store and carry the information, and therefore increases the energy consumption
at SN and MR while transmitting and receiving the information (PR and PW), respectively.
0 200 400 600 800
10-3
10-2
10-1
100
101
SN distance to the BS [m]
En
erg
y c
on
su
mp
tio
n [
KJ
]
OptimumMR closest to BS
1-hop cellular1-hop Direct-contact
Figure 6‐7. Optimum configuration of two‐hop opportunistic MCN communications: Total energy
consumption.
Using the configurations illustrated in Figure 6‐4, Figure 6‐5 and Figure 6‐6, the
optimum MR location (‘Optimum’) results in significant total energy savings for the end‐
to‐end transmission of the file before T from SN to BS (Figure 6‐7). On average, the total
energy consumption can be reduced by 98% when using the derived optimum
configuration for opportunistic MCN communications with respect to the ‘MR closest to
BS’ approach. The lower cellular transmission energy consumption levels (Figure 6‐6.b)
obtained when selecting the MR as close as possible to the BS cannot compensate the
higher D2D transmission (Figure 6‐4.b) and SC (Figure 6‐5.b) energy consumption levels.
The obtained results clearly demonstrate the need to adequately configure
opportunistic MCN communications to achieve the desired objectives in terms of energy
efficiency.
The energy consumption of traditional single‐hop cellular communications has also
been evaluated and is reported in Figure 6‐7. The ‘1‐hop cellular’ configuration refers to
the case in which the static SN transmits the file directly to the BS. In the ‘1‐hop Direct‐
contact’ configuration, the SN is mobile, and can store, carry and forward the

Chapter 6. Opportunistic Multi‐hop Cellular Networks
131
information to the BS without using a mobile relay; this scheme is usually referred to as
Direct‐contact in the literature [111]. For a fair comparison, the ‘1‐hop Direct‐contact’
configuration follows a similar optimization process to that reported in Section 6.3 to
derive the optimum location at which the moving SN should start forwarding the
information to the BS in order to minimize the total energy consumption. The obtained
results show that when SN is very close to BS, there are no energy benefits from using
opportunistic MCN communications compared to single‐hop cellular schemes. However,
as the distance increases, an optimum configuration of opportunistic MCN
communications can significantly reduce the total energy consumption compared to
single‐hop cellular schemes; please note that energy consumption levels in Figure 6‐7
are shown in logarithmic scale. For example, when SN is 300 meters away from the BS,
the optimum configuration (‘Optimum’) reduces the total energy consumption by
approximately 75% compared to traditional single hop cellular communications (‘1‐hop
cellular’). The reduction augments to approximately 98% at the cell edge. The Direct‐
contact scheme (‘1‐hop Direct‐contact’) reduces the total energy consumption
compared to traditional single‐hop cellular communications (on average by 85%), but
cannot achieve the total energy consumption levels that an optimum configuration of
opportunistic MCN communications can reach. In fact, such optimum configuration can
reduce the total energy consumption by up to 85% (on average by 77%) compared to
the Direct‐contact scheme. In addition, the ‘1‐hop Direct‐contact’ scheme cannot reach
the capacity benefits shown by the optimum configuration in Figure 6‐6.a in terms of the
time needed to upload the information to the BS.
6.5 Influence of Traffic Characteristics on the Energy
ConsumptionofOpportunisticMCN
The study conducted in Section 6.4 has derived optimum configurations of
opportunistic MCN communications (i.e. the optimum MR location and the location at
which the MR should start forwarding the information to the BS) and their
corresponding energy consumption levels. The analytical framework presented in
Section 6.3 showed that the optimum opportunistic MCN configuration depends on the
traffic characteristics (T and F) of the mobile delay tolerant service. This section
therefore investigates the impact of such traffic characteristics on the total energy
consumption, and how opportunistic MCN communications should be configured to
exploit traffic characteristics in order to reduce the energy consumption. This study also
considers that a static SN wants to upload a message of size F to the BS before a

Chapter 6. Opportunistic Multi‐hop Cellular Networks
132
deadline T. The term message will refer in this section to the information data that
needs to be uploaded to the BS before the service‐dependent delay tolerance (T)
elapses. For example, it could represent the entire file in the case of cloud/email
services, or a set of grouped fragments in the case of mobile video traffic (see Section
6.2). This analysis is also conducted through numerical resolution of the analytical
framework described in Section 6.3. The optimization problem has been thus solved by
means of brute force techniques implemented in Matlab for all possible distances
between SN and BS, and for a wide set of traffic characteristics T and F representing
different delay tolerant mobile traffic services.
1.2551012.5
18.7525 0
50100150200
80
120
160
200
Deadline -T- [s]Message size -F- [MB]
SN
dis
tan
ce
to
BS
[m
]
Figure 6‐8. SN distance to the BS from which two‐hop opportunistic MCN communications are
more energy efficient than single‐hop cellular communications. The distance is depicted as a
function of the size of the message to be transmitted (F) and the traffic‐dependent deadline (T).
The energy consumed by opportunistic MCN communications is first compared
against that consumed in traditional single‐hop cellular (‘1‐hop cellular’, direct cellular
connection between SN and BS). Figure 6‐8 shows the SN distance to the BS from which
two‐hop opportunistic MCN communications are more energy efficient than 1‐hop
cellular communications. The results are shown for a variety of F and T, and have been
obtained considering a cell radius of 1000 meters and mobile MRs moving towards the
BS at pedestrian speed (2 m/s)18. The depicted results show that the SN distance to the
18 The rest of parameters for the evaluation conducted in this section are those already
presented in Table 6‐1.

Chapter 6. Opportunistic Multi‐hop Cellular Networks
133
BS from which opportunistic MCN communications are more efficient than single‐hop
communications increases with increasing values of F. This means that with messages of
larger size, opportunistic MCN communications can be more energy efficient if SN is not
close to the BS. This is due to the fact that large messages increase the ED2D and ESC
energy consumption levels in the opportunistic MCN connection. To reduce the overall
energy consumption with respect to single‐hop cellular communications, high energy
savings from the MR‐BS cellular transmission are hence necessary to compensate the
increased ED2D and ESC levels. Opportunistic MCN communications can achieve such
savings with increasing SN‐BS distances because of the lower single‐hop energy
efficiency at large distances to the BS, and the use of store, carry and forward schemes
with mobile relays. This is actually reflected in Figure 6‐9 that shows the total energy
consumption for 1‐hop cellular and opportunistic MCN communications as a function of
the SN‐BS distance (F=5 MB and T= 150 seconds)19. Figure 6‐9 shows that an optimum
configuration of opportunistic MCN communications can significantly reduce the total
energy consumption for SN‐BS distances larger than 140 meters. For example, when SN
19 Note that the results presented in Figure 6‐9 are similar to those already shown in Figure 6‐7
for different traffic characteristics. While the results shown in Figure 6‐7 were obtained with F=10
Mb and T=100 s, the results in Figure 6‐9 are obtained with F=5 MB and T=150 s. However,
similar trends are observed in both figures.
0 200 400 600 80010
-3
10-2
10-1
100
101
SN distance to the BS [m]
En
erg
y c
on
su
mp
tio
n [
KJ
]
1-hop cellular
Optimum
Figure 6‐9. Total energy consumption as a function of the distance between SN and BS when F=5
MB and T=150 seconds.

Chapter 6. Opportunistic Multi‐hop Cellular Networks
134
is located 250 meters away from the BS, opportunistic MCN communications reduce by
60% the energy consumption compared with traditional single‐hop cellular
communications. This gain increases above 90% for distances between SN and BS higher
than 350 meters. Figure 6‐9 has been obtained considering LTE for the cellular
transmissions. Simulations were also conducted with HSPA (see Annex A), and the same
trends were observed with slightly smaller energy gains for opportunistic MCN
communications compared to when using LTE. This is the case because of the higher LTE
transmission rates that benefit opportunistic MCN communications as the MR moves
towards the BS and forwards the information to the cellular network.
Figure 6‐8 also shows that the SN distance to the BS from which opportunistic MCN
communications are more energy efficient than single‐hop cellular communications
increases when the message deadline T is small. This is the case because small deadlines
do not provide sufficient time to exploit the store and carry process, and the MR
forwards the message to the BS as soon as received. When T increases, the SN‐BS
distance from which opportunistic MCN communications achieves higher energy
efficiency than single‐hop cellular communications does not vary with T. However, T has
an impact on the average reduction in total energy consumption of opportunistic MCNs
compared to single‐hop cellular communications. Such impact is shown in Table 6‐2 as a
function of the distance between SN and BS. As previously discussed, opportunistic MCN
communications do not provide an energy gain when SN is close to the BS (SN‐BS
distances below 100 meters); Table 6‐2 shows that this trend is independent of the
deadline T. When the SN‐BS distance increases, opportunistic MCN communications can
significantly reduce the energy consumption compared to single‐hop cellular
communications, reaching reduction levels near 100% under certain conditions. In fact,
the obtained results show that for a fixed deadline T, opportunistic MCN
communications achieve its higher energy gains compared to single‐hop cellular
communications when the distance from SN to the BS increases. When this distance
increases, opportunistic MCN communications achieve their higher possible energy
gains compared to single‐hop cellular communications when T also increases, but up to
a certain limit. For example, when SN is at a distance to the BS between 401 and 500
meters, the maximum energy reduction is reached for T=200 seconds, and no further
gains are achieved for higher values of T. Increasing T allows reducing the D2D distance
at which SN should start the transmission to MR, as well as the distance to the BS at
which MR should start the cellular transmission to reduce the total energy consumption.
Reducing such distances decreases the energy consumption in the D2D and cellular
transmissions (see Figure 6‐4 and Figure 6‐6 in Section 6.4) but increases the energy

Chapter 6. Opportunistic Multi‐hop Cellular Networks
135
consumption of the store and carry process at the MR (see Figure 6‐5 in Section 6.4).
The results depicted in Table 6‐2 clearly show that for a given SN‐BS distance, there is a
T threshold (Tthr) from which the D2D and cellular transmission energy savings do not
compensate the increased store and carry energy consumption levels. For the scenario
under study, it can be derived such T threshold (Tthr) that depends on the location of SN
(represented by means of the SN‐BS distance – Xi), the distance from the SN to the
optimum MR location (distSN‐MR), and the speed at which MR moves towards the BS (v),
as follows:
i SN MRthr
X distT
v
(6‐16)
It should be also noted that Table 6‐2 does not show any values when T=40 seconds
and the SN‐BS distance increases beyond 700 meters. This is the case because under
these conditions, it is not possible to establish an opportunistic MCN connection that
can transmit the complete 10 MB message before the T deadline expires. Since such
connection is not possible, a comparison with traditional single‐hop cellular
communications is not feasible.
Table 6‐2. Average energy reduction (in %) of opportunistic MCN communications compared to
single‐hop cellular communications for different values of T and F= 10 MB.
SN‐BS distance [m] T [s]
40 100 200 300
1‐100 ‐33.0 ‐33.0 ‐33.0 ‐33.0
101‐200 3.1 3.1 3.1 3.1
201‐300 50.3 58.0 58.7 58.7
301‐400 70.2 85.5 88.3 88.3
401‐500 80.8 93.7 97.1 97.1
501‐600 80.5 94.3 98.7 99.2
601‐700 82.7 95.4 99.3 99.7
701‐800 ‐ 95.5 99.4 99.8
801‐900 ‐ 95.7 99.5 99.9
901‐1000 ‐ 94.9 99.4 99.9
The energy gains of opportunistic MCN communications depend on an adequate
selection of the MR. For example, Section 6.4.2 showed that selecting an MR as close as
possible to the BS (referred to as ‘MR closest to BS’ in this study) can reduce the energy
consumed in the cellular transmission (Figure 6‐6), but this is done at the expense of
higher energy consumption levels in the D2D transmission (Figure 6‐4) that can increase

Chapter 6. Opportunistic Multi‐hop Cellular Networks
136
the total energy consumption (Figure 6‐7). It is therefore necessary to derive the
optimum MR location that minimizes the overall energy consumption, and analyze its
dependence with the traffic service characteristics. Figure 6‐10 shows the optimum MR
location to start the D2D transmission as a function of the distance between SN and BS.
The MR location is represented by means of the distance between SN and MR. Figure
6‐10.a shows for example that if SN is located 600 meters away from the BS, the MR
should be ideally located 88 meters away from SN in the direction of the BS in order to
minimize the total energy consumption. The results depicted in Figure 6‐10.a show that
the distance between SN and MR that minimizes the energy consumption increases with
the distance between SN and BS, and that it does not vary with the message size F (fixing
the message deadline T to 100 seconds). On the other hand, Figure 6‐10.b shows that,
for a given location of SN, the distance from SN to MR that minimizes the overall energy
consumption decreases as T increases (F is set to 6.25 MB). With increasing values of T,
MR has more time to store and carry the information, and therefore can reduce the D2D
distance with SN, and hence the total energy consumption. On the other hand, when the
traffic service is characterized by lower T deadlines, opportunistic MCN communications
should increase the D2D distance to start the cellular forwarding process closer to the BS
and reduce the total energy consumption. In this context, for the scenario under study,
it is possible to derive an expression to calculate the optimum MR location (represented
by means of the distance between SN and MR – distSN‐MR) as a function of the SN‐BS
distance (Xi) and the time available to upload the message to the BS (T) as follows:
45 10 0.2 1SN MR idist T X (6‐17)
0 200 400 600 800 10000
40
80
120
160
200
SN distance to the BS [m]
SN
-MR
dis
tan
ce
[m
]
F= 1.25MBF=6.25MB
F= 10MBF= 12.5MB
0 200 400 600 800 10000
40
80
120
160
SN distance to the BS [m]
SN
-MR
dis
tan
ce[
m]
T= 60sT= 100s
T= 150sT= 200s
a) T=100 seconds b) F=6.25 MB
Figure 6‐10. Optimum MR location that minimizes the total energy consumption for opportunistic
MCN communications. The MR location is shown as a function of the distance between SN and BS
and varying service characteristics (F and T).
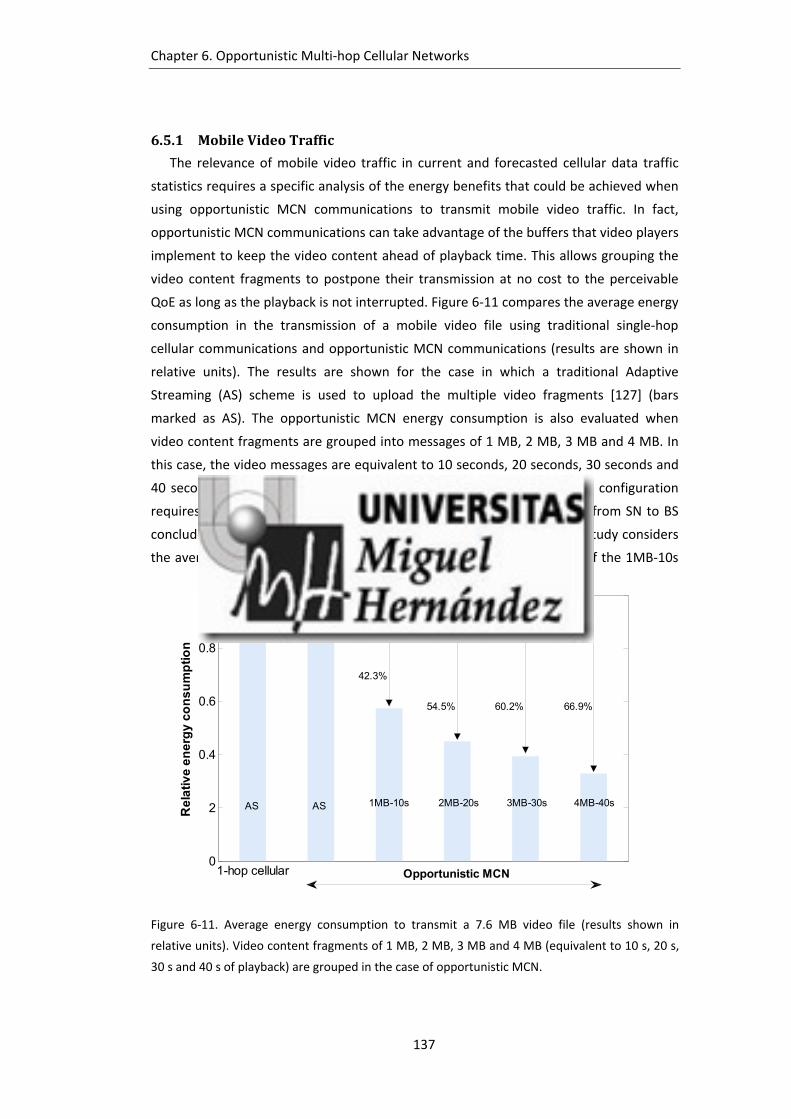
Chapter 6. Opportunistic Multi‐hop Cellular Networks
137
6.5.1 MobileVideoTraffic
The relevance of mobile video traffic in current and forecasted cellular data traffic
statistics requires a specific analysis of the energy benefits that could be achieved when
using opportunistic MCN communications to transmit mobile video traffic. In fact,
opportunistic MCN communications can take advantage of the buffers that video players
implement to keep the video content ahead of playback time. This allows grouping the
video content fragments to postpone their transmission at no cost to the perceivable
QoE as long as the playback is not interrupted. Figure 6‐11 compares the average energy
consumption in the transmission of a mobile video file using traditional single‐hop
cellular communications and opportunistic MCN communications (results are shown in
relative units). The results are shown for the case in which a traditional Adaptive
Streaming (AS) scheme is used to upload the multiple video fragments [127] (bars
marked as AS). The opportunistic MCN energy consumption is also evaluated when
video content fragments are grouped into messages of 1 MB, 2 MB, 3 MB and 4 MB. In
this case, the video messages are equivalent to 10 seconds, 20 seconds, 30 seconds and
40 seconds of playback [127] respectively. As a result, a 1MB‐10s traffic configuration
requires that the opportunistic MCN transmission of the 1 MB message from SN to BS
concludes before 10 seconds to avoid the video playback to freeze. This study considers
the average YouTube video size (7.6 MB) reported in [145]. In the case of the 1MB‐10s
1-hop cellular0
2
0.4
0.6
0.8
1
Re
lati
ve
en
erg
y c
on
su
mp
tio
n
42.3%
10.2%
2MB-20s 3MB-30s 4MB-40s1MB-10sASAS
Opportunistic MCN
66.9%60.2%54.5%
Figure 6‐11. Average energy consumption to transmit a 7.6 MB video file (results shown in
relative units). Video content fragments of 1 MB, 2 MB, 3 MB and 4 MB (equivalent to 10 s, 20 s,
30 s and 40 s of playback) are grouped in the case of opportunistic MCN.
Chapter 6. Opportunistic Multi‐hop Cellular Networks
138
traffic configuration, eight opportunistic MCN transmissions from SN to BS are necessary
to complete the video transmission (seven transmissions of 1 MB plus one transmission
of 0.6 MB). It is considered that the time available to transmit the 0.6 MB video
fragment from SN to BS is also equal to 10 seconds. This is the case because the time
available to transmit this fragment is related to the buffered data in the playback from
the previous transmission (1 MB video fragment with 10 seconds of playback). A 4MB‐
40s traffic configuration would only require two transmissions (1x4 MB + 1x3.6 MB) with
the maximum time available (deadline T) for each one equal to 40 seconds. Each of
these opportunistic MCN transmissions is initiated at the same location of the SN but
uses different MRs (always at the same location for a given traffic configuration, Figure
6‐10.a) as MRs are mobile. The energy consumption levels shown in Figure 6‐11 for
opportunistic MCN communications correspond then to the sum of the energy
consumption in each one of the transmissions necessary to complete the video file
transference. The energy consumption values shown in Figure 6‐11 have been averaged
for all possible distances between SN and BS considering a cell radius of 1000 meters
and MRs moving towards the BS at 2 m/s20.
Figure 6‐11 shows that opportunistic MCN communications can considerably reduce
the average energy consumption with respect to single‐hop cellular communications.
The reduction is particularly relevant when video content fragments are grouped. In
fact, the reduction increases with the number of video content fragments that are
grouped. For example, the reduction increases from 42.26% with the 1MB‐10s traffic
configuration to 66.87% with the 4MB‐40s traffic configuration. This is due to the fact
that opportunistic MCN communications can benefit from increasing values of the
transmission deadline T since the MR would have more time to store and carry the
information, and therefore reduce the D2D distance, the cellular distance with the BS,
and finally the total energy consumption (as analyzed in Section 6.5). The message
deadline T in mobile video traffic, and therefore the energy benefits of opportunistic
MCN communications, increase with the amount of video content fragments that are
grouped. It should be noted that this is at the expense of a higher delay in the
transmission of the first message, which can determine the start of the playback. For
example, the first message (set of grouped video content fragments) is uploaded to the
BS before 10 seconds elapse in the case of the 1MB‐10s traffic configuration. On the
other hand, it could take up to 40 seconds to receive the first 4 MB message in case of
the 4MB‐40s traffic configuration.
20 The rest of parameters used in the study are the same as those already presented in Table 6‐1.

Chapter 6. Opportunistic Multi‐hop Cellular Networks
139
6.6 SummaryandDiscussion
5G cellular networks will require innovative solutions to tackle with the capacity and
energy challenges resulting from the exponential growth of data traffic as mobile users
are increasingly taking a prosumer role. Such innovative solutions should not solely rely
on new radio access technologies and the massive deployment of small BSs, but also
need to exploit the characteristics of the cellular data traffic at no cost to the user QoE.
Some of the services driving the mobile data growth are characterized by certain delay
tolerance. In this context, this chapter investigates how the adoption and design of
opportunistic store, carry and forward mechanisms in MCNs can help significantly
decrease the energy consumption for delay tolerant traffic. To this aim, the study first
derives an analytical framework to identify in two hop scenarios the optimum mobile
relay location and the location from which the mobile relay should start forwarding the
information to the cellular base station in order to minimize the overall energy
consumption. The obtained results show that significant energy gains can be achieved
(on average up to 90%) compared to traditional single‐hop cellular transmissions. This
study has also analyzed the impact of traffic characteristics of delay tolerant services on
the energy gains that can be reached with opportunistic MCN communications, and how
opportunistic MCN communications should be configured to exploit the traffic delay
tolerance in order to reduce the overall energy consumption. The obtained results have
shown that the energy reduction levels with respect to traditional single‐hop cellular
communications can be above 95% under certain conditions (e.g. with increased traffic
delay tolerance thresholds and the increased distance of the source node to the serving
base station). Particular attention has been paid to the case of mobile video traffic that
accounts for a very significant portion of current and forecasted mobile data traffic. The
conducted analysis has shown that by grouping video content fragments, mobile video
traffic and opportunistic MCN communications can provide significant energy savings in
cellular networks at no cost to the perceived QoE. The conducted study has focused on
deriving optimum configurations that can be used as performance bounds. This is the
case because it is hardly likely that in a real scenario an MR can be found at the
identified optimum location and time instant. The optimum locations should then be
considered as reference points from where to look for other neighboring MRs. In this
context, the derived analytical framework can be used as a benchmark for the design of
more realistic opportunistic forwarding schemes in MCN systems exploiting D2D
communications.


141
7 Context‐AwareOpportunistic
ForwardinginMCN
The study conducted in Chapter 6 has identified optimum configurations for two‐hop
opportunistic MCNs using mobile relays and D2D communications. In particular, the
study has identified the optimum MR location and the location at which the MR should
start forwarding the information to the BS in order to minimize the overall energy
consumption. This optimum configuration can help establish an energy‐efficiency
performance bound. This is the case because the derived optimum configuration
assumes that an MR can be found when needed at the identified optimum location,
which might not always be the case in a real world network deployment. To address this
scenario, this chapter presents novel context‐aware opportunistic forwarding schemes
designed to facilitate the selection of an MR when no device is available at the identified
optimum location and time instant. The proposed solutions build from the optimum
MCN configuration and MR location identified in Chapter 6, and exploit context
information provided by the cellular infrastructure to search for candidate MRs. The first
proposal –that is presented in Section 7.2 and that is referred to as ‘Time‐dependent
opportunistic forwarding’ (DELAY, in short)– delays the start of the D2D transmission
until an MR is found at the identified optimum location. The second proposal –that is
presented in Section 7.3, and that is referred to as ‘Space‐dependent opportunistic
forwarding’ (AREA, in short)– increases the search area where to look for potential MRs

Chapter 7. Context‐aware Opportunistic Forwarding in MCN
142
around the optimum MR location. These two approaches improve the feasibility of
integrating opportunistic forwarding schemes into cellular networks in a practical setting
since they relax the need for an MR to be located at the identified optimum location and
time instant. Section 7.4 compares the performance of the two context‐aware
opportunistic forwarding proposals under different evaluation settings, and analyzes the
conditions under which each proposal outperforms the other.
7.1 Context‐AwarenessinMCNs
Context‐awareness is increasingly gaining research attention as a means of taking
advantage of context‐information (user preferences, social relationships, network state,
spectrum availability and characteristics, link conditions, interference levels, operating
conditions) to improve the operation and efficiency of networks in general, and MCNs in
particular. For example, the study reported in [146] proposes a centralized scheme
where the cellular BS selects the mobile relay for a two‐hop MCN connection with the
longest multi‐hop link duration. To do so, the BS collects GPS information about the
location of mobile nodes using measurement report messages. The infrastructure‐
assisted selection of mobile relays is shown to minimize the relay switching rate and
increase the system throughput. In [147], the authors exploit context information to
reduce inter‐cell interference in MCNs. In particular, the study presented in [147] divides
cells into sub‐cells characterized by a radius of several orders of magnitude smaller than
the cell radius. By adjusting the sub‐cell‐radius (using context‐information such as
intercell and intersession interferences), the proposal jointly optimizes scheduling,
routing and power control to obtain the optimum tradeoff between throughput, delay
and power consumption in MCNs.
Leading international activities [148] have also recognized the importance to exploit
context information in cellular networks in order to manage the adequate time or
location where certain wireless transmissions should take place in order to optimize
spectral and energy efficiency. A first approximation towards this assessment is
presented in [149] where the authors demonstrate that the performance of
opportunistic networking can be improved when exploiting context information. In
particular, the authors propose to exploit the spatial and temporal features of context
information for more efficient forwarding decisions. The study proposes a social
context‐based routing scheme that is used to predict the context of nodes, so that
devices know when and where they should start forwarding messages in order to
minimize the transmission delay and network overhead. The benefits of using context

Chapter 7. Context‐aware Opportunistic Forwarding in MCN
143
information and device’s storing capabilities have been also demonstrated in [150] to
reduce peak traffic demands. In particular, the authors explore in [150] the proactive
caching concept through which files are proactively cached on users’ smart mobile
devices during off‐peak periods based on the file popularity and correlations among user
and file patterns. Files are then disseminated to other users via D2D communication.
Numerical results demonstrate that the proposed proactive caching paradigm can
increase by up to 25% the ratio of satisfied users. A similar approach is presented in
[151] that exploits context‐information to predict mobile user behavior related to
consumption of content. Content prediction and mobility information is exploited in
[151] to change the time and location where content is delivered to the user in order to
increase network efficiency and improve user service perception. The work presented in
[152] also exploits opportunistic D2D sharing to offload the traffic from cellular links to
local communications among users. In [152], a subset of mobile users is initially selected
as seeds based on their content spreading impact (extensive study on the selection of
the target set of mobile users is presented in [153]). Then, selected users share the
content via opportunistic local connectivity using WiFi‐Direct. The conducted evaluation
shows that the cellular traffic can be reduced by 63‐85% while satisfying the users’ delay
requirements.
Previous studies have shown that the use of context information can result in
important benefits for opportunistic networking and mobile relaying solutions. In this
context, this study investigates the design of realistic opportunistic forwarding schemes
in MCNs that exploit context information already available in cellular networks to reduce
the energy consumption and increase the system capacity in MCNs that utilize mobile
relays and D2D communications.
7.2 Time‐dependentOpportunisticForwarding:DELAY
The DELAY proposal uses the optimum MR location identified in Chapter 6, but delays
the start of the D2D transmission until an MR is found at the identified optimum
location. The space‐time graph shown in Figure 7‐1 is used to represent and compare
the operation when considering the optimum configuration identified in Chapter 6
(‘Optimum’), and the time‐dependent proposal that delays the D2D transmission until
an MR reaches the identified optimum location (‘DELAY’). For the optimum
configuration, the D2D transmission between SNi and the optimum MR located at Opt_Xi
starts at time instant τ0. MR then stores and carries the information from Opt_Xi until it
reaches the Opt_Yi location at time instant τc, and initiates the cellular transmission. The

Chapter 7. Context‐aware Opportunistic Forwarding in MCN
144
DELAY proposal considers the scenario in which SNi cannot find an MR at the optimum
location (Opt_Xi) at time instant τ0. In this case, the proposed scheme delays the D2D
transmission until an MR arrives at Opt_Xi. We denote as t the time SNi should delay the
D2D transmission to guarantee with certain probability that an MR reaches the
identified optimum location (additional details are presented below). When such node
reaches the optimum location, SNi can start the D2D transmission. MR would again store
and carry the information before starting the cellular transmission to the BS. The cellular
transmission cannot start at the location Opt_Yi and time τc when implementing the
DELAY proposal since SNi had to delay the start of the D2D transmission. However, the
complete transmission has to still end before the deadline T. In this case, MR would start
the forwarding process to the cellular BS at location Y’i (further away from the BS than
Opt_Yi) and time τ’c.
The DELAY scheme requires SN to delay the D2D transmission for t seconds until an
MR reaches the optimum MR location identified in Chapter 6. The time t has to be
selected conditioned to the fulfillment of the following two conditions. First, it is
necessary to guarantee with certain probability that at least one MR reaches the
identified optimum MR location before t seconds elapse. This thesis proposes to define
and establish this probabilistic requirement using context information that can be
extracted from cellular networks, in particular statistical information about the spatial
density and distribution of mobile nodes within a cell. This information is already
available in current cellular systems and can be obtained at no further cost since mobile
terminals are required to register their location with the serving BS. Even a more
accurate identification of the mobile devices location can be achieved with cellular
standards such as HSPA and LTE that define concentric rings where mobile users utilize
different transmission modes based on radio link quality parameters (e.g. signal strength
SN distance to the BSBSOpt_XiOpt_Yi
τ0
τ0+t
τcτ'c
Y’i SNiOptimum
DELAY
Figure 7‐1. A graphical representation of two‐hop opportunistic MCN communications for the
optimum configuration and the DELAY proposal.
Chapter 7. Context‐aware Opportunistic Forwarding in MCN
145
or CQI). The second condition is that, despite the delay in the D2D transmission, the BS
must still receive the complete file before the service‐dependent deadline T. This
condition must be satisfied independently of whether SN has to exhaust or not the delay
time t to find an MR at the identified optimum location. If these two conditions are not
fulfilled, a satisfactory opportunistic MCN transmission is considered unfeasible, and SN
should directly transmit the information to the cellular BS through a traditional single‐
hop cellular link.
7.2.1 UniformDistributionofNodeswithintheCell
The parameter t represents the time SN needs to delay the start of the D2D
transmission in order to guarantee with certain probability the arrival of at least one MR
at the identified optimum MR location. To determine its value, this study first considers
that mobile devices are uniformly distributed within the cell. Using the Poisson
distribution21, the probability that an MR reaches the identified optimum MR location
can be calculated as follows [154]:
_
0
0; ' 1 0; '
' exp '1 1 exp ' , _ 1,...,
0!
Opt Xi
i
P P x t P x t
t tt Opt X R
(7‐1)
where μ’ represents the average arrival rate of MRs to the identified optimum MR
location (actually to any location within the cell), and t corresponds to the inter‐arrival
delay time or the time to the next arrival of an MR to the identified location. μ’ is
computed using the average number of MRs (μ) uniformly distributed within a cell of
radius R and the nodes’ speed v as follows:
'v
R
(7‐2)
The time t that guarantees with probability δ (i.e. POpt_Xi= δ) the arrival of an MR at
the identified optimum MR location Opt_Xi can be expressed as shown in equation (7‐4):
_ 1 exp 'Opt XiP t (7‐3)
' 1 1
ln 1' arg min ...i
tb b
Rt iff Y
v
(7‐4)
21 Poisson methods have been demonstrated to correctly model the number of isolated points
that are expected to fall within a particular region, and also the arrival rate and inter‐arrival time
of nodes to a specific location based on characteristics such as the node’s speed [154][155].
Chapter 7. Context‐aware Opportunistic Forwarding in MCN
146
As shown in equation (7‐4), the time t that guarantees the arrival of at least one MR
at the identified optimum MR location is proportional to the cell radius (R) and inversely
proportional to the average spatial density of nodes within the cell (μ/R) and to the
nodes’ speed (v). In addition, t increases with the probability δ guaranteeing the
presence of the MR at the identified optimum MR location. It is important to note that
the derived delay time t represents the worst case, i.e. the maximum time the SN should
delay the D2D transmission waiting for an MR to reach the optimum MR location. In this
context, the time t can be found if and only if (iff) the condition shown in equation (7‐4)
is also fulfilled. The condition requires that there exists a suboptimum solution Y’i of the
optimization problem (ϑ) presented in Chapter 6. This solution is obtained considering
that the D2D transmission would finish at time instant τb‐1+t (the optimum configuration
needs τb‐1 to conclude the D2D transmission from SN to MR). If this condition is met, it is
possible to establish the two‐hop opportunistic MCN link to transmit the information
from SN to the BS before the service‐dependent deadline T. If the condition is not met,
SN will transmit the information directly to the BS through a traditional single‐hop
cellular link.
7.2.2 Non‐uniformDistributionofNodeswithintheCell
The time t can also be computed when the distribution of users within the cell is non‐
uniform. Without loss of generality, this study considers a distribution in which the
spatial density of nodes is higher close to the BS. This is actually a common assumption
in the literature since it represents scenarios where BSs are deployed to provide
coverage to frequently visited places. Following [156], the mathematical model of this
non‐uniform distribution has been represented by means of a truncated Normal
distribution centered at the position of the cellular BS. The truncated Normal
distribution can be expressed as follows [154]:
, [ , ]; , , ,
0 , [ , ]
x s
if x a bP x s a bZ
if x a b
(7‐5)
where Ø(x‐s/σ) represents the probability density function of the standard Normal
distribution. The Normal distribution of a random variable x with mean s and variance σ2
can be expressed as [154]:
2
2
1; , exp ,
22
x sP x s x
(7‐6)

Chapter 7. Context‐aware Opportunistic Forwarding in MCN
147
In equation (7‐5), Z is the Cumulative Distribution Function (CDF) difference at the
upper (b \ x ∊ [‐∞, b]) and lower (a \ x ∊ [a, ∞]) bounds:
b s a sZ
(7‐7)
being the CDF defined as:
; ,x
x F x P X x P x s dx
(7‐8)
The probability to find one MR at the identified optimum MR location Opt_Xi can be
calculated using equation (7‐5) as:
_ 2
__ 2
( ; , , , )Opt Xi
Opt XiOpt Xi
P P x s a b dx
(7‐9)
where ε represents the spatial discretization unit. Considering that the average spatial
density of nodes in the cell is equal to μ/R, the average spatial density of nodes at Opt_Xi
can then be computed as μOpt_Xi = (μ/R)∙POpt_Xi. Following the indications in [157], the
truncated Normal distribution can be discretized into many Poisson distributions as
shown in Figure 7‐2. In Figure 7‐2, μi represents the parameter that characterizes the
Poisson distribution (i.e. the expected value in general). This allows carrying out a similar
analysis to that presented in Section 7.2.1 for the uniform distribution of nodes within
the cell (equations (7‐1) to (7‐4)). In particular, we can calculate the time t the SN needs
to delay the D2D transmission to guarantee with probability δ the arrival of an MR at the
identified optimum location under non‐uniform distribution of nodes within the cell. t
can be calculated as follows:
'_ 1 1
ln 1' arg min ...i
tOpt X b bi
Rt iff Y
P v
(7‐10)
It is important to note that equation (7‐10) depends on POpt_Xi and thus on the
optimum MR location (Opt_Xi) within the cell; this is not the case when nodes are
uniformly distributed within the cell. The definition of equation (7‐10) is also subject to
the fulfillment of the condition that there exists a suboptimum solution of the
optimization problem (ϑ) presented in Chapter 6. It this condition is not met, the SN
transmits the file to the BS using a traditional single‐hop cellular link.
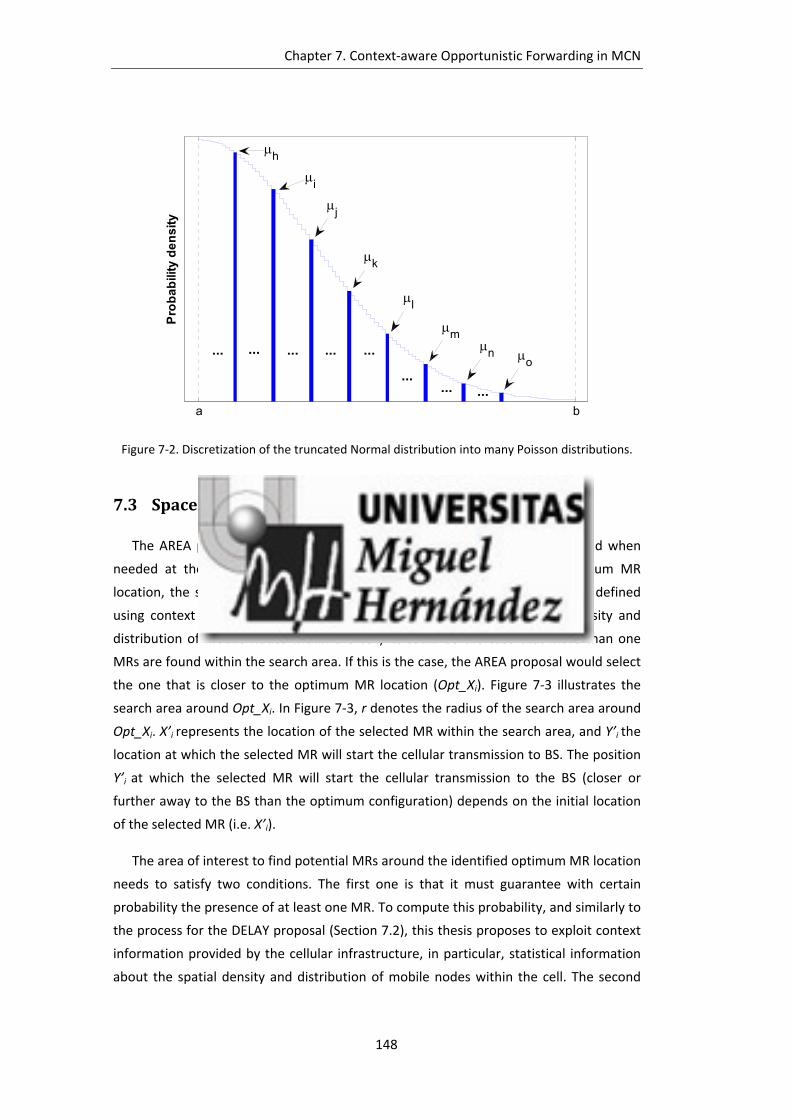
Chapter 7. Context‐aware Opportunistic Forwarding in MCN
148
a b
Pro
ba
bili
ty d
en
sity
...... ... ... ...
...... ...
j
k
l
mn o
i
h
Figure 7‐2. Discretization of the truncated Normal distribution into many Poisson distributions.
7.3 Space‐dependentOpportunisticForwarding:AREA
The AREA proposal addresses the scenario in which an MR cannot be found when
needed at the identified optimum location by increasing, around the optimum MR
location, the search area where to look for potential MRs. The search area is defined
using context information provided by the cellular infrastructure (spatial density and
distribution of mobile nodes within the cell). It could be the case that more than one
MRs are found within the search area. If this is the case, the AREA proposal would select
the one that is closer to the optimum MR location (Opt_Xi). Figure 7‐3 illustrates the
search area around Opt_Xi. In Figure 7‐3, r denotes the radius of the search area around
Opt_Xi. X’i represents the location of the selected MR within the search area, and Y’i the
location at which the selected MR will start the cellular transmission to BS. The position
Y’i at which the selected MR will start the cellular transmission to the BS (closer or
further away to the BS than the optimum configuration) depends on the initial location
of the selected MR (i.e. X’i).
The area of interest to find potential MRs around the identified optimum MR location
needs to satisfy two conditions. The first one is that it must guarantee with certain
probability the presence of at least one MR. To compute this probability, and similarly to
the process for the DELAY proposal (Section 7.2), this thesis proposes to exploit context
information provided by the cellular infrastructure, in particular, statistical information
about the spatial density and distribution of mobile nodes within the cell. The second
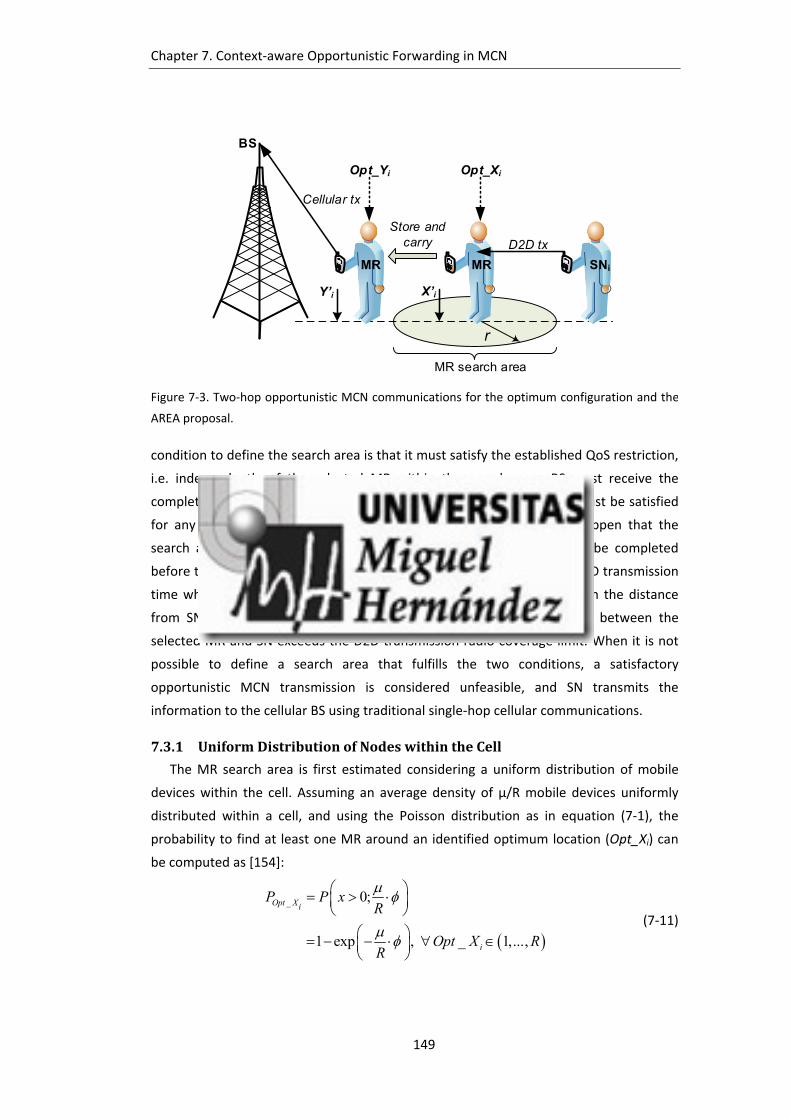
Chapter 7. Context‐aware Opportunistic Forwarding in MCN
149
condition to define the search area is that it must satisfy the established QoS restriction,
i.e. independently of the selected MR within the search area, BS must receive the
complete file before the service‐dependent deadline T. This condition must be satisfied
for any possible MR location within the search area. It might then happen that the
search area is so large that the end‐to‐end MCN transmission cannot be completed
before the deadline T. This may be due to a significant increase of the D2D transmission
time when the distance from SN to the selected MR is much larger than the distance
from SN to the optimum MR. It might also happen that the distance between the
selected MR and SN exceeds the D2D transmission radio coverage limit. When it is not
possible to define a search area that fulfills the two conditions, a satisfactory
opportunistic MCN transmission is considered unfeasible, and SN transmits the
information to the cellular BS using traditional single‐hop cellular communications.
7.3.1 UniformDistributionofNodeswithintheCell
The MR search area is first estimated considering a uniform distribution of mobile
devices within the cell. Assuming an average density of μ/R mobile devices uniformly
distributed within a cell, and using the Poisson distribution as in equation (7‐1), the
probability to find at least one MR around an identified optimum location (Opt_Xi) can
be computed as [154]:
_ 0;
1 exp , _ 1,...,
Opt Xi
i
P P xR
Opt X RR
(7‐11)
SNi
BS
Opt_XiOpt_Yi
r
D2D tx
Store and carry
Cellular tx
X’iY’i
MR search area
MRMR
Figure 7‐3. Two‐hop opportunistic MCN communications for the optimum configuration and the
AREA proposal.

Chapter 7. Context‐aware Opportunistic Forwarding in MCN
150
where μ is the average number of MRs within the cell of radius R, and Ø corresponds to
the diameter of the MR search area. It is important to note that equation (7‐11) is valid
for any Opt_Xi location within the cell. Following equation (7‐11), the radius r around
Opt_Xi that guarantees with probability δ the presence of at least one MR can be
estimated as:
' ( _ , )
ln 1' arg min
2 iX o Opt X ri i
Rr iff Y
(7‐12)
with the diameter of the search area (Ø) being equal to 2r. The condition defined in
equation (7‐12) requires that for every possible location of the selected MR within the
search area (X’i), the optimization problem formulated in Chapter 6 (represented by ϑ in
equation (7‐12)) provides the location (Y’i) at which the MR should start the cellular
transmission to the BS that minimizes the total energy consumption and satisfies that
the transmission is completed before T. If this condition is met, it is possible to define
the MR search area o(Opt_Xi, r) centered in Opt_Xi and with radius r. If the condition is
not met, the SN will transmit the information directly to the BS through a traditional
single‐hop cellular link.
7.3.2 Non‐uniformDistributionofNodeswithintheCell
The search area (defined by the radius r around Opt_Xi) has also been computed
when the distribution of users within the cell is non‐uniform. As indicated in the
definition of the DELAY proposal (Section 7.2), this study considers a non‐uniform
distribution in which the spatial density of nodes is higher close to the BS. This
distribution is mathematically modeled by means of a truncated Normal distribution
(equation (7‐5)). Equation (7‐9) estimates the probability POpt_Xi that one MR is located at
the identified optimum MR location. Using equation (7‐9), the probability to find one
MR within the search area can be defined as a function of r:
_ 2
_ 2
( ; , , , )Opt X ri
SearchArea
Opt X ri
P r P x a b dx
(7‐13)
where ε represents the spatial discretization unit. If we consider that there are on
average μ MRs within the cell, the probability to find at least one MR within the search
area around the identified optimum MR location Opt_Xi can be calculated as:
1 1 SearchAreaP r
(7‐14)
In this context, the minimum radius r (r ϵ ) around Opt_Xi that guarantees with
probability δ the presence of at least one MR can be defined using the following
conditions:

Chapter 7. Context‐aware Opportunistic Forwarding in MCN
151
' ( _ , )
1 1 1
1 1 ' arg min
SearchArea
SearchArea iX o Opt X ri i
P r
and P r iff Y
(7‐15)
It should be noted that that equation (7‐15) depends on PSearchArea and thus on the
optimum MR location (Opt_Xi) within the cell; this is not the case when nodes are
uniformly distributed within the cell. It should be also noted that the same condition to
that analyzed in equation (7‐12) must be satisfy in equation (7‐15) in order to define the
MR search area o(Opt_Xi, r∙ ε); i.e. for every possible location of the selected MR within
the search area (X’i), the optimization problem formulated in Chapter 6 (represented by
ϑ in equation (7‐15)) provides the location (Y’i) at which the MR should start the cellular
transmission to the BS that minimizes the total energy consumption and satisfies that
the transmission is completed before T. If the condition is not met, the SN will again
transmit the information directly to the BS through a traditional single‐hop cellular link.
7.4 PerformanceComparisonoftheDELAYandAREAproposals
7.4.1 WorstCaseConditions
This section is aimed at numerically comparing the performance of the two proposed
context‐aware opportunistic forwarding strategies considering their worst case
operation conditions. In particular, we consider that the DELAY scheme needs to wait for
the complete time t to elapse before an MR reaches the optimum MR location (Opt_Xi),
and that AREA founds the MR at the limit of the search area. The evaluation under these
worst case conditions allows identifying the minimum energy gains that the proposed
strategies can achieve with respect to traditional single‐hop cellular communications.
Annex B complements this study by means of deriving the configuration of opportunistic
forwarding for the DELAY and AREA proposals under worst case conditions.
The comparison is first conducted considering a uniform distribution of nodes within
the cell. The probability δ used to guarantee the presence of the MR at the identified
location and time instant is set to 0.9. The performance has been evaluated in Matlab
for all possible distances between SN and BS. The study considers a cell with a radius of
800 meters. The cell is divided into 15 equally spaced and concentric rings with a LTE
transmission mode assigned to each ring (Section 6.4.1). The energy consumption values
for the DRAM and NAND flash storage units have been obtained from [142] and [143]
respectively. The file that the static SN needs to upload to the BS has initially a nominal

Chapter 7. Context‐aware Opportunistic Forwarding in MCN
152
size of 10 Mb. The study considers the following range of deadlines T={60 s, 100 s, 150 s,
200 s}. We consider that the MR is in line with the SN, and move towards the BS with a
speed of 2 m/s. The rest of parameters are summarized in Table 7‐1.
Figure 7‐4 compares the energy consumed by DELAY and AREA as a function of the
distance between SN and BS. The results are depicted in logarithmic scale, and have
been obtained for an average spatial density of users within the cell equal to μ/R=0.03
MRs/m. Figure 7‐4.a represents the energy consumed in the D2D transmission from SN
to MR, while Figure 7‐4.b represents the energy consumed in the store and carry
process, and Figure 7‐4.c the energy consumed in the cellular transmission from MR to
BS. Figure 7‐4.a shows that the DELAY proposal reduces the energy consumed in the
D2D transmission with respect to AREA. However, AREA reduces the energy consumed
in the store and carry (Figure 7‐4.b) and cellular transmission (Figure 7‐4.c) processes
with respect to DELAY. The delay introduced by DELAY on the D2D transmission results
in that MR starts the cellular transmission to the BS at a higher distance to the BS than
the AREA scheme. This results in that DELAY increases the time MR needs to upload the
Table 7‐1. Evaluation parameters.
Parameter Description Value
R Cell radius 800 m
BW LTE system bandwidth 5 MHz
GTX, GRX Transmitter and receiver antenna gain 1
etx, erx Energy consumed per bit by the
transmitter/receiver 50 x 10‐9 J/b
PRX Power reception threshold ‐62 dBm
hSN, hMR, hBS Antenna height of SN, MR and BS 1.5 m, 1.5 m, 10 m
DRAM PR, PW,
PIdle_self‐refresh
DRAM power consumed for Reading, Writing and
in Idle_self‐refresh state
252 mW, 252 mW, 1.35
mW
NAND EffRead,
EffWrite, PIdle
NAND efficiency for Reading and Writing, and
Power consumed in Idle state
1.83 nJ/b, 11.92 nJ/b, 0.4
mW
Transf_DF,
Transf_FD
Transfer speed from the DRAM to the NAND
flash and vice versa 4.85 MiB/s, 927.1 KiB/s
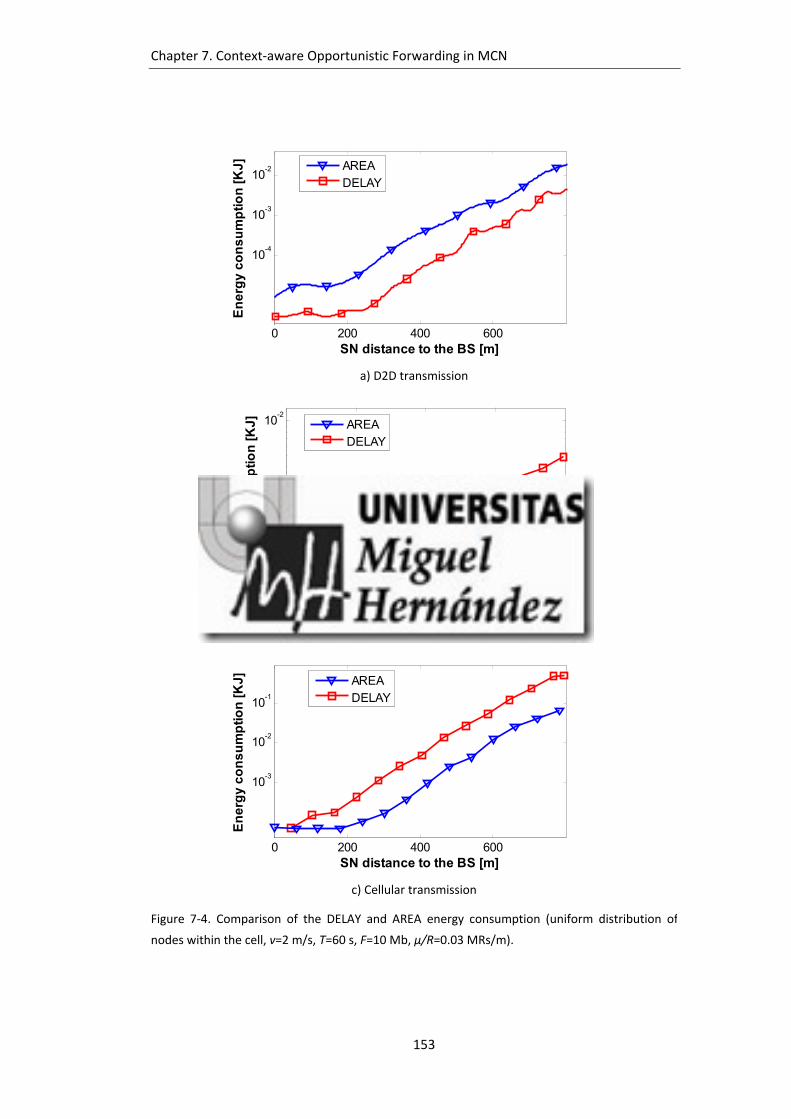
Chapter 7. Context‐aware Opportunistic Forwarding in MCN
153
0 200 400 600
10-4
10-3
10-2
SN distance to the BS [m]
En
erg
y c
on
su
mp
tio
n [
KJ
]
AREA
DELAY
a) D2D transmission
0 200 400 600
10-3
10-2
SN distance to the BS [m]
En
erg
y c
on
su
mp
tio
n [
KJ
]
AREA
DELAY
b) Store and Carry (SC)
0 200 400 600
10-3
10-2
10-1
SN distance to the BS [m]
En
erg
y c
on
su
mp
tio
n [
KJ
]
AREA
DELAY
c) Cellular transmission
Figure 7‐4. Comparison of the DELAY and AREA energy consumption (uniform distribution of
nodes within the cell, v=2 m/s, T=60 s, F=10 Mb, μ/R=0.03 MRs/m).

Chapter 7. Context‐aware Opportunistic Forwarding in MCN
154
information to the BS, and therefore the energy consumed in the cellular transmission
to the BS (Figure 7‐4.c). The comparison of Figure 7‐4.a and Figure 7‐4.c shows that the
reduction in energy consumed in the D2D transmission process by DELAY cannot
compensate the increase in the energy consumed during the cellular transmission.
0 100 200 300 400 500 600 700
10-3
10-2
10-1
100
SN distance to the BS [m]
En
erg
y c
on
su
mp
tio
n [
KJ
]
1-hop cellularOptimumDELAYAREA
Figure 7‐5. Total energy consumption (uniform distribution of nodes within the cell, v=2 m/s,
T=60 seconds, F=10 Mb, μ/R=0.03 MRs/m).
The total energy consumed under the evaluated worst‐case scenario and conditions
is depicted in Figure 7‐5. Both schemes decrease the energy consumption compared to
traditional single‐hop cellular communications. It is also important to highlight that
AREA and DELAY only result in minor degradations of the energy performance compared
to the optimum configuration. On average, AREA reduces the energy consumption
compared to single‐hop cellular communications by 91.8%, and DELAY by 88.1%. The
optimum configuration reduces on average the energy consumption compared to single‐
hop cellular communications (from SN to BS) by 95.6%. The results also show that AREA
achieves better energy performance than DELAY. In fact, Figure 7‐5 shows that the AREA
proposal can reduce, on average, the total energy consumption compared to DELAY by
17.4%. This trend is observed for (almost) all the distances between SN and BS22, and for
different values of the deadline T.
22 Under a uniform distribution of mobiles within the cell, t and r are constant for any location of
the SN within the cell following equations (7‐4) and (7‐12).

Chapter 7. Context‐aware Opportunistic Forwarding in MCN
155
0 200 400 600
10-3
10-2
10-1
100
SN distance to the BS [m]
En
erg
y c
on
su
mp
tio
n [
KJ
]
1-hop cellularOptimumAREADELAY
a) v=2 m/s, T=60 s, F=10 Mb, μ/R=0.09 MRs/m
0 200 400 600
10-3
10-2
10-1
100
SN distance to the BS [m]
En
erg
y c
on
su
mp
tio
n [
KJ
]
1-hop cellularOptimum
AREADELAY
b) v=10 m/s, T=60 s, F=10 Mb, μ/R=0.03 MRs/m
0 200 400 600
10-2
10-1
100
101
SN distance to the BS [m]
En
erg
y c
on
su
mp
tio
n [
KJ
]
1-hop cellularOptimum
AREADELAY
c) v=2 m/s, T=60 s, F=50 Mb, μ/R=0.03 MRs/m
Figure 7‐6. Total energy consumption (uniform distribution of nodes within the cell).
However, we observe that the differences between AREA and DELAY decrease as the
deadline T increases. For example, if we increase T from 60 s to 100 s, 150 s and 200 s,
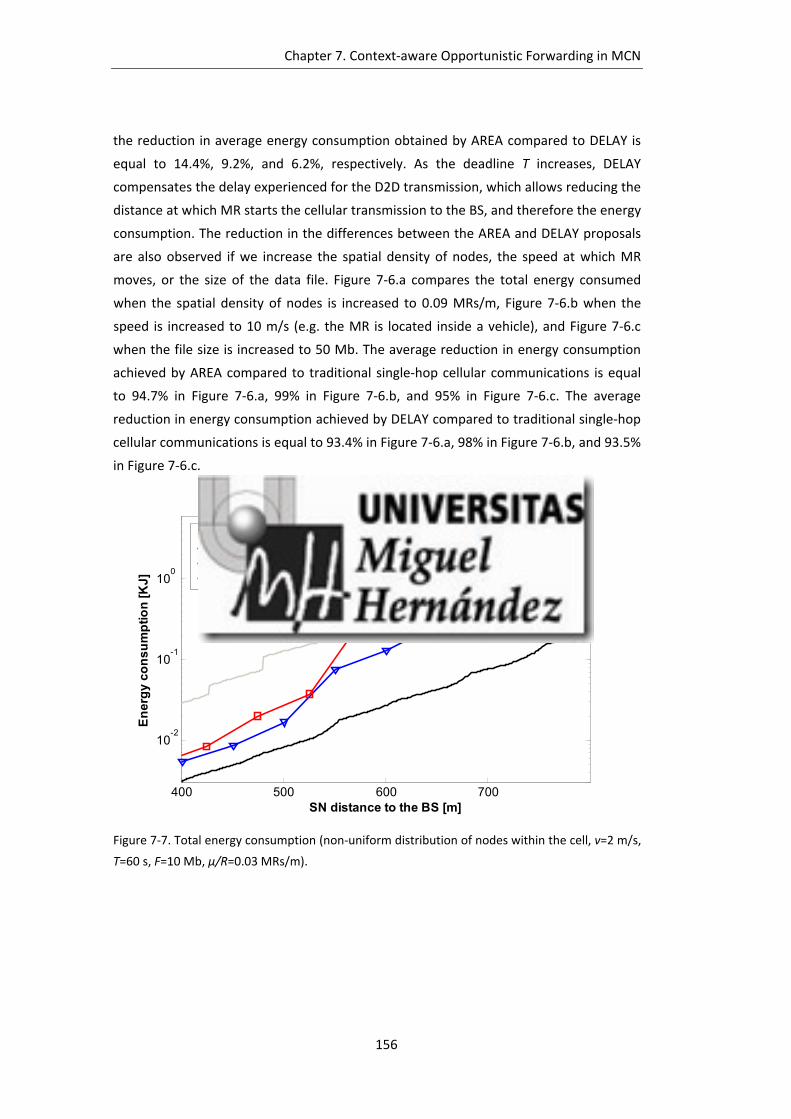
Chapter 7. Context‐aware Opportunistic Forwarding in MCN
156
the reduction in average energy consumption obtained by AREA compared to DELAY is
equal to 14.4%, 9.2%, and 6.2%, respectively. As the deadline T increases, DELAY
compensates the delay experienced for the D2D transmission, which allows reducing the
distance at which MR starts the cellular transmission to the BS, and therefore the energy
consumption. The reduction in the differences between the AREA and DELAY proposals
are also observed if we increase the spatial density of nodes, the speed at which MR
moves, or the size of the data file. Figure 7‐6.a compares the total energy consumed
when the spatial density of nodes is increased to 0.09 MRs/m, Figure 7‐6.b when the
speed is increased to 10 m/s (e.g. the MR is located inside a vehicle), and Figure 7‐6.c
when the file size is increased to 50 Mb. The average reduction in energy consumption
achieved by AREA compared to traditional single‐hop cellular communications is equal
to 94.7% in Figure 7‐6.a, 99% in Figure 7‐6.b, and 95% in Figure 7‐6.c. The average
reduction in energy consumption achieved by DELAY compared to traditional single‐hop
cellular communications is equal to 93.4% in Figure 7‐6.a, 98% in Figure 7‐6.b, and 93.5%
in Figure 7‐6.c.
400 500 600 700
10-2
10-1
100
SN distance to the BS [m]
En
erg
y c
on
su
mp
tio
n [
KJ
]
1-hop cellularOptimumAREADELAY
Figure 7‐7. Total energy consumption (non‐uniform distribution of nodes within the cell, v=2 m/s,
T=60 s, F=10 Mb, μ/R=0.03 MRs/m).

Chapter 7. Context‐aware Opportunistic Forwarding in MCN
157
Figure 7‐7 compares the total energy consumed when MRs are not uniformly
distributed within the cell23; μ/R is set equal to 0.03 MRs/m and the spatial distribution
of users results in that approximately 68% of the nodes are located at distances to the
BS smaller than 300 meters. A non‐uniform distribution of users within the cell results in
that t and r increase with the distance between SN and BS in order to compensate the
smaller density of users when the distance to the BS increases. In this context, the AREA
proposal considerably increases the energy consumed in the D2D transmission (and
therefore the total energy consumption) with the SN distance to BS, and the DELAY
proposal might exhaust the available deadline T without completely transmitting the file
of size F because of the time it had to wait for an MR to arrive at the identified optimum
location. It is important to remember that the current numerical evaluation considers a
worst case scenario in which AREA selects the MR at the limit of the search area around
the optimum MR location, and DELAY needs to wait for t to elapse before an MR
reaches the optimum MR location. In any case, the results in Figure 7‐7 clearly show that
AREA and DELAY improve the energy consumption compared to traditional single‐hop
cellular communications. On average, AREA reduces the energy consumption compared
to single‐hop cellular communications by 40%, and DELAY by 26%. These results clearly
highlight that opportunistic MCN communications still provide clear energy benefits
(close to those achieved by the optimum configuration) compared to single‐hop cellular
communications under real deployments. The benefits of the AREA and DELAY proposals
under worst case conditions reduce when SN is located at the cell edge. The reduction is
influenced by the spatial density of users within the cell (it does not have an impact on
the performance of the optimum configuration since it assumes an MR can be found
when needed at the optimum location). Figure 7‐7 shows that AREA is challenged to
establish an efficient opportunistic MCN link for SN distances to the BS higher than 715
meters as a result of the large distances between SN and MR. DELAY experiences the
same challenge for SN distances to the BS higher than 555 meters. If we increase T from
60 s to 100 s, 150 s or 200 s, the differences between AREA and DELAY decrease. For
example, if we increase T from 60 s to 100 s, 150 s and 200 s, the SN distances to the BS
from which DELAY cannot establish an efficient opportunistic MCN link (and needs to
start a traditional single‐hop cellular transmission) increase to 650 m, 715 m and 730 m
respectively. These distances do not change for AREA when T is increased (remain equal
to 715 meters) since AREA is challenged by the large distances between SN and MR.
Under a non‐uniform distribution of nodes within the cell, we can also observe that the
23 The results are presented for SN distances to BS higher than 400 meters since the two schemes
achieve very similar results for smaller distances.

Chapter 7. Context‐aware Opportunistic Forwarding in MCN
158
400 500 600 700
10-2
10-1
100
SN distance to the BS [m]
En
erg
y c
on
su
mp
tio
n [
KJ
]
1-hop cellularOptimum
AREADELAY
a) v=2 m/s, T=60 s, F=10 Mb, μ/R=0.09 MRs/m
400 500 600 70010
-3
10-2
10-1
100
SN distance to the BS [m]
En
erg
y c
on
su
mp
tio
n [
KJ
]
1-hop cellularOptimum
AREADELAY
b) v=10 m/s, T=60 s, F=10 Mb, μ/R=0.03 MRs/m
400 500 600 70010
-2
10-1
100
101
SN distance to the BS [m]
En
erg
y c
on
su
mp
tio
n [
KJ
]
1-hop cellularOptimumAREADELAY
c) v=2 m/s, T=60 s, F=50 Mb, μ/R=0.03 MRs/m
Figure 7‐8. Total energy consumption (non‐uniform distribution of nodes within the cell).

Chapter 7. Context‐aware Opportunistic Forwarding in MCN
159
differences between DELAY and AREA reduce if we increase the spatial density of nodes,
the speed at which MR moves or the size of the file. Figure 7‐8.a compares the total
energy consumed when the spatial density of nodes is increased to 0.09 MRs/m, Figure
7‐8.b when the speed is increased to 10 m/s (in this scenario AREA shows better energy
performance than DELAY), and Figure 7‐8.c when the file size is increased to 50 Mb. The
average reduction in energy consumption achieved by AREA compared to traditional
single‐hop cellular communications is equal to 91.3% in Figure 7‐8.a, 50% in Figure 7‐8.b,
and 32% in Figure 7‐8.c. The average reduction in energy consumption achieved by
DELAY compared to traditional single‐hop cellular communications is equal to 53.8% in
Figure 7‐8.a, 52.3% in Figure 7‐8.b, and 13.8% in Figure 7‐8.c.
The conducted evaluation of the context‐aware opportunistic forwarding proposals
has shown that AREA and DELAY can notably reduce the energy consumption compared
to traditional single‐hop cellular communications even under worst case conditions. This
is observed for all scenarios and conditions (Figure 7‐5 to Figure 7‐8). The two proposals
better approximate the energy performance achieved with an optimum configuration of
opportunistic MCN communications under a uniform distribution of users. The results
have also shown that AREA can reduce the energy consumption compared to DELAY
under a uniform distribution of users in the cell. This trend is also generally observed
under a non‐uniform distribution of users within the cell; DELAY only achieves better
energy performance at larger distances to the BS under certain conditions (high deadline
T and MR speed).
7.4.2 EnergyEfficiency
The previous section numerically evaluated the energy performance of the proposed
context‐aware opportunistic forwarding schemes under defined worst‐case conditions.
The conducted evaluation allows identifying minimum energy performance bounds. This
section seeks to complement the previous study with an evaluation that covers various
and more general possible operating conditions. In other words, the AREA scheme is not
bounded to select an MR at the border of the search area, and DELAY does not have to
wait t seconds before an MR is found at the optimum location. The AREA and DELAY
proposals are also configured so that if no MR can be found at the identified locations
and within the estimated timeframe, then SN directly transmits the information to the
BS using traditional single‐hop cellular communications. The evaluation here reported
also includes additional reference schemes for comparison, and introduces variants of
the AREA and DELAY schemes.

Chapter 7. Context‐aware Opportunistic Forwarding in MCN
160
The AREA and DELAY variants are defined based on how the cellular infrastructure
provides the context information required to calculate t and r. The original DELAY and
AREA proposals described in Section 7.2 and Section 7.3, respectively, consider that the
context information (spatial density and distribution of users within the cell) is provided
per cell. However, this context information could also be provided for each concentric
ring that defines a cell24. In this study, we consider a total of 15 rings per cell with each
ring characterized by the use of a different LTE transmission mode (see Section 6.4.1).
When the context information is provided per ring rather than per cell, we denote the
context‐aware opportunistic forwarding schemes as AREA‐Ring or DELAY‐Ring. The
original DELAY scheme and DELAY‐Ring estimate t using the expression derived for a
uniform distribution of nodes within the cell (equation (7‐4)). When the context
information is provided per ring, the spatial density of users (μ/R) in equation (7‐4) is
replaced by φi/lir. φi represents the average number of nodes in the ring i where the
optimum MR location is situated, and lir the ring length. The average number of MRs
within the cell can be then calculated as 1
N
ii
and the cell radius as1
N
i
ilrR
, with i
ϵ {1...N} and N representing the number of rings in the cell (N=15 in this study). The
original AREA scheme and AREA‐Ring estimate r using the expression derived for a
uniform distribution of nodes within the cell (equation (7‐12)). When the context
information is provided per ring, the spatial density of users (μ/R) in equation (7‐12) is
also replaced by φi/lir. It should be noted that the AREA and DELAY variants utilize the
same expressions of r and t under uniform and non‐uniform user distributions.
The AREA and DELAY performance is here compared against that obtained with
traditional single‐hop cellular communications (‘1‐hop cellular’) and the optimum
configuration of opportunistic MCN communications (‘Optimum’). The performance is
also compared against other reference schemes. The ‘1‐hop Direct‐contact’ scheme
refers to the case in which the SN is mobile and can store and carry the information to
the BS without using a mobile relay [111]. ‘MR closest to SN’ and ‘MR closest to BS’ refer
to two opportunistic MCN schemes in which SN selects the MR closer to its location
[158] and the MR that provides the higher progress towards the BS [144], respectively.
For a fair comparison with the proposed schemes, the configuration of the reference
schemes is also derived following a similar optimization process to that reported in
Chapter 6 (Section 6.3) that seeks minimizing the energy consumption. For example, the
optimization process identifies for the ‘MR closest to BS’ scheme the MR location that
24 Standards such as LTE or HSPA divide cells into concentric rings. Different transmission modes are used per ring based on parameters such as the signal strength or the CQI.

Chapter 7. Context‐aware Opportunistic Forwarding in MCN
161
provides the highest progress towards BS and is able to upload the information before
the deadline T. The location at which MR should start forwarding the information to the
BS is also derived in the optimization problem.
The performance of all schemes is evaluated considering a single cell scenario that
has been simulated using a discrete‐event simulator implemented in Matlab. The
implemented scenarios consider both uniform and non‐uniform distribution of MRs in
the cell. To create uniform distributions of nodes within the cell, MRs appear at the cell
edge following a Poisson process with a rate equal to μ∙v/R, and move towards the BS at
a predefined constant speed. In the case of non‐uniform distributions, MRs can be
initially placed at intermediate locations between the BS and the cell edge. This process
allows creating higher spatial densities of nodes close to BS by exploiting the additive
property of Poisson processes. The results here presented have been obtained for a
large number of experiments (minimum 80 experiments for each result) in order to
ensure that the standard error of the mean (i.e. the standard deviation of the estimated
mean with respect to the mean obtained in each experiment) is always below 0.01.
Table 7‐2 reports the reduction (in percentage) of the average energy consumption
achieved with the different schemes compared to traditional single‐hop cellular
communications. The depicted results clearly show that the use of opportunistic
forwarding schemes helps reducing the energy consumption, with the benefits
increasing when adequately combining opportunistic networking and MCN
communications. Only the ‘MR closest to BS’ technique consumes more energy in some
of the considered scenarios than single‐hop cellular communications (negative values in
Table 7‐2). This is the case because of the high energy consumed during the D2D
transmission as a result of selecting the MR as close as possible to the BS. The higher
energy benefits would be achieved if the ‘Optimum’ reference configuration could be
possible (Table 7‐2). The results depicted in Table 7‐2 for the ‘Optimum’ configuration
correspond to the numerical results obtained in Section 6.4. These results assume that it
is always possible to find an MR at the identified optimum location and time instant.
This assumption is made to obtain a maximum performance bound with which to
compare the energy benefits that can be obtained with the context‐aware proposals.
However, this assumption might not always be feasible. In fact, the probability that SN
could find an MR at the required optimum location and time instant was less than 0.3
when the spatial density of users in the cell was 0.125 MRs/m. This probability
decreased to 0.1 when μ/R was equal to 0.03 MRs/m.
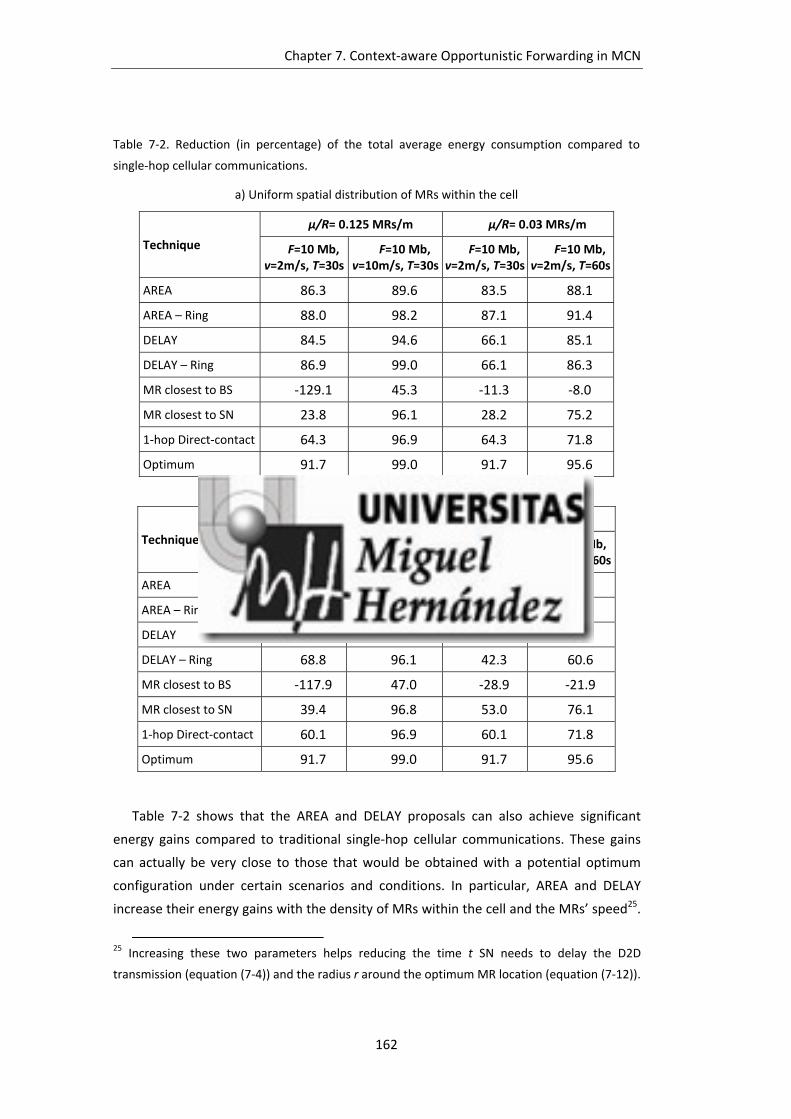
Chapter 7. Context‐aware Opportunistic Forwarding in MCN
162
Table 7‐2 shows that the AREA and DELAY proposals can also achieve significant
energy gains compared to traditional single‐hop cellular communications. These gains
can actually be very close to those that would be obtained with a potential optimum
configuration under certain scenarios and conditions. In particular, AREA and DELAY
increase their energy gains with the density of MRs within the cell and the MRs’ speed25.
25 Increasing these two parameters helps reducing the time t SN needs to delay the D2D
transmission (equation (7‐4)) and the radius r around the optimum MR location (equation (7‐12)).
Table 7‐2. Reduction (in percentage) of the total average energy consumption compared to
single‐hop cellular communications.
a) Uniform spatial distribution of MRs within the cell
Technique
μ/R= 0.125 MRs/m μ/R= 0.03 MRs/m
F=10 Mb, v=2m/s, T=30s
F=10 Mb, v=10m/s, T=30s
F=10 Mb, v=2m/s, T=30s
F=10 Mb, v=2m/s, T=60s
AREA 86.3 89.6 83.5 88.1
AREA – Ring 88.0 98.2 87.1 91.4
DELAY 84.5 94.6 66.1 85.1
DELAY – Ring 86.9 99.0 66.1 86.3
MR closest to BS ‐129.1 45.3 ‐11.3 ‐8.0
MR closest to SN 23.8 96.1 28.2 75.2
1‐hop Direct‐contact 64.3 96.9 64.3 71.8
Optimum 91.7 99.0 91.7 95.6
b) Non‐uniform spatial distribution of MRs within the cell
Technique
μ/R= 0.125 MRs/m μ/R= 0.03 MRs/m
F=10 Mb, v=2m/s, T=30s
F=10 Mb, v=10m/s, T=30s
F=10 Mb, v=2m/s, T=30s
F=10 Mb, v=2m/s, T=60s
AREA 51.7 56.9 54.1 55.5
AREA – Ring 87.1 95.7 73.9 80.5
DELAY 52.0 68.1 38.3 50.9
DELAY – Ring 68.8 96.1 42.3 60.6
MR closest to BS ‐117.9 47.0 ‐28.9 ‐21.9
MR closest to SN 39.4 96.8 53.0 76.1
1‐hop Direct‐contact 60.1 96.9 60.1 71.8
Optimum 91.7 99.0 91.7 95.6

Chapter 7. Context‐aware Opportunistic Forwarding in MCN
163
This trend is observed independently of whether MRs are distributed uniformly or not
within the cell. Higher T deadlines also tend to improve the performance of AREA and
DELAY since the schemes have more time to exploit the benefits of opportunistic
networking. A closer comparison of the AREA and DELAY schemes shows that AREA is
particularly suitable under low density of users or a small T deadline. When the spatial
density of users and T decrease, DELAY reduces its hit rate (Table 7‐3) because the time
SN needs to wait for an MR to reach the optimum MR location does not allow
establishing the two‐hop opportunistic MCN connection before T expires. The hit rate is
defined as the average percentage of SN‐BS links established using two‐hop
opportunistic MCN communications. The results in Table 7‐3 show that AREA’s hit rate is
not that highly influenced by the T parameter, and explain why AREA outperforms
DELAY for low values of T. When T increases to 60 seconds, DELAY and AREA achieve
closer energy efficiency levels. This is due to the fact that higher T values allow DELAY to
compensate the longer delays experienced for the D2D transmission as a result of the
need to wait for an MR to reach the optimum MR location. For this scenario, the AREA
and DELAY proposals show slightly lower energy performance than under worst case
conditions (Section 7.3.1) where it was assumed that an MR was always found at the
limit of the search area (AREA) or at the optimum MR location after t seconds elapse
(DELAY). The simulation results here reported consider that if no MR can be found at the
identified locations and within the estimated timeframe, then SN directly transmits the
information to the BS using traditional single‐hop cellular communications. This
operational difference explains why the simulation results do not have to be equal or
higher than those reported in Section 7.4.1 under worst case conditions. If in this
scenario we only consider the SN‐BS transmissions that took place using a two‐hop
opportunistic MCN link (Table 7‐4), the average reduction in energy consumption
achieved by AREA and DELAY compared to traditional single‐hop cellular
communications would be equal to 95% and 94%, respectively –i.e. higher energy
performance levels than in worst‐case conditions. Table 7‐4 reports the energy
performance achieved by the proposed context‐aware proposals when only considering
the SN‐BS transmissions that took place using a two‐hop opportunistic MCN link. The
obtained results show that in this case the proposals achieve very similar energy
performance levels to that obtained with the ‘Optimum’ configuration.
The results depicted in Table 7‐2 show that a higher mobility of MRs improves the
energy gains of AREA and DELAY, with the largest improvements obtained for DELAY.
Increasing the MRs’ speed results in that the cellular transmission from MR to the BS will
start closer to the BS where higher cellular data rates are possible. However, it can also

Chapter 7. Context‐aware Opportunistic Forwarding in MCN
164
negatively impact AREA if the distance between SN and the selected MR exceeds the
D2D communications range. This risk increases at higher speeds, which explains the
slight negative impact of the MRs’ speed on AREA’s hit rate (Table 7‐3). These trends are
observed under uniform and non‐uniform distribution of users in the cell. However,
non‐uniform distributions of users in the cell reduce the energy gains of both schemes. A
non‐uniform distribution of users in the cell results in a lower density of nodes with
increasing distances to the BS. A varying user density across the cell influences the
estimation of the t and r parameters. Providing the context information per cell in the
case of a non‐uniform distribution of MRs cannot take into account this variation, and
can hence result in frequent incorrect estimations of t and r. The results depicted in
Table 7‐3 show that when the distribution of users per cell varies from a uniform one to
a non‐uniform one, the hit rate decreases. AREA and DELAY do not establish
opportunistic MCN links to transmit the information from SN to BS when they cannot
find an MR at the identified locations and within the estimated timeframe. A lower
percentage of SN‐BS links established using opportunistic MCN links26 decreases the
26 Especially those close to the cell edge where opportunistic networking shows higher energy
efficiency.
Table 7‐3. Hit rate: percentage of SN‐BS links established using two‐hop opportunistic MCN
communications.
a) Uniform spatial distribution of MRs within the cell
Technique
μ/R=0.125 MRs/m μ/R= 0.03 MRs/m
F=10 Mb, v=2m/s, T=30s
F=10 Mb, v=10m/s, T=30s
F=10 Mb, v=2m/s, T=30s
F=10 Mb, v=2m/s, T=60s
AREA 94.1 92.1 90.3 89.4
AREA – Ring 96.5 99.4 97.4 96.5
DELAY 93.0 96.7 79.1 89.0
DELAY – Ring 96.1 99.9 78.9 93.5
b) Non‐uniform spatial distribution of MRs within the cell
Technique
μ/R=0.125 MRs/m μ/R= 0.03 MRs/m
F=10 Mb, v=2m/s, T=30s
F=10 Mb, v=10m/s, T=30s
F=10 Mb, v=2m/s, T=30s
F=10 Mb, v=2m/s, T=60s
AREA 80.0 78.3 80.1 77.6
AREA – Ring 96.1 95.7 94.6 95.2
DELAY 80.9 85.9 67.0 76.5
DELAY – Ring 91.8 98.9 65.7 83.9

Chapter 7. Context‐aware Opportunistic Forwarding in MCN
165
energy gains of the AREA and DELAY proposals compared to traditional single‐hop
cellular communications (Table 7‐2); the gains are still very significant and above 50% in
most cases.
Table 7‐3 shows that providing the context information per ring rather than per cell
results in that AREA and DELAY increase their hit rate even under non‐uniform user
distributions per cell. In fact, the AREA‐Ring and DELAY‐Ring schemes can achieve hit
rate levels with non‐uniform distributions close to that obtained by AREA and DELAY
under uniform user distributions per cell. Table 7‐3 also shows that the impact of
whether the context information is provided per cell or ring is higher for non‐uniform
user distributions than for uniform ones. As previously explained, this is the case
because using context information per cell can result in incorrect estimations of the t
and r parameters when users are non‐uniformly distributed in the cell. Providing the
context information per ring rather than per cell significantly improves the hit rate
(Table 7‐3) and the energy gains compared to traditional single‐hop cellular
communications (Table 7‐2) independently of the user distribution. The results in Table
7‐2 show that under a uniform distribution of users, the differences between AREA‐Ring
and DELAY‐Ring appear only for a low density of users. In this case, AREA‐Ring
Table 7‐4. Reduction (in percentage) of the total average energy consumption compared to
single‐hop cellular communications (only two‐hop opportunistic MCN transmissions).
a) Uniform spatial distribution of MRs within the cell
Technique
μ/R=0.125 MRs/m μ/R= 0.03 MRs/m
F=10 Mb, v=2m/s, T=30s
F=10 Mb, v=10m/s, T=30s
F=10 Mb, v=2m/s, T=30s
F=10 Mb, v=2m/s, T=60s
AREA 91.5 99.0 90.6 94.9
AREA – Ring 91.5 99.0 89.8 94.5
DELAY 91.0 99.0 89.3 93.6
DELAY – Ring 91.0 99.0 89.3 93.4
b) Non‐uniform spatial distribution of MRs within the cell
Technique
μ/R=0.125 MRs/m μ/R= 0.03 MRs/m
F=10 Mb, v=2m/s, T=30s
F=10 Mb, v=10m/s, T=30s
F=10 Mb, v=2m/s, T=30s
F=10 Mb, v=2m/s, T=60s
AREA 90.8 98.9 88.8 94.0
AREA – Ring 90.5 98.9 80.6 86.8
DELAY 89.8 98.9 87.0 92.3
DELAY – Ring 89.3 98.8 87.1 91.3
Chapter 7. Context‐aware Opportunistic Forwarding in MCN
166
outperforms DELAY‐Ring, with higher differences observed for the lowest T value. This is
due to the fact that DELAY needs to wait for an MR to reach the optimum MR location,
with the D2D delay increasing with the lower density of users per cell. This delay, and
decreasing the T deadline, results in the reduction of the hit‐rate performance shown in
Table 7‐3. AREA‐Ring also outperforms DELAY‐Ring for non‐uniform user distributions. In
this case, the differences appear even for the higher density of users evaluated. The use
of the context information per ring provides a better indication of how users are
distributed within the cell, which allows better adjusting t and r.
7.4.3 NetworkCapacity
The previous sections have demonstrated that the use of opportunistic MCN
communications can significantly improve the energy efficiency of MCNs compared to
traditional single‐hop cellular communications. The AREA and DELAY proposals have
been shown to be able to provide energy gains close to that reached with an optimum
energy configuration of opportunistic MCN communications if adequately configured,
e.g. using context information per ring in the case of non‐uniform user distributions. The
observed energy gains result from a more efficient use of radio resources. Indeed,
opportunistic MCN communications provide the means to decide when to establish a
communications link based on its efficiency and quality. Table 7‐5 demonstrates that the
efficient use of radio resources that results from the combination of opportunistic
networking and MCN for delay tolerant services can also provide very significant cellular
capacity gains at the network level compared to traditional single‐hop cellular
communications. The capacity gain is measured in this study as the reduction of the
time needed to complete the MR‐BS cellular transmission in the case of two‐hop
opportunistic MCN communications compared to the time needed by traditional single‐
hop cellular communications to complete the SN‐BS cellular transmission. The ‘MR
closest to BS’ reference scheme is the one achieving higher capacity gains. This is the
case because the MR is selected as close as possible to the BS, and therefore the scheme
can minimize the time needed to upload the information to the BS. However, it is
important to remember that this scheme actually consumed even more energy than
traditional single hop cellular communications (Table 7‐2). This is due to the fact that
selecting an MR as close as possible to the BS significantly increases the energy
consumption in the D2D transmission due to the lower quality/efficiency conditions for
the D2D link. Table 7‐5 also shows that the ‘1‐hop Direct‐contact’ reference scheme can
increase the capacity compared to traditional single‐hop cellular communications.
However, its capacity gains are in general below the ones obtained with opportunistic
MCN as it does not take advantage of the D2D transmission to start the cellular

Chapter 7. Context‐aware Opportunistic Forwarding in MCN
167
transmission closer to the BS. Similar trends are observed in terms of the impact of user
density, MR speed, deadline T and context information (per cell or per ring) on the AREA
and DELAY capacity performance and comparison (Table 7‐5) as they were observed for
the energy consumption (Table 7‐2). The results reported in Table 7‐6 also shows that
when only considering the SN‐BS transmissions that took place using a two‐hop
opportunistic MCN link, the context‐aware proposals achieves very similar capacity gains
levels to that obtained with the ‘Optimum’ configuration.
Table 7‐5. Capacity gains with respect to single‐hop cellular communications.
a) Uniform spatial distribution of MRs within the cell
Technique
μ/R= 0.125 MRs/m μ/R= 0.03 MRs/m
F=10 Mb, v=2m/s, T=30s
F=10 Mb, v=10m/s, T=30s
F=10 Mb, v=2m/s, T=30s
F=10 Mb, v=2m/s, T=60s
AREA 63.1 72.6 61.1 66.3
AREA – Ring 64.2 78.5 63.5 68.6
DELAY 61.1 76.1 49.3 62.8
DELAY – Ring 62.6 78.9 49.3 63.5
MR closest to BS 74.7 81.8 72.4 76.6
MR closest to SN 18.5 72.4 20.5 48.3
1‐hop Direct‐contact 41.1 73.6 41.1 48.3
Optimum 66.9 79.1 66.9 72.1
b) Non‐uniform spatial distribution of MRs within the cell
Technique
μ/R= 0.125 MRs/m μ/R= 0.03 MRs/m
F=10 Mb, v=2m/s, T=30s
F=10 Mb, v=10m/s, T=30s
F=10 Mb, v=2m/s, T=30s
F=10 Mb, v=2m/s, T=60s
AREA 42.2 50.5 43.2 45.7
AREA – Ring 63.0 76.7 57.7 65.1
DELAY 41.7 58.4 31.0 40.8
DELAY – Ring 51.6 76.9 33.9 61.2
MR closest to BS 73.7 81.6 63.9 70.2
MR closest to SN 25.4 73.5 36.6 53.7
1‐hop Direct‐contact 41.4 73.6 41.4 48.3
Optimum 66.9 79.1 66.9 72.1

Chapter 7. Context‐aware Opportunistic Forwarding in MCN
168
7.5 SummaryandDiscussion
This chapter has proposed a set of context‐aware opportunistic forwarding schemes
for MCN communications that exploit the store, carry and forward capabilities of mobile
devices. The proposed schemes are based on the reference optimum configuration of
opportunistic MCN communications analytically derived with the objective to minimize
the energy consumption (Chapter 6). The set of derived schemes exploit context
information available in cellular networks to identify adequate mobile relays taking into
account the identified optimum configuration. If no MR can be found at the identified
optimum location and time instant, the AREA proposal expands the MR search area
around the optimum location using information about the spatial density and
distribution of mobile nodes within the cell. The DELAY proposal uses the same context
information to identify for how long the D2D transmissions from the source node can be
delayed to find an MR at the identified optimum location. The conducted extended
Table 7‐6. Capacity gains with respect to single‐hop cellular communications (only two‐hop
opportunistic MCN transmissions).
a) Uniform spatial distribution of MRs within the cell
Technique
μ/R=0.125 MRs/m μ/R= 0.03 MRs/m
F=10 Mb, v=2m/s, T=30s
F=10 Mb, v=10m/s, T=30s
F=10 Mb, v=2m/s, T=30s
F=10 Mb, v=2m/s, T=60s
AREA 66.2 78.8 65.1 70.8
AREA – Ring 66.1 79.0 65.0 70.5
DELAY 64.9 78.8 61.1 67.7
DELAY – Ring 64.8 79.0 61.2 67.1
b) Non‐uniform spatial distribution of MRs within the cell
Technique
μ/R=0.125 MRs/m μ/R= 0.03 MRs/m
F=10 Mb, v=2m/s, T=30s
F=10 Mb, v=10m/s, T=30s
F=10 Mb, v=2m/s, T=30s
F=10 Mb, v=2m/s, T=60s
AREA 61.1 75.0 59.6 63.2
AREA – Ring 65.3 79.0 62.4 69.2
DELAY 59.3 76.1 52.8 61.1
DELAY – Ring 60.8 78.3 53.0 61.2
Chapter 7. Context‐aware Opportunistic Forwarding in MCN
169
numerical evaluations have shown that the integration of opportunistic networking
principles into MCN yields significant energy savings and capacity gains compared to
traditional single‐hop cellular communications. The AREA proposal generally
outperforms the DELAY scheme. Both schemes benefit from the provision of context
information per ring rather than per cell. In this case, the proposals, and in particular the
AREA scheme, can achieve energy and capacity performance levels close to those that
could be obtained under an optimum configuration of opportunistic MCN
communications. In this case, the context‐aware schemes can reduce the energy
consumption compared to traditional single‐hop cellular communications by up to 98%
for delay tolerant services, and increase the cellular capacity by up to 79%. These results
demonstrate that opportunistic networking and MCN can significantly contribute
towards achieving the capacity and energy efficiency gains sought for 5G networks.


171
8 Conclusions
Future 5G networks are being designed with the objective to efficiently handle the
exponential growth in mobile data traffic. According to recent estimates, it is expected
that mobile data traffic will increase nearly tenfold between 2014 and 2019. The
objective of 5G networks is to support these growth levels while saving up to 90% of
energy per provided service. To reach these goals, device‐centric wireless solutions,
including D2D and MCNs, are being considered as part of the 5G ecosystem as emerging
alternatives to traditional cell‐centric architectures. Device‐centric MCNs utilize mobile
relays and D2D communications. Device‐centric MCNs can help address certain
limitations of conventional cell‐centric architectures. In particular, MCNs are capable to
provide higher and more homogeneous QoS levels across the cell by substituting long‐
distance (NLOS) cellular links for multiple hops with better link budgets. Device‐centric
MCNs are aimed at exploiting the increasing intelligence, communications and
computing resources of mobile devices. In device‐centric MCNs, smart mobile devices
become prosumers of wireless connectivity and act as a bridge between the cellular
infrastructure and other devices. If efficiently coordinated, device‐centric MCNs have
demonstrated potential for significantly increasing the capacity, energy efficiency and
QoS. In fact, several analytical and simulation‐based studies proved the benefits of
MCNs using mobile relays in terms of capacity improvement, cell coverage, network
scalability and infrastructure deployment cost among others. However, to date, no study
had previously experimentally evaluated the QoS benefits of MCNs using mobile relays

Chapter 8. Conclusions
172
and D2D communications. In this context, this thesis has empirically contributed
towards a better understanding of the real potential and performance benefits that
device‐centric MCNs can provide over traditional cellular systems. In particular, this
thesis has designed a unique MCN hardware testbed that has been used to validate and
quantify the QoS benefits of MCNs with respect to single‐hop cellular communications,
and the conditions under which such benefits can be obtained. This thesis has then used
the data obtained from field measurements to derive a unique set of empirical models
of the communications performance of MCNs.
A large portion of the traffic that is driving the mobile data growth can be deemed as
delay tolerant. This is the case for example of mobile vide traffic, that is expected to
represent 72% of mobile data traffic by 2019, and it also includes email, file sharing,
social networking, software/firmware updates, cloud services, data metering and goods
tracking. The integration of opportunistic networking and MCNs represents then an
interesting option to provide QoS while improving energy‐efficiency by taking advantage
of the delay tolerance of these traffic services. Opportunistic schemes can exploit the
mobile device’s storing, carrying and forwarding capabilities, and the non real‐time
properties of delay tolerant services, to enhance the efficiency of wireless transmissions.
In this context, this thesis has contributed towards the analysis of the capacity of
opportunistic MCNs to improve the energy‐efficiency of cellular networks. In particular,
this thesis has proposed an analytical framework for two‐hop opportunistic MCN
communications designed to identify their optimum configuration in terms of energy
efficiency. In addition, this thesis has proposed two context‐aware opportunistic
forwarding schemes. The proposed schemes exploit context information already
available in the cellular networks to identify adequate mobile relays taking into account
the identified optimum configuration. The proposed schemes increase the feasibility of
integrating opportunistic networking mechanisms into MCNs, and contribute towards
achieving the 5G capacity and energy‐efficiency objectives.
The following sections provide a comprehensive summary of the main results and
conclusions derived from the investigations carried out in this thesis. Finally, possible
future research directions are discussed.
8.1 ExperimentalEvaluationofMulti‐hopCellularNetworks
This thesis has introduced mHOP, the first research platform designed to investigate
the performance benefits of MCNs using mobile relays over traditional cellular systems,
Chapter 8. Conclusions
173
and to analyze the conditions under which such benefits can be obtained. To allow for
their performance comparison, the platform includes a conventional single‐hop cellular
link and a MCN link that gains access to the cellular infrastructure through a hybrid
mobile node capable of forwarding cellular data in real‐time to (from) the destination
mobile node. In addition, this thesis has also presented the first results obtained from an
extensive field test campaign that validate the potential of MCNs using mobile relays
and D2D communications, and demonstrate the important end‐user QoS improvements
that can be achieved with this emerging technology compared to traditional cellular
systems. In particular, the conducted field tests have experimentally proved the capacity
of MCN technologies to extend the cellular radius, and increase the QoS at large
distances to the serving BS, in indoor environments, under NLOS propagation
conditions, and in handover areas. The conducted measurements have also
experimentally demonstrated the capability of MCNs using mobile relays to reduce the
energy consumption compared to traditional single hop cellular systems.
8.2 ModelingthePerformanceofMulti‐hopCellularNetworks
Using the experimental testbed and data previously discussed, this thesis has
presented novel and unique empirical models for the communications performance of
MCNs using mobile relays and D2D communications. The proposed models can be useful
to support the design, test and optimization of novel communications and networking
protocols tailored for MCNs. The models have been obtained following a large field
testing campaign using an active cellular network in the city of Elche in Spain. The
reported models represent the MCN throughput experienced at a mobile destination
node as a function of the distance, propagation/visibility conditions, number of hops
and communication settings. The MCN throughput performance has been modeled with
a sigmoid function that is a function of the cellular throughput experienced at the hybrid
or gateway mobile node. Models have been reported for MCN configurations of up to 5‐
hops. The models’ fitting parameters have been shown to depend on key factors such as
the propagation conditions and number of hops. Another relevant parameter is the
critical distance or distance at which the MCN throughput operates below the cellular
throughput. The models have been derived considering HSPA cellular transmissions (LTE
was not deployed at the time of deriving the models) and IEEE 802.11g D2D
communications. Extending the models to other cellular technologies could be feasible
as long as the MCN performance is upper‐bounded by the cellular link between the BS
and the hybrid mobile node. Using the MCN measurements, this thesis has also derived

Chapter 8. Conclusions
174
empirical models for the communications between mobile devices. In particular, the
thesis provides models for the IEEE 802.11g data rate, PER and RSSI parameters as a
function of the distance between the communicating devices.
8.3 OpportunisticForwardinginMulti‐hopCellularNetworks
A large portion of the cellular data traffic (present and future) can be deemed delay
tolerant. In this context, this thesis has proposed to exploit this delay tolerance to
further increases the MCN benefits through the integration of opportunistic networking
policies. The study has focused on a two‐hop MCN scenario, and has analytically
formulated the energy optimization problem that allows identifying the optimum mobile
relay location, and the location at which the relay needs to start forwarding the
information to the cellular network, in order to minimize the energy consumption. The
conducted study has analyzed the impact of traffic characteristics of delay tolerant
services on the energy gains that can be reached with opportunistic MCN
communications compared to traditional single‐hop cellular communications. The study
has also investigated how opportunistic MCN communications should be configured to
exploit the traffic delay tolerance in order to reduce the total transmission energy
consumption. The obtained results have shown that opportunistic MCN communications
can significantly reduce the energy consumption compared to traditional single‐hop
cellular communications for delay tolerant services. The reduction can go beyond 95%
under certain conditions. In particular, the reduction levels increase with increased
traffic delay tolerance thresholds and increasing distances of the source node to the
serving base station.
The derived optimum configurations have then been used as reference performance
bounds for the design of realistic opportunistic forwarding schemes for MCN
communications using mobile relays. In particular, a set of context‐aware opportunistic
forwarding schemes for MCN communications have been proposed. The schemes
exploit context information available in cellular networks to identify adequate mobile
relays taking into account the identified optimum configuration. If no MR can be found
at the identified optimum location and time instant, the AREA proposal expands the MR
search area around the optimum location using information about the spatial density
and distribution of mobile nodes within the cell. The DELAY proposal uses the same
context information to identify for how long the D2D transmissions from the source
node can be delayed to find an MR at the identified optimum location. The conducted
evaluations have shown that the integration of opportunistic networking principles into

Chapter 8. Conclusions
175
MCN yields significant energy savings and capacity gains compared to traditional single‐
hop cellular communications. The AREA proposal generally outperforms the DELAY
scheme. Both schemes benefit from the provision of context information per ring rather
than per cell. In this case, the context‐aware proposals can reduce the energy
consumption (by up to 98%) and increase the cellular capacity (by up to 79%) compared
to traditional single‐hop cellular communications in the case of delay tolerant services.
These results demonstrate that opportunistic networking and MCNs can significantly
contribute towards achieving the capacity and energy efficiency gains sought for 5G
networks.
8.4 FutureWork
The mHOP testbed was implemented using Ubuntu laptops as mobile relays. This
decision was taken due to the requirements of the platform in terms of monitoring
capabilities, scalability and flexibility to investigate various communications settings.
During the thesis, the author has closely followed the evolution of the Ubuntu for
Devices project (also known as Ubuntu Touch or Ubuntu Phone) [160] since it would
have been interesting to evolve the mHOP platform to integrate handheld devices.
Given the fact that the mHOP implemented code is working on Ubuntu distributions, the
migration to Ubuntu handheld devices should not require considerable efforts.
However, a stable release of Ubuntu for Devices was not available at the time this thesis
implemented mHOP (actually the first Ubuntu phone went on sale on February 2015
with BQ on the Aquaris E4.5). The releases available for developers (known as Developer
Preview) lack yet of all the functionalities needed to implement a mHOP node. For
example, the Developer Preview currently only supports limited voice and SMS services
over GSM and UMTS. Some networking functionalities are supported such as IEEE
802.11 in ad‐hoc mode, but limited access is yet provided to modify communication
parameters at the PHY and MAC layers. Another issue is the fact that mHOP nodes are
equipped with an external IEEE 802.11 wireless ExpressCard for the ad‐hoc D2D
communications since the built‐in wireless interface is dedicated to monitor
retransmitted packets. This ExpressCard can be plugged to the handheld devices using
their mini USB port which needs to deliver power to the wireless ExpressCard. However,
this USB On‐The‐Go (OTG) functionality is not yet supported.
Another interesting evolution for the mHOP platform would be the integration of
alternative radio interfaces to support D2D communications. To this aim, Qualcomm’s
release of LTE‐Direct certainly represents a progress towards the study of MCNs using

Chapter 8. Conclusions
176
LTE‐based D2D communications. The LTE‐Direct software development kit is available
from the manufacturer, and can be installed in handheld devices to develop proximal
discovery solutions and proximity services. However, the software development kit
provided by Qualcomm does not support yet D2D communications.
In parallel to this thesis, members of the UWICORE laboratory have been evolving the
mHOP platform to implement link‐aware opportunistic D2D communications by
modifying the legacy IEEE 802.11 implementation in the Linux kernel, in particular its
MAC layer [14]. The development is aimed at improving the efficiency and performance
of D2D communications by avoiding unnecessary (and inefficient) transmissions when
the link quality conditions are not good. In particular, the solution implemented pauses
D2D transmissions between devices when the measured link quality conditions are
below an RSSI threshold. The D2D transmission is then re‐started when the link quality
conditions improve. This opportunistic operation has shown to result in important
energy, capacity and QoS benefits in D2D communications [14]. Efforts need now to be
devoted to extend the platform to support multi‐hop D2D opportunistic
communications, but most importantly to support opportunistic MCN communications
at the D2D and cellular levels considering the differences needed for uplink and
downlink transmissions.
This thesis has demonstrated the energy efficiency and capacity benefits resulting
from the integration of opportunistic networking mechanisms into MCNs for delay
tolerant services. Following the results obtained, further work would be needed to
design innovative wireless networking policies that exploit diverse service requirements
and opportunistic networking principles to establish efficient connections. To this aim, it
will be of paramount importance to increase the use of context information (e.g. user
preferences, network state, spectrum availability and characteristics, link conditions,
interference levels, operating conditions). Actually, context‐awareness is clearly
highlighted as a key characteristic for future 5G networks. However, acquiring and
sharing such context could require significant signaling overhead that would need to be
carefully controlled by evaluating the value and acquisition cost of the context
information. In this context, lightweight schemes to extract and characterize context
conditions considering the trade‐offs between relevance and granularity of the context
information and acquisition cost would be also needed to be analyzed.
Future 5G wireless networks will be characterized by the co‐existence of different
radio access technologies (adequate for the diverse 5G services requirements),
spectrum bands (e.g. licensed and unlicensed), and communications modes (e.g. single‐

Chapter 8. Conclusions
177
hop cellular communications, D2D and MCNs). Future heterogeneous ecosystems will
hence require advanced management techniques to exploit the envisioned
heterogeneity. In this context, it would be interesting to extend the studies carried out
in this thesis to heterogeneous, context‐aware and spectrum agile multi‐technology
networks that allow D2D communications and MCNs to utilize heterogeneous
technologies and spectrum bands for their transmissions. In this scenario, D2D and
MCNs would be able to dynamically select the most appropriate configuration for each
transmission, with the selection depending on the efficiency, reliability and latency
requirements of the diverse 5G applications and services.
It would be also important to highlight the work to be done for progressing towards
the envisioned 5G device‐centric wireless networks. In order to ensure that nodes can
take independent and local decisions, further work would need to be done in the
evolution of current architectures to facilitate flexible device‐centric architectures. To
this aim, approaches could consider current proposals to decouple the control and user
planes, which could operate under different technologies and/or spectrum bands. In
addition, device‐centric solutions would require the design of novel distributed and
semi‐centralized control algorithms that provide sufficient flexibility for local decisions
at the device level while ensuring that such decisions, whether coordinated or not with
the cellular network, can maximize network performance, capacity and efficiency with
minimum signaling exchanges.
This thesis has demonstrated that the integration of opportunistic forwarding
mechanisms into MCNs can help improve the capacity and energy‐efficiency of future
wireless networks. These networks will also need to reduce latency over the radio access
network. Certainly, the proposals to decouple control and user planes in device‐centric
architectures are expected to have a significant impact on the reduction of the latency.
A complementary solution that might benefit from the flexibility of device‐centric
wireless networks is the possibility to use the mobile devices as content distributors.
Doing so, the information is stored at the pure edge of the network and the time to
access the information is significantly reduced. However, important issues that need yet
to be resolved are the decisions on which information should be stored, which node
should store such information and how to distribute such information.

179
8Conclusiones
Las futuras redes 5G están siendo diseñadas con el objetivo de hacer frente de una
manera eficiente al tráfico de datos de las redes móviles que crece a tasas
exponenciales. Estudios recientes han estimado que el tráfico de datos de las redes
móviles se incrementará diez veces entre 2014 y 2019. El objetivo de las redes 5G es
soportar estos niveles de crecimiento en el tráfico de datos a la vez que se reduce en un
90% el consumo energético por servicio ofrecido. Para alcanzar estos objetivos, las
soluciones centradas en los dispositivos, incluyendo D2D y MCNs, están siendo
consideradas como parte del ecosistema 5G como alternativas emergentes a las
soluciones celulares tradiciones. Las redes MCNs centradas en los dispositivos utilizan
retransmisores móviles y comunicaciones D2D. Las redes MCNs centradas en los
dispositivos pueden ayudar a abordar ciertas limitaciones de las arquitecturas celulares
tradicionales. En particular, las redes MCNs son capaces de proveer niveles de QoS más
altos y más homogéneos en toda la celda mediante la sustitución de enlaces de larga
distancia (y probablemente en condiciones NLOS) por múltiples enlaces de mejor
calidad. Las redes MCNs centradas en los dispositivos persiguen explotar la inteligencia y
los cada vez mayores recursos de comunicación y cómputo de los dispositivos móviles.
En las redes MCNs centradas en los dispositivos, los dispositivos móviles se convierten
en productores/consumidores de conectividad inalámbrica y actúan como puente entre
la infraestructura celular y otros dispositivos. Las redes MCNs han demostrado tener el

Capítulo 8. Conclusiones
180
potencial para ofrecer importantes beneficios de capacidad, eficiencia energética y QoS.
De hecho, estudios analíticos y basados en simulación han demostrado los beneficios de
las redes MCNs que utilizan retransmisores móviles en términos de mejora de la
capacidad, extensión de la cobertura, escalabilidad de la red, y coste de despliegue. Sin
embargo, hasta la fecha, ningún estudio había evaluado experimentalmente los
beneficios de las redes MCNs que utilizan retransmisores móviles y comunicaciones
D2D. En este contexto, esta tesis ha contribuido en el conocimiento del verdadero
potencial y los beneficios de rendimiento que las redes MCNs centradas en los
dispositivos pueden proporcionar con respecto a los sistemas celulares tradicionales. En
particular, esta tesis ha diseñado una plataforma hardware MCN única que ha sido
utilizada para validar y cuantificar los beneficios de QoS de las redes MCNs con respecto
a las comunicaciones celulares basadas en un único salto, y las condiciones en las que
estos beneficios pueden obtenerse. Esta tesis ha utilizado también los datos obtenidos
de campañas de medidas para desarrollar un conjunto único de modelos empíricos del
rendimiento de las comunicaciones en las redes MCNs.
Una gran porción del tráfico que está contribuyendo en el crecimiento de los datos
en las redes móviles puede considerarse como tolerante a retardos. Este es el caso por
ejemplo del tráfico de video móvil, que se espera que represente el 72% del tráfico de
datos en las redes móviles en 2019, y también incluye tráfico de emails, compartición de
ficheros, redes sociales, actualizaciones de software/firmware, servicios en la nube,
datos medidos y seguimiento de productos/mercancías. La integración de mecanismos
oportunistas en las redes MCNs representa una opción interesante para proveer QoS a
la vez que se mejora la eficiencia energética aprovechando la tolerancia al retardo de
estos servicios de tráfico. Los mecanismos oportunistas pueden sacar provecho de las
capacidades de almacenamiento, transporte y reenvío de los dispositivos móviles, y de
las propiedades de no tiempo real de los servicios tolerantes a retardos, para mejorar la
eficiencia de las transmisiones inalámbricas. En este contexto, esta tesis ha contribuido
en analizar la capacidad de las redes MCNs oportunistas de mejorar la eficiencia
energética de las redes celulares. En particular, esta tesis ha propuesto un entorno
analítico para las redes oportunistas MCN de dos saltos diseñado para identificar su
configuración óptima en términos de eficiencia energética. Además, esta tesis ha
propuesto dos técnicas oportunistas que hacen uso de la información de contexto que
está disponible en las redes celulares para identificar a los retransmisores móviles
adecuados y teniendo en cuenta la configuración óptima identificada. Los esquemas
propuestos incrementan la viabilidad de integrar mecanismos oportunistas en las redes
Capítulo 8. Conclusiones
181
MCNs, y contribuyen en alcanzar los objetivos de las redes 5G en cuanto a capacidad y
eficiencia energética.
Las siguientes secciones proporcionan un completo resumen de los principales
resultados y conclusiones obtenidos de las investigaciones llevadas a cabo en esta tesis.
Finalmente, se discuten posibles líneas futuras de investigación.
8.1 EvaluaciónExperimentaldelasRedesMCN
Esta tesis ha desarrollado mHOP, la primera plataforma de investigación diseñada
para investigar los beneficios de rendimiento de las redes MCNs con retransmisores
móviles sobre los sistemas celulares tradicionales, y las condiciones en las que estos
beneficios pueden obtenerse. Para permitir la comparativa de rendimiento, la
plataforma incluye un enlace celular convencional y un enlace MCN que consigue el
acceso a la infraestructura celular a través de un nodo móvil híbrido capaz de
retransmitir los datos celulares en tiempo real hacia (desde) el nodo destino. Además,
esta tesis ha presentado también los primeros resultados obtenidos de una extensa
campaña de medidas que validan el potencial de las redes MCNs que utilizan
retransmisores móviles y comunicaciones D2D, y demuestran las importantes mejoraras
en la QoS que pueden conseguirse con esta tecnología emergente comparada con los
sistemas celulares tradicionales. En particular, las pruebas de campo llevadas a cabo han
demostrado experimentalmente la capacidad de las tecnologías MCN de extender el
radio celular, y de incrementar la QoS a distancias alejadas de la BS, en entornos de
interior, bajo condiciones de NLOS, y en zonas de traspaso de celda. Las medidas
llevadas a cabo han demostrado también de modo experimental la capacidad de las
redes MCNs que utilizan retransmisores móviles de reducir el consumo energético
comparado con los sistemas celulares tradicionales.
8.2 ModeladodelRendimientodeRedesMCN
Utilizando la plataforma experimental mHOP y los datos obtenidos de la campaña de
medidas comentada anteriormente, esta tesis ha obtenido unos novedosos y únicos
modelos empíricos del rendimiento de las comunicaciones en redes MCNs que utilizan
retransmisores móviles y comunicaciones D2D. Los modelos propuestos pueden ser
útiles en el diseño, testeo y optimización de novedosos protocolos de comunicación y de
red para redes MCNs. Los modelos han sido obtenidos tras una larga campaña de
medidas en la red celular operativa de la ciudad de Elche en España. Los modelos

Capítulo 8. Conclusiones
182
obtenidos representan el throughput experimentado en el nodo destino de la
comunicación MCN en función a la distancia, las condiciones de visibilidad/propagación,
número de saltos, y configuración de la comunicación. El throughput de la comunicación
MCN ha sido modelado utilizando una función sigmoidea que depended del throughput
celular experimentado en el nodo híbrido o pasarela. Se han obtenido modelos para
configuraciones MCN de hasta 5 saltos. Los parámetros de ajuste de los modelos han
demostrado depender de factores clave como las condiciones de propagación y el
número de saltos. Otro parámetro relevante ha sido la distancia crítica o distancia a la
que el throughput de la comunicación MCN opera por debajo del throughput de la
conexión celular. Los modelos han sido obtenidos considerando transmisiones celulares
HSPA (LTE no estaba desplegado cuando se estaban obteniendo los modelos) y IEEE
802.11g para las comunicaciones D2D. Extender estos modelos a otras tecnologías sería
posible siempre y cuando el rendimiento de la comunicación MCN este limitado por el
enlace celular entre la BS y el nodo híbrido. Utilizando los datos obtenidos en estas
pruebas de campo, la tesis también ha obtenido modelos empíricos de la comunicación
entre dispositivos. En particular, esta tesis proporciona modelos de la tasa de
transmisión IEEE 802.11 (data rate), la tasa de paquetes erróneos (PER) y el nivel de la
señal recibida (RSSI) en función a la distancia entre los nodos de comunicación.
8.3 TécnicasOportunistasenRedesMCN
Una gran proporción del tráfico de datos (presente y futuro) pueden considerarse
tolerante a retardos. En este contexto, esta tesis ha propuesto sacar provecho a esta
tolerancia al retardo para mejorar aún más los beneficios de las redes MCNs a través de
la integración de técnicas oportunistas. El estudio se ha centrado en un escenario con 2
saltos en la red MCN, y ha formulado analíticamente el problema de optimización de
consumo energético que permite identificar la localización óptima del retransmisor
móvil, y la localización en la que el retransmisor necesita iniciar la retransmisión de la
información hacia la red celular, con el objetico de minimizar el consumo energético. El
estudio llevado a cabo ha analizado el impacto de las características del tráfico tolerante
a retardos en las ganancias de energía que pueden obtenerse con las comunicaciones
oportunistas en redes MCNs utilizando como base de la comparación las
comunicaciones celulares tradicionales. El estudio ha investigado también como las
comunicaciones oportunistas en redes MCNs deben configurarse para sacar el máximo
provecho a la tolerancia al retardo del tráfico con el objetivo de reducir el consumo
energético total de las transmisiones. Los resultados obtenidos han demostrado que las

Capítulo 8. Conclusiones
183
comunicaciones oportunistas en redes MCNs pueden reducir significativamente el
consumo energético con respecto a las comunicaciones celulares tradicionales para
tráfico tolerante a retardos. Los niveles de reducción pueden ir más allá del 95% en
determinadas condiciones. En particular, los niveles de reducción del consumo
energético se incrementan a medida que incrementa el tiempo límite que tolera el
tráfico tolerante a retardos y se incrementa la distancia del nodo fuente a la estación
base.
Las configuraciones óptimas obtenidas han sido utilizadas como referencia para el
diseño de técnicas oportunistas realistas para redes MCNs que utilizan retransmisores
móviles. En particular, un conjunto de técnicas oportunistas que hacen uso de
información de contexto han sido propuestas. Las técnicas propuestas sacan provecho
de la información de contexto que pueden obtener de las redes celulares para
identificar a los retransmisores móviles más adecuados y teniendo en cuenta la
configuración óptima identificada. Si no puede encontrarse un MR en la localización
óptima identificada en el instante requerido, la propuesta AREA expande el área
búsqueda alrededor de la localización óptima utilizando información acerca de la
densidad de usuarios en la celda y su distribución. La propuesta DELAY utiliza la misma
información de contexto para identificar cuánto tiempo puede retrasarse la transmisión
D2D desde el nodo fuente para encontrar un MR en la localización óptima identificada.
Las evaluaciones llevadas a cabo han demostrado que la integración de estas técnicas
oportunistas realistas en las redes MCNs también permite obtener importantes ahorros
energéticos y ganancias de capacidad en comparación con las redes celulares
tradicionales. La propuesta AREA generalmente mejora el rendimiento de la propuesta
DELAY. Ambas técnicas se benefician de la utilización de información de contexto por
anillo en lugar de por celda. En este caso, las técnicas propuestas pueden reducir el
consumo energético (hasta en un 98%) e incrementar la capacidad celular (hasta en un
79%) en comparación con las comunicaciones celulares tradicionales y para tráfico
tolerante a retardos. Estos resultados demuestran que las técnicas oportunistas en las
redes MCNs pueden contribuir significativamente a alcanzar las objetivos de las redes
5G en términos de capacidad y eficiencia energética.
8.4 TrabajosFuturos
La plataforma mHOP fue implementada utilizando portátiles Ubuntu como
retransmisores móviles. Esta decisión fue tomada debido a los requisitos de la
plataforma en términos de capacidades de monitorización, escalabilidad y flexibilidad

Capítulo 8. Conclusiones
184
para investigar diferentes configuraciones de comunicación. Durante la tesis, el autor ha
seguido muy de cerca la evolución del proyecto Ubuntu for Devices (también conocido
como Ubuntu Touch o Ubuntu Phone) ya que hubiese sido interesante evolucionar la
plataforma para integrar terminales móviles. Dado que el código de implementación de
mHOP está desarrollado en Ubuntu, la migración a un terminal móvil Ubuntu no debería
requerir muchos esfuerzos. Sin embargo, en el momento que se implementó mHOP no
había una versión estable del proyecto Ubuntu for Devices (de hecho el primer terminal
Ubuntu salió a la venta en Febrero de 2015 en el BQ Aquaris E4.5). Las versiones
disponibles para desarrolladores (conocidas como Developer Preview) carecen todavía
de todas las funcionalidades que se necesitan para implementar un nodo de la
plataforma mHOP. Por ejemplo, en la versión disponible para desarrolladores sólo hay
disponible servicios de SMS y voz sobre GSM y UMTS. Algunas funcionalidades de red
están soportadas como la configuración en modo ad‐hoc de IEEE 802.11, pero el acceso
a modificar parámetros de comunicación de las capas PHY y MAC es todavía limitado.
Otro tema es el hecho de que los nodos de la plataforma mHOP están equipados con
una interfaz externa IEEE 802.11 para realizar las comunicaciones ad‐hoc D2D ya que la
interfaz interna se dedica a monitorizar los paquetes retransmitidos. Esta tarjeta externa
puede conectarse al terminal móvil utilizando el puerto mini USB que necesita proveer
de corriente a la tarjeta. Sin embargo, esta funcionalidad (USB OTG) no está todavía
soportada.
Otra interesante evolución de la plataforma mHOP sería la integración de interfaces
radio alternativas para soportar las comunicaciones D2D. La tecnología desarrollada por
Qualcomm, LTE‐Direct, representa un claro progreso para estudiar las comunicaciones
MCN utilizando tecnologías basadas en LTE. El software de desarrollo de LTE‐Direct está
disponible y puede ser instalado en terminales para desarrollar soluciones de
descubrimiento de proximidad y servicios de proximidad. Sin embargo, el software de
desarrollo proporcionado por Qualcomm no soporta todavía comunicaciones D2D.
En paralelo al desarrollo de esta tesis, algunos miembros del laboratorio UWICORE
han estado evolucionando la plataforma mHOP para implementar comunicaciones
oportunistas D2D basadas en la calidad del enlace modificando la implementación por
defecto de IEEE 802.11 que se encuentra en el Kernel de Linux, en particular su capa
MAC. Este desarrollo persigue mejorar la eficiencia y rendimiento de las comunicaciones
D2D evitando transmisiones innecesarias (e ineficientes) cuando la calidad de los
enlaces no es lo suficientemente buena. En particular, la solución implementada pausa
la comunicación D2D entre dos dispositivos cuando la calidad del enlace medida está

Capítulo 8. Conclusiones
185
por debajo de un umbral de RSSI. La transmisión D2D se reinicia cuando la calidad del
enlace mejora. Esta implementación ha demostrado resultar en importantes beneficios
de para la comunicación D2D en términos de energía, capacidad y QoS. Los esfuerzos
deben destinarse ahora a extender esta plataforma para soportar comunicaciones D2D
oportunistas multi‐salto, y aún más importante para soportar comunicaciones MCN en
las que la pausa oportunista se efectúe tanto en los enlaces D2D como en el enlace
celular.
Esta tesis ha demostrado los beneficios energéticos y de capacidad que pueden
obtenerse de la integración de mecanismos oportunistas en redes MCNs para tráfico
tolerante a retardos. A partir de los resultados obtenidos, se podría seguir trabajando en
el diseño de novedosas políticas de red que tengan en cuenta los diferentes requisitos
de los servicios y las particularidades de las técnicas oportunistas para establecer
conexiones eficientes. Para este objetivo, disponer de mayor información de contexto
será algo muy a tener en cuenta (por ejemplo, las preferencias de los usuarios, el estado
de la red, la disponibilidad de espectro, las condiciones del enlace, niveles de
interferencia, y condiciones de operación). De hecho, las comunicaciones basadas en el
contexto están claramente marcadas como una característica clave de las futuras redes
5G. Sin embargo, adquirir y compartir esta información de contexto podría requerir
mucha información de contexto, lo cual debe de ser controlado de manera muy
cuidadosa evaluando el valor y el coste de adquisición de la información de contexto. En
este contexto, deberán desarrollarse esquemas que requieran de poca señalización para
extraer y caracterizar las condiciones de contexto considerando los compromisos entre
relevancia y granuralidad de la información de contexto.
Las futuras redes 5G estarán formadas por la coexistencia de diferentes tecnologías
de acceso radio (adecuadas para los diversos servicios 5G), bandas de espectro (con
licencia y sin licencia), y modos de comunicación (tradicionales, D2D y MCNs). Los
futuros ecosistemas heterogéneos requerirán por lo tanto técnicas de gestión avanzadas
para utilizar de una manera adecuada la esperada heterogeneidad. En este contexto,
sería interesante extender los estudios llevados a cabo en esta tesis a redes
multitecnología heterogéneas y con una alta flexibilidad de espectro, en las que se
permita que las comunicaciones D2D y las redes MCN utilicen tecnologías y bandas
heterogéneas para sus transmisiones. En este escenario, las comunicaciones D2D y MCN
serían capaces de seleccionar dinámicamente la configuración más adecuada para cada
transmisión, dependiendo la selección de los diversos requisitos de eficiencia, fiabilidad
y latencia de las aplicaciones y servicios de las redes 5G.

Capítulo 8. Conclusiones
186
También sería importante mencionar el trabajo que queda por hacer para progresar
hacia las redes inalámbricas centradas en los dispositivos. Para asegurar que los nodos
pueden tomar decisiones independientes y locales, se necesita progresar en la evolución
de las arquitecturas celulares actuales para facilitar arquitecturas más flexibles. Con este
objetivo, las soluciones que se propongan podrían considerar las propuestas de separar
los planos de control y de usuario, los cuales podrían operar en diferentes tecnologías
y/o bandas de espectro. Además, las redes centradas en los dispositivos requieren del
diseño de novedosos mecanismos de control distribuidos y semi‐centralizados que
ofrezcan la suficiente flexibilidad para tomar decisiones a nivel del dispositivo mientras
que se asegura que esas decisiones, coordinadas o no por la red celular, ayudan a
maximizar el rendimiento de la red, la capacidad y eficiencia con un mínimo intercambio
de señalización.
Esta tesis ha demostrado que la integración de técnicas oportunistas en las redes
MCNs puede ayudar a contribuir a conseguir los requisitos de capacidad y eficiencia
energética de las futuras redes inalámbricas. Estas redes necesitarán también que
reducir la latencia en la red de acceso. Las propuestas para separar los planos de control
y de usuario en las arquitecturas centradas en los dispositivos pueden tener un efecto
importante en la reducción de la latencia. Una solución complementaria que podría
beneficiarse de la flexibilidad de las redes inalámbricas centradas en los dispositivos es
la posibilidad de usar los terminales móviles como distribuidores de contenido. De este
modo, la información está almacenada en el verdadero límite de la red y el tiempo para
acceder a la información se reduce de manera significativa. Sin embargo, es necesario
resolver todavía importantes asuntos como decidir qué información debe ser
almacenada, quién debería almacenar esta información y cómo distribuir esta
información.

187
AnnexA. ConfigurationofOpportunistic
ForwardingusingHSPA
Technology
Chapter 6 has investigated the integration of opportunistic networking schemes into
MCNs that utilize D2D communications for delay tolerant services. The study has
focused on a two‐hop MCN scenario in which a static Source Node (SN) uploads a
message to the Base Station (BS) using a Mobile Relay (MR) with store, carry and
forward capabilities (Figure 6‐2). The scenario considers a delay tolerant service
characterized by a message of size F that needs to be uploaded to the BS within a time T.
The study has then proposed an analytical framework to manage the available time in
order to reduce the energy consumption considering the processes involved in a two‐
hop opportunistic MCN transmission: selection of the mobile relay node, store and carry
process, and the cellular communication with the base station. The analytical framework
has allowed deriving an optimum configuration of opportunistic MCN communications
that identifies the MR location at which the D2D transmission from SN to MR should
start, and the MR location at which the cellular transmission starts. The study in Chapter
6 was carried out considering LTE at 2 GHz for the cellular transmission and IEEE 802.11g
at 2.4 GHz for the D2D transmissions. This annex reproduces the study using High Speed

Annex A. Configuration of Opportunistic Forwarding using HSPA Technology
188
Packet Access (HSPA) at 2.1 GHz for the cellular transmissions to demonstrate that the
conclusions reached in Chapter 6 are not dependent on the selected radio access
technologies. To this aim, Annex A.b derives and analyzes the optimum configuration of
opportunistic forwarding for the two‐hop MCN scenario. Chapter 7 addressed the
scenario in which the optimum configuration cannot be established, and presented
suboptimum opportunistic forwarding approaches that use context‐information
provided by the cellular infrastructure. Annex A.c analyzes then the performance of the
‘Space‐dependent Opportunistic Forwarding’ (AREA) context‐aware opportunistic
forwarding scheme27 considering HSPA for the cellular radio access. See Chapter 7 for
additional details on the definition of the AREA proposal (e.g. how to calculate the
radius around the optimum MR search area for uniform and non‐uniform distributions
of users within the cell).
a. EvaluationScenario
The numerical resolution of the multi‐objective constrained optimization framework
presented in Chapter 6 is done considering HSPA at 2.1 GHz for the cellular
transmissions and IEEE 802.11g at 2.4 GHz for the ad‐hoc D2D transmissions. The
cellular transmission adapts the modulation and coding schemes based on the
experienced channel conditions. Following the model reported in [159], the cellular
transmission rate of the communication from MR to BS is modeled as follows:
cell 2R d k C log M d BW (Annex A‐1)
where BW, M and C represent the system bandwidth, modulation constellation size and
coding rate, respectively. M and C are selected according to the distance between the
mobile device and the BS (the higher the distance, the lower the received signal
strength, and more robust modulation and coding schemes are needed). This study
considers seven possible combinations of modulation and coding schemes with a
maximum transmission rate of 7 Mbps. K represents an attenuation factor that limits the
cellular data rate, and includes, among others, the effect of transmission failures,
retransmissions, and interference [159]. The SN needs to transmit to the BS a 10 Mb (F)
file before a 60 seconds deadline T. The scenario considers that the MRs are in line with
the SN, and moving towards the BS with a speed of 2 m/s. The rest of parameters are
reported in Table A.1.
27 AREA was selected since this proposal generally outperforms DELAY.

Annex A. Configuration of Opportunistic Forwarding using HSPA Technology
189
Table A.1. Evaluation parameters.
Parameter Description Value
Cell Cell radius 1000 m
AMC Adaptive modulation and coding
BPSK(r=1/3)
QPSK(r=1/3, 1/2, 2/3)
16QAM(r=1/2, 2/3, 5/6)
BW System bandwidth 10 MHz
GTX, GRX Transmitter and receiver antenna gain 1
etx, erx Energy consumed per bit by the
transmitter/receiver 50 x 10‐9 J/b
PRX Power reception threshold ‐62 dBm
hSN, hMR, hBS Antenna height of SN, MR and BS 1.5 m, 1.5 m, 10 m
DRAM PR, PW, PIdle_self‐refresh
DRAM power consumed for Reading, Writing and in Idle_self‐refresh state
252 mW, 252 mW, 1.35 mW
NAND EffRead, EffWrite, PIdle
NAND efficiency for Reading and Writing, and Power consumed in Idle state
1.83 nJ/b, 11.92 nJ/b, 0.4 mW
Transf_DF, Transf_EF
Transfer speed from the DRAM to the NAND flash and vice versa
4.85 MiB/s, 927.1 KiB/s
b. OptimumConfiguration
The resolution of the objective function presented in Chapter 6 results in the
optimum MR location to start the D2D transmission depicted in Figure A.1.a. The MR
location is represented by means of the distance between SN and MR, and is depicted in
Figure A.1.a as a function of the distance between SN and BS. Figure A.1.a shows for
example that if SN is located 400 meters away from the BS, the MR should be ideally
located 65 meters away from the SN in the direction of the BS in order to minimize the
total energy consumption. Figure A.1.a shows that the distance between SN and the
optimum MR that minimizes the energy consumption increases with the distance
between SN and BS. This is the case because as the distance between SN and MR
increases, the MR is closer to the BS, and the cellular transmission energy decreases. On
the other hand, the D2D transmission energy increases as MR is closer to the BS. As a
result, the distance between SN and the optimum MR location only increases when the
energy saving of the store and carry process can compensate the increase in the D2D
transmission energy consumption. The energy consumption levels for the D2D
transmission from SN to the optimum MR location are reported in Figure A.1.b in

Annex A. Configuration of Opportunistic Forwarding using HSPA Technology
190
logarithmic scale. The energy consumption levels are shown as a function of the
distance between SN and BS, and are labeled ‘Optimum’. The increasing distances
between SN and the optimum MR (Figure A.1.a) result in that the D2D transmission
energy consumption levels increase with the distance between SN and BS.
0 200 400 600 8000
50
100
150
SN distance to the BS [m]
SN
-MR
dis
tan
ce
[m]
0 200 400 600 800
10-4
10-3
10-2
10-1
SN distance to the BS [m]
D2
D t
x e
ner
gy
co
ns
um
pti
on
[K
J]
a) Optimum MR location b) D2D transmission energy consumption
Figure A.1. Optimum configuration of two‐hop opportunistic MCN communications using HSPA
for the cellular transmission: D2D transmission.
0 200 400 600 8000
10
20
30
40
50
60
SN distance to the BS [m]
Tim
e th
e M
R S
C t
he
info
[s]
0 200 400 600 800
10-3
10-2
SN distance to the BS [m]
SC
en
erg
y co
nsu
mp
tio
n [
KJ]
Optimum
MR closest to BS
a) Time the MR stores and carries the
information while moving towards the BS
b) Store and carry energy consumption
Figure A.2. Optimum configuration of two‐hop opportunistic MCN communications using HSPA
for the cellular transmission: Store and Carry (SC).
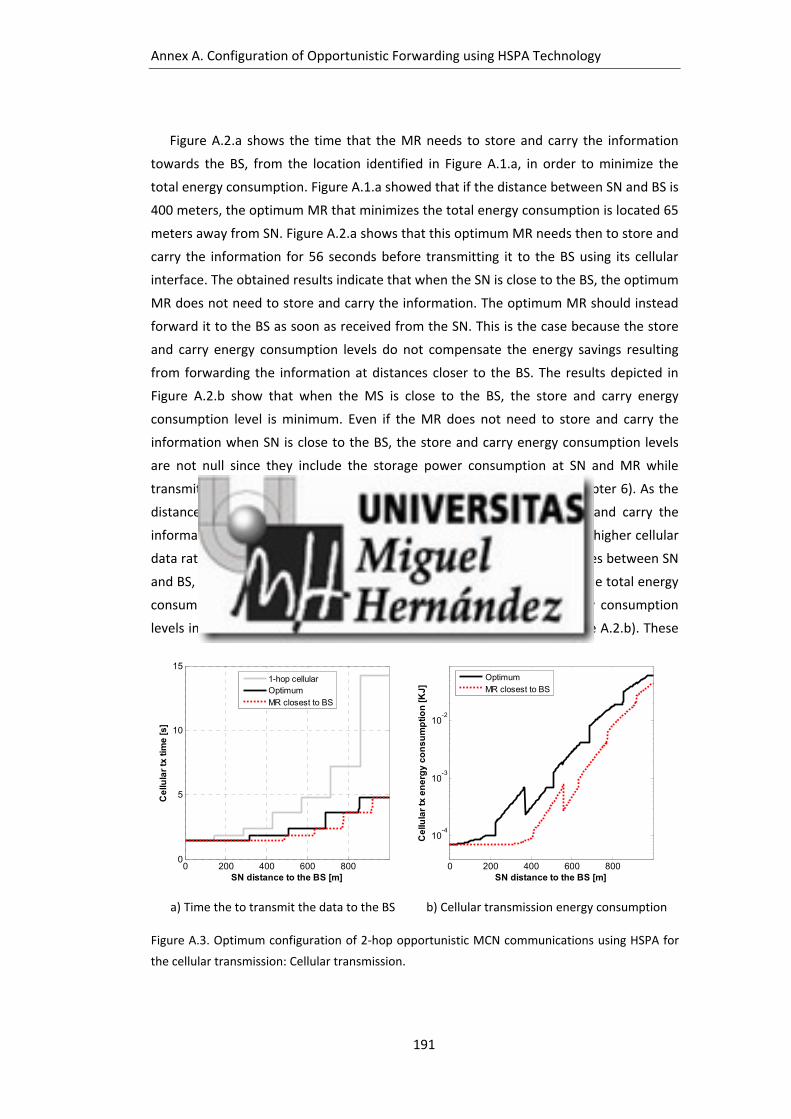
Annex A. Configuration of Opportunistic Forwarding using HSPA Technology
191
Figure A.2.a shows the time that the MR needs to store and carry the information
towards the BS, from the location identified in Figure A.1.a, in order to minimize the
total energy consumption. Figure A.1.a showed that if the distance between SN and BS is
400 meters, the optimum MR that minimizes the total energy consumption is located 65
meters away from SN. Figure A.2.a shows that this optimum MR needs then to store and
carry the information for 56 seconds before transmitting it to the BS using its cellular
interface. The obtained results indicate that when the SN is close to the BS, the optimum
MR does not need to store and carry the information. The optimum MR should instead
forward it to the BS as soon as received from the SN. This is the case because the store
and carry energy consumption levels do not compensate the energy savings resulting
from forwarding the information at distances closer to the BS. The results depicted in
Figure A.2.b show that when the MS is close to the BS, the store and carry energy
consumption level is minimum. Even if the MR does not need to store and carry the
information when SN is close to the BS, the store and carry energy consumption levels
are not null since they include the storage power consumption at SN and MR while
transmitting and receiving the information (PW and PR, in Figure 6‐3 –Chapter 6). As the
distance from SN to the BS increases, the optimum MR should store and carry the
information so that its cellular transmission starts closer to the BS where higher cellular
data rates are possible. However, Figure A.2.a shows that for high distances between SN
and BS, the time the MR stores and carries the information to minimize the total energy
consumption decreases. On the other hand, the store and carry energy consumption
levels increase with the distance between SN and BS (‘Optimum’ in Figure A.2.b). These
0 200 400 600 8000
5
10
15
SN distance to the BS [m]
Ce
llula
r tx
tim
e [
s]
1-hop cellularOptimum
MR closest to BS
0 200 400 600 800
10-4
10-3
10-2
SN distance to the BS [m]
Cel
lula
r tx
en
erg
y c
on
su
mp
tio
n [K
J]
Optimum
MR closest to BS
a) Time the to transmit the data to the BS b) Cellular transmission energy consumption
Figure A.3. Optimum configuration of 2‐hop opportunistic MCN communications using HSPA for
the cellular transmission: Cellular transmission.

Annex A. Configuration of Opportunistic Forwarding using HSPA Technology
192
two effects are due to the increase in the time needed to complete the D2D (Figure
A.3.a) and cellular transmissions (‘Optimum’ in Figure A.3.a). Figure A.3.a shows the
time the optimum MR needs to transmit the information to the BS using its cellular radio
interface, while Figure A.3.b reports the resulting cellular transmission energy
consumption levels. The results reported in Figure A.3.a demonstrate the capacity
benefits of opportunistic MCN communications with regards to traditional single‐hop
cellular communications (‘1‐hop cellular’). The capacity benefits are depicted in terms of
the reduction of the time needed to complete the cellular transmission.
The optimum configurations (i.e. MR location, time the MR should store and carry
the information, and location at which the MR should start forwarding the information
to the BS) illustrated in Figure A.1, Figure A.2 and Figure A.3, result in the total energy
consumption levels shown in Figure A.4 (‘Optimum’ in Figure A.4). Figure A.4 also shows
the total energy consumption level if the SN directly transmits the information to the BS
through traditional single‐hop cellular communications (‘1‐hop cellular’ in Figure A.4).
The obtained results show that when SN is very close to the BS, there are no energy
benefits from using opportunistic MCN communications compared to traditional single‐
hop cellular communications. However, as the distance increases, opportunistic MCN
communications can result in significant energy benefits compared to traditional single‐
hop cellular communications. For example, when the distance between SN and BS is 350
meters, opportunistic MCNs can reduce the energy consumption level by 50% compared
to traditional single‐hop cellular communications. This value increases to 90% at the
0 200 400 600 800
10-3
10-2
10-1
SN distance to the BS [m]
En
erg
y c
on
su
mp
tio
n [
KJ
]
1-hop cellular
OptimumMR closest to BS
Figure A.4. Total energy consumption (the schemes use HSPA for the cellular transmission).

Annex A. Configuration of Opportunistic Forwarding using HSPA Technology
193
cell edge. On average, an optimum configuration of MCN schemes using opportunistic
store, carry and forward can reduce energy consumption levels by over 85‐90%
compared to traditional single‐hop cellular communications (Figure A.4).
The benefits that can be achieved when combining MCNs and opportunistic store,
carry and forward schemes, depend on an adequate selection of the MR location and
the location at which the MR should start forwarding the information to the BS. To
demonstrate such dependency, Figure A.4 also reports the total energy consumption
levels with a scheme in which the SN selects the MR that provides the higher progress
towards the BS (‘MR closest to BS’ in Figure A.4) [144]. For a fair comparison, a similar
optimization process to that reported in Chapter 6 is conducted for this scheme, but
considering the new location of the MR (the closest to the BS). This configuration results
in that the MR is able to minimize the time needed to upload the information to the BS
(Figure A.3.a), and therefore the cellular transmission energy consumption (Figure
A.3.b). However, this is obtained at the expense of a significant increase in the total
energy consumption levels compared to an optimum configuration of opportunistic
MCN communications (Figure A.4). Figure A.4 also shows that selecting the MR as close
as possible to the BS can significantly increase the energy consumption levels when the
SN is close to the BS. This effect is due to the high energy consumption levels
experienced in the D2D transmission between SN and MR (Figure A.1.b), and the store
and carry process (Figure A.2.b). The obtained results demonstrate that an optimum
configuration of opportunistic MCN communications can reduce the energy
consumption by up to 97% compared to selecting the MR that provides a higher
progress towards BS.
The obtained results demonstrate that the benefits that opportunistic MCN
communications can achieve with respect to single‐hop cellular communications do not
depend on the selected cellular radio access technology. This annex uses HSPA for the
cellular link between the MR and the BS, while the study conducted in Chapter 6 used
LTE. Similar trends in the energy consumption for opportunistic MCN communications
are observed using both cellular radio access technologies. Considering all the scenarios
analyzed (different traffic characteristics, etc.), only small differences are appreciated in
the energy gains of opportunistic MCN communications with respect to single‐hop
cellular communications when using different radio access technologies. The energy
gains are slightly smaller when using HSPA. This is due to the higher LTE transmission
rates that benefit opportunistic MCN communications as the MR moves towards the BS
and forwards the information to the cellular network.

Annex A. Configuration of Opportunistic Forwarding using HSPA Technology
194
c. Context‐AwareOpportunisticForwardinginMCN
This section evaluates the performance of the AREA proposal (see Chapter 7) in the
scenario summarized by the parameters presented in Table A.1 and where cellular
transmissions use HSPA. The scenario considers the SN needs to upload to the BS a file
of size 10 Mb, and the time available to complete the transmission is set to 60 seconds.
The scenario considers that the MRs are in line with the SN, and moving towards the BS
with a speed of 2 m/s. The energy consumption of the proposed AREA context‐aware
opportunistic forwarding scheme is here compared against that obtained with
traditional single‐hop communications (‘1‐hop cellular’), the optimum configuration of
opportunistic forwarding (‘Optimum’), and 3 other reference schemes from the
literature. In the reference scheme ‘MR closest to BS’, the SN selects the MR that
provides a higher progress towards the BS [144]. On the other hand, the ‘MR closest to
SN’ reference scheme selects the MR that is closer to SN [158]. Once the MR is selected
(closest to the BS or SN), and for a fair comparison, a similar optimization process to that
reported in Chapter 6 is then conducted for both techniques, but considering only the
store and carry and the cellular transmission processes. This optimization process allows
determining the location at which the selected MR should forward the information
towards the BS in order to minimize the total energy consumption. Finally, the
performance of the context‐aware proposal is also compared to the ‘1‐hop Direct‐
contact’ [111]. In this scheme, the SN is mobile and can store, carry and forward the
information to the BS without using a mobile relay. In this case, and for a fair
comparison, the optimization process reported in Chapter 6 is used to define the
optimum location at which the moving SN should start forwarding the information to
the BS to minimize the energy consumption.
Table A.2 shows the average energy reduction that can be obtained with the
different schemes compared to traditional single‐hop cellular communications28. The
depicted results correspond to average values obtained for all possible distances
between SN and BS. Different tables are used for uniform and non‐uniform spatial
distributions of mobile devices within the cell. Results are shown for different spatial
densities of MRs (μ/R={0.1, 0.05} MRs/m) within a cell. In the case of a non‐uniform
distribution of users within the cell, higher densities are considered for the rings closer
28 The ‘MR closest to BS’ technique consumes more energy than single‐hop cellular
communications (negative values in Table A.2) due to the high energy being consumed during the
D2D transmission as a result of selecting the MR as close as possible to the BS.

Annex A. Configuration of Opportunistic Forwarding using HSPA Technology
195
to the BS without loss of generality29. The context‐aware AREA proposal requires
information about the density of users. When such information is provided per cell, the
proposal is referred to as AREA. When the information is provided per ring, the scheme
is referred to as AREA‐Ring. To provide the density information per ring, this study
considers that a cell is divided into seven rings; a cellular transmission mode (Table A.1)
is assigned to each ring.
The results depicted in Table A.2 show that the AREA proposal significantly reduces
the energy consumption compared to single‐hop cellular communications without
sacrificing the end‐user QoS (in this case, the transmission deadline). The reduction
ranges from 50 to 80%, and is obtained independently on whether the density
information is provided per cell or ring. The obtained results show that in terms of
energy reduction levels compared to single‐hop cellular communications, the AREA
proposal is only outperformed by the optimum configuration of opportunistic
forwarding (‘Optimum’). As previously mentioned, it is possible that an MR cannot be
found when needed at the identified optimum location. This reduces the feasibility to
apply the optimum configuration in practical settings. Table A.2 shows that under a
uniform distribution of users within the cell, there is not a significant performance
difference between the AREA and AREA‐Ring proposals. On the other hand, the AREA‐
Ring variant outperforms the AREA one when there is a non‐uniform distribution of
users within the cell. The context‐aware proposal looks for potential MRs in a search
area calculated using density information. When an MR cannot be found in the
identified search area, the SN directly communicates with the BS using traditional single‐
hop cellular communications. The AREA variant looks for potential MRs in a search area
calculated using density information per cell. When the distribution of users is non‐
uniform within a cell, the density information per cell can result in frequent incorrect
estimations of the MR search area compared to the case in which the density
information is provided per ring; the density information per ring can provide a better
indication of the non‐uniform distribution of users, and therefore better adjust the MR
search area. This trend is observed when analyzing the hit rate of the context‐aware
proposal (Table A.3), or percentage of transmissions conducted using two‐hop MCN
communications. Table A.3 shows that in the case of non‐uniform distribution of users
within the cell, the AREA variant significantly decreases the hit rate
29 For μ/R=0.1 MRs/m, the density (in MRs/m) in the seven rings is (values are shown from closer
to more distant to the BS): {0.4, 0.085, 0.071, 0.057, 0.043, 0.029, 0.014}. For μ/R=0.05 MRs/m,
these values are equal to: {0.2, 0.043, 0.036, 0.026, 0.021, 0.014, 0.007}.

Annex A. Configuration of Opportunistic Forwarding using HSPA Technology
196
as a result of an incorrect definition of the MR search area. The lower percentage of
two‐hop MCN connections established with the AREA variant increases the energy
consumption with respect to the AREA‐Ring variant for non‐uniform distributions (Table
A.2.b). On the other hand, the AREA‐Ring variant results in a better definition of the MR
search area, and therefore a higher hit rate. This is illustrated in Figure A.5 that shows
the hit rate as a function of the distance between SN and the BS30. Figure A.5.a shows
that for a uniform distribution of users within the cell, the AREA and AREA‐Ring variants
achieve similar hit rate levels independently of the location of the SN. In the case of non‐
uniform distributions within the cell (in this study, higher MR densities close to the BS),
the AREA variant underestimates the MR search area with increasing distances from SN
to the BS, which results in a decrease of the hit rate (Figure A.5.b). On the other hand,
the AREA‐Ring variant adapts the MR search area to the density of users in the ring
30 Similar trends are observed for δ=0.8 and μ/R=0.05 MRs/m.
Table A.2. Average energy reduction (in %) compared to single‐hop cellular communications. The
schemes use HSPA for the cellular transmission.
a) Uniform spatial distribution of MRs
Technique μ/R=0.1 MRs/m μ/R=0.05 MRs/m
δ=0.9 δ=0.8 δ=0.9 δ=0.8
AREA 78.9 74.6 77.8 75.2
AREA – Ring 82.5 77.8 82.8 77.5
MR closest to BS ‐104.2 ‐49.1
MR closest to SN 58.7 58.5
1‐hop Direct‐contact 65.4
Optimum 87.9
b) Non‐uniform spatial distribution of MRs
Technique μ/R=0.1 MRs/m μ/R=0.05 MRs/m
δ=0.9 δ=0.8 δ=0.9 δ=0.8
AREA 49.2 47.0 45.4 38.3
AREA – Ring 82.2 79.8 75.7 70.8
MR closest to BS ‐90.7 ‐45.4
MR closest to SN 62.8 62.7
1‐hop Direct‐contact 65.4
Optimum 87.9
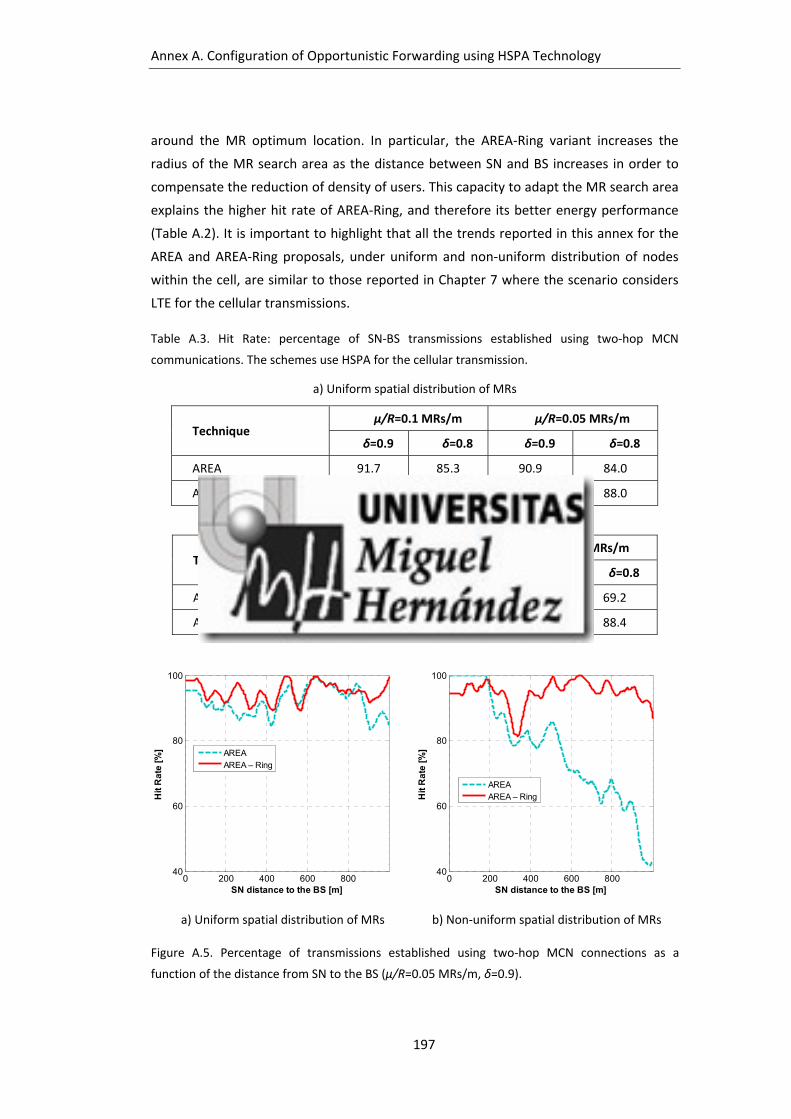
Annex A. Configuration of Opportunistic Forwarding using HSPA Technology
197
around the MR optimum location. In particular, the AREA‐Ring variant increases the
radius of the MR search area as the distance between SN and BS increases in order to
compensate the reduction of density of users. This capacity to adapt the MR search area
explains the higher hit rate of AREA‐Ring, and therefore its better energy performance
(Table A.2). It is important to highlight that all the trends reported in this annex for the
AREA and AREA‐Ring proposals, under uniform and non‐uniform distribution of nodes
within the cell, are similar to those reported in Chapter 7 where the scenario considers
LTE for the cellular transmissions.
Table A.3. Hit Rate: percentage of SN‐BS transmissions established using two‐hop MCN
communications. The schemes use HSPA for the cellular transmission.
a) Uniform spatial distribution of MRs
Technique μ/R=0.1 MRs/m μ/R=0.05 MRs/m
δ=0.9 δ=0.8 δ=0.9 δ=0.8
AREA 91.7 85.3 90.9 84.0
AREA – Ring 95.0 87.9 95.0 88.0
b) Non‐uniform spatial distribution of MRs
Technique μ/R=0.1 MRs/m μ/R=0.05 MRs/m
δ=0.9 δ=0.8 δ=0.9 δ=0.8
AREA 79.7 74.1 77.4 69.2
AREA – Ring 95.3 89.2 96.1 88.4
0 200 400 600 80040
60
80
100
SN distance to the BS [m]
Hit
Ra
te [
%]
AREA
AREA – Ring
0 200 400 600 80040
60
80
100
SN distance to the BS [m]
Hit
Ra
te [
%]
AREA
AREA – Ring
a) Uniform spatial distribution of MRs b) Non‐uniform spatial distribution of MRs
Figure A.5. Percentage of transmissions established using two‐hop MCN connections as a
function of the distance from SN to the BS (μ/R=0.05 MRs/m, δ=0.9).

199
AnnexB. ConfigurationofContext‐Aware
OpportunisticMCNunderWorst
CaseConditions
This annex evaluates for the two proposed context‐aware schemes (DELAY and
AREA) how to configure the opportunistic forwarding process under worst case
conditions. The two proposals are compared against the optimum configuration of
opportunistic forwarding (Section 6.4) and hence are evaluated in the scenario
presented in Section 6.4.1 that is characterized by the parameters summarized in Table
6‐1. The study here presented considers uniform and non‐uniform distributions of nodes
and different spatial densities of nodes (μ/R={0.1, 0.05} MRs/m) within the cell. In the
case of a non‐uniform distribution of nodes within the cell, this study considers a
standard deviation σ equal to 300 meters (this means that approximately 68% of the
nodes are located at distances closer to 300 meters to the BS with cell radius equal to
1000 meters).
a. ConfigurationofDELAY
The worst case scenario for DELAY in case of opportunistic transmissions is
experienced when SN needs to delay the D2D transmission for the full time t. In a real

Annex B. Configuration of Context‐Aware Opportunistic MCN under Worst Case
Conditions
200
operation, it might happen that SN does not need always to delay the D2D transmission
by t seconds if an MR arrives earlier to the optimum MR location. Section 7.2 showed
that the time t that guarantees with probability δ (set to 0.8 in this section) the arrival of
an MR at the identified optimum location depends on the spatial density and
distribution of nodes within the cell. Figure B.1 shows the time t the SN needs to delay
the D2D transmission waiting for an MR to arrive at the identified optimum MR location
in the worst case scenario31. t is depicted as a function of the distance between SN and
BS, and is computed following equations (7‐4) and (7‐10) for uniform and non‐uniform
distributions of nodes within the cell, respectively. Figure B.1.a shows, for example, that
when nodes are uniformly distributed within the cell, a SN located 400 meters away
from the BS needs to delay the D2D transmission by 16.1 seconds waiting for an MR to
arrive at the optimum MR location32. The results reported in Figure B.1 show that under
uniform distribution of nodes t is constant for any location of the SN within the cell, but
decreases as the spatial density of nodes within the cell increases (from 16.1 seconds to
8.05 seconds when the spatial density of MRs increases from 0.05 MRs/m –Figure B.1.a–
to 0.1 MRs/m –Figure B.1.b).
0 200 400 600 8000
20
40
60
80
SN distance to the BS [m]
D2
D tx
de
lay
[s
]
Uniform
Non-uniform
0 200 400 600 8000
20
40
60
80
SN distance to the BS [m]
D2
D tx
de
lay
[s
]
Uniform
Non-uniform
a) μ/R = 0.05 MRs/m b) μ/R = 0.1 MRs/m
Figure B.1. Delay time t in the D2D transmission to guarantee the arrival of at least one MR at the
identified optimum MR location with δ equal to 0.8.
31 The optimum MR location was reported in Chapter 6 (Section 6.4, Figure 6‐4.a) as a function of
the distance between SN and BS.
32 The optimum MR location was at a 50 meters distance away from the SN in the direction of the
BS according to Figure 6‐4.a.
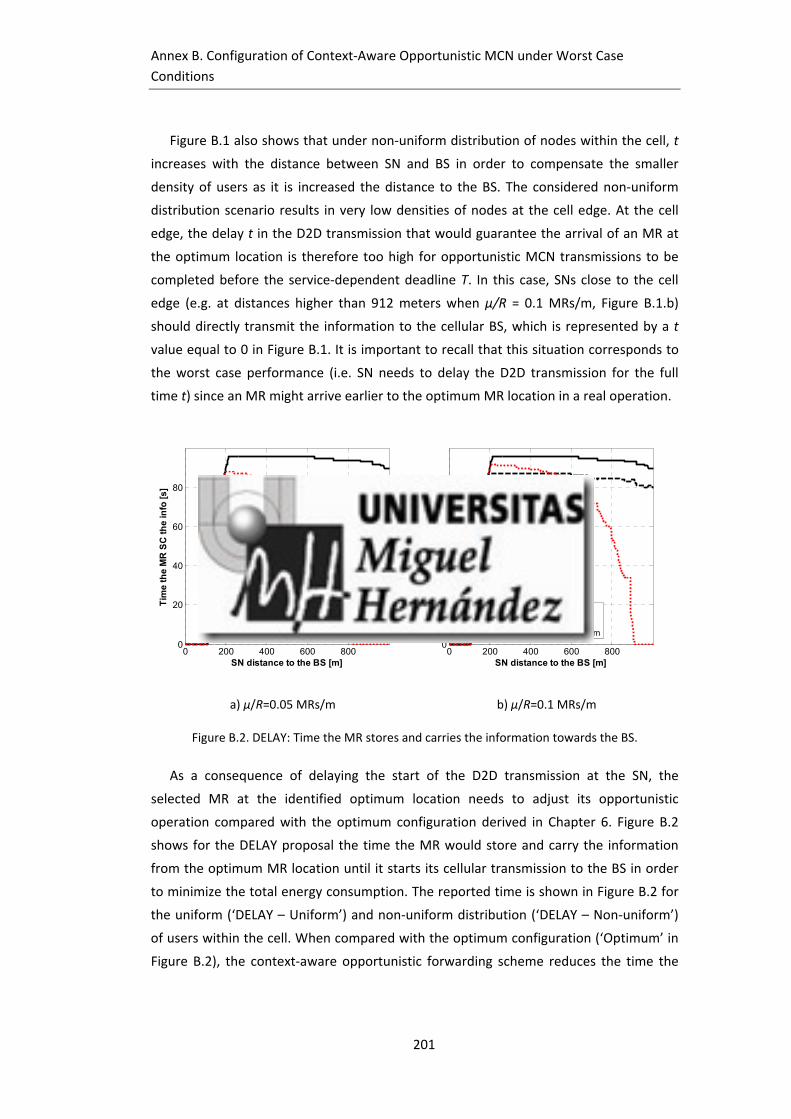
Annex B. Configuration of Context‐Aware Opportunistic MCN under Worst Case
Conditions
201
Figure B.1 also shows that under non‐uniform distribution of nodes within the cell, t
increases with the distance between SN and BS in order to compensate the smaller
density of users as it is increased the distance to the BS. The considered non‐uniform
distribution scenario results in very low densities of nodes at the cell edge. At the cell
edge, the delay t in the D2D transmission that would guarantee the arrival of an MR at
the optimum location is therefore too high for opportunistic MCN transmissions to be
completed before the service‐dependent deadline T. In this case, SNs close to the cell
edge (e.g. at distances higher than 912 meters when μ/R = 0.1 MRs/m, Figure B.1.b)
should directly transmit the information to the cellular BS, which is represented by a t
value equal to 0 in Figure B.1. It is important to recall that this situation corresponds to
the worst case performance (i.e. SN needs to delay the D2D transmission for the full
time t) since an MR might arrive earlier to the optimum MR location in a real operation.
0 200 400 600 8000
20
40
60
80
SN distance to the BS [m]
Tim
e t
he
MR
SC
th
e in
fo [s
]
OptimumDELAY – UniformDELAY – Non-uniform
0 200 400 600 8000
20
40
60
80
SN distance to the BS [m]
Tim
e t
he
MR
SC
th
e in
fo [s
]
Optimum
DELAY – UniformDELAY – Non-uniform
a) μ/R=0.05 MRs/m b) μ/R=0.1 MRs/m
Figure B.2. DELAY: Time the MR stores and carries the information towards the BS.
As a consequence of delaying the start of the D2D transmission at the SN, the
selected MR at the identified optimum location needs to adjust its opportunistic
operation compared with the optimum configuration derived in Chapter 6. Figure B.2
shows for the DELAY proposal the time the MR would store and carry the information
from the optimum MR location until it starts its cellular transmission to the BS in order
to minimize the total energy consumption. The reported time is shown in Figure B.2 for
the uniform (‘DELAY – Uniform’) and non‐uniform distribution (‘DELAY – Non‐uniform’)
of users within the cell. When compared with the optimum configuration (‘Optimum’ in
Figure B.2), the context‐aware opportunistic forwarding scheme reduces the time the
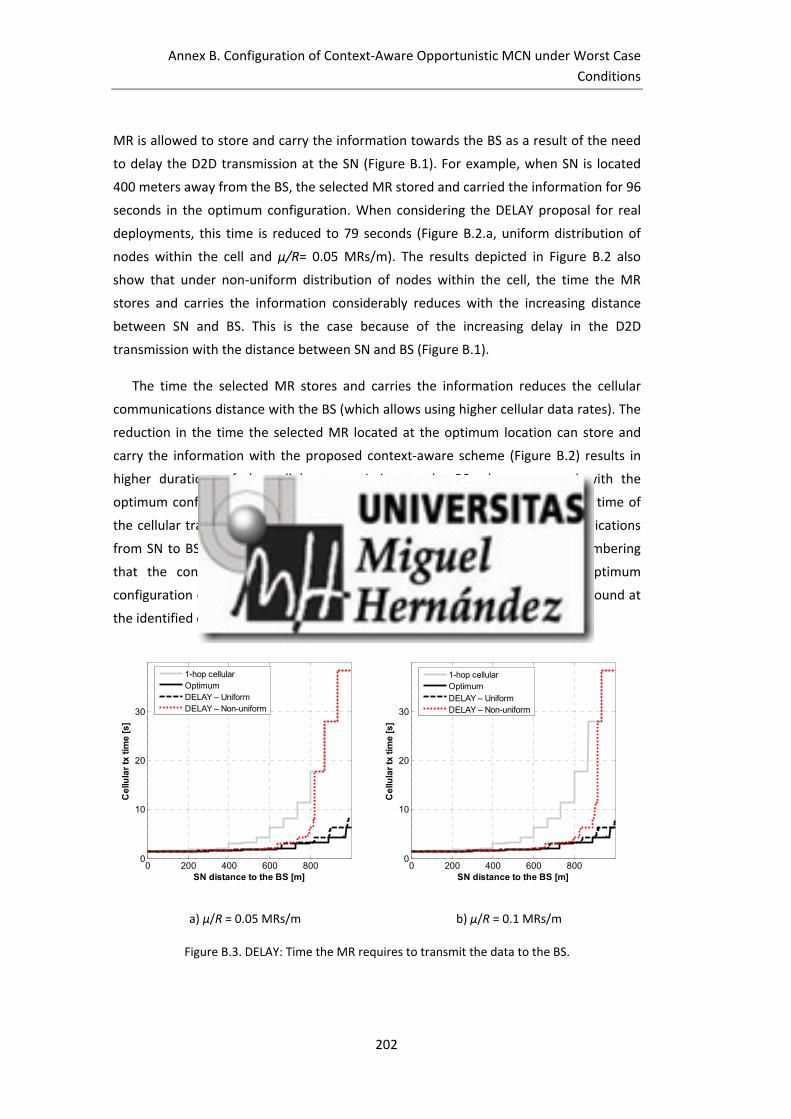
Annex B. Configuration of Context‐Aware Opportunistic MCN under Worst Case
Conditions
202
MR is allowed to store and carry the information towards the BS as a result of the need
to delay the D2D transmission at the SN (Figure B.1). For example, when SN is located
400 meters away from the BS, the selected MR stored and carried the information for 96
seconds in the optimum configuration. When considering the DELAY proposal for real
deployments, this time is reduced to 79 seconds (Figure B.2.a, uniform distribution of
nodes within the cell and μ/R= 0.05 MRs/m). The results depicted in Figure B.2 also
show that under non‐uniform distribution of nodes within the cell, the time the MR
stores and carries the information considerably reduces with the increasing distance
between SN and BS. This is the case because of the increasing delay in the D2D
transmission with the distance between SN and BS (Figure B.1).
The time the selected MR stores and carries the information reduces the cellular
communications distance with the BS (which allows using higher cellular data rates). The
reduction in the time the selected MR located at the optimum location can store and
carry the information with the proposed context‐aware scheme (Figure B.2) results in
higher durations of the cellular transmission to the BS when compared with the
optimum configuration (Figure B.3). However, the DELAY proposal reduces the time of
the cellular transmission compared with traditional single‐hop cellular communications
from SN to BS (‘1‐hop cellular’ in Figure B.3). In addition, it is important remembering
that the context‐aware proposal provides a solution to an unfeasible optimum
configuration of opportunistic MCN communications in the case no MR can be found at
the identified optimum location and requested time instant.
0 200 400 600 8000
10
20
30
SN distance to the BS [m]
Ce
llula
r tx
tim
e [s
]
1-hop cellularOptimumDELAY – UniformDELAY – Non-uniform
0 200 400 600 8000
10
20
30
SN distance to the BS [m]
Ce
llula
r tx
tim
e [s
]
1-hop cellularOptimum
DELAY – UniformDELAY – Non-uniform
a) μ/R = 0.05 MRs/m b) μ/R = 0.1 MRs/m
Figure B.3. DELAY: Time the MR requires to transmit the data to the BS.

Annex B. Configuration of Context‐Aware Opportunistic MCN under Worst Case
Conditions
203
b. ConfigurationofAREA
The AREA proposal experiences the worst case scenario when the MR is found at the
edge of the defined search area. The analysis conducted in Section 7.3 showed that the
radius around the optimum MR location that guarantees with probability δ (set to 0.8 in
this section) the presence of at least one MR within the search area depends on the
spatial density and distribution of nodes within the cell. Figure B.4 shows the radius (r)
around the optimum MR location33 to guarantee the presence of at least one MR within
the search area. r is depicted as a function of the distance between the SN and the BS
and is computed following equations (7‐12) and (7‐15) for uniform and non‐uniform
distributions of nodes within the cell, respectively. Figure B.4.a shows, for example, that
a SN located 400 meters away from the BS needs to search for potential MRs within a
search area of radius 16 meters around the optimum location of the MR34. The results
reported in Figure B.4 show that under uniform distribution of nodes, r is constant for
any location of the SN within the cell, but decreases as the spatial density of nodes
within the cell increases (from 16 meters to 8 meters when the spatial density of MRs
increases from 0.05 MRs/m –Figure B.4.a– to 0.1 MRs/m –Figure B.4.b). The obtained
results indicate that the worst‐case performance occurs when the MR is selected at the
edge of the search area closer to the BS (further away to the SN). This is the case
because of the higher impact of an increase of the communication distance on the D2D
transmission energy consumption compared with the cellular transmission energy
consumption.
Figure B.4 also shows that under non‐uniform distribution of nodes within the cell, r
increases with the distance between SN and BS in order to compensate the smaller
density of users as it is increased the distance to the BS. The considered non‐uniform
distribution scenario results in very low densities of nodes at the cell edge that hence
require too high radius around the optimum MR location to guarantee the presence of
an MR. It is important also remembering that the distance from the SN to the optimum
MR location increases with the distance between the SN and the BS in order to reduce
the distance at which the MR starts forwarding the information towards the BS (see
Chapter 6, Section 6.4, Figure 6‐4.a). As a consequence, when the SN is at the cell edge it
33 The optimum MR location was reported in Chapter 6 (Section 6.4, Figure 6‐4.a) as a function of
the distance between SN and BS.
34 The optimum MR location was at a 50 meters distance away from the SN in the direction of the
BS according to Figure 6‐4.a.

Annex B. Configuration of Context‐Aware Opportunistic MCN under Worst Case
Conditions
204
results unfeasible to complete the end‐to‐end opportunistic MCN transmissions before
the deadline T for all the possible locations of an MR within the search area. This can be
caused by the increase of the D2D transmission time (as the distance from the SN to the
MR increases with respect to the distance from the SN to the optimum MR location), by
the increase of the cellular transmission time (as it is increased the MR‐BS distance at
which the cellular transmission is conducted), or because the SN‐MR distance exceeds
the D2D transmission radio coverage limit. In these cases, the SN would directly transmit
the information to the cellular BS, which is represented by an r value equal to 0 in Figure
B.4.
0 200 400 600 8000
20
40
60
80
SN distance to the BS [m]
Ra
diu
s o
f th
e M
R s
ea
rch
are
a [
m]
UniformNon-uniform
0 200 400 600 8000
20
40
60
80
SN distance to the BS [m]
Ra
diu
s o
f th
e M
R s
ea
rch
are
a [
m]
UniformNon-uniform
a) μ/R=0.05 MRs/m b) μ/R=0.1 MRs/m
Figure B.4. Radius around the optimum MR location to guarantee the presence of at least one MR
within the search area with δ equal to 0.8.
As a consequence of varying the location at which the MR is selected, it is necessary
to adjust the opportunistic operation compared with the optimum configuration derived
in Chapter 6. Figure B.5 shows for the context‐aware AREA opportunistic forwarding
proposal the time the MR would store and carry the information from the identified
location within the search area until it starts its cellular transmission to the BS in order
to minimize the total energy consumption. The reported time is shown in Figure B.5 for
the uniform (‘AREA – Uniform’) and non‐uniform distribution (‘AREA – Non‐uniform’) of
users within the cell. Figure B.5 shows only slight differences between the optimum
configuration and the performance of the context‐aware opportunistic scheme in spite
of the fact the study considers the worst‐case scenario. This is the case because the
AREA proposal does not delay the start of the D2D transmission and therefore the small

Annex B. Configuration of Context‐Aware Opportunistic MCN under Worst Case
Conditions
205
differences are only due to the variation in the location of the selected MR within the
search area (which is different to the optimum MR location). The results depicted in
Figure B.5 also show that the time the MR stores and carries the information only
reduces when the SN is located at the cell edge and under non‐uniform distribution of
nodes within the cell. This is the case because of the increasing radius of the MR search
area with the distance between SN and BS (Figure B.4).
0 200 400 600 8000
20
40
60
80
SN distance to the BS [m]
Tim
e th
e M
R S
C t
he
info
[s
]
Optimum
AREA – UniformAREA – Non-uniform
0 200 400 600 8000
20
40
60
80
SN distance to the BS [m]
Tim
e t
he
MR
SC
th
e in
fo [s
]
OptimumAREA – UniformAREA – Non-uniform
a) μ/R =0.05 MRs/m b) μ/R = 0.1 MRs/m
Figure B.5. AREA: Time the MR stores and carries the info towards the BS.
0 200 400 600 8000
10
20
30
SN distance to the BS [m]
Ce
llula
r tx
tim
e [
s]
1-hop cellularOptimumAREA – UniformAREA – Non-uniform
0 200 400 600 8000
10
20
30
SN distance to the BS [m]
Ce
llula
r tx
tim
e [s
]
1-hop cellularOptimumAREA – UniformAREA – Non-uniform
a) μ/R = 0.05 MRs/m b) μ/R = 0.1 MRs/m
Figure B.6. AREA: Time the MR requires to transmit the data to the BS.

Annex B. Configuration of Context‐Aware Opportunistic MCN under Worst Case
Conditions
206
The small changes of the AREA proposal in the time the selected MR stores and
carries the information result also in minor variations in the duration of the cellular
transmission to the BS when compared with the optimum configuration (Figure B.6).
Actually, the differences are only appreciated when the SN is located at the cell edge
and under non‐uniform distribution of nodes within the cell; the transmissions at the
cell edge that could not be conducted through a two‐hop opportunistic MCN connection
require the same duration as the single‐hop cellular communications (‘1‐hop cellular in
Figure B.6’).
207
Bibliography
[1] A. Osseiran, V.Braun, H. Taoka, P. Marsch, H. Schotten, H. Tullberg, M. A. Uusitalo and
M. Schellman, "The Foundation of the Mobile and Wireless Communications System for
2020 and Beyond: Challenges, Enablers and Technology Solutions”, Proceedings of the
77th IEEE Vehicular Technology Conference (VTC‐Spring), pp. 1‐5, Dresden (Germany), 2‐
5 Jun. 2013. DOI: 10.1109/VTCSpring.2013.6692781.
[2] R. Baldemair, E. Dahlman, G. Fodor, G. Mildh, S. Parkvall, Y. Selen, H. Tullberg and K.
Balachandran, "Evolving Wireless Communications: Addressing the Challenges and
Expectations of the Future", IEEE Vehicular Technology Magazine, vol. 8, no. 1, pp. 24‐
30, Mar. 2013. DOI: 10.1109/MVT.2012.2234051.
[3] W. Roh, S. Ji‐Yun, J. Park, B. Lee, J. Lee, Y. Kim, J. Cho, K. Cheun and F. Aryanfar,
"Millimeter‐wave Beamforming as an Enabling Technology for 5G Cellular
Communications: Theoretical Feasibility and Prototype Results", IEEE Communications
Magazine, vol. 52, no. 2, pp. 106‐113, Feb. 2014. DOI: 10.1109/MCOM.2014.6736750.
[4] F. Boccardi, R.W. Heath, A. Lozano, T.L. Marzetta and P. Popovski, "Five Disruptive
Technology Directions for 5G", IEEE Communications Magazine, vol. 52, no. 2, pp. 74‐80,
Feb. 2014. DOI: 10.1109/MCOM.2014.6736746.
[5] T. Jamal and P. Mendes, "Cooperative Relaying in User‐centric Networking under
Interference Conditions", IEEE Communications Magazine, vol. 52, no. 12, pp. 18‐24,
Dec. 2014. DOI: 10.1109/MCOM.2014.6979947.
[6] S. Mumtaz, H. Lundqvist, K.M. Saidul‐Huq, J. Rodriguez and A. Radwan, “Smart Direct‐
LTE Communication: An Energy Saving Perspective”, Ad Hoc Networks, vol. 13, part B,
pp. 296‐311, Feb. 2014. DOI:10.1016/j.adhoc.2013.08.008.
[7] M.J. Yang, S.Y. Lim, H.J. Park and N.H. Park, "Solving the Data Overload: Device‐to‐device
Bearer Control Architecture for Cellular Data Offloading", IEEE Vehicular Technology
Magazine, vol. 8, no. 1, pp. 31‐39, Mar. 2013. DOI: 10.1109/MVT.2012.2234052.
[8] L. Keun‐Woo, J. Woo‐Sung and K. Young‐Bae, “Energy Efficient Quality‐of‐Service for
WLAN‐based D2D communications”, Ad Hoc Networks, vol. 25, part A, pp. 102‐116, Feb.
2015. DOI: 10.1016/j.adhoc.2014.10.004.

Bibliography
208
[9] 3GPP TR 22.803 V12.1.0. Technical Specification Group Services and System Aspects;
Feasibility study for Proximity Services (ProSe). Mar. 2013.
[10] Y. Lin and Y. Hsu, “Multihop Cellular: A New Architecture for Wireless Communications”,
Proceedings of the 19th IEEE Computer Communications Conference (INFOCOM), vol. 3,
pp. 1273‐1282, Tel Aviv (Israel), 26‐30 Mar. 2000,. DOI: 10.1109/INFCOM.2000.832516.
[11] D. Cavalcanti, D. Agrawal, C. Cordeiro, B. Xie and A. Kumar, "Issues in Integrating Cellular
networks WLANs, AND MANETs: a Futuristic Heterogeneous Wireless Network", IEEE
Wireless Communications Magazine, vol. 12, no. 3, pp. 30‐41, Jun. 2005. DOI:
10.1109/MWC.2005.1452852.
[12] Y. Yang, H. Honglin, X. Jing and M. Guoqiang, "Relay Technologies for WiMax and LTE‐
advanced Mobile Systems", IEEE Communications Magazine, vol. 47, no. 10, pp. 100‐105,
Oct. 2009. DOI: 10.1109/MCOM.2009.5273815.
[13] L. Pelusi, A. Passarella and M. Conti, "Opportunistic Networking: Data forwarding in
Disconnected Mobile Ad‐hoc Networks", IEEE Communications Magazine, vol. 44, no. 11,
pp. 134‐141, Nov. 2006. DOI: 10.1109/MCOM.2006.248176.
[14] A. Moraleda‐Soler, B. Coll‐Perales and J. Gozalvez, "Link‐aware Opportunistic D2D
communications: Open Source Test‐bed and Experimental Insights into their Energy,
Capacity and QoS Benefits", Proceedings of the 11th IEEE International Symposium on
Wireless Communications Systems (ISWCS), pp. 606‐610, Barcelona (Spain), 26‐29 Aug.
2014. DOI: 10.1109/ISWCS.2014.6933425.
[15] Cisco Visual Networking Index: Global Mobile Data Traffic Forecast Update, 2014–2019.
Cisco White Paper, Feb. 2015.
[16] H. Nourizadeh, S. Nourizadeh and R. Tafazolli, "Performance Evaluation of Cellular
Networks with Mobile and Fixed Relay Station", Proceedings of the 64th IEEE Vehicular
Technology Conference (VTC 2006‐Fall), pp. 1‐5, Montreal (Canada), Sept. 2006. DOI:
10.1109/VTCF.2006.501.
[17] R. Pabst, B.H. Walke, D.C. Schultz, P. Herhold, H. Yanikomeroglu, S. Mukherjee, H.
Viswanathan, M. Lott, W. Zirwas, M. Dohler, H. Aghvami, D.D. Falconer and G.P.
Fettweis, "Relay‐based Deployment Concepts for Wireless and Mobile Broadband
Radio", IEEE Communications Magazine, vol. 42, no. 9, pp. 80‐89, Sept. 2004. DOI:
10.1109/MCOM.2004.1336724.
[18] A. Radwan and H.S. Hassanein, "Does Multi‐hop Communication Extend the Battery Life
of Mobile Terminals?", Proceedings of the IEEE Global Telecommunications Conference
(GLOBECOM '06), pp. 1‐5, California (USA), 27 Nov.‐1 Dec. 2006. DOI:
10.1109/GLOCOM.2006.337.
[19] A. Catovic and S. Tekinay, "Power Efficiency of User Cooperation in Multihop Wireless
Networks", IEEE Communications Letters, vol. 9, no. 12, pp. 1034‐1036, Dec. 2005. DOI:
10.1109/LCOMM.2005.1576579.

Bibliography
209
[20] H. Holma and A. Toskala, “WCDMA for UMTS: HSPA Evolution and LTE”, John Wiley &
Sons, Ltd. Sept. 2007.
[21] Y. Sui, “On the Benefits of Moving Relay Nodes in Wireless Networks”, Thesis for the
Degreee of Engineering, Chalmers University of Technology, Gothenburg (Sweden), 2012.
[22] 3GPP TR 36.814 V9.0.0. Technical Specification Group Radio Access Network; Further
Advancements for E‐UTRA Physical Layer Aspects. Mar. 2010.
[23] IEEE P802.16j/D9. Draft Amendment to IEEE Standard for Local and Metropolitan Area
Networks Part 16: Air Interface for Fixed and Mobile Broadband Wireless Access
Systems: Multihop Relay Specification. Feb. 2009.
[24] T. Wirth, V. Venkatkumar, T. Haustein, E. Schulz and R. Halfmann, "LTE‐Advanced
Relaying for Outdoor Range Extension", Proceedings of the 70th IEEE Vehicular
Technology Conference (VTC 2009‐Fall), pp. 1‐4, Alaska (USA), Sept. 2009. DOI:
10.1109/VETECF.2009.5378969.
[25] G. Fettweis, J. Holfeld, V. Kotzsch, P. Marsch, E. Ohlmer, Z. Rong and P. Rost, "Field Trial
Results for LTE‐advanced Concepts", Proceedings of the IEEE International Conference
on Acoustics Speech and Signal Processing (ICASSP), pp. 5606‐5609, Texas (USA), Mar.
2010. DOI: 10.1109/ICASSP.2010.5495249.
[26] J.F. Monserrat, G. Mange, V. Braun, H. Tullberg, G. Zimmermann and Ö. Bulakci, “METIS
Research Advances Towards the 5G Mobile and Wireless System Definition”, EURASIP
Journal on Wireless Communications and Networking 2015, vol. 2015, no. 53, pp. 1‐16,
Mar. 2015. DOI: 10.1186/s13638‐015‐0302‐9.
[27] The METIS project’s Official Web Site: https://www.metis2020.com/. Last accessed on
Jan. 2015.
[28] The MOTO project’s Official Web Site: http://www.fp7‐moto.eu/. Last accessed on Jan.
2015.
[29] 3GPP TR 23.703 V2.0.0. Technical Specification Group Services and System Aspects;
Study on Architecture Enhancements to Support Proximity‐based Services (ProSe). Feb.
2014.
[30] 3GPP TS 23.303 V12.3.0. Technical Specification Group Services and System Aspects;
Proximity‐based services (ProSe). Dec. 2014.
[31] 3GPP TR 33.833 V1.2.0. Technical Specification Group Services and System Aspects;
Study on Security issues to support Proximity Services (ProSe). Nov. 2014.
[32] 3GPP TR 36.843 V12.0.1. Technical Specification Group Radio Access Network; Study on
LTE Device to Device Proximity Services. Mar. 2014.
[33] 3GPP TS 24.333 V12.1.0. Technical Specification Group Core Network and Terminals;
Proximity‐services (ProSe) Management Objects (MO). Dec. 2014.
[34] 3GPP TS 24.334. Technical Specification Group Core Network and Terminals; Proximity‐
services (ProSe) User Equipment (UE) to ProSe Function Protocol Aspects. Dec. 2012.
Bibliography
210
[35] F. Daquan, L. Lu, Y. Yuan‐Wu, G.Y. Li, F. Gang and L. Shaoqian Li, "Device‐to‐Device
Communications Underlaying Cellular Networks", IEEE Transactions on Communications,
vol. 61, no. 8, pp. 3541‐3551, Aug. 2013. DOI: 10.1109/TCOMM.2013.071013.120787.
[36] P. Janis, V. Koivunen, C. Ribeiro, J. Korhonen, K. Doppler and K. Hugl, K., "Interference‐
Aware Resource Allocation for Device‐to‐Device Radio Underlaying Cellular Networks",
Proceedings of the IEEE 69th Vehicular Technology Conference (VTC Spring 2009), pp.1‐5,
Barcelona (Spain), 26‐29 Apr. 2009. DOI: 10.1109/VETECS.2009.5073611.
[37] K. Doppler, M. Rinne, C. Wijting, C. Ribeiro, and K. Hugl, “Device‐to‐device
Communication as an Underlay to LTE‐Advanced Networks”, IEEE Communication
Magazine, vol. 47, no. 12, pp. 42–49, Dec. 2009. DOI: 10.1109/MCOM.2009.5350367.
[38] Y. Pei and Y.C. Liang, “Resource Allocation for Device‐to‐Device Communication
Overlaying Two‐way Cellular Networks”, IEEE Transactions on Wireless Communications,
vol. 12, no. 7, pp. 3611–3621, Jul. 2013. DOI: 10.1109/TWC.2013.061713.121956.
[39] Deutsche Telekom AG, Orange Silicon Valley, Qualcomm Technologies Inc., Tagged Inc.
and Samsung Electronics. LTE Direct Workshop White Paper. May 2013.
[40] Qualcomm Research White Paper. LTE Direct: The Case for Device‐to‐Device Proximate
Discovery. Feb. 2013.
[41] Qualcomm Tech. LTE‐Direct project’s Official Web Site: https://ltedirect.qualcomm.com/
and https://www.qualcomm.com/invention/research/projects/lte‐direct. Last accessed
on Jan. 2015.
[42] W. Xinzhou, S. Tavildar, S. Shakkottai, T. Richardson, L. Junyi, R. Laroia and A. Jovicic,
"FlashLinQ: A Synchronous Distributed Scheduler for Peer‐to‐Peer Ad Hoc Networks",
IEEE/ACM Transactions on Networking, vol. 21, no. 4, pp. 1215‐1228, Aug. 2013. DOI:
10.1109/TNET.2013.2264633.
[43] S. Dimatteo, P. Hui, B. Han and V.O.K Li, "Cellular Traffic Offloading through WiFi
Networks", Proceedings of the IEEE International Conference on Mobile Ad hoc and
Sensor Systems (MASS), pp. 192‐201, Valencia (Spain), 17‐22 Oct. 2011. DOI:
10.1109/MASS.2011.26.
[44] J. Kim, N.O. Song, B.H. Jung, H. Leem and D.K. Sung, "Placement of WiFi Access Points for
Efficient WiFi Offloading in an Overlay Network", Proceedings of the 24th IEEE
International Symposium on Personal Indoor and Mobile Radio Communications
(PIMRC), pp. 3066‐3070, London (UK), 8‐11 Sept. 2013. DOI:
10.1109/PIMRC.2013.6666673.
[45] B. H. Walke, S. Mangold and L. Berlemann. IEEE 802 Wireless Systems: Protocols, Multi‐
hop Mesh/Relaying, Performance and Spectrum Coexistence. Chapter 5: IEEE 802.11
Wireless Local Area Networks. John Wiley and Sons, Ltd. Mar. 2008.

Bibliography
211
[46] S. Basagni, M. Conti, S. Giordano and I. Stojmenovic. Mobile Ad Hoc Networking. Chapter
3: IEEE 802.11 in Ad Hoc Networks: Protocols, Performance and Open Issues. John Wiley
and Sons, Ltd. Sept. 2004.
[47] IEEE 802.11 Standard for Information Technology. Part 11: Wireless LAN Medium Access
Control (MAC) and Physical Layer (PHY) Specifications. Dec. 2013.
[48] IEEE 802.11n Standard for Information Technology. Part 11: Wireless LAN Medium
Access Control (MAC) and Physical Layer (PHY). Specifications Amendment 5:
Enhancements for Higher Throughput. Oct. 2009.
[49] IEEE 802.11s Standard for Information Technology. Part 11: Wireless LAN Medium
Access Control (MAC) and Physical Layer (PHY). Specifications Amendment 10: Mesh
Networking. Feb. 2011.
[50] D. Camps‐Mur, A. Garcia‐Saavedra and P. Serrano, "Device‐to‐device communications
with Wi‐Fi Direct: overview and experimentation", IEEE Wireless Communications, vol.
20, no. 3, pp. 96‐104, Jun. 2013. DOI: 10.1109/MWC.2013.6549288.
[51] IEEE 802.11ac Standard for Information Technology. Part 11: Wireless LAN Medium
Access Control (MAC) and Physical Layer (PHY). Specifications Amendment 4:
Enhancements for Very High Throughput for Operation in Bands below 6GHz. Dec. 2013.
[52] IEEE 802.11ad Standard for Information Technology. Part 11: Wireless LAN Medium
Access Control (MAC) and Physical Layer (PHY). Specifications Amendment 3:
Enhancements for Very High Throughput in the 60GHz band. Mar. 2014.
[53] IEEE 802.11af Standard for Information Technology. Part 11: Wireless LAN Medium
Access Control (MAC) and Physical Layer (PHY). Specifications Amendment 5: Television
White Spaces (TVWS) Operation. Mar. 2014.
[54] IEEE 802.11ah/D2.0 Draft Standard for Information Technology. Part 11: Wireless LAN
Medium Access Control (MAC) and Physical Layer (PHY) Specifications: Amendment –
Sub 1 GHz License‐Exempt Operation. Jun. 2014.
[55] K.R. Jacobson and W.A. Krzymien, “Cell Dimensioning and Network Throughput in
Cellular Multi‐hop Relay Networks“, Proceedings of the 64th IEEE Vehicular Technology
Conference (VTC‐Fall), pp. 1‐5, Montreal (Canada), 25‐28 Sept. 2006. DOI:
10.1109/VTCF.2006.497.
[56] ETSI.TR 101 146 v3.0.0, “UMTS 30.06, Support for relaying ODMA“, December 1997.
[57] M. Hossain and A. Mammela, "Effect of User Density and Traffic Volume on Uplink
Capacity of Multihop Cellular Network", Proceedings of the 5th IEEE International
Conference on Wireless and Mobile Communications (ICWMC), pp. 49‐53, Cannes
(France), 23‐29 Aug. 2009. DOI: 10.1109/ICWMC.2009.79.
[58] M.C. Lucas‐Estañ, J. Gozalvez and B. Coll‐Perales, “Mode Selection for Mobile
Opportunistic Multi‐hop Cellular Networks", Proceedings of the 79th IEEE Vehicular
Technology Conference (VTC2014‐Spring), pp. 1‐5, Seoul (Korea), 18‐21 May 2014.
Bibliography
212
[59] A. Osseiran, K. Doppler, C. Ribeiro, M. Xiao, M. Skoglund and J. Manssour, "Advances in
Device‐to‐Device Communications and Network Coding for IMT‐Advanced", Proceedings
of the ICT Mobile and Wireless Communications Summit (ICT‐Mobile Summit), pp. 1‐8,
Santander (Spain), 10‐12 Jun. 2009.
[60] R. Sisodia, B. Manoj and C. Murthy, “A Preferred Link Based Routing Protocol for Ad Hoc
Wireless Networks”, Journal of Communications and Networks, vol. 4, no. 1, pp. 14‐21,
Mar. 2002. DOI: 10.1109/JCN.2002.6596928.
[61] S. Itaya, J. Hasegawa, P. Davis, N. Kadowaki and S. Obana, “Achieving Stable Operation of
Ad Hoc Wireless Networks with Neighbor Pre‐selection and Synchronous Route
Updates”, Proceedings of the 30th IEEE Local Computer Networks Conference (LCN), pp.
702‐708, Sydney (Australia), 15‐17 Nov. 2005. DOI: 10.1109/LCN.2005.23.
[62] C. Cramer and T. Fuhrmann, “Proximity Neighbor Selection for a DHT in Wireless Multi‐
hop Networks”, Proceedings of the 5th IEEE Peer‐to‐Peer Computing Conference (P2P),
pp. 3‐10, Konstanz (Germany), 31 Aug.‐2 Sept. 2005. DOI: 10.1109/P2P.2005.28.
[63] B. Coll‐Perales and J. Gozalvez, "Neighbor Selection Techniques for Multi‐hop Wireless
Mesh Networks", Proceedings of the 9th IEEE International Workshop on Wireless Local
Networks (WLN), pp. 1020‐1026, Zürich (Switzerland), 20‐23 Oct. 2009. DOI:
10.1109/LCN.2009.5355024.
[64] B. Coll‐Perales and J. Gozalvez, "Energy Efficient Routing Protocols for Multi‐hop Cellular
Networks", Proceedings of the 20th IEEE Personal, Indoor and Mobile Radio
Communications Symposium (PIMRC), pp. 1457‐1461, Tokyo (Japan), 13‐16 Sept. 2009.
DOI: 10.1109/PIMRC.2009.5450170.
[65] C. Perkins and E. Royer, “Ad hoc On‐Demand Distance Vector Routing”, Proceedings of
the 2nd IEEE Workshop on Mobile Computing Systems and Applications (WMCSA), pp.
90‐100, Louisiana (USA), 25‐26 Feb. 1999. DOI: 10.1109/MCSA.1999.749281.
[66] B. Coll‐Perales and J. Gozalvez, “Contextual optimization of location‐based routing
protocols for multi‐hop cellular networks using mobile relays”, Springer
Telecommunication Systems, in press, 2015. DOI: 10.1007/s11235‐015‐0036‐3.
[67] 3G TR 25.924 V1.0.0. Technical Specification Group Radio Access Network; Opportunity
Driven Multiple Access. Dec. 1999.
[68] C. Shin‐Ming and L. Phone, "Power‐efficient Routing Mechanism for ODMA Systems",
IEEE Transactions on Vehicular Technology, vol. 55, no. 4, pp. 1311‐1319, Jul. 2006. DOI:
10.1109/TVT.2006.877457.
[69] IWICS White Paper. ODMA Opportunity Driven Multiple Access. Available online at:
http://www.iwics.com/. Last accessed on Dec. 2014.
[70] A. Papadogiannis, M. Farber, A. Saadani, M.D. Nisar, P. Weitkemper, T.M. de Moraes, J.
Gora, N. Cassiau, D. Ktenas, J. Vihriala, M. Khanfouci and T. Svensson, "Pass It on:
Advanced Relaying Concepts and Challenges for Networks Beyond 4G", IEEE Vehicular
Bibliography
213
Technology Magazine, vol. 9, no. 2, pp. 29‐37, Jun. 2014. DOI:
10.1109/MVT.2014.2312268.
[71] Samsung’ source, “Future 3GPP Radio Technologies for IMT‐Advanced”, 3GPP IMT‐
Advanced Workshop, Agenda item 3, REV‐080037, Shenzhen (China), 7‐8 Apr. 2008.
[72] L. Xingqin, J. Andrews, A. Ghosh and R. Ratasuk, "An Overview of 3GPP Device‐to‐Device
Proximity Services", IEEE Communications Magazine, vol. 52, no. 4, pp. 40‐48, Apr. 2014.
DOI: 10.1109/MCOM.2014.6807945.
[73] J.G. Andrews, S. Buzzi, C. Wan Choi, S.V. Hanly, A. Lozano, A.C.K. Soong and J.C. Zhang,
"What Will 5G Be?", IEEE Journal on Selected Areas in Communications, vol. 32, no. 6,
pp. 1065‐1082, Jun. 2014. DOI: 10.1109/JSAC.2014.2328098.
[74] Ericsson White Paper. 5G Radio Access: Research and Vision. Jun. 2013.
[75] DOCOMO 5G White Paper. 5G Radio Access: Requirements, Concept and Technologies.
Jul. 2014.
[76] NetWorld2020 White Paper. 5G: Challenges, Research Priorities, and Recommendations.
Aug. 2014.
[77] H.C. Woon, F. Zhong and R. Haines, "Emerging Technologies and Research Challenges for
5G Wireless Networks", IEEE Wireless Communications, vol. 21, no. 2, pp. 106‐112, Apr.
2014. DOI: 10.1109/MWC.2014.6812298.
[78] T. Korakis, M. Knox, E. Erkip and S. Panwar, “Cooperative Network Implementation Using
Open‐Source Platforms”, IEEE Communication Magazine, vol. 47, no. 2, pp. 134‐141, Feb.
2009. DOI: 10.1109/MCOM.2009.4785391.
[79] P. Liu, T. Zhifeng, S. Narayanan, T. Korakis and S.S. Panwar, “CoopMAC: A Cooperative
MAC for Wireless LANs”, IEEE Journal on Selected Areas in Communications, vol. 25, no.
2, pp. 340–354, Feb. 2007. DOI: 10.1109/JSAC.2007.070210.
[80] A. Sharma, M. Tiwari and H. Zheng, "MadMAC: Building a Reconfiguration Radio Testbed
using Commodity 802.11 Hardware", Proceedings of the 1st IEEE Workshop on
Networking Technologies for Software Defined Radio Networks (SDR '06), pp. 78‐83,
Reston (USA), 25 Sept. 2006. DOI: 10.1109/SDR.2006.4286329.
[81] C. Cheng, P. Hsiao, H.T Kung and D. Vlah, "Adjacent Channel Interference in Dual‐radio
802.11a Nodes and Its Impact on Multi‐hop Networking", Proceedings of the IEEE Global
Telecommunications Conference (GLOBECOM '06), pp. 1‐6, San Francisco (USA), Nov. 27‐
Dec. 1 2006. DOI: 10.1109/GLOCOM.2006.500.
[82] A. Sharma, V. Navda, R. Ramjee, V.N, Padmanabhan and E. M. Belding, “Cool‐Tether:
Energy Efficient On‐the‐fly WiFi Hot‐spots using Mobile Phones”, Proceedings of the 5th
ACM Conference on emerging Networking EXperiments and Technologies (CoNEXT), pp.
109‐120, Rome (Italy), 1‐4 Dec. 2009. DOI: 10.1145/1658939.1658952.
[83] Y. Hong, L. Shen and B. Xu, "Experimental System for Integration of Ad‐Hoc and Cellular
Network", Proceedings of the 5th IEEE International Conference on Wireless

Bibliography
214
Communications, Networking and Mobile Computing (WiCom '09), pp. 1‐4, Beijing
(China), 24‐26 Sept. 2009. DOI: 10.1109/WICOM.2009.5301998.
[84] Anite’s Official Web Site: http://www.anite.com. Last accessed on Jan. 2015.
[85] Wireshark’s Official Web Site: https://www.wireshark.org/. Last accessed on Jan. 2015.
[86] Kismet’s Official Web Site: https://www.kismetwireless.net/. Last accessed on Jan. 2015.
[87] P. Mahasukhon, M. Hempel, C. Song and H. Sharif, "Comparison of Throughput
Performance for the IEEE 802.11a and 802.11g Networks", Proceedings of the 21st IEEE
International Conference on Advanced Information Networking and Applications (AINA),
pp. 792‐799, Niagara Falls (Canada), 21‐23 May 2007. DOI: 10.1109/AINA.2007.46.
[88] S. Mohan, R. Kapoor and B. Mohanty, "Enhanced HSDPA Mobility Performance: Quality
and Robustness for Voice over HSPA Service", Proceedings of the 71st IEEE Vehicular
Technology Conference (VTC 2010‐Spring), pp. 1‐5, Taipei (China), 16‐19 May 2010. DOI:
10.1109/VETECS.2010.5493710.
[89] K. Pedersen, A. Toskala and P. Mogensen, "Mobility Management and Capacity Analysis
for High Speed Downlink Packet Access in WCDMA", Proceedings of the 60th IEEE
Vehicular Technology Conference (VTC2004‐Fall), pp. 3388‐3392, Los Angeles (USA), 26‐
29 Sept. 2004. DOI: DOI: 10.1109/VETECF.2004.1404692.
[90] L. Seunghyun, K. Daeeun, K. Younglak, K. Moonhong, K. Myungchan, S. Sungho, H.
Seongho and I. Jongtae, "Optimization of the HSDPA Network in the Cell‐Overlaid Area",
Proceedings of the 10th IEEE International Conference on Communication Systems (ICCS),
pp. 1‐5, Singapore, 30 Oct.‐2 Nov. 2006. DOI: 10.1109/ICCS.2006.301546.
[91] C. Sunghyun, E.W. Jang and J.M. Cioffi, "Handover in Multihop Cellular Networks", IEEE
Communications Magazine, vol. 47, no. 7, pp. 64‐73, Jul. 2009. DOI:
10.1109/MCOM.2009.5183474.
[92] K. Ronny, J. Inuk, Y. Xiangying and C. Chao‐Chin, "Advanced Handover Schemes in IMT‐
Advanced Systems [WiMAX/LTE Update]", IEEE Communications Magazine, vol. 48, no.
8, pp. 78‐85, Aug. 2010. DOI: 10.1109/MCOM.2010.5534590.
[93] M. Ghassemian, V. Friderikos and H. Aghvami, "Hybrid Handover in Multihop Radio
Access Networks", Proceedings of the 61st IEEE Vehicular Technology Conference (VTC
2005‐Spring), pp. 22007‐2211, Stockholm (Sweden), 30 May‐1 Jun. 2005. DOI:
10.1109/VETECS.2005.1543726.
[94] H. Nourizadeh, S. Nourizadeh and R. Tafazolli, "Impact of the Inter‐Relay Handoff on the
Relaying System Performance", Proceedings of the 64th IEEE Vehicular Technology
Conference (VTC‐2006 Fall), pp. 1‐5, Montreal (Canada), Sept. 2006. DOI:
10.1109/VTCF.2006.521.
[95] Y.W. Blankenship, "Achieving High Capacity with Small Cells in LTE‐A," Proceedings of the
50th IEEE Annual Allerton Conference on Communication, Control, and Computing

Bibliography
215
(Allerton), pp. 1680‐1687, pp. 1‐5, Monticello (USA), 1‐5 Oct. 2012. DOI:
10.1109/Allerton.2012.6483424.
[96] H. Lei, X.F. Wang and P.H.J. Chong, "Opportunistic Relay Selection in Future Green
Multihop Cellular Networks", Proceedings of the 72nd IEEE Vehicular Technology
Conference (VTC 2010‐Fall), pp. 1‐5, Ottawa (Canada), 6‐9 Sept. 2010. DOI:
10.1109/VETECF.2010.5594387.
[97] Microsoft Mobile’s Official Store Site: http://store.ovi.com/. Last accessed on Jan. 2015.
[98] R. Ananthapadmanabha, B.S. Manoj and C.S.R. Murthy, "Multi‐hop Cellular Networks:
the Architecture and Routing Protocols", Proceedings of the 12th IEEE International
Symposium on Personal, Indoor and Mobile Radio Communications (PIMRC), pp. 78‐82,
San Diego (USA), 29 Sept.‐1 Oct. 2001. DOI: 10.1109/PIMRC.2001.965324.
[99] P. Kolios, V. Friderikos and K. Papadaki, "Future Wireless Mobile Networks", IEEE
Vehicular Technology Magazine, vol. 6, no. 1, pp. 24‐30, Mar. 2011. DOI:
10.1109/MVT.2010.939905.
[100] Q. Ayub, S. Rashid, M.S. Mohd‐Zahid and A.H. Abdullah, “Contact Quality Based
Forwarding Strategy for Delay Tolerant Network”, Journal of Network and Computer
Applications, vol. 39, no. 3, pp. 302‐309, Mar. 2014. DOI: 10.1016/j.jnca.2013.07.011.
[101] iPerf’s Web Site: http://iperf.sourceforge.net/. Last accessed on Jan. 2015.
[102] D. Krishnaswamy, “Game Theoretic Formulations for Network‐Assisted Resource
Management in Wireless Networks”, Proceedings of the 56th IEEE Vehicular Technology
Conference (VTC 2002‐Fall), pp. 1312‐1316, Vancouver (Canada), 24‐28 Sept. 2002. DOI:
10.1109/VETECF.2002.1040428.
[103] C. Moler. Numerical Computing with Matlab. Ed. SIAM, pp. 155‐182, 2004.
[104] TradersPlace, “Moving Averages in Technical Analysis”, WhitePaper. Available online at:
http://www.tradersplace.in/moving_averages.html. Last accessed on Jan. 2015.
[105] D. Xia, J. Hart and Q. Fu, “Evaluation of the Minstrel Rate Adaptation Algorithm in IEEE
802.11g WLANs”, Proceedings of the IEEE International Conference on Communications
(ICC), pp. 2223‐2228, Budapest (Hungary), 9‐13 Jun. 2013. DOI:
10.1109/ICC.2013.6654858.
[106] S. Mare, D. Kotz and A. Kumar “Experimental Validation of Analytical Performance
Models for IEEE 802.11 networks”, Proceedings of the 2nd IEEE International Conference
on Communication Systems and Networks (COMSNETS), pp. 1‐8, Liverpool (UK), 5‐9 Jan.
2010. DOI: 10.1109/COMSNETS.2010.5431957.
[107] F. Capulli, C. Monti, M. Vari and F. Mazzenga, “Path Loss Models for IEEE 802.11a
Wireless Local Area Networks”, Proceedings of the 3rd IEEE International Symposium on
Wireless Communication Systems (ISWCS’06), pp. 621‐624, Valencia (Spain), 6‐8 Sept.
2006. DOI: 10.1109/ISWCS.2006.4362375.
[108] T. Rappaport. Wireless communications: principles and practices. Prentice Hall, 2001.

Bibliography
216
[109] C. Aydogdu and E. Karasan, "An Analysis of IEEE 802.11 DCF and Its Application to
Energy‐Efficient Relaying in Multihop Wireless Networks", IEEE Transactions on Mobile
Computing, vol. 10, no. 10, pp. 1361‐1373, Oct. 2011. DOI: 10.1109/TMC.2010.239.
[110] A. Duda, "Understanding the Performance of 802.11 Networks", Proceedings of the 19th
IEEE International Symposium on Personal, Indoor and Mobile Radio Communications
(PIMRC), pp. 1‐6, Cannes (France), 15‐18 Sept. 2008. DOI:
10.1109/PIMRC.2008.4699942.
[111] A. Chaintreau, P. Hui, J. Crowcroft, C. Diot, R. Gass and J. Scott, "Impact of Human
Mobility on Opportunistic Forwarding Algorithms", IEEE Transactions on Mobile
Computing, vol. 6, no. 6, pp. 606‐620, Jun. 2007. DOI: 10.1109/TMC.2007.1060.
[112] Z. Ruifeng, J.M. Gorce and K. Jaffres‐Runser, "Low Bound of Energy‐Latency Trade‐Off of
Opportunistic Routing in Multi‐hop Networks", Proceedings of the IEEE International
Conference on Communications (ICC), pp. 1‐6, Dresden (Germany), 14‐18 Jun. 2009. DOI:
10.1109/ICC.2009.5199148.
[113] W. Moreira and P. Mendes, “Impact of Human Behavior on Social Opportunistic
Forwarding”, Ad Hoc Networks, vol. 25, part B, pp. 293‐302, Feb. 2015. DOI:
10.1016/j.adhoc.2014.07.001.
[114] L. Yong, J. Yurong, J. Depeng, S. Li, Z. Lieguang and D.O. Wu, "Energy‐Efficient Optimal
Opportunistic Forwarding for Delay‐Tolerant Networks", IEEE Transactions on Vehicular
Technology, vol. 59, no. 9, pp. 4500‐4512, Nov. 2010. DOI: 10.1109/TVT.2010.2070521.
[115] T. Kimura, T. Matsuda and T. Takine, "Probabilistic Store‐Carry‐Forward Message
Delivery Based on Node Density Estimation", Proceedings of the 11th IEEE Consumer
Communications and Networking Conference (CCNC), pp.432‐437, Las Vegas (USA), 10‐
13 Jan. 2014. DOI: 10.1109/CCNC.2014.6866606.
[116] M.J. Williams, R.M. Whitaker and S.M. Allen, “Decentralised Detection of Periodic
Encounter Communities in Opportunistic Networks”, Ad Hoc Networks, vol. 10, no. 8, pp.
1544‐1556, Nov. 2012. DOI: http://dx.doi.org/10.1016/j.adhoc.2011.07.008.
[117] J. Gebert, and R. Fuchs, "Probabilities for Opportunistic Networking in Different
Scenarios", Proceedings of the IEEE Future Network & Mobile Summit (FutureNetw), pp.
1‐8, Berlin (Germany), 4‐6 Jul. 2012.
[118] G. Luo, J. Zhang, H. Huang, K. Qin, and H. Sun, “Exploiting Intercontact Time for Routing
in Delay Tolerant Networks”, Transactions on Emerging Telecommunications
Technologies, vol. 24, no. 6, pp. 589‐599, Oct. 2013. DOI: 10.1002/ett.2553.
[119] Z. Huan Zhou, C. Jiming, Z. Hongyang, G. Wei Gao and C. Peng, "On Exploiting Contact
Patterns for Data Forwarding in Duty‐Cycle Opportunistic Mobile Networks", IEEE
Transactions on Vehicular Technology, vol. 62, no. 9, pp. 4629‐4642, Nov. 2013, DOI:
10.1109/TVT.2013.2267236.

Bibliography
217
[120] N. Nomikos, D. Vouyioukas, T. Charalambous, I. Krikidis, P. Makris, D.N. Skoutas, M.
Johansson and C. Skianis, “Joint relay‐pair selection for buffer‐aided successive
opportunistic relaying”, Transactions on Emerging Telecommunications Technologies,
vol. 25, no. 8, pp. 823–834, Aug. 2014. DOI: 10.1002/ett.2718.
[121] N. Zlatanov, R. Schober and P. Popovski, "Buffer‐Aided Relaying with Adaptive Link
Selection", IEEE Journal on Selected Areas in Communications, vol. 31, no. 8, pp. 1530‐
1542, Aug. 2013. DOI: 10.1109/JSAC.2013.130816.
[122] W. Rui, V.K.N. Lau and H. Huang, "Opportunistic Buffered Decode‐Wait‐and‐Forward
(OBDWF) Protocol for Mobile Wireless Relay Networks", IEEE Transactions on Wireless
Communications, vol. 10, no. 4, pp. 1224‐1231, Apr. 2011. DOI:
10.1109/TWC.2011.020111.100466.
[123] B. Zhao and V. Friderikos, "Optimal stopping for energy efficiency with delay constraints
in Cognitive Radio networks", Proceedings of the IEEE Personal Indoor and Mobile Radio
Communications (PIMRC), pp. 820‐825, Sydney (Australia), 9‐12 Sept. 2012. DOI:
10.1109/PIMRC.2012.6362897.
[124] Ustream’s Official Web Site: http://www.ustream.tv/. Last accessed on Jan. 2015.
[125] Bambuser’s Official Web Site: http://bambuser.com/. Last accessed on Jan. 2015.
[126] Livestream’s Official Web Site: http://new.livestream.com/. Last accessed on Jan. 2015.
[127] P. Ameigeiras, J.J. Ramos‐Muñoz, J. Navarro‐Ortiz, and J.M. López‐Soler, “Analysis and
modelling of YouTube traffic”, Transactions on Emerging Telecommunications
Technologies, vol. 23, no. 4, pp. 360‐377, Jun. 2012. DOI: 10.1002/ett.2546.
[128] P. Kolios, V. Friderikos and K. Papadaki, “Energy‐Aware Mobile Video Transmission
Utilizing Mobility”, IEEE Network, vol. 27, no. 2, pp. 34‐40, Mar. 2013. DOI:
10.1109/MNET.2013.6485094.
[129] A. Finamore, M. Mellia, M.M. Munafò, R. Torres and S.G. Rao, “YouTube Everywhere:
Impact of Device and Infrastructure Synergies on User Experience”, Proceedings of the
ACM SIGCOMM conference on Internet Measurement Conference (IMC’11), pp. 345‐360,
Berlin (Germany), 2‐4 Nov. 2011. DOI: 10.1145/2068816.2068849.
[130] J.I. Moreno‐Novella and F.J. Gonzalez‐Castaño. Resource Management in Satellite
Networks. Chapter 3: QoS Requirements for Multimedia Services. Ed. Springer, 2007.
[131] Facebook, Ericsson and Qualcomm WhitePaper, “A focus on Efficiency”, Sept. 2013.
[132] Line’s Official Web Site: http://line.me/en/. Last accessed on Jan. 2015.
[133] Viber’s Official Web Site: http://www.viber.com/en/. Last accessed on Jan. 2015.
[134] Heytell’s Official Web Site: http://www.heytell.com. Last accessed on Jan. 2015.
[135] B. Bing, "A fast and Secure Framework for Over‐the‐Air Wireless Software Download
using Reconfigurable Mobile Devices", IEEE Communications Magazine, vol. 44, no. 6,
pp. 58‐63, Jun. 2006. DOI: 10.1109/MCOM.2006.1668420.

Bibliography
218
[136] C. Troncoso, G. Danezis, E. Kosta, J. Balasch and B. Preneel, "PriPAYD: Privacy‐Friendly
Pay‐As‐You‐Drive Insurance", IEEE Transactions on Dependable and Secure Computing,
vol. 8, no. 5, pp. 742‐755, Sept.‐Oct. 2011. DOI: 10.1109/TDSC.2010.71.
[137] WINNER consortium, “D1.1.2 V.1.1. WINNER II channel models”, WINNER European
Research project Public Deliverable, Nov. 2007.
[138] P. Bertrand, J. Jiang and A. Ekpenyong, "Link Adaptation Control in LTE Uplink",
Proceedings of the 72th IEEE Vehicular Technology Conference (VTC 2012‐Fall), pp. 1‐5,
Quebec (Canada), 3‐6 Sept. 2012. DOI: 10.1109/VTCFall.2012.6399063.
[139] F.D. Calabrese, C. Rosa, M. Anas, P.H. Michaelsen, K.I. Pedersen and P.E. Mogensen,
"Adaptive Transmission Bandwidth Based Packet Scheduling for LTE Uplink", Proceedings
of the 68th IEEE Vehicular Technology Conference (VTC 2008‐Fall), pp. 1‐5, Calgary
(Canada), 21‐24 Sept. 2008. DOI: 10.1109/VETECF.2008.316.
[140] 3GPP TR 28.814. Technical Specification Group Radio Access Network; Physical Layer
Aspects for Evolved UTRA. Sept. 2006.
[141] 3GPP TS 36.213. Technical Specification Group Radio Access Network; Physical layer
procedures for Evolved UTRA. Sept. 2013.
[142] M. Greenberg, “How Much Power Will a Low‐Power SDRAM Save you?”, White Paper
Denali Software, 2009.
[143] A. Carroll and G. Heiser, “An analysis of power consumption in a smartphone”,
Proceedings of the USENIXATC, pp. 21‐25, Boston, USA, 23‐25 Jun. 2010.
[144] B. Karp and H Kung, “Greedy Perimeter Stateless Routing for Wireless Networks”,
Proceedings of the 6th ACM/IEEE Annual International Conference on Mobile Computing
and Networking (MobiCom), pp. 243‐254, Boston (USA), 6‐11 Aug. 2000. DOI:
10.1145/345910.345953.
[145] X. Cheng, J. Liu and C. Dale, “Understanding the Characteristics of Internet Short Video
Sharing: A YouTube‐Based Measurement Study”, IEEE Transactions on Multimedia, vol.
1, no. 5, pp. 1184‐1194, Aug. 2013. DOI: 10.1109/TMM.2013.2265531.
[146] H. Zhang, P. Hong and K. Xue, “Mobile‐Based Relay Selection Schemes for Multi‐hop
Cellular Networks”, KICS/IEEE Journal of Communications and Networks, vol. 15, no. 1,
pp. 45‐53, Feb. 2013. DOI: 10.1109/JCN.2013.000009.
[147] B. Lorenzo and S. Glisic, "Context‐Aware Nanoscale Modeling of Multicast Multihop
Cellular Networks", IEEE/ACM Transactions on Networking, vol. 21, no. 2, pp. 359‐372,
Apr. 2013. DOI: 10.1109/TNET.2012.2199129.ç
[148] L.M. Correia and R. Tafazolli, “A Strategy for Innovation in Future Networks in Europe”,
Net!works ETP: SRA v10, 10th ed. Strategy Research Agenda, Deliverable 1.4, Jul. 2012.
[149] H. A. Nguyen and S. Giordano, “Context Information Prediction for Social‐based Routing
in Opportunistic Networks”, Ad Hoc Networks, vol. 10, no. 8, pp. 1557‐1569, Nov. 2012.
DOI: http://dx.doi.org/10.1016/j.adhoc.2011.05.007.
Bibliography
219
[150] E. Bastug, M. Bennis and M. Debbah, "Living on the Edge: The role of Proactive Caching
in 5G Wireless Networks", IEEE Communications Magazine, vol. 52, no. 8, pp. 82‐89, Aug.
2014. DOI: 10.1109/MCOM.2014.6871674.
[151] Lungaro, P.; Segall, Z.; Zander, J., "Predictive and Context‐Aware Multimedia Content
Delivery for Future Cellular Networks," Proceedings of the 71st IEEE Vehicular
Technology Conference (VTC 2010‐Spring), pp. 1‐5, Taipei (Taiwan), 16‐19 May 2010.
DOI: 10.1109/VETECS.2010.5493664.
[152] W. Xiaofei. C. Min, T. Kwon, L. Jin and V. Leung, "Mobile Traffic Offloading by Exploiting
Social Network Services and Leveraging Opportunistic Device‐to‐Device Sharing", IEEE
Wireless Communications, vol. 21, no. 3, pp. 28‐36, Jun. 2014. DOI:
10.1109/MWC.2014.6845046.
[153] H. Bo, H. Pan, V.S.A. Kumar, M.V. Marathe, S. Jianhua and A. Srinivasan, "Mobile Data
Offloading through Opportunistic Communications and Social Participation", IEEE
Transactions on Mobile Computing, vol. 11, no. 5, pp. 821‐834, May 2012. DOI:
10.1109/TMC.2011.101.
[154] D.C. Montgomery and G.C. Runger. Applied Statistics and Probability for Engineers. John
Wiley and Sons, 2011.
[155] J. Tengviel, K.A. Dotche and K. Diawuo, “The Impact of Mobile Nodes Arrival Patterns in
MANETS Using Poisson Models”, International Journal of Managing Information
Technology, vol. 4, no. 3, pp. 55‐71, Aug. 2012. DOI : 10.5121/ijmit.2012.4305.
[156] M. Elalem and L. Zhao, "Realistic User Distribution and its Impact on Capacity and
Coverage for a WCDMA Mobile Network", Proceedings of the IEEE SARNOFF, pp. 1‐5,
New Jersey (USA), Mar. 30‐Apr. 1 2009. DOI: 10.1109/SARNOF.2009.4850342.
[157] C. Bettstetter, “Topology Properties of Ad hoc Networks with Random Waypoint
Mobility”, ACM SIGMOBILE Mobile Computing and Communications Review, vol. 7, no. 3,
pp. 50‐52, Jul. 2003. DOI: 10.1145/961268.961287.
[158] I. Stojmenovic and X. Lin, “Power‐Aware Localized Routing in Wireless Networks”, IEEE
Transaction on Parallel Distributed Systems, vol. 12, no. 11, pp. 1122‐1133, Nov. 2001.
DOI: 10.1109/71.969123.
[159] R. Schoenen and B.H. Walke, "On PHY and MAC Performance of 3G‐LTE in a Multi‐hop
Cellular Environment", Proceedings of the IEEE International Conference on Wireless
Communications, Networking and Mobile Computing (WiCom), pp. 926‐929, Shangai
(China), 21‐25 Sept. 2007. DOI: 10.1109/WICOM.2007.238.
[160] Ubuntu for Devices’s Official Web Site: https://developer.ubuntu.com/en/. Last
accessed on Jan. 2015.