prof ncube impact of unwinding ump on exchange rates … ncube_impact of unwinding ump... · impact...
TRANSCRIPT
Impact of Unwinding UMP on Exchange Rates and Capital
Flows in AfricaFlows in AfricaProf Mthuli Ncube
University of Oxford
Blavatnik
Symposium of the Association of Central Banks (August, 2016
Impact of Unwinding UMP on Exchange Rates and Capital
Flows in AfricaFlows in AfricaProf Mthuli Ncube
University of Oxford
Blavatnik School
Central Banks (AACB), Abuja, Nigeria, 18-19 August, 2016

Types of Unconventional Monetary Policy Channels of Transmission• In response to the financial crisis of 2008, and need to combat an
economic recession, Central Banks in US, UK, Japan, and ECB, launched programs in ‘Unconventional Monetary Policy”, or Quantitative Easing(QE)
• Ref: Hausken and Ncube(2013) QE and Its impact in US, Japan, UK and Europe, SpringerEurope, Springer
• UMP Programs are meant to lower longreduce the cost of capital and eventually boost domestic demand and investment, employment, and inflation.
• However, the UMP programs vary in transmission channels: signaling channel; portfolio rebalancing channel; market liquidity channel; confidence channel
• The channels of transmission are not mutually exclusive
Types of Unconventional Monetary Policy Channels of Transmission
In response to the financial crisis of 2008, and need to combat an economic recession, Central Banks in US, UK, Japan, and ECB, launched programs in ‘Unconventional Monetary Policy”, or Quantitative
and Ncube(2013) QE and Its impact in US, Japan, UK and
UMP Programs are meant to lower long-term interest rates, and thus reduce the cost of capital and eventually boost domestic demand and investment, employment, and inflation.
However, the UMP programs vary in transmission channels: signaling channel; portfolio rebalancing channel; market liquidity channel;
The channels of transmission are not mutually exclusive

Signaling Channel
• Works via a Bond purchase program of longthat provides information about the future path longterm interest rates and commitment to lower interest rates in the future: Signaling channel
• The Federal Reserse (FED) bond purchase program ($85 • The Federal Reserse (FED) bond purchase program ($85 billion monthly)
• If FED raised interest rates in future then it would realize huge loses…commitment mechanism to lower rates
• Ncube and Hausken (2013) show that UMP in US lowered interest rates, and impacted employment and growth positively
Works via a Bond purchase program of long-term assets that provides information about the future path long-term interest rates and commitment to lower interest rates in the future: Signaling channel
(FED) bond purchase program ($85 (FED) bond purchase program ($85
If FED raised interest rates in future then it would realize huge loses…commitment mechanism to lower
(2013) show that UMP in US lowered interest rates, and impacted employment and

Portfolio rebalancing channel
• Works through the portfolio rebalancing, by purchasing assets held by private sector and therefore altering relative supply and their pricing(yields).Investors then rebalance their portfolios by purchasing other assets with similar yields and therefore pushing up prices and thus similar yields and therefore pushing up prices and thus lowering yields.
• The Bank of England UMP program in 2008, and postBREXIT in 2016
• Hausken and Ncube(2013) show that this approach also lowers long term interest rates and boosts growth.
Portfolio rebalancing channel
orks through the portfolio rebalancing, by purchasing rivate sector and therefore altering
relative supply and their pricing(yields).Investors then rebalance their portfolios by purchasing other assets with similar yields and therefore pushing up prices and thus similar yields and therefore pushing up prices and thus
The Bank of England UMP program in 2008, and post-
and Ncube(2013) show that this approach also lowers long term interest rates and boosts growth.

Liquidity Channel
• Central Bank increases liquidity in the hands of investors by purchasing long-term securities and issuing bank reserves. This then lowers the premium for illiquidity, increases prices and lowers yields.
• Mainly applies to Japan
• Not working well in boosting economic growth
Central Bank increases liquidity in the hands of investors term securities and issuing bank
reserves. This then lowers the premium for illiquidity, increases prices and lowers yields.
Not working well in boosting economic growth

Bank Lending and Confidence Channel
• Apart from the asset price channels, UMP also boosts bank lending and confidence
• It boost bank liquidity and gets then to finance new loans
Bank Lending and Confidence
Apart from the asset price channels, UMP also boosts bank
It boost bank liquidity and gets then to finance new loans
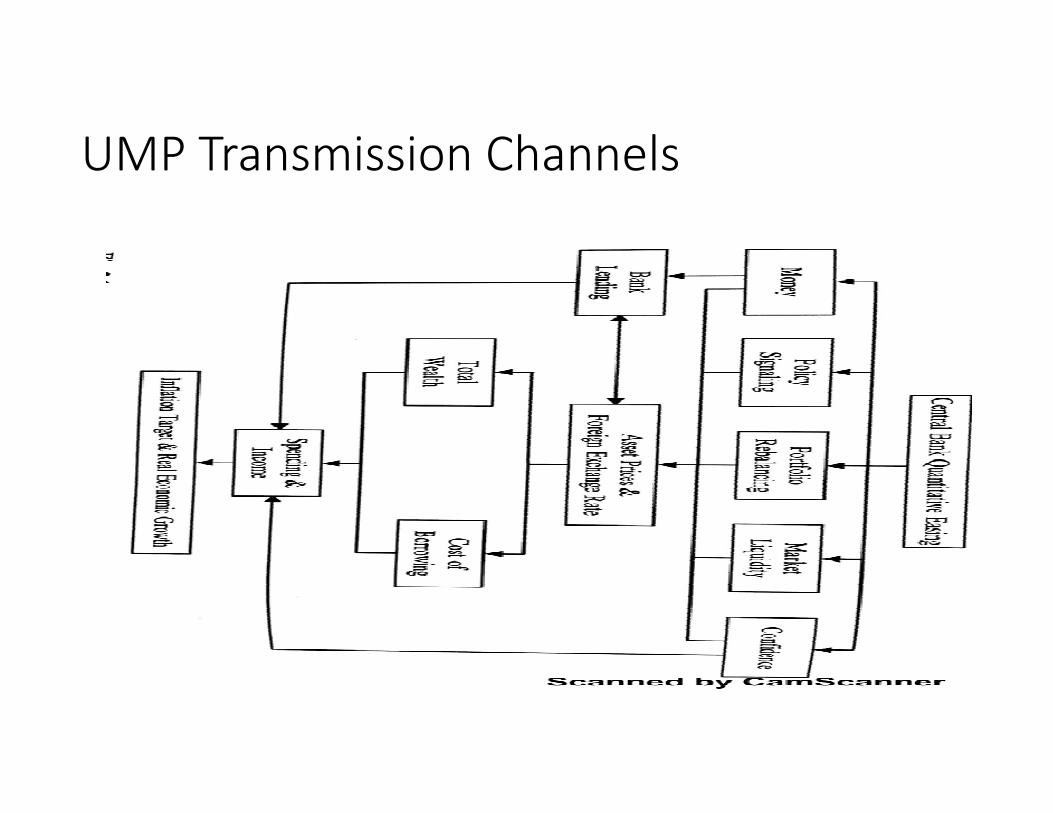
UMP Transmission ChannelsUMP Transmission Channels
Effect of ending UMP on Exchange Rates in Africa…Inflation and Interest Rates Differential Channels
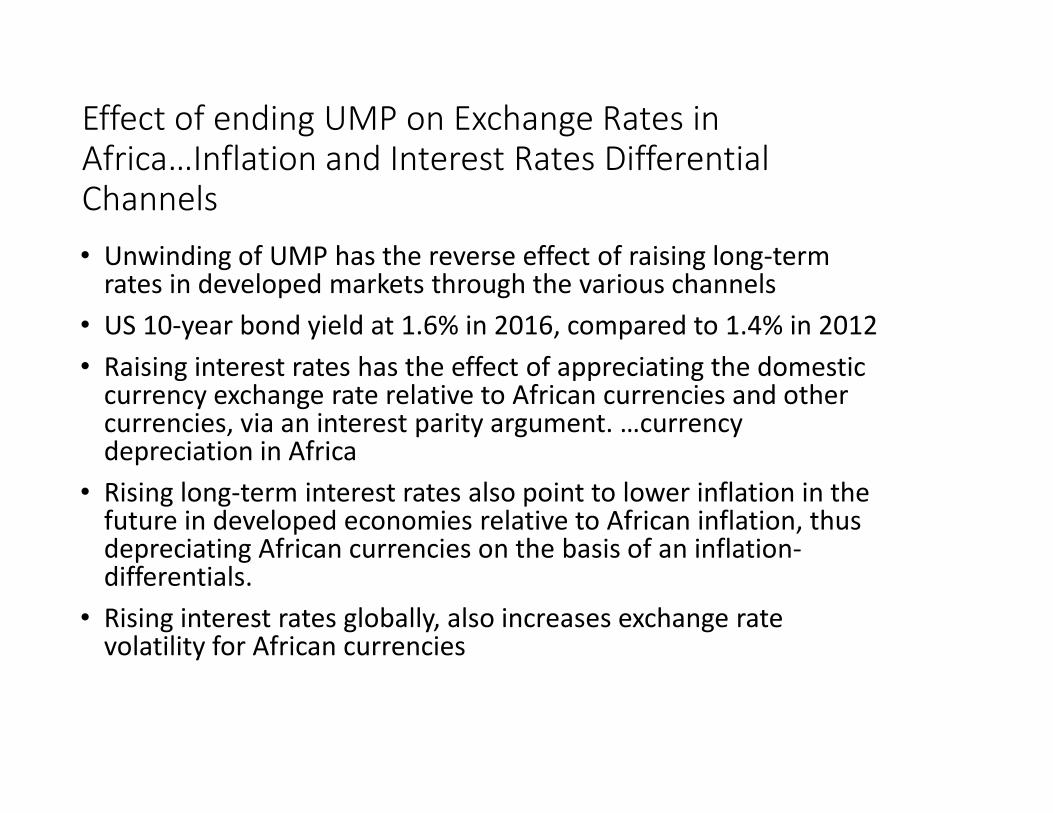
• Unwinding of UMP has the reverse effect of raising longrates in developed markets through the various channels
• US 10-year bond yield at 1.6% in 2016, compared to 1.4% in 2012
• Raising interest rates has the effect of appreciating the domestic currency exchange rate relative to African currencies and other currencies, via an interest parity argument. …currency currency exchange rate relative to African currencies and other currencies, via an interest parity argument. …currency depreciation in Africa
• Rising long-term interest rates also point to lower inflation in the future in developed economies relative to African inflation, thus depreciating African currencies on the basis of an inflationdifferentials.
• Rising interest rates globally, also increases exchange rate volatility for African currencies
Effect of ending UMP on Exchange Rates in Africa…Inflation and Interest Rates Differential
Unwinding of UMP has the reverse effect of raising long-term rates in developed markets through the various channels
year bond yield at 1.6% in 2016, compared to 1.4% in 2012
Raising interest rates has the effect of appreciating the domestic currency exchange rate relative to African currencies and other currencies, via an interest parity argument. …currency currency exchange rate relative to African currencies and other currencies, via an interest parity argument. …currency
term interest rates also point to lower inflation in the future in developed economies relative to African inflation, thus depreciating African currencies on the basis of an inflation-
Rising interest rates globally, also increases exchange rate
Effect of UMP on Exchange Rates in Africa…via Gold Prices
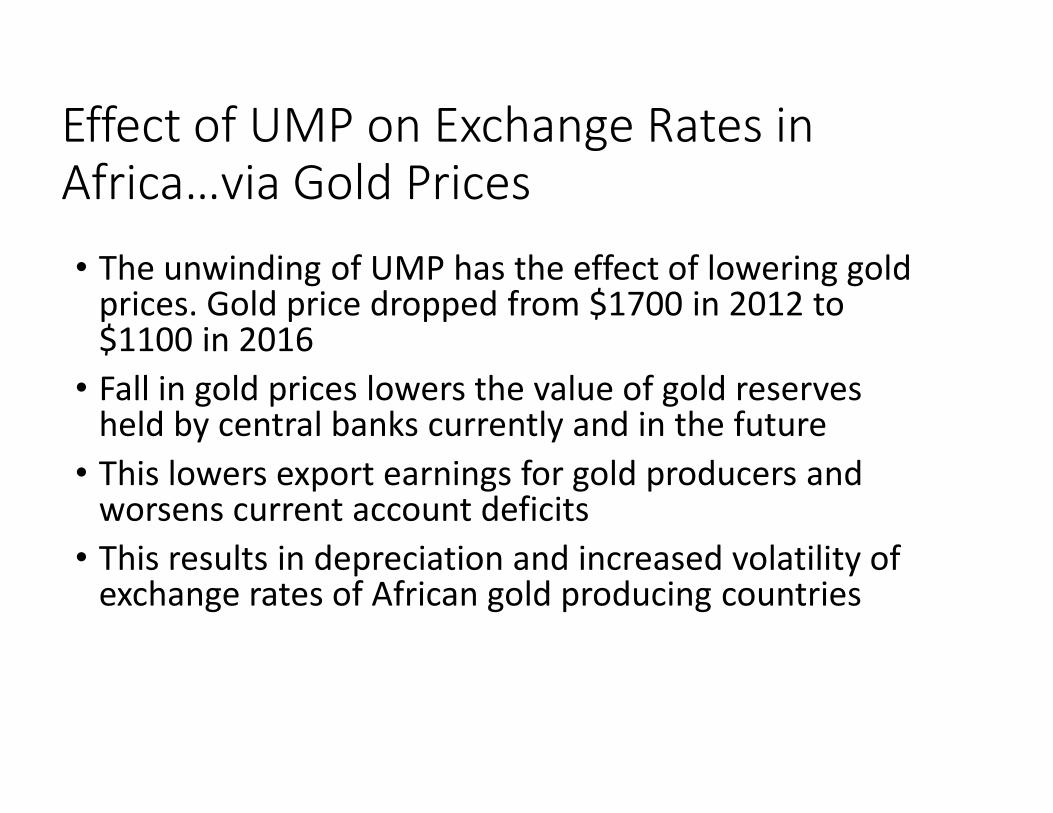
• The unwinding of UMP has the effect of lowering gold prices. Gold price dropped from $1700 in 2012 to $1100 in 2016
• Fall in gold prices lowers the value of gold reserves held by central banks currently and in the future• Fall in gold prices lowers the value of gold reserves
held by central banks currently and in the future
• This lowers export earnings for gold producers and worsens current account deficits
• This results in depreciation and increased volatility of exchange rates of African gold producing countries
Effect of UMP on Exchange Rates in Africa…via Gold Prices
The unwinding of UMP has the effect of lowering gold prices. Gold price dropped from $1700 in 2012 to
Fall in gold prices lowers the value of gold reserves held by central banks currently and in the futureFall in gold prices lowers the value of gold reserves held by central banks currently and in the future
This lowers export earnings for gold producers and worsens current account deficits
This results in depreciation and increased volatility of exchange rates of African gold producing countries
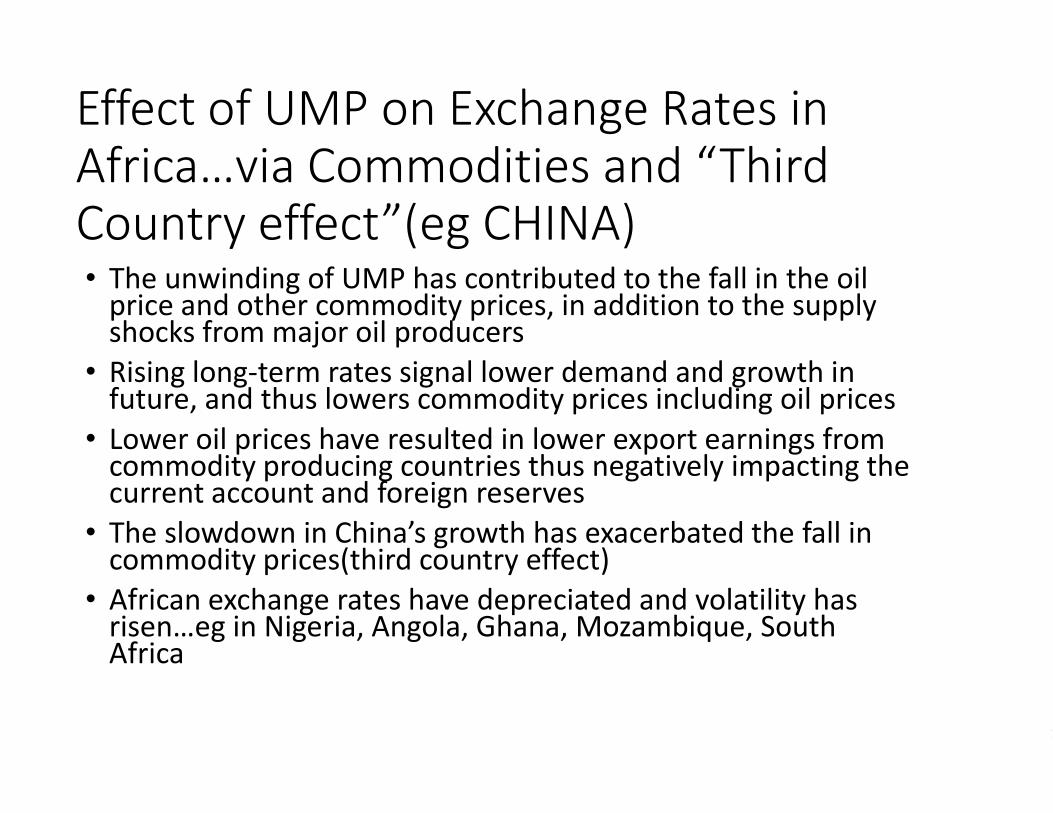
Effect of UMP on Exchange Rates in Africa…via Commodities and “Third Country effect”(eg CHINA)• The unwinding of UMP has contributed to the fall in the oil
price and other commodity prices, in addition to the supply shocks from major oil producers
• Rising long-term rates signal lower demand and growth in future, and thus lowers commodity prices including oil pricesfuture, and thus lowers commodity prices including oil prices
• Lower oil prices have resulted in lower export earnings from commodity producing countries thus negatively impacting the current account and foreign reserves
• The slowdown in China’s growth has exacerbated the fall in commodity prices(third country effect)
• African exchange rates have depreciated and volatility has risen…eg in Nigeria, Angola, Ghana, Mozambique, South Africa
Effect of UMP on Exchange Rates in Africa…via Commodities and “Third
CHINA)The unwinding of UMP has contributed to the fall in the oil
rices, in addition to the supply
term rates signal lower demand and growth in future, and thus lowers commodity prices including oil pricesfuture, and thus lowers commodity prices including oil prices
Lower oil prices have resulted in lower export earnings from commodity producing countries thus negatively impacting the current account and foreign reserves
The slowdown in China’s growth has exacerbated the fall in commodity prices(third country effect)
African exchange rates have depreciated and volatility has in Nigeria, Angola, Ghana, Mozambique, South
10

Effect of UMP on Capital Flows in Africa
• Foreign Direct Investment(FDI) into Africa dropped in 2015 partly due to fall in commodity prices and currency volatility
• FDI in SSA was $38 billion in 2015, from about $50 billion in 2014
• Portfolio flows into African capital markets decreased due to rising interest rates in developed marketsinterest rates in developed markets
• Portfolio inflows into NSE was $17 billion in 2013(over 80% in equities), and dropped to $6 billion in 2015
• The unwinding UMP, which impacts bank liquidity negatively, also impacts trade finance facilities and lines of credit(LOCs) to African banks (regulatory spillovers of Basle II and III also responsible for this)
Effect of UMP on Capital Flows in
Foreign Direct Investment(FDI) into Africa dropped in 2015 partly due to fall in commodity prices and currency volatility
FDI in SSA was $38 billion in 2015, from about $50 billion in 2014
Portfolio flows into African capital markets decreased due to rising
Portfolio inflows into NSE was $17 billion in 2013(over 80% in equities), and dropped to $6 billion in 2015
The unwinding UMP, which impacts bank liquidity negatively, also impacts trade finance facilities and lines of credit(LOCs) to African banks (regulatory spillovers of Basle II and III also responsible for this)
11

Some Stylized facts and patterns:Global Risk Aversion and Financial Reaction in South Africa
Some Stylized facts and patterns:Global Risk Aversion and Financial Reaction in South Africa
• VIX index tends to move in the opposite direction with SA stock prices
• VIX tends to have a positive relationship with the rand exchange rate to the US exchange rate to the US dollar.
• VIX is the implied volatility of the US S&P 500 Index options and used as a measure of market risk levels (‘fear’)
12

Co-Movement in Asset PricesMovement in Asset Prices
• Positive relationship between US and Euro Bond Yields, and South African bond yields
• Positive relationship between • Positive relationship between US Equities and South African
13

Global GDP Growth, Trade and Real Exchange RateGlobal GDP Growth, Trade and Real
• G7 growth decline preceded the appreciation of Real Exchange Rate
• G7 Growth decline preceded fall in SA exports to the worldto the world
14
Methodology (VAR)
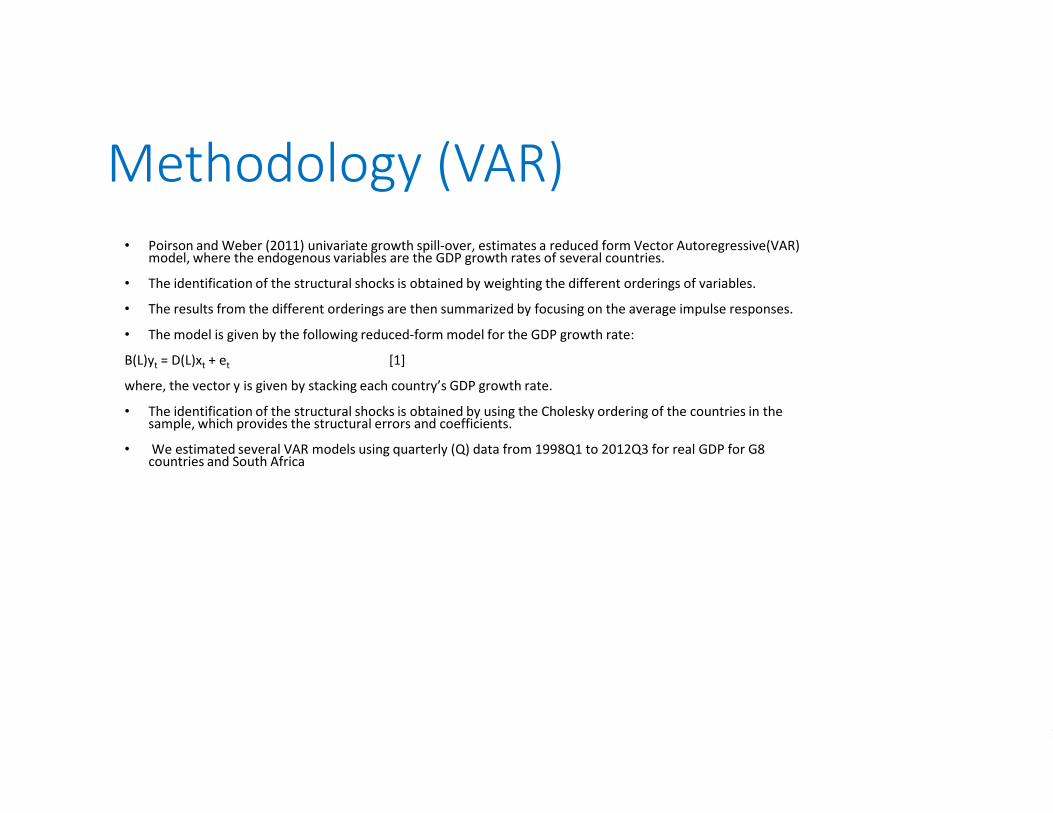
• Poirson and Weber (2011) univariate growth spill-over, estimates a reduced form model, where the endogenous variables are the GDP growth rates of several countries.
• The identification of the structural shocks is obtained by weighting the different orderings of variables
• The results from the different orderings are then summarized by focusing on the average impulse responses
• The model is given by the following reduced-form model for the GDP growth rate:
B(L)yt = D(L)xt + et [1]
where, the vector y is given by stacking each country’s GDP growth rate.
• The identification of the structural shocks is obtained by using the • The identification of the structural shocks is obtained by using the sample, which provides the structural errors and coefficients.
• We estimated several VAR models using quarterly (Q) data from 1998Q1 to 2012Q3 for real GDP for G8 countries and South Africa
Methodology (VAR)
over, estimates a reduced form Vector Autoregressive(VAR) where the endogenous variables are the GDP growth rates of several countries.
The identification of the structural shocks is obtained by weighting the different orderings of variables.
The results from the different orderings are then summarized by focusing on the average impulse responses.
form model for the GDP growth rate:
where, the vector y is given by stacking each country’s GDP growth rate.
The identification of the structural shocks is obtained by using the Cholesky ordering of the countries in the The identification of the structural shocks is obtained by using the Cholesky ordering of the countries in the
We estimated several VAR models using quarterly (Q) data from 1998Q1 to 2012Q3 for real GDP for G8
15

G7 versus SA Growth (correcting for Ordering Uncertainty)G7 versus SA Growth (correcting for Ordering Uncertainty)
• Used Poirson and Weber(2011) approach to correct for ordering uncertainty
• Positive GDP growth shocks from the US, France, UK, Japan, Canada, France and Italy raise the South African growth rate, for 4 quartersAfrican growth rate, for 4 quarters
• Positive GDP growth rate shocks emanating from Canada and France raise South African growth significantly, for about 3 quarters.
• Russia’s growth impact is positive but diminished
• Germany’s growth has no impact on SA growth
16

Channels of Transmission(Trade, Financial and ‘Third Country” channels)
• Estimated VARs using two lags selected by the AIC and including the QE1 and QE2 dummy variables
• We augment the model, to capture transmission channels, exports, commodity prices (commodity), equity prices (JSE), bond yields (bond), nominal effective exchanges rates (NEER), and business confidence index (BCI).
• In the augmented model we use the following variables, US GDP growth, G8 member country’s GDP growth, South African trade variables, and the South African GDP growth rate. The model is estimated using this ordering. The analysis of the role of different channels is achieved through a counterfactual analysis specification
Channels of Transmission(Trade, Financial and ‘Third Country” channels)
two lags selected by the AIC and use four variables including the QE1 and QE2 dummy variables.
model, to capture transmission channels, and include real exports, commodity prices (commodity), equity prices (JSE), bond yields
rates (NEER), and business confidence
In the augmented model we use the following variables, US GDP growth, G8 member country’s GDP growth, South African trade and financial
and the South African GDP growth rate. The model is estimated The analysis of the role of different channels is counterfactual analysis based on a small country VAR
17

Channels of Transmission(Trade, Financial and ‘Third Country” hannelsShocks(Example)
Channels of Transmission(Trade, Financial hannels)..US Growth
• These are cumulative responses to a positive one standard deviation shock in US growth. The dotted lines of similar patterns denote one standard deviation bands. The line with a dot between two dashes is impulse response estimated in presence of indicated variable and is within two error bands. The thin continuous red line represents the counterfactual impulse response estimated when the indicated channel is shut-off. BCI refers to business confidence indicator. NEER refers to nominal effective exchange rate
We measure the importance of each channel in transmitting • We measure the importance of each channel in transmitting shocks to South African GDP growth, by the gap between the impulses responses in the presence of the particular channel to the responses when this channel is shutoff.
• We ascertain the importance of the particular channel when both impulse responses are not bounded within the same error bands.
• US Growth shocks transmitted through Trade, Equity Market, Bond Yields, Exchange rate, business confidence, and commodity price channels
18

Channels of Transmission of Shocks from G8 countriesChannels of Transmission of Shocks
• The results confirm that the trade, bond yields, NEER, BCI and commodity price channels amplify foreign growth shocks into South Africa, albeit with differing magnitudes. differing magnitudes.
19

‘Third Country’ Channel (Indirect)‘Third Country’ Channel (Indirect)
• To what extent do external growth shocks get transmitted via other countries before impacting South African growth?
• Evidence that Shocks originating from the US, Japan, UK and France are transmitted via third countries into South Africa.
• Cumulative responses to a one positive standard deviation in individual G8 economies growth shocks. The error bands are for the thin line with two dots between the dashes. The thick with two dots between the dashes. The thick continuous lines refer to counterfactual growth impulse responses after shutting off third country effects. The absence of third country effects is captured when both thin line with two dots between the dashes and thick line lies with error bands, otherwise implies significance of third country effects.
20
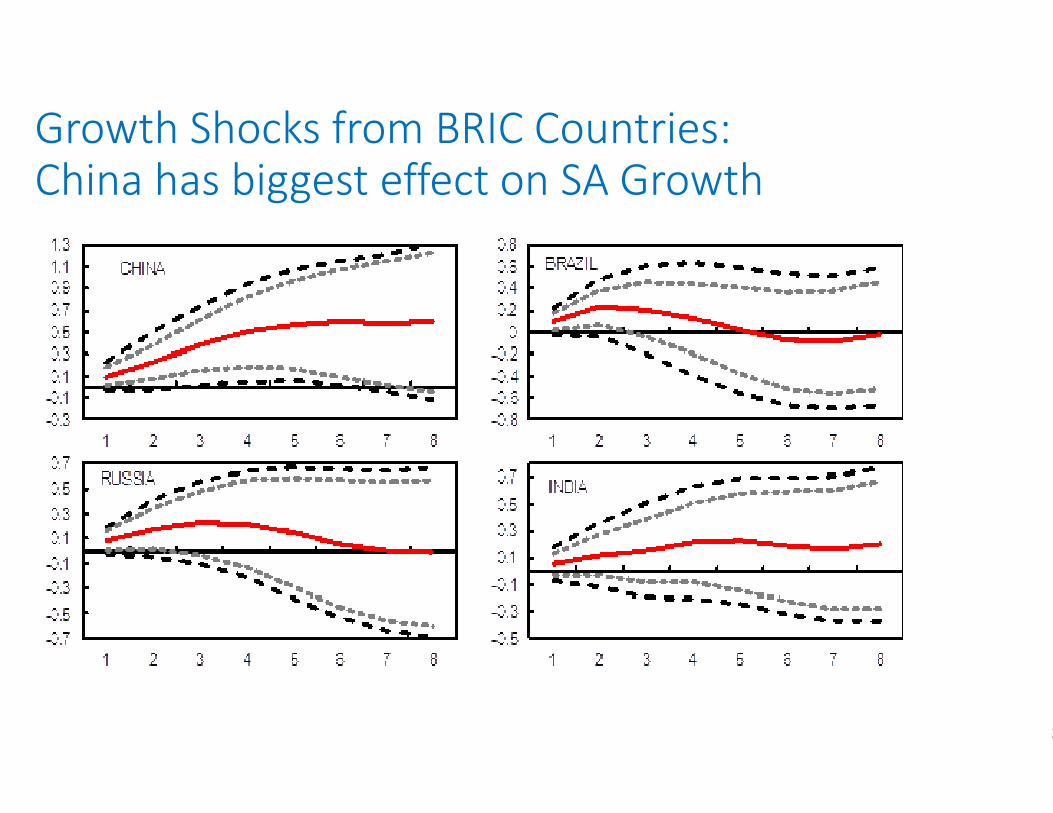
Growth Shocks from BRIC Countries: China has biggest effect on SA GrowthGrowth Shocks from BRIC Countries: China has biggest effect on SA Growth
21
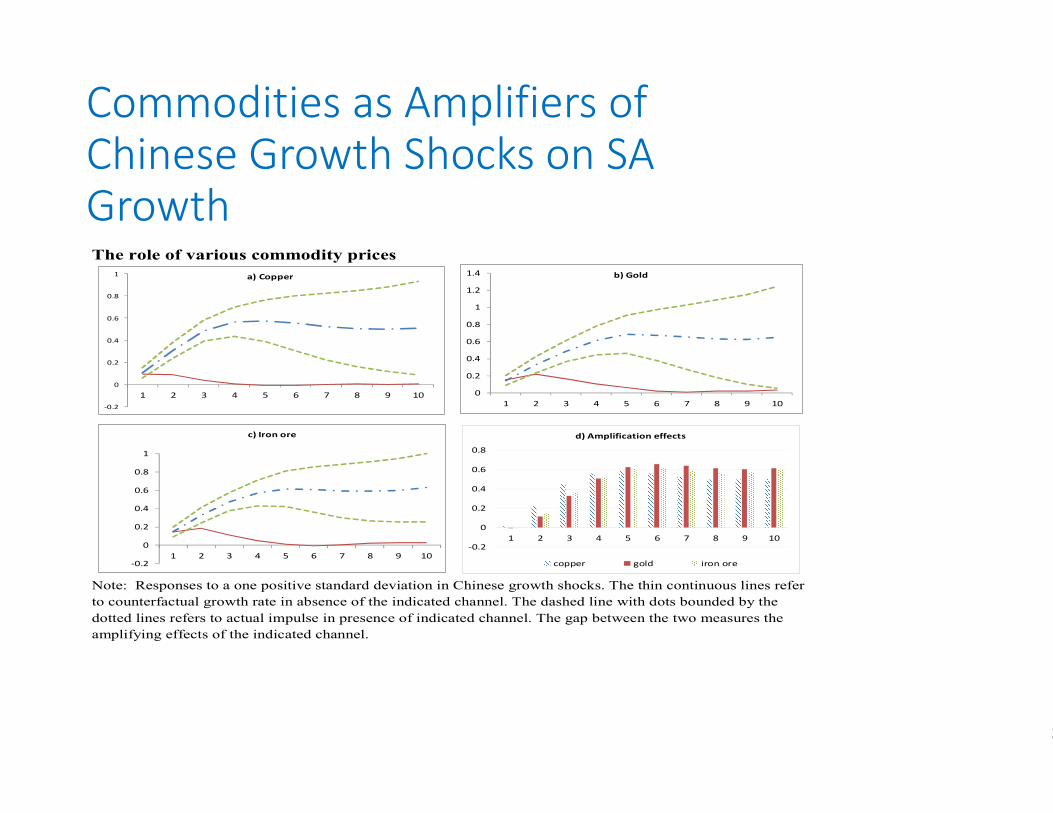
Commodities as Amplifiers of Chinese Growth Shocks on SA GrowthThe role of various commodity prices
-0.2
0
0.2
0.4
0.6
0.8
1
1 2 3 4 5 6 7 8 9 10
a) Copper
0
0.2
0.4
0.6
0.8
1
1.2
1.4
1-0.2 1
-0.2
0
0.2
0.4
0.6
0.8
1
1 2 3 4 5 6 7 8 9 10
c) Iron ore
-0.2
0
0.2
0.4
0.6
0.8
1
Note: Responses to a one positive standard deviation in Chinese growth shocks
to counterfactual growth rate in absence of the indicated channel. The
dotted lines refers to actual impulse in presence of indicated channel.
amplifying effects of the indicated channel.
Commodities as Amplifiers of Chinese Growth Shocks on SA
2 3 4 5 6 7 8 9 10
b) Gold
2 3 4 5 6 7 8 9 10
2 3 4 5 6 7 8 9 10
d) Amplification effects
copper gold iron ore
standard deviation in Chinese growth shocks. The thin continuous lines refer
indicated channel. The dashed line with dots bounded by the
to actual impulse in presence of indicated channel. The gap between the two measures the
22

Shocks from Capital Inflows and their EffectShocks from Capital Inflows and
23

Financial Stress Index (FSI) and Global Shocks
• FSI Components:(i) conditions in the banking sector, (ii) various dynamics of exchange rate and (iii) nonactivities such as equities and bonds.
• The principal components method is utilized to aggregate the variables in the financial stress index (see and Keeton 2009).and Keeton 2009).
Financial Stress Index (FSI) and
) conditions in the banking sector, (ii) various dynamics of exchange rate and (iii) non–intermediation financial
.
The principal components method is utilized to aggregate the variables in the financial stress index (see Cevik et al. 2012, Hakkio
24
FSI: Equity and Currency Risk
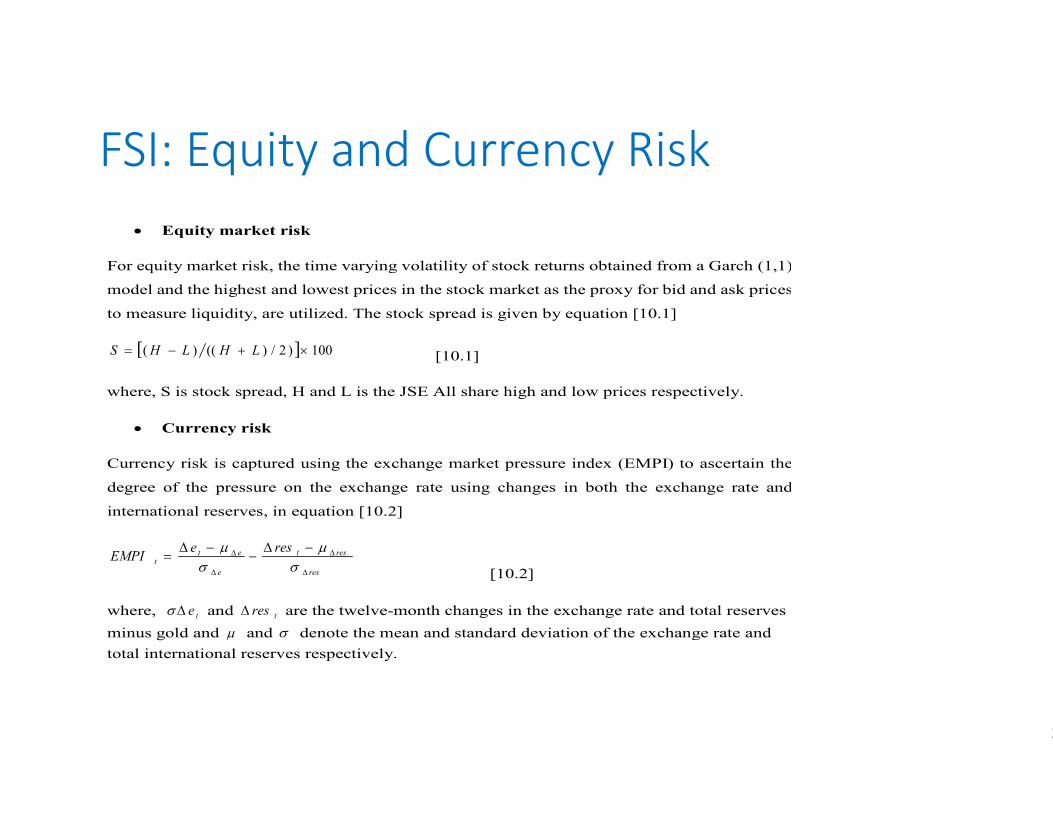
• Equity market risk
For equity market risk, the time varying volatility of stock returns obtained from a Garch (1,1)
model and the highest and lowest prices in the stock market as the proxy for bid and ask prices
to measure liquidity, are utilized. The stock spread is given by
[ ] 100)2/)(()( ×+−= LHLHS [10.1]
where, S is stock spread, H and L is the JSE All share hig
• Currency risk
Currency risk is captured using the exchange market pressure index (EMPI) to ascertain the
degree of the pressure on the exchange rate using changes in both the exchange rate and
international reserves, in equation [10.2]
res
rest
e
ett
reseEMPI
∆
∆
∆
∆ −∆−
−∆=
σ
µ
σ
µ
[10.2]
where, te∆σ and tres∆ are the twelve-month changes in the exchange rate and total reserves
minus gold and µ and σ denote the mean and standard deviation of the exchange rate and
total international reserves respectively.
FSI: Equity and Currency Risk
the time varying volatility of stock returns obtained from a Garch (1,1)
prices in the stock market as the proxy for bid and ask prices
is given by equation [10.1]
S is stock spread, H and L is the JSE All share high and low prices respectively.
using the exchange market pressure index (EMPI) to ascertain the
degree of the pressure on the exchange rate using changes in both the exchange rate and
[10.2]
month changes in the exchange rate and total reserves
denote the mean and standard deviation of the exchange rate and
25

FSI: Exchange rate Volatility, Credit Stress, Money Market Spreads
• Exchange rate volatility
Exchange rate volatility is measured using, the time varying volatility of nominal effective
exchange rate (NEER) changes modelled using a Garch
• Credit stress
Credit stress is measured using the growth rate in credit extension as in
• Money market spreads
For the money market spread we use the bid-ask spreads in the Treasury bill rates
indicator of short term costs of funds for banks. An increase in
in uncertainty in the money market. The illiquidity effects are
[ ] 100)2/)(()( ×+−= BPAPBPAPS [10.3]
where, S is spread, AP is the ask price and BP is the bid ask price for T
FSI: Exchange rate Volatility, Credit Stress, Money Market
the time varying volatility of nominal effective
exchange rate (NEER) changes modelled using a Garch (1,1).
Credit stress is measured using the growth rate in credit extension as in Civek et al. (2012).
ask spreads in the Treasury bill rates as an
increase in this spread reflects an increase
The illiquidity effects are measured by equation [10.3].
[10.3]
BP is the bid ask price for Treasury bill rates.
26

FSI: Yield Curve, Sovereign Risk, Risk Aversion
• Yield curve
The yield curve is calculated as the difference between three months
long term bond yields and its slope is a useful predictor of recessions.
• SA-US bond spread (sovereign risk) • SA-US bond spread (sovereign risk)
We include variables that capture changes in investors risk perceptions which drive short term
capital flows. This is captured by using the sovereign bond spreads,
between EMBI and ten-year US Treasury yield in constructing the index.
• Risk aversion
The investor’s risk appetite is captured using the VIX which
by option prices.
ield Curve, Sovereign Risk,
difference between three months Treasury bill rates and
useful predictor of recessions.
We include variables that capture changes in investors risk perceptions which drive short term
ing the sovereign bond spreads, which is the difference
year US Treasury yield in constructing the index.
using the VIX which is based on the volatility implied
27

Financial Pressure Index(FSI) for South AfricaFinancial Pressure Index(FSI)
28

FSI and Economic Activity: Impulse response functions from VAR AnalysisFSI and Economic Activity: Impulse response functions from VAR Analysis
29

Propagation Role of FSI: Impact on Monetary Policy setting
Following Baxa et al. (2012) we adjust for the FSI into
using the specification in equation [10.4]
FSIrycr κθλππϕ +++−+= *)( ttttt FSIrycr κθλππϕ +++−+= −−1*)(
Where, tr
denotes the monetary policy instrument, ty
the central bank’s average inflation rate. According to Baxa et al. (2012) the interest rate
inertia κ can increase as the central bank reacts to financial stress, when stress is elevated
Propagation Role of FSI: Impact on
into the monetary policy reaction function
ε+ tε+−1 [10.4]
ty is the measure of output gap, *π is
According to Baxa et al. (2012) the interest rate
can increase as the central bank reacts to financial stress, when stress is elevated
30

Conclusion
• UMP unwinding works through various channels
• Channels do not have the same transmission ability
• Global spillovers of the unwinding of UMP impact the African economies through exchange rate movements, volatility, capital flows and commodity prices
African currencies are more volatility, and they are depreciating, • African currencies are more volatility, and they are depreciating, and capital inflows are decreasing
• Transmission channels give policy-makers pointers of how to target policy responses
• The ability to sustain future growth depends on domestic policy responses to global shocks
• Domestic shocks are as important as global shocks
UMP unwinding works through various channels
Channels do not have the same transmission ability
Global spillovers of the unwinding of UMP impact the African economies through exchange rate movements, volatility, capital
African currencies are more volatility, and they are depreciating, African currencies are more volatility, and they are depreciating,
makers pointers of how to
The ability to sustain future growth depends on domestic policy
Domestic shocks are as important as global shocks
31

Thank you
32