professional learning community - home | parkrose school district
TRANSCRIPT

Professional Learning Community
PLC
Handbook 2011-2012


Table of Contents
Section 1: The PLC Team Process ......................................................................................................................................................................................................................... 3
Professional Learning Communities ............................................................................................................................................................................................. 4
Four Questions to Guide PLC’s .................................................................................................................................................................................................... 5
Professional Learning Communities Model .................................................................................................................................................................................. 6
PLC Standards .............................................................................................................................................................................................................................. 7
What Do PLC Teams Actually Do At Meetings? .......................................................................................................................................................................... 8
PLC Team Process ....................................................................................................................................................................................................................... 9
SMARTe Goal Guidelines: .......................................................................................................................................................................................................... 12
Data Analysis Steps .................................................................................................................................................................................................................... 14
Section 2: PLC Forms ............................................................................................................................................................................................................................................. 15
2011-2012 Professional Development Plan Template ............................................................................................................................................................... 16
PLC Meeting Minutes Template ................................................................................................................................................................................................. 17
PLC Power Standards Worksheet .............................................................................................................................................................................................. 19
Unwrapping the Standard ........................................................................................................................................................................................................... 20
PLC / Professional Development Plan........................................................................................................................................................................................ 21
PLC Rubric .................................................................................................................................................................................................................................. 22
SMARTe Goal Rubric ................................................................................................................................................................................................................. 23
DATA Analysis Rubric ................................................................................................................................................................................................................. 24
PLC Collaboration Rubric ........................................................................................................................................................................................................... 25
PLC Meeting Feedback Form ..................................................................................................................................................................................................... 26
Data Organizer ............................................................................................................................................................................................................................ 27
Analysis of Student Work ............................................................................................................................................................................................................ 28
Instructional Strategies ............................................................................................................................................................................................................... 29
I Do, We Do, Y’all Do, You Do .................................................................................................................................................................................................... 31
Section 3: Supporting Documents and Resources ............................................................................................................................................................................................. 32
District Initiatives 2011-2012 ....................................................................................................................................................................................................... 33
OAKS, Oregon Assessment of Knowledge & Skills ................................................................................................................................................................... 34
Cultural Shifts in a Professional Learning Community ............................................................................................................................................................... 35
Collaboration ............................................................................................................................................................................................................................... 38
Accurately Reporting Student Standard-Based Progress .......................................................................................................................................................... 39
PLC Meeting Note Documentation ............................................................................................................................................................................................. 40
Parkrose Instructional Framework .............................................................................................................................................................................................. 41
Instructional Strategies Menu ..................................................................................................................................................................................................... 43
Parkrose Pyramid of Interventions .............................................................................................................................................................................................. 44
Classroom Instruction Within ...................................................................................................................................................................................................... 45
A Simultaneous Loose/Tight Framework .................................................................................................................................................................................... 45
Assessment System Diagram ..................................................................................................................................................................................................... 46
Common Formative Assessments .............................................................................................................................................................................................. 47
Data Analysis and Student Work ................................................................................................................................................................................................ 48
Good Statistical Practice in Education ........................................................................................................................................................................................ 49
Definitions.................................................................................................................................................................................................................................... 53


The PLC Team Process
The PLC Team Process
Section 1 Contents:
Professional Learning Communities ....................................................................................................... 4
Four Questions to Guide PLC’s .............................................................................................................. 5
Professional Learning Communities Model ............................................................................................ 6
PLC Standards ....................................................................................................................................... 7
What Do PLC Teams Actually Do At Meetings? ...................................................................................... 8
PLC Team Process ................................................................................................................................. 9
SMARTe Goal Guidelines: .....................................................................................................................12
Data Analysis Steps ...............................................................................................................................14
Parkrose School District School Improvement Department (revised 9.26.11) Page 3 of 53

Professional Learning Communities An Overview
To create a professional learning community, focus on learning rather than teaching, work collaboratively, and hold yourself accountable for results. -Rick DuFour, 2004
Fundamental Assumptions 1. We can make a difference: Our schools can be more effective. 2. Improving our knowledge is the key to improving our schools. 3. Significant school improvement will impact teaching and learning.
The ONE Thing in a Professional Learning Community, “learning” rather than “teaching” is the fundamental purpose of your school.
Three Big Ideas 1. Focus on Learning 2. Collaboration 3. Focus on Results
Definition “…A Professional Learning Community is a collaboration of teachers, administrators, parents, and students, who work together to seek out best practices, test them in the classroom, continuously improve processes, and focus on results.” - Rick DuFour, 2002
Parkrose School District School Improvement Department (revised 9.26.11) Page 4 of 53

Four Questions to Guide PLC’s
1. What do we expect students to learn? Essent ial outcomes, power standards,
learning targets, pacing 2. How will we know if they learn it? Common assessments, quick checks for
understanding, results analysis 3. How do we respond when students
experience difficulty in learning? Differentiated instruction, Pyramid of Interventions, and Response to Instruction
4. How do we respond when students do
learn? Differentiated instruction and
Enrichments
Parkrose School District School Improvement Department (revised 9.26.11) Page 5 of 53

Professional Learning Communities Model
Model for Improving Student Achievement Through Collaborative Professional Development
QuickTime™ and aTIFF (Uncompressed) decompressorare needed to see this picture.
1. Data study of trends in past student achievement. PLC determines focus for professional improvement, and sets SMARTe goal .
2. Members determine com mon work that will be done by students of all PLC members, that is in alignment with SMARTe goal.
3. Members determine mode of professional development needed to meet goal, and meet at least monthly to collaborate.
4. PLC members share student work using a pro tocol to review student progress toward SMARTe goal.
Increased Student
Ach ievement!
Parkrose School District School Improvement Department (revised 9.26.11) Page 6 of 53

PLC Standards
Teachers will be able to:
� Write a goal that is Strategic and Specific, Measurable, Attainable, Results Oriented / Relevant / Rigorous, Time Bound and includes Everyone
� Write PLC meeting notes that:
√ include key components (SMARTe goals, data analysis, action plan tasks, collaboration and clarity in documentation),
√ are complete, and √ are specific, clear and succinct (a reader not at the meeting can
understand the meeting)
� Demonstrate proficiency in professional collaboration as measured by: √ a focus on group norms √ students learning √ shared responsibility √ professional communication and √ research/information sharing
� Analyze data in the following component areas:
√ data processing √ data manipulation and presentation √ data analysis and √ data implications for instructional practice
Parkrose School District School Improvement Department (revised 9.26.11) Page 7 of 53

What Do PLC Teams Actually Do At Meetings?
Establish Group Norms The first thing the PLC team needs to do is to establish “norms” and a method to monitor them. In a PLC, norms represent protocols and commitments to guide members in working together. Norms help team members clarify expectations regarding how they will work together to achieve their shared goal. When establishing group norms, consider: TIME and PLACE - When do we meet? - Where do we meet? How do we determine this? - Will we set a beginning and ending time? - Will we start and end on time? LISTENING - How will we encourage listening? - How will we discourage interrupting? DECISION-MAKING - How will we make decisions? - Are we an advisory or a decision-making body? - Will we reach decisions by consensus? - How will we deal with conflicts? EXPECTATIONS - What do we expect from members? - Are there requirements for participation? - What data or student work will we bring to the next meeting?
Parkrose School District School Improvement Department (revised 9.26.11) Page 8 of 53

PLC Team Process
1. Examine power standards. Begin with a small time element: a month, unit, chapter, or quarter. a. “Unwrap” the power standard. Examine the specific learning targets for that specific time period
(unit, quarter, month, etc.) and develop a team pacing guide. b. Formulate questions.
i. What concepts and skills must students master as a result of your teaching during this time period (quarter, month, chapter, etc.)?
ii. What concepts and skills must students already have?
2. Develop learning targets (and student-friendly learning targets). a. What does your year-long map (or pacing guide) look like? b. How will you strategically place/schedule content and concepts during the year so that students will
have optimal time to understand concepts and apply skills?
3. Create a common post-assessment. This will be administered at the conclusion of the teaching time (unit, quarter, month) based on what students must master (Power Standards).
4. Administer the common post-assessment BEFORE teaching. At this time it acts as a pre-assessment. a. What foundation do students already have? b. What knowledge, understanding, and skills do students already have about the topic that they are
about to study? c. Which students are starting absolutely at square one in terms of understanding the concepts and/or
applying the skills? d. Send pre-assessment data to PLC Facilitator.
5. Go through the five formal and definitive steps of the PLC Team process:
a. Step 1—Collect and chart data. This data is generated from the pre-assessment. PLC Facilitator prepares a simple table with pre-assessment data, including total number of students, students who are proficient or higher, students who are not proficient, and percentage of students who are proficient or higher.
Parkrose Data Organizer:
Category: # of Students
Assessed # of Student
Proficient # of Students
Close to Proficiency
# of Students Not Proficient
% of Students Proficient
Parkrose School District School Improvement Department (revised 9.26.11) Page 9 of 53

b. Step 2—Analyze strengths and obstacles. With actual student work or observation rubrics in hand, examine papers for what students are able to do, as well as for what is missing. What is present becomes strengths. What is missing becomes obstacles or challenges, which then become the priority—the FOCUS—for the teaching unit. What prerequisite skills are missing to get the student to learn this objective?
c. Step 3—Establish goals: set, review, revise.
Use an exact form of goal statement to include all parts of the information needed in a SMARTe (Specific, Measurable, Achievable, Relevant, Timely, and Everyone) goal.
Example: % of Grade 7 students scoring proficient and higher in calculating the surface area of geometric shapes will increase from 28% to 73% by the end of October as measured by a team-created assessment administered on October 30 (31 make-up date).
d. Step 4—Select instructional strategies (what will you and your entire team do for YOUR students?)
i. What concepts are the focuses of the specific time period (unit, quarter, month, etc.)? ii. What are student intervention needs? Drastic measures requiring drastic action? iii . What strategies will you implement that will have greater impact student achievement? iv. Keeping in mind the effective teaching strategies, which techniques will you select to focus
on? Which strategies will help the most students and maximize learning? v. Use Instructional Strategies Brainstorm form.
Four Questions to Guide PLC’s 1. What do we expect students to learn? Essential outcomes, power standards, learning targets, pacing 2. How will we know if they learn it? Common assessments, quick checks for understanding, results analysis 3. How do we respond when students experience difficulty in learning? Differentiated instruction, POI, and RTI 4. How do we respond when students do learn? Differentiated instru ction and enrichment
Parkrose School District School Improvement Department (revised 9.26.11) Page 10 of 53

Techniques: Comparing Classifying Creating Metaphors Creating Analogies Summarizing Note-Taking Effort Recognition Homework Practice
Nonlinguistic Representation Cooperative Groups Setting Objectives Providing Feedback Generating Hypotheses Testing Hypotheses Cueing Questioning Advance Organizers (graphic organizers) Writing
e. Step 5—Determine results indicators and Common Formative Assessment
i. “When WE implement the strategies/techniques identified in step 4, then WE expect the following in terms of what students will demonstrate”:
Students will demonstrate: • Understanding of concepts and skills (e.g., math) • Increased application when using the comparing strategy in all
subjects • Improved ability to think in more complex ways
Teach and then assess (using formative assessment techniques; part or all of the pre-/post-assessment is appropriate to see students’ learning in relation to proficiency of expected outcomes). Using a variety of instructional techniques and learning activities for students, begin the instructional cycle again. Summary
1. “Unwrap” power standards to determine concepts and skills to teach. 2. Develop learning targets. 3. Develop, administer and score pre-assessment created before instruction took place. 4. Input your pre-assessment data into the common Parkrose Data Organizer to prepare for
PLC Team meeting. 5. Fill out the Analysis of Student work form. Review the four PLC questions. 6. Establish Goals. 7. Brainstorm Instructional Strategies. Determine common instructional strategies. 8. Teach and use Formative Assessments including at least one common formative assessment
with your team. 9. Administer and Score post-assessment. 10. Input your post-assessment data into the common Parkrose Data Organizer. 11. Meet as a team/department to determine if goal was met, and next steps. 12. Examine curriculum map (pacing guide) for next unit, month, quarter, etc. Begin cycle again;
and repeat steps.
Parkrose School District School Improvement Department (revised 9.26.11) Page 11 of 53
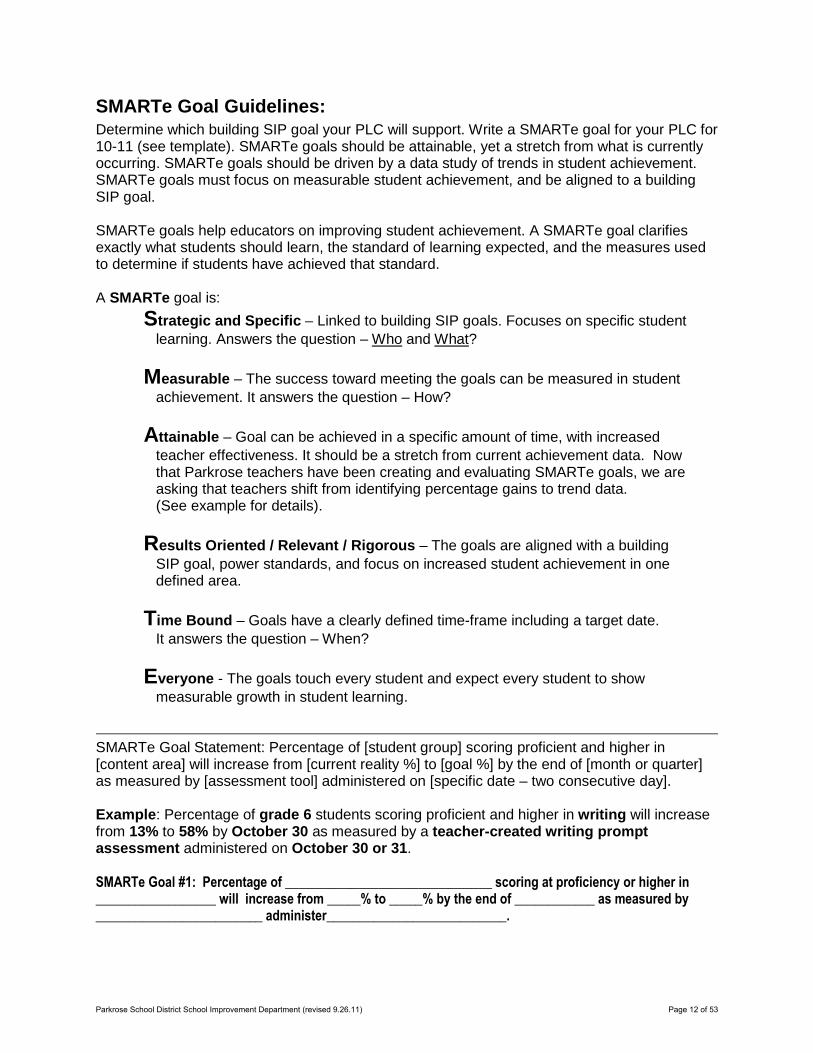
SMARTe Goal Guidelines: Determine which building SIP goal your PLC will support. Write a SMARTe goal for your PLC for 10-11 (see template). SMARTe goals should be attainable, yet a stretch from what is currently occurring. SMARTe goals should be driven by a data study of trends in student achievement. SMARTe goals must focus on measurable student achievement, and be aligned to a building SIP goal. SMARTe goals help educators on improving student achievement. A SMARTe goal clarifies exactly what students should learn, the standard of learning expected, and the measures used to determine if students have achieved that standard. A SMARTe goal is:
Strategic and Specific – Linked to building SIP goals. Focuses on specific student learning. Answers the question – Who and What?
Measurable – The success toward meeting the goals can be measured in student achievement. It answers the question – How?
Attainable – Goal can be achieved in a specific amount of time, with increased teacher effectiveness. It should be a stretch from current achievement data. Now that Parkrose teachers have been creating and evaluating SMARTe goals, we are asking that teachers shift from identifying percentage gains to trend data. (See example for details).
Results Oriented / Relevant / Rigorous – The goals are aligned with a building SIP goal, power standards, and focus on increased student achievement in one defined area.
Time Bound – Goals have a clearly defined time-frame including a target date. It answers the question – When?
Everyone - The goals touch every student and expect every student to show measurable growth in student learning.
SMARTe Goal Statement: Percentage of [student group] scoring proficient and higher in [content area] will increase from [current reality %] to [goal %] by the end of [month or quarter] as measured by [assessment tool] administered on [specific date – two consecutive day]. Example : Percentage of grade 6 students scoring proficient and higher in writing will increase from 13% to 58% by October 30 as measured by a teacher-created writing prompt assessment administered on October 30 or 31. SMARTe Goal #1: Percentage of _______________________________ scoring at proficiency or higher in __________________ will increase from _____% to _____% by the end of ____________ as measured by _________________________ administer___________________________.
Parkrose School District School Improvement Department (revised 9.26.11) Page 12 of 53

Examples:
Not a SMARTe goal:
• Students will improve their writing skills in English 10.
Does not identify a measurement or time frame. The “trend” is not measurable.
• Fifth grade students will improve mathematical modeling in algebraic relationships as measured by fifth grade common formative assessments.
Does not identify time frame or the quantifiable numbers for improvement. What is the trend?
• As measured by the 8 th grade common formative assessment for writing
org anization, 8 th grade students will improve their organization by 50% during the 2009-2010 school year. Does not identify the trend data or proficiency level.
SMARTe goal:
• The percentage of English 9 students scoring a 3 or better on the state writing standards rubric will increase from 46% to 66% by the end of second term of the 2009- 2010 school year.
• During the 2010-2011 school year, all 4th grade students will improve their math calculation skills as measured by at least a 1.0 year gain in state grade equivalent growth (RIT) from the 2008-09 to the 2009-10 OAKS math test.
• As measured by the “Six Analytical Writing Traits Writing Assessment,” all 7th students below the 3.0 writing standard in conventions will make continuous growth until they reach the 3.0 level during the 2009-2010 school year. All others will increase to at least 3.5 level or better.
• During the 2010-2011 school year, non-proficient (based on RIT scores) 10th grade students in
the ELL subgroup group (as indicated by the eSIS 2008-09 state assessment report for PHS) will increase by 25% as measured by the OAKS math algebraic relationships subtest strand.
SMARTe Goal Example:
The percentage of time that we as teachers pre-teach vocabulary before units and lessons will increase from 50% to 90% by December 10th as measured by documentation in our planning books and a survey administrated on December 15th.
Parkrose School District School Improvement Department (revised 9.26.11) Page 13 of 53

Data Analysis Steps
The various steps of the analysis of the data can be
summarized as follows –
1. Collect and organize the data. 2. Break down the data for sub groups, which gives
quantitative description. 3. Using statistical descriptions of data such as graphs may
bring different aspects into view. 4. Examine the data as well as the patterns in the student
work to help to improve the evaluation of the findings. 5. Different qualitative, non-statistical, and statistical
methods can be used for obtaining additional findings but
only as needed. 6. Summarize the findings. During this last step, revisit the
data many times to verify, test, or confirm the themes and
patterns you have identified.
PLC Tools for Data Analysis
� Data Organizer
� Analysis of Student Work
� Instructional Strategies Brainstorm Form
� Graphing Templates
Parkrose School District School Improvement Department (revised 9.26.11) Page 14 of 53

PLC Forms All forms available on PLC Team Site
Section 2 Contents:
2011-2012 Professional Development Plan Template ........................................................................... 16
PLC Meeting Minutes Template ............................................................................................................ 17
PLC Power Standards Worksheet ......................................................................................................... 19
Unwrapping the Standard ..................................................................................................................... 20
PLC / Professional Development Plan .................................................................................................. 21
PLC Rubric ............................................................................................................................................ 22
SMARTe Goal Rubric ............................................................................................................................ 23
DATA Analysis Rubric ............................................................................................................................ 24
PLC Collaboration Rubric ...................................................................................................................... 25
PLC Meeting Feedback Form ............................................................................................................... 26
Data Organizer ...................................................................................................................................... 27
Analysis of Student Work ...................................................................................................................... 28
Instructional Strategies .......................................................................................................................... 29
I Do, We Do, Y’all Do, You Do ............................................................................................................... 31
Parkrose School District School Improvement Department (revised 9.26.11) Page 15 of 53
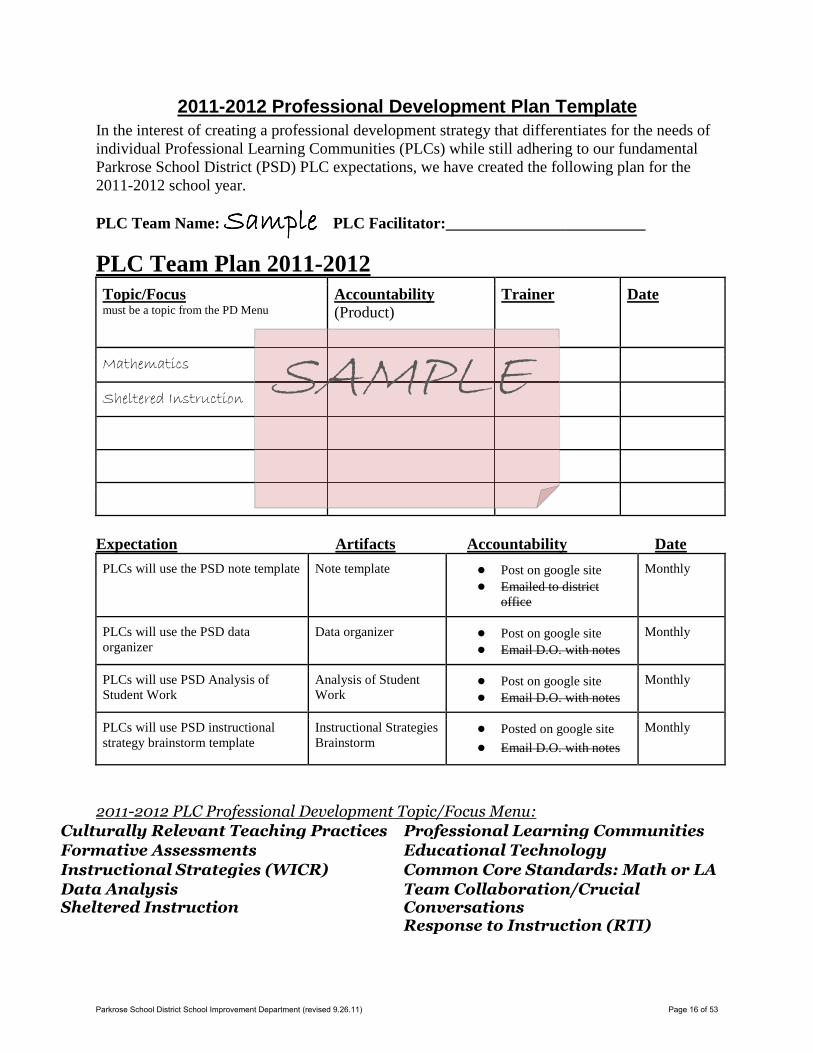
2011-2012 Professional Development Plan Template In the interest of creating a professional development strategy that differentiates for the needs of individual Professional Learning Communities (PLCs) while still adhering to our fundamental Parkrose School District (PSD) PLC expectations, we have created the following plan for the 2011-2012 school year.
PLC Team Name: SampleSampleSampleSample PLC Facilitator:_________________________
PLC Team Plan 2011-2012 Topic/Focus must be a topic from the PD Menu
Accountability (Product)
Trainer
Date
Mathematics
Sheltered Instruction
Expectation Artifacts Accountability Date
PLCs will use the PSD note template Note template ● Post on google site ● Emailed to district
office
Monthly
PLCs will use the PSD data organizer
Data organizer ● Post on google site ● Email D.O. with notes
Monthly
PLCs will use PSD Analysis of Student Work
Analysis of Student Work
● Post on google site ● Email D.O. with notes
Monthly
PLCs will use PSD instructional strategy brainstorm template
Instructional Strategies Brainstorm
● Posted on google site ● Email D.O. with notes
Monthly
2011-2012 PLC Professional Development Topic/Focus Menu:
Culturally Relevant Teaching Practices Professional Learning Communities Formative Assessments Educational Technology Instructional Strategies (WICR) Common Core Standards: Math or LA Data Analysis Sheltered Instruction
Team Collaboration/Crucial Conversations Response to Instruction (RTI)
SAMPLE
Parkrose School District School Improvement Department (revised 9.26.11) Page 16 of 53

PLC Meeting Minutes Template
Parkrose School District School Improvement Department (revised 9.26.11) Page 17 of 53

Parkrose School District School Improvement Department (revised 9.26.11) Page 18 of 53

PLC Power Standards Worksheet
Date:
School: Parkrose SchoolParkrose SchoolParkrose SchoolParkrose School
Team: SAMPLESAMPLESAMPLESAMPLE
Subject Area: MathMathMathMath
FOR THE YEAR – Identify 8 – 10 Power Standards
# Power Standard Rationale
1
Math, Number and Operations, Extend the Counting Math, Number and Operations, Extend the Counting Math, Number and Operations, Extend the Counting Math, Number and Operations, Extend the Counting SequenceSequenceSequenceSequence
2
3
4
5
6
7
8
9
10
SAMPLE
Parkrose School District School Improvement Department (revised 9.26.11) Page 19 of 53

Unwrapping the Standard
Big Idea – What is the over riding idea that will help students make connections and apply learning to different situations?:
Essential Question(s) – What questions, if answered correctly in some
from of assessment, will demonstrate a deep understanding of the idea?:
Learning Targets – In order to demonstrate proficiency in this standard, what do students need to be able to know, understand, do and produce?
Know:
Understand: Do: Produce:
Parkrose School District School Improvement Department (revised 9.26.11) Page 20 of 53

PLC / Professional Development Plan
When
Identified Area
PLC Time
Other Time
Dispersed Leadership
Month: SeptemberSeptemberSeptemberSeptember
Math, Number Math, Number Math, Number Math, Number and Operations, and Operations, and Operations, and Operations, Extend the Extend the Extend the Extend the Counting Counting Counting Counting SequenceSequenceSequenceSequence
09/14 09/14 09/14 09/14 –––– review review review review prepreprepre----assessment assessment assessment assessment data, plan shared data, plan shared data, plan shared data, plan shared lessons, lessons, lessons, lessons, assessmentassessmentassessmentassessment
09/21 09/21 09/21 09/21 –––– check in check in check in check in on shared lessonson shared lessonson shared lessonson shared lessons
----Bob to develop Bob to develop Bob to develop Bob to develop prepreprepre----assesassesassesassessmentsmentsmentsment ----PrePrePrePre----assessment assessment assessment assessment given by 9/12, given by 9/12, given by 9/12, given by 9/12, scored. Allscored. Allscored. Allscored. All ----Shared lessons Shared lessons Shared lessons Shared lessons to inboxes by to inboxes by to inboxes by to inboxes by 9/199/199/199/19
Month:
Month:
Team: SampleSampleSampleSample
SAMPLE
Parkrose School District School Improvement Department (revised 9.26.11) Page 21 of 53

PLC RubricPLC RubricPLC RubricPLC Rubric
PLC Meeting Rubric Team: Date: Skil ls Pre-Initiation Initiating Implementing Refining Sustaining
SMARTe Goal: Specific,
Measureable, Attainable,
Relevant, Time Bound, Everyone
The goal is not written as a SMARTe Goal
SMARTe Goals are missing three components
SMARTe Goals are missing two components
SMARTe Goals are missing only one
component.
SMARTe Goals have all required components.
Data Analysis
The team collected, analyzed and used data to change instructional
strategies.
The team collected, analyzed and used data to change instructional
strategies.
The team collected, analyzed and used
common data to change instructional strategies.
The majority of the team collected, analyzed and used common data to change instructional
strategies.
The whole team collected, analyzed and used common data to change instructional
strategies.
Instructional Strategies Plan
Action Tasks are not related to a SMARTe Goal. No evidence of
implementation on designated instructional
strategies.
Action Tasks are remotely related to the
SMARTe Goal. Team is talking about tasks,
however no significant action has been taken.
Action Tasks are somewhat related to the SMARTe Goal. Action toward the tasks have been identified with a
timeline for completion.
Action Tasks are related to the SMARTe Goal. Action on tasks
have gone beyond implementation.
Action Tasks are directly related to the
SMARTe Goal. Evidence on the tasks indicate that the process has become
embedded.
Collaboration Little or no
collaboration is evident around student learning.
Team is talking about collaboration with no
significant evidence of collaboration about student learning.
Collaboration about student learning has begun but remains
fragile.
Collaboration about student learning has
gone beyond implementation.
Collaboration about student learning is deeply embedded.
Clarity in Documentation
The content is unclear and off topic.
The content is somewhat clear.
The content is moderately clear.
Most of the content is clear and the ideas are somewhat formulated.
The content and ideas are clearly present,
documented, and on topic. Details are
explicitly explained and transparent.
Parkrose School District School Improvement Department (revised 9.26.11) Page 22 of 53
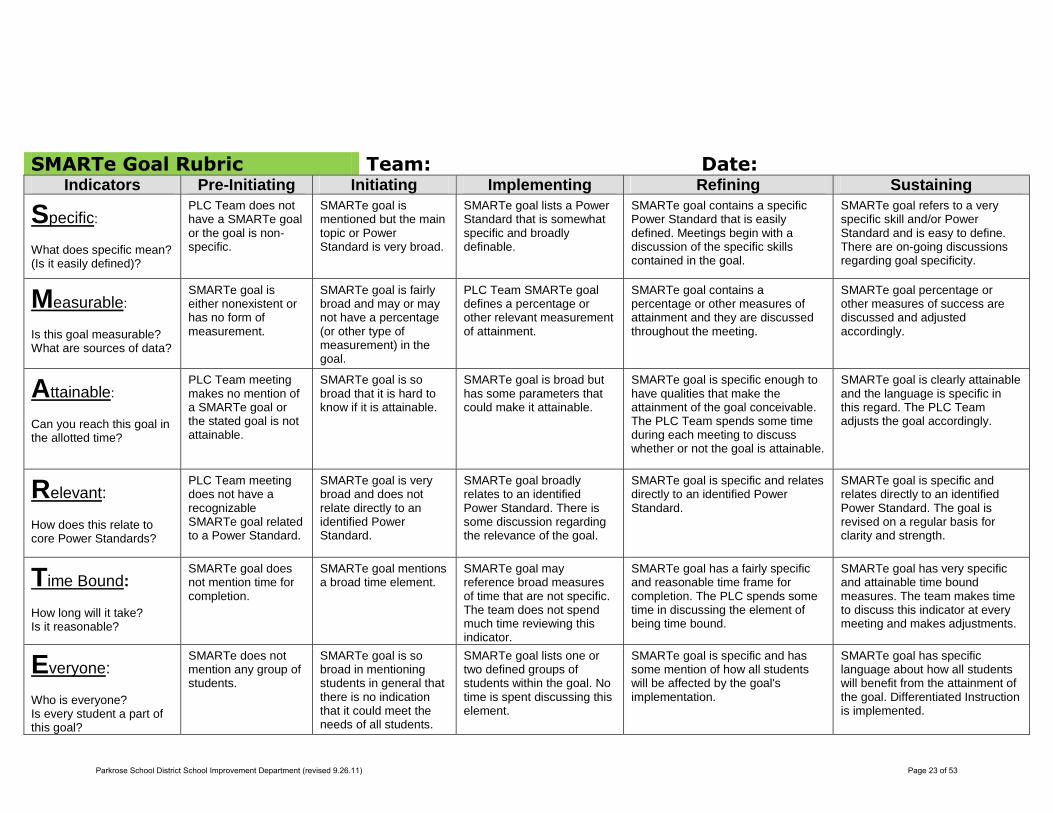
SMARTe Goal Rubric
SMARTe Goal Rubric Team: Date: Indicators Pre-Initiating Initiating Implementing Refining Sustaining
Specific: What does specific mean? (Is it easily defined)?
PLC Team does not have a SMARTe goal or the goal is non-specific.
SMARTe goal is mentioned but the main topic or Power Standard is very broad.
SMARTe goal lists a Power Standard that is somewhat specific and broadly definable.
SMARTe goal contains a specific Power Standard that is easily defined. Meetings begin with a discussion of the specific skills contained in the goal.
SMARTe goal refers to a very specific skill and/or Power Standard and is easy to define. There are on-going discussions regarding goal specificity.
Measurable: Is this goal measurable? What are sources of data?
SMARTe goal is either nonexistent or has no form of measurement.
SMARTe goal is fairly broad and may or may not have a percentage (or other type of measurement) in the goal.
PLC Team SMARTe goal defines a percentage or other relevant measurement of attainment.
SMARTe goal contains a percentage or other measures of attainment and they are discussed throughout the meeting.
SMARTe goal percentage or other measures of success are discussed and adjusted accordingly.
A ttainable: Can you reach this goal in the allotted time?
PLC Team meeting makes no mention of a SMARTe goal or the stated goal is not attainable.
SMARTe goal is so broad that it is hard to know if it is attainable.
SMARTe goal is broad but has some parameters that could make it attainable.
SMARTe goal is specific enough to have qualities that make the attainment of the goal conceivable. The PLC Team spends some time during each meeting to discuss whether or not the goal is attainable.
SMARTe goal is clearly attainable and the language is specific in this regard. The PLC Team adjusts the goal accordingly.
Relevant: How does this relate to core Power Standards?
PLC Team meeting does not have a recognizable SMARTe goal related to a Power Standard.
SMARTe goal is very broad and does not relate directly to an identified Power Standard.
SMARTe goal broadly relates to an identified Power Standard. There is some discussion regarding the relevance of the goal.
SMARTe goal is specific and relates directly to an identified Power Standard.
SMARTe goal is specific and relates directly to an identified Power Standard. The goal is revised on a regular basis for clarity and strength.
Time Bound: How long will it take? Is it reasonable?
SMARTe goal does not mention time for completion.
SMARTe goal mentions a broad time element.
SMARTe goal may reference broad measures of time that are not specific. The team does not spend much time reviewing this indicator.
SMARTe goal has a fairly specific and reasonable time frame for completion. The PLC spends some time in discussing the element of being time bound.
SMARTe goal has very specific and attainable time bound measures. The team makes time to discuss this indicator at every meeting and makes adjustments.
Everyone: Who is everyone? Is every student a part of this goal?
SMARTe does not mention any group of students.
SMARTe goal is so broad in mentioning students in general that there is no indication that it could meet the needs of all students.
SMARTe goal lists one or two defined groups of students within the goal. No time is spent discussing this element.
SMARTe goal is specific and has some mention of how all students will be affected by the goal's implementation.
SMARTe goal has specific language about how all students will benefit from the attainment of the goal. Differentiated Instruction is implemented.
Parkrose School District School Improvement Department (revised 9.26.11) Page 23 of 53

DATA Analysis Rubric
DATA Analysis Rubric Team: Date: Category Pre-Initiation Initiating Implementing Refining Sustaining
Data Gathering
The team makes no attempt to arrange the data into fields or categories. Team members show no understanding of processing data.
The team rarely attempts to arrange the data into categories or fields. The team shows little evidence of understanding data types.
The team usually arranges the data into simple categories or fields, however, there is not yet consistency in reviewing the data. There is some evidence of data processing and understanding. The data is entered accurately.
The team routinely arranges the data in adequate categories or fields, however, they are still working on embedding the process into practice. There is evidence of processing and understanding. Data is valid and reliable.
The team is able to arrange the data into appropriate fields or categories on a consistent basis. Data is processed and revised.
Data Organization
The team makes no attempt to organize data into subgroup categories and levels of proficiency.
The team rarely organizes data into subgroup categories and levels of proficiency.
The team usually organizes data into subgroup categories and levels of proficiency.
The team routinely organizes data into subgroup categories and levels of proficiency.
The team consistently organizes data into subgroup categories and levels of proficiency.
Analysis
The team makes no attempt to analyze the data or draw conclusions. There is no attempt to link the data to prior knowledge.
The team rarely attempts to identify trends and draw conclusions from the data. The team rarely attempts to make some links to prior knowledge.
The team usually draws conclusions from the data. The team usually makes some links to prior knowledge.
The team routinely identifies trends and draws some conclusions from the data that relates to power standards or student learning. The team routinely relates the presented data to previous or new knowledge.
The team consistently identifies trends and is able to draw suitable conclusions from the data that directly relates to power standards or student learning. The team consistently connects the presented data to previous or new knowledge.
Instructional Planning
The team does not use assessment and data in instructional planning. • Uses data to select
instructional strategies. • There is evidence of
linking assessment, data and instruction.
• Develops assessment methods to progress, plan and pace instruction
• Maintains consistent records of task completion and student performance.
• Reports student progress.
The team rarely uses assessment and data in instructional planning. • Uses data to select
instructional strategies. • There is evidence of
linking assessment, data and instruction.
• Develops assessment methods to progress, plan and pace instruction
• Maintains consistent records of task completion and student performance.
• Reports student progress.
The team usually uses assessment and data in instructional planning. • Uses data to select
instructional strategies. • There is evidence of linking
assessment, data and instruction.
• Develops assessment methods to progress, plan and pace instruction
• Maintains consistent records of task completion and student performance.
• Reports student progress.
The team routinely uses assessment and data in instructional planning. • Uses data to select instructional
strategies. • There is evidence of linking
assessment, data and instruction. • Develops assessment methods to
progress, plan and pace instruction • Maintains consistent records of task
completion and student performance. • Reports student progress.
The team embeds and extends assessment and data in instructional planning, and consistently links assessment, data and instruction. • Uses data to select instructional
strategies. • There is evidence of linking
assessment, data and instruction. • Develops assessment methods to
progress, plan and pace instruction • Maintains consistent records of task
completion and student performance.
• Reports student progress.
Parkrose School District School Improvement Department (revised 9.26.11) Page 24 of 53

PLC Collaboration Rubric
PLC Collaboration Rubric Team: Date: Category Pre-Initiation Initiating Implementing Refining Sustaining
Team Norms Norms have not been developed. Norms are rarely followed consistently. Norms are usually followed. Norms are routinely reviewed
and followed at each meeting. Norms are deeply embedded in the team.
Focus on Student Learning No focus around student learning. Rarely is there collaboration
on student learning.
Usually, the team begins discussion of student learning and achievement.
Discussion of student learning and achievement has gone beyond implementation.
Student learning is deeply embedded and extends into the dialogue. Consistent focus on improving student achievement.
Shared Responsibility and Follow Through of
Tasks Assigned at Meeting
Team has one person who dominates and seems to take the responsibility of the whole team.
Rarely do more than two people participate and share responsibility of the team.
Most of the team is usually active and shares responsibility. People often have to be reminded of their assigned work.
Most of the team is routinely active and shares responsibility. Most people do their assigned work without reminders.
Consistently have full team participation and sharing of responsibility. No one has to be reminded of his/her assigned work.
Professional Communication
The team does not: • Actively listen • Have respectful discourse • Focus on the topic • Formulate questions • Contribute to the intellectual content of the PLC discussion • Show components of professional communications
The team rarely: • Actively listens • Has respectful discourse • Focuses on the topic • Formulates questions • Contributes to the intellectual content of the PLC discussion • Shows components of professional communications
The team usually: • Actively listens • Has respectful discourse • Focuses on the topic • Formulates questions • Contributes to the intellectual content of the PLC discussion
The team routinely: • Actively listens • Has respectful discourse • Focuses on the topic • Formulates insightful questions • Contributes insight or inspiration to their peers
The team consistently: • Actively listens • Has respectful discourse • Focuses on the topic • Formulates insightful questions • Contributes insight or inspiration to their peers
Problem Solving Using Research and
Information Sharing
The team does not discuss research or ideas about teaching strategies. No problem solving.
The team rarely provides useful research or teaching strategies when participating in the team discussion. Rarely is there any problem solving
The team usually provides useful research and teaching when participating in the team discussion. The team usually participates in problem solving.
The team routinely gathers research and shares teaching strategies in the team discussion. The team routinely problem solves.
The team has embedded gathering research and the sharing of teaching strategies. Defends/rethinks ideas relating to the team's SMARTe goals. Team members take the initiative outside of PLC time to look for further information. The team consistently problem solves.
Parkrose School District School Improvement Department (revised 9.26.11) Page 25 of 53

PLC Meeting Feedback Form
Name of PLC: _____________________________________________________
Meeting Date: ___________________________________________________________________
Team Goal: _______________________________________________________
Commendations (What was going well):
• _____________________________________________________________________________
_____________________________________________________________________________
• _____________________________________________________________________________
_____________________________________________________________________________
• _____________________________________________________________________________
_____________________________________________________________________________
Questions/Suggestions (Focus areas):
• _____________________________________________________________________________
_____________________________________________________________________________
• _____________________________________________________________________________
_____________________________________________________________________________
Members Present: Members Absent (List Reason) _______________________________________ _______________________________________
_______________________________________ _______________________________________
_______________________________________ _______________________________________
_______________________________________ _______________________________________
_______________________________________
Parkrose School District School Improvement Department (revised 9.26.11) Page 26 of 53

Data Organizer School: ______________________________ Identify an assessment measure (attendance, grades, OAKS scores, easyCBM, formative assessment), and complete the following table. Assessment Measure ___________________________________ Date of Analysis _____________________________ Proficiency Standard ____________________________________ Close to Proficient ___________________________
Based on your data analysis, what hypothesis do you have? What indicators do we have that we are progressing? Are there things now that we can change to align to our goals? What help do you need?
Category: # of Students
Assessed # of Student
Proficient # of Students Close
to Proficiency # of Students Not Proficient
% of Students Proficient
Parkrose School District School Improvement Department (revised 9.26.11) Page 27 of 53

Analysis of Student Work
Name: SampleSampleSampleSample Mentor:
Grade Level/Subject Area: Date:
Student Performance Area Selected for Analysis:
Performance Objective:
Students will develop factual multiple paragraph compositions to include: min. 3 paragraphs, topic sent, @
beginning, intro., supportive facts, conclusion, correct indentation
2. Sort the students’ work and write the students’ names in the appropriate column.2. Sort the students’ work and write the students’ names in the appropriate column.2. Sort the students’ work and write the students’ names in the appropriate column.2. Sort the students’ work and write the students’ names in the appropriate column.
objective not met objective partially met objective met exceeding objective
Christian
Sam
Alex
Jose
Carl
John
Arron Brian
Jake
Juan
Ebony
Raquel
Omar
Frankie
_____ % of class
_____ % of class _____ % of class _____ % of class
3. Choose one sample from each category and describe the performance of each selected student.3. Choose one sample from each category and describe the performance of each selected student.3. Choose one sample from each category and describe the performance of each selected student.3. Choose one sample from each category and describe the performance of each selected student.
objective not met objective partially met objective met exceeding objective
Sam:
� 1 paragraph
� unclear topic sentence
� did not indent
� no factual information
� no supporting details
Carl:
� 2 strong paragraphs
� brief conclusion
� limited facts
� clear topic sentence
� indention
Ebony:
� 3 paragraphs
� 1st
sentence topic
sentence
� intro., support (using
facts)
� clear conclusion
� proper indention
Frankie:
� 4 paragraphs
� 1st
sentence topic
sentence
� intro., support (using
facts)
� clear conclusion
� includes illustration
4. Describe the learning needs of the identified students.4. Describe the learning needs of the identified students.4. Describe the learning needs of the identified students.4. Describe the learning needs of the identified students.
objective not met objective partially met objective met exceeding objective
Sam:
� examples (visual) that
match criteria
� 1:1 or peer tutor
paragraphs, review basic
structure + how to gather
factual info
Carl:
� review conclusion +
indentation
� fact gathering tools
Ebony:
� develop more comple
sent. structure
� expand composition
Frankie:
� use variety or research
tools
� expand composition
� develop factual reports
5. Identify differentiated strategies/instruction to move students forward. Note any patterns and trends. Consider 5. Identify differentiated strategies/instruction to move students forward. Note any patterns and trends. Consider 5. Identify differentiated strategies/instruction to move students forward. Note any patterns and trends. Consider 5. Identify differentiated strategies/instruction to move students forward. Note any patterns and trends. Consider
resources and/or personnel to sresources and/or personnel to sresources and/or personnel to sresources and/or personnel to support you.upport you.upport you.upport you.
objective not met objective partially met objective met exceeding objective
� reduced assignments
� focus on 1 strong para.
gradually increase
expectation
� examples of paragraphs
with and without errors
� graphic organizers vary
type used w/levels
� extended time to
complete assignment
� develop more complex
sentence structure
� cooperative learning
groups
� graphic organizers vary
type used w/levels
� develop more complex
sentence structure
� variety of research skills
� cooperative learning
groups
� graphic organizers vary
type used w/levels
� Peer coaching
� Instruction in factual
report writing
� variety of research skills
cooperative learning
groups
� graphic organizers vary
type used w/levels
SAMPLE
Parkrose School District School Improvement Department (revised 9.26.11) Page 28 of 53

Instructional Strategies Brainstorm and discuss possible instructional strategies that will improve or have improved student performance for the assessment being targeted.
Be sure to extend your instructional repertoire rather than relying on what has always been done.
Consider WICR and Marzano’s effective teaching strategies. Target Group (i.e. Nearly Meeting) ______________________________________
Evaluate and Analysis: √ Analyze each effective teaching strategy/technique in terms of the impact it has on student
learning. √ Consider what other teachers are implementing to cause a high degree of success. √ Discount strategies that focus on student behaviors (i.e. Students are not turning in their
work samples, so we will… Strategy or Strategies to Implement √ Identify two or three teaching strategies that the group will implement in their classrooms
marking them with an X. √ Of the strategies selected with an X, label Teacher Implemented Strategies with a “T” and
Student Implemented Strategies with an “S.” √ Collaborate on the one or two strategies that we all agree to implement during the next
teaching period. Additional Supports Needed √ If the strategy is new to the data team, identify what resources you will need to implement in
your classroom (i.e. Literacy Coach, AVID Coach, Math Coach, etc.) effectively. √ If new or additional strategies are needed, identify how the data team will collaborate with
experts to identify research-based strategies.
Parkrose School District School Improvement Department (revised 9.26.11) Page 29 of 53

Interventions For each of the strategies the team agrees to implement from the previous table, differentiate between teacher behaviors (i.e. instructional strategies) and student behaviors (activities that students will complete) that will result in an increase in student performance. Teacher Behaviors: What will teacher say, do, etc.
How Often?
Student Behaviors: What will students hear, say, do, etc.?
How Often?
Instructional Strategy 1
Instructional Strategy 2
Instructional Strategy 3
Parkrose School District School Improvement Department (revised 9.26.11) Page 30 of 53

I Do, We Do, Y’all Do, You Do
Instructional Planning Worksheet
Please attach and/or list texts, activities, support materials, worksheets, etc. to your planning.
Learning Objective (written in student-friendly terms):
_______________________________________________________________________
Level of Scaffolding Lessons, Activities, Materials, Assessments
I do. What will I model? How will I model it? What will the kids do?
We do – I do, you help. What can I do to get the kids participating in learning the skill/objective?
Y’all Do – You do in groups, I help. How can the kids work together at their level (with your support) to practice the skill/objective?
You do – You do. How can the kids practice the skill independently at their level? How will they check their answers?
You do – You do. How will I assess that ALL students have learned my objective?
Parkrose School District School Improvement Department (revised 9.26.11) Page 31 of 53


Supporting Documents and Resources
Supporting Documents and Resources (Additional resources to help with your professional learning community)
Section 3 Contents:
District Initiatives 2011-2012 ................................................................................................................. 33
OAKS, Oregon Assessment of Knowledge & Skills ............................................................................... 34
Cultural Shifts in a Professional Learning Community .......................................................................... 35
Collaboration ......................................................................................................................................... 38
Accurately Reporting Student Standard-Based Progress...................................................................... 39
PLC Meeting Note Documentation ........................................................................................................ 40
Parkrose Instructional Framework ......................................................................................................... 41
Instructional Strategies Menu ................................................................................................................ 43
Parkrose Pyramid of Interventions ........................................................................................................ 44
Classroom Instruction Within................................................................................................................. 45
A Simultaneous Loose/Tight Framework ............................................................................................... 45
Assessment System Diagram ............................................................................................................... 46
Common Formative Assessments ......................................................................................................... 47
Data Analysis and Student Work ........................................................................................................... 48
Good Statistical Practice in Education .................................................................................................. 49
Definitions ............................................................................................................................................. 53
Parkrose School District School Improvement Department (revised 9.26.11) Page 32 of 53

District Initiatives 2011District Initiatives 2011District Initiatives 2011District Initiatives 2011----2012201220122012
Parkrose School District School Improvement Department (revised 9.26.11) Page 33 of 53

OAKS, Oregon Assessment of Knowledge & SkillsOAKS, Oregon Assessment of Knowledge & SkillsOAKS, Oregon Assessment of Knowledge & SkillsOAKS, Oregon Assessment of Knowledge & Skills
Oregon State Standards
School-Based Common Formative (Pre) Assessments
Data Teams & Effective Teaching Strategies
PLC
Data Teams & Effective Teaching Strategies
PLC
School-Based Common Formative (Post) Assessments
“Unwrapping” Standards, Big Ideas, and Essential Questions
End-of-Course Summative Assessment
(Secondary)
District Benchmark Formative or Summative Assessments
(Elementary/Secondary)
OAKS (Oregon Assessment of Knowledge & Skills Tests, Writing Assessment, Work Samples)
Conceptual Units of Instruction with
Classroom Performance Assessment Tasks and Scoring
Guides
Priority (Power) Standards
Parkrose School District School Improvement Department (revised 9.26.11) Page 34 of 53

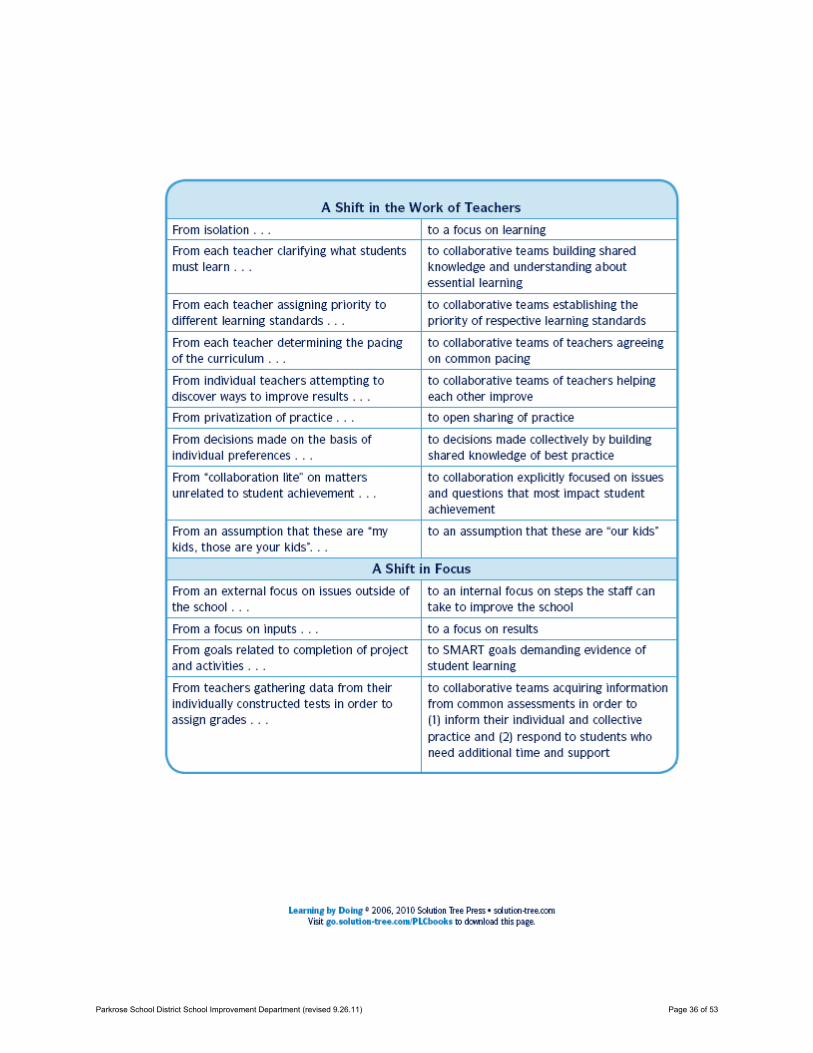
Cultural Shifts in a Professional Learning Community
Parkrose School District School Improvement Department (revised 9.26.11) Page 35 of 53
Parkrose School District School Improvement Department (revised 9.26.11) Page 36 of 53

Parkrose School District School Improvement Department (revised 9.26.11) Page 37 of 53

Collaboration
"Educators committed to working collaboratively in ongoing processes of collective inquiry and action research to achieve better results for the students they serve. Professional learning communities operate under the assumption that the key to improved learning for students is continuous job-embedded learning for educators." Learning by Doing (2006)
A Collaborative Culture
Introducing new teaching practices or refining power standards is challenging and complex. Teacher teamwork and collaboration makes these complex tasks more manageable, stimulates new ideas, and promotes coherence in a school's curriculum and instruction. Working together, teachers have the skills and resources to attempt new practices that would exhaust the energy, skill, or resources of an individual teacher. The accomplishments well-organized group is greater than the accomplishments of an isolated individual (Little, 1987, p. 496). It takes time, however to overcome years of habit, thought, and isolation.
From All Things PLC:
A PLC is composed of collaborative teams whose members work interdependently to achieve common goals linked to the purpose of learning for all. The team is the engine that drives the PLC effort and the fundamental building block of the organization. It is difficult to overstate the importance of collaborative teams in the improvement process. It is equally important, however, to emphasize that collaboration does not lead to improved results unless people are focused on the right issues. Collaboration is a means to an end, not the end itself. In many schools, staff members are willing to collaborate on a variety of topics as long as the focus of the conversation stops at their classroom door. In a PLC, collaboration represents a systematic process in which teachers work together interdependently in order to impact their classroom practice in ways that will lead to better results for their students, for their team, and for their school.
References DuFour, R., DuFour, R., Eaker, R., & Many (2006). Learning by Doing: A Handbook for Professional Learning Communities at Work™, pp. 2–4. http://www.allthingsplc.info/about/aboutPLC.php Inger, Mortan (1993) Teacher Collaboration in Secondary Schools. Retrieved from: CenterFocus Number 2 / December 1993. University of California – Berkeley http://vocserve.berkeley.edu/centerfocus/CF2.html
Parkrose School District School Improvement Department (revised 9.26.11) Page 38 of 53

Accurately Reporting Student Standard-Based Progress Prerequisite Collaborative Planning
By Robert Eaker and Janel Keating Workshop: Leading in Collaborative Teams
Evidence of
Meeting the
Standard (What would the
standard, if met,
look like in student
work?)
Common
Scoring
Rubrics for
Formative
and
Summative
Assessments (What would
accurate responses
look like?)
Accurate
Reporting of
Pupil
Progress
“Power”
Standard (What is essential
that every student
must learn?)
Parkrose School District School Improvement Department (revised 9.26.11) Page 39 of 53

PLC Meeting Note Documentation The collection of evidence is vital to change in educational practices. Davies (1999) suggests that evidence based practice in education operates at two levels. The first is to utilize evidence from the educational research and literature; the second is to establish sound evidence, by systematically collecting information about particular phenomena. A school that wishes to improve practice needs to do both. An evidence-based approach to managing change is vital to school improvement. The evidence collected provides a basis for making judgment on the evaluation of how the improvement is implemented. A school establishes, implements, and monitors the continuous process of improvement that focuses on student learning. A school is successful in meeting this goal when it implements a collaborative and ongoing process for improvement that aligns the functions of the school with the expectations of district initiatives. Improvement efforts are sustained and the school demonstrates progress in implementing new practices with the collection of evidence such as meeting notes. New improvement efforts are informed by the results of earlier efforts through reflection and assessment of documents from the improvement process. In line with this thinking, Hargreaves (1999) has suggested that evidence based practice is an important term for us to consider when wishing to move towards school improvement and teachers developing a soundly informed knowledge base. References Davies, P. (1999). What is Evidence Based Education? The British Journal of Education Studies, 47 (2) pp. 108 - 121. Hargreaves, D. (1999). Revitalising Educational Research: Lessons from the Past and Proposals for the Future. The Cambridge Journal of Education, 29 (2) pp. 242 - 260.
Parkrose School District School Improvement Department (revised 9.26.11) Page 40 of 53

Parkrose Instructional Framework
Parkrose School District School Improvement Department (revised 9.26.11) Page 41 of 53

Parkrose School District School Improvement Department (revised 9.26.11) Page 42 of 53

Instructional Strategies Menu Acronym Memory Method Action Projects Acting Out Agree/Disagree Matrix Agreement Circles Air Drawing Alphabet Summary Analyzing Perspectives Application Cards Artifacts Strategy Author's Chair Assumption Smashing Authentic Questions Biopoem Book Talk Brainstorming Brochure Build Background Knowledge Bulletin Boards C.A.F.E. Strategies Capsule Vocabulary Categorizing Cheat Notes Class Publication Classroom Conversation Cloze Procedure Clustering Collages Commercial Compare & Contrast Competitions Computer Assisted Instruction Concept Formation Concept Map Conducting Experiment Creative Problem Solving Debates Deliberations/Devil’s Advocate Demonstration Discussion Drill & Practice Essay Exit Tickets Explain, Restate, Show Explicit Teaching Field Trip Find Someone Who Find the Truth Finding Clues in a Picture
Format Matters Four Corners/Your Choice Four Square Draw Free Writing Games Grab Bag Gradual Release of Responsibility Graphic Organizers Guided & Assisted Reading Guided Questions for Reading/Video Guided Reading & Thinking Heterogeneous Grouping Homogeneous Grouping I do, we do, you do Idea Spinner Inquiry Inside-Outside Circle Instructional Groups Interactive Reading Interviewing Jack Kerouac Quick Talk Jigsaw Journal Writing Jumbled Summary K-W-L Chart Learning Centers Learning Logs Literature Circles Mini Lessons Model Building Multiple Intelligences Modeled Reading Modeled Writing Needs-Based Grouping No Opt Out Novel Study One Word Summary Paired Reading Peer Conferencing Peer Partner Learning Picture Book or Illustrator Study Prediction Raffle Problem Solving QARs Question War Questioning Levels Quick Draw Quick Talk RAFT Random Item Challenge Read Aloud
Read, Cover, Remember, Retell Read & Paraphrase Read & Respond Read, Pause & Reflect Readers' Theater Readers' Workshop Reading Strategies Reciprocal Reading Reflect & Refine Research Project Response Journal Reverse Think Aloud Right is Right Role Playing Say Something Technique Scaffolding Self-Monitoring Strategies Shared Reading Simulation Sort Cards SQ3R Stretch It Story Mapping Storytelling Student Discovery Study Group Take a Stand Talking Circle Teacher Demonstration Ten Plus Two Think Along Think Aloud Think, Pair, Share Think Together Three, Two, One Ticket Out TRIP Turn & Talk Two-Word Technique Vegas Visual Imaging Vocabulary Log Walls Are Clozing In Webbing WebQuest Word Wall Writer's Workshop Writing Conference Writing Modes Writing Process WritingTrait
Parkrose School District School Improvement Department (revised 9.26.11) Page 43 of 53

Parkrose Pyramid of Interventions
ACADEMIC BEHAVIOR
TIER 3-Intensive All Schools: *Specially designed instruction (ex: Edmark reading, Corrective Reading, STAR) * Individualized instruction MS & HS: Language! Curriculum
TIER 2-Strategic Elementary:
• Reading-Read Naturally, Read Well, Sidewalks
• Language for Learning (Sh,Pr)
• Small group math Middle School:
• Intervention classes-Reading Writing, Math
• Study skills/Organization groups High School:
• Math Workshop, LA Lab Classes (9-11)
• AVID, PACE, Twilight, Plato, GED
TIER 1-Universal All Schools:
• Core Curriculum
• Common Instructional Strategies (WICR)
• ELD for ELL students
• Sheltered Instruction strategies
• Differentiated Instruction
Elementary:
• Literacy & math blocks
• Universal screening reading, math
Middle School/High School:
• Student planners
• After-school Homework Help
• Credit by Proficiency
TIER 1 Universal All Schools:
• School-wide PBIS o Behavior
expectations taught
o Acknowledgment system (Tiger Paws, Rockets, Cougar Paws, Rock Stars, PRIDE)
• Comprehensive Counseling Curriculum Framework
• After-school activities Elementary:
• Second Step curriculum
• Bully Prevention curriculum
• Playworks Recess Coaches
Support Services updated: 6/13/11
TIER 3 Intensive All Schools:
• Individually designed, Function-based behavior support plan
Middle School: Restorative Justice
Tier 2-Strategic All Schools:
• Small group/individual counseling
• Incentive plans Elementary:
• Check In-Check Out
• Steps to Respect curriculum
• Small group skills instruction
• Structured Recess, Recess Buddies Middle School:
• Check In-Check Out
• Mediation, Community Service, Conflict Resolution groups
• Elevate Oregon High School:
• Lifeskills class, Elevate Oregon
Parkrose School District School Improvement Department (revised 9.26.11) Page 44 of 53

Classroom Instruction Within
A Simultaneous Loose/Tight Framework By Robert Eaker and Janel Keating
Workshop: Leading in Collaborative Teams
1. Am I absolutely clear about what my students should know or be able to do as a result of my instruction? Where these “essential outcomes/power standards” the result of a collaborative effort by my team and are they tired directly to state standards/industry standards and/or MSP?
2. Am I clear and are students clear regarding the
level of proficiency that is expected regarding each standard? Were these proficiency standards collaboratively developed by my team?
3. What will I do to pre-assess where my students
currently are on the standards that are embedded in each unit? What is the relationship between where my students are and the instructional strategies I plan to utilize?
4. As I plan my unit or lesson have I ensured that
every student will practice, in class, the kinds for things for which they will be held accountable for on the formative and summative assessments? Are they practicing things in the fame formats as
the formats on the assessments? How will I monitor their practice?
5. Have I used formative assessment results (both my individual assessments and the common formative assessments that have been developed by the team) to analyze learning levels of my students-student-by-student, skill-by-skill?
6. Have I identified specific homework assignments
that will provide students with focused practice beyond classroom instruction.
7. Have plans been developed for students to
receive additional time and support (especially focused practice) when they experience difficulty in their learning?
8. How will I extend and enrich the learning of students who demonstrate proficiency with regards to the learning standards?
Parkrose School District School Improvement Department (revised 9.26.11) Page 45 of 53

Assessment System Diagram
Oregon State Assessment
District Level Assessments
Classroom
Assessments
Assessment System
ELPA
Extended Assessments
OAKS
Student Friendly Learning Targets
Easy CBMs Interim Assessments
Work Samples
Power Standards
Common Pacing Guide
Common
Pre-Assessment
Differentiated Instruction
Common
Formative Assessment
Revise Instruction
Checks for Understanding
Additional
Time and
Support
Review for Assessments
Common Summative
Assessment
Parkrose School District School Improvement Department (revised 9.26.11) Page 46 of 53

Common Formative Assessments
• Identify the standards representing the greatest need for students to be successful each year in school, in life, and on annual high stakes assessments. Determined by professional judgment, these become the Power Standards or the prioritized standards upon which to place the greatest instructional emphasis throughout the year. • Analyze state assessment data to see where students are scoring low and to identify in the state assessment requirements those standards which receive the most “weight” in terms of frequency and rigor of test items. • Make modifications or changes to initial selection of Power Standards to reflect data analysis and assessment requirements. • “Unwrap” those prioritized standards to identify concepts and skills students need to know and be able to do; determine Big Ideas and Essential Questions to focus instruction and assessment. • Select effective teaching strategies to achieve student understanding of the “unwrapped” concepts, skills, and Big Ideas. • Teach those “unwrapped” concepts and skills in depth by using classroom performance assessment tasks with an emphasis on student writing
Power Standards
“Unwrap” Standards. Big Ideas,
Essential Questions
Performance Assessments
Rubrics
Common Formative
Ass essments
Data-Driven Decision Making
Effective Teaching Strategies
Parkrose School District School Improvement Department (revised 9.26.11) Page 47 of 53

Data Analysis and Student Work To improve student achievement results, use data to focus on a few simple, specific goals.
Mike Schmoker (2003)
Data analysis can be used at various levels within a school. Individual teachers can use it to improve teaching instructional strategies in their classrooms. Groups of faculty can use data analysis to amend areas of concern within a department. Finally, the entire school can use data analysis to reform and bring about school improvement. The results-oriented professional learning community not only welcomes data but also turns data into useful and relevant information for staff. When teacher teams develop common formative assessments throughout the school year, each teacher can identify how his or her students performed on each skill compared with other students. Individual teachers can call on their team colleagues to help them reflect on areas of concern. Each teacher has access to the ideas, materials, strategies, and talents of the entire team. Student work is any common work that all students of PLC members participate, as aligned with the SMARTe goal. By reviewing student work periodically, PLC members have the opportunity to monitor the effect their instruction is having on student achievement prior to the culminating assessment identified by the SMARTe goal. In order to facilitate professional dialog, it is important that all PLC members bring common student work to sessions identified for looking at work. Members are given the opportunity to present work, and seek the advice of colleagues to collaboratively improve student achievement. Student work includes: Anything that students do that demonstrates their increased understanding based on your improved instruction , and allows for meaningful professional dialog.
• Classroom or Unit Assessments • Standards Assessments • Video tapes (of student skills, demonstrations, presentations, etc.) • Writing samples • Common Assessments
Additional resources for looking at student work, including additional suggestions, can be found at www.lasw.org
“Looking at Student Work” When meeting to share student work, PLCs must determine and follow a structure for professional dialog. Options include using protocols for looking at student work particularly protocols that include the criteria for authentic student performance, criteria for authentic assessment, and criteria for authentic instruction. It is imperative to the success of PLCs that all members share student work and participate in the professional dialog to foster collaboration.
Student work should be collected and shared at least 2-4 times annually. This is determined by the PLC, in order to monitor progress toward goal.
Parkrose School District School Improvement Department (revised 9.26.11) Page 48 of 53

Good Statistical Practice in Education
Statistical/Data Presentation Tools Descriptive statistics enable us to understand data through summary values and graphical presentations. Summary values not only include the average, but also the spread, median, mode, range, and standard deviation. It is important to look at summary statistics along with the data set to understand the entire picture, as the same summary statistics may describe very different data sets. Descriptive statistics can be illustrated in an understandable fashion by presenting them graphically using statistical and data presentation tools. When creating graphic displays, keep in mind the following questions (IHI 1995):
• What am I trying to communicate? • Who is my audience? • What might prevent them from understanding this display? • Does the display tell the entire story?
Several types of statistical/data presentation tools exist, including: (a) charts displaying frequencies (bar, pie, and Pareto charts, (b) charts displaying trends (run and control charts), (c) charts displaying distributions (histograms), and (d) charts displaying associations (scatter diagrams). Different types of data require different kinds of statistical tools. There are two types of data. Attribute data are countable data or data that can be put into categories: e.g., the number of people willing to pay, the number of complaints, percentage who want blue/percentage who want red/percentage who want yellow. Variable data are measurement data, based on some continuous scale: e.g., length, time, cost.
Choosing Data Display Tools
To Show Use Data Needed
Frequency of occurrence: Simple percentages or comparisons of magnitude
Bar chart Pie chart Pareto chart
Tallies by category (data can be attribute data or variable data divided into categories)
Trends over time Line graph Run chart Control chart
Measurements taken in chronological order (attribute or variable data can be used)
Distribution: Variation not related to time (distributions)
Histograms Forty or more measurements (not necessarily in chronological order, variable data)
Association: Looking for a correlation between two things
Scatter diagram Forty or more paired measurements (measures of both things of interest, variable data)
Parkrose School District School Improvement Department (revised 9.26.11) Page 49 of 53

Bar and Pie Charts
Bar and pie charts use pictures to compare the sizes, amounts, quantities, or proportions of various items or groupings of items.
When to Use Them
Bar and pie charts can be used in defining or choosing problems to work on, analyzing problems, verifying causes, or judging solutions. They make it easier to understand data because they present the data as a picture, highlighting the results. This is particularly helpful in presenting results to team members, managers, and other interested parties. Bar and pie charts can present results that compare different groups. They can also be used with variable data that have been grouped. Bar charts work best when showing comparisons among categories, while pie charts are used for showing relative proportions of various items in making up the whole (how the "pie" is divided up).
Selecting a Type of Bar Chart
Teams may choose from three types of bar charts, depending on the type of data they have and what they want to stress:
Simple bar charts sort data into simple categories.
Grouped bar charts divide data into groups within each category and show comparisons between individual groups as well as between categories. (It gives more useful information than a simple total of all the components.)
Stacked bar charts, which like grouped bar charts, use grouped data within categories. (They make clear both the sum of the parts and each group’s contribution to that total.)
All graph templates available online: http://www.parkrose.k12.or.us/ Home » Departments » School Improvement » Professional Development Resources
Parkrose School District School Improvement Department (revised 9.26.11) Page 50 of 53

Bar Charts Step 1. Choose the type of bar chart that stresses the results to be focused on. Grouped and stacked bar charts will require at least two classification variables. For a stacked bar chart, tally the data within each category into combined totals before drawing the chart.
Step 2. Draw the vertical axis to represent the values of the variable of comparison (e.g., number, cost, time). Establish the range for the data by subtracting the smallest value from the largest. Determine the scale for the vertical axis at approximately 1.5 times the range and label the axis with the scale and unit of measure.
Step 3. Determine the number of bars needed. The number of bars will equal the number of categories for simple or stacked bar charts. For a grouped bar chart, the number of bars will equal the number of
categories multiplied by the number of groups. This number is important for determining the length of the horizontal axis.
Step 4. Draw bars of equal width for each item and label the categories and the groups. Provide a title for the graph that indicates the sample and the time period covered by the data; label each bar.
Descriptive Statistics When simply describing a set of data with summary statistics, useful statistics to present are the mean, the number of observations and a measure of the variation or "scatter" of the observations, as well as the units of measurement. The range or the standard deviation (SD) is useful measures of the variation in the data. The standard error (SE) is not relevant in this context, since it measures the precision with which the mean of the data estimates the mean of a larger population. If there are a large number of variables to be described the means, SDs etc. should be presented in a table. However if there are only one or two variables, these results can be included in the text. For example:- 'The initial weights of 48 ewes in the study had a mean of 34.7 kg and ranged from 29.2 to 38.6 kg.' or 'The mean initial weight of ewes in the study was 34.7 kg (n = 48, SD = 2.61)'. When quoting a standard deviation (or standard error), a (sign is irrelevant. As well as being unnecessary here, a (sign is ambiguous if used without explanation in expressions such as 'Mean = 34.7 ( 3.6 kg'. It is not clear whether the number after the (sign is a standard deviation, a standard error or a confidence interval.
Parkrose School District School Improvement Department (revised 9.26.11) Page 51 of 53

Basic points
1. Data can be presented in the text, in a table, or pictorially as a chart, diagram or graph. Any of these may be appropriate to give information the reader or viewer is supposed to be able to assimilate "from cold" while reading or listening.
2. Text alone should not be used to convey more than three or four numbers. Well presented tables and graphs can concisely summarize information which would be difficult to describe in words alone. On the other hand, poorly presented tables and graphs can be confusing or irrelevant.
3. When whole numbers (integers) are given in text, numbers less than or equal to nine should be written as words, numbers from 10 upwards should be written in digits. When decimal numbers are quoted, the number of significant digits should be consistent with the accuracy justified by the size of the sample and the variability of the numbers in it.
4. In general, tables are better than graphs for giving structured numeric information, whereas graphs are better for indicating trends and making broad comparisons or showing relationships.
5. Tables and graphs should, ideally, be self-explanatory. The title should be informative, and rows and columns of tables or axes of graphs should be clearly labeled.
6. Descriptions of the numbers represented in a table or picture should be kept as simple as possible, while having sufficient detail to be useful and informative. As with the original data, it is important that summaries make clear what was measured - so there is no important uncertainty about the definition and the units; where the data were collected - so the extent of the coverage is clear; when - so the time period represented is explicit; and if the data are quoted from elsewhere, the source .
7. Statistical information, e.g. appropriate standard errors, is usually required in formal scientific papers. This may not be necessary for a more general audience. Such statistical information should be presented in a way that does not obscure the main message of the table or graph.
8. Conveying information efficiently goes along with economical use of "non-data ink". For example, "perspective" should not be added to two-dimensional charts and graphs. It impedes quick and correct interpretation.
9. Tabular output from a computer program is not normally ready to be cut and pasted into a report. For example a well-laid-out table need never include vertical lines.
References: BTS’s Guide to Good Statistical Practice http://www.bts.gov/publications/guide_to_good_statistical_practice_in_the_transportation_field/index.html Population Reference Bureau: Guidelines for Effective Data Presentations http://www.prb.org/EventsTraining/TrainingMaterials/GuidelinesforEffectivePresentations.aspx
Parkrose School District School Improvement Department (revised 9.26.11) Page 52 of 53

Definitions Power Standards are a subset of the entire list of the state or district content and performance standards. These are prioritized standards that are determined as being absolutely essential for student understanding and success (a) in each level of schooling; (b) in life; and (c) on all high-stakes assessments. “Unwrapping” the standards refers to a simple yet powerful technique of analyzing the Power Standards—and other related standards—to identify the critical concepts and skills students need to know and be able to do. Big Ideas and Essential Questions that emerge from the “unwrapped” standards are then used to focus and align both instruction and assessment. Instructional unit design follows—not leads—the selection and “unwrapping” of Power Standards and includes designing conceptual units of study with performance tasks and accompanying rubrics or scoring guides. Classroom performance tasks serve as “learning vehicles” that enable students to apply and understand the “unwrapped” concepts and skills and develop their own Big Idea responses to the Essential Questions. A pre-assessment is given to students prior to designing instructional units and performance assessments. A post-assessment is given at the conclusion of the instructional unit. Formative classroom assessment results can provide immediate feedback to both teachers and students regarding current levels of student understanding. These same results provide teachers with feedback regarding the effectiveness of instruction and how to better meet learning needs of students. Summative classroom assessment results provide a final measure for determining if learning goals have been met. Working together, formative and summative assessments provide “multiple measures” of evidence regarding the degree of student understanding of the standards in focus. Common formative and summative assessments may be identical to individual classroom formative and summative assessments except for one notable distinction—they are developed collaboratively in grade level and department teams and incorporate each team’s collective wisdom (professional knowledge and experience) in determining the selection, design, and administration of those assessments. Collaborative scoring of student work occurs after administering the common formative pre- and post-assessments to students, particularly if the assessments are of the constructed-response type. Participating teachers meet to evaluate the student papers by means of a scoring guide designed for that purpose, and then sort the student papers by predetermined levels of proficiency. Collaborative scoring promotes fair and accurate determination of proficiency levels. Grades reflect student performance on summative assessments. Data-driven instructional decision-making involves five steps: (1) the charting of student performance data; (2) analyzing the data; (3) setting a goal for improvement; (4) selecting specific teaching strategies to meet that goal; and (5) determining results indicators to gauge the effectiveness of the selected teaching strategies. Participating teachers write an action plan to guide the implementation of their five data-driven steps to improve student achievement. Planning for instructional interventions and accelerations results from analyzing the formal and informal assessments teachers use to diagnose and monitor student learning
Parkrose School District School Improvement Department (revised 9.26.11) Page 53 of 53