professor tess kay - oss.scot
TRANSCRIPT

Sport and social inequality
Professor Tess Kay
OBSERVATORY FOR SPORT IN SCOTLAND: ACADEMIC REVIEW PAPER
Sport and social inequality
Professor Tess Kay
OBSERVATORY FOR SPORT IN SCOTLAND: ACADEMIC REVIEW PAPER
money
povertylethargy
sadnessviolence
addiction
helpunemployment
stress
hope
lessne
sscrime
depe
nden
cy
recessionproblems
despairange
r
abus
e
lifestyle
homeles
s
depression

ACKNOWLEDGEMENTS
My research has been circling sport, deprivation and poverty since the Thatcher era, so I am very grateful to the Observatory for Sport in Scotland for giving me the chance to go round again and hopefully get a bit closer. Working with OSS has been a very collegial process and I have appreciated the collaborative approach everyone has adopted. I have had invaluable input from knowledgeable people who have kindly helped me shape my ideas about the scope of this paper, assisted compiling the evidence, and made suggestions for very pertinent additions to this final version. Thank you therefore to Jon Best for the breadth and depth of his encyclopaedic knowledge and his willingness to share it on demand. Thank you also to Dr Larissa Davies and Nick Rowe for responding to my specific requests as I worked on this, and to the authors of the OSS reviews on related topics who were kind enough to share their own preliminary drafts - Nick and Larissa again, and Professor Simon Shibli and Dr Jane Dennehy. John Taylor at the University of Stirling not only encouraged me to give more specific attention to the Scotland and Glasgow ‘effects’, but also directed me to excellent sources. All of this has been underpinned by Marie McQuade’s and subsequently David Ferguson’s efficient leadership and friendly liaison on behalf of OSS.
1
INTRODUCTION
Sport does not have too bad a record in addressing inequality. In Scotland as in the other UK home nations, disparities in sport participation have been recognised and addressed for several decades. Efforts to increase participation have been approached from a diversity perspective, as in wider social policy. The report on Equality and Sport Research (Research Scotland, 2016) commissioned to inform sportscotland’s work addressed all nine of the protected characteristics identified in the Equality Act 2010 – age, disability, gender reassignment, marriage and civil partnership, pregnancy and maternity, race, religion or belief, sex, and sexual orientation.
The diversity approach has been valuable in and beyond sport. It recognises that people’s characteristics can expose them to social processes that disadvantage them – such as when sexism is experienced by girls and women, racism by people of minority ethnic groups, and disregard and stigma by people with disabilities. In sport, this has prompted a wide range of targeted initiatives, underpinned by research that has identified the need to address the practical and cultural constraints limiting participation. There has also been some recognition that the interplay between these characteristics can disadvantage people in multiple ways, such as being both female and of a minority ethnic group, or having a disability and being elderly. This intersectional approach has been important in seeing beyond single characteristics as defining identities, and recognising the potential for compound effects to arise.
But in all this attention to equalising access to sport, where is poverty and material deprivation? Where is the consideration of social disadvantage in its many guises - low income, socio-economic status, poor education? Because it is these characteristics that underpin inequalities and account for the deprivations that disproportionately affect groups with particular characteristics. At population level, wealth protects against acute hardships; across the protected characteristics the greatest divides are not between those who have the ‘advantaged’ (e.g. male; white; able) and ‘disadvantaged’
2

status (e.g. female; BAME; with disability), but between those who are well resourced and those who are not. Men and women resident in Scotland’s least deprived neighbourhoods, for example, have more in common with each other’s everyday lifestyles and living conditions than they have with adults of their own gender who are low qualified, low paid, work in insecure employment sectors and live in the most deprived neighbourhoods. It is not, therefore, characteristics such as gender and race alone that disadvantage people, but their role in exposing individuals to social inequality – e.g. the effects of racism, sexism and ageism in affecting employment status and progression. More than the protected characteristics, it is ‘low social position’ (e.g. Marmot, 2010) that divides those who are well resourced from those who are vulnerable and lack power. In this respect social inequality is the fundamental intersectional force – the ultimate divider.
This is the issue that this paper addresses. Its purpose is to rescue social inequality from the shadow of the protected characteristics and reposition it as the primary influence on sport participation inequalities in Scotland. This argument is developed over five sections. Sections 1 and 2 lay the groundwork, by explaining how the concept of ‘social inequality’ has been interpreted and applied in the paper (Section 1) and providing a statistical overview of how disadvantage and deprivation are patterned across the Scottish population (Section 2). Section 3 then collates evidence on the relationship between social inequality and sport, and finds that this is sparse: although national data consistently revealed marked disparities in aggregate participation levels, no more detailed analysis has been undertaken for more than a decade. Despite this neglect, or perhaps because of it, staff in the Scottish sport sector regard social inequalities as the first priority for raising participation: the survey conducted to inform the Equality and Sport Research report (Research Scotland, 2016) found more staff expressed a need for training on engaging people disadvantaged through social inequalities than for any other characteristic. Section 4 begins to address this need, focusing not on sport delivery, but by providing as detailed an account as possible of the multiple ways in which people are affected and
3 4
constrained by social inequality. This approach is intended to demonstrate that initiatives to address social inequalities in sport participation must be grounded in knowledge and understanding: social inequalities have corrosive effects on individuals, families and communities and before these challenges can be addressed they must be recognised and understood. The wide availability of high-quality relevant research and data is signposted. Section 5 concludes the paper, offering an agenda to redress the neglect of social inequalities in sport in Scotland, and identifies the contributions required from sport policy, practice and research. As part of this it notes that these require appropriate theoretical underpinning that goes beyond narrowly-focused behaviour change theory to recognise the - sometimes overwhelming – impact of external contexts and influences on individuals.
In this paper as whole there is more content about social inequality than about sport. This is for three reasons. Firstly, and this is a main issue identified by this paper – and equally by other authors of the Observatory for Sport in Scotland reviews – there is not much recent data or research on this beyond the simple aggregate cross-tabulations in the Scotland’s People reports of the annual Scottish Household Survey (Scottish Government, 2018a), reported also in Simon Shibli’s review of Sport for the Future for the Observatory. Filling this gap is one of the priorities in the recommendations. Secondly, and perhaps less obviously, it is not knowledge about sport that has to improve to address social inequality, so much as understanding of social inequalities – and specifically, understanding of poverty and deprivation, and how these interact with other characteristics. It is this knowledge that is almost wholly missing from the numerous analyses of ‘sport and diversity’ undertaken across the UK in the last three decades. Finally, addressing this now aligns with the unique position adopted by the Scottish Government, which alone among the UK parliaments includes addressing socio-economic disadvantage as a duty within the Equalities Act. The ‘socio-economic’ duty requires a range of public bodies to address socio-economic inequalities in their strategic policies; central to the original Equalities Act passed in April 2010, it was dropped rapidly by

Home Secretary Theresa May under the Coalition Government in November 2010. In Scotland it was reinstated in April 2018 through a new section of the Equality Act, a ‘Fairer Scotland Duty’ that “places a legal responsibility on particular public bodies in Scotland to actively consider (‘pay due regard’ to) how they can reduce inequalities of outcome caused by socio-economic disadvantage, when making strategic decisions” (Scottish Government, 2018b). That the Observatory has commissioned a review specifi cally on this topic provides a unique opportunity for the sport sector in Scotland to disrupt entrenched approaches, embrace this revived national agenda, and take the lead across the UK in addressing the most fundamental constraints to participation in sport and other physical activity – social inequalities.
5
1.1 INTRODUCTION
The purpose of this paper is to focus on ‘social inequality’, and to consider how this may infl uence engagement in sport and other physical activity. This section explains how this term has been interpreted and applied in this paper, and discusses the terminology used to describe it. It also provides a brief overview of the relationship between social inequality and social capital, to clarify the diff erences between these concepts.
1.2 APPROACH
Social inequality is a multi-faceted concept, involving the distribution of wealth and poverty, patterns of high and low social ‘status’ and processes of social inclusion and exclusion. A variety of measures are used to capture its dimensions, including individual and household indicators of income, education, occupation and socio-economic group. Indices are also used that capture area characteristics, including factors such as housing quality, overcrowding, availability of services, and environmental conditions such as air quality. The Scottish Index of Multiple Deprivation 2016 contains 38 such indicators (Scottish Government, 2016). It is not suffi cient, therefore, to conceptualise social inequality simply in terms of fi nancial resources, or to focus exclusively on the individual as the unit of analysis: it has broader social impacts, and collective ones.
The approach taken in this paper is therefore:
n Firstly, in terms of reducing inequalities, the focus is clearly on those towards the disadvantaged end of the spectrum of inequality – eg, with low rather than high incomes, living in deprived rather than affl uent neighbourhoods, experiencing insecure sub-employment rather than ‘successful’ careers. The paper aims to identify and understand the situation of these people.
6
Section 1 SOCIAL INEQUALITY AND DEPRIVATION
photo: Adobe stock

n In defining this population, the central element is material deprivation – ie, poverty and its wider disadvantages and deprivations. Crudely speaking this paper therefore focuses on ‘poor people’ – a broad swathe that crosses all of the protected characteristics. Yet despite its prevalence, material deprivation has seldom featured prominently in sport policy and research, and has frequently been omitted.
n In this paper material deprivation is conceptualised as having major social dimensions and the experience of living in poverty as a holistic one. The analysis is not therefore concerned only with financial resources, but with the broader consequences of low ‘social position’ to which a wide range of individual, collective and area characteristics contribute.
In short then, this paper examines the situation of disadvantaged people, argues that the role of poverty and disadvantage have been underplayed in sport, demonstrates why an understanding of these impacts is needed if efforts to address low participation are to be effective, and advocates for centring analyses of inequalities in sport policy and practice. It aims to reinstate material deprivation to its rightful place – at the heart of social inequalities that affect life chances across the life course:
Poverty as measured by material deprivation through lack of economic resources remains absolutely central to understanding the causation and patterning of most aspects of social exclusion and a wide range of social outcomes... Attempts to wash ‘poverty’ out of the
policy agenda and government target-setting are quite wrong and unsustainable.
(Bramley, 2017)
7
1.3 SPORT, SOCIAL INEQUALITY AND SPORTING CAPITAL
It is helpful to distinguish the different contributions that ‘social inequalities’ and ‘social capital’ frameworks make to analysing inequalities in sport participation. The two are quite distinct, though broadly compatible.
The social inequalities framework applied in this paper focuses on the role of social structural influences in affecting people’s capacity to engage in sport. Its aim is to illuminate the wider experiences and lifestyles which foster inequalities in sport participation. It is therefore concerned with overarching social constraints, such as poor mental wellbeing as a result of living in poverty, rather than sport-specific factors, such as a lack of motivation to participate in sport.
In contrast, ‘sporting capital’ addresses attributes directly associated with sports participation. It is a valuable and multifaceted concept with an established intellectual pedigree in sport scholarship. Rowe’s (2015) recent theorisation defines it as “the stock of physiological, social and psychological attributes and competencies that support and motivate an individual to participate in sport and to sustain that participation over time” (p45). These include attributes such as self-efficacy and self-esteem, and social connectedness - such as knowing people who are sporty, and having companions with whom to participate.
Rowe’s (2018) empirical analyses identify strong correlations between individuals’ sport participation and their level of sporting capital, and also show that inequalities in sporting capital map to socio-demographic variations in sport participation. Sporting capital is lower among those with low participation in sport, including older adults compared to younger, females compared to males, and individuals classed as lower SEG compared to higher. This confirms the importance of recognising sporting capital as a feature of inequalities in sport participation.
A sporting capital framework does not however address - and does not claim to - how the attributes of sporting capital come to be socially patterned in this way. In contrast, a ‘social inequalities’ framework focuses on these
8

underlying structural factors. In effect, ‘sporting capital’ addresses the more immediate sport-specific contributors to engagement in sport, while ‘social inequalities’ addresses what Marmot (2010) has termed “the causes of the causes”- the underlying influences that produce unequal sporting capital.
1.4 TERMINOLOGY
The breadth of ‘social inequality’ makes it quite difficult to employ terminology that captures its dimensions consistently and accurately but also reads reasonably fluently. A pragmatic approach has been taken in this paper and a variety of terms are used. The main criterion has been to ensure they are used appropriately, eg when discussing particular indicators such as educational level or income. Some consideration has however also been given to style, and at times the vocabulary is varied simply to avoid undue repetition or complicated phraseology. In general:
n The term ‘social inequality’ is used sparingly; vocabulary that more specifically highlights the socio-economic dimensions of disadvantage is preferred, including ‘poverty’, ‘low-income’ and ‘material deprivation’.
n A range of terms are used to refer to the situation of being ‘disadvantaged’, including ‘socio-economic status/classification’, ‘social position’ and ‘the social gradient’. The term ‘low-income’ is also occasionally used in this broader sense, e.g. in references to ‘low-income sectors of the population’.
n ‘Deprivation’, ‘inequality’ and ‘disadvantage’ are used specifically in relation to discussion of indicators, but also generically as non-technical vocabulary in the general commentary.
9
2.1 INTRODUCTION
Comprehensive data on the scale and distribution of poverty and deprivation across the Scottish population are widely available. The sources used in this section offer methodological rigour and illustrate how easily the sport sector can avail itself of accessible and useful material.
2.2 POVERTY IN SCOTLAND
The recent Discussion Paper on the Drivers of Poverty by the Scottish Government Communities Analysis Division (SGCAD, 2017) provides a good starting point. This report is the first of the series ‘Building the Evidence Base on Tackling Poverty’ and shows that:
n In 2015/16, a fifth of people in Scotland were living in relative poverty (defined as income of less than 60% of the median). This is approximately 1.05 million people, made up of 650,000 working age adults, 140,000 pensioners and 260,000 children. Around one in four children (26%) were living in poverty (SGCAD, 2017: p5). Cross-sectional data such as these confirm that poverty is a minority experience but not a rare one, and is experienced at all stages of the life course.
n Vulnerability to poverty and disadvantage is also transmitted across generations. Analyses of social mobility in the UK highlight how negative experiences in early life affect trajectories across the life course (Social Mobility Commission, 2017). More specific analyses of the situation of young people in Scotland suggest that it is becoming increasingly difficult for the young to escape unfavourable socio-economic circumstances, with transitions to the labour market and advanced education becoming more complex, and opportunities for home-buying more limited (Scottish Government, 2017).
10
Section 2 SOCIAL INEQUALITY, POVERTY AND DEPRIVATION IN SCOTLAND

n Responses to the impacts of poverty are especially severe in Scotland, at national and regional level. Firstly, Scotland demonstrates disproportionately poor health outcomes compared to countries of similar political and economic status, and has the lowest life expectancy and the widest mortalities inequalities in Europe (Walsh et al, 2016). Secondly, within Scotland, ‘excess mortality’ occurs throughout the country but especially in Western Scotland and around the Greater Glasgow area, a pattern that until recently was often referred to as the ‘Glasgow eff ect’.
n The causes and impacts of poverty are multifaceted, and people who are poor are likely to face challenging circumstances in several diff erent areas of their lives, such as housing conditions, employment status, and family situations. Separate indicators are available which can identify these, eg data on labour market participation, employment income, household size and structure, and local area characteristics. Responses to poverty can therefore be informed by analyses which identify which types of people are aff ected, by which factors, allowing more specifi c identifi cation of the challenges diff erent groups may face.
11
The previously-named Glasgow Eff ect, referred to above, is a further and very specifi c manifestation of the varied impact of poverty in Scotland. Attempts to explain “the patterns in Glasgow, and more widely across Scotland”, have identifi ed a diverse array of factors, both past and present. The Glasgow Centre for Population Health’s comprehensive report (Walsh et al, 2016) suggests that historical processes including housing and labour market policies have had long-term eff ects that have intensifi ed vulnerability to current adverse circumstances, including the psychological stress associated with deprivation and economic insecurity (Cowley et al, 2016).
12
2.3 THE UNEQUAL DISTRIBUTION OF POVERTY
Risk of relative income poverty after housing costs, for diff erent groups and household types in Scotland (2015/16) % in poverty
TABLE 1
All people 19%
Household composition*Working age couples with dependent children Working age couples, no dependent children Single working age adults with dependent children Single working age adults, no dependent children Male Female Single pensioners Male Female Pensioner couples
No of children*0 1 2 3+
Urban/rural*Urban 20%Rural 14%
Source: Adapted from SGCAD (2017): p7, Table 1
GenderMen Women
Ethnicity*White – BritishWhite – Other Asian or Asian British Mixed, Black, Black British, Chinese and Other Age group ChildrenWorking age adults Pensioners (age 65+) Disability* People in a household with a disabled adultPeople in a household without a disabled adult People in a household with a disabled child People in a household without a disabled child
18%19%
18%25% 32% 39%
26%20% 13%
23%
17% 27%
18%
18%
11%
37%
26%27%
14%19%10%
16%22%19% 30%
20%14%
photo: Adobe stock
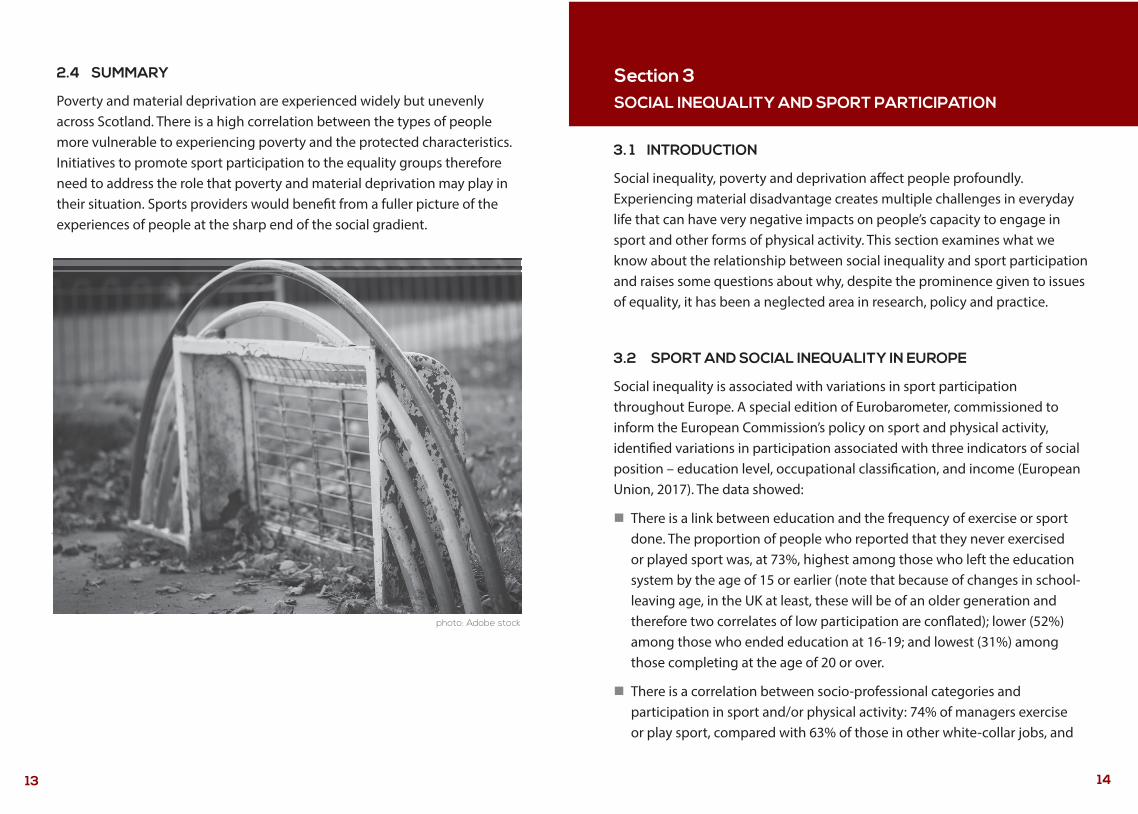
2.4 SUMMARY
Poverty and material deprivation are experienced widely but unevenly across Scotland. There is a high correlation between the types of people more vulnerable to experiencing poverty and the protected characteristics. Initiatives to promote sport participation to the equality groups therefore need to address the role that poverty and material deprivation may play in their situation. Sports providers would benefi t from a fuller picture of the experiences of people at the sharp end of the social gradient.
13
3. 1 INTRODUCTION
Social inequality, poverty and deprivation aff ect people profoundly. Experiencing material disadvantage creates multiple challenges in everyday life that can have very negative impacts on people’s capacity to engage in sport and other forms of physical activity. This section examines what we know about the relationship between social inequality and sport participation and raises some questions about why, despite the prominence given to issues of equality, it has been a neglected area in research, policy and practice.
3.2 SPORT AND SOCIAL INEQUALITY IN EUROPE
Social inequality is associated with variations in sport participation throughout Europe. A special edition of Eurobarometer, commissioned to inform the European Commission’s policy on sport and physical activity, identifi ed variations in participation associated with three indicators of social position – education level, occupational classifi cation, and income (European Union, 2017). The data showed:
n There is a link between education and the frequency of exercise or sport done. The proportion of people who reported that they never exercised or played sport was, at 73%, highest among those who left the education system by the age of 15 or earlier (note that because of changes in school-leaving age, in the UK at least, these will be of an older generation and therefore two correlates of low participation are confl ated); lower (52%) among those who ended education at 16-19; and lowest (31%) among those completing at the age of 20 or over.
n There is a correlation between socio-professional categories and participation in sport and/or physical activity: 74% of managers exercise or play sport, compared with 63% of those in other white-collar jobs, and
14
Section 3 SOCIAL INEQUALITY AND SPORT PARTICIPATION
photo: Adobe stock
only 51% of manual workers. Other groups with low levels of participation include housepersons (33%) and the unemployed (51%).
n There are strong differences in participation levels in relation to the respondent’s financial position: the majority of people who have difficulties paying bills most of the time never exercise or play sport (66%), and nor do 55% of those who have difficulties paying bills from time to time. In contrast, among those who do not have trouble paying bills, only 41% do not exercise.
3.3 EVIDENCE ON SPORT AND SOCIAL INEQUALITY IN SCOTLAND
Poverty, inequality and deprivation are prominent concerns in Scottish social policy, including health and education with which the sport sector is a frequent collaborator. Relevant data and analyses on the impact of poverty in Scotland are therefore easily accessible, with the Scottish Household Survey (SHS) reporting annually through the Scotland’s People report. Published analyses of sport are however limited, going no further than aggregate correlations:
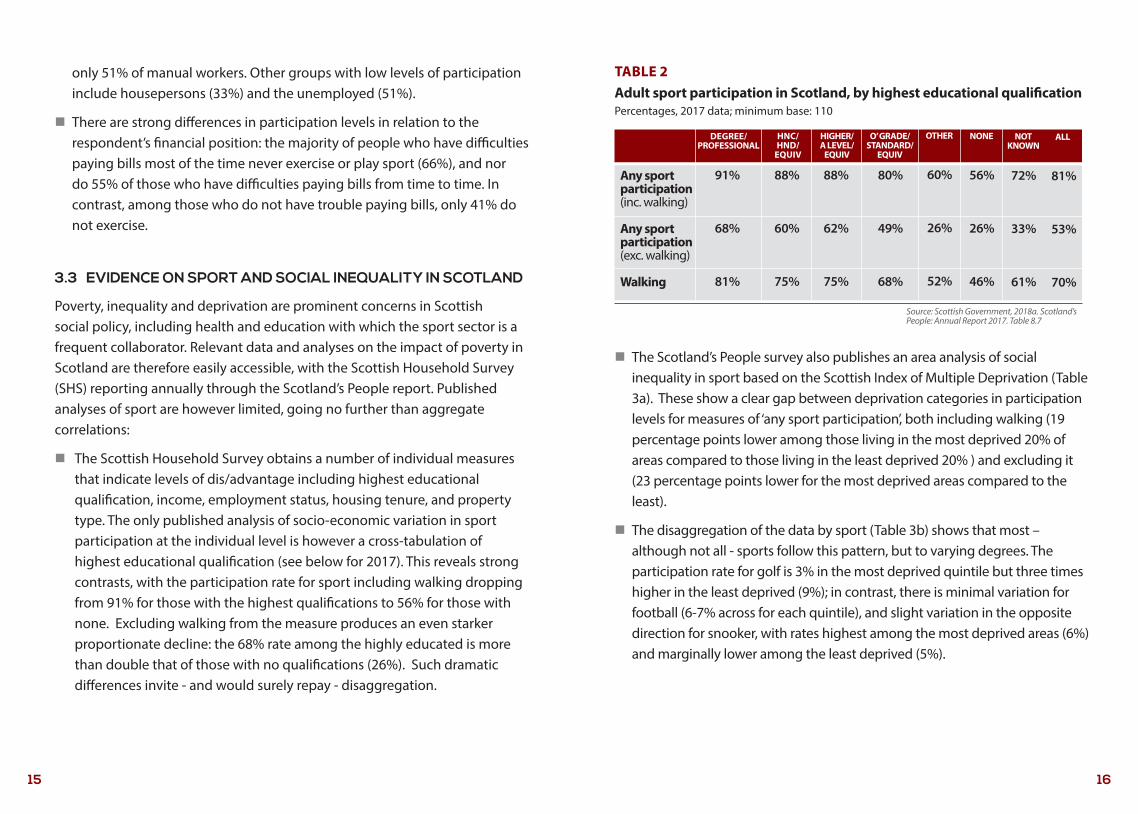
n The Scottish Household Survey obtains a number of individual measures that indicate levels of dis/advantage including highest educational qualification, income, employment status, housing tenure, and property type. The only published analysis of socio-economic variation in sport participation at the individual level is however a cross-tabulation of highest educational qualification (see below for 2017). This reveals strong contrasts, with the participation rate for sport including walking dropping from 91% for those with the highest qualifications to 56% for those with none. Excluding walking from the measure produces an even starker proportionate decline: the 68% rate among the highly educated is more than double that of those with no qualifications (26%). Such dramatic differences invite - and would surely repay - disaggregation.
15
n The Scotland’s People survey also publishes an area analysis of social inequality in sport based on the Scottish Index of Multiple Deprivation (Table 3a). These show a clear gap between deprivation categories in participation levels for measures of ‘any sport participation’, both including walking (19 percentage points lower among those living in the most deprived 20% of areas compared to those living in the least deprived 20% ) and excluding it (23 percentage points lower for the most deprived areas compared to the least).
n The disaggregation of the data by sport (Table 3b) shows that most – although not all - sports follow this pattern, but to varying degrees. The participation rate for golf is 3% in the most deprived quintile but three times higher in the least deprived (9%); in contrast, there is minimal variation for football (6-7% across for each quintile), and slight variation in the opposite direction for snooker, with rates highest among the most deprived areas (6%) and marginally lower among the least deprived (5%).
16
TABLE 2 Adult sport participation in Scotland, by highest educational qualificationPercentages, 2017 data; minimum base: 110
91%
68%
81%
Any sport participation (inc. walking)
Any sport participation (exc. walking)
Walking
Source: Scottish Government, 2018a. Scotland’s People: Annual Report 2017. Table 8.7
DEGREE/ PROFESSIONAL
HNC/ HND/
EQUIV
88%
60%
75%
HIGHER/ A LEVEL/
EQUIV
88%
62%
75%
O’ GRADE/ STANDARD/
EQUIV
80%
49%
68%
OTHER
60%
26%
52%
NONE
56%
26%
46%
NOTKNOWN
72%
33%
61%
ALL
81%
53%
70%

TABLE 3B Adult participation in physical activity and sport in the last four weeks by Scottish Index of Multiple Deprivation Percentages, 2017 data
17
n The Scotland’s People report for 2017 also used the Scottish Index of Multiple Deprivation (SIMD) to provide trend data for area variations in sport participation. These show that the gap in participation rates for sport and other physical activity between the 20 per cent most deprived areas of Scotland and the least deprived 20% has been broadly consistent over the recent decade. For participation in any sport including walking the gap was 18 percentage points in 2007/08 (63 per cent and 81 per cent respectively), and 19 points in 2017 although at higher levels (71 per cent and 90 per cent respectively). For sport participation alone, with walking excluded, the gap increased from 19 points (44% participation in the most deprived areas; 63% in the least deprived) in 2007/08 to 23 points (42% and 65% respectively) in 2017 (Scottish Government, 2009, Table 13.10; 2018, Table 8.3). These findings would appear to confirm a relationship between deprivation and sport participation, albeit in less detail than Coalter and Dowers (2006) analysis of regional patterns in sports participation. This found “surprising” variations in participation between local authority areas, and noted that these were not wholly explained by either socio-demographic or sport supply factors (Coalter and Dowers, 2006, pp3-4). Fuller investigation may be needed to understand the processes producing such patterns.
n The recent report on the sportscotland contribution to Active Scotland Outcomes Framework: schools and education and clubs and communities environments (Research Resource and Research Scotland, 2018) also uses the SIMD to provide a brief analysis of variations in the physical inactivity levels of school pupils targeted by the Active Schools initiative. Although the press release accompanying the publication of this report highlighted that its “detailed findings on equalities” showed that “Active Schools participation in areas of Multiple Deprivation (SIMD) were similar regardless of levels of deprivation”, the fuller picture reveals a much more marked pattern of inequality. The report found that pupils living in the most deprived 20% areas in Scotland are most likely to be inactive - 35% of this group overall, compared to 23% for those in the 20% least deprived areas. In the 20% most deprived areas, inactivity rises to rising to 42% for those not
18
TABLE 3A Adult participation in physical activity and sport in the last four weeks by Scottish Index of Multiple Deprivation Percentages, 2017 data
71
42
1,820
Any sport participation (inc. walking)
Any sport participation (exc. walking)
Base(minimum)
Source: Scottish Government, 2018. Scotland’s People: Annual Report 2017. Scottish Government: Edinburgh. Table 8.3. Columns add up to more than 100% as multiple responses allowed
MOSTDEPRIVED
20%
2ND
77
48
1,960
3RD
81
53
2,140
4TH
86
59
2,080
LEAST DEPRIVED
20%
81
53
9,810
SCOTLAND
90
65
1,810
ADULTS
60
1699
97
5736
26
29
1,820
Walking (at least 30 mins) Swimming Keep Fit /Aerobics Multigym / Weight Training Running / jogging Cycling (at least 30 mins) Dancing Football Golf Snooker / Billiards / Pool Bowls Other None of these
Base (minimum)
65
151213
108
6846
46
23
1,960
69
181414
1413
7856
28
19
2,140
75
191717
1716
6765
21014
2,080
79
222120
2119
8795
21110
1,810
70
181515
1412
7756
28
19
9,810
MOSTDEPRIVED
20%
3RD 4TH LEAST DEPRIVED
20%
SCOTLANDADULTS 2ND
Source: Scottish Government, 2018. Scotland’s People: Annual Report 2017. Scottish Government: Edinburgh. Table 8.3. Columns add up to more than 100% as some respondents take part in more than one sport.

participating in Active Schools compared to 30% in the 20% least deprived areas; for those who do participate in Active Schools, inactivity is lower, but twice as high in the most deprived areas compared to the least (18% compared to 9%).
n This is supported by 2017 data from the Scottish Health Survey (McLean et al, eds, 2018) that showed substantial differences in levels of sport participation from only 52% of children living in the most deprived areas to 82% of those in the least deprived areas:
AREAS OF MULTIPLE DEPRIVATION: MOST TO LEAST DEPRIVED QUINTILES
Children’s (2-15) participation 1 2 3 4 5in the last week All sports (excl. walking) 52 59 67 75 82
No. of child respondents 285 299 289 267 268
While current published analyses of social inequality are only available at population level, with no disaggregation by equality groups, it should be noted that some older sources have undertaken such analyses. Murray’s (2006) report on sport, exercise and physical activity contains a succinct but valuable examination of differences relating to deprivation in participation, barriers and attitudes. After announcing “stark differences” in participation in relation to income levels and considering the interaction of income with other characteristics, it concludes that “deprivation level (and housing tenure, which is closely linked with deprivation) are good predictors of participation”, and that for some groups, levels of deprivation (based on the Scottish Index of Multiple Deprivation) are actually the most accurate predictors. Equivalent work on current datasets would have considerable value.
19
3.4 ADDRESSING SOCIAL INEQUALITY THROUGH SPORT POLICY AND PROVISION IN SCOTLAND
The significance of social disadvantage in shaping inequalities in participation in sport and other physical activity has been underplayed in policy and practice as well as research. Addressing disadvantage has not been identified as a national sport strategy priority in its own right and this has been reflected elsewhere in the Scottish sport system. A review of Scottish local authorities’ Physical Activity strategies in 2007/8 found that the population sub-groups most commonly prioritised by local authorities for promoting participation were children and young people, girls and women, adults of working age, older adults, people with disabilities, minority ethnic communities, and rural/isolated communities. The overview report does not identify specific attention being paid to low income sub-groups within these populations (Blake Stevenson Limited, 2008).
The focus on equality characteristics in isolation from social deprivation also frames the recent Equality and Sport Research report (Research Scotland, 2016). The main body of the report includes extended discussion of the evidence for each equality category, covering (in order) sex, disability, sexual orientation, gender reassignment, race, religion and belief, pregnancy and maternity, and marriage and civil partnership. Inequalities associated with social class, income or deprivation are not identified as a separate category, nor are they addressed within the discussions of the population groups examined. Socio-economic disadvantage is also not addressed in the reports of the focus groups with sport participants of varied characteristics that were conducted to inform the report.
There is however evidence elsewhere in the Equality and Sport Research report that sport sector staff in Scotland recognise the significance of deprivation. The survey of staff that informed the report included ‘socio-economic inequality’ as an item in questions relating to the importance of different equality characteristics for sport participation. Sport sector staff felt strongly that deprivation and poverty created inequalities in relation to sports access and participation and, in focus group discussions, showed some insight into the
20

challenges they pose. A representative from a Scottish governing body of sport commented that an initiative to target activity at people who wouldn’t normally experience sport “is not going anywhere” because “their priority for sport is low [whereas] we expect regular participation”.
The report further noted that “focus group discussions also demonstrated that many staff felt much more comfortable talking about issues around socio-economic deprivation, sex and disability, than other characteristics”. The survey indicated this too, finding that staff felt relatively confident of their knowledge and understanding of socio-economic deprivation, and did not see it as a particular priority for training compared to some other forms of inequality. Paradoxically, however, more survey respondents identified a need for training to increase participation among people experiencing socio-economic disadvantage, than for any other equality characteristic (Research Scotland, 2016, p55, Fig Q7). This suggests that while sport sector staff readily recognise that social disadvantage is a major constraint on individuals’ sport participation, their knowledge and understanding is not in fact sufficiently detailed for them to help people overcome it. The next section addresses this knowledge gap.
3.5 SUMMARY
There is a long tradition of aggregate analyses which show that sport participation in Scotland varies sharply according to deprivation. Despite the scale of these variations and the consistency of this evidence, no published analyses exist which unpick these patterns, identify the resultant barriers that affect sport participation, and examine how these might be overcome. Policymakers and practitioners clearly need to be more informed about these impacts if they are to develop guidance and forms of delivery that help raise participation levels among these sectors of the population. The next section begins to address this by providing an overview of the impacts of poverty and deprivation that may affect people’s capacity to engage in sport.
21 22
Section 4 ADDRESSING SOCIAL INEQUALITY IN SCOTTISH SPORT: UNDERSTANDING HOW PEOPLE ARE AFFECTED BY POVERTY AND DEPRIVATION
4.1 INTRODUCTION
Poverty is a longstanding focus for social policy in Scotland, the UK and the European Union, and expert analyses on the consequences of poverty are widely available. This brief overview examines how people’s everyday lives are affected by socio-economic disadvantage. Knowledge of these impacts is important if strategies to promote sport and other physical activity are to address the real challenges that disadvantaged individuals and families face in participating in sport and other physical activity.
4.2 UNDERSTANDING SOCIAL INEQUALITY: HOW POVERTY AND MATERIAL DEPRIVATION AFFECT THE LIFE COURSE
Social inequality shortens lives. One of the most telling measures of the impact of social deprivation in Scotland is the reduced life expectancy of people of lower socio-economic status:
n There is on average a twelve-year gap in life expectancy between people living in the most and least deprived areas: in the most deprived tenth of neighbourhoods, the average woman dies aged 76 and man dies aged 70, while in the least deprived tenth, the average woman dies aged 85 and man dies aged 83. (National Records of Scotland, 2019, pp82-83)
n There are bigger discrepancies in the length of life lived in poor health: in the most deprived tenth of neighbourhoods, the average person will experience 23 years of living in ‘poor health’, but in the least deprived tenth, the average person will live in poor health for only 10 years. (BBC Scotland, using data from the Scottish Health Observatory, www.bbc.co.uk/news/uk-scotland-38003373. Accessed 5 May 2018). Taking account of the difference in overall life expectancy shown in the previous

paragraph, the difference in healthy life expectancy for women and men in the 10% most and 10% least deprived areas was 23 years in 2015-17 (National Records of Scotland, 2019, p82).
n Extreme variations in life expectancy are defining features of inequality in and beyond Glasgow. Life expectancy in the city and region is not just poor among those experiencing disadvantage, but disproportionately so in comparison to equivalent populations living elsewhere in the UK. Health outcomes for Glasgow, and consequently for Scotland as a whole, are therefore characterised by ‘excessive mortality’ over and above that associated with inequalities. In comparison to Liverpool and Manchester, all-cause mortality in Glasgow is +12.5 percentage points (Walsh et al, 2010).
On average, people in the most deprived tenth of areas in Scotland are therefore likely to experience ill-health from around the age of 50. This may impact on employment and earning capacity and have implications beyond the individual, for example if other family members have to take on caring responsibilities and reduce their own labour market activity to do so. This can further affect household income, disrupt established household roles and activities, and may have longer-term implications, eg for pension entitlement. In contrast, the much later onset of ill-health for those in the least deprived areas, typically at around age 72, allows employment to continue into what can be the most lucrative earning years, and may also enhance retirement income.
These data provide a good illustration of the social divide that socio-economic inequalities in Scotland produce. In a more localised analysis of mortality rates, Seaman et al (2015) found that over 90% of excess mortality in Glasgow, relative to comparable Scottish cities, is accounted for by its extreme deprivation profile. They concluded that reducing the high levels of deprivation in Glasgow could reduce inequalities in life expectancy within the city, and between Glasgow and three other major Scottish cities.
23 24
Differences in life expectancy and mortality rates illustrate both how poverty has a life course dimension, and a holistic one. Reduced life expectancy arises from the cumulative effects of deprivation across the life course and has impacts beyond individual health, affecting other spheres such as employment and family life. The relationship between poverty and its ‘impacts’ is therefore reciprocal: poverty exposes people to a range of specific disadvantages, such as poor health, low educational achievement and poor-quality living conditions, and these in turn exacerbate exposure to poverty.
4.3 UNDERSTANDING SOCIAL INEQUALITY: THE IMPACTS OF POVERTY AND MATERIAL DEPRIVATION ON THE NEIGHBOURHOOD ENVIRONMENT
Not everyone who lives in a ‘deprived’ area is in poverty and not everyone in poverty lives in a deprived area. Nonetheless, the environment in which people live is an important contributor to their experience of social inequality. In Scotland, small-area deprivation is measured through the Scottish Index of Multiple Deprivation 2016 (‘SIMD16’) which combines 38 indicators across seven domains, namely: income, employment, education, health, access to services, crime, and housing (Scottish Government, 2016). High levels of poverty occur in every kind of location, with poverty highest in large urban areas and lowest in remote towns though there is strong evidence that access to services is worse in more rural or remote locations (Poverty and Social Exclusion, 2016). Living in a deprived neighbourhood can mean limited access to services, facilities and green space, poor quality built environment and air quality, while high crime rates can add to stress and insecurity and undermine neighbourhood cohesion and social connectedness.
REFERENCES

4.4 UNDERSTANDING SOCIAL INEQUALITY: THE IMPACTS OF POVERTY AND MATERIAL DEPRIVATION ON EVERYDAY HOUSEHOLD AND FAMILY LIFE
People and families living in poverty lack resources to meet the needs of everyday life. Financial pressures affect day-to-day experience far beyond the problems of immediate shortages. Being unable to purchase commonplace goods and service (eg, internet access) and afford activities that are regarded as social norms (such as socialising with friends) excludes people from society in fundamental ways. This is recognised in the EU’s current measures (Guio et al, 2017, pp5, 51) which define material deprivation as being unable to meet five or more out of thirteen specified needs:
n Face unexpected expenses.
n Afford a one-week annual holiday away from home.
n Avoid arrears (in mortgage or rent, utility bills or hire purchase instalments).
n Afford a meal with meat, chicken or fish every second day.
n Afford to keep the home adequately warm.
n Afford to have a car/van for personal use.
n Replace worn-out clothes with some new ones.
n Have two pairs of properly fitting shoes.
n Spend a small amount of money each week on him/herself.
n Have regular leisure activities.
n Get together with friends/family for a drink/meal at least monthly.
n Have an internet connection.
n Replace worn-out furniture.
The indicators provide a good insight into the way poverty pervades every aspect of everyday life. The home environment may be inhospitable and dispiriting; adults may experience stress from financial worries and debt; parents may be anxious about meeting the needs of children and family
relationships become strained; and accessing internet-based support and information may be difficult. Constraints that have more individual effects – such as poor diet and malnutrition; insufficient hot water for maintaining personal hygiene, household cleanliness and doing laundry; the inability to replace worn-out and outgrown clothes and shoes – can damage individual wellbeing and self-confidence and discourage social contact. Material deprivation caused by social inequality can therefore have far-reaching day-to-day impacts and its undermining effects can be barriers to engaging people in sport and other physical activity.
4.5 UNDERSTANDING SOCIAL INEQUALITY: THE PERSONAL EXPERIENCE OF POVERTY AND MATERIAL DEPRIVATION
Poverty is associated with multiple adverse effects on individuals:
n POOR HEALTH: Exposure to stressors in the social and physical environment is associated with both short-term changes in physiology, perceptions and behaviour, and longer-term risk of adverse outcomes including cardiovascular disease, diabetes and anxiety disorders (Thompson et al, 2015). The impact on mental as well as physical health is important: analyses of patterns in Glasgow show that the risk of excess mortality is +11.9 percentage points for disorders of the circulatory system and +26.7 points for lung cancer, but markedly higher for behaviours associated with poor mental wellbeing: suicide (+68.0 points); alcohol (+129.5 points) and drug-related poisonings (+248.5). Health has the biggest impact on sport and exercise participation: those with a condition causing long-term major reduced daily capacity were less likely to be physically active: 39 per cent compared to 87 per cent of those with no condition (Scottish Government 2019). This two-way causal relationship is arguably underplayed and important to note: while the role of physical activity in improving health is widely recognised, rather less attention is given to the role of ill-health in reducing physical activity. The interaction of poverty and health pose a challenge to sport participation.
25 26

n POOR WELLBEING AND MENTAL HEALTH: “Poverty produces an environment that is extremely harmful to individuals’, families’ and communities’ mental health” (Elliott, 2016, p15). People in poor mental health experience low self-esteem and a loss of social confidence that encourages isolation and reduces social connectedness. Poor mental health is a significant cause of individuals’ wider social and health problems, including low educational achievement and work productivity, poor community cohesion, high levels of physical ill health, premature mortality, violence, and relationship breakdown. For some of these factors, such as relationship breakdown, the causal relationship runs both ways (Centre for Social Justice, 2011; in Elliott, 2016, p15).
n DIFFICULTIES IN HOME AND FAMILY LIFE: People experiencing poverty may face challenging household/family circumstances, including young parenthood, lone parenthood, large families, and higher levels of family/relationship breakdown.
n HARMFUL BEHAVIOURS: People living in poverty have an above-average likelihood of engaging in behaviours which are harmful to themselves or others, including alcoholism, substance abuse and violent and/or criminal behaviour. Poverty is also associated with behaviours damaging to health, including poor diet and smoking, and poor health outcomes including obesity.
n LOSS OF SELF-ESTEEM, AGENCY AND PURPOSE: Material hardship induces high levels of stress that are disabling and are associated with increases in depressive illnesses, suicide and para suicide. As a result, coping mechanisms and capacity for agency are reduced - not through inadequacy, but as a rational, and involuntary, response to hardship (Tomlinson and Walker, 2009). This can make sport participation strategies that focus on individual motivation and ‘behaviour change’ inappropriate for people whose capacity to act in their own interests has been impaired and whose behaviour is constrained by their circumstances. Given the dominance of behaviour change theory in physical activity policy and guidance, this potentially has quite profound implications.
4.6 UNDERSTANDING SOCIAL INEQUALITY: THE INTERACTION OF POVERTY AND MATERIAL DEPRIVATION WITH THE PROTECTED CHARACTERISTICS – THE EXAMPLE OF GENDER
When social inequality interacts with other social structural processes its negative effects can be intensified. The impacts occur cumulatively across the life course and can be wide-ranging, potentially affecting all aspects of life.
This section illustrates this by considering the intersection of social inequality with gender. Notwithstanding the commonalities of gender disadvantage, women in poverty unquestionably experience more wide-ranging and acute constraints than more affluent women. These arise from marked differences in the way in which their respective family circumstances, labour market engagement and relationship to the welfare state interact to influence and constrain their lives.
The interaction between the labour market and the domestic sphere is a key differentiator for men and women. Generally, men are much more likely than women to be employed full time and continuously throughout their working life, and much less likely to reduce their employment if they become a parent; in fact, work hours are higher for fathers than for men without children, but lower for mothers than childless women. Associated with this, men are on average more highly paid than women and more likely to hold senior positions.
But what is important to understand from a social inequality perspective is how much more acutely low-income women are affected by gender inequality than women of higher SEG status. Fig. 1 uses educational level as an indicator of socio-economic position, comparing the job skill level for male and female graduates and non-graduates (UK Commission for Employment and skills, 2015):
n As expected, graduates are more likely to occupy higher skill jobs than non-graduates, and men are more likely to occupy higher skill jobs than women.
n The gap between graduate men (53%) and women (49%) for high skilled jobs is only 4%; it is wider (10%) for middle skill jobs. The gender differential between non-graduate men and women is much greater - 56% of non-graduate men hold jobs classed as high or middle skill level, compared to
27 28

only 24% of women. In comparison to men of their own social position, women with lower education experience much more acute gender inequality than highly educated women do.
n Although the gender diff erential is substantial for non-graduate women, it is not the most striking gap. That occurs between non-graduate women and their higher educated counterparts. Among graduate women, 70% hold jobs of high or middle skill level, a diff erence of 46 percentage points over non graduate women. This is substantially more than the gender diff erence of 32% between non graduate women and men. While the combined eff ect of gender and low educational level on non-graduate women is very strong, more is attributable to social position than gender.
FIGURE 1 Skill level of jobs by gender and education status
Source: UK Commission for Employment and skills, 2015
Table 4 builds on this example to off er an indicative illustration of the eff ects arising from the intersection of socio-economic disadvantage with gender. It does this by highlighting how women living in poverty may be aff ected by the interaction of poverty-related impacts identifi ed in this section with structural gender inequalities.
TABLE 4 Recognising the intersection of socio-economic deprivation with the equality characteristics: the example of women experiencing poverty
29 30
Income level Income sourcesWelfare supportIncome securityAccess to personal spending
Family formationFamily size and structure ParentingDivision of domestic labour Caring responsibilities Qualifi cations
Employment statusEmployment hoursEmployment patternContinuity of employmentWorker benefi tsEmployment security
Transport Access to shops and servicesProvision for child playAccess to green spaceEnvironmental quality Crime and security
Income and poverty
Family
Education
Labour market
Area
INDICATORS
• Experience material deprivation• Have limited/irregular earned
income • Be dependent on welfare payments• Have low levels of/entitlement to
personal funds• Receive a reduced/minimum pension
• Have their fi rst child relatively young • Have more than two children• Be or become a lone parent • Lack childcare support • Experience family breakup• Be constrained by ideologies of
mothering and a strong ethic of care
• Have no or low qualifi cations
• Work in low paid unskilled jobs• Work part-time and/or irregular
hours• Lack job security• Reduce or cease work when they are
mothers • Have limited entitlement to worker
benefi ts (e.g. maternity leave)
• Depend on public transport• Live in areas with limited services
and facilities• Live in areas with limited community
provision • Live in areas with poor quality
housing and built environment• Live in areas with high levels of crime
and insecurity
HOW POVERTY SHAPES WOMEN’S LIVESWOMEN LIVING IN POVERTY ARE LIKELY TO:
CONSTRAINTS TO PARTICIPATING IN SPORT
• Overwhelming impact of fi nancial hardship on self and living conditions
• Low agency and confi dence• Poor health • No/low fi nancial resources• Guilt on spending on self
• Intense level of childcare responsibility
• Strong ethic of care: child/ family needs take priority
• Stress of managing resources to provide for family
• Low sense of entitlement to prioritise self
• Less likely to have history of participation
• Time demands• Unpredictable work hours • Energy demands• Increases guilt about time
not spent with children • Second earner status can
reinforce low sense of entitlement to time for self
• Contributes to the holistic negative impact of poverty
• Exacerbates isolation • Limits opportunities and
resources
DIMENSION

4.7 SUMMARY
Socio-economic disadvantage has complex, fundamental impacts on people’s lives. This section has attempted to capture the key dimensions of these eff ects by recognising them as life course infl uences that aff ect people at community, household and individual level. It has also considered how these forms of disadvantage interact with other structural inequalities, illustrating this with the example of gender. The purpose has been to demonstrate that there is much knowledge available to increase understanding in the sport sector of how these aspects of inequality can limit sport participation. Harnessing this knowledge can help in addressing participation inequalities eff ectively.
Section 5 RAISING SPORT PARTICIPATION IN SCOTLAND BY ADDRESSING SOCIAL INEQUALITY AND DEPRIVATION
This paper has argued that social inequality and deprivation is the main cause of sport inequalities in Scotland. It is also the most overlooked. If the sport sector is to be eff ective in addressing low participation among under-represented groups, this omission needs to be addressed. This section sets out recommendations for policy, practice and research to support this.
1. The key to addressing social disadvantage in sport is for social inequality and material deprivation to be identifi ed as priority focuses at national policy level. Without visible, formal commitment, action is unlikely to occur at regional level and local level to infl uence practice.
2. Evidence needs to be developed to substantiate the case for addressing social inequalities in sport. Available large-scale datasets should be exploited to provide an overarching analysis of the relationship between sport participation and measures of social inequalities including, for example, income, education level, occupational category, social class and area deprivation. Where feasible this should follow Murray’s (2006) approach in identifying the variables which most accurately capture participation levels.
3. Large-scale datasets should be further exploited to provide analysis of how the intersection of social disadvantage with the equality characteristics is related to sport participation. Profi les should fi rst be produced that identify the pattern of social inequalities associated with each equality characteristic (eg, for men and women; for diff erent ethnic groups; for diff erent age groups) where relevant variables are available. Further analysis should then investigate associations between diff erent measures of social disadvantage, the equality characteristics, and sport participation. Where feasible, intersectional analyses should also be undertaken – eg, examining the combined impacts of gender and ethnicity on participation.
31 32
photo: Adobe stock

4. Building on 2-3 above, the need for guidance and resources for the sport sector should be ascertained and priorities determined. These should be developed drawing on a wide range of expertise, including from sectors outside sport from which it may benefi t, such as health, youth and community, social care, education and health. The expertise of the many sport deliverers who already work with disadvantaged populations should also be recognised to produce:
n Policy guidance that recognises that individuals are exposed to constraining factors and that these can reduce both their opportunity and their capacity to participate in sport.
n Practitioner guidance that takes the specifi c needs of potential users and the constraints aff ecting them as the basis for designing and delivering interventions that respond to local situations and use contextualised local knowledge to address them.
n Wider sport promotion messaging which acknowledges that beginning to participate in sport can be diffi cult, recognises the obstacles that non-participants may need to overcome, and admits and supports eff ort that may be needed to achieve this.
5. Finally, the implications of social inequalities for wider approaches to promoting participation should be recognised. In particular, the limitations of behaviour change theory should be considered: this decontextualises individuals from the impacts of poverty and disadvantage which are central to their experiences and capacities. It is unrealistic to expect individuals grappling with material deprivation to change established patterns of unhealthy behaviour while facing the same challenges and constraints that have shaped it. As Bambra et al warn, it is unlikely that policies to tackle health inequalities will succeed if they attempt to do so “by trying to ‘empower’ people or encouraging them to feel happier, more confi dent or more responsible, without necessarily addressing the key, underlying issues” (Bambra et al, 2011, p 403). Addressing social inequalities means recognising that behaviour change theory may not be the best approach,
cannot be the only one, and for people in extreme circumstances, may not be appropriate at all.
Sir Michael Marmot has argued that “the link between social conditions and health is not a footnote to the ‘real’ concerns with health but should become the main focus” (Marmot, 2010, p4). This equally can be applied to addressing social inequalities in relation to sport. Social inequality is not an additional equality group: it is a condition that aff ects low participation across the full diversity of the population. It needs to be addressed in sport, to the potential benefi t of all.
33 34
photo: Adobe stock

35 36
REFERENCES
Bambra, C., Smith, K. E., Garthwaite, K., Joyce, K. E. & Hunter, D. J. (2011). A labour of Sisyphus? Public policy and health inequalities research from the Black and Acheson Reports to the Marmot Review. Journal of Epidemiology and Community Health, 65, 399-406.
Blake Stevenson Limited (2008) Audit of local physical activity strategies in Scotland. Edinburgh: NHS Health Scotland.
Bramley, Glen, 2017. ‘The centrality of poverty.’ Poverty and Social Exclusion, 8 Dec 2017. www.poverty.ac.uk/editorial/centrality-poverty - accessed 28/03/18
Centre for Social Justice, 2011. Mental Health: Poverty, Ethnicity and Family Breakdown. London: The Centre for Social Justice; in Elliott, I. (2016) Poverty and Mental Health: A review to inform the Joseph Rowntree Foundation’s Anti-Poverty Strategy. London: Mental Health Foundation, p.15.
Coalter, F. and Dowers, S, 2006. An analysis of regional variations in sports participation in Scotland. Edinburgh: sportscotland.
Cowley, J., Kiley, J and Collins, D., 2016. ‘Unravelling the Glasgow effect: The relationship between accumulative bio-psychosocial stress, stress reactivity and Scotland’s health problems’. Preventive Medicine Reports, (4) 370-375.
Elliott, I., 2016. Poverty and Mental Health: A review to inform the Joseph Rowntree Foundation’s Anti-Poverty Strategy. London: Mental Health Foundation.
European Union, 2017. Special Eurobarometer 472 - Sport and physical activity Executive Summary. European Commission.
Guio, A., Gordon, D., Najera, H. and Pomati , M., 2017. Revising the EU material deprivation variables. Luxembourg: Publications Office of the European Union, 2017
Marmot, M., 2010. The Marmot Review: Fair society, healthy lives Strategic Review of Health Inequalities in England Post 2010. Marmot Review Final Report. London: University College London.
McLean, Joanne, Shanna Christie, Stephen Hinchliffe and Lindsay Gray (eds), 2018. The Scottish health survey 2017 edition. Vol 1: main report, table 7.8. Sept 2018.www2.gov.scot/Publications/2018/09/9247/downloads#res542077
Murray, L., 2006. Sport, exercise and physical activity: public participation, barriers and attitudes. Ipsos MORI report to the Scottish Executive Social Research.
National Records of Scotland. Scotland’s population. The Registrar General’s annual review of demographic trends 2018. 164th edition. National Records of Scotland: Edinburgh.
Poverty and Social Exclusion, 2016. www.poverty.ac.uk/tags/area-deprivation. Accessed 3 May 2018.
Research Resource and Research Scotland, 2018. sportscotland contribution to Active Scotland Outcomes Framework: schools and education and clubs and communities environments. Research Resource: Glasgow.
Research Scotland, 2016. Equality and sport research. Glasgow: Research Scotland.
Rowe, N F, 2015. Sporting capital: a theoretical and empirical analysis of sport participation determinants and its application to sports development policy and practice, International Journal of Sport Policy and Politics, 7:1, 43-61;www.tandfonline.com/doi/abs/10.1080/19406940.2014.915228
Rowe, N F, 2018. Sporting capital: transforming sports development policy and practice. Routledge, Abingdon.
Scottish Government, 2009. Scotland’s people. Annual report: results from 2007/2008 Scottish Household Survey. Scottish Government: Edinburgh.
Scottish Government, 2016. Introducing the Scottish Index of Multiple Deprivation 2016. Scottish Government, Edinburgh. www2.gov.scot/Resource/0050/00504809.pdf
Scottish Government, 2017. The life chances of young people in Scotland: an evidence review for the First Minister’s Independent Advisor on Poverty and Inequality. Scottish Government: Edinburgh.
Scottish Government, 2018a. Scotland’s People Survey: Annual Report 2017. Scottish Government: Edinburgh.
Scottish Government, 2018b. The fairer Scotland duty. Interim guidance for public bodies. Scottish Government: Edinburgh.www.gov.scot/binaries/content/documents/govscot/publications/guidance/2018/03/fairer-scotland-duty-interim-guidance-public-bodies/documents/00533417-pdf/00533417-pdf/govscot%3Adocument

37
Scottish Government, 2019. Scotland’s people annual report 2018.Scottish Government: Edinburgh.
Scottish Government Communities Analysis Division, 2017. Building the Evidence Base on Tackling Poverty Paper 1 – A Discussion Paper on the Drivers of Poverty. Scottish Government: Edinburgh.
Seaman, R., Mitchell, R., Dundas, R., Leyland, A.H., and Popham, F., 2015. ‘How much of the difference in life expectancy between Scottish cities does deprivation explain?’ BMC Public Health 15:1057 DOI 10.1186/s12889-015-2358-1
Social Mobility Commission, 2017. State of the Nation 2017: Social Mobility in Great Britain. London: HMSO.
Thompson C., Lewis D. J., Greenhalgh T., Smith N. R., Fahy A. E, Cummins, S., 2015. ‘Everyone was looking at you smiling’: East London residents’ experiences of the 2012 Olympics and its legacy on the social determinants of health. Health and Place 36, 18-24.
Tomlinson, M. & Walker, R. (2009). Coping with complexity: child and adult poverty. London: Child Poverty Action Group.
UK Commission for Employment and skills, 2015. Opportunities and outcomes in education and work: Gender effects. London: UK Commission for Employment and skills.www.gov.uk/government/publications/opportunities-and-outcomes-in-education-and-work-gender-effects; accessed 14 April 2018.
Walsh D, Bendel N, Jones R, Hanlon P., 2010. It’s not ‘just deprivation’: Why do equally deprived UK cities experience different health outcomes? Public Health 124(9):487-495.
Walsh, D., McCartney, G., Collins, C., Taulbut, M., and Batty, G. D., 2016. History, politics and vulnerability: explain excess mortality in Scotland and Glasgow. Glasgow: Glasgow Centre for Population Health.

For more information on this and other OSS research, please visit our website
www.oss.scot
or contact Executive Director David Ferguson at [email protected]