profile of sustainability in some mediterranean tourist - plan bleu
TRANSCRIPT

Profile of Sustainability in some Mediterranean Tourist Destinations
Synthesis: Djerba, Tunisia Based on the case study by Jean Mohamed Mehdi CHAPOUTOT
Loïc Bourse
Plan Bleu UNEP/MAP Regional Activity Centre
Sophia Antipolis September 2011

The study is financed under the FEMIP Trust Fund. This Fund, which was established in 2004 and has been financed – to date – by 15 EU member States and the European Commission, is intended to support the development of the private sector via the financing of studies and technical assistance measures and the provision of private equity.
This study also benefited from the support of:
The analysis and conclusion expressed in this report do not necessarily reflect the view of the European Investment Bank the l’Agencia Española de Cooperación para el Desarrollo or the Agence Française de Développement.


3
Contents
Introduction 5
I. Tourism and economic development 8 1. Changes in the tourism offer and demand .................................................................................. 8 2. Revenue from tourism ......................................................................................................... 11
II. Tourism and socio-territorial development 12
III. Tourism and the environment 14 1. Water and energy consumption; production and treatment of solid and liquid waste ............................. 14 2. Land pressure associated with tourism ..................................................................................... 16 3. Biodiversity ....................................................................................................................... 17
IV. Tourism and governance 17
V. Proposals of policy measures 19 1. Defining local governance for improved political regulation of tourism .............................................. 19 2. Policy measures in the business sector ..................................................................................... 20 3. Policy measures in the socio-territorial sector ............................................................................ 20 4. Policy measures in the environmental sector ............................................................................. 20
Conclusion 20
Bibliography 23
Table of illustrations 24
Appendices 25

5
Introduction The case study by Jean Mohamed Mehdi Chapoutot on Djerba (Tunisia) is part of the Plan Bleu project “Profiles of sustainability in some Mediterranean tourist destinations”. It is based on an experimental method and involves measuring and assessing the impacts of tourism from the perspective of the key goals of the Mediterranean Strategy for Sustainable Development (MSSD), and taking into account environmental, social and economic issues in the destinations studied. A “profile of sustainability” has been produced for 11 tourist destinations across eight Mediterranean countries1 using the DPSIR2 approach.
Firstly, the sustainability of the destination was studied using economic performance indicators (e.g. accommodation occupancy rates), territorial, demographic and sociological indicators (e.g. the effect of seasonality on employment, the income levels of the local population, the quality of essential amenities and services) and environmental indicators (e.g. damage to the landscape associated with coastal development). Secondly, thought was given to political measures that could be taken to improve the sustainability of the destination. This systemic and territorial approach was used to examine the destination, which is the basic unit of tourism development, as well as taking into account several different levels (local, national and regional) and the various stakeholders across the region, while relating the Mediterranean tourist system with the other priority areas from the MSSD: water, transport, waste, energy, etc.
In selecting the destinations to be studied, Plan Bleu defined a methodology requiring that the destination studied should be an administrative unit on the Mediterranean coast with significant international and/or domestic tourism, that is also home to a permanent population but is not a major city. Based on the variables identified and the data supplied by the experts who authored the case studies, Plan Bleu proposed a classification of destinations (Figure 1):
• Type one (Torremolinos, Alanya and Djerba) are international destinations with extensive tourist amenities, and are characterised by a range of hotel accommodation, particularly 4 and 5 star hotels, with a wide selection of leisure activities (health spas, marinas, golf courses, casinos, etc.) and a dependence on tour operators. The sea, beach and associated activities are the main attraction, so these mass tourism destinations are referred to as “3 S” destinations (Sea, Sand and Sun).
• Type two (El Alamein, Siwa Oasis and Marsa Matrouh) are domestic destinations with extensive tourist amenities, and are characterised by mainly hotel accommodation (4 and 5 stars) with luxury amenities (health spas, marinas, golf courses, casinos, etc.) and a significant range of cultural centres, e.g. historical sites. Type two destinations are distinguished from type one on the basis of the origin of the tourists - internal demand as opposed to foreign tourists.
• Type three (Cabras, Castelsardo, the Tetouan coast and Tipaza) are destinations attracting domestic tourists who mainly stay in accommodation other than hotels (residential accommodation, bed and breakfasts, campsites, etc.). Other factors that attract tourists to these destinations are also their significant cultural and natural heritage (markets selling local products, nature reserves, etc.).
• Type four (Rovinj) are destinations that are in rejuvenation phase, and represent destinations with primarily international customers, where Tour Operators do not play a significant role and whose accommodation options are primarily facilities other than hotels.
1 Torremolinos (Spain), Cabras and Castelsardo (Sardinia, Italy), Rovinj (Croatia), Alanya (Turkey), El Alamein, Marsa Matrouh and Siwa Oasis (Egypt), Djerba (Tunisia), Tipaza (Algeria), the Tetouan Coast (Morocco). 2 Drivers – Pressures – State – Impacts – Responses.

6
Figure 1 - Graph showing the types of tourist destination studied
Source: Principal Component Analysis by Loïc Bourse based on data produced by the experts and processed by Ioannis Spilanis, 2011. Guide (see also Figure 14 in the Appendix): Axes 1 and 2 explain 64% of the data variance. Axis 1 alone explains 39% of the information: - on the right side, it represents domestic tourism with visitors using accommodation other than hotels (residential accommodation or camping),
focusing on cultural products (e.g. markets selling local goods, craft demonstrations, etc.) and/or natural features (e.g. national parks, nature reserves and marine nature reserves);
- on the left side, it represents the international character of tourism characterised by widespread use of charter planes (influence of Tour Operators), extensive tourist amenities and a high density of hotel accommodation in the administrative area.
Axis 2 explains 25% of the information: - on the top part, it represents tourism characterised by international visitors using accommodation other than hotels; - on the bottom part, it represents tourism with extensively equipped hotels with historical sites and primarily domestic visitors.
Djerba is an “international destination with extensive tourist amenities”. According to the Butler model (BUTLER 1980), it is in consolidation phase. Other destinations of the same type can be considered for comparison: Torremolinos (Spain) is between consolidation phase and decline phase and Alanya (Turkey) is in stagnation phase (Figure 2).
Against a backdrop of intense competition between tourist destinations, Djerba has boosted its hotel and leisure offer by diversifying accommodation quality (sharply increasing the number of 4 and 5 star hotels), offering conference facilities and constructing leisure amenities such as the golf course. Furthermore, the “Djerba” product is based around cultural activities such as museums (the arts and crafts museum), historical sites (Borj El Ghazi Mustapha), monuments and cultural events (pilgrimage to the El-Ghriba synagogue in Er-Riadh).

7
Figure 2 - “International destinations with extensive tourist amenities” based on the Butler model (BUTLER 1980)
Source: The data was produced by experts then scaled and centred (Bourse, 2011).
Although there has been a hotel on Djerba since 1936, tourism took off with the arrival of Club Med in 1959. Djerba offered a European clientele “a pacific island five hours from Paris” on a virtually uninhabited site (CHAPOUTOT 2011). In a favourable international economic climate, tourism was seen as a development choice and a relatively safe investment in the 1961-69 period. The saturation of European tourist destinations and the gradual reduction of air transport costs within a holiday package worked in favour of the development of tourism in Tunisia generally and on Djerba in particular. The tourism industry on Djerba has been subject to fairly strict land planning (via the Tourism Development Plan and Tourism Development Zone) with a tourist zone created away from existing urban areas with no reference to an organised layout. The result has been “poor coastal development”, a scattering of hotels along the coastline and privatisation of the seafront (CHAPOUTOT 2011).
On the basis of these observations, and with a view to presenting the profile of sustainability for Djerba, the case study is structured in four sections – corresponding to the four main variables identified in the MSSD (PLAN BLEU 2009) – through which we will discuss various indicators (SPILANIS & VAYANNI 2011), in particular:
8
• economic indicators: the number of hotel beds, the number and size of accommodation facilities, occupancy rates, the effect of seasonality and revenue per bed;
• socio-territorial indicators: demographic changes, the overall share of tourism in local employment by gender and types of employment contract, and unemployment statistics;
• environmental indicators: natural resource and energy consumption, production and treatment of solid and liquid waste, land pressure and biodiversity;
• governance indicators: implementation of an internationally-defined model of governance, local governance practices and the categories of stakeholders involved in governance.
In the conclusion, we will bring these four variables together in graphic form and assess the state of sustainability at the destination, then we will present the “policy measures” proposed by Chapoutot to improve the sustainability of Djerba.
I. Tourism and economic development Since independence in 1956, Tunisian economic growth has been marked by the emergence or extension of export sectors. The tourism industry can also be classified as an export business because it has made a significant contribution to Tunisian economic growth thanks to the influx of foreign currency. The Tunisian tourism product is based on mass tourism, targeting a middle-income international clientele, who use package holidays, arrive in Tunisia by (charter) plane and stay in hotels (CHAPOUTOT 2011).
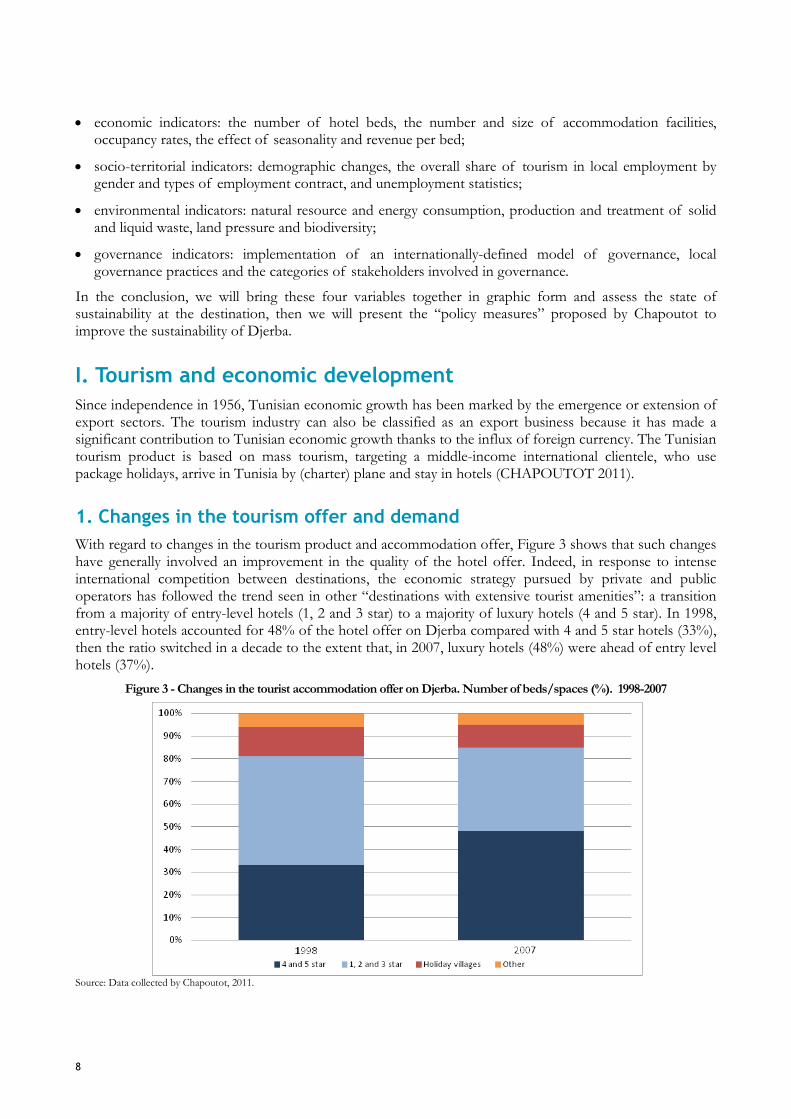
1. Changes in the tourism offer and demand With regard to changes in the tourism product and accommodation offer, Figure 3 shows that such changes have generally involved an improvement in the quality of the hotel offer. Indeed, in response to intense international competition between destinations, the economic strategy pursued by private and public operators has followed the trend seen in other “destinations with extensive tourist amenities”: a transition from a majority of entry-level hotels (1, 2 and 3 star) to a majority of luxury hotels (4 and 5 star). In 1998, entry-level hotels accounted for 48% of the hotel offer on Djerba compared with 4 and 5 star hotels (33%), then the ratio switched in a decade to the extent that, in 2007, luxury hotels (48%) were ahead of entry level hotels (37%).
Figure 3 - Changes in the tourist accommodation offer on Djerba. Number of beds/spaces (%). 1998-2007
Source: Data collected by Chapoutot, 2011.
9
The predominance of the hotel offer over other types of tourist accommodation has also been accentuated: for example, holiday villages dropped from a 13% share of the overall accommodation offer in 1998 to 10% in 2007. The overrepresentation of large hotel complexes is also characteristic of the tourist accommodation offer on Djerba: in 2008, 73% of bed capacity belonged to hotels with more than 500 beds. According to Chapoutot, these various characteristics of the accommodation offer on Djerba are typical of an international destination targeted by airlines and tour operators.
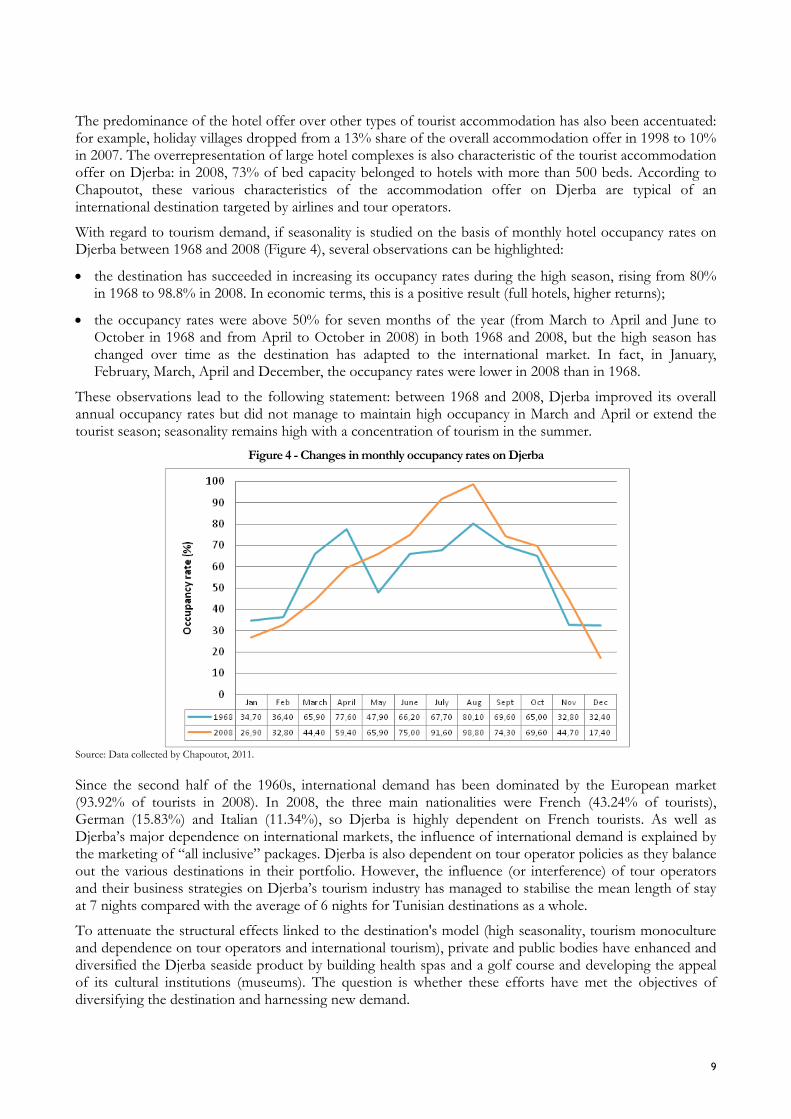
With regard to tourism demand, if seasonality is studied on the basis of monthly hotel occupancy rates on Djerba between 1968 and 2008 (Figure 4), several observations can be highlighted:
• the destination has succeeded in increasing its occupancy rates during the high season, rising from 80% in 1968 to 98.8% in 2008. In economic terms, this is a positive result (full hotels, higher returns);
• the occupancy rates were above 50% for seven months of the year (from March to April and June to October in 1968 and from April to October in 2008) in both 1968 and 2008, but the high season has changed over time as the destination has adapted to the international market. In fact, in January, February, March, April and December, the occupancy rates were lower in 2008 than in 1968.
These observations lead to the following statement: between 1968 and 2008, Djerba improved its overall annual occupancy rates but did not manage to maintain high occupancy in March and April or extend the tourist season; seasonality remains high with a concentration of tourism in the summer.
Figure 4 - Changes in monthly occupancy rates on Djerba
Source: Data collected by Chapoutot, 2011.
Since the second half of the 1960s, international demand has been dominated by the European market (93.92% of tourists in 2008). In 2008, the three main nationalities were French (43.24% of tourists), German (15.83%) and Italian (11.34%), so Djerba is highly dependent on French tourists. As well as Djerba’s major dependence on international markets, the influence of international demand is explained by the marketing of “all inclusive” packages. Djerba is also dependent on tour operator policies as they balance out the various destinations in their portfolio. However, the influence (or interference) of tour operators and their business strategies on Djerba’s tourism industry has managed to stabilise the mean length of stay at 7 nights compared with the average of 6 nights for Tunisian destinations as a whole.
To attenuate the structural effects linked to the destination's model (high seasonality, tourism monoculture and dependence on tour operators and international tourism), private and public bodies have enhanced and diversified the Djerba seaside product by building health spas and a golf course and developing the appeal of its cultural institutions (museums). The question is whether these efforts have met the objectives of diversifying the destination and harnessing new demand.

10
Figure 5 - Effects of the diversification of leisure activities on seasonality (2007)
Source: Data collected by Chapoutot, 2011.
In Figure 5 – where two types of variable are shown: the variable to be explained (total number of visitors) and the explanatory variables (number of golfers, number of visitors to historical sites and number of museum visitors) – it can be seen that the curves corresponding to the number of golfers and museum visitors run contrary to the curve for the total number of visitors, which is not the case for the curve for visitors to historical sites. Consequently, it can be hypothesised that the number of golfers and museum visitors has a positive effect on seasonality as they are present during the low season. To test this hypothesis, the correlation coefficients3 were calculated between the total number of visitors (the variable to be explained) and the numbers of golfers, museum visitors and visitors to historical sites (the explanatory variables).
Table 1 - Correlation coefficients to test the influence of golfing and cultural activities on reducing seasonality
Total number of visitors
Number of visitors to historical sites
Number of museum visitors
Number of golfers
Total number of visitors 0.00078 0.08474 0.01088
Number of visitors to historical sites 0.83214 0.066163 0.02612
Number of museum visitors -0.51766 -0.54621 0.00343
Number of golfers -0.70226 -0.63626 0.76939 Source: Data collected by Chapoutot, 2011.
The results (Table 1) show that the variables “number of museum visitors” and “number of golfers” both correlate with the variable “total number of visitors” and contribute to reducing seasonality as they have a minus sign (-0.52 for the number of museum visitors and -0.70 for the number of golfers). Furthermore, two other sociologically explicable phenomena are observed: firstly, a significant number of museum visitors and golfers add to the number of visitors to historical sites but the opposite is not true; secondly, golfers are also museum visitors.
3 The correlation coefficient is equal to 1 when one of the variables is an increasing linear function of the other variable and -1 when it is a decreasing linear function. Intermediate values give information on the degree of linear dependence between the two variables. The closer the coefficient is to the extreme values -1 and 1, the stronger the correlation between the variables: the expression “strongly correlated” is used to describe the two variables. A correlation of 0 means that the variables are linearly independent.

11
Ultimately, the diversification of leisure activities via the development of golfing and cultural activities contributes to reducing seasonality. Djerba now attracts a high-income, cultured clientele in low season and a middle-income mass-tourism clientele in high season.
Finally, the consequences of international current affairs add to the structural effects: “Over the period 1998-2008, the reduction in the number of overnight stays on Djerba in 2002 and 2003 is one of the indirect consequences of the 9/11 attacks in New York in 2001. This shows the sensitivity of air traffic, and thus international tourism, to external events, although tourism bounces back rapidly following such crisis events” (CHAPOUTOT 2011).
2. Revenue from tourism Several indicators have been identified regarding revenue from tourism. The first indicator adopted for measuring revenue linked to tourism is daily spending per visitor: in 2008, this was €24.73 for Djerba, whereas the average for Tunisia was €53.71. However, the annual expenditure by visitors as a ratio of the number of overnight stays averaged €53 on Djerba, which is very close to the Tunisian average (€54).
The second indicator used is the added value created by the tourist sector: in 2008, the added value of tourism in Tunisia was €1,070m. The destination’s share of the total number of overnight stays in Tunisia (21.5%) was used as a basis for estimating the added value of tourism on Djerba, giving an added value of €230m for 2008. From this data, revenue per bed in the same year can be estimated at €5,077 on Djerba. On the basis of this third indicator, Figure 6 shows that revenue from tourism declined between 2004 and 2008, from €6,151 per bed to €5,077 per bed.
Figure 6 - Changes in tourism revenue (€ per bed) (2004-2008)
Source: Data collected by Chapoutot, 2011.
To conclude this economic section, it should be noted that Djerba is a destination characterised by a middle-income clientele in high season and a wealthier clientele in low season. This diversification of clientele has been generated by diversifying the accommodation options and the cultural and leisure activities on offer (golf course, historical sites and museums). However, this diversification is not sufficient to significantly reduce the high levels of seasonality due to the structural dependence of the “Djerba – seaside resort” product on foreign tour operators and an international clientele.
Finally, from a purely financial standpoint, revenue per bed was €5,077 in 2008 on Djerba, whereas at Torremolinos (which is in stagnation and decline phase on Butler’s model) it was €9,182 in 2009. So, Djerba has lower revenue per bed than Torremolinos but a high reactivity and even resilience in the face of internal and external structural and event-related effects. However, the question of whether this reactivity is made possible by favourable social conditions (such as low labour costs) should be raised.

12
II. Tourism and socio-territorial development The population of Djerba increased from 70,217 in 1975 to 139,517 in 2004. The Tunisian authorities succeeded in countering the depopulation of Djerba by making it attractive thanks to the development of tourism on the island (Figure 7). “For a long time, Djerba had significant emigration and negative net migration. In the 1960s and 1970s especially, emigration, which was mainly male and temporary, impacted population growth but from the 1980s the development of tourism has reversed migration flows. (...) When the labour requirements for building infrastructure and tourist facilities are taken into account, the situation has clearly turned around. The traditional emigration of the island’s population has been replaced by the immigration of families from the mainland” (CHAPOUTOT 2011).
Figure 7 - Demographic changes. Djerba
Source: Data collected by Chapoutot, 2011.
Thus, demographic processes are directly linked to the economic health of the destination in general and the tourism sector in particular. The tourism sector is the core of job creation on Djerba (Table 2).
Table 2 - Share of tourism in the number of jobs (%) (2004)
Total tourism employment/Total active population 38.55% Of this 38.55% Men accounted for 83.33% Women accounted for 16.67%
Source: INS, “General census of the population and habitat” (RGPH) and data collected by Chapoutot, 2004.
According to Chapoutot and data from the Tunisian national institute of statistics (INS), direct employment from tourism accounted for 18,000 jobs in 2004, which is 38.55% of total jobs on the island. The workforce is 83% male (15,000 men compared with 3,000 women), which roughly corresponds to the proportion of men in the active population on Djerba (81% men and 19% women) (Table 2). Tourism is therefore a major sector of the economy for job creation, although the number of jobs created per bed is lower on Djerba than the Tunisian average (0.40 jobs per bed compared with 1.07 jobs per bed) and gender inequality is still very high.
Table 3 - Employment conditions in the tourism sector (%) (2008)
Types of contracts for tourism-related labour Permanent contracts 32 Temporary contracts 58 Internship contracts 10 Overall unemployment 8.43% Of which Men 6.27% Women 17.67% 15-29 year-olds 6.11%
Source: Data collected by Chapoutot, 2011.

13
With regard to employment conditions on Djerba, Chapoutot reports that:
• Four-star hotels account for 39.8% of jobs in tourist accommodation, ahead of three-star and five-star hotels (28% and 22.4% respectively);
• permanent employment accounts for 32% of overall employment (with 5,800 permanent jobs), temporary employment 58% (with 10,512 jobs) and apprenticeships and internships 10% (1,812 jobs) (Table 3);
• on average, “middle management” jobs account for 28% and ordinary jobs 72%;
• the turnover of the workforce is 22%.
Thus, tourism employment on Djerba involves a mainly unskilled male workforce, with temporary contracts and high turnover. Such employment conditions lead to a high unemployment rate (8.43% of the active population, while the dependent population of under 16s and over 65s account for 36% of the total population), especially for women (17.67% of active women are registered unemployed, i.e. 1,500 unemployed women out of a total of 8,992 active women). Thus, gender inequality in access to employment is highly marked.
Figure 8 shows that gender inequality is accentuated by differences in levels of education between men and women: women have lower levels of education than men and are the most likely to lack schooling (25% of women are uneducated compared with 7.43% of men).
Figure 8 - Education levels. Djerba (2004)
Source: The Tunisian national institute of statistics (INS) “General census of the population and habitat” (RGPH), 2004.
However, the efforts made by the authorities to train the tourism workforce should be highlighted: there is a hotel & hospitality training centre on Djerba that offers vocational qualifications (BTP) in hotel catering, restaurant operations and hotel housekeeping. In 2008, 93 students graduated from this centre: 35 in “catering”, 29 in “restaurant” and 29 in “housekeeping”.
To conclude this section about socio-territorial indicators, it should be noted that Djerba has become an attractive location thanks to tourism, which has, in particular, reversed the direction of migration; the population growth rate on Djerba is now more than 2%. However, in terms of access to employment, effort needs to be made:
• to improve gender equality;
• with respect to the type of work contract, the majority of which are still temporary (which is a sign of job insecurity).

14
III. Tourism and the environment On the basis of the economic and socio-territorial indicators used, the following observations can be made:
• the destination has high visitor numbers in the summer (seasonality);
• accommodation capacity is constantly increasing, rising from 3,274 beds in 1968 to 45,311 beds in 2008, which represents 18.9% of the total capacity in Tunisia, with a mean annual increase of 14% since 1998.
• an increase in the total resident population on Djerba, which has become a place of immigration thanks to tourism.
These various observations will be used to examine the consequences of tourism on the environment through three components: water and energy consumption and the production and treatment of solid and liquid waste; the footprint of tourism in terms of land use; the state of biodiversity on Djerba.
1. Water and energy consumption; production and treatment of solid and liquid waste The question of water supply on Djerba is crucial for at least two reasons: inadequate rainfall, poor runoff, and the wide spacing of plots means that Djerba is an island where water has always been problem. This issue is exacerbated by the fact that the groundwater is usually brackish (CHAPOUTOT 2011).
Figure 9 - Capacity to supply water consumption in the tourism sector (m3) (2004)
Source: Data collected by Chapoutot, 2011.
Consequently, to meet the shortfall in drinking water and the increasing domestic and tourism demand since 1966, a 150 km long water-supply network was built. Thus, there is significant transfer of water from two sources located in the Zeuss-Koutine watershed on the mainland (Medenine Governorate). Extraction from these two boreholes fell significantly in the late 1990s due to the creation of two brackish-water desalination plants in Zarzis (1999) and on Djerba (2000). The brackish-water desalination plant on Djerba, which started operating in 2000, has a production capacity of 20,000 m3 per day. Treated water from the Djerba and Zarzis plants is then mixed with water from the Zeuss-Koutine aquifer before being distributed by SONEDE (the national water company). This gives Djerba a total water supply capacity of 0.36 m3 per person per day.
If the supply capacity figures are compared with the water consumption figures, the problem is obvious. The supply capacity is 0.36 m3 per inhabitant per day, whereas mean tourism consumption is 0.76 m3 per overnight stay (Figure 9 (b)). In addition, peak water consumption is in the summer, when tourism peaks, which is the dry season during which competition for water is at its highest between the various users (tourism, domestic and agricultural).
It should also be noted that monthly tourism water consumption, when measured in m3 per overnight stay, is higher in low season than in high season. In 2008, it was 0.96 m3 per overnight stay in December versus

15
0.37 m3 per overnight stay in August which is due to lower occupancy rates in the low season in hotels that, although operational in winter, are underbooked.
However, as well as setting an objective of reducing water consumption to 0.33 m3 per overnight stay, the Tunisian authorities in partnership with private operators in the tourism sector have implemented a diversification of supply sources by using non-conventional supplies such as treated, desalinated or recycled water. According to a survey performed in 1999 and 2004 by SONEDE, the use of independent water supplies by hotels is on the rise because: the number of boreholes has increased from 14 to 17, three hotels use desalination units, six hotels make use of water from sewage treatment plants and the Djerba golf course, which uses 1,500 m3 per day, is irrigated using treated water from the sewage plant.
Furthermore, electricity consumption from tourism accounts for 22% of total energy consumption in the service sector and hotel energy consumption increased by 6% annually from 2006 to 2008 (Figure 10 (a)). Figure 10 (b) shows that – as for water – the peak in electricity consumption occurs in the summer. Electricity consumption has risen from 11 kWh per overnight stay in 1993 to more than 20 kWh today.
Figure 10 - Tourism sector electricity consumption (kWh)
Source: Data collected by Chapoutot, 2011.
On the basis of these observations, the Tunisian authorities have targeted tourism for inclusion in the programmes and projects run by the national energy management agency (ANME). These programmes have helped the 125 participating hotels to make estimated energy savings of approximately 25% of their overall energy consumption. Furthermore, ANME has launched a solar panel programme for hotels using “Prosol Photovoltaïque” modules. Although economic issues have been the main reason for sign-up, these issues obviously coincide with environmental concerns.
Table 4 - Water and electricity consumption; production of solid and liquid waste
Type of resource consumed or waste produced Units Quantity Water (2004) m3 per overnight stay 0.76 Mean electricity consumption (2008) kWh per overnight stay 14.24 Solid waste production (2004) kg per person per day 1.73 Wastewater production (2004) m3 per day 26,010
Source: Data collected by Chapoutot, 2011.
In 2004, solid waste production in the Midoun délégation (municipality) was 20,500 tonnes of which 14,797 was from tourism and urban areas and 5,703 from rural areas, which corresponds to a mean daily production of 1.73 kg per person. In terms of waste treatment, “the Houmt Souk and Midoun municipalities have reached 92% coverage for household waste collection in rural areas and 100% in urban areas” (CHAPOUTOT 2011). All hotels in both municipalities are included in these collections. These positive results for solid waste treatment must be tempered by the problems caused by the existence of six uncontrolled landfill sites on Djerba. The authorities plan to replace these uncontrolled sites by controlled sites and transit centres.

16
Finally, with respect to wastewater treatment, Houmt Souk municipality, where 26,010 m3 per day is produced, has separate stormwater/wastewater networks with 2,500 connections to the wastewater network bringing the coverage rate for the urban population to 41%, compared with 21% for the municipality as a whole. Thus, significant progress needs to be made in this area. On Djerba, the capacity for treating wastewater is 22,250 m3 per day in its three sewage treatment plants (Houmt Souk 3,500 m3 per day, Aghir-Djerba 15,750 m3 per day and Sidi Mehrez (Midoun) 3,000 m3 per day). Thus, in the absence of an effective solution for the island as a whole, sewage networks and treatment plants have been supplemented by relatively unsustainable alternatives such as septic tanks and leaching cesspools.
2. Land pressure associated with tourism Tourism has a significant impact on land development and change of use as it has completely reversed the trends in terms of which areas are attractive for the residential population4 (Figure 11). The Tunisian authorities have intervened to encourage this restructuring of the island, in particular via the incentives inherent in defining a “tourist zone” on Djerba: to benefit from state aid, tourism projects must be within the “tourist zone”. Development of the tourist zone is not uncontrolled: “Within the tourist zone, a development plan with associated planning rules has been drawn up. Infrastructure is sized for the needs of tourists and the resident population” (CHAPOUTOT 2011).
Figure 11 - Changes in land use on Djerba
a - Land use before tourism b - Land use since tourism
Source: Maps produced by Chapoutot, 2011.
In terms of the repercussions of tourism on the island, the developed surface area of the tourist zone was doubled following the 1985 development plan and covers 1,184.57 hectares with an accommodation capacity of 72,571 beds: all tourism development has been concentrated in this area, which represents 3.2% of the surface area of the Houmt Souk and Midoun municipalities. The development has mainly involved building hotels. The coastline, which was previously unused land, has been developed at the expense of the centre of the island which is increasingly neglected. Despite good intentions, green spaces account for only 3.5% of the surface area of the tourism development plan; 25% of the coastline has been developed.
4 “Midoun, which is directly affected by the development of tourism, has seen sharp population growth; it is a particularly appealing town. As its service sector has developed, Houmt Souk has seen a rise in land and property prices which has caused some of the resident population to move out and further suburbs and secondary urban centres to develop” (CHAPOUTOT 2011).

17
3. Biodiversity On Djerba, biodiversity is relatively low (Figure 12 a and c): since antiquity, human activity has affected the flora, which only now exists in its natural state in very limited zones not affecting the tourist zone (the only tree found in the tourist zone is the palm tree). The fauna is concentrated in wetlands where human activity is less visible; there are mongooses, jackals, hyenas and fennecs.
However, Djerba is an important staging post for migratory birds such as flamingos which gather on the Ras Er-Rmel peninsula in winter. This area also warrants protection because it is a favourable spot for tortoises to lay their eggs and has populations of rodents, other small mammals, reptiles and invertebrates. Furthermore, “the recent formation of wetlands and dune tongues has enabled certain species to fill the ecological void” (CHAPOUTOT 2011).
Figure 12 - Djerba and Mediterranean biodiversity, as defined by the IUCN (CUTTELOD et al. 2008)
a - Species richness of terrestrial amphibians, mammals, dragonflies and reptiles in the Mediterranean basin.
b - Species richness of threatened terrestrial amphibians, mammals, dragonflies and reptiles in the Mediterranean basin.
c. Species richness of marine mammals in the Mediterranean Sea. d. Species richness of threatened marine mammals in the
Mediterranean Sea.
Source: CUTTELOD, A. et al., 2008. The Mediterranean: a Biodiversity Hotspot under Threat. The IUCN Red List of Threatened Species.
IV. Tourism and governance Based on the information supplied by Chapoutot5, governance of the tourism industry in Tunisia in general and on Djerba in particular, only involves national and international governance by the Tunisian government and the tour operators respectively.
5 This analysis obviously refers to the pre-“Arab Spring” period.

18
First, the exercise of national governance by the Tunisian state, which has had various roles in tourism, will be covered. The first of these roles is that of promoting tourism: during the 1960s, the state considered tourism as a development opportunity. The Tunisian government therefore encouraged the construction of hotels and tourist amenities via an initial piece of legislation: Decree 66-339 dated 2 September 1966. Political measures were then multiplied from the 1970s onwards as the government “became aware of the ‘under use’ of the area, of the cost of building infrastructure and of the role of organisations operating in the tourist market and their influence on defining policy for the development of the Tunisian tourism offer” (CHAPOUTOT 2011). These various measures defined the second role of the state, as land-use and planning regulator6.
To fulfil the aims of this role, the state has two regulatory mechanisms:
• the Tourism Real Estate Agency (AFT), established in 1973 to structure the legal framework for managing land expropriations;
• the Investments Code: Act 9021 dated 19 March 19907, pertaining to the promulgation of the Tourism Investments Code which deals with state help for investments.
The role of the AFT is to compile and manage a stock of land: it purchases and sells the land required for implementing approved projects in tourist zones. It also works in collaboration with the National Office for Tunisian Tourism (ONTT) to produce Tourism Development Plans (PAT), and to design and implement infrastructure projects for tourist zones.
The Investments Code is comprised of a set of fiscal, financial and supervisory incentives. It provides a statutory framework that specifies the roles of various stakeholders in the construction of tourism infrastructure. Thus, the national government is responsible for the infrastructure work required for the construction of tourism projects up to their plot boundaries8. The 1993 Tourism Investments Code9 defines a possible new distribution of roles, opening the door to private investment in infrastructure and reducing the role of the state in investments associated with tourism projects.
However, despite the strong role of the state, the family-based nature of investments in Tunisian hotels is a major obstacle to the adoption of good practices in governance10. “The founding shareholders often have decision-making positions and can run their business against the interests of creditors. The generally limited level of transparency impedes Tunisian hotels from changing business-management models towards collegial administration, consultation and social sensitivity” (CHAPOUTOT 2011).
With regard to the international aspect of the tourism industry, the tour operators remain the major players. In the 1970s, the foreign private sector was very influential because “foreign tour operators advised Tunisian property developers on the design and sizing of hotels and helped them financially by taking a stake in the projects, which ensured they had good marketing. This investment took one of two forms: (i) an advance recovered on services supplied to customers, generally over 2 or 3 years; (ii) a generally minor shareholding, that the Tunisian developers then quickly bought back” (CHAPOUTOT 2011). As the Tunisian economy opened up to the world market at the end of the 1980s, a reduction in the state’s role has again been seen, along with a larger role for private initiative. Consequently, marketing remains the prerogative of foreign tour operators and the relationship between hotel owners and tour operators has moved from collaboration to a well-understood partnership. Tour operators choose their partners on the basis of the hotel's location, brand image and category. These criteria affect the success of the tour operator’s activity and constitute its marketing strength towards its European customers. Furthermore, tour operators have grown through horizontal and vertical integration, which has increased their market share and strengthened their stranglehold on prices.
6 This regulation was made possible by the creation of Tourist Zones including one on Djerba (Decree 73-162 dated 5 April 1973), the production of development plans including one for Djerba (Decree 76-759 dated 31 August 1976) and of planning rules which specified the conditions for land use. 7 This Code was preceded by Act 86-85 pertaining to encouraging tourism investments. 8 Article 15 of the 1990 Investments Act. 9 Act 93-120 dated 27 December 1993. 10 The author cites Fitch Ratings, 2007, “Tunisian tourism industry – business model needs re-engineering”, Tunis.
19
This increased integration with the Tunisian economy has been accompanied by the acceptance of ideas of sustainable development and partnership11. In this context, strong national legislation has again been seen via the establishment of two major institutions:
• a national commission for sustainable development was set up (Decree 93-2061 dated 11 October 1993) and a baseline document was produced12;
• the Ministry of the Environment and Land Development, established in 1992, has now become the Ministry of the Environment and Sustainable Development (MEDD), with various institutions coming under its wing: the national environmental protection agency (ANPE), the coastline protection and development agency (APAL), the energy management agency (ANME) and the Tunis international centre for environmental technology.
In addition to these new institutions, the Tunisian government has developed financial tools such as the Fund for the Protection of Tourist Zones13 which aims to improve sanitation and the environment, and state contributions for tourist towns to help these municipalities benefit from funding to improve public living space14.
To end this section, it should be highlighted that the Tunisian state remains solely responsible for land regulation and development policy and is also the responsible for the redistribution of public funds in the promotion of tourism. However, in the context of liberalisation and the removal of state structures in national economies, private stakeholders such as tour operators dictate their rules with regard to marketing tourism products, leaving the market to play a large role in the economic regulation of tourism on Djerba. Consequently, social regulation (via the issue of employment) is also largely left to the market.
V. Proposals of policy measures Following the various observations on the sustainability of Djerba, this final section focuses on the policy measures put forward by Chapoutot. We will base the structure of these proposals on an observation agreed upon by the group of experts who worked together on the Plan Bleu project “Profiles of sustainability – Mediterranean Destinations”: tourism should be seen as a means to develop an area and not as an end in itself. Tourism must be rooted in the territory, such that the tourism offer can be developed through encouraging a focus on quality rather than quantity by mobilising economic and social forces in the area. Thus, the proposals regarding integrated and sustainable local development are set out as follows: proposals for local governance with regard to decision making, economic proposals, socio-territorial proposals and environmental proposals.
1. Defining local governance for improved political regulation of tourism The first proposals concern the definition of a model of local governance for improved political regulation of tourism. According to Chapoutot, to improve the sustainability of the destination, it is important to define an environmental culture for each tourism product to reconcile tourism and environmental issues. There is a mismatch between the interests of private operators, i.e. hotel owners who are currently experiencing marketing difficulties, and the desire of the authorities to take all environmental issues into account. Consequently, in a context of market-regulated economic development and a reduced economic role for the state, “it is up to the state to preserve the environment and organise the development of tourism sites” (CHAPOUTOT 2011).
11 The author cites BOUZAHER A., FORSTER S., 1995, “Economic growth and environmental sustainability in Tunisia: linkages and implication”, Economics working paper on Tunisia. Appendix 1. World Bank; Europe, Central Asia, Middle East and North Africa Region; Technical Department; Environment Division; Washington DC. 12 Agenda 21, 1994. 13 Act 92-122 pertaining to the 1993 law on management finances and in particular Articles 38, 39 and 40 pertaining to the creation of a special fund. It is managed by the Finance Ministry, the Ministry of Tourism and the Tunisian Hotel Trade Federation (FTH). 14 They are managed by the Interior Ministry, the Secretary of State for Regional Affairs and Local Authorities and the Ministry of Tourism.
20
2. Policy measures in the business sector The policy measures that the author proposes in the business sector concern two major areas:
• improving the destination’s image15, diversifying the accommodation offer, enhancing the seaside resort offer, rolling out the practice of dynamic pricing16 more widely and implementing a Djerba tourism quality award;
• the development of websites by Djerba hotel owners for sales, transport and accommodation with a view to loosening the grip of tour operators.
So, “the marketing strategy will be based on promoting the local environment as an integrated whole. The island as a whole must present a tourism image that draws on and values all aspects of Djerba. Also, it is necessary to abandon the idea of a “tourist zone” and all the advantages linked to it: these fiscal, financial and marketing advantages should be distributed across the whole island” (CHAPOUTOT 2011).
3. Policy measures in the socio-territorial sector With regard to policy measures concerning sustainable socio-territorial development, the author says that it is important to work on enhancing and promoting the central area of the island (the interior which forms the hinterland of the tourist zone) beyond the current private initiatives based on building residential villas. According to Chapoutot, integrating the centre of the island would enable:
• participation in the development of a tourism offer whose land base is not just the coastline but includes the whole island;
• a reduction in the marginalisation of the centre which is currently economically and developmentally sidelined;
• reconnecting the centre of the island with economic dynamism through handicraft and local know-how, with the help of highly qualified technicians with an aim of reviving this sector which is vital for the island’s social balance.
4. Policy measures in the environmental sector In terms of proposals for policy measures in the environmental sector, the highly vulnerable natural environment must be subject to constant scrutiny: natural sites (beaches, dunes and salt flats) must be protected and agriculture must also be reformed. Finally, according to Chapoutot, Djerba must be considered as a whole island that draws its specific appeal from a harmonious balance between its natural environment and human activities. Taking account of the imbalance between coastal and inland areas leads to a set of recommendations that aim to integrate all future initiatives into an overall vision for the island.
Conclusion In order to summarise the profile of sustainability for Djerba, we compared it with the other destinations studied in the “Profiles of sustainability – Mediterranean Destinations” project: a second Principal Component Analysis (Figure 13) compares the sustainability of each destination with the mean and standard deviation17 for all sites studied and for each indicator used, based on the MSSD variables. This second Principal Component Analysis (PCA) does not incorporate information regarding governance because the “governance” variable can be considered more as a component used to explain the results and the
15 The author cites LEGOFF N., 2009, “Le Cap Bon face au tourisme informel : évolutions paysagères et risque environnemental” (Cap Bon confronted by informal tourism: landscape changes and environmental risks), Revue Tunisienne de Géographie (Tunisian Geography), n°40, pp. 57-86. 16 The aim of this policy is to promote early booking. 17 Standard deviation is the difference between the largest value and the smallest value in a sample.

21
economic, social, territorial and environmental impact of tourism on the destinations. In other words, the results observed correlate closely with the policy choices implemented in each destination. For instance, in destinations where the availability of water is not a problematic issue, this is due to the fact that the authorities have invested in infrastructure projects such as dams and desalination plants. In contrast, in destinations where, for instance, the land pressure caused by tourist and residential accommodation facilities is high, this is often because of a failure to enforce the regulatory framework or a lack of regulation, as well as because of property-related and financial speculation.
Figure 13 - Graph showing the profiles of sustainability for the tourist destinations studied
Source: Principal Component Analysis by Loïc Bourse, 2011. Guide (see also Figure 15 in the Appendix): Axes 1 and 3 explain 61% of the data variance. Axis 1 alone explains 53% of the data:
- The further the destination is to the right on Axis 1, the higher the environmental performance and the lower the social and economic performance in the destination,
- The further the destination is to the left on Axis 1, the higher the economic and social performance of the destination, alongside more negative environmental impacts.
Axis 3 explains 8% of the data: - The higher the destination is on Axis 3, the higher the economic and social performance of the destination, with high environmental impacts, - The lower the destination is on Axis 3, the lower the social and economic performance in the destination, with controlled or low environmental
impacts. The PCA results are used to distinguish between four types of “sustainability profile” for the destinations:
• destinations with a high level of economic performance, where social protection offers cohesion and the environmental impact of tourism is high (e.g. Torremolinos),
• destinations that are economically competitive, socially fragmented and where the environmental impact is significant (e.g. Djerba and Alanya),
• destinations that, in economic terms, are emerging or in rejuvenation phase, that are socially fragmented and where the environmental impact is either controlled (e.g. Rovinj) or geographically limited (e.g. Matrouh Governorate),

22
• destinations whose economic performance is poor, that are socially fragmented and where the environmental impact is low or controlled, but where land pressure is a threat (e.g. Cabras, Castelsardo, Tipasa and the Tétouan Coast).
In terms of sustainability, Djerba achieves similar results to Alanya, which is classified as the same type of “international destination with extensive tourist amenities”. These two destinations are nevertheless different from Torremolinos, especially in terms of social and environmental performance. From a social standpoint, tourism has increased Djerba’s appeal for migrants, transforming the island from a source of emigration to a destination for immigration. Tourism has also created more jobs than in other destinations of the same type. However, these results are still insufficient, with an imbalance between the active and inactive population, and an imbalance between the dependant population and the active working population. In addition, jobs in tourism requiring a high level of qualification are chiefly occupied by executive-level staff from other regions of Tunisia and abroad. This is the main reason why Djerba is shown as the lowest point on Axis 3 of Figure 13. From an environmental perspective, the land pressure caused by tourism on Djerba is lower than in Torremolinos, which explains the somewhat better environmental performance for the destination. However, the water and electricity consumption and the production of solid and liquid waste remain high. Although the economic results are lower for Djerba than for Torremolinos (revenue per bed, daily spending by tourists), it nonetheless remains true that the diversification of the accommodation and leisure offer has attenuated seasonality, which is lower in Djerba than in the other destination types. Djerba is therefore an economically competitive destination, as shown by its resilience and ability to bounce back from economic crises, but it is socially fragmented and the environmental impacts there are high.

23
Bibliography BUTLER, R.W., 1980. The concept of a tourist area cycle of evolution: implications for management of resources. Canadian
Geographer / Le Géographe canadien, 24(1), p.5-12.
CHAPOUTOT, J.M.M., 2011. Profil de durabilité de la destination touristique Jerba - Tunisie, Sophia Antipolis: Plan Bleu.
CHAPOUTOT, J.M.M., 1990, "Tourisme, alternative à l’aménagement", Revue d’Économie Régionale et Urbaine n° 4, Publication de l’ADICUEER avec le concours du C.N.R.S, p. 511-522.
CHAPOUTOT, J.M.M., 1994, Le foncier touristique en Tunisie : de la disponibilité à la préservation, Cahiers du Tourisme, série B-74, 50 p., Centre des Hautes Études Touristiques, Aix-en-Provence.
CHAPOUTOT, J.M.M., 1999, "Jerba : espace insulaire, développement touristique et comportement humain", Série colloques et séminaires, n°79, Université Mohamed V – Agdal, Rabat, pp. 121-135.
CHAPOUTOT, J.M.M., 1999, "La politique touristique de la Tunisie à l’heure de la mondialisation : reformulation des stratégies et redéfinition du rôle des acteurs", Iremam, coll. Études de l’Annuaire de l’Afrique du Nord, pp. 163-183.
CHAPOUTOT, J.M.M., 2004, Indicators of sustainable development for tourism destinations (coll.) OMT, Madrid.
CHAPOUTOT, J.M.M., 2008, "De la qualité à la qualité totale : Les systèmes d’appui à la qualité dans l’hôtellerie en Tunisie", Les Cahiers internationaux du tourisme, n°2, Cirvath, Perpignan.
CUTTELOD, A. et al., 2008. The Mediterranean: a Biodiversity Hotspot under Threat. The IUCN Red List of Threatened Species.
PLAN BLEU, 2009. Etat de l’environnement et du développement en Méditerranée, Sophia Antipolis: Plan Bleu, PNUE/PAM.
SPILANIS, I. & VAYANNI, H., 2011. Tourism results and impacts to the destinations’ sustainability, Sophia Antipolis: Plan Bleu.

24
Table of illustrations Figure 1 - Graph showing the types of tourist destination studied ............................................................ 6 Figure 2 - “International destinations with extensive tourist amenities” based on the Butler model (BUTLER 1980)................................................................................................................................................. 7 Figure 3 - Changes in the tourist accommodation offer on Djerba. Number of beds/spaces (%). 1998-2007 ............................................................................................................................................................ 8 Figure 4 - Changes in monthly occupancy rates on Djerba ........................................................................ 9 Figure 5 - Effects of the diversification of leisure activities on seasonality (2007) ................................ 10 Figure 6 - Changes in tourism revenue (€ per bed) (2004-2008) .............................................................. 11 Figure 7 - Demographic changes. Djerba .................................................................................................... 12 Figure 8 - Education levels. Djerba (2004) .................................................................................................. 13 Figure 9 - Capacity to supply water consumption in the tourism sector (m3) (2004) ............................ 14 Figure 10 - Tourism sector electricity consumption (kWh) ...................................................................... 15 Figure 11 - Changes in land use on Djerba .................................................................................................. 16 Figure 12 - Djerba and Mediterranean biodiversity, as defined by the IUCN (CUTTELOD et al. 2008) .................................................................................................................................................................. 17 Figure 13 - Graph showing the profiles of sustainability for the tourist destinations studied ............. 21 Figure 14 - Schematic representation of the classification based on a Principal Component Analysis25 Figure 15 - Schematic representation of the Principal Component Analysis of the sustainability profiles ............................................................................................................................................................... 25
Table 1 - Correlation coefficients to test the influence of golfing and cultural activities on reducing seasonality ......................................................................................................................................................... 10 Table 2 - Share of tourism in the number of jobs (%) (2004) .................................................................. 12 Table 3 - Employment conditions in the tourism sector (%) (2008) ....................................................... 12 Table 4 - Water and electricity consumption; production of solid and liquid waste ............................. 15 Table 5 - Destination Datasheet of Jerba ..................................................................................................... 26

25
Appendices
Figure 14 - Schematic representation of the classification based on a Principal Component Analysis
Source: Loïc Bourse, 2011
Figure 15 - Schematic representation of the Principal Component Analysis of the sustainability profiles
Source: Loïc Bourse, 2011.

26
Table 5 - Destination Datasheet of Jerba
Year Value (1 : yes ; 0 : no)
Demand Residents (%) 2008 3,70% Non-residents (%) 2008 96,30% Charter passengers/total passengers 2008 77,94% Airport 2011 1 Harbour 2011 0 Accommodation offer Number of beds 2007 45 631 Hotel beds / total number of beds (%) no data Holiday village beds (%) no data Other beds (%) no data Campsite spaces (%) no data Leisure amenities Spas / health clubs 2011 1 Sports amenities 2011 1 Casino 2011 1 Golf courses 2011 1 Leisure parks 2011 1 Marinas 2011 1 Conference and exhibition centres 2011 0 Beaches 2011 1 Natural and cultural heritage Historic monuments 2011 1 Places of worship 2011 1 Museums 2011 1 Cultural events (festivals or traditional events) 2011 1 Nature reserves 2011 0 Places selling local products (craft markets) 2011 0 Cultural activities 2011 0 Economic performance Number of overnight stays 2008 815 000 Daily spending per tourist (€) 2008 25 Revenue per bed (€) 2008 5 077 Revenue per overnight stay (€) 2008 24 Seasonality Mean annual occupancy rate 2008 58,40% Social performance Direct employment per bed (number of jobs) 2008 0,39725453 Unemployment 2004 8,43% Level of education of employees: higher education 2004 5,67% Level of education of employees: secondary education 2004 33,57% Level of education of employees: primary education 2004 44,47% Level of education of employees: no qualifications 2004 16,33% Demographic indicators Total population 2004 130 850 Dependent population 2004 36,33% Life expectancy 2004 72,9 yrs Population growth rate 2004 2,03% Migration rate 2004 0,75% Environmental performance Water consumption 2004 0,76 m3/night spent Energy consumption 2008 14,24 kwh/night spent Waste production 2004 1,73 kg/tourist/day Wastewater production 2004 11 511 m3/day Land area of tourist accommodation / total area governed by local authority 2007 122,89