profile of t-beam bridges in pa
TRANSCRIPT

Profile of TProfile of T--beam Bridges in PAbeam Bridges in PA
n Total Number in USA > 32,000n Total Number in PA >2600n Type Specific Design
n Built Between ~1930 & 1950n Span ~20 ft -40 ftn Width ~ 20 ft - 40 ftn Skew ~ 0 - 45 degn Slab Thickness ~ 8-8.5 inn Beam Spacing ~ 5 ft on centern Beam Depth ~ 19 in - 40 in
1,651 Single Span T-beam Bridges in PA Standard Design Drawings

Statistical Sampling of TStatistical Sampling of T--beam Bridgesbeam Bridges
15
Bri
dge
Pop
ulat
ion
Degree Skew
Bri
dg
e P
op
ula
tion
Structural Parameters
Bri
dg
e P
op
ula
tio
n
Condition Rating0 1 2 3 4 5 6 7 8 9 10 11
Year Constructed
Bri
dge
Pop
ulat
ion
19481929Location
Condition Parameters
District Engineers' Input for Bridges That Need Evaluation
SPAN
Span (ft)
SKEW
30'
50%
50%25%50%
50%
50% 25%
25%
50%
25%
Load Capacity Rating=F (Nominal Structural Parameters + Condition Parameters)

Model Calibration with Field Test ResultsModel Calibration with Field Test Results
Transverse Centerline Deflection of the Superstructure (Test vs. Models)
Def
lect
ion
(in
)
-0.010
-0.020
-0.030
0
-0.040
-0.050
-0.060
-0.070
Section A-A
A2 B2 C2 D2 E2 F2
-0.010
-0.020
-0.030
0
Def
lect
ion
(in
)
-0.040
-0.050
-0.060
-0.070
Deflection of the T-Beam "C" (Test vs. Models)
Superstructure
C3 C2 C1
Section B-BLoad Test Truck
51.5 kips 48.0 kips
Boundary Condition Idealization of Different Models
Positioning Trucks
Displacement Sensor Location
Steel Strain Sensor Location Concrete Strain Gauge Location
A-A
A B C D E F
3
2
1
CL
CL
B-BK K K K
Calibrated FEM
Truck and Sensor Locations:
a) Instrumentation Plan, Truck Loading and Model Boundary Conditions
b) Regional Calibration and Correlation
Pins @ dowel locations
RFinv=3.18RF inv=2.96 RF inv=3.06
RFinv=2.94RF inv=1.89 RF inv=2.02
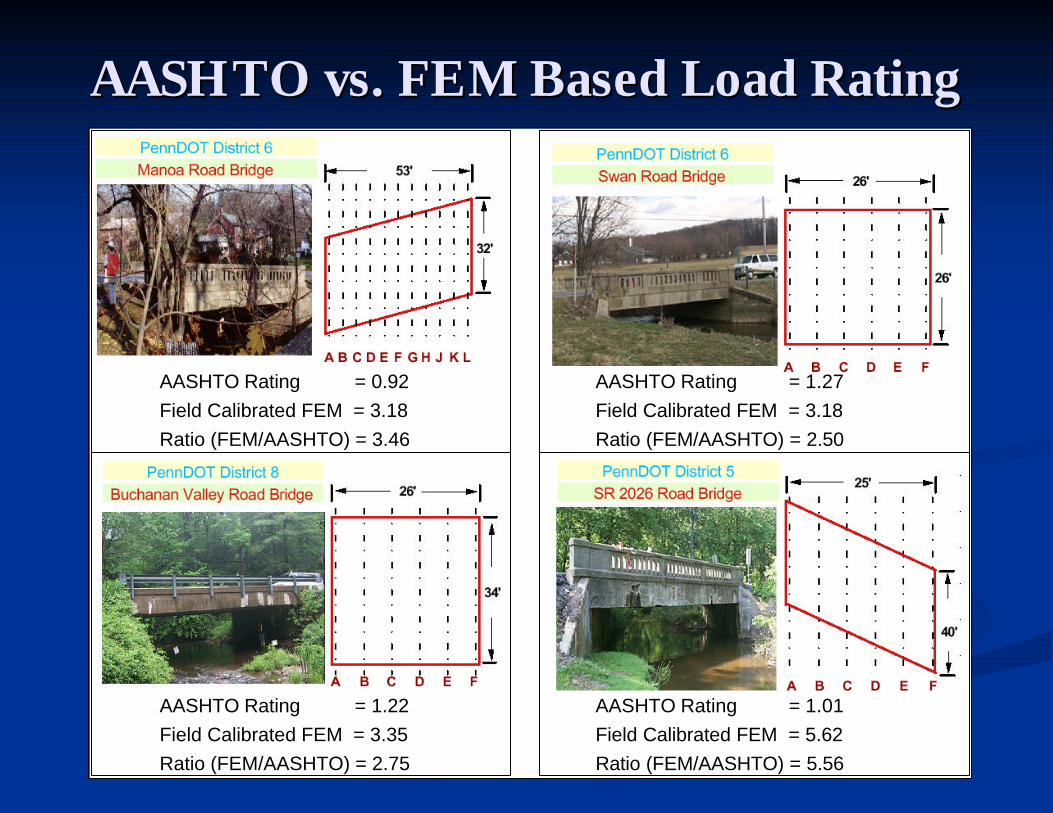
AASHTO vs. FEM Based Load RatingAASHTO vs. FEM Based Load Rating
Ratio (FEM/AASHTO) = 5.56
AASHTO Rating = 1.01Field Calibrated FEM = 5.62
Ratio (FEM/AASHTO) = 2.75
AASHTO Rating = 1.22Field Calibrated FEM = 3.35
Ratio (FEM/AASHTO) = 2.50
AASHTO Rating = 1.27Field Calibrated FEM = 3.18
Ratio (FEM/AASHTO) = 3.46
AASHTO Rating = 0.92Field Calibrated FEM = 3.18