reflective cracking of shear keys in multi-beam bridges
TRANSCRIPT
REFLECTIVE CRACKING OF SHEAR KEYS
IN MULTI-BEAM BRIDGES
A Thesis
by
GRAEME PETER SHARPE
Submitted to the Office of Graduate Studies of
Texas A&M University in partial fulfillment of the requirements for the degree of
MASTER OF SCIENCE
August 2007
Major Subject: Civil Engineering

REFLECTIVE CRACKING OF SHEAR KEYS
IN MULTI-BEAM BRIDGES
A Thesis
by
GRAEME PETER SHARPE
Submitted to the Office of Graduate Studies of Texas A&M University
in partial fulfillment of the requirements for the degree of
MASTER OF SCIENCE
Approved by: Chair of Committee, Harry Jones Committee Members, Ray James Harry Hogan Head of Department, David Rosowsky August 2007 Major Subject: Civil Engineering

iii
ABSTRACT
Reflective Cracking of Shear Keys
in Multi-beam Bridges. (August 2007)
Graeme Peter Sharpe, B.S., Carnegie Mellon University
Chair of Advisory Committee: Dr. Harry Jones
Multi-beam bridges made from precast concrete box girders are one of the most
common bridge types used in the United States. One problem that affects these bridges
is the development of longitudinal or reflective cracks on the road surface because of
failure of the shear keys. Some states have attempted to correct this problem by
redesigning the shear key or adding post-tensioning, but the problem persists in many
new bridges.
The purpose of this study is to investigate why these shear key failures are
occurring. This project studies two types of box girder designs, the common
Precast/Prestressed Concrete Institute (PCI) box girder bridges and the Texas
Department of Tranportation (TxDOT) box girder bridge. In the past, reflective
cracking has occurred in bridges of both types.
The analysis procedure involves finite element analyses of bridge models with
realistic support and loading conditions, and comparing the PCI and TxDOT bridges.
The results indicate that both PCI and TxDOT box girder have sufficient strength to
resist cracking from vehicular loads, but uneven temperature changes and shrinkage

iv
strains cause high tensile stresses in the shear key regions and lead to reflective cracking.
The analyses showed the highest stresses were often times near the supports, rather than
at midspan.
Past studies have proposed using larger composite deck slabs, transverse post-
tensioning, or full-depth shear keys to prevent shear key failure. Composite slabs were
the most effective way to reduce high stresses in shear keys, and were effective for all
loading cases considered. Post-tensioning and full-depth keys also showed a reduction
in shear key stresses, but were less effective.

v
DEDICATION
This work is dedicated to my wonderful wife, Heather Joan Sharpe. She
supported me in many ways during my time at Texas A&M, in both the jubilant times of
gathering results to the despairs of lost data. She has my utmost respect as a fellow
engineer, and has always inspired me to do my very best.

vi
ACKNOWLEDGEMENTS
I would like to take this opportunity to acknowledge those individuals who have
contributed to the completion of this thesis. My advisor, Dr. Harry Jones was a great
leader and helped me explore the many details of this complicated engineering problem.
His advice was always meaningful and I am appreciative for the time he spent on this
project.
Dr. Ray James also taught me a great deal about this subject as a graduate
assistant at the Texas Transportation Institute. I would like to thank him, TTI, and Dr.
Jones once again for their assistance on that project and the funding it provided which
allowed me to finish this thesis.
My fellow students at Texas A&M University deserve a lot of credit for helping
me understand the many difficult aspects of computer modeling, and I would like to
thank them. Special thanks go to Jong-Wha Bai, Yateesh Contractor, Tamas Liszkai,
Fayez Moutassem, and Shashikant Sarada, who were always there for help and advice.
Also special thanks to Natalie Brush, who was a great research partner and dedicated a
lot of her time towards our project.
I would like to acknowledge the help from the Texas A&M Supercomputing
Center and the High-Bay Structural and Materials Testing Laboratory. Their help and
commitment to research activities were always appreciated.

vii
TABLE OF CONTENTS
Page
ABSTRACT ..................................................................................................................... iii
DEDICATION ...................................................................................................................v
ACKNOWLEDGEMENTS ..............................................................................................vi
TABLE OF CONTENTS .................................................................................................vii
LIST OF FIGURES...........................................................................................................ix
LIST OF TABLES ..........................................................................................................xiv
INTRODUCTION..............................................................................................................1
RESEARCH OBJECTIVES ..............................................................................................7
LITERATURE REVIEW...................................................................................................8
Materials Selection .................................................................................................8 Transverse Post-Tensioning .................................................................................10 Small Scale Tests .................................................................................................11 Large Scale Tests .................................................................................................17 Other Box Girder Bridge Literature .....................................................................20 Elastomeric Bearing Pad Literature .....................................................................21
BRIDGES STUDIED.......................................................................................................22
TxDOT Box Girders.............................................................................................22 PCI Box Girders ...................................................................................................25
SOLID MODEL DESCRIPTION....................................................................................29
Introduction ..........................................................................................................29 Box Girder Description ........................................................................................30 Shear Key and Slab Description...........................................................................30 Material Properties ...............................................................................................31 Internal Diaphragms.............................................................................................32

viii
Page
IDEALIZATION OF BEAM SUPPORTS ......................................................................33
Introduction ..........................................................................................................33 Elastomeric Bearing Pads.....................................................................................33 Linear Spring Models...........................................................................................34 Linear Spring Stiffness.........................................................................................36
LOADS APPLIED ...........................................................................................................40
HS-25 Truck Loading...........................................................................................40 Initial Shrinkage Loads ........................................................................................44 Thermal Gradient Load ........................................................................................47
ANALYSIS PROCEDURE .............................................................................................50
Description of Program Output ............................................................................50 Failure Criteria .....................................................................................................52
SOLID MODEL VERIFICATION..................................................................................55
Beam Bending ......................................................................................................55 Transverse Bending..............................................................................................57 Submodel Analysis...............................................................................................63
RESULTS.........................................................................................................................80
Introduction ..........................................................................................................80 Results for Shrinkage Loading.............................................................................82 Results for Temperature Loading.........................................................................90 Results for Vehicular Loading .............................................................................98 Discussion of Bridge Features............................................................................102
SUMMARY AND CONCLUSIONS.............................................................................115
Summary of Project............................................................................................115 Summary of Results ...........................................................................................117 Conclusions ........................................................................................................118 Recommendations for Further Research ............................................................119
REFERENCES...............................................................................................................121
VITA ..............................................................................................................................123

ix
LIST OF FIGURES
Page Figure 1: Schematic of Two Box Girders and a Shear Key ..............................................2
Figure 2: PCI 33” Box Girder with Shear Keys................................................................5
Figure 3: TxDOT 34” Box Girder with Shear Keys .........................................................5
Figure 4: Test Specimen Under Tension.........................................................................12
Figure 5: Test Specimen in Bending ...............................................................................12
Figure 6: Test Specimen in Shear....................................................................................13
Figure 7: Typical TxDOT Box Girder Geometry ...........................................................23
Figure 8: PCI Box Girder Typical Geometry..................................................................26
Figure 9: 5B34 Box Girder with Mesh............................................................................30
Figure 10: Shear Key Detail with Element Mesh............................................................31
Figure 11: Bearing Pad Deformation and Behavior........................................................34
Figure 12: Bearing Pad Vertical Spring Supports ...........................................................35
Figure 13: Bearing Pad Schematic ..................................................................................36
Figure 14: Truck at Midspan Location............................................................................41
Figure 15: Truck at End of Span Location .......................................................................41
Figure 16: Truck Axle Location on 2-Lane Bridge.........................................................42
Figure 17: Truck Axle Location on 3-Lane Bridge, Lane 1............................................42
Figure 18: Truck Axle Location for 3-Lane Bridge, Lane 2 ...........................................43
Figure 19: Schematic of Shrinkage Effects.....................................................................45

x
Page Figure 20: Positive Temperature Profile for Thermal Gradient Load.............................48
Figure 21: Negative Temperature Profile for Thermal Gradient Load ...........................49
Figure 22: Girder and Shear Key Cross Section .............................................................51
Figure 23: Transverse Normal Stress Profile ..................................................................51
Figure 24: Beam Bending Test Bridge............................................................................56
Figure 25: Transverse Bending Test Bridge ...................................................................58
Figure 26: Transverse Bending Shell Model...................................................................59
Figure 27: Transverse Bending Solid Model ..................................................................60
Figure 28: Results for Transverse Bending Bridge Models ............................................61
Figure 29: Shell Model vs. Solid Model Results ............................................................63
Figure 30: Global Model and Highlighted Submodel Region ........................................65
Figure 31: Global Model Mesh .......................................................................................66
Figure 32: Submodel Mesh .............................................................................................67
Figure 33: Closer View of Submodel Shear Key............................................................67
Figure 34: Submodel with Applied Constraints ..............................................................68
Figure 35: Maximum Transverse Stress in Submodel due to Slab Shrinkage ................69
Figure 36: Stress Profile for Slab Shrinkage ...................................................................70
Figure 37: Maximum Transverse Stress in Submodel due to Shear Key Shrinkage ......71
Figure 38: Stress Profile for Shear Key Shrinkage .........................................................72
Figure 39: Maximum Transverse Stress in Submodel due to Positive
Temperature Gradient ....................................................................................73

xi
Page Figure 40: Stress Profile for Positive Temperature Gradient ..........................................74
Figure 41: Maximum Transverse Stress in Submodel due to Negative
Temperature Gradient ....................................................................................75
Figure 42: Stress Profile for Negative Temperature Gradient ........................................76
Figure 43: Maximum Transverse Stress in Submodel due to Truck Loading.................77
Figure 44: Stress Profile for Truck Loading ...................................................................78
Figure 45: Joint Numbering Scheme...............................................................................81
Figure 46: Maximum Transverse Stress due to Slab Shrinkage in 2-Lane Bridges .......83
Figure 47: Maximum Transverse Stress due to Slab Shrinkage in 3-Lane Bridges .......84
Figure 48: Stresses in Joints for TxDOT Bridge due to Slab Shrinkage
(2-Lane TB28 - 59) ........................................................................................85
Figure 49: Stresses in Joints for PCI Bridge due to Slab Shrinkage
(2-Lane PB27 - 59).........................................................................................85
Figure 50: Maximum Transverse Stress due to Shear Key Shrinkage in
2-Lane Bridges ...............................................................................................87
Figure 51: Maximum Transverse Stress due to Shear Key Shrinkage in
3-Lane Bridges ...............................................................................................88
Figure 52: Stresses in Joint for TxDOT Bridge Under Shear Key Shrinkage
(2-Lane TB28 - 59) ........................................................................................89
Figure 53: Stresses in Joint for PCI Bridge under Shear Key Shrinkage
(2-Lane PB27 - 59).........................................................................................89
xii
Page Figure 54: Maximum Transverse Stress due to Positive Thermal Gradient in
2-Lane Bridges ...............................................................................................91
Figure 55: Maximum Transverse Stress due to Positive Thermal Gradient in
3-Lane Bridges ...............................................................................................92
Figure 56: Stresses in Joint for TxDOT Bridge due to Positive Temperature
Gradient ..........................................................................................................93
Figure 57: Stresses in Joint for PCI Bridge due to Positive Temperature Gradient........93
Figure 58: Maximum Transverse Stress due to Negative Thermal Gradient in
2-Lane Bridges ...............................................................................................95
Figure 59: Maximum Transverse Stress due to Negative Thermal Gradient in
3-Lane Bridges ...............................................................................................96
Figure 60: Stresses in Joint for TxDOT Bridge due to Negative Thermal Gradient ......97
Figure 61: Stresses in Joint for PCI Bridge due to Negative Thermal Gradient .............97
Figure 62: Maximum Transverse Stress due to HS-25 Loading in 2-Lane Bridges .......99
Figure 63: Maximum Transverse Stress due to HS-25 Loading in 3-Lane Bridges .....100
Figure 64: Stresses in Joint for TxDOT Bridge due to Truck Loading
(2-Lane TB28 - 59) ......................................................................................101
Figure 65: Stresses in Joint for PCI Bridge due to Truck Loading
(2-Lane PB27 - 59).......................................................................................101
Figure 66: TxDOT Bridge with no shear key under HS-25 loads
(2-Lane TB28 – S 59)...................................................................................103

xiii
Page Figure 67: TxDOT Bridge with no shear key and (+) Thermal Gradient Loads
(2-Lane TB28 - S 59) ...................................................................................104
Figure 68: Texas Box Girder (TB28) with Full Depth Shear Key................................105
Figure 69: PCI Box Girder (PB27) with Full Depth Shear Key ...................................105
Figure 70: TxDOT Bridge with Full-Depth Key under HS-25 Loads
(2-Lane TB28 - FD 59) ................................................................................107
Figure 71: TxDOT Bridge with Full-Depth Key under (-) Thermal Gradient Loads ....107
Figure 72: Average Stress in TxDOT bridge from Post-Tensioning Force
(2-Lane TB28 – PT 59) ................................................................................109
Figure 73: Post-Tensioned TxDOT Bridge without Loads Applied
(2-Lane TB28 – PT 59) ................................................................................110
Figure 74: Post-Tensioned TxDOT Bridge without Loads Applied
(2-Lane TB28 – PT 59) ................................................................................111
Figure 75: Post-Tensioned PCI Bridge without Loads Applied
(2-Lane PB27 – PT 59) ................................................................................112
Figure 76: Post-Tensioned PCI Bridge without Loads Applied
(2-Lane PB27 – PT 59) ................................................................................113

xiv
LIST OF TABLES
Page Table 1: Small-scale specimen tests................................................................................16
Table 2: TxDOT Box Beam Typical Spans ....................................................................24
Table 3: Table of TxDOT Box Girder Bridges ...............................................................25
Table 4: PCI Box Beams and Typical Spans ..................................................................26
Table 5: Comparison of PCI and TxDOT Box Beams....................................................27
Table 6: Table of PCI Box Girder Bridges .....................................................................28
Table 7: Bearing Pad Stiffnesses.....................................................................................39
Table 8: Shrinkage loads applied to bridge .....................................................................47
Table 9: Beam Verification Results ................................................................................57
Table 10: Bridge Suffix Identification Code...................................................................80

1
INTRODUCTION
Transportation departments across the U.S. have been using concrete box girder
bridges since the 1950’s. This bridge style accounts for a significant percentage of new
and existing bridges (FHWA 2005). The section depth is one of the most important
considerations for a new bridge, as the overhead clearance of a bridge affects many costs
associated with bridge construction. The concrete box girder bridge is well suited for
highway structures that require a limited section depth, short to medium spans, and rapid
construction. The initial cost of the bridge is high when compared to other bridge types,
but the advantages of box girder bridges often justify the higher cost.
The construction process for a multi-beam bridge occurs in distinct phases. The
first phase is the construction of the box girders off-site, at a precast concrete
manufacturing facility. The benefit of the precast process is that the manufacturer can
maintain a high level of quality control over the materials used in the construction of the
box girder. The next phase is the on-site construction of all the bridge sub-components,
such as bent caps and approach slabs. When the site is ready for the placement of the
box girders, they are lifted into place with a crane. Typically, the box girders rest on
bearing pads that will accommodate the thermal elongation experienced by the box
girders. The final phase of the construction process is the creation of joints, called shear
keys, that link the individual box girders together and transfer vehicle loads from one
beam to the next so they share the loads produced by vehicular traffic. In addition, a
composite deck slab may be applied either as an integral part of the shear key casting
operation or as a separate, later stage. This thesis follows the style of ASCE Journal of Bridge Engineering.

2
The shear key gets its name from the transfer of vertical shear forces between
adjacent girders. It has a geometry that causes the two girders to deflect as a single unit.
When present, a composite deck slab also contributes to the transfer of forces between
adjacent boxes. The multi-beam bridge cross section shown in Figure 1 is a Texas
Department of Transportaion (TxDOT) standard and utilizes a large shear key.
Figure 1: Schematic of Two Box Girders and a Shear Key
Reflective cracking in a multi-beam bridge refers to longitudinal cracks that can
form on the roadway surface over the shear key area. TxDOT, as well as a number of
other state DOT’s, have reported reflective cracking problems severe enough to require
corrective maintenance or replacement of the entire bridge. It is generally held that such
cracking is associated with cracking which first occurs in the shear key below. The

3
reflection of keyway cracks in roadway surfaces can lead to spalling in a concrete deck
and debonding of the asphalt layer when an overlaid riding surface is used. Field
inspections of distressed multi-beam bridges by various transportation agencies suggests
that shear key integrity deteriorates over time as a result of repetitive loads from passing
traffic and causes more pronounced reflective cracking in the riding surface. Other field
reports indicate that some bridges develop reflective cracks very soon after the bridge is
completed, and sometimes before it is open for traffic.
Reflective cracks can be a major maintenance issue. Cracks in the roadway
surface allow water and de-icing salts to corrode the reinforcing steel in the beams and
the composite deck slab. Stains visible on the underside of the bridge and cracks on the
road surface are considered unsightly. Also, transverse post-tensioning and tie bars, if
present on the bridge, will be exposed to corrosive chemicals and begin to degrade. If
the shear key damage is severe enough, it is possible for a girder to be overloaded
because no load distribution to adjacent beams is occurring. This means that a girder
may support loads greater than anticipated, and this can result in faster deterioration or
structural failure. For example, a multi-beam box girder bridge experienced this type of
failure in late 2005 (Grata and Saxton 2005), and the state of Pennsylvania had to close
and inspect similar bridges.
The geometry of shear keys in use today seems to have evolved from early
experiences and lacks any mechanics based procedure for rational design. In the last
decade, however, growing awareness of common problems with shear keys led to new

4
efforts to design a better shear key. Reports since that time indicate that the problem
continues, and further information is needed on this subject.
Some states have attempted to reduce reflective cracking through expensive
alterations. TxDOT, for example, has issued new standard designs which mandate the
use of a minimum 5 inch thick reinforced deck slab, adding cost and construction time to
projects. Others have changed their designs to incorporate more extensive transverse
post tensioning, which also increases cost significantly.
The two box girder designs considered in this study are the PCI/AASHTO
(Precast/Prestressed Concrete Institute and American Association of State Highway and
Transportation Officials) and the TxDOT version. The PCI – AASHTO design is used
by more than half of the states in the U.S. The Texas DOT uses its own version with a
more massive shear key. Figure 2 shows a PCI 33 inch deep box girder with associated
shear keys as adopted by the Ohio DOT. Figure 3 shows a TxDOT 34 inch deep box
girder and shear keys. The PCI girder has less concrete in the cross section and a much
smaller shear key than the TxDOT girder. The bridges have similar structural properties,
however, and are used for similar span lengths in multi-beam bridges. The primary
reinforcement is prestressed steel strands at the bottom flange, and the amount of
prestressing force along with section depth generally determines the span length and
load capacity.

5
Figure 2: PCI 33” Box Girder with Shear Keys
Figure 3: TxDOT 34” Box Girder with Shear Keys

6
The PCI and Texas shear keys share several other characteristics. They are both
set high up in the section and make up part of the roadway surface. Also, the gap in the
bottom is small so that a stop can be placed to contain the grout or concrete in the
keyway. The keyway inset into the soffit of the box beam is usually very shallow or
slanted in order to prevent air pockets from forming and weakening the joint.
The complex geometry of box girder bridges means that numerical methods or
laboratory tests are necessary to determine stresses in the shear key. The AASHTO
lateral load distribution factors can be used to determine the shear forces transferred
between adjacent box girders due to traffic loads, but experience shows that the
reflective cracking will occur if the shear keys are designed only to resist vertical shear.
This happens because transverse normal stresses in the shear key from shrinkage,
thermal effects, and wheel loads are also acting on the shear key. In this study, FEA was
used to examine the stress state in the shear key. This approach also allows for
incorporating the effects of composite deck slabs and transverse post-tensioning on the
stress field in the shear key.
It is believed that both these elements work to reduce the tensile stresses in the
shear key and prevent or reduce cracking. Field experience, however, demonstrates that
the addition of these elements doesn’t ensure the elimination of shear key cracking. This
study was undertaken in an attempt to correlate the state of stress in the shear key with
observed deterioration reported in both TxDOT and PCI concrete box girder bridges.
7
RESEARCH OBJECTIVES
The objectives of this study are:
1) Determine the state of stress in the shear key resulting from different
loading situations
2) Determine what loads are likely to damage shear key connections in
multi-beam box girder bridges
3) Determine the effectiveness of post-tensioning and composite slabs in
reducing shear key failure
4) Compare the behavior of the PCI and TxDOT box girders which
represent the two extremes of shear key design

8
LITERATURE REVIEW
In this section previous work relating to the failure of shear keys is reviewed in
order to fully describe the problem at hand, and to understand what solutions have
already been proposed. The research conducted on shear keys is divided into five
categories; the first addresses materials selection, the second addresses the effect of
transverse post-tensioning, the third reviews small-scale tests, and the fourth group
investigates the performance of shear keys in full-scale constructed multi-beam bridges.
The final section discusses the general design and construction, as well as the history of
box girder bridges.
Materials Selection
The most common material choices for a shear key are unreinforced concrete or
cementitious grout. However, other materials have been used, and research into the
effectiveness of alternative materials has been conducted previously. Tensile and
compressive strength are the most often cited properties of a shear key material. Just as
important are several other factors such as amount of shrinkage, bond strength, chloride
permeability, and ease of application. Higher performing materials will have higher
cost, and a balance must be struck between the need for a reasonably priced material and
the need for reliable performance.
The materials used in shear keys and their ASTM specifications are described in
"Evaluation of Keyway Grout Test Methods for Precast Concrete Bridges" (Gulyas et al.
1995). This article details the work that Master Builders Technologies researchers have

9
conducted on the benefits of using cementitious materials other than grout in shear keys.
The authors discuss important information related to the shrinkage and bond strength of
both non-shrink grout and “Set-45” or magnesium ammonium phosphate (Mg-NH4-
PO4) mortar. The Set-45 mortar tested much better in both the bond strength test and
shrinkage test.
In a follow up commentary to the last article (Nottingham et al. 1995), an
engineering firm discusses their experience with using Set-45 on a dock structure on the
coast of Alaska. The shear keys there have performed well in a precast panel deck.
However, the authors state that inappropriate joint details can lead to poor performance
and early failure in typical installations.
Another alternative material discussed in the literature is epoxy based glue. The
article “Epoxy Glue Joints in Precast Concrete Segmental Bridge Construction”
(Moreton 1981) focused on how an epoxy glue joint would behave if two beams were
joined and subjected to bending. The results published by the author indicate that the
joints performed well if the mating surfaces were prepared carefully and the glue is
allowed to cure under the appropriate conditions. In this study, epoxy was applied by
hand and the specimens had to be pressed together for several days to achieve the right
bond, indicating the need for some type of transverse post-tensioning system.
Further research into the use of alternative materials such discussed above is in
the article "Performance of Transverse Joint Grout Materials in Full-Depth Precast
Concrete Bridge Deck Systems" (Issa et al. 2003). The article details the authors’ efforts
to compare different materials, including grout, Set-45 (Mg-NH4-PO4), Set-45 HW (for

10
hot weather), and polymer concrete. The authors concluded that conventional grout is
the best material choice because it provides high strength and ease of use. Further, the
authors state that they recommend polymer concrete over the Set-45 mortar where
extreme conditions warrant a more expensive solution.
Transverse Post-Tensioning
An important factor cited in some earlier work is transverse post-tensioning.
Some previous studies have suggested that reflective cracking can be remedied with
large amounts of post-tensioning. Post tensioning has the ability to reduce debonding
and tension failures by applying transverse compression across the shear keys.
However, the amount of force and spacing of the post-tensioning strands needed to
obtain satisfactory behavior in a general case is unclear. In addition, TxDOT as well as
some other state DOT’s, are cautious about using transverse post-tensioning because it
can add significant cost and make the multi-beam bridges more troublesome than other
types of bridge construction.
In Japan, where shear keys seldom fail, a large amount of transverse post-
tensioning is used. In the article “Transverse Design of Adjacent Precast Prestressed
Concrete Box Girder Bridges” (El Remaily et al. 1996), the authors detail Japan’s efforts
and adapt them to conventional bridges in the U.S. Some details of this design are full-
depth shear keys with cast in place concrete filled diaphragms at the quarter-point
locations of the bridge where post-tensioning strands can be used, and a relatively high
post-tensioning force.

11
The article “Shear Strength of Post-Tensioned Grouted Keyed Connections”
relates the strength of a shear key joint to the amount of transverse post-tensioning
(Annamalai and Brown 1990). Their experiments show that increased post-tensioning
improves both the strength and the monolithic behavior of a shear key. They state that
the successful performance of grouted shear keys depend primarily on the amount of
compressive stress present.
Two articles that present in-depth analyses of shear keys and their failure are
"Fracture Mechanics Approach for Failure of Concrete Shear Key I: Theory" (Kaneko
et al. 1993a) and "Fracture Mechanics Approach for Failure of Concrete Shear Key II:
Verification" (Kaneko et al. 1993b). In these papers, the authors use the principles of
fracture mechanics to derive the failure conditions for a concrete shear key. The results
from the first paper were based on certain fracture mechanics assumptions, but may not
be applicable for every shear key geometry or loading scenario. A closed form solution
that gives the shear strength or peak load of a shear key is presented. However, this
equation assumes that post-tensioning will be present and that vertical shear controls the
failure, but if these assumptions are not met then the equation will not give meaningful
results.
Small Scale Tests
Several of the articles in the literature include results from small-scale tests
performed on shear key specimens. These tests are intended to characterize the strength
per unit width of a shear key design for a given material and address the capacity of a

12
shear key in shear, moment, or tension. The testing configuration for tension is shown in
Figure 4, moment testing is shown in Figure 5, and shear testing is shown in Figure 6.
Figure 4: Test Specimen Under Tension
Figure 5: Test Specimen in Bending

13
Figure 6: Test Specimen in Shear
The above referenced article about material selection (Issa et al. 2003) presents
the results for the specimens that were tested in several failure modes. The specimens
represented a typical transverse joint for a full-depth concrete bridge deck and the shear
keys were 6 to 8 inches deep and 5 to 6 inches wide. The test results for conventional
grout material yielded shear key strengths of 358 psi in direct shear, 223 psi in direct
tension, and 620 psi in flexural tests.
Gulyas et al. include information about failures of small-scale specimens in the
article mentioned earlier. In their tests, grouted shear key specimens 8 to 12 inches deep
and 3.25 inches wide were subjected to various loading conditions. Their results

14
indicated that the specimens with grout failed at 75 psi in direct tension, 61 psi in
longitudinal shear, and failed in vertical shear at about 223 psi.
The article concerning fracture mechanics as applied to shear keys (Kaneko et al.
1993b) references a test where a specimen composed of concrete that had a shear key 6
inches deep and 3 inches wide failed when the average stress in the shear key was 1520
psi. This test was done for vertical shear loading where a large amount of transverse
prestressing was used; the value of prestress force given in the article is 6000 pounds of
compression.
Detailed information about all of the small-scale tests can be found in Table 1.
This data was recorded by researchers and published in their research reports. The type
of loading, ultimate load, and failure mode as well as the stress is included in the table.
The stress data was calculated for this study and uses simple formulas for average axial
and shear stress (P/A, V/A), or maximum bending stress (M*y/I), depending upon the
loading and the specimen geometry. This data represents the ultimate strength of shear
keys. It can be seen from looking at failure modes that samples using grout or other
cementitious materials are weakest in direct tension, and will fail at loads lower than
their material strengths would indicate. This means the bond between the keyway face
and the shear key itself is very important. If the key debonds from the box girder, there
is no steel reinforcement to keep the joint intact.
The data from the table also notes the failure mode of the samples, indicating if a
joint line failure (debonding), material failure (cracking), or a mixed failure
(combination of debonding and cracking) was the result of the test. As can be seen in

15
the table, debonding or mixed failures are the result for every case except the prestressed
sample that failed by crushing. This means that debonding is the most likely cause of
failure regardless of loading, and therefore a cementitious material is unlikely to achieve
full strength in a shear key design since the shear key will separate from the face of the
box girder prematurely.

16
Table 1: Small-scale specimen tests
Authors Materialfc'
(psi)ft (psi)
Depth (in)
Length (in)
Width (in)
Type of TestFailure (lbs)
Stress (psi)
Notes
Issa, et al. Grout 7700 658 6 5 9 Vertical Shear 10749 358 Mixed failure
" " " 8 5 20 Tension 8948 224 Mixed failure
" " " 6 6 18 (2Pt) Flexural 22331 620 Mixed failure
Set-45 5820 572 6 5 9 Vertical Shear 9756 325 Joint failure
" " " 8 5 20 Tension 8036 201 Joint failure
" " " 6 6 18 (2Pt) Flexural 9817 273 Joint failure
Kaneko, et al. Concrete 7105 632 6 3 10 Vertical Shear 20880 1160 6000 lbs prestress
Gulyas, et al. Grout 5870 390 12 3.25 6.5 Longitudinal Shear 2400 62 Bond line failure
" " " 12 3.25 6.5 Vertical Shear 5850 150 Bond line failure
" " " 8 3.25 6.5 Vertical Shear 7850 302 Bond line failure
" " " 8 3.25 6.5 Tension 1940 75 Bond line failure
Set-45 7260 557 12 3.25 6.5 Longitudinal Shear 14300 367 Mixed failue
" " " 12 3.25 6.5 Vertical Shear 16500 423 Mixed failue
" " " 8 3.25 6.5 Vertical Shear 20250 779 Mixed failue
" " " 8 3.25 6.5 Tension 5730 220 Mixed failue
Failure InformationGeometryMaterial Information
17
Large Scale Tests
Full-scale tests were discussed in some of the articles reviewed. The benefit of
these studies is that the shear keys can be tested in a manner similar to how they will be
used in the field. However, there are some problems with large-scale tests. First,
determining the existence and extent of cracking or failure in the shear key is difficult.
Second, construction of full-scale bridges is costly and so only a limited number of
studies can be carried out.
Cusens and Pama (1965) investigated the design of shear keys and the transverse
loads experienced in multi-beam bridges. The authors discuss the appropriate way to
analyze a bridge, including those with shear keys and composite slabs. They
recommend the use of modified orthotropic plate equations derived from mechanics of
materials. The authors discuss how to account for the stiffness of the bridge in the
transverse direction, even if the shear key is not full-depth or cracked.
More recently, the Ohio Department of Transportation sponsored several projects
to improve the behavior and strength of concrete multi-beam box girder bridges with
grouted shear keys. In the first article by Huckelbridge et al. (1995), the authors
instrumented an existing box girder bridge and measured displacements between
adjacent girders to determine how much shear transfer took place. They found that the
shear keys in some regions of the bridge had failed almost entirely and the beam
prestressing strands were corroded from leaking water. The authors concluded that
design changes to the bridge were necessary, as the current design had insufficient
strength.

18
In a later study sponsored by the Ohio DOT (Huckelbridge and El-Esnawi 1997),
the authors attempted to correct the design flaws of the shear key. This project involved
a thorough investigation of the design forces in the bridge using a 3D finite element
analysis of a multi-beam box girder bridge subjected to a vehicular wheel load. The
authors concluded that the stresses in the shear key were large enough to cause failure
after repeated loadings, and so changes needed to be made to the shear key design. The
transverse post-tensioning alternative was investigated and found to be uneconomical, as
strands would need to be located every 2.5 feet in order to apply an effective
compressive stress across the entire length of the bridge. An improved design with the
shear key relocated at mid-depth of the girder was investigated and it failed at a load 2.3
times higher than the original design. Therefore, the authors recommended moving the
shear key to mid-depth and using conventional grouting procedures.
The latest Ohio DOT study (Miller et al. 1998) details the results of a full-scale
bridge with the improved shear key designs as compared to the original detailing. Three
tests were performed, one with the conventional shear key design with grout, the same
design with epoxy, and a new design with a grouted key at mid-depth. Surprisingly, the
shear keys with grouted keys began to crack before any load was applied. The
specimens were dismantled, cleaned and new shear keys were installed, but the same
failures occurred. A combination of thermal cycling and off-axis beam orientation was
cracking the shear keys within a few days. In fact, it was found that throughout testing,
vehicle loading did not initiate any cracking but only propagated existing cracks. The
mid-depth shear key design had a higher resistance to both crack formation and crack

19
propagation. The epoxy joints did not crack at any point during loading. The authors
noted that the worst crack locations still transferred a significant amount of load to
adjacent girders, but longer fatigue testing may continue to degrade a shear key.
The article “Full Depth Shear-Key Performance in Adjacent Prestressed-Beam
Bridges” (Lall et al. 1997), sponsored by the New York DOT discusses the performance
of box girder bridges in New York. The New York State DOT had recently switched to
a full-depth design with a transverse tie system and was reporting on the effectiveness of
the new bridge design. From the questionnaires sent to different state officials, it was
clear that the design changes had reduced the cracking problems but had not eliminated
them. Further design recommendations were introduced, including more transverse
post-tensioning. Other recommendations included a tighter control of construction
practices, full-width bearing pads to prevent off-axis tilting, and a higher amount of steel
reinforcement in the concrete deck overlay.
One report was written specifically about Texas bridges and their reflective
cracking problems (Jones 1999). This report includes a survey of existing bridges with
problems as well as data from a bridge instrumented with strain gages in order to
determine loading effects and strains in the bridge. The paper also addresses the failure
of bridges that had a composite deck slab and were built without a shear key. A three-
dimensional beam analysis program developed by the author identified high transverse
moments in the deck slab as a potential problem in the bridges analyzed. The report
shows design forces for a wide range of Texas bridges and gives live load distribution
factors for a number of box girder geometries used in Texas bridges.

20
Other Box Girder Bridge Literature
The design and construction process for TxDOT box girder bridges is detailed in
documents from their website (TxDOT 2001). The documents include information on
the standardized bridge designs, dimensions of all box girders, construction drawings for
slabs, and details about elastomeric bearing pads. This information was consulted for
material specifications and bridge geometry of the models used in this study.
Similar to the Texas standards, the Ohio bridge design manual and box beam
standards (ODOT 2005) were consulted to obtain the specifications for a PCI type box
girder. These documents were posted on the Ohio DOT website. The Ohio standards
were chosen because these are PCI sections that have been studied in the past and many
results are available in the literature regarding the design and construction of these
bridge types. Also, Ohio uses a minimal amount of transverse post-tensioning so the
comparison with TxDOT examples is more meaningful than a bridge with extensive
post-tensioning.
The AASHTO LRFD Bridge Design Specifications (AASHTO 2004) and
Standard Specifications for Highway Bridges (AASHTO 1992) books were consulted to
find the current practices of construction and design, as well as how to correctly model
design loads for the bridges.
21
Elastomeric Bearing Pad Literature
One article about the support conditions of bridge girders on elastomeric bearing
pads was consulted (Yazdani et al. 2000). This article details the role that the stiffness
of the bearing pads play in the behavior of precast concrete bridges. The article
concludes that the bearing pad stiffness must be taken into account if the actual bending
behavior of a girder is to be accurately modeled. The recommended stiffnesses for
bearing pads are found in the AASHTO documents, but the researchers found that
bearing pads grew stiffer as they aged, and that this can significantly alter the bending
behavior. Also, the stiffnesses of the bearing pads can affect the lateral distribution of
loads between girders.

22
BRIDGES STUDIED
For this study, 39 different multi-beam box girder bridges were analyzed with
ANSYS, a general finite element computer program. The focus of the study was the
behavior of each bridge under realistic loading conditions. The lengths and widths of the
bridges were based on current bridge design standards used by TxDOT. The selected
bridges have no slope in the transverse direction, no curvature along their length, a
constant cross section, and no skew.
Of the 39 different bridges, 28 use TxDOT boxes and 11 incorporate the PCI box
girder. These bridge types were chosen because they represent the two extremes of
shear key design. The overall width of each bridge depends upon the number and type
of box girder used in construction. A typical way to represent this for a 26 ft wide
TxDOT box girder bridge would be 5Bxx + 4[4Bxx] + 5Bxx, where the bridge is made
up of a 5 ft wide box girder at one edge then (4) – 4 ft wide interior box girders, then
another 5 ft wide box girder at the other edge. The Bxx indicates a Box Girder section
with “xx” as the depth of the girder.
TxDOT Box Girders
When the Texas bridge design engineers originally considered the box girder
issue, they felt that the PCI sections used shear keys that were too small to resist the
vehicular loads, so a new design was created (TxDOT 2001). The Texas box girder uses
the soffit form developed in the 1950’s for prestressed concrete I-beams. The result, as
seen in Figure 7, is an abnormally large shear key. The benefit of using this detail was
23
that the concrete beam fabricators had the ability to make either an I-beam or a box
girder with the same form. One disadvantage is that the shear key and box girder uses
more concrete or grout than the PCI design. Thus, there is an extra material cost as well
as the additional dead load that must be supported by the bridge superstructure, possibly
resulting in the use of deeper sections or more prestressing than other designs.
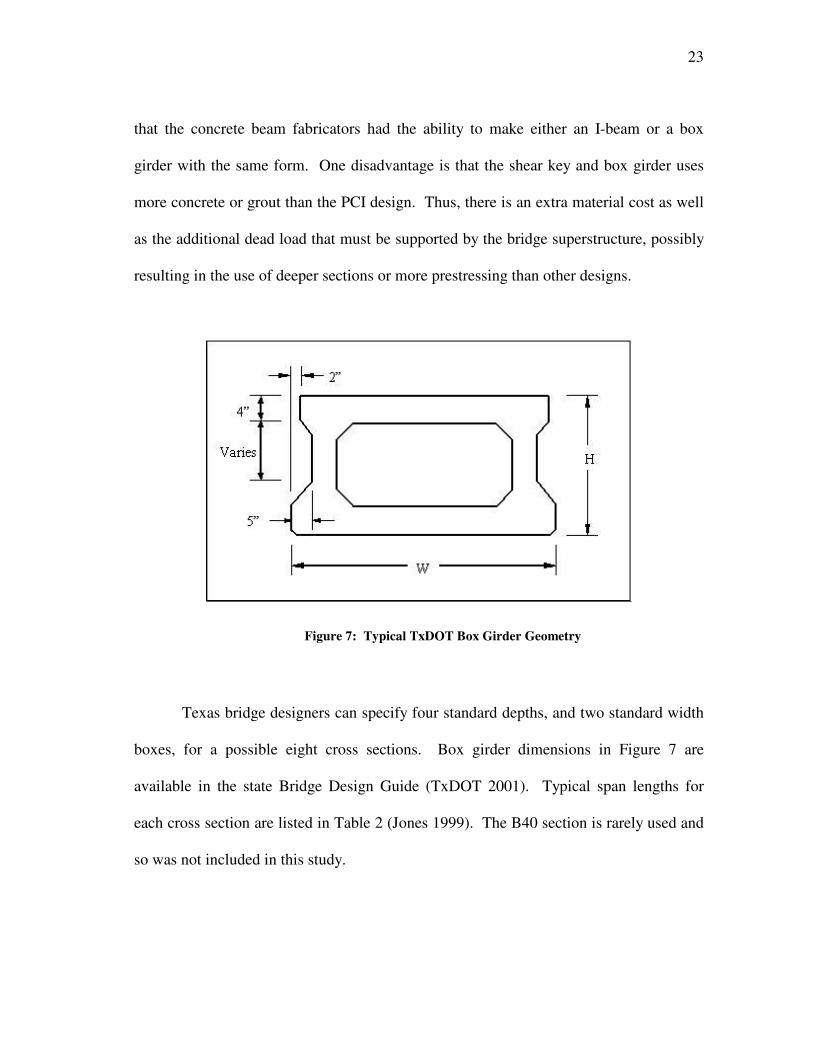
Figure 7: Typical TxDOT Box Girder Geometry
Texas bridge designers can specify four standard depths, and two standard width
boxes, for a possible eight cross sections. Box girder dimensions in Figure 7 are
available in the state Bridge Design Guide (TxDOT 2001). Typical span lengths for
each cross section are listed in Table 2 (Jones 1999). The B40 section is rarely used and
so was not included in this study.

24
Table 2: TxDOT Box Beam Typical Spans
Section Name Depth (in) Shortest Medium LongestB20 20 39 49 59B28 28 39 59 79B34 34 65 79 92B40 40 79 92 105
Span Length (ft)
The shear key is constructed after the bridge box girders have seated on the bent
caps and a backer rod is used to seal the bottom of the keyway. Grout or concrete is then
poured into the keyway, and as soon as it has reached design strength the bridge is
complete. In its latest design standard, TxDOT encourages the use of a concrete
composite topping slab in an attempt to reduce longitudinal cracking in the riding
surface. A nominal depth of 5 inches is required, but the slab can be thicker. If an
asphalt topping is chosen instead of the composite slab, the minimum thickness is 2
inches and the bridge must have transverse post-tensioning according to TxDOT
specifications.
Texas has built multi-beam box girder bridges in many different configurations,
reflecting the combinations available. Table 3 shows the TxDOT box girder bridges that
were used in this study, including the most important characteristics of each one. The
purpose of including the large number of bridges is to investigate what role each
component plays on the stresses present in the shear key.
25
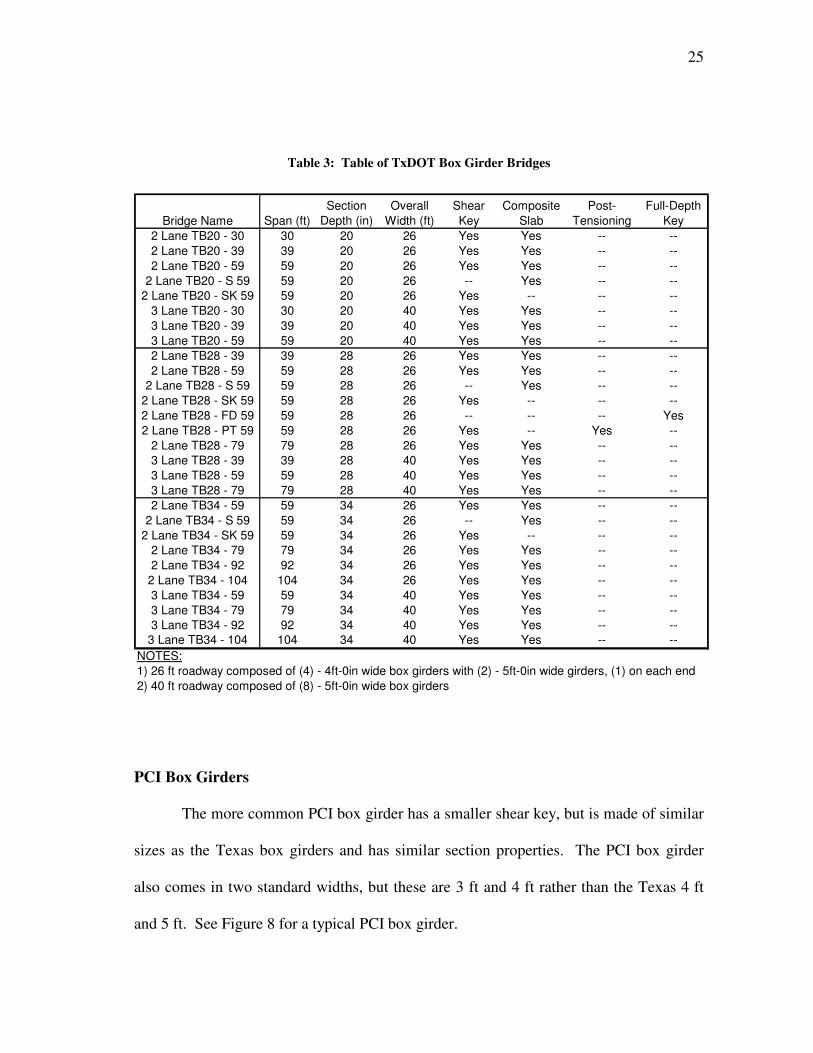
Table 3: Table of TxDOT Box Girder Bridges
Bridge Name Span (ft)Section
Depth (in)Overall
Width (ft)Shear Key
Composite Slab
Post-Tensioning
Full-Depth Key
2 Lane TB20 - 30 30 20 26 Yes Yes -- --2 Lane TB20 - 39 39 20 26 Yes Yes -- --2 Lane TB20 - 59 59 20 26 Yes Yes -- --
2 Lane TB20 - S 59 59 20 26 -- Yes -- --2 Lane TB20 - SK 59 59 20 26 Yes -- -- --
3 Lane TB20 - 30 30 20 40 Yes Yes -- --3 Lane TB20 - 39 39 20 40 Yes Yes -- --3 Lane TB20 - 59 59 20 40 Yes Yes -- --2 Lane TB28 - 39 39 28 26 Yes Yes -- --2 Lane TB28 - 59 59 28 26 Yes Yes -- --
2 Lane TB28 - S 59 59 28 26 -- Yes -- --2 Lane TB28 - SK 59 59 28 26 Yes -- -- --2 Lane TB28 - FD 59 59 28 26 -- -- -- Yes2 Lane TB28 - PT 59 59 28 26 Yes -- Yes --
2 Lane TB28 - 79 79 28 26 Yes Yes -- --3 Lane TB28 - 39 39 28 40 Yes Yes -- --3 Lane TB28 - 59 59 28 40 Yes Yes -- --3 Lane TB28 - 79 79 28 40 Yes Yes -- --2 Lane TB34 - 59 59 34 26 Yes Yes -- --
2 Lane TB34 - S 59 59 34 26 -- Yes -- --2 Lane TB34 - SK 59 59 34 26 Yes -- -- --
2 Lane TB34 - 79 79 34 26 Yes Yes -- --2 Lane TB34 - 92 92 34 26 Yes Yes -- --
2 Lane TB34 - 104 104 34 26 Yes Yes -- --3 Lane TB34 - 59 59 34 40 Yes Yes -- --3 Lane TB34 - 79 79 34 40 Yes Yes -- --3 Lane TB34 - 92 92 34 40 Yes Yes -- --
3 Lane TB34 - 104 104 34 40 Yes Yes -- --NOTES:1) 26 ft roadway composed of (4) - 4ft-0in wide box girders with (2) - 5ft-0in wide girders, (1) on each end2) 40 ft roadway composed of (8) - 5ft-0in wide box girders
PCI Box Girders
The more common PCI box girder has a smaller shear key, but is made of similar
sizes as the Texas box girders and has similar section properties. The PCI box girder
also comes in two standard widths, but these are 3 ft and 4 ft rather than the Texas 4 ft
and 5 ft. See Figure 8 for a typical PCI box girder.

26
Figure 8: PCI Box Girder Typical Geometry
The applications for the PCI sections are similar to the Texas sections, but only
the 27” and 33” sections are used. The 39” box girder section will not be included in
this study due to infrequent use, but some of the relevant information is shown here for
completeness. Table 4 shows the typical span lengths for a PCI box beam bridge
(ODOT 2005).
Table 4: PCI Box Beams and Typical Spans
Section Name Depth Short Medium LongBI 27 40 60 70BII 33 50 65 85BIII 39 60 65 100

27
Since both Texas and the PCI box girder are used for similar bridges, Table 5
was created to compare properties for three different examples. These box girders have
similar cross sectional properties, and therefore if a shear key fails in one bridge type but
not the other, then it indicates that the shear key itself is the difference.
Table 5: Comparison of PCI and TxDOT Box Beams
OH BI-48 27 692.6 65,835TX 4B28 28 678.8 68,745OH BII-48 33 752.6 110,333TX 4B34 34 797.7 115,540OH BIII-48 39 812.6 168,377TX 4B40 40 917.7 176,556
State of Use
Box Girder Type
Depth (in)
Area (in^2)
Moment of Inertia (in^4)
The PCI bridges in this study are similar to the TxDOT bridges in most respects,
but are composed of 4 ft wide sections since no 5 ft wide section is available. For the
smaller bridges used in this study, the difference between the PCI and TxDOT designs is
small, about 2 feet, so the overall response to vehicular loads should be similar.
However, for a wider 3 lane bridge the PCI design would use 10 girders rather than the
TxDOT design of 8 girders, and the results would be difficult to compare. Therefore
only the 2 lane bridge design is modeled using the PCI box girders.
Each state has a different specification for the composite deck slab. Also, there
are differences in the type and extent of transverse post-tensioning. In order to keep the
analyses consistent, the effects of transverse reinforcing are ignored unless otherwise

28
noted. Also, the bridges chosen assume a 5 inch composite top slab is used. Thus, the
only difference between the PCI and TxDOT bridge models are the box sections
themselves and the size of the shear key. Table 6 shows the PCI bridges analyzed for
this study.
Table 6: Table of PCI Box Girder Bridges
Bridge Name Span (ft)Section
Depth (in)Overall
Width (ft)Shear Key
Composite Slab
Post-Tensioning
Full-Depth Key
2 Lane PB27 - 39 39 27 24 Yes Yes -- --2 Lane PB27 - 59 59 27 24 Yes Yes -- --
2 Lane PB27 - S 59 59 27 24 -- Yes -- --2 Lane PB27 - SK 59 59 27 24 Yes -- -- --2 Lane PB27 - FD 59 59 27 24 -- -- -- Yes2 Lane PB27 - PT 59 59 27 24 Yes -- Yes --
2 Lane PB27 - 79 79 27 24 Yes Yes -- --2 Lane PB33 - 59 59 33 24 Yes Yes -- --2 Lane PB33 - 79 79 33 24 Yes Yes -- --2 Lane PB33 - 92 92 33 24 Yes Yes -- --2 Lane PB33 - 104 104 33 24 Yes Yes -- --
NOTES:1) 24 ft roadway composed of (6) - 4ft-0in wide box girders

29
SOLID MODEL DESCRIPTION
Introduction
The multibeam bridges in this study were analyzed using the commercial finite
element program ANSYS (ANSYS 2005). The finite element method is used to get a
detailed prediction of shear key stresses. These stresses are used as a predictor of shear
key cracking. An earlier study (Huckelbridge 1997) also used finite element analyses to
predict stresses in the shear key. The bridge models contained in the current work
presented here are similar, but seek to build upon the earlier work.
The finite element method uses an idealized mathematical model that
incorporates all of the important features of an actual structure. There are certain
modeling concerns that must be addressed with the finite element method. First, the
correct elements must be chosen. Second, the element sizes must be sufficiently small
so that the high stresses are not averaged out. Third, material properties must reflect
actual values. Fourth, the support conditions and loads must reflect reality. The focus of
this section is on how the idealized bridge models meet these requirements.

30
Box Girder Description
The box section, shear key, and slab were modeled using three dimensional solid
brick elements. There was a limit on the number of elements and nodes available for a
single model for the software license, so this forced the use of a relatively coarse mesh in
beams to allow enough detail to study the shear keys. A box girder cross section with its
mesh is shown in Figure 9. The elements are about 6 inches in the longitudinal
dimension, because if a smaller spacing is used then the bridge models exceeded the
software license restrictions.
Figure 9: 5B34 Box Girder with Mesh
Shear Key and Slab Description
A composite deck slab used in some of the bridges studied. The slab was 5
inches thick and based on current TxDOT construction practice. The effect of adding an

31
asphalt riding surface was not considered. All parts of the bridge use solid 3D elements,
and the nodes were rigidly connected to each other. The beams are all at the same
elevation, and no cases with skewed supports are analyzed. A cross section of a PCI box
girder shear key with mesh is shown in Figure 10. This figure also shows the nearby
elements making up the rest of the box girder and the composite slab near the top.
Figure 10: Shear Key Detail with Element Mesh
Material Properties
There were three material models used in the finite element analysis. All three
were considered linear elastic isotropic materials. The modulus of elasticity for each
material is based on the current ACI specifications (ACI 2002) for normal weight
concrete, which is given by the relationship 57,000 'cE f c= , and Poisson’s ratio was

32
taken as 0.20. Thus, only the concrete compressive strength (psi) is needed to
completely describe the material properties. The box girder concrete was assumed to
have a compressive strength of 5500 psi. The composite deck slab, if present, was given
a 4000 psi compressive strength, and the shear key was given a strength of 5000 psi.
Internal Diaphragms
As specified in the TxDOT standards, internal diaphragms are provided at the
ends of each beam. These extend 1 ft into each end and serve to anchor reinforcing bars
and limit deformations near the supports. These diaphragms are also included in the
PCI/AASHTO box girders for consistency. If post-tensioning is used, then diaphragms
are added at approximately 10 ft on center spacing in the exterior box girders, but none
are added for interior box girders.

33
IDEALIZATION OF BEAM SUPPORTS
Introduction
The bridges examined in this study rest on elastomeric bearing pads. Earlier
work (Jones 1999, and Yazdani 2000) suggests that appropriate representation of bearing
pads is important and erroneous results can occur if box girder supports are treated as
simple supports. This section explains how the beam supports were modeled and how
the structural element properties were obtained.
Elastomeric Bearing Pads
Box Beam bridges usually rest on solid supports or bent caps with an elastomeric
bearing pad to accommodate movement. The elastomeric bearing pad is typically very
stiff in the vertical direction, but allows movement in the other two dimensions. This is
done to accommodate the constant expansion and contraction of the box girders, while
providing resistance against vertical deflection. A schematic of this behavior is shown
in Figure 11.

34
Figure 11: Bearing Pad Deformation and Behavior
In Texas, the box girder design specification states that a three point bearing
setup must be used for new bridge construction. This is where a single large pad is
placed under one end of the bridge and two smaller pads are located under the opposite
edge. This is done to eliminate rocking if the pads have slightly different support
elevations. In the models, all of the larger pads are on one side of the bridge and all the
smaller double pads are on the other side of the bridge.
Linear Spring Models
In the model, these bearings are represented by linear spring elements connected
to the bridge model at one node and are restrained at the other node. Because the
bearing pads resist movement in three dimensions, each side of the bridge has two spring

35
sets with three spring elements each restrained in only one direction. A schematic
showing the cross section view of the end of a beam with two pads is shown in Figure
12. In this view, the two horizontal springs are not shown for clarity.
Figure 12: Bearing Pad Vertical Spring Supports
The springs are simple linear elements, known as LINK11 in the ANSYS
element library (ANSYS 2005). This element will resist both compression and tension,
but a real bearing pad can only resist compression. This means that a girder could
potentially “lift-off” the bearing pad. In actuality, the pads are compressed under the
dead load, so lift-off does not occur.

36
Linear Spring Stiffness
A value for stiffness, K (measured in lb/in), must be specified for each spring
element. The stiffness values were based on Mechanics of Materials equations
combined with recommendations from AASHTO (AASHTO 2004). The stiffness
values were taken to be those of a new bearing pad, but it is known that the values may
change as time and movement affect the pad, as previously discussed in the literature
review (Yazdani et al. 2000).
The stiffness of an elastomeric bearing pad is based on the overall size and
laminations used. A schematic of the bearing pad is shown in Figure 13, illustrating the
parameters used for the stiffness equations.
Figure 13: Bearing Pad Schematic
The first step in relating the spring stiffness to the bearing pad properties is to
find a parameter ‘S’, which is the shape factor. This parameter takes into account the

37
steel laminations and elastomer to give an indication of how much each material
contributes to the overall stiffness. The laminated steel sheets resist compression as well
as bulging of the elastomer, while the elastomer permits movement in the two horizontal
dimensions without much resistance. Once the shape factor is found, it is used in an
equation along with the shear modulus, G, which gives an approximation of the
compressive modulus of elasticity. The variable hri is the height of an individual
lamination within the bearing pad.
The shape factor equation given in AASHTO is:
S = (L*W)/(2*hri*(L+W))
The compressive modulus of elasticity is:
Ec = 6*G*S2
These equations are used to calculate the design compressive modulus for a
given pad. After the bearing pad specifications have been found, the spring stiffness can
be calculated using mechanics of materials. The following equations are used to find the
spring constants:
Hookes law:
σx = E * εx
τxy = G * γxy
average stress:
σx = Px/A
τxy = Vy/A

38
displacement:
δx = εx * H
δy = tan (γxy) * H
spring constants:
kx = Px/δx
ky = Py/δy
An assumption is made that ky and kz are similar and that the orientation of the
pad will not affect the horizontal stiffness greatly. To make the calculation of spring
stiffnesses easier these equations can be condensed down to a single expression for each
spring component (Yazdani, et al 2000), such that:
kx = (Ec*A)/H
ky = (G*A)/H
The shear modulus recommended by TxDOT is 100psi when taken at a standard
73 deg F. The size of the bearing pad used for a bridge is dependent upon the depth of
the section used, but does not depend on the span length or other factors (assuming some
standard conditions are met). In this study, similar pads are used for standard PCI
sections for consistency. In reality, however, the use of four bearing pads rather than
three is typical in many states. The state of New York even uses full-width bearing pads
to prevent rotation at the ends of the beams (Lall 1997). A summary of the values used
in this study is shown in Table 7 below.

39
Table 7: Bearing Pad Stiffnesses
W L T Long. Vert. W L T Long. Vert.
14 3.83E+052 3/4 1527
B20
B28
B34
6
2 3/4 3055 1.29E+06 6
3491
7
6 12 2 3/4 2618 1.01E+06 6
2 3/4
One-Pad Size (in) Two-Pad Size (in)Stiffness (lb/in) Stiffness (lb/in)
2 3/4 1309 2.83E+05
6
Beam Type
1745 4.92E+05
Elastomeric Bearing Pad Information
1.60E+06 6 8 2 3/46 16
The table shows the sizes of the pads and the corresponding computed spring
stiffnesses for the linear elements. The stiffness for the single-pad side of the beam is
more than twice as stiff as the double-pad side stiffness, even though the gross area of
the pads is the same for both sides. This is a consequence of the shape factor equation,
which is non-linear. For the bearing pads used in this study, the stiffness of the vertical
springs will be about twenty times greater than the stiffness of the two horizontal
springs.
Elastomeric bearing supports have important consequences for box girder
bridges. The horizontal springs alter the bending stiffness of the box girders, and can act
as a partial restraint for end rotations. The vertical springs allow the box girders to
deflect at the supports, spreading out the load to adjacent box girders. These effects are
necessary to incorporate into the bridge models or else the stresses will not represent
actual conditions.

40
LOADS APPLIED
In the actual bridges, dead load is carried by the box girders because the shear
keys and composite slab are cast after erection. Live loads are resisted by the entire
composite section including the shear keys and composite slabs. The live loads
considered include HS-25 truck loading (AASHTO 2004), initial shrinkage loads, and
thermal gradient loads. Previous work (Huckelbridge et al. 1995, and Miller et al. 1998)
has indicated shrinkage and temperature effects can produce larger stresses than
vehicular loads, and so they must be included in the analysis.
HS-25 Truck Loading
The vehicular loads applied to the bridge model are those recommended by the
AASHTO HS-25 design loading. This loading pattern represents a heavy tractor-trailer
and has three axles, each with two wheels acting on the top surface of the structure. The
bridge is divided into a number of lanes depending on the width of the bridge, and there
can only be a single truck in one lane at a time. In this study, multiple presence factors
have not been considered, nor have live load factors.
The AASHTO specification states that the truck loads should be placed where
they cause the largest stresses to the section of bridge under consideration. This location
was found by varying the position of the truck along the span and across the width of
each lane and checking the stress of the shear key and composite slab. The worst
locations for most bridges were either at the very end of the bridge near the supports or
at midspan. All locations had higher stresses when short wheelbases with 14’ spacing

41
were used for each axle. Schematics of sample truck locations on a two lane bridge are
shown in Figure 14 and Figure 15.
Figure 14: Truck at Midspan Location
Figure 15: Truck at End of Span Location
The wheel locations for a two lane bridge are shown in Figure 16. The locations
available for a three lane bridge are shown in Figure 17 and Figure 18. The wheel loads
were applied as vertical concentrated forces at nodes. These loads are applied on the top

42
surface of the bridge and located at the nearest nodal location corresponding to a truck
wheel.
Figure 16: Truck Axle Location on 2-Lane Bridge
Figure 17: Truck Axle Location on 3-Lane Bridge, Lane 1

43
Figure 18: Truck Axle Location for 3-Lane Bridge, Lane 2
The location of the wheel loads was based upon the AASHTO guide concerning
the application of truck loads inside a lane. The truck axles were moved from side to
side and along the length of the bridge, in order to find the location where they caused
the highest stresses. The highest tensile stresses were found when the axle was near a
shear key, but not directly on top of it. Thus, the trucks axles were placed in their proper
lane with at least one of the axles near the edge of a shear key.
As noted above, the wheel loads are applied as a single concentrated load rather
than a pressure over a given area as AASHTO recommends. This is justified by using
St. Venant’s principle of statically equivalent systems. This principle states that the
differences in stress between a load applied over a small area and a concentrated load
will only be significant within a small distance from this area. This will be dealt with in
more detail in the Solid Model Verification section.

44
Initial Shrinkage Loads
The second loading type was the stress induced by shrinkage. This load is
applied to the elements that might be expected to experience any type of shrinkage after
casting. Shrinkage is due to a number of factors including temperature changes during
curing, loss of water, and general chemistry reactions within the slab. Grouted keyways
are often created with non-shrink grout material. Non-shrink grout must conform to the
specifications set by ASTM (ASTM 1993). This requires that the grout not lose any
volume over a certain time period. This is usually achieved with the use of proprietary
grout mixes with special additives.
Concrete members can be subjected to residual stresses if shrinkage effects are
not addressed. This is particularly damaging in unreinforced concrete because there is
no steel to prevent failure or redistribute stresses. Restrained shrinkage can impose large
tensile stresses, and a schematic of this effect in a uniaxial specimen is shown in Figure
19. The effect in a shear key would be similar, but shrinkage would take place in all
three dimensions.

45
Figure 19: Schematic of Shrinkage Effects
In one of the studies referenced in the literature review (Issa et al. 2003),
shrinkage measurements were taken for a variety of materials commonly used in
keyways, including non-shrink grout. The total shrinkage measured at 28 days after
casting was close to 900 microstrain, which is much higher than allowed by ASTM for
this material. The authors pointed out that they used a greater amount of water than they
expected in order to get the material to flow at the right consistency. The specimens
followed the ASTM C 157 specifications, and were prisms of 1 in. x 1 in. x 11 ¼ in.
The specimens were demolded six hours after casting and placed in lime-saturated water
for 15 minutes.
The simple shrinkage specimens are placed in very specific laboratory
conditions, and so the overall shrinkage measured will probably be different than the
shrinkage experienced by a shear key in-situ. It is believed that shrinkage strains of 900
microstrain, as seen in the simple shrinkage specimens, are unrealistic in actual shear

46
keys because of the high volume to surface ratio present. In comparison to non-shrink
grout, typical shrinkage strains of unreinforced concrete members is between 400-700
microstrain, and so the shrinkage reported in the study referenced above seems high.
Therefore, 500 microstrain is the value of shrinkage strain used for the shear keys in this
study, as this is between the reported shrinkage values of 900 microstrain and zero
microstrain as reported in the literature review section.
A composite slab will also experience shrinkage, but the reinforcing steel will
limit the ultimate shrinkage values. A typical slab is reinforced with steel in two
directions, and the reinforcement is usually designed to limit the amount of shrinkage
that can take place. For reinforced members, a shrinkage strain of 200 microstrain will
be used for the composite slab based on previous research (Leet and Bernal 1995).
The box girders will not impose any shrinkage load on the shear keys because it
is assumed that the girders will have reached ultimate shrinkage before the bridge is
constructed. Therefore, the shrinkage load is only applied to the shear keys and top slab.
Although no method is provided in ANSYS to apply shrinkage directly on the
model, the effect can be represented with a body force temperature applied that
corresponds to the correct strain value. Using the value of the coefficient of thermal
expansion, the shrinkage strain to temperature conversion is found using the equation:
Temp * Cthermal expansion = εsh
So, using a thermal expansion coefficient of 5.5E-6 in/in/deg F and 500 microstrain
shrinkage value, a temperature of –91 deg F is applied to the shear key elements. When
a composite slab is present on the top of the bridge deck, the shrinkage strain of 200

47
microstrain is applied as temperature loads to the slab elements. The temperature
applied is –36 deg F. The values of shrinkage and their converted temperatures are
reported in Table 8 below.
Table 8: Shrinkage loads applied to bridge
Category Shrinkage (in/in) α (in/in/deg F) Temp (deg F)Prestressed Box Beam 0 5.5E-06 0Unreinforced Shear Key -0.0005 5.5E-06 -91
Reinforced Concrete Slab -0.0002 5.5E-06 -36
In reality, shrinkage will vary within the structural members. The top surface
will dry faster than the interior surfaces and each part of the shear key will experience
shrinkage at a different rate. However, it is assumed in this study that the shrinkage will
be uniform through the depth of the concrete member and that the shrinkage values will
reach the ultimate value at the same time.
Thermal Gradient Load
A thermal gradient load was applied based on that recommended by AASHTO
specifications (AASHTO 2004). There are two cases, a positive thermal profile and a
negative thermal profile. For the positive loading case, the nodes on the top surface have
the highest temperature, and the temperature profile decreases through the depth of the
bridge cross section. The temperatures are relative to ambient temperature, so a value of
zero deg Fahrenheit indicates no difference from ambient temperature. A graph showing
this temperature profile is shown in Figure 20.

48
Figure 20: Positive Temperature Profile for Thermal Gradient Load
The temperature loads change according to the depth of the node below the top
surface, representing the effect that solar radiation has on the bridge during a sunny day.
The AASHTO provisions are based on a bridge where the bottom surface is cool,
whereas the top surface is being heated by the sun. This creates a thermal expansion and
can result in significant stresses built up in the bridge.
The reverse of this loading scenario is also considered where the interior and
bottom of the bridge have warmed to the high daytime temperatures, but the top surface
is now losing heat to the cooler atmosphere at night. This is specified by AASHTO to

49
have the similar profile as the positive case, but with negative temperatures applied to
the bridge models, as shown in Figure 21.
Figure 21: Negative Temperature Profile for Thermal Gradient Load
In the bridge models, the thermal loads are applied as nodal temperatures relative
to ambient levels. The thermal gradients will produce bending in the box girders, but the
transverse effects of thermal loads are not well known. As mentioned above and in the
literature review, the reports from studies in Ohio (Hucklebridge et al. 1995, and Miller
et al. 1998) suggested that thermal loads were the prime reason that shear keys were
failing in the field.

50
ANALYSIS PROCEDURE
The program chosen for the structural analysis of the bridges was ANSYS
Version 9.0 running on the UNIX based supercomputers hosted by Texas A&M. This
program is a general finite element package, specializing in engineering simulations and
stress analysis. The license held by the Texas A&M University computing center is one
for research applications and is limited to 128,000 nodes, which imposed some
constraints on modeling efforts.
Input files were written using the native ANSYS language, APDL, to facilitate
generation of bridge models with similar geometry and loading conditions. Program
output consisted of stresses, strains, and displacements at each nodal point. The ANSYS
graphical user interface was used to produce many of the plots in this thesis.
Description of Program Output
The results of interest in this study are the normal and shear stresses in the shear
key and composite slab. It is known that cracking of the shear key occurs along a
vertical plane, so the stresses that are responsible for this are likely to act perpendicular
to this plane. So to find this information, a computer routine was written to report the
stresses though the depth of each shear key, from the top of the composite slab to the
bottom of the keyway. A profile was then built along a vertical line at the center of the
shear key as shown in Figure 22.

51
Figure 22: Girder and Shear Key Cross Section
Transverse Normal Stress Profile
0
5
10
15
20
25
30-40 -30 -20 -10 0 10 20
Stress (psi)
Dep
th b
elow
top
(in)
Figure 23: Transverse Normal Stress Profile

52
The resulting stress profile, showing transverse normal stress from the top
surface to the bottom of the keyway is shown in Figure 23. This represents the stress at
a single location on the bridge, and was taken from a bridge model with a concentrated
load. The stresses represent the transverse normal stress at different depths along the
vertical line of the cross section. The centerline of the shear key was chosen to represent
data for the entire shear key. Transverse normal stresses in the middle of the shear key
and those existing on the either side at the beam-shear key interfaces were essentially the
same in every case.
The most important quantity in the stress profile is the maximum tensile stress as
this will govern initiation of a crack. Consequently, this value was tabulated for each
stress profile given by ANSYS and compared amongst all the bridges.
Failure Criteria
Shear keys typically fail in two different ways. The first is a fracture or cracking
in the shear key. The second is debonding of the key material from the precast box
girder. Both problems can be considered as cracks, and both allow water and chlorides
to leak into the joint. This study considers both debonding and cracking as a shear key
failure, as both are detrimental to the performance of the shear key and may result in
reflective cracking.

53
Failure by Debonding
Debonding failure is a result of a poor bond between the shear key and precast
box girder. The theoretical strength of the bond is that of the base material itself, but the
bond strengths reported in the previous research usually did not achieve a bond that was
this strong. In fact, the range of stresses in tensile failures for non-shrink grout reported
in the literature varied between 75 – 224 psi. When other loading situations were
considered (other than pure tension), the bond strengths reported were between 62 – 620
psi. The criterion for failure by debonding will be defined as a tensile stress exceeding
300 psi at the bond surface, as this is typical of the values reported in the literature.
Failure by Cracking
A cracking failure occurs when the concrete material separates due to tensile
stresses. The ACI recommends that tension in unreinforced concrete is limited to a
value of 6 'f c⋅ for normal weight concrete. At the assumed compressive strength of
' 5000f c = psi used in this study, the failure stress is 424 psi.
Cracking failures have more serious consequences than debonding failures
because the crack can happen on a vertical plane allow slip, reducing load transfer
between girders. The loss of load transfer in the shear key depends on the location and
extent of fracture, but previous studies (detailed in the literature review) show that the
shear key can experience severe damage and cease performing its function in certain
cases.

54
Shear keys usually will lose their bond with the adjacent girders before an
internal fracture occurs, but some tests have indicated that fractures do occur if bond
strength is sufficiently high. When the shear keys are cast from epoxy or polymer
concrete debonding is unlikely and cracking would occur in the box girder if large
transverse stresses are present.

55
SOLID MODEL VERIFICATION
Three different tests were performed in order to verify the finite element model.
The goal of the verification tests was to confirm the element types and mesh used for the
analysis were accurate. The first test measured beam bending behavior of bridge models
and compared them to the results given by ordinary 2D beam theory. The second test
compared transverse stresses for box girder bridge models built with different element
types. The last test used a model with a very refined mesh to check convergence of the
results.
Beam Bending
In this test, a single simply supported beam is subjected to a load at midspan.
Two finite element models are created, one using BEAM189 elements and the other
using SOLID45 elements. The results are also compared with a simple beam bending
solution.
The purpose of modeling the beam in different ways is to find out if the finite
element model agrees with expected results. Since the solution for a simply supported
beam is well known, it is a good test of model behavior. Typically, 3-D solid elements
are stiffer and require a fine mesh to correctly model bending behavior, so it is important
to confirm that the model has an adequate mesh density.

56
Figure 24: Beam Bending Test Bridge
The results discussed here are for a single 59 ft long Texas 4B34 box girder that
has no composite slab, simple supports at both ends, and is made of material that has an
elastic modulus of 4 million psi and a Poisson Ratio of 0.20. A view of the beam
geometry used for this test is shown in Figure 24. Two load cases were considered, a
distributed load and a concentrated load. The distributed load is from the concrete self-
weight of 150 lb/ft3 and the concentrated load is a 20,000 lbs load at midspan
(distributed evenly across the width).

57
Table 9: Beam Verification Results
Load Case Results Beam Eqns Beam189 Solid45Dead Load Top Stress (psi) -678 -673 -672
Bottom Stress (psi) 603 603 603Deflection (in) 0.492 0.498 0.502
Point Load Top Stress (psi) -551 -543 -550Bottom Stress (psi) 490 487 490
Deflection (in) 0.32 0.326 0.327
1 x 4B34 Beam Simply Supported
The results shown in Table 9 indicate that stresses and deflections were virtually
the same for all cases. Overall, the results indicate that the beam is correctly modeled,
because the stresses agree very closely with analytical solutions for both distributed
loads and concentrated loads. The model built with solid 3D (SOLID45) elements used
the same mesh density as the other bridges in this study. When the mesh was varied for
the solid element models the results were similar to those shown in the table above.
Transverse Bending
A total of 6 finite element models were built to confirm transverse behavior. The
purpose of using several different element types was to confirm that the elements chosen
for the study gave reliable and accurate results. All the models were simply supported,
with two Texas 4B34 box girders connected with a 5 inch composite slab, similar to that
discussed for the beam bending section. The loading chosen for this bridge is a 20,000

58
lbs point load at the midspan location directly above the centroid of the left beam. A
cross section of the test bridge is shown in Figure 25.
Figure 25: Transverse Bending Test Bridge
The first model used exclusively shell elements (ANSYS SHELL181) for the
slab, girder webs, and girder top and bottom flanges. A screenshot of this bridge is
shown in Figure 26 with offset nodal locations to best match the girder geometry. A
review of the figure below shows the limitations of this element type for modeling
complex geometries. The large gaps and overlapping elements resulted from trying to
match the geometry of the box girders with the modeling requirements of the shell
elements. The shell elements were not appropriate element types for use in this study,
but they were included in this verification test for the sake of comparison.

59
Figure 26: Transverse Bending Shell Model
Solid element types were used to create the remainder of the test models. Solid
elements can be used to build finite element models of any geometry, but they use a
larger amount of computing resources. The other problems with solid elements are that
they are too stiff in bending situations and the shape of each element needs to be similar
to a cube for best results (ANSYS 2005). The second bridge model used solid (ANSYS
SOLID45) elements for the bridge throughout the model. The third model used Solid45
elements but with a mesh twice as dense in every dimension as the previous bridge
model. Figure 27 shows a cross section of a bridge model with solid elements.
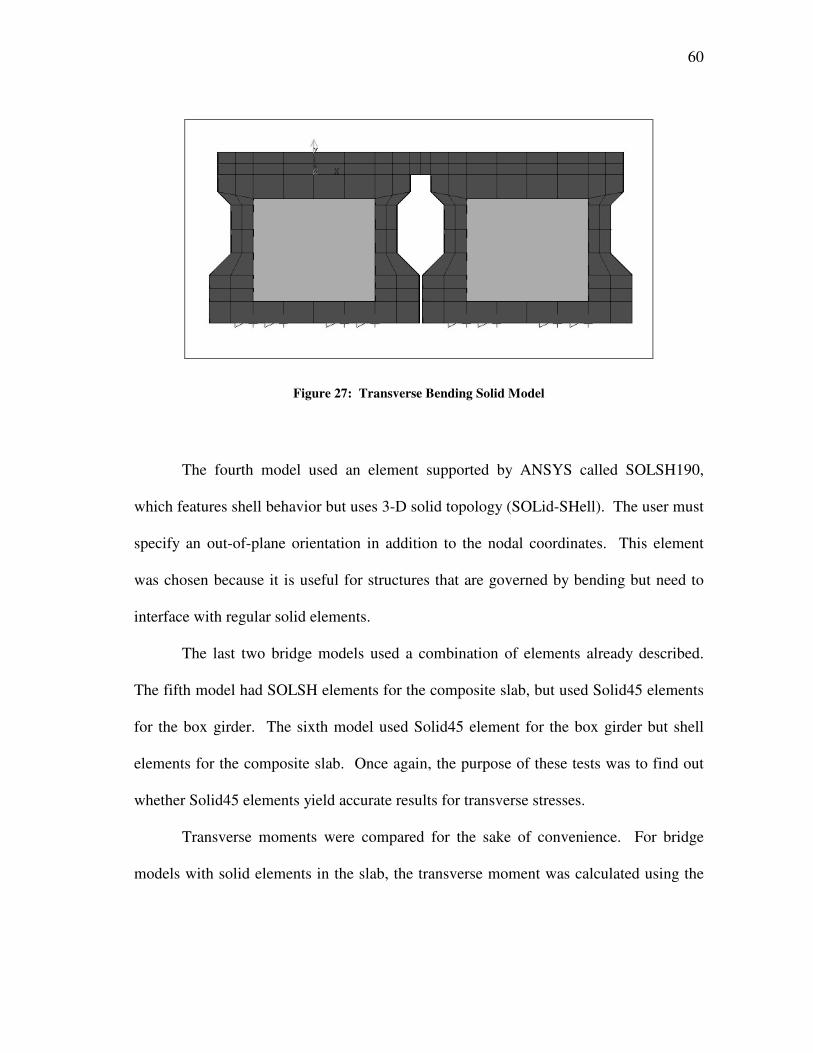
60
Figure 27: Transverse Bending Solid Model
The fourth model used an element supported by ANSYS called SOLSH190,
which features shell behavior but uses 3-D solid topology (SOLid-SHell). The user must
specify an out-of-plane orientation in addition to the nodal coordinates. This element
was chosen because it is useful for structures that are governed by bending but need to
interface with regular solid elements.
The last two bridge models used a combination of elements already described.
The fifth model had SOLSH elements for the composite slab, but used Solid45 elements
for the box girder. The sixth model used Solid45 element for the box girder but shell
elements for the composite slab. Once again, the purpose of these tests was to find out
whether Solid45 elements yield accurate results for transverse stresses.
Transverse moments were compared for the sake of convenience. For bridge
models with solid elements in the slab, the transverse moment was calculated using the

61
stress values given at each nodal location and a moment of inertia based on slab
thickness.
Figure 28 shows the transverse moments in the shear key from one end of the
bridge model to the other. This is the transverse moment resulting from the application
of the 20,000 lb point load applied above the centroid of one of the beams as discussed
earlier. This data does not show the results for the bridge model built entirely from shell
elements, which will be discussed later.
Transverse Moment in Slab
-140
-120
-100
-80
-60
-40
-20
0
20
40
60
0 200 400 600
Location (in)
Mom
ent (
lb-in
/in)
Solid Element Girder / Shell Element Slab
Solid Element with Coarse Mesh
Solid Element with Fine Mesh
Solid Element Girder / SOLSH Element Slab
SOLSH Elements
Figure 28: Results for Transverse Bending Bridge Models

62
The graph indicates that all bridge models behave similarly, regardless of
element type or mesh fineness. This means that the bridge can be modeled using
Solid45 elements with the proposed mesh without losing accuracy in the results.
One item to note is the moment near the ends for the Solid Model with Coarse
Mesh versus all the other bridges. This was the only model without end diaphragms in
the box girder. When end diaphragms were present, the transverse moment was lower
because the girder did not experience as much deformation near the support locations
and so less rotation was imposed on the slab. Thus, the presence of internal diaphragms
was an important factor in the behavior of the bridges and was included in every model
as discussed in the section regarding Solid Model Description.
Figure 29 shows the differences in transverse moment between the bridge model
built only with shell elements and the model built only with solid elements. In this case,
the shell model showed much higher moments than the solid model. As noted in the
discussion on the shell element model, that element type was not appropriate for use in a
box girder bridge with shear keys. The results shown in the graph indicate that the box
girder bridge models with shell elements are more flexible than those with solid
elements, even the SOLSH elements that use shell behavior. Therefore, a box girder
bridge should be modeled with solid elements for accurate results.

63
Transverse Moment in Slab
-400
-350
-300
-250
-200
-150
-100
-50
0
50
100
0 100 200 300 400 500 600 700
Location (in)
Mom
ent (
lb-in
/in)
Solid Element with Coarse Mesh
Shell Element
Figure 29: Shell Model vs. Solid Model Results
Submodel Analysis
The last verification test used a process called submodelling. In this technique, a
small portion of the model is recreated with a higher mesh density in the areas of
importance. A submodel can give more detailed results and is useful when a limit on the
number of nodes prevents a small mesh size from being used. In this test, a submodel
was built to verify that the mesh size chosen would give accurate answers.

64
The theory of submodeling is that a coarse mesh will give accurate results with
regard to displacements, but the stresses (which are based on derivatives of
displacement) may be inaccurate. If the stress varies greatly within a small region of the
model, the solid elements will only be able to capture an approximation of that stress.
Therefore, a fine mesh is desired in regions where stress varies greatly. However, a fine
mesh was not an option due to limited computer resources. Submodeling allows a model
to have a coarse mesh in a global model and a very fine mesh in regions where the stress
results are important.
The process of submodeling superimposes the displacements from a large
“global” model upon a smaller “submodel.” In ANSYS, the user can specify the “cut
boundaries,” or the locations where the submodel will be sliced out of the larger model.
The smaller submodel is then recreated in the same three dimensional space as the
original model and the global model displacement field is applied to the submodel
boundary. Because the submodel incorporates the effects of the global structure but has
a significantly higher number of elements in the shear key, the profile of stresses through
the depth of the joint should be more accurate.
A submodel with elastic springs used to simulate the effects of the global
structure was used in the article “Evaluation of Improved Shear Key Designs for Multi-
Beam Box Girder Bridges” (Hucklebridge and El-Esnawi 1997). The type of submodel
used for the present study is somewhat different than that approach. The results for each
individual loading situation are applied as constraints on a smaller model. The submodel

65
with imposed displacements on the boundaries is the most accurate type of submodel
and is the best way to model the effects of temperature and shrinkage.
The bridge under consideration is a PCI box girder bridge with (6) – 4 ft wide,
27” deep girders, and a span of 59 feet. A standard PCI shear key and a 5” composite
top slab is used, and no internal diaphragms or transverse post-tensioning is present. A
10 ft slice of the larger bridge near midspan is taken from one side of the bridge to
investigate. A screenshot from the global model is shown in Figure 30. This model
shows the general configuration of the bridge, and the region chosen for the submodel is
highlighted.
Figure 30: Global Model and Highlighted Submodel Region

66
The mesh size used for the global model is shown in a closer view of the model
in Figure 31. The element size shown is similar to that used for all the other bridge
models in this study. The mesh size is generally about 4” - 6” per side, but some
elements have sides up to 10” when they are away from the shear key region.
Figure 31: Global Model Mesh
The submodel is shown in Figure 32, where the elements are about 2 inches on
each side. A close-up of the shear key region is shown in Figure 33. The results from
the global model analysis are superimposed on the boundary of the submodel and the
loads are applied to the submodel in the same manner as on the global model.

67
Figure 32: Submodel Mesh
Figure 33: Closer View of Submodel Shear Key
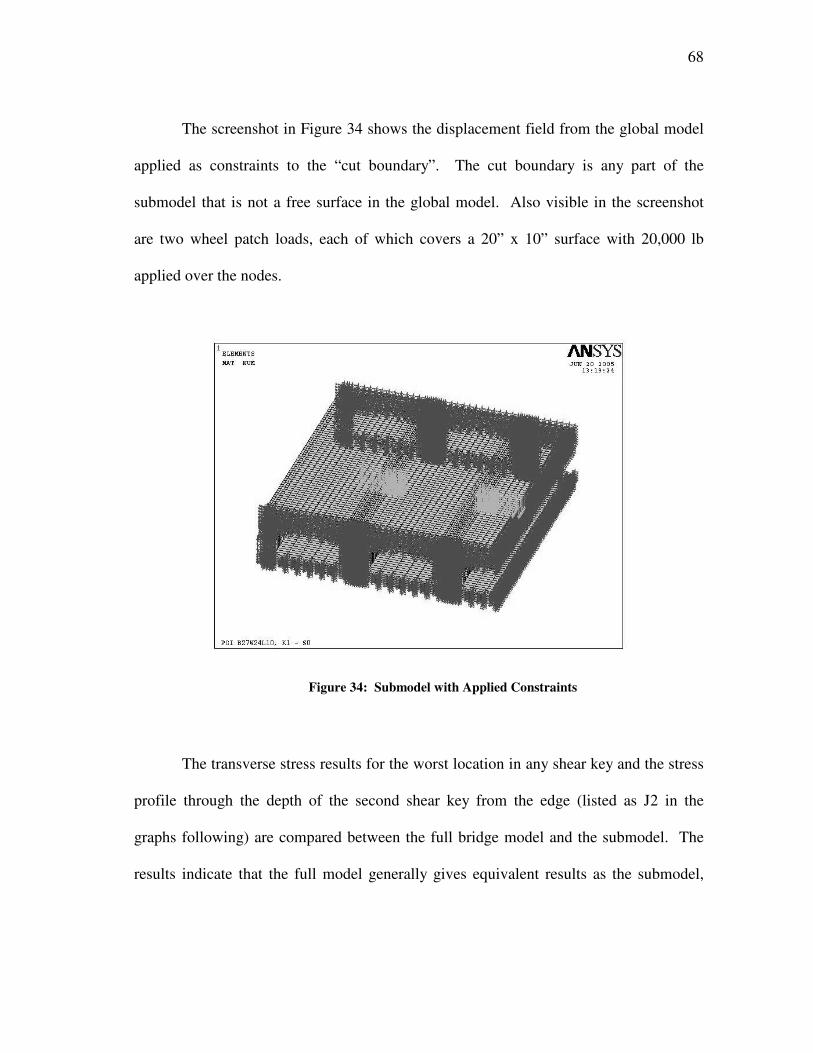
68
The screenshot in Figure 34 shows the displacement field from the global model
applied as constraints to the “cut boundary”. The cut boundary is any part of the
submodel that is not a free surface in the global model. Also visible in the screenshot
are two wheel patch loads, each of which covers a 20” x 10” surface with 20,000 lb
applied over the nodes.
Figure 34: Submodel with Applied Constraints
The transverse stress results for the worst location in any shear key and the stress
profile through the depth of the second shear key from the edge (listed as J2 in the
graphs following) are compared between the full bridge model and the submodel. The
results indicate that the full model generally gives equivalent results as the submodel,

69
but some loading situations show discrepancies. The results for each loading are
discussed below in more detail.
Shrinkage in the Slab
The maximum transverse normal stress in the shear key or composite slab due to
slab shrinkage is shown in Figure 35. In this case, the full model shows a fairly
consistent value around 750 psi near midspan. The submodel shows a value near 900
psi. The results indicate that the full bridge model underestimates maximum transverse
normal stresses by about 20%.
Max Tensile Transverse Normal Stress in Bridge Joints
0
200
400
600
800
1000
1200
24 26 28 30 32 34
Span (ft)
Tran
sver
se N
orm
al
Str
ess
(psi
)
SUB
FULL
Figure 35: Maximum Transverse Stress in Submodel due to Slab Shrinkage
There are also peaks in stress near the edges of the submodel. These are a result
of applied constraints which are interpolated from the global model and cause the stress

70
to spike in this area as a result. These spikes in stress near the submodel cut boundaries
are typical of the data presented in this section. Since they are fictitious and only a result
of the modeling technique, they will be disregarded.
The stresses through the depth of the shear key and composite slab are shown in
Figure 36. The results here indicate that the stresses follow the same pattern, but that the
submodel shows a wider variation in stresses in the upper portion of the shear key and
lower portion of the composite slab. The full bridge model does not include this
interaction between the slab and shear key because the elements are larger and the
effects get averaged out.
Transverse Normal Stress Profile at Midspan Location
0
2
4
6
8
10
12
14
16
18
20-600 -400 -200 0 200 400 600 800 1000
Stress (psi)
Dep
th (i
n)
J2 SUB
J2 FULL
Figure 36: Stress Profile for Slab Shrinkage

71
Overall, the stress profile and maximum stresses compare favorably between
each model when slab shrinkage is considered. The results provided by the full model
should provide enough accuracy to use in the analysis of the shear key.
Shrinkage in the Shear Key
The maximum transverse normal stress in the shear key or composite slab due to
shrinkage in the shear key is shown in Figure 37. The full bridge model shows a
maximum normal stress near 700 psi whereas the submodel gives a result of about 450
psi. The full bridge model appears to overestimate maximum tensile stresses by about
50%.
Max Tensile Transverse Normal Stress in Bridge Joints
0
100
200
300
400
500
600
700
800
24 26 28 30 32 34
Span (ft)
Tran
sver
se N
orm
al
Str
ess
(psi
)
SUB
FULL
Figure 37: Maximum Transverse Stress in Submodel due to Shear Key Shrinkage

72
The stresses through the depth of the section are shown in Figure 38. In this
case, the submodel shows that the stresses vary near the top of the section between
compression and tension, and the area of the shear key near the top is under a significant
amount of tensile stress. The full bridge model does not show tension in this region, so
there is some concern that the full model does not include this effect. The stresses near
the bottom of the shear key have the same pattern, but the submodel shows more
compression and a less tension than the full bridge model.
Transverse Normal Stress Profile at Midspan Location
0
2
4
6
8
10
12
14
16
18
20-4000 -3000 -2000 -1000 0 1000
Stress (psi)
Dep
th (i
n)
J2 SUB
J2 FULL
Figure 38: Stress Profile for Shear Key Shrinkage
The differences between the two models under shear key shrinkage loads are
quite large. The full bridge model does a poor job of representing the worst tensile loads
and shows the reverse stress conditions from the submodel at the top of the section. The
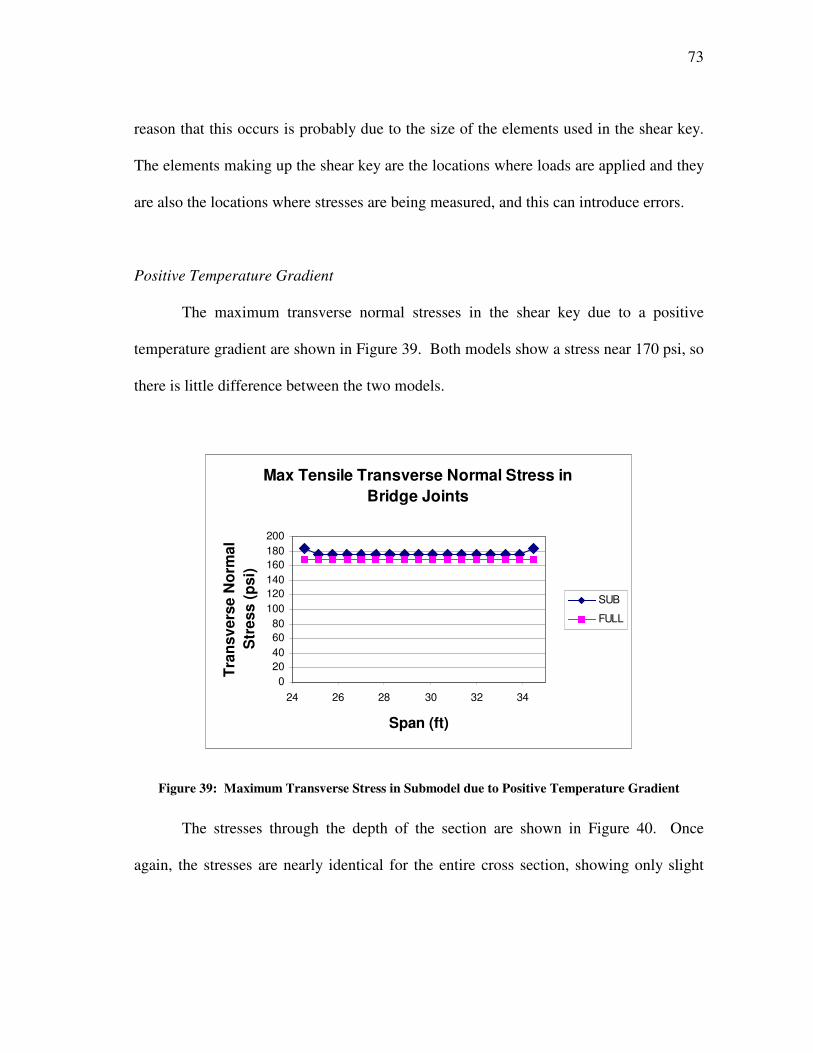
73
reason that this occurs is probably due to the size of the elements used in the shear key.
The elements making up the shear key are the locations where loads are applied and they
are also the locations where stresses are being measured, and this can introduce errors.
Positive Temperature Gradient
The maximum transverse normal stresses in the shear key due to a positive
temperature gradient are shown in Figure 39. Both models show a stress near 170 psi, so
there is little difference between the two models.
Max Tensile Transverse Normal Stress in Bridge Joints
020406080
100120140160180200
24 26 28 30 32 34
Span (ft)
Tran
sver
se N
orm
al
Str
ess
(psi
)
SUB
FULL
Figure 39: Maximum Transverse Stress in Submodel due to Positive Temperature Gradient
The stresses through the depth of the section are shown in Figure 40. Once
again, the stresses are nearly identical for the entire cross section, showing only slight

74
variations. The top and bottom of the joint section are both in compression, while the
stresses near the mid-depth region are all in tension.
Transverse Normal Stress Profile at Midspan Location
0
2
4
6
8
10
12
14
16
18
20-600 -500 -400 -300 -200 -100 0 100 200 300
Stress (psi)
Dep
th (i
n)
J2 SUB
J2 FULL
Figure 40: Stress Profile for Positive Temperature Gradient
From the data shown comparing the two models, it can be seen that the
differences are small for this loading case. The results of the full bridge model agree
closely with the submodel, so there is no adjustment needed.
Negative Solar Radiation Temperature Differential
The maximum transverse normal stresses in the shear key due to a positive
temperature gradient are shown in Figure 41. This loading case is similar to the positive
thermal gradient, but the temperature loads are reversed in sign and have a lower value.

75
The stresses for the submodel are near 200 psi, while the full bridge model stresses are
near 160 psi, which means that the full model underestimates the stresses by about 20%.
Max Tensile Transverse Normal Stress in Bridge Joints
0
50
100
150
200
250
24 26 28 30 32 34
Span (ft)
Tran
sver
se N
orm
al
Str
ess
(psi
)
SUB
FULL
Figure 41: Maximum Transverse Stress in Submodel due to Negative Temperature Gradient
The stresses through the depth of the section are shown in Figure 42. The
stresses shown for each model agree very closely except for the area near the bottom of
the shear key. The stress profile here is opposite in sign from the one shown in the
positive thermal gradient loading case, and so in this case the tension occurs at the very
top and bottom of the section.

76
Transverse Normal Stress Profile at Midspan Location
0
2
4
6
8
10
12
14
16
18
20-100 -50 0 50 100 150 200
Stress (psi)
Dep
th (i
n)
J2 SUB
J2 FULL
Figure 42: Stress Profile for Negative Temperature Gradient
In this loading case, the differences are noticeable, but not very large. The
results from the full bridge model are accurate enough to use in the analysis with only a
small amount of adjustment necessary.
HS-25 Truck Loading
The maximum transverse normal stresses due to HS-25 truck loading are shown
in Figure 43. For this case, the results of full bridge model are compared with the results
from two loading patterns of the submodel. The first loading case considered is similar
to the full bridge model, where the HS-25 wheel loads are applied at a single node. The
second loading case is where the HS-25 wheel loads are applied over an area that is the
correct AASHTO specification. This “patch” loading means that the load pressure is

77
100 psi and distributed over an area according to the formula listed in the AASHTO
documents (AASHTO 2004).
The maximum transverse stress results show that there is little difference
between the submodel with a point load and the submodel with a patch load. However,
the full bridge model underestimates the maximum stresses by about 20%.
Max Tensile Transverse Normal Stress in Bridge Joints
0
50
100
150
200
250
300
24 29 34
Span (ft)
Tran
sver
se N
orm
al S
tres
s (p
si) SUB - Patch
SUB - Point
FULL
Figure 43: Maximum Transverse Stress in Submodel due to Truck Loading
The stresses through the depth of the section are shown in Figure 44. The graph
shows the results for both submodel loading conditions and the full bridge model with
point loads. At this location, both the submodel with patch loads and with point loads

78
agree closely with each other, but the full bridge model is a bit off from the submodel
results. All models show a region of compression near the top of the section and a large
tensile stress at the extreme bottom of the shear key. Using a point load instead of a
patch load was found to have little consequence on the overall results, as both styles of
loading showed similar patterns of stresses through the depth of the section.
Transverse Normal Stress Profile at Midspan Location
0
2
4
6
8
10
12
14
16
18
20-100 -50 0 50 100 150 200 250
Stress (psi)
Dep
th (i
n)
J2 SUB POINTJ2 SUB PATCH
J2 FULL
Figure 44: Stress Profile for Truck Loading
Summary of Submodel Verification Test
In general, the results from the submodel verification test show that the
maximum transverse tensile and stress profile match well, but some adjustments need to
be made in order to match the results from the submodel. First, the load case involving
shear key shrinkage overestimates maximum transverse stresses by about 50%. Next,
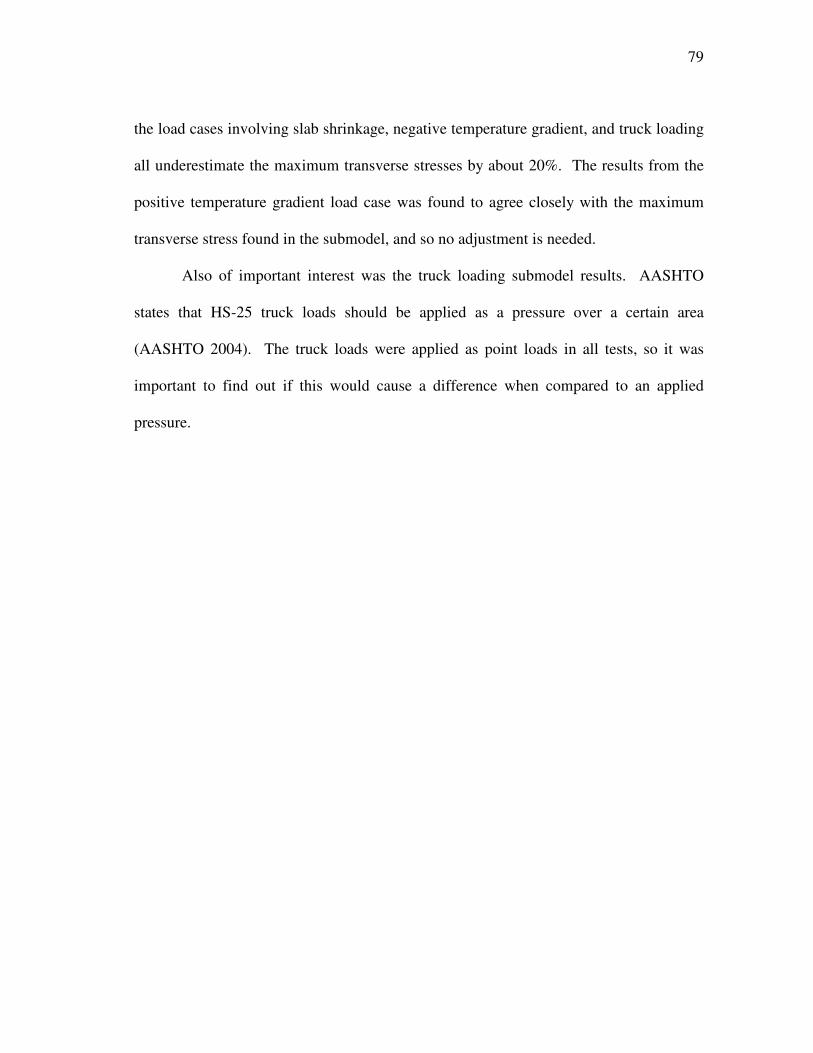
79
the load cases involving slab shrinkage, negative temperature gradient, and truck loading
all underestimate the maximum transverse stresses by about 20%. The results from the
positive temperature gradient load case was found to agree closely with the maximum
transverse stress found in the submodel, and so no adjustment is needed.
Also of important interest was the truck loading submodel results. AASHTO
states that HS-25 truck loads should be applied as a pressure over a certain area
(AASHTO 2004). The truck loads were applied as point loads in all tests, so it was
important to find out if this would cause a difference when compared to an applied
pressure.

80
RESULTS
Introduction
The results shown in this section compare the stresses from the bridge models to
the failure criteria. The results are given independently for each load case. These results
are shown in graphs that plot the highest tensile stress in a bridge joint as a function of
span length. Additional graphs show the variation of stresses through the depth of each
bridge joint at midspan for typical TxDOT and PCI bridges. The notation used to
identify the various bridges analyzed in this study is shown in Table 10.
Table 10: Bridge Suffix Identification Code
PrefixPT
SectionBxx
SuffixNone- S
- SK- PT- FD NO slab present, full depth shear key used
Bridge Identification Code
Assumes 5" slab and shear key presentAssumes 5" slab, NO shear key presentNO slab present, shear key is present
NO slab present, post-tensioning and shear key used
ExplanationPCI style box girder and shear key
Texas style box girder and shear key
Box girder section "xx", depth of girder section only
As an example, a TB20 – S (59) indicates a Texas B20 section with no shear key
and a 5 inch composite slab on a bridge span of 59 feet. A PB33 (92) indicates a PCI
B33 (IIB) section with both a shear key and a 5 inch composite slab on a 92 ft. span.
The span length is often used as one of the axes on each graph, so that information may

81
be unlisted if it would be redundant. Also, the results are separated by the number of
design lanes, so each chart will be noted as 2-lane bridges or 3-lane bridges.
It should be noted the results show only the worst case transverse tensile stresses
for a bridge joint. The transverse tensile stress is the most important stress component
because it is the best predictor of failure in a shear key, and likely to be the cause of
reflective cracking on the roadway surface.
In addition to the maximum transverse tensile stresses, graphs showing
transverse stress through the depth of the joint section are given. The “joint section” is
the part of the bridge that transfers forces from one box girder to the adjacent girders.
For a bridge that has shear keys and a composite slab, the joint would be composed of
both the shear key and the part of the slab directly above the shear key. The results for
each joint are graphed versus section depth and begin at the top of the shear key or
composite slab and extend to the bottom of the shear key, similar to that described in the
previous section on the submodel. A sample joint numbering pattern is shown in Figure
45.
Figure 45: Joint Numbering Scheme

82
Only a selection of bridges for each load case will include stresses through the
depth of the joint section because the other bridges will have a similar pattern for the
same load case. Listing the full results for every bridge under every load case would be
redundant and consume too much space for a worthwhile discussion.
Each load case also discusses the scaling factor required for the global model
results to match the submodel results. This factor represents the difference between the
coarse mesh “global model” and the fine mesh “submodel”. In some cases, this
difference accounted for a factor of 50% difference in the maximum tensile stress, but
typically the difference was about 20%. This factor is mentioned in the description of
each load case, but the factor has not been applied to any results. The values shown in
the graphs are the actual stresses obtained from the analysis, and contain no scaling
factors.
Results for Shrinkage Loading
Slab Shrinkage
As discussed in the section on loading values, the slab has a shrinkage strain
equivalent to 200 microstrain. Because the analysis is linear, the stresses can be scaled
up or down to obtain the results for an analysis performed with a shrinkage strain
different from the 200 microstrain used.
The results shown in Figure 46 and Figure 47 show that the tensile stresses due to
slab shrinkage in all bridges are higher than both the rupture strength and debonding

83
failure criteria. The highest tensile stresses occur in bridges without a shear key. Span
length appears to be a factor for the PCI style bridges, but the Texas bridges do not show
a dependence on span length.
The submodel analysis indicated that the global models would underestimate
tensile stresses by 20%, so the stresses should be scaled up to reflect these conditions.
Maximum Tensile Transverse Stress Shrinkage in Slab Loading, 2-lane bridge
0
500
1000
1500
0 25 50 75 100
Span Length (ft)
Str
ess
(psi
)
TB20 TB20 - S TB28 TB28 - STB34 TB34 - S PB27 PB27 - SPB33 Bond Strength Rupture Modulus
Figure 46: Maximum Transverse Stress due to Slab Shrinkage in 2-Lane Bridges

84
Maximum Tensile Transverse Stress Shrinkage in Slab Loading, 3-lane bridge
0
200
400
600
800
1000
1200
0 25 50 75 100
Span Length (ft)
Str
ess
(psi
)
TB20 TB28 TB34 Bond Strength Rupture Modulus
Figure 47: Maximum Transverse Stress due to Slab Shrinkage in 3-Lane Bridges
The transverse stresses at midspan in Figure 48 and Figure 49 indicate that the
stresses caused by slab shrinkage are similar for all joint locations. The stress profiles
through the depth of the section also show that tension stresses are highest at the top and
bottom surfaces, and some compression exists in the middle region. Cracking at the top
surface is possible due to this load case, and cracking could occur at every joint location.

85
Transverse Normal Stress Profile at Midspan Location
0
5
10
15
20
25
30-400 -200 0 200 400
Stress (psi)
Dep
th b
elow
top
(in) .
J1
J2
J3
J4
J5
Figure 48: Stresses in Joints for TxDOT Bridge due to Slab Shrinkage (2-Lane TB28 - 59)
Transverse Normal Stress Profile at Midspan Location0
5
10
15
20-500 0 500 1000
Stress (psi)
Dep
th b
elow
top
(in)
J1
J2
J3
J4
J5
Figure 49: Stresses in Joints for PCI Bridge due to Slab Shrinkage (2-Lane PB27 - 59)

86
Shear Key Shrinkage
The shear key shrinkage load case is similar to that for shrinkage in the slab. The
shrinkage loads are confined to the shear keys, and all other elements do not have any
loads applied. The value used for shrinkage is 400 microstrain. The stress levels for
shear key shrinkage should be reduced by approximately 50% to reflect the differences
between the global model and the submodel. The bridge models that do not have a shear
key have been removed from this data set as no loads can be applied to them.
The results for shrinkage in the shear key are shown in Figure 50 and Figure 51.
For this load case, most TxDOT bridges and some of the PCI bridges without a
composite slab are above the failure criteria, after considering the scaling factor needed
to match the submodel results. In this load case, the span length is not a factor
contributing to maximum tensile stress. However, the size of the shear key is a factor.
The use of full depth shear keys and post-tensioning improve the results for the bridges
with those features. The presence of a composite slab does not have a large effect on the
stress levels under this load, because the loads and stress effects are concentrated in the
shear key area.

87
Maximum Tensile Transverse Stress Shrinkage in Shear Key Loading, 2-lane bridge
0
200
400
600
800
1000
1200
0 20 40 60 80 100
Span Length (ft)
Str
ess
(psi
)
TB20 TB20 - SK TB28 TB28 - SKTB28 - PT TB28 - FD TB34 TB34 - SKPB27 PB27 - SK PB27 - PT PB27 - FDPB33 Bond Strength Rupture Modulus
Figure 50: Maximum Transverse Stress due to Shear Key Shrinkage in 2-Lane Bridges

88
Maximum Tensile Transverse Stress Shrinkage in Shear Key Loading, 3-lane bridge
0
200
400
600
800
1000
1200
0 20 40 60 80 100
Span Length (ft)
Str
ess
(psi
)
TB20 TB28 TB34 Bond Strength Rupture Modulus
Figure 51: Maximum Transverse Stress due to Shear Key Shrinkage in 3-Lane Bridges
The stress profiles for a typical TxDOT and PCI bridge are shown in Figure 52
and Figure 53. The TxDOT bridges have the highest tensile stress just below mid-depth.
The PCI bridges have the highest tensile stresses at the top of the slab and near the
bottom of the keyway. When stresses are reduced to match the submodel results, the
values are still above the failure criteria.

89
Transverse Normal Stress Profile at Midspan Location
0
5
10
15
20
25
30-4000 -3000 -2000 -1000 0 1000 2000
Stress (psi)
Dep
th b
elow
top
(in)
J1
J2
J3
J4
J5
Figure 52: Stresses in Joint for TxDOT Bridge Under Shear Key Shrinkage (2-Lane TB28 - 59)
Transverse Normal Stress Profile at Midspan Location
0
5
10
15
20-3000 -2000 -1000 0 1000
Stress (psi)
Dep
th b
elow
top
(in)
J1
J2
J3
J4
J5
Figure 53: Stresses in Joint for PCI Bridge under Shear Key Shrinkage (2-Lane PB27 - 59)

90
Results for Temperature Loading
(+) Positive Thermal Gradient
The thermal gradient load considers the effect of solar heating on the top surface
of the bridge, while the bottom regions of the bridge remain at lower temperatures. The
transverse stresses due to thermal expansion are applied using the recommended
temperature profiles from AASHTO. The submodel analysis showed very little
difference with respect to the global model maximum tensile stresses, so no adjustment
factor is needed for this load case.
The results from Figure 54 and Figure 55 show that the Texas box girders much
lower tensile stresses versus the PCI sections with regard to thermal differential loads.
None of the standard Texas bridges has stresses above the failure criteria, but similar
bridges using a PCI shear key will have much higher stresses. Bridges without a
composite slab or without a shear key also have much higher transverse stresses in the
joint. Post-tensioning (bridges listed with – PT) reduces the tensile stresse, but a full-
depth shear key reduces the tensiles stress even further in PCI bridges.

91
Maximum Tensile Transverse Stress (+) Thermal Gradient Loading, 2-lane bridge
0
200
400
600
800
1000
1200
0 20 40 60 80 100
Span Length (ft)
Str
ess
(psi
)
TB20 TB20 - S TB20 - SK TB28TB28 - S TB28 - SK TB28 - PT TB28 - FDTB34 TB34 - S TB34 - SK PB27PB27 - S PB27 - SK PB27 - PT PB27 - FDPB33 Bond Strength Rupture Modulus
Figure 54: Maximum Transverse Stress due to Positive Thermal Gradient in 2-Lane Bridges

92
Maximum Tensile Transverse Stress (+) Thermal Gradient Loading, 3-lane bridge
0
200
400
600
800
1000
1200
0 20 40 60 80 100Span Length (ft)
Str
ess
(psi
)
TB20 TB28 TB34 Bond Strength Rupture Modulus
Figure 55: Maximum Transverse Stress due to Positive Thermal Gradient in 3-Lane Bridges
The stress profiles of typical TxDOT and PCI bridge joints are shown in Figure
56 and Figure 57. All joint locations show similar stress levels, and the highest tensile
stresses occur about mid-depth of the joint. The results shown in these figures are for
stress at mid-span, but the higher stresses shown in Figure 54 are near the end of the
span.

93
Transverse Normal Stress Profile at Midspan Location
0
5
10
15
20
25
30-800 -600 -400 -200 0 200 400
Stress (psi)
Dep
th b
elow
top
(in)
J1
J2
J3
J4
J5
Figure 56: Stresses in Joint for TxDOT Bridge due to Positive Temperature Gradient
(2-Lane TB28 - 59)
Transverse Normal Stress Profile at Midspan Location
0
5
10
15
20-600 -400 -200 0 200 400
Stress (psi)
Dep
th b
elow
top
(in)
J1
J2
J3
J4
J5
Figure 57: Stresses in Joint for PCI Bridge due to Positive Temperature Gradient
(2-Lane PB27 - 59)

94
(-) Negative Thermal Gradient
The counterpart to the solar induced thermal effects is the loss of thermal energy
to the night sky. The temperature differential is less, but the top surface of the bridge
can experience large tensile stresses. The temperature profiles are applied using the
AASHTO negative thermal gradient specifications similar to the other thermal gradient
load case. The submodel analysis indicated that this load case would underestimate the
stresses, so the stresses shown in the results should be scaled up by about 20%.
The results in Figure 58 and Figure 59 show that most bridges have stress values
below the failure criteria. Only bridges built without a shear key are close to the
cracking stress, but these bridges would not experience problems with debonding
because the slab is typically a monolithic pour.
The stress profiles for a typical TxDOT and PCI bridge for this load case are
shown in Figure 60 and Figure 61. The results indicate that high tensile stresses exist
near the top surface for both TxDOT and PCI bridge, but the stresses are below the
failure criteria even after scaling up to match the submodel results.

95
Maximum Tensile Transverse Stress (-) Thermal Gradient Loading, 2-lane bridge
0
200
400
600
800
1000
1200
0 20 40 60 80 100
Span Length (ft)
Str
ess
(psi
)
TB20 TB20 - S TB20 - SK TB28TB28 - S TB28 - SK TB28 - PT TB28 - FDTB34 TB34 - S TB34 - SK PB27PB27 - S PB27 - SK PB27 - PT PB27 - FDPB33 Bond Strength Rupture Modulus
Figure 58: Maximum Transverse Stress due to Negative Thermal Gradient in 2-Lane Bridges
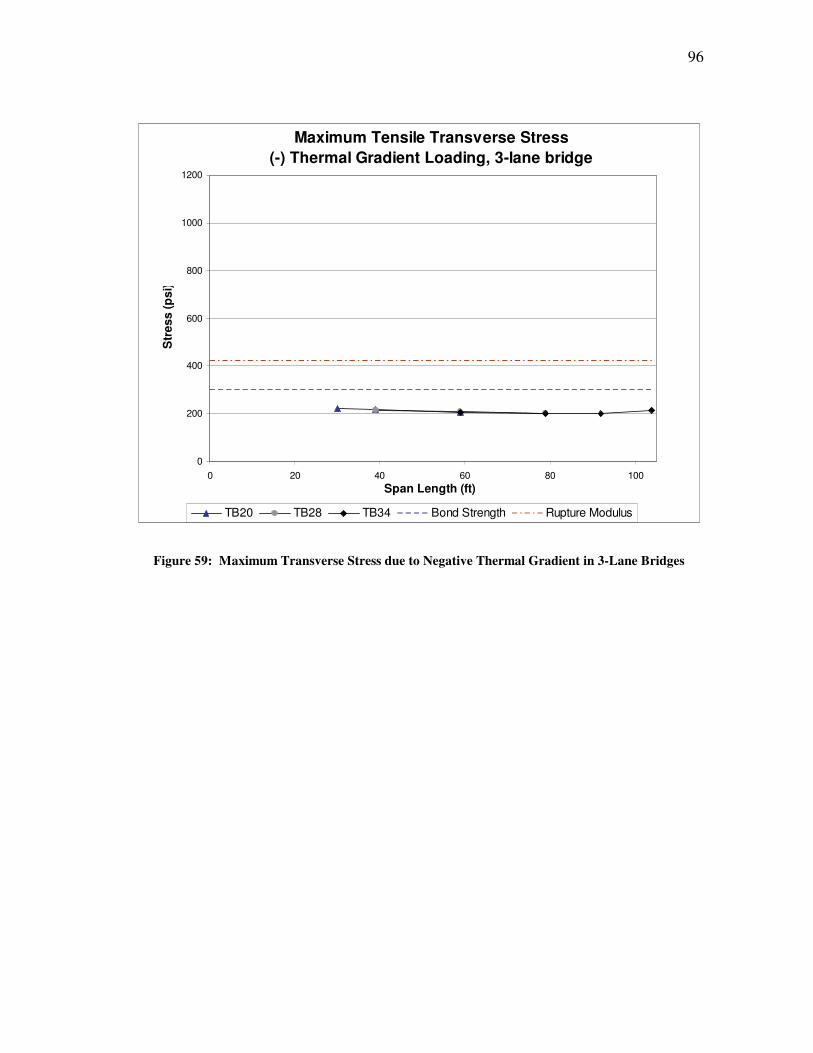
96
Maximum Tensile Transverse Stress (-) Thermal Gradient Loading, 3-lane bridge
0
200
400
600
800
1000
1200
0 20 40 60 80 100Span Length (ft)
Str
ess
(psi
)
TB20 TB28 TB34 Bond Strength Rupture Modulus
Figure 59: Maximum Transverse Stress due to Negative Thermal Gradient in 3-Lane Bridges

97
Transverse Normal Stress Profile at Midspan Location0
5
10
15
20
25
30-100 0 100 200
Stress (psi)
Dep
th b
elow
top
(in)
J1
J2
J3
J4
J5
Figure 60: Stresses in Joint for TxDOT Bridge due to Negative Thermal Gradient
(2-Lane TB28 - 59)
Transverse Normal Stress Profile at Midspan Location0
5
10
15
20-100 -50 0 50 100 150 200
Stress (psi)
Dep
th b
elow
top
(in)
J1
J2
J3
J4
J5
Figure 61: Stresses in Joint for PCI Bridge due to Negative Thermal Gradient
(2-Lane PB27 -59)

98
Results for Vehicular Loading
HS-25 Design Truck
The HS-25 truck load results produced by a single truck are shown in Figure 62
and Figure 63. The submodel analysis indicated that the results from the global models
would underestimate stresses, so the results presented here should be scaled up by 20%
to take this into consideration.
One problem with the data shown in the figures is that actual truck loadings are
generally more complicated than the simple static loads presented here. There can be
several lanes loaded at one time and dynamic interactions between the truck and the
bridge, so the effects of truck loads can result in higher stresses than what is shown by a
single static truck load.
There is not an increase in transverse stresses when multiple trucks are placed on
the bridge, because the additional trucks effectively reduce bending in the transverse
direction. Placing a truck in every lane causes all box girders to deflect similarly, so
shear across the shear key is reduced. Therefore trucks in multiple lanes were not
considered. Likewise, multiple trucks in the same lane were not considered, but the
stresses from this situation could be much higher than for a single truck.
The issue of “impact loading” or higher stresses due to dynamic effects of the
moving wheel loads is discussed in the AASHTO bridge manual, but no impact factor
was incorporated in this study.
As shown in the results, all of the bridges have stresses below the rupture
modulus, and only the PCI Bridge without a composite slab is significantly above the

99
stress level that would cause debonding. The increase of tensile stresses by 20% to
match the submodel results means that more bridges would be above the failure criteria
for debonding, but still none would be above the failure criteria for cracking. The
TxDOT three lane bridges are also below the stress levels for cracking and debonding.
Maximum Tensile Transverse Stress HS-25 Truck Loading, 2-lane bridge
0
200
400
600
800
1000
1200
0 20 40 60 80 100Span Length (ft)
Str
ess
(psi
)
TB20 TB20 - S TB20 - SK TB28TB28 - S TB28 - SK TB28 - PT TB28 - FDTB34 TB34 - S TB34 - SK PB27PB27 - S PB27 - SK PB27 - PT PB27 - FDPB33 Bond Strength Rupture Modulus
Figure 62: Maximum Transverse Stress due to HS-25 Loading in 2-Lane Bridges

100
Maximum Tensile Transverse Stress HS-25 Truck Loading, 3-lane bridge
0
200
400
600
800
1000
1200
0 20 40 60 80 100Span Length (ft)
Str
ess
(psi
)
TB20 TB28 TB34 Bond Strength Rupture Modulus
Figure 63: Maximum Transverse Stress due to HS-25 Loading in 3-Lane Bridges
The stress profiles for a typical TxDOT and PCI bridge are shown in Figure 64
and Figure 65. The maximum tensile stress for a joint at midspan exists below the wheel
loads, and the stresses decrease as one moves further away from the wheel loads. The
TxDOT bridges have small stresses at each joint at midspan, but the tensile stresses near
the ends of the bridge are much higher. The PCI bridges have high tensile stresses in
their joints at the midspan location as well as near the ends.
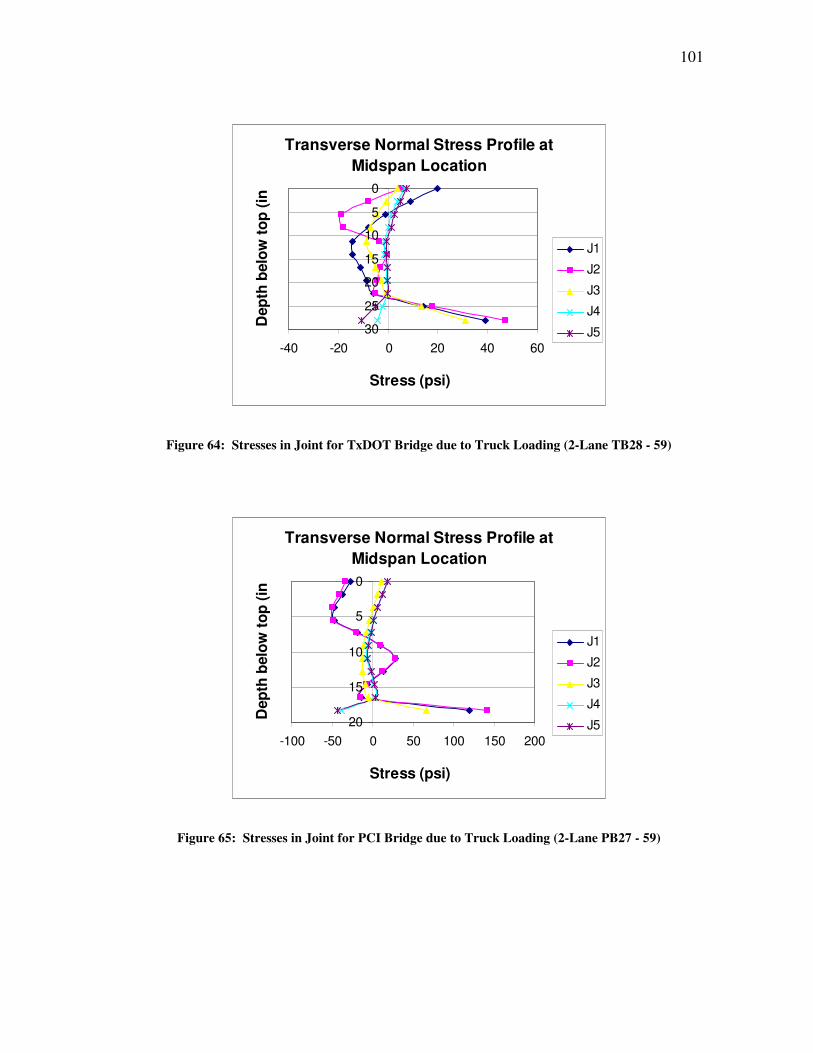
101
Transverse Normal Stress Profile at Midspan Location
0
5
10
15
20
25
30-40 -20 0 20 40 60
Stress (psi)
Dep
th b
elow
top
(in)
J1
J2
J3
J4
J5
Figure 64: Stresses in Joint for TxDOT Bridge due to Truck Loading (2-Lane TB28 - 59)
Transverse Normal Stress Profile at Midspan Location0
5
10
15
20-100 -50 0 50 100 150 200
Stress (psi)
Dep
th b
elow
top
(in)
J1
J2
J3
J4
J5
Figure 65: Stresses in Joint for PCI Bridge due to Truck Loading (2-Lane PB27 - 59)

102
Discussion of Bridge Features
The role of composite slabs, shear keys, transverse post-tensioning, full depth
shear keys, and bridge width are discussed here to highlight the differences between the
various bridge features.
Effect of Composite Slab
The effect of adding a composite slab serves to increase the load transfer
mechanism and protect the shear keys from large tensile stresses. The bridges without
composite slabs show higher stresses for most loading conditions. The major benefit of
a composite slab is that it contains reinforcing steel and so would not be expected to lose
the ability of load transfer once cracking occurs. However, the large shrinkage strains in
a composite slab are a concern.
Effect of Shear Keys
The construction of a bridge with a composite slab but without a shear key
produces stresses that are above the failure criteria when shrinkage and thermal loads are
considered. The stresses due to the HS-25 load case are comparable to other bridge
designs, as shown in Figure 66. The stresses due to thermal loads are very high, as
shown in Figure 67. The experience of TxDOT with using these box girder bridges
confirms these predictions (Jones 1999). The slabs developed large reflective cracks
over shear keys and sometimes over the center of a girder. This is most likely related to
shrinkage, but even without shrinkage the thermal stresses are high enough to cause

103
failure. It is unknown whether any PCI box girders have been built without shear keys,
but the results would be similar to the TxDOT designs discussed here.
Transverse Normal Stress Profile at Midspan Location
0
1
2
3
4
5
6-300 -200 -100 0 100 200 300
Stress (psi)
Dep
th (i
n)
J1
J2
J3
J4
J5
Figure 66: TxDOT Bridge with no shear key under HS-25 loads (2-Lane TB28 – S 59)

104
Transverse Normal Stress Profile at Midspan Location
0
1
2
3
4
5
6-1500 -1000 -500 0 500 1000 1500
Stress (psi)
Dep
th (i
n)J1
J2
J3
J4
J5
Figure 67: TxDOT Bridge with no shear key and (+) Thermal Gradient Loads (2-Lane TB28 - S 59)
Effect of Full Depth Shear Key
The use of a full depth shear key means that the shear key material extended to
the bottom of the section. This is accomplished by including additional small elements
below the gap of the typical shear key, but otherwise the models are similar to other
bridges. The effect of the full-depth key is somewhat dependent on the original shear
key configuration, as the PCI key is typically much smaller than the TxDOT key. This
means that there will be a greater difference in the PCI bridges than for the TxDOT
bridges. For example, a TxDOT B28 section will have a shear key extending 23” below
the top (Figure 68). A PCI B27 (IB) will have a shear key that is only 13” below the top
surface, so the key extends only about halfway down the section (Figure 69).

105
Figure 68: Texas Box Girder (TB28) with Full Depth Shear Key
Figure 69: PCI Box Girder (PB27) with Full Depth Shear Key
The full depth shear key allows the bridge to transfer transverse normal stresses
more effectively across joints, and there is less of a stress concentration at the bottom of
the shear key. This might be difficult to accomplish with current designs, but would

106
result in lower tensile stresses in the shear key region under the same loads as a partial
depth shear key. Another aspect of full depth shear keys is that they are less likely to act
like a hinge, and more likely to transfer moment to adjacent girders.
Adding a full depth key to a bridge without a composite slab does lower the
maximum tensile stresses as shown in the results. In addition, the use of a full depth key
decreases the effect of the stress concentration at the bottom of the current shear key
design. This area has an abrupt geometry change and could potentially be a crack
initiator. This effect was not explored in this study, but the use of a full depth key
decreased tensile stress levels for most bridges and load cases.
The improvements associated with using full depth keys were not evident in the
Texas bridges that already have large shear keys. The use of a full depth key in the
bridges was effective in lowering the tensile stresses for most load cases, and the results
for the HS-25 load case is shown in Figure 70. The full-depth key did not lower the
stresses for the negative solar radiation load, as shown in Figure 71.

107
Transverse Normal Stress Profile at Midspan Location
0
5
10
15
20
25-40 -20 0 20 40 60
Stress (psi)
Dep
th (i
n)J1
J2
J3
J4
J5
Figure 70: TxDOT Bridge with Full-Depth Key under HS-25 Loads (2-Lane TB28 - FD 59)
Transverse Normal Stress Profile at Midspan Location
0
5
10
15
20
25-100 0 100 200 300
Stress (psi)
Dep
th (i
n)
J1
J2
J3
J4
J5
Figure 71: TxDOT Bridge with Full-Depth Key under (-) Thermal Gradient Loads
(2-Lane TB28 - FD 59)

108
Effect of Transverse Post-Tensioning
The models with post-tensioning are similar to the other models with three main
differences. The first is that point loads are applied at the post-tensioning reaction
locations simulating the effect of unbonded post-tensioned strands. The second
difference is that internal diaphragms are included according to TxDOT or Ohio DOT
standards. The last major difference is that no composite slab is used. The Texas bridge
standard requires that when post-tensioning is used, diaphragms must be included in the
exterior girders spaced every 10 feet with tendons at the same spacing tensioned to
45,000 lbs each. The PCI bridge has diaphragms (at the exterior girders) and tendons
only at the ends and midspan locations, and each tendon is tensioned to 30,000 lbs. The
effectiveness of post-tensioning had been dismissed by earlier studies, but in the models
used for this study it was found to limit the maximum tensile transverse stresses in some
cases. The overall improvements were small, and some load cases showed no apparent
improvement in reducing transverse tensile stresses. Thus, the use of a small amount of
post-tensioning does not appear to justify the additional expense.
One of the problems discussed with post-tensioning is that a close spacing and
high tensile forces must be used if a compressive stress is needed for the entire shear key
along the entire length of the bridge. The joints at the interior of the bridge have the
most consistent compression, whereas the exterior joints have higher compression near
the tendon reactions and lower compression halfway between reaction locations.
In the bridges discussed here, the strand is located at the mid-depth of the shear
key. However, higher compressive stresses develop at the top and bottom of the shear

109
key due to the relative flexibility of the box girder walls. The average normal stress in a
typical TxDOT bridge is shown in Figure 72.
Average Transverse Normal Stress in Bridge Joints
-120
-100
-80
-60
-40
-20
00 20 40 60 80
Position Along Bridge (ft)
Tran
sver
se N
orm
al
Str
ess
(psi
)
J1
J2
J3
J4
J5
Figure 72: Average Stress in TxDOT bridge from Post-Tensioning Force (2-Lane TB28 – PT 59)
The stress profile through the depth of the shear keys in a typical TxDOT post-
tensioned bridge with no composite slab is shown in Figure 73. The profile shown in
Figure 74 is similar but taken at the L/4 (the quarter-point of the span) location, which is
halfway between tendon locations. The joints in this model show a similar level of
stress for all the interior joints, but the exterior joints show a 50% decrease from the
level shown in the results from the midspan location. So, the interior joints will have a
net compressive force that is consistent along the entire length of the bridge, but the

110
exterior joints can only be assured of half of that compressive force at locations away
from strand reactions.
Transverse Normal Stress Profile at Midspan Location
0
5
10
15
20
25-80 -60 -40 -20 0 20
Stress (psi)
Dep
th (i
n)
J1
J2
J3
J4
J5
Figure 73: Post-Tensioned TxDOT Bridge without Loads Applied (2-Lane TB28 – PT 59)

111
Transverse Normal Stress Profile at L/4 Location
0
5
10
15
20
25-60 -40 -20 0 20
Stress (psi)
Dep
th (i
n)J1
J2
J3
J4
J5
Figure 74: Post-Tensioned TxDOT Bridge without Loads Applied (2-Lane TB28 – PT 59)
The PCI bridge with post-tensioning according to OHIO DOT specifications uses
three strand locations and 30,000 lbs of force at each location. The average compressive
stress as a function of location along the span length is shown in Figure 75. From these
results, it can be seen that the compressive stress decreases quite rapidly when one
moves away from the post-tensioning strands.

112
Average Transverse Normal Stress in Bridge Joints
-100
-80
-60
-40
-20
0
20
0 20 40 60 80
Position Along Bridge (ft)
Tran
sver
se N
orm
al
Str
ess
(psi
)
J1J2J3J4J5
Figure 75: Post-Tensioned PCI Bridge without Loads Applied (2-Lane PB27 – PT 59)
The stresses through the depth of the joint section at midspan are shown in
Figure 76. The highest compressive stresses are at the bottom of the joint, but this effect
could be a reflection of the post-tensioning strand location. The post-tensioned strands
were assumed to be at mid-depth of the shear key since no location was specified.

113
Transverse Normal Stress Profile at Midspan Location
02468
101214
-400 -300 -200 -100 0 100
Stress (psi)
Dep
th (i
n)J1
J2
J3
J4
J5
Figure 76: Post-Tensioned PCI Bridge without Loads Applied (2-Lane PB27 – PT 59)
The TxDOT bridges with post-tensioning have a measurable level of
compression for each joint along the length of the bridge. However the compressive
stress was about 15 psi on average and only half this value away from strand locations.
This is not high enough to prevent cracks from forming, but may help control the
opening of cracks and limit their width. If crack prevention is desired, much higher
post-tensioning force is needed to ensure compressive stresses high enough to counteract
the tensile stresses along the entire bridge.
Alternatively, if the maximum tensile stresses occur only in certain areas of the
bridge, then the location of the post-tensioning can be optimized as an effective way to
reduce cracking. For example, if cracking is a problem only at the end of span and
midspan locations, then the current specifications may prevent shear key failure to a

114
certain extent. However, it should be noted that other techniques were much more
reliable and effective at reducing tensile stresses such as using a composite slab or a full
depth key.
The post-tensioned PCI bridges have two main problems. The first is that the
compressive forces are too small to resist cracking. The second problem is that there is
no consistency in compressive stresses at the joints along the length of the bridge.
Between the post-tensioning locations, the average compressive stress drops to zero. If
post-tensioning is needed to resist the large tensile stresses experienced by the shear
keys, then a closer spacing of strands is necessary to ensure a consistent compressive
stress along the length of the bridge.
Effects of Bridge Width
The differences between bridges of different widths were not significant when
considering the maximum transverse normal stresses. The results for a 2 lane bridge
were similar to the results for a 3 lane bridge under each loading case. This is because
the highest stresses due to vehicular loads do not extend very far beyond the girders
supporting the loads, and the secondary loads (shrinkage and temperature) remain
consistent across every joint.

115
SUMMARY AND CONCLUSIONS
Summary of Project
The purpose of this study is to determine why shear keys are failing in multi-
beam box girder bridges. Texas box girder bridges as well as PCI/AASHTO box girder
bridges are investigated, because both of these have developed reflective cracks in the
past. Other research has been carried out on this topic and several important discoveries
have been made, including what loads are likely to cause reflective cracking and the
strength of different materials currently used as shear keys. This study aims to build on
previous work to create realistic computer models that will provide more information on
the topic of reflective cracking.
Previous laboratory and computer analyses, as discussed in the literature review,
indicate that shear keys should withstand normal vehicular loads. The shear key designs
of most box girder bridges are theoretically strong enough to perform their intended
function. In service, however, many box girder bridges utilizing shear keys have
experienced problems, and reflective cracking is present on many bridge decks.
This study suggests that secondary loading effects are the principal cause of
reflective cracking, or that they act in conjunction with vehicular loads to cause
reflective cracking. Secondary loads reflect local conditions, such as the final shrinkage
of the concrete used in a specific bridge or the temperature differential of a particular
bridge shortly after construction. It is possible that secondary loads can be high in some
bridges (those with reflective cracking), while remaining small in most bridges (those
with no evidence of reflective cracking).

116
In addition, secondary loads are proposed as a contributor of reflective cracking
because when bridges are closely evaluated under normal environmental conditions they
show some kind of reflective cracking above the shear keys, whereas in a controlled
laboratory setting most test specimens achieve adequate failure loads. In both Texas and
PCI box girder designs, some bridges appeared to develop cracking before the bridge
was open for traffic (Jones 1999, Hucklebridge 1995). This clearly indicates the
importance of secondary loading effects such as thermal expansion or shrinkage.
Finite element models are a central part of this study, and much work has been
carried out to understand how a box girder bridge can be modeled using finite elements
as well as how different loads can be applied correctly to these models. Many individual
experiments involving convergence tests, comparisons of finite element models,
previous published results, and experience from other finite element projects have been
used in this particular study.
The finite element models in this study are similar to those used in previous
research efforts, but some refinements have been made. First, the specific geometry of
the shear key and box girders have been modeled, along with interior diaphragms and
composite slabs. A second improvement is the addition of elastic support conditions,
reflecting the common use of elastomeric bearing pads. The stiffness, size, and location
of these bearing pads have an effect on the transverse loads near the supports, and so
these are included within the finite element models.
Solid elastic elements were chosen to represent all of the bridges because many
of the bridge components did not meet the requirements for beam or shell element

117
assumptions. The use of solid elastic elements allows the true geometry of the bridge to
be used in the model, avoiding the assumptions required to transform the problem into
one involving beam or shell elements.
Another benefit of using solid elastic elements is that loads can be applied
directly to nodes in a simple manner. This is important when secondary loads are
considered. Thermal differentials and shrinkage effects can be input as loads directly at
the locations that they act upon, so complicated strain profiles such as temperatures can
be applied as intended. Another benefit of having many nodes available is that stress
profiles reflect what is truly happening in a given section, rather than back-calculating
stresses based on an assumed strain profile as when classical beam theory is used.
Summary of Results
The results show that most multi-beam box girder bridges considered in this
study have shear keys that can safely and effectively transfer vehicular loads. An HS-25
design truck loading will not cause stresses high enough to create cracking problems in
the center of the bridge. This is in agreement with most previous studies, and the data
shows that the static loading of a truck is not sufficient to cause reflective cracking of
multi-beam bridges. However, truck loading does create high stresses near the ends of
the bridge, and as a truck passes over the end of the bridge the stresses can be quite
large.
Also, secondary loading effects including shrinkage and temperatures result in
much higher stresses than vehicular loading. This was true for all of the bridges studied.

118
The effect of a design temperature gradient as specified by AASHTO causes tensile
stresses high enough to cause cracking in some shear keys. The Texas shear keys, by
virtue of their larger section, developed lower stresses than the PCI shear keys and
would not be expected to have problems with temperature gradients. The other
secondary loading situation considered was shrinkage of the shear key and composite
slab. If shrinkage values approached the levels used in this study, then all bridges would
develop problems with cracking in the shear key and the composite slab.
The results show that section depth and shear key size are the most important
factors. Also important are the number and locations of the bearing pad supports, and
the presence of a composite slab. Span length does not appear to be an important factor
for maximum transverse stress. The presence of post-tensioning does appear to limit the
tensile stresses in the shear key, but the improvement is not evident for every load case
considered. Another proposed solution, the use of a full depth shear key, resulted in
lower tensile stresses, but once again the improvement was not seen for every load case.
Conclusions
Based on the results, several conclusions can be drawn from this study. First, the
stresses caused by secondary loadings cannot be ignored when designing and analyzing
a multi-beam bridge that will use shear keys. The ACI 318 specifications require that
unreinforced concrete elements be analyzed for these effects, but this does not seem to
have been addressed in current designs.

119
Another finding from the computer models is that the largest stresses often occur
at the ends of the bridge. The regions near the supports have been found to crack often
in previous research, and so the boundary conditions and elastomeric bearing pads must
be carefully designed to protect the bridge joints from high stresses.
Another conclusion that can be drawn from the data is that HS-25 truck loads are
not large enough to cause shear key failure independently of other loads. If problems
with reflective cracking exist along the entire length of the bridge, then shrinkage of the
slab and shear key is the most probable candidate. Temperature loads can be large
enough to cause cracking and daily temperature fluctuations can cause large stress
reversals.
The solutions proposed for shear key failures in past research include transverse
post-tensioning and design changes such as the use of a full depth key. These solutions
did show improvements compared to a bridge without these features, but the use of a
composite slab was the most effective way to decrease tensile stresses. The full depth
key was more effective than transverse post-tensioning, but neither reduced tensile
stresses for every load considered.
Recommendations for Further Research
The finite element models used in this study were not able to model what would
happen after initial cracking. This behavior would be an important step to understanding
the consequences of shear key failure. Specifically, the difference in behavior between a
fractured shear key and a debonded shear key is essential to determining whether this

120
has an effect on the composite deck slab. If a debonded shear key is able to transfer load
between girders and does not cause cracking in the slab above, then this system would
be a good candidate for creating a waterproof joint. However, if a slab is affected by a
debonded shear key then the problem with the shear key itself must be corrected.
Another recommendation is to study the impact that the elastic bearing
conditions have on transverse stresses near the supports. These locations consistently
experienced the highest stresses in the bridge models, and so altering the location or size
of the bearing pads could have benefits for the shear keys.
A final recommendation for further work is to measure transverse shrinkage in a
composite deck slab as it is installed on a bridge. The shrinkage loadings produced the
highest tensile stresses in the bridge models, but the values used for ultimate shrinkage
strain were based on limited information. Better knowledge about this effect could lead
to slab designs that are able to withstand reflective cracking better than previous bridges.

121
REFERENCES
American Association of State Highway and Transportation Officials (AASHTO). (1992). Standard Specifications for Highway Bridges, Fifteenth Edition. Washington, DC.
American Association of State Highway and Transportation Officials (AASHTO).
(2004). Load and Resistance Factor Design (LRFD) Bridge Design Specifications, Third Edition. Washington, DC.
American Concrete Institute (ACI). (2002). ACI-318-02, Building Code Requirements
for Reinforced Concrete. Detroit, MI. American Society for Testing and Materials. (1993). ASTM Standards Volume 04.02.
Philadelphia, PA. Annamalai, G., and Brown, R. C. (1990). “Shear Strength of Post-Tensioned Grouted
Keyed Connections in Precast Concrete-Framed Structures,” ACI Structural Journal, 87(1), 53-59.
ANSYS, Inc. (2005). ANSYS Theory and Reference Manual, Version 8.0.
http://sc.tamu.edu/softwareDocs/ansys80/ Cusens, A. R., and Pama, R. P. (1965). “Design of Concrete Multibeam Bridge Decks,”
Journal of the Structural Division. October, 254-278. El-Remaily, A., Tadros, M. K., Yamane, T., and Krause, G. (1996). “Transverse
Design of Adjacent Precast Prestressed Concrete Box Girder Bridges.” PCI Journal. 41(4), 96-113.
Federal Highway Administration (FHWA). (2005). “National Bridge Inventory.”
<http://www.fhwa.dot.gov/bridge/nbi.htm> Grata, J. and M. Saxton. (2005). “Road salt, hits from trucks likely led to bridge
collapse.” Pittsburgh Post-Gazette. December 24. Gulyas, R. J., Wirthlin, G. J., and Champa, J. T. (1995). "Evaluation of Keyway Grout
Test Methods for Precast Concrete Bridges," PCI Journal. 40(1), 44-57. Huckelbridge, A. A., and El-Esnawi, H. H. (1997). “Evaluation of Improved Shear Key
Designs for Multi-Beam Box Girder Bridges,” Final Report, Ohio Department of Transportation, FHWA/OH-97/009. Columbus, OH.

122
Huckelbridge, A. A. Jr., El-Esnawi, H., and Moses, F. (1995). "Shear Key Performance in Multibeam Box Girder Bridges." Journal of Performance of Constructed Facilities. 9(4), 271-285.
Issa, Mohsen A., Ribeiro de Valle, C. L., Abdalla, H. A., Islam, S. H., and Issa,
Mahmoud A. (2003). "Performance of Transverse Joint Grout Materials in Full-Depth Precast Concrete Bridge Deck Systems." PCI Journal. 48(4), 92-103.
Jones, H. L. Multi-Box Beam Bridges with Composite Deck. (1999). FHWA-TX-00-
1709-1. Texas Transportation Institute. Texas A&M University, College Station, TX.
Kaneko, Y., Connor, J. J., Traiantfillou, T. C., and Leung, C. K. (1993a). "Fracture
Mechanics Approach for Failure of Concrete Shear Key I: Theory." Journal of Engineering Mechanics, ASCE. 119(4), 681-699.
Kaneko, Y., Connor, J. J., Traiantfillou, T. C., and Leung, C. K. (1993b). "Fracture
Mechanics Approach for Failure of Concrete Shear Key II: Verification." Journal of Engineering Mechanics, ASCE. 119(4), 701-719.
Lall, J., DiCocco, E. F., and Alampalli, S. (1997). “Full Depth Shear-Key Performance
in Adjacent Prestressed-Beam Bridges.” Special Report 124, Transportation Research and Development Bureau, New York State Dept. of Transportation, Albany, NY.
Miller, R. A., Hlavacs, G. M., and Long, T. W. (1998). “Testing of Full-Scale
Prestressed Beams to Evaluate Shear Key Performance,” Final Report, Ohio Department of Transportation, FHWA/OH-98/019, Columbus, Ohio.
Moreton, A. J. (1981). “Epoxy Glue Joints in Precast Concrete Segmental Bridge
Construction,” Proc. Instn. Civ. Engrs. 70(1), 163-177. Nottingham, D., Gulyas, R. J., Wirthlin, G. J., and Champa, J. T. (1995). "Reader
Comments - Evaluation of Keyway Grout Test Methods for Precast Concrete Bridges," PCI Journal. 40(4).
Ohio Department of Transportation (ODOT). (2005). “ODOT Bridge Design Manual.”
<http://www.dot.state.oh.us> Texas Department of Transportation (TxDOT) (2001). “TxDOT Bridge Design
Manual.” <http://manuals.dot.state.tx.us/dynaweb/colbridg/> Yazdani, N., S. Eddy, C. S. Cai. (2000). “Effect of Bearing Pads on Precast Prestressed
Concrete Bridges.” Journal of Bridge Engineering, ASCE. 5(3), 224-232.

123
VITA
Graeme Peter Sharpe graduated with a Master of Science degree in civil
engineering from Texas A&M University in August 2007. His thesis advisor was Dr.
Harry Jones, and he worked with Dr. Ray James and Dr. Jones as a research assistant for
the Texas Transportation Institute before finishing work on his thesis. Graeme received
his Bachelor of Science degree in civil engineering from Carnegie Mellon University in
May 2002. He has been an engineer at the firm of Silver Creek Engineering, Inc. of
Indianapolis, IN since July, 2005.
Contact Information:
Graeme Peter Sharpe
400 S. Ritter Avenue
Indianapolis, IN 46219
United States of America
Email: [email protected]