profile on gypsum board - precise consult...
TRANSCRIPT

104. PROFILE ON THE PRODUCTION OF GYPSUM
BOARD

104-1
TABLE OF CONTENTS
PAGE
I. SUMMARY 104-2
II. PRODUCT DESCRIPTION & APPLICATION 104-3
III. MARKET STUDY AND PLANT CAPACITY 104-3
A. MARKET STUDY 104-3
B. PLANT CAPACITY & PRODUCTION PROGRAM 104-6
IV. MATERIALS AND INPUTS 104-6
A. RAW & AUXILIARY MATERIALS 104-6
B. UTILITIES 104-7
V. TECHNOLOGY & ENGINEERING 104-7
A. TECHNOLOGY 104-7
B. ENGINEERING 104-8
VI. HUMAN RESOURCE & TRAINING REQUIREMENT 104-12
A. HUMAN RESOURCE REQUIREMENT 104-12
B. TRAINING REQUIREMENT 104-13
VII. FINANCIAL ANLYSIS 104-13
A. TOTAL INITIAL INVESTMENT COST 104-14
B. PRODUCTION COST 104-15
C. FINANCIAL EVALUATION 104-16
D. ECONOMIC AND SOCIAL BENEFITS 104-18
104-2
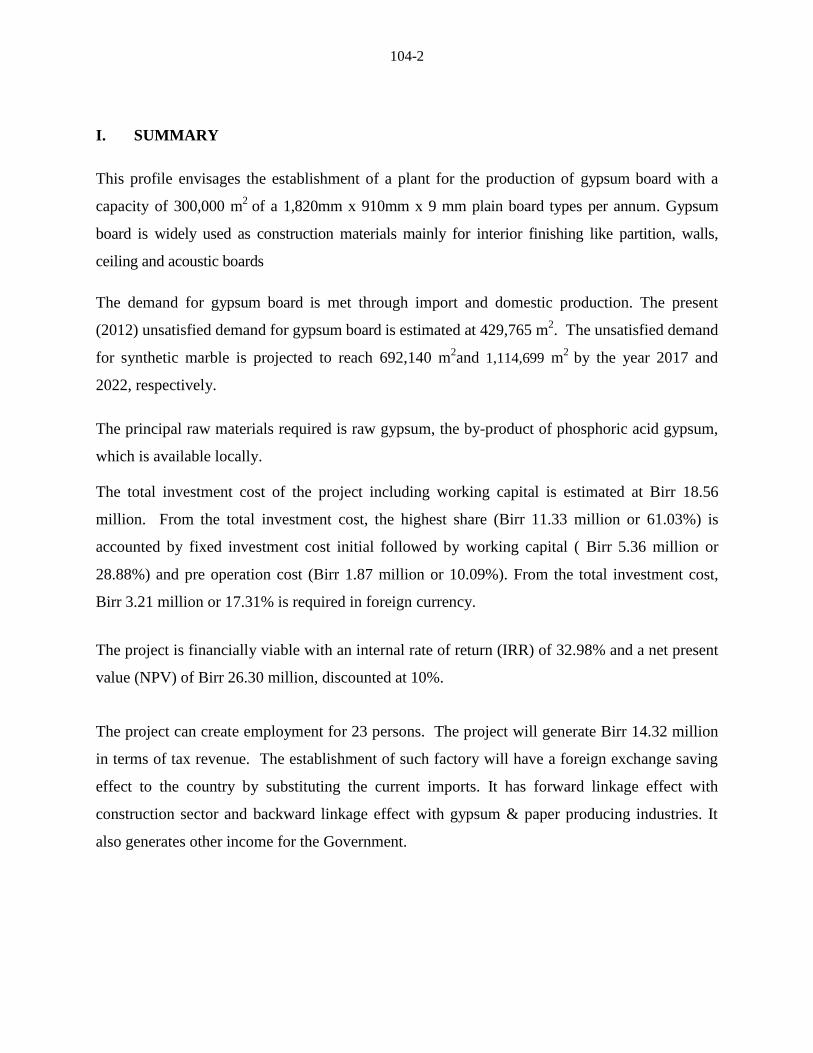
I. SUMMARY
This profile envisages the establishment of a plant for the production of gypsum board with a
capacity of 300,000 m2
of a 1,820mm x 910mm x 9 mm plain board types per annum. Gypsum
board is widely used as construction materials mainly for interior finishing like partition, walls,
ceiling and acoustic boards
The demand for gypsum board is met through import and domestic production. The present
(2012) unsatisfied demand for gypsum board is estimated at 429,765 m2. The unsatisfied demand
for synthetic marble is projected to reach 692,140 m2and 1,114,699 m
2 by the year 2017 and
2022, respectively.
The principal raw materials required is raw gypsum, the by-product of phosphoric acid gypsum,
which is available locally.
The total investment cost of the project including working capital is estimated at Birr 18.56
million. From the total investment cost, the highest share (Birr 11.33 million or 61.03%) is
accounted by fixed investment cost initial followed by working capital ( Birr 5.36 million or
28.88%) and pre operation cost (Birr 1.87 million or 10.09%). From the total investment cost,
Birr 3.21 million or 17.31% is required in foreign currency.
The project is financially viable with an internal rate of return (IRR) of 32.98% and a net present
value (NPV) of Birr 26.30 million, discounted at 10%.
The project can create employment for 23 persons. The project will generate Birr 14.32 million
in terms of tax revenue. The establishment of such factory will have a foreign exchange saving
effect to the country by substituting the current imports. It has forward linkage effect with
construction sector and backward linkage effect with gypsum & paper producing industries. It
also generates other income for the Government.

104-3
II. PRODUCT DESCRIPTION AND APPLICATION
Gypsum board is a board made of gypsum, which consists of the core of the board and covering
of the core of the board and covering paper. It is widely used as construction materials mainly
for interior finishing like partition, walls, ceiling and acoustic boards. Major raw materials are
gypsum and hard board papers. The plant can be categorizes as small-scale industry.
III. MARKET STUDY AND PLANT CAPACITY
A. MARKET STUDY
1. Past Supply and Present Demand
Gypsum board is widely used as construction materials mainly for interior finishing like
partition, walls, ceiling and acoustic boards. Therefore, the demand for the product is influenced
by the dynamism in the real estate sub sector mainly of residential and commercial building.
Nowadays, the use of gypsum board partition for commercial building has become customary.
Furthermore, high end houses, restaurants, pastries and the like use gypsum board for ceiling and
decorations.
The local demand for gypsum board was met only through import in the past. However, recently
a gypsum board manufacturing plant named GH Industrial Plc has become operational.
However, there is no available data which indicates the production level of the new plant.
Therefore, for estimating the demand for the product the unsatisfied demand i.e. the demand
which is met through import is considered. Accordingly, the quantity of gypsum board imported
during the period 2002-2011 is given in Table 3.1

104-4
Table 3.1
IMPORT OF GYPSUM BOARD (IN M2)
Year Import
2002 28,247
2003 11,901
2004 25,275
2005 54,998
2006 101,379
2007 236,634
2008 105,045
2009 281,953
2010 217,294
2011 380,323
Source: - Ethiopian Revenues & Customs Authority.
As could be observed from Table 3.1, import of gypsum board exhibits a substantial growth
especially during the recent six years i.e. 2006--2011. The average annual import, which was
30,105 m2 during the period 2002-2005, has increased by more than seven fold to an average of
220,438 m2
during the period 2006-2011.
For estimating the present unsatisfied demand for gypsum board, a growth rate 13% which is
equivalent to growth rate of the contribution of the construction sector to GDP during the period
2001--2010 is considered.
Accordingly, taking the 2011 level of import as a base and applying a growth rate 13%, the
present (2012) unsatisfied demand for gypsum board is estimated at 429,765 m2.
2. Demand Projection
The demand for gypsum board is directly related with the growth in the construction sector in
general and the housing construction sub sector in particular which in turn depends on the overall
economic development of the country.
The contribution of the construction sector to the GDP during the period 2001 – 2010 have been

104-5
growing at annual average growth rate of 13 percent which is above the average annual
growth rate of real GDP during the period under consideration (11.4 %), indicating a rise
in the share of the construction sector within the overall economy.
According to the GTP, during the period 2010/11 – 2014/15 the real GDP of the country (at a
base case scenario) is expected to grow at an average annual growth rate of 11.2%. Moreover,
during the same period the annual average planned targets of growth for the construction sector
is 20%.
Accordingly, by considering the above factors the demand for gypsum board is conservatively
assumed to grow at a rate of 10%. Accordingly, projected unsatisfied demand is presented in
Table 3.2.
Table 3.2
PROJECTED UNSATISFIED DEMAND (M2)
Year
Projected
Demand
2013 472,741
2014 520,015
2015 572,017
2016 629,219
2017 692,140
2018 761,354
2019 837,490
2020 921,239
2021 1,013,363
2022 1,114,699
3. Pricing and Distribution
The current factory price of gypsum board ranges between Birr 125 per m2 to 160 per m
2. For the
envisaged plant a factory-gate price of Birr 140 per m2 is recommended. The plant will directly
sell its product to the end-users at the premises of the factory.

104-6
B. PLANT CAPACITY AND PRODUCTION PROGRAM
1. Plant Capacity
Based on the market study and the economic scale of Gypsum board, the rated capacity of the
plant is proposed to be 300,000 m2
of a 1,820mm x 910mm x 9 mm plain board types per annum.
2. Production Program
The production program is set away that the plant will attain 75% of its capacity in the first year,
85% in the second year and full capacity beginning from the third year.
IV. MATERIALS AND INPUTS
A. RAW MATERIALS
Raw gypsum, the by-product of phosphoric acid gypsum, is the main raw material for production
of gypsum board which is available locally. The annual raw material required with the
corresponding cost is given in Table 4.1.
Table 4.1
RAW MATERIALS REQUIREMENT AND COST
Raw Material
Type
Quantity Cost (‘000 Birr)
(Tone) FC LC Total
Gypsum 2,240 16,800.00 16,800.00
Paper 210 1543.50 661.50 2,205.00
Pulp 14 51.45 22.05 73.50
Additives 35 183.75 78.75 262.50
Total 1778.7 17,562.3 19,341.00

104-7
B. UTILITIES
The utilities required are steam, fuel (heavy oil), water and electrical power, annual cost of
utilities is Birr 13.34 million. Table 4.2 below shows utility requirement and the corresponding
cost at full capacity utilization of the envisaged plant.
Table 4.2
UTILITIES REQUIREMENT AND COST
Sr.
No.
Utilities Unit of
Measure
Quantity
Cost
(Birr)
1 Steam kg 2,400,000 468,304
2 Fuel (heavy oil) liters 490,000 7,105,000
3 Water m3 550,000 5,500,000
5 Electrical power kWh 465,000 269,700
Total 13,343,004
V. TECHNOLOGY AND ENGINEERING
A. TECHNOLOGY
1. Production Process
The wet gypsum is dried in a dryer, then calcined to form plaster, hemihydrates of calcium
sulphate (partly water soluble anhydrite) in a calcination unit, and stocked in silos after milling
of the calcined product. Heavy oil is usually used for drying and calcination, and the exhaust gas
is released in to air passing through a scrubber.
The pulp used as filler is mixed with required amount of water in pulper. In a board forming
process, plaster, filter and water and adhesives under fixed ratios into a mixer, and the slurry
leaving the mixer is sent to forming unit. While the paper for the top and bottom of the gypsum
board is supplied is fed in between the top and the bottom papers moving sandwiched and

104-8
enveloped by the papers. Setting of the plaster in the slurry raked place on the belt conveyer of
the forming unit along the moving of the formed gypsum board, and after certain time allowed
for setting the board is cut into uniform size. The setting progresses further on the gypsum board
pieces are placed in a drying unit.
2. Environmental Impact Assessment
Gypsum is an abundant naturally occurring non-toxic mineral and the production process of
gypsum board which consist drying, calcinations and cutting does no have any adverse effect on
the environment.
B. ENGINEERING
1. Machinery and Equipment
Total cost of machinery and equipment is estimated at Birr 6,951,450, out of which Birr
3,212,850 is required in foreign currency. The list of machinery and equipment required for the
manufacture of gypsum board is given in Table 5.1.
Table 5.1
LIST OF REQUIRED MACHINERY AND EQUIPMENT
Sr.
No.
Description Qty.
1
Gypsum Drying Section
Oil storage tank
Furnace
Gypsum feeder & Conveyer
Gypsum dryer
Cyclone
Exhaust gas blower
Scrubber
Dry gypsum hopper
1
1
1set
1
1
1
1
1

104-9
Sr.
No.
Description Qty.
2 Gypsum Calcining Section
Kettle
Furnace
Hot pit
Pulverizer
Silo
Plaster hopper electrical dust collector
Bag filter
Scrubber
Exhaust gas blower
Feeder and conveyor
2
1
2
2
3
1
1
1
1
1
3 Automatic regulating equipment 1
4 2HP motors, fans, hand cars 4 set
5 Accessories 1set
2. Land, Building and Civil Works
The plant requires a total of 1,000 m2 area of land out of which 600 m
2 is built-up area, which
includes manufacturing area, raw material stock area, offices etc. Assuming construction rate of
Birr 5,000 per m2, the total cost of construction is estimated to be Birr 3 million.
According to the Federal Legislation on the Lease Holding of Urban Land (Proclamation No.
721/2004) in principle, urban land permit by lease is on auction or negotiation basis, however,
the time and condition of applying the proclamation shall be determined by the concerned
regional or city government depending on the level of development.
The legislation has also set the maximum on lease period and the payment of lease prices. The
lease period ranges from 99 years for education, cultural research health, sport, NGO , religious
and residential area to 80 years for industry and 70 years for trade while the lease payment
period ranges from 10 years to 60 years based on the towns grade and type of investment.

104-10
Moreover, advance payment of lease based on the type of investment ranges from 5% to
10%.The lease price is payable after the grace period annually. For those that pay the entire
amount of the lease will receive 0.5% discount from the total lease value and those that pay in
installments will be charged interest based on the prevailing interest rate of banks. Moreover,
based on the type of investment, two to seven years grace period shall also be provided.
However, the Federal Legislation on the Lease Holding of Urban Land apart from setting the
maximum has conferred on regional and city governments the power to issue regulations on the
exact terms based on the development level of each region.
In Addis Ababa, the City’s Land Administration and Development Authority is directly
responsible in dealing with matters concerning land. However, regarding the manufacturing
sector, industrial zone preparation is one of the strategic intervention measures adopted by the
City Administration for the promotion of the sector and all manufacturing projects are assumed
to be located in the developed industrial zones.
Regarding land allocation of industrial zones if the land requirement of the project is below
5,000 m2,
the land lease request is evaluated and decided upon by the Industrial Zone
Development and Coordination Committee of the City’s Investment Authority. However, if the
land request is above 5,000 m2, the request is evaluated by the City’s Investment Authority and
passed with recommendation to the Land Development and Administration Authority for
decision, while the lease price is the same for both cases.
Moreover, the Addis Ababa City Administration has recently adopted a new land lease floor
price for plots in the city. The new prices will be used as a benchmark for plots that are going to
be auctioned by the city government or transferred under the new “Urban Lands Lease Holding
Proclamation.”
The new regulation classified the city into three zones. The first Zone is Central Market District
Zone, which is classified in five levels and the floor land lease price ranges from Birr 1,686 to
Birr 894 per m2. The rate for Central Market District Zone will be applicable in most areas of the
city that are considered to be main business areas that entertain high level of business activities.

104-11
The second zone, Transitional Zone, will also have five levels and the floor land lease price
ranges from Birr 1,035 to Birr 555 per m2 .This zone includes places that are surrounding the city
and are occupied by mainly residential units and industries.
The last and the third zone, Expansion Zone, is classified into four levels and covers areas that
are considered to be in the outskirts of the city, where the city is expected to expand in the future.
The floor land lease price in the Expansion Zone ranges from Birr 355 to Birr 191 per m2
(see
Table 5.2).
Table 5.2
NEW LAND LEASE FLOOR PRICE FOR PLOTS IN ADDIS ABABA
Zone Level
Floor
Price/m2
Central Market
District
1st 1686
2nd
1535
3rd
1323
4th
1085
5th
894
Transitional zone
1st 1035
2nd
935
3rd
809
4th
685
5th
555
Expansion zone
1st 355
2nd
299
3rd
217
4th
191
Accordingly, in order to estimate the land lease cost of the project profiles it is assumed that all
new manufacturing projects will be located in industrial zones located in expansion zones.
Therefore, for the profile a land lease rate of Birr 266 per m2
which is equivalent to the average
floor price of plots located in expansion zone is adopted.

104-12
On the other hand, some of the investment incentives arranged by the Addis Ababa City
Administration on lease payment for industrial projects are granting longer grace period and
extending the lease payment period. The criterions are creation of job opportunity, foreign
exchange saving, investment capital and land utilization tendency etc. Accordingly, Table 5.3
shows incentives for lease payment.
Table 5.3
INCENTIVES FOR LEASE PAYMENT OF INDUSTRIAL PROJECTS
Scored Point
Grace
Period
Payment
Completion
Period
Down
Payment
Above 75% 5 Years 30 Years 10%
From 50 - 75% 5 Years 28 Years 10%
From 25 - 49% 4 Years 25 Years 10%
For the purpose of this project profile, the average i.e. five years grace period, 28 years payment
completion period and 10% down payment is used. The land lease period for industry is 60
years.
Accordingly, the total land lease cost at a rate of Birr 266 per m2 is estimated at Birr 266,000 of
which 10% or Birr 26,600 will be paid in advance. The remaining Birr 239,400 will be paid in
equal installments with in 28 years i.e. Birr 8,550 annually.
VI. HUMAN RESORCE AND TRAINING REQUIREMENTS
A. HUMAN RESORCE REQUIREMENT
Total human resource requirement, including skilled and unskilled labor is 23 persons.
Correspondingly total annual labor cost is estimated at Birr 302,400. Table 6.1 below shows the
list of human resource required and the estimated annual labor costs.

104-13
Table 6.1
HUMAN RESORCE REQUIREMENT & LABOR COST(BIRR)
Sr.
No.
Job Position
Req.
No.
Salary Per
Month
Salary Per
Year
1 Manager 1 3,000 36,000
2 Admin. and finance head 1 2,400 28,800
3 Prod. & technique head 1 2,400 28,800
4 Marketing head 1 2,400 28,800
5 Supervisor 2 2,000 24,000
6 General service head 1 1,500 18,000
7 Secretary 1 1,050 12,600
8 Personnel clerk 1 1,050 12,600
9 Sales man 2 2,000 24,000
10 Production operators 3 1800 21,600
11 Drying section operators 2 1,200 14,400
12 Finishing section operators 3 1,800 21,600
13 Security guards 3 1,800 21,600
14 Driver 1 800 9,600
Total 23 25,200 302,400
B. TRAINING REQUIREMENT
All operators need basic training so that they can be acquainted to the operation. This can be
done during the commissioning period of the plant. Such training is estimated to cost about Birr
125,000.
VII. FINANCIAL ANALYSIS
The financial analysis of the gypsum board project is based on the data presented in the previous
chapters and the following assumptions:-

104-14
Construction period 1 year
Source of finance 30 % equity & 70% loan
Tax holidays 3 years
Bank interest 10%
Discount cash flow 10%
Accounts receivable 30 days
Raw material local 30 days
Work in progress 1 day
Finished products 30 days
Cash in hand 5 days
Accounts payable 30 days
Repair and maintenance 5% of machinery cost
A. TOTAL INITIAL INVESTMENT COST
The total investment cost of the project including working capital is estimated at Birr 18.56
million (see Table 7.1). From the total investment cost, the highest share (Birr 11.33 million or
61.03%) is accounted by fixed investment cost initial followed by working capital ( Birr 5.36
million or 28.88%) and pre operation cost (Birr 1.87 million or 10.09%). From the total
investment cost, Birr 3.21 million or 17.31% is required in foreign currency.

104-15
Table 7.1
INITIAL INVESTMENT COST ( ‘000 Birr)
Sr.
No Cost Items
Local
Cost
Foreign
Cost
Total
Cost
%
Share
1 Fixed investment
1.1 Land Lease 26.60 26.60 0.14
1.2 Building and civil work 3,000.00 3,000.00 16.16
1.3 Machinery and equipment 3,738.45 3,213.00 6,951.45 37.45
1.4 Vehicles 900.00 900.00 4.85
1.5 Office furniture and equipment 450.00 450.00 2.42
Sub total 8,115.05 3,213.00 11,328.05 61.03
2 Pre operating cost *
2.1 Pre operating cost 658.54 658.54 3.55
2.2 Interest during construction 1,214.27 1,214.27 6.54
Sub total 1,872.81 1,872.81 10.09
3 Working capital ** 5,360.06 5,360.06 28.88
Grand Total 15,347.92 3,213.00 18,560.92 100
* N.B Pre operating cost include project implementation cost such as installation, startup,
commissioning, project engineering, project management etc and capitalized interest during
construction.
** The total working capital required at full capacity operation is Birr 7.68 million. However,
only the initial working capital of Birr 5.36 million during the first year of production is
assumed to be funded through external sources. During the remaining years the working
capital requirement will be financed by funds to be generated internally (for detail working
capital requirement see Appendix 7.A.1).
B. PRODUCTION COST
The annual production cost at full operation capacity is estimated at Birr 37.06 million (see Table
7.2). The cost of raw material account for 52.19% of the production cost. The other major
components of the production cost are utility, depreciation, financial cost, and labor, which
account for 36.01%, 5.04%, 3.15, and 0.81%, respectively. The remaining 2.80% is the share of
repair and maintenance, labor overhead and administration cost. For detail production cost see
Appendix 7.A.2.

104-16
Table 7.2
ANNUAL PRODUCTION COST AT FULL CAPACITY (YEAR THREE)
Items Cost
(in 000
Birr)
%
Raw Material and Inputs 19,341 52.19
Utilities 13,343 36.01
Maintenance and repair 209 0.56
Labor direct 302 0.81
Labor overheads 76 0.21
Administration Costs 250 0.67
Land lease cost 0 0.00
Cost of marketing and distribution 500 1.35
Total Operating Costs 34,021 91.81
Depreciation 1,867 5.04
Cost of Finance 1,169 3.15
Total Production Cost 37,057 100.00
C. FINANCIAL EVALUATION
1. Profitability
Based on the projected profit and loss statement, the project will generate a profit throughout its
operation life. Annual net profit after tax will grow from Birr 3.58 million to Birr 5.46 million
during the life of the project. Moreover, at the end of the project life the accumulated net cash
flow amounts to Birr 54.41 million. For profit and loss statement and cash flow projection see
Appendix 7.A.3 and 7.A.4, respectively.

104-17
2. Ratios
In financial analysis, financial ratios and efficiency ratios are used as an index or yardstick for
evaluating the financial position of a firm. It is also an indicator for the strength and weakness of
the firm or a project. Using the year-end balance sheet figures and other relevant data, the most
important ratios such as return on sales which is computed by dividing net income by revenue,
return on assets (operating income divided by assets), return on equity (net profit divided by
equity) and return on total investment (net profit plus interest divided by total investment) has
been carried out over the period of the project life and all the results are found to be satisfactory.
3. Break-even Analysis
The break-even analysis establishes a relationship between operation costs and revenues. It
indicates the level at which costs and revenue are in equilibrium. To this end, the break-even
point for capacity utilization and sales value estimated by using income statement projection are
computed as followed.
Break- Even Sales Value = Fixed Cost + Financial Cost = 17,640,000 Birr
Variable Margin ratio (%)
Break -Even Capacity utilization = Break- even Sales Value X 100 = 27.92 %
Sales revenue
4. Pay-back Period
The pay- back period, also called pay – off period is defined as the period required for recovering
the original investment outlay through the accumulated net cash flows earned by the project.
Accordingly, based on the projected cash flow it is estimated that the project’s initial investment
will be fully recovered within 2 years.
104-18
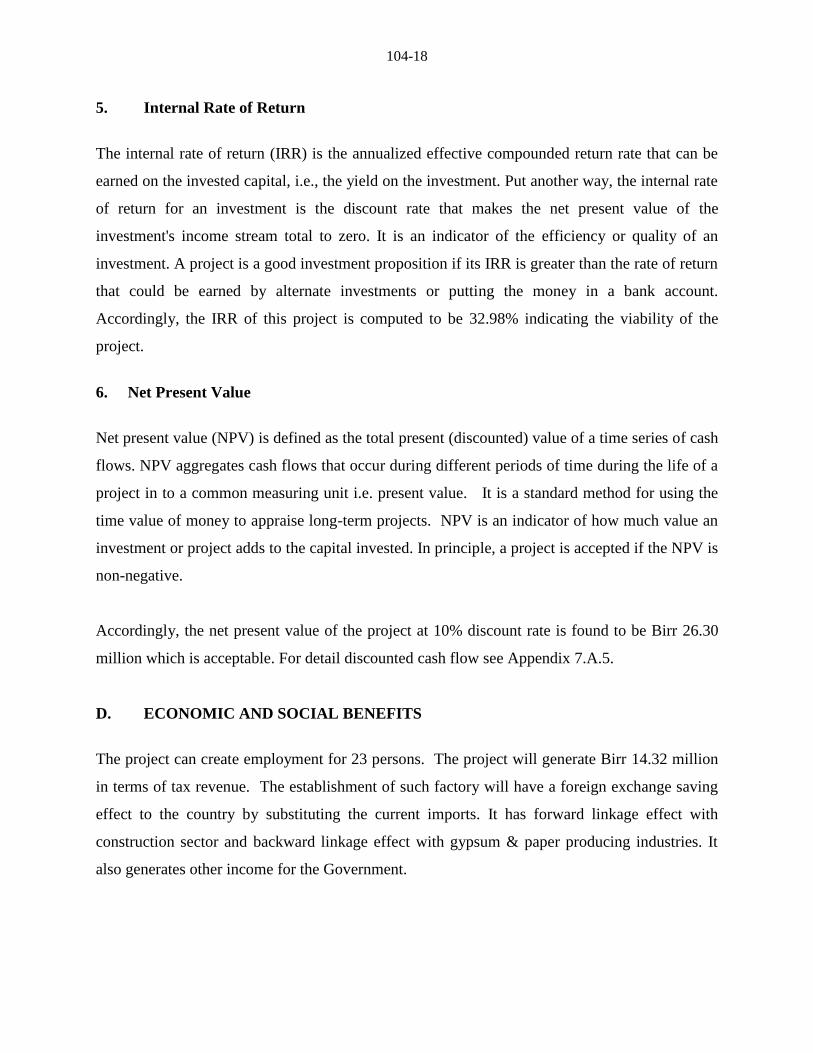
5. Internal Rate of Return
The internal rate of return (IRR) is the annualized effective compounded return rate that can be
earned on the invested capital, i.e., the yield on the investment. Put another way, the internal rate
of return for an investment is the discount rate that makes the net present value of the
investment's income stream total to zero. It is an indicator of the efficiency or quality of an
investment. A project is a good investment proposition if its IRR is greater than the rate of return
that could be earned by alternate investments or putting the money in a bank account.
Accordingly, the IRR of this project is computed to be 32.98% indicating the viability of the
project.
6. Net Present Value
Net present value (NPV) is defined as the total present (discounted) value of a time series of cash
flows. NPV aggregates cash flows that occur during different periods of time during the life of a
project in to a common measuring unit i.e. present value. It is a standard method for using the
time value of money to appraise long-term projects. NPV is an indicator of how much value an
investment or project adds to the capital invested. In principle, a project is accepted if the NPV is
non-negative.
Accordingly, the net present value of the project at 10% discount rate is found to be Birr 26.30
million which is acceptable. For detail discounted cash flow see Appendix 7.A.5.
D. ECONOMIC AND SOCIAL BENEFITS
The project can create employment for 23 persons. The project will generate Birr 14.32 million
in terms of tax revenue. The establishment of such factory will have a foreign exchange saving
effect to the country by substituting the current imports. It has forward linkage effect with
construction sector and backward linkage effect with gypsum & paper producing industries. It
also generates other income for the Government.
104-19
Appendix 7.A
FINANCIAL ANALYSES SUPPORTING TABLES
104-20
Appendix 7.A.1
NET WORKING CAPITAL ( in 000 Birr)
Items Year 2 Year 3 Year 4 Year 5 Year 6 Year 7 Year 8 Year 9 Year 10 Year 11
Total inventory 3,384.68 3,868.20 4,835.25 4,835.25 4,835.25 4,835.25 4,835.25 4,835.25 4,835.25 4,835.25
Accounts receivable 1,997.06 2,276.40 2,835.08 2,835.08 2,835.80 2,835.80 2,835.80 2,835.80 2,835.80 2,835.80
Cash-in-hand 8.14 9.30 11.63 11.63 11.74 11.74 11.74 11.74 11.74 11.74
CURRENT ASSETS 5,389.87 6,153.90 7,681.96 7,681.96 7,682.79 7,682.79 7,682.79 7,682.79 7,682.79 7,682.79
Accounts payable 29.81 34.07 42.58 42.58 42.58 42.58 42.58 42.58 42.58 42.58
CURRENT
LIABILITIES 29.81 34.07 42.58 42.58 42.58 42.58 42.58 42.58 42.58 42.58
TOTAL WORKING
CAPITAL 5,360.06 6,119.83 7,639.38 7,639.38 7,640.21 7,640.21 7,640.21 7,640.21 7,640.21 7,640.21

104-21
Appendix 7.A.2
PRODUCTION COST ( in 000 Birr)
Item Year 2 Year 3 Year 4 Year 5 Year 6 Year 7 Year 8 Year 9 Year 10 Year 11
Raw Material and Inputs 13,539 15,473 19,341 19,341 19,341 19,341 19,341 19,341 19,341 19,341
Utilities 9,340 10,674 13,343 13,343 13,343 13,343 13,343 13,343 13,343 13,343
Maintenance and repair 146 167 209 209 209 209 209 209 209 209
Labour direct 211 242 302 302 302 302 302 302 302 302
Labour overheads 53 61 76 76 76 76 76 76 76 76
Administration Costs 175 200 250 250 250 250 250 250 250 250
Land lease cost 0 0 0 0 9 9 9 9 9 9
Cost of marketing
and distribution 500 500 500 500 500 500 500 500 500 500
Total Operating Costs 23,965 27,317 34,021 34,021 34,030 34,030 34,030 34,030 34,030 34,030
Depreciation 1,867 1,867 1,867 1,867 1,867 165 165 165 165 165
Cost of Finance 0 1,336 1,169 1,002 835 668 501 334 167 0
Total Production Cost 25,832 30,519 37,057 36,890 36,731 34,862 34,695 34,528 34,362 34,195
104-22
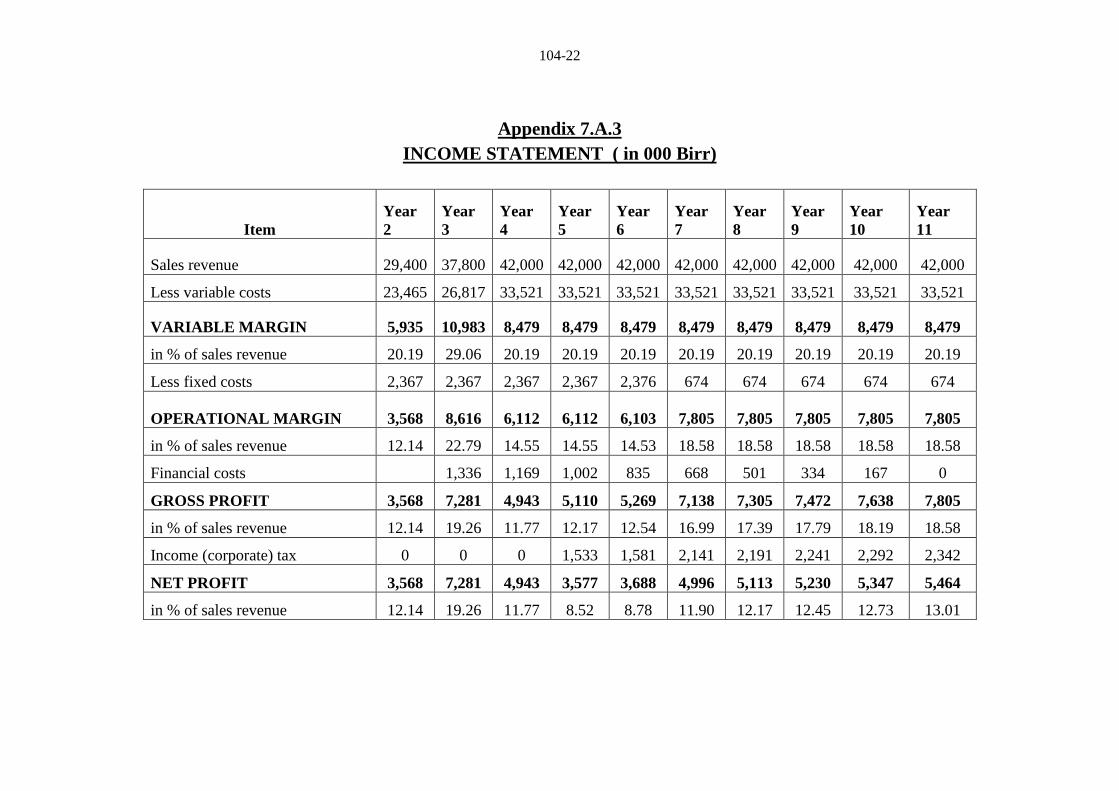
Appendix 7.A.3
INCOME STATEMENT ( in 000 Birr)
Item
Year
2
Year
3
Year
4
Year
5
Year
6
Year
7
Year
8
Year
9
Year
10
Year
11
Sales revenue 29,400 37,800 42,000 42,000 42,000 42,000 42,000 42,000 42,000 42,000
Less variable costs 23,465 26,817 33,521 33,521 33,521 33,521 33,521 33,521 33,521 33,521
VARIABLE MARGIN 5,935 10,983 8,479 8,479 8,479 8,479 8,479 8,479 8,479 8,479
in % of sales revenue 20.19 29.06 20.19 20.19 20.19 20.19 20.19 20.19 20.19 20.19
Less fixed costs 2,367 2,367 2,367 2,367 2,376 674 674 674 674 674
OPERATIONAL MARGIN 3,568 8,616 6,112 6,112 6,103 7,805 7,805 7,805 7,805 7,805
in % of sales revenue 12.14 22.79 14.55 14.55 14.53 18.58 18.58 18.58 18.58 18.58
Financial costs 1,336 1,169 1,002 835 668 501 334 167 0
GROSS PROFIT 3,568 7,281 4,943 5,110 5,269 7,138 7,305 7,472 7,638 7,805
in % of sales revenue 12.14 19.26 11.77 12.17 12.54 16.99 17.39 17.79 18.19 18.58
Income (corporate) tax 0 0 0 1,533 1,581 2,141 2,191 2,241 2,292 2,342
NET PROFIT 3,568 7,281 4,943 3,577 3,688 4,996 5,113 5,230 5,347 5,464
in % of sales revenue 12.14 19.26 11.77 8.52 8.78 11.90 12.17 12.45 12.73 13.01

104-23
Appendix 7.A.4
CASH FLOW FOR FINANCIAL MANAGEMENT ( in 000 Birr)
Item Year 1 Year 2 Year 3 Year 4 Year 5 Year 6 Year 7 Year 8 Year 9 Year 10 Year 11 Scrap
TOTAL CASH INFLOW 11,987 36,004 37,804 42,009 42,000 42,000 42,000 42,000 42,000 42,000 42,000 10,681
Inflow funds 11,987 6,604 4 9 0 0 0 0 0 0 0 0
Inflow operation 0 29,400 37,800 42,000 42,000 42,000 42,000 42,000 42,000 42,000 42,000 0
Other income 0 0 0 0 0 0 0 0 0 0 0 10,681
TOTAL CASH
OUTFLOW 11,987 30,569 31,086 38,387 38,225 38,115 38,508 38,391 38,275 38,158 36,371 0
Increase in fixed assets 11,987 0 0 0 0 0 0 0 0 0 0 0
Increase in current assets 0 5,390 764 1,528 0 1 0 0 0 0 0 0
Operating costs 0 23,465 26,817 33,521 33,521 33,530 33,530 33,530 33,530 33,530 33,530 0
Marketing and
Distribution cost 0 500 500 500 500 500 500 500 500 500 500 0
Income tax 0 0 0 0 1,533 1,581 2,141 2,191 2,241 2,292 2,342 0
Financial costs 0 1,214 1,336 1,169 1,002 835 668 501 334 167 0 0
Loan repayment 0 0 1,670 1,670 1,670 1,670 1,670 1,670 1,670 1,670 0 0
SURPLUS (DEFICIT) 0 5,435 6,718 3,621 3,775 3,885 3,492 3,609 3,725 3,842 5,629 10,681
CUMULATIVE CASH
BALANCE 0 5,435 12,153 15,775 19,549 23,434 26,925 30,534 34,259 38,102 43,731 54,412

104-24
Appendix 7.A.5
DISCOUNTED CASH FLOW ( in 000 Birr)
Item Year 1
Year
2 Year 3
Year
4 Year 5
Year
6 Year 7
Year
8 Year 9
Year
10 Year 11 Scrap
TOTAL CASH INFLOW 0 29,400 37,800 42,000 42,000 42,000 42,000 42,000 42,000 42,000 42,000 10,681
Inflow operation 0 29,400 37,800 42,000 42,000 42,000 42,000 42,000 42,000 42,000 42,000 0
Other income 0 0 0 0 0 0 0 0 0 0 0 10,681
TOTAL CASH OUTFLOW 17,347 24,724 28,836 34,021 35,555 35,610 36,171 36,221 36,271 36,321 36,371 0
Increase in fixed assets 11,987 0 0 0 0 0 0 0 0 0 0 0
Increase in net working capital 5,360 760 1,520 0 1 0 0 0 0 0 0 0
Operating costs 0 23,465 26,817 33,521 33,521 33,530 33,530 33,530 33,530 33,530 33,530 0
Marketing and Distribution cost 0 500 500 500 500 500 500 500 500 500 500 0
Income (corporate) tax 0 0 0 1,533 1,581 2,141 2,191 2,241 2,292 2,342 0
NET CASH FLOW -17,347 4,676 8,964 7,979 6,445 6,390 5,829 5,779 5,729 5,679 5,629 10,681
CUMULATIVE NET CASH FLOW -17,347
-
12,671 -3,707 4,272 10,717 17,106 22,936 28,715 34,444 40,123 45,751 56,433
Net present value -17,347 4,250 7,408 5,995 4,402 3,968 3,290 2,966 2,673 2,408 2,170 4,118
Cumulative net present value -17,347
-
13,096 -5,688 307 4,709 8,676 11,967 14,932 17,605 20,013 22,183 26,301
NET PRESENT VALUE 26,301
INTERNAL RATE OF RETURN 32.98%
NORMAL PAYBACK 2 years