profile on plywood - precise consult...
TRANSCRIPT
116. PROFILE ON THE PRODUCTION OF CHIP
BOARD
116-1
TABLE OF CONTENTS
PAGE
I. SUMMARY 116-2
II. PRODUCT DESCRIPTION & APPLICATION 116-2
III. MARKET STUDY AND PLANT CAPACITY 116-3
A. MARKET STUDY 116-3
B. PLANT CAPACITY & PRODUCTION PROGRAM 116-7
IV. MATERIALS AND INPUTS 116-8
A. RAW & AUXILIARY MATERIALS 116-8
B. UTILITIES 116-8
V. TECHNOLOGY & ENGINEERING 116-9
A. TECHNOLOGY 116-9
B. ENGINEERING 116-9
VI. HUMAN RESOURCE & TRAINING REQUIREMENT 116-13
A. HUMAN RESOURCE REQUIREMENT 116-13
B. TRAINING REQUIREMENT 116-14
VII. FINANCIAL ANLYSIS 116-14
A. TOTAL INITIAL INVESTMENT COST 116-15
B. PRODUCTION COST 116-16
C. FINANCIAL EVALUATION 116-17
D. ECONOMIC AND SOCIAL BENEFITS 116-18
116-2
I. SUMMARY
This profile envisages the establishment of a plant for the production of chipboard with a
capacity of 187,200.00 m3 per annum. Chipboard is used in the construction industry as
prefabricated houses or as ceiling materials in monolithic structure and in the furniture and wood
industries as a substitute for wooden boards.
The demand for chipboard is met both from import and domestic production. The present (2012)
demand for chipboard is estimated at 2.33 million cubic meters. The demand for chipboard is
projected to reach 3,752 million cubic meters and 6,043 million cubic meters by the year 2017
and 2022, respectively.
The principal raw materials required by the envisaged plant are eucalyptus tree logs and glue
which are locally available.
The total investment cost of the project including working capital is estimated at Birr 72.23
million. From the total investment cost the highest share (Birr 47.94 million or 66.37%) is
accounted by initial working capital followed by fixed investment cost (Birr 18.46 million or
25.56%) and pre operation cost (Birr 5.82 million or 8.06%). From the total investment cost Birr
12 million or 16.61% is required in foreign currency.
The project is financially viable with an internal rate of return (IRR) of 34.64% and a net present
value (NPV) of Birr 116.69 million discounted at 10%.
The project can create employment for 41 persons. The establishment of such factory will have a
foreign exchange saving effect to the country by substituting the current imports. The project
will also create forward linkage with the furniture and construction sub sectors and also
generates income for the Government in terms of tax revenue and payroll tax.
II. PRODUCT DESCRIPTION AND APPLICATION
Chip board/ wood are produced by gluing wood particles. It is used in the construction industry
as prefabricated houses or as ceiling materials in monolithic structure. Chip wood is also used in
the furniture and wood industries where it is used as a substitute for wooden boards.

116-3
The major end user of chip wood is the building construction sector. Thus the demand for chip
wood is related to the expansion and growth of the building construction sector. The current
demand for chipboard is met through local production and import.
Chip wood is produced in standard sizes of 1.2 meters by 2 meters. The thickness range is 8mm,
12mm, 13mm, 15mm, 17mm, and 20mm.
The project is resource based. Moreover, at present the country import a significant quantity of
the products. Therefore, the project is both resource based and aimed at import substitution.
III. MARKET STUDY AND PLANT CAPACITY
A. MARKET STDY
1. Past Supply and Present Demand
Chip board/wood is mainly used in the housing construction industry as a prefabricated house or
as a ceiling material and in the furniture industrial group as a substitute for wooden boards.
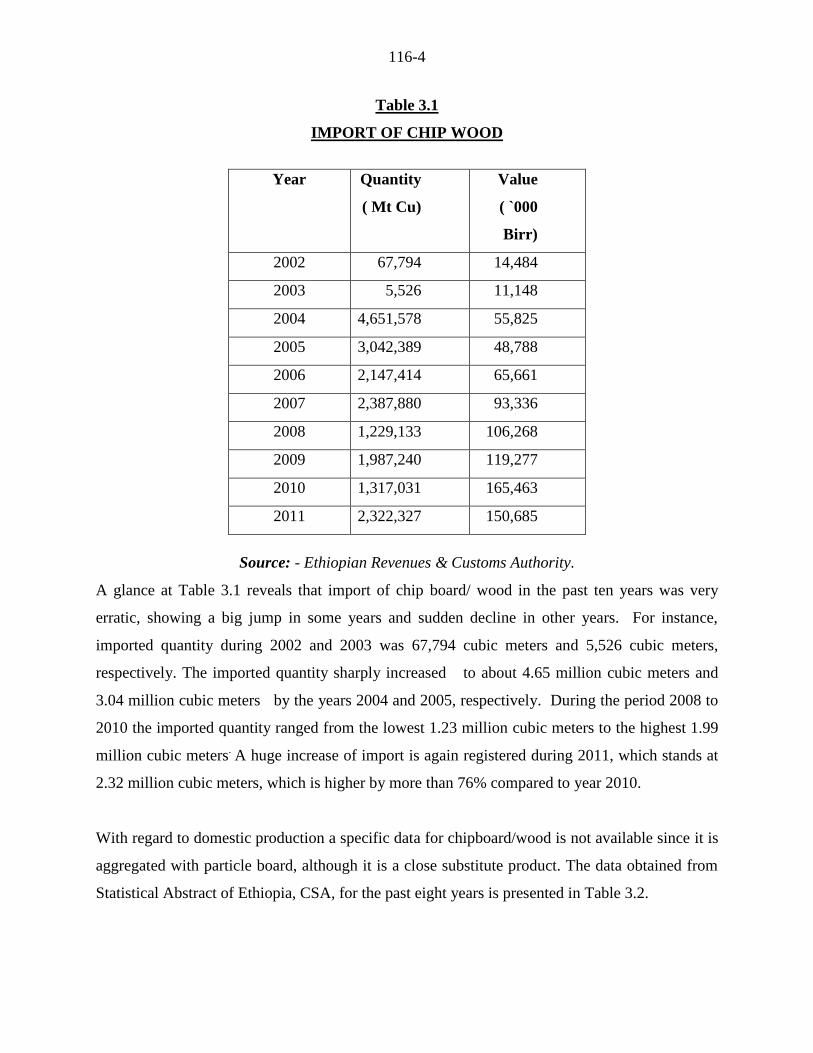
The country`s requirement of chip wood is met both from import and domestic production. The
External Trade Statistics of the Ethiopian Revenues & Customs Authority reveals that Ethiopia
imports chip wood categorized in to three types. These are coniferous wood sawn or chipped >
6mm thick, beech wood and oak wood (quercus spp) sawn /chipped length wise > 6 mm thick
and wood n.e.s sawn or chipped > 6 mm thick. The total quantity of the three types of chipped
woods (excluding particle board) imported to the country in the past 10 years is given in Table
3.1.
116-4
Table 3.1
IMPORT OF CHIP WOOD
Year Quantity
( Mt Cu)
Value
( `000
Birr)
2002 67,794 14,484
2003 5,526 11,148
2004 4,651,578 55,825
2005 3,042,389 48,788
2006 2,147,414 65,661
2007 2,387,880 93,336
2008 1,229,133 106,268
2009 1,987,240 119,277
2010 1,317,031 165,463
2011 2,322,327 150,685
Source: - Ethiopian Revenues & Customs Authority.
A glance at Table 3.1 reveals that import of chip board/ wood in the past ten years was very
erratic, showing a big jump in some years and sudden decline in other years. For instance,
imported quantity during 2002 and 2003 was 67,794 cubic meters and 5,526 cubic meters,
respectively. The imported quantity sharply increased to about 4.65 million cubic meters and
3.04 million cubic meters by the years 2004 and 2005, respectively. During the period 2008 to
2010 the imported quantity ranged from the lowest 1.23 million cubic meters to the highest 1.99
million cubic meters. A huge increase of import is again registered during 2011, which stands at
2.32 million cubic meters, which is higher by more than 76% compared to year 2010.
With regard to domestic production a specific data for chipboard/wood is not available since it is
aggregated with particle board, although it is a close substitute product. The data obtained from
Statistical Abstract of Ethiopia, CSA, for the past eight years is presented in Table 3.2.

116-5
Table 3.2
DOMESTIC PRODUCTION OF CHIP WOOD & PARTICLE BOARD (CU.MT)
Year Quantity
2003 2,231
2004 7,950
2005 1,300
2006 2,079
2007 6,925
2008 7,266
2009 129,630
2010 556,704
Source:-Various issues of the Statistical Abstract of Ethiopia, CSA.
Domestic production of chip board/wood and particle board in the past eight years was
fluctuating highly in the past eight years as shown in Table 3.2. During the initial six years of the
data set, i.e. 2003--2008, the production level ranged from the lowest 1,300 cubic meters (year
2005) to the highest 7,950 cubic meters in year 2004, with a mean figure of 4,625 cubic meters.
The production level has tremendously increased to 129,630 cubic meters and 556,704 cubic
meters by the year 2009 and 2010, respectively. According to information obtained from
knowledgeable people in the sub-sector the exceptional increase observed in the last two years of
the data set is due to the establishment and start of operation of a new particle board plant at
Maichew, Tigray regional state. Hence, it can be concluded that the volume of chip board/wood
that is supplied from the domestic source is estimated to be near to the amount that was produced
in 2008, which is 8 thousand cubic meters.
Therefore, the present demand is estimated by adding only the domestic production of chipboard
(excluding particle board) and the imported quantity in year 2011. Accordingly, present demand
for the product is set at 2.33 million cubic meters, which is reasonable compared to the past eight
year’s average.

116-6
2. Projected Demand
Demand for chipboard/ wood is influenced by the growth of the building construction industry
and manufacturing sector mainly the furniture industrial group. The industrial sector (which
includes manufacturing and construction) has been growing by about 10% in the recent past
years. During the GTP period the industrial sector is forecasted to grow at annual average growth
rate of 20%. To be conservative, at a minimum, the demand for chipboard/ wood is assumed to
grow by 10%. The total projected demand and the unsatisfied demand that has to be fulfilled
through the establishment of new plants is shown in Table 3.3.
Table 3.3
PROJECTED DEMAND FOR CHIPBOARD/ WOOD (`000 CU.MT)
Year Total
Demand
Domestic
Production
Unsatisfied
Demand
2013 2,563 8 2,555
2014 2,819 8 2,811
2015 3,101 8 3,093
2016 3,411 8 3,403
2017 3,752 8 3,744
2018 4,127 8 4,119
2019 4,540 8 4,532
2020 4,994 8 4,986
2021 5,494 8 5,486
2022 6,043 8 6,035
The unsatisfied demand for chip wood will increase from 2,555 thousand cubic meters by the
year 2013 to 3,744 thousand and 16,250 thousand cubic meters by the year 2,018 and 2,022,
respectively.
3. Pricing and Distribution
The current factory gate price of chip wood in Addis Ababa which is 1,275 per mt.cu is adopted
for sales revenue projection.

116-7
The product can be sold directly to the end users i.e. building construction enterprise and
furniture industrial group.
B. PLANT CAPACITY AND PRODUCTION PROGRAM
1. Plant Capacity
According to the market study, unsatisfied demand of chip board/wood in the year 2018 will be
3,744,000 m3, whereas this demand will grow to 16,250,000 m
3 by the year 2022. Taking only
about 5% of the demand of the year 2018, the proposed plant will have a capacity of 187,200.00
m3 per annum. The size of chip wood to be manufactured is 1.2 mt x2mtx12 mm. Its demand is
ever on the increase. However, additional market requirement can be met by running the
production unit on a second or third shift or through the establishment of other similar plants.
2. Production Program
The unit is planned to operate one shift of 8 hours a day for a total working of 300 days a year by
taking Sundays and national holidays into considerations.
It is also anticipated to operate at 75% and 85% of installed capacity in the first and second year,
respectively. Full capacity production is expected to be achieved in the successive years. The
low production level at the initial stage is planned to develop substantial market outlets for the
product and to build up production capacity of new equipment (see Table 3.4).
Table 3.4
ANNUAL PRODUCTION PROGRAM
Description
Production Year
1 2 3
Capacity utilization rate (%) 75 85 100
Chip board (m3) 140,400 159,120 187,200

116-8
IV. MATERIAL AND INPUTS
A. RAW AND AUXILIARY MATERIALS
Eucalyptus tree Logs, which are suitable for chip wood, and glue are the main materials used to
produce chip wood. The annual raw material requirement is calculated on the bases of the final
output. Thus, the total cost of material at full operation capacity of the plant is estimated to be
Birr 204,300,000. The detail breakdown is shown in Table 4.1.
Table 4.1
ANNUAL RAW AND AUXILIARY MATERIALS REQUIREMENT AND COST
No
.
Description Qty Unit Unit Cost Cost (`000 Birr)
( Birr) LC FC Total
1 Red Eucalyptus tree Logs 60,000 m3 3,200.00 192,000 - 192,000
2 Glue 180 ton 66,666.67 12,000 - 12,000
3 Miscellaneous set - 300,000.00 300 - 300
Total Raw Material Annual Cost 204,300
B. UTILITIES
The major utilities of the project are electricity, furnace oil and water. The total annual
expenditure on utilities is, thus, about Birr 3,349,350.00. Annual requirement and cost of utilities
is indicated in Table 4.2.
Table 4.2
UTILITIES REQUIREMENT AND COST
Sr.
No. Description
Annual
Consumption Unit
Unit
Cost
( Birr)
Total Cost
( "000 ) Birr
1 Electricity 310,000 kWh 0.58 179.80
2 Furnace oil 160,000 lt 14.50 2320.00
3 Water 85,000 m3 10.00 850.00
Total Annual Cost 3,349.80

116-9
V. TECHNOLOGY AND ENGINEERING
A. TECHNOLOGY
1. Process Description
The manufacturing of chipboard/ wood requires intermediate technology. It involves chopping
eucalyptus logs to standard sizes. Then, they are grounded by the wood-grinding machine and
reduced to woodchips. Then, the chip is mixed with glue and water. Next, it is fed to the
forming machine where the thickness, length and width of the board are set and is then formed. It
is fed to the hydraulic press. The product is dried in the press using steam. Finally, it is
polished, inspected and then made ready for delivery.
2. Environmental impact
The process has some dusty effect on the workers, and needs proper exhaust system for it.
Therefore, for this environmental protection equipment an estimated amount of Birr 100,000 is
allocated.
B. ENGINEERING
1. Machinery and Equipment
The total cost of machinery and equipment is estimated at Birr 15 million, of which Birr 12
million is required in foreign currency. Table 5.1 shows the list of machinery and equipment
required by the envisaged plant.

116-10
Table 5.1
LIST OF MACHINERY AND EQUIPMENT
Sr. No. Description Qty.
1 Chopping machine 1
2 Grinding machine 1
3 Gluing machine 1
4 Forming machine 1
5 Pressing machine 1
6 Conveyor system 1
7 Polishing machine 1
8 Drying press 1
9 Boiler with its
accessories
1
2. Land, Building and Civil Works
The plant requires a total of 2,500 m2 area of land out of which 1,600 m
2 is built-up area which
includes Processing area, raw material stock area, offices etc. Assuming construction rate of Birr
5,000 per m2 the total investment cost for building and civil works is estimated at Birr 8 million.
According to the Federal Legislation on the Lease Holding of Urban Land (Proclamation No
272/2002) in principle, urban land permit by lease is on auction or negotiation basis, however,
the time and condition of applying the proclamation shall be determined by the concerned
regional or city government depending on the level of development.
The legislation has also set the maximum on lease period and the payment of lease prices. The
lease period ranges from 99 years for education, cultural research health, sport, NGO , religious
and residential area to 80 years for industry and 70 years for trade while the lease payment
period ranges from 10 years to 60 years based on the towns grade and type of investment.
116-11
Moreover, advance payment of lease based on the type of investment ranges from 5% to
10%.The lease price is payable after the grace period annually. For those that pay the entire
amount of the lease will receive 0.5% discount from the total lease value and those that pay in
installments will be charged interest based on the prevailing interest rate of banks. Moreover,
based on the type of investment, two to seven years grace period shall also be provided.
However, the Federal Legislation on the Lease Holding of Urban Land apart from setting the
maximum has conferred on regional and city governments the power to issue regulations on the
exact terms based on the development level of each region.
In Addis Ababa the City’s Land Administration and Development Authority is directly
responsible in dealing with matters concerning land. However, regarding the manufacturing
sector, industrial zone preparation is one of the strategic intervention measures adopted by the
City Administration for the promotion of the sector and all manufacturing projects are assumed
to be located in the developed industrial zones.
Regarding land allocation of industrial zones if the land requirement of the project is below
5,000 m2,
the land lease request is evaluated and decided upon by the Industrial Zone
Development and Coordination Committee of the City’s Investment Authority. However, if the
land request is above 5,000 m2 the request is evaluated by the City’s Investment Authority and
passed with recommendation to the Land Development and Administration Authority for
decision, while the lease price is the same for both cases.
Moreover, the Addis Ababa City Administration has recently adopted a new land lease floor
price for plots in the city. The new prices will be used as a benchmark for plots that are going to
be auctioned by the city government or transferred under the new “Urban Lands Lease Holding
Proclamation.”
The new regulation classified the city into three zones. The first Zone is Central Market District
Zone, which is classified in five levels and the floor land lease price ranges from Birr 1,686 to
Birr 894 per m2. The rate for Central Market District Zone will be applicable in most areas of the
city that are considered to be main business areas that entertain high level of business activities.

116-12
The second zone, Transitional Zone, will also have five levels and the floor land lease price
ranges from Birr 1,035 to Birr 555 per m2 .This zone includes places that are surrounding the city
and are occupied by mainly residential units and industries.
The last and the third zone, Expansion Zone, is classified into four levels and covers areas that
are considered to be in the outskirts of the city, where the city is expected to expand in the future.
The floor land lease price in the Expansion Zone ranges from Birr 355 to Birr 191 per m2
(see
Table 5.2).
Table 5.2
NEW LAND LEASE FLOOR PRICE FOR PLOTS IN ADDIS ABABA
Zone Level
Floor
Price/m2
Central Market
District
1st 1686
2nd
1535
3rd
1323
4th
1085
5th
894
Transitional zone
1st 1035
2nd
935
3rd
809
4th
685
5th
555
Expansion zone
1st 355
2nd
299
3rd
217
4th
191
Accordingly, in order to estimate the land lease cost of the project profiles it is assumed that all
new manufacturing projects will be located in industrial zones located in expansion zones.
Therefore, for the profile a land lease rate of Birr 266 per m2
which is equivalent to the average
floor price of plots located in expansion zone is adopted.
116-13
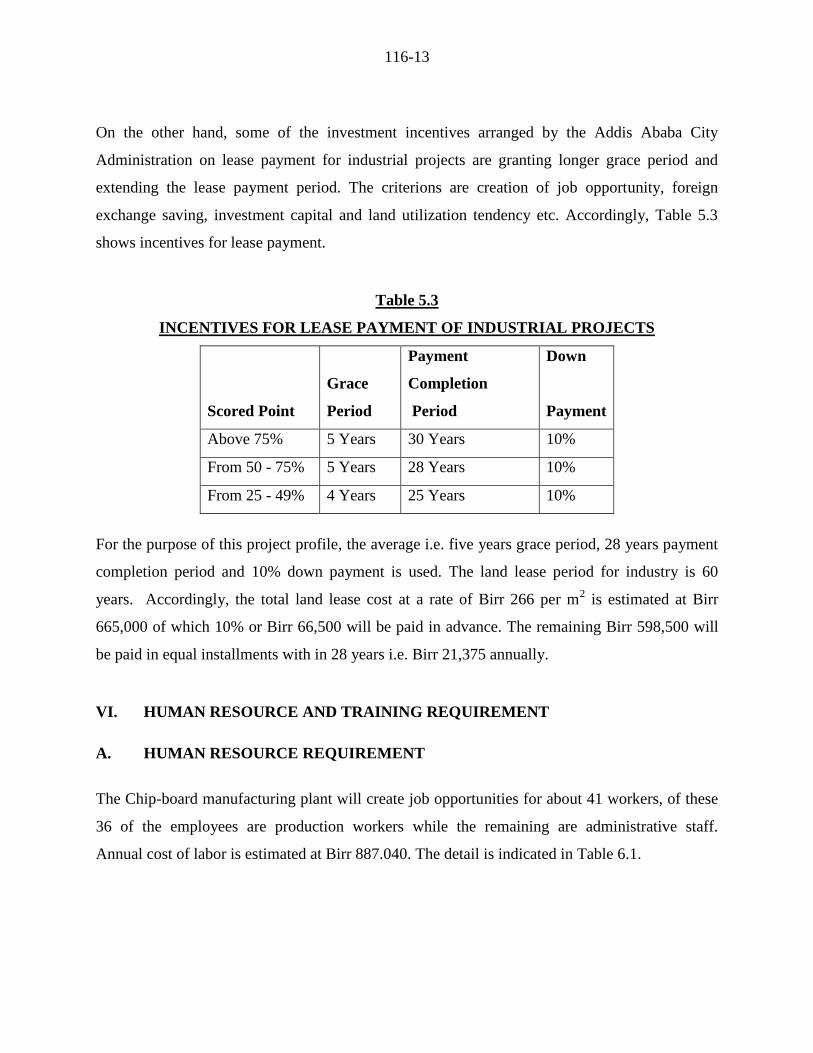
On the other hand, some of the investment incentives arranged by the Addis Ababa City
Administration on lease payment for industrial projects are granting longer grace period and
extending the lease payment period. The criterions are creation of job opportunity, foreign
exchange saving, investment capital and land utilization tendency etc. Accordingly, Table 5.3
shows incentives for lease payment.
Table 5.3
INCENTIVES FOR LEASE PAYMENT OF INDUSTRIAL PROJECTS
Scored Point
Grace
Period
Payment
Completion
Period
Down
Payment
Above 75% 5 Years 30 Years 10%
From 50 - 75% 5 Years 28 Years 10%
From 25 - 49% 4 Years 25 Years 10%
For the purpose of this project profile, the average i.e. five years grace period, 28 years payment
completion period and 10% down payment is used. The land lease period for industry is 60
years. Accordingly, the total land lease cost at a rate of Birr 266 per m2 is estimated at Birr
665,000 of which 10% or Birr 66,500 will be paid in advance. The remaining Birr 598,500 will
be paid in equal installments with in 28 years i.e. Birr 21,375 annually.
VI. HUMAN RESOURCE AND TRAINING REQUIREMENT
A. HUMAN RESOURCE REQUIREMENT
The Chip-board manufacturing plant will create job opportunities for about 41 workers, of these
36 of the employees are production workers while the remaining are administrative staff.
Annual cost of labor is estimated at Birr 887.040. The detail is indicated in Table 6.1.

116-14
Table 6.1
HUMAN RESOURCE REQUIREMENT AND LABOR COST (BIRR)
No. Description No.
Monthly Salary
( Birr)
Annual salary
( "000 ) Birr
1 Plant manager 1 6,000.00 72.0
2 Secretary 1 1,500.00 18.0
3 Administration and finance 1 3,500.00 42.0
4 Accountant 1 2,000.00 24.0
5 Mechanic 1 2,200.00 26.4
6 Electrician 1 2,200.00 26.4
7 Operators and skilled workers 20 1,400.00 336.0
8 production foreman 1 3,000.00 36.0
11 Clerk 1 800.00 9.6
12 Cashier 1 1,000.00 12.0
13 Assistant operator 5 700.00 42.0
14 Quality supervisor 2 1,600.00 38.4
15 store keeper 1 1,400.00 16.8
16 time keeper 1 1,200.00 14.4
17 Guards 3 700.00 25.2
Total 41 29,200.00 739.2
18
Employment benefits and
allowances 20% 5,840.00 147.8
Total Annual Labor Cost (Direct +Indirect) 887.0
B. TRAINING REQUIREMENT
Imparting skill both on the supervisor and the operators who will be directly involved in the
plywood production is an essential task. Thus, on-job-training by the machinery supplier for
about two weeks should be given locally. The training cost is estimated to be Birr 100,000.
VII. FINANCIAL ANALYSIS
The financial analysis of the Chipboard project is based on the data presented in the previous
chapters and the following assumptions:-
Construction period 1 year
Source of finance 30 % equity & 70 loan

116-15
Tax holidays 3 years
Bank interest 10%
Discount cash flow 10%
Accounts receivable 30 days
Raw material local 30 days
Work in progress 5 days
Finished products 30 days
Cash in hand 5 days
Accounts payable 30 days
Repair and maintenance 5% of machinery cost
A. TOTAL INITIAL INVESTMENT COST
The total investment cost of the project including working capital is estimated at Birr 72.23
million (See Table 7.1). From the total investment cost the highest share (Birr 47.94 million or
66.37%) is accounted by initial working capital followed by fixed investment cost (Birr 18.46
million or 25.56%) and pre operation cost (Birr 5.82 million or 8.06%). From the total
investment cost Birr 12 million or 16.61% is required in foreign currency.
Table 7.1
INITIAL INVESTMENT COST ( ‘000 Birr)
Sr.
No Cost Items
Local
Cost
Foreign
Cost
Total
Cost
%
Share
1 Fixed investment
1.1 Land Lease 66.50
66.50 0.09
1.2 Building and civil work 2,250.00
2,250.00 3.11
1.3 Machinery and equipment 3,000.00 12,000.00 15,000.00 20.76
1.4 Vehicles 900.00
900.00 1.25
1.5 Office furniture and equipment 250.00
250.00 0.35
Sub total 6,466.50 12,000.00 18,466.50 25.56
2 Pre operating cost *
2.1 Pre operating cost 1,100.00
1,100.00 1.52
2.2 Interest during construction 4,725.85
4,725.85 6.54
Sub total 5,825.85
5,825.85 8.06
3 Working capital ** 47,945.67
47,945.67 66.37
Grand Total 60,238.02 12,000.00 72,238.02 100
116-16
* N.B Pre operating cost include project implementation cost such as installation, startup,
commissioning, project engineering, project management etc and capitalized interest during
construction.
** The total working capital required at full capacity operation is Birr 68.47 million. However,
only the initial working capital of Birr 47.94 million during the first year of production is
assumed to be funded through external sources. During the remaining years the working
capital requirement will be financed by funds to be generated internally (for detail working
capital requirement see Appendix 7.A.1).
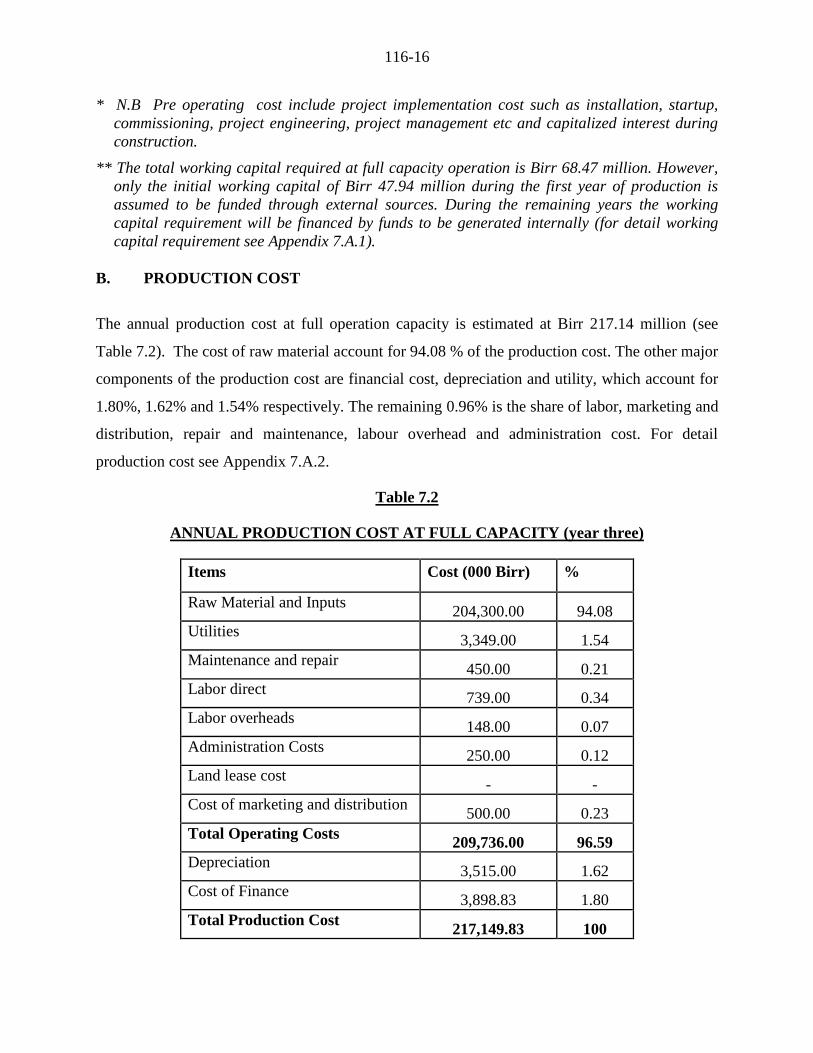
B. PRODUCTION COST
The annual production cost at full operation capacity is estimated at Birr 217.14 million (see
Table 7.2). The cost of raw material account for 94.08 % of the production cost. The other major
components of the production cost are financial cost, depreciation and utility, which account for
1.80%, 1.62% and 1.54% respectively. The remaining 0.96% is the share of labor, marketing and
distribution, repair and maintenance, labour overhead and administration cost. For detail
production cost see Appendix 7.A.2.
Table 7.2
ANNUAL PRODUCTION COST AT FULL CAPACITY (year three)
Items Cost (000 Birr) %
Raw Material and Inputs 204,300.00 94.08
Utilities 3,349.00 1.54
Maintenance and repair 450.00 0.21
Labor direct 739.00 0.34
Labor overheads 148.00 0.07
Administration Costs 250.00 0.12
Land lease cost - -
Cost of marketing and distribution 500.00 0.23
Total Operating Costs 209,736.00 96.59
Depreciation 3,515.00 1.62
Cost of Finance 3,898.83 1.80
Total Production Cost 217,149.83 100

116-17
C. FINANCIAL EVALUATION
1. Profitability
Based on the projected profit and loss statement, the project will generate a profit through out its
operation life. Annual net profit after tax will grow from Birr 16.59 million to Birr 20.16 million
during the life of the project. Moreover, at the end of the project life the accumulated net cash
flow amounts to Birr 243.71 million. For profit and loss statement and cash flow projection see
Appendix 7.A.3 and 7.A.4, respectively.
2. Ratios
In financial analysis financial ratios and efficiency ratios are used as an index or yardstick for
evaluating the financial position of a firm. It is also an indicator for the strength and weakness of
the firm or a project. Using the year-end balance sheet figures and other relevant data, the most
important ratios such as return on sales which is computed by dividing net income by revenue,
return on assets (operating income divided by assets), return on equity (net profit divided by
equity) and return on total investment (net profit plus interest divided by total investment) has
been carried out over the period of the project life and all the results are found to be satisfactory.
3. Break-even Analysis
The break-even analysis establishes a relationship between operation costs and revenues. It
indicates the level at which costs and revenue are in equilibrium. To this end, the break-even
point for capacity utilization and sales value estimated by using income statement projection are
computed as followed.
Break Even Sales Value = Fixed Cost + Financial Cost = Birr 32,546,536
Variable Margin ratio (%)
Break Even Capacity utilization = Break even Sales Value X 100 = 14%
Sales revenue
4. Pay-back Period
The pay- back period, also called pay-off period is defined as the period required for recovering
the original investment outlay through the accumulated net cash flows earned by the project.

116-18
Accordingly, based on the projected cash flow it is estimated that the project’s initial investment
will be fully recovered within 2 years
5. Internal Rate of Return
The internal rate of return (IRR) is the annualized effective compounded return rate that can be
earned on the invested capital, i.e., the yield on the investment. Put another way, the internal rate
of return for an investment is the discount rate that makes the net present value of the
investment's income stream total to zero. It is an indicator of the efficiency or quality of an
investment. A project is a good investment proposition if its IRR is greater than the rate of return
that could be earned by alternate investments or putting the money in a bank account.
Accordingly, the IRR of this project is computed to be 34.64% % % indicating the viability of
the project.
6. Net Present Value
Net present value (NPV) is defined as the total present (discounted) value of a time series of cash
flows. NPV aggregates cash flows that occur during different periods of time during the life of a
project in to a common measuring unit i.e. present value. It is a standard method for using the
time value of money to appraise long-term projects. NPV is an indicator of how much value an
investment or project adds to the capital invested. In principle, a project is accepted if the NPV is
non-negative. Accordingly, the net present value of the project at 10% discount rate is found to
be Birr 116.69 million which is acceptable. For detail discounted cash flow see Appendix 7.A.5.
D. ECONOMIC AND SOCIAL BENEFITS
The project can create employment for 41 persons. The project will generate Birr 54.36 million
in terms of tax revenue. The establishment of such factory will have a foreign exchange saving
effect to the country by substituting the current imports. The project will also create forward
linkage with the furniture and construction sub sectors and also generate income for the
Government in terms of payroll tax.

116-19
Appendix 7.A
FINANCIAL ANALYSES SUPPORTING TABLES

116-20
Appendix 7.A.1
NET WORKING CAPITAL ( in 000 Birr)
Items Year 2 Year 3 Year 4 Year 5 Year 6 Year 7 Year 8 Year 9 Year 10 Year 11
Total inventory 35,752.50 40,860.00 45,967.50 51,075.00 51,075.00 51,075.00 51,075.00 51,075.00 51,075.00 51,075.00
Accounts receivable 12,247.10 13,990.73 15,734.37 17,478.00 17,479.78 17,479.78 17,479.78 17,479.78 17,479.78 17,479.78
Cash-in-hand 15.43 17.63 19.84 22.04 22.34 22.34 22.34 22.34 22.34 22.34
CURRENT
ASSETS 48,015.03 54,868.37 61,721.70 68,575.04 68,577.12 68,577.12 68,577.12 68,577.12 68,577.12 68,577.12
Accounts payable 69.36 79.27 89.18 99.08 99.08 99.08 99.08 99.08 99.08 99.08
CURRENT
LIABILITIES 69.36 79.27 89.18 99.08 99.08 99.08 99.08 99.08 99.08 99.08
TOTAL
WORKING
CAPITAL 47,945.67 54,789.10 61,632.53 68,475.96 68,478.04 68,478.04 68,478.04 68,478.04 68,478.04 68,478.04

116-21
Appendix 7.A.2
PRODUCTION COST ( in 000 Birr)
Item Year 2 Year 3 Year 4 Year 5 Year 6 Year 7 Year 8 Year 9 Year 10 Year 11
Raw Material and Inputs 143,010 163,440 183,870 204,300 204,300 204,300 204,300 204,300 204,300 204,300
Utilities 2,344 2,679 3,014 3,349 3,349 3,349 3,349 3,349 3,349 3,349
Maintenance and repair 315 360 405 450 450 450 450 450 450 450
Labour direct 517 591 665 739 739 739 739 739 739 739
Labour overheads 104 118 133 148 148 148 148 148 148 148
Administration Costs 175 200 225 250 250 250 250 250 250 250
Land lease cost 0 0 0 0 21 21 21 21 21 21
Cost of marketing
and distribution 500 500 500 500 500 500 500 500 500 500
Total Operating Costs 146,965 167,889 188,812 209,736 209,757 209,757 209,757 209,757 209,757 209,757
Depreciation 3,515 3,515 3,515 3,515 3,515 115 115 115 115 115
Cost of Finance 0 5,198 4,549 3,899 3,249 2,599 1,949 1,300 650 0
Total Production Cost 150,480 176,602 196,876 217,150 216,521 212,472 211,822 211,172 210,522 209,872

116-22
Appendix 7.A.3
INCOME STATEMENT ( in 000 Birr)
Item Year 2 Year 3 Year 4 Year 5 Year 6 Year 7 Year 8 Year 9
Year
10
Year
11
Sales revenue 167,076 214,812 238,680 238,680 238,680 238,680 238,680 238,680 238,680 238,680
Less variable costs 146,465 167,389 188,312 209,236 209,236 209,236 209,236 209,236 209,236 209,236
VARIABLE MARGIN 20,611 47,423 50,368 29,444 29,444 29,444 29,444 29,444 29,444 29,444
in % of sales revenue 12.34 22.08 21.10 12.34 12.34 12.34 12.34 12.34 12.34 12.34
Less fixed costs 4,015 4,015 4,015 4,015 4,036 636 636 636 636 636
OPERATIONAL MARGIN 16,596 43,408 46,353 25,429 25,408 28,808 28,808 28,808 28,808 28,808
in % of sales revenue 9.93 20.21 19.42 10.65 10.65 12.07 12.07 12.07 12.07 12.07
Financial costs 5,198 4,549 3,899 3,249 2,599 1,949 1,300 650 0
GROSS PROFIT 16,596 38,210 41,804 21,530 22,159 26,208 26,858 27,508 28,158 28,808
in % of sales revenue 9.93 17.79 17.51 9.02 9.28 10.98 11.25 11.53 11.80 12.07
Income (corporate) tax 0 0 0 6,459 6,648 7,863 8,057 8,252 8,447 8,642
NET PROFIT 16,596 38,210 41,804 15,071 15,511 18,346 18,801 19,256 19,710 20,165
in % of sales revenue 9.93 17.79 17.51 6.31 6.50 7.69 7.88 8.07 8.26 8.45

116-23
Appendix 7.A.4
CASH FLOW FOR FINANCIAL MANAGEMENT ( in 000 Birr)
Item Year 1 Year 2 Year 3 Year 4 Year 5 Year 6 Year 7 Year 8 Year 9 Year 10 Year 11 Scrap
TOTAL CASH
INFLOW 19,567 219,817 214,822 238,690 238,680 238,680 238,680 238,680 238,680 238,680 238,680 74,620
Inflow funds 19,567 52,741 10 10 0 0 0 0 0 0 0 0
Inflow operation 0 167,076 214,812 238,680 238,680 238,680 238,680 238,680 238,680 238,680 238,680 0
Other income 0 0 0 0 0 0 0 0 0 0 0 74,620
TOTAL CASH
OUTFLOW 19,567 199,706 186,439 206,712 233,445 226,154 226,717 226,262 225,807 225,353 218,400 0
Increase in fixed
assets 19,567 0 0 0 0 0 0 0 0 0 0 0
Increase in current
assets 0 48,015 6,853 6,853 6,853 2 0 0 0 0 0 0
Operating costs 0 146,465 167,389 188,312 209,236 209,257 209,257 209,257 209,257 209,257 209,257 0
Marketing and
Distribution cost 0 500 500 500 500 500 500 500 500 500 500 0
Income tax 0 0 0 0 6,459 6,648 7,863 8,057 8,252 8,447 8,642 0
Financial costs 0 4,726 5,198 4,549 3,899 3,249 2,599 1,949 1,300 650 0 0
Loan repayment 0 0 6,498 6,498 6,498 6,498 6,498 6,498 6,498 6,498 0 0
SURPLUS
(DEFICIT) 0 20,111 28,383 31,977 5,235 12,526 11,963 12,418 12,873 13,327 20,280 74,620
CUMULATIVE
CASH
BALANCE 0 20,111 48,494 80,472 85,706 98,232 110,195 122,613 135,485 148,813 169,093 243,713

116-24
Appendix 7.A.5
DISCOUNTED CASH FLOW ( in 000 Birr)
Item
Year
1
Year
2 Year
3
Year
4 Year
5
Year
6 Year
7
Year
8 Year
9
Year
10 Year
11 Scrap
TOTAL CASH INFLOW 0 167,076 214,812 238,680 238,680 238,680 238,680 238,680 238,680 238,680 238,680 74,620
Inflow operation 0 167,076 214,812 238,680 238,680 238,680 238,680 238,680 238,680 238,680 238,680 0
Other income 0 0 0 0 0 0 0 0 0 0 0 74,620
TOTAL CASH OUTFLOW 67,512 153,809 174,732 195,656 216,197 216,405 217,620 217,815 218,010 218,205 218,400 0
Increase in fixed assets 19,567 0 0 0 0 0 0 0 0 0 0 0
Increase in net working capital 47,946 6,843 6,843 6,843 2 0 0 0 0 0 0 0
Operating costs 0 146,465 167,389 188,312 209,236 209,257 209,257 209,257 209,257 209,257 209,257 0
Marketing and Distribution cost 0 500 500 500 500 500 500 500 500 500 500 0
Income (corporate) tax 0 0 0 6,459 6,648 7,863 8,057 8,252 8,447 8,642 0
NET CASH FLOW -67,512 13,267 40,080 43,024 22,483 22,275 21,060 20,865 20,670 20,475 20,280 74,620
CUMULATIVE NET CASH FLOW -67,512 -54,245 -14,165 28,859 51,342 73,617 94,677 115,542 136,213 156,688 176,968 251,589
Net present value -67,512 12,061 33,124 32,325 15,356 13,831 11,888 10,707 9,643 8,684 7,819 28,769
Cumulative net present value -67,512 -55,451 -22,327 9,998 25,354 39,185 51,073 61,780 71,422 80,106 87,925 116,694
NET PRESENT VALUE 116,694
INTERNAL RATE OF RETURN 34.64%
NORMAL PAYBACK 2 years
