profiling of estrogen up- and down-regulated gene ...rzlab.ucr.edu/281f_microarray/4562.pdfprofiling...
TRANSCRIPT

Profiling of Estrogen Up- and Down-Regulated GeneExpression in Human Breast Cancer Cells: Insights intoGene Networks and Pathways Underlying EstrogenicControl of Proliferation and Cell Phenotype
JONNA FRASOR, JEANNE M. DANES, BARRY KOMM, KEN C. N. CHANG, C. RICHARD LYTTLE,AND BENITA S. KATZENELLENBOGEN
Department of Molecular and Integrative Physiology, University of Illinois (J.F., J.M.D., B.S.K.), Urbana, Illinois 61801;and Women’s Health Research Institute, Wyeth Research (B.K., K.C.N.C., C.R.L.), Collegeville, Pennsylvania 19426
Estrogens are known to regulate the proliferation of breastcancer cells and to alter their cytoarchitectural and pheno-typic properties, but the gene networks and pathways bywhich estrogenic hormones regulate these events are onlypartially understood. We used global gene expression profil-ing by Affymetrix GeneChip microarray analysis, with quan-titative PCR verification in many cases, to identify patternsand time courses of genes that are either stimulated or inhib-ited by estradiol (E2) in estrogen receptor (ER)-positiveMCF-7 human breast cancer cells. Of the >12,000 genes que-ried, over 400 showed a robust pattern of regulation, and,notably, the majority (70%) were down-regulated. We ob-served a general up-regulation of positive proliferation reg-ulators, including survivin, multiple growth factors, genesinvolved in cell cycle progression, and regulatory factor-receptor loops, and the down-regulation of transcriptional
repressors, such as Mad4 and JunB, and of antiproliferativeand proapoptotic genes, including B cell translocation gene-1and -2, cyclin G2, BCL-2 antagonist/killer 1, BCL 2-interactingkiller, caspase 9, and TGF� family growth inhibitory factors.These together likely contribute to the stimulation of prolif-eration and the suppression of apoptosis by E2 in these cells.Of interest, E2 appeared to modulate its own activity throughthe enhanced expression of genes involved in prostaglandin Eproduction and signaling, which could lead to an increase inaromatase expression and E2 production, as well as the de-creased expression of several nuclear receptor coactivatorsthat could impact ER activity. Our studies highlight the di-verse gene networks and metabolic and cell regulatory path-ways through which this hormone operates to achieve itswidespread effects on breast cancer cells. (Endocrinology 144:4562–4574, 2003)
ESTROGENS REGULATE DIVERSE physiological pro-cesses in reproductive tissues and in mammary, car-
diovascular, bone, liver, and brain tissues. The effects ofestrogens are mediated via its receptors [estrogen receptor(ER)], which are members of the nuclear receptor superfam-ily of ligand-activated transcription factors that control thesephysiological processes, in large part through the regulationof gene transcription (1–3).
The ER uses multiple mechanisms to either activate orrepress transcription of its target genes. These mechanismsinclude 1) direct interaction of the ligand-occupied receptorwith DNA at estrogen response elements, followed by re-cruitment of transcriptional coregulator or mediator com-plexes; 2) interaction of the ligand-occupied ER with othertranscription factors, such as activating protein-1 (AP-1) (4),Sp1 (5), or nuclear factor-�B (NF-�B) (6); or 3) indirect mod-
ulation of gene transcription via sequestration of general/common transcriptional components (7, 8). To add a furtherlayer of complexity, the ability of ER to regulate transcriptionthrough these various mechanisms appears to be cell typespecific, perhaps due to differences in the complement oftranscriptional coregulatory factors available in each celltype (9–11). Also, transcriptional regulation is dependentupon the nature of the ligand, with various natural andsynthetic selective ER modulators (SERMs) acting as eitherER agonists or antagonists through each of these variousmechanisms (12–15).
With the sequencing of the human genome as well as theadvent of microarray technology, it is now possible to in-vestigate the complexities of ER-mediated gene transcriptionon a more global scale rather than one estrogen-responsivetarget gene at a time. One area where this would be of greatimportance is in the study of the regulation of gene expres-sion by both estrogens and SERMs, such as tamoxifen orraloxifene, in ER-positive breast cancer. The effects of estra-diol (E2) on increased breast cancer cell proliferation andtumorigenesis have been well documented, and several re-cent studies using microarray techniques have begun to doc-ument the gene expression profiles in breast cancer. Most ofthese studies have focused on identifying genes overex-pressed in breast cancer (16) or patterns of gene expressionassociated with clinical outcome or prognosis (17, 18), re-
Abbreviations: AP-1, Activating protein-1; BMP4, bone morphogenicprotein 4; BTG, B cell translocation gene; CDC, cell division cycle; CHX,cycloheximide; CS, confidence score; E2, estradiol; ER, estrogen recep-tor; ERF, Ets2 repressor factor; HBP1, HMG box-containing protein 1;HMG, high-mobility group; MAD, mothers against decapentaplegic;MCM, minichromosome maintenance; NF-�B, nuclear factor-�B; PC3pheochromacytoma cell-3; RFC4, replication factor C4; SDF-1, stromalcell-derived factor 1; SERM, selective ER modulator; SMAD3, Sma andMAD3; SRC, steroid receptor coactivator; TIF, transcriptional interme-diary factor; TOB, transducer of ERBB2; VEGF, vascular endothelialgrowth factor.
0013-7227/03/$15.00/0 Endocrinology 144(10):4562–4574Printed in U.S.A. Copyright © 2003 by The Endocrine Society
doi: 10.1210/en.2003-0567
4562

sponses to chemotherapy or drug resistance (19), tumor ag-gressiveness (20), or classification of primary tumors (21–23).The role of ER expression has also been addressed in severalstudies in which distinct gene expression patterns associatedwith ER status have been identified (24–26).
Despite these recent investigations, the exact role ofestrogen-mediated gene regulation in ER-positive breast can-cer and the manner in which these changes in gene expres-sion affect breast cancer proliferation and progression are farfrom clear. Relatively few microarray studies have examinedthe role of estrogens in regulating gene expression, and thestudies that have been performed in breast cancer cells havebeen on a relatively limited scale, with few genes examinedor over a limited time course of hormone treatment (27–30).
In this study the ER-positive breast cancer cell line MCF-7was treated with E2 for different times up to 48 h, and geneexpression profiling was carried out using the Affymetrixhuman GeneChip U95A, which contains oligonucleotideprobes for approximately 12,000 human genes. Our findingsreveal that E2 regulates gene expression with several distincttime-course patterns, that almost 70% of the genes regulatedby E2 are, in fact, down-regulated, and that numerous cellcycle-associated genes as well as expression of novel tran-scription factors, receptors, and signaling pathways are mod-ulated by E2, many of which could play roles in mediatingthe effects of E2 on breast cancer proliferation and cellphenotype.
Materials and MethodsCell culture and RNA extraction
The MCF-7 cell line was routinely maintained in MEM (Sigma-Aldrich Corp., St. Louis, MO) supplemented with 5% calf serum(HyClone, Logan, UT). Four days before E2 treatment, cells wereswitched to phenol red-free MEM containing 5% charcoal-dextran-treated calf serum. Medium was changed on d 2 and 4 of culture, andthen cells were treated with 10 nm E2 (Sigma-Aldrich Corp.) for 4, 8, 24,or 48 h. The time-course experiment was repeated three times, with twoof the three replicates used for microarray analysis and all three used forreal-time PCR. In experiments using cycloheximide (CHX), CHX at 10�g/ml was present throughout the 24-h period of exposure to E2 orcontrol (0.1% ethanol) vehicle. Total RNA was prepared using TRIzolreagent (Invitrogen, Carlsbad, CA) according to the manufacturer’s in-structions. RNA was further purified using RNeasy columns (Qiagen,Valencia, CA) and treatment with ribonuclease-free deoxyribonucleaseI (Qiagen).
GeneChip microarrays
Total RNA was used to generate cRNA, which was labeled with biotinaccording to techniques recommended by Affymetrix (Santa Clara, CA).cRNA was then hybridizd to Affymetrix Hu95A GeneChips, whichcontain approximately 12,000 human oligonucleotide probe sets. Afterwashing, the chips were scanned and analyzed using MicroArray Suite5.0 (Affymetrix). Average intensities for each GeneChip were globallyscaled to a target intensity of 150. Further analysis was performed usingGeneSpring software version 5.0.1 (Silicon Genetics, Redwood City, CA)to obtain fold change and P values for each gene at each time pointrelative to untreated control.
Identification of E2-regulated genes
To identify genes significantly regulated by E2 treatment, a confi-dence score (CS) was calculated for each gene at each time point of E2treatment, based on the report by Jelinksy et al. (31) with some modi-fications. The CS was defined as the sum of individual scores given forfold change (FC), P value (PV), expression level (EL), and present calls
(PC), so that CS � FC � PV � EL � PC. The score for FC was 5 if thefold change was 2.0 or more for stimulated genes or 0.5 or less forinhibited genes, it was 2 if the fold change was more than 1.5 forstimulated genes or less than 0.67 for inhibited genes, and it was �0.5if the fold change was less than 1.5 or 0.67 or more for stimulated orinhibited genes, respectively. The PV score was 3 if P � 0.05, it was 2 ifP � 0.1, and it was �0.5 if P � 0.1. The expression level was based onthe scaled intensity for each gene, with the EL score being 3 if theintensity was more than 20, 1 if the intensity was more than 15, or �0.5if the intensity was 15 or less. The PC score was 3 if the gene was presentin at least two of the four samples, was 1 if the gene was present in onlyone of the four samples, or was �0.5 if the gene was absent. Based onthis scoring, the maximum CS for any gene would be 14.0. We consid-ered a gene to be significantly regulated by E2 if the CS was 12.0 orgreater. Our selection of this CS identified genes known to be estrogenregulated and gave highly reproducible patterns of regulation for newlyidentified genes.
Real-time PCR
Real-time PCR was carried out on over 50 genes to verify the regu-lation of expression by E2. One microgram of total RNA was reversetranscribed in a total volume of 20 �l using 200 U reverse transcriptase,50 pmol random hexamer, and 1 mm deoxy-NTP (New England Biolabs,Beverly, MA). The resulting cDNA was then diluted to a total volumeof 100 �l with sterile H2O. Each real-time PCR reaction consisted of 1 �ldiluted RT product, 1� SYBR Green PCR Master Mix (PE AppliedBiosystems, Foster City, CA), and 50 nm forward and reverse primers.Reactions were carried out on an ABI PRISM 7700 Sequence DetectionSystem (PE Applied Biosystems) for 40 cycles (95 C for 15 sec, 60 C for1 min) after an initial 10-min incubation at 95 C. For the genes whoseregulation is described in detail in this report, the primers used forreal-time PCR are listed in Table 1. The fold change in expression of eachgene was calculated using the �� Ct method, with the ribosomal protein36B4 mRNA as an internal control (32).
ResultsIdentification of E2 up- and down-regulated genes
To examine the time-dependent regulation of gene ex-pression by E2 in breast cancer cells, MCF-7 cells were treatedwith E2 for different lengths of time, ranging from 4–48 h,and RNA from duplicate samples at each time point wasanalyzed using oligonucleotide microarrays. A CS was cal-culated for each gene at each time point of E2 treatment, asdescribed in Materials and Methods. The advantage of usinga CS is that it takes into account the fold change and statisticalsignificance (P value) of the multiple measurements for eachgene compared with control as well as the expression leveland the present/absent calls for each gene represented on thearray. Using a CS cut-off of 12.0 or greater, 438 genes wereidentified to be significantly regulated by E2. This cut-offensured that the fold change was at least 2.0, the P value wasless than 0.1, and the gene was expressed at a level detectableby microarray. Surprisingly, only 30% (n � 132) of thesegenes were up-regulated by E2, whereas the majority (70%;n � 306 genes) were down-regulated.
Time-course patterns of gene regulation
Three types of analyses were performed to identify dif-ferent patterns of gene regulation based on the time courseof E2 treatment. First, gene cluster analysis was performedusing GeneSpring software (Fig. 1A). Each row represents asingle time point (0–48 h) and contains all 438 regulatedgenes, with stimulated genes in red, inhibited genes in blue,and genes not different from control in yellow. The pattern for
Frasor et al. • Estrogen-Regulated Gene Networks in Breast Cancer Endocrinology, October 2003, 144(10):4562–4574 4563

each cluster of genes can be observed vertically over thedifferent treatment times. Using this method, several pat-terns of E2 regulation are visible, as is the fact that the ma-jority of genes are inhibited by E2. Clusters labeled A throughC demonstrate three patterns of stimulated genes, with Ashowing genes highly regulated at all time points examined,B showing genes stimulated at the earlier time points only,and C showing genes stimulated only at the later time points.Clusters labeled D and E show two patterns of down-regu-lated genes: genes highly down-regulated at all time points(in D) and genes down-regulated at later time points only(in E).
In a second type of analysis, scatter plots were producedto examine the proportion of genes stimulated or inhibitedat each distinct time point of the experiment (Fig. 1B). In theseplots, the normalized signal for each of the E2-regulatedgenes at the time of interest is plotted on the y-axis againstthe control signal on the x-axis. The outer diagonal linesrepresent 2-fold changes in expression. This type of analysisdemonstrates that at early time points, a greater proportionof genes are up-regulated by E2 (red) compared with down-regulated genes (blue), whereas at later time points a fargreater number of genes are down-regulated in relation bothto early time points and to the number of up-regulated genes.
These observations were confirmed using a third analysis(Fig. 2), in which the 438 genes regulated by E2 were assignedto one of three distinct patterns: 1) regulated early only(�2-fold at 4 and/or 8 h only), 2) regulated early and late(�2-fold at 4 and/or 8 h and at 24 and/or 48 h), or 3)regulated late only (�2-fold at 24 and/or 48 h only). Forstimulated genes, an approximately equal number of geneswere observed in each of the 3 patterns (early, n � 44; earlyand late, n � 46; late, n � 42), with the most robustly stim-ulated genes in the early and late patterns (Fig. 2, left panel).In contrast, very few inhibited genes showed the early onlypattern (n � 11), with the majority of genes being down-regulated at either the early and late (n � 110) or the late timepoints only (n � 185; Fig. 2, right panel). As our first time pointwas 4 h, it is possible that some additional early responsegenes may not have been identified.
Functional categories of genes regulated by E2
Of the 438 genes found to be regulated by E2, approxi-mately 80% of the stimulated genes and 70% of the inhibitedgenes encode proteins with either a known or an inferredfunction. The major functional categories for these genes (Fig.3) include apoptosis, cell adhesion/extracellular matrix, cellcycle, cytoskeleton/structural, enzymes/metabolism, growthfactors/hormones/cytokines, nucleotide processing, proteinprocessing, receptors, signal transduction, transcription, andtransporters. With a few exceptions, the proportion of stimu-lated to inhibited genes in each category was similar (Fig. 3). Asubstantially greater proportion of genes involved in cell cycleand nucleotide processing, such as DNA repair or RNA splic-ing, were stimulated by E2, whereas a greater proportion of celladhesion and extracellular matrix genes as well as enzymeswere inhibited by E2.
Fifty-two genes have been examined using real-time PCRfor regulation by E2, with 51 of the 52 showing a high degreeof correlation to our microarray data. If anything, the mi-croarray data tend to underestimate the fold change due toE2. Regulation of specific genes by E2 within specific cate-gories is discussed further below, and the genes found inthese categories are listed in Tables 2–5.
E2 regulation of genes promoting cell proliferationand survival
It is well established that E2 stimulates MCF-7 cell pro-liferation, and as expected, we identified a number of genes,quite a few novel ones as well as some previously known,that are stimulated by E2 and are associated with the cellcycle (Table 2). The time courses of regulation for the knownE2-stimulated genes cyclin D1 and cell division cycles 2 and20 (CDC2 and CDC20) are shown in Fig. 4A. Figure 4B showsreal-time PCR data for the time course of identified E2-stimulated genes, minichromosome maintenance genes(MCM2, MCM3, and MCM5), CDC6, and replication factorC4 (RFC4), all of which have roles in DNA synthesis. Ofinterest, the time course information indicates that the ma-jority of cell cycle-associated genes that are stimulated by E2
TABLE 1. Primers used for real-time PCR
Gene Forward primer Reverse primer
A-Myb 5�-CACAATGAAGGAGCCATGGA 5�-CTGAGGATGGCTGGTGGAGTB-Myb 5�-GCCACTTCCCTAACCGCAC 5�-CCCTTGACAAGGTCTGGATTCAC-Myb 5�-CACTCCACTCCATCTCTGCCA 5�-GGACGATCATGCACCTTGCTCXCR4 5�-TCATCACGCTTCCCTTCTGG 5�-CATGGACTGCCTTGCATAGGAEPOR 5�-CTGCTCATCTGCTTTGGCC 5�-GACGCAAGAGCTGGGAGCTIL1-RI 5�-CCGGCCAGTTGAGTGACAT 5�-TTCCCCTAGCACTGGGTCATCNOTCH3 5�-TGATCGGCTCGGTAGTAATGC 5�-GCTCCCAGGTAGTCAGCGGCALR 5�-CCGCATACCAAGGAGAAGGTC 5�-ATACTCCAGCCGGTGTGTCATRIP140 5�-AAGCGAAGCCCATTTGCA 5�-TTTGGGAGCTGGTAACTGCCTIF1� 5�-CCCCACGATTACTAGTGCAGC 5�-GACCCTCCCACTGGTGAGCSRC2 5�-AGGACAGCCCACCTCCATG 5�-TGACTGGGTGGGATTCGAGSRC3 5�-CCATGGGAAGACCAGGAGG 5�-CGAAGAGGCAATGTGGGAASMAD3 5�-CCGATGTCCCCAGCACATA 5�-GAGATGGAGCACCAGAAGGCPNRC2 5�-TGGATGGGAAGCACTGTTGA 5�-TGCCATCAGCTCCCTGTTTCDC6 5�-AGGAAACGTCTGGGCGATG 5�-TCTTGCCTTGCTTTGGTGGMCM2 5�-TGCAAGCCAGGAGACGAGA 5�-CCATTGGCAGTGTTGAGGGMCM3 5�-TCAGACCATGTCCTTCGGATG 5�-GCACTACCCAAGGGCATAGCMCM5 5�-ATCTTGTCGCGCTTCGACA 5�-CGTGCAGAGTGATGACATGCTRFC4 5�-TCAGATGGGAAGCCGTGTC 5�-GCCTGAGCAGCTGAGGTCAT36B4 5�-GTGTTCGACAATGGCAGCAT 5�-GACACCCTCCAGGAAGCGA
4564 Endocrinology, October 2003, 144(10):4562–4574 Frasor et al. • Estrogen-Regulated Gene Networks in Breast Cancer

are regulated late, at 24 h or later. Only cyclin D1 and CDC6are up-regulated by E2 within the first 4 h of treatment.
In addition to these E2-stimulated genes, we identified anumber of antiproliferative and proapoptotic genes to bedown-regulated by E2 (Table 2 and Fig. 4C). Two membersof the pheochromacytoma cell-3 (PC3)/B cell translocation
gene (BTG)/transducer of ERBB2 (TOB) family, BTG-1 andBTG-2, which have been shown to be induced by p53 and toinhibit cell cycle progression, are down-regulated by E2,although their precise molecular functions are not known(33). Also down-regulated by E2 is cyclin G2, a gene knownto induce cell cycle arrest and to be up-regulated when cellsundergo arrest or apoptosis (34). It also appears that E2 mayinfluence not only proliferation, but also cell survivalthrough the up-regulation of the antiapoptotic gene survivinand the down-regulation of multiple proapoptotic genes,including BCL 2-interacting killer, BCL-2 antagonist/killer 1,immediate early response 3 (also known as IEX-1), andcaspase 9. Hence, E2 acts to stimulate genes associated withcell proliferation, in particular genes associated with DNAsynthesis, as well as to down-regulate antiproliferative andproapoptotic genes, probably leading to an overall increasein both proliferation and cell survival.
E2 regulation of genes encoding growth factors, cytokinesand hormones
Our findings support the proposal (35) that major changesin breast cancer cell proliferation by E2 involve the up-regulation of growth factors that can act in an autocrinemanner. We have found several growth factors, cytokines,and hormones to be regulated by E2 in MCF-7 cells (Table 3).Amphiregulin, stromal cell-derived factor 1 (SDF-1; alsoknown as chemokine ligand 12), stanniocalcin 2, and vas-cular endothelial growth factor (VEGF), all previously iden-tified as E2-stimulated genes, showed early increases after E2exposure, and as shown in Fig. 5, each of these genes had aunique time course of regulation, with amphiregulin andSDF-1 showing sustained high fold stimulated levels over the48 h, and VEGF and stanniocalcin being elevated primarilyat early times only.
Several novel genes associated with the suppression ofbreast cancer cell proliferation were found to be down-regulated by E2, including TGF�3, bone morphogenic pro-tein 4 (BMP4) and the inhibin �B-subunit, which is commonto both activin and inhibin (Table 3 and Fig. 5). These datahighlight that in addition to the stimulation of growth factorsassociated with increased cell proliferation, down-regulationof several growth inhibitory factors, particularly members ofthe TGF� family, including TGF�3, BMP4, and inhibin �B,may contribute to the increased proliferation elicited by E2.
E2 regulation of receptors and signaling pathways
A significant number of receptors and signaling moleculeswere found to be regulated by E2, particularly at early times(Table 4). Two pathways of note, which are regulated atseveral levels, include the prostaglandin E pathway (Fig. 6A)and SDF-1 (up-regulated by E2; as shown in Fig. 5) and itschemokine receptor CXCR4 (Fig. 6B) pathway. The enzymeprostaglandin E synthase as well as the prostaglandin Ereceptor (EP3) were found to be stimulated by E2 (Fig. 6A).In contrast, the CXCR4 receptor, which may play a role in cellmotility, was down-regulated by E2, as was BLNK (Fig. 6B),a B cell scaffolding protein that is involved in regulating theactivity of CXCR4 (36). These findings suggest an overalldecrease in signaling through the CXCR4 pathway, but an
FIG. 1. Cluster analysis for the time-course pattern of E2-regulatedgene expression (A) and scatterplots for E2-regulated genes at 4, 8, 24,and 48 h of E2 exposure (B). MCF-7 breast cancer cells were treatedwith 10 nM E2 for the times indicated before cell harvest and Af-fymetrix gene chip microarray analysis. Gene cluster analysis (A) wasperformed for 438 genes found to be significantly regulated by E2using GeneSpring software. Stimulated genes are shown in red, in-hibited genes in blue, and genes not regulated in yellow. Clusters Athrough C show 3 different time-course patterns of stimulated genes;clusters D and E demonstrate 2 distinct time-course patterns of down-regulated genes. Scatterplots in B were produced for each time pointusing the normalized signal for each of the E2-regulated genes at thetime of interest, plotted against the control signal for that gene on thex-axis. The outer diagonal lines represent a 2-fold increase or decreasein expression. Stimulated genes are in red, inhibited genes are in blue,and genes not different from control are in yellow.
Frasor et al. • Estrogen-Regulated Gene Networks in Breast Cancer Endocrinology, October 2003, 144(10):4562–4574 4565

increase in prostaglandin E production and signaling in re-sponse to E2.
Some other important receptors found to be regulated byE2 include the highly up-regulated calcitonin receptor (Fig.6C) and the down-regulated erythropoietin receptor, IL-1receptor type I, and Notch 3, which are rapidly decreased, by4 and 8 h (Fig. 6D).
E2 regulation of transcription factors andtranscriptional coregulators
Many novel transcription factors, including HOXC4,HOXC5, and HOXC6, were identified as being markedlystimulated by E2 (Fig. 7A and Table 5). Interestingly, thesethree genes had an identical time course of E2 regulation,with the maximum stimulation at 4 h, followed by a decrease.However, it should be noted that HOXC4 showed a muchhigher degree of stimulation and remained greatly elevatedthroughout the entire 48-h time course. The biological sig-nificance of these differences is not clear.
Other transcription factors, including c-Fos, c-Myc,BRCA1, and BRCA2, known to be stimulated by E2, werealso found by our microarray studies (Table 5). However, our
time-course analysis reveals some new information about E2regulation of several of these factors. One example is that ofthe oncogene c-myb and two related transcription factors,A-Myb and B-Myb (also known as myb-like 1 and myb-like2). All three were stimulated by E2, but had very differenttime courses and magnitudes of regulation (Fig. 7B). BothA-Myb and C-Myb were highly up-regulated within 4 h ofE2 treatment and remained elevated throughout the 48 h,with the level of A-Myb stimulation being approximatelythree to four times greater at all time points. In contrast,B-Myb was not significantly up-regulated by E2 until 24 h oftreatment, at which time a 4- to 5-fold stimulation was ob-served. This suggests that although these three related tran-scription factors are stimulated by E2, their regulation maybe through different mechanisms. Indeed, studies with theprotein synthesis inhibitor, cycloheximide (Fig. 7C), revealthat the rapidly up-regulated A-Myb and C-Myb genes areprobably primary response genes as their stimulation is notblocked by cycloheximide whereas B-Myb, the more slowlyresponding gene is probably a secondary response gene, asits stimulation is prevented by cycloheximide treatment. In-deed, it is likely that the early changes in the expression of
FIG. 2. Time-course patterns of gene regulation inMCF-7 cells upon E2 treatment. All E2-stimulated (leftpanel) or inhibited (right panel) genes were assigned toone of three categories. For early only regulated genes,the fold change was 2-fold or greater at 4 and/or 8 h only.For early and late regulated genes, the fold change was2-fold or greater at 4 and/or 8 h and at 24 and/or 48 h.For late only regulated genes, the fold change was 2-foldor greater at 24 and/or 48 h only. Once genes were as-signed to one of the three time-course patterns, the meanfold change (�SEM) was calculated and plotted for allgenes in that pattern. The number of genes in eachcategory is indicated.
FIG. 3. Functional categories of genes stimulated or inhib-ited by E2 in MCF-7 breast cancer cells. Where possible,E2-regulated genes were assigned to 1 of 12 functional cat-egories or to the other/unknown category (not shown). Thepercentage of stimulated or inhibited genes in each categorywas calculated based on the number of genes assigned to thecategory divided by the total number of stimulated or in-hibited genes.
4566 Endocrinology, October 2003, 144(10):4562–4574 Frasor et al. • Estrogen-Regulated Gene Networks in Breast Cancer
genes encoding transcription factors could impact the ex-pression of later downstream genes.
Also of interest, a number of transcription factors thoughtto be transcriptional repressors were down-regulated by E2(Fig. 8). These include Mad4, JunB, an Ets2 repressor factor(ERF), and two members of the Id family of transcriptionalregulators, inhibitor of DNA binding 1 and 2. We also found
mRNA encoding the high-mobility group (HMG) box-containing protein 1 (HBP1) and SATB1, an AT-rich bindingprotein and nuclear matrix scaffolding factor, to be down-regulated by E2, and the down-regulations observed by Af-fymetrix microarray analysis were confirmed by real-timePCR (Fig. 8B). The suppression of gene expression for mul-tiple transcriptional repressors might enable E2 to increase
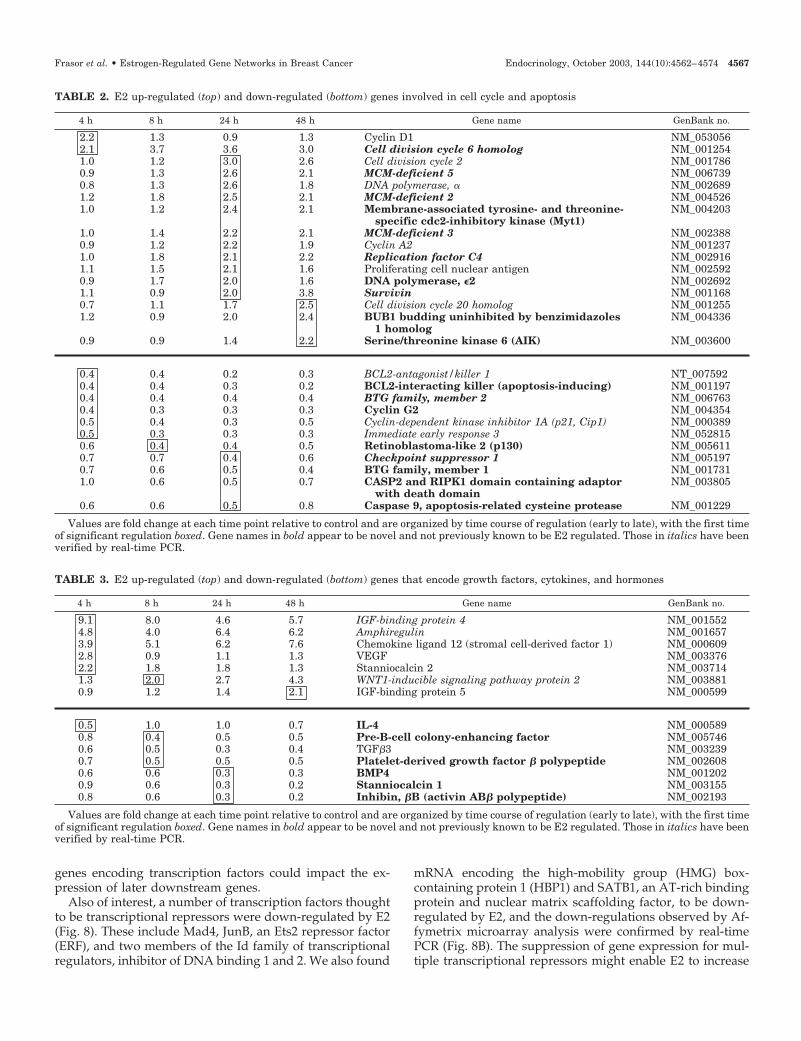
TABLE 2. E2 up-regulated (top) and down-regulated (bottom) genes involved in cell cycle and apoptosis
4 h 8 h 24 h 48 h Gene name GenBank no.
2.2 1.3 0.9 1.3 Cyclin D1 NM_0530562.1 3.7 3.6 3.0 Cell division cycle 6 homolog NM_0012541.0 1.2 3.0 2.6 Cell division cycle 2 NM_0017860.9 1.3 2.6 2.1 MCM-deficient 5 NM_0067390.8 1.3 2.6 1.8 DNA polymerase, � NM_0026891.2 1.8 2.5 2.1 MCM-deficient 2 NM_0045261.0 1.2 2.4 2.1 Membrane-associated tyrosine- and threonine-
specific cdc2-inhibitory kinase (Myt1)NM_004203
1.0 1.4 2.2 2.1 MCM-deficient 3 NM_0023880.9 1.2 2.2 1.9 Cyclin A2 NM_0012371.0 1.8 2.1 2.2 Replication factor C4 NM_0029161.1 1.5 2.1 1.6 Proliferating cell nuclear antigen NM_0025920.9 1.7 2.0 1.6 DNA polymerase, �2 NM_0026921.1 0.9 2.0 3.8 Survivin NM_0011680.7 1.1 1.7 2.5 Cell division cycle 20 homolog NM_0012551.2 0.9 2.0 2.4 BUB1 budding uninhibited by benzimidazoles
1 homologNM_004336
0.9 0.9 1.4 2.2 Serine/threonine kinase 6 (AIK) NM_003600
0.4 0.4 0.2 0.3 BCL2-antagonist/killer 1 NT_0075920.4 0.4 0.3 0.2 BCL2-interacting killer (apoptosis-inducing) NM_0011970.4 0.4 0.4 0.4 BTG family, member 2 NM_0067630.4 0.3 0.3 0.3 Cyclin G2 NM_0043540.5 0.4 0.3 0.5 Cyclin-dependent kinase inhibitor 1A (p21, Cip1) NM_0003890.5 0.3 0.3 0.3 Immediate early response 3 NM_0528150.6 0.4 0.4 0.5 Retinoblastoma-like 2 (p130) NM_0056110.7 0.7 0.4 0.6 Checkpoint suppressor 1 NM_0051970.7 0.6 0.5 0.4 BTG family, member 1 NM_0017311.0 0.6 0.5 0.7 CASP2 and RIPK1 domain containing adaptor
with death domainNM_003805
0.6 0.6 0.5 0.8 Caspase 9, apoptosis-related cysteine protease NM_001229
Values are fold change at each time point relative to control and are organized by time course of regulation (early to late), with the first timeof significant regulation boxed. Gene names in bold appear to be novel and not previously known to be E2 regulated. Those in italics have beenverified by real-time PCR.
TABLE 3. E2 up-regulated (top) and down-regulated (bottom) genes that encode growth factors, cytokines, and hormones
4 h 8 h 24 h 48 h Gene name GenBank no.
9.1 8.0 4.6 5.7 IGF-binding protein 4 NM_0015524.8 4.0 6.4 6.2 Amphiregulin NM_0016573.9 5.1 6.2 7.6 Chemokine ligand 12 (stromal cell-derived factor 1) NM_0006092.8 0.9 1.1 1.3 VEGF NM_0033762.2 1.8 1.8 1.3 Stanniocalcin 2 NM_0037141.3 2.0 2.7 4.3 WNT1-inducible signaling pathway protein 2 NM_0038810.9 1.2 1.4 2.1 IGF-binding protein 5 NM_000599
0.5 1.0 1.0 0.7 IL-4 NM_0005890.8 0.4 0.5 0.5 Pre-B-cell colony-enhancing factor NM_0057460.6 0.5 0.3 0.4 TGF�3 NM_0032390.7 0.5 0.5 0.5 Platelet-derived growth factor � polypeptide NM_0026080.6 0.6 0.3 0.3 BMP4 NM_0012020.9 0.6 0.3 0.2 Stanniocalcin 1 NM_0031550.8 0.6 0.3 0.2 Inhibin, �B (activin AB� polypeptide) NM_002193
Values are fold change at each time point relative to control and are organized by time course of regulation (early to late), with the first timeof significant regulation boxed. Gene names in bold appear to be novel and not previously known to be E2 regulated. Those in italics have beenverified by real-time PCR.
Frasor et al. • Estrogen-Regulated Gene Networks in Breast Cancer Endocrinology, October 2003, 144(10):4562–4574 4567

TABLE 4. E2 up-regulated (top) and down-regulated (bottom) genes that encode receptors and signal transduction proteins
4 h 8 h 24 h 48 h Gene name GenBank no.
4.7 3.7 2.4 1.6 Ret/Ptc NM_0003234.4 1.2 1.8 0.8 Retinoic acid receptor � NM_0009644.0 5.6 3.7 3.7 RAB31 NM_0068683.6 1.3 0.9 0.7 RAS guanyl-releasing protein 1 NM_0057393.0 2.8 3.3 4.3 Calcitonin receptor NM_0017422.8 2.2 2.3 1.6 Ret/Ptc22.6 1.4 1.6 2.1 Adenylate cyclase 9 NM_0011162.6 1.9 1.2 1.5 Growth arrest and DNA damage-inducible � NM_0156752.5 2.6 1.6 1.5 Glycine receptor � NM_0008242.3 1.4 1.6 1.4 Tetraspan 5 NM_0057232.1 1.6 2.7 2.1 Prostaglandin E receptor 3 NM_0009572.0 1.1 0.9 0.9 Ste20-related serine/threonine kinase NM_0147202.0 1.6 1.3 1.3 Osteoclast-stimulating factor 1 NM_0123831.8 2.2 1.8 1.7 Janus kinase 1 NM_0022271.5 1.9 2.7 2.6 Protein phosphatase 2, regulatory subunit A� NM_0027161.5 1.3 2.0 1.6 Chemokine-binding protein 2 NM_001296
0.2 0.3 0.3 0.2 B-cell linker NM_0133140.4 0.6 0.6 0.4 Chemokine (C-X-C motif) receptor 4 NM_0034670.4 0.4 0.2 0.2 Erythropoietin receptor NM_0001210.4 0.1 0.0 0.0 IL-1 receptor, type I NM_0008770.4 0.4 0.3 0.3 Protein tyrosine phosphatase, nonreceptor type 12 NM_0028350.4 0.3 0.2 0.1 Dual specificity phosphatase 4 NM_0013940.4 0.6 0.6 0.8 Serine/threonine kinase 3 (STE20 homolog) NM_0062810.5 0.7 0.6 0.8 CDC42 effector protein (Rho GTPase binding) 4 NM_0121210.5 0.5 0.6 0.5 Growth factor receptor-bound protein 10 NM_0053110.5 0.6 0.5 0.5 Phosphoinositide-3-kinase, regulatory subunit, polypeptide 3 NM_0036290.5 0.5 0.5 0.5 Cas-Br-M (murine) ecotropic retroviral transforming sequence b NM_0043510.5 0.4 0.5 0.3 MAPK kinase 6 NM_0027580.6 0.4 0.4 0.5 Notch homolog 3 (Drosophila) NM_0004350.8 0.4 0.2 0.1 Annexin A3 NM_0051390.6 0.4 0.3 0.3 Coxsackie virus and adenovirus receptor NM_0013380.7 0.4 0.3 0.4 Dual specificity phosphatase 1 NM_0044170.6 0.4 0.3 0.2 Serum-inducible kinase NM_0066220.9 0.4 0.3 0.4 RAP1, GTPase-activating protein 1 NM_0028850.8 0.5 0.3 0.4 Phosphatidylinositol (4,5) bisphosphate 5-phosphatase, A NM_0144220.8 0.5 0.5 0.5 IQ motif containing GTPase-activating protein 1 NM_0038700.7 0.5 0.3 0.2 Retinoic acid-induced 3 NM_0039790.8 0.5 0.5 0.5 v-erb-b2 NM_0044480.9 0.6 0.2 0.3 T cell receptor � locus NG_0013360.9 0.6 0.3 0.2 Parvalbumin NM_0028540.8 0.9 0.3 0.4 Interferon-� receptor 2 (interferon-� transducer 1) NM_0055340.6 0.6 0.4 0.4 RAB9A, member RAS oncogene family NM_0042510.9 0.6 0.4 0.5 Discoidin domain receptor family, member 1 NM_0019541.0 0.7 0.4 0.6 PTEN-induced putative kinase 1 NM_0324090.6 0.6 0.4 0.3 Protein phosphatase 1, regulatory (inhibitor) subunit 3C NM_0053980.7 0.6 0.4 0.3 Son of sevenless homolog 2 (Drosophila) NT_0258920.7 0.6 0.4 0.5 RAB6A, member RAS oncogene family NM_0028690.8 0.6 0.4 0.5 Low density lipoprotein receptor NM_0005270.8 0.6 0.4 0.5 Syndecan 4 (amphiglycan, ryudocan) NM_0029990.7 0.9 0.4 0.8 TGF� receptor II NM_0032421.0 0.7 0.4 0.8 Inositol hexaphosphate kinase 1 NM_1532730.9 0.6 0.4 0.9 Dual specificity phosphatase 3 NM_0040900.7 0.6 0.4 0.5 Retinoid X receptor � NM_0029570.9 0.7 0.4 0.3 Protein tyrosine phosphatase, receptor type, K NM_0028440.9 0.6 0.5 0.5 Leptin receptor gene-related protein NM_0175260.7 0.8 0.5 0.8 Reticulocalbin 2, EF-hand calcium-binding domain NM_0029020.6 0.7 0.5 0.6 Phosphoinositide-3-kinase, class 2, � polypeptide NM_0026460.7 0.6 0.5 0.6 v-erb-b2, homolog 3 (ERBB3) NM_0019820.6 0.7 0.5 0.4 ras homolog gene family, member E NM_0051680.8 0.8 0.5 1.0 Dual specificity tyrosine (Y) phosphorylation-regulated kinase 2 NM_0035830.9 0.8 0.5 0.7 Serine/threonine kinase 16 NM_0036910.8 0.6 0.5 0.5 Phosphoinositol 3-phosphate-binding protein-3 NM_0149350.9 0.6 0.6 0.5 GTP cyclohydrolase I feedback regulatory protein NM_005258
Values are fold change at each time point relative to control and are organized by time course of regulation (early to late), with the first timeof significant regulation boxed. Gene names in bold appear to be novel and not previously known to be E2 regulated. Those in italics have beenverified by real-time PCR.
4568 Endocrinology, October 2003, 144(10):4562–4574 Frasor et al. • Estrogen-Regulated Gene Networks in Breast Cancer

the transcriptional activity of genes in numerous pathwaysin breast cancer cells.
In addition to transcription factors and transcriptional re-pressors, E2 regulated a number of genes encoding nuclearreceptor transcriptional coregulators. Over time, as shown inFig. 9, there appears to be a change in the complement of cellcoregulators, with a down-regulation of steroid receptorcoactivator (SRC)-2/glucocorticoid receptor interacting
protein 1/transcriptional intermediary factor (TIF)2, SRC-3/amplified in breast cancer 1/ACTR (a novel coactivator),and TIF1� (37), as well as two other enhancers of ER activity,a small proline-rich coactivator termed PNRC2 (38) andSMAD3 [Sma and mothers against decapentaplegic (MAD)homolog 3], another transcription factor known to enhance ERactivity (39). In contrast, the only coregulator we observed to bestimulated by E2 was receptor-interacting protein 140/nuclear
TABLE 5. E2 up-regulated (top) and down-regulated (bottom) genes that encode transcription factors and transcriptional coregulators
4 h 8 h 24 h 48 h Gene name GenBank no.
15.5 9.5 7.0 8.9 Homeo box C4 NM_1536336.8 1.6 1.4 1.3 Core-binding factor, runt domain, �-subunit 2; translocated to, 3 NM_0051874.1 2.6 2.5 2.9 Early growth response 3 NT_0083003.8 2.2 2.0 1.6 c-fos NM_0052523.6 2.7 2.3 2.7 Nuclear receptor interacting protein 1 NM_0034893.5 1.9 1.3 1.4 E74-like factor 1 NT_0099843.1 1.9 1.4 2.2 Homeo box C6 NM_0045032.8 2.0 1.0 1.2 Homeo box C5 NM_0189532.3 2.0 1.6 1.1 c-myc NM_0024672.3 1.4 1.3 1.8 TGF�-induced factor 2 NM_0218092.3 1.7 1.8 1.9 ELL-related RNA polymerase II elongation factor NM_0120812.2 2.3 2.0 1.5 TATA element modulatory factor 1 NM_0071142.1 2.1 1.9 1.9 c-myb NM_0053752.1 2.1 1.8 2.1 Retinoblastoma-binding protein 7 NM_0028932.0 1.0 6.6 5.4 a-myb NT_0081661.1 1.2 2.8 3.1 b-myb NM_0024661.0 1.6 2.5 2.0 Breast cancer 2, early onset NM_0000590.9 1.7 1.9 2.0 Breast cancer 1, early onset NM_007294
0.3 0.4 0.4 0.4 MAD, mothers against decapentaplegic homolog 6 NM_0055850.4 0.5 0.4 0.3 Core promoter element-binding protein NM_0013000.4 0.5 0.3 0.3 Inhibitor of DNA binding 2 NM_0021660.4 0.7 0.5 0.4 Nuclear receptor coactivator 2 NM_0065400.4 0.4 0.5 0.2 Nuclear receptor subfamily 2, group C, member 1 NM_0032970.5 0.7 0.7 0.8 Transcriptional intermediary factor 1 NM_0038520.6 0.4 0.4 0.3 Aryl-hydrocarbon receptor nuclear translocator 2 NM_0148620.8 0.4 0.6 0.7 junB protooncogene NM_0022290.8 0.4 0.1 0.4 MAX dimerization protein 4 NM_0064540.6 0.5 0.4 0.4 Interferon regulatory factor 6 NM_0061470.6 0.5 0.3 0.4 Special AT-rich sequence-binding protein 1 NM_0029710.7 0.5 0.7 0.5 � sleep-inducing peptide, immunoreactor NM_0040890.7 0.5 0.5 0.5 HMG box-containing protein 1 NM_0122570.7 0.5 0.5 0.5 LPS-induced TNF � factor NM_0048620.8 0.5 0.4 0.5 Basic helix-loop-helix domain containing, class B, 2 (DEC1) NM_0036700.8 0.5 0.4 0.5 SRY (sex determining region Y)-box 9 NM_0003461.0 0.6 0.3 0.1 Aml1-Evi-1 S690020.6 0.7 0.3 0.3 Nuclear factor related to �B-binding protein NM_0061650.6 0.6 0.4 0.4 Inhibitor of DNA binding NM_0021650.6 0.6 0.4 0.5 Proline rich 2 NM_0068130.7 0.6 0.4 0.5 MAD, mothers against decapentaplegic homolog 3 NM_0059020.7 0.6 0.4 0.4 Zinc finger protein 217 NM_0065260.6 0.6 0.5 0.6 Nuclear receptor coactivator 3 NM_0065340.6 0.6 0.5 0.6 TGF�-stimulated protein TSC-22 NM_0060220.7 0.6 0.5 0.4 Basic transcription element-binding protein 1 (KLF9) NM_0012060.7 0.6 0.5 0.4 Pre-B-cell leukemia transcription factor 1 NM_0025850.8 0.6 0.5 0.9 Regulatory factor X, 5 NM_0004490.8 0.6 0.5 0.5 RING1 and YY1-binding protein NM_0122340.7 0.7 0.5 0.5 Hepatocyte nuclear factor 3, � NM_0044960.8 0.7 0.5 0.7 Ets2 repressor factor NM_0064940.9 0.7 0.5 0.4 Forkhead box O3A NM_0014550.9 0.8 0.5 0.6 Thyroid transcription factor 1 NM_0033171.1 0.8 0.5 0.6 Zinc finger protein 36, C3H type-like 2 NM_0068870.8 0.9 0.6 0.5 Iroquois homeobox protein 5 NM_0058530.8 0.8 1.0 0.5 Hairy homolog (Drosophila) NM_005524
Values are fold change at each time point relative to control and are organized by time course of regulation (early to late), with the first timeof significant regulation boxed. Gene names in bold appear to be novel and not previously known to be E2 regulated. Those in italics have beenverified by real-time PCR.
Frasor et al. • Estrogen-Regulated Gene Networks in Breast Cancer Endocrinology, October 2003, 144(10):4562–4574 4569
receptor-interacting protein 1 (Table 5); it generally functions asa corepressor of ER, but can also exhibit coactivator activity andhas previously been reported to be regulated by E2 (40).
Discussion
Estrogens are known to regulate the proliferation of breastcancer cells and to alter cytoarchitectural and other pheno-typic properties of these cells, but the mechanisms and path-ways by which estrogens regulate these events are only par-tially understood. We have used global gene expressionprofiling by microarray analysis, with quantitative PCR ver-ification in many cases, to identify patterns and networks ofgenes that are either stimulated or inhibited by E2. We haveobserved that many genes whose expression is altered by this
hormone, are associated with specific cell signaling path-ways and regulatory factor-receptor loops. These include ageneral up-regulation of positive proliferation regulatorsand the down-regulation of negative proliferation regula-tors, which together may contribute to the overall stimula-tion of proliferation and suppression of apoptosis by estro-gen in these ER-positive breast cancer cells. In addition toaffecting several important regulators of the cell cycle, E2altered the expression of many growth factors and growthfactor receptors, and up-regulated hormone biosynthetic en-zymes that might result in elevated levels of estrogenproduction.
Many genes affected by E2 are down-regulated
Of the more than 12,000 genes queried on the AffymetrixU95A microarray, we identified over 400 genes that showeda robust pattern of regulation by E2, but notably the majorityof these genes (70%) were, in fact, down-regulated. Althoughthere may be multiple mechanisms involved in this down-regulation, two mechanisms by which E2 has been shown torepress gene expression involve the inhibition of NF-�B, suchas occurs for E2 down-regulation of IL-6, or squelching/sequestering of shared transcriptional coactivators thatmight be necessary for maintaining basal gene expression(6–8). Both mechanisms seem plausible, as NF-�B signalinghas been detected in breast cancer cells and has been impli-cated in the progression of breast cancer from ER-positive toER-negative status (41, 42). Also, our finding that multipletranscriptional coactivators are down-regulated by E2 sug-gests that some of the estrogen-induced down-regulation ofgenes could be due at least in part to changes in levels oflimiting transcriptional coregulators.
Time course and level of regulation: primary vs.secondary responses
The time-course studies we have performed, spanningtimes up to 48 h, reveal a diversity of temporal patterns ofgene regulation by E2. One can use these patterns as a generalguide to assist in identifying genes that are likely to beprimary responses vs. secondary responses to the hormone.Although genes that show rapid changes in mRNA levels arelikely to be primary response genes, and those that show alag before changing are likely to be secondary, the half-lifeof the specific mRNA will also be an important factor in
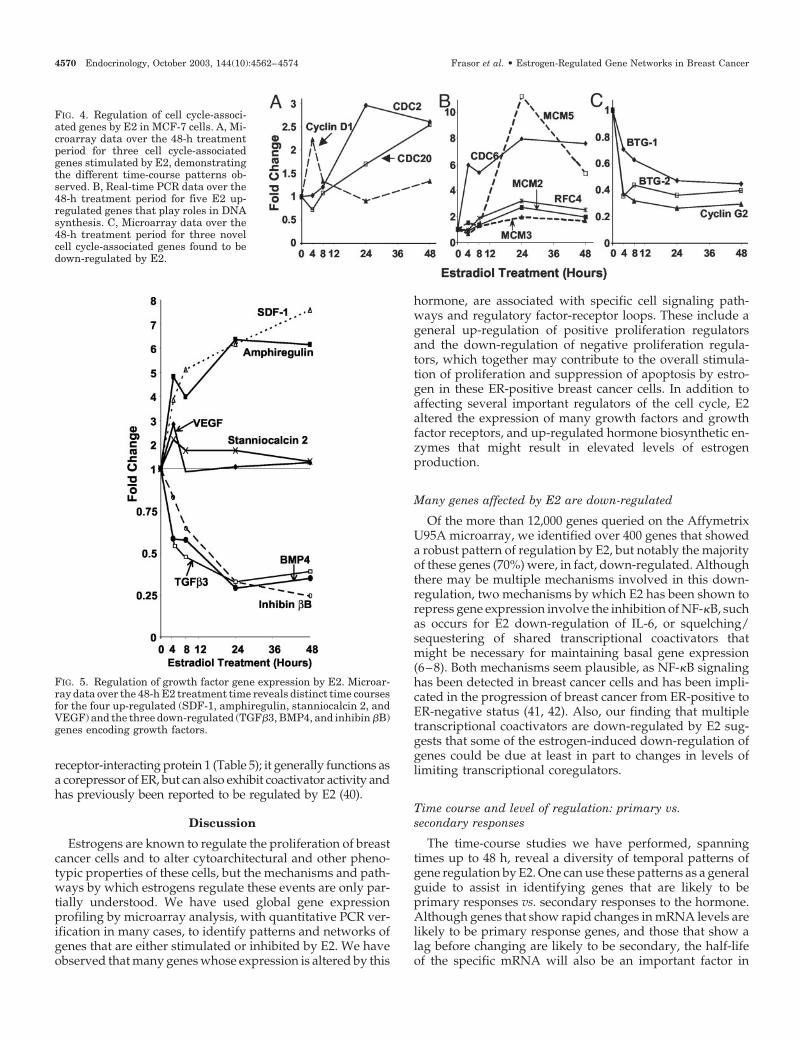
FIG. 5. Regulation of growth factor gene expression by E2. Microar-ray data over the 48-h E2 treatment time reveals distinct time coursesfor the four up-regulated (SDF-1, amphiregulin, stanniocalcin 2, andVEGF) and the three down-regulated (TGF�3, BMP4, and inhibin �B)genes encoding growth factors.
FIG. 4. Regulation of cell cycle-associ-ated genes by E2 in MCF-7 cells. A, Mi-croarray data over the 48-h treatmentperiod for three cell cycle-associatedgenes stimulated by E2, demonstratingthe different time-course patterns ob-served. B, Real-time PCR data over the48-h treatment period for five E2 up-regulated genes that play roles in DNAsynthesis. C, Microarray data over the48-h treatment period for three novelcell cycle-associated genes found to bedown-regulated by E2.
4570 Endocrinology, October 2003, 144(10):4562–4574 Frasor et al. • Estrogen-Regulated Gene Networks in Breast Cancer

FIG. 6. Regulation by E2 of genes encoding receptorsand signal transduction proteins. A and B, Microarraydata are shown for prostaglandin E synthase (PGES)and prostaglandin receptor EP3, which are both stim-ulated by E2, and for the chemokine receptor CXCR4and the signaling protein B cell linker (BLNK), whichare both down-regulated by E2. C and D, Real-time PCRdata are shown for four receptors found to be eitherrapidly up-regulated or down-regulated by E2.
FIG. 7. Time course of regulation by E2 for mem-bers of two families of transcription factors(HOXC and Myb). A, Microarray data for HOXC4,C5, and C6 gene expression showing similar timecourses, but different magnitudes of change. B,Real-time PCR data for A-Myb, B-Myb, and C-Myb transcription factors showing different timecourses and magnitudes of change. C, Real-timePCR data investigating the ability of CHX to blockthe 24-h E2 stimulation of A-Myb, B-Myb, or C-Myb gene expression.
Frasor et al. • Estrogen-Regulated Gene Networks in Breast Cancer Endocrinology, October 2003, 144(10):4562–4574 4571
determining how long it takes to detect a change, either upor down, in the mRNA level of a specific gene.
A more definitive way to distinguish primary from sec-ondary responses often employs the use of cycloheximide,which should not affect primary gene responses, but shouldblock secondary mRNA responses. We chose to probe thispoint in one particular case, that of the three Mybs. As seenin Fig. 7C, the A-, B-, and C-Myb transcription factors wereall stimulated by E2, with the changes in A- and C-Myb beingrapid, but B-Myb showing a distinct lag before stimulation.Cycloheximide had no effect on A- and C-Myb stimulation,but blocked B-Myb stimulation very effectively, indicatingthat the two genes that showed the rapid response wereprimary, whereas the gene with the late pattern of increasewas not a primary response gene. Thus, in this case the timecourse of response to estrogen was predictive of primary vs.secondary gene responsiveness. Although time-course datacan be useful as a general guide, definitive determination ofwhether a gene response is primary would need to be eval-uated in genes of interest individually.
Motifs in the regulation of proliferation: up-regulation ofpositive and down-regulation of negative factors
E2 up-regulates genes such as cyclin D1, cyclin A2, cdc2(cdk1), cdc20, and some novel genes we identified, such asBub1, that are involved in the progression of the cell cycle,and genes involved in DNA synthesis, such as RFC4, pro-liferating cell nuclear antigen, CDC6, and MCM proteins 2,3, and 5. Interestingly, the gene survivin (BIRC5), whichencodes an inhibitor of apoptosis, was found by us to beup-regulated by E2 and has recently been shown to protectMCF-7 cells from etoposide-induced apoptosis (43). Otherpositive growth-promoting effects of E2 occur through theinduction of growth factors and transcription factors, such asSDF-1, which was recently shown to play a role in E2 inducedovarian cancer cell proliferation (44). Interestingly, the tran-scription factors HOXC6 and A-Myb, which we found to behighly induced by E2 at early time points, have both beenshown through mouse knockout models to be required fornormal mammary gland development (45, 46). AlthoughHOXC6 is essential for normal mammary gland develop-ment, it noteworthy that its synthesis is actually down-regulated by E2 in normal mouse mammary gland epithe-lium (45). Whether the up-regulation of HOXC6 or theprimary induction of A-Myb by E2 in breast cancer cellscontributes to the progression of breast cancer cell prolifer-ation is currently under investigation.
Perhaps the most novel finding of this work is that E2-induced enhancement of cell proliferation and of cell cycleprogression is associated with the down-regulation of nu-merous factors that are known to inhibit the cell cycle. Hence,E2 down-regulates genes directly involved in inhibition ofthe cell cycle, such as BTG-1, BTG-2, and cyclin G2, and alsodown-regulates cytokines and growth factors that are knownto inhibit cell proliferation, such as members of the TGF�superfamily. Although TGF-�3 is known to be down-regu-lated by E2 in MCF-7 cells and to inhibit breast cancer cellproliferation (47), BMP4 has not yet been shown to play a rolein breast cancer. It is known to be stimulated by antiestrogensin bone cells, but it has not previously been implicated inplaying a role in breast cancer, whereas BMP2 is known toinhibit breast cancer cell proliferation, suggesting that, likeBMP2 and TGF�, BMP4 may also be growth inhibitory (48,49). In addition, activin is growth inhibitory to breast cancercells (41, 45), and it is of interest that its subunit inhibin �Bwas significantly down-regulated by E2.
E2 down-regulation of multiple transcriptional repressorscould also contribute to increased cell proliferation. For ex-ample, Mad4 antagonizes Myc action by competing for theirbinding partner Max and forming dimers with Max that bindto E boxes in Myc target genes, thereby repressing transcrip-tion (50). Thus, E2 could enhance Myc activity not only byup-regulating c-Myc, but additionally by down-regulatingan inhibitor of Myc. Also, the transcription factor JunB,which is a member of the AP-1 transcription factor family,may act as a negative regulator of transcription throughAP-1, particularly in the presence of c-Jun and when actingon cell proliferation-associated genes (51). Therefore, by up-regulation of c-Fos and down-regulation of JunB, E2 couldfurther enhance growth stimulatory gene transcription
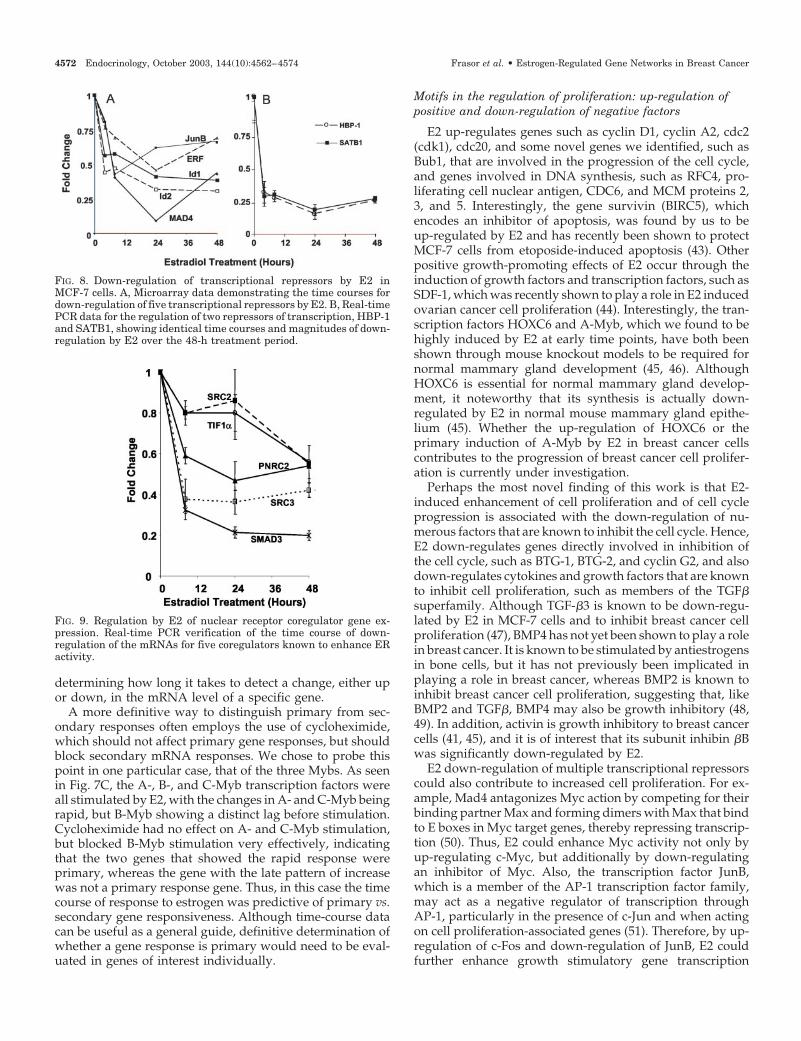
FIG. 8. Down-regulation of transcriptional repressors by E2 inMCF-7 cells. A, Microarray data demonstrating the time courses fordown-regulation of five transcriptional repressors by E2. B, Real-timePCR data for the regulation of two repressors of transcription, HBP-1and SATB1, showing identical time courses and magnitudes of down-regulation by E2 over the 48-h treatment period.
FIG. 9. Regulation by E2 of nuclear receptor coregulator gene ex-pression. Real-time PCR verification of the time course of down-regulation of the mRNAs for five coregulators known to enhance ERactivity.
4572 Endocrinology, October 2003, 144(10):4562–4574 Frasor et al. • Estrogen-Regulated Gene Networks in Breast Cancer

through AP-1. Other transcriptional repressors whose down-regulation by E2 may contribute to enhanced cell prolifera-tion include HBP1, which can represses Wnt signaling (52,53), and ERF, which represses the transcription of promoterscontaining an ets-binding site and is inactivated by the Ras/MAPK pathway (54). This down-regulation of multiple tran-scriptional repressors (such as JunB, Mad4, HBP1, and ERF)suggests that one major function of E2 in breast cancer cellsis perhaps to increase the transcriptional activity of numer-ous cell transduction pathways, several of which appear tobe involved in the regulation of cell proliferation.
E2 modification of its own synthesis and of ER actions
A particularly interesting regulatory loop that may con-tribute to the amplification of E2-induced processes is thatinvolving prostaglandin and prostaglandin receptors, andthe genes that they regulate. Prostaglandin E synthase (alsoknown as PIG12) (55) and prostaglandin E receptor type 3(EP3) were found to be up-regulated by E2. By up-regulatingprostaglandin E synthase, estrogen could be increasing theproduction of prostaglandin E2. This hormone can act on theprostaglandin EP1 or EP2 receptors to stimulate aromataseactivity in breast cancer, thereby raising estrogen levels inthese cells (56). This suggests the intriguing possibility thatE2 could be up-regulating its own synthesis in a feedforwardcascade that involves up-regulation of prostaglandin E syn-thase and the subsequent action of increased prostaglandinE2 levels on prostaglandin receptors, which would up-reg-ulate the aromatase gene.
In contrast to the potential stimulatory effects on its ownproduction, E2 might act in a classical negative feedback loopon ER activity through the down-regulation of many genes,the products of which are known to enhance ER activity.These would include SRC2, SRC3, TIF1�, PNRC2, andSMAD3. In addition, as observed by others (41) and by us,E2 up-regulated the receptor corepressor RIP140. These ob-servations are of particular interest because although themechanisms of how coregulators function are being wellstudied, little is known about how coregulator expression isregulated. Overall, these findings suggest that E2 acts to alterlevels of coregulators in a manner that would result in adecrease in ER� activity, but whether this represents a clas-sical negative feedback mechanism is not known. Alterna-tively, these changes could represent an overall change in thecomplement of cellular coregulators, leading to the prefer-ential action of some coregulators over others. For example,the level of SRC1, which was not regulated by E2, would beincreased in MCF-7 cells relative to the p160 steroid receptorcoactivators SRC2/TIF2 and SRC3, both of which are down-regulated by E2 (57). Several recent studies have shown thatthe levels of coregulators, relative to one another, may dictatehow a cell will respond to hormone. For example, the levelof SRC1 in uterine cells is a critical determinant of how thesecells respond to the SERM tamoxifen (12). Also, the balancebetween SRC1 and SRC2, which is down-regulated by E2,can determine peroxisome proliferator-activated receptor �activity and adipogenesis in mice (58). Whether this down-regulation of important coactivators by E2 contributes to theE2-induced down-regulation of the numerous estrogen-
responsive genes we have observed remains to be inves-tigated.
In summary, our studies highlight the diverse gene net-works and metabolic and cell regulatory pathways throughwhich E2 operates to alter the proliferation and phenotype ofbreast cancer cells, and they demonstrate the very wide-spread effects of this hormone on breast cancer cells.
Acknowledgments
We thank Dennis Akan and Mark Band (University of Illinois Bio-technology Center) for assistance with microarray analyses.
Received May 7, 2003. Accepted July 1, 2003.Address all correspondence and requests for reprints to: Dr. Benita
S. Katzenellenbogen, Department of Molecular and Integrative Physi-ology, University of Illinois, 524 Burrill Hall, 407 South GoodwinAvenue, Urbana, Illinois 61801-3704. E-mail: [email protected].
This work was supported by NIH Grants CA-18119 and T32-HD-07028 and the Breast Cancer Research Foundation.
References
1. Katzenellenbogen BS, Katzenellenbogen JA 2000 Estrogen receptor tran-scription and transactivation: estrogen receptor � and estrogen receptor �:regulation by selective estrogen receptor modulators and importance in breastcancer. Breast Cancer Res 2:335–344
2. Hall JM, Couse JF, Korach KS 2001 The multifaceted mechanisms of estradioland estrogen receptor signaling. J Biol Chem 276:36869–36872
3. McDonnell DP, Norris JD 2002 Connections and regulation of the humanestrogen receptor. Science 296:1642–1644
4. Kushner PJ, Agard DA, Greene GL, Scanlan TS, Shiau AK, Uht RM, WebbP 2000 Estrogen receptor pathways to AP-1. J Steroid Biochem Mol Biol 74:311–317
5. Safe S 2001 Transcriptional activation of genes by 17�-estradiol through es-trogen receptor-Sp1 interactions. Vitam Horm 62:231–252
6. McKay LI, Cidlowski JA 1999 Molecular control of immune/inflammatoryresponses: interactions between nuclear factor-�B and steroid receptor-signal-ing pathways. Endocr Rev 20:435–459
7. Harnish DC, Scicchitano MS, Adelman SJ, Lyttle CR, Karathanasis SK 2000The role of CBP in estrogen receptor cross-talk with nuclear factor-�B in HepG2cells. Endocrinology 141:3403–3411
8. Speir E, Yu ZX, Takeda K, Ferrans VJ, Cannon 3rd RO 2000 Competition forp300 regulates transcription by estrogen receptors and nuclear factor-�B inhuman coronary smooth muscle cells. Circ Res 87:1006–1011.
9. Cerillo G, Rees A, Manchanda N, Reilly C, Brogan I, White A, Needham M1998 The oestrogen receptor regulates NF�B and AP-1 activity in a cell-specificmanner. J Steroid Biochem Mol Biol 67:79–88
10. Evans MJ, Eckert A, Lai K, Adelman SJ, Harnish DC 2001 Reciprocal an-tagonism between estrogen receptor and NF-�B activity in vivo. Circ Res89:823–830
11. Maret A, Clamens S, Delrieu I, Elhage R, Arnal JF, Bayard F 1999 Expressionof the interleukin-6 gene is constitutive and not regulated by estrogen in ratvascular smooth muscle cells in culture. Endocrinology 140:2876–2882
12. Shang Y, Brown M 2002 Molecular determinants for the tissue specificity ofSERMs. Science 295:2465–2468
13. Katzenellenbogen BS, Katzenellenbogen JA 2002 Defining the “S” in SERMs.Science 295:2380–2381
14. Margeat E, Bourdoncle A, Margueron R, Poujol N, Cavailles V, Royer C 2003Ligands differentially modulate the protein interactions of the human estrogenreceptors � and �. J Mol Biol 326:77–92
15. Dang ZC, Audinot V, Papapoulos SE, Boutin JA, Lowik CW 2003 Peroxisomeproliferator-activated receptor � (PPAR�) as a molecular target for the soyphytoestrogen genistein. J Biol Chem 278:962–967
16. Jiang Y, Harlocker SL, Molesh DA, Dillon DC, Stolk JA, Houghton RL,Repasky EA, Badaro R, Reed SG, Xu J 2002 Discovery of differentially ex-pressed genes in human breast cancer using subtracted cDNA libraries andcDNA microarrays. Oncogene 21:2270–2282
17. van de Vijver MJ, He YD, van’t Veer LJ, Dai H, Hart AA, Voskuil DW,Schreiber GJ, Peterse JL, Roberts C, Marton MJ, Parrish M, Atsma D, Wit-teveen A, Glas A, Delahaye L, van der Velde T, Bartelink H, Rodenhuis S,Rutgers ET, Friend SH, Bernards R 2002 A gene-expression signature as apredictor of survival in breast cancer. N Engl J Med 347:1999–2009
18. van’t Veer LJ, Dai H, van de Vijver MJ, He YD, Hart AA, Mao M, PeterseHL, van der Kooy K, Marton MJ, Witteveen AT, Schreiber GJ, KerkhovenRM, Roberts C, Linsley PS, Bernards R, Friend SH 2002 Gene expressionprofiling predicts clinical outcome of breast cancer. Nature 415:530–536
Frasor et al. • Estrogen-Regulated Gene Networks in Breast Cancer Endocrinology, October 2003, 144(10):4562–4574 4573

19. Sotiriou C, Powles TJ, Dowsett M, Jazaeri AA, Feldman AL, Assersohn L,Gadisetti C, Libutti SK, Liu ET 2002 Gene expression profiles derived fromfine needle aspiration correlate with response to systemic chemotherapy inbreast cancer. Breast Cancer Res 4:R3
20. Zajchowski DA, Bartholdi MF, Gong Y, Webster L, Liu HL, Munishkin A,Beauheim C, Harvey S, Ethier SP, Johnson PH 2001 Identification of geneexpression profiles that predict the aggressive behavior of breast cancer cells.Cancer Res 61:5168–5178
21. Perou CM, Sorlie T, Eisen MB, van de Rijn M, Jeffrey SS, Rees CA, PollackJR, Ross DT, Johnsen H, Akslen LA, Fluge O, Pergamenschikov A, WilliamsC, Zhu SX, Lonning PE, Borresen-Dale AL, Brown PO, Botstein D 2000Molecular portraits of human breast tumours. Nature 406:747–752
22. Sorlie T, Perou CM, Tibshirani R, Aas T, Geisler S, Johnsen H, Hastie T,Eisen MB, van de Rijn M, Jeffrey SS, Thorsen T, Quist H, Matese JC, BrownPO, Botstein D, Eystein Lonning P, Borresen-Dale AL 2001 Gene expressionpatterns of breast carcinomas distinguish tumor subclasses with clinical im-plications. Proc Natl Acad Sci USA 98:10869–10874
23. Hedenfalk IA, Ringner M, Trent JM, Borg A 2002 Gene expression in inher-ited breast cancer. Adv Cancer Res 84:1–34
24. West M, Blanchette C, Dressman H, Huang E, Ishida S, Spang R, Zuzan H,Olson Jr JA, Marks JR, Nevins JR 2001 Predicting the clinical status of humanbreast cancer by using gene expression profiles. Proc Natl Acad Sci USA98:11462–11467
25. Dressman MA, Walz TM, Lavedan C, Barnes L, Buchholtz S, Kwon I, EllisMJ, Polymeropoulos MH 2001 Genes that co-cluster with estrogen receptor �in microarray analysis of breast biopsies. Pharmacogenom J 1:135–141
26. Gruvberger S, Ringner M, Chen Y, Panavally S, Saal LH, Borg A, Ferno M,Peterson C, Meltzer PS 2001 Estrogen receptor status in breast cancer isassociated with remarkably distinct gene expression patterns. Cancer Res61:5979–5984
27. Soulez M, Parker MG 2001 Identification of novel oestrogen receptor targetgenes in human ZR75–1 breast cancer cells by expression profiling. J MolEndocrinol 27:259–274
28. Omoto Y, Hayashi S 2002 A study of estrogen signaling using DNA microarrayin human breast cancer. Breast Cancer 9:308–311
29. Inoue A, Yoshida N, Omoto Y, Oguchi S, Yamori T, Kiyama R, Hayashi S2002 Development of cDNA microarray for expression profiling of estrogen-responsive genes. J Mol Endocrinol 29:175–192
30. Lobenhofer EK, Bennett L, Cable PL, Li L, Bushel PR, Afshari CA 2002Regulation of DNA replication fork genes by 17�-estradiol. Mol Endocrinol16:1215–1229
31. Jelinsky SA, Harris HA, Brown EL, Flanagan K, Zhang X, Tunkey C, Lai K,Lane MV, Simcoe DK, Evans MJ 2003 Global transcription profiling of es-trogen activity: estrogen receptor � regulates gene expression in the kidney.Endocrinology 144:701–710
32. Livak KJ, Schmittgen TD 2001 Analysis of relative gene expression data usingreal-time quantitative PCR and the 2(-Delta Delta C(T)) method. Methods25:402–408
33. Tirone F 2001 The gene PC3(TIS21/BTG2), prototype member of the PC3/BTG/TOB family: regulator in control of cell growth, differentiation, and DNArepair? J Cell Physiol 187:155–165
34. Bennin DA, Don AS, Brake T, McKenzie JL, Rosenbaum H, Ortiz L, DePaoli-Roach AA, Horne MC 2002 Cyclin G2 associates with protein phosphatase 2Acatalytic and regulatory B’ subunits in active complexes and induces nuclearaberrations and a G1/S phase cell cycle arrest. J Biol Chem 277:27449–27467
35. Dickson RB, Lippman ME 1987 Estrogenic regulation of growth and polypep-tide growth factor secretion in human breast carcinoma. Endocr Rev 8:29–43
36. Guinamard R, Signoret N, Ishiai M, Marsh M, Kurosaki T, Ravetch JV,Masamichi I 1999 B cell antigen receptor engagement inhibits stromal cell-derived factor (SDF)-1� chemotaxis and promotes protein kinase C (PKC)-induced internalization of CXCR4. J Exp Med 189:1461–1466
37. McKenna NJ, Lanz RB, O’Malley BW 1999 Nuclear receptor coregulators:cellular and molecular biology. Endocr Rev 20:321–344
38. Zhou D, Chen S 2001 PNRC2 is a 16 kDa coactivator that interacts with nuclearreceptors through an SH3-binding motif. Nucleic Acids Res 29:3939–3948
39. Matsuda T, Yamamoto T, Muraguchi A, Saatcioglu F 2001 Cross-talk betweentransforming growth factor-� and estrogen receptor signaling through Smad3.J Biol Chem 276:42908–42914
40. Thenot S, Charpin M, Bonnet S, Cavailles V 1999 Estrogen receptor cofactorsexpression in breast and endometrial human cancer cells. Mol Cell Endocrinol156:85–93
41. Nakshatri H, Bhat-Nakshatri P, Martin DA, Goulet Jr RJ, Sledge Jr GW 1997Constitutive activation of NF-�B during progression of breast cancer to hor-mone-independent growth. Mol Cell Biol 17:3629–3639.
42. Biswas DK, Dai SC, Cruz A, Weiser B, Graner E, Pardee AB 2001 The nuclearfactor �B (NF-�B): a potential therapeutic target for estrogen receptor negativebreast cancers. Proc Natl Acad Sci USA 98:10386–10391
43. Choi KS, Lee TH, Jung MH 2003 Ribozyme-mediated cleavage of the humansurvivin mRNA and inhibition of antiapoptotic function of survivin in MCF-7cells. Cancer Gene Ther 10:87–95
44. Hall JM, Korach KS 2003 Stromal cell-derived factor 1, a novel target ofestrogen receptor action, mediates the mitogenic effects of estradiol in ovarianand breast cancer cells. Mol Endocrinol 17:792–803
45. Garcia-Gasca A, Spyropoulos DD 2000 Differential mammary morphogenesisalong the anteroposterior axis in Hoxc6 gene targeted mice. Dev Dyn 219:261–276
46. Toscani A, Mettus RV, Coupland R, Simpkins H, Litvin J, Orth J, Hatton KS,Reddy EP 1997 Arrest of spermatogenesis and defective breast developmentin mice lacking A-myb. Nature 386:713–717
47. Arrick BA, Korc M, Derynck R 1990 Differential regulation of expression ofthree transforming growth factor � species in human breast cancer cell linesby estradiol. Cancer Res 50:299–303
48. van den Wijngaard A, Mulder WR, Dijkema R, Boersma CJ, Mosselman S,van Zoelen EJ, Olijve W 2000 Antiestrogens specifically up-regulate bonemorphogenetic protein-4 promoter activity in human osteoblastic cells. MolEndocrinol 14:623–633
49. Ghosh-Choudhury N, Woodruff K, Qi W, Celeste A, Abboud SL, GhoshChoudhury G 2000 Bone morphogenetic protein-2 blocks MDA MB 231 hu-man breast cancer cell proliferation by inhibiting cyclin-dependent kinase-mediated retinoblastoma protein phosphorylation. Biochem Biophys ResCommun 272:705–711
50. Grandori C, Cowley SM, James LP, Eisenman RN 2000 The Myc/Max/Madnetwork and the transcriptional control of cell behavior. Annu Rev Cell DevBiol 16:653–699
51. Shaulian E, Karin M 2002 AP-1 as a regulator of cell life and death. Nat CellBiol 4:E131–136
52. Tevosian SG, Shih HH, Mendelson KG, Sheppard KA, Paulson KE, Yee AS1997 HBP1: a HMG box transcriptional repressor that is targeted by the ret-inoblastoma family. Genes Dev 11:383–396
53. Sampson EM, Haque ZK, Ku MC, Tevosian SG, Albanese C, Pestell RG,Paulson KE, Yee AS 2001 Negative regulation of the Wnt-�-catenin pathwayby the transcriptional repressor HBP1. EMBO J 20:4500–4511
54. Sgouras DN, Athanasiou MA, Beal Jr GJ, Fisher RJ, Blair DG, Mavroth-alassitis GJ 1995 ERF: an ETS domain protein with strong transcriptionalrepressor activity, can suppress ets-associated tumorigenesis and is regulatedby phosphorylation during cell cycle and mitogenic stimulation. EMBO J14:4781–4793
55. Jakobsson PJ, Thoren S, Morgenstern R, Samuelsson B 1999 Identification ofhuman prostaglandin E synthase: a microsomal, glutathione-dependent, in-ducible enzyme, constituting a potential novel drug target. Proc Natl Acad SciUSA 96:7220–7225
56. Brueggemeier RW, Richards JA, Joomprabutra S, Bhat AS, Whetstone JL2001 Molecular pharmacology of aromatase and its regulation by endogenousand exogenous agents. J Steroid Biochem Mol Biol 79:75–84
57. Lauritsen KJ, List HJ, Reiter R, Wellstein A, Riegel AT 2002 A role for TGF-�in estrogen and retinoid mediated regulation of the nuclear receptor coacti-vator AIB1 in MCF-7 breast cancer cells. Oncogene 21:7147–7155
58. Picard F, Gehin M, Annicotte JS, Rocchi S, Champy MF, O’Malley BW,Chambon P, Auwerx J 2002 SRC-1 and TIF2 control energy balance betweenwhite and brown adipose tissues. Cell 111:931–941
4574 Endocrinology, October 2003, 144(10):4562–4574 Frasor et al. • Estrogen-Regulated Gene Networks in Breast Cancer