prognostic and predictive markers for breast cancer management · 70 prognosis genes tumor samples...
TRANSCRIPT

Prognostic and predictive markers for breast cancer management
www.abc-lisbon.org
F. Cardoso, MDDirector, Breast Unit, Champalimaud Clinical Center, Lisbon, Portugal
ESMO Board of Directors & NR Committee Chair
ESO Breast Cancer Program Coordinator & ABC Global Alliance Chair
EORTC Breast Group Past-Chair

DISCLOSURES SLIDE
Financial disclosures:
Personal financial interest in form of consultancy role for: Amgen,
Astellas/Medivation, AstraZeneca, Celgene, Daiichi-Sankyo, Eisai, GE Oncology,
Genentech, GlaxoSmithKline, Macrogenics, Merck-Sharp, Merus BV, Mylan,
Mundipharma, Novartis, Pfizer, Pierre-Fabre, Roche, Sanofi, Seattle Genetics, Teva.
Institutional financial support for clinical trials from: Amgen, Astra-Zeneca,
Boehringer-Ingelheim, Bristol-Myers-Squibb, Daiichi, Eisai, Fresenius GmbH,
Genentech, GlaxoSmithKline, Ipsen, Incyte, Nektar Therapeutics, Nerviano, Novartis,
Macrogenics, Medigene, MedImmune, Merck, Millenium, Pfizer, Pierre-Fabre,
Roche, Sanofi-Aventis, Sonus, Tigris, Wilex, Wyeth.
Non-Financial disclosures:
Chair ABC Global Alliance and ABC Consensus Conference and Guidelines.
Member/Committee Member of ESMO, ESO, EORTC-BCG, IBCSG, SOLTI, ASCO,
AACR, EACR, SIS, ASPIC.
I am one of the PIs of the MINDACT study (but I have no financial interests related
to MammaPrint).

Copyright © American Society of Clinical Oncology
Outcomes of Adjuvant Chemotherapy in Breast Cancer
Walgren et al. JCO 2005;23:7342-7349

L-PAM, MF
CMF x 6
AC x 4
FAC → FEC x 6
A(E) → CMF
AC x 4 → Paclitaxel x 4
TAC x 6
FEC → docetaxel
AC → paclitaxel dose-dense
±
+
++
+++
++
+++
±
+
Average treatment
effect
Financial toxicity
1970’s 1980’s 1990’s 2000’s
Successive generations of adjuvant CT regimens
Adapted from G. Hortobagyi
d) ≈ 20.000 $
c) ≈13.800 $
b) ≈ 7.400 $
a) ≈ 800 $
+++ ADJUVANT TRASTUZUMAB+++
++ ADJUVANT AIs ++
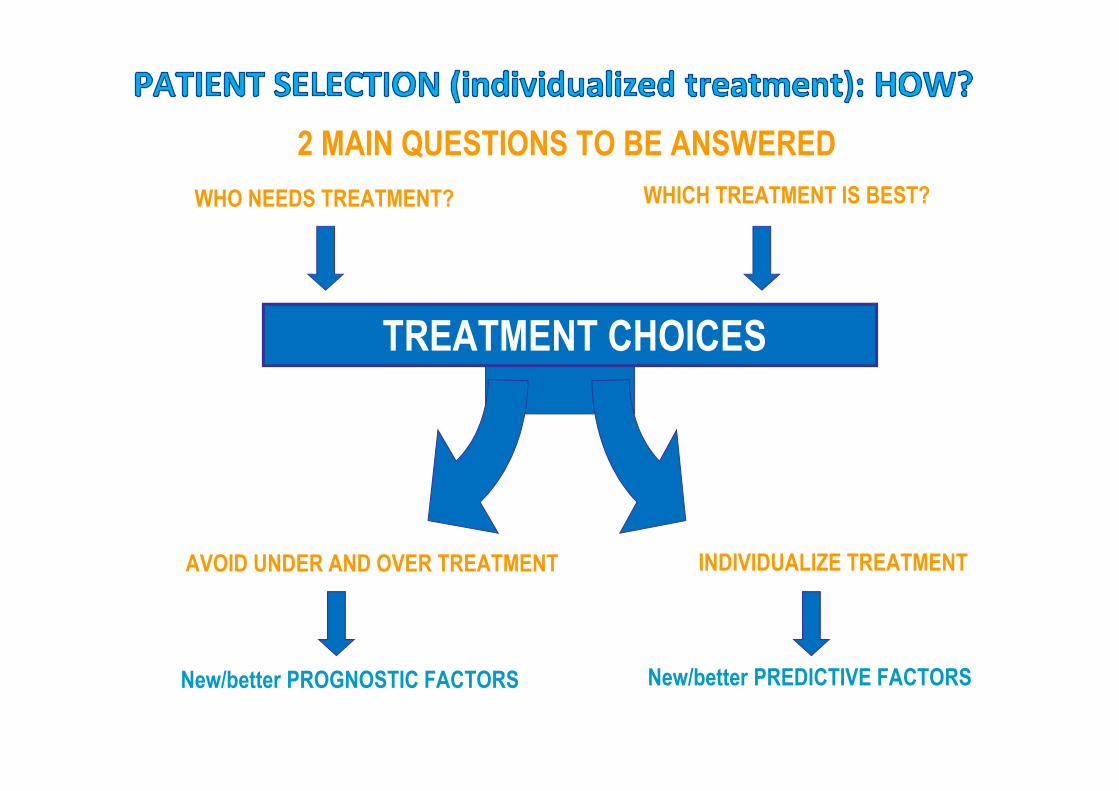
WHO NEEDS TREATMENT? WHICH TREATMENT IS BEST?
TREATMENT CHOICES
AVOID UNDER AND OVER TREATMENT INDIVIDUALIZE TREATMENT
2 MAIN QUESTIONS TO BE ANSWERED
New/better PROGNOSTIC FACTORS New/better PREDICTIVE FACTORS

CLINICAL IMPLEMENTATION OF BIOMARKERS
Biomarker
ANALYTICAL
VALIDATION
• Accuracy and prediction in measurement of the
analytes
• Robustness
CLINICAL
VALIDATION
• Correlation of score/classifier with clinical state or
outcome
CLINICAL UTILITY • Actionable (could affect treatment)
• Use results for patient benefit
Courtesy F. Penault-Llorca
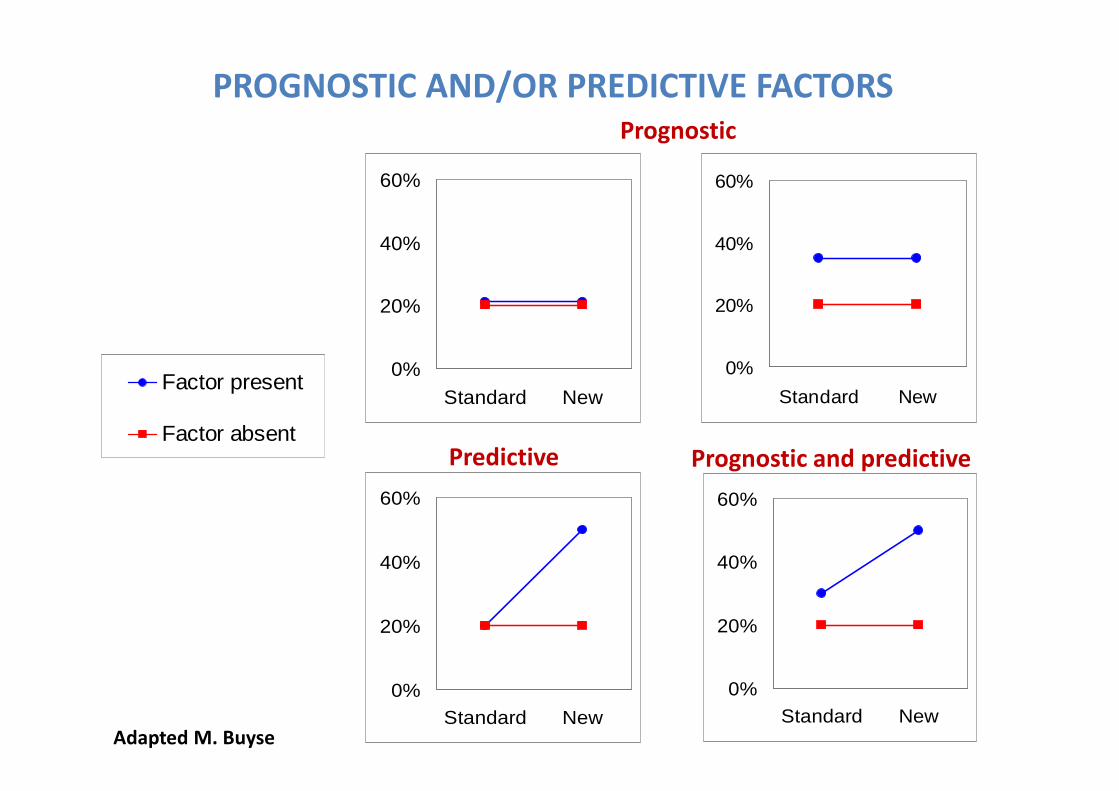
PROGNOSTIC AND/OR PREDICTIVE FACTORS
0%
20%
40%
60%
Standard New
0%
20%
40%
60%
Standard New
0%
20%
40%
60%
Standard New0%
20%
40%
60%
Standard New
0%10%20%30%40%50%60%
Control Treated
Factor present
Factor absent
Prognostic
Predictive Prognostic and predictive
Adapted M. Buyse

Sources of variation in biomarkers
testingTime to slicing and
fixation Method of tissue
processing
Type of
fixation
Equipment
calibration
Laboratory
procedures
Time of
fixation
Assay
validation
Staff competence
Type of antigen
retrieval
Test reagents
Control
materials
Assay
conditions
Use of
image
analysis
Interpretation
criteria
Reporting
elements
Scoring
system
Wolff et al 2007
IHC, ISH
testing
variables
Post-analytical Pre-analytical
Analytical

PROGNOSTIC FACTORS

CLINICOPATHOLOGICAL PROGNOSTIC FACTORS IN EBC
• Tumor size
• Lymph node status
• Grade
• ER, PR and HER-2 receptor expression
• Presence of lymphovascular invasion

PROGNOSTIC ALGORITHMS FOR TREATMENT
DECISION MAKING
• Predict Plus
• Adjuvant! Online
• Nottingham Prognostic Index
INTERNATIONAL TREATMENT GUIDELINES
� ESMO, St. Gallen, NCCN, ASCO, AGO, Cancer Care Ontario
Clinical Practice Guidelines, and others...

PROGNOSTIC VALUE OF BC MOLECULAR SUBTYPES
Courtesy of MJ Brito�UR����UI��V�A��U

MOLECULAR CLASSIFICATION OF BREAST CANCER - SURROGATES
Subtype Molecular characteristics Histological characteristics
SURROGATES
Biology/treatment
Luminal A • luminal CK expression
• resembles normal
epithelium cells
• ER+
• low grade/low proliferation
• indolent behaviour
• sensitive to hormonal therapy
Luminal B •similar than luminal A • ER+ (lower expression than
in luminal A)
• high grade/high
proliferation
• more aggressive behaviour
than luminal A
•less sensitive to hormonal
therapy than luminal A
Basal-like • without expression of ER, PR
and HER-2 genes
•basal CK expression (CK5)
• expression of growth factors
(EGFR, c-kit, HGF, IGF)
• BRCA disfunction
• genetic instability
•“ Triple negative”
(ER-, PR -, HER 2-)
• high grade/high
proliferation
• aggressive behaviour
• sensitive to chemotherapy
Her-2
enriched
• amplification of HER-2 gene
and overexpression of HER-2
receptor
• HER 2+ • aggressive
• sensitive to anti-HER-2 therapy
• sensitive to chemotherapy

PROGNOSTIC VALUE OF SUBTYPES IHC SURROGATES
Dent et al, Clin Cancer Res, 2007
CRUCIAL ROLE OF HIGH QUALITY PATHOLOGY
(and also cost-effective!)

Variable MammaPrint Oncotype DX Breast Cancer
Index
PAM 50 ROR EndoPredict
Clin
Provider Agendia Genomic Health Biotheranostics NanoString Sividon
Type of assay 70-gene assay
Centralized
21-gene recurrence
score
Centralized
2-gene ratio (H/I) and
molecular grade
index
Decentralized
50-gene assay
Decentralized
12-gene assay
Decentralized
Type of tissue
sample
Fresh frozen or FFPE FFPE FFPE FFPE FFPE
Technique DNA microarray, also
qRT-PCR
qRT-PCR qRT-PCR qRT-PCR qRT-PCR
Clinical
application
Prognosis of N 0-3,
ER+/ER neg,
untreated
Early Relapses
Prognosis in ER+/HER2
neg, N0-3, treated
with TAM
Early Relapses
Prognostic in ER+,
prediction of
response to TAM
Early and Late
Relapses
Originally for intrinsic
subtyping, prognosis
Early and Late
Relapses
Prognosis for
ER/HER-2 neg, N0
Early and Late
relapses
Results
presentation
Dichotomous, good
or poor prognosis
Low, intermediate and
high risk groups
Continuous variable Continuous variable Dichotomous, low
or high risk
Level of
evidence
I A for prognosis and
CT decision
I A for prognosis and
CT decision
I B for prognosis I B for prognosis I B for prognosis
FDA clearance YES NO NO YES NO

FIRST GENERATION SIGNATURES

Recurrence Score/Oncotype DX®
• A RT-PCR-based gene signature that measures the expression of 21 genes (16
cancer-related genes and 5 reference genes)
• It uses the Recurrence score (RS) to predict the risk of distant relapse within
10 years
• Developed in ER+, under tamoxifen treatment
• Extensive retrospective validation; ongoing prospective validation
p < .001 Paik, NEJM 2004

Oncotype DX® in Node Negative BCPaik , JCO 2006
• NSABP B-20 :ER+, N0, CT (CMF regimen); 651pts (227 TAM /424 TAM+CT)
• High RS (≥ 31): benefited from CT (RR 0.26 (95% CI, 0.13 -0.53), relative risk
reduction in 10 yrs 27.6% (SE 8.0%))
• Low RS (< 18) no significant benefit from CT (RR 1.31 (95% CI, 0.46 – 3.78),
relative risk reduction in 10 yrs -1.1% (SE 2.2%))

Oncotype DX® in node-positive BCAlbain - Lancet Oncol 2010
• SWOG 8814 trial – postmenopausal women, ER+, N+, CT (CAF)
• 367 pts (TAM 148/ CAF-TAM 219)
• No benefit of CT for pts with RS < 18 (p=0.97, HR 1.02 (95%: CI, 0.54–
1.93))
• Better DFS with CT for pts with high RS (≥31) (p=0.033, HR 0.59
(CI95%: 0.35–1.01))

Oncotype DX® and response to anthracyclinesGianni et al. JCO 2005
• The Recurrence Score (RS) was positively associated with the
likelihood of pathologic complete response (pCR; measurement
of gene expression, p=0.005)
• No predictive value to differentiate between different
chemotherapy agents/regimens

TAILORx Methods: Treatment Assignment & RandomizationAccrued between April 2006 – October 2010
Preregister – Oncotype DX RS (N=11,232)
Register (N=10,273)
ARM A: Low RS 0-10
(N=1629 evaluable)
ASSIGN
Endocrine Therapy (ET)
Mid-Range RS 11-25
(N=6711 evaluable)
RANDOMIZEStratification Factors: Menopausal
Status, Planned Chemotherapy, Planned Radiation, and RS 11-15, 16-20, 21-25
ARM B: Experimental Arm
(N=3399)
ET Alone
ARM C: Standard Arm
(N=3312)
Chemo and ET
ARM D: High RS 26-100
(N=1389 evaluable)
ASSIGN
Chemo and ET
Joseph A. Sparano, MD

22
Results LOW RISK ARM (ET alone)No. of events: 88 iDFS events and 30 deaths within 5 years of registration, including 18 recurrences (10 distant as
first event), 15 second primary breast cancers, 43 other second primary cancers, 12 deaths without another event
5 year iDFS Rate 93.8%
(95% CI 92.4%, 94.9%)
5 year RFI Rate 98.7%
(95% CI 97.9%, 99.2%)
5 year DRFI Rate 99.3%
(95% CI 98.7%, 99.6%)
5 year OS Rate 98.0%
(95% CI 97.%, 98.6%)


24
TAILORx Results - ITT Population: All Arms (A,B,C & D)
IDFS
P<0.001
Joseph A. Sparano, MD
RS 0-10: Assigned to ET Alone
RS 11-25: Randomized to ET Alone
RS 11-25: Randomized to CHEMO + ET
RS 25-100: Assigned to CHEMO + ET
9-Year Event Rates
• RS 0-10 (Arm A)• 3% distant recurrence with ET
alone
• RS 11-25 (Arms B & C) • 5% distant recurrence rate overall• < 1% difference for all endpoints
• IDFS (83.3 vs. 84.3%)• DRFI (94.5 vs. 95.0%)• RFI (92.2 vs. 92.9%)• OS (93.9 vs. 93.8%)
• RS 26-100 (Arm D)• 13% distant recurrence despite
chemo + ET

Prospective WSG Phase III PlanB trial: Adjuvant 4xEC→4xDoc vs. 6xDocetaxel/Cyclophosphamide in high
clinical and intermediate/high genomic risk ER+/HER2-neg EBC
25
� pT>2� G2-3� uPA/PAI-1↑� HR-� age <35 years
� Age<75 years � cM0� free margins� pN+ � pN0 high risk
RANDOMIZATION
Doc75C600 x 6*
E90C600x4 �Doc100 x4*
RECURRENCE
SCORE
Endocrine therapy *0-3 LN and
RS<11
0-3 LN and RS>11
or >/= 4 LN
HR+
HR-
* Endocrine Therapy and RT according to national guidelinesE: Epirubcin; Doc: Docetaxel; C: Cyclophosphamide
Recurrence Score:after early amendment
Presented by: Nadia Harbeck, MD
Courtesy of Nadia Harbeck

Disease-free survival (DFS) for anthracycline-free regimen vs. standard chemotherapy in HER2-negative primary breast cancer.
� DFS = time from randomization to any relapse, secondary malignancy or death without recurrence� Results expected by 2017
26
� Prospective evaluation of prognostic impact of Recurrence Score (RS) at a median follow up of 3 and 5 years
� Outcome in RS low-risk patients treated by endocrine therapy alone � Prospective evaluation of the prognostic impact of an independent central
pathological review vs RS
PlanB: Endpoints
Primary endpoint
� Safety� Overall survival
Secondary Endpoints
Extensive translational program
Courtesy of Nadia Harbeck

PlanB : Translational subprotocol 5-year DFS in per-protocol population(no chemotherapy in pN0-1 and Recurrence Score 0-11)
27
5-Y DFS 94.2%5-Y DFS 94.5%5-Y DFS 85.5%
5-Y DFS 94%5-Y DFS 95%5-Y DFS 88%
94%94%84%
N0 N1
Gluz et al, EBCC 2016, plenary lecture
Presented by: Nadia Harbeck, MD
Courtesy of Nadia Harbeck

PlanB: Shared decision making based on Recurrence Score
� 18% of patients potentially spared chemotherapy (n=404 post-amendment)� 86% acceptance
Courtesy of Nadia Harbeck

PlanB: Recurrence Score by (central) Ki-67
07.12.2018 WSG GmbH Gluz et al. JCO 2016Courtesy of Nadia Harbeck
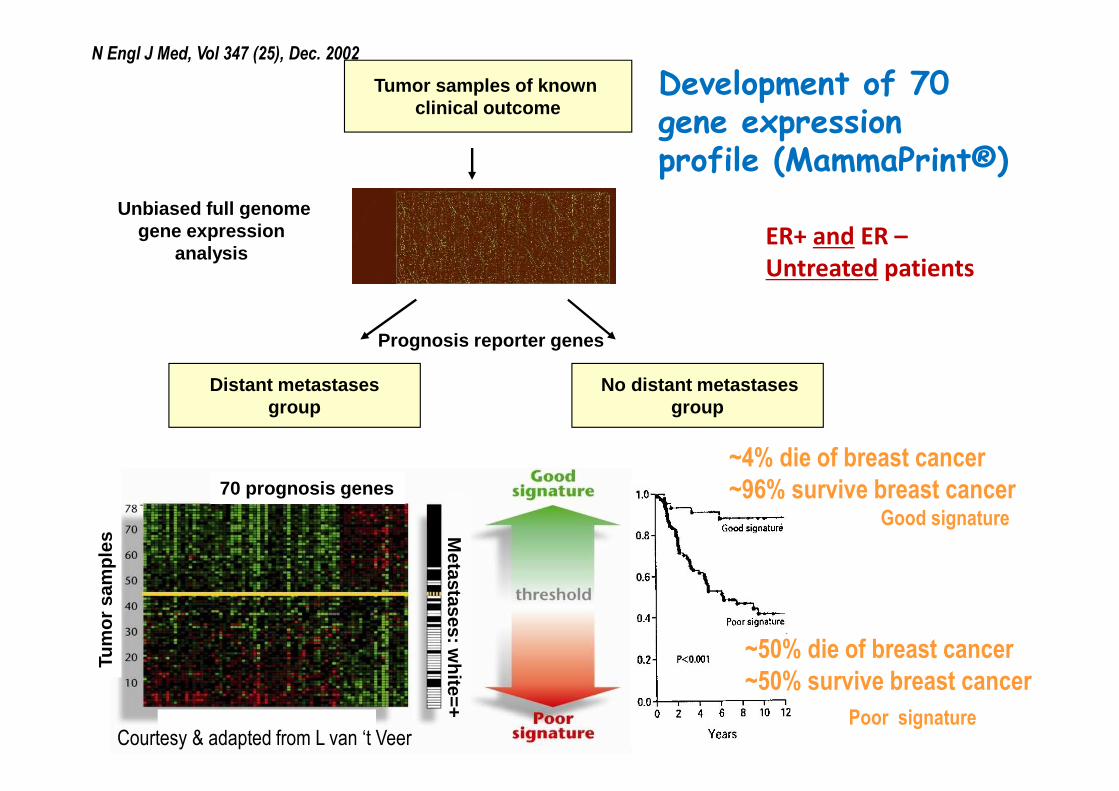
Tumor samples of known clinical outcome
No distant metastasesgroup
Unbiased full genome gene expression
analysis
Distant metastasesgroup
70 prognosis genes
Tum
or s
ampl
es
Metastases: w
hite=+
Prognosis reporter genes
Development of 70 gene expression profile (MammaPrint®)
Good signature
Poor signature
~4% die of breast cancer
~96% survive breast cancer
~50% die of breast cancer
~50% survive breast cancer
N Engl J Med, Vol 347 (25), Dec. 2002
Courtesy & adapted from L van ‘t Veer
ER+ and ER –
Untreated patients

BIG-TRANSBIG HQ– Used with permissionFeb 2009- Confidential

MAMMAPRINT® (70-gene profile)
in LN 1 to 3+ BC
Distant metastases as first event
Breast cancer specific survival
Good profile (n=142)
Poor profile (n=205)
HR adjusted 5.4 (2.1 – 13.9; p=0.001)
HR adjusted 2.8 (1.3 – 6.0; p=0.009)
91%
73%
HR 3.8 (2.0 – 7.4; p<0.001)
96%
71%
HR 6.1 (2.8 – 13.5; p<0.001)
P<0.001 P<0.001

12% absolute benefit | 50% relative benefit
DDFS: MammaPrint HIGH
RISK(n=289)
DDFS: MammaPrint LOW
RISK(n=252)
Chemotherapy benefit in MammaPrint HIGH RISK patients (n=289)
Knauer et al., Breast Cancer Res Treat, 2010 Feb
TIME IN YEARS
ET+CT (n=148, 51%)
ET (n=141, 49%)
HR.0.35(0.17-0.71)
p=0.01
ET+CT (n=78, 31%)
ET (n=174, 69%)
HR.0.26(0.03-2.02)
p=0.20
99
%93
%
88
%76
%
PE
RC
EN
T S
UR
VIV
AL
PE
RC
EN
T
SU
RV
IVA
L
TIME IN YEARS

No. at risk 200 117
187 125
Risk groupPatients
Received chemotherapy (%)
5 years DRFI (%)
10 yearsDRFI (%)
MammaPrint Low-risk
219 34 (15.5) 96.3 93.7
MammaPrint High-risk
208 168 (80.8) 92.2 86.8
Clinical low-risk* 243 44 (18.1) 97.1 91.7
Clinical high-risk* 183 157 (85.8) 90.6 88.2
Log-rank P = 0.034
10 year follow-up of the RASTER study (2004-2006)• Prospective evaluation of the MammaPrint® in community based hospitals.
• 427 breast cancer patients of 60 years or younger with cT1-3N0M0.
• Decision on adjuvant systemic treatment was based on:
� Dutch guideline (CBO 2004)
� Preference of patient and physician
� High or Low Genomic risk of distant recurrence (MammaPrint)
Distant Recurrence Free Interval
*according to MINDACTS. Vliek, ESMO 2017
MP Low-risk, no chemotherapy (n=185): 10 years DRF I 93.6%

C-high/ G-high Discordant cases
C-high/G-low or C-low/G-high
C-low/G-low
Chemotherapy
MINDACT TRIAL DESIGN
2nd randomizationAnthracycline –based vs. Capecitabine-Docetaxel
3rd randomizationTamoxifen 2y / Letrozole 5y vs. Letrozole 7y
Registration & Screening
Surgery
Clinical-Pathological (C) risk (Adjuvant! Online)
Genomic (G) risk (70-gene signature)
Endocrine therapy
1st randomization to treatmentuse Clinical vs. Genomic risk
No Chemotherapy
HR+ HR+
N= 6600

Primary endpoint: Distant metastasis free survival ( DMFS) at 5 years
Null hypothesis: 5-year DMFS rate in PT population = 92%
Alpha: 2.5% (1-sided)
Power: 80% when true 5-year DMFS rate=95%
Primary test:
95% 2-sided Confidence interval (CI) for the 5-year DMFS rate will be compared to 92%
significant if CI exceeds 92%
MINDACT Primary endpoint and test
F. Cardoso, NEJM 2016

MINDACT population at 5y median follow -upDMFS IN ALL 4 RISK GROUPS
Discordant risk
groups
F. Cardoso, NEJM 2016

MINDACT population at 5y median follow -upDISCORDANT RISK GROUPS: PRIMARY TEST
The primary statistical test(DMFS at 5Y)
Null Hypothesis: set at 92%
Observed 5Y DMFS = 94.7%
95% CI ≈ 92.5 – 96.2% excludes 92% !!!F. Cardoso, NEJM 2016

Efficacy Secondary Endpoint:
CT vs no CT in discordant risk groups in ITT analysis
Allocated to: Allocated to:
Allocated
Treatment
strategy
% at 5 Year(s)
(95% CI)
Hazard Ratio
(adjusted Cox
model)
(95% CI)
p-value
(adjusted
logrank)
CT95.9 (94.0,
97.2)
0.78
(0.50,1.21)0.267
no CT94.4 (92.3,
95.9)1.00
Allocated
Treatment
strategy
% at 5 Year(s)
(95% CI)
Hazard Ratio
(adjusted Cox
model)
(95% CI)
p-value
(adjusted
logrank)
CT95.8 (92.9,
97.6)
1.17
(0.59,2.28)0.657
no CT95.0 (91.8,
97.0)1.00
Distant Metastasis Free Survival
c-High/g-Low
Distant Metastasis Free Survival
c-Low/g-High
F. Cardoso, NEJM 2016

The MINDACT population: CT assignment according to a “Clinical” vs a “Genomic” strategy
Discordant
N=2745
clinical Low/genomic Low
N=1806
clinical High/genomic High
N=1550
clinical High/genomic Low
N=592
clinical Low/genomic High
Whole population N = 6,693
«Clinical» strategyCT to 1550 + 1806 = 3,356 pts
= 50 %
«Genomic» strategyCT to 592 + 1806 = 2,398 pts
= 36 %
14% reductionF. Cardoso, NEJM 2016

Proposed future clinical use of MammaPrint ®
Clinical risk (c)
Adjuvant Online!
Genomic risk (g)
70-gene signature or
MammaPrint®
c-Low/g-Low c-High/g-HighDiscordant
c-Low/g-High c-High/g-Low
R-TN=1550 N=1806
Clinical «Low risk» patients Clinical «High risk» patients
No proven added value of MammaPrint® Proven added value of MammaPrint®
with a 46%[1550/(1550+1806)] reduction in CT prescription (depends on baseline CT
prescription rate!) F. Cardoso, NEJM 2016

Conclusions (2)
• Mindact results provide level 1A evidence of the clinical utility of
MammaPrint® for assessing the lack of a clinically relevant
chemotherapy benefit in the clinically high risk (c -High) population.
• c-High/g-Low patients, including 48% Node positive and 29% grade 3 ,
had a 5-year DMFS rate in excess of 94% , whether randomized to
adjuvant CT or no CT.
• In the entire MINDACT population, the trial confirm ed the hypothesis
that the « genomic » strategy leads to a 14% reductio n in CT
prescription versus the « clinical » strategy.
• Among the c-High risk patients, the clinical use of MammaPrint® is
associated with a 46% reduction in chemotherapy prescription . F. Cardoso, NEJM 2016

Practical use of Mammaprint® in the clinic based on
evidence from the MINDACT trial
HR+ tumor:
Define clinical risk
Clinical “low” risk* Clinical “high” risk
Treatment according to
guidelines
Discuss with patient if she would value a 1.5% gain
in DMFS with adjuvant chemotherapy
No
Order
Mammaprint
Yes
Proceed with
chemotherapy
Courtesy M. Piccart

FROZEN TUMOR SAMPLES
PARAFFIN-EMBEDDED TUMOR SAMPLES
SERUM & BLOOD SAMPLES
A GOLDMINE FOR (Future) RESEARCH
Independent biological materials bank
Policy for access to samples and/or data

The use of MammaPrint
allows to spare
chemotherapy in about 46%
of patients traditionally
considered at high risk
Implementation problems:
Cost of the test,
lack of reimbursement,
logistics,
time

2002
2016
• 14 years
• ± 50 million Euros
• Over 11,000 pts
screened & 6,600
enrolled

First-generation Gene Signatures for EBC
Recurrence Prediction
Time dependence of HRs for
gene signature adjusted for the
clinical risk (A) and the clinical
risk alone (B) for time to distant
metastases
Oncotype Dx RS, Mammaprint
and Rotterdam gene signature
are good in predicting early
distant recurrence of EBC.
Desmedt C et al., Clin Cancer Res 2007.

DISSECTING GENE EXPRESSION SIGNATURES
C. Sotiriou – used with permission
AmsterdamNo (%)70 genes
(Van de Vijver et al.NEJM, 2002)
35 (50)
6 (9)
34 (49)
10 (14)
4 (6)
7 (10)
9 (9)
ESR1 = luminal/basal
ERBB2 = Her2-neu
STK6 = proliferation/GGI
PLAU = stroma/invasion
STAT1 = immune response
VEGF = angiogenesis
NA = undetermined
RotterdamNo (%)76 genes
(Wang et al.The Lancet, 2005)
17 (18)
2 (3)
30 (39)
1 (1)
6 (8)
4 (5)
30 (39)
Microarray Indices

SECOND GENERATION SIGNATURES

PAM 50 ROR (PROSIGNA®)
� PROSIGNA ROR score is based on gene exression profile, proliferation
score and tumor size
� 1017 pts in the ATAC (Dowsett, JCO 2013) and 1620 pts in the ABCSG8
(Gnant, Ann Oncol 2014)
� Developed in patients under ET therapy
� Adds prognostic information to standard clinicopathological parameters
(within first 10 yrs of follow up)
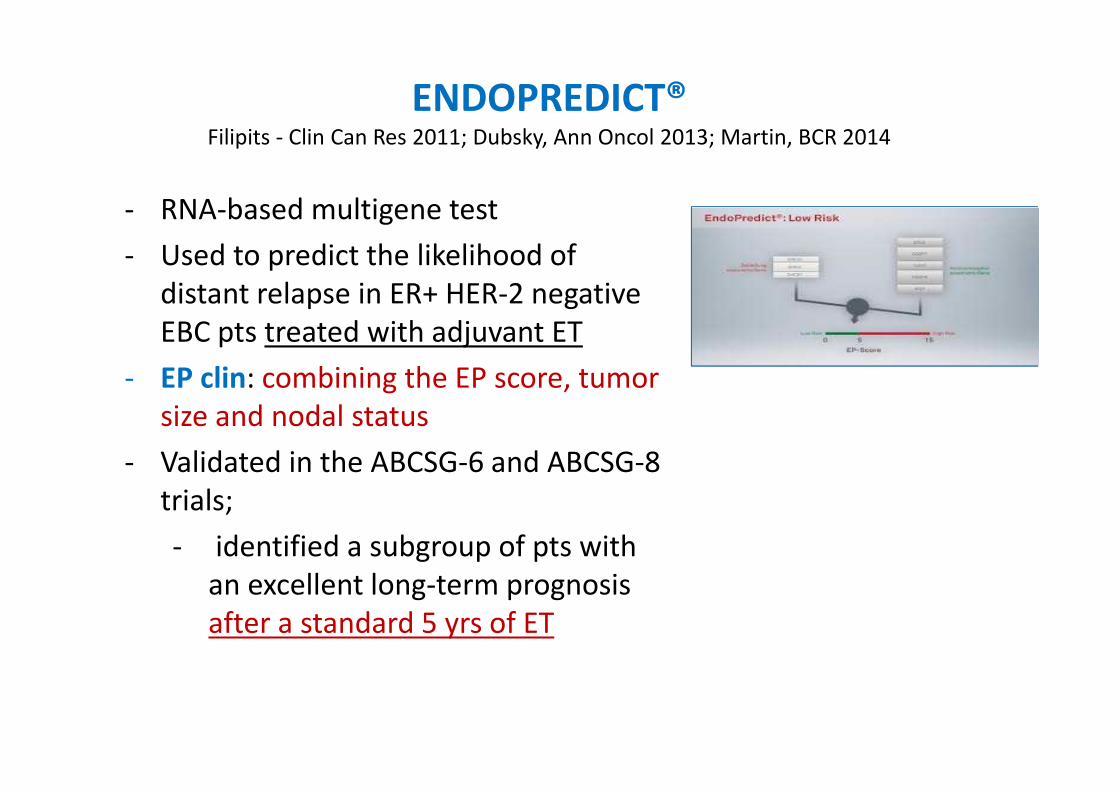
ENDOPREDICT®Filipits - Clin Can Res 2011; Dubsky, Ann Oncol 2013; Martin, BCR 2014
- RNA-based multigene test
- Used to predict the likelihood of
distant relapse in ER+ HER-2 negative
EBC pts treated with adjuvant ET
- EP clin: combining the EP score, tumor
size and nodal status
- Validated in the ABCSG-6 and ABCSG-8
trials;
- identified a subgroup of pts with
an excellent long-term prognosis
after a standard 5 yrs of ET

EP-clinic-score
98.20% (96.5- 99.8)
87.7% (82.8-92.5)
Allow the identification of pts with an excellent prognosis
after 5 yrs, for whom it might not be necessary to extend
endocrine therapy
Courtesy F. Penault-Llorca

Breast Cancer index (BCI)
• a second-generation gene signature that is prognostic for pts with ER+ EBC who have/have not receivedTAM
• a qRT-PCR method that measuresexpression of 2 genes, HOXB13 andIL17BR and classifies pts into low, intermediate and high-risk group
• Validation: the Stockholm study, n=317 pts, ER+, N0, TAM
Zhang Y et al. Clin Cancer Res. 2013
Sgroi DC et al., Lancet Oncol 2013.
BCI was the only significant prognostic
factor for risk of both, early and late
distant recurrence (apart from
OncotypeDx RS and IHC4, which
predicted only early distant recurrence).

Genomic
Clinico-
pathological
Genomic
Clinico-
pathological
Untreated
Treated
Sotiriou- used with permission
DO GENOMIC TESTS REPLACE CLASSICAL PROGNOSTIC
FACTORS OR ADD TO THEM?
C. Sotiriou et al

% of pts classified as low/intermediate risk :
82.1% for Oncotype DX
72.0% for IHC4
65.6% for Prosigna
61.4% for MammaPrint
DO ALL GENOMIC TESTS CLASSSIFY EQUALLY EACH PATIENT?
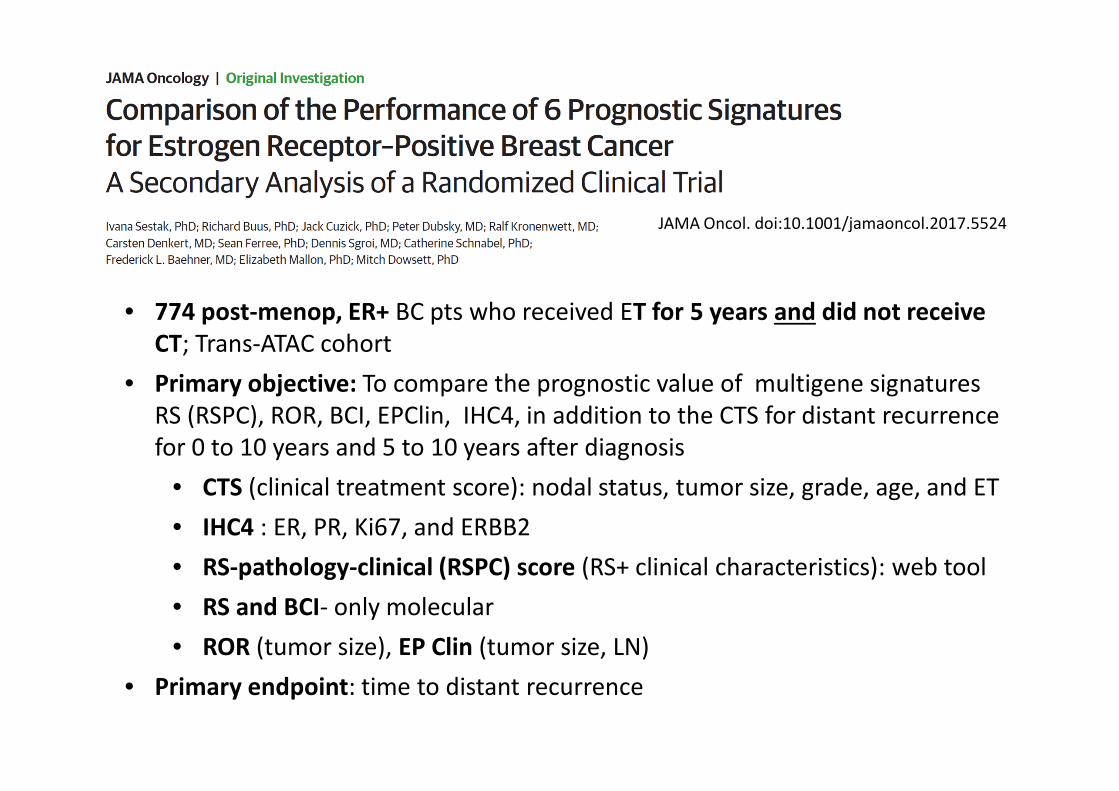
JAMA Oncol. doi:10.1001/jamaoncol.2017.5524
• 774 post-menop, ER+ BC pts who received ET for 5 years and did not receive
CT; Trans-ATAC cohort
• Primary objective: To compare the prognostic value of multigene signatures
RS (RSPC), ROR, BCI, EPClin, IHC4, in addition to the CTS for distant recurrence
for 0 to 10 years and 5 to 10 years after diagnosis
• CTS (clinical treatment score): nodal status, tumor size, grade, age, and ET
• IHC4 : ER, PR, Ki67, and ERBB2
• RS-pathology-clinical (RSPC) score (RS+ clinical characteristics): web tool
• RS and BCI- only molecular
• ROR (tumor size), EP Clin (tumor size, LN)
• Primary endpoint: time to distant recurrence

• N0: All signatures provide independent prognostic information; ROR, EPClin,
BCI more potent
• N1-3: weaker prognostic significance, and not significant for IHC4
• N0: EP Clin, BCI and ROR are better for late relapses but identify larger
proportion of high risk at 10 years
• Combination of clinical and molecular information enhanced prognostic
performance.

COST-EFFECTIVENESS ANALYSIS OUTCOME:
“Effectiveness” is expressed in QALYs
QALY is Quality adjusted life year
New technology is accepted if ICER is below
the maximum willingness to pay per QALY (e.g. €30,000/QALY)
Courtesy V. Retèl

COST-EFFECTIVENESS OF GENOMIC TESTING>PUBLISHED STUDIES
N=34
Cost-
effectiveness
analyses
N=32
Genomic profile
resulted as
preferred strategy
ICER ranges
Oncotype DX 26 25 Dominance-
€39,000/QALY
MammaPrint 7 6 Dominance-
€134,000/QALY
Blok ea, Crit Rev Cancer, 2018 Courtesy V. Retèl

COST-EFFECTIVENESS BASED ON MINDACT RESULTS>RESULTS: BUDGET IMPACT
Breast cancer incidence
Clinical high ER+/Her2-
Per patient savings Annual savings
UK ~20,000 £1,447 £28M
NL ~4,000 €9,215 €37M
US ~120,000 $12,625 $1,5B
Courtesy V. Retèl

BIOMARKER
CLINICAL
VALIDATIONThe test identifies subsets
with significantly different
* risks of relapse
* chances of response
The test is
* sensitive
* specific
* reproducible
TECHNICAL
VALIDATION
YES YES (Different LoE)
GENOMIC TESTS
Ready for use routine use in the clinic?
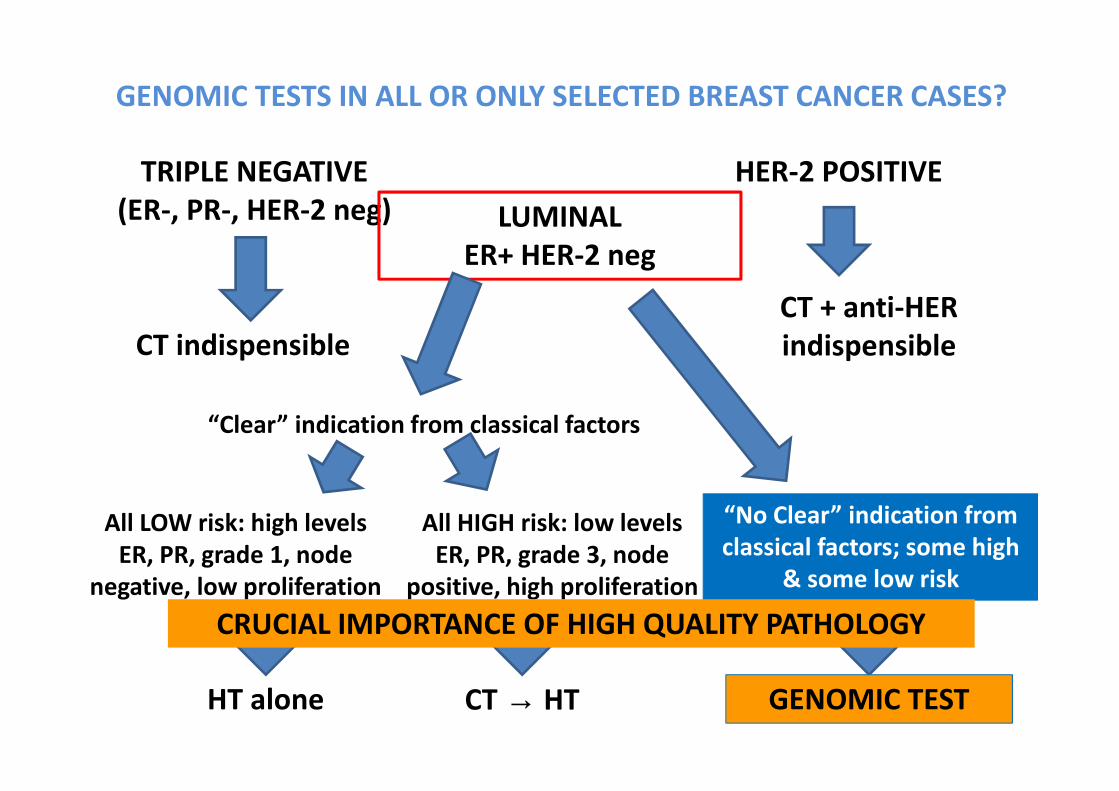
GENOMIC TESTS IN ALL OR ONLY SELECTED BREAST CANCER CASES?
TRIPLE NEGATIVE
(ER-, PR-, HER-2 neg)
CT indispensible
HER-2 POSITIVE
CT + anti-HER
indispensible
LUMINAL
ER+ HER-2 neg
“Clear” indication from classical factors
All LOW risk: high levels
ER, PR, grade 1, node
negative, low proliferation
HT alone
All HIGH risk: low levels
ER, PR, grade 3, node
positive, high proliferation
CT → HT
“No Clear” indication from
classical factors; some high
& some low risk
GENOMIC TEST
CRUCIAL IMPORTANCE OF HIGH QUALITY PATHOLOGY
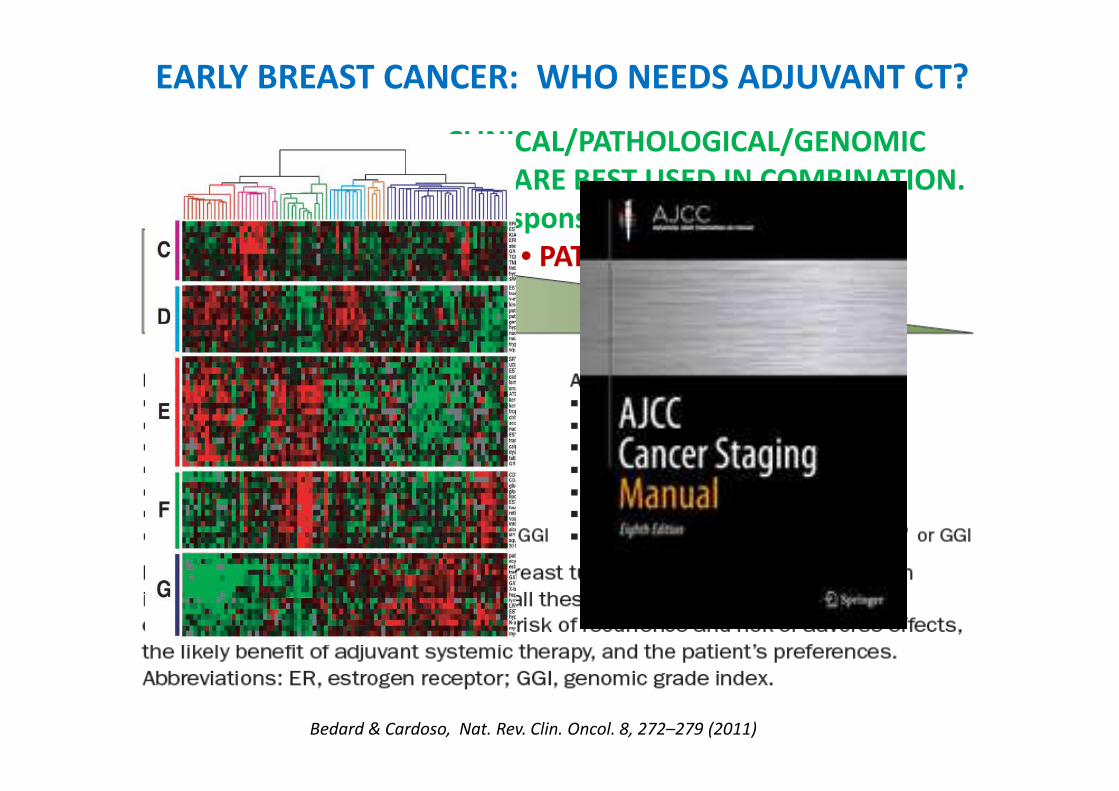
EARLY BREAST CANCER: WHO NEEDS ADJUVANT CT?
Bedard & Cardoso, Nat. Rev. Clin. Oncol. 8, 272–279 (2011)
• CLINICAL/PATHOLOGICAL/GENOMIC
FACTORS ARE BEST USED IN COMBINATION.
• Responsiveness is a continuum.
• PATIENT PREFERENCE!

PREDICTIVE FACTORS

HER2
Negative predictive value
(<5% chance to respond to anti-estrogens or trastuzumab)
HIGH 95%
Positive predictive value
30-50%
Breast Cancer
ER/PGR
What is the level of prediction
accuracy clinically useful?
Cut off 1%
Courtesy F. Penault-Llorca

Courtesy F. Penault-Llorca

Prediction of response to NACT
Histologic subtype (lobular vs ductal)
High Tumor grade
ER negative
HER2 positive
SBR grade, proliferation
Intrinsic classification
High TILsCourtesy F. Penault-Llorca

Association between pCR and EFS by BC subtype
Cortazar P et al. Pathological complete response and long-term clinicalbenefit in breast cancer: the CTNeoBC pooled analysis. Lancet. 2014
PROGNOSTIC VALUE OF pCR

Overall survival as a function of
response to neoadjuvant PCT
Liedtke C et al, J Clin Oncol, 2008, 26:1275

The magnitude of improvement in pCR rate
did not predict EFS and OS effect
Cortazar P et al. Pathological complete response and long-term clinicalbenefit in breast cancer: the CTNeoBC pooled analysis. Lancet. 2014

PREDICTIVE FACTORS
Endocrine-based strategies

Many genetic biomarkers have shown little or no association
with response to therapy
Biomarker Clinical studies Findings (mutant/amplified /loss vs wildtype)
PIK3CA
CCND1
p16
FGFR
BOLERO-2 PALOMA-3
FERGI
BOLERO-2 PALOMA-1
PALOMA-1
BOLERO-2
PIK3CA: no significant difference in
treatment effect
CCND1/p16 (PALOMA-1): changes in
copy number did not improve patient
selection beyond ER/HER2 status
CCND1 (BOLERO-2): no significant
difference in treatment effect
FGFR: no significant difference in
treatment effect
[BOLERO-2] Hortobagyai et al. J Clin Oncol 2016;34:419–429; [PALOMA-3] Cristofanilli et al. Lancet Oncol 2016;17:425–-39; [FERGI] Krop et al. Lancet Oncol 2016;17:811–821 [PALOMA-1] Finn et al. Lancet Oncol 2015; 16:25–35

ESR1 mutations seem to be associated with
resistance to AIs
SoFEA SoFEA: treatment less effective in mut vs wt
PALOMA-3: no difference between mut vs wtPALOMA-3
BOLERO-2 BOLERO-2: improved OS and PFS in wt vs mut*
Schiavon et al Schiavon et al: ESR1 mutations
predict resistance to subsequent AI
therapy**
*no statistical analysis carried out; **small sample size (n=45); mut = mutant; wt = wildtype[PALOMA-3] Turner N, presented at ASCO 2016 (abstract 512); [SoFEA] Fribbens et al. J Clin Oncol 2016; 34:2961–2968; [BOLERO-2] Chandarlapaty, presented at SABCS 2015 (abstract S2-07); Schiavon et al. Sci Transl Med 2015;7
Biomarker Clinical studies Findings (mutant/amplified /loss vs wildtype)
ESR1

ESR1 mutation and selection of endocrine therapy
ESR1-WT: No difference betweenExemestane and Fulvestrant
ESR1-Mutant tumours:less sensitive to Exemestane
ESR1-status makes no difference in response to SERDs
Fribbens et al, JCO 2016, Spoerke et al, Nat Comm 2016
ESR1-Mutations result in constitutively activated ER leading to resistance -> SERD more sensitive than AI or SERM
Primary Early MBC Late MBC
Incidence of
ESR1-Mutations
Courtesy Peter Schmid, ESMO 2016, Discussant

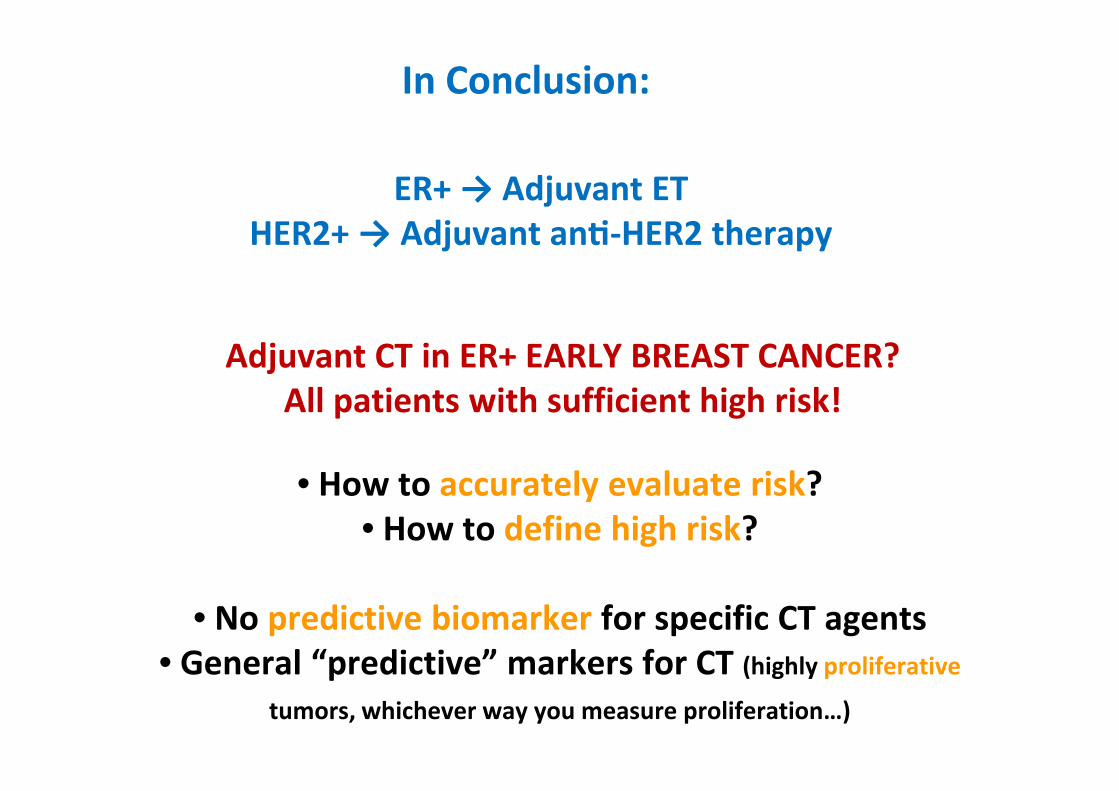
Adjuvant CT in ER+ EARLY BREAST CANCER?
All patients with sufficient high risk!
• How to accurately evaluate risk?
• How to define high risk?
• No predictive biomarker for specific CT agents
• General “predictive” markers for CT (highly proliferative
tumors, whichever way you measure proliferation…)
ER+ → Adjuvant ET
HER2+ → Adjuvant an[-HER2 therapy
In Conclusion: