program visualization: comparing eye-tracking patterns with
TRANSCRIPT

Program Visualization: Comparing Eye-TrackingPatterns with Comprehension Summaries and
Performance
Roman Bednarik, Niko Myller, Erkki Sutinen, and Markku Tukiainen
University of Joensuu, PO BOX 111, FI-80101, FINLAND,{bednarik,nmyller,sutinen,mtuki}@cs.joensuu.fi,
http://www.joensuu.fi/tkt
Abstract. We present preliminary results of an experiment in computer programcomprehension that was conducted to find out whether visual strategiescan char-acterize low- and high-comprehenders. In addition, we investigated whether thetype and quality of externalized mental models can be associated with the visualstrategies.Participants of various levels of experience used a program visualizationtool, Je-liot, to comprehend short Java programs, while their eye-movements were recorded.Comprehension summaries were evaluated for correctness as a measure of perfor-mance and also analyzed using Good’s information-types scheme. Times spent onviewing certain structures of the program visualization were analyzed andcorre-lated with the information types found in comprehension summaries. Dependingon comprehension performance and target program, some information types werefound to be correlated with eye-data patterns.Comprehension performance did not significantly correlate with information types.When the visual strategies of low-comprehenders were similar to those ofhigh-comprehenders, the comprehension outcome of the low-comprehenders was poor.When the strategies diverged, the mental models of low-comprehenders tend tomatch those of high-comprehenders. Based on the results, we propose that eye-tracking can help to partially predict the mental model that is built during com-prehension. We discuss limitations and future directions of this research.
1 Introduction
Program comprehension, the ability to understand programs, is often recognized ascentral to programming and software maintenance in general. Researchers examiningcognitive processing have used several techniques, such asthink-aloud protocols, ob-servational studies, eye tracking and other, to get insightinto the behavior and strategiesthe participants exhibit during reading or problem-solving tasks. Previous research inprogram comprehension have used many of these methods to capture and investigatecognitive processes involved in programming [1–4]. However, visual attention trackingmethods have been employed relatively rarely.
When the reasoning is related to or even dependent on visual stimuli, eye-trackingsystems have shown to be useful in revealing the patterns of visual attention during the
In P. Romero, J. Good, E. Acosta Chaparro & S. Bryant (Eds). Proc. PPIG 18 Pages 68 - 82
18th Workshop of the Psychology of Programming Interest Group, University of Sussex, September 2006 www.ppig.org

task. Programming tasks such as design, debugging or comprehension are such situa-tions, since normally programmers work with a graphical interface that provides themwith several representations of a program. While most of the previous studies have uti-lized think-aloud protocols and artificial environments, visual attention patterns duringprogramming have not been studied widely. Little has been done to analyze and explainthe visual strategies of programmers and relate them to the cognitive models formedduring the programming tasks. Therefore, one of the motivations of this study is to in-vestigate the usability and also limitations of gaze tracking for studies of programming.We also wish to relate the gaze-data to and validate them withother sources of empiricaland behavioral data.
Our longterm goal is to characterize the visual strategies and related mental modelsof programmers of different skill levels and performance inprogram comprehension.As a step in our ongoing efforts, we present an exploratory empirical experiment inwhich participants tried to comprehend Java programs usinga program visualizationtool. To capture the visual attention patterns during comprehension, we recorded theeye-movement data. Our study aims to address questions suchas: What kinds of visualstrategies lead to successful and unsuccessful comprehension? How is the quality ofconstructed mental models related to the visual attention patterns during comprehen-sion? What structures do programmers visually attend in order to comprehend a pro-gram successfully? Answers to these questions help us to better understand not onlywhat shall be visualized, but also how program visualization is used and should be used[5]. Furthermore, this research contributes to systems that can support programmers andstudents based on their eye-data during the programming tasks.
2 Related Work
What cognitive processes are involved during programming tasks? One way to studycognitive skills is through examining differences in the performance of novices and ex-perts [6]. Differences between novices and experts in comprehension and debuggingtasks have been of great interest in previous research. Gugerty and Olson [7] found thatduring debugging, not only novices were much slower in discovering the bug, but theyalso introduced new bugs. Experts tend to spend more time on planning and evaluation,and their mental models are rich to support mental simulations of the programs [8]. Ex-perts also think about programs in terms of higher-level abstractions [3], while novicesuse elements on the (surface) level of the programming language [9].
Eye-movement tracking has been successfully applied in many domains, includ-ing cognitive processing [10], reading [11], usability [12], or as a medium for directinteraction with interfaces [13]. In the domain of empirical studies of programming, in-stead, investigations of cognitive processes involved in programming have been mostlybased on verbal-protocols [4], a well established - and probably the most popular -method, used to capture and analyze the thought-processing. Despite its potentials, eye-movement tracking has not been widely applied in the domain and the applications ofthe eye-movement tracking to study the behavioral aspects of programming are stillrare.
Bednarik, Myller, Sutinen and Tukiainen
PPIG 2006 University of Sussex 69 www.ppig.org

The advantages of eye-tracking to study human behavior are,however, numerous.Modern eye-trackers are highly unobtrusive and no additional effort is required fromparticipants to be tracked. Capitalizing on these advantages, Stein and Brennan [14]used a head-mounted eye-tracker to record the point of gaze of professional program-mers debugging. These recordings were then replayed for a half of other participantssearching for the bugs. It was found that those who viewed thegaze path of profession-als found the bugs more quickly than those who did not see it. Torii et al. [15] madeuse of the gaze from a wearable eye-tracker as one of the sources of behavioral data tomonitor users during software development.
Crosby and Stelovsky [16] studied gaze patterns of participants reading source code.They found that the visual strategies vary and depend on individual preferences. Inaddition, beacons [17], the typical structures found in thesource code, were found toplay an important role in visual strategies. Using an artificial environment and multiplestatic representations, Romero et al. [18] studied visual attention during debugging.Good debugging performance was found to be linked with balanced switching betweenthe different representations.
In a previous analysis of the present experiment, we concentrated on theeffects ofprevious experience on the interaction and gaze patterns during comprehension [19]. Inthe experiment, participants with various levels of programming experience used a pro-gram visualization tool, Jeliot [20], to comprehend short Java programs. We have founda significant effect of previous experience 1) on the generalcomprehension strategiesoutside the animation, 2) on the fixation durations over different areas of interest, and3) on the interaction patterns with the visualization tool.More experienced participantsspent more time on reading the code and generating hypotheses to finally validate themagainst the visualization. Novice programmers, on the other hand, viewed the visual-izations in order to generate hypotheses without studying the code carefully first. Onlythen they tried to comprehend the programs from the source code. However, the qualityof the resulting mental models did not significantly differ and gaze patterns during thevisualization were similar to a great extent. Novice participants exhibited a higher meanfixation duration that can be related to the depth and complexity of the required mentalprocessing.
In a study similar in some aspects to the present one, Nevalainen and Sajaniemi [21]investigated the effects of a programming environment, Turbo Pascal, and a program vi-sualization system, PlanAni, on visual strategies and mental models constructed duringprogram comprehension. Eye-movement data were analyzed interms of the proportionof fixation times spent on code and visualization. While the authors found some effectsof the tools on the visual strategies, no statistically significant effects on the constructedmental models were found. Some correlations between looking into visualization ofvariables and information types were found. However, a great number of correlationtests were performed in the study. It is then probable that many of the significant find-ings might not indicate real dependencies, but be artifactsof the type I error becausethe significance level was not adjusted.
Bednarik et al. [19] claim that complex and lengthy processes such as programcomprehension cannot be effectively described using a single long-term eye-trackingmeasure. In addition, the visualization of program execution is dynamic and often in-
Bednarik, Myller, Sutinen and Tukiainen
PPIG 2006 University of Sussex 70 www.ppig.org

volves several semantically distinct structures and entities that appear on the displayduring limited period. For instance, a dedicated area showsthe type and actual con-tent of variables, while another one concurrently illustrates changes in the control flow.Thus, we study how the visual attention is allocated on thoseelements during the timethey are active. In the present study, we therefore concentrate only on the times whenthe animation of a program was available and we decompose thevisualization interfaceinto several semantically distinctive areas.
Programmers acquire a mental model of a program as an outcomeof the compre-hension process. Good and Brna [22] developed an analysis scheme based on the infor-mation types and object descriptions found in comprehension summaries. The schemeallows the evaluation of the quality of mental models in terms of proportions of differentinformation types and in terms of their level of abstraction. The information types arethe statements related to control-flow, data-flow, functionor operation of the program.Object descriptions (i.e. how the variables and objects areexplained in the summary)are classified based on the references they make to program, domain or real-world spe-cific terms. A more detailed description of the comprehension summary analysis can befound in [22].
In this report, we focus on particularly successful comprehenders and contrast theirvisual strategies with those of low-comprehenders. We makeuse of Good’s scheme andanalyze the gaze-patterns of each of the groups and make an attempt to correlate themental models with the visual strategies. In addition, we compare the comprehensionperformance to the information types, to investigate whether quality and performancecorrelate.
3 Experiment
The purpose of this exploratory investigation was to discover if high and low compre-hension outcomes are results of particular visual strategies of programmers using a pro-gram visualization tool. Furthermore, we investigated whether information types foundin the program comprehension summaries correlate with these strategies. Knowledgeof such patterns could have direct implications to the design of future programmingenvironments that could use the gaze-tracking in real time.
3.1 Method
Dependent variables were the information types that were found in program compre-hension summaries, comprehension summaries’ quality measures, and the proportionsof fixation times spent on each area of interest. The information types reflect the qualityof mental models. The proportional fixation time is a measureof participant’s intereston an area [12] and therefore it reflects the importance of theinformation contained inthe area. Only the gaze data during the program animation were used in this analysis be-cause that was the only time when all the representations were available concurrently.Thus, the selection of the attended representation would make a difference in under-standing the program. The data were analyzed using correlations, ANOVA and plannedcomparisons based on t-test.
Bednarik, Myller, Sutinen and Tukiainen
PPIG 2006 University of Sussex 71 www.ppig.org

3.2 Participants
A total of sixteen (13 male, 3 female) participants were recruited from high-school stu-dents attending a university level programming course, andundergraduate and graduatecomputer science students from local university. The experimental group can be char-acterized as follows with mean values (standard deviationsin parentheses): age 23.25(7.67), experience with programming in months 49.13 (54.05), experience with Javain months 13.06 (12.75), experience with other programminglanguages 19.31 (29.25)months, two participants had a previous industrial experience. All participants had nor-mal or corrected-to normal vision, according to their own report.
3.3 Materials and Apparatus
Three short Java programs, a factorial computation, a recursive binary search program,and a naıve string matching program were presented to the participants. Each of theprograms generated only one line of output and did not require any user input. Thenames of methods and variables were altered in order to avoida possible recognitionof a program based on these surface features and motivate theparticipants to try tounderstand the programs.
Visualization window is
further split into four
semantically different areas:
a) Method
b) Expression Evaluation
c) Instances and Array
d) Constants
The eye-movement data
from these areas were
analyzed.
Fig. 1. Interface of the program visualization tool used in the experiment.
To visualize the target Java programs, Jeliot 3 [20], a program visualization tool,was used. The user interface of Jeliot 3 (Figure 1) consists of four separate areas: theCode (1) is on the top left, the visualization is shown in the top right area (2), the Controlpanel (3) with VCR-like buttons to control the animation is on the bottom left, and theOutput (4) of the program is displayed in the bottom right panel.
Moreover, the visualization area is further split into fourdiscrete sections that detaila) the method frames and local variables, b) expression evaluation, c) constants and sta-tic fields, and d) instantiated objects and arrays. These four areas were in the focus ofthe present study. TheMethod area displays the currently executed method and types
Bednarik, Myller, Sutinen and Tukiainen
PPIG 2006 University of Sussex 72 www.ppig.org

and values of local variables. When an expression is being evaluated during execution,theExpression Evaluation area displays the process step-by-step. In addition, informa-tion about method calls, return values and some explanations about the control flow ofthe program are presented in this area. TheInstances and Arrays area shows the vi-sualization of arrays and instances of objects, their fieldsand content. Finally, in theConstants and Static Fields area all the literal values are introduced and static fieldsare visualized. The areas are not separate in the sense that there are several operationsthat can transfer information from one area to another. For instance, when a result ofan expression evaluation is assigned into a local variable,the resulting value is movedfrom the expression evaluation area to its proper location in the method area. Thus,these transitions contain also semantical meaning relatedto the programs’ execution.
3.4 Procedure and Design
The experiment was conducted in a quiet usability lab. Participants were seated in anordinary office chair, near the experimenter, and facing a 17” TFT display. Every partic-ipant then passed an automatic eye-tracking calibration. After a successful calibration,participants performed three sessions, each consisting ofa comprehension phase usingJeliot 3 and a program summary writing phase.
Participants were instructed to comprehend the program as well as possible. In addi-tion they were told that after the comprehension they will beasked to write a summaryof a program. They could interact with the program visualization tool as they foundit necessary. The target programs contained no errors and were always preloaded intoJeliot and compiled. The duration of a session was not limited.
The first target program was factorial computation and it wasused as a warm-upand the resulting data were discarded. The order of the two actual comprehension taskswas randomized so that half of the participants started withthe recursive binary searchand other half with naıve string matching.
4 Results
Previous reports of this experiment [19] concentrated on distinguishing visual attentionpatterns of participants according to their prior programming knowledge and experi-ence. In this report, we focus on particular successful comprehenders and contrast theirvisual strategies with those of low-comprehenders.
Comprehension summaries were evaluated based on three elements. A point wasgiven to those that contained a correct description of the function (what) of a program.Another point was given if the procedure of the program (how) was described correctly.If description contained a full description of the program and its execution in the currentcase, a point was given. Thus, a comprehension summary couldbe given a maximumof three points.
4.1 Comprehension performance vs. quality of mental models
Participants were post-hoc divided into two groups based ontheir performance in com-prehension: those participants whose comprehension summaries received at least two
Bednarik, Myller, Sutinen and Tukiainen
PPIG 2006 University of Sussex 73 www.ppig.org

points in both of the target programs were assigned to ahigh comprehenders group, andother participants were assigned to alow comprehenders group. Following the criterion,nine participants were assigned to the high-comprehendersgroup and seven participantswere assigned to the other group.
All thirty two program summaries were analyzed by an experienced rater. To estab-lish the validity of the information-types analysis and of the performance evaluations,eleven randomly selected summaries (approximately one third) were analyzed by tworaters. The summaries were chunked based on consensus, resulting in 130 chunks. Thepure inter-rater agreements were 83.8% (κ=.814, ASE=.037,p<.001) regarding the in-formation types analysis. Considering the comprehension performance analysis, 100%for presence of both function and procedure correct descriptions, and 90.9% (κ=.621,ASE=.335,p=.026, one disagreement) for correct full description of the program wereachieved1.
High-comprehenders received on average 2.33 (SD=0.44) points, while the othergroup achieved an average score of 1.07 (SD=0.62). Besides asignificant effect ofgroup F(1,14)=32.34,p<.001 on points received, a two-way ANOVA (program (2) xgroup (2)) discovered no effect of program F(1,14)=.445,p=.52. A weak interactionbetween group and program F(1,14)=4.43,p=.054 was found, with partialη2 = .24.Thus, according to the performance criteria, the groups significantly different (high-comprehenders performed significantly better) and the performance kept constant be-tween the programs. This finding has been expected and the analysis only served asa confirmation that the post-hoc division yielded differentgroups in terms of perfor-mance.
To evaluate the information types (IT) found in summaries and therefore the qual-ity of the externalization of the constructed models, comprehension summaries wereanalyzed using Good’s scheme [22]. To reduce the complexityof the analysis, we con-centrated on two composite ratings that would reflect the level of abstractions foundin the models. Similarly as in [23, 21], theinfo-high type was defined as a compositevalue including the higher-level statements about data, function, action, and so calledstate-high statements. Theinfo-low composite type included statements at a lower-levelof abstraction, namely statements about operation, control, and state-low. Other infor-mation types provided by Good’s scheme were not included in the analysis, however,the proportions are reported in Table 1.
Since both the classification of the performance and the information types analy-sis were based on the same comprehension summaries, it mightbe hypothesized thatthe two measures are correlated. To analyze a possible relationship, we correlated thepoints awarded with the info-high and info-low proportions. For all of the summaries,comprehension points with info-low and comprehension points with info-high were notsignificantly correlated: info-low and comprehension points had a small negative cor-relation (pearsonr between -.28 and -.16,ns) and info-high and comprehension pointshad a small positive correlation (pearsonr between .25 and .18,ns). It therefore seemsthat the performance classification and analysis of produced mental models were inde-
1 Inter-rater agreement is considered reliable enough ifκ > .7. However, there are problemsapplying κ, when there are few categories and values. Thus, theκ = .621 of 11 agree-ments/disagreements can be still considered relatively good.
Bednarik, Myller, Sutinen and Tukiainen
PPIG 2006 University of Sussex 74 www.ppig.org

Table 1. Proportions of information types found in comprehension summaries. SD = Standarddeviation.
Target programBinary search String matching
IT High compr.Low compr. High compr.Low compr.mean SD mean SD mean SD mean SD
function 7.47 3.64 4.29 6.31 6.50 4.63 4.68 4.97action 7.60 5.80 5.47 7.16 8.55 9.43 15.85 13.43
operation 8.07 16.0420.83 20.7312.56 10.6920.39 15.76state-high 7.11 7.62 7.20 6.80 14.93 9.84 6.68 3.53state-low 13.63 12.3111.09 15.95 5.80 5.79 13.99 13.02
data 21.54 9.51 9.28 8.59 12.85 9.03 6.77 6.05control 22.16 10.8723.32 21.0212.76 9.85 9.77 6.29
elaborate 9.79 11.3316.60 13.4023.29 15.0911.03 9.27meta 1.79 3.33 0.00 0.00 0.00 0.00 5.96 10.29
unclear 0.00 0.00 0.00 0.00 0.00 0.00 0.00 0.00incomplete 0.00 0.00 0.00 0.00 0.00 0.00 0.00 0.00continuation 0.00 0.00 1.91 3.28 0.00 0.00 0.00 0.00
irrelevant 0.83 2.36 0.00 0.00 2.76 4.41 4.89 5.64Σ info-high 43.72 15.9826.24 15.2942.83 17.8333.15 15.34Σ info-low 43.86 17.6855.25 26.3031.11 18.3244.15 19.78
pendent in general and can be used as separate measures. In other words, presence ofcertain information type (e.g. info-high) in a summary doesnot indicate correct com-prehension, and vice versa.
Table 1 provides a complete overview of the comprehension models and informa-tion types found in the summaries, for both of the two programcomprehension tasks.Three-way ANOVA (program (2) x group (2) x IT-type (2)) revealed no effects ofthe type, F(1,13)=1.674,p=.218 and a mild effect of program F(1,13)=3.456,p=.086on IT found in mental models, with a weak interaction betweenIT-type and perfor-mance group F(1,13)=2.598,p=.131. Other interactions were not significant; similarlyas no effect of group on information type was found F(1,13)=.045, p=.84. Plannedcomparisons revealed a significant difference between the groups on info-high-type,t(13)=2.16,p=.050 for the binary search, and no difference for the string matchingt(13)=1.06,p=.305. No statistically significant differences were found in thepropor-tions of info-low type.
It shall be observed that the analysis of the information types is strongly affected bythe great variances in the models. Nevertheless, the summaries of low-comprehenderscontained more low-level information than high-level information. Although the groupsstatistically did not differ in the proportion of info-low-type found in their summaries,clearly, mental models of high-comprehenders contained higher proportions of higherlevel references than the models of low-comprehenders.
Bednarik, Myller, Sutinen and Tukiainen
PPIG 2006 University of Sussex 75 www.ppig.org

4.2 Eye-movement patterns vs. quality of mental models
Correlations of eye-movement data on the main interface areas of the interface with theproportions of information types found in the summaries were analyzed. We analyzedthe visual behavior separately for the two target programs,because the animations of theprogram executions were different and they might have had aneffect on the allocationof visual attention. Correlations of the times spent on the two main interface areas areshown in Table 2 and the distribution of the times is shown in Table 3.
Table 2. Correlations of proportional fixation times on the Code and Visualization areas withinformation types. Levels of significance in parentheses. Correlations approaching p=.1 are high-lighted in italics.
ProgramGroup IT Code Visualiz.
Binarysearch
Highcompr.
info-high -.200(.635)
.235(.575)
info-low .005(.990)
-.047(.913)
Lowcompr.
info-high .679(.094)
-.622(.136)
info-low -.605(.150)
.484(.271)
Stringmatching
Highcompr.
info-high -.226(.559)
.223(.565)
info-low .191(.622)
-.184(.636)
Lowcompr.
info-high -.079(.866)
.005(.992)
info-low .103(.825)
-.072(.878)
Recursive binary search program Detailed analysis of the fixation patterns on thesub-areas of the visualization window revealed following:while comprehending thebinary search program, none of the proportional fixation times were significantly cor-related with any of the information contained in mental models, except for a negativecorrelation of low-comprehenders’ time to view the Expression area and info-high thatapproached p of .05, (r(7)=-.73,p=.062). To analyze the effect of code reading duringthe animation of this program, the time spent on looking intothe source code and timespent on looking into visualization were correlated with information types, as shown inTable 2. Although not significantly, the times the low-comprehenders spent on Code andVisualization were interestingly correlated with the info-high and partly with info-low.In addition, the distributions of the fixation times did not differed between the groupsduring comprehension of this program.
Bednarik, Myller, Sutinen and Tukiainen
PPIG 2006 University of Sussex 76 www.ppig.org
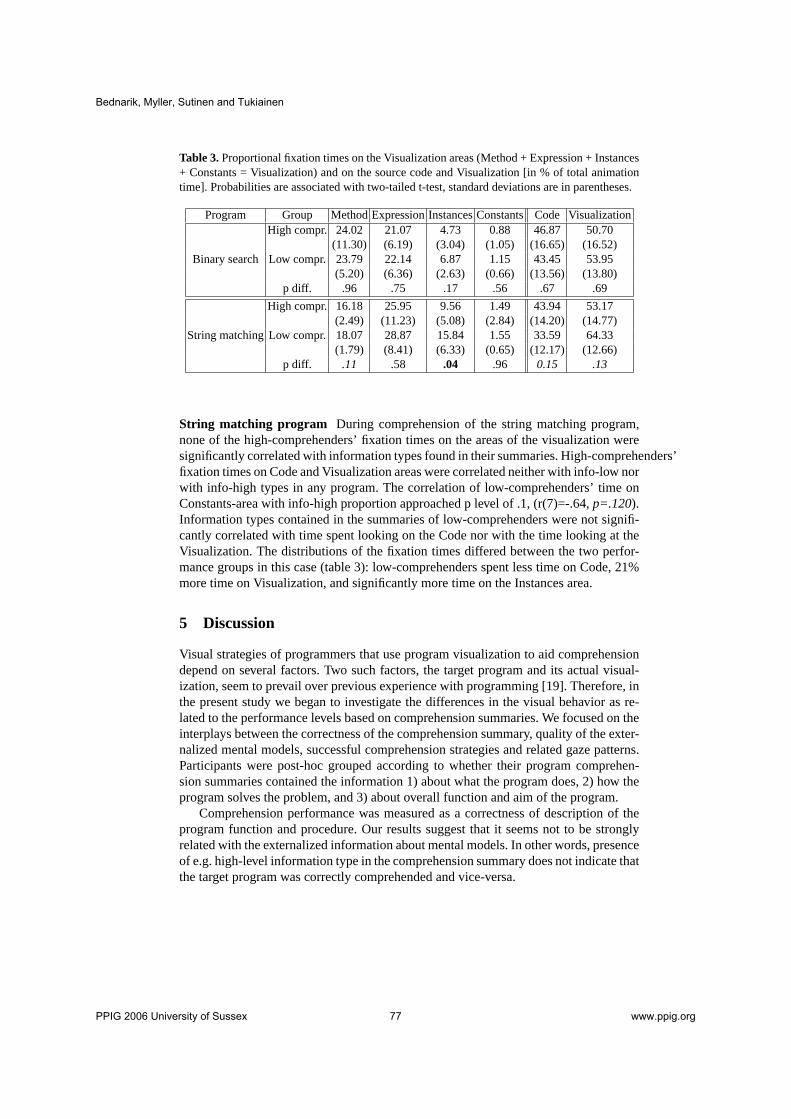
Table 3. Proportional fixation times on the Visualization areas (Method + Expression+ Instances+ Constants = Visualization) and on the source code and Visualization [in % oftotal animationtime]. Probabilities are associated with two-tailed t-test, standard deviations are in parentheses.
Program Group MethodExpressionInstancesConstants Code Visualization
Binary search
High compr. 24.02 21.07 4.73 0.88 46.87 50.70(11.30) (6.19) (3.04) (1.05) (16.65) (16.52)
Low compr. 23.79 22.14 6.87 1.15 43.45 53.95(5.20) (6.36) (2.63) (0.66) (13.56) (13.80)
p diff. .96 .75 .17 .56 .67 .69
String matching
High compr. 16.18 25.95 9.56 1.49 43.94 53.17(2.49) (11.23) (5.08) (2.84) (14.20) (14.77)
Low compr. 18.07 28.87 15.84 1.55 33.59 64.33(1.79) (8.41) (6.33) (0.65) (12.17) (12.66)
p diff. .11 .58 .04 .96 0.15 .13
String matching program During comprehension of the string matching program,none of the high-comprehenders’ fixation times on the areas of the visualization weresignificantly correlated with information types found in their summaries. High-comprehenders’fixation times on Code and Visualization areas were correlated neither with info-low norwith info-high types in any program. The correlation of low-comprehenders’ time onConstants-area with info-high proportion approached p level of .1, (r(7)=-.64,p=.120).Information types contained in the summaries of low-comprehenders were not signifi-cantly correlated with time spent looking on the Code nor with the time looking at theVisualization. The distributions of the fixation times differed between the two perfor-mance groups in this case (table 3): low-comprehenders spent less time on Code, 21%more time on Visualization, and significantly more time on the Instances area.
5 Discussion
Visual strategies of programmers that use program visualization to aid comprehensiondepend on several factors. Two such factors, the target program and its actual visual-ization, seem to prevail over previous experience with programming [19]. Therefore, inthe present study we began to investigate the differences inthe visual behavior as re-lated to the performance levels based on comprehension summaries. We focused on theinterplays between the correctness of the comprehension summary, quality of the exter-nalized mental models, successful comprehension strategies and related gaze patterns.Participants were post-hoc grouped according to whether their program comprehen-sion summaries contained the information 1) about what the program does, 2) how theprogram solves the problem, and 3) about overall function and aim of the program.
Comprehension performance was measured as a correctness ofdescription of theprogram function and procedure. Our results suggest that itseems not to be stronglyrelated with the externalized information about mental models. In other words, presenceof e.g. high-level information type in the comprehension summary does not indicate thatthe target program was correctly comprehended and vice-versa.
Bednarik, Myller, Sutinen and Tukiainen
PPIG 2006 University of Sussex 77 www.ppig.org

Analysis of externalized mental models indicates that high-comprehenders referredto higher-level information more, which is not a surprisingfinding. However, in thecase of the string matching program, the less successful participants improved theirperformance in terms of higher-level understanding of the program so that there wasnot any significant difference in the proportions between the two groups.
Looking at the patterns of visual attention, our results offer one explanation: whilehigh-comprehenders’ visual strategies do not seem to be correlated with the level ofabstraction found in their summaries, their performance ishigher. In other words, it ishard to find common patterns in the visual strategies of high-comprehenders as theirvisual behavior seems to be rather individual. This conclusion seems to be in line withthe findings of Crosby and Stelovsky [16].
During the comprehension of both programs, the attention ofthe high-comprehenderswas more balanced between the different representations compared to the low-comprehenders.This seems to support the previous results about visual strategies during debugging[18]. It is surprising how the distribution of fixation timesof low-comprehenders duringbinary-search resembles the overall distribution representing the high-comprehenders’behavior. While the performance differs, the times spent on different areas during com-prehension of this program were similar. However, high-comprehenders, perhaps, hadthe abilities and knowledge to extract the information fromdifferent areas as neces-sary. Similarly distributed visual attention of the low-comprehenders then led to failedcomprehension of the program. As seen from table 2, the more the low-comprehendersread the Code during animation of the binary search program,the more higher-levelinformation was contained in their program summaries. At the same time, looking intothe visualization decreased the proportion of the higher-level references in their mentalmodels.
Let’s contrast the previous with the behavior during the comprehension of the string-matching program. For many of the areas (Method, Instances,and also code), visualattention patterns of the two groups differed. For example,low-comprehenders paidmore attention to the Visualization area, in particular, Instances were attended signifi-cantly more. We believe, that these strategies then led to the improvement in the propor-tion of higher-level information found in the low-comprehenders’ summaries of string-matching program. To reliably explain this improvement andthe difference, a furtherqualitative analysis, such as questioning of the participants, would be required.
To summarize the previous observations, we have found that during comprehensionof one program the visual strategies of two performance groups were similar while theirmental models differed. On the other hand, during comprehension of another programthe visual strategies were different while the mental models were similar.
An alternative explanation for the finding could be that although the order of the pro-grams was randomized in the original experiment, the post-hoc assignment into groupscould result in an unbalanced order within the groups. However, this was not the case:the order of programs was balanced also for the post-hoc groups. It remains thereforemost probable that the actual target programs and their respective visualizations playedan important role in the differences found in comprehensionand visual behavior.
While there has been found an evidence of the relation betweenthe fixation patternsand cognitive processing, e.g. in reading [10], eye-movement data are generally difficult
Bednarik, Myller, Sutinen and Tukiainen
PPIG 2006 University of Sussex 78 www.ppig.org

to interpret in the complex domains. This is partly due to thefact that in complex do-mains, such as programming, some information and processesare implicit and thereforeare hard to represent explicitly. For example, during a constructor call the constructorof the super class is called even though this call would not beexplicitly written into theprogram code. Programmers might understand the call even without visually attendingthe code of the constructor.
Could eye-tracking data help to explain the differences found in comprehensionsummaries? The presented findings suggest that gaze-patterns, at least partially, canpredict information later found in mental models of programmers. For instance, the in-formation shown in the Method and Instances areas expose higher-level informationabout program execution. Therefore, visually attending these areas shall have an ef-fect on an increased awareness of the higher-level information related to execution.Similarly, attending Constants and Expression evaluationareas shall provide the pro-grammer with low-level information. Our findings indicate,however, that looking atthe Expression evaluation area might have decreased the proportion of high-level infor-mation of low-comprehenders. However, at the same time, theresults also empiricallymanifest that just looking at visualization does not guarantee its correct understanding[24].
Although a promising technology, the gaze-related data, asused in this experimentand similar research, do not directly allow us to identify strategies that may lead togood comprehension. To overcome these problems, we are currently developing newmeasures and analysis techniques that would better reflect the cognitive processes in-volved in comprehension. For example, we employ the gaze to estimate the (gradual)changes in importance of the different representations to the programmer [25]. Thus, infuture we can support the comprehenders efforts when the gaze is used in real-time.
There are, however, also other factors at play in determining good and poor com-prehenders than just what structures of visualization theyselect to visually attend. Forinstance, according to related research, good comprehenders can combine their previ-ous domain and programming knowledge with the information about the program inorder to make sense of it [2]. It is quite possible that also inour study some of themore experienced participants could build good mental models even without payingattention to the visualization. In addition, it is also possible that more experienced par-ticipants failed to comprehend the programs and therefore they were classified into thelow-comprehender group. In our future analysis we plan to take this possibility intoaccount.
Furthermore, different learning styles can affect the comprehension process andcertain types of learners might be more ready to comprehend programs with a help ofan animation than others. However, gaze data may give indications of what kind ofknowledge the comprehender tries to interpret.
5.1 Limitations and future work
The presented results have to be critically considered witha certain caution. The samplesize was relatively small and the applied analysis requiresa great number of correlationsto be run. Therefore the generalizability of the conclusions could be limited. Furtherstudies shall include a larger number of participants and validate or reject our findings.
Bednarik, Myller, Sutinen and Tukiainen
PPIG 2006 University of Sussex 79 www.ppig.org

Our results, however, provide an interesting starting point for further investigations. Inour future work, we wish to more accurately classify the strategies leading to differentmental representations of a program. If we can distinguish between good and poorcomprehenders based on the gaze data or get indications about the abstraction levelof their mental models, we might be able to support differentcomprehenders in theirlearning with an appropriately adapted support to foster comprehension.
In addition, we plan to improve the methodology introduced in this paper. First, theanalysis of the comprehension summaries shall be conductedby several raters. In thisway, we will be able to estimate an agreement between the raters and therefore add avalidity measure for each of the correlations. The coding book provided in [22] andimproved in [23] is comprehensive. The complete set of Good’s information types willbe analyzed, however, multivariate type of correlations orcanonical correlations haveto be used when the number of correlations grows. Finally, other gaze data, such asfixation duration and area switching, will be analyzed.
6 Conclusions
Eye-movement data indicate what structures of program visualization have been at-tended by programmers during comprehension. Program comprehension summariescontain information about mental models acquired during the comprehension. We haveexamined the relation between these two sources of data and we compared them withhigh- and low-comprehension outcomes.
We have not found any correspondence between program comprehension perfor-mance and structure of created mental models as indicated byinformation type analy-sis.
Although further studies are needed to achieve generalizability and higher valid-ity, our data suggest important implications into the research of program comprehen-sion. High-comprehenders divided their attention on the visualization and the code ina more balanced way. A few correlations between the eye-movement patterns and in-formation types in the summaries of low-comprehenders havebeen found. When low-comprehenders’ viewing times on different representations resembled those of high-comprehenders, they attempted to infer information on wrong abstraction levels fromthe visualization and the source code. This, in our opinion,negatively affected the low-comprehenders’ results. When the fixation-time distributions and therefore the strate-gies of the two groups diverged and the low-comprehenders concentrated more on thevisualization, the quality of their mental models improved. Yet, they failed to correctlycomprehend the program. This implies that personal strategies might be more effectivedepending on the knowledge level of the comprehender.
Our long term aim is to develop systems that could assist the users in programcomprehension and debugging by analyzing their gaze-data in real-time. This worktakes the first steps into this direction.
References
1. von Mayrhauser, A., Vans, A.M.: Identification of dynamic comprehension processes duringlarge scale maintenance. IEEE Transactions on Software Engineering22 (1996) 424–437
Bednarik, Myller, Sutinen and Tukiainen
PPIG 2006 University of Sussex 80 www.ppig.org

2. Vans, A., von Mayrhauser, A., Somlo, G.: Program understanding behavior during correctivemaintenance of large-scale software. Int. Journal of Human-Computer Studies51 (1999) 31–70
3. Wiedenbeck, S., Fix, V., Scholtz, J.: Characteristics of the mental representations of noviceand expert programmers: an empirical study. Int. Journal of Man-Machine Studies39 (1993)793–812
4. Ericsson, K.A., Simon, H.A.: Protocol analysis: Verbal reportsas data. MIT Press, Cam-bridge, MA (1984)
5. Hundhausen, C.D., Douglas, S.A., Stasko, J.T.: A meta-study of algorithm visualizationeffectiveness. Journal of Visual Languages and Computing13 (2002) 259–290
6. Ormerod, T.C.: Human cognition and programming. In Hoc, J.M.,Green, T.R.G., Samurcay,R., Gilmore, D.J., eds.: The Psychology of Programming, AcademicPress (1990) 63–82
7. Gugerty, L., Olson, G.M.: Comprehension differences in debugging by skilled and noviceprogrammers. In: First Workshop on Empirical Studies of Programmers on Empirical Studiesof Programmers. (1986) 13–27
8. Petre, M., Blackwell, A.: Mental imagery in program design and visual programming. In-ternational Journal of Human-Computer Studies51 (1999) 7–30
9. Adelson, B., Soloway, E.: The role of domain experience in software design. IEEE Transac-tions on Software Engineering11 (1985) 1351–1360
10. Just, M.A., Carpenter, P.A.: Eye fixations and cognitive processes. Cognitive Psychology8(1976) 441–480
11. Rayner, K.: Eye movements in reading and information processing: 20 years of research.Psychological Bulletin124 (1998) 372–422
12. Goldberg, J., Kotval, X.P.: Computer interface evaluation using eye movements: Methodsand constructs. International Journal of Industrial Ergonomics24 (1999) 631–645
13. Jacob, R.J.K.: The use of eye movements in human-computer interaction techniques: whatyou look at is what you get. ACM Transactions of Information Systems9 (1991) 152–169
14. Stein, R., Brennan, S.E.: Another person’s eye gaze as a cue insolving programming prob-lems. In: ICMI ’04: Proceedings of the 6th Int. Conference on Multimodal Interfaces, NewYork, NY, USA, ACM Press (2004) 9–15
15. Torii, K., Matsumoto, K., Nakakoji, K., Takada, Y., Takada, S.,Shima, K.: Ginger2: an envi-ronment for computer-aided empirical software engineering. IEEE Transactions on SoftwareEngineering25 (1999) 474–492
16. Crosby, M.E., Stelovsky, J.: How do we read algorithms? A case study. IEEE Computer23(1990) 24–35
17. Wiedenbeck, S.: Beacons in computer program comprehension.Int. Journal of Man-Machine Studies25 (1986) 697–709
18. Romero, P., Lutz, R., Cox, R., du Boulay, B.: Co-ordination of multiple external representa-tions during Java program debugging. In: HCC ’02: Proceedings of the IEEE 2002 Symposiaon Human Centric Computing Languages and Environments (HCC’02), Washington, DC,USA, IEEE Computer Society (2002) 207
19. Bednarik, R., Myller, N., Sutinen, E., Tukiainen, M.: Analyzing individual differences inprogram comprehension with rich data. Technology, Instruction, Cognition and Learning3(2006) 205–232
20. Moreno, A., Myller, N., Sutinen, E., Ben-Ari, M.: Visualizing programs with Jeliot 3. In:Proceedings of the Working Conference on Advance Visual Interfaces (AVI 2004), ACM(2004) 373–376
21. Nevalainen, S., Sajaniemi, J.: Short-term effects of graphical versus textual visualisationof variables on program perception. In: Proceedings of the 17th Annual Psychology ofProgramming Interest Group Workshop (PPIG’05), Brighton, UK (2005) 77–91
Bednarik, Myller, Sutinen and Tukiainen
PPIG 2006 University of Sussex 81 www.ppig.org

22. Good, J., Brna, P.: Program comprehension and authentic measurement: a scheme foranalysing descriptions of programs. Int. Journal of Human ComputerStudies61 (2004)169–185
23. Byckling, P., Kuittinen, M., Nevalainen, S., Sajaniemi, J.: Inter-Rater Reliability Analysis ofGood’s Program Summary Analysis Scheme. In: Proceedings of the 16th Annual Workshopof the Psychology of Programming Interest Group (PPIG 2004). (2004) 170–184
24. Petre, M.: Why looking isn’t always seeing: readership skills and graphical programming.CACM 38 (1995) 33–44
25. Bednarik, R., Tukianen, M.: An eye-tracking methodology for characterizing program com-prehension. In: ETRA06: Eye Tracking Research and Applications, New York, NY, USA,ACM Press (2006) 125–132
Bednarik, Myller, Sutinen and Tukiainen
PPIG 2006 University of Sussex 82 www.ppig.org