state-of-the-art of visualization for eye tracking data · t. blascheck, k. kurzhals, m. raschke,...
TRANSCRIPT

Eurographics Conference on Visualization (EuroVis) (2014) STAR – State of The Art ReportR. Borgo, R. Maciejewski, and I. Viola (Editors)
State-of-the-Art of Visualization for Eye Tracking Data
T. Blascheck1, K. Kurzhals2, M. Raschke1, M. Burch2, D. Weiskopf2 and T. Ertl1
1Institute for Visualization and Interactive Systems, University of Stuttgart, Germany2Visualization Research Center, University of Stuttgart, Germany
AbstractEye tracking technology is becoming easier and cheaper to use, resulting in its increasing application to numerousfields of research. The data collected during an eye tracking experiment can be analyzed by statistical methodsand/or with visualization techniques. Visualizations can reveal characteristics of fixations, saccades, and scanpathstructures. In this survey, we present an overview of visualization techniques for eye tracking data and describe theirfunctionality. We classify the visualization techniques using nine categories. The categories are based on propertiesof eye tracking data, including aspects of the stimuli and the viewer, and on properties of the visualization techniques.The classification of about 90 publications including technical as well as application papers with modifications ofcommon visualization techniques are described in more detail. We finally present possible directions for furtherresearch in the field of eye tracking data visualization.
Categories and Subject Descriptors (according to ACM CCS): [General and reference]: Document types—Surveys andoverviews [Human-centered computing]: Visualization—Visualization techniques [Human-centered computing]:Visualization—Visualization design and evaluation methods
1. Introduction
Eye tracking has become a widely used method to analyzeuser behavior in marketing, neuroscience, human-computerinteraction, and visualization research [Duc02, TCSC13].Apart from measuring completion times and recording accu-racy rates of correctly given answers during the performanceof visual tasks in classical controlled user experiments, eyetracking-based evaluations provide additional informationon how visual attention is distributed and changing fora presented stimulus. Eye tracking devices record gazepoints of a participant as raw data. Afterwards, these gazepoints can be aggregated into fixations and saccades formeasuring which areas on the stimulus have been focusedon. If necessary, areas of interest (AOIs) can be defined toconcentrate the analysis on specific regions on the stimulus.
Due to the wide field of applications of eye tracking andvarious kinds of research questions, different approacheshave been developed to analyze eye tracking data such as sta-tistical algorithms (either descriptive or inferential) [HNA∗11],string editing algorithms [PS00, DDJ∗10], visualization-related techniques, and visual analytics techniques [AABW12].Regardless of whether statistical or visual methods areused for eye tracking data analysis, a large amount of datagenerated during eye tracking experiments has to be handled.
For example, a user experiment with 30 participants, threetypes of tasks, and 30 stimuli for each task leads to 2,700scanpaths in total. Each scanpath typically consists of alarge number of fixations and every fixation aggregates gazepoints. The number of these gaze points depends on therecording rate of eye tracking devices. In this example, morethan 10,000 fixations and more than 100,000 gaze pointshave to be stored, formatted, and analyzed to finally confirmor reject one or more hypotheses. Besides analyzing eyetracking data with respect to quantitative metrics such asfixation count, distribution, and position, saccadic amplitude,and pupil size, semantic information about which areas onthe stimulus were focused on gives additional information tounderstand viewing strategies of participants.
Where statistical analysis mainly provides quantitativeresults, visualization techniques allow researchers to analyzedifferent levels and aspects of the recorded eye trackingdata in an explorative and qualitative way. Visualizationtechniques help analyze the spatio-temporal aspect of eyetracking data and the complex relationships within the data.This more qualitative exploration aims at finding hypothesesthat can be investigated with statistical methods later on.Due to the increasing complexity of tasks and stimuli in eyetracking experiments, we believe that visualization will play
c© The Eurographics Association 2014.

T. Blascheck, K. Kurzhals, M. Raschke, M. Burch, D. Weiskopf & T. Ertl / State-of-the-Art of Visualization for Eye Tracking Data
1950 1960 1970 1980 1990 2000 201010
Figure 1: Histogram of all publications of this survey, relevant for eye tracking data visualization techniques. The number ofpublished articles, conference papers, and books has strongly increased during the last decade.
an increasingly important role in future eye tracking analysis.Thus, the contribution of the survey is manifold: First, basedon a taxonomy for eye tracking terms, a classification sys-tem for stimuli and visualization techniques is formulated.Second, we assign papers from the literature to those classes.Third, based on these results, we identify questions for futuredevelopment of eye tracking visualization techniques.
Evaluation has become an important step in the develop-ment of new visualization techniques. Eye tracking is onemeans of evaluating those newly developed approaches.Thus, analyzing eye tracking data with visualization tech-niques is just a logical step that followed. The number ofpublished articles, conference papers, and books about eyetracking visualizations has strongly increased during the lastdecade. Figure 1 shows a histogram of all relevant publica-tions with visualization techniques for eye tracking data, thatare included in this survey. Especially, after the first IEEESymposium on Information Visualization in 1995 [GE95],the number of visualization techniques for eye tracking hassteadily increased. However, so far a comprehensive surveyof visualization techniques for eye tracking, structuring anddiscussing the approaches is still missing. Since eye trackingis used in a wide application range and new challenges arise,such as eye tracking in the 3D environment, an exhaustivesurvey is necessary to find missing visualization techniques.
Due to the wide application range of eye tracking, thedevelopment of visualization techniques has become aninterdisciplinary challenge that requires a comprehensiveliterature research over many different disciplines. To sat-isfy this requirement, we reviewed the main visualizationand visual analytics conferences (VIS, EuroVIS, EuroVA),the ACM Digital Library, and the IEEE Xplorer DigitalLibrary, but also the top conference on eye tracking research(ETRA), and main journals of usability research (Journal ofHuman Factors), psychology (Behavior Research Methods),and cognitive sciences (Cognitive Science Journal). Thisliterature research resulted in about 90 papers found on eyetracking data visualization. To allow the reader to better findadequate visualization techniques for his or her analysis,we subdivided the visualization techniques into three main
classes: point-based visualization techniques, AOI-basedvisualization techniques, and visualization techniques usingboth. Next, we tagged the visualization techniques withinformation about stimulus type, in-context visualizations,animated visualizations, interactive visualizations, and activestimulus content. A detailed description of this classificationwill be given in the next section. The main part of the paperis the presentation of the different visualization techniqueswith respect to this classification system. At the end, we willdiscuss possibilities for future research.
2. Taxonomy
Before we present our taxonomy classifying visualizationtechniques, we first define the basic terminology related toeye tracking data (Section 2.1). The taxonomy is subdividedinto two categories: those related to stimuli of eye trackingexperiments (Section 2.2) and those related to visualizationtechniques (Section 2.3). Other taxonomy papers targetareas different from ours, e.g., taxonomies restricted to thestimulus alone [SNDC09], the dimensionality of the visu-alization [Špa08], or the eye tracking data [RTSB04]. Ourtaxonomy includes more categories to obtain a fine-grainedcategorization of the visualization techniques and to find outwhat visualization techniques might be missing.
2.1. Terminology
Eye tracking devices record gaze points performed by aparticipant on a stimulus. The recording rates depend onthe characteristics of the devices. State-of-the-art devicesallow rates between 60 and 120 Hz. Some newer high speedeye trackers support recording rates of 240 Hz or more. Therecording rate specifies how many gaze points are recordedper second. However, eye tracking research is not using rawgaze points. Rather, different data types which are shownin Figure 2 can be distinguished and will be defined in thefollowing in more detail. For each data type different metricsare used in an eye tracking analysis. The most importantmetrics for each data type will be explained shortly. Acomprehensive collection of eye tracking metrics can befound in the book by Holmqvist et al. [HNA∗11].
c© The Eurographics Association 2014.
T. Blascheck, K. Kurzhals, M. Raschke, M. Burch, D. Weiskopf & T. Ertl / State-of-the-Art of Visualization for Eye Tracking Data
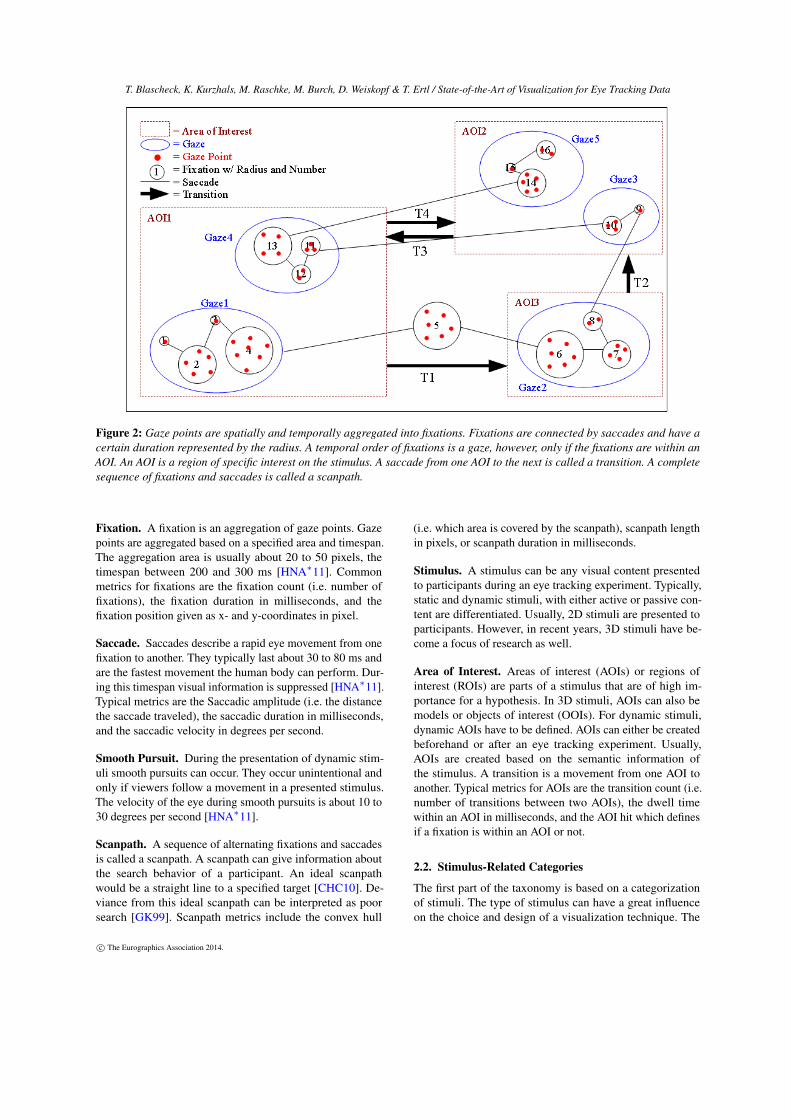
Figure 2: Gaze points are spatially and temporally aggregated into fixations. Fixations are connected by saccades and have acertain duration represented by the radius. A temporal order of fixations is a gaze, however, only if the fixations are within anAOI. An AOI is a region of specific interest on the stimulus. A saccade from one AOI to the next is called a transition. A completesequence of fixations and saccades is called a scanpath.
Fixation. A fixation is an aggregation of gaze points. Gazepoints are aggregated based on a specified area and timespan.The aggregation area is usually about 20 to 50 pixels, thetimespan between 200 and 300 ms [HNA∗11]. Commonmetrics for fixations are the fixation count (i.e. number offixations), the fixation duration in milliseconds, and thefixation position given as x- and y-coordinates in pixel.
Saccade. Saccades describe a rapid eye movement from onefixation to another. They typically last about 30 to 80 ms andare the fastest movement the human body can perform. Dur-ing this timespan visual information is suppressed [HNA∗11].Typical metrics are the Saccadic amplitude (i.e. the distancethe saccade traveled), the saccadic duration in milliseconds,and the saccadic velocity in degrees per second.
Smooth Pursuit. During the presentation of dynamic stim-uli smooth pursuits can occur. They occur unintentional andonly if viewers follow a movement in a presented stimulus.The velocity of the eye during smooth pursuits is about 10 to30 degrees per second [HNA∗11].
Scanpath. A sequence of alternating fixations and saccadesis called a scanpath. A scanpath can give information aboutthe search behavior of a participant. An ideal scanpathwould be a straight line to a specified target [CHC10]. De-viance from this ideal scanpath can be interpreted as poorsearch [GK99]. Scanpath metrics include the convex hull
(i.e. which area is covered by the scanpath), scanpath lengthin pixels, or scanpath duration in milliseconds.
Stimulus. A stimulus can be any visual content presentedto participants during an eye tracking experiment. Typically,static and dynamic stimuli, with either active or passive con-tent are differentiated. Usually, 2D stimuli are presented toparticipants. However, in recent years, 3D stimuli have be-come a focus of research as well.
Area of Interest. Areas of interest (AOIs) or regions ofinterest (ROIs) are parts of a stimulus that are of high im-portance for a hypothesis. In 3D stimuli, AOIs can also bemodels or objects of interest (OOIs). For dynamic stimuli,dynamic AOIs have to be defined. AOIs can either be createdbeforehand or after an eye tracking experiment. Usually,AOIs are created based on the semantic information ofthe stimulus. A transition is a movement from one AOI toanother. Typical metrics for AOIs are the transition count (i.e.number of transitions between two AOIs), the dwell timewithin an AOI in milliseconds, and the AOI hit which definesif a fixation is within an AOI or not.
2.2. Stimulus-Related Categories
The first part of the taxonomy is based on a categorizationof stimuli. The type of stimulus can have a great influenceon the choice and design of a visualization technique. The
c© The Eurographics Association 2014.

T. Blascheck, K. Kurzhals, M. Raschke, M. Burch, D. Weiskopf & T. Ertl / State-of-the-Art of Visualization for Eye Tracking Data
first categorization divides stimuli into point-based and AOI-based data. Furthermore, stimuli can be distinguished as be-ing static or dynamic, with active or passive content, and rep-resenting 2D or 3D content. The viewing task would be an-other type for classification, however it will not be includedin our taxonomy.
Point-based versus AOI-based. Eye tracking data of astimulus can be evaluated in a point-based or AOI-basedfashion [AABW12]. Point-based evaluation of eye trackingdata focuses on the overall movement and its spatial ortemporal distribution. Here, a semantic annotation of datais not required. Depending on the stimulus, a point-basedevaluation is not always sufficient for specific analysistasks (e.g., comparison of asynchronous eye tracking data).Therefore, an annotation of identified AOIs on the stimuluscan be used for applying AOI-based metrics. In AOI-basedmetrics the transition and relation of AOIs is of interest. Thisclassification will be used as the first level to distinguishbetween different visualization techniques.
Static versus Dynamic Stimuli. Static stimuli can, for ex-ample, be static visualizations, pictures, or advertisementswhere the stimulus does not change. Dynamic stimuli canbe videos, dynamic visualizations, or real-world scenarios.Some visualization techniques are presented as an overlay onthe stimulus and can be used with static and dynamic stimuli.Other visualization techniques depend on a static stimulusand cannot be applied to dynamically changing content.
Passive versus Active Stimulus Content. The viewer’smode of interaction is an important factor for data visualiza-tion and how the graphical user interface for a visualizationtechnique is designed. Viewers can watch presented stimulipassively without interfering actions. The stimulus can beeither static or dynamic, i.e., the presentation of picturesor videos. A synchronization between recordings of dif-ferent viewers is possible with minor effort, allowing oneto compare multiple viewers and search for similarities ordifferences in their scanpaths. Viewers can also actively influ-ence the stimulus by their actions, here the stimulus becomesdynamic. Eye tracking of interactive applications are goodexamples of individual recordings that result from the activeintegration of the viewer into the experiment. Comparingthese individually recorded data sets is a non-trivial task,since a synchronization of the data is difficult [Duc07].
2D versus 3D Stimuli. 2D stimuli have been mostly in-vestigated and can, for example, be static or dynamic 2Dvisualizations, videos, or web pages. Stimuli representing 3Dmodels or objects are being investigated more in recent years.Here, 3D stimuli can either be represented as stereoscopicimages on 3D screens, or using head-mounted eye trackers inreal or virtual world scenarios. A challenge with 3D stimuliis mapping the fixations onto the correct geometrical modelof the stimulus.
Viewing Task. Although a given task during an eye trackingexperiment has a significant influence on the eye movementof viewers [AHR98], we decided not to use the task as acategorization factor, since many visualization techniquesdo not depend explicitly on the given task for a successfulinterpretation of the data.
2.3. Visualization-Related Categories
There are numerous taxonomies for visualizations basedon different aspects. Some taxonomies focus on the datadimension or type [Chi00, TM04], on interaction techniques[YaKSJ07, Shn96], on the visualization task [BM13], or onspecific visualization types [LPP∗06, CM97]. However, foreye tracking visualizations those taxonomies are either toogeneral or too concrete. Our taxonomy uses a categorizationbased on the eye tracking data types and the number ofusers represented. We distinguish between animated andstatic, 2D and 3D, in-context and not in-context, as well asinteractive and non-interactive visualizations. Lastly, wewant to introduce the field of visual analytics as one meansto evaluate eye tracking data.
Statistical Graphics. The most commonly used visualiza-tion techniques for eye tracking data are statistical diagramssuch as line charts, bar charts, box plots, or scatter plots.These visualization techniques can be used for analyzing eyetracking data quantitatively. This survey will mostly focuson approaches for qualitative or explorative data analysis.Statistical graphics used for eye tracking data are only brieflydiscussed in Section 3.
Temporal, Spatial, and Spatio-Temporal Visualizations.The visualization techniques in this survey will be classifiedas either temporal, spatial, or spatio-temporal. The temporaldimension focuses on time and is usually visualized witha timeline as one axis. The spatial dimension of the datafocuses on the x-, y-, and if relevant, the z-coordinates offixations. For AOI-based visualization techniques, the spatialdomain contains the AOIs and their relation to each other.The third data type is the combination of both, called spatio-temporal. Here, temporal as well as spatial aspects of the dataare included into the visualization approach.
Static Versus Animated Visualizations. Static visualiza-tions usually use a time-to-space mapping of the data. Fordynamic stimuli creating a static visualization often requirespredefined AOI definitions, since the spatial linking to thedynamically changing content is commonly hard to achieve.Animated visualizations use a time-to-time mapping ofthe data by sequentially presenting certain points in timefrom the data. This allows in-context visualizations withan overlay of the visualization over the stimulus, keepingthe stimulus data and the visualization in the same domain.However, this requires quite complex layout algorithmsthat follow aesthetic drawing criteria [Pur97] for each static
c© The Eurographics Association 2014.

T. Blascheck, K. Kurzhals, M. Raschke, M. Burch, D. Weiskopf & T. Ertl / State-of-the-Art of Visualization for Eye Tracking Data
image in the sequence. Additionally, aesthetic criteria foranimation [BBD09] have to be applied to preserve a viewer’smental map.
Single User Versus Multiple Users. An important factorfor eye tracking analysis is the number of users representedin a visualization technique. Representing single users allowsthe analyst to inspect the viewing behavior of one participant.However, visualizing multiple users at the same time canallow one to find strategies of groups, but these represen-tations might suffer from visual clutter if too much data isrepresented at the same time. Here, optimization strategies,such as averaging or bundling of lines might be used, toachieve better results [HFG06, HEF∗13].
2D Versus 3D Visualizations. 2D visualizations representonly two different data types at the same time, for example,one spatial dimension and the temporal, or both spatial di-mensions. Usually, eye tracking data from 2D stimuli is rep-resented with 2D visualizations. Representing 2D stimuli us-ing 3D visualizations can be helpful as in the case of space-time cubes. Here, the spatial as well as the temporal data isvisualized. However, the third dimension has to be handledwith care because of perceptual issues related to 3D visual-izations. Visualizing 3D data in a 2D domain removes onedimension and leads to data loss. However, this can makethe analysis easier. To avoid data loss and represent all datadomains, 3D visualization techniques are developed for 3Deye tracking data.
In-Context Versus Not In-Context Visualizations. In-context visualizations link stimulus and visualization witheach other, such as overlays over the stimulus or AOIs withthumbnail images. This allows a mental map preservationas the stimulus is shown in the background. Visualizationmethods that do not include the stimulus in the visualizationare not in-context visualizations. This is often the casefor AOI-based visualization techniques. Not in-contextvisualizations have the problem that the topology of the AOIsand the mental map is lost. However, if the relation betweenAOIs is more important loosing the topological informationis an acceptable trade off.
Interactive Versus Non-Interactive Visualizations. Non-interactive visualizations usually represent the data with afixed set of parameters. The user has no option to influencethose parameters either because there are no options orbecause they have been predefined. In contrast, interactivevisualizations allow the user to explore the data beyond whatis represented at the beginning. For example, the user cannavigate through time, zoom and filter the represented data,or obtain detailed information about the data.
Visual Analytics. When visualization techniques aloneare not able to handle the vast amount of generated eyetracking data, the emerging discipline of visual analytics
can be a convenient option for explorative data analysis.Algorithmic concepts such as data mining or knowledgediscovery in databases combined with visualization tech-niques and the perceptual abilities of the human viewercan be a good means to uncover common structures orstrategies among the study participants. In the eye trackingdomain, different visual analytics systems have been de-veloped over the last years. One example of how existingvisual analytics systems can be used with eye trackingdata is described by Andrienko et al. [AABW12]. Theauthors investigated how visual analytics approaches forgeographic information science (GIScience) can be adaptedfor analyzing spatio-temporal data.
2.4. Classification Structure
Based on the above categories, we divide the papers of eyetracking visualizations into two main subsets that differen-tiate whether the visualization technique is for point-basedor AOI-based analysis. On a second level, we will furthersegment the visualization techniques based on temporal,spatial, and spatio-temporal aspects of visualization. Table 1gives an overview of all eye tracking visualizations thatintroduced a new visualization technique, an improvementof an existing visualization technique, or that adapted anexisting visualization technique for its application to eyetracking data. The table also classifies the visualizationtechniques based on the above mentioned two levels. Theupper part contains the point-based visualization techniquesthat will be described in Section 4 and the lower part of thetable shows the visualization-related visualization techniquesdescribed in Section 5. The middle part of the table containspapers from authors which present approaches where one ispoint-based and another AOI-based. Each approach is thendescribed in the corresponding section. The individual sec-tions on point-based and AOI-based visualization techniquesare further subdivided into temporal, spatial, and spatio-temporal visualization techniques. This is also representedby the first column of the table. In the case of point-basedvisualization techniques, the temporal approaches are namelytimeline visualizations, spatial approaches are attentionmaps, and the spatio-temporal approaches are subdividedinto scanpaths and space-time cube visualizations as theyrepresent two different concepts. In the AOI-based section,first timeline as temporal approaches, and then relationalvisualization techniques as spatial approaches are discussed.The spatio-temporal techniques are mainly concerned with3D data and are not included due to space limitations. 3Dhas just recently started to be investigated in eye tracking re-search, and therefore is not the focus of most of the researchso far. Therefore, some of the references mentioned in thetable are not described in the text itself. Furthermore, thetable displays all remaining categorizing factors described inthe taxonomy, starting with visualization categories and thenthe stimulus categories.
c© The Eurographics Association 2014.

T. Blascheck, K. Kurzhals, M. Raschke, M. Burch, D. Weiskopf & T. Ertl / State-of-the-Art of Visualization for Eye Tracking Data
Table 1: List of all references that introduced a new, an improvement, or an adaption of an existing visualization technique. Thereferences are classified by the visualization-related and stimulus-related categories described in Sections 2.2 and 2.3.
Tem
pora
l
Spat
ial
Spat
io-t
empo
ral
Ani
mat
ed
Stat
ic
Sing
leus
er
Mul
tiple
user
s
2D 3D In-c
onte
xt
Not
in-c
onte
xt
Inte
ract
ive
Non
-int
erac
tive
Stat
ic
Dyn
amic
Act
ive
cont
ent
Pass
ive
cont
ent
2D 3D
Reference Visualization Stimulus
Poin
t-ba
sed
Grindinger et al. [GDS10] • ◦ ◦ ◦ • ◦ • • ◦ ◦ • ◦ • • • ◦ • • ◦Goldberg & Helfman [GH10c] • • ◦ ◦ • • ◦ • ◦ ◦ • ◦ • • ◦ ◦ • • ◦Bojko [Boj09] ◦ • ◦ ◦ • ◦ • • ◦ • ◦ ◦ • • ◦ ◦ • • ◦Velichkovsky & Hansen [VH96] ◦ • ◦ ◦ • ◦ • • ◦ • ◦ ◦ • • ◦ ◦ • • ◦Wooding [Woo02] ◦ • ◦ ◦ • ◦ • • • • • ◦ • • ◦ ◦ • • ◦Latimer [Lat88] ◦ • ◦ ◦ • ◦ • ◦ • ◦ • ◦ • • ◦ ◦ • • ◦Kurzhals & Weiskopf [KW13] ◦ • • • • ◦ • • • • ◦ • ◦ ◦ • ◦ • • ◦Paletta et al. [PSF∗13b] ◦ • • ◦ • • ◦ ◦ • • ◦ • ◦ ◦ • • ◦ ◦ •Noton & Stark [NS71b] ◦ ◦ • ◦ • • ◦ • ◦ • ◦ ◦ • • ◦ ◦ • • ◦Ramloll et al. [RTSB04] ◦ ◦ • ◦ • • ◦ • ◦ • ◦ ◦ • ◦ • • ◦ ◦ •Mackworth & Mackworth [MM58] ◦ ◦ • ◦ • • ◦ • ◦ • ◦ ◦ • ◦ • ◦ • • ◦Yarbus [Yar67] ◦ ◦ • ◦ • • ◦ • ◦ ◦ • ◦ • • ◦ ◦ • • ◦Lankford [Lan00] ◦ ◦ • ◦ • • ◦ • • • ◦ ◦ • • • • • • ◦Burch et al. [BSRW14] ◦ ◦ • ◦ • • • • ◦ • ◦ ◦ • • ◦ ◦ • • ◦Hembrooke et al. [HFG06] ◦ ◦ • ◦ • ◦ • • ◦ • ◦ ◦ • • ◦ ◦ • • ◦Chen et al. [CAS13] ◦ ◦ • ◦ • ◦ • • ◦ ◦ • ◦ • • ◦ ◦ • • ◦Li et al. [LÇK10] ◦ ◦ • ◦ • ◦ • ◦ • • ◦ • ◦ • ◦ • ◦ • ◦Hurter et al. [HEF∗13] ◦ ◦ • • • • • • ◦ • ◦ ◦ • • • • • • ◦Dorr et al. [DJB10] ◦ ◦ • • ◦ • ◦ • ◦ • ◦ ◦ • ◦ • ◦ • • ◦Duchowski et al. [DPMO12] ◦ ◦ • • ◦ ◦ • • ◦ • ◦ ◦ • ◦ • ◦ • • ◦Duchowski & McCormick [DM98] ◦ ◦ • • ◦ ◦ • ◦ • • ◦ • ◦ ◦ • ◦ • • ◦
Bot
h
Stellmach et al. [SND10b] • • • ◦ • • ◦ • • • • • ◦ ◦ • • ◦ ◦ •Weibel et al. [WFE∗12] • ◦ • • • • ◦ • ◦ • • • ◦ ◦ • • ◦ ◦ •Pfeiffer [Pfe12] ◦ • • • ◦ • • ◦ • • ◦ • ◦ ◦ • • ◦ ◦ •
AO
I-ba
sed
Špakov & Räihä [ŠR08] • ◦ ◦ ◦ • • ◦ • ◦ • ◦ • ◦ • ◦ ◦ • • ◦Beymer & Russel [BR05] • ◦ ◦ ◦ • • ◦ • ◦ • ◦ • ◦ • ◦ ◦ • • ◦Räihä et al. [RAM∗05] • ◦ ◦ ◦ • • ◦ • ◦ • ◦ ◦ • • ◦ ◦ • • ◦Kim et al. [KDX∗12] • ◦ ◦ ◦ • • ◦ • ◦ ◦ • ◦ • • ◦ • ◦ • ◦Crowe & Narayanan [CN00] • ◦ ◦ ◦ • • ◦ • ◦ ◦ • ◦ • • ◦ ◦ • • ◦Holsanova [Hol01] • ◦ ◦ ◦ • • ◦ • ◦ ◦ • ◦ • • ◦ ◦ • • ◦Itoh et al. [ITS00] • ◦ ◦ ◦ • • ◦ • ◦ ◦ • ◦ • ◦ • • ◦ ◦ •Pellacini et al. [PLG06] • ◦ ◦ ◦ • • • • ◦ ◦ • ◦ • • ◦ ◦ • • ◦Kurzhals et al. [KHW14] • ◦ ◦ ◦ • ◦ • • ◦ • ◦ • ◦ ◦ • • ◦ • ◦Burch et al. [BKW13] • ◦ ◦ ◦ • ◦ • • ◦ ◦ • • ◦ • ◦ ◦ • • ◦Raschke et al. [RCE12] • ◦ ◦ ◦ • ◦ • • ◦ ◦ • ◦ • • ◦ ◦ • • ◦Richardson & Dale [RD05] • ◦ ◦ ◦ • ◦ • • ◦ ◦ • ◦ • • ◦ ◦ • • ◦Tsang et al. [TTS10] • • ◦ ◦ • ◦ • • ◦ ◦ • • ◦ ◦ • • ◦ ◦ •Blascheck et al. [BRE13] ◦ • ◦ ◦ • • ◦ • ◦ ◦ • • ◦ • ◦ ◦ • • ◦Goldberg & Kotval [GK99] ◦ • ◦ ◦ • • ◦ • ◦ ◦ • ◦ • • ◦ • ◦ • ◦Egusa et al. [ETK∗08] ◦ • ◦ ◦ • • ◦ • ◦ ◦ • ◦ • • ◦ ◦ • • ◦Itoh et al. [IHN98] ◦ • ◦ ◦ • • ◦ • ◦ ◦ • ◦ • ◦ • • ◦ ◦ •Schulz et al. [SSF∗11] ◦ • ◦ ◦ • • ◦ • ◦ ◦ • ◦ • ◦ • • ◦ ◦ •West et al. [WHRK06] ◦ • ◦ ◦ • ◦ • • ◦ ◦ • • ◦ • ◦ ◦ • • ◦Goldberg & Helfman [GH10b] ◦ • ◦ ◦ • ◦ • • ◦ ◦ • ◦ • • ◦ ◦ • • ◦Siirtola et al. [SLHR09] ◦ • ◦ ◦ • ◦ • • ◦ ◦ • ◦ • • ◦ ◦ • • ◦Baldauf et al. [BFH10] ◦ ◦ • • ◦ • ◦ ◦ • • ◦ • ◦ ◦ • • ◦ ◦ •Duchowski et al. [DMC∗02] ◦ ◦ • ◦ • • ◦ ◦ • • ◦ ◦ • ◦ • • ◦ ◦ •
c© The Eurographics Association 2014.

T. Blascheck, K. Kurzhals, M. Raschke, M. Burch, D. Weiskopf & T. Ertl / State-of-the-Art of Visualization for Eye Tracking Data
Figure 3: Example of a line chart, bar chart, and scatter plot. Each graph represents the same data set.
3. Statistical Graphics
Before we describe the eye tracking visualization techniquesbased on our classification, this section summarizes a selec-tion of statistical graphics that are commonly used to visual-ize eye tracking data, however are not especially developedfor it. Figure 3 shows an example of a bar chart, scatter plot,and line chart all representing the same data set.
One of the first papers in eye tracking research uses linecharts to study eye movement characteristics of children in aTV viewing scenario [GWG∗64]. The authors present sum-marized time durations of different types of eye movementssuch as mini movements, slides, and saccades in a line chart.Atkins and Zheng [AJTZ12] quantify the difference betweendoing and watching a manual task. To this end, they presentresults of recorded fixations in two line charts showing valuesfor x- and y-locations of the fixations. Based on this visual-ization, the authors then discuss saccadic properties. Smithand Mital [SM13] use line charts to present values of meanfixation durations, mean saccadic amplitudes, and other met-rics over time. Additionally, they also use line charts to sepa-rately show these metrics for dynamic and static stimuli.
A bar chart is mainly employed to display a histogram ofan eye tracking metric. Convertino et al. [CCY∗03] plot thepercentage of the fixation duration for four different combi-nations of visualization techniques onto a bar chart. Thereby,the authors compare the usability of parallel coordinates withother types of visualizations. To evaluate different methodsof image fusion, Dixon et al. [DLN∗06] present eye locationaccuracy with bar charts. A 3D bar chart shows the fixationdistribution mainly around the screen center in a TV viewinguser experiment by Brasel and Gips [BG08].
Scatter plots are commonly used to plot data in a 2DCartesian diagram. This type of diagram shows relationsbetween two values of a sample. Just and Carpenter [JC76]plot the relation between response latency and angulardisparity. Berg et al. [BBM∗09] compare human vision andmonkey vision. The authors present scatter plots of amplitudeand velocity measurements of saccadic movements for bothspecies. Additionally, they compared saliency of humans andmonkeys and show results also using a scatter plot.
Box plots are a popular visualization technique to presentstatistical distribution. Hornof and Halverson [HH02] ana-lyze absolute, horizontal, and vertical deviation of fixationsfor participants of their experiment to monitor the deteriora-tion of the calibration of the eye tracker. Dorr et al. [DMGB10]investigate how similar eye movement patterns of differentsubjects are when viewing dynamic natural scenes. Tocompare eye movements they employ normalized scanpathsaliency scores and show a boxplot of the computed scoresfor different movies.
Another type of statistical graphics is the star plot used byGoldberg and Helfman [GH10c] to analyze angular propertiesof scanpaths and by Nakayama and Hayashi [NH10] to studyangular properties of fixation positions.
4. Point-Based Visualization Techniques
This section comprises all visualization techniques that usespatial and temporal information of recorded data points (i.e.,x- and y-coordinates of fixations along with temporal infor-mation) for visualization directly. Therefore, a definition ofAOIs is not required. These visualization techniques can beused for the analysis of temporal evolution of the positionof data points, distribution of attention, scanpath analysis, orspatio-temporal structure of eye tracking data.
4.1. Timeline Visualizations
Timelines are a typical approach to visualize temporal data.A point-based timeline visualization represents time on oneaxis of a coordinate system and eye tracking data on the otheraxis. Such plots are usually represented in 2D space. There-fore, only one image dimension is left for the fixation dataand some reduction from the original x- and y-coordinateshas to be performed. For example, fixation position canbe split into its x- and y-coordinates and each one can berepresented individually as shown in Figures 4 and 5. Forthe x-coordinate, time is depicted on the y-axis and for they-coordinate, time is shown on the x-axis [GH10c]. This canbe done for static or dynamic stimuli and for one or multipleparticipants [GDS10]. Such timeline visualizations reducecrossings and overlaps of the saccade lines. Furthermore, the
c© The Eurographics Association 2014.

T. Blascheck, K. Kurzhals, M. Raschke, M. Burch, D. Weiskopf & T. Ertl / State-of-the-Art of Visualization for Eye Tracking Data
visualization technique allows a visual scanpath comparisonto measure the similarity of aggregated scanpaths [GDS10].Additionally, a general overview of scanning tendenciescan be seen such as downward and upward scanning, orhorizontal shifts [GH10c]. However, the separation into x-and y-coordinates makes it difficult to perceive the combinedbehavior in the two spatial dimensions.
Figure 4: Temporal evolution of a scanpath of one partic-ipant separated into x- and y-direction. On the left side ascanpath is shown representing only the saccades. In themiddle, the same scanpath is shown representing solely they-coordinate. Time is represented on the x-axis. On the leftside, the scanpath represents the x-coordinate. Time is repre-sented on the y-axis. Figure reprinted with kind permissionfrom Goldberg and Helfman [GH10c].
Figure 5: Temporal evolution of scanpaths of multiple par-ticipants. Time is represented on the horizontal axis, and thevertical fixation position on the vertical axis. Individual scan-paths are represented by a different color. Figure reprintedwith kind permission from Grindinger et al. [GDS10].
4.2. Attention Maps
For spatial visualization techniques, marking fixation po-sitions as an overlay on a stimulus is one of the simplestvisualization techniques for recorded eye movements andwas applied to dynamic stimuli as early as in 1958 by Mack-worth and Mackworth [MM58]. The combined visualizationof this fixation data from different participants and the stim-ulus is denoted bee swarm [Tob08]. It is usually presentedas an animation to show the temporal changes of fixations.
The aggregation of fixations over time and/or participantsis known under the term attention map, fixation map, orheat map and can be found in numerous publications assummarizing illustrations of the analyzed data. The mainpurpose of attention maps is to obtain an overview of theeye movements and identify regions on the stimulus thatattract much attention; the latter is often used to determineAOIs. There are numerous papers describing how to createattention maps (e.g., [ŠM07, Bli10]).
Bojko [Boj09] introduces different types of attention mapsdepending on the data used, e.g., fixation count attentionmaps, absolute fixation duration attention maps, relativefixation duration attention maps, or participant percentageattention maps. Each type has its benefits depending onthe data needed for an evaluation. In her paper, guidelinesfor using attention maps are described to avoid misuse andmisinterpretation of attention maps. A review of attentionmaps is given by Holmqvist et al. [HNA∗11], who furtherrecommend that attention maps should be used with care.
Classical attention maps are visualized as luminancemaps [VH96], 3D landscapes [Lat88, Woo02, HRO11], 2Dtopographic maps with contour lines [GWP07, DMGB10],or with color coding [Boj09, DPMO12]. To emphasize at-tended regions, alternative visualization techniques use filterapproaches to reduce sharpness and color saturation [DJB10]in the unattended regions.
For dynamic stimuli, like videos, not only the spatial,but also the temporal component of the data is generallyvisualized by applying dynamically changing attention maps,for example, to identify attentional synchrony of multipleparticipants [MSHH11]. Attention maps for dynamic stimulibear the problem that an aggregation of the data cannot berepresented statically due to the changing stimulus. Thisproblem is overcome by motion-compensated attention mapsusing optical flow information between consecutive framesto adjust fixation data based on the moving object that wasattended [KW13]. This leads to an attention map where thehighest values are on the moving object (cf. Figure 6).
When looking at 3D stimuli, the third dimension has tobe included into the attention map. Usually, this is done byrepresenting the attention map on the 3D model itself [Pfe12,PSF∗13a, PSF∗13b] as shown in Figure 7 on the right. An-other possibility is to use a 2D representation of the 3Dstimulus and show the attention map on this 2D projec-tions [SND10a] (cf. Figure 7 on the left). However, this leadsto data loss due to the reduction of one dimension. A thirdpossibility when multiple objects are shown in a 3D scene isto color code the complete object in the attention map colorshown in Figure 7 in the middle [SND10a]. The creation ofattention maps for 3D stimuli is often associated with theutilization of additional information about object positions inthe stimulus or feature detection.
c© The Eurographics Association 2014.

T. Blascheck, K. Kurzhals, M. Raschke, M. Burch, D. Weiskopf & T. Ertl / State-of-the-Art of Visualization for Eye Tracking Data
a) Traditional Attention Map
b) Motion-Compensated Attention Map
Figure 6: A conventional attention map for a video scene isdisplayed in (a), where most of the attention seems to be ontwo people in the background. The motion-compensated at-tention map in (b) shows that most attention actually was onthe moving car. The motion-compensated attention map usesoptical flow information to adjust fixations before the atten-tion map is calculated. Figure reprinted with kind permissionfrom Kurzhals and Weiskopf [KW13] and IEEE.
a) Projected b) Object-based c) Surface-based
Figure 7: Attention maps for 3D stimuli: (a) the projected at-tention map, (b) object-based attention map, and (c) surface-based attention map. Figure reprinted with kind permissionfrom Stellmach et al. [SND10b] and ACM.
4.3. Scanpath Visualizations
Spatio-temporal visualization with scanpaths connect consec-utive fixations through saccade lines on the stimulus. Notonand Stark [NS71a, NS71b] used the word “scanpath” to de-scribe a fixation path of one subject when viewing a specificpattern. Today, the word “scanpath” describes any sequenceof saccades and fixations on a stimulus [HNA∗11]. In a
typical scanpath visualization, each fixation is indicated by acircle, where the radius corresponds to the fixation duration,see Figure 8. Saccades between fixations are represented byconnecting lines [SPK86]. Additional information such asthe speed of fixations can be represented by changing thecolor of the fixation circles [Lan00]. A simple scanpath onlyshows recorded saccades without printing circles for thefixations [Yar67]. Another interesting eye tracking metric isthe convex hull of a scanpath [GK99].
Figure 8: In a typical scanpath visualization, each fixationis indicated by a circle, where the radius corresponds to thefixation duration. Saccades between fixations are representedby connecting lines between these circles.
Many different approaches exist to show position of fix-ations and their temporal information in a scanpath layout.However, only scanpath visualizations like the one shown inFigure 8 are broadly used today. It is clear that this kind ofvisualization quickly produces visual clutter, if several scan-paths are shown in one visualization to study eye movementbehavior. On the one hand, if scanpath shapes are different,lines and circles are plotted all across the visualization andit is difficult to find patterns. On the other hand, if scanpathshapes are similar, all saccade lines and fixation circles lieone over the other. Again, it is very difficult to compare thesescanpaths with each other.
Many approaches have been presented to overcome theproblem of visual clutter. One approach averages or bun-dles scanpaths [HFG06, HEF∗13, CAS13]. A crucial ques-tion is to find an adequate averaging or bundling criterion.This question of scanpath similarity has not been fullyanswered. Another solution is to reduce the ink used inscanpath visualizations and to show a condensed versionof a scanpath [GH10c] (cf. Figure 9). The advantage ofthis visualization technique is that less visual clutter isproduced since circles for representing fixations are missing.However, the drawback of this graphical representation isthat it is still difficult to visually identify common scanpathpatterns by comparing line directions. Another solution is
c© The Eurographics Association 2014.

T. Blascheck, K. Kurzhals, M. Raschke, M. Burch, D. Weiskopf & T. Ertl / State-of-the-Art of Visualization for Eye Tracking Data
to break down the spatial information of fixations into theirtwo dimensions [CPS06]. For example, the vertical andhorizontal components of saccades are then shown separatelyon four sides of an attention map visualization [BSRW14](cf. Figure 11). The advantage of this visualization techniqueis that the horizontal and vertical characteristics can bestudied independently from each other. However, it demandsmore mental effort to combine the two separately presentedviews into one mental image of the scanpath. Still, anotherpossibility is to shown only a part of the scanpath at a time,for example, the proceeding five seconds of a selectedtimestamp, or time frame [WFE∗12].
a) Standard
b) Light to Dark
c) Multicolor
d) Thin to Thick
Figure 9: Different types of scaled traces where the scan-path representation is shown without fixation durations. In(a) the normal scaled trace is shown, the line type in (b) ischanged from light to dark, in (c) multicolors are used foreach saccade. In (d) the line thickness changes from thin tothick. Figure reprinted with kind permission from Goldbergand Helfman [GH10c].
Another challenge of scanpath visualization is how toshow 3D fixation information. Basically, there are twoapproaches. The first one, shown in Figure 10, is to visualizescanpaths over the original stimulus [DMC∗02, SND10b,Pfe12, PSF∗13a]. The other one is to warp the stimulus intoa 2D representation and to draw scanpath lines on this 2Dimage [RTSB04]. Besides the question how to adequatelyshow 3D data on a 2D computer screen, which might lead todata loss, visualization of scanpaths from 3D data have samethe limitations as their 2D counterparts.
4.4. Space-Time Cube
As an alternative spatio-temporal visualization approach,space-time cube (STC) visualizations are commonly used invarious research fields [Häg82, Kra03]. For the application toeye tracking data, the 2D spatial domain of the stimulus isextended by a third, temporal dimension. This representation
Figure 10: The scanpath in 3D environments is representedwith spheres as shown in the left figure. The cones used inthe right figure are a different technique to show the scan-path of a participant. This technique allows to encode addi-tional information into the scanpath besides fixation dura-tion. Figure reprinted with kind permission from Stellmach etal. [SND10b] and ACM.
provides an overview of the complete data set and can be ap-plied to static [LÇK10] and dynamic stimuli [DM98, KW13].With the STC, scanpaths, fixations, and cluster informationare visualized statically and allow a direct identification ofinteresting timespans that would require a sequential searchin the data otherwise.
Figure 12 shows an STC for the visualization of fixationsand gaze clusters of multiple participants, recorded from adynamic stimulus. A sliding video plane along the temporaldimension is applied to relate timespans with the dynamiccontent of the stimulus. Since this 3D visualization bearsissues resulting from occlusion, distortion, and inaccuratedepth perception, 2D projections of the data can be appliedto walls on the sides of the STC.
The main advantage of the STC in comparison to alterna-tive visualization techniques, is the direct overview of datafrom multiple participants that allows an efficient identifica-tion of important AOIs. To this point, an application of theSTC to data from multiple participants was applied to syn-chronizable stimuli only. The application of this visualiza-tion technique to asynchronous data (i.e., head-mounted eyetracking data) has not been investigated so far, since it bearsadditional issues with the spatio-temporal coherence betweenparticipants and an AOI-based analysis of this kind of dataprovides more effective approaches.
5. AOI-Based Visualization Techniques
Other than the point-based visualization techniques, AOI-based visualization techniques use additional informationof the recorded fixation data that annotates regions or ob-jects on the stimulus that are of special interest to the user.The annotation of AOIs in a static stimulus is often solvedby defining bounding shapes around an area or an object.Automatic fixation clustering algorithms are also a common
c© The Eurographics Association 2014.

T. Blascheck, K. Kurzhals, M. Raschke, M. Burch, D. Weiskopf & T. Ertl / State-of-the-Art of Visualization for Eye Tracking Data
Figure 11: Saccade plots represents the horizontal and vertical position of a saccade on the four sides of a stimulus. The positionis represented by a dot and the color coding is used to distinguish between the different saccades. The distance of the dot fromthe stimulus represents the length of the saccade. If a dot is placed on the left or right side, or top or bottom depends on theposition of the saccade in the stimulus. For example, if the saccade is in the top part of the stimulus it is shown on top of thestimulus. Figure based on [BSRW14].
approach to identify AOIs on a stimulus [PS00, SD04].With AOI information, various metrics can be applied tothe data [PB06, JK03], depending on the user’s researchquestions. A simple in-context approach is an overlay ofAOI boundaries on the stimulus with values of the usedmetric in each AOI (e.g., dwell time in an AOI [RVM12]).The visualization techniques in this section visualize mainlytemporal aspects of the data, or relations between AOIs.
5.1. Timeline AOI Visualizations
Similar to point-based data, timelines can also be applied toshow temporal aspects of AOI-based data. As in the case ofpoint-based timeline visualizations, time is again representedas one axis of a coordinate system. The other axis can repre-sent AOIs or participants.
In the case of AOIs represented on the second axis eitherone user, averaged information of multiple users, or multipleusers separately can be shown. In general, all of these tech-niques represent the AOIs on separate timelines horizontallyor vertically next to each other. A visualization techniquerepresenting only one user at a time is shown in Figure 13.
Here, either fixations can be represented [RAM∗05] orthe timespan of an AOI visit can be shown with a rectan-gle [CN00, Hol01]. The first one is similar to a scanpath aseach fixation is represented individually. Therefore, showingmultiple participants on top of each other would lead tovisual clutter. However, for investigating individual partici-pants, as for example in reading tasks [ŠR08, BR05] whereeach word represents one AOI, this technique can be helpfulas it allows to see backtracks (i.e. backward movementsto re-read words). Furthermore, attention maps allow todisplay fixation frequencies on visual regions of interestover time [Coc09]. There is a condensed version of thisvisualization technique [KDX∗12]. This technique uses onlyone horizontal axis for time. Each fixation is displayed as acircle on the horizontal axis. The radius of the AOI circlecorresponds to the fixation duration and the color of eachfixation corresponds to the AOI. This visualization indicateshow long and how often an AOI was visited and how manyfixations belong to an AOI.
Representing averaged eye tracking data allows to showdata of multiple participants in the same visualization with-out causing visual clutter. This can be represented by a time-
c© The Eurographics Association 2014.

T. Blascheck, K. Kurzhals, M. Raschke, M. Burch, D. Weiskopf & T. Ertl / State-of-the-Art of Visualization for Eye Tracking Data
Figure 12: Space-time cube visualization for video eye tracking data. A temporal dimension (green) extends the spatial dimensionof the video to a static overview of the data. Gaze clusters are generated automatically from the gaze data of all participants.The gaze points are projected onto the sidewalls of the space-time cube. A frame-by-frame navigation is realized to be able toinvestigate interesting frames. Figure based on [KW13].
Figure 13: The time plot (on the right) uses a horizontaltimeline for each AOI, which are highlighted as rectangleson the stimulus (on the left). Each fixation is drawn as acircle at its point in time and depending on the AOI. Thecircle radius indicates the fixation duration. Each fixation isconnected by a line showing the path. Figure reprinted withkind permission from Räihä et al. [RAM∗05].
line for each AOI where the AOI visit is indicated by a rect-angle [KHW14] or by using AOI rivers [BKW13] shown inFigure 15. Here, the time spent in each AOI and the distribu-tion amongst participants can be seen.
When each participant is represented individually, atimeline for each is shown. Here, a representation withrectangles [HNA∗11, WFE∗12] or as a scanpath can beused [ITS00, RCE12]. The second visualization, shownin Figure 14, allows a visual scanpath comparison whenapplying statistical measures [RHB∗14].
When participants are used for the second dimension,AOI hits are represented as rectangles on the timeline. This
t
AOI 1 AOI 2 AOI 3 AOI 4
Figure 14: Parallel scanpath visualization maps time ontothe y-axis and the AOIs of a stimulus onto the x-axis. Foreach participant the fixations within an AOI are displayedaccording to time, and the saccades are represented by lines.Figure based on [RCE12].
visualization technique is called a scarf plot [RD05]. It can beextended by displaying each fixation with the correspondingduration separately, the color of the fixation indicating theAOI it belongs to [RHOL13]. Participant groups instead ofindividual participants can be visualized by displaying AOIswith a thumbnail image on the x-axis [TTS10]. This canboth be used for static and dynamic stimuli. Condensingthe scarf plot even more can be achieved by placing a scarfline for all participants belonging to one group next toeach other. A scarf plot technique can also be combined
c© The Eurographics Association 2014.

T. Blascheck, K. Kurzhals, M. Raschke, M. Burch, D. Weiskopf & T. Ertl / State-of-the-Art of Visualization for Eye Tracking Data
Figure 15: Based on ThemeRiver by Havre et al. [HHWN02], the AOI Rivers display the change of fixation frequencies for eachAOI and transitions between AOIs. Time is represented on the x-axis, and each AOI is color-coded individually. Figure basedon [BKW13].
Figure 16: AOIs are placed in a circular layout in the middleof the search path. The size of the AOI circle correspondsto the number of visits to that AOI. The smaller circles in-side an AOI represent the transition probability for this AOIfrom each other AOI. Each fixation is then placed next to itscorresponding AOI, which leads to a circular looking searchpath. Figure reprinted with kind permission from Lorigo etal. [LHB∗08].
with an AOI timeline [KHW14] (cf. Figure 17). For 3Dstimuli, the scarf plot can be extended to a the model ofinterest timeline. It represents objects in a 3D scene insteadof AOIs [SND10b]. Each object is assigned a color, andobjects belonging to a semantic group can be distinguishedby assigning the same color. The times when an objectwas focused on is displayed on the x-axis with a coloredrectangle (cf. Figure 18). The scarf plot can be used to findsimilar search patterns of participants by calculating thescanpath similarity. Furthermore, it allows to see which AOIshave been looked at the most or the least. However, the
transition information between AOIs is lost with these typesof visualizations.
A different approach, where the time axis is representedin a circular layout allows to represent AOIs in the middle ofthe circle (cf. Figure 16). The AOIs can include additional in-formation, as for example, the transition probability [PLG06].The temporal information of which AOI has been visited atwhat point in time is represented in this technique. However,it does not scale well if many AOIs are represented at thesame time.
5.2. Relational AOI Visualizations
Relational visualization techniques use AOIs and showthe relationship between them, for example, how oftenattention changed between two AOIs. Different metrics arerepresented in the AOI context, for example, the transitionpercentage or transition probability between two AOIs. Acommon visualization technique to evaluate transitionsbetween AOIs is the transition matrix [GK99]. A transitionmatrix orders AOIs horizontally in rows and vertically incolumns and each cell contains the number of transitionsbetween two AOIs (cf. Table 2). This matrix representationcan be used to evaluate the search behavior of participants.In this case, the stimulus is equally divided up into a grid ofAOIs. For example, a densely filled matrix indicates poorsearch behavior since all AOIs have been focused on forseveral times. Finding visual search patterns is improvedwhen cells in the transition matrix are colored to show thetransition count [LPS∗12].
Furthermore, transition matrices can be used to comparemultiple participants. The classical transition matrix only
c© The Eurographics Association 2014.

T. Blascheck, K. Kurzhals, M. Raschke, M. Burch, D. Weiskopf & T. Ertl / State-of-the-Art of Visualization for Eye Tracking Data
Figure 17: The upper part shows AOI timelines with attention histograms. The lower part shows scarf plots of ten participants.For each participant a timeline is shown with colored timespans that correspond to the colors of visited AOIs. Black spacesindicate that no AOI was looked at. Figure based on [KHW14].
Figure 18: Models of a 3D stimulus are mapped to a timeline depending on the time when and how long they were fixated. Figurereprinted with kind permission from Stellmach et al. [SND10b] and ACM.
represents one participant. If all participants are representedin the same matrix a visual comparison of search strategiesis possible. This is achieved by concatenating the matricesof all participants and assigning a value to each matchingsequence between them as shown in Figure 19 [GH10b]. Asimilar visualization technique using matrices is to placeAOIs horizontally as rows and, for example, the task or queryof a study vertically as columns. Each cell can then containdifferent metrics such as fixation duration, or fixation count[ETK∗08,SLHR09]. A matrix representation mixes statisticalmeasures with a visual representation. This representation hasthe advantage of comparing 2D data sets visually. However,if the number of AOIs is high, the matrix becomes large.
The following visualization techniques are not focusedon representing statistical information as the transitionmatrix. Rather, the relation between AOIs is analyzed byusing well established visualization techniques such as adirected graph or tree visualization. A directed graph canbe used to show transitions between AOIs (cf. Figures 20and 21). Each node of the graph depicts one AOI and thelinks depict the transitions. Node size can be varied orcolor coding can be used to represent different metricssuch as fixation count or fixation duration. The thicknessof a link can depict the number of transitions between twoAOIs as shown in the example in Figure 20. Usually, this
Table 2: A classical transition matrix orders AOIs of oneparticipant horizontally in rows and vertically in columns.Each cell represents the number of transitions between twoAOIs. The diagonal is empty as no transitions within AOIscan exist [GK99].
AOI 1 AOI 2 AOI 3 AOI 4AOI 1 - 1 0 3AOI 2 2 - 4 1AOI 3 0 7 - 3AOI 4 1 0 2 -
type of diagram represents only data of one participant.Averaged values of multiple participants can also be used.Most visualization techniques show the graph independentlyof the stimulus [IHN98, FJM05, TAK∗05, SSF∗11, BRE13].Losing the topological order makes the graph harder tointerpret. However, the transition information allows one tosee in which order AOIs have been looked at or how oftenthe participant returned to look at an AOI. One example ofsuch a visualization technique is shown in Figure 21. Likethe transition matrix, the graph representation does not scalewell to a vast amount of AOIs.
c© The Eurographics Association 2014.

T. Blascheck, K. Kurzhals, M. Raschke, M. Burch, D. Weiskopf & T. Ertl / State-of-the-Art of Visualization for Eye Tracking Data
Figure 19: The AOI sequences of multiple users are con-catenated and shown in one matrix horizontally and verti-cally. Each matching sequence is marked by a red line. Greenlines show where the AOI sequence of one participant ends.Figure reprinted with kind permission from Goldberg andHelfman [GH10a] and ACM.
A tree visualization can be used to compare AOI se-quences of participants. A node in the tree represents an AOI.Each branch in the tree represents a different AOI sequenceas shown in Figure 22. Thus, many branches represent manydifferent search patterns [WHRK06, TTS10, RHOL13].This visual comparison of scan patterns allows one to findparticipant groups. However, it can only be used for short se-quences, because for long sequences the difference betweenparticipants will be to large and each participant would be asingle participant group.
6. Discussion of Future Research Directions
Numerous visualization techniques have been developedto visualize different aspects of eye tracking data. Table 1shows an overview of existing approaches: visualizations forpoint-based data, AOI-based data, and visualizations for bothdata types. From this overview, we can recognize that someaspects of eye tracking analysis have been investigated to alesser degree than others.
The column for the category “interactive visualization”shows that there are not many visualizations for interactiveanalysis of eye tracking data. Most visualizations follow theparadigm of static visualization and provide little support forinteraction. For this reason, we motivate to allow more userinteraction with visualization techniques for eye tracking data.
Figure 20: The top figure represents AOIs as circles whichare placed on the stimulus. The radius of the circle presentsthe proportional dwell time. Transitions are depicted by ar-rows where the thickness presents the number of transitionsbetween two AOIs. Figure reprinted with kind permissionfrom Holmqvist et al. [HHBL03] and Elsevier. The bottomfigure depicts AOIs in a triangular layout with the most impor-tant AOI in the middle. Transitions are represented by arrowswith the thickness corresponding number of transitions. Fig-ure reprinted with kind permission from Tory et al. [TAK∗05]and IEEE.
Interaction allows the user to investigate the data by usingfiltering techniques or selecting participants.
Table 1 also shows that the number of spatio-temporalvisualization techniques for AOI-based analysis is small.Usually, if time is visualized for AOI-based methods, a time-line is used along with one other data dimension. Therefore,animation is not needed. This might also explain the lack ofin-context visualization techniques for AOI-based analysis.In case of point-based eye tracking visualizations, fixationdata is often overlaid on the stimulus or presented as a 3Dvisualization in case of dynamic stimuli. For in-context AOI-based visualization, the presentation of the eye tracking datais more abstract. This abstraction is intended to help analystsconcentrate on specific semantic questions. However, themental map of the eye tracking data on the stimulus is lost.
c© The Eurographics Association 2014.

T. Blascheck, K. Kurzhals, M. Raschke, M. Burch, D. Weiskopf & T. Ertl / State-of-the-Art of Visualization for Eye Tracking Data
Figure 21: The circular heat map transition diagram placesAOIs on a circle, where the AOI circle segment is color-codedbased on the fixation count inside the AOI. The size of thecircle segment indicates the total dwell time within an AOI.Transitions between AOIs are represented by arrows, with thethickness displaying the number of transitions. Figure basedon [BRE13].
Figure 22: A word tree represents the sequences of AOIsstarting at a selected AOI. The font size corresponds to thenumber of sequences. The sequence AOI 0, AOI 10 and AOI11, shows the most common sequence amongst participants.
In general, for AOI-based methods, the biggest limitation isthe number of AOIs that can be represented at once. Mostof the techniques do not scale well, if there are many AOIs.Here, new visualization techniques have to be developed.
We found that the number of visualization techniques forthe category “dynamic stimuli” increased within the last fiveyears. The literature research also showed that the question ofhow the visual analysis of multiple viewers with an individualstimulus is still an interesting research topic. Applicationareas for dynamic stimuli are, for example, video data ordata coming from a head-mounted eye tracker. Only a fewapproaches deal with the question of how 3D eye trackingdata can be visualized. This question is important in case ofuser experiments that record stereoscopic fixation data.
Also, separate handling of smooth pursuit from dynamicstimuli has mostly been neglected. Including smooth pursuitinformation in scanpath representations, for example, couldprovide valuable information about attentional synchronybehavior of multiple viewers.
Furthermore, we think that multimodal data visualizationtechniques will become more important due to the interdis-ciplinary character of eye tracking research. For example,eye tracking data could be combined with other sensorinformation coming from EEG devices, or skin-resistancemeasurements. One approach is already included in the com-mercial software BeGaze from SMI [SMI14]. However, thereare many open questions for new visualizations techniques inthis direction.
Another challenge in eye tracking are stimuli with activecontent, where the user can influence the stimulus during thestudy. For example, in studies of the usability of Web pages,users may click on links and navigate to different sites. Here,the question is how participants can be compared. Often,a representative stimulus is created and the fixation of theparticipants are manually mapped to the stimulus. However,this might lead to erroneous data due to ambiguity or inac-curacies introduced by the annotator. A tool called GazeTracker [Lan00] records the complete Web page informationand scroll behavior automatically. Yet, this approach canonly be used for Web pages or graphical user interfaces. Webelieve that further visualization techniques for this type ofstimulus will be developed in the future.
Our literature review showed that there is a large numberof visualization techniques for the analysis of eye trackingdata. However, it is not always apparent which visualiza-tion technique works best for which type of analysis. Thisquestion cannot be answered completely and to a full extent.Choosing an appropriate visualization technique depends ondifferent factors. Therefore, we have classified the presentedtechniques based on our taxonomy. Yet, we have let out theanalysis task. For example, a common analysis task is tocompare scanpaths of participants. Comparing scanpathsof multiple users can help find regularities or similar pat-terns between different participants. Many of the presentedvisualization techniques can be used for scanpath compari-son [Coc09, GH10b, TTS10, WHRK06, RHOL13, RBB14].This is just one example of how the analysis task influencesthe type of visualization technique for an evaluation.
Finding patterns in the eye tracking data is a general goalof eye tracking analysis. However, often not one visualiza-tion technique alone is sufficient to find those patterns andanalyze the eye tracking data. Rather, multiple visualizationtechniques have to be used in combination. An interactionof the user with the visualization techniques can furtherimprove analysis results. In the end, statistical tests have tobe used to show that results are significant. Therefore, wepropose to combine those approaches: using visualizations,statistics, and interaction together. This is to some extenddone by visual analytics and could therefore, also be appliedto eye tracking analysis.
c© The Eurographics Association 2014.

T. Blascheck, K. Kurzhals, M. Raschke, M. Burch, D. Weiskopf & T. Ertl / State-of-the-Art of Visualization for Eye Tracking Data
7. Conclusion
In this state-of-the-art report, we have reviewed existing pa-pers describing eye tracking visualizations. To classify thedifferent approaches we have created a taxonomy that dividesthe papers into point-based and AOI-based visualization tech-niques as well as into visualizations that use both types ofdata. Furthermore, we have classified the papers on the sec-ond level according to the data represented: temporal, spa-tial, or spatio-temporal. An overview of all visualization tech-niques was given as well as a detailed description of the dif-ferent visualization techniques. Based on the results, we havepresented future directions for research.
References
[AABW12] ANDRIENKO G., ANDRIENKO N., BURCH M.,WEISKOPF D.: Visual analytics methodology for eye movementstudies. IEEE Transactions on Visualization and Computer Graph-ics 18, 12 (2012), 2889–2898. 1, 4, 5
[AHR98] AALTONEN A., HYRSKYKARI A., RÄIHÄ K.-J.: 101spots, or how do users read menus? In Proceedings of the SIGCHIConference on Human Factors in Computing Systems (1998), CHI’98, pp. 132–139. 4
[AJTZ12] ATKINS S., JIANG X., TIEN G., ZHENG B.: Sac-cadic delays on targets while watching videos. In Proceedings ofthe 2012 Symposium on Eye Tracking Research & Applications(2012), ETRA’12, pp. 405–408. 7
[BBD09] BECK F., BURCH M., DIEHL S.: Towards an aestheticdimensions framework for dynamic graph visualisations. In Pro-ceedings of the 13th International Conference on InformationVisualization (2009), IV ’09, pp. 592–597. 5
[BBM∗09] BERG D. J., BOEHNKE S. E., MARINO R. A.,MUNOZ D. P., ITTI L.: Free viewing of dynamic stimuli byhumans and monkeys. Journal of Vision 9, 5 (2009), 1–15. 7
[BFH10] BALDAUF M., FRÖHLICH P., HUTTER S.: KIBITZER:A wearable system for eye-gaze-based mobile urban exploration.In Proceedings of the 1st Augmented Human International Con-ference (2010), AH ’10, pp. 9:1–9:5. 6
[BG08] BRASEL S. A., GIPS J.: Points of view: Where do welook when we watch TV. Perception 37, 12 (2008), 1890–1894. 7
[BKW13] BURCH M., KULL A., WEISKOPF D.: AOI Rivers forvisualizing dynamic eye gaze frequencies. Computer GraphicsForum 32, 3.3 (2013), 281–290. 6, 12, 13
[Bli10] BLIGNAUT P.: Visual span and other parameters for thegeneration of heatmaps. In Proceedings of the 2010 Symposiumon Eye Tracking Research & Applications (2010), ETRA ’10,pp. 125–128. 8
[BM13] BREHMER M., MUNZNER T.: A multi-level typology ofabstract visualization tasks. IEEE Transactions on Visualizationand Computer Graphics 19, 12 (2013), 2376–2385. 4
[Boj09] BOJKO A.: Informative or misleading? heatmaps decon-structed. In Human-Computer Interaction. New Trends, Jacko J.,(Ed.), LNCS ’09. Springer, 2009, pp. 30–39. 6, 8
[BR05] BEYMER D., RUSSELL D. M.: WebGazeAnalyzer: Asystem for capturing and analyzing web reading behavior usingeye gaze. In CHI ’05 Extended Abstracts on Human Factors inComputing Systems (2005), CHI EA ’05, pp. 1913–1916. 6, 11
[BRE13] BLASCHECK T., RASCHKE M., ERTL T.: Circular heatmap transition diagram. In Proceedings of the 2013 Conferenceon Eye Tracking South Africa (2013), ETSA ’13, pp. 58–61. 6,14, 16
[BSRW14] BURCH M., SCHMAUDER H., RASCHKE M.,WEISKOPF D.: Saccade plots. In Proceedings of the 2014 Sympo-sium on Eye Tracking Research & Applications (2014), ETRA’14,pp. 307–310. 6, 10, 11
[CAS13] CHEN M., ALVES N., SOL R.: Combining spatial andtemporal information of eye movement in goal-oriented tasks. InHuman Factors in Computing and Informatics. Springer, 2013,pp. 827–830. 6, 9
[CCY∗03] CONVERTINO G., CHEN J., YOST B., RYU Y.-S.,NORTH C.: Exploring context switching and cognition in dual-view coordinated visualizations. In Proceedings of the 2003 In-ternational Conference on Coordinated and Multiple Views inExploratory Visualization (2003), pp. 55–62. 7
[CHC10] CONVERSY S., HURTER C., CHATTY S.: A descriptivemodel of visual scanning. In Proceedings of the 3rd BELIV’10Workshop: BEyond Time and Errors: Novel evaLuation methodfor Information Visualization (2010), BELIV ’10, pp. 35–42. 3
[Chi00] CHI E. H.: A taxonomy of visualization techniques usingthe data state reference model. In IEEE Symposium on InformationVisualization (2000), InfoVis ’00, pp. 69–75. 4
[CM97] CARD S., MACKINLAY J.: The structure of the informa-tion visualization design space. In IEEE Symposium on Informa-tion Visualization (1997), InfoVis ’97, pp. 92–99. 4
[CN00] CROWE E. C., NARAYANAN N. H.: Comparing interfacesbased on what users watch and do. In Proceedings of the 2000Symposium on Eye Tracking Research & Applications (2000),ETRA ’00, pp. 29–36. 6, 11
[Coc09] COCO M. I.: The statistical challenge of scan-path anal-ysis. In Proceedings of the 2nd Conference on Human SystemInteractions (2009), HSI’09, pp. 372–375. 11, 16
[CPS06] CROFT J., PITTMAN D., SCIALFA C.: Gaze behaviorof spotters during an air-to-ground search. In Proceedings ofthe 2006 Symposium on Eye Tracking Research & Applications(2006), ETRA ’06, pp. 163–179. 10
[DDJ∗10] DUCHOWSKI A. T., DRIVER J., JOLAOSO S., TAN W.,RAMEY B. N., ROBBINS A.: Scan path comparison revisited. InProceedings of the 2010 Symposium on Eye Tracking Research &Applications (2010), ETRA ’10, pp. 219–226. 1
[DJB10] DORR M., JARODZKA H., BARTH E.: Space-variantspatio-temporal filtering of video for gaze visualization and per-ceptual learning. In Proceedings of the 2010 Symposium on EyeTracking Research & Applications (2010), ETRA ’10, pp. 307–314. 6, 8
[DLN∗06] DIXON T. D., LI J., NOYES J., TROSCIANKO T.,NIKOLOV S., LEWIS J., CANGA E., BULL D., CANAGARA-JAH C.: Scan path analysis of fused multi-sensor images withluminance change: A pilot study. In Proceedings of the 9th In-ternational Conference on Information Fusion (2006), pp. 1–8.7
[DM98] DUCHOWSKI A., MCCORMICK B. H.: Gaze-contingentvideo resolution degradation. In Proceedings of the Society ofPhotographic Instrumentation Engineers (1998), vol. 3299 ofSPIE ’98, pp. 318–329. 6, 10
[DMC∗02] DUCHOWSKI A., MEDLIN E., COURINA N.,GRAMOPADHYE A., MELLOY B., NAIR S.: 3D eye movementanalysis for VR visual inspection training. In Proceedings ofthe 2002 Symposium on Eye Tracking Research & Applications(2002), ETRA ’02, pp. 103–155. 6, 10
c© The Eurographics Association 2014.

T. Blascheck, K. Kurzhals, M. Raschke, M. Burch, D. Weiskopf & T. Ertl / State-of-the-Art of Visualization for Eye Tracking Data
[DMGB10] DORR M., MARTINETZ T., GEGENFURTNER K. R.,BARTH E.: Variability of eye movement when viewing dynamicnatural scenes. Journal of Vision 10, 10 (2010), 1–17. 7, 8
[DPMO12] DUCHOWSKI A. T., PRICE M. M., MEYER M.,ORERO P.: Aggregate gaze visualization with real-time heatmaps.In Proceedings of the 2012 Symposium on Eye Tracking Research& Applications (2012), ETRA’12, pp. 13–20. 6, 8
[Duc02] DUCHOWSKI A.: A breadth-first survey of eye-trackingapplications. Behavior Research Method, Instruments, & Comput-ers 34, 4 (2002), 455–470. 1
[Duc07] DUCHOWSKI A.: Eye Tracking Methodology: Theoryand Practice, 2nd ed. Science+Business Media. Springer, 2007. 4
[ETK∗08] EGUSA Y., TERAI H., KANDO N., TAKAKU M.,SAITO H., MIWA M.: Visualization of user eye movement forsearch result pages. The 2nd International Workshop on Evaluat-ing Information Access (EVIA) - (2008), 42–46. 6, 14
[FJM05] FITTS P. M., JONES R. E., MILTON J. L.: Eye move-ment of aircraft pilots during instrument-landing approaches. Er-gonomics: Psychological Mechanisms and Models in Ergonomics3 (2005), 56–66. 14
[GDS10] GRINDINGER T., DUCHOWSKI A., SAWYER M.:Group-wise similarity and classification of aggregate scanpaths.In Proceedings of the 2010 Symposium on Eye Tracking Research& Applications (2010), ETRA ’10, pp. 101–104. 6, 7, 8
[GE95] GERSHON N. D., EICK S. G. (Eds.):. IEEE SymposiumOn Information Visualization 1995, (InfoVis) (1995), InfoVis ’95,IEEE Computer Society. 2
[GH10a] GOLDBERG J. H., HELFMAN J. I.: Comparing infor-mation graphics: a critical look at eye tracking. In Proceedingsof the 3rd BELIV’10 Workshop: BEyond Time and Errors: NovelevaLuation method for Information Visualization (2010), BELIV’10, pp. 71–78. 15
[GH10b] GOLDBERG J. H., HELFMAN J. I.: Scanpath clusteringand aggregation. In Proceedings of the 2010 Symposium on EyeTracking Research & Applications (2010), ETRA ’10, pp. 227–234. 6, 14, 16
[GH10c] GOLDBERG J. H., HELFMAN J. I.: Visual scanpathrepresentation. In Proceedings of the 2010 Symposium on EyeTracking Research & Applications (2010), ETRA ’10, pp. 203–210. 6, 7, 8, 9, 10
[GK99] GOLDBERG J. H., KOTVAL X. P.: Computer interfaceevaluation using eye movements: Methods and constructs. Inter-national Journal of Industrial Ergonomics 24 (1999), 631–645. 3,6, 9, 13, 14
[GWG∗64] GUBA E., WOLF W., GROOT S. D., KNEMEYERM., ATTA R. V., LIGHT L.: Eye movement and TV viewing inchildren. AV Communication Review 12, 4 (1964), 386–401. 7
[GWP07] GOLDSTEIN R., WOODS R., PELI E.: Where peoplelook when watching movies: Do all viewers look at the sameplace? Computers in Biology and Medicine 37, 7 (2007), 957–964.8
[HEF∗13] HURTER C., ERSOY O., FABRIKANT S., KLEIN T.,TELEA A.: Bundled visualization of dynamic graph and trail data.IEEE Transactions on Visualization and Computer Graphics PP,99 (2013), 1–1. 5, 6, 9
[HFG06] HEMBROOKE H., FEUSNER M., GAY G.: Averagingscan patterns and what they can tell us. In Proceedings of the 2006Symposium on Eye Tracking Research & Applications (2006),ETRA ’06, p. 41. 5, 6, 9
[Häg82] HÄGERSTRAND T.: Diorama, path and project. Tijd-schrift voor Economische en Sociale Geografie 73, 6 (1982), 323–339. 10
[HH02] HORNOF A. J., HALVERSON T.: Cleaning up systematicerror in eye-tracking data by using required fixation locations. Be-havior Research Method, Instruments, & Computers 34, 4 (2002),592–604. 7
[HHBL03] HOLMQVIST K., HOLSANOVA J., BARTHELSON M.,LUNDQVIST D.: Reading or scanning? A study of newspaperand net paper reading. In The Mind’s Eye, Hyönä J., Radach R.,Deubel H., (Eds.). Elsevier Science BV, 2003, pp. 657–670. 15
[HHWN02] HAVRE S., HETZLER E., WHITNEY P., NOWELLL.: ThemeRiver: Visualizing thematic changes in large documentcollections. IEEE Transactions on Visualization and ComputerGraphics 8, 1 (2002), 9–20. 13
[HNA∗11] HOLMQVIST K., NYSTRÖM M., ANDERSSON R., DE-WHURST R., JARODZKA H., VAN DE WEIJER J.: Eye Tracking:A Comprehensive Guide to Methods and Measures, 1 ed. OxfordUniversity Press, 2011. 1, 2, 3, 8, 9, 12
[Hol01] HOLSANOVA J.: Picture viewing and picture description:Two windows on the mind. PhD thesis, Lund University, 2001. 6,11
[HRO11] HUTCHERSON D., RANDALL R., OUZTS A.: Shelf realestate: Package spacing in a retail environment. 2011. 8
[IHN98] ITOH K., HANSEN J., NIELSEN F.: Cognitive modellingof a ship navigator based on protocol and eye-movement analysis.Le Travail Humain (1998), 99–127. 6, 14
[ITS00] ITOH K., TANAKA H., SEKI M.: Eye-movement analysisof track monitoring patterns of night train operators: Effects ofgeographic knowledge and fatigue. In Proceedings of the HumanFactors and Ergonomics Society Annual Meeting (2000), vol. 44,pp. 360–363. 6, 12
[JC76] JUST M. A., CARPENTER P. A.: Eye fixations and cogni-tive processes. Cognitive Psychology 8 (1976), 441–480. 7
[JK03] JACOB R., KARN K.: Eye tracking in human-computer in-teraction and usability research: Ready to deliver the promises. InThe Mind’s Eye, Hyönä J., Radach R., Deubel H., (Eds.). ElsevierScience BV, 2003, pp. 573–605. 11
[KDX∗12] KIM S.-H., DONG Z., XIAN H., UPATISING B., YIJ. S.: Does an eye tracker tell the truth abou visualizations?findings while investigating visualizations for decision making.IEEE Transactions on Visualization and Computer Graphics 18,12 (2012), 2421–2430. 6, 11
[KHW14] KURZHALS K., HEIMERL F., WEISKOPF D.:ISeeCube: Visual analysis of gaze data for video. In Proceedingsof the 2014 Symposium on Eye Tracking Research & Applications(2014), ETRA’14, pp. 43–50. 6, 12, 13, 14
[Kra03] KRAAK M.-J.: The space-time cube revisited from a geo-visualization perspective. In Proceedings of the 21st InternationalCartographic Conference (2003), pp. 1988–1995. 10
[KW13] KURZHALS K., WEISKOPF D.: Space-time visual analyt-ics of eye-tracking data for dynamic stimuli. IEEE Transactionson Visualization and Computer Graphics 19, 12 (2013), 2129 –2138. 6, 8, 9, 10, 12
[Lan00] LANKFORD C.: Gazetracker: Software designed to facili-tate eye movement analysis. In Proceedings of the 2000 Sympo-sium on Eye Tracking Research & Applications (2000), ETRA’00, pp. 51–55. 6, 9, 16
[Lat88] LATIMER C. R.: Eye-movement data: Cumulative fixationtime and cluster analysis. Behavior Research Method, Instruments,& Computers 20 (1988), 437–470. 6, 8
[LÇK10] LI X., ÇÖLTEKIN A., KRAAK M.-J.: Visual explorationof eye movement data using the space-time-cube. In GeographicInformation Science, Fabrikant S., Reichenbacher T., Kreveld M.,
c© The Eurographics Association 2014.

T. Blascheck, K. Kurzhals, M. Raschke, M. Burch, D. Weiskopf & T. Ertl / State-of-the-Art of Visualization for Eye Tracking Data
Christoph S., (Eds.), LNCS ’10. Springer, 2010, pp. 295–309. 6,10
[LHB∗08] LORIGO L., HARIDASAN M., BRYNJARSDÓTTIR H.,XIA L., JOACHIMS T., GAY G., GRANKA L., PELLACINI F.,PAN B.: Eye tracking and online search: Lessons learned andchallenges ahead. Journal of the American Society for InformationScience and Technology 59, 7 (2008), 1041–1052. 13
[LPP∗06] LEE B., PLAISANT C., PARR C. S., FEKETE J.-D.,HENRY N.: Task taxonomy for graph visualization. In Proceed-ings of the 2006 AVI Workshop on BEyond Time and Errors: NovelEvaluation Methods for Information Visualization (2006), BELIV’06, pp. 1–5. 4
[LPS∗12] LI R., PELZ J., SHI P., OVESDOTTER ALM C., HAAKEA.: Learning eye movement pattens for characterization of per-ceptual expertise. In Proceedings of the 2012 Symposium on EyeTracking Research & Applications (2012), ETRA’12, pp. 393–396.13
[MM58] MACKWORTH J. F., MACKWORTH N. H.: Eye fixationsrecorded on changing visual scenes by the television eye-marker.Journal of the Optical Society of America 48, 7 (1958), 439–444.6, 8
[MSHH11] MITAL P. K., SMITH T. J., HILL R. L., HENDERSONJ. M.: Cluster analysis of gaze during dynamic scene viewing ispredicted by motion. Cognitive Computation 3, 1 (2011), 5–24. 8
[NH10] NAKAYAMA M., HAYASHI Y.: Estimation of viewer’sresponse for contextual understanding of tasks using features ofeye-movements. In Proceedings of the 2010 Symposium on EyeTracking Research & Applications (2010), ETRA ’10, pp. 53–56.7
[NS71a] NOTON D., STARK L.: Scanpaths in eye movementsduring pattern perception. Science 171, 3968 (1971), 308–311. 9
[NS71b] NOTON D., STARK L.: Scanpaths in saccadic eye move-ments while viewing and recognizing patterns. Vision Research11 (1971), 929U942. 6, 9
[PB06] POOLE A., BALL L.: Eye tracking in Human-ComputerInteraction and Usability Research: Current Status and FutureProspects. Idea Group Inc., 2006, ch. E, pp. 211–219. 11
[Pfe12] PFEIFFER T.: Measuring and visualizing attention in spacewith 3d attention volumes. In Proceedings of the 2012 Sympo-sium on Eye Tracking Research & Applications (2012), ETRA’12,pp. 29–36. 6, 8, 10
[PLG06] PELLACINI F., LORIGO L., GAY G.: Visualizing Pathsin Context, 2006. 6, 13
[PS00] PRIVITERA C., STARK L.: Algorithms for defining visualregions-of-interest: Comparison with eye fixations. IEEE Transac-tions on Pattern Analysis and Machine Intelligence 22, 9 (2000),970–982. 1, 11
[PSF∗13a] PALETTA L., SANTNER K., FRITZ G., HOFMANN A.,LODRON G., THALLINGER G., MAYER H.: A computer visionsystem for attention mapping in SLAM based 3d models. CoRR(2013). 8, 10
[PSF∗13b] PALETTA L., SANTNER K., FRITZ G., MAYER H.,SCHRAMMEL J.: 3D attention: Measurement of visual saliency us-ing eye tracking glasses. In CHI ’13 Extended Abstracts on HumanFactors in Computing Systems (2013), CHI EA ’13, pp. 199–204.6, 8
[Pur97] PURCHASE H. C.: Which aesthetic has the greatest effecton human understanding? In Proceedings of Graph Drawing(1997), pp. 248–261. 4
[RAM∗05] RÄIHÄ K.-J., AULA A., MAJARANTA P., RANTALAH., KOIVUNEN K.: Static visualization of temporal eye-tracking
data. In Human-Computer Interaction-INTERACT 2005, Costa-bile M. F., Paternò F., (Eds.), vol. 3585 of LNCS ’05. Springer,2005, pp. 946–949. 6, 11, 12
[RBB14] RASCHKE M., BLASCHECK T., BURCH M.: VisualAnalysis of Eye Tracking Data. Springer New York, 2014, ch. 15,pp. 391–409. 16
[RCE12] RASCHKE M., CHEN X., ERTL T.: Parallel scan-pathvisualization. In Proceedings of the 2012 Symposium on EyeTracking Research & Applications (2012), ETRA’12, pp. 165–168.6, 12
[RD05] RICHARDSON D. C., DALE R.: Looking to understand:The coupling between speakers’ and listeners’ eye movements andits relationship to discourse comprehension. Cognitive Science29, 6 (2005), 1045–1060. 6, 12
[RHB∗14] RASCHKE M., HERR D., BLASCHECK T., BURCH M.,SCHRAUF M., WILLMANN S., ERTL T.: A visual approach forscan path comparison. In Proceedings of the 2014 Symposium onEye Tracking Research & Applications (2014), ETRA’14, pp. 135–142. 12
[RHOL13] RISTOVSKI G., HUNTER M., OLK B., LINSEN L.:EyeC: Coordinated views for interactive visual data explorationof eye-tracking data. Internation Conference on InformationVisualization (2013), 239. 12, 15, 16
[RTSB04] RAMLOLL R., TREPAGNIER C., SEBRECHTS M.,BEEDASY J.: Gaze data visualization tools: Opportunities andchallenges. In Proceedings of the 8th International Conference onInformation Visualization (2004), IV ’04, pp. 173–180. 2, 6, 10
[RVM12] RODRIGUES R., VELOSO A., MEALHA O.: A televi-sion news graphical layout analysis method using eye tracking. InProceedings of the 16th International Conference on Informationvisualization (2012), IV ’12, pp. 357–362. 11
[SD04] SANTELLA A., DECARLO D.: Robust clustering of eyemovement recordings for quantification of visual interest. InProceedings of the 2004 Symposium on Eye Tracking Research &Applications (2004), ETRA ’04, pp. 27–34. 11
[Shn96] SHNEIDERMAN B.: The eyes have it: a task by data typetaxonomy for information visualizations. In IEEE Symposium onVisual Languages (1996), pp. 336–343. 4
[SLHR09] SIIRTOLA H., LAIVO T., HEIMONEN T., RAIHA K.-J.: Visual perception of parallel coordinate visualizations. InProceedings of the 13th International Conference on InformationVisualization (2009), IV ’09, pp. 3–9. 6, 14
[ŠM07] ŠPAKOV O., MINIOTAS D.: Visualization of eye gazedata using heat maps. Electronics and Electrical Engineering 2,74 (2007), 55–58. 8
[SM13] SMITH T. J., MITAL P. K.: Attentional synchrony and theinfluence of viewing task on gaze behavior in static and dynamicscenes. Journal of Vision 13, 8 (2013), 1–24. 7
[SMI14] SMI BeGaze eye tracking analysis software.http://www.smivision.com, 2014. 16
[SND10a] STELLMACH S., NACKE L., DACHSELT R.: 3D atten-tional maps: Aggregated gaze visualizations in three-dimensionalvirtual environments. In Proceedings of the International Confer-ence on Advanced Visual Interfaces (2010), AVI ’10, pp. 345–348.8
[SND10b] STELLMACH S., NACKE L., DACHSELT R.: Advancedgaze visualizations for three-dimensional virtual environments. InProceedings of the 2010 Symposium on Eye Tracking Research &Applications (2010), ETRA ’10, pp. 109–112. 6, 9, 10, 13, 14
[SNDC09] STELLMACH S., NACKE L., DACHSELT R., CRAIGL.: Trends and techniques in visual gaze analysis. CoRR (2009),89–93. 2
c© The Eurographics Association 2014.

T. Blascheck, K. Kurzhals, M. Raschke, M. Burch, D. Weiskopf & T. Ertl / State-of-the-Art of Visualization for Eye Tracking Data
[Špa08] ŠPAKOV O.: iComponent - Device-independent Platformfor Analyzing Eye Movement Data and Developing Eye-BasedApplications. PhD thesis, University of Tampere, 2008. 2
[SPK86] SCINTO L. F., PILLALAMARRI R., KARSH R.: Cogni-tive strategies for visual search. Acta Psychologica 62, 3 (1986),263 – 292. 9
[ŠR08] ŠPAKOV O., RÄIHÄ K.-J.: KiEV: A tool for visualiza-tion of reading and writing processes in translation of text. InProceedings of the 2008 Symposium on Eye Tracking Research &Applications (2008), ETRA ’08, pp. 107–110. 6, 11
[SSF∗11] SCHULZ C. M., SCHNEIDER E., FRITZ L.,VOCKEROTH J., HAPFELMEIER A., BRANDT T., KOCHSE. F., SCHNEIDER G.: Visual attention of anaesthetists duringsimulated critical incidents. British Journal of Anaesthesia 106, 6(2011), 807–813. 6, 14
[TAK∗05] TORY M., ATKINS S., KIRKPATRICK A., NICOLAOUM., YANG G.-Z.: Eyegaze analysis of displays with combined2d and 3d views. In Visualization, 2005. VIS 05. IEEE (2005),pp. 519–526. 14, 15
[TCSC13] TOKER D., CONATI C., STEICHEN B., CARENINIG.: Individual user characteristics and information visualization:Connecting the dots through eye tracking. In Proceedings of theSIGCHI Conference on Human Factors in Computing Systems(2013), CHI ’13, pp. 295–304. 1
[TM04] TORY M., MOLLER T.: Rethinking visualization: A high-level taxonomy. In IEEE Symposium on Information Visualization(2004), InfoVis ’04, pp. 151–158. 4
[Tob08] TOBII TECHNOLOGY AB: Tobii Studio 1.X User Manual,2008. 8
[TTS10] TSANG H. Y., TORY M. K., SWINDELLS C.: eSeeTrack- visualizing sequential fixation patterns. IEEE Transactions onVisualization and Computer Graphics 16, 6 (2010), 953–962. 6,12, 15, 16
[VH96] VELICHKOVSKY B. M., HANSEN J. P.: New techno-logical windows into mind: There is more in eyes and brains forhuman-computer interaction. In Proceedings of the SIGCHI Con-ference on Human Factors in Computing Systems (1996), CHI’96, pp. 496–503. 6, 8
[WFE∗12] WEIBEL N., FOUSE A., EMMENEGGER C., KIMMICHS., HUTCHINS E.: Let’s look at the cockpit: Exploring mobileeye-tracking for observational research on the flight deck. InProceedings of the 2012 Symposium on Eye Tracking Research &Applications (2012), ETRA’12, pp. 107–114. 6, 10, 12
[WHRK06] WEST J. M., HAAKE A. R., ROZANSKI E. P., KARNK. S.: eyePatterns: software for identifying patterns and simi-larities across fixation sequences. In Proceedings of the 2006Symposium on Eye Tracking Research & Applications (2006),ETRA ’06, pp. 149–154. 6, 15, 16
[Woo02] WOODING D. S.: Fixation maps: quantifying eye-movement traces. In Proceedings of the 2002 Symposium on EyeTracking Research & Applications (2002), ETRA ’02, pp. 31–36.6, 8
[YaKSJ07] YI J. S., AH KANG Y., STASKO J., JACKO J.: Towarda deeper understanding of the role of interaction in informationvisualization. IEEE Transactions on Visualization and ComputerGraphics 13, 6 (2007), 1224–1231. 4
[Yar67] YARBUS A. L.: Eye Movements and Vision. Plenum Press,1967. 6, 9
Biography
Blascheck Tanja graduated in Computer Science (Diplom-Informatiker) at the University of Stuttgart, Germany in 2012.As a research assistant she is working at the Institute for Vi-sualization and Interactive Systems (VSI) at the University ofStuttgart. Her main research interests are eye tracking, visu-alization, visual analytics, and digital humanities. A specificfocus of her research is on developing new methods to ana-lyze eye movement data from interactive stimuli.
Kurzhals Kuno graduated in Computer Science (Diplom-Informatiker) at the University of Stuttgart, Germany in 2012.As a research assistant he is working at the VisualizationResearch Center (VISUS) at the University of Stuttgart.His main research interests are eye tracking, visualization,visual analytics, and computer vision. A specific focus ofhis research is on developing new visualization methods toanalyze eye movement data from dynamic stimuli.
Raschke Michael graduated in Physics (Diplom-Physiker) atthe Ruprecht-Karls-University Heidelberg, Germany in 2009.As a research assistant he is working at the Institute forVisualization and Interactive Systems (VIS) at the Universityof Stuttgart. His main research interests are human centricvisualization, cognition simulations, human-computer in-teraction, and philosophical questions of visualization andcognition.
Burch Michael is a postdoctoral researcher the Visualiza-tion Research Center (VISUS) at the University of Stuttgart,Germany. He received his Dr. rer. nat. (PhD) degree in com-puter science from the University of Trier in 2010. His mainresearch interests are in information visualization, in particu-lar, visualizing dynamic directed and weighted graphs withan additional hierarchical organization of the nodes in a staticdiagram. Other areas of expertise are the large-scale visual-ization of hierarchical data, eye-tracking evaluation of infor-mation visualization techniques, and the visualization of eye-tracking data.
Weiskopf Daniel is a full professor at the VisualizationResearch Center (VISUS) at the University of Stuttgart,Germany. He received his Dr. rer. nat. (PhD) degree inphysics from the University of Tübingen, and the Habilita-tion degree in computer science at the University of Stuttgart.His research interests include all areas of visualization, visualanalytics, GPU methods, perception-oriented computergraphics, and special and general relativity.
Ertl Thomas is a full professor at the University of Stuttgart,Germany and the head of the Institute for Visualization andInteractive Systems (VIS) and the Visualization ResearchCenter (VISUS). He received a MS in computer sciencefrom the University of Colorado at Boulder and a Dr. rer. nat.(PhD) degree in physics at the University of Tübingen. Hisresearch interests include visualization, computer graphics,and human-computer interaction.
c© The Eurographics Association 2014.