programme area: offshore wind project: floating system ... · draft standard for design of floating...
TRANSCRIPT

Title:
Disclaimer:
This document was prepared for the ETI by third parties under contract to the ETI. The ETI is making these documents and data available to the public to inform the debate on low carbon energy innovation and deployment.
The Energy Technologies Institute is making this document available to use under the Energy Technologies Institute Open Licence for Materials. Please refer to the Energy Technologies Institute website for the terms and conditions of this licence. The Information is licensed ‘as is’ and the Energy Technologies Institute excludes all representations, warranties, obligations and liabilities in relation to the Information to the maximum extent permitted by law. The Energy Technologies Institute is not liable for any errors or omissions in the Information and shall not be liable for any loss, injury or damage of any kind caused by its use. This exclusion of liability includes, but is not limited to, any direct, indirect, special, incidental, consequential, punitive, or exemplary damages in each case such as loss of revenue, data, anticipated profits, and lost business. The Energy Technologies Institute does not guarantee the continued supply of the Information. Notwithstanding any statement to the contrary contained on the face of this document, the Energy Technologies Institute confirms that the authors of the document have consented to its publication by the Energy Technologies Institute.
Studies carried out by the Energy Technologies Institute (ETI) and by the European Wind Energy Association have shown that floating offshore wind, close to shore and in water depths of between 60 to 100m, could significantly reduce the cost of offshore wind energy. Further analysis by ETI indicated that the tension-leg platform (TLP) floating concept has the best potential for reducing cost, and they commissioned the Offshore Wind Floating Platform Demonstration Project FEED Study to better understand and determine the levelised cost of energy (LCOE) associated with the TLP concept, particularly as applied in United Kingdom waters. The selected design was the PelaStar TLP developed by Glosten, Inc., of Seattle, Washington, USA. PelaStar is a deep-water, floating foundation structure system for offshore wind turbines. This report presents a comprehensive analysis of the levelised cost of energy for PelaStar in United Kingdom (UK) waters.The results presented in this report show that the PelaStar TLP, supporting a 6 MW offshore wind turbine generator, can achieve an LCOE of £106/MWh in average UK conditions, and a LCOE as low as £97/MWh at sites with superior wind conditions.
Context:This project draws upon earlier ETI studies. These showed that floating foundations could be very attractive, by allowing the UK to access higher wind sites that are reasonably close to shore. Our analysis suggests that floating offshore wind has the medium to long term potential to deliver attractive energy costs. The Glosten Associates, a US-based navel architecture and marine engineering firm have designed a tension leg platform (TLP) floating system demonstrator through a Front End Engineering Design (FEED) Study.
Programme Area: Offshore Wind
Project: Floating System Feed Study GL
PelaStar Cost of Energy: A cost study of the PelaStar floating foundation system in UK waters
Abstract:

For Public Distribution
1201 Western Avenue, Suite 200, Seattle, Washington 98101-2953 TEL 206.624.7850 www.glosten.com
Offshore Wind Floating Platform Demonstration Project FEED Study
PelaStar Cost of Energy: A cost study of the PelaStar floating foundation system in UK waters
Prepared for:
File No. 12004.01 Rev 01 – 21 Jan 2014
Prepared by:
William L. Hurley, Jr., PE Charles J. Nordstrom, PE

ETI Floating Platform FEED Study Glosten Rev 01 i 21 January 2015
Contents References ...................................................................................................................iii Acknowledgements .....................................................................................................iv Executive Summary ..................................................................................................... v 1. Capital Cost Analysis Methodology ................................................................... 1
1.1 Overview ...................................................................................................................... 1 1.2 Matrix of Analysis Cases .............................................................................................. 1 1.3 Site Condition Parameters ............................................................................................ 1
1.3.1 Baseline Case ........................................................................................................ 2 1.3.2 Wind Speed ........................................................................................................... 3 1.3.3 Water Depth .......................................................................................................... 3 1.3.4 Wave Height and Period ....................................................................................... 4 1.3.5 Water Level ........................................................................................................... 5 1.3.6 Current ................................................................................................................... 5 1.3.7 Distance to Port ..................................................................................................... 5 1.3.8 Seabed ................................................................................................................... 6 1.3.9 Sensitivity to Larger Turbines ............................................................................... 6 1.3.10 Full Matrix of Analysis Cases ............................................................................... 7 1.3.11 Concept Design Methodology and the PelaStar Optimizer .................................. 8
2. Concept Designs for UK Conditions .................................................................. 9 2.1 Baseline Design ............................................................................................................ 9 2.2 Design for Wave Hub Demonstration Site ................................................................. 10 2.3 Platform Design Differences with Variations in Design Parameters ......................... 11
2.3.1 Variation in Seabed Type .................................................................................... 11 2.3.2 Variation in Wind Speed ..................................................................................... 11 2.3.3 Variation in Water Depth .................................................................................... 12 2.3.4 Variation in Wave Height ................................................................................... 13 2.3.5 Variation in Tide Range ...................................................................................... 13 2.3.6 Variation in Distance to Port ............................................................................... 14 2.3.7 Combination Cases .............................................................................................. 14 2.3.8 Harsh Wave Environments .................................................................................. 15
2.4 Platform Design for a 10 MW Turbine ...................................................................... 15 3. Parametric CAPEX Analysis .............................................................................16
3.1 Methodology and General Assumptions .................................................................... 16

ETI Floating Platform FEED Study Glosten Rev 01 ii 21 January 2015
3.2 Scope, Assumptions, and Basis of Estimate ............................................................... 17 3.3 Findings ...................................................................................................................... 25
3.3.1 CAPEX for Baseline Design ............................................................................... 25 3.3.2 CAPEX Estimates for Complete Matrix of Cases .............................................. 26 3.3.3 Hull CAPEX Primary Drivers ............................................................................. 28 3.3.4 Anchor and Tendon CAPEX Drivers .................................................................. 28 3.3.5 Installation CAPEX Drivers ................................................................................ 28 3.3.6 Turbine CAPEX Drivers ..................................................................................... 28 3.3.7 Balance of System CAPEX Drivers .................................................................... 28
4. Projected Future Capital Costs .........................................................................29 4.1 Learning Rates ............................................................................................................ 29 4.2 Technology Deployment Rates .................................................................................. 30 4.3 Future Technologies: The 10MW Turbine ................................................................ 30 4.4 CAPEX Forecast for 2020 through 2050 ................................................................... 31
5. Cost-of-Energy Calculation Methodology .......................................................33 5.1 Levelised Cost of Energy Model ................................................................................ 33 5.2 Operations and Maintenance Cost .............................................................................. 34
5.2.1 Bottom Lease ....................................................................................................... 34 5.2.2 Plant Operations .................................................................................................. 35 5.2.3 Scheduled and Un-Scheduled Turbine Maintenance .......................................... 35 5.2.4 Equipment and Foundations Maintenance .......................................................... 35 5.2.5 Transmission Fee ................................................................................................. 35 5.2.6 Operation and Maintenance Cost Summary per Turbine .................................... 35
5.3 Annual Energy Production ......................................................................................... 36 5.4 Cost of Financing ........................................................................................................ 36
6. Levelised Cost of Energy Analysis ..................................................................38 6.1 LCOE for Baseline Case ............................................................................................. 38 6.2 LCOE for Matrix of Analysis Cases ........................................................................... 38
6.2.1 Impact on LCOE from Changes in Seabed Type ................................................ 40 6.2.2 Impact on LCOE from Changes in Wind Speed ................................................. 40 6.2.3 Impact on LCOE from Changes in Water Depth ................................................ 40 6.2.4 Impact on LCOE from Changes in Wave Height ............................................... 41 6.2.5 Impact on LCOE from Changes in Tide Range .................................................. 41 6.2.6 Impact on LCOE from Changes in Distance from Port ...................................... 41 6.2.7 Impact on LCOE from Changes in Multiple Parameters .................................... 41

ETI Floating Platform FEED Study Glosten Rev 01 iii 21 January 2015
6.2.8 Harsh Wave Environments .................................................................................. 42 6.3 LCOE for 10 MW Turbine ......................................................................................... 42
7. Sensitivity Analysis ............................................................................................43 7.1 Methodology for Sensitivity Analysis ........................................................................ 43 7.2 Findings from Sensitivity Analysis ............................................................................ 48
7.2.1 Key Drivers for Model Sensitivity ...................................................................... 48 7.2.2 Sensitivity to Combined Factors ......................................................................... 51
8. Forecast of LCOE in 2020 to 2050 ....................................................................51 8.1 LCOE Forecast Methodology ..................................................................................... 51 8.2 LCOE Forecast Results .............................................................................................. 52
References 1. Assessment of Wave and Current Resources at the Wave Hub Site, University of Exeter
and Marine Energy Matters, January 2011. 2. Draft OWA Offshore Wind Foundations, UK Round 3, Design Basis, The Carbon Trust,
Revision 2, November 2009. 3. Draft Standard for Design of Floating Wind Turbine Structures, Det Norske Veritas,
12 February 2013. 4. Guide for Buckling and Ultimate Strength Assessment, The American Bureau of
Shipping, 2004. 5. Innovative Offshore Wind Plant Design, Revision A, The Glosten Associates, 15 April
2013. 6. Journée, J and Massie, W., Offshore Hydromechanics, January 2001. 7. Lantz, Eric, et al, IEA Wind Task 26: The Past and Future Cost of Wind Energy, Work
Package 2, International Energy Agency, May 2012. 8. Offshore Wind Cost Reduction Pathways Study, The Crown Estate, May 2012. 9. Offshore Wind Cost Reduction Pathways: Finance Work Stream, Price Waterhouse
Coopers, April 2012. 10. Offshore Wind Cost Reduction Pathways: Technology Work Stream, BVG Associates,
June 2012. 11. Primer: The DOE Wind Energy Program’s Approach to Calculating the Cost of Energy,
National Renewable Energy Laboratory, Report SR-500-37653, January 2008. 12. Principles of Naval Architecture, Society of Naval Architects and Marine Engineers,
Volume 3, 1989. 13. Recommended Practice DNV RP-C203: Fatigue Design of Offshore Steel Structures, Det
Norske Veritas, October 2012. 14. Recommended Practice DNV-RP-C205: Environmental Conditions and Environmental
Loads, Det Norske Veritas, October 2010. 15. Rules for Building and Classing Floating Production Installations, The American
Bureau of Shipping, 2013.
ETI Floating Platform FEED Study Glosten Rev 01 iv 21 January 2015
16. Stewart, G., et al., Calibration and Validation of a FAST Floating Wind Turbine Model of the DeepCwind Scaled Tension-Leg Platform, International Offshore and Polar Engineering Conference, June 2012.
17. SW Wave Hub – Metocean Design Basis, METOC, Report No. 2056 Rev 1, 29 April 2009.
18. Turbine Capacity Factor Analysis, The Glosten Associates, ETI FEED Study, Report 02-13 (Proprietary Information)
19. Wind Levelized Cost of Energy: A Comparison of Technical and Financing Input Variables, United States Department of Energy National Renewable Energy Laboratory, October 2009.
Acknowledgements Glosten acknowledges the Energy Technologies Institute for funding, supporting and directing the Floating Platform FEED Study, and for their commitment to investing in the demonstration of promising technologies to help the UK achieve its 2050 carbon reduction targets. The leadership from Andrew Scott, the ETI Programme Manager, was particularly instrumental to the success of this project. We also wish to acknowledge the supporting data provided by BVG Associates, as well as the constructive interaction and input from BVG.

ETI Floating Platform FEED Study Glosten Rev 01 v 21 January 2015
Executive Summary
Studies carried out by the Energy Technologies Institute (ETI) and by the European Wind Energy Association have shown that floating offshore wind, close to shore and in water depths of between 60 to 100m, could significantly reduce the cost of offshore wind energy. Further analysis by ETI indicated that the tension-leg platform (TLP) floating concept has the best potential for reducing cost, and they commissioned the Offshore Wind Floating Platform Demonstration Project FEED Study to better understand and determine the levelised cost of energy (LCOE) associated with the TLP concept, particularly as applied in United Kingdom waters. The selected design was the PelaStar TLP developed by Glosten, Inc., of Seattle, Washington, USA. PelaStar is a deep-water, floating foundation structure system for offshore wind turbines. This report presents a comprehensive analysis of the levelised cost of energy for PelaStar in United Kingdom (UK) waters. The results presented in this report show that the PelaStar TLP, supporting a 6 MW offshore wind turbine generator, can achieve an LCOE of £106/MWh in average UK conditions, and a LCOE as low as £97/MWh at sites with superior wind conditions. These figures are in 2013 constant currency and assume a 10.0% discount rate. The costs also assume the installation of a 500 MW wind plant consisting of 83 – 6 MW turbines with a final investment decision in year 2020. It is shown that this technology has strong potential for radical decreases in LCOE looking to 2025 and beyond, with £85/MWh a conservative forecast for 2025.
Capital Cost (CAPEX) Part 1 of this report presents capital cost (CAPEX) data and calculations for the PelaStar system. A matrix of analysis cases was developed in consultation with ETI to isolate and capture the effects of parameters that includes water depth, wave conditions, wind speed, tidal range, seabed conditions, and distance from port and grid connection. For each analysis case, a cost-optimized PelaStar concept design was developed and the CAPEX was calculated. CAPEX for the PelaStar tension-leg platform has been calculated for the full range of conditions encountered in commercially exploitable United Kingdom (UK) waters with depths greater than 40 meters. Site conditions were systematically varied to determine cost drivers for the system. The results of this Part 1 are used as inputs to the LCOE analysis in Part 2. The PelaStar CAPEX includes: hull fabrication and delivery to UK staging port; a tendon and anchor system; and the installation of floating turbine, tendons, and anchors. The total system CAPEX further includes the turbine and the balance of system (such as cabling, grid interconnection, permitting, etc.). The total system CAPEX range is remarkably consistent across the range of conditions expected in commercially exploitable UK waters, varying by only 10% of the CAPEX for average site conditions. In absolute terms, the total system CAPEX varies from £2529/kW to £2798/kW. For average site conditions, the total system CAPEX is £2536/kW. A forecast of CAPEX from 2020 to 2050 was performed to quantify the impacts of expected learning rates and future technologies. The forecast shows that in real (constant) currency, the wind farm CAPEX is expected to drop by 25% from 2020 to 2030 and by nearly 50% from 2020 to 2050.

ETI Floating Platform FEED Study Glosten Rev 01 vi 21 January 2015
The application and future development of the PelaStar technologies in the design are a primary reason for the large reduction in CAPEX in future years. The new technologies are at the very beginning of their learning and experience curves. The primary cost drivers are extreme wave height (i.e., significant wave height with a 50-year return period), water depth, and combinations of the two. Wind speed is a secondary and much weaker cost driver. Contours of PelaStar total system CAPEX are shown in Figure 1. They were generated to show the relationship between water depth, extreme wave height, and CAPEX. Using the Optimizer software, cost-optimized designs were developed for approximately 200 combinations of water depth and extreme wave height, representing the range of commercially exploitable UK waters. The baseline (average) conditions are water depth of 75 m and extreme wave height of 8.2 m. The Wave Hub demonstration site parameters are also noted (water depth of 57 m, extreme wave height of 10.3 m). Key findings from Part 1 are:
1. PelaStar is broadly applicable to commercially exploitable UK waters at a CAPEX that is both attractive and consistent across the range of site conditions.
2. The ideal water depth, based on CAPEX, is very close to the average water depth for commercially exploitable UK waters.
3. Water depth and wave height are the primary cost drivers for PelaStar, with other site parameters exhibiting a relatively minor influence on the total system cost.
4. PelaStar cost increases for site conditions with relatively shallow water combined with high wave heights.
Figure 1 Contours of PelaStar CAPEX for average conditions in commercially exploitable UK waters
(Note: Extreme wave height is significant wave height in a 3 hour 50-year return period storm)
Levelised Cost of Energy (LCOE) Part 2 of this report presents a detailed Levelised Cost of Energy analysis. Detailed sensitivity analysis was performed on to quantify the impact on LCOE from technology factors and externalities. The analysis shows that technology factors account for a sensitivity range of -5% to +7%, whereas externalities account for a sensitivity range of -26% to +24%. The LCOE
Average water depth and wave height
Wave Hub water depth and wave height

ETI Floating Platform FEED Study Glosten Rev 01 vii 21 January 2015
model is most sensitive to financial market factors with large uncertainty ranges, namely currency exchange rates and cost of capital. LCOE was forecast from 2020 to 2050, accounting for expected learning curves, introduction of larger turbines, and increasing uncertainty in externalities over time. Using constant 2013 currency, the LCOE from PelaStar floating wind plants is forecast to drop to £64/MWh by 2030 (28% reduction) and to £51/MWh by 2050 (52% reduction). The application and future development of the new technologies in the PelaStar TLP design are a primary reason for the large reduction in LCOE in future years. The new technologies are at the very beginning of their learning and experience curves. Implementation of Advanced Industrialization (AI) processes could lead to even greater LCOE reductions. The comprehensive nature of this analysis supports the following important conclusions about the PelaStar system:
x A LCOE in 2020 in the range of £100/MWh to £110/MWh can be achieved across most of site conditions encountered in commercially exploitable UK waters.
x Cost-effective access to high-wind-speed sites is enabled, thereby driving down the levelised cost of energy below £100/MWh at these sites.
x High-wind-speed sites yield the lowest LCOE, even after the increased capital expenditure (CAPEX) associated with accessing such sites is considered.
x The LCOE shows little variation across the range of conditions encountered in commercially exploitable UK waters.
x This LCOE is forecast to drop by over half by 2050 in today’s currency, due to expected learning curves and economies of scale achieved in the PelaStar system when paired with larger (10 MW) wind turbines.
The following figure shows the PelaStar LCOE forecast from 2020 through 2050.
Figure 2 PelaStar LCOE forecast

PelaStar Cost of Energy - Part 1: CAPEX
ETI Floating Platform FEED Study Glosten Rev 01 1 21 January 2015
1. Capital Cost Analysis Methodology
1.1 Overview The purpose of this analysis is to gain a thorough understanding of the PelaStar system capital cost (CAPEX) across the range of conditions encountered in deeper UK waters with commercial potential. The areas considered “commercially exploitable,” or areas of interest for this study, are those within 150 km of current grid connection nodes and in water depths greater than 40 m. The CAPEX estimates developed in this analysis also become one of the important inputs to the levelised cost of energy (LCOE) analysis in Part 2 of this report. A set of parametric analysis cases was developed, in coordination with ETI, representing the range of conditions encountered in the UK waters of interest. A Baseline Case was established, and site parameters varied from the baseline so that the sensitivity of CAPEX to each parameter and the upper and lower-bound costs could be understood. For each analysis case, an optimized PelaStar concept design is developed and the CAPEX is calculated. CAPEX trends are analyzed across the full set of cases to develop cost functions. This analysis results in a baseline PelaStar concept design, 21 additional PelaStar concept designs, a CAPEX estimate for each design, and cost functions derived from the full set of analysis cases.
1.2 Matrix of Analysis Cases The matrix of analysis cases represents the range of offshore conditions found in UK waters thought to be commercially exploitable for floating wind turbine systems, where water depths are greater than 40 m and within 150 km of an onshore grid connection point. A baseline case is established, which is considered to be a representative mean of UK conditions. A set of key parameters is determined, representing cost-driving variations in conditions from the baseline and from one site to another. For each parameter, a range of values is determined to capture the upper bound, lower bound, and points between. Most parameters are extreme climatological conditions, such as wave heights and wind speeds with a once-in-fifty-years probability of occurrence. These extreme conditions often drive the design of floating systems. The following sub-sections describe the site parameters to be studied, the baseline case, and the range of values for each parameter. Table 8 lists the full matrix of cases.
1.3 Site Condition Parameters The complete set of site parameters is defined in Table 1. All of the analysis cases assume a 500 MW wind plant consisting of 83 – 6 MW turbines.
PelaStar Cost of Energy - Part 1: CAPEX
ETI Floating Platform FEED Study Glosten Rev 01 2 21 January 2015
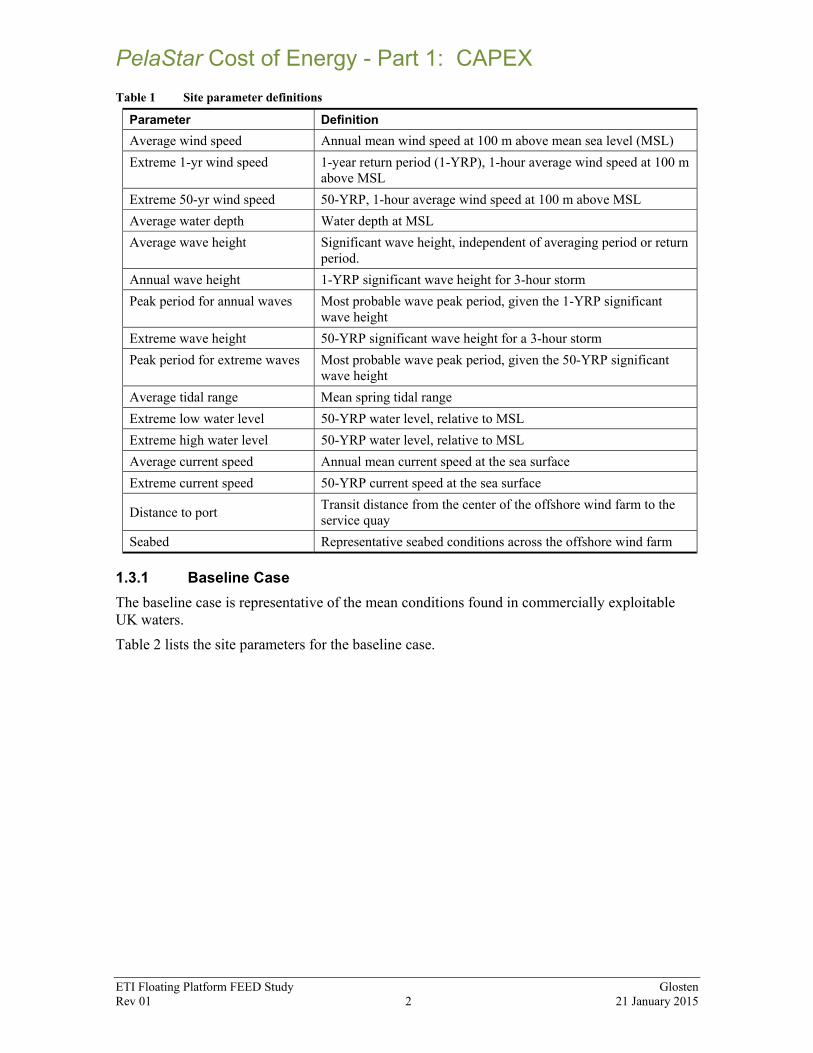
Table 1 Site parameter definitions
Parameter Definition Average wind speed Annual mean wind speed at 100 m above mean sea level (MSL) Extreme 1-yr wind speed 1-year return period (1-YRP), 1-hour average wind speed at 100 m
above MSL Extreme 50-yr wind speed 50-YRP, 1-hour average wind speed at 100 m above MSL Average water depth Water depth at MSL Average wave height Significant wave height, independent of averaging period or return
period. Annual wave height 1-YRP significant wave height for 3-hour storm Peak period for annual waves Most probable wave peak period, given the 1-YRP significant
wave height Extreme wave height 50-YRP significant wave height for a 3-hour storm Peak period for extreme waves Most probable wave peak period, given the 50-YRP significant
wave height Average tidal range Mean spring tidal range Extreme low water level 50-YRP water level, relative to MSL Extreme high water level 50-YRP water level, relative to MSL Average current speed Annual mean current speed at the sea surface Extreme current speed 50-YRP current speed at the sea surface
Distance to port Transit distance from the center of the offshore wind farm to the service quay
Seabed Representative seabed conditions across the offshore wind farm
1.3.1 Baseline Case The baseline case is representative of the mean conditions found in commercially exploitable UK waters. Table 2 lists the site parameters for the baseline case.

PelaStar Cost of Energy - Part 1: CAPEX
ETI Floating Platform FEED Study Glosten Rev 01 3 21 January 2015
Table 2 Site parameters for baseline case
Parameter Units Value Average wind speed m/s 9.7 Annual wind speed m/s 30.5 Extreme wind speed m/s 46.0 Average water depth m 75.0 Average wave height m 1.9 Annual wave height m 6.6
Peak period for annual waves sec 11.0 Extreme wave height m 8.2
Peak period for extreme waves sec 12.0 Average tidal range m 3.5 Extreme low water level m -1.8 Extreme high water level m +3.0 Average current speed m/s 0.7 Extreme current speed m/s 1.12 Distance to port km 70 Seabed n/a sand
1.3.2 Wind Speed Mean wind speed at a site is used for modeling power output, a critical element of LCOE (levelised cost of energy) analysis. Annual extreme wind speed is used in ALS (accidental limit state) analysis, which can be a driver for some system characteristics, such as robustness against slack tendons. Extreme wind speed is used in ULS (ultimate limit state) analysis, which drives many aspects of the floating turbine system, such as structural strength and anchor loads. Reference 3 (DNV standard) specifies the 50-YRP as the extreme wind speed statistic for ULS analysis. Reference 2 provides extreme wind speeds for the nine UK Round 3 development zones. The 50-YRP, 1-hour average wind speed at 100 m above mean sea level ranges from 44.0 to 48.5 m/s. Table 3 lists the combinations of wind speeds considered in the present analysis. Table 3 Selected wind speed parameters
Parameter Units Case Number
2
(baseline) 5
6
Average wind speed m/s 9.7 10.5 11.4 Annual wind speed m/s 30.5 33.0 35.5 Extreme wind speed m/s 46.0 47.0 48.5
1.3.3 Water Depth Water depth has two primary impacts on the floating turbine system CAPEX: 1) the amount of material required for the mooring lines; and 2) the system dynamic response to environmental loads. For a tension-leg platform with constant displacement, changing the water depth changes

PelaStar Cost of Energy - Part 1: CAPEX
ETI Floating Platform FEED Study Glosten Rev 01 4 21 January 2015
the system surge natural frequency. This can either increase or decrease the loads in the mooring system and structure, depending on whether the change in water depth moves the system surge natural frequency closer to or further from excitation frequencies, especially dominant wave frequencies. These changes in loads print through as changes in cost. A water depth range of 40 m to 130 m at mean sea level is considered in this analysis. These are the water depths thought to be commercially exploitable for floating turbine systems in UK waters. The average water depth for commercially exploitable UK waters is approximately 75 m, which is the baseline water depth for this study. The complete list of water depths studied herein is: 57 m, 75 m, 100 m, and 130 m at mean sea level.
1.3.4 Wave Height and Period Wave conditions are one of the most important site characteristics affecting the cost of floating wind turbine systems. Sites with severe wave conditions, characterized by large extreme wave heights, generally have a higher system cost than sites with more benign wave conditions; these are due to the larger wave-induced loads that must be resisted by the floating system structure and mooring system. The wave periods at a site are also important to understand, so that systems can be designed to avoid resonance with wave excitation. While wave period alone may not be a cost driver, it must be defined to completely characterize the wave environment. In addition to the design and cost of the hull structure, wave height will also impact the offshore operational costs associated with CAPEX, such as the installation of anchors and platforms. Annual extreme wave height is used in ALS analysis. Extreme wave height is used in ULS analysis. Reference 3 specifies the 50-YRP significant wave period for a 3-hour storm as the extreme wave height statistic for ULS analysis. Reference 2 states the extreme wave height for all nine UK Round 3 development zones. The most benign sites are Hastings (southern England), Norfolk (eastern England), and the Irish Sea, with extreme wave heights of 7.0 m, 7.5 m, and 7.5 m, respectively. The most severe sites are Bristol Channel and Moray Firth (northeastern Scotland), each with extreme wave height of 12.0 m. The Wave Hub site has an extreme wave height of 10.3 m. The baseline extreme wave height for this study is 8.2 m, representing the average for commercially exploitable UK waters. Two additional extreme wave heights, 14 meters and 16 meters, are included for sensitivity analysis. Wave peak periods are determined by holding the wave slope, ratio of significant wave height to deep water wave length, constant with the wave slope from Case 13 (12 m extreme wave height). Wave height sensitivity cases are included as Cases 23 and 24. Table 4 lists the combinations of wave conditions considered in the present analysis. Table 4 Wave parameters
Parameter Units Case Number
11 2
(Baseline) 12 13 23 24 Average wave height m 1.0 1.9 2.5 2.8 2.9 3.0 Annual wave height m 4.9 6.6 7.2 8.9 9.0 10.0
Peak period for annual waves sec 8.0 11.0 12.0 14.0 14.0 15.0
Extreme wave height m 7.0 8.2 10.3 12.0 14.0 16.0 Peak period for extreme waves sec 8.0 12.0 14.0 16.0 17.3 18.4

PelaStar Cost of Energy - Part 1: CAPEX
ETI Floating Platform FEED Study Glosten Rev 01 5 21 January 2015
1.3.5 Water Level Water level, for this study, refers to the relative change in water level from mean sea level caused by tides and storm surge. To accommodate larger water level ranges, the tower is lengthened, which in turn can increase the structure cost. Changes in water level also have a minor impact on the system pretension, which can affect mooring system cost and hull structure cost. For consistency with wind and wave parameters, water levels should ideally be based on the annual extreme and the 50-YRP extreme. However, these data are not readily available, so a proxy for these statistical values is developed. Reference 2 provides 50-YRP water level statistics for the Wave Hub site. The 50-YRP high water level is 4.1 m above mean sea level (MSL). The 50-YRP low water level is 4.0 m below MSL. Table 5 lists the combinations of water levels considered in the present analysis. Table 5 Water level parameters
Parameter Units Case Number
14 2
(Baseline) 15 Average tidal range m 2.0 3.5 8.0 Extreme low water level m -1.25 -1.50 -4.50 Extreme high water level m +2.18 +3.00 +5.25
1.3.6 Current Current imparts drag loads on the floating platform and mooring system, which must be accounted for in the system design. As with other climatological conditions, the 1-YRP and 50-YRP current speed profiles would ideally be used in the present analysis. However, these data are not available, so proxy values are developed based on UK Round 3 conditions. Current has an impact on the platform design but a negligible impact on the system CAPEX. The presence of current tends to add tension to the tendons, making the system more robust against a slack line occurrence and, in turn, allowing a slightly lighter weight hull. However, current also increases the loads in the tendons and anchors, which increases the required tendon and anchor strength capacity. The net result is that the design condition for any site is the zero current condition. All sites experience the zero current condition; hence current is not a relevant cost parameter, and current is held constant throughout the matrix of cases. Currents, however, are included in the OrcaFlex design validation analyses. The average current speed is 0.70 m/s, and the extreme current speed is 1.12 m/s. All values are surface current speed. The current velocity profile, with depth, is developed according to DNV-recommended practice (Reference 14).
1.3.7 Distance to Port Distance to port is a variable site parameter in order to capture the platform installation cost implications. Export cable cost is also a function of distance to port; however, the export cable is not included in the platform CAPEX. The more significant impact is on Operations and Maintenance (O&M) costs, which is addressed in Part 2, the LCOE Analysis.
PelaStar Cost of Energy - Part 1: CAPEX
ETI Floating Platform FEED Study Glosten Rev 01 6 21 January 2015
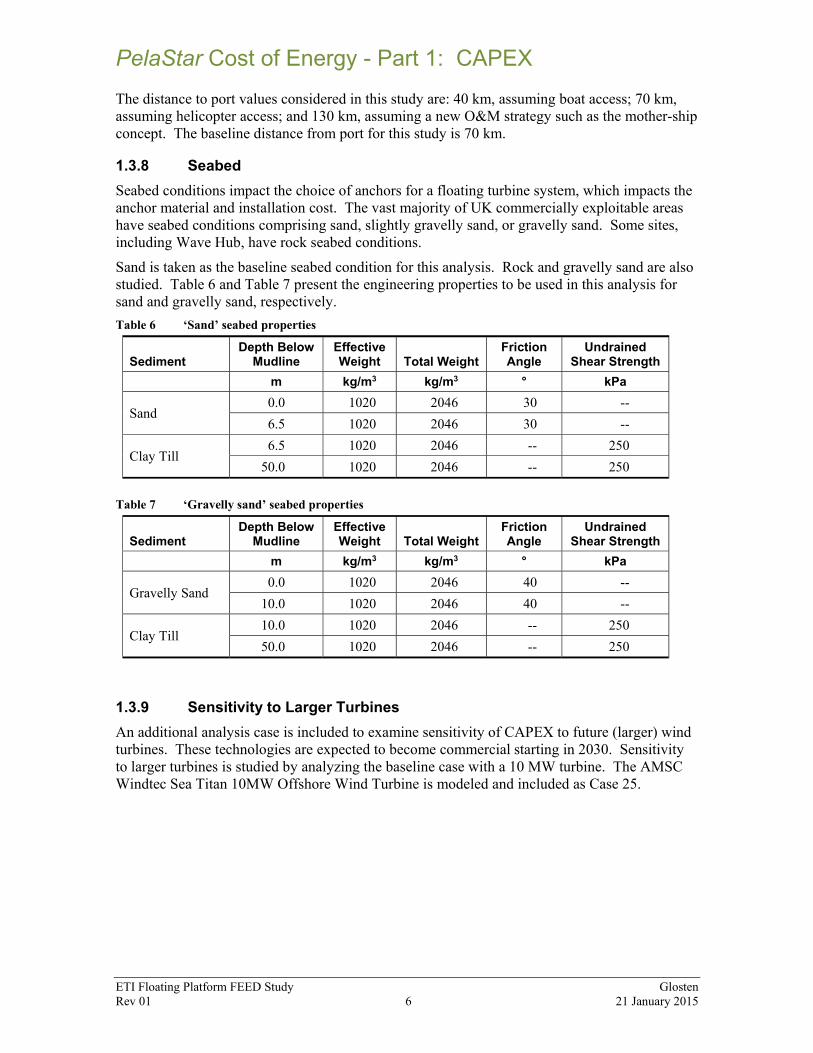
The distance to port values considered in this study are: 40 km, assuming boat access; 70 km, assuming helicopter access; and 130 km, assuming a new O&M strategy such as the mother-ship concept. The baseline distance from port for this study is 70 km.
1.3.8 Seabed Seabed conditions impact the choice of anchors for a floating turbine system, which impacts the anchor material and installation cost. The vast majority of UK commercially exploitable areas have seabed conditions comprising sand, slightly gravelly sand, or gravelly sand. Some sites, including Wave Hub, have rock seabed conditions. Sand is taken as the baseline seabed condition for this analysis. Rock and gravelly sand are also studied. Table 6 and Table 7 present the engineering properties to be used in this analysis for sand and gravelly sand, respectively. Table 6 ‘Sand’ seabed properties
Sediment Depth Below
Mudline Effective Weight Total Weight
Friction Angle
Undrained Shear Strength
m kg/m3 kg/m3 ° kPa
Sand 0.0 1020 2046 30 -- 6.5 1020 2046 30 --
Clay Till 6.5 1020 2046 -- 250
50.0 1020 2046 -- 250 Table 7 ‘Gravelly sand’ seabed properties
Sediment Depth Below
Mudline Effective Weight Total Weight
Friction Angle
Undrained Shear Strength
m kg/m3 kg/m3 ° kPa
Gravelly Sand 0.0 1020 2046 40 --
10.0 1020 2046 40 --
Clay Till 10.0 1020 2046 -- 250 50.0 1020 2046 -- 250
1.3.9 Sensitivity to Larger Turbines An additional analysis case is included to examine sensitivity of CAPEX to future (larger) wind turbines. These technologies are expected to become commercial starting in 2030. Sensitivity to larger turbines is studied by analyzing the baseline case with a 10 MW turbine. The AMSC Windtec Sea Titan 10MW Offshore Wind Turbine is modeled and included as Case 25.

PelaStar Cost of Energy - Part 1: CAPEX
ETI Floating Platform FEED Study Glosten Rev 01 7 21 January 2014
1.3.10 Full Matrix of Analysis Cases The parameters described in the preceding section are systematically varied to develop the full matrix cases, shown in Table 8. Table 8 Full matrix of parametric analysis cases
Variable: Wave Hub BASELINECase: 1 2 3 4 5 6 7 8 9 10 11 12 13 14 15 16 17 18 19 20 21 22 23 24 25
Wav
e Hu
b (E
TI D
emon
stra
tor)
[Not
e 5]
BASE
LINE
Se
e No
te [1
]
Rock
Gra
velly
San
d
High
er W
ind
Spee
d
High
est W
ind
Spee
d
Shal
low
est W
ater
Dep
th
Deep
Rou
nd 3
Wat
er D
epth
Deep
(100
m)
Wat
er D
epth
Deep
est (
130m
) Wat
er D
epth
Low
est W
ave
Heig
ht
High
Wav
e He
ight
High
est W
ave
Heig
ht
Low
est T
ide
Rang
e
High
est T
ide
Rang
e
Low
est D
ista
nce
to P
ort (
Boat
for O
&M)
High
est D
ista
nce
to P
ort (
Nove
l O&M
)
High
est W
ind
Spee
d an
d Hi
ghes
t W
ave
Heig
ht
Low
est W
ave
Heig
ht a
nd D
eepe
st
Wat
er D
epth
High
est W
ave
Heig
ht a
nd S
hallo
wes
t W
ater
Dep
th
Rock
in D
eep
Roun
d 3
Wat
er D
epth
Rock
in D
eep
(100
m) W
ater
Dep
th
Extre
me
Wav
e He
ight
14
met
ers
Extre
me
Wav
e He
ight
16
met
ers
10-M
W W
ind
Turb
ine
Annual mean wind speed [note 4] m/s 9.6 9.7 9.7 9.7 10.5 11.4 9.7 9.7 9.7 9.7 9.7 9.7 9.7 9.7 9.7 9.7 9.7 11.4 9.7 9.7 9.7 9.7 9.7 9.7 9.7Extreme 1-yr return wind speed m/s 29.6 30.5 30.5 30.5 33.0 33.5 30.5 30.5 30.5 30.5 30.5 30.5 30.5 30.5 30.5 30.5 30.5 33.5 30.5 30.5 30.5 30.5 30.5 30.5 30.5Extreme 50-yr return wind speed m/s 37.2 46.0 46.0 46.0 47.0 48.5 46.0 46.0 46.0 46.0 46.0 46.0 46.0 46.0 46.0 46.0 46.0 48.5 46.0 46.0 46.0 46.0 46.0 46.0 46.0
Mean water depth m 57.0 75.0 75.0 75.0 75.0 75.0 57.0 [2] 57.0 100.0 130.0 75.0 75.0 85.0 [2] 75.0 75.0 75.0 75.0 85.0 [2] 130.0 70.0 [2] 57.0 100.0 90.0 [2] 120.0 [2] 75.0Annual mean significant wave height m 2.5 1.9 1.9 1.9 1.9 1.9 1.9 1.9 1.9 1.9 1.0 2.5 2.8 1.9 1.9 1.9 1.9 2.8 1.0 2.8 1.9 1.9 2.8 2.8 1.9Extreme 1-yr return wave height m 7.1 6.6 6.6 6.6 6.6 6.6 6.6 6.6 6.6 6.6 4.9 7.2 8.9 6.6 6.6 6.6 6.6 8.9 4.9 8.9 6.6 6.6 8.9 8.9 6.6
Peak period for annual waves sec 13.0 11.0 11.0 11.0 11.0 11.0 11.0 11.0 11.0 11.0 8.0 12.0 14.0 11.0 11.0 11.0 11.0 14.0 8.0 14.0 11.0 11.0 11.0 11.0 11.0Extreme 50-yr return wave height m 10.3 8.2 8.2 8.2 8.2 8.2 8.2 8.2 8.2 8.2 7.0 10.3 12.0 8.2 8.2 8.2 8.2 12.0 7.0 12.0 8.2 8.2 14.0 16.0 8.2
Peak period for extreme waves sec 14.5 12.0 12.0 12.0 12.0 12.0 12.0 12.0 12.0 12.0 8.0 14.0 16.0 12.0 12.0 12.0 12.0 16.0 8.0 16.0 12.0 12.0 17.3 18.4 12.0Mean tidal range m 5.80 3.50 3.50 3.50 3.50 3.50 3.50 3.50 3.50 3.50 3.50 3.50 3.50 2.00 8.00 3.50 3.50 3.50 3.50 3.50 3.50 3.50 3.50 3.50 3.50
Extreme low water level m -3.50 -1.80 -1.80 -1.80 -1.80 -1.80 -1.80 -1.80 -1.80 -1.80 -1.80 -1.80 -1.80 -1.25 -4.50 -1.80 -1.80 -1.80 -1.80 -1.80 -1.80 -1.80 -1.80 -1.80 -1.80Extreme high water level m 4.38 3.00 3.00 3.00 3.00 3.00 3.00 3.00 3.00 3.00 3.00 3.00 3.00 2.18 5.25 3.00 3.00 3.00 3.00 3.00 3.00 3.00 3.00 3.00 3.00
Mean current speed - [Note 3] m/s 0.80 0.7 0.7 0.7 0.7 0.7 0.7 0.7 0.7 0.7 0.7 0.7 0.7 0.7 0.7 0.7 0.7 0.7 0.7 0.7 0.7 0.7 0.7 0.7 0.7Extreme 50-yr return current speed m/s 1.29 1.12 1.12 1.12 1.12 1.12 1.12 1.12 1.12 1.12 1.12 1.12 1.12 1.12 1.12 1.12 1.12 1.12 1.12 1.12 1.12 1.12 1.12 1.12 1.12
Distance to port km 130 70 70 70 70 70 70 70 70 70 70 70 70 70 70 40 130 70 70 70 70 70 70 70 70
Seabed -- Rock Sand Rock Gravelly Sand Sand Sand Sand Sand Sand Sand Sand Sand Sand Sand Sand Sand Sand Sand Sand Sand Rock Rock Sand Sand Sand
Notes:1. The Baseline Reference Case is generally the average of the UK conditions. 2. Indicates shallowest (minimum) possible water depth for this combination of conditions3. Current is has negligible impact on system CAPEX. Current is modeled in OrcaFlex and ignored in PelaStar Optimizer. 4. Wind speed is at 100m hub height. Wave Hub data is from HR Wallingford and virtual met mast data, converted from 90m hub height to 100m.5. HR Wallingford metocean report forms reference for Wave Hub wind speed, wave height and period, and extreme 50-yr return current
Green cells show where values differ from Baseline Case #2
SensitivityWave height Tide Range DistanceSeabed CombinationsWind Speed Water Depth

PelaStar Cost of Energy - Part 1: CAPEX
ETI Floating Platform FEED Study Glosten Rev 01 8 21 January 2014
1.3.11 Concept Design Methodology and the PelaStar Optimizer A concept design of the PelaStar tension-leg platform is prepared for each analysis case in this study. The proprietary tool, PelaStar Optimizer, accepts inputs describing the selected turbine and prescribed site conditions, then produces a cost-optimized design for each scenario. A generic 6 MW offshore turbine is used throughout this analysis, but site conditions vary, as shown in Table 8. The resulting optimized concept designs are sufficiently described to calculate the system CAPEX. The PelaStar Optimizer produces a cost-optimized concept design for a specified turbine and a selected site. Using various optimization algorithms, PelaStar searches the “solution space” comprising all allowable combinations of design parameters, such as column diameter, length and wall thickness; arm length, width, depth, and taper; overall draft; and other design characteristics. For each combination of design parameters, the system CAPEX is calculated and pre-defined constraints are checked. The cost is a function of required material quantities and loads, which are determined from first principles and application of offshore design standards, especially Reference 3. The constraints ensure key design criteria, such as robustness against slack tendon, are satisfied. Optimizer explores a solution space comprising the following PelaStar design parameters, each of which is bounded by either an absolute limit or a relative limit:
1. Central column diameter. 2. Central column length. 3. Lower hull diameter. 4. Overall draft. 5. Effective radius of arms (radius to tendon connection). 6. Arm width at root. 7. Arm depth at root.
For every explored combination of design parameters, Optimizer calculates the environmental loads on the floating turbine. These environmental loads include:
x First-order wave loads. x Steady hydrodynamic drag loads. x Steady aerodynamic drag and thrust loads.
Environmental loads are calculated for five design environments: 1. Survival design environment. 2. Extreme design environment. 3. Lifetime design environment. 4. Cut-out wind speed and associated sea state. 5. Rated thrust wind speed and associated sea state.
Platform accelerations are can be an important design driver, especially the impact of platform surge accelerations on stresses in the central tower. Optimizer calculates the rigid-body surge response of the floating turbine using first principles. Once geometry is determined and loads are calculated, a blend of Class Society (DNV) Rules and First Principles is used to develop the required scantlings of the column, lower hull, and arms.

PelaStar Cost of Energy - Part 1: CAPEX
ETI Floating Platform FEED Study Glosten Rev 01 9 21 January 2014
The ultimate objective of Optimizer is to develop the lowest-cost design for a given turbine at a given site, with specified project parameters such as project scale and location. To that end, the cost function in Optimizer is the platform CAPEX, including the hull, tendon fabrication, and anchor fabrication. The hull cost is derived primarily from the primary steel weight, though the total fabrication cost is included. The tendon cost and anchor cost are derived primarily from the maximum tendon loads. Optimizer captures the inherent tradeoffs between competing design tendencies; for example, a platform with longer arms (more steel) and lower tendon loads versus a platform with shorter arms and higher tendon loads. Similarly, Optimizer strikes the optimal balance between a larger column diameter, giving less weight but higher hydrodynamic loads, or a smaller diameter with higher weight but lower hydrodynamic loads.
2. Concept Designs for UK Conditions This section presents the concept-level platform designs resulting from the PelaStar Optimizer software, as discussed in Section 1.3.11. Designs are presented for the matrix of cases shown in Table 8. This section then addresses how the design changes as the design parameter is varied. All designs use the 5-arm configuration, as this provides the optimal balance between robustness and cost. The optimized designs are highly consistent across the matrix of cases. A select few designs have arms that are 1 to 2 m longer or shorter than the baseline design. Two optimized designs have a longer central column than the baseline design by 2 m. The Wave Hub design is an outlier in the matrix, showing a much shorter column and much larger lower hull diameter than the baseline design. The Wave Hub design also has the greatest steel weight by nearly 200 MT compared to the next heaviest design, and by over 300 MT compared to the baseline. Cases with relatively low wave heights and deep water could be considered the “lower bound” designs, meaning that the steel weight, tendon loads, and anchor loads are the lowest out of the matrix of cases. Cases with relatively high wave heights combined with either shallow water or higher wind speeds could be considered “upper bound” designs, which means that the steel weight, tendon loads, and anchor loads are the greatest out of the matrix of cases. Case 21 best represents a lower bound design, while Cases 20 and 22 best represent an upper bound.
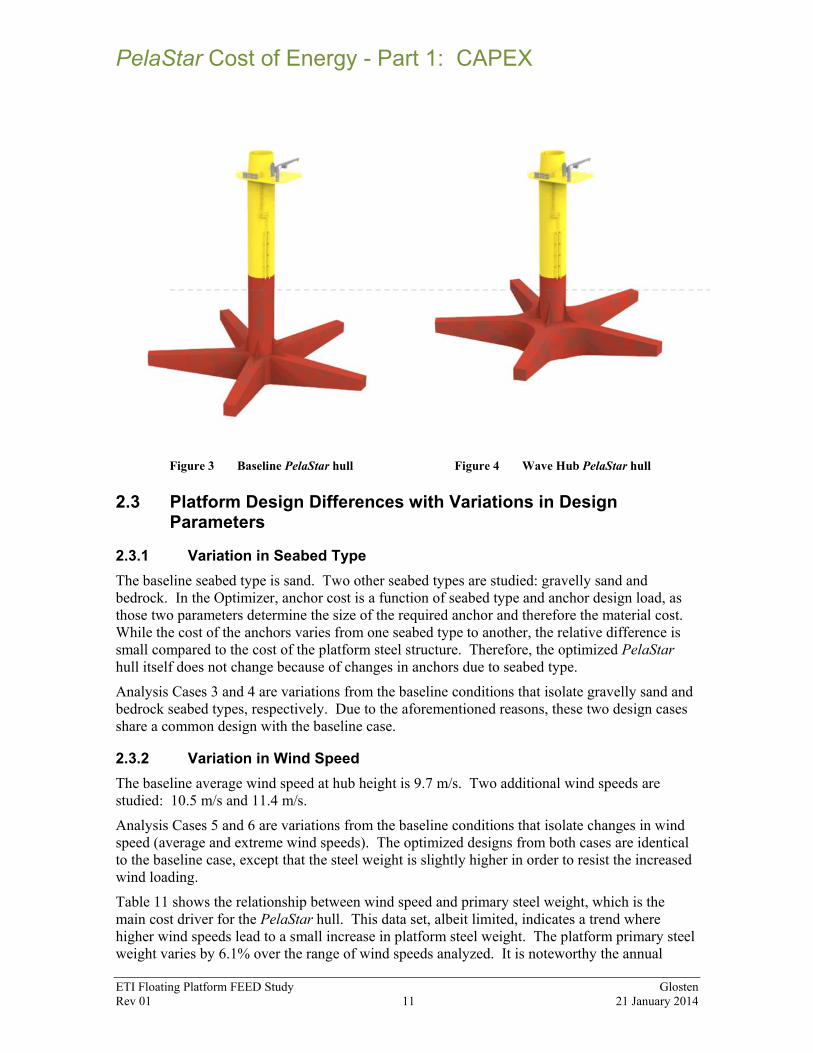
2.1 Baseline Design The baseline design is a sleek, relatively lightweight structure that minimizes hydrodynamic wave loading by locating the arms some 22 m below the LAT waterline and by minimizing the diameter of the lower hull. The column diameter is 7 m, which is the optimal balance between minimizing hydrodynamic loads, resisting structural loads, and developing buoyancy. Principal characteristics for the optimized baseline design are listed in Table 9. Figure 3 shows a 3D rendering of the baseline design.

PelaStar Cost of Energy - Part 1: CAPEX
ETI Floating Platform FEED Study Glosten Rev 01 10 21 January 2014
Table 9 Principal characteristics: Baseline design
Design Characteristic Units Baseline Primary steel weight MT 1174 Displaced volume m3 4033 Column diameter m 7.0 Column length (below LAT) m 22.0 Lower hull diameter m 18.0 Lower hull depth m 8.5 Draft at LAT m 30.5 Arm effective radius m 30.0 Arm root width m 4.0 Arm tip width m 3.0
2.2 Design for Wave Hub Demonstration Site The Wave Hub site proves challenging for the PelaStar system, and indeed for floating structures in general1. The limited water depth leads to a design where the column is relatively short compared to the baseline, and the lower hull diameter is relatively large. The reason for this change in hull geometry is to achieve as long a tendon length as possible while at the same time developing sufficient buoyancy. Compared to the baseline design, the Wave Hub design has much more displaced volume nearer to the free surface, which tends to attract more hydrodynamic wave loading. The resulting design has primary steel weight over 300 MT greater than the baseline. Figure 3 and Figure 4 illustrate the differences between the baseline and Wave Hub designs. Both figures use the same scale and viewport settings. Table 10 lists the principal characteristics for the Wave Hub design. Table 10 Principal characteristics: Wave Hub demonstration site design (as generated by Optimizer)
Design Characteristic Units Wave Hub
Demonstrator Primary steel weight MT 1500 Displaced volume m3 4723 Column diameter m 7.0 Column length (below LAT) m 12.3 Lower hull diameter m 17.0 Lower hull depth m 8.75 Draft at LAT m 21.05 Arm effective radius m 31.2 Arm root width m 3.5 Arm tip width m 3.0
1 In 2010 The Glosten Associates expended a significant effort designing a mooring system for a 1 MW wave energy converter (WEC) prototype for the Wave Hub site. It was ultimately concluded that a feasible mooring system design (i.e., technically and economically feasible) could not be achieved with off-the-shelf materials.
PelaStar Cost of Energy - Part 1: CAPEX
ETI Floating Platform FEED Study Glosten Rev 01 11 21 January 2014
Figure 3 Baseline PelaStar hull
Figure 4 Wave Hub PelaStar hull
2.3 Platform Design Differences with Variations in Design Parameters
2.3.1 Variation in Seabed Type The baseline seabed type is sand. Two other seabed types are studied: gravelly sand and bedrock. In the Optimizer, anchor cost is a function of seabed type and anchor design load, as those two parameters determine the size of the required anchor and therefore the material cost. While the cost of the anchors varies from one seabed type to another, the relative difference is small compared to the cost of the platform steel structure. Therefore, the optimized PelaStar hull itself does not change because of changes in anchors due to seabed type. Analysis Cases 3 and 4 are variations from the baseline conditions that isolate gravelly sand and bedrock seabed types, respectively. Due to the aforementioned reasons, these two design cases share a common design with the baseline case.
2.3.2 Variation in Wind Speed The baseline average wind speed at hub height is 9.7 m/s. Two additional wind speeds are studied: 10.5 m/s and 11.4 m/s. Analysis Cases 5 and 6 are variations from the baseline conditions that isolate changes in wind speed (average and extreme wind speeds). The optimized designs from both cases are identical to the baseline case, except that the steel weight is slightly higher in order to resist the increased wind loading. Table 11 shows the relationship between wind speed and primary steel weight, which is the main cost driver for the PelaStar hull. This data set, albeit limited, indicates a trend where higher wind speeds lead to a small increase in platform steel weight. The platform primary steel weight varies by 6.1% over the range of wind speeds analyzed. It is noteworthy the annual

PelaStar Cost of Energy - Part 1: CAPEX
ETI Floating Platform FEED Study Glosten Rev 01 12 21 January 2014
energy production of the wind farm varies by 13% over the same range of wind speeds, which indicates that PelaStar cost of energy decreases with increasing wind speed. Table 11 Impact on primary steel weight from wind
Case
Average Wind Speed at Hub Height
[m/s]
Primary Steel Weight
[MT]
Optimization Cost
Function1 Baseline 9.7 1174 £896,548Case 5 10.5 1177 £897,827Case 6 11.4 1246 £898,492
1 The optimization cost function is the sum of the hull cost, tendon material cost, and anchor material cost, and is per MW installed.
2.3.3 Variation in Water Depth For this section, water depth refers to the water depth at mean sea level. The baseline water depth is 75 m. Several additional water depths are analyzed, including: “shallowest possible,” which is determined through the present analysis to be 57 m for the baseline wave, wind, and tide conditions; “deep UK Round 3,” which is also 57 m; 100 m; and 130 m. Other minimum water depths are established for non-baseline conditions and discussed below in the Combination Cases section. Analysis Cases 7, 8, 9, and 10 are variations from the baseline conditions that isolate changes in water depth. Cases 7 and 8 are effectively the same case, since the limiting shallow water depth is determined to be 57 m for baseline wind, wave, and tidal conditions. The optimized design for Case 7/8 is identical to the baseline design, except that some plate thicknesses are higher in order to resist the higher dynamic loads encountered in shallow water conditions. The optimized designs for Cases 9 and 10 are identical to the baseline design, except that the arms are 2 m shorter in both cases. The primary steel weight is lower for the two deep water cases (Case 9 and 10). In general, the data shows that platform primary steel weight decreases with increasing water depth. This decrease in steel cost is offset by an increase in tendon cost, which illustrates the ability of the PelaStar Optimizer software to find the lowest-cost overall design solution for a given set of conditions. The optimization cost function (sum of hull cost, tendon material cost, and anchor material cost) is relatively constant over the range of water analyzed depths, with the minimum occurring in water depths near the baseline conditions. The data suggests that the lowest overall cost occurs in water depths between 75 m and 100 m. Table 12 Impact on primary steel weight and optimization cost function from water depth
Case
Water Depth at MSL
[m]
Primary Steel Weight
[MT]
Optimization Cost
Function1
Case 7/8 57.0 1246 £908,956 Baseline 75.0 1174 £896,548 Case 9 100.0 1152 £902,807 Case 10 130.0 1152 £931,091
1 The optimization cost function is the sum of the hull cost, tendon material cost, and anchor material cost, and is per MW installed.

PelaStar Cost of Energy - Part 1: CAPEX
ETI Floating Platform FEED Study Glosten Rev 01 13 21 January 2014
2.3.4 Variation in Wave Height For convenience, wave height ranges are discussed in terms of the extreme wave height (significant wave height with a 50-year return period) in this section of the report. The baseline extreme wave height is 8.2 m. Three additional wave cases are studied, with extreme wave heights of 7.0 m, 10.3 m, 12.0 m, 14.0 m, and 16.0 m. The full definition of wave conditions for each case is shown in Table 4. Analysis Cases 11, 12, 13, 23 and 24 are variations for the baseline case that isolate changes in wave height. The optimized design for Case 11 (7 m extreme wave height) has the same dimensions as the baseline design, but with lower tendon and anchor design loads. The optimized design for Case 12 (10.3 m extreme wave height) has a central column and draft that is 1 m greater than the baseline, and is otherwise the same as baseline. Case 13 (12 m extreme wave) shares the longer column design with Case 11, and also has arm radius 1 m greater than the baseline design. For the sensitivity cases (extreme wave heights of 14 and 16 m), the column diameter increases to 7.5 m, and the arm length increases to 34 m. Table 13 shows the relationship between extreme wave height and primary steel weight, which is the main cost driver for the PelaStar hull. This data set indicates a clear trend where higher wave heights lead to an increase in primary steel weight, especially for wave heights larger than the baseline case. The platform primary steel weight varies by 11.3% over the range of extreme wave heights analyzed. Wave height also impacts offshore operations such as installation cost and turbine availability resulting from a more challenged Operations and Maintenance program. The CAPEX implications are discussed in Section 3, and the LCOE impacts are discussed in Part 2. Table 13 Impact on primary steel weight from wave
Case
Extreme Wave Height
[m]
Primary Steel Weight
[MT]
Optimization Cost
Function1 Case 11 7.0 1172 £888,993 Baseline 8.2 1174 £896,548 Case 12 10.3 1223 £916,882 Case 13 12.0 1307 £957,615 Case 23 14.0 1352 £985,571 Case 24 16.0 1410 £1,030,986
1 The optimization cost function is the sum of the hull cost, tendon material cost, and anchor material cost, and is per MW installed.
2.3.5 Variation in Tide Range The baseline tide range is 4.8 m. Two additional tide ranges are studied: 3.4 m and 9.8 m. Analysis Cases 14 and 15 are variations from the baseline conditions that isolate changes in tide range. The optimized designs from both cases are identical to the baseline case, except that the steel weight for Case 15 (9.8 m tide range) is 73 MT greater than the baseline. The higher steel weight is attributable to thicker plate thickness, due to the increased moment arm between the turbine hub height and the base of the central column. In general, the data suggest that the PelaStar design is not sensitive to tide range for the conditions expected for UK commercially exploitable waters.

PelaStar Cost of Energy - Part 1: CAPEX
ETI Floating Platform FEED Study Glosten Rev 01 14 21 January 2014
2.3.6 Variation in Distance to Port Distance to port is considered in CAPEX as this distance impacts the transit distance for installation. However, there is not an inherent PelaStar design feature (column diameter, arm length, etc.) that makes an appreciable impact on these costs, so the optimized PelaStar design itself does not change due to changes in distance from port. The CAPEX implications are discussed in Section 3, and the LCOE impacts due to transit distance for maintenance are discussed in Part 2.
2.3.7 Combination Cases Analysis cases combining upper and lower bounds of wave height, wind speed, and water depth are analyzed to study the interaction effects of these site parameters. Analysis Cases 18, 19, and 20 are variations from the baseline case that isolate the following combinations:
x Highest wind speed and highest wave height (Case 18). x Lowest wave height and deepest water depth (Case 19). x Highest wave height and shallowest water depth (Case 20).
The optimized design for Case 18 has the second-greatest primary steel weight out the matrix of cases. Only the Wave Hub design (Case 1) has a greater steel weight. The combination of wind and wave loads drives the optimized design to have a larger column diameter than the baseline by 0.5 m, a longer column diameter that baseline by 2 m, and longer arm radius by 2 m. It is noteworthy that the minimum feasible water depth for this combination of wind and waves is 85 m. The optimized design for Case 19 is relatively lightweight. The combination of lower wave energy (due to lower wave height) and lower platform accelerations (due to deep water and longer surge natural period) make the optimized design for Case 19 the lightest primary steel weight of all the analysis cases. The optimized design for Case 20 is relatively heavy compared to the baseline, because the design is pushed to the limit of shallow water and large waves. The minimum feasible water depth for this combination of site parameters is 70 m. Table 14 Impact on primary steel weight from wave and wind
Case Description
Extreme Wave Height
[m]
Average Wind Speed [m/s]
Water Depth at MSL
[m]
Primary Steel
Weight [MT]
Optimization Cost
Function1
Case 18 Highest wind speed and highest wave height 8.2 11.4 85.0 1337 £965,714
Baseline 8.2 9.7 75.0 1174 £896,548
Case 19 Lowest wave height and deep water 7.0 9.7 130.0 1152 £917,110
Case 20 Highest wave height and shallow water
12.0 9.7 70.0 1276 £934,052
1 The optimization cost function is the sum of the hull cost, tendon material cost, and anchor material cost, and is per MW installed.

PelaStar Cost of Energy - Part 1: CAPEX
ETI Floating Platform FEED Study Glosten Rev 01 15 21 January 2014
2.3.8 Harsh Wave Environments The matrix of cases considers extreme wave heights of 7 to 12 m, which is the expected range for commercially exploitable UK waters. However if certain grid improvements were implemented, however, then sites very harsh wave environments (e.g., northwest of Scotland) could be within a reasonable distance of an adequate onshore grid connection. Cases 23 and 24 isolate the impact of 14 m and 16 m extreme wave heights, respectively. All other conditions are the same as the baseline case, except water depth. For each of the two wave heights, the minimum economical water depth was determined. These are 90 m and 120 m, respectively. The results of this analysis are summarized in Table 15. Table 15 Impact on primary steel weight from harsh wave environments
Case No. Extreme Wave
Height
Primary Steel Weight
[MT]
Optimization Cost
Function1
Baseline 8.2 m 1174 £896,548
23 14.0 m 1352 £985,571 24 16.0 m 1410 £1,030,986
2.4 Platform Design for a 10 MW Turbine An optimized design was developed for the ASMC Windtec 10 MW Sea Titan and Baseline conditions, and is presented as Case 25. The primary steel weight scales nearly linearly with the wind turbine power rating. Principal characteristics for the optimized Baseline 6 MW and 10 MW designs are listed in Table 16. Table 16 Principal characteristics: Baseline design
Design Characteristic Units Baseline 6 MW Baseline 10 MW Primary steel weight MT 1174 2091 Displaced volume m3 4033 6846 Column diameter m 7.0 10.0 Column length (below LAT) m 22.0 23.0 Lower hull diameter m 8.0 15.0 Lower hull depth m 8.5 9.0 Draft at LAT m 30.5 32.0 Arm effective radius m 30.0 35.0 Arm root width m 4.0 4.0 Arm tip width m 3.0 4.0
PelaStar Cost of Energy - Part 1: CAPEX
ETI Floating Platform FEED Study Glosten Rev 01 16 21 January 2014
3. Parametric CAPEX Analysis
3.1 Methodology and General Assumptions CAPEX is calculated for the PelaStar platform, mooring system, and installation. The CAPEX calculations model utility-scale deployment and commercial conditions. Primary PelaStar cost components correspond to the anticipated work breakdown structure for sub-contractors in large wind farm installation. The primary cost components are: hull fabrication and delivery; mooring system; and installation. Each major component is divided into sub-components. Cost calculations are performed at the sub-component level. Major assumptions, such as wind farm size, high-level design requirements, and selected turbine, are listed in the following sections; and a detailed cost breakdown of the PelaStar system is also presented.
Turbine and Site x Turbine is a generic 6 MW offshore turbine with 150 m rotor diameter. x Turbine has 410-ton top head mass and 372-ton tower. Tower length is 72.8 m. x Soil conditions are sand (see Section 1.3) unless otherwise stated. x Extreme Design Environment is a 50-year-return-period (50-YRP) storm.
Design Criteria x “Hull” includes all structure and outfitting below the bottom tower flange. x Hull and mooring system are design to forthcoming DNV Rules for Floating Offshore
Wind Turbine Installations (Reference 3). x Hull and mooring system are designed for 20-year service life without mid-life haul-out
or servicing.
Installation x Hull is fabricated in a shipyard and delivered to the local staging port. x Turbine is assembled atop the floating hull in the staging port using land-based crane. x PelaStar Support Barge transports floating wind turbine (i.e., hull and turbine) to wind
plant location and stabilizes floating turbine during final installation.
Financial x €1.000 = $1.323: Average spot exchange rate for 2013 (Bank of England). x £1.000 = $1.558: Average spot exchange rate for 2013 (Bank of England). x CAPEX is calculated in constant currency (2013 pounds sterling) for PelaStar floating
wind plants with financial investment decision (FID) in 2030, 2040, and 2050. Future wind plants assume expected learning rates in fabrication and installation.

PelaStar Cost of Energy - Part 1: CAPEX
ETI Floating Platform FEED Study Glosten Rev 01 17 21 January 2014
3.2 Scope, Assumptions, and Basis of Estimate PelaStar CAPEX calculations are based on the work breakdown structure shown in Table 17. Cost estimates are made for each sub-component. This report section details the scope, assumptions, and basis of estimate for each sub-component. Table 17 PelaStar CAPEX components
Item No. Description 1 Hull Fabrication and Delivery
1.1 Primary Steel Fabrication 1.2 Secondary Steel Fabrication 1.3 Mechanical Outfitting 1.4 Platform Paint 1.5 Cathodic Protection 1.6 Transport 1.7 Engineering & Management 1.8 Fees
2 Anchor and Tendon System 2.1 Synthetic Fiber Tendons 2.2 Connectors 2.3 Anchors 2.4 Anchor Installation
3 Installation 3.1 Tendon Installation 3.2 Platform / Turbine Installation
4 Turbine and Tower 5 Balance of System
5.1 Port and Staging Equipment 5.2 Port Improvements 5.3 Offshore Sub-System (Installed)
5.4 Electrical Array Cables (Installed)
5.5 Electrical Transmission Cable (Installed)
5.6
Permits, Engineering, Site Assessment, Project Management, Consultants and Bank Fees
5.7 Overall Project Contingencies

PelaStar Cost of Energy - Part 1: CAPEX
ETI Floating Platform FEED Study Glosten Rev 01 18 21 January 2014
Item 1: Hull Fabrication and Delivery
Scope
x Hull Fabrication includes procurement of the complete floating hull and delivery to the local staging port in the UK.
x Hull Fabrication includes detailed engineering, construction management, and PelaStar profit.
Item 1.1: Primary Steel Fabrication
Scope
x Primary steel includes all external plating, internal bulkheads, decks, internal stiffening, external brackets, allowance for welding and brackets (5%), Preliminary Design Margin (10%).
x Level II coating (primed and painted). x Load-out of completed hull onto transport ship.
Assumptions
x Primary steel weight includes a 5% allowance for brackets and welding and a 10% Preliminary Design Margin.
x Fabrication occurs in Romania. x Typical shipbuilding learning curve for multiple units, based on an indicative shipyard
quote for 1 unit and 10 units. Basis of Estimate
x Steel weight is calculated using the PelaStar Optimizer. x Fabrication cost is based on an indicative shipyard quote in August 2013.
Item 1.2: Secondary Steel Fabrication
Scope
x Secondary steel includes all external ladders, platforms, fenders/boat bumpers, support barge spud pockets, tendon foundations, internal piping, allowance for welding and brackets (5%), Preliminary Design Margin (10%).
x Level II coating (primed and painted). x Integration with primary structure.
Assumptions
x Secondary steel weight includes a 5% allowance for brackets and welding and a 10% Preliminary Design Margin.
x Fabrication occurs in Romania. x Typical shipbuilding learning curve for multiple units.
Basis of Estimate
x Steel weight is using the PelaStar Optimizer. x Fabrication cost is based on an indicative shipyard quote in August 2013.
PelaStar Cost of Energy - Part 1: CAPEX
ETI Floating Platform FEED Study Glosten Rev 01 19 21 January 2014
Item 1.3: Mechanical
Scope
x Mechanical outfitting includes all electrical and mechanical equipment necessary to monitor and operate the floating hull; e.g., motor-operated sea valves, bilge alarm sensors, internal lighting, internal ventilation, tendon monitoring system, power panel, back-up batteries and other items identified on a one-line electrical diagram.
x PelaStar does not require pumps, winches, chain jacks, hydraulic tensioners, or any other major mechanical equipment.
Assumptions
x Tendons do not require in-field length adjustment or active tensioning. This is achieved by accurately measuring the post-installation location of the anchor connection point and the ability to manufacture synthetic fiber ropes within a tight tolerance on overall length.
x Platform installation is performed by the PelaStar Support Barge, which supplies all electrical power and compressed air required to perform the operation. These systems are included in Item 3.3.
Basis of Estimate
x Quote from fabricator for single-unit demonstration project, adjusted to commercial-scale project to reflect economies of scale and expected changes in scope of supply.
Item 1.4: Platform Paint
Scope
x Platform paint includes primer applied to platform interior and exterior, and two coats of paint applied to ballast tank interior and platform exterior.
Assumptions
x Shipyard procures and applied coatings. Basis of Estimate
x Previous experience as owner’s representative for similar platforms.
Item 1.5: Cathodic Protection
Scope
x Cathodic Protection includes the supply and installation of aluminum anodes. Coatings are included in Items 1.1 and 1.2.
Assumptions
x Platform uses Level II coating. x Required weight of anodes is calculated using PelaStar Optimizer.
Basis of Estimate
x Global commodity price for aluminum, plus installation labor.

PelaStar Cost of Energy - Part 1: CAPEX
ETI Floating Platform FEED Study Glosten Rev 01 20 21 January 2014
Item 1.6: Transport
Scope
x Transport includes shipping completed hulls from fabrication facility in Romania to the staging port in the UK and offloading hulls at stating port. Load-out onto the transport ship is included in Item 1.1.
Assumptions
x Uses heavy-lift vessel, such as Dockwise Mighty Servant (or Swan Class), to transport multiple hulls per trip.
x 6,800 nm transit. (3,400 nm each way, and pay for empty return trip). x Transit speed = 14 knots. x Vessel day rate = $120,000/day, plus 20 MT of fuel per day at $700/ton. Day rate is
based on the long term contract for transport of foundations and equipment for a full wind farm, plus the transport of 3 foundations in each trip.
Basis of Estimate
x Previous experience as owner’s representative for similar shipments.
Item 1.7: Engineering and Management
Scope
x Engineering and Management includes detailed design, shipyard engineering support through fabrication, and program management costs associated with hull procurement.
Assumptions
x Assume engineering and management is 8% of the hull fabrication cost (Items 1.1 – 1.4). Basis of Estimate
x Previous experience as owner’s representative for barge and vessel procurement, where Glosten work scope is in line with the scope of this cost item.
Item 1.8 Fees
Scope
x Margin obtained through the supply of PelaStar hull, tendons, and tendon connectors. Assumptions
x The assumed profit margin is 10% on furnished materials. Basis of Estimate
x PelaStar industrialization plan.
Item 2: Anchor and Tendon System
Scope
x Anchor and Tendon System includes all hardware required to secure the floating turbine to the sea bed, including anchors, tendons, and connectors.
x Anchor and Tendon System includes installation of anchors. Tendon installation is included separately, with platform/turbine installation.

PelaStar Cost of Energy - Part 1: CAPEX
ETI Floating Platform FEED Study Glosten Rev 01 21 21 January 2014
x Component costs include management and engineering and transportation to the staging port.
Item 2.1: Synthetic Fiber Tendons
Scope
x Synthetic Fiber Tendons include the design, manufacture, and delivery of the complete tendon.
x All required protective jacketing is included. x End terminations are included.
Assumptions
x Synthetic Fiber Tendons utilize endless-winding-fiber technology, as embodied in FibreMaxTM cables.
x The selected fiber is a high-molecular weight polyethylene (HMPE) with the trade name Dyneema Max, or DM20.
Basis of Estimate
x Quote from manufacturer, FibreMax.
Item 2.2: Connectors
Scope
x Connectors include the hardware required to connect the synthetic fiber tendons to the anchor at the lower end and the hull at the upper end.
x Connectors are 2-axis linkages. Assumptions
x Connectors are fabricated from steel. x The upper connector is a simple 2-axis linkage with a pin connection to the tendon and a
seated, rigid connection to the hull. x The lower connector is a simple 2-axis linkage with a pin connection to the lower end of
the tendon and a pin connection to the upper end of the anchor. Basis of Estimate
x Based on indicative pricing from SRP.
Item 2.3: Anchors
Scope
x Anchors include all the hardware permanently installed in the seabed, below the lower tendon connector.
x Anchors include the design, manufacture, and delivery of anchors to the project site. Assumptions
x Anchors are driven piles. x Pile diameter is between 3 and 4 meters. Pile length is between 25 m and 50 m. x Anchors are fabricated in the United States.

PelaStar Cost of Energy - Part 1: CAPEX
ETI Floating Platform FEED Study Glosten Rev 01 22 21 January 2014
Basis of Estimate
x Detailed quote from supplier, InterMoor.
Item 2.4: Anchor Installation
Scope
x Anchor Installation includes: � Project management and engineering. � Procurement of stabilization frames and hammers. � Storage. � Mobilization of installation vessel (work boat). � Mobilization of specialist installation crew. � Vessel day rate; vessel fuel. � Vessel crew. � ROV equipment and crew. � Survey equipment and crew. � Installation vessel de-mobilization. � Specialist installation crew de-mobilization. � Mandatory vessel down time for vessel maintenance.
Assumptions
x Stability frame, hammer, and first load of piles are transported on installation vessel. Subsequent piles are transported via barge or cargo vessel from fabrication/storage site to offshore wind plant site.
x Anchors are common across wind plant. Basis of Estimate
x Detailed quote from InterMoor.
Item 3: Installation
Scope
x Installation includes transporting the fully assembled floating turbine from the staging port to the wind plant site, deploying the tendons, connecting the tendons to the anchors, securing the floating turbine to the tendons, and final power cable connection.
x Installation includes for the aforementioned tasks: vessel day rates, vessel and personnel mobilization, consumables, required fixtures and equipment, procurement of the PelaStar Support barge.
x Installation excludes laying the intra-array cables. These are included in Item 5, Balance of System.
x Installation excludes turbine assembly, which is performed in the staging port with a land-based crane while the hull is alongside the quay wall. This cost is included in Item 4, Turbine.

PelaStar Cost of Energy - Part 1: CAPEX
ETI Floating Platform FEED Study Glosten Rev 01 23 21 January 2014
Item 3.1: Tendon Installation
Scope
x Tendon installation includes deploying tendons from the PelaStar Support Barge, connecting the lower end of the tendons to the anchors, and connecting the upper ends of the tendons to the PelaStar hull.
Assumptions
x Tendon installation occurs as part of the overall PelaStar installation process, hence no additional trips or dedicated vessels are required.
x Tendon connections are made by ROV (remote-operated vehicle). No divers are utilized.
x Tendon installation accounts for approximately 0.75 days out of the overall installation process.
x All equipment and personnel required to perform tendon installation is included in the PelaStar Support Barge capital cost and operating cost, respectively.
Basis of Estimate
x Detailed analysis of PelaStar Support Barge operating costs performed by Glosten. See below.
Item 3.2: Platform / Turbine Installation
Scope
x Platform / turbine installation includes transporting the fully assembled floating turbine from the staging port to the offshore wind plant site using the PelaStar Support Barge.
x PelaStar Support Barge acquisition. x Anchor installation and tendon installation are included in Items 2.4 and 3.1,
respectively. x Assembly of the turbine atop the floating hull in the staging port is not included. This
assembly is completed using a land-based crane while the floating hull is alongside the quay wall.
Assumptions
x All 83 floating wind turbines are installed in a two-year period. x The cost of procuring the required number of PelaStar Support Barges is amortized over
83 floating wind turbines. x Total transit distance from staging port to offshore wind plant site is 130 nm. x Installation occurs can occur year-round, weather permitting. x The limiting sea state for transit and installation operations is characterized by a 2 m
significant wave height; the resulting weather down time is accounted for. x Mechanical down time is 10%.
Basis of Estimate
x Preliminary engineering of PelaStar Support Barge and installation logistics performed by Glosten under a US Department of Energy Grant Award, DOE-EE00005490.

PelaStar Cost of Energy - Part 1: CAPEX
ETI Floating Platform FEED Study Glosten Rev 01 24 21 January 2014
x Support Barge hull fabrication is based on budgetary quote from Conrad Industries in the United States. The quote includes fabrication of the bare hull with no outfitting. A detailed cost estimate for the Support Barge, including all outfitting, was performed by Glosten under a US Department of Energy Grant Award, DOE-EE00005490.
Item 4: Wind Turbine
Scope
x 6 MW Offshore Wind Turbine Generator (WTG), Rotor Nacelle Assembly (RNA), and Tower, ex-works.
x In-harbor WTG assembly on PelaStar platform, including cranes, tooling, and manpower.
x In-harbor WTG pre-commissioning. x Offshore WTG final commissioning.
Assumptions
x Projected commercial pricing for final investment decision in year 2020, in today’s currency.
x Large single order of 83 WTGs. x Manufacturer is generic, Siemens, Alstom, etc.
Basis of Estimate
x Anticipated turbine cost assuming large-scale production.
Item 5: Balance of System
Scope
x All CAPEX items, beyond the PelaStar and turbine, required to complete the construction of the wind plant.
x Port facilities and staging equipment. x Required port capital improvements (none are required for PelaStar). x Array cables. x Other costs, such as permits and engineering. x Overall project contingency. x Excludes offshore sub-station and excludes export cable from offshore sub-station to
onshore sub-station. The OFTO transmission fees are included in the OPEX. See Part 2. Assumptions
x Balance-of-system costs are comparable to UK Round 3 bottom-fixed projects. x Decommissioning is cost-neutral, since:
1. The scrap value of steel inherent in the floating platforms is greater than the cost of removing and disassembling the floating wind turbines.
2. The equipment required to remove the floating turbines (i.e., the PelaStar Installation Barge) is owned by the wind plant. Therefore, the cost of removing the floating turbines is limited to the marginal costs of performing the operation, which are essentially fuel and crew costs.

PelaStar Cost of Energy - Part 1: CAPEX
ETI Floating Platform FEED Study Glosten Rev 01 25 21 January 2014
3. Anchor designs have the head of the anchor at the top of the seabed, hence they remain in the seabed and are not removed.
Basis of Estimate
x Previous work executed by The Glosten Associates under contract with the US Department of Energy where balance-of-system costs were adapted from known and projected UK Round 3 developments to a PelaStar floating wind plant. Most of the balance-of-system cost estimating was, in turn, supported by BVG Associates on that DOE contract.
3.3 Findings The wind farm capital cost (CAPEX) is presented in detail for the baseline site conditions for commercially exploitable UK waters, and in summary form for the complete matrix of analysis cases. The CAPEX drivers are also summarized.
3.3.1 CAPEX for Baseline Design Table 18 lists a breakdown of the total system CAPEX per turbine for the Baseline design. The total installed cost of the Baseline wind farm is £2534/kW (€2984/kW or $3947/kW). Table 18 PelaStar CAPEX per turbine, baseline design (gray items are generic costs and not specific to the
PelaStar foundation)
Item No. Description
Pounds Sterling Euros US Dollars
1 Hull Fabrication and Delivery
£4,037,000 € 4,754,000 $6,289,000
1.1 Primary Steel Fabrication £1,639,000 € 1,930,000 $2,553,000
1.2 Secondary Steel Fabrication
£187,000 € 220,000 $291,000
1.3 Mechanical Outfitting £893,000 € 1,051,000 $1,391,000 1.4 Platform Paint £321,000 € 378,000 $500,000
1.5 Cathodic Protection £17,000 € 20,000 $27,000 1.6 Transport £351,000 € 413,000 $546,000
1.7 Engineering & Management
£245,000 € 288,000 $381,000
1.8 PelaStar Profit £385,000 € 454,000 $600,000 2 Anchor and Tendon System £2,400,000 € 2,827,000 $3,740,000
2.1 Synthetic Fiber Tendons £205,000 € 242,000 $320,000 2.2 Connectors £321,000 € 378,000 $500,000 2.3 Anchors £802,000 € 944,000 $1,249,000 2.4 Anchor Installation £1,072,000 € 1,263,000 $1,671,000
3 Installation £582,000 € 685,000 $906,000 4 Turbine and Tower £6,793,000 € 8,000,000 $10,584,000

PelaStar Cost of Energy - Part 1: CAPEX
ETI Floating Platform FEED Study Glosten Rev 01 26 21 January 2014
Item No. Description
Pounds Sterling Euros US Dollars
5 Balance-of-System £1,391,000 € 1,637,000 $2,166,000
5.1 Port and Staging Equipment
£67,000 € 79,000 $104,000
5.2 Port Improvements £ 0 € 0 $0
5.3 Substation (Offshore), Installed
£ 0 € 0 $0
5.4 Electrical Array Cables, Installed
£871,000 € 1,025,000 $1,357,000
5.5 Electrical Transmission Cable, Installed
£ 0 € 0 $0
5.6 Permits, Engineering, Site Assessment, Proj. Mgmt., Consulting & Bank Fees
£453,000 € 533,000 $705,000
5.7 Overall Project Contingencies
£ 0 € 0 $0
3.3.2 CAPEX Estimates for Complete Matrix of Cases This section presents the PelaStar CAPEX and the total wind farm CAPEX for each set of site conditions in the Matrix of Analysis Cases. The turbine cost and balance-of-system costs are held constant for every case. The installation cost is constant with the exception of Cases 16 and 17, where the distance from port is varied. Figure 5 shows the breakdown of capital costs for the complete matrix of analysis cases. The total system CAPEX shows little variation across the range of site conditions. The Baseline CAPEX is £2534/kW. Cases 3, 21 and 22 (bedrock seabed) are outliers at £2789/kW to £2798/kW, or 10% higher than the baseline case. The remaining cases fall within -0% and +3% of the Baseline CAPEX2. This is an important finding, as it indicates that PelaStar can be broadly applied to UK waters at a consistent cost.
2 Case 23 and 24 are sensitivity case modeling wave heights outside the range of expected conditions in commercially exploitable UK waters, and are therefore not included in the stated CAPEX range.

PelaStar Cost of Energy - Part 1: CAPEX
ETI Floating Platform FEED Study Glosten Rev 01 27 21 January 2014
Figure 5 CAPEX breakdown for Matrix Analysis Cases
£0
£2,000,000
£4,000,000
£6,000,000
£8,000,000
£10,000,000
£12,000,000
£14,000,000
£16,000,000
£18,000,000
1 2 3 4 5 6 7 8 9 10 11 12 13 14 15 16 17 18 19 20 21 22 23 24
Cap
ital Cost
Analysis Case No.
Capital Cost for Matrix of Analysis Cases
Anchors andTendonsHull
Installation
Balance ofSystemTurbine

PelaStar Cost of Energy - Part 1: CAPEX
ETI Floating Platform FEED Study Glosten Rev 01 28 21 January 2014
3.3.3 Hull CAPEX Primary Drivers One of the strongest drivers for PelaStar CAPEX is the extreme wave height. Analysis Cases 11, 12, and 13 isolate extreme wave height. There is a consistent trend showing an increase in CAPEX with increasing extreme wave height. The total range of extreme wave heights changes the system CAPEX by up to 5.3% from the Baseline CAPEX. Another primary driver for PelaStar CAPEX is the water depth. Analysis Cases 7, 8, 9, and 10 isolate water depth. The CAPEX data indicates that the optimal water depth is between 75 m and 100 m. The system cost increases in shallower sites due to the dynamic response of the floating system to wave loads, and increases in deeper waters due to increasing tendon material cost. This is an important finding in light of the fact that the average water depth for commercially exploitable UK waters is 75 m, which corresponds to the optimal water depth for the PelaStar system. Certain combination of shallow water depth and high wave heights are strong drivers for PelaStar CAPEX. Analysis Cases 19 shows that low wave heights at deep water sites yield a low CAPEX, while Analysis Case 20 shows that high wave heights at shallow sites yield high CAPEX. This trend echoes the known limitations of tension-leg platforms in general. The specific data in these analysis cases help to define the “feasibility frontier” for the PelaStar system as applied to commercially exploitable UK waters. The data also illustrate the increased cost associated with approaching the feasibility frontier.
3.3.4 Anchor and Tendon CAPEX Drivers For the baseline case, anchor fabrication accounts for 52% of the anchor and tendon system cost. Anchor installation is 33% and tendons, including connectors, accounts for the remaining 15%. For bedrock conditions, the total CAPEX is 10% higher than the Baseline case.
3.3.5 Installation CAPEX Drivers Installation cost is driven by the cost of the PelaStar Support Barge (PSB), which is assumed to be amortized during the construction phase of the first utility-scale (500 MW) wind farm. Secondary drivers are the distance from staging port and the weather availability window for offshore operations, especially the stationary work at the final installation site, e.g., connecting the tendons and power cable.
3.3.6 Turbine CAPEX Drivers The turbine CAPEX is driven by market conditions and the ability to realize cost reductions through high volumes of manufacturing.
3.3.7 Balance of System CAPEX Drivers The balance of system CAPEX is driven by the installed cost of array cables, which account for more than half of the balance of system cost. Decommissioning is also a cost driven for PelaStar. At present decommissioning is modeled as a cost-neutral activity, whereas bottom-fixed wind farms carry substantial decommissioning costs as CAPEX in the project finance model. PelaStar decommissioning is cost-neutral because the PSB is owned by the wind farm and the cost of operating the PSB is far less than the scrap value of the platform steel.

PelaStar Cost of Energy - Part 1: CAPEX
ETI Floating Platform FEED Study Glosten Rev 01 29 21 January 2014
4. Projected Future Capital Costs
4.1 Learning Rates The cumulative average learning method is applied. This theory states that as the cumulative quantity of units produced doubles, the average cost of all units produced to date is decreased by a constant percentage. Nascent technologies tend to see relatively high learning rates; i.e., larger reductions in cost over time. A high learning rate reflects significant head room for innovation. Conversely, mature technologies tend to see lower learning rates, which have less head room for innovation. In the present analysis, the technological maturity of each major CAPEX item is categorized as “mature,” “emerging,” or “nascent.” Mature technologies are assigned a 5% learning curve, meaning that the average cost per unit is reduced by 5% each time the cumulative number of units produced or installed doubles. Similarly, the emerging technologies are assigned a 10% learning rate, and nascent technologies a 15% to 20% learning rate. Table 19 details the assumed learning curves for major CAPEX items.
Table 19 Learning curve assumptions
Item No. Description Technological
Maturity
Learning Rate
2020-2050 Notes 1 Hull Fabrication and
Delivery Emerging 10% New opportunities to exploit
serial production. 2 Anchor and Tendon
System
2.1 Synthetic Fiber Tendons
Nascent 20% First time using synthetic fibers in a tension-leg platform (TLP). First time using endless winding cable as TLP tendon.
2.2 Connectors Emerging 10% New opportunities to exploit serial production.
2.3 Anchors Emerging 10% Opportunities for new fabrication techniques.
2.4 Anchor Installation
Nascent 15% New opportunities to develop tooling and installation methods.
3 Installation Nascent 15% First time installing fully assembled TLP.
4 Turbine (2020 – 2029) Mature 5% Substantial learning achieved prior to 2020.
4 Turbine (2030 – 2050) Emerging 10% Introduction of new generator and blade technologies.
5 Balance of System Mature 5% Substantial learning achieved prior to 2020.
The cumulative average learning theory is modeled by the following equation: )1( bANY �� ;
Where Y is the average cost of N units, A is the cost of one unit, and b is the learning rate

PelaStar Cost of Energy - Part 1: CAPEX
ETI Floating Platform FEED Study Glosten Rev 01 30 21 January 2014
4.2 Technology Deployment Rates Technology deployment rates are forecast to provide a basis for applying learning curves. The planned deployment of PelaStar is modeled as follows:
x 2017 1 Foundation (6 MW). Demonstrator. x 2018-2020 25 Foundations (150 MW). Pilot-Scale projects. x 2021 50 Foundations (300 MW). First utility-scale wind farm. x 2021 – 2029 100 Foundations (600 MW) per year. x 2030 – 2039 100 Foundations /year (1000 MW), increasing to 200/year (2000 MW). x 2040 – 2050 200 Foundations (2000 MW) per year.
Figure 6 illustrates the applied learning curves on a component-by-component basis. A unit cost of 1.0 represents the unit cost for the first commercial-scale floating wind plant in 2020. Future unit costs follow the learning curves and are normalized by the 2020 commercial-scale unit cost. The turbine learning curve “resets” in 2030 when 10MW turbines are first used in a commercial-scale wind plant. For simplicity and conservatism, all components (including the wind turbines) follow the PelaStar deployment schedule and ignore identical or similar units deployed to other non-PelaStar wind plants. The applied learning curves account for components with 5-to-1 or 10-to-1 deployment ratios; e.g., 5 tendons per PelaStar foundation, or 10 connectors per PelaStar foundation. The largest relative gains in unit cost are seen in the tendons and connectors, as there is a combination of high learning and deployment rates.
Figure 6 Learning rates, normalized by unit cost of first commercial-scale PelaStar floating wind plant in
2020
4.3 Future Technologies: The 10MW Turbine In combination with learning curves, one step change in technology is modeled. Starting in 2030, it is assumed that 10 MW turbines will replace 6 MW turbines as standard equipment. For
0.0
0.1
0.2
0.3
0.4
0.5
0.6
0.7
0.8
0.9
1.0
2020 2025 2030 2035 2040 2045 2050
Unit Cost in Constant Currency[Fraction of First Commercial‐Scale
Wind Plant Unit Cost]
Year of Financial Investment Decision
PelaStarTM Learning Curves for Major CAPEX Items
Turbine 2020‐2029Turbine 2030‐2050Hull, Anchors, and Balance‐of‐PlantTendon ConnectorsSynthetic Fiber Tendons
(25) (2500)(1000)
(cumulative units installed at time of FID)
(4500)

PelaStar Cost of Energy - Part 1: CAPEX
ETI Floating Platform FEED Study Glosten Rev 01 31 21 January 2014
this analysis, the ASMC Windtec Sea Titan 10 MW turbine physical properties are used to develop optimized PelaStar designs. Table 20 lists a breakdown of the total system CAPEX per turbine for the 10MW wind turbine and baseline site conditions. The total installed cost of the wind farm works out to £2208/kW (€2576/kW or $3354/kW). Table 20 PelaStar CAPEX per turbine, baseline design
Item No. Description Pounds Sterling Euros US Dollars 1 Hull Fabrication and Delivery £5,892,000 € 6,938,000 $9,180,000
1.1 Primary Steel Fabrication £2,920,000 € 3,438,000 $4,549,000 1.2 Secondary Steel Fabrication £189,000 € 222,000 $294,000 1.3 Mechanical Outfitting £893,000 € 1,051,000 $1,391,000 1.4 Cathodic Protection £513,000 € 605,000 $800,000 1.5 Platform Paint £22,000 € 26,000 $35,000 1.6 Transport £351,000 € 413,000 $546,000 1.7 Engineering & Management £363,000 € 427,000 $565,000 1.8 PelaStar Profit £642,000 € 756,000 $1,000,000
2 Anchor and Tendon System £2,999,000 € 3,532,000 $4,672,000 2.1 Synthetic Fiber Tendons £369,000 € 435,000 $575,000 2.2 Connectors £293,000 € 345,000 $456,000 2.3 Anchors £1,187,000 € 1,397,000 $1,849,000 2.4 Anchor Installation £1,150,000 € 1,355,000 $1,792,000
3 Installation £582,000 € 685,000 $906,000 4 Turbine £10,207,000 € 12,021,000 $15,903,000 5 Balance of System £1,867,000 € 2,199,000 $2,909,000
4.4 CAPEX Forecast for 2020 through 2050 Forecasts are made for PelaStar floating wind plants with financial investment decision in 2030, 2040, and 2050. The learning rates and new technologies described in Section 3.2 are considered in the forecast. In this model, next-generation 10 MW wind turbines are deployed in 2030, just as the learning curve for 6 MW turbines is reaching a plateau. From 2020 to 2030 there is a steep learning curve due to the novel balance-of-plant components, specifically the PelaStar hull, tendons, and offshore installation operations. From 2030 to 2050, the majority of learning curve benefit is derived from the wind turbine. Table 21 lists the total system CAPEX in constant 2013 currency for financial investment decisions in 2020, 2025, 2030, 2040, and 2050. Table 21 CAPEX forecast for learning curves and future technologies
FID 2020 FID 2025 FID 2030 FID 2040 FID 2050 Total System CAPEX (2013 currency) £2534/kW £1902/kW £1866/kW £1357/kW £1261/kW
The analysis shows that in real (constant) currency, the wind farm CAPEX is expected to drop by 26% from 2020 to 2030 and by 50% from 2020 to 2050. The following excerpt from a 2012 International Energy Agency (Reference 7) report examining historical learning curves in onshore wind shows that this forecast may be conservative:

PelaStar Cost of Energy - Part 1: CAPEX
ETI Floating Platform FEED Study Glosten Rev 01 32 21 January 2014
From the 1980s to the early 2000s, average capital costs for wind energy projects declined markedly. In the United States, capital costs achieved their lowest level from roughly 2001 to 2004, approximately 65% below costs from the early 1980s. In Denmark, capital costs followed a similar trend, achieving their lowest level in 2003, more than 55% below the levels seen in the early 1980s. Over the same time period, global installed wind power capacity grew from a negligible quantity to nearly 40,000 megawatts (MW), with the bulk of this growth (>85%) occurring between 1995 and the early 2000s. The primary markets for wind energy during this time were Europe and the United States.
Figure 7 CAPEX forecast showing impact of learning curves and future technology
.
£0
£500
£1,000
£1,500
£2,000
£2,500
£3,000
2020 2025 2030 2035 2040 2045 2050
Total CAPEX
/KW
(constan
t 2013 cu
rrency)
Year of Financial Investment Decision
PelaStarTM Wind Farm CAPEX Forecast:Impact of Learning Curves and Future Turbine Technology
(25) (4500)(1000)
(cumulative units installed at time of FID)
(2500)
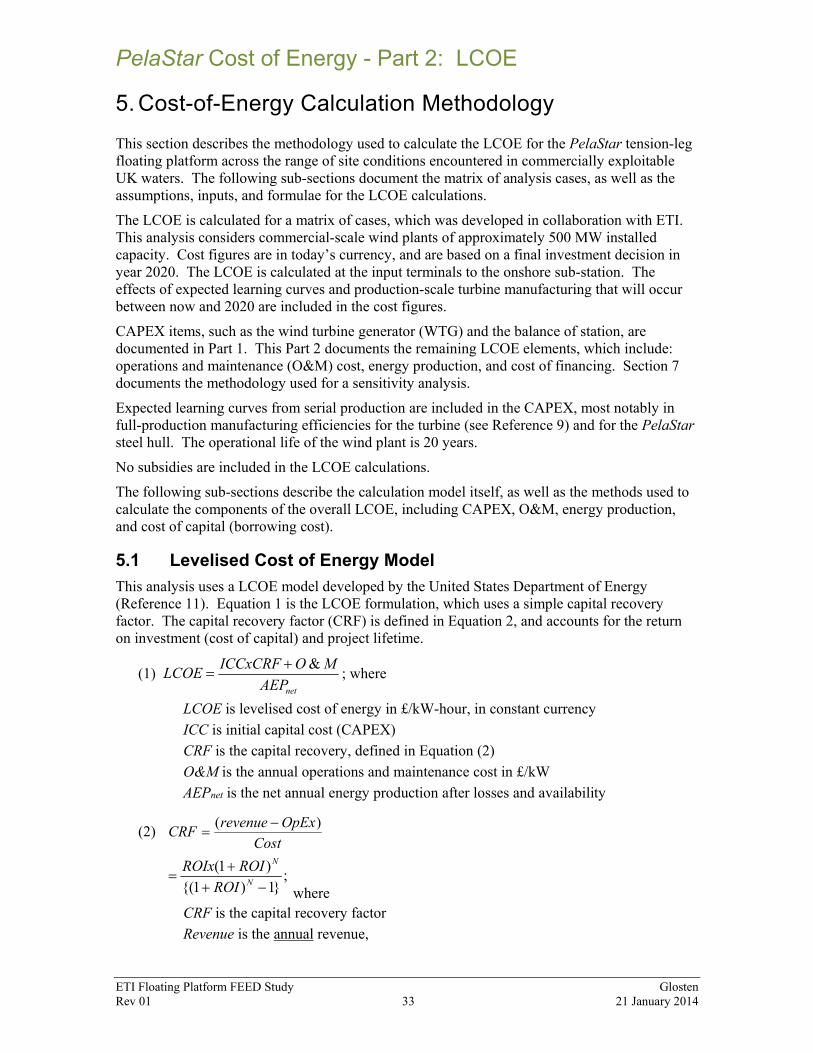
PelaStar Cost of Energy - Part 2: LCOE
ETI Floating Platform FEED Study Glosten Rev 01 33 21 January 2014
5. Cost-of-Energy Calculation Methodology This section describes the methodology used to calculate the LCOE for the PelaStar tension-leg floating platform across the range of site conditions encountered in commercially exploitable UK waters. The following sub-sections document the matrix of analysis cases, as well as the assumptions, inputs, and formulae for the LCOE calculations. The LCOE is calculated for a matrix of cases, which was developed in collaboration with ETI. This analysis considers commercial-scale wind plants of approximately 500 MW installed capacity. Cost figures are in today’s currency, and are based on a final investment decision in year 2020. The LCOE is calculated at the input terminals to the onshore sub-station. The effects of expected learning curves and production-scale turbine manufacturing that will occur between now and 2020 are included in the cost figures. CAPEX items, such as the wind turbine generator (WTG) and the balance of station, are documented in Part 1. This Part 2 documents the remaining LCOE elements, which include: operations and maintenance (O&M) cost, energy production, and cost of financing. Section 7 documents the methodology used for a sensitivity analysis. Expected learning curves from serial production are included in the CAPEX, most notably in full-production manufacturing efficiencies for the turbine (see Reference 9) and for the PelaStar steel hull. The operational life of the wind plant is 20 years. No subsidies are included in the LCOE calculations. The following sub-sections describe the calculation model itself, as well as the methods used to calculate the components of the overall LCOE, including CAPEX, O&M, energy production, and cost of capital (borrowing cost).
5.1 Levelised Cost of Energy Model This analysis uses a LCOE model developed by the United States Department of Energy (Reference 11). Equation 1 is the LCOE formulation, which uses a simple capital recovery factor. The capital recovery factor (CRF) is defined in Equation 2, and accounts for the return on investment (cost of capital) and project lifetime.
(1) netAEP
MOICCxCRFLCOE &� ; where
LCOE is levelised cost of energy in £/kW-hour, in constant currency ICC is initial capital cost (CAPEX) CRF is the capital recovery, defined in Equation (2) O&M is the annual operations and maintenance cost in £/kW AEPnet is the net annual energy production after losses and availability
(2) Cost
OpExrevenueCRF )( �
;}1)1{(
)1(��
� N
N
ROIROIROIx
where CRF is the capital recovery factor Revenue is the annual revenue,

PelaStar Cost of Energy - Part 2: LCOE
ETI Floating Platform FEED Study Glosten Rev 01 34 21 January 2014
OpEx is the annual operating expense, Cost is the total invested cost, ROI is the average annual return on investment (%), before tax N is the project life in years
Table 22 summarizes the Initial Capital Cost (ICC), or CAPEX, from Part 1. The following exchange rates are used throughout this analysis:
x €1.000 = $1.323. Average spot exchange rate for 2013 (Bank of England) x £1.000 = $1.558. Average spot exchange rate for 2013 (Bank of England)
Table 22 PelaStar capital cost for baseline analysis case
Description Pounds Sterling Euros US Dollars
Hull Fabrication and Delivery £4,037,000 € 4,754,000 $6,289,000
Anchor and Tendon System £2,400,000 € 2,827,000 $3,740,000
Installation £582,000 € 685,000 $906,000
Turbine £6,793,000 € 8,000,000 $10,584,000
Balance of System £1,391,000 € 1,637,000 $2,166,000
It is noteworthy that the foundation cost (hull fabrication and delivery) is higher than projected costs for bottom-fixed structures in UK Round 3 zones, and that installation cost is lower than projected costs for bottom-fixed systems. The PelaStar foundation cost is higher due to the need for high-vertical-load anchors. The PelaStar installation cost is lower due to the use of an innovative, shore-based turbine assembly and commissioning plan.
5.2 Operations and Maintenance Cost O&M costs comprise the recurring costs upon construction and commissioning of the wind plant. There are four categories of O&M costs, which are described in this section:
1. Plant operations. 2. Scheduled turbine maintenance. 3. Un-scheduled turbine maintenance. 4. Equipment and foundation maintenance.
Previous work completed by Glosten under contract to the United States Department of Energy (Reference 5) provides parametric costs for Items 1 and 3. These costs were developed by BVG Associates, based on BVG’s concurrent work (at the time) on the Crown Estate Technology Pathways project.
5.2.1 Bottom Lease The bottom lease is expected to be 2% of project revenue. This LCOE model treats the bottom lease as a fee against revenue rather than a cost; therefore, the bottom lease is not included in the LCOE.

PelaStar Cost of Energy - Part 2: LCOE
ETI Floating Platform FEED Study Glosten Rev 01 35 21 January 2014
5.2.2 Plant Operations Plant operation is a fixed annual cost, based on BVG Associates’ proprietary database of offshore wind plant cost data. This is the category in which taxes and insurance are included.
5.2.3 Scheduled and Un-Scheduled Turbine Maintenance Turbine maintenance cost is a fixed annual cost, for a given distance from port. The annual cost includes scheduled and un-scheduled maintenance for three distances from port: 40 km, 70 km, and 130 km. The cost estimate models the use of the PelaStar™ Support Barge (PSB) for major maintenance activities. This is in contrast to a conventional offshore wind farm that would use a jack up vessel for major maintenance activities. Scheduled and un-scheduled maintenance costs are quoted in 2013 constant currency, based on a 500-MW offshore wind farm centered at the noted distances from port. No learning curve benefits for years 2014 through 2020 are included in this estimate. Table 23 lists the total scheduled and unscheduled turbine maintenance cost for three distances from port: Table 23 Annual turbine maintenance cost, per MW installed capacity
40 km 70 km
(Baseline) 130 km
Annual Turbine Maintenance (Scheduled and Un-Scheduled)
£37,000 / MW £48,500 / MW £50,500 / MW
5.2.4 Equipment and Foundations Maintenance Equipment and foundations maintenance is a fixed annual cost based on BVG Associates’ proprietary database of offshore wind plant cost data. Regularly occurring structural inspections are included in this category. The PelaStar hull is expected to have a similar level of inspection effort required as a bottom-fixed foundation, namely a regularly scheduled, remotely-operated vehicle (ROV) based visual inspection in-situ. It is not anticipated that the PelaStar hull will be removed from service for repairs or maintenance during its 20-year service life.
5.2.5 Transmission Fee In lieu of including the cost of the offshore sub-station and export cable to shore, this analysis accounts for these costs with a transmission fee. This approach is consistent with a typical offshore wind farm financial model, where the Offshore Transmission Network Owner (OFTO) owns the offshore-substation and export cable and charges an interconnection fee for use of that infrastructure. Transmission fees were provided by BVG Associates for three distances to shore. The fees are listed in the Table 24. Table 24 Annual electrical transmission fees, per MW installed capacity
40 km 70 km
(Baseline) 130 km
Annual Transmission Fee £69,000 / MW £92,000 / MW £137,000 / MW
5.2.6 Operation and Maintenance Cost Summary per Turbine Table 25 presents a summary of operation and maintenance costs used in this study per a 6 MW turbine in a 500 MW wind farm.

PelaStar Cost of Energy - Part 2: LCOE
ETI Floating Platform FEED Study Glosten Rev 01 36 21 January 2014
Table 25 Annual operation and maintenance costs, per turbine
Description Pounds Sterling Euros US Dollars Annual O&M Costs £1,020,700 € 1,201,900 $1,590,100
Bottom Lease £51,600 € 60,800 $80,400 Plant Operations £54,200 € 63,800 $84,400 Turbine Maintenance £291,100 € 342,800 $453,500 Equipment and Foundations Maintenance £71,800 € 84,500 $111,800 Transmission Fee £552,000 € 650,000 $860,000
5.3 Annual Energy Production Gross annual energy production is calculated using a generic power curve for a 6 MW Offshore Wind Turbine, which is presented in Reference 18 (proprietary information). This power curve represents the most probable power output at each given wind speed, which is often known as a “P50” curve. The wind speed distribution follows a Weibull fit with a k-factor of 2.0. The net annual energy production AEPnet assumes 8,760 operating hours per year, and factors in the availability factor and losses listed in Table 26. Table 26 Availability and losses for annual energy production calculation
Description Factor Turbine and Grid Availability 0.940 Total Losses 0.869
Wakes and large-array effects 0.896 Electrical losses 0.985 High wind hysteresis 1.000 Degradation of power curve 0.990
Three average wind speeds are studied in this analysis: 9.7 m/s, 10.5 m/s, and 11.4 m/s. The gross and net annual energy production figures for each of these wind speeds are listed in Table 27. Table 27 Annual energy production
Average Wind Speed at Hub Height
Gross Annual Energy
Production
Net Annual Energy
Production Capacity Factor
9.7 m/s 29,321 MWh 23,460 MWh 45.59%
10.5 m/s 31,454 MWh 25,705 MWh 48.91%
11.4 m/s 33,267 MWh 27,186 MWh 51.72%
5.4 Cost of Financing The borrowing costs, or cost of capital, has a strong influence on the levelised cost of energy. For the present analysis, it was decided to use a financial model with 10.0% discount rate, which is also known as a weighted-average capital cost or a capital recovery factor. This cost of capital reflects what is projected to be a realistic borrowing cost for UK offshore wind projects using proven technology, with the final investment decision in year 2020.
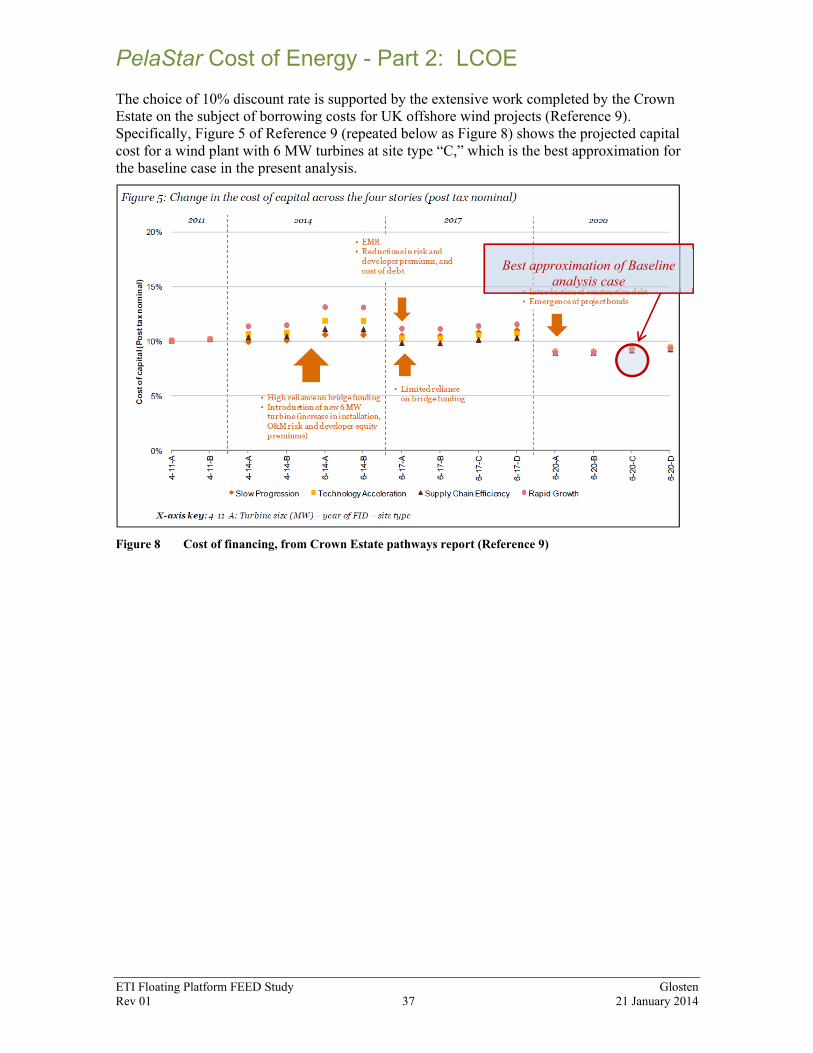
PelaStar Cost of Energy - Part 2: LCOE
ETI Floating Platform FEED Study Glosten Rev 01 37 21 January 2014
The choice of 10% discount rate is supported by the extensive work completed by the Crown Estate on the subject of borrowing costs for UK offshore wind projects (Reference 9). Specifically, Figure 5 of Reference 9 (repeated below as Figure 8) shows the projected capital cost for a wind plant with 6 MW turbines at site type “C,” which is the best approximation for the baseline case in the present analysis.
Figure 8 Cost of financing, from Crown Estate pathways report (Reference 9)
Best approximation of Baseline analysis case
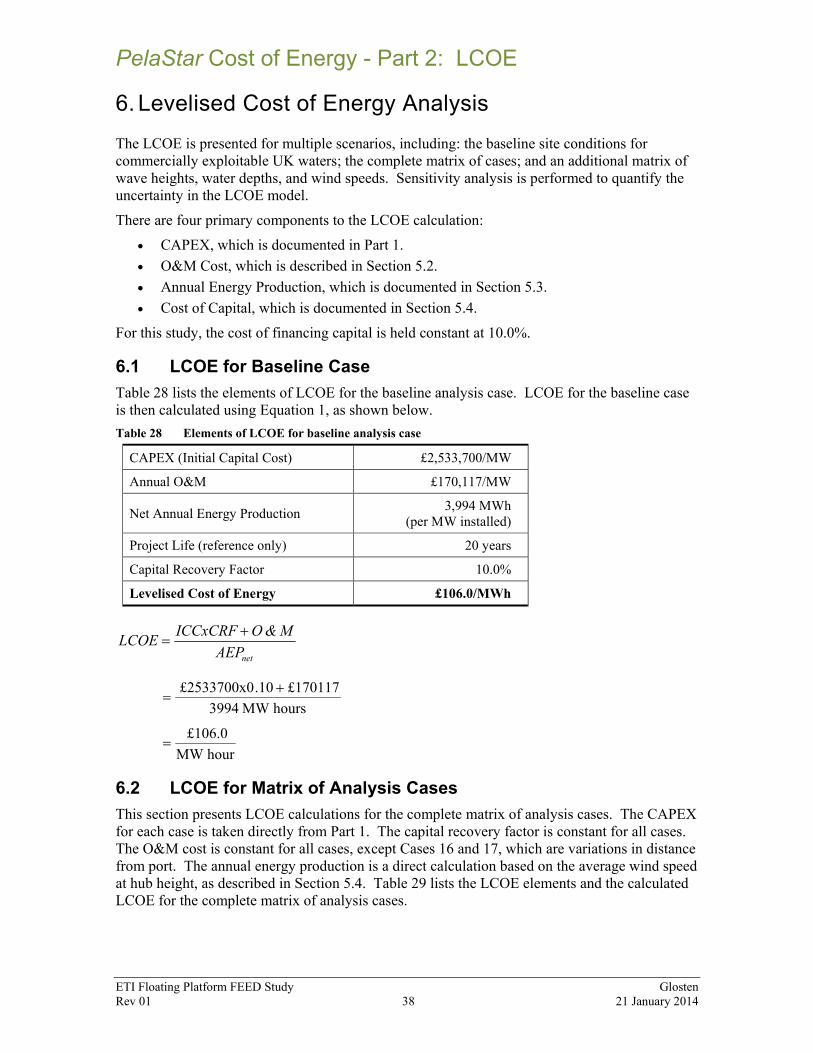
PelaStar Cost of Energy - Part 2: LCOE
ETI Floating Platform FEED Study Glosten Rev 01 38 21 January 2014
6. Levelised Cost of Energy Analysis The LCOE is presented for multiple scenarios, including: the baseline site conditions for commercially exploitable UK waters; the complete matrix of cases; and an additional matrix of wave heights, water depths, and wind speeds. Sensitivity analysis is performed to quantify the uncertainty in the LCOE model. There are four primary components to the LCOE calculation:
x CAPEX, which is documented in Part 1. x O&M Cost, which is described in Section 5.2. x Annual Energy Production, which is documented in Section 5.3. x Cost of Capital, which is documented in Section 5.4.
For this study, the cost of financing capital is held constant at 10.0%.
6.1 LCOE for Baseline Case Table 28 lists the elements of LCOE for the baseline analysis case. LCOE for the baseline case is then calculated using Equation 1, as shown below. Table 28 Elements of LCOE for baseline analysis case
CAPEX (Initial Capital Cost) £2,533,700/MW
Annual O&M £170,117/MW
Net Annual Energy Production 3,994 MWh (per MW installed)
Project Life (reference only) 20 years
Capital Recovery Factor 10.0%
Levelised Cost of Energy £106.0/MWh
hoursMW 3994£170117 .10£2533700x0 �
hourMW £106.0
6.2 LCOE for Matrix of Analysis Cases This section presents LCOE calculations for the complete matrix of analysis cases. The CAPEX for each case is taken directly from Part 1. The capital recovery factor is constant for all cases. The O&M cost is constant for all cases, except Cases 16 and 17, which are variations in distance from port. The annual energy production is a direct calculation based on the average wind speed at hub height, as described in Section 5.4. Table 29 lists the LCOE elements and the calculated LCOE for the complete matrix of analysis cases.
netAEPM&OICCxCRFLCOE �

PelaStar Cost of Energy - Part 2: LCOE
ETI Floating Platform FEED Study Glosten Rev 01 39 21 January 2014
Table 29 LCOE for complete matrix of analysis cases
Cost Item Case 1 Case 2 Case 3 Case 4 Case 5 Case 6 Case 7 Case 8
Wave Hub Baseline Bedrock Gravelly Sand Wind 10.5m/s Wind 11.4m/sShallowest
Water Depth Deep Round 3 CAPEX / MW £ 2,648,167 £ 2,536,167 £ 2,788,500 £ 2,536,167 £ 2,537,333 £ 2,538,000 £ 2,548,500 £ 2,548,500 Annual O&M / MW £ 170,117 £ 170,117 £ 170,117 £ 170,117 £ 170,117 £ 170,117 £ 170,117 £ 170,117 Capacity Factor 44.64% 45.59% 45.59% 45.59% 48.91% 51.46% 45.59% 45.59%Net Annual Energy Production / MW 3,910 3,994 3,994 3,994 4,284 4,511 3,994 3,994 Capital Recovery Factor (CRF) 10.00% 10.00% 10.00% 10.00% 10.00% 10.00% 10.00% 10.00%Levelized Cost of Energy / MW-hour 111.2£ 106.1£ 112.4£ 106.1£ 98.9£ 94.0£ 106.4£ 106.4£
Cost Item Case 9 Case 10 Case 11 Case 12 Case 13 Case 14 Case 15 Case 16100m Depth 130m Depth Hs 7m Hs 10.3 Hs 12.0 Low Tide High Tide Distance 40km
CAPEX / MW £ 2,542,333 £ 2,570,667 £ 2,528,500 £ 2,556,500 £ 2,597,167 £ 2,535,667 £ 2,554,833 £ 2,532,500 Annual O&M / MW £ 170,117 £ 170,117 £ 170,117 £ 170,117 £ 170,117 £ 170,117 £ 170,117 £ 135,550 Capacity Factor 45.59% 45.59% 45.59% 45.59% 45.59% 45.59% 45.59% 45.59%Net Annual Energy Production / MW 3,994 3,994 3,994 3,994 3,994 3,994 3,994 3,994 Capital Recovery Factor (CRF) 10.00% 10.00% 10.00% 10.00% 10.00% 10.00% 10.00% 10.00%Levelized Cost of Energy / MW-hour 106.3£ 107.0£ 105.9£ 106.6£ 107.6£ 106.1£ 106.6£ 97.4£
Cost Item Case 17 Case 18 Case 19 Case 20 Case 21 Case 22 Case 23 Case 24
Distance 130km
Wind 11.4; Hs 12m
Hs 7m; Depth 130m
Hs 12m; Shallowest
DepthBedrock; Deep
Round 3Bedrock; 100m
Depth Hs 14m Hs 16mCAPEX / MW £ 2,599,667 £ 2,605,333 £ 2,556,667 £ 2,573,667 £ 2,795,000 £ 2,797,500 £ 2,625,167 £ 2,670,500 Annual O&M / MW £ 217,150 £ 170,117 £ 170,117 £ 170,117 £ 170,117 £ 170,117 £ 170,117 £ 170,117 Capacity Factor 45.59% 45.59% 45.59% 45.59% 45.59% 45.59% 45.59% 45.59%Net Annual Energy Production / MW 3,994 3,994 3,994 3,994 3,994 3,994 3,994 3,994 Capital Recovery Factor (CRF) 10.00% 10.00% 10.00% 10.00% 10.00% 10.00% 10.00% 10.00%Levelized Cost of Energy / MW-hour 119.5£ 107.8£ 106.6£ 107.0£ 112.6£ 112.6£ 108.3£ 109.5£
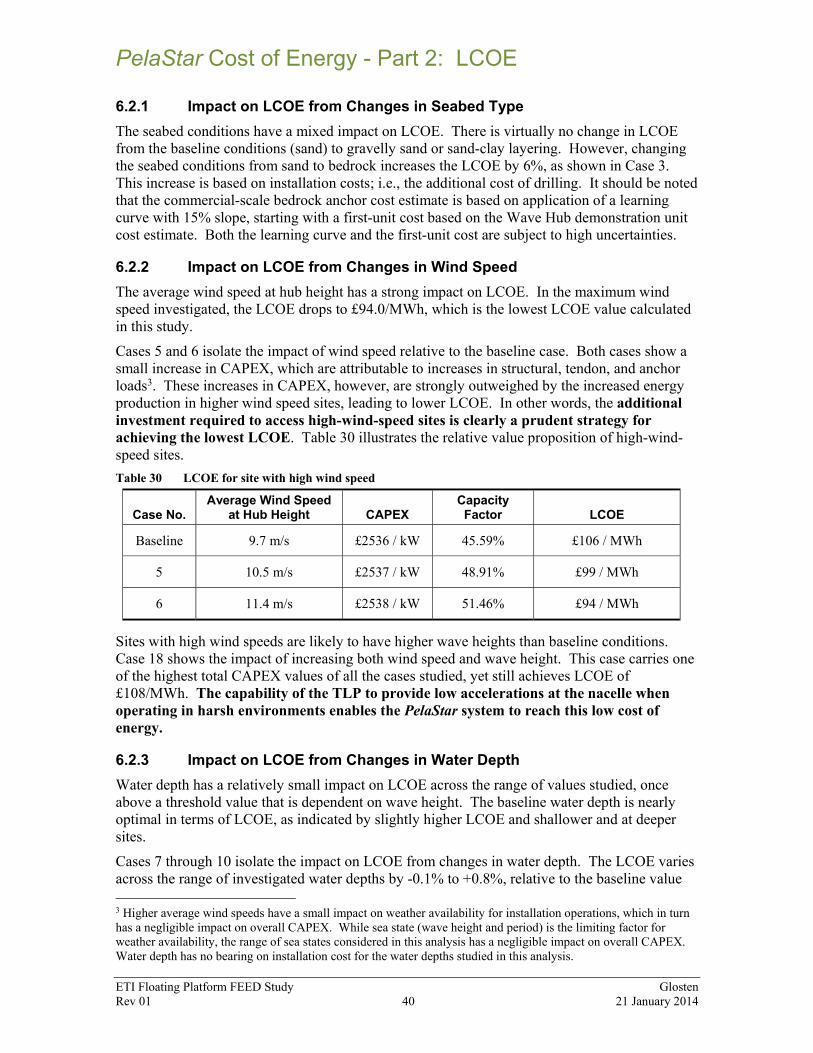
PelaStar Cost of Energy - Part 2: LCOE
ETI Floating Platform FEED Study Glosten Rev 01 40 21 January 2014
6.2.1 Impact on LCOE from Changes in Seabed Type The seabed conditions have a mixed impact on LCOE. There is virtually no change in LCOE from the baseline conditions (sand) to gravelly sand or sand-clay layering. However, changing the seabed conditions from sand to bedrock increases the LCOE by 6%, as shown in Case 3. This increase is based on installation costs; i.e., the additional cost of drilling. It should be noted that the commercial-scale bedrock anchor cost estimate is based on application of a learning curve with 15% slope, starting with a first-unit cost based on the Wave Hub demonstration unit cost estimate. Both the learning curve and the first-unit cost are subject to high uncertainties.
6.2.2 Impact on LCOE from Changes in Wind Speed The average wind speed at hub height has a strong impact on LCOE. In the maximum wind speed investigated, the LCOE drops to £94.0/MWh, which is the lowest LCOE value calculated in this study. Cases 5 and 6 isolate the impact of wind speed relative to the baseline case. Both cases show a small increase in CAPEX, which are attributable to increases in structural, tendon, and anchor loads3. These increases in CAPEX, however, are strongly outweighed by the increased energy production in higher wind speed sites, leading to lower LCOE. In other words, the additional investment required to access high-wind-speed sites is clearly a prudent strategy for achieving the lowest LCOE. Table 30 illustrates the relative value proposition of high-wind-speed sites. Table 30 LCOE for site with high wind speed
Case No. Average Wind Speed
at Hub Height CAPEX Capacity Factor LCOE
Baseline 9.7 m/s £2536 / kW 45.59% £106 / MWh
5 10.5 m/s £2537 / kW 48.91% £99 / MWh
6 11.4 m/s £2538 / kW 51.46% £94 / MWh
Sites with high wind speeds are likely to have higher wave heights than baseline conditions. Case 18 shows the impact of increasing both wind speed and wave height. This case carries one of the highest total CAPEX values of all the cases studied, yet still achieves LCOE of £108/MWh. The capability of the TLP to provide low accelerations at the nacelle when operating in harsh environments enables the PelaStar system to reach this low cost of energy.
6.2.3 Impact on LCOE from Changes in Water Depth Water depth has a relatively small impact on LCOE across the range of values studied, once above a threshold value that is dependent on wave height. The baseline water depth is nearly optimal in terms of LCOE, as indicated by slightly higher LCOE and shallower and at deeper sites. Cases 7 through 10 isolate the impact on LCOE from changes in water depth. The LCOE varies across the range of investigated water depths by -0.1% to +0.8%, relative to the baseline value 3 Higher average wind speeds have a small impact on weather availability for installation operations, which in turn has a negligible impact on overall CAPEX. While sea state (wave height and period) is the limiting factor for weather availability, the range of sea states considered in this analysis has a negligible impact on overall CAPEX. Water depth has no bearing on installation cost for the water depths studied in this analysis.

PelaStar Cost of Energy - Part 2: LCOE
ETI Floating Platform FEED Study Glosten Rev 01 41 21 January 2014
£106/MWh. This finding demonstrates that the PelaStar system enables consistent and attractive LCOE across the range of water depths encountered in commercially exploitable UK waters.
6.2.4 Impact on LCOE from Changes in Wave Height Extreme wave height4 has a measurable impact on LCOE. Higher wave heights, compared to the baseline conditions, lead to higher LCOE due to increased platform, tendon, and anchor cost. Likewise, lower wave heights lead to lower LCOE. It is recognized that maintenance access has a significant impact on turbine availability and hence on LCOE. Access, of course, is largely dependent on wave height. For the purposes of this study, availability is held constant with wave height (Table 26). It is assumed that recent developments in turbine access systems will work to reduce this dependence in the timeframe associated with these data (2020 and beyond). Cases 11 through 13 isolate the impact of extreme wave height on LCOE. For the range of extreme wave heights studied (7 m to 12 m), the LCOE varies by -0.2% to 1.4% relative to the baseline LCOE of £106/MWh. This finding shows that the PelaStar system enables LCOE between £106/MWh and £108/MWh across the full range of wave conditions expected in commercially exploitable UK waters.
6.2.5 Impact on LCOE from Changes in Tide Range The tide range has a nearly negligible impact on LCOE across the range of conditions studied (minimum and maximum tide range of 2 m and 8 m, respectively). Higher tide ranges increase the platform cost, as a longer central column is required to achieve the required blade tip clearance to sea level. Cases 14 and 15 isolate the impact of tide range on LCOE. Case 14 (low tide range) has the same LCOE as the baseline case. Case 15 (high tide range) has LCOE of £106.6-hour, a mere £0.6/MWh (0.5%) above the baseline LCOE.
6.2.6 Impact on LCOE from Changes in Distance from Port Case 16 and 17 isolate the impact on LCOE from transmission fees and turbine maintenance costs that vary with distance from shore. Case 16 (shorter distance from shore, 40 km) has a LCOE that is £8/MWh lower than the baseline case. Case 17 (longer distance from shore, 130km) has a LCOE £13/MWh higher than the baseline case. Distance to port and distance from shore are assumed to be the same in this analysis.
6.2.7 Impact on LCOE from Changes in Multiple Parameters Combinations of extreme wave height, water depth, and average wind speed at hub height are studied in Cases 18, 19, and 20. Case 18 is an extreme “upper bound” case in that the highest waves and highest wind speed are simultaneously modeled. Case 19 is a “lower bound” case from a system dynamics perspective, with the lowest wave height and deepest water depth concurrently modeled. Conversely, Case 20 is an “upper bound” case from a system dynamics perspective, modeling the minimum possible water depth with the highest waves.
4 Extreme wave height is the significant wave height for a three-hour storm with a 50-year return period.

PelaStar Cost of Energy - Part 2: LCOE
ETI Floating Platform FEED Study Glosten Rev 01 42 21 January 2014
Cases 18, 19, and 20, with LCOE of £108/MWh, £107/MWh, and £107/MWh, respectively, illustrate another important finding: The PelaStar system LCOE shows little variation across the range of conditions encountered in commercially exploitable UK waters.
6.2.8 Harsh Wave Environments The matrix of cases considers extreme wave heights of 7 to 12 m, which is the expected range for commercially exploitable UK waters. If certain grid improvements were implemented, however, then sites with very harsh wave environments (e.g., northwest of Scotland) could be within a reasonable distance of an adequate onshore grid connection. Cases 23 and 24 isolate the impact of 14 and 16 m extreme wave heights, respectively. All other conditions are the same as the baseline case, except water depth. For each of the two wave heights, the minimum technically feasible water depth was determined. These are 90 m and 120 m, respectively. The results of this analysis are summarized in Table 31. The impact on LCOE due to harsh wave environments is expected to be relatively small, especially considering that such sites are likely to have very high wind speeds, which would offset increases in CAPEX relative to the baseline. The impacts on O&M cost from harsh wave environments are a subject of industry-wide study. For Cases 23 and 24, the baseline O&M cost is assumed. Table 31 LCOE for site with harsh wave environments
Case No. Extreme Wave Height CAPEX LCOE
Baseline 8.2 m £2536 / kW £106 / MWh
23 14 m £2625 / kW £108 / MWh
24 16 m £2671 / kW £109 / MWh
6.3 LCOE for 10 MW Turbine LCOE is calculated for a 500 MW PelaStar floating wind plant using AMSC Windtec 10 MW Sea Titan offshore wind turbines. For simplicity, and due to lack of data, the annual O&M cost per megawatt is held constant with the baseline case using 6 MW turbines. Annual energy production is taken from AMSC Windtec’s power curve, which applies the same losses as in the baseline case. The annual energy production scales are nearly linearly with the power rating. The cost of capital is also the same as the baseline case, which is 10.0%. Therefore, gains in LCOE from 10 MW turbines are derived primarily from the CAPEX savings. Table 32 shows that the LCOE breakdown for a 500 MW PelaStar floating wind plant using 10 MW turbines is £97/MWh, which is 8.7% lower than the baseline LCOE. Table 32 Elements of LCOE for 10 MW turbines (Case 25)
CAPEX £2,155,000/MW
Annual O&M £170,117/MW
Net Annual Energy Production 3,994 MWh (per MW installed)
Project Life 20 years
Capital Recovery Factor 10.0%
Levelised Cost of Energy £97.0/MWh

PelaStar Cost of Energy - Part 2: LCOE
ETI Floating Platform FEED Study Glosten Rev 01 43 21 January 2014
7. Sensitivity Analysis This section describes analysis performed to quantify sensitivity to uncertainties in the LCOE model. The analysis methods are presented in Section 7.1, and the findings are presented in Section 7.2. A “tornado diagram” (Figure 9) illustrates the relative impact on LCOE from each of thirty-four input parameters. Uncertainties are categorized as “technology” or “externality,” as indicated in Table 33 and shown graphically in the tornado diagram. The majority of uncertainty in the LCOE model is due to externalities, such as financial market conditions. The top six contributors to uncertainty are all externalities, and collectively account for 65% to 75% of the total uncertainty range. The top two “technology” contributors are wind turbine maintenance cost and wind turbine losses. The largest LCOE sensitivity from the PelaStar technology is due to uncertainty in platform primary steel fabrication cost (£/ton). The overall range of uncertainty, including the combined effects of externalities and technology, is determined for the base line case (Case 2) using the root-sum-squares (RSS) method. The calculated range is £78/MWh to £131/MWh. The baseline LCOE is £106/MWh, which represents a range of -26% below and +24% above the baseline LCOE. This uncertainty range can be applied to each case in the matrix of analysis cases.
7.1 Methodology for Sensitivity Analysis A list of input parameters for the LCOE model is determined by choosing one or more key inputs to each of the items CAPEX work breakdown (Table 22), OpEx work breakdown (Table 25), discount rate, and annual energy production (Table 27). Additionally, since the LCOE model takes inputs in three currencies, exchange rates are included in the sensitivity analysis. For each input parameter, an expected value, high value, and low value are determined. The range between the high and low values represents, nominally, a range of +/- two standard deviations from the expected value. In other words, the selected range represents approximately a 90% confidence level. Clearly there are many input variables for which a probability density function is not available; hence, the notion that the high-low range covers +/- two standard deviations is established primarily to ensure consistency throughout the analysis and to cover a sufficiently broad range of possible scenarios. Table 33 lists the input variables, along with expected value, high/low values, and basis for the range. First, the base line LCOE is calculated using the expected variable for every input. The LCOE is then calculated by changing only one input at a time to determine the direct impact from the isolated variable.
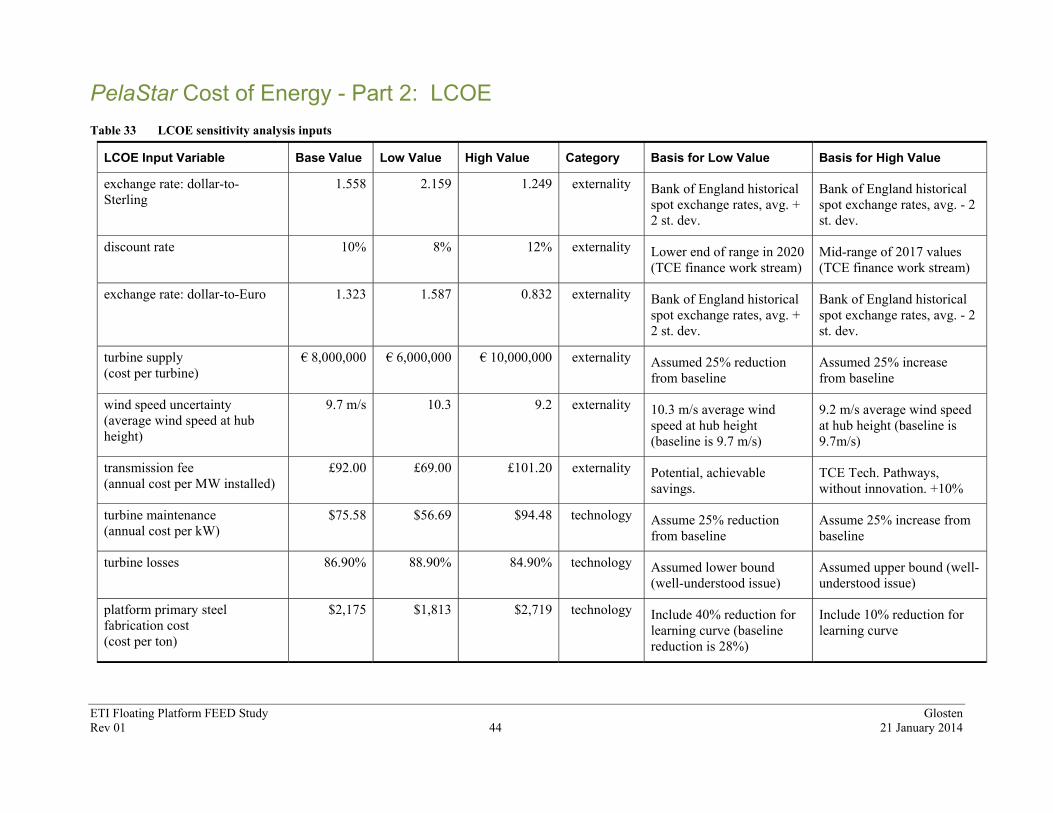
PelaStar Cost of Energy - Part 2: LCOE
ETI Floating Platform FEED Study Glosten Rev 01 44 21 January 2014
Table 33 LCOE sensitivity analysis inputs
LCOE Input Variable Base Value Low Value High Value Category Basis for Low Value Basis for High Value
exchange rate: dollar-to-Sterling
1.558 2.159 1.249 externality Bank of England historical spot exchange rates, avg. + 2 st. dev.
Bank of England historical spot exchange rates, avg. - 2 st. dev.
discount rate 10% 8% 12% externality Lower end of range in 2020 (TCE finance work stream)
Mid-range of 2017 values (TCE finance work stream)
exchange rate: dollar-to-Euro 1.323 1.587 0.832 externality Bank of England historical spot exchange rates, avg. + 2 st. dev.
Bank of England historical spot exchange rates, avg. - 2 st. dev.
turbine supply (cost per turbine)
€ 8,000,000 € 6,000,000 € 10,000,000 externality Assumed 25% reduction from baseline
Assumed 25% increase from baseline
wind speed uncertainty (average wind speed at hub height)
9.7 m/s 10.3 9.2 externality 10.3 m/s average wind speed at hub height (baseline is 9.7 m/s)
9.2 m/s average wind speed at hub height (baseline is 9.7m/s)
transmission fee (annual cost per MW installed)
£92.00 £69.00 £101.20 externality Potential, achievable savings.
TCE Tech. Pathways, without innovation. +10%
turbine maintenance (annual cost per kW)
$75.58 $56.69 $94.48 technology Assume 25% reduction from baseline
Assume 25% increase from baseline
turbine losses 86.90% 88.90% 84.90% technology Assumed lower bound (well-understood issue)
Assumed upper bound (well-understood issue)
platform primary steel fabrication cost (cost per ton)
$2,175 $1,813 $2,719 technology Include 40% reduction for learning curve (baseline reduction is 28%)
Include 10% reduction for learning curve

PelaStar Cost of Energy - Part 2: LCOE
ETI Floating Platform FEED Study Glosten Rev 01 45 21 January 2014
LCOE Input Variable Base Value Low Value High Value Category Basis for Low Value Basis for High Value
turbine availability 94% 96% 92% technology Industry-wide improvements, esp. access
Typical present-day value
platform transport distance (one-way transit)
6800 nm 6800 nm 21400 nm technology Romanian shipyard to UK Korean shipyard to UK
anchor installation: vessel day rate
$200,000 $50,000 $250,000 technology basic jack up barge or multi-purpose PelaStar Barge
Use large jack-up turbine installation vessel
balance of system: decommissioning (cost per unit)
$0 -$472,113 $483,100 technology Net value of hull and turbine steel at $0.20/lb
Installation cost (net of vessel acquisition) + anchor cut off below mudline
platform electrical system (cost per platform)
$1,390,800 $1,043,100 $1,738,500 technology Assume 25% reduction from baseline cost
Assume 25% increase from baseline cost
balance of system: array cables (cost per turbine)
$1,356,700 $1,017,525 $1,695,875 technology Assume 25% reduction from baseline
Assume 25% increase from baseline
PelaStar profit margin (gross profit per platform)
$100,000 $100,000 $200,000 technology Minimum for PelaStar to be viable and provide return to ETI and investors
Maximum achievable in excellent market conditions (20% profit margin on hull)
installation: weather availability (average annual availability)
80% 85% 60% technology Assumed upper bound of weather availability (~2m Hs)
Requires 2nd vessel. Assumed lower bound of weather availability (~1.3m Hs)
anchor installation: weather availability (average annual availability)
80% 85% 60% technology Assumed upper bound of weather availability (~2m Hs)
Assumed lower bound of weather availability (~1.3m Hs)

PelaStar Cost of Energy - Part 2: LCOE
ETI Floating Platform FEED Study Glosten Rev 01 46 21 January 2014
LCOE Input Variable Base Value Low Value High Value Category Basis for Low Value Basis for High Value
anchor installation: productivity (piles installed per day)
1.5 1.75 1.25 technology Assumed upper bound of productivity
Assumed lower bound of productivity
anchor fabrication cost (cost per ton)
$2,175 $1,813 $2,719 technology Include 40% reduction for learning curve (baseline reduction is 28%)
Include 10% reduction for learning curve
equipment and foundation maintenance (annual cost per kW installed)
$18.63 $15.84 $21.42 technology Assume 15% reduction from baseline
Assume 15% increase from baseline
tendon connectors (cost per platform)
$500,000 $300,000 $700,000 technology Better than expected learning curve
Worse than expected learning curve
seabed lease (percent of revenue)
2% 1% 2% externality Round 3 lease rate (TCE expects this to be upper bound)
Approx. average of Round 1 and 2
platform transport day rate (all-in vessel day rate)
$54,000 $40,000 $70,000 technology $30k/day vessel and $500/ton fuel
$50k/day vessel and $1000/ton fuel
balance of system: permits and engineering (cost per unit)
$705,172 $528,879 $881,465 technology Assume 25% reduction from baseline
Assume 25% increase from baseline
platform secondary steel fabrication cost (cost per ton)
$8,511 $6,615 $15,435 technology Assume $3/lb (baseline is $3.86/lb)
Assume $7/lb
anchor steel weight (weight per pile)
100.8 mt 76.6 mt 110.8 mt technology 10% reduction from baseline weight estimate
10% increase from baseline estimate
platform primary steel weight (weight per platform)
1174 mt 1067 mt 1174 mt technology Remove 10% concept design margin
Include 10% concept design margin

PelaStar Cost of Energy - Part 2: LCOE
ETI Floating Platform FEED Study Glosten Rev 01 47 21 January 2014
LCOE Input Variable Base Value Low Value High Value Category Basis for Low Value Basis for High Value
platform shipyard engineering & management (cost per platform)
8% 5% 10% technology Assume 5% Assume 10%
installation: vessel acquisition cost (cost per vessel)
$47,791,932
$43,012,739
$52,571,125 technology Assume 10% reduction from baseline
Assumed 10% increase from baseline
tendons (synthetic fiber cables) (cost per platform)
$319,627 $290,570 $363,213 technology Remove 10% margin Increase margin from 10% to 25%
installation: crew and equipment (cost per platform)
$187,445 $149,956 $224,934 technology Assume 20% reduction from baseline
Assumed 20% increase from baseline
platform secondary steel weight (weight per platform)
47.5 mt 43 mt 47.5 mt technology Remove 10% concept design margin
Include 10% concept design margin
platform cathodic protection: cost per ton (cost per platform)
$2,000 $1,500 $2,500 technology Assume 25% reduction from baseline
Assume 25% increase from baseline

PelaStar Cost of Energy - Part 2: LCOE
ETI Floating Platform FEED Study Glosten Rev 01 48 21 January 2014
7.2 Findings from Sensitivity Analysis The baseline analysis case (Case 2) is the basis for the sensitivity analysis. Table 34 shows the high and low LCOE values for each input variable, as well as the percent change from the baseline LCOE of £106.0/MWh. Figure 9 is a “tornado diagram” showing the impact on LCOE from each of the sensitivity input variables. Dashed bars indicate externalities and solid bars indicate technology factors.
7.2.1 Key Drivers for Model Sensitivity The LCOE model is highly sensitive to externalities, largely because the factors themselves have a relatively large range of uncertainty. The top three uncertainties (two exchange rates and the discount rate/cost of capital) are dictated by the global financial markets. The fourth largest contributor to uncertainty (the wind turbine price) is largely dictated by market conditions at the time of purchase, but also depends on the overall growth of the offshore wind industry between now and the end of this decade, which affects the learning rates and by extension the wind turbine cost and price. The LCOE model is sensitive to the average wind speed at hub height, which at present is predicted by meso-scale meteorological predictions and therefore carries a relatively large uncertainty. Minimizing this uncertainty is a straight-forward exercise in direct measurement of site data over a multi-year period. Uncertainty in the transmission fee could be removed or at least minimized though policy actions. Additionally, there is headroom for innovation in this area which could reduce costs and therefore fees. With The Crown Estate seabed lease as the exception, the remaining uncertainty variables are related to the technology; i.e., the PelaStar platform, the wind turbine, or the balance of system. Table 34 LCOE sensitivity analysis results
LCOE Input Variable
LCOE with Low Value [£/MWh]
LCOE with High Value
[£/MWh]
' from Baseline
(low value)
' from Baseline
(high value) exchange rate: dollar-to-Sterling £86.9 £123.0 -18.0% 16.0%discount rate £93.4 £118.8 -11.9% 12.1%exchange rate: dollar-to-Euro £95.5 £111.7 -9.9% 5.4%turbine supply £98.9 £113.1 -6.7% 6.7%wind speed uncertainty £100.5 £111.9 -5.2% 5.6%transmission fee £100.3 £108.3 -5.4% 2.2%turbine maintenance £103.0 £109.1 -2.8% 2.9%turbine losses £103.7 £108.5 -2.2% 2.4%platform primary steel fabrication cost
£104.2 £108.8 -1.7% 2.6%
turbine availability £103.9 £108.3 -2.0% 2.2%platform transport distance £106.0 £109.2 0.0% 3.0%anchor installation: vessel day rate £104.2 £106.7 -1.7% 0.7%balance of system: decommissioning £104.8 £107.3 -1.1% 1.2%platform electrical system £105.0 £107.0 -0.9% 0.9%

PelaStar Cost of Energy - Part 2: LCOE
ETI Floating Platform FEED Study Glosten Rev 01 49 21 January 2014
LCOE Input Variable
LCOE with Low Value [£/MWh]
LCOE with High Value
[£/MWh]
' from Baseline
(low value)
' from Baseline
(high value) balance of system: array cables £105.1 £106.9 -0.8% 0.8%PelaStar license fee (PelaStar profit) £106.0 £107.6 0.0% 1.5%installation: weather availability £106.0 £107.5 0.0% 1.4%anchor installation: weather avail. £105.8 £107.3 -0.2% 1.2%anchor installation: productivity £105.4 £106.8 -0.6% 0.8%anchor fabrication cost £105.5 £106.8 -0.5% 0.8%equipment and foundation maintenance
£105.6 £106.5 -0.4% 0.5%
tendon connectors £105.5 £106.6 -0.5% 0.6%seabed lease £104.9 £106.0 -1.0% 0.0%platform transport day rate £105.5 £106.5 -0.5% 0.5%balance of system: permits and engineering
£105.5 £106.5 -0.5% 0.5%
platform secondary steel fabrication cost
£105.8 £106.7 -0.2% 0.7%
anchor steel weight £105.3 £106.2 -0.7% 0.2%platform primary steel weight £105.3 £106.0 -0.7% 0.0%platform shipyard engineering & management
£105.6 £106.3 -0.4% 0.3%
installation: vessel acquisition cost £105.9 £106.2 -0.1% 0.2%tendons (synthetic fiber cables) £105.9 £106.1 -0.1% 0.1%installation: crew and equipment £105.9 £106.1 -0.1% 0.1%platform secondary steel weight £105.9 £106.0 -0.1% 0.0%platform cathodic protection: cost per ton
£106.0 £106.0 0.0% 0.0%

PelaStar Cost of Energy - Part 2: LCOE
ETI Floating Platform FEED Study Glosten Rev 01 50 21 January 2014
Figure 9 Tornado Diagram for LCOE Sensitivity Analysis. Dashed bars indicate externalities. Solid bars indicate technology

PelaStar Cost of Energy - Part 2
ETI Floating Platform FEED Study Glosten Rev 01 51 21 January 2014
7.2.2 Sensitivity to Combined Factors This section describes the LCOE model’s sensitivity to combinations of factors. The RSS method is used to capture the combined effect of multiple input variables. The overall LCOE model sensitivity accounts for the combined impact of all 34 sensitivity input variables using the RSS method. The impact on LCOE from technology factors is low compared to the impact from externalities. Sensitivity to externalities accounts for the combined impact of the inputs marked “external” in Table 33. Similarly, sensitivity to technology factors accounts for the combined impact of the “technology” variables indicated in Table 33. Table 35 summarizes the combined sensitivities. Note that the total uncertainty range is the Pythagorean sum of the externality range and the technology range. Table 35 Sensitivity to combined factors
Category
LCOE with Low Values
[£/MWh]
LCOE with High Values
[£/MWh] ' from Baseline
(low value) ' from Baseline
(high value) Externalities -27.35 24.00 -25.8% 22.6% Technology -5.59 7.27 -5.3% 6.9% Total -27.92 25.07 -26.3% 23.7%
8. Forecast of LCOE in 2020 to 2050 A forecast is made for PelaStar floating wind plants with financial investment decision in 2020 through 2050, using constant 2013 currency. The forecast accounts for the learning rates and economies of scale5, which reduce the LCOE. The forecast also accounts for increasing uncertainty over time. The following sub-sections describe the methodology and results for the LCOE forecast.
8.1 LCOE Forecast Methodology The forecast is anchored by the matrix of analysis cases, which collectively form the expected range of PelaStar LCOE for projects with a financial investment decision (FID) in 2020. The total uncertainty range, as determined in 7, is then applied above the case with highest LCOE (Case 17) and below the case with lowest LCOE (Case 16) to determine the overall “90% confidence” range. In the years after 2020, the learning curves are applied to the CAPEX. A middle-of-the-range learning curve with 10% slope is applied to the O&M costs in the years after 2020. The technology uncertainty range (i.e., percent above and below high/low LCOE values) is held constant over time. However, the total uncertainty increases gradually over time to reflect the increasing uncertainty in externalities and learning curve effects in the future. Table 36 lists the total uncertainty ranges used in the LCOE forecast.
5 Learning rates account for “learning-by-doing” and the relative headroom for innovation, which is based on the technological maturity of each cost contributor. Economies of scale account for use of larger, 10-MW wind turbines, which are expected to be commercially deployed staring in 2030.

PelaStar Cost of Energy - Part 2
ETI Floating Platform FEED Study Glosten Rev 01 52 21 January 2014
Table 36 Schedule of applied uncertainty values for LCOE forecast
Year of FID Total Uncertainty Low Total Uncertainty
High
2020 -26% 24% 2025 -31% 34% 2030 -41% 44% 2035 -51% 54% 2040 -56% 59% 2045 -61% 64% 2050 -66% 69%
8.2 LCOE Forecast Results The forecast indicates a strong potential to realize major reductions in the cost of energy from PelaStar floating offshore wind plants in the years 2020 through 2050. In constant 2013 currency, the expected future LCOE decreases by 28% by year 2025, by 40% by year 2030, and by 52% by year 2050. Table 37 summarizes the PelaStar LCOE forecast. Figure 10 illustrates the decreasing LCOE over time, along with the increasing uncertainty. Table 37 CAPEX forecast for learning curves and future technologies
Forecasted PelaStar LCOE Values in 2013 Constant Currency [£/MWh]
FID
2020 FID
2025 FID
2030 FID
2035 FID
2040 FID
2045 FID
2050 Low LCOE
(“90% confidence”)
71.7 48.4 34.6 26.5 22.2 18.8 15.9
Low LCOE (Expected)
97.3 70.4 59.0 54.4 50.9 48.6 47.1
High LCOE (Expected)
119.5 84.9 71.8 66.3 62.0 59.2 57.2
High LCOE (“90%
confidence”)
147.8 113.5 103.2 101.8 98.4 96.9 96.6

PelaStar Cost of Energy - Part 2
ETI Floating Platform FEED Study Glosten Rev 01 53 21 January 2014
Figure 10 PelaStar LCOE forecast, 2020 through 2050 (note, this is the same figure as Figure 2)