programme of support for the national action plan for
TRANSCRIPT

Programme of Support for the National Action Plan
for Orphans and Other Vulnerable Children
Outcome Assessment
FINAL REPORT
19th May 2010
The views expressed in this report are of the consultants and do not necessarily reflect those of the
OECD-OVC Group, the Ministry of Labour and Social Services and UNICEF.
PoS for the NAP for OVC - Outcome Assessment - Final Report
Jimat Development Consultants /Page i
Programme of Support for the National Action Plan for Orphans
and Vulnerable Children
Outcome Assessment
Final Report
(Cover photo: Jimat file photo, Children in School, Mutoko District, 2007)
May 2010
Jimat Consult Private Limited
www.jimatconsult.co.zw

PoS for the NAP for OVC - Outcome Assessment - Final Report
Jimat Development Consultants /Page ii
CONTENTS
Contents ii
Abbreviations and acronyms iii Executive Summary iv 1 Introduction
1
2. The Programme of Support (PoS) for OVC
2
3. Research Methodology and Issues
6
4. Relevance, Efficiency and Effectiveness 7
A. Relevance 8
B. Efficiency 10
C. Effectiveness 22
5. Outcomes 28
6. Conclusions and Next Steps
32
Annexes 1 Terms of reference 40 2 List of team members 44 3 Field itinerary 45 4 Field research methodology 47 5 Field research results 54 6 Efficiency and cost effectiveness analysis 69

PoS for the NAP for OVC - Outcome Assessment - Final Report
Jimat Development Consultants /Page iii
ABBREVIATIONS AND ACRONYMS
AR Annual Review ART Anti-retroviral therapy BEAM BR
Basic Education Assistance Module Birth Registrations
BRTI Biomedical Research and Training Institute CBO Community Based Organisation CEA Cost Effectiveness Analysis CEO CF
Chief Executive Officer (at district level) Children First
CPC Child Protection Committee CRC Contracts Review Committee CRS CSO
Catholic Relief Services Civil Society Organization
DAC Development Assistance Committee (of OECD) DCCO Dananai Child Care Organisation DFID Department for International Development DFID Department for International Development DG Director General DSS Department of Social Services ECHO ETF
European Commission Humanitarian Aid Education Transition Fund
EU European Union FAO Food and Agricultural Organisation FOST Farm Orphan Support Trust FPE Free Primary Education FST Family Support Trust GoZ GPA
Government of Zimbabwe Global Political Agreement
HOCIC Hope for a Child in Christ HOSPAZ Hospice Association of Zimbabwe IA JAR
Impact Assessment Joint Annual Review
M&E Monitoring and Evaluation M&E Monitoring and Evaluation MASO Midland Aids Support Organization MoLSS Ministry of Labour and Social Services MTLC Managing, Technical and Learning Centre NAC National AIDS Council NAP National Action Plan NASCOH NCP
National Association of Societies for the Care of the Handicapped Neighbourhood Care Points
NDO Netherlands Development Organisation NGO Non-Governmental Organization NGO Non-Governmental Organisation OECD Organisation for Economic Cooperation and Development OVC Orphan and Vulnerable Children PD Paris Declaration PoS Programme of Support PRP Protracted Relief Programme PSS Psychosocial support SAT Southern African AIDS Trust SC Save the Children SCN Save the Children Norway SCT Social Cash Transfers SG Sub-Grantee SPSS Statistical Package for the Social Sciences SU Scripture Union TRC Technical Review Committee UK United Kingdom UNICEF United Nations Children Fund VfM Value for Money WATSAN WPO
Water and Sanitation Working Party of Officials
ZWD Zimbabwe Dollars

PoS for the NAP for OVC - Outcome Assessment - Final Report
Jimat Development Consultants /Page iv
Programme of Support for Orphans and Vulnerable Children
OUTCOME ASSESSMENT
EXECUTIVE SUMMARY
1. This report presents the findings of an outcome assessment study of the Programme
of Support (PoS) to the National Action Plan (NAP) for Orphans and Vulnerable Children
(OVC).
2. The US$86 million PoS is financed by a group of OECD countries and implemented
by UNICEF, in close coordination with the NAP for OVC Secretariat of the Ministry of Labour
and Social Services (MoLSS)1. It is scheduled to run for 3.75 years from April 2007 to
December 2010.
3. The PoS involves activities across a number of areas of support (school-related
support, birth registration, psycho-social support, food and nutrition, health care, water and
sanitation, child participation, child protection, education on nutrition, health and hygiene,
economic strengthening, life-skills and vocational training, cash transfer and shelter/other
support). It is implemented through 32 NGO partner organisations, who undertake activities
directly and through 150 smaller, local organisations, known as Sub-Grantees (SGs).
4. The PoS was assessed by the consultants against the OECD criteria of relevance,
efficiency and effectiveness and rated using the OECD four-point rating scale (that is:
A=very good; B=good, C=some problems; and D=serious deficiencies). The consultants
score the overall programme ‘B’ (Good).
5. The PoS is highly relevant (Score ‘A’) to the needs of the OVC, the country and
Government of Zimbabwe and to donors, who are fully harmonised and aligned behind the
Government’s NAP. The PoS approach was relevant in the context of a complex
emergency situation. Many elements of the approach remain valid and will continue to be
so in future. When the PoS was launched in 2005/06, the number of children orphaned by
HIV and AIDS was increasing, and government had limited funds to mitigate the impacts of
HIV and AIDS on children. During the programme period, government’s resource base and
capacity contracted sharply and the environment for child development deteriorated. There
was therefore, an urgent need for a vehicle that would extend the basic services to large
numbers of unserved OVC and to protect children from abuse. These conditions still exist
today and, at least for the next few years, the PoS will continue to be needed.
6. The PoS is efficient and cost-effective (Score ‘B’). UNICEF, MoLSS and partners
have achieved a great deal in very difficult circumstances. UNICEF has striven to be as
efficient as possible (e.g., reducing overheads, implementing the Sub-Grantee model, and
using centralised bulk procurement) in order to direct as many of the funds as possible to
NGOs for OVC, which is commendable. However, in the Mission’s view, the programme
could have achieved higher overall value-for-money (VfM), especially from the
viewpoint of reaching children quicker and with more services per child. By spending
1 Or NAP Secretariat, in short

PoS for the NAP for OVC - Outcome Assessment - Final Report
Jimat Development Consultants /Page v
a little more (e.g., to procure vehicles more quickly, to employ a Grant Manager with
necessary staff earlier, to monitor quality and learn lessons in a timely way) it could have
delivered better for OVC. By engaging state actors better, the PoS could have leveraged
complementary services much needed to make the investment effective. The Mission did not
spend long enough with NGOs to come to a view on whether their overheads and operating
budgets are adequate, but established that many partners continued to receive funds for
support costs even at a time when their field activities were suspended by the NGO ban in
2008. The flexibility of the programme to continue to fully fund NGOs during this critical
time was well conceived as it helped many to retain critical staff needed for the eventual
scale up of operations which became possible with the introduction of the multi-currency
system and the implementation of the Global Political Agreement (GPA) in 2009.
7. The PoS has been effectively implemented but there have been some problems
(Score B/C). Outputs have been delivered well. Almost 400,000 OVC have received some
benefit from the programme and implementation rates are high. Coordination among
stakeholders at national level has been very good, a sound programme of capacity building
for NGOs was put in place and an excellent output monitoring system established. However,
there are a number of problems, including:
• the fragmented nature of the programme (OVC suffer many types of deprivation, but the
PoS offers only 1 or 2 types of support to each child);
• the programme focused on reach (number of children served) rather than the quality of
the service provided;
• coordination at province, district and ward levels is often ineffective and the Department
of Social Services staff should be more involved in quality assurance (which would
require financial support);
• there is a need to build into the programme more rapid lesson-learning on what works
and sharing of good practice among all stakeholders to improve programme
performance.
The report makes recommendations for improvements in these areas.
Looking forward
8. The evaluation team supports the emerging consensus in Zimbabwe on the need to
put in place a comprehensive and national social protection framework for the country,
which would probably involve (a) a system of cash transfers for poor labour-scarce
households (as is the case for most OVC families); (b) strengthened child and family care;
and (c) more effective government social services (e.g., health and education).
9. The Mission considers that the PoS will have a key role to play in the transition
towards a national social protection framework in Zimbabwe. This transition would
probably take a number of years to give ample time to design, resource mobilisation, and
setting up of appropriate institutional arrangements. The Mission thus recommends, that
PoS is extended for another three years (2011 to 2013) in order to maintain the focus on
meeting the needs of OVC and to support the government in the process of transition.

PoS for the NAP for OVC - Outcome Assessment - Final Report
Jimat Development Consultants /Page 1
PROGRAMME OF SUPPORT FOR ORPHANS AND VULNERABLE CHILDREN
OUTCOME ASSESSMENT
REPORT
1. INTRODUCTION
1.1 This report presents the findings of the Outcome Assessment of the Programme of
Support to the National Action Plan for Orphans and other Vulnerable Children (OVC), which
was undertaken by JIMAT Development Consultants from 5th March to 5th May 2010.
1.2. The purpose of the study was to assess the extent to which the Programme of Support has reduced the overall vulnerability of OVC in Zimbabwe,2 by analysing the Programme’s ability to meet its stated objectives. Linked to this, there were four sub-objectives to:
• assess the outcomes of interventions as well as the number of children being reached by the programme’s NGO partners;
• analyse the cost effectiveness and value for money of the different approaches adopted by the Ministry of Labour and Social Services (MoLSS) and UNICEF (e.g. NGO-led Vs BEAM) to reduce children’s vulnerability and compare them with alternative approaches in Zimbabwe and the region;
• identify the benefits of different approaches to reduce the vulnerability of OVC in
Zimbabwe and assess their strengths and weaknesses;
• highlight opportunities, challenges and lessons learned for the design of a future programme.
Detailed Terms of Reference are given at Annex 1.
1.3. The consultancy team comprised: Mr Steve Jones (Team Leader), Mr Munhamo
Chisvo (Financial and Economic Analysis Expert), Mr Ngoni Marimo (Project
Manager/Fieldwork Coordinator) and Mr Backson Muchini (OVC Expert), plus 23 field
research and data analysis staff (see Annex 2). The itinerary for the field studies is given in
Annex 3.
1.4 The study involved interviews and meetings with key stakeholders in Harare (the
NAP Secretariat, UNICEF, OECD/OVC donors, NGO representatives); a desk review of
previous studies and documents provided by UNICEF; field research in 10 districts to assess
the programme’s outcomes for OVC; and data analysis and report writing back in Harare.
1.5 The team would like to thank the Ministry of Labour and Social Services (especially
the National Action Plan for OVC Secretariat), provincial and district officials interviewed, the
2 The target group for the programme includes children orphaned as a result of the loss of one or more parents
but also children living on the streets, engaged in hazardous child labour, living with disabilities and those living with HIV and AIDS who require special attention.

PoS for the NAP for OVC - Outcome Assessment - Final Report
Jimat Development Consultants /Page 2
OECD/OVC Group, UNICEF, partner NGOs and especially communities for giving so freely
of their time. Special thanks are due to Annely Koudstaal (Chair of the OECD/OVC Group);
Indranil Chakrabarty and Wendy Takundwa-Banda at DFID; Lauren Rumble, Elayn
Sammon, Chris Ngwerume, Sue Laver and Frank Chikhata at UNICEF; and Nellie
Dhlembeu at the NAP Secretariat for the help and support they provided to the team. The
views expressed in this report are of the consultants and do not necessarily reflect those of
donors or the Ministry of Labour and Social Services and UNICEF.
1.6 The report is divided into six sections, including the introduction:
1: Introduction.
2: Overview of the National Action Plan for OVC and the Programme of Support.
3: Research methodology and issues.
4: Assessment of how well the PoS achieved its objectives, using the OECD/DAC3 criteria of relevance, effectiveness and efficiency.
5: Assessment of the outcomes of the PoS, based on the results of the field research.
6: Summary of key conclusions and possible next steps.
2. OVERVIEW OF THE PROGRAMME OF SUPPORT FOR OVC
2.1 The Programme of Support for the National Action Plan4 for Orphans and Vulnerable
Children was established in 2006 in recognition of the large number of highly vulnerable
children in Zimbabwe and the need for increased resources and a stronger system of
coordination in delivering assistance. It is implemented by UNICEF, in close cooperation with
the Government of Zimbabwe, through NGOs.
2.2 The PoS structure is headed by the Working Party of Officials (WPO) and includes
donors, the Technical Review Committee (TRC), the Core Team, NGOs, children and
communities. The programme is funded by a multi-donor pooled fund (US$ 86 Million), to
which CSOs apply for funds. Funding decisions are made by the Technical Review
Committee. There are currently 32 NGO partners and over 150 Sub-Grantees (SGs).
Tripartite agreements are signed between Ministry of Labour and Social Social Services
(MoLSS), UNICEF and partner NGOs. In addition, the NGOs sign a Project Cooperation
Agreement (PCA) with UNICEF, an instrument for financial management of the programme.
The NGOs report to both MoLSS and UNICEF.
3 The Organisation for Economic Cooperation and Development (OECD) / Development Assistance Committee
(DAC) recommends five evaluation criteria: relevance, efficiency, effectiveness, impact and sustainability. It was too early to assess impact and sustainability so the study focused on the first three criteria plus outcomes.
4 In 2006 the programme changed its name from “National Plan of Action for Orphans and Vulnerable Children”
to “National Action Plan (NAP) for Orphans and Vulnerable Children”.
PoS for the NAP for OVC - Outcome Assessment - Final Report
Jimat Development Consultants /Page 3
Box 1: The Programme of Support: How does it work?
• Donors give funds to UNICEF in a single account (pooled funding).
• Civil society organisations apply for funds.
• A Technical Review Committee (made up of Government technical line ministries, National Aids Council (NAC), donors and UNICEF) decides who gets the grants.
• Tripartite agreements are signed between the Ministry of Labour and Social Services, UNICEF and the organisations, outlining their responsibilities. UNICEF also signs contracts with individual organisations and disburses the funds.
• Organisations report both to the Ministry of Public Service, Labour and Social Welfare and UNICEF.
• UNICEF prepares a single annual programme report and financial statement to all donors.
Source: Lesley Adams (2009) Social Development Consultancy for 2009 Annual Review, DFID based on
UNICEF (2008) Zimbabwe’s Programme of Support to the National Action Plan for Orphans and Other
Vulnerable Children: A partnership making a difference. UNICEF/NAC/GOZ
2.3 Box 1 (below) summarises how the programme functions and the flow of funds is
given in Table 1.
NAP Strategic Objectives
2.4 The PoS was established to address one of the most devastating effects of the AIDS
pandemic – the large number of orphans. A quarter of all children in Zimbabwe – 1.3 million
– have lost one or both parents. Nearly 50,000 households are headed by a child under 18
years. Most of the orphans are cared for by their extended families, including grandparents
(‘generation gap’ households), whose livelihoods are often precarious. Many orphans live in
extremely poor households and are less likely to access health care, attend school or have
basic clothing and bedding (clothes, shoes, blanket). They are also more likely to suffer from
psychological problems and to be subjected to forced sex in adolescence, which increases
their likelihood of contracting HIV. However, not all orphans are poor – orphans can be found
throughout Zimbabwean society5.
2.5 The National Action Plan (NAP) was approved in 20046 and aims to address the
needs of vulnerable children in Zimbabwe. The PoS was developed in 20057 to support the
NAP and scale up the response for OVC. Guidelines on the Operationalization of the NAP
were developed and adopted by Cabinet8.
5 Zimbabwe Vulnerability Assessment Committee (ZIMVAC) (2006) Rural Vulnerability Assessment, Harare. 6 Government of Zimbabwe (2004) National Action Plan for Orphans and Vulnerable Children, 2004-10, Ministry
of Public Service, Labour and Social Welfare, Harare.
7 Bühler, Markus, Geoff Foster and Derek Reynolds (2005) Programme Design Document: Programme of
Support for the National Action Plan for Orphans and other Vulnerable Children, ZImbabwe. October. (
8 Government of Zimbabwe (2006) Guidelines for Operationalising the National Action Plan for Orphans and
Vulnerable Children, Ministry of Public Service, Labour and Social Welfare, Harare.

PoS for the NAP for OVC - Outcome Assessment - Final Report
Jimat Development Consultants /Page 4
2.6 The NAP had seven strategic objectives (Box 2).
Box 2: NAP Strategic Objectives
1. Strengthen existing coordination structures for OVC programmes and increase resource mobilisation by December 2005;
2. Increase child participation as appropriate in all issues that concern them from community to national level, considering their evolving capacities;
3. Increase the percentage of children with birth certificates by at least 25% by December 2005;
4. Increase new school enrolment of OVC by at least 25% by December 2005, while ensuring retention of OVC in primary and secondary schools;
5. Increase access to food, health services and water and sanitation for all OVC by December 2005;
6. Increase education on nutrition, health, and hygiene for all OVC by December 2005; and
7. Reduce the number of children who live outside a family environment by at least 25% by December 2005.
2.7 Immediately after the Operationalisation Plan was approved, a national call for
concept papers, in line with the seven NAP strategic objectives, was launched and 10
provincial pre-application workshops were convened. NGOs submitted more than 160
concept papers leading to short-listing of 53 NGOs for submission of project proposals and,
in November 2006, after a thorough and transparent process, 21 project proposals were
approved by the Technical Review Committee, comprising Government, donors and
UNICEF. In February 2007, tripartite agreements were signed between the 21 organizations,
the MoLSS9 and UNICEF for a duration of 3 years.
2.8 Parallel to this, a pooled funding mechanism was established by donors, including
DFID, New Zealand, Sweden, Germany, Australia and the EU. Commitments to the pool
currently total US$ 86 Million. The PoS is thus a multi-donor funded programme which aims
to strengthen the NAP and enhance its operations and impact.
PoS Objectives
2.9 The purpose and outputs of the PoS from the logical framework (May 2008) are
given in Box 3. A goal is not given in the logframe, but the NAP Vision is to reach out to all
orphans and other vulnerable children in Zimbabwe with basic services that will positively
impact on their lives.
9 This used to be called the Ministry of Public Service, Labour and Social Welfare (MoPSLSW).

PoS for the NAP for OVC - Outcome Assessment - Final Report
Jimat Development Consultants /Page 5
Box 3: Programme Objectives
NAP Vision/Goal To reach out to all orphans and other vulnerable children in Zimbabwe with basic services that will positively impact on their lives. Purpose To increase access by OVC in Zimbabwe to basic social services and improve their protection from all forms of abuse. Outputs In order to achieve the purpose, the programme will deliver the following outputs:
1. Increased number of OVC receive free external support, care and protection through civil society organizations;
2. Structures for effective coordination and management of the programme are in place and increased year on year with multi-donor funding available;
3. Capacity of programme partners supporting OVC strengthened;
4. Programme wide M&E systems in place to measure outcomes and ensure best practice in interventions.
Development of the programme 2007-2010
2.10 The PoS was originally conceived as a three year programme. However, because of
the difficulties encountered in 2008, including extreme political economic instability, hyper-
inflation and a temporary ban on NGOs, the programme was extended to 3.75 years. It will
now run from April 2007 to December 2010. There was also some expenditure in 2006,
before the programme formally started.
Table 1: Expenditure by financial year (2006-2009)
US$
2006 2007 2008 2009 2007-09
A. Support to OVC through Civil Society Organizations
0.70 5.42 11.29 22.17 39.59
B. Programme management, including M&E and capacity building of NGOs (1)
0.21 1.18 1.45 1.59 4.42
C. UNICEF-Zimbabwe (A+B)
0.91 6.60 12.74 23.76 44.01
D. UNICEF HQ Overhead (5%)
0.05 0.35 0.64 1.25 2.29
TOTAL (2)
0.96 6.95 13.38 25.01 46.30
Notes 1. Capacity development, operational research, audit +finance, selection procedures, M&E, coordination communication. 2. This does not include the funds from UNICEF HQ provided to support NAP Secretariat.
Source: UNICEF (Total with UNICEF HQ 5% estimated by consultants).

PoS for the NAP for OVC - Outcome Assessment - Final Report
Jimat Development Consultants /Page 6
2.11 At the end of 2009, the programme had spent $44.01 million through UNICEF Harare
and $2.29 million dollars through UNICEF HQ in New York, bringing the total to $46.30 (see
Table 1).
2.12 To date, the PoS has reached 409,926 beneficiaries (as of 28 February 2010). This
number is not expected to increase significantly before the end of the programme in
December 2010 (Table 2). In reporting programme progress, UNICEF divides the 3.75 year
programme into three periods – ‘Year’ 1 2007 (12 months), ‘Year’ 2 (15 months) 2008/9 and
‘Year’ 3 2009/10 (18 months). The achievements for these three periods are given in Table
2. In addition, the PoS has provided education assistance to 517,000 OVC through BEAM,
with a target for Term 3 (September-December), 2009 of 560,00010.
Table 2: Cumulative number of OVC beneficiaries
Year 1 April 2007-March 2008
Year 2 April 2008-June 2009
Year 3 July 2009-Dec
2010
No of OVC beneficiaries
184,296 321,440 Approx. 410,000
2.13 From April 2007 to March 2008, UNICEF and its NGO partners focused on getting
the programme running and the number of beneficiaries was quite small. Between April 2008
and March 2009, the operating environment deteriorated and it was difficult for UNICEF
partners to deliver services to OVC. Since April 2009, the economy has become more
stable, with low inflation and the programme is expanding strongly. UNICEF is confident that
targets for December 2010 will be achieved.
3. RESEARCH METHODOLOGY AND ISSUES
3.1 The research involved the following activities:
• a desk review of reports and other documents provided by UNICEF and DFID, and of
information on similar programmes in Zimbabwe and in the region;
• extensive interviews with key stakeholders in Harare, including MoLSS, UNICEF,
OECD/OVC group and NGOs, and a two hour session with over 40 NGOs during the
UNICEF-NGOs quarterly meeting;
• field research involving interviews with 1,326 children (926 ‘treatment’ and 400
‘control’) and household heads in 15 wards in 10 districts (see Map in Figure 1),
using a structured questionnaire, focus group discussions and interviews with key
informants (from the community and government officials). The districts, wards and
households were randomly selected. All OVC in the households were interviewed;
and
10
It should be noted that many BEAM beneficiaries are already PoS beneficiaries.

PoS for the NAP for OVC - Outcome Assessment - Final Report
Jimat Development Consultants /Page 7
• Data analysis using SPSS (Statistical Package for the Social Sciences) and
discourse analysis of the qualitative information.
For more details on the research methodology, see Annex 4.
Figure 1: Map of Research Locations
4. RELEVANCE, EFFICIENCY AND EFFECTIVENESS
4.1 This section assesses how well the PoS achieved its objectives, as specified in the
logical framework (see Box 3) using the OECD/DAC11 criteria of relevance, efficiency and
effectiveness. The programme will be scored on each of these criteria using the OECD scale
shown in Table 3).
11
Organisation for Economic Cooperation and Development (OECD)/Development Assistance Committee (DAC).
Masvingo
Midlands
Matabeleland North
Manicaland
Mashonaland West
Matabeleland South
Mashonaland East
Mashonaland Central
Harare
Bulawayo
300 0 300 600 Kilometers
N
Zimbabwe's Provinces Beitbridge DistrictBulawayo DistrictChitungwiza DistrictGokwe DistrictHwange DistrictKariba DistrictMasvingo DistrictNyanga DistrictShamva DistrictHarare District
Seke rural
Epworth, and
Chitungwiza

PoS for the NAP for OVC - Outcome Assessment - Final Report
Jimat Development Consultants /Page 8
Table 3: OECD Rating Scale
Rating Score Very good A Good B Some problems C Serious deficiencies D
A. RELEVANCE
Relevance: :The extent to which the objectives of a development intervention are consistent with beneficiaries’ requirements, country needs, global priorities and partners’ and donors’ policies
Score
A
4.2 The evaluation team rates the PoS ‘A’ on relevance because it is fully consistent with
the beneficiaries’ requirements, the country’s needs, global priorities and the Government of
Zimbabwe and donor policies. More detailed explanation is given in Table 4.
Table 4: Relevance of PoS to different stakeholders
Stakeholder Reason for relevance of PoS OVC beneficiaries
The PoS addresses seven of OVC’s main priorities, which were identified during programme design through consultations with OVC in different parts of the country. Some problems have been experienced in implementation (see discussion on effectiveness, below) but this does not affect the relevance rating.
Country needs
The PoS addresses one of the most devastating effects of the AIDS pandemic – the creation of large numbers of orphans. A quarter of all children in Zimbabwe – 1.3 million – have lost one or both parents. Nearly 50,000 households are headed by a child under 18 years; other orphans live with their grand-parents, often in conditions of extreme poverty.
Global priorities
The AIDS pandemic is global. Lessons learnt in supporting AIDS orphans and other vulnerable children in Zimbabwe could have important lessons for other countries in the region and in other developing countries.
Government of Zimbabwe The National Action Plan on OVC is a major government priority. The PoS supports implementation of the NAP and UNICEF provides funding for the NAP Secretariat in the Department of Social Services under the programme.
Donors
The PoS is consistent with OECD donors’ priority of poverty reduction and implementing the Paris Declaration. The donors are harmonised among themselves and fully aligned with the Government of Zimbabwe’s policy on OVC.
4.3 The PoS is implemented by UNICEF. Donor funds are channelled through UNICEF
to NGO partners who deliver goods and services to the OVC in their communities. The
original and current arrangements are shown in Figures 2A and 2B. The institutional
arrangements make it possible for the donors to support the NAP, while not channelling
funds through the Government, which they cannot currently do for political and fiduciary
reasons. If, at some time in the future, it becomes possible for donors to channel funds
through the Government of Zimbabwe then alternatives figures 2C and 2D might be feasible.

PoS for the NAP for OVC - Outcome Assessment - Final Report
Jimat Development Consultants /Page 9
Figure.2 : Alternative models for Flow of Funds
A. Initial Funds Flow
B. Current Funds Flow
Donor
Donor
UNICEF
UNICEF
NGO
partners
NGO
Partners
BEAM
Schools
SGs SGs
Orphans and vulnerable
children
Orphans and vulnerable
Children
C. Funds Flow through government-1
D. Funds Flow through government-2
Donor
Donor
GOVT
UNICEF
GOVT
Educ.
Health
NGOs
Educ
Health
NGOs
SGs SGs
Orphans and vulnerable children
Orphans and vulnerable children

PoS for the NAP for OVC - Outcome Assessment - Final Report
Jimat Development Consultants /Page 10
4.4 This arrangement is not ideal. It is more expensive to use NGOs than government
and it would be better to build the capacity of the government to implement programmes of
this kind, rather than NGOs. However, in the circumstances, it is difficult to see what other
option was available. Although the Protracted Relief Programme (PRP), which is also
implemented by NGOs, is managed by a private consultancy firm, on behalf of the donors,
the government would not have accepted this arrangement for a national ‘flagship’
programme. The donors also preferred to work through a UN agency in the prevailing
circumstances.
4.5 This institutional set-up has not been without its difficulties. UNICEF Zimbabwe ran a
$10 million/year programme in 2006 and has had to grow rapidly. It is now one of the biggest
UNICEF programmes in the world, with an annual budget of $130 million, which will rise in
2010. The PoS has become an important “prototype” for donor funding, allowing for a pooled
funding arrangement for multiple donors, Government leadership on policy development and
programme coordination and UNICEF’s role as fund manager and technical advisor.12
UNICEF had little previous experience of large-scale NGO grant management prior to the
PoS, struggled to build its capacity in this area, and faced problems in adapting UNICEF’s
global rules to the new way of working. However, systems are now in place and operating
well. To this end, UNICEF has done a commendable job.
4.6 It became clear, early on, that most NGOs would need capacity building to undertake
their work. UNICEF responded by organising a programme of training courses, which was
important in making the new institutional arrangements effective.
B. EFFICIENCY
Efficiency: How economically are resources/inputs (funds, expertise and time) converted to results?
Score
B
4.7. The evaluation team rates the programme B on efficiency. The PoS is efficiently
implemented and cost effective, though there is scope to increase value-for-money.
4.8 A detailed analysis of all aspects of the efficiency of the PoS is presented in Annex 6.
This section discusses the main findings and conclusions on (a) the efficiency of the design
and the implementation process (the quality and pace of implementation vis-a-vis
implementation targets) and (b) the cost-effectiveness of the PoS.
Efficiency of PoS design
4.9 The PoS was, right from the outset, not conceived as a stand-alone programme but
one to provide financial support towards implementation of an existing national programme,
the NAP for OVC. By supporting already identified and agreed upon national priorities and
initiatives, the PoS was able to benefit from the goodwill of institutional structures identified
for the implementation of the NAP for OVC. However, the absence of direct PoS support
12
This model has been replicated in the Education Transition Fund (ETF) as well as the Essential Medicines Programme in UNICEF.

PoS for the NAP for OVC - Outcome Assessment - Final Report
Jimat Development Consultants /Page 11
to government structures that were supposed to play a key role in coordination and
supervision, stood out as a systemic design flaw of the PoS, which affected not only
the speed of implementation but quality of outputs and, ultimately, results for
children. This problem was raised in every Annual Report but with no real solution in sight
because of the donor moratorium on direct state support, which was part of the conditionality
governing the PoS funding. With the collapse of fiduciary risk management within
government, however, the moratorium was understandable13. However, the culture in
government is slowly changing and the perceived fiduciary risk is declining making it
possible to consider alternative financing models in the future.
4.10 The PoS focused on scaling up existing support for OVC. This approach was a much
needed “fast-track” route for reaching children. It enabled many participating NGOs and
CBOs to retain and attract additional qualified staff, expand their operations and
achieve economies of scale14. Some NGOs were able to bring in additional resources
mobilised outside the PoS. In some cases, such matching funds were reported to be in the
order of 30-40%. Nevertheless, the absence of systematic technical due diligence on the
NGO programmes that were being scaled up (except through the project proposal
approval process) resulted in some inefficient operations unintentionally being scaled
up. This was not helped by the absence of (i) minimum design standards, (ii) programme-
wide learning from previous similar interventions, and (iii) systematic follow-up of
beneficiaries to monitor the utilisation of the inputs provided to OVC.
4.11 The third important feature of the design of the PoS was the pool funding
mechanism. The study finds this mechanism in perfect alignment with the “three ones”
principle15 and thus a good example of how donors can still work harmoniously
together in a “fragile state” context towards fulfilling the Paris Declaration Principles on
Aid Effectiveness16. There is strong coordination among donors funding the PoS and those
in the OVC sector in general especially through the forums such as the monthly meetings of
the OECD-OVC Group and the Joint Annual Review (JAR) exercise. The JAR allows joint
learning, encourages harmonisation of approaches and promotes the spirit of mutual
accountability. As part of the JAR, donors also produce a common set of recommendations
with a clear plan of action that coordinates their subsequent monitoring of the programme.
4.12 Both predictability of funding for OVC, and efficiency of NGO planning, from one-year
funding cycles to a 3-year funding framework improved. This achievement however, was
somewhat reversed when, some NGO budgets were rationalised in light of challenges with
absorption capacity. In addition, some NGOs lost their previous direct donor funding when
they joined the PoS and for this reasons perceived the PoS in some negative light.
13
Many government institutions have audits that are overdue
14 Many of the sampled NGOs interviewed confirmed having increased their staff establishment and geographic
and thematic scope of their interventions, with this investment having paid off mainly in the first and third year of implementation
15 The three ones are: one agreed OVC action framework that provides the basis for coordinating the work of all
partners (this is the NAP for OVC); one national OVC coordinating authority, with a broad based multi-sector mandate (this is the NAP for OVC Secretariat in the Department of Social Services); and one agreed country-level monitoring and evaluation system (which is the NAP for OVC M&E Framework, which is 100% harmonized with the national M&E system)
16 These are Ownership, Alignment, Harmonization, Managing for Development Results, and Mutual
Accountability

PoS for the NAP for OVC - Outcome Assessment - Final Report
Jimat Development Consultants /Page 12
4.13 A major shortfall of the pool funding mechanism, however, was the fact that the PoS
funds were not channelled through the government system in full compliance with the Paris
Declaration principles. A shadow structure was created for resource management, which
though necessary at the time of growing international isolation of the Government of
Zimbabwe, was obviously at the cost of adding another layer of bureaucracy and transaction
costs. While these costs were reasonably well managed by UNICEF, the presence of a
shadow structure, in any case reduced the visibility of government and that of the donors,
and according to the Department of Social Services, this was at the cost of NGO
accountability to Government for quality programming. The position was reinforced by
the presence of two agreements governing the implementation of the PoS ((i) the Tripartite
Agreement signed by the NGOs, UNICEF and the Government and (ii) the Project
Cooperation Agreement signed only by UNICEF and the NGOs). The two agreements led to
a dual accountability system (i.e., technical accountability to Government and financial
accountability to UNICEF) with the latter often overshadowing the former given the “power”
in financial control.
4.14 A fourth major feature of the PoS design were the multi-stakeholder institutional
arrangements for PoS coordination and implementation comprising the NAP Secretariat and
its sub-national structures at provincial, district and local levels as the overall coordinating
body, the OECD-OVC group as funding agencies, UNICEF as fund manager, the Working
Party of Officials, the Technical Review Team, the Core Team and the NGOs and CBOs as
implementers. By and large, the study found that the composition and roles of these
institutions were well articulated, they promoted good interaction and cooperation
among the key stakeholders and facilitated broad-based ownership and flexibility
which helped to clear some of the most challenging bottlenecks encountered during
programme implementation. However, capacity bottlenecks associated mostly with
understaffing of these bodies coupled with weak ownership of the PoS by CSOs and the
delayed setting up of village-level coordination structures (child protection committees)
in some areas, negatively affected coordination and the pace of programme implementation.
Weak coordination in some instances hindered the PoS from getting critical complementary
services, such as birth registration. It is hoped that the DSS Audit planned for May 2010 will
help to outline, analyse, and begin to define a framework for action, for the social welfare
system and its ability to deliver services for vulnerable children and families. One critical
outcome for this “audit” will be a clear understanding of the capacity of district social workers
to fulfil their statutory obligations under the Child Welfare Act of 2004- viewed as a key
stumbling block to achieving national scale outcomes for OVC under the PoS.
Efficiency of PoS Implementation
Selection and contracting of NGOs
4.15 The flood gate system used for the call for concept notes was well received by
NGOs and was transparent. There was good coordination of NGO selection as gaps in
geographic and thematic coverage were addressed through targeted calls. However, the
guidelines accompanying the first call for proposal could have better targeted NGO
competencies as well as thematic and geographic coverage using more focused and
customised selection criteria to avoid poor performing partners.

PoS for the NAP for OVC - Outcome Assessment - Final Report
Jimat Development Consultants /Page 13
4.16 A key feature of the NGO selection process was the hands-on technical support
given by the Core Team to NGOs with “promising projects”. This, together with
subsequent generic training on project proposal writing offered through the PoS Capacity
Development agenda, was appreciated by many NGOs as having improved the quality of
project design. This, however, did not automatically translate into implementation of quality
interventions, as many NGOs lacked implementation capacity, information on best practices
and monitoring/supervision by the TRC17.
Disbursement of funds to NGOs
4.17 Further technical and financial scrutiny and rationalisation of the selected NGO
proposals by UNICEF’s Contract Review Committee (CRC) imposed another layer of
bureaucracy which delayed contracting and processing of the initial disbursements to NGOs,
but had the benefit of strengthening transparency and value for money in NGO selection.
4.18 An estimated 46% of disbursements made under the PoS during the period April
2007 – September 2009 were not liquidated on time (within 6 months) and this hindered
further disbursements. Many NGOs irrespective of whether they were local or international,
or whether they received their funds in foreign or local currency, had difficulties liquidating
their disbursements on time. Management of disbursements and liquidations was
severely constrained by the hyper-inflationary environment, unstable monetary
policies, distorted exchange rates and the “informalization” of the supply economy
for programme inputs and services.
4.19 Application of rigid internationally accepted procurement standards was made
difficult18, so was quick adaptation of the UNICEF payment system to cope with the rapid
accumulation of zeros in the deflating local currency. Under these circumstances, the study
finds that UNICEF displayed both a sufficiently high degree of flexibility to ensure
value for money and sound financial management to minimise fiduciary risk.
4.20 NGO consortia arrangements set up to address issues of capacity and thematic
coverage, encountered major challenges with disbursement, implementation and
liquidation as there was little prior experience either among the NGOs involved or
within UNICEF and the MoLSS on how to manage such types of collaboration. The
innovation needed more careful attention – especially to ensure that lead NGOs in consortia
arrangements executed their functions in a manner sufficiently accountable to their partners.
Implementation rates and funds absorption
4.21 The PoS had a slow start, mainly as a result of processes necessary to build
ownership within government. The PoS therefore did not quickly reach children.
Furthermore, the severely constraining operating political and economic environment that
17
Although it was not explicitly their core role, members of the TRC were best placed to jointly go for monitoring.
18 During much of 2008, it became increasingly difficult to get quotations valid for a period of 3 weeks (the lead
time UNICEF needed to process disbursements).

PoS for the NAP for OVC - Outcome Assessment - Final Report
Jimat Development Consultants /Page 14
obtained from late 2007 and persisted throughout the year 2008 made it difficult for the PoS
to be implemented as planned and continue reaching many new children (see Figure 3)19.
4.22 Funds absorption rate lagged behind time lapse for much of the implementation
period so far, except late in 2009 when the operating environment improved and the
programme started scaling up activities on the ground (see Figure 4). However, scaling up
the programme only towards the end of the planned implementation timeframe implies that
not much impact may be achievable during the remaining period.
4.23 Furthermore, while the programme managed to scale up in 2009, the general state of
collapse of basic social services remained a challenge for most partners as reach did not
necessarily translate to improvement in access by OVC. The strike by teachers for
example, continued to affect reach of OVC through educational support as schools remained
closed in the first quarter of 2009. Birth registration also continued to be affected by the lack
of cooperation from the Registrar General’s Office plus the inability of families to secure the
basic documentation required.
Figure 3: New OVC reached per month by type of intervention (selected interventions)
19
All interventions (education, food and nutrition, etc ) were severely affected, however new OVC were reached with the service to reintegrate children due to the surge in deportation of unaccompanied children from Botswana and South Africa in 2008.

PoS for the NAP for OVC - Outcome Assessment - Final Report
Jimat Development Consultants /Page 15
Efficiency of procurement of programme inputs, equipment and other supplies
4.24 Through centralised procurement of equipment and supplies UNICEF was able to
secure savings of up to 30-40% on vehicles and on water and sanitation supplies, and as
much as 50% on computers for its partners20. However, this was at the expense of
timeliness of delivery due to UNICEF’s long lead time. Some partners received programme
vehicles only in the second year. In retrospect, alternative modes of managing some of the
procurements so as to reach children faster could have been explored, especially as this
was an emergency intervention.
Figure 4: Comparison between cumulative expenditures by NGOs and time lapse
Efficiency of monitoring and supervision of activities
4.25 UNICEF in collaboration with the NAP Secretariat and the National AIDS Council
successfully developed a state-of-the-art output monitoring system for the PoS which has
become a model for replication in other OVC programmes internationally.
4.26 However, the lack of direct financial support to the existing national machinery
for monitoring and supervision hampered efforts by government technical staff at all
levels to quality assure the PoS at a time when UNICEF (as fund manager and technical
partner) also lacked sufficient manpower to balance administrative and technical monitoring.
This structural weakness cascaded to the NGO level and compromised quality of outputs
achieved. Primary NGOs lacked capacity to monitor activities of sub-grantees. Sub-grantees
lacked capacity to monitor the work of their staff and NGO field staff did not adequately
monitor utilisation of inputs and services by beneficiaries. Support from NGOs to government
counterparts for field monitoring was not consistent across the programme and, where it
existed, sometimes compromised the independence and objectivity of monitoring visits
by state actors.
20
The magnitude of the procurements, especially at the height of the cholera emergency and widespread food shortages, was unprecedented, and UNICEF was able to handle the procurements by placing some of it staff in South Africa to manage the procurement process

PoS for the NAP for OVC - Outcome Assessment - Final Report
Jimat Development Consultants /Page 16
4.27 While the PoS monitoring system had good indicators for monitoring outputs, equal
attention should have been accorded to quality assurance and outcome level
indicators in order to give NGOs a strong urge to focus on quality.
Cost Effectiveness
Cost per beneficiary reached
4.28 The computation and comparison of unit costs of the PoS and those of other
programmes was generally constrained by (i) non-tracking of the number of unique OVC
reached by a combination of activities, (ii) non-tracking of period of support to each OVC
reached, (iii) lack of standardisation of definitions of support costs, and (iv) non-disclosure of
overhead costs by some programmes. The parameters had to be estimated. Results on
analysis of unit costs of the PoS (excluding BEAM), direct support to BEAM through PoS,
and three other comparable OVC programmes are summarised in Table 5. The cut-off point
for the cost analysis was 31st December 2009.
Table 5: Comparison of unit costs for OVC programmes in Zimbabwe and the region
Parameter UNICEF PoS
2006-2009
Children First Project
Jan 2008-Jun 2009
PoS Support
to BEAM Term 3 (Oct-Dec) 2009
2
Malawi Social Cash
Transfer
Swaziland Neighbourhood
Care Points
Expenditure US$46,320,000 US$3,669,580 US$4,584,624 Not available Not available
Children reached 379,730 49,440 517,312 3,2363 34,000
Cost per child US$122 US$74 US$9 Not available Not available
Cost/child/year US$181 US$861 US$27 US$30 US$230
Cost intensity US$85 US$36 US$8.67 US$28 Not available
Cost of transfer US$0.42 US$0.56 US$0.02 US$0.08 Not available Notes: 1Cost per child per month ranged between US$6.03 and US$7.50, the lower figure being for supply-driven interventions such as education support, and the higher figure being for demand-driven services such as a package with PSS, health, Child Protection and shelter. 2 BEAM expenditure is based on February 2010 financial report. 3 The pilot project targeted children through their households. An impact assessment conducted by Boston University found that children accounted for about 17.8% of household size. Data Sources: (1) UNICEF M&E and Financial Data; (2) “Promoting Quality Education for Orphans and Vulnerable Children: A Sourcebook of Programme Experiences in Eastern and Southern Africa”, United Nations Children’s Fund (UNICEF), November 2009; (3) Children First Project, Strategy Options for the Period 2010-2012.
4.29 As at December 31st, 2009 the average cost per child for the PoS was USD12221.
The cost per child per year averaged US$181, whilst cost intensity reached US$85 per child
and the cost of transferring USD$1 of benefit to a child averaged US$0.42.
4.30 The cost to NGOs per OVC reached per month of support averaged USD9.92, which
is equivalent to USD 119 per child per year. However, when costs related to capacity
building, M&E, UNICEF HQ, and UNICEF coordination are taken into account the cost per
21
The total number of OVC reached by the PoS as at 31 December 2009 was estimated at 379,730 while the total expenditure of the programme was reported at USD46.32 million. This gave rise to a cost per OVC of approximately USD122. By 28 February the number of OVC reached had risen substantially to an estimated 409,926 and the cost per child was expected to have improved.

PoS for the NAP for OVC - Outcome Assessment - Final Report
Jimat Development Consultants /Page 17
OVC reached by the PoS increased to USD15.14 per month or USD181.62 per year on
average.
4.31 Unit costs varied widely across PoS partners, depending on type and quality of
service package, reach, and efficiency of the operations. Most NGOs implementing softer,
demand-driven services such as counselling, reunification of children, and provision
of psychosocial support and treatment to children who are victims of sexual abuse
had higher unit costs than those that implemented supply-driven and often hardware
type interventions (food and nutrition, and educational support) (Figure 5).
4.32 In general, organisations that had lower unit costs than the NGO average of US$76
per child, had managed to achieve economies of scale through high numbers on reach
associated with supply-driven interventions (except water and sanitation which was affected
by shortage of hardware on local markets and the NGO ban which hindered health and
hygiene promotion).
4.33 When the unit costs of the PoS are compared with those of other approaches, it
becomes evident that the cost per child for the PoS is consistently higher than that for
projects that target the household as opposed to the child (e.g., the Malawi Social Cash
Transfer, and the multi-donor funded Protracted Relief Programme in Zimbabwe although
the latter also targets a different group from that of the PoS22). It is also higher than for
projects that equally target the OVC such as funded under the Children First (CF)
Project. One of the main differences is the high level of investment the PoS is making into
the lives of children with extreme vulnerability such as those with disabilities (purchasing of
equipment and supporting their rehabilitation). The second most important factor is that a
larger proportion of CF Project partners were located in urban areas and were arguably not
affected to the same extent by the NGO ban in 2008 as the PoS partners who were working
mostly in rural areas. In addition, the Children First Project has successfully tested new
approaches with the potential of reaching many children with critical support at
reasonably low cost in a short space of time such as the school health assessments
coupled with block grants to clinics. The high cost of the PoS is also attributed to the fact
that the programme continued to provide support costs to partners at a time of limited
outreach due to factors beyond the NGOs’ control, even though it is evident that the cost of
transfer for the PoS is lower than for the CF Project, and this is explained partly by the
economies of scale secured by UNICEF in managing a ten times larger budget for the PoS
than that managed by World Education Incorporated under the CF Project. Similarly,
economies of scale also explain the better cost performance of direct support to BEAM than
educational support through NGOs. However, unit costs of the PoS are generally lower than
for interventions that target community systems rather than the child. In an effort to
secure the rights of children through building stronger community-led social protection
systems, for example, the Neighbourhood Care Points programme in Swaziland23 is run at a
cost equivalent to US$230 per child.
22
The statistics for the PRP I and II show a cost per child of £10 and £12, respectively, but have not been included here as the target groups are slightly different from those of the PoS.
23 This programme strengthens community-based care of orphans and vulnerable children and promotes their
access to education.

PoS for the NAP for OVC - Outcome Assessment - Final Report
Jimat Development Consultants /Page 18
Intensity of investment per child
4.34 On average, NGOs invested US$61 of benefit (value of inputs and services reaching
each child) per child during the period 2006-2009 (Figure 6). Organisations with high
intensity of support24 also had consistently higher levels of investment (value of transfer) per
child. The varying amounts spent per child based on the type and level of vulnerability
show that the PoS was able to respond to unique needs of children (e.g., those with
disabilities), an approach that is consistent with the basic tenets of a child rights approach.
Figure 5: Cost per OVC reached by PoS partners (2006-2009) (US$)
Source: UNICEF Partner Expenditures Data (2006-2009).
Figure 6: Comparison of the level of investment per child (PoS inputs and services),
(2006-2009), US$
Source: UNICEF Partner Expenditure Data (2006-2009).
24
Total programme costs (excluding support costs) divided by the total number of direct beneficiaries. It shows the average total cost of transfers (goods and services delivered) per beneficiary.

PoS for the NAP for OVC - Outcome Assessment - Final Report
Jimat Development Consultants /Page 19
Cost of transfer
4.35 Using international standards, the cost of transfer should ideally not exceed US$0.67
per US$1 of benefit transferred (40% overhead and 60% admin). In the worst case scenario,
should not go beyond US$1. The average cost of transfer for the PoS as a whole (including
funds retained by UNICEF at HQ) was only US$0.42 (and US$0.31 for NGO activities only).
Both of these figures are within the acceptable range despite suspension of programme
activities in 2008 whilst partners continued to absorb the administration budget.
4.36 Having said this, the cost of transferring benefits to children was quite high for some
consortium arrangements, especially those that did not run smoothly. MASO, whose model
was the most expensive US$0.88), centralised the management of logistical resources for
the consortium, a development that cost the project in terms of quality programming and also
led to high overheads.
4.37 The new approach of paying school fees directly to schools rather than through
NGOs (new BEAM model) has been able to reach more children and exploit economies of
scale. The cost of transferring US$1 of benefit to a child through the NGOs averaged
US$0.42 (Figure 7) but, with direct support to BEAM, the cost of transfer for education
assistance is only US$0.02.
Figure 7: Cost of transferring US$1 of benefit to OVC through PoS partners (US$)
Source: UNICEF Partner Expenditure Data (2006-2009).
Returns to investment in children
4.38 The study finds that most economic empowerment programmes (nutrition gardens,
poultry, village savings and investment and livestock pass on schemes) supported under the
PoS had limited viability during the period 2007-2008 as they were severely affected by
hyperinflation, commodity price distortions and the absence of cash on the local markets.
Where livestock assets were provided to OVC, these projects thrived by enabling
beneficiaries to participate in barter trade. However, complementary inputs such as

PoS for the NAP for OVC - Outcome Assessment - Final Report
Jimat Development Consultants /Page 20
veterinary supplies, were not available on the local markets to control common animal
diseases, hence case fatality (especially for poultry) was high in some regions where
disease outbreaks (Newcastle) were frequent and animal feed were not accessible.
4.39 Another factor that affected resilience and viability of agricultural projects is the wide
variations in quality of support as many lacked adequate technical advice and minimum
standards. However, with the restoration of favourable economic conditions, support to OVC
economic empowerment projects has just returned once more to viability but many need to
be re-kick-started with an injection of working capital for revitalisation.
4.40 The real cost per school dropout or hunger averted or problem of shelter addressed
was much higher than the average cost per child per year realised by the PoS in total. This
is due to the fact most interventions did not adequately meet the needs of some of the
children reached. The real costs for addressing one problem in each of the PoS intervention
areas is summarised in Table 6 below.
Table 6: Real unit costs for addressing OVC problems
Intervention %
Adequate
% Effectiveness
(resolved problems)
Cost multiplier
Indicative real cost per problem case averted,
US$/child
Education 62 50 2.00 91.00
Food + nutrition 57 49 2.04 37.00
Child Protection 51 47 2.13 1,540
Economic strengthening* 39 23 4.35 79.00
Psycho-social support* 88 82 1.22 169.00
Health care* 62 63 1.59 780.00
Shelter, clothing * 74 90 1.11 102.00
Notes: * The figures are based on too small sample size.
4.41 For example over the period 2006-2009 the cost of averting one dropout was at the
cost of US$91.00, that of averting hunger was US$37 and that for addressing one case of
street/institutionalised children averaged US$1,540. The highest cost multiplier was for
economic strengthening projects whose effectiveness was poorest.
Comparison of the financial efficiency of the PoS with that of other regional programmes
4.42 Comparison of the PoS with other OVC programmes in the region led to a number of
conclusions, these are:
• No other programme implemented through NGOs reached as high a number of OVC
as the PoS.
• Implementation through national systems (government) has the potential to reach
more OVC at lower unit costs (BEAM reached 517,312 children at a cost equivalent
to USD27 per child per year, and a cost of transfer of US$0.02).

PoS for the NAP for OVC - Outcome Assessment - Final Report
Jimat Development Consultants /Page 21
• National policy instruments (e.g., free education policy) have potential to reach even
larger numbers of OVC than targeted support (e.g., school fees) and can be
achieved at even lower cost. Kenya Free Primary Education Policy increased
enrolment by 1.3 million children overnight in 2005 at a cost of USD14 – USD41 per
child per year depending on the child’s special needs. However, sound advance
planning is needed to ensure supply of teachers and water and sanitation facilities
copes with the increase in demand, otherwise OVC enrol and quickly drop out of
school.
• Whilst most interventions focus on formal education, some OVC may not enrol in
formal schools despite presence of targeted fee support. Informal education and
vocational training may be more appropriate for their circumstances. The
Complementary Basic Education in Tanzania Programme showed that such non-
formal education for OVC requires a higher investment (US$166 per child per year).
• Programmes that aim to assist the child by strengthening community systems for
care and support (e.g., Swaziland’s Neighbourhood Care Points), come with higher
investment requirements (US$230 per child per year) than those targeting the child
directly (such as the PoS with cost per child per year of US$181. However, the
former have the benefit of building more sustainable systems as they also tap into
local resources.
• Social cash transfer programmes (e.g., Malawi Pilot Social Cash Transfer Scheme
reaching 18,180 households in 7 districts) can be implemented at reasonably lower
cost (US$30 per person per year, and US$0.08 per US$1 of benefit transferred) than
the PoS package. Depending on the level of the cash transfers, social cash transfers
empower the poor people to make decisions on their entitlements and have the
potential to address multiple needs of OVC and their families (education, health, food
and nutrition, clothing, hygiene, water and sanitation, shelter, hiring of labour, etc).
However, SCT cannot address directly issues of child protection and these need a
separate system.
• Integrated packages of support to OVC come at higher cost per child, than singular
intervention approaches. This is evident when examining the financial performance of
the All Children Safe in Schools Programme from Swaziland and the new approach
to BEAM through the PoS in Zimbabwe. The cost per child per year is 3 times higher
for Swaziland’s more comprehensive programme (at US$95 per child per year for a
package comprising education for all grants, water and sanitation, school feeding,
school farms and gardens and PSS) than that for BEAM (US$27) which only
addresses one need of OVC – the tuition support.

PoS for the NAP for OVC - Outcome Assessment - Final Report
Jimat Development Consultants /Page 22
C. EFFECTIVENESS
Effectiveness: The extent to which the development interventions’ objectives were achieved, or are expected to be achieved, taking into account their relative importance.
Overall score
B/C
Output 1: Care and Protection for OVC Increased number of OVC receive free external support, care and protection through civil society organizations;
A/C
Output 2: Coordination and finance Structures for effective coordination and management of programme in place and increased multi-year if multi-donor funding is available
B
Output 3: Capacity of partners enhanced Capacity of programme partners supporting OVC strengthened;
B/C
Output 4: M&E systems to ensure best practice in interventions Programme wide M&E systems in place to measure outcomes and ensure best practice in interventions.
B/C
4.43. The evaluation team rates the programme B/C on effectiveness. The PoS is effective
but there are some problem areas.
Output 1: Care and protection for OVC
Rated ‘A’ on OVC coverage (‘reach’) and ‘C’ on quality/intensity of support.
4.44 Considering the severely constrained operating environment, UNICEF and its partner
NGOs have done an excellent job in reaching OVC. As was noted earlier, by February 2010,
services had reached 409,926 OVC beneficiaries plus another 517,000 through BEAM by
the end of December 2009.
Table 7: Beneficiaries and Implementation by ‘Year’
Year 1 April 2007-March 2008
Year 2 April 2008-June 2009
Year 3 July 2009-Dec 2010
Beneficiaries (cumulative)
184,296 321,440 Approx. 410,000
Implementation rate %
125% 61.2% 100.0% 28/02/10
4.45 The PoS has already achieved the original NAP target of reaching 25 percent of
OVC25. The Year 3 target is double the original NAP target. Currently, the average UNICEF’s
NGO partner reaches 15,000 OVC; by end 2010, this figure is expected to almost double to
29,400.
4.46 By the end of the programme in December 2010, UNICEF expects that its NGO
partners and their Sub-Grantees (SGs) will have provided, on average, each OVC
25
The NAP estimate for the number of OVC in Zimbabwe is 1.35 million. Recent evidence, however indicates that the number of children whose families live in extreme poverty and are vulnerable is possibly as high as 3.5 million. See Figure 9, below.

PoS for the NAP for OVC - Outcome Assessment - Final Report
Jimat Development Consultants /Page 23
beneficiary with 1.5 types of support under the programme. The types of support provided
are listed in Table 8.
4.47 Many of these broad categories include different types of support. For example:
• Education includes: (a) block grants to schools to improve their facilities on condition
they admit OVC, (b) paying the schools fees of OVC, (c) providing learning materials
(books, stationery) and (d) providing school uniforms; and
• Food/Nutrition includes: (a) training, (b) supplementary feeding, (c) nutrition and
behaviour change, (d) nutrition gardens, and (e) agricultural inputs.
4.48 OVC beneficiaries generally receive only one, possibly two types of support. When a
child receives more than one type of support, they are sometimes related (e.g., school fees
and school uniforms) or unrelated (e.g., school fees and a life-skills camp, under psycho-
social assistance).
Table 8: Summary report of implemented activities
Indicator Years 1-3
Target Implementation
rate %
Dec 2010 Feb 2010
1 Child Participation Children trained in child participation issues
49,097 4%
2 Birth Registration New OVC who obtained birth certificates
10,395 42%
3 Education New OVC provided with school-related assistance
150,574 164%
4 Health New OVC provided with medical support
28,999 94%
5 HIV/AIDS – ART Children living with HIV and AIDS started on ART
1,117 56%
6 Food/Nutrition New OVC provided with food/nutritional assistance
115,119 64%
7 Psycho-social support New OVC receiving psycho-social assistance
159,829 60%
8 Drinking water New community water points constructed/rehabilitated
939 25%
9 Sanitation New household latrines constructed/rehabilitated
3,265 31%
10 Life-skills training New OVC attending life-skills training
83,813 52%
11 Vocational Guidance New OVC completing vocational guidance
3,378 242%
12 Legal assistance New OVC provided with legal assistance
1,808 152%
13 Family re-unification New children living outside of family care reunited within a family environment
5,208 104%
TOTAL (excluding #8 and #9).
609,337

PoS for the NAP for OVC - Outcome Assessment - Final Report
Jimat Development Consultants /Page 24
4.49 The interventions which reach the largest number of OVC are psycho-social support,
education and food/nutrition, which together account for over 80 percent of all support to
OVC (Table 9).
Table 9: Most common areas of support, February 2010
Area of support Target Beneficiaries Most common intervention Number %
Psycho-social support 159,829 16.2 Life-skills camps Education 150,574 24.7 Payment of school fees Food/Nutrition 115,119 18.9 Supplementary feeding Life-skills training 83,813 13.8 Training courses Other 100,002 16.4 Various
Total 609,337 100.0
4.50 The most common interventions are ones that can be delivered relatively easily (e.g.,
school fees, school uniforms, life skills camps). Other types of support (e.g., family
reunification, psycho-social counselling) are more difficult to deliver and require frequent
visits to the OVC over a period of time.
4.51 Birth registration is important if a child is to receive his or her rights and entitlements.
The evaluation team was surprised that little progress has been made in this area. More
could be achieved, through closer working of UNICEF, MoLSS and the Registrar-General’s
Office and more work on policy advocacy issues.
Reach, quality and intensity of support
4.52 Although substantial progress has been made in ‘reaching’ OVC, the evaluation team
considers that insufficient attention has been given to (a) the quality of the support services
delivered and (b) ensuring follow-up by the NGOs. The main areas of concern are as
follows:
Fragmented approach: Very few of UNICEF’s NGO partners address the child’s total
needs or examine the child’s needs in the context of his or her household. Despite the
fact that children suffer from multiple and often inter-related deprivations, UNICEF’s
NGO partners tend to focus on just one or two areas of need. Sometimes this can
produce a positive result (e.g., psycho-social care counselling) but generally the
outcome is less than would have been the case with a more integrated approach. As Mr
S. Mhishi, the Director of Social Services put it “..we have implemented a series of
projects rather than a coherent programme”. A fragmented approach is, in most
cases, an inefficient way to achieve outcomes.
For example, there is little point in paying a child’s school fees if he or she has no
uniform, books or stationery and is discriminated against in school and drops out. As
one focus-group participant put it:
“....we might be getting food from our gardens, but our children will still stay at home
without fees and uniforms and other important resources”26.
26
A Committee Member of the CPC in Chisina 3, Ward 24, Gokwe South district.

PoS for the NAP for OVC - Outcome Assessment - Final Report
Jimat Development Consultants /Page 25
Also, NGOs tend to provide the same type of support to all OVC in a community and
do not address the individual needs of the child. An example of this was reported in
District ‘A’, where all the OVC in a school were reported to have been lined up by a
field staff member and given one thing each. Those at the front of the line got
uniforms, the next got books and the remainder got stationery.
Also, if a child has received support from one organisation (no matter how small) it
may preclude him or her being assisted by another programme.
One NGO, in District B, that has adopted an integrated approach and blends money
from PoS with funds from a bilateral donor not in the OECD/OVC group to try
holistically to tackle the problems children face.
Beyond reach? The PoS has concentrated on reaching the largest number of OVC
and has given less attention to the quality of the support provided by NGOs. The
PoS started without agreed standards for the different support services to be
provided. These were introduced later (2009) but only after the NGO’s had started
work. Many NGOs told the evaluation team they are still unclear about the
standards, for example, for PSS. Moreover, the current monitoring system does not
assess the quality of interventions and the MoLSS/UNICEF agreed indicators
measure quantity not quality of support.
Lack of follow-up. It became clear from interviews with OVC, local stakeholders
and NGO staff that NGOs do not always maintain contact with OVC after they have
given assistance. Many NGOs are reported to deliver the service and leave (unless
they were working in the community, when they stay on). Only a few of the NGO
workers interviewed felt they had a responsibility to continue supporting the OVC or
to ensure outcomes (e.g., a child whose fees have been paid stays in school and
does not drop out) once the service had been provided.
The lack of follow-up is demonstrated by the fact that many of the OVC lists
provided to our research team by NGOs, included children who had moved away
(approximately 10 percent in rural areas and 15 to 20 percent in urban areas). The
fact that the NGOs were not aware of this indicates that they were not maintaining
sufficient contact with their beneficiaries after the service had been delivered.
Despite this, there are many examples of good practice, especially in psycho-social
care. For example, an NGO in District C and a Sub-Grantee in District D both
carefully followed OVC who received counselling and provided further support
where needed. The first NGO also sought to raise awareness among police officers,
teachers and education officers, in order to create a supportive environment for
OVC in need.
However, there are also examples of poor practice. For example, local people in
District E reported that staff of one NGO came in 2008 to measure the feet of
disabled children for footwear, after which the children heard nothing. The NGO
returned in 2009 to distribute buckets and soap – and then disappeared again!

PoS for the NAP for OVC - Outcome Assessment - Final Report
Jimat Development Consultants /Page 26
Output 2: Coordination and Finance
Rated ‘B’ – This output is being delivered well.
4.53 The PoS is well coordinated at the national level and donors have committed the
funding required to achieve the PoS targets (US$86 million). The coordination structure at
the national level has been described earlier and brings together all key stakeholders in
government (MoLSS and other ministries, the National Aids Council, UNICEF and donors
(Para 2.2, Box 1). UNICEF has worked hard to ensure that the Government of Zimbabwe
leads the programme and is well placed to take over full management of the programme,
once donors are able to fund government directly. Since the OECD donors cannot currently
fund the government directly, UNICEF pays the costs of the PoS Secretariat (in MoLSS)
from its own resources.
4.54. Sub-national coordination is generally less effective. The District Administrators,
Chief Executive Officers (CEO) and Social Services Committees usually ensure broad
geographic coverage but integration – bringing together the different government staff to
support of PoS implementation – is a challenge. Many structures at the district level are
dysfunctional (e.g., District AIDS Action Committees and Child Protection Committees in
some districts). In some districts, the NAP Core Team, DSS Welfare Officers, other
departments and NGOs rarely meet (e.g., Gowke South). In Hwange, on the other hand
they do meet regularly and provincial coordination in Matabeleland is also good. NGOs could
possibly play a bigger role in facilitating coordination, with support from UNICEF.
4.55 There is almost no coordination at the ward or village levels. In most wards there are
a number of different organisations and programmes operating, which rarely seem to be
coordinated effectively. Also, coordination between partner NGOs and Sub-grantees (SGs)
is not as effective as it should be. Many SGs interviewed report the NGOs monopolise the
resources coming from UNICEF and prioritise their usual areas of activity rather than
supporting other interventions which SGs have identified with OVC as priorities.
Output 3: Capacity of NGO partners
Rated ‘B/C’: This output is being delivered well, but with some problems.
4.56 UNICEF has run a programme of capacity building courses for its NGO partners
since Year 1. These cover ten areas: OVC programming skills; project cycle management;
partner management and development; managerial effectiveness, governance and
leadership; gender mainstreaming; child protection and participation mainstreaming; rights-
based approaches; information sharing; strategic planning; finance and administration; and
monitoring and evaluation (M&E).
4.57 Most NGOs reported that the courses have been useful and there are many
examples of NGOs strengthening their systems and ways of working as a result of the
training received. One or two NGOs would have liked higher-level training (e.g., on
organisational learning), but they are in a minority. UNICEF has also produced an interactive
DVD library of capacity development resource materials, for use by partners and others, and
ran training of trainers courses. Although the capacity courses started late (well after NGOs
had started work), they have proved effective.

PoS for the NAP for OVC - Outcome Assessment - Final Report
Jimat Development Consultants /Page 27
4.58 The main limitations of capacity building programme are that:
• Government officials have only recently joined the courses. Over 704 NGO staff
members have been trained but only 30 Government staff members have benefitted
directly.
• There has been no explicit quota on training courses for staff of SGs and no attempt
to design the more basic kinds of training, which many SGs need. The NGOs have
tended to avail all the training opportunities and have offered less places to their
SGs. In some cases SGs received information on training opportunities late making it
difficult for them to free their staff at short notice for the training. The “training-of-
trainers” approach which was envisaged at the start, with primary NGOs receiving
the training first and then cascading it to their Sub-grantees, was a good concept but
not systematically followed with support for the second level of training.
• The PoS has emphasised top-down learning (the training courses) and not
encouraged sufficiently horizontal learning (i.e., sharing of good practices among
NGOs and SGs, and with other organisations working with OVC). Also, only a few
courses involve either exposure visits to other programmes or follow-up visits by the
trainers to the organisations, which have been trained to reinforce good practice. The
Save the Children UK child protection course is a notable exception.
• The capacity building programme needs to be tailored more to the specific learning
needs of each partner organisation (e.g., possibly for mentoring and coaching).
4.59 UNICEF is aware of these limitations and is implementing changes in its capacity
building programme.
Output 4: M&E systems to ensure best practice
Rated ‘A/C’: This output is being delivered well, but with some problems.
4.60 UNICEF, working together with MoLSS and NAC, has developed an excellent output
monitoring system, based on self-reporting by NGOs against a set of indicators, which have
been developed jointly and harmonised with the national M&E system. The monitoring
system produces progress reports by intervention and NGO, and implementation rates (i.e.,
percent of target achieved) within thirty days of the end of each month. It has recently been
transferred fully to the NAP Secretariat, which now operates it. The system has been
adopted elsewhere in the region and has been recognised globally by UNICEF.27
4.61 In the last 18 months, UNICEF has also commissioned four operational research
studies to identify possible ways in which PoS implementation could be strengthened28 and a
27
UNICEF (2009), Guidance Document: Developing and operationalising a national monitoring and evaluation system for the protection, care and support of orphans and vulnerable children living in a world with HIV and AIDS, Working Paper, UNICEF, New York
28 On (a) An evidence based intervention for providing community support to HIV-positive children; (b)
identification of best practices on the provision of psycho-social support for OVC; (c) understanding the burden of HIV infection among primary school children; and (d) the impact of a pilot project for cash transfers (conditional and non-conditional).

PoS for the NAP for OVC - Outcome Assessment - Final Report
Jimat Development Consultants /Page 28
study on good practices on providing psycho-social support and early childhood
development centres.29
4.62 The main challenges facing the M&E of the programme are as follows:
• The monitoring system is based on self-reporting by NGOs, but there is no system
for checking the accuracy of their reports. UNICEF does make a small number of
surprise visits, but this is not done systematically in order to check the reliability of
the information in the database.
• The monitoring system does not currently attempt to assess the quality of the outputs
delivered. It only assesses the ‘reach’ of the programme. Quality is very difficult to
measure routinely (it involves a judgment on whether agreed standards are being
followed) and would probably best be done by independent assessors, working
closely with DSS staff in the districts, every six or twelve months.
There is a need for UNICEF programme staff (or consultants) to make more frequent
field visits to review NGO and SG programmes, identify what works and does not
work in PoS implementation and to share these lessons across the PoS and with
other organisations. The operations research studies mentioned earlier need to be
complemented by more rapid lesson-learning from the practice of partner
organisations. One of the main weaknesses of the programme is this lack of learning
in a timely way from field experience.
5. OUTCOMES
5.1 The study was described in the Terms of Reference as an impact assessment. But,
since the programme has only been going for 3 years, it is probably unrealistic to expect to
see many impacts (sustained improvements in the quality of life of OVC) though one should
see evidence of outcomes (use of the services provided/behaviour changes) resulting from
the outputs.
5.2 A logic diagram (‘model of change’) for PoS, which makes this distinction clear, is
given in Figure 8.
29
SAFAIDS (2009) Our Children, Our Future: Two Zimbabwean Good Practices addressing the issues of OVC, Southern Africa HIV and AIDS Information Dissemination Service,

PoS for the NAP for OVC - Outcome Assessment - Final Report
Jimat Development Consultants /Page 29
Figure 8 Logic Model
Inputs Outputs Outcomes Impacts
5.3 This section summarises the main results of the field research undertaken to assess
the outcomes of the programme on orphans and vulnerable children. Details are given in
Annex 5. The research sample comprised 926 orphans and vulnerable children who had
been covered by the PoS (the ‘treatment’ group) and 400 similar children as a ‘control
group’. There were no significant differences between children in the treatment and control
households.
Characteristics of OVC
5.4 Key characteristics of the two groups were as follows:
• 51% of the OVC household heads in the treatment group were single, divorced or
widowed, compared to 49% for heads of households in the control group. The mean
household size for the treatment group was 5.82, compared to 5.43 for the control
group.
• The treatment group included 4% child-headed households and 39% ‘generation
gap’ households (headed by one or two grand-parents); for the control group, the
figures were 2% and 35%, respectively.
• 69% of OVC households in the treatment group and 76% in the control group
reported running out of food in the past twelve months. Both groups ran out of food
for between 5 and 6 months.
• Nearly a quarter of OVC households in both groups did not have access to clean
water for drinking and cooking and approximately 40% obtain their water for
cooking and drinking fully or partly from streams, open wells, rivers, dams.
• A third of OVC households had no access to hygienic sanitary facilities and used
the bush and a combination of toilet and the bush as latrines.
• Only 3% of OVC in treatment and control groups lived outside family care (e.g.,
street children).
Donor /
UNICEF
funding for
PoS OVC
Use of those
services by
OVC and their
families and
associated
behaviour
changes
Sustained
improvements
in the quality
of life of OVC
and their
households
Improved
access to
services
for OVC in 7
key service
areas

PoS for the NAP for OVC - Outcome Assessment - Final Report
Jimat Development Consultants /Page 30
• The vulnerability status of OVC in the treatment and control groups was similar.
Close to 80% of children in both groups were vulnerable because they had been
abandoned, double-orphaned or were maternal orphans. Just under one-third of
children in both groups had no birth certificates.
• Almost 40% of children of school going age in both the treatment and control groups
had dropped out of school between 2007 and 2009.
Summary of Programme Outcomes Assessment 5.5 The household survey showed that children benefitting from the PoS received on
average 1.6 types of support30. School-related and psychosocial support were the most
common (32% and 31% respectively), while food and nutrition support, health care support
and child protection interventions made up 29% of the beneficiaries (Table 10). In view of
this, the outcomes analysis focused on the top five interventions which together made up
93% of the beneficiaries and therefore enabled conclusions to be made with reasonable
level of confidence. Nonetheless, some useful lessons could still be gleaned from the other
interventions based on the qualitative information collected. Detailed outcomes information is
presented in Annex 5.
Table 10: Percentage of children benefiting from different services under the PoS
Education
Support
Food and
Nutrition
Support
Psychosocial
Support
Child
Protection
Health
Care
Support
Shelter
clothing
and other
materials
Economic
Strengthening Total
32
11 31 9 10 4 4 100
5.6 The adequacy, effectiveness and relevance of services were assessed for each type
of support (Table 11). It was not possible to conduct this assessment for combinations of
different services, since the average number of services offered to each child was low (1.6)
and since this could have resulted in double counting. With the exception of ‘economic
strengthening’, over half of OVC household heads reported that support provided was
adequate, effective and relevant. Economic strengthening was rated low largely because of
the challenging economic environment where exchange for money was replaced with
bartering and ultimately bartering became impossible (consider periods – end of 2007 and
whole of 2008). Furthermore, there appeared to have been a mismatch for this service area
by targeting households which were labour and asset deficient and did not have capacity to
undertake economic activity.
30
UNICEF data reported in para 4.46 indicate a figure of 1.5 for the programme.

PoS for the NAP for OVC - Outcome Assessment - Final Report
Jimat Development Consultants /Page 31
Table 11: Proportion of households reporting that support provided was adequate
and/or effective and/or relevant
Interventions generally appreciated
Adequate Effective
(resolved problems) Relevant
Education 62 50 68 Food+ nutrition 57 49 81 Child Protection 51 47 62 Economic strengthening 39 23 30 Psychosocial Support 88 82 42 Health care 62 63 55 Shelter, clothing 74 90 83
5.7 Different interventions were offered for each service area. For example, five
instruments were used in education support. These were block grants, direct school fees
support, provision of learning materials and uniforms and vocational skill training. The
assessment shows that a larger proportion of the beneficiaries (46.7%) received direct
education assistance followed by learning materials (34.9%) and uniforms (10.3%).
5.8 Key observations can be made around programme outcomes. First, the PoS was
implemented under very challenging circumstances and all stakeholders performed well
given the prevailing situation. However, more could have been achieved. Second, the
fragmented nature of PoS programming could have compromised its outputs, outcomes and
ultimately impacts. For example, throughout the three-year project period, the scope of a
number of programming areas remained unclear (e.g., psycho-social support, child
protection and child participation). There were marked differences in the activities
undertaken by different NGOs in these service areas, especially for the first two years of
programming. The partner NGOs tended mainly to offer support in their traditional areas of
expertise and were less effective in new service areas. Minimum standards for interventions
were issued only in 2009 and remain poorly understood by implementing partners.
5.9 Also, because a limited number of services was offered to individual children, the
PoS could not comprehensively address the needs of OVC. For example, some children did
not stay in school, even when their fees were paid, because they lacked other critical
services, including food, uniforms, psycho-social support and school levies (which are higher
than school fees).
5.9 Interestingly, OVC from the control group also received support from outside
organisations. Although this was not on the same scale as those supported by PoS, it was
significant (50-60% of control group children were supported). This emphasises the need for
effective coordination at ward and village levels.
5.10 The large numbers of children who are vulnerable in Zimbabwe and the fact that
OVC are an ever shifting target, in terms of services required and in numbers involved,
require a robust monitoring system and a programming culture that is responsive and has
capacity to offer a basket of services. This will ensure OVC access complimentary services
to reinforce gains made in one service area.

PoS for the NAP for OVC - Outcome Assessment - Final Report
Jimat Development Consultants /Page 32
6. CONCLUSIONS AND NEXT STEPS
6.1 The overall rating scores proposed by the consultants, against OECD evaluation
criteria are as follows:
Overall programme B Relevance A Efficiency B Effectiveness B/C
6.2 The OVC approach was relevant in the context of a complex emergency situation.
Elements of the approach remain valid and will continue to be so in future. When the PoS
was launched in 2005/06, government had limited funds, there was an urgent need to
extend the basic services to large numbers of unserved OVC and to protect children from
abuse. These conditions still exist today and, at least for the next few years, the PoS will
continue to be needed.
6.3. UNICEF, MoLSS and partners have achieved a great deal in very difficult
circumstances. Outputs have been delivered and this has been done efficiently. Almost
400,000 OVC have received some benefit from the programme and implementation
rates are high. UNICEF has striven to be as efficient as possible (e.g., reducing overheads,
implementing the SG model and using centralised bulk procurement) in order to direct as
many of the funds as possible to NGOs for OVC, which is commendable.
6.4. However, in the Mission’s view, the programme could have achieved better
outcomes for OVC and higher overall value-for money (VfM). UNICEF may have cut its
overheads and operating budget too far. By spending a little more (e.g., to procure vehicles
more quickly, to employ a Grant Manager with necessary staff, to monitor quality and learn
lessons in a timely way) it could have delivered better for OVC. The Mission did not spend
long enough with NGOs to come to a view on whether their overheads and operating
budgets are adequate.
6.5 Recently, UNICEF has made important changes to the programme (e.g., capacity
building emphasising mentoring and horizontal learning; involvement of MoLSS staff in
trainings; and operational research on innovative approaches to capture and disseminate
best practice). However, further improvements are needed to improve the ways in
which UNICEF and its NGO partners deliver for OVC. The mission recommends that
consideration is given to:
(a) Strengthening the monitoring and evaluation system so that UNICEF can:
• monitor the quality of services provided by NGOs and SGs, against NAP
standards which would enable UNICEF and MoLSS to assess the relative efficiency
and effectiveness of different organisations and improve outcomes for OVC. The
DSS at provincial and district levels has a key role to play in quality assurance and
ways should be found to finance this;

PoS for the NAP for OVC - Outcome Assessment - Final Report
Jimat Development Consultants /Page 33
• check the quantitative self-monitoring data provided by NGOs and SGs (e.g.,
though unannounced visits by UNICEF or consultants appointed by UNICEF) and
devise a system for self-reporting of the quality of goods and services delivered;
• undertake rapid operational research assessments of key aspects of the
programme in order to understand the reasons for successes and failures and
disseminate these lessons across the programme;
• better assess the outcomes and impacts of the PoS, by undertaking tracer studies
of a random sample of OVC who benefitted from the main programme interventions
to assess outcomes (behaviour changes) and impacts (sustainable improvement in
the quality of OVC’s lives). These studies would require detailed interviews with
children, their carers and the service providers.
(b) Strengthening the grants management unit in UNICEF to minimise the time
UNICEF technical advisors spend on administration thus freeing up time for them to (a) visit
the field more frequently and (b) ensure that learning from the field is used to improve the
programme (i.e., are fed into organisational learning).
(c) Clarifying and revising grant agreements and performance indicators for NGOs
and SGs to encourage them to (a) maintain contact with OVC over time (e.g., though follow-
up visits) and (b) take a more holistic and comprehensive approach to the needs of
individual OVC, which takes account of their households’ needs.
(d) Producing operational guidelines on the NGO-SG partnership. These should
include: (a) specifying how funds will be shared between NGOs and SGs; (b) ensuring that
SGs are provided with capacity building, which addresses their needs; and (c) specifying
performance standards for the NGO and SG in respect of monitoring, flow of funds and
supervision; and (d) recommending regular workshops among SGs to discuss any problems
they face and identify solutions. NGOs and SGs should have recourse to UNICEF and/or
district DSS staff, if the guidelines are breached.
Targeting
6.6 The PoS has benefitted 397,000 OVC31 and 517,000 more children from the
revitalisation of BEAM. The PoS has already reached a significant proportion of the 1.35
million orphans and other vulnerable children it defined as its target group.
6.7 However, while some interventions have been effective (e.g. education, psycho-
social care), the fragmented approach (with many OVC receiving only one or two benefits,
and not necessarily their key priorities) means that outcomes have not been as good as they
could have been.
The Future of the PoS
6.8 The evaluation team supports the emerging consensus in Zimbabwe on the need to
put in place a comprehensive social protection framework for the country. The future of
31
As of 31st January 2010.

PoS for the NAP for OVC - Outcome Assessment - Final Report
Jimat Development Consultants /Page 34
the Programme of Support, beyond December 2010, should be considered in the context of
the probable development of this national social protection framework.
6.9 In a recent UNICEF report, Bernd Schubert estimates that 23 per cent of the people
of Zimbabwe live in moderate poverty and 55 percent in extreme poverty32. He estimates
that the extreme poor comprise an estimated 6.5 million people, including 3.5 million children
and live in 1.5 million households.
6.10 The extreme poor can be divided into two groups (see Figure 9):
Category C: Extremely poor households with no labour shortage, who need temporary social
transfers and support to develop livelihood strategies. This group should be able to work
themselves out of extreme poverty, with support from programmes like PRP (Protracted
Relief Programme).
Category D: Extremely poor households with insufficient labour, who will require long term
assistance until the children in the household grow up and are able to work. This group
comprises 250,000 households (approx. 1.25 million people) and is the PoS target group
(together with some of the more vulnerable children in Category C).
6.11 Category D comprises three types of households:
a) Child headed households;
b) ‘Generation-Gap’ households where a grand-parent or grand-parents are bringing up
their grand-children because their parents have died;
c) Households where there is a mother, father and/or adult child, but they are not able
to do productive work because they are either chronically ill (e.g., with AIDS),
disabled or have to look after dependents.
6.12 If a National Social Protection Framework is introduced, which includes cash
transfers to Category D (and some Category C) households, this would take care of many of
the needs of (b) and (c), because they would now be able to access services. However,
special assistance would still be needed for child-headed households and other child and
family welfare support would still be needed at community level (which would benefit all
households, not just Category D). It is likely that the Programme of Support is already
reaching many of these children with a variety of community-based services. A future PoS
would need to ensure careful case management of each of these children to ensure that a
wide range of quality services is available to meet their needs, and to complement such cash
assistance.
6.13 The support that OVC households would need, given a National Social Protection
Framework providing cash transfers, are shown in Figure 10.
32 B. Schubert (2010) Child-Sensitive Social Protection in Zimbabwe, UNICEF, Harare (Draft)

PoS for the NAP for OVC - Outcome Assessment - Final Report
Jimat Development Consultants /Page 35
Towards a National Social Protection Framework
6.14 The Mission considers that the PoS will have a key role to play in the transition
towards a National Social Protection Framework in Zimbabwe. The transition would probably
take 2-3 years and, as shown in Figure 11, would require:
• an action research project to test the cash transfer programme for Category D
households and pilot projects on strengthening of the Child Welfare System, and
improving delivery of basic services (e.g., BEAM); and
• expanding the reach and quality of services provided by PoS with a focus on quality
monitoring, operational research, lesson-learning and a more comprehensive and
integrated provision of services (see para. 6.4 , above).
6.15 The Mission would thus recommend that the PoS is extended for another three years
(2011 to 2013), to maintain the focus on meeting the need of OVC and to support the
government in the process of transition.
Figure 9: A typology of moderate and extreme poverty and the number of households
in each poverty category, in Zimbabwe
Source: Modified after B. Schubert (2010) Child-Sensitive Social Protection in Zimbabwe, UNICEF, Harare (Draft)
Temporary social
transfers and livelihoods
initiatives to work
themselves sustainably
out of extreme poverty
Long-term social
assistance until
demographic structure
changes – unable to
respond to labour-
based schemes
Absolute poverty line 78%
A Moderate Poor
400,000 Food poverty line 55%
B Moderate poor
100,000
C Extreme Poor
1,250,000
D Extreme Poor
250,000
No labour shortage
households
Labour shortage
households
1.5 m households / 6.5 m people/3.5 m children

PoS for the NAP for OVC - Outcome Assessment - Final Report
Jimat Development Consultants /Page 36
Figure 10: A Social Protection Framework for OVC
Cash Transfer
Household Livelihood
Government Service
Provision
Health care,
education, water
and sanitation
Special Needs of Children
Child protection, PSS, children with disabilities, child
headed households
Gap Filling Social
Protection as necessary
Government + Non-State
Actors
Government + Donors +
Private Sector
Government + Donors +
Private Sector
Non-State Actors
Figure 11: Towards a National Social Protection Framework
2010 2011 2012 2013 onwards
PoS OVC
Expand reach, focus on quality
operational research and lesson-learning
NATIONAL SOCIAL
PROTECTION FRAMEWORK
DSS Review
Pilot strengthening of the Child
and Family Welfare System
Improved Child and Family
Welfare Programme
Review BEAM
and other basic
services
Improve delivery of basic services
(Health, Education, Nutrition)
On-going operational Research
Improved delivery of basic
services
Pilot Project on
Cash Transfers
Introduce Cash Transfers for
Category D households across
Zimbabwe
Cash Transfers for Category D
National programme
Gap filling
Social Protection by Civil
Society

PoS for the NAP for OVC - Outcome Assessment - Final Report
Jimat Development Consultants /Page 37
Next Steps
6.16 Before the end of the PoS in December 2010, it is recommended that MoLSS, the
OECD donor group and UNICEF should undertake the following next steps:
1. Design a 3-year a follow-on Phase II Programme of Support (2011-13). The new
programme would aim to:
• build on the success of the PoS extending its reach to cover all children in
‘Category D’ households in Zimbabwe with comprehensive high quality packages
of support;
• develop and test new approaches to social protection (e.g., cash transfers,
removal of user fees in water and sanitation, health, education, etc) whilst at the
same time strengthening the Family and Child Welfare system to ensure quality
protection services to the most vulnerable, with special attention to girls and
children with disabilities. This would complement work in other social sectors to
improve access to and quality of health, education, birth registration, nutrition
services, etc) and support the scaling up of these so that they become building
blocks of the Government’s new National Social Protection Framework;
• enhance the capacity of Government to take over full management of the
National Social Protection Framework that is child and HIV sensitive and that
duly recognizes the special vulnerability of orphans and HIV-affected children,
once in place.
2. Further strengthen and consolidate the PoS ‘model’ so that it can be expanded
rapidly and effectively in Phase II. This would include:
• ensuring that each intervention is guided by minimum standards, including
reviewing the current MoLSS standards, revising these where necessary,
training partner NGOs, SGs and district DSS staff in their use, and
mainstreaming these into on-going NGO projects;
• experimenting with different ways for NGOs (probably initially in a district or
group of districts) to work together comprehensively to address the needs of
OVC, combining by different skills (e.g., in education, health, food and nutrition,
psycho-social support, economic strengthening and child protection) using an
alternative approach to sub-granting;
• assessing the capacity and effectiveness of UNICEF’s current NGO partners,
with a view to reducing their number, while developing their capacity more
effectively to work together and with sub-grantees (including producing
operational guidelines on the NGO-SG partnership and providing hands-on
support such as tailored training and mentoring during implementation);

PoS for the NAP for OVC - Outcome Assessment - Final Report
Jimat Development Consultants /Page 38
• defining clear criteria for partnerships with NGOs based on financial and
technical competencies;
• strengthening the capacity of DSS staff coordination structures at both national
and sub-national levels including providing them with the needed financial and
logistical resources to enable them to play a fuller and more effective role in both
coordination and quality assurance of NGO service delivery (reach, quality,
follow-up and cost-effectiveness);
• identifying and documenting best practice for all main PoS interventions,
promoting wider application by primary NGOs and SGs and, where feasible,
finding ways to introduce these into government service delivery systems;
• strengthening programme management and monitoring by putting in place
systems to: (a) check the accuracy of quantitative self-monitoring data provided
by NGOs and SGs; (b) assess the quality of support being provided by NGOs
and SGs; (c) undertake rapid operational research assessments of key aspects
of the programme in order to understand the reasons for successes and failures;
and (d) assess the outcomes of the PoS for OVC through ‘tracer’ studies; and
• UNICEF undertaking a review of its PoS management arrangements to assess
whether there is a need to strengthen staffing and/or systems to more effectively
deliver for OVC and to ensure value for money.
The aim of all these actions would be to (a) build the capacity of the PoS to deliver
more effectively in Phase II and (b) put these improvements in place before the start
of Phase II.
3. Generate up-to-date and reliable statistics on OVC to inform programming by
commissioning a ‘National OVC Census and Status Survey’ to generate up-to-date
information on demographic characteristics of OVC, their spatial distribution, and
the main pull and push factors determining their vulnerability. Special attention
should be paid to the situation of children separated from their families and living in
residential care. This information would form the basis for formulation of a more
comprehensive social protection programme for Zimbabwe. The Central Statistical
Office, the Department of Social Services, the National AIDS Commission, Ministry
of Health and Child Welfare and the Ministry of Education, Sports, Arts and Culture
should be actively involved in the survey.
4. Research on Orphaning to improve programme design (e.g., on the links
between high rates of maternal mortality and orphaning; on what happens to
orphans taken into care by external families (e.g., possible discrimination); on the
extent of differences between OVC and non-OVC in access to services), including
on HIV-affected orphans in families and communities.

PoS for the NAP for OVC - Outcome Assessment - Final Report
Jimat Development Consultants /Page 39
5. Assess how the delivery of critical complementary OVC services by
Government can be strengthened, including how to bolster birth registration
capacity and services of the Registrar General’s Office, strengthening the role of
the DSS in the family reunification of abandoned children, and role of the public
health sector in continuing with pediatric ART and other critical complementary
health services for the OVC. To effectively tackle this, the new PoS should have a
strong component on policy advocacy.
6. Evaluation of BEAM to improve the reach and quality of support provided to OVC
in the period of transition (2011-13) to a National Social Protection Framework,
which would include the abolition of fees in health and education. The evaluation
should include a school-level research to discover whether BEAM is cost-
effectively resulting in quality education and to make recommendations on how to
improve the system, including on the role of NGOs.
7. Coordinate more effectively with other programmes (e.g., PRP, ETF, SAT,
Children First) to ensure a variety of social transfers to OVC and other extremely
poor households and to benefit from possible synergies (e.g., sharing beneficiary
lists, mapping of activities in each district, joint monitoring, avoiding duplication).
This District Social Services Teams should play a key role in this process.

PoS for the NAP for OVC - Outcome Assessment - Final Report
Jimat Development Consultants /Page 40
ANNEX 1 – TERMS OF REFERENCE
Background It is estimated that more than one in four children in Zimbabwe has been orphaned in Zimbabwe.
Many children classified as orphans still have a surviving relative or parent and there is therefore the
need scale up support through families and communities where possible in line with the internationally
endorsed Framework of Protection, Care and Support for Children living in a world with HIV and AIDS
and more recent communiqué from the Global Partners Forum on Children and HIV and AIDS. As
well as children who have lost one or both parents, there are many highly vulnerable children living on
the streets, those who have engaged in hazardous child labour, children with disabilities and those
living with HIV and AIDS who require special attention.
Child vulnerability has been driven by a combination of factors in Zimbabwe including HIV/AIDS and
the economic downturn which has led to the collapse of many basic services. The National Action
Plan for Orphans and Vulnerable Children (NAP for OVC) is the vehicle through which the national
response to the plight of OVC is being implemented. The programme was developed in a
collaborative manner involving government line ministries and development partners. Following the
costing of the NAP for OVC programme the Programme of Support (PoS) was developed to provide a
multi-year – multi-donor and predictable source of funding for the implementation of the NAP for OVC
programme. The design of the PoS is in line with DAC/OECD principles for working in fragile states.
DFID NZAid, SIDA, Germany, AusAid, Netherlands and the EC have since contributed to the PoS
creating a pooled fund of around US$ 75 Million to date. DFID is the largest contributor to the pooled
fund with a commitment of £23 million over 4 years. Whilst funding continues to be channeled through
UN and NGOs, Government of Zimbabwe has played a constructive and lead role in this programme.
The PoS was launched in 2006 following Cabinet approval for the Guidelines for the
Operationalisation of the NAP for OVC. Immediately after, a national call for concept papers was
launched, inviting civil society organizations to submit their proposals in line with the seven objectives
of the National Action Plan for OVC. More than 160 concept papers were submitted and after a
thorough and transparent process, in November 2006 21 project proposals were approved by a
Technical Review Committee composed of 5 government ministries, National AIDS Council (NAC),
donors and UNICEF. In February 2007, tripartite agreements were signed between the 21
organizations and the MoLSS and UNICEF for a duration of 3 years, starting implementation
thereafter.
Disbursements through the programme have been slower than expected partly due to the challenging
operating environment over the last few years. Most partners were unable to operate for more than 6
months in 2008 due to the elections and suspension of NGO activities. Moreover the unstable
economic environment caused many implementation challenges.
This study is an impact assessment of the Programme of Support, in the build up to the third Annual
Review that will be conducted early 2010. This study will feed into the Annual Review and aims to
outline the efficiency, effectiveness and relevance of the programme, assess the impact the PoS has
had on OVC the last three years and examine the value and cost effectiveness of the programme
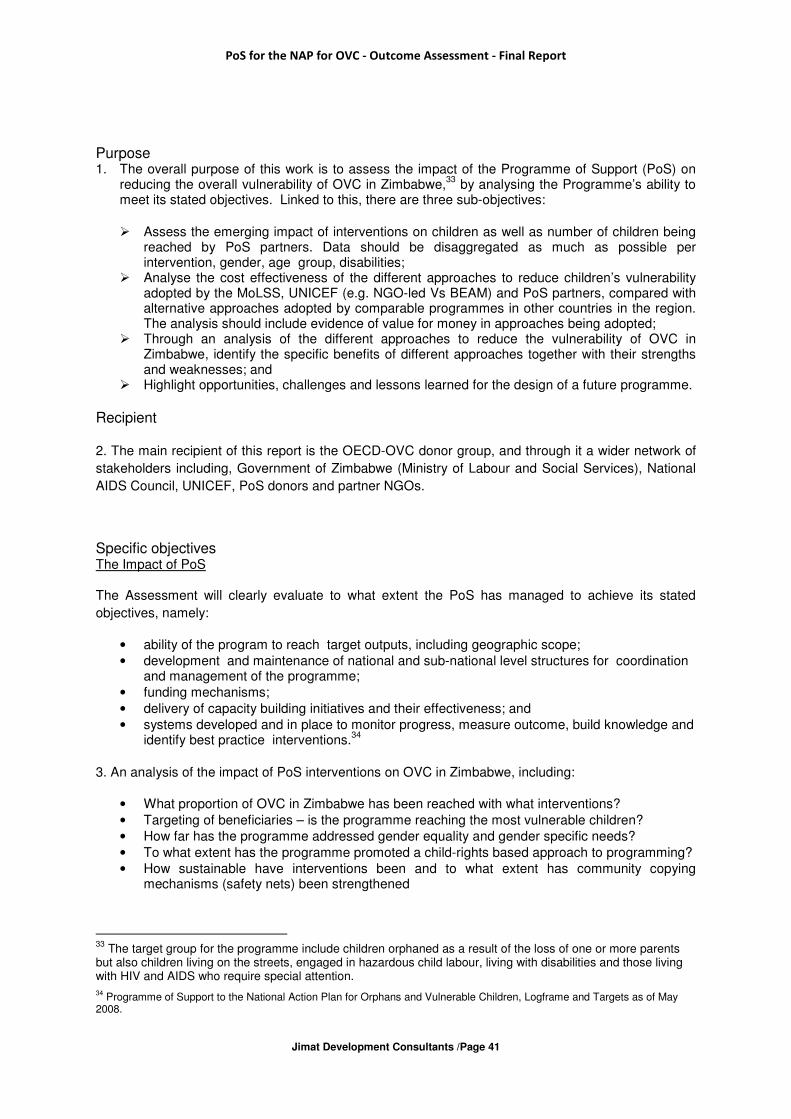
PoS for the NAP for OVC - Outcome Assessment - Final Report
Jimat Development Consultants /Page 41
Purpose 1. The overall purpose of this work is to assess the impact of the Programme of Support (PoS) on
reducing the overall vulnerability of OVC in Zimbabwe,33
by analysing the Programme’s ability to meet its stated objectives. Linked to this, there are three sub-objectives:
� Assess the emerging impact of interventions on children as well as number of children being
reached by PoS partners. Data should be disaggregated as much as possible per intervention, gender, age group, disabilities;
� Analyse the cost effectiveness of the different approaches to reduce children’s vulnerability adopted by the MoLSS, UNICEF (e.g. NGO-led Vs BEAM) and PoS partners, compared with alternative approaches adopted by comparable programmes in other countries in the region. The analysis should include evidence of value for money in approaches being adopted;
� Through an analysis of the different approaches to reduce the vulnerability of OVC in Zimbabwe, identify the specific benefits of different approaches together with their strengths and weaknesses; and
� Highlight opportunities, challenges and lessons learned for the design of a future programme.
Recipient 2. The main recipient of this report is the OECD-OVC donor group, and through it a wider network of
stakeholders including, Government of Zimbabwe (Ministry of Labour and Social Services), National
AIDS Council, UNICEF, PoS donors and partner NGOs.
Specific objectives The Impact of PoS
The Assessment will clearly evaluate to what extent the PoS has managed to achieve its stated
objectives, namely:
• ability of the program to reach target outputs, including geographic scope; • development and maintenance of national and sub-national level structures for coordination
and management of the programme; • funding mechanisms; • delivery of capacity building initiatives and their effectiveness; and • systems developed and in place to monitor progress, measure outcome, build knowledge and
identify best practice interventions.34
3. An analysis of the impact of PoS interventions on OVC in Zimbabwe, including:
• What proportion of OVC in Zimbabwe has been reached with what interventions? • Targeting of beneficiaries – is the programme reaching the most vulnerable children? • How far has the programme addressed gender equality and gender specific needs? • To what extent has the programme promoted a child-rights based approach to programming? • How sustainable have interventions been and to what extent has community copying
mechanisms (safety nets) been strengthened
33
The target group for the programme include children orphaned as a result of the loss of one or more parents but also children living on the streets, engaged in hazardous child labour, living with disabilities and those living with HIV and AIDS who require special attention.
34 Programme of Support to the National Action Plan for Orphans and Vulnerable Children, Logframe and Targets as of May 2008.

PoS for the NAP for OVC - Outcome Assessment - Final Report
Jimat Development Consultants /Page 42
4. An analysis of the economic and social benefits that OVC and their extended families or carers
have derived from the programme, including:
• increased access to entitlements (heath care, education etc) • increased access and productive use of available resources • status within their communities • Reduced vulnerability to abuse and exploitation.
Cost effectiveness 5. An independent cost effectiveness analysis of PoS, including:
• An analysis of the cost effectiveness of the different approaches to reduce children’s vulnerability adopted by the MoLSS, UNICEF (e.g. NGO-led Vs BEAM) and PoS partners;
• A comparison of the associated costs in delivering the programme to beneficiaries, including intra-household benefits, with the costs of other programmes of support to OVC in the region and in Zimbabwe; and
• Evidence of value for money in approaches being adopted
6. Analysis of both direct and indirect costs such as staffing, training, human resource management,
UNICEF and NGO partners overhead subsidies and indirect subsidies. UNICEF cost data should be
used for the study as these are relevant and accessible.
7. Analysis of cost effectiveness should as far as possible relate to a range of vulnerability reduction
and empowerment outcomes (social and economic) including both the immediate effect of this
support and the potential longer term benefits. Where this is not possible, this should be clearly stated
and the reason explained, and a comparison should only be made of broadly comparable costs.
Analysis of Effectiveness in Reducing the Vulnerability of OVC 8. Through an analysis of the different approaches to reduce the vulnerability of OVC in Zimbabwe,
identify the strengths and weaknesses of different approaches in relation to different kinds of
outcomes. The analysis can be extended to comparing the OVC programme in Zimbabwe, to one
other programme in the region (to be agreed).
Methodology
9. The Consultants methods should include but not be limited to: a review of all relevant PoS documents held by UNICEF and key programme partners; meetings with stakeholders as outlined in para 2, and with OVC and their families through field visits.
10. The Consultants will interact with the UNICEF Finance Department to get a full insight into the costing aspects of the programme, expenditure levels and patterns since the programme began in 2006.
11. The report indicates where comparative analysis is weakened by programme differences, data
availability issues and targeting.
12. Key to measuring the impact of PoS’ work will be to make an informed judgement of what would
have happened to OVC and their households in the absence of NAP for OVC interventions through
PoS (the ‘counterfactual’). In terms of the counterfactual, the consultants should consider looking at
OVC who are part of the programme, OVC who benefiting from the PoS, but are in an area where
there are PoS funded interventions and so may have gained benefits as a result of the PoS’ advocacy
and related work in terms of access to basic services etc, and OVC not covered by PoS.
Outputs 13. The main output will be a document of 20 pages, plus annexes, written in plain English which
covers the three main objectives of the study and practical, time-bound recommendations for
improving the impact and cost effectiveness of any future programme to support OVC in Zimbabwe.

PoS for the NAP for OVC - Outcome Assessment - Final Report
Jimat Development Consultants /Page 43
14. The lead consultants should share and agree the proposed methodology with the lead adviser
and project officer (and others, if appropriate) before the end of the first phase of the consultancy.
15. The final stage of the consultancy should include:
i. Consultants share their revised draft report with the key stakeholders (Ministry of Labour and Social Services, UNICEF and the OECD OVC group) for review for comments by email;
ii. Based on comments received, consultants present draft report to MoLSS, UNICEF and the OECD OVC group via projector and lead a discussion;
iii. Within 5 working days of the presentation, consultants will deliver final version of report with edits and additions agreed by all.
16. This document will be used to inform strategic decisions about future support to OVC in
Zimbabwe.
17. In order to strengthen the utilisation focus of the impact assessment, a follow-up day is
recommended 3 months after delivering the final report, with consultants, UNICEF and PoS partners.
Lead consultants participation can be facilitated through video/teleconferencing facilities.
Timeframe 18. This study will be split into two phases. Phase 1, starting from 15 January and lasting 5 days would be to scope the study, outline and agree the methodology, recruit local consultants and commission them to collect the necessary data. Phase 2 would form the substantive part of consultancy, and would be used for further data analysis, triangulation and reporting back to the Ministry, UNICEF and the OECD OVC group and for the drafting of the final report. This phase would start by 3
rd week of January 2010 for a period of 15 days. A third phase will be to finalise the report
with comments received from stakeholders, if required.
19. A total of 25 days is envisaged for this work, with 20 days in country (phase 1 and 2) and the rest for finalisation of the report (phase 3).
Reporting 20. First drafts of the report will be provided at least 48 hours before the presentation of the consultants findings and should take place by February 20, 2010.
21. Within 5 days of presentation, the consultants will provide a final version of the CBA of no more than 20 pages, in Word format by end of February 2010.
Coordination 22. The consultants will report to DFID for all technical and professional matters relating to this work.
Wendy Takundwa-

PoS for the NAP for OVC - Outcome Assessment - Final Report
Jimat Development Consultants /Page 44
ANNEX 2: TEAM MEMBERS
Steve Jones Team Leader
Munhamo Chisvo Economist
Backson Muchini OVC Specialist
Ngoni Marimo Survey Coordinator
23 Research Staff Field research and data analysis

PoS for the NAP for OVC - Outcome Assessment - Final Report
Jimat Development Consultants /Page 45
ANNEX 3: FIELDWORK ITINERARY
Team1
Date Organisation District Ward
19 March 2010 SCF-Norway, FST Beitbridge 2
20 March 2010 SCF-Norway, FST Beitbridge 2
22 March 2010 BRTI Hwange 11
23 March 2010 BRTI Hwange 11
24March 2010 HOCIC, NASCH,
Scripture Union
Bulawayo 2
25 March 2010 HOCIC, NASCH,
Scripture Union
Bulawayo 2
26 March 2010 MASO Gokwe 19 & 25
27 March 2010 MASO Gokwe 25
Team 2
Date Organisation District Ward
23 March 2010 FOST Shamva 20
25 March 2010 Care Masvingo 7
26 March 2010 Care Masvingo 7
28 March 2010 Christian CARE Kariba 6
29 March 2010 Christian CARE Kariba 6
30 March 2010 Christian CARE Kariba 6
2 April 2010 HOSPAZ Epworth 2
Team 3

PoS for the NAP for OVC - Outcome Assessment - Final Report
Jimat Development Consultants /Page 46
Date Organisation District Ward
18 March 2010 ASAP Nyanga 12
19 March 2010 ASAP Nyanga 12
20 March 2010 GOAL Nyanga 8
21 March 2010 ASAP Nyanga 8
23 March 2010 FOST Shamva 20
24 March 2010 NASCH Shamva 1
31 March 2010 Harare (Chitungwiza) FST 24

PoS for the NAP for OVC - Outcome Assessment - Final Report
Jimat Development Consultants /Page 47
ANNEX 4: FIELD RESEARCH METHODOLOGY
1. The study was carried out in five phases as follows:
a) Inception b) Desk review c) Field data collection, data entry and cleaning d) PoS Implementing partners workshop (NGO Workshop) e) Data analysis, synthesis and report writing
Desk review
2. During the desk review phase, all relevant literature on the PoS and comparable
programmes in Zimbabwe and the Southern Africa region were collected and reviewed.
Consultants also studied the information in the NAP for OVC and PoS M&E databases to
obtain information on outputs, outcomes and lessons. They gathered information on direct
and indirect costs of the PoS and comparable programmes, and carried the cost-
effectiveness analysis guided by the steps in section 4 of this chapter.
3. Apart from document review, key information interviews were also conducted
targeting Harare-based stakeholders, the main ones being the following: NAP for OVC
Secretariat; UNICEF (management, programme, M&E and finance staff); the OECD – OVC
donor group; PoS implementing partners (NGOs); sub-grantees; and agencies managing
comparable programmes such as Children First Project, STRIVE project, and DFID PRP
MTLC. Through these interviews the experts were able to gain a deeper insight into issues
such as: the design of the programme; the geographical and thematic coverage; the NGO
partners that were selected and how they were selected; technical and financial due
diligence carried on the NGOs; the components and activities that were funded; the
resources that were spent to-date; implementation arrangements that were put in place and
how effective the institutional arrangements were; the M&E system that was set up and how
well it functioned; the financial systems that were introduced and how they performed in
terms of speeding up disbursements, ensuring value for money and reducing fiduciary risk;
challenges during implementation; major outputs; successful models developed through the
PoS and what the future of the PoS should be.
Field data collection, data entry and cleaning
4. The approach to field data collection comprised the following components:
(a) quantitative household survey targeting household heads to gain quantitative insight
into the outcomes at OVC level;
(b) Focus Group Discussions targeting OVC (treatment group only) and adult community
members (care givers/community volunteers, general community members, community
leaders/headmen, etc) to explore targeting mechanisms, delivery mechanisms, local
participation and ownership, community capacity, most significant changes in terms of
access of OVC to basic social services and their quality of life;

PoS for the NAP for OVC - Outcome Assessment - Final Report
Jimat Development Consultants /Page 48
(c) district level Key Informant Interviews (KII) targeting implementing partner staff, and
members of the district child protection committees and/or social welfare committees to gain
insight into issues of relevance to national policy, district priorities and felt needs at
community level; capacity of government systems including M&E; quality of programme
coordination; implementation capacity of NGOs; best practice models; challenges during
implementation; quality of outputs and outcomes achieved; comparative analysis of different
approaches to service provision (e.g., via NGO or direct to target group); sustainability of
PoS impacts;
(d) KII targeting school heads/teachers, and technical line ministry field officers to
assess the effect of the PoS from their perspectives;
(e) school-based case studies on BEAM (in this case, the study targeted one school per
each of the ten provinces to carry out a detailed comparison of education support through
BEAM and that via NGOs – this information helped to answer questions of targeting
effectiveness, reach, cost and intermediate outcomes);
(f) OVC case studies to assess relevance and effectiveness of the PoS in terms of
changing lives of children – i.e., increasing access to and utilisation of services, and
improving quality of lives of children (outcomes);
(g) other case studies and documentaries – in assessing how the PoS has changed the
lives of OVC in Zimbabwe in the last 3-4 years.
For the field data collection phase, the sampling methodology which will determine the
geographical locations where the quantitative household survey will be conducted is
discussed in detail in section 2 of this report.
PoS Implementing Partners’ Workshop
5. The team managed to hold a three hour workshop with NGOs during the 1st quarter
review meeting to get their overall impressions on the successes, failures and challenges of
the PoS over the evaluation period.
Data analysis, synthesis and report writing
6. Quantitative data will be analysed in SPSS. The quantitative data will be triangulated
with the qualitative data from FGDs, KII, desk review, case studies, and the NGO workshop
before drawing conclusions on the outcomes and impacts of the PoS.
Qualitative data will be entered into qualitative data matrices which allow for discourse
analysis. Discourse analysis enables common themes and trends in responses from
stakeholders to be picked up. These will then be used to draw conclusions on the extent to
which the programme achieved its stated objectives as well as outcomes.

PoS for the NAP for OVC - Outcome Assessment - Final Report
Jimat Development Consultants /Page 49
Sample design
7. For the quantitative data collection, a weighted random sampling method was used
to select the wards to be covered in each province. Each province was weighted according
to the number of wards in which work started in Year 1 of the programme (2007) to
determine how many wards (1, 2 or 3) should be selected. Sampling Year 1 operations
allows the team to analyse outcomes for activities that have had the longest gestation time
under the PoS and therefore more likely to have produced results at outcome and impact
levels as well.
8. In selecting the number of wards to be covered, it was assumed that a total of 480
OVC households would be interviewed with 30 OVC household interviews in each ward (20
OVC households covered by the programme and 10 control households). However, a total of
407 OVC households were eventually interviewed because the team could not be allowed
access two wards in Kariba district. From these households a total 1325 children had data
collected, 409 controls and 926 treatments.
9. A random selection was then made35 of:
• one district in each province; and
• the required number of wards from that district.
10. The consultants would have preferred to have randomly selected wards from each
province, but that would have resulted in highly dispersed research sites. Given the tight
time schedule and limited resources for the study, it was decided to select all the wards for
each province from just one district in the province.
11. During field work, the villages and households surveyed were also selected
randomly, using random number tables.
Table 1: Surveyed districts and wards
Province District No wards
NGOs
Manicaland Nyanga 2 GOAL, CRS
Mashonaland Central
Shamva 2 ZIMNHAM, FOST
Mashonaland East
Seke Rural 1 HOSPAZ
Mashonaland West
Kariba Rural 3 SC - UK, Christian Care, CRS
Masvingo Masvingo Rural
1 CARE
Matabeleland North
Hwange 1 BRTI
35
Using the random number generator at www.random.org

PoS for the NAP for OVC - Outcome Assessment - Final Report
Jimat Development Consultants /Page 50
Province District No wards
NGOs
Matabeleland South
Beitbridge Rural
1 FST, SC-Norway
Midlands Gokwe 2 MASO
Harare - 1 Chitungwiza 1 FST
Harare - 2 Epworth 1 HOSPAZ
Bulawayo – 1 BYO Central 1 HOCIC, Scripture Union
Total 10 16 15
12. The selected districts and number of wards and NGOs working in the selected wards
are given in Table 2 and a Map 1 shows the research locations. Hurungwe was replaced
with Kariba after considering a donor request to cover Save the Children UK projects, and
also Chikomba was replaced with Seke rural from the original sample because HOSPAZ had
the PCA with the sub-grantee cancelled. There were also some changes in the wards that
were selected for the evaluation and finally visited because some NGOs had either just
begun implementing or had stopped all together.
13. A total of 15 NGOs (6 international and 9 international) are working in the wards to be
covered.
Map 1: Quantitative Household Survey Sites
Masvingo
Midlands
Matabeleland North
Manicaland
Mashonaland West
Matabeleland South
Mashonaland East
Mashonaland Central
Harare
Bulawayo
300 0 300 600 Kilometers
N
Zimbabwe's Provinces Beitbridge DistrictBulawayo DistrictChitungwiza DistrictGokwe DistrictHwange DistrictKariba DistrictMasvingo DistrictNyanga DistrictShamva DistrictHarare District
Seke rural
Epworth, and
Chitungwiza

PoS for the NAP for OVC - Outcome Assessment - Final Report
Jimat Development Consultants /Page 51
14. Other sampling approaches were considered, including using sample frames based
on population, size of grant and type of PoS activity, but it was agreed, at a meeting with
donors and UNICEF on 8th March at the Netherlands Embassy, to use the method outlined
above.
15. In total, the study covered all 10 provinces (8 rural and 2 urban).
1.0 Field Research Methods
16. The field research studies were carried out by three teams:
Team Leader Districts
1. Backson Muchini Beitbridge, Bulawayo, Hwange, Gokwe
2. Ngoni Marimo Kariba, Seke rural, Masvingo
3. Lead Research
Assistant
Nyanga, Shamva, Harare
17. Each team will comprised one Team Leader, one Field Supervisor and six field
researchers, with at least two female field researchers in each team. A Lead Research
Assistant/Supervisor who was given backstopping support by the Economist from the office
led the third team on occasions
Table 2: Typical Field Research Programme
Day 1 Team Leader Supervisor Field Teams
AM Meeting with District Administrator, other officials and NGOs working in the sample ward. Travel to ward. Meetings with community leaders.
PM
Focus group discussion with (a) Community Leaders and (b) NGO staff
Random selection of PoS OVC households, identification of control households, and random selection of OVC ‘control’ households.
Household surveys with PoS OVC children and households
Day 2
AM Detailed discussion with wider group of key informants at district on the PoS OVC.
Focus groups with OVC children and community. Collection of poems and drawings by OVC children. Photos
Household surveys with PoS OVC children and households
PM Household surveys with OVC control households

PoS for the NAP for OVC - Outcome Assessment - Final Report
Jimat Development Consultants /Page 52
18. The typical programme that was followed for the field research is given in Table 3 (for
a province with one ward to be included in the survey). The detailed itineraries for the field
teams are given in Annex 3.
19. The focus group discussions elicited the views of key groups (e.g., government
officials, NGOs, district and local leaders) on the situation of OVC in the area and the
strengths and weaknesses of the PoS and other programmes and to assess the capacity of
the NGOs (how efficient and effective are they in service delivery, monitoring and evaluation,
and financial management). These were undertaken by the Team Leader, using checklists
and a semi-structured questionnaire with the NGO workers.
20. The household interviews were carried out by the field teams. They used a structured
questionnaire to capture:
• basic information on the OVC and their households; and
• details of the types support available to OVC (Education, Food and Nutrition, Child
Protection, Economic Strengthening, Psychosocial Support, Healthcare and
Housing/Clothing), their outcomes for the OVC and the adequacy, effectiveness,
relevance and sustainability of the support.
22. The NGOs working in the selected wards were informed, a few days ahead, that
theoutcome assessment field teams will be visiting so give them enough time to make
necessary preparations and ensure that key informants are available. However, the specific
villages and OVC households for interview were decided once the field team had arrived in
the ward.
Selection of control households
23. Considerable care was taken to ensure that the OVC control households are as
similar as possible to the PoS OVC households for more effective comparison. To ensure
that selection of controls was carefully done, a step by step guide was used in the field by
the survey team.
24. To select controls, the research team obtained information on the selection criteria
used by the NGO to select the treatment group. The 20 OVC randomly selected from the
treatment group will be sub-grouped according to the characteristics which led to their
enrolment onto the PoS programme. The total number for each criterion/characteristic were
established. The research team would then use the same characteristics and proportional
distribution of the sampled treatment group to select the control groups such that if say, 50%
of the treatment group were selected mainly because they were double orphans (lost both
parents) and had no adult household heads, then the control group of 10 would also have
50% of the OVC matching these two characteristics. Hence, only households with children
who match the selection criteria for the sampled ‘treatment group” would be considered for
the control group.

PoS for the NAP for OVC - Outcome Assessment - Final Report
Jimat Development Consultants /Page 53
25. In all cases, the research team identified control households with children who meet
the NAP criteria of classifying a child as an “OVC” but have been “left out”. To be considered
as a control, a child would have characteristics that qualified him/her for the PoS intervention
in question, but the child was not included, neither did the child indirectly benefit from the
PoS intervention. The child would be living in a similar village setting, have a similar culture,
socio-economic status and remoteness to the treatment OVC.
Limitations of the study
26. The main limitations of the field research were:
• time and cost constraints, which meant that only about 1.5 days could be spent at
each location – this limited the time available for cross-checking and more detailed
probing;
• the small number of children who received less common interventions (e.g.,
nutrition education), which made it difficult to assess the adequacy or effectiveness of
these inputs – despite an overall sample size of over 900 OVC beneficiaries;
• the possibility that NGOs, who knew in advance that the field research teams would
come, had influenced the responses of the OVC and their households. While this is
possible, our experienced field supervisors do not think this had happened;
• difficulties in gaining permission from the authorities to work certain wards (e.g., in
Kariba and Epworth), which necessitated some last minute ‘non-random’ changes to
the sample;
• the fact that approximately 10 percent of the OVC on the lists provided by NGOs in
rural areas no longer lived locally and in urban areas, the figure was15-20 percent.
Although this was not a serious problem for the research (other children were
randomly selected), it is suprising that the NGOs were not aware that these children
had moved.

PoS for the NAP for OVC - Outcome Assessment - Final Report
Jimat Development Consultants /Page 54
ANNEX 5: FIELD RESEARCH RESULTS
1. This annex presents the analysis of the field survey data collected as part of the
outcome assessment study. The methodology is described in Annex 4.
A. Household Demographic Characteristics
2. The OVC households surveyed included child-headed households (4% in the
treatment group and 2% in the control), generation-gap households (39% in the treatment
group and 35% in the control) and 57% in the treatment and 64% in the control had
household heads aged 18 to 49 years (Table 1).
Table 1: Age Groups and Sex of Heads of Households
Total Male Female
Treatment Control Treatment Control Treatment Control
Under 18 Number 10 2 2 0 8 2
% households 4 2 4 0 4 2
18-49 Number 148 83 34 26 114 57
% households 57 64 62 77 56 60
50 and
above
Number 102 45 19 8 83 36
% households 39 35 35 24 41 38
Total
Number 260 130 55 34 205 95
% households 100 100 100 100 100 100
Marital Status of Heads of Households and Household Size
3. Approximately 51% of the OVC household heads in the treatment group were single,
divorced or widowed, compared to 49% for heads of households in the control group. In the
treatment sample, mean household size was 5.82, whilst the control group had a mean
household size of 5.43 (table 2).
Table 2: Marital status by mean size of the household
Marital
Status
Mean Size of Household
Treatment Control Total
Mean
size
Number of
households
Mean
size
Number of
households Mean size
Number of
households
Single 4.33 24 5.45 11 4.69 35
Married 6.29 128 5.67 66 6.08 194
Divorced 4.90 21 5.36 11 5.06 32
Widowed 5.75 87 5.07 41 5.53 128
Total 5.82 260 5.43 129 5.69 389

PoS for the NAP for OVC - Outcome Assessment - Final Report
Jimat Development Consultants /Page 55
Educational Level of Heads of Households
4. More than half (56.3%) of the heads of households in the treatment group had either
primary or no formal education, compared to 57.5% in the control (Table 3).
Table 3: Education levels of household-heads of OVC
Gender
Education level
Primary Secondary College No formal
education Total
T C T C T C T C T C
Male Number
16 14 29 20 3 0 6 1 54 35
%
households 30 40 534 57 6 0 11 3 100 100
Female Number
89 53 79 32 1 2 33 5 202 92
%
households 41 58 39 1 2 16 5 100 100
Note: T= treatment; C = Control
Water and Sanitation for OVC Households
5. Nearly a quarter of OVC households in treatment and control groups had no access
to clean water for drinking and cooking (Table 4). Approximately 42% of the treatment group
and 38% in the control group sourced their water for cooking and drinking from streams,
open wells, rivers, dams or combinations of these with safe sources.
Table 4: Sources of water for cooking and drinking
Category
Sources of water for cooking and drinking Total
Bore
hole
Bore
hole
Str
ea
m
Bore
hole
/
Open w
ell
Bore
hole
and o
ther
Str
ea
m
Open
We
ll
Open w
ell
and o
ther
Riv
er
Tap
Wate
r
Pro
tecte
d
We
ll
Dam
T
No 94 1 1 0 8 83 1 10 54 3 3 258
% 36 0.4 0.4 0 3 32 0.4 4 21 1 1 100
C No 51 0 4 1 2 37 0 6 27 1 0 129
% 40 0 3 1 2 29 0 5 21 1 0 100
Total No 145 1 5 1 10 120 1 16 81 4 3 387
%
38 0.3 1 0.3 3 31.0 .3 4 21 1 1 100
6. A third of OVC households had no access to hygienic sanitary facilities. Thirty-two
percent of OVC households in both treatment groups were using the bush and a
combination of toilet and the bush for relieving themselves (Table 5).

PoS for the NAP for OVC - Outcome Assessment - Final Report
Jimat Development Consultants /Page 56
Availability of Food in OVC Households
7. Approximately 69% of treatment and 76% of the control group households reported
running out of food in the past twelve months. Both groups ran out of food for 5 to 6 months
(5.85 months for the treatment and 5.47 months for the control groups). (Tables 6 and 7).
Table 5: Types of sanitary facilities used by households with OVC
Treatment/
control Toilet
Both Toilet
and Bush
Toilet and
Other Bush Other Total
Treatment
Number
174 3 0 81 3 261
% 67 1 0 31 1 100.0
Contol
Number
87 0 1 41 0 129
% type 67 0 1 32 0 100.0
Total
Number
261 3 1 122 3 390
% 67 1 0.3 31 1 100.0
Table 6: Households, which ran out of food in past twelve months
Yes No Total
Treatment Control Treatment Control Treatment Control
Number
180 100 82 31 262 131
% households
69 76 31 24 100 100
Table 7: Average number of months households ran out of food
Mean Sample size
Treatment Control Treatment Control
5.85
5.47 264 131
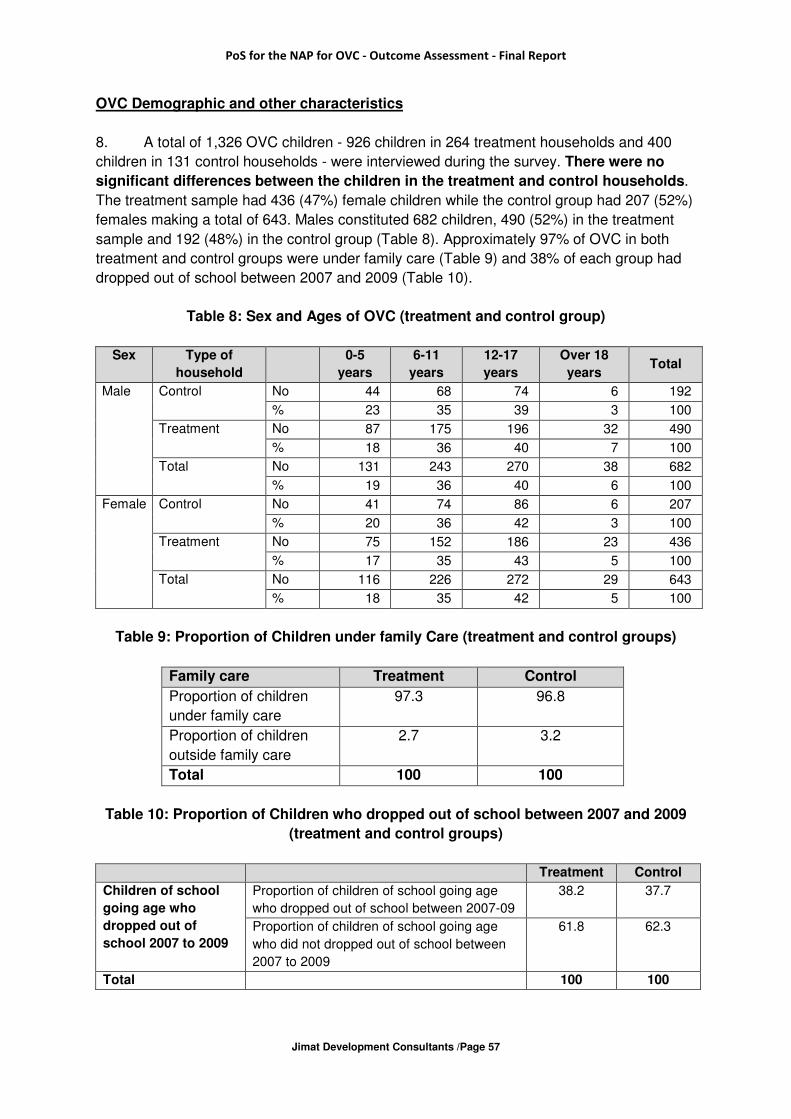
PoS for the NAP for OVC - Outcome Assessment - Final Report
Jimat Development Consultants /Page 57
OVC Demographic and other characteristics
8. A total of 1,326 OVC children - 926 children in 264 treatment households and 400
children in 131 control households - were interviewed during the survey. There were no
significant differences between the children in the treatment and control households.
The treatment sample had 436 (47%) female children while the control group had 207 (52%)
females making a total of 643. Males constituted 682 children, 490 (52%) in the treatment
sample and 192 (48%) in the control group (Table 8). Approximately 97% of OVC in both
treatment and control groups were under family care (Table 9) and 38% of each group had
dropped out of school between 2007 and 2009 (Table 10).
Table 8: Sex and Ages of OVC (treatment and control group)
Sex Type of
household
0-5
years
6-11
years
12-17
years
Over 18
years Total
Male
Control No 44 68 74 6 192
% 23 35 39 3 100
Treatment
No 87 175 196 32 490
% 18 36 40 7 100
Total No 131 243 270 38 682
% 19 36 40 6 100
Female
Control No 41 74 86 6 207
% 20 36 42 3 100
Treatment
No 75 152 186 23 436
% 17 35 43 5 100
Total No 116 226 272 29 643
% 18 35 42 5 100
Table 9: Proportion of Children under family Care (treatment and control groups)
Family care Treatment Control
Proportion of children
under family care
97.3 96.8
Proportion of children
outside family care
2.7 3.2
Total 100 100
Table 10: Proportion of Children who dropped out of school between 2007 and 2009
(treatment and control groups)
Treatment Control
Children of school
going age who
dropped out of
school 2007 to 2009
Proportion of children of school going age
who dropped out of school between 2007-09
38.2 37.7
Proportion of children of school going age
who did not dropped out of school between
2007 to 2009
61.8 62.3
Total 100 100

PoS for the NAP for OVC - Outcome Assessment - Final Report
Jimat Development Consultants /Page 58
9. Almost 77% of OVC in the treatment group and 76% in the control group were aged
6 to 17 years (Table 11 below).
Table 11: Ages of OVC (treatment and control groups)
Age Group Treatment (%) Control (%)
Age 0-5 years 17.5 21.3
6-11 years 35.3 35.6
12-17 years 41.3 40.1
18 and over 5.9 3.0
Total 100 100
Vulnerability status
10. The vulnerability status of OVC in the treatment and control groups was similar.
Close to 80% of children in both groups were vulnerable because they had been
abandoned, double-orphaned or were maternal orphans (Table 12). Approximately 30% of
children in both groups had no birth certificates.
Table 12: Vulnerability Status of OVC
Variable Category Treatment (%) Control (%)
Main causes of vulnerability
Vulnerability
status
Abandoned children 39.5 43.6
Double orphaned children 22.8 16.5
Maternal orphans 14.2 20.6
Sub-total 76.5 80.7
Other causes of vulnerability
Children of imprisoned parents 0 0.8
Neglected Children 4.9 5.1
Destitute Children 0.2 0.8
Abused children 3 1.1
Children outside family environment 0 0.8
Child parents 1 1.4
Children in conflict with the law 0.1 0
Children in remote areas 9.1 6.5
Children with Chronically ill parents 3.9 3.3
Children living with disabilities 0.3 0.3
Other 0.2 0
Total 100.0 100.0
Bad practices 11. Household heads was asked whether they considered that bad practices affecting children were ‘non-existent’, ‘rare’ or ‘frequent’. Over 20% of those

PoS for the NAP for OVC - Outcome Assessment - Final Report
Jimat Development Consultants /Page 59
interviewed reported that child labour and forced labour are common; between 15% and 19% considered that emotional, physical and sexual abuse of children is common; and between 10% and 15% reported that stigmatising and discrimination against OVC is common (see Table 13).
Table 13: Bad Practices Affecting Children
Practice
No/% of household heads reporting problem is:
Non-
existent
Rare Common Total
Grabbing of OVC property No
135 82 34 251
% 54 33 14 100
Sexual abuse of children No
127 83 38 248
% 51 34 15 100
Emotional abuse of children No
125 79 45 249
% 50 32 18 100
Physical abuse of children No
120 84 42 246
% 49 34 17 100
Children in paid work No
131 53 53 237
% 55 22 22 100
Spirit appeasement No
168 47 12 227
% 74 21 5 100
Forced marriage No
121 59 62 242
% 50 24 26 100
Stigmatising of OVC No
129 80 25 234
% 55 34 11 100
Discrimination against OVC No
131 79 31 241
% 54 33 13 100
B. Outcomes Assessment 14. This section analyses the outcomes resulting from the different PoS interventions. It presents a child centred analysis of beneficiaries of the PoS programme. While 926 children in households with OVC benefiting from the PoS were captured in the household survey 904 children received at least an intervention under the PoS. However, education and psychosocial support constituted the larger share of beneficiaries, 32% and 31% respectively, while food and nutrition support, health care support and child protection interventions made up 29% of the beneficiaries (Table 14). The other interventions accounted for only 7% of the beneficiaries. As a result, the analysis will focus on the top five interventions which together made up 93% of the beneficiaries and therefore conclusions can be made with reasonable level of confidence. Nonetheless, some useful lessons can still

PoS for the NAP for OVC - Outcome Assessment - Final Report
Jimat Development Consultants /Page 60
be gleaned from these interventions based on the qualitative information collected. This is presented in a separate sub-section.
Table 14: Percentage of Children benefiting from different interventions under the PoS
Education
Support
Food and
Nutrition
Support
Psycho-
social
Support
Child
Protection
Health
Care
Support
Shelter
clothing
and other
materials
Economic
support
Total
32
11 31 9 10 4 4 100
Education Support 15. Five instruments were used under education support. These included block grants, direct school fees support, provision of learning materials and uniforms and vocational skill training. Table 15 shows that a larger proportion of the beneficiaries (46.7%) received direct education assistance followed by learning materials (34.9%) and uniforms (10.3%).
Table 15: Distribution of education assistance
(% education beneficiaries)
Block grants Direct School
fees support
Learning
materials
Uniforms Vocational
Skills training
Total
7.7 46.7 34.9 10.3 0.4 100
16. All interventions were considered relevant by beneficiaries (60.4% to 87.5%) and the adequacy of support was generally satisfactory (Table 17 on perceptions on adequacy). The interventions also had varying outcomes on the lives of OVC including keeping children in school, improving children’s ability to learn and improving OVC’s self-confidence in school.36 17. However, benefits varied among interventions. Block grants appear to have kept children in school over the period of evaluation (85.7%) more than direct fees (38.6%) and the other components of education support (16.8% for learning materials and 21.4% for uniforms37).This is possibly due to the longer duration of support under block grants (average of 17.4 months) than direct fees (11.4 months), learning materials (9.2 months) and uniforms (7.9%) (Table 16). Teacher incentives, and other school levies also had a negative impact on school attendance as most students that fail to pay either of these are sent away from school. As a caregiver of a double orphan in Nyanga ward 8 put it: “…my child was sent away from school in the second term of 2009 because I could not afford the US$3 incentive required for the teacher despite ASAP paying for his school fees. I cannot pay the money, as I have nowhere to sell my agricultural produce. ” 18. A second reason is that very little support has been provided for secondary education. As children graduate from primary school, they also fall out of school as caregivers of OVC are generally poor and cannot afford the higher secondary school fees
37 Learning materials have a lesser chance of improving school attendance but improve the ability of children to
learn effectively.

PoS for the NAP for OVC - Outcome Assessment - Final Report
Jimat Development Consultants /Page 61
plus the incentives for teachers. For example, 71.8% of OVC in treatment households that dropped out of school between 2007 and 2009 had lacked school fees and levies while 11.8% dropped out because they lacked school fees, levies, stationery and uniforms. Again, the weak integration of the different components under education assistance and other interventions within the PoS portfolio of responses could also have contributed to other children dropping out (see Case Study 1 below). Quality of education enhancing interventions such as learning materials and confidence building interventions such as uniforms have a positive impact on children remaining in school as 38.3% of beneficiaries benefiting from these interventions noted. Thus, despite the general appreciation of the interventions, a noticeable number of beneficiaries, ranging from 42.1% for block grants to 52% for uniforms, rated the interventions as having partly resolved their problems (Table 17).
Table 16: Changes in the lives of OVC from education assistance
Changes Reported block grants direct fees
learning materials
Uniforms
Child remained in school Number 18 49 16 6
% 85.7 38.6 16.8 21.4
Children learnt to read and write
Number 4 22 58 3
% 19.1 17.3 61.1 10.7
Improved child’s self confidence
Number 0 21 11 17
% 0.0 16.5 11.6 60.7
Child currently in school Number 8 62 28 12
% 38.1 48.8 29.5 42.9
Other Number 0 6 12 3
% 0.0 4.7 12.6 10.7
Case Study 1
“In 2008 Lubhancho paid Nyasha’s38 school fees and provided him with school
exercise books and ball point pens. He managed to stay in school that year.
However with the myriad of challenges that he faced this support alone could not
keep him in school the following year.” (Note: Nyasha not his real name)
Table 17: Perception of adequacy, effectiveness and relevance of food and nutrition support
Block
grants Direct fees
Learning
materials Uniforms
Relevant 87.5 60.4 70.4 87
Adequate 75 61 64.6 52
Resolved
problems
57.9 50.9 49.4 48
19. When compared to direct fees, block grants seem to be more relevant, adequate and resolve the problems of education better for OVC. Several factors contributing to this include that block grants have a direct effect on quality of education (as indicated by 19.1% of block
38
Nyasha is a double orphan who lives on his own in Kamativi urban.

PoS for the NAP for OVC - Outcome Assessment - Final Report
Jimat Development Consultants /Page 62
grant recipients) depending on what is provided for the grant. Out of the 10 schools visited for in-depth case studies, fee support from PoS partners was used for activities related to directly improving the quality of education and learning environment while majority of fee support under BEAM is used for administrative related expenditure for the school (Table 18).
Table 18: Comparison of NGO led and BEAM education assistance
PoS Use NGO (%) BEAM (%)
Building Teachers Cottages 10 10
Stationery 30 10
Build toilet 10 0
Transport 30 0
Procure text books 20 0
Counter books and markers 20 0
Sports 40 10
Administration 10 20
Construction of Buildings 30 0
Gardening & EWP activities 20 0
Repair of school buildings 20 20
Payment of amenities 10 10
Teacher Incentives 10 0
Paying Guard 10 0
Grounds man wage 10 0
20. Implications. School fees are not the panacea for keeping children in school. An integrated approach involving different interventions is needed to improve attendance, confidence and learning ability of OVC. This package should also be linked to the other PoS interventions to provide a well-rounded and holistic safety net for the child. Integration should not only look within the PoS but also at other channels of financing education assistance in the targeted areas to ensure efficient use of resources. 21. Secondly, it is important to consider providing support for secondary education as this increases the opportunities for the OVC and could have a major impact on reducing intergenerational transmission of poverty. While BEAM in some ways deals with this problem, beneficiaries generally complained of the low numbers being take up for secondary school education under BEAM. As most of these households are chronically poor39 and are in the poorest income quintile, chances of a child continuing through to secondary school once support is cut after primary level are minimal. 22. Thirdly, the education assistance model adopted by the PoS may need to be pursued in conjunction with advocacy work on policy changes especially given the large numbers of children unable to access education services because of household poverty (consider the figure of 3.5 million children vulnerable). Many children are increasingly unable to access education because of user fees (school fees, levies) and the requirement for uniforms. Is supporting an education system with a fee structure that discriminates on the basis of other fees (boarding, levies) and requirements like uniform rights-based?
39
B. Schubert (2010) Child-Sensitive Social Protection in Zimbabwe, UNICEF, Harare (Draft)

PoS for the NAP for OVC - Outcome Assessment - Final Report
Jimat Development Consultants /Page 63
Food and Nutrition Support 21. While five interventions were implemented under food and nutrition support, most resources seem to have gone into supplementary feeding and nutrition gardens in the areas visited for the evaluation. The numbers captured for the other interventions: training, nutrition behaviour change and inputs distribution are too small to make meaningful conclusions on them and thus the analysis in this section focuses on supplementary feeding and nutrition gardens (Table 19).
Table 19: Interventions under food and nutrition support (% OVC receiving each intervention)
Training Supplementary
feeding
Nutrition
behaviour
change
Nutrition
gardens
Inputs
distribution
Total
1.9 66.0 1.0 22.3 8.7 100
22. Supplementary feeding and nutrition gardens contributed to various outcomes including: increased food access and health status; improved school performance; improved school attendance; increased access to pens and exercise books; and improved quality of meals (Table 20). Majority of supplementary feeding beneficiaries reported that children did not complain of hunger (67.7%) and some reported improved health status (30.9%). On the other hand, some nutrition gardens beneficiaries reported children could buy text books and pens (17.4%), increased number of meals (21.7%) and improved quality of meals (13%). Nonetheless, both interventions partly resolved these problems despite being adequate in terms of size of support (Table 21).
Table 20: Outcomes of food and nutrition support Outcome Supplementary
feeding Nutrition gardens
Children did not complain of hunger
Number 46 1 % children 68 4
Improved children’s health status
Number 21 2 % children 31 9
Improved school performance
Number 3 0 % children 4 0
Improved school attendance Number 9 2 % children 13 9
Increase in number of daily mails
Number 15 5 % children 22 22
was able to purchase books and pens
Number 4 4 % children 6 17
Improved quality of meals Number 0 3 % children 0 13
Improved child responsibility, enjoys gardening
Number 0 1 % children 0 4

PoS for the NAP for OVC - Outcome Assessment - Final Report
Jimat Development Consultants /Page 64
Table 21: Perceptions on adequacy and effectiveness
Category Supplementary feeding Nutrition gardens
Adequate 56.8 82.4
Resolved problems 41.9 46.7
23. For supplementary feeding, this can be better understood when general food security level is taken into account for these households. On average 68.7% of the treatment households interviewed have no food for about 5.85 months per year. As a result supplementary feeding, though important for the health and food intake for the child, it did not adequately resolve the problem of food insecurity because of household level lack of food. In some cases access to supplementary feeding resulted in meal substitution at the home as the child could be sent home without eating anything because they would get a porridge ration at school. Thus, while addressing child level food security it is also important to consider household level food security through livelihoods promoting interventions or at least have a linkage between child rights centred interventions funded through PoS and other interventions funded through other pipelines of support. 24. Contribution of nutrition gardens to the various outcomes of food and nutrition support is very minimal (see Table XX above). Main weaknesses of nutrition gardens in the areas visited for the evaluation included labour deficits in targeted households, lack of sustainable ground water for irrigating vegetables, and the lack of market linkages for surplus production. Other challenges included relevance of the seeds for vegetables in the target areas (see case 2 below) and crop protection from pests and animals. These challenges, which are common for nutrition gardens, were unknowingly scaled up without improvements in these fundamental flaws.
Case Study 2: Community members Gokwe South Ward 25
“…gardens were irrelevant for us because the vegetables have no market and not enough
as food. The vegetables are seasonal which has little impact on our lives.”
Case Study 3: Beneficiary of nutrition garden Kariba Ward 6
"There is no one to sell the vegetables to here because everyone has vegetables. I now
have only one bed of rape left in my garden. It’s not worth prioritising.”
25. Implications. Food and nutrition support for OVC needs to be linked with household livelihood interventions to improve food intake (quality and quantity) for all members of the household (including the child). Nutrition gardens need to be linked to markets and a proper assessment of needs in the target area for them to be relevant. Psychosocial Support 26. Under psychosocial support, six key areas of support were provided to OVC: counselling; life skills; memory work; music, art and dance; speak out; and emotional and spiritual support. Majority of the support was through counselling (35.4%), life skills camps (24.3%), and music, art and dance (16.4%). 27. A majority of household heads (53.5%) reported that counselling of OVC resulted in orphans in their care developing positive connections with them and improving their relations with their peers (20.2%). An interesting observation has been the acquisition of counselling skills by OVC, which contributes to sustainability of the intervention. An interesting 17.2% of

PoS for the NAP for OVC - Outcome Assessment - Final Report
Jimat Development Consultants /Page 65
households indicated that their children had acquired skills to counsel others. This outcome of psychosocial support is also observable in beneficiaries of life skills camps. These benefits of psychosocial support interventions increase sustainability and child participation and therefore are important to strengthen. 28. Each of the interventions had a greater degree of effect on a specific outcome or number of outcomes. For example, interventions in music art and dance, speak out and emotional and spiritual support enable OVC to develop self-esteem and relations with peers while counselling and emotional and spiritual support are significant in developing positive connections between the child and caregiver. Life skills camps on the other hand, had small effects on all outcomes of psychosocial support. This can be attributed to the fact that during life skills camps a bit of all the interventions are provided to OVC attending the camps but entrenchment of impact has lacked because there has been a missing link between the camp and life after the camp. In most of the psychosocial support programmes visited for the evaluation provision of life skills support is not combined with longer-term provision of psychosocial support for the child and indeed for the caregivers which is also very important for providing a home that promotes the well-being of the child (see Case Study 4).
Case study 4
Outcomes of psychosocial support training beyond the child, Shamva District
Special Needs Education and Psychological Services officer
“… attitudes of teachers and school staff was bad to the disabled and OVC but this has
changed after the training on children rights.”
29. Based on this analysis Table 22 details the importance of different interventions under psychosocial support for different outcomes.
Table 22: Importance of different interventions under psychosocial support for different outcomes
Counselling Life skills Music art
and dance Speak out
Emotional
and
spiritual
support
Orphans developed positive
connection primary caregivers 4 3 1 1 3
OVC have improved self-
esteem 2 3 4 3 4
Build coping skills of OVC
2 3 2 1 2
OVC relate to others well
2 3 4 2 4
Acquiring skills to counsel other
children 2 2 1 1 1
Scale: 1= not important; 2= moderately important; 3= important; 4= very important
30. From the varying degrees of effect of the different interventions, it is clear that forms of psychosocial support need to be driven by the problem to be addressed which was not the case for most interventions under psychosocial support in the PoS. To demonstrate this most of the beneficiaries of psychosocial reported that the form of psychosocial support provided was not what they needed at the time of provision (ranging from 13.6% for speak out to 42.2% for counselling).
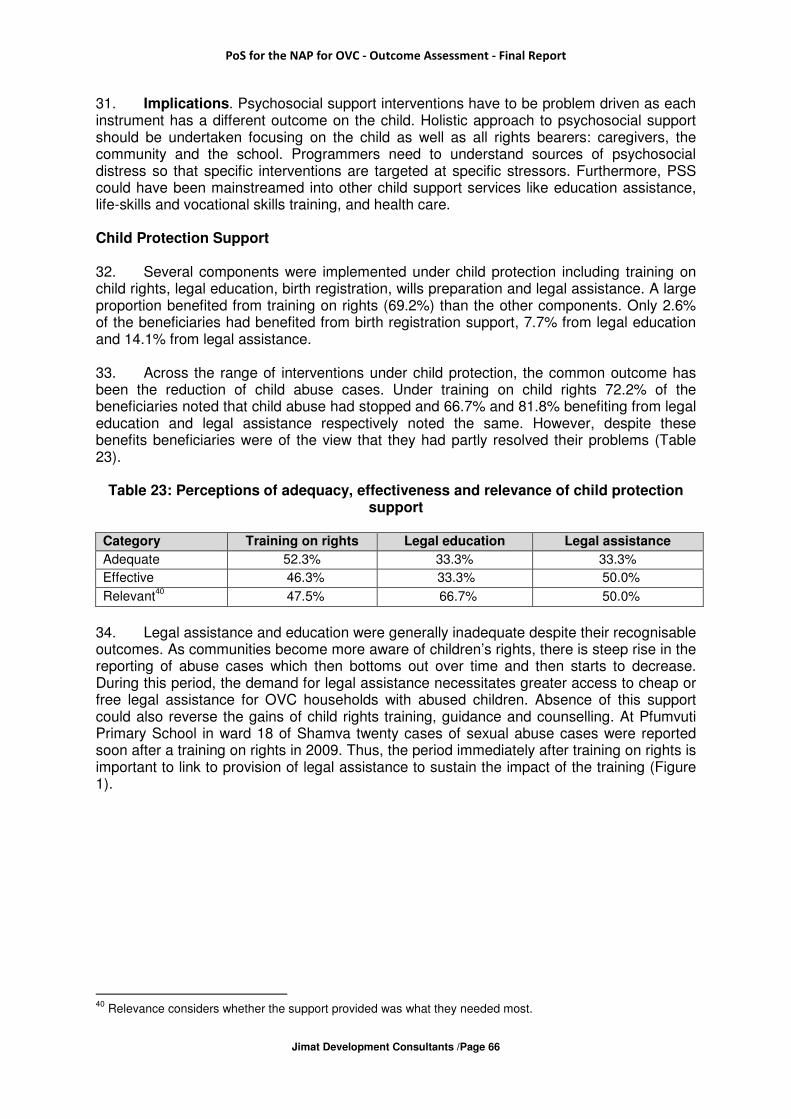
PoS for the NAP for OVC - Outcome Assessment - Final Report
Jimat Development Consultants /Page 66
31. Implications. Psychosocial support interventions have to be problem driven as each instrument has a different outcome on the child. Holistic approach to psychosocial support should be undertaken focusing on the child as well as all rights bearers: caregivers, the community and the school. Programmers need to understand sources of psychosocial distress so that specific interventions are targeted at specific stressors. Furthermore, PSS could have been mainstreamed into other child support services like education assistance, life-skills and vocational skills training, and health care. Child Protection Support 32. Several components were implemented under child protection including training on child rights, legal education, birth registration, wills preparation and legal assistance. A large proportion benefited from training on rights (69.2%) than the other components. Only 2.6% of the beneficiaries had benefited from birth registration support, 7.7% from legal education and 14.1% from legal assistance. 33. Across the range of interventions under child protection, the common outcome has been the reduction of child abuse cases. Under training on child rights 72.2% of the beneficiaries noted that child abuse had stopped and 66.7% and 81.8% benefiting from legal education and legal assistance respectively noted the same. However, despite these benefits beneficiaries were of the view that they had partly resolved their problems (Table 23).
Table 23: Perceptions of adequacy, effectiveness and relevance of child protection support
Category Training on rights Legal education Legal assistance
Adequate 52.3% 33.3% 33.3%
Effective 46.3% 33.3% 50.0%
Relevant40
47.5% 66.7% 50.0%
34. Legal assistance and education were generally inadequate despite their recognisable outcomes. As communities become more aware of children’s rights, there is steep rise in the reporting of abuse cases which then bottoms out over time and then starts to decrease. During this period, the demand for legal assistance necessitates greater access to cheap or free legal assistance for OVC households with abused children. Absence of this support could also reverse the gains of child rights training, guidance and counselling. At Pfumvuti Primary School in ward 18 of Shamva twenty cases of sexual abuse cases were reported soon after a training on rights in 2009. Thus, the period immediately after training on rights is important to link to provision of legal assistance to sustain the impact of the training (Figure 1).
40
Relevance considers whether the support provided was what they needed most.

PoS for the NAP for OVC - Outcome Assessment - Final Report
Jimat Development Consultants /Page 67
Figure 1: Integration of training on rights and legal assistance (legal education and direct assistance in prosecution)
Health Care Support 35. Health care support comprised of health education, general treatment, Primary Health Care Promotion (PHC promotion), construction of water and sanitation facilities, HIV prevention, and Anti-retroviral treatment (ART). However, much of the support provided in the areas visited for the evaluation was in the form of health education (40.4%) and HIV prevention (20.2%). 36. The main benefit that OVC have derived from health education is increased health seeking behavior (68.4% of recipients) while HIV prevention enabled increased knowledge on HIV transmission and prevention among beneficiaries (36.8%). Health education was perceived as more relevant, adequate and effective than HIV prevention activities in addressing different outcome objectives (Table 24).
Table 24: Perceptions on adequacy, effectiveness and relevance of support
Category Health care education (%) HIV prevention (%)
Relevance 53.3 0
Effective 60 40
Adequate 66.7 0
Other interventions 37. This section looks at some the lessons that can be gleaned from the other interventions that were provided to the least proportion of beneficiaries: economic strengthening support and provision of shelter, blankets and other materials. 38. Internal savings and loans (IS&L), which were the dominant intervention in economic strengthening in the areas visited for the evaluation, were largely unsuccessful. About 52.4% of the beneficiaries of IS&L did not see any significant improvement in the lives of OVC benefiting from this support and only 5.7% of the beneficiaries indicated the project resolved their problems and 62.9% and 31.4% perceived the project to have party resolved their problems and not resolved problems respectively (Table 25). Despite their failure beneficiaries indicated that these were quite relevant.

PoS for the NAP for OVC - Outcome Assessment - Final Report
Jimat Development Consultants /Page 68
Table 25: Perceptions on adequacy, effectiveness and relevance of IS&L
Category IS&L (%)
Adequate 28.6
Effective 5.7
Relevant 65.7
Source: survey results 39. The failure of IS&L is linked to several factors First, by nature IS&L do not work for the very poor households because of the need to make an initial investment by those participating. Most of the households targeted for this intervention are among the poorest 10% and do not have income to save and thus involvement in IS&L becomes limited. If they do manage to join either through borrowing (in some groups the initial investment was US$1) substitution of a need for the investment sustaining the groups was problematic because money would not flow back into the group. This is because income from the savings clubs will be used for consumption i.e. meet unfulfilled needs, thus affecting investment viability of the groups. Thus, the setting up of IS&L should have moved from the norm (where initial investment is provided) to providing at least a start up kit (monetary investment, sewing machine etc) to ensure viability and sustainability of the IS&L groups. Secondly, training and frequent monitoring of the functionality and outcomes of the IS&L were weak in the projects visited. Thirdly, IS&L need to be linked to market palatable goods that could be traded by members of IS&L for the groups to function viably. Outcomes at Community Level (building capacity of communities to respond to the needs of OVC) 40. The PoS was designed to build community level capacity for child protection. The Child Protection structure was designed to be cascaded from national to sub-national levels – to provincial, district, ward, and village levels. This structure was functional at national and provincial levels. There were no functional CPCs in more than half of the districts, more than three quarters of the wards and villages visited by the evaluation team. Outcomes at Organizational Level (building organizational level capacity to respond to the needs of OVC) 41. The NGO capacity development was viewed by many NGOs as successful and was
reported to have contributed to major changes in their organizational systems and
procedures. However, many felt capacity development could have come earlier, could have
been cascaded down to sub-grantees and could have used a range of approaches including
coaching clinics with

PoS for the NAP for OVC - Outcome Assessment - Final Report
Jimat Development Consultants /Page 69
ANNEX 6 – EFFICIENCY AND COST EFFECTIVENESS
1. This section discusses (a) the efficiency of the design and the implementation
process (the quality and pace of implementation vis-a-vis implementation targets) and (b) the
cost-effectiveness of the PoS.
A. EFFICIENCY
2 The PoS was right from the outset not conceived as a stand-alone programme but
one to provide financial support towards implementation of an existing national programme,
the NAP for OVC. This was a pillar of strength from an efficiency standpoint. By not
reinventing the wheel, but supporting already identified and agreed upon national priorities
and initiatives, the PoS was able to benefit from existing institutional structures identified for
the implementation of the programme. However, the absence of direct PoS support to
government structures that were supposed to play a key role in coordination and
supervision, stood out as a systemic design flaw of the PoS, which affected not only
the speed of implementation but quality of outputs and, ultimately, results for
children. This problem was raised in every Annual Report but with no real concrete
corrective action having been possible partly due to the donor moratorium on direct state
support, which was part of the conditionality governing the PoS funding. With the collapse of
fiduciary risk management within government, however, the moratorium was
understandable41. However, the culture in government is slowly changing and the urgently
required innovations on how to support these important players may be possible.
3. The PoS focused on scaling up existing support for OVC so as to maximise reach
and outcomes for children, as opposed to starting new interventions altogether. This
approach was a much needed fast-track route for reaching children. It enabled many
participating NGOs and CBOs to retain and attract additional qualified staff, expand
their operations and achieve economies of scale42. Some NGOs such as GOAL, Save
the Children Norway, Action Aid and other international NGOs were able to bring in
additional resources mobilised outside the PoS. In some cases, such matching funds were
reported to be in the order of 30-40%. Nevertheless, the absence of systematic technical
due diligence on the programmes that were being scaled up (except that which was
done through the project proposal approval process) resulted in some inefficient
operations unintentionally being scaled up. This was not helped by the absence of
minimum design standards for some of the interventions (such as child participation) or the
lack of their enforcement where such existed (e.g., food and nutrition support). For example,
with the exception of a few, many NGOs that provided support for nutrition gardens did not
follow good practice, or lessons learnt from previous work done by UNICEF, DFID’s
Protracted Relief Programme, EU, DG ECHO and FAO in this area. In addition, across all
41
Many government institutions have audits that are overdue
42 Many of the sampled NGOs interviewed confirmed having increased their staff establishment and geographic
and thematic scope of their interventions, with this investment having paid off mainly in the first and third year of implementation

PoS for the NAP for OVC - Outcome Assessment - Final Report
Jimat Development Consultants /Page 70
supply-led interventions, there was a widespread absence of systematic follow-up of
beneficiaries to monitor the utilisation of the inputs provided to OVC.
4 The third important feature of the design of the PoS was the pool funding mechanism
whereby a number of donors contributed financial resources into a common pot. The study
finds this mechanism in perfect alignment with the “three ones” principle43 and thus a good
example of how donors can still work harmoniously together in a “fragile state”
context towards fulfilling the Paris Declaration Principles on Aid Effectiveness44. The
number of donors participating in the OECD-OVC group meetings has consistently
increased so has funding for OVC programmes during the PoS. The pool funding
mechanism to a large extent managed to increase predictability of funding for OVC, and
efficiency of NGO planning, from one-year funding cycles to a 3-year funding framework.
This achievement however, was somewhat reversed when, some NGO budgets were
rationalised in light of challenges with absorption capacity. In addition, some NGOs lost their
previous direct donor funding when they joined the PoS.
5. A major shortfall of this pool funding mechanism, however, was precisely the fact that
PoS funds were not, and could not be channelled through the government system in full
compliance of these PD principles. Hence, creation of a shadow structure, though necessary
at the time of growing international isolation of the Government of Zimbabwe, was obviously
at the cost of adding another layer of bureaucracy and transaction costs. Though transaction
costs were reasonably well managed by UNICEF mainly through better coordination of NGO
funding, implementation and monitoring and evaluation OVC initiatives (see section on cost-
effectiveness below), the presence of a shadow structure, in any case often reduced the
visibility of government and that of the donors, and according to the Department of Social
Services, this was at the cost of NGO accountability to Government for quality
programming. The presence of two agreements governing the implementation of the PoS
((i) the Tripartite Agreement signed by the NGOs, UNICEF and the Government and (ii) the
Project Cooperation Agreement signed only by UNICEF and the NGOs) inevitably led to a
dual accountability system (i.e., technical accountability to Government and financial
accountability to UNICEF) with the latter often overshadowing the former given the “power”
in financial control.
6. A fourth major feature of the PoS design were the multi-stakeholder institutional
arrangements for PoS coordination and implementation comprising the NAP Secretariat for
OVC and its sub-national structures at provincial, district and local levels as the overall
coordinating body, the OECD-OVC group as funding agencies, UNICEF as fund manager,
the Working Party of Officials, the Technical Review Team, the Core Team and the NGOs
and CBOs as implementers. By and large, the study found that the composition and roles
of these institutions were well articulated in the Operational Guidelines for the PoS,
they promoted good interaction and cooperation among the key stakeholders and
facilitated broad-based ownership and flexibility which helped to clear some of the
43
The three ones are: one agreed OVC action framework that provides the basis for coordinating the work of all partners (this is the NAP for OVC); one national OVC coordinating authority, with a broad based multi-sector mandate (this is the NAP for OVC Secretariat in the Department of Social Services); and one agreed country-level monitoring and evaluation system (which is the NAP for OVC M&E Framework, which is 100% harmonised with the national M&E system)
44 These are Ownership, Alignment, Harmonisation, Managing for Development Results, and Mutual
Accountability

PoS for the NAP for OVC - Outcome Assessment - Final Report
Jimat Development Consultants /Page 71
most challenging bottlenecks encountered both at inception and during programme
implementation. However, capacity bottlenecks associated mostly with understaffing of
coordinating and implementing bodies negatively affected the pace at which implementation
took place right from the beginning. The study also found that ownership of the programme
at the level of NGOs was somewhat lower.
Efficiency of PoS Implementation
Selection and contracting of NGOs
7. The flood gate system used for the call for concept notes was well received by
NGOs and was transparent. It enabled the programme to select implementing partners
from a wide base, but the large response rate (over 140 Concept notes) overwhelmed the
capacity of the Core Team and the TRC thus prolonging the selection process. Despite
UNICEF and the MoLSS having given good guidance to the NGOs through 10 provincial
pre-application workshops, and the national proposal writing workshop, the quality of
concept notes and, subsequently, the project proposals, varied widely as shown by the final
selection of only 21 (i.e., 15%) of the initial 140+ NGOs that had indicated interest in the first
round – an outcome that resulted also in many frustrations, especially among many non-
successful local NGOs. The TRC also noted several gaps in thematic and geographic
coverage, as well as participation of local NGOs, which, to some extent, were later
addressed through targeted calls45, this in itself being a positive development. Whilst the
flood-gate system, with its large response rate, enabled PoS management to better
appreciate the interest and capacities within the NGO sector, the guidelines accompanying
the first call for proposal could have better targeted NGO competencies as well as thematic
and geographic coverage using more focused and customised selection criteria46.
8. A key feature of the NGO selection process was the hands-on technical support
given by the Core Team to NGOs with “promising projects”. This, together with
subsequent generic training on project proposal writing offered through the PoS Capacity
Development agenda, was appreciated by many NGOs as having improved the quality of
project design. This, however, did not automatically translate into implementation of quality
interventions, as many NGOs lacked implementation capacity, information on best practices
was scant and monitoring/supervision by the TRC was either weak or absent altogether47.
About half of the composition of TRC came from the Government and were not supported
directly through the Pos for monitoring and supervision of activities on the ground. Neither
were the sub-national structures of the NAP for OVC Secretariat supported for their
important technical oversight role. Their participation in project monitoring depended on the
voluntary efforts of NGOs to extend transport and other logistical support to their government
45
Support to OVC with disabilities and those living in institutions and on the street were cited as examples of themes where special targeted calls were made
46 Special points could have been given to traditionally marginalised themes like support to OVC with disabilities,
paediatric ART, child participation, adolescent reproductive health, or activities in certain under-serviced districts, or certain types of NGOs, etc
47 Although it was not explicitly their core role, members of the TRC were best placed to jointly go for monitoring
visits and see if their recommendations to NGOs at the time of project proposal were indeed implemented on the ground

PoS for the NAP for OVC - Outcome Assessment - Final Report
Jimat Development Consultants /Page 72
counterparts and such rare acts of benevolence from NGOs also compromised the
independence and objectivity of monitoring visits48 by state actors at district level.
9. An innovation that the Core Review Team and the TRC considered was to
encourage NGOs to form consortia so as to benefit from their collective experience and
better package project proposals, especially covering thematic areas that were under-
represented in the initial response to the first round call or to increase the level of
participation of local NGOs in the PoS. Conceptually the merits of consortia arrangements
appeared sound, but practically the PoS encountered some major challenges with
disbursement, implementation and liquidation under these NGO partnership
arrangements as there was little prior experience either among the NGOs involved or
within UNICEF and the MoLSS on how to manage such types of collaboration49. In
retrospect, the innovation needed to be taken as a separate project, and accompanied
closely with supervision and tailored mentoring to ensure success.
10. Once selected, NGO proposals were subjected to further scrutiny by UNICEF’s
Contract Review Committee (CRC). This additional step, although imposing another layer of
bureaucracy which delayed contracting and processing of the initial disbursement, ensured
both transparency of the selection process and value for money, as the CRC took an
independent quality check and further rationalised NGO budgets for cost-efficiency.
Disbursement of funds to NGOs
11. What perhaps could be termed the most challenging aspect of the PoS was
management of disbursements in a hyper-inflationary environment50, where monetary
policy was unstable, exchange rates were severely distorted, and the supply economy
for programme inputs and services was increasingly going informal, thereby
progressively making it difficult to apply rigid internationally accepted procurement
standards51. Under these circumstances, the study finds that UNICEF displayed both a
sufficiently high degree of flexibility to ensure value for money and sound financial
management to minimise fiduciary risk.
12. Initial delays in disbursements caused by the decision by UNICEF to first undertake a
time-demanding micro-assessment of NGO financial systems subsequently held back the
roll-out of activities, but efficiencies unlocked by this important step in introducing the HACT
system became apparent at liquidation as NGO partners used own systems for financial
accountability, complemented only with a few routine assurance missions by UNICEF’s
48
According to MoLSS staff, the frequency of monitoring visits in any given period was reduced to less than 5% of ideal frequency due to an acute shortage of staff and the severe shortage of financial resources in Government at central, provincial and district levels
49 During the impact assessment reports were received from sub-grantees and consortium members of difficulties
they encountered with these arrangements, and the most common difficulties were: (i) centralisation of management of resources such as transport giving preference to the consortium leader at the expense of activities of consortium members; (ii) delayed disbursement of funds from the lead NGO to consortium members/sub-grantees; (iii) prioritisation of low priority activities by the lead NGO; and (iv) delayed liquidation by some sub-grantees/consortium members which made every NGO in the partnership move at the pace of the “lowest common denominator”.
50 At its highest point in the last quarter of 2008, inflation was estimated at 2 million percent, at the time
dollarization was introduced in February 2009, the CSO had stopped releasing inflation information.
51 During much of 2008, it became increasingly difficult to get quotations valid for a period of 3 weeks (the lead
time UNICEF needed to process disbursements)

PoS for the NAP for OVC - Outcome Assessment - Final Report
Jimat Development Consultants /Page 73
finance team52. The routine visits improved financial management within NGOs as well as
helping UNICEF finance team appreciate the environment in which NGOs were operating
and their capacity gaps. However, the harmonisation of PoS financial accountability with
NGO systems did not necessarily eliminate delays in disbursement, some of which were
caused by hyperinflation coupled with UNICEF’s slow adaptation to the challenge of with
“too many zeros in the local currency”, slow liquidations by most NGOs (both local and
international), and the freezing of balances held by NGOs in foreign currency denominated
bank accounts by the Reserve Bank of Zimbabwe in 2008.
13. Table 5 below shows a financial management summary for a selection of local and
international NGOs and indicates how widespread the problem of delayed liquidations was
as about half (46%) of the disbursements made to NGOs were not liquidated on schedule
and led to automatic suspension of further disbursements to the NGOs concerned.
Table 5: Timeliness of liquidations for a sample of NGOs
NGO Partner Period covered by
analysis
Total disbursements
(#)
Not over-due for
liquidation (#)
Due for liquidation
(#)
Liquidated within 6 months
(#)
Liquidations made on time (%)
FOST 10 Dec 2007 - 18 Dec 2009
20 2 18 1 6%
MASO 4 Mar 2008 - 3 Mar 2010 48 2 46 46 100%
NASCOH 1
14 Dec 2007 - 29 Sep 2008
9 0 9 0 0%
SCN – Z 14 Dec 2007 - 26 Feb 2010
11 2 9 5 56%
Scripture Union
29 Nov 2007 - 24 Feb 2010
24 2 22 4 18%
Batsirayi 23 Oct 2007 - 13 Jan 2010
26 1 25 20 80%
BRTI 2
11 Apr 2007 - 5 Feb 2010
40 3 37 11 30%
CARE 3 3 Oct 2008 - 6 Mar 2010 2 1 1 0 0%
CRS 4
29 Jul 2008 - 1 Feb 2010
8 3 5 3 60%
GOAL 19 Feb 2008 - 9 Feb 2010
5 2 3 1 33%
HOCIC 26 Nov 2007 - 15 Feb 2010
25 1 24 17 71%
Sample totals 11 Apr 2007 - 6 Mar 2010
218 19 199 108 54%
Notes: 1 Contract later cancelled due to weak financial management
2 Liquidations improved in 2009, as six disbursements were late but liquidated very close to the due date
(borderline) 3 CARE received a large grant of USD 532,069 on 3 Oct 2008 which they liquidated on 6 June 2009
4 CRS received a very large grant of USD 1,080,245 on 17 Feb 2010 which is not yet over due for liquidation
Source: UNICEF Financial Management Summaries for NGOs
52
Frequency of NGO visits depended on the gravity of the findings and recommendations of the micro-assessment exercise (i.e., the level of risk in relation to the value of the cash transfers in question). The assurance activities were intended to determine whether expenditures that took place were for the purposes intended. UNICEF staff conducted assurance visits to the partners when the level of disbursements for a specific year reached 25 to 30% of the value of the agreed budget.

PoS for the NAP for OVC - Outcome Assessment - Final Report
Jimat Development Consultants /Page 74
14. The financial summaries show delays in the receipt of the first disbursement by
NGOs (including the ones in the first batch of 21 NGOs selected in 2006). They also show
that many NGOs irrespective of whether they were local or international, or whether they
received their funds in foreign or local currency, had difficulties liquidating their
disbursements on time. International NGOs that received most of their funding in hard
currency, such as CARE, CRS, GOAL and SCN-Z also had some problems with liquidations
partly due to the environment obtaining on the ground and partly as a result of their slow
adaptation to the evolving operating conditions. On the contrary some local NGOs such as
MASO, Batsirayi and HOCIC appeared to have performed better despite having been
receiving their funds for field activities in local currency.
15. The liquidations data also shows the serious problem that UNICEF had with its
system in coping with the increase in zeros in the local currency53. For example, on 20
March 2008 instead of disbursing in one tranche ZWD1,568,280,500,000.00 to MASO, the
disbursement was split into 16 tranches, 15 of which were for ZWD99 billion each and the
16th disbursement was for the balance of ZWD83,280,500,000.00. Hence instead of
processing only 19 disbursements to MASO during the period studied, UNICEF ended up
having to process a total of 48 disbursements. Management of disbursement and
liquidations became time-consuming for both finance and programme staff to the detriment
of quality assurance activities, especially on technical aspects. This applied to all levels of
the PoS institutional framework54. As a result of this work load, UNICEF focal points reported
having to spend close to 40% of their time on administrative work as opposed to technical
during the height of the cash crisis (from about October 2007 to the time UNICEF made a
decision to stop disbursements in local currency and negotiated with Government to
disburse PoS funds to NGOs only in hard currency in the last quarter of 2008). This decision
to suspend disbursements, although temporarily affecting implementation to a very large
extent saved the entire programme heavy inflation and exchange losses, on the one hand
and losses associated to the writing-off of balances in ZWD denominated bank accounts
when Zimbabwe adopted a multi-currency trading system in the first quarter of 2009.
16. The poor performance record of NASCOH on liquidations is also evident from the
data and this and other reasons contributed to the good decision taken together by UNCEF
and the NAP for OVC Secretariat to cancel the Project Cooperation Agreement and instead
carryon with the project with direct disbursements and capacity development going to
selected NASCOH partners. This development also went to show the inherent weaknesses
in the consortium approach, an innovation meant to build capacity of local NGOs and fill
gaps in thematic coverage of the PoS, but an experiment that hardly took off. It also revealed
gaps in the micro-assessment exercise as it could not pick the risk associated with
consortium arrangements (the capacity of NASCOH to play consortium leader role).
53
The system could only handle payments below ZWD100 billion.
54 The finance team at UNICEF and that in the Ministry of Labour and Social Services had to visit NASCOH to
help the NGO to liquidate funds disbursed to the organisation.

PoS for the NAP for OVC - Outcome Assessment - Final Report
Jimat Development Consultants /Page 75
Implementation rates and funds absorption
17. Figures 3 and 4 below reconfirm the “slow start” nature of the PoS and the rapid
scaling up towards the end of the programme (from late 2009 into 2010). To quickly achieve
impact a programme such as the PoS would normally have spent most of the resources
availed to it in the first 3 years of implementation and then leave the final 1-2 years for
learning, impact assessment and formulation of a follow-up phase.
Figure 3: Comparison between cumulative expenditures by NGOs and time lapse
18. However resources availed to the PoS did not quickly reach children mainly due
to the difficulties encountered with the start-up phase and subsequently with the
severely constraining operating political and economic environment that obtained
from late 2007 and persisted throughout the year 2008.
19. The slow start in 2006 and early 2007, was understandable largely because of
processes absolutely essential to (i) promote strong ownership, especially within
government, (ii) set up the institutional arrangements for implementation and management;
(iii) select partners and carryout financial due diligence on them; (iv) start working out the
monitoring and evaluation system; and (v) workout the funds disbursement systems which
would ensure sufficient flexibility to smooth implementation but at the same complying with
national regulations and promoting sound financial management so as to reduce fiduciary
risk.
20. Implementation efficiency improved mid 2007 soon after conclusion of the partner
selection process and the HACT assessments when both funds absorption and reach
started rising. However, this was short-lived when government introduced stringent price
controls starting with the “price slash” which led to disappearance of basic commodities (and
critical programme inputs) from the formal supply chain thus hampering local procurements.
Implementation remained very constrained in 2008, with two rounds of harmonised national
elections (March and June), suspension of NGO/donor food aid, the ban on all NGO activity
(4 June – 31 August), a crippling inflation (200 million percent by September) and a cash
crisis that made it extremely difficult for NGOs to get cash from the banks to finance

PoS for the NAP for OVC - Outcome Assessment - Final Report
Jimat Development Consultants /Page 76
programme costs. Consequently reach of new OVC substantially decreased during that
period (Figure 2).
21. The operating environment improved only after signature of the Global Political
Agreement on 15 September 2008 and when in October 2008 the Reserve Bank of
Zimbabwe allowed the UN and partners to operate and pay name service providers in USD.
Fifty-percent of total expenditure incurred by NGOs from programme start till March 2010
was incurred in 2009. However, given the general state of collapse of basic social services
improving access to services for children was a challenge for most partners as reach did
not necessarily imply access. The strike by teachers continued to affect reach of OVC
through educational support as schools remained closed in the first quarter of 2009. Hence,
expenditures lagged behind time lapse until only in October 2009 (Figure 1).
Figure 4: New OVC reached per month by type of intervention (selected interventions)
Efficiency of procurement of programme inputs, equipment and other supplies
22. Efficiency in procurement was promoted through centralised procurement of
equipment and supplies managed by UNICEF. Through this strategy, the programme was

PoS for the NAP for OVC - Outcome Assessment - Final Report
Jimat Development Consultants /Page 77
able to benefit from greater price leverage, as UNICEF managed to secure savings, for
example, of up to 30-40% on vehicles and on water and sanitation equipment and supplies,
and as much as 50% on computers for its partners55. However, this was at the expense of
timeliness due to UNICEF’s long lead time. Some partners reported having had to operate
with no programme vehicles during the first year of programme implementation. In
retrospect, alternative modes of managing some of the procurements, for example, through
other larger NGOs who have more flexible systems and can land the same supplies quicker
and at competitive prices could have been explored.
Efficiency of monitoring and supervision of activities
23. UNICEF together with the NAP for OVC Secretariat need to be commended for
having managed to develop a state of the art output monitoring system for the PoS which
has become a model for replication in other OVC programmes internationally.
24. However, a number of factors led to systemic gaps in the quality of monitoring
observed by outcomes assessment team. The lack of financial support to existing national
machinery for monitoring and supervision hampered efforts by government officers at all
levels to quality assure the programme at a time when UNICEF (as fund manager and
technical partner) also lacked sufficient manpower to invest adequate time into both
administrative and technical monitoring56. This structural weakness was also observable at
NGO level where primary NGOs also lacked capacity to monitor activities of sub-grantees,
consortium partners or their own staff on the ground. As a result, monitoring and follow-up of
the utilisation of inputs distributed to OVC was less than would have been ideal to ensure
realisation of the planned outcomes of the programme. The focus on outputs and,
especially, the absence of quality assurance indicators (such as number and
usefulness of client follow-up visits) and those at outcome level in the PoS monitoring
system also meant that NGOs lacked the incentives to focus on quality.
Efficiency of programme Coordination
25. The formulation of the PoS jointly by government and UNICEF, and its subsequent
approval by Cabinet smoothened coordination of the programme at the national level.
According to the key stakeholders, the Core Team formed by the Ministry of Labour and
Social Services, NAC and UNICEF acts as the “engine behind the PoS”57 and plays its
functions well, maintaining open communication and constant interaction among the major
stakeholders. This good coordination is credited for the success of efforts of the PoS to
lobby for the lifting of the NGO ban, and for the humanitarian space that the government
continued to give to some of the PoS interventions even during the period of the NGO ban.
55
The magnitude of the procurements, especially at the height of the cholera emergency and widespread food shortages, was unprecedented, and UNICEF was able to handle the procurements by placing some of it staff in South Africa to manage the procurement process
56 The time demands of a programme of this magnitude were not anticipated at the time the PoS was designed.
Commendable efforts were made to recruit a good calibre of staff specifically for the programme, however, much of the staff time was devoted to managing administrative and logistical issues of programme operations which increasingly became complex as the operating environment deteriorated thus crowding out technical monitoring and quality assurance.
57 PoS Annual Progress Report, May 2008; page 13

PoS for the NAP for OVC - Outcome Assessment - Final Report
Jimat Development Consultants /Page 78
26. The IA study found strong coordination also among donors funding the PoS and
those in the OVC sector in general especially through the forums such as the monthly
meetings of the OECD-OVC Group and the Joint Annual Review exercise. The JAR allows
joint learning, encourages harmonisation of approaches and promotes the spirit of mutual
accountability. As part of the JAR, donors also produce a common set of recommendations
with a clear plan of action that coordinates their subsequent monitoring of the programme.
27. Whilst there is good coordination at the national level, considerable challenges have
been experienced at the sub-national levels, where a combination of understaffing and
underfunding of government departments and lack of harmonisation of NGO approaches for
engagement with state parties affects the quality of coordination. Weak coordination in some
instances has hindered the PoS from getting the intervention space it needed as well as
complementary services critical for children to get access to basic social services. This
applies especially to birth registration and at times services to do with reintegration of
children in institutions with their families and this partly explains the limited reach by these
services.
B. COST EFFECTIVENESS
Cost per beneficiary reached
28. The computation of costs per beneficiary was constrained by non-tracking of the
number of unique OVC reached by a combination of PoS activities. The number of new OVC
reached was reported on a service by service basis but not at programme-wide level. Hence
aggregation while ensuring that OVC receiving more than one service are not double
counted has proven to be a challenge for the PoS programme58.
29. In addition, the duration of support per OVC reached by the PoS was not
systematically monitored and reported on, hence making it difficult to reduce costs to a
common denominator that facilitates comparison of the PoS with other OVC programmes.
To enable computation of the cost per beneficiary for the entire programme, and the cost per
beneficiary per year, therefore, these missing statistics were estimated59. The results on
analysis of unit costs are summarised in Table 6.
30. The total number of OVC reached by the PoS as at 31 December 2009 was
estimated at 379,730 while the total expenditure of the programme was reported at
USD46.21 million. This gave rise to a cost per OVC of USD122. Assuming that, on
average, children reached in 2007 and 2008 were supported for an average duration of 4
months per year, those reached in 2009 were assisted for a duration of 6 months, and that
there was a continuation of services for those reached for the first time in 2007 and 2008,
the cost to NGOs per OVC reached per month of support averages USD9.92, which is
equivalent to USD 119 per child per year60. However, when costs related to capacity
58
Apparently, this weakness was also observed for the comparators, DFID PRP II and the Children First Project funded by USAID and World Education Incorporated.
59 The cost per OVC reached was computed based on data provided by UNICEF on the estimated number of
beneficiaries and the total programme expenditures up to 31 December 2009.
60 These estimates are based on the time the first disbursements were made, the time NGOs began reaching
children and other difficulties of the operating environment such as the elections, the NGO ban, the non-availability of programme inputs on the local market which affected implementation.

PoS for the NAP for OVC - Outcome Assessment - Final Report
Jimat Development Consultants /Page 79
building, M&E, UNICEF HQ, and UNICEF coordination are taken into account the cost per
OVC reached increases to USD15.14 per month or USD181.62 per year on average.
31. The analysis in Table 7 also shows the wide variation in unit costs among different
approaches that have been used in Zimbabwe to alleviate poverty during a complex
emergency era, with consistently higher costs per child for interventions targeting the
child as opposed to the household. In addition, a consistent pattern emerged when NGO-
level unit costs were analysed for the PoS activities (Figure 3). Most NGOs implementing
softer, demand-driven services such as counselling, reunification of children, and
provision of psychosocial support and treatment to children who are victims of sexual
abuse had higher unit costs than those that implemented supply-driven and often
hardware type interventions (food and nutrition, and educational support) (Figure 5).
Table 6: Comparison of unit costs
Parameter UNICEF
PoS 2006-2009
Children First Project
Jan 2008-Jun 2009
BEAM Term 3
(Oct-Dec) 20096
DFID PRP I Jun 2004 to June 2008
DFID PRP II (n=7
NGOs) Jul 2008-Nov 20095
Expenditure US$46.2 m US$3.7 m US$4.6 m £35.3 m £6.1 m
Children reached
379,730 49,440 517,312 3,500,0001 533,1333
Cost per child US$122 US$74 US$9 £102 £12
Cost per child year
US$181 US$864 US$27 Data not
available £26
Cost intensity US$85 US$36 US$8.67 Data not
available £9
Cost of transfer US$0.42 US$1.087 US$0.02 Data not
available £0.24
Notes: 1 The PRP I reached out to an estimated 1.5 million households, which translates to about 6.5 million people of which approximately 3.5
million were children. 2 The cost per child averaged is £10 for the programme.
3 Total number of direct beneficiaries was estimated at 990,103, of
which 533,133 were estimated to be children. 4 Cost per child per month ranged between US$6.03 and US$7.50, the lower figure being for
supply-driven interventions such as education support, and the higher figure being for demand-driven services such as a package with PSS, health, Child Protection and shelter.
5 Figures in this column are not on the overall programme but for a sample of 7 NGOs that were funded
under both PRP II, and the PoS. 6 Beam expenditure is based on February 2010 financial report.
7If personnel recruited specifically for the project
is considered as programmes, the cost of transfer reduces to US$0.56. Data Sources: (1) UNICEF M&E and Financial Data; (2) PRP NGO expenditure data; (3) PRP II Inception Report Number 6; and (4) PRP II M & E data.
32. For the PoS, partners that registered higher unit costs than the NGO average of
US$76 appeared to be consistent with those affected by implementation bottlenecks or
whose interventions did not naturally yield large beneficiary numbers. For example, Child
Protection Society, which registered the highest cost per OVC (of US$1,649.00), was
involved in re-unification of children from institutions into their families, an intervention that is
labour intensive, demands skilled staff and a lot of visits to families to sensitise, negotiate
and create an environment conducive to successful reintegration of the child. NASCOH had
the second highest unit cost, partly due to the expensive nature of support provided to
children with disabilities (specialized equipment and rehabilitation services) and partly due to
inefficiency (the NGO failed to implement its consortium lead role successfully, a
development that eventually led to cancellation of their service contract in 2008). The NGO
delayed disbursements to partners and failed to submit liquidations on time, therefore
delaying reach, yet continuing to absorb the budget for support costs. DCCO, another NGO

PoS for the NAP for OVC - Outcome Assessment - Final Report
Jimat Development Consultants /Page 80
with high unit costs, experienced capacity problems. UNICEF had to temporarily suspend
disbursements for their programme activities pending audits, yet support costs continued to
be incurred to retain staff. Part of the reason for high costs for DCCO was also the
procurement of a lot of equipment as programme inputs. Another NGO that had high unit
costs, Scripture Union, was involved in the family reintegration of children living on the
streets and this venture also proved an expensive model although absolutely necessary
given the nature of vulnerabilities of such children.
Figure 5: Cost per OVC reached by PoS partners (2006-2009) (US$)
Source: UNICEF Partner Expenditures Data (2006-2009).
33. In general, organisations that had lower unit costs had managed to achieve
economies of scale through high numbers on reach associated with supply-driven
interventions61. SCN-Z was the only exception but managed to achieve higher reach in 2008
given the surge in deportations of unaccompanied children from Botswana and South Africa.
Some international NGOs such as GOAL, WVI and Action Aid had the capacity to share
costs with the PoS, some contributing matching funds of up to 40% of the PoS budget, and
this enabled these NGOs to reduce unit costs on the PoS component. Other international
NGOs did not perform as expected on cost-efficiency. An example is Save the Children UK
that had high unit costs, which were partly attributable to the high transportation costs
associated with the remoteness of their target areas (Kariba Rural), but also due to a
generally expensive model (overheads).
61
An exception to this pattern was the water and sanitation intervention. Activities were slow in starting up given challenges of the operating environment (shortage of hardware on the local market, limited uptake by communities (e.g., slow digging of wells), lack of transport to increase NGO capacity, NGO ban prevented hygiene promotion meetings, etc).

PoS for the NAP for OVC - Outcome Assessment - Final Report
Jimat Development Consultants /Page 81
Intensity of investment per child
34. Analysis of the portion of the cost per OVC that went to the child as a direct benefit is
important since a high cost per beneficiary is not necessarily a bad thing if the bulk of the
costs went to inputs and services that reached the intended beneficiary (in this case the
child). Figure 6 shows the intensity of support achieved by each NGO, which shows the
average total value of inputs and services received by the children that were reached by
each NGO.
35. On average, NGOs invested US$61 of benefit per child during the period 2006-2009.
The graph further confirms that organisations which had high costs (per beneficiary) also
had consistently higher levels of investment (value of transfer) per child. The varying
amounts spent per child based on the type and level of vulnerability show that the
PoS was able to respond to unique needs of children62, an approach that is consistent
with the basic tenets of a child rights based approach.
Figure 6: Comparison of the level of investment per child (PoS inputs and services),
(2006-2009), US$
Source: UNICEF Partner Expenditure Data (2006-2009).
Cost of transfer
36. Global standards of measuring efficiency stipulate that overheads or administrative
expenses should not exceed 40% of total expenditure. At the least, 60% of the financial
resources should be spent on goods and services that directly reach the intended
beneficiaries. Where administration costs exceed 50% of the total operating costs, such
programs are rated as poor performers. Using these international standards, the cost of
transfer should ideally not exceed US$0.67 per US$1 of benefit transferred and in the worst
case scenario, should not go beyond US$1.
62
Children with disability, those in need of paediatric ART, PSS and child protection services had different needs from those in need of food and nutrition support or educational support. The programme was able to respond to these needs due to its flexibility and demand-driven nature.
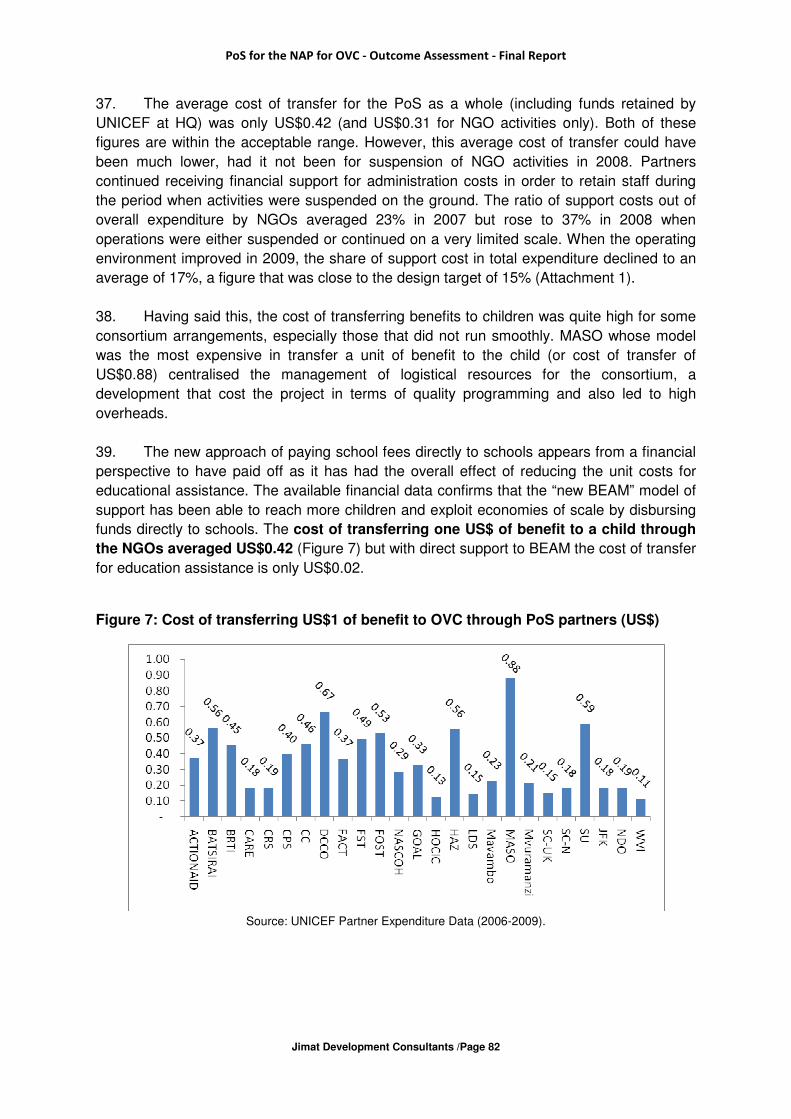
PoS for the NAP for OVC - Outcome Assessment - Final Report
Jimat Development Consultants /Page 82
37. The average cost of transfer for the PoS as a whole (including funds retained by
UNICEF at HQ) was only US$0.42 (and US$0.31 for NGO activities only). Both of these
figures are within the acceptable range. However, this average cost of transfer could have
been much lower, had it not been for suspension of NGO activities in 2008. Partners
continued receiving financial support for administration costs in order to retain staff during
the period when activities were suspended on the ground. The ratio of support costs out of
overall expenditure by NGOs averaged 23% in 2007 but rose to 37% in 2008 when
operations were either suspended or continued on a very limited scale. When the operating
environment improved in 2009, the share of support cost in total expenditure declined to an
average of 17%, a figure that was close to the design target of 15% (Attachment 1).
38. Having said this, the cost of transferring benefits to children was quite high for some
consortium arrangements, especially those that did not run smoothly. MASO whose model
was the most expensive in transfer a unit of benefit to the child (or cost of transfer of
US$0.88) centralised the management of logistical resources for the consortium, a
development that cost the project in terms of quality programming and also led to high
overheads.
39. The new approach of paying school fees directly to schools appears from a financial
perspective to have paid off as it has had the overall effect of reducing the unit costs for
educational assistance. The available financial data confirms that the “new BEAM” model of
support has been able to reach more children and exploit economies of scale by disbursing
funds directly to schools. The cost of transferring one US$ of benefit to a child through
the NGOs averaged US$0.42 (Figure 7) but with direct support to BEAM the cost of transfer
for education assistance is only US$0.02.
Figure 7: Cost of transferring US$1 of benefit to OVC through PoS partners (US$)
Source: UNICEF Partner Expenditure Data (2006-2009).

PoS for the NAP for OVC - Outcome Assessment - Final Report
Jimat Development Consultants /Page 83
Returns to investment in children
Economic empowerment projects
40. The study finds that most economic empowerment programmes (nutrition gardens,
poultry, village savings and investment and livestock pass on schemes) supported under the
PoS had limited viability during the period 2007-2008 as they were severely affected by
hyperinflation, commodity price distortions and the absence of cash on the local markets.
Where livestock assets were provided to OVC, these projects thrived by enabling
beneficiaries to participate in barter trade. However, complementary inputs such as
veterinary supplies, were not available on the local markets to control common animal
diseases, hence case fatality (especially for poultry) was high in some regions where
disease outbreaks (Newcastle) were frequent and animal feed were not accessible.
41. Another factor that affected resilience and viability of agricultural projects is the wide
variations in quality of support as many lacked adequate technical advice and minimum
standards. However, with the restoration of favourable economic conditions, support to OVC
economic empowerment projects has just returned once more to viability but many need to
be re-kick-started with an injection of working capital for revitalisation. Many of these
projects have the potential to perform to the same level or even surpass that achieved by
many interventions funded under the PRP Phase I, as follows. Many of the NGOs supported
under the PRP have also been beneficiaries under the PoS and using same models of
intervening in the economic strengthening field as for the PRP (examples include NGOs
providing OVC with support for nutrition gardens). The range attainable by economic
strengthening projects in the new dispensation (dollarized economy) are summarised in
Table 7.
Table 7: Potential returns to investment in OVC economic empowerment projects
Intervention Potential Benefit-cost ratios
(1)
Savings and lending 2.8 – 5.0 Agricultural inputs 1.6 -2.5 Nutrition gardens 2.0 – 9.2 Small livestock transfers 3.0 - 9.7
Notes: (1) Projects sampled from the 14 NGOs
were too few and most had only started.
Social services (education, food and nutrition, water and sanitation)
42. The cost per school dropout or hunger averted or problem of shelter addressed was
much higher than the average cost per child per year realised by the PoS in total. This is due
to the fact most interventions did not adequately meet the needs of the children in that
particular service area. The real costs for addressing one problem in each of the PoS
intervention areas is summarised in Table 8 below.
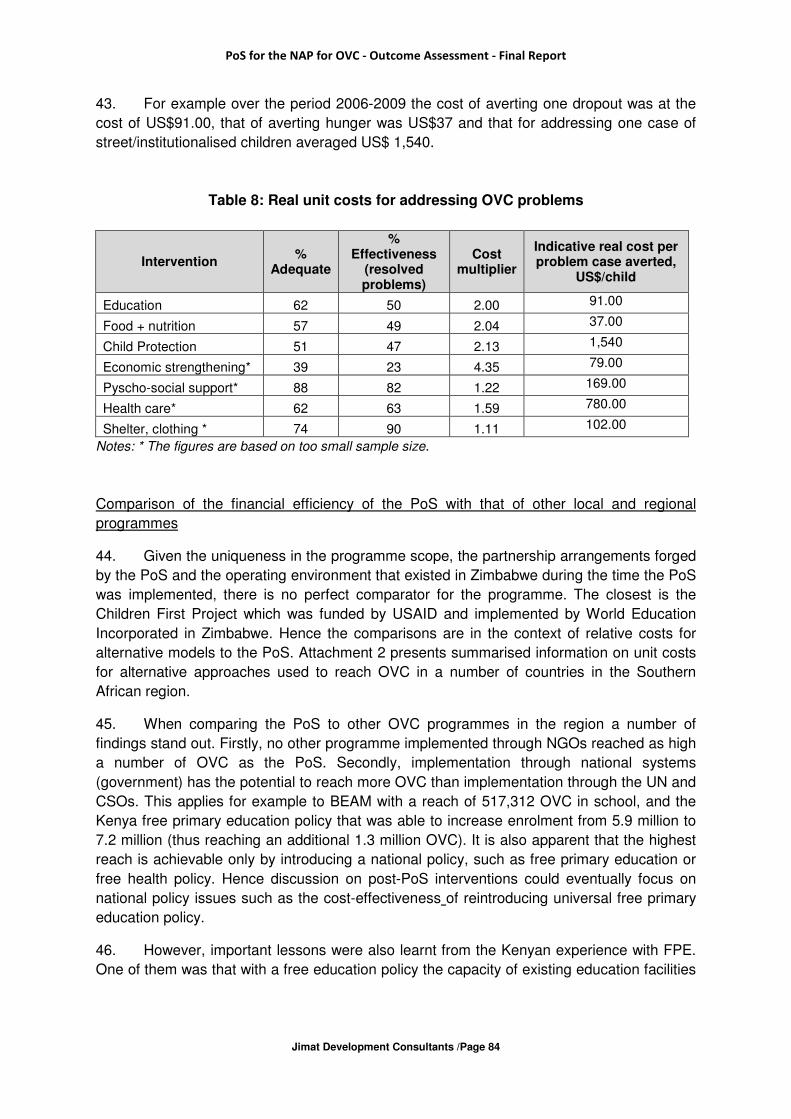
PoS for the NAP for OVC - Outcome Assessment - Final Report
Jimat Development Consultants /Page 84
43. For example over the period 2006-2009 the cost of averting one dropout was at the
cost of US$91.00, that of averting hunger was US$37 and that for addressing one case of
street/institutionalised children averaged US$ 1,540.
Table 8: Real unit costs for addressing OVC problems
Intervention %
Adequate
% Effectiveness
(resolved problems)
Cost multiplier
Indicative real cost per problem case averted,
US$/child
Education 62 50 2.00 91.00
Food + nutrition 57 49 2.04 37.00
Child Protection 51 47 2.13 1,540
Economic strengthening* 39 23 4.35 79.00
Pyscho-social support* 88 82 1.22 169.00
Health care* 62 63 1.59 780.00
Shelter, clothing * 74 90 1.11 102.00
Notes: * The figures are based on too small sample size.
Comparison of the financial efficiency of the PoS with that of other local and regional
programmes
44. Given the uniqueness in the programme scope, the partnership arrangements forged
by the PoS and the operating environment that existed in Zimbabwe during the time the PoS
was implemented, there is no perfect comparator for the programme. The closest is the
Children First Project which was funded by USAID and implemented by World Education
Incorporated in Zimbabwe. Hence the comparisons are in the context of relative costs for
alternative models to the PoS. Attachment 2 presents summarised information on unit costs
for alternative approaches used to reach OVC in a number of countries in the Southern
African region.
45. When comparing the PoS to other OVC programmes in the region a number of
findings stand out. Firstly, no other programme implemented through NGOs reached as high
a number of OVC as the PoS. Secondly, implementation through national systems
(government) has the potential to reach more OVC than implementation through the UN and
CSOs. This applies for example to BEAM with a reach of 517,312 OVC in school, and the
Kenya free primary education policy that was able to increase enrolment from 5.9 million to
7.2 million (thus reaching an additional 1.3 million OVC). It is also apparent that the highest
reach is achievable only by introducing a national policy, such as free primary education or
free health policy. Hence discussion on post-PoS interventions could eventually focus on
national policy issues such as the cost-effectiveness of reintroducing universal free primary
education policy.
46. However, important lessons were also learnt from the Kenyan experience with FPE.
One of them was that with a free education policy the capacity of existing education facilities

PoS for the NAP for OVC - Outcome Assessment - Final Report
Jimat Development Consultants /Page 85
may fail to cope with the swelling enrolment63. For example, the tendency by planners to
“think children first, then quality of education later” was evident in the Kenyan example. How
the system would deal with the higher demand for teachers and water and sanitation
facilities at existing schools was overlooked. Hence Kenya’s Free Education Policy was
criticised for having led to massive increase in enrolment yet this was short lived as pupils
dropped out because WATSAN facilities at schools failed to cope.
47. Another important lesson is that many OVC may not enrol in formal schools but
prefer informal education and vocational training which may be more appropriate for their
circumstances. In Kenya, free education for all policy was therefore not a panacea to OVC
education problems. This challenge is what the Complementary Basic Education in Tanzania
Programme tried to address but this came at a much higher cost of US$166 per child per
year than conventional formal educational support programmes.
48. The third major finding from the regional comparisons is that programmes aiming to
reach the child through strengthening community systems for care and support, come with
higher investment requirements than those targeting the child directly, but they have the
benefit of building sustainable systems. Swaziland’s Neighbourhood Care Points (NCP)
programme seeks to strengthen community-based care of orphans and vulnerable children
so as to promote their access to education, but comes at much higher cost of US$230 per
child per year which is almost double that for the PoS of US$119 per child per year.
49. Fourth, the social cash transfer programme of Malawi shows that SCT can be
implemented at reasonably lower cost than the PoS package, but equally leverage OVC
access to education and other basis services (especially when they are complemented by a
“top-up child bursary” or “top-up special needs” grant to cater for other needs of children with
disability, HIV and AIDS, etc). However, cash alone will not be sufficient, as it cannot
address other softer issues such as psychological support services for victims of child
abuse.
50. Integrated packages come at higher cost per child, than singular intervention
approaches. This is evident when examining the financial performance of the All Children
Safe in Schools Programme from Swaziland and the new approach to BEAM through the
PoS in Zimbabwe. The cost per child per year is 3 times higher for Swaziland’s more
comprehensive programme than that for BEAM which only addresses one need of OVC –
the tuition support. The NGOs providing education assistance in Zimbabwe through the PoS
had varied approaches (block grants or direct fee payment) but often added school uniforms,
text books, stationery and sometimes integrated these with water and sanitation
infrastructure support and hygiene education at the targeted schools. Comparison of unit
costs of BEAM and the alternative PoS package is therefore not that straight forward but
suffice to say, that the new BEAM has obvious strengths in quick rollout, high beneficiary
numbers, and low overhead costs. Furthermore, evidence from the field also points out
obvious weaknesses in the sudden shift to BEAM (with no transition phase) which left many
OVC not on BEAM and not eligible for tuition support under the NGO education package.
Some OVC fell through the cracks, and some non-OVC benefitted from the BEAM support in
63 The norm for class ratio in Kenya which was set in 1975, envisaged 1 teacher per 40 children. After
introducing FPE, class ratios in many schools rose as high as 120 children per teacher thereby introducing many challenges for the

PoS for the NAP for OVC - Outcome Assessment - Final Report
Jimat Development Consultants /Page 86
schools where the allocation exceeded the demand for tuition support by OVC. Some OVC
that transferred schools were also not catered for at the new schools since the formula and
allocation of BEAM funds is based on historical enrolment as opposed to current needs.
51. Another observation evident from comparing unit costs of the PoS to those of
national programmes such as the Children First Project is the generally high cost of demand-
driven and community level interventions such as PSS and reunification of children from
institutions or from the streets with their families.

PoS for the NAP for OVC - Outcome Assessment - Final Report
Jimat Development Consultants /Page 87
Attachment 1: Cost effectiveness analysis of the PoS
Implementing Partner Notes Total Total Total Total Direct Cost of Cost per Intensity of
Costs Value % Costs Value % Costs Value % Costs Value % Beneficiaries Transfer Beneficiary Support
Actionaid International Zimbabwe a 244,280 61,070 25% 761,306 190,327 25% 985,344 285,770 29% 1,990,930 537,166 27% 32,512 0.37 61.24 44.71
AFRICAID b 40,500 4,609 11% 40,500 4,609 11% 0.13
Batsirayi Group c 268,055 72,010 27% 603,513 294,835 49% 292,377 52,027 18% 1,163,944 418,872 36% 10,882 0.56 106.96 68.47
Biomedical Research and Training Institute (BRTI) c 370,791 120,095 32% 349,225 215,029 62% 682,955 102,443 15% 1,402,971 437,567 31% 12,197 0.45 115.03 79.15
CARE International a 364,393 34,673 10% 532,069 108,934 20% 922,349 138,352 15% 1,818,811 281,960 16% 37,151 0.18 48.96 41.37
Catholic Relief Services (CRS) a 338,973 37,287 11% 601,654 144,397 24% 1,949,107 272,875 14% 2,889,734 454,559 16% 24,363 0.19 118.61 99.95
Child Protection Society (CPS) c 119,592 46,506 39% 443,250 258,254 58% 1,089,134 163,370 15% 1,651,976 468,130 28% 1,002 0.40 1,648.68 1,181.48
Childline b 221,940 46,607 21% 221,940 46,607 21% 0.27
Christian Care c 129,471 36,466 28% 127,952 86,418 68% 271,031 43,907 16% 528,454 166,791 32% 11,640 0.46 45.40 31.07
Dananai Child Care Organisation (DCCO) f 149,106 140,982 95% 405,367 80,605 20% 554,473 221,586 40% 735 0.67 754.39 452.91
EGPAF 174,508 20,068 12% 174,508 20,068 0.13
Family AIDS Caring Trust (FACT) c 337,109 22,465 7% 246,761 92,705 38% 680,120 225,167 33% 1,263,991 340,337 27% 20,374 0.37 62.04 45.33
Family Support Trust (FST) c 145,190 50,850 35% 316,751 161,216 51% 325,515 48,355 15% 787,456 260,421 33% 7,086 0.49 111.13 74.38
Farm Orphan Support Trust (FOST) c 248,851 110,778 45% 217,951 111,216 51% 709,813 184,551 26% 1,176,615 406,545 35% 20,577 0.53 57.18 37.42
Former Nascoh * c 142,369 21,323 15% 711,597 207,570 29% 597,776 93,444 - 1,451,742 322,337 22% 1,270 0.29 1,143.10 889.30
GOAL Zimbabwe a 332,962 63,263 19% 147,518 22,128 15% 541,739 166,558 31% 1,022,219 251,948 25% 56,007 0.33 18.25 13.75
Helpage 14% - -
Hope for a Child in Christ (HOCIC) c 337,284 7,250 2% 133,542 10,247 8% 708,376 116,882 17% 1,179,203 134,379 11% 7,138 0.13 165.20 146.37
Hospice Association of Zimbabwe (HAZ) c 320,625 114,798 36% 583,652 281,463 48% 332,519 46,220 14% 1,236,796 442,481 36% 5,437 0.56 227.48 146.09
Lutheran Development Service (LDS) 97,482 14,622 15% 101,282 15,192 15% 124,455 11,201 9% 323,219 41,016 13% 5,807 0.15 55.66 48.60
Mavambo Trust c 330,474 32,815 10% 324,735 120,691 37% 507,285 61,045 12% 1,162,494 214,551 18% 13,412 0.23 86.68 70.68
Mercy Corps 290,658 57,793 20% 290,658 57,793 0.25
Midlands AIDS Service Organisation (MASO) c 157,755 105,550 67% 447,829 353,960 79% 546,325 78,853 14% 1,151,909 538,363 47% 16,706 0.88 68.95 36.73
Mvuramanzi Trust e 45,172 2,259 5% 110,027 5,501 5% 277,362 68,139 25% 432,561 75,898 18% 3,101 0.21 139.49 115.02
Regai Dzive Shiri b 132,738 20,840 16% 132,738 20,840 16% 0.19
SAFAIDS - - 0% 97,951 0% 383,598 34,524 9% 481,549 34,524 7% 0.08
Save the Children - UK a 103,551 13,462 13% 364,192 21,852 6% 1,139,258 177,724 16% 1,607,001 213,037 13% 7,097 0.15 226.43 196.42
Save the Children - Norway 296,934 44,540 15% 419,535 62,930 15% 683,415 105,246 15% 1,399,883 212,716 15% 22,339 0.18 62.67 53.14
Scripture Union a 125,928 85,955 68% 357,010 224,235 63% 557,282 75,233 14% 1,040,219 385,423 37% 3,626 0.59 286.88 180.58
The J F Kapnek Charitable Trust 123,701 18,555 15% 459,197 68,880 15% 308,407 51,196 17% 891,305 138,630 16% 18,191 0.18 49.00 41.38
The Netherlands Development organisation 94,525 14,179 15% 279,078 41,862 15% 471,046 76,780 16% 844,649 132,821 16% 20,616 0.19 40.97 34.53
World Vision International 269,096 40,364 15% 252,834 37,925 15% 786,150 55,031 7% 1,308,080 133,320 10% 19,772 0.11 66.16 59.42
TOTAL 5,075,466 1,171,135 23% 8,886,683 3,278,749 37% 17,138,449 2,965,414 17% 31,622,529 7,415,298 23% 0.31
Total 2 g 5,075,466 1,171,135 23% 8,788,732 3,278,749 37% 15,894,507 2,780,972 17% 30,280,635 7,230,856 24% 379,038 0.31 79.89 60.81
* Former NASCOH Total Total
Costs Value % Costs Value %
nzeve 72,455 47,792 66% -
king george 50,560 33,810 67% 39,185 5,062
jairos jiri 44,178 14,617 33% 235,271 30,391
znlb 104,024 26,877 26% 12,789 1,652
zphcabyo 103,711 22,780 22% 81,432 10,519
rokpa 82,425 14,948 18% 79,591 15,918
zimnamh 80,806 39,938 49% 149,508 29,902
zphcahre 173,438 6,809 4% -
Totals 711,596.89 207,570 29% 597,776 93,444 16%
Notes
a. Estimates of indirect costs are based on reported expenditure on a sample of FACE forms submitted by the IP.
b. POS agreement for Africaid was only signed in October 2009.
c. Estimates of indirect costs are based on disbursements in USD for salaries and fuel in 2007 and 2008.
d. No disbursement was made to this implementing partner in 2009 as it more than 9 months to liquidate 2008 disbursement
e. Estimates of indirect costs are based on audited financial statements
f. No costs for 2007 as PCA was onlly signed on 1 April 2008
g. This total is for data on NGOs whose beneficiary numbers were provided.
Source : (1) Data on expenditures and direct beneficiaries were provided by UNICEF; and (2) Unit costs were computed by Consultants.
2007-20092009
Support Costs
Support Costs
2008
Support Costs
2007-2009
Support Costs
2007
Support Costs
2008
These NGO'S were formerly grouped under
NASCOH, the agreement with NASCOH was
terminated in 2008 and subsequently Jairos Jiri and Zimnamh have taken several of the other
NGO's as sub-grantees. Some disbursements
were made to the other NGO's prior to this
arrangement however the assumption is that similar support costs will apply to these
organisations.
2009
Support Costs
20%
13%

PoS for the NAP for OVC - Outcome Assessment - Final Report
Jimat Development Consultants /Page 88
Attachment 2: National and regional comparisons
Programme nameNAP Programme of
SupportChildren First Project BEAM
Social Cash Transfer
Pilot Scheme (SCTS)
Neighbourhood Care
Points
All Children Safe
in School
Programme
Most Vulnerable
Child Programme
Complementary Basic
Education in Tanzania
Programme
Free Primary Education
Country Zimbabwe Zimbabwe Zimbabwe Malawi Swaziland Swaziland Tanzania Tanzania Kenya
Organisation(s) managing projectMin of Labour and
Social Services/UNICEF
World Education/
USAID
Ministry of Labour and
Social Services/UNICEF
Ministry of Econ
Planning and
Devt/UNICEF
Office of the Prime
Minister/UNICEF
Min of Education/
UNICEF
Department of
Social Welfare/
UNICEF
Mininstry of
Education/UNICEF
Ministry of
Education/UNICEF
Period covered by analysis 2006-2009 Oct 2007-June 2009 2009-2010 2007-2009 2003-2007 2004-2007 2000-2007 1997-2009 2005 - 2010
Package
Educational
assistance, birth
registration, child
protection &
participation, social
services, education on
nutrition, health and
hygiene
Education assistance,
PSS, child protection,
health services, food,
shelter, water and
sanitation, ECD, HIV
and AIDS
Direct payment of
school fees to schools
for OVC
Monthly stipend + top
up for OVC education
support
Food, non-formal
ECD, PSS, lifeskills,
child rights,
protection from child
abuse, health check-
ups, training of care
givers
EFA grants,
Watsan, school
feeding, school
farms and
gardens, PSS
Community based
care and support,
education, food
Basic education and
child centred
participatory teaching
methods
Capitation/tuition grant;
plus top up for OVC with
special needs (e.g., for
children with disabilities)
Target group OVC OVC OVCLabour-constrained
ultra poor HH
Preschool-age OVC
and out-of-school
children aged 4–12
OVCMost vulnerable
children
Out-of-school OVC (8-
24 yrs)
All primary school-age
children
Number of beneficiaries reached 379,038 49,440 517,312 18,180 34,000 29,245 (3) 100,000 185,206 7,200,000
Cost per beneficiary per year, US$ US$119.00 US$86.00 US$27 US$30.00 US$230.00 US$95.00Community +Unicef
matchUS$166.00 US$14.00 - US$41.00
Intensity of support, US$ USD61.00 US$36.00 US$8.67 US$28.00 N/A US$95.00 N/A N/A N/A
Cost of transferring US$1 benefit US$0.31 US$1.08 (1) US$0.02 US$0.08 N/A N/A N/A N/A N/A
Sources: (1) UNICEF, 2009. PromoEng Quality EducaEonfor Orphans andVulnerable ChildrenA Sourcebook of Programme Experiencesin Eastern and Southern Africa
(2) Unicef Malawi - Budgets for Scale up of Mchinji Pilot Social Cash Transfer Programme
(3) Unicef Harare NGO - PoS Enditures as at 31st December 2010
Notes: (1) Refers to PMU costs and other indirect costs.
Regional ComparisonsNational Comparisons