progress in organic coatings -...
TRANSCRIPT

IC
ML
a
ARRA
KACCPFS
1
bstaammoHspabpcsc
C
0d
Progress in Organic Coatings 72 (2011) 360– 379
Contents lists available at ScienceDirect
Progress in Organic Coatings
j ourna l ho me p ag e: www.elsev ier .com/ locate /porgcoat
nfluence of the surface properties of concrete on the adhesion of coating:haracterization of the interface by peel test and FT-IR spectroscopy�
atthieu Horgnies ∗, Pierre Willieme, Olivier Gabetafarge Centre de Recherche, 95, Rue du Montmurier, F-38291 Saint-Quentin Fallavier, France
r t i c l e i n f o
rticle history:eceived 17 November 2010eceived in revised form 19 April 2011ccepted 13 May 2011
eywords:dhesionoatingoncrete
a b s t r a c t
The understanding of the adhesion between protective coating and concrete is essential to ensure theaesthetic of buildings. Polyurea (PU) based coating are mainly deposited on the surface of concrete,several days after demoulding. However, their adhesion on concrete depends on different interlinkedparameters. This study is based on the development of specific peel tests. A strengthened and porousmembrane is introduced into the layer of liquid coating before its crosslinking. This methodology ensuresa reproducible debonding of the coating/concrete system to measure the fracture energy. The fractureloci are then characterized by Fourier Transformed Infra-Red (FT-IR) spectroscopy. Results show thathumid conditions of curing and long-term ageing strongly decrease the adhesion of coating. This weak
eel testT-IREM
adhesion is related to the presence of large crystals of portlandite, the growth of efflorescence or thekinetics of carbonation that could close the porosity or induce a weak interface. The type of the mould isalso significant because it could induce the tearing of the extreme surface of concrete during demoulding.This tearing increases the roughness and the open porosity that enhances the fracture energy. Finally, thisstudy demonstrates that the adhesion of PU coating is mainly conditioned by the mechanical anchorage
.
at the surface of concrete. Introduction
Surface of high performance concrete (HPC) is characterizedy its specific microstructure that induces a high probability oftaining. This phenomenon could be prevented by depositing a pro-ective coating. Different formulations are used to protect concretegainst staining and ageing by UV, acid rains, dust, settlement oflgae, lichens, etc. [1–3]. Polyurea-based (PU) coatings are com-only used due to their high resistance against chemical andechanical aggressions [4–6]. The coatings are mainly sprayed
nto the surface of concrete 28 days (or more) after the demoulding.owever, the properties of the surface of concrete could depend on
everal interlinked parameters as moulding conditions, intrinsicorosity and roughness, relative humidity during storage/curing,nd kinetics of carbonation during ageing. Indeed, the reactionetween CO2 of atmosphere, humidity and concrete hydrates (likeortlandite, Ca(OH)2) produces calcium carbonate (CaCO3) that
ould cover the surface of concrete and close its porosity after a longtorage [7–9]. Moreover, many crystals of CaCO3 (called efflores-ences) could appear and grow under humid conditions of curing.� The standard cement chemistry nomenclature was used throughout this article: = CaO, S = SiO2, A = Al2O3, F = Fe2O3 and H = H2O.∗ Corresponding author. Tel.: +33 474823340.
E-mail address: [email protected] (M. Horgnies).
300-9440/$ – see front matter © 2011 Elsevier B.V. All rights reserved.oi:10.1016/j.porgcoat.2011.05.009
© 2011 Elsevier B.V. All rights reserved.
These crystals modify significally the composition [10,11] and themorphology of the HPC surface. The aim of this study concernsthe mechanism of adhesion that occurs at the interface betweenHPC and PU coating. Fracture energies were measured by 90◦-peel tests. This method was retained because it is an appropriatemethod to characterize the adhesion of thin film [12–15] or theadhesion between concrete and fibers-composite [16]. Some pub-lications have showed the use of strengthened membrane, lineror mesh sheet that were incorporated into the bulk of the softmaterial to characterize. Indeed, Giannis et al. [17] had performed180◦-peel tests by introducing a metal mesh sheet between twolayers of sealant. Leforestier et al. [18] had undertaken peel tests byusing a membrane into an adhesive/carbon fibre-based composite.Moreover, we have developed this methodology to peel bitumenfrom aggregate surface [19]: a membrane made of polyethyleneterephtalate (PET) was then introduced into the bitumen layer.However, this methodology of peeling, necessary to strengthen thesystem and measure a reproducible adhesion, has not been usedto characterize the adhesion between protective coating and con-crete before. The results recorded during these peel tests were thencorrelated to the analyses of the debonded faces, undertaken byFT-IR to detect the residues of concrete or coating. This correlation
between peel tests and characterization of interface after debond-ing is usually used to understand the adhesion between materials[20,21]. FT-IR spectroscopy allows detecting organic compounds[22–24] and several components of concrete [8]. Influences of
Organ
eoeedlcwsa
2
2
2
ui5Cdamprmppo(dpttdaaIHsapgop
TR
M. Horgnies et al. / Progress in
xperimental parameters were studied by this methodology inrder to determine how the surface properties of concrete couldnhance or decrease the adhesion of PU coating. Indeed, the influ-nces of the type of the mould, the ageing time between theemoulding and the deposition of coating (short time of 28 days and
ong time of 6 months), the environment of curing (humid or driedonditions) and the roughness of the concrete (after sandblasting)ere characterized. Finally, a substrate made of non-porous dolo-
tone was used to determine the influence of the porosity on thedhesion of coating.
. Materials and methods
.1. Materials
.1.1. Substrates made of hardened concreteA mix-design based on high-performance concrete (HPC) was
sed to prepare the samples. However, no fibers were introducedn the final mix. It was made of 31% white Portland cement (CEM I2.5 PMES from Lafarge, Le Teil, France), 9% of limestone filler (DUR-AL 1 from Omya), 7% of silica fumes (MST from Société Européennees produits Réfractaire), 43.5% of sand (BE01 from Sibelco France)nd 1.5% of admixture (DUCTAL F2 from Chryso). The concrete wasixed with a water to cement ratio (W/C) of 0.26. The samples were
repared by pouring the fresh concrete mixture into horizontal andectangular formwork (15 cm length, 12 cm width and 1 cm thick)ade of polyvinyl chloride: sample called “HPC (PVC)”; or made of
olyoxymethylene: sample called “HPC (POM)”. All the HPC sam-les were removed from their formworks after 18 h. HPC samplesf reference were cured during 28 days under ambient conditions25 ◦C; 50% relative humidity). Other HPC samples were cured 28ays under humid conditions (25 ◦C; 90% relative humidity). A thirdart of the samples was aged during 6 months under ambient condi-ions. Some HPC samples were also sandblasted after demouldingo increase their roughness. The sandblasting was performed 28ays after demoulding (curing under ambient conditions) by using
powder of corindons. The sandblasted samples were cleaned byir flow to remove the dust before the deposition of the coating.n order to test the influence of specific crystals, a fresh mix ofPC was also introduced into a PVC mould covered by a specific
olution of demoulding. The preparation and the properties of thisqueous solution made of surfactants were discussed in a previous
ublication [25]. The main influence of these surfactants was therowth of large crystals made of portlandite at the extreme surfacef the HPC sample during the moulding time. The HPC samplesresented an overall porosity of 8.0% and threshold diameters ofable 1oughness of HPC surfaces according to the curing/ageing conditions.
Parameters
Ra roughness (�m) after 28 days of curing under ambient conditions
Ra roughness (�m) after 28 days of curing under humid conditions
Ra roughness (�m) after 6 months of curing under ambient conditions
Ra roughness (�m) if the surface is covered by crystals of portlandite
Ra roughness (�m) after sandblasting
Mix of HPC Demoulding
20 h 28 days or 6 months of c u
Different moul ds; POM or PVC
Disti nct curing cond iambient or humi d con
Fig. 1. Different steps to manufactu
ic Coatings 72 (2011) 360– 379 361
20 nm. These characteristics were determined by mercury intru-sion porosimetry (MIP) (Autopore IV from Micromeritics, USA).The roughness of the HPC samples was measured by profilometry(Surftest SJ-201 M from Mitutoyo, Japan) to calculate the arith-metic mean of the profile deviations from the mean line (Ra). Asshown in Table 1, the Ra values of HPC depended on the demould-ing process and increased strongly after sandblasting. Comparedto 28 days curing under ambient conditions, curing under humidconditions increased slightly the roughness while ageing during 6months under ambient conditions did not modify the roughness.
2.1.2. Non-porous substrate made of dolostoneA sedimentary stone, due to the accumulation of particles made
of carbonates (CaCO3 and CaMg(CO3)2) was used as a referencesubstrate. This dolostone presented an overall porosity of 0.8%by MIP measurements. This dolostone was then assumed to be a“non-porous” substrate in order to understand the influence of theporosity of the surface. The dimensions of the parallepipedic sam-ples were about 15 cm length, 8 cm width and 2 cm thick. All thesurfaces of dolostone were polished or sandblasted before applyingthe coating. Roughness of the dolostone (Ra values) after polishingand after sandblasting were close to 1.3 �m (±0.3) and 10.0 �m(±0.4), respectively.
2.1.3. Coating and conditions of depositionThe PU coating was composed of 50% of isocyanates diluted
into 45% of solvent (butyl acetate). A catalyst (dibutyltin laurate,DBTL) was added into the mix to initiate the reaction with water(present in concrete or in atmosphere moisture). Indeed, the iso-cyanates units reacted with water to produce a polyurea-based film[26]. The PU coating is known to have high protective propertiesagainst chemical aggressions and scratching [5,27]. The coatingswere sprayed on the HPC surface 28 days or 6 months after HPCdemoulding. The short-term period (28 days) corresponded to thecurrent curing that ensures a good hydration of the concrete. Thelong-term ageing period (6 months) was used to determine theinfluence of the carbonation (under ambient conditions). Concern-ing one sample, the PU coating was applied on the HPC (POM)previously stored 28 days under ambient conditions and soakedfor 1 h into water (just before the deposition). The coating wasalways spread on the surface of concrete (120 g/m2) by using a spray
gun with air pressure of three atmospheres. The drying period wasabout 3 days under ambient conditions (25 ◦C, 50% relative humid-ity) before peeling. Fig. 1 details the procedure to manufacture theHPC/coating samples before the peel tests.HPC (POM) HPC (PVC)
0.7 ± 0.3 �m 0.5 ± 0.3 �m1.2 ± 0.3 �m 1.5 ± 0.4 �m0.7 ± 0.3 �m 0.5 ± 0.3 �m– 0.8 ± 0.5 �m12.2 ± 0.4 �m 12.1 ± 0.5 �m
rin g/a geing
Deposition of PU coating
tions: ditio ns
Ambient conditi ons
Peel test
3 days
re the samples before peeling.

3 Organic Coatings 72 (2011) 360– 379
2
2
e4ao
2
e((Ttrobctsps
tpd(lSr
2s
tf
G
fi
G
p9
62 M. Horgnies et al. / Progress in
.2. Methods of characterization
.2.1. Scanning Electron Microscopy (SEM)Samples were characterized by using a high-resolution field-
ffect gun digital scanning electron microscope (SEM FEG Quanta00 from FEI Company, USA; using an accelerating voltage of 15 keVnd a current intensity of 1 nA). Images of the cross-sections werebtained after being polished.
.2.2. Fourier Transform-Infrared (FT-IR) SpectroscopyThe FT-IR spectrometer (Nicolet iS10 from Thermo Fisher Sci-
ntific Inc., USA) was equipped with a deuterated triglycine sulfateDTGS) detector and controlled by OMNIC software. The ATRAttenuated Total Reflexion) mode was mainly used in this study.he sampling area analysed was approximately 1 mm2. The crys-al used was made of diamond and 16 scans were routinelyecorded over the range 4000–650 cm−1 with a spectral resolutionf 4 cm−1. The background was collected at ambient atmosphereefore analyzing each sample of concrete. Spectra were automati-ally corrected with a linear baseline. FT-IR (in ATR mode) allowedhe characterisation of sample over a thickness of a few �m. Nopecific preparation of the samples of concrete and coating waserformed before FT-IR analyses (in ATR mode): the surfaces weretudied after demoulding or after debonding.
Moreover, a powder of C3S* was analysed as a reference to detecthe presence of alite at the surface of the HPC samples. C3S* wasrepared by successive heating (at 1600 ◦C) of a mixture of finelyivided silica (Aerosil 200 from Degussa) and calcium carbonatefrom Prolabo) with appropriate stoichiometric proportions. A pel-et was prepared by mixing 1 mg of C3S* powder in 300 mg of KBr.pectral analysis was performed in transmission mode over theange 4000–400 cm−1 with a spectral resolution of 4 cm−1.
.2.3. Peel tests and specific method developed for HPC/coatingystem
Peel test allows measuring the debonding force (F). Accordingo the peel angle (�) and the width of the adhesive coating (w), theracture energy (G) is calculated according to Eq. (1) [28,29]:
=(
F
w
)(1 − cos �) (1)
In the specific case of 90◦ peel angle, G is equal to the peelingorce (F) divided by the width (w) of the adhesive coating (as shownn Eq. (2)):
= F(2)
w
The coating was strengthened by inserting a membrane made ofolyamide 6.6, in order to ensure homogenous and reproductible0◦-peel tests. The membrane was cut in polyamide 6.6 tissu (Nytex
Fig. 3. Diagram and image of the e
Fig. 2. SEM image of a cross-section of the HPC/coating-membrane system.
from Dutscher SAS) and deposited on each surface of HPC sam-ples. The coating was directly sprayed on this membrane in orderto avoid any air bubble at the interface. Finally, the edges of themembrane were cut to avoid any shear during the debonding. Themembrane is non-deformable under the sollicitations induced dur-ing the peel test. The dimensions of each membrane were 200 mmlong, 20 mm wide, 120 �m thick, with an open porosity of 50% and amesh opening of 150 �m. A cross-section of the HPC/coating inter-face was observed by SEM to present the coating/concrete system.Fig. 2 details the localization of the membrane, introduced into thelayer of the PU coating that covered the HPC surface.
All the peel tests were performed with a 1000 N sensor,equipped with a specific mobile table that ensured a 90◦ anglebetween the substrate and the peel direction (as detailed by Fig. 3).All the peel tests were performed under ambient conditions (25 ◦C,50% relative humidity). Moreover, the speed of peel was adjustedto a constant 0.2 mm/s in order to avoid any stick-slip behavior.
3. Results
3.1. Analyses of the reference materials before deposition andpeeling
3.1.1. HPC surfaces according to the type of the mouldHPC samples were characterized by FT-IR (in ATR mode), 28 days
after demoulding, in order to give reference spectra of the compo-sition of the surface. Two distinct moulds were used during the
cast of the HPC samples: PVC and POM. Fig. 4a and Table 2 detailthe IR bands of HPC (PVC). Portlandite (at 3640 cm−1) and C-S-H*/silica (large band at 1078 cm−1) were well detected. Moreover,three strong bands were also assigned to the presence of CaCO3.xperimental test of peeling.

M. Horgnies et al. / Progress in Organic Coatings 72 (2011) 360– 379 363
Fig. 4. Reference FTIR spectra of: (a) HPC (PVC); and (b) HPC (POM).
Table 2Assignment of IR bands recorded on each material: HPC (according to the type of mould), non-porous substrate, membrane, and coating.
Assignment FTIR bands (cm−1) HPC (PVC) HPC (POM) Non-porous substrate(dolostone)
Membrane made ofpolyamide
PU coating
O–H; portlandite Ca(OH)2 3640 XC O; CaCO3 1410; 872; 710 X X XSi–O; silicates, CSH 1080–970 X XSi–O; C3S 935; 900 XSi–O; silica 797; 777 X XCH2/CH3; methyl units 2850; 2950; 1450 X XN–H; amide 3300; 3070 XC O; amide 1630; 1530 XN–H; urea 3335 XNCO; isocyanates 2270 X (in case of partial
crosslinking)C O; urea 1690 X

364 M. Horgnies et al. / Progress in Organic Coatings 72 (2011) 360– 379
nditio
Todo(blap
Fig. 5. FTIR spectra after 28 days of curing under ambient co
heir detection confirmed previous studies [7,8,30]. The detectionf CaCO3 could be due to the carbonation of the surface but alsoue to the use of limestone filler in the HPC mix. The spectrumf HPC (POM) underlines distinct IR bands at 935 and 900 cm−1
Fig. 4b) that were assigned to alite (a component of the cement
efore hydration). Moreover, no band characteristic of the port-andite was detected. In Fig. 5a, the spectrum of HPC (PVC) presents large band at 1080 cm−1 that corresponds to the sum of severaleaks characteristic of silica and silicates. In Fig. 5a, this spectrum
ns: (a′) HPC (POM); (a′′) HPC (PVC); and (b) synthesized C3S.
was also compared to the one of HPC (POM) that showed peaks at901, 934 and 1092 cm−1, assigned to Si-O bonds from silica fumesand alite [31]. These spectra could be compared to the one of apure synthetic C3S* powder (Fig. 5b). These silica fumes and aliteare usually present in the bulk of HPC sample.
Fig. 6 compares the surfaces of HPC (POM or PVC). These ref-erence samples were observed by SEM, 28 days after demoulding(curing under ambient conditions). The HPC (POM) seems to berougher (Fig. 6a and b) than the HPC (PVC) (Fig. 6c and d). The flat

M. Horgnies et al. / Progress in Organic Coatings 72 (2011) 360– 379 365
r amb
thTfiwIfToa
3
wdcw
3
ta[tub(lt
Fig. 6. SEM images recorded after 28 days of curing unde
opography observed after using PVC mould contrasted with theeterogenous and rough surface obtained after using a POM mould.hese observations confirmed the measurements obtained by pro-lometry (Table 1): the Ra value obtained after using a POM mouldas little higher than the one obtained after using a PVC mould.
ndeed, these results suggest that a tearing of the extreme sur-ace of HPC could happen during the removing of the POM mould.his hypothesis could also explain why silica fumes were easilybserved by SEM observations on the surface (Fig. 6b) and whylite was detected by FT-IR spectroscopy.
.1.2. Non-porous substrate made of dolostoneThe composition of the surface of the non-porous substrate
as analysed by FT-IR. As presented by Fig. 7 (and Table 2), theolostone was only characterized by the IR bands assigned to thearbonates (at 1390, 870 and 710 cm−1). No other chemical unitsere highlighted by this technic of characterization.
.1.3. PU coating with membraneThe use of the FT-IR spectroscopy is known to determine
he degree of crosslinking of the isocyanates because a bandt 2270 cm−1 characterizes the presence of isocyanates units32,33]. The decreasing of the intensity of this band is relatedo the crosslinking of the isocyanates groups in order to formrea units [34]. Fig. 8 represents the spectra of a liquid coating
efore crosslinking (Fig. 8a) and a solid coating entirely crosslinkedFig. 8b). During this study, no results of adhesion were directlyinked to the degree of crosslinking of the coating. Whateverhe analyses of the coating/HPC sides after debonding, the FT-ient conditions: (a, b) HPC. (POM); and (c, d) HPC (PVC).
IR spectra allowed concluding that the PU coating was alwayscrosslinked. However, Fig. 8 and Table 2 underline other IR bandsassigned to the presence of urea units (at 3335 and 1690 cm−1).These bands were used to detect the residues of PU coating afterpeeling.
3.1.4. Membrane made of polyamideThe membrane was also analysed by FT-IR in order to assign
the reference peaks. Fig. 9 and Table 2 show the chemical vibra-tions of the amide units (at 3300, 3070, 1630 and 1530 cm−1)that characterized the polyamide 6.6. However, these IR bands ofthe polyamide were not detected on the spectra detailed in thispaper.
3.2. Results of peel tests and FT-IR analyses of the interface afterdebonding
3.2.1. Influence of the mould used to cast the HPCFig. 10 compares the peel curves obtained on two HPC samples
previously cured 28 days under ambient conditions. The adhe-sion between coating and HPC varied according to the type ofmould used. As shown in Table 3, the fracture energy measuredduring the peel of the PU coating from HPC (POM) is higher(1000 ± 150 N/m) than the one measured during the peel from HPC(PVC): 400 ± 50 N/m. Observation of the sample after debonding
showed that failure seemed to occur into the coating with the HPC(POM) while the debonding of the system occurred at the interfacebetween HPC (PVC) and coating. FT-IR analyses were performed toconfirm this result. Fig. 11a presents the FT-IR spectrum recorded
366 M. Horgnies et al. / Progress in Organic Coatings 72 (2011) 360– 379
stone)
oaTdtOsa
Fl
Fig. 7. FTIR spectrum of the non-porous substrate (dolo
n the HPC (POM) side after peeling: almost all the IR bands weressigned to the residues of coating that covered the entire surface.hese results confirm that the high fracture energy was linked to aebonding into the bulk of the coating. It could also be deduced that
he adhesion between HPC and coating was better than 1000 N/m.n the contrary, Fig. 11b shows FT-IR spectrum of the HPC (PVC)ide after peeling: compounds of concrete (such as CaCO3, silicand portlandite) were mainly detected and some traces of coat-
ig. 8. FTIR spectra of the PU coating: (a, in red) before crosslinking; and (b, in blue) afteegend, the reader is referred to the web version of the article.)
: only bands assigned to the carbonates were detected.
ing were highlighted. Moreover, Fig. 11c shows FT-IR spectrum ofthe coating (internal side) after peeling from HPC (PVC). All the IRbands were assigned to the own components of the coating. Thesedata allow concluding that the debonding occurred at the interface
between HPC and coating. These results showed a significant influ-ence of the type of the mould on the adhesion between PU coatingand concrete. The fracture energies (from Fig. 10) and FT-IR analy-ses after debonding (from Fig. 11) could be correlated to the SEMr complete crosslinking. (For interpretation of the references to color in this figure

M. Horgnies et al. / Progress in Organic Coatings 72 (2011) 360– 379 367
Fig. 9. FTIR spectrum of the mem
0
200
400
600
800
1000
1200
1400
0 10 20 30 40 50 60 70 80
Leng th of debo ndi ng (mm)
G (N
/m)
(a)
(b)
Fig. 10. Peel curves of coating recorded on HPC samples cured 28 days under ambi-ent conditions: (a, in blue) HPC (POM); and (b, in red) HPC (PVC). (For interpretationof the references to color in this figure legend, the reader is referred to the webversion of the article.)
Table 3Summary of the results obtained by peel tests and FTIR characterization of the interface H
HPC (mould) Time between demouldingand coating
Conditions of curing Post-tcoatin
POM28 days Ambient conditions –
PVC
POM28 days Humid conditions –
PVC
POM6 months Ambient conditions –
POM
POM28 days Ambient conditions Sandb
PVC
PVC 28 days Ambient conditions Surfacportla
brane made of polyamide.
images of the HPC surface before the deposition of the coating. Fig. 6had highlighted that the surface of HPC (POM) was more heteroge-nous than the HPC (PVC), which did not present any significantdetails. A tearing between the POM mould and HPC surface duringthe demoulding is the best explanation of this difference. We candeduce that the liquid coating (before crosslinking) strongly dif-fused and anchored into the HPC (POM) surface. On the contrary,the flat and close HPC (PVC) surface did not allow a high mechan-ical anchorage. Fig. 12a and b summarizes these results with twodrawings of these systems after debonding according to the type ofmould used.
3.2.2. Influence of the curing in humid conditionsSome HPC samples were cured during 28 days under humid
conditions that optimize the growth of the efflorescences madeof calcium carbonates. Fig. 13a and b presents the SEM imagesrecorded on a reference HPC (PVC), cured 28 days under ambientconditions. These images could be compared to the ones recorded
PC/coating after debonding.
reatment beforeg
Fracture energy (N/m) Failure localization deducedfrom FTIR analyses
1000 ± 150 Inside the PU coating400 ± 50 At HPC/PU interface500 ± 100 Mainly at HPC/PU interface
(+some PU coating residueson HPC surface)
800 ± 100 Mainly inside the PU coating(+some areas at the interface)
200 ± 50 At HPC/PU interface100 ± 50 At HPC/PU interface
lasting1200 ± 100 Inside the PU coating1200 ± 100 Inside the PU coating
e covered byndite
100 ± 50 At HPC/PU interface

368 M. Horgnies et al. / Progress in Organic Coatings 72 (2011) 360– 379
F g systes g (int
oteFa
ig. 11. FTIR spectra of the HPC (cured 28 days under ambient conditions)/coatinurface; (b) HPC (PVC) side: some traces of coating could be detected; and (c) coatin
n a HPC cured 28 days under humid conditions. The growth of
he CaCO3 crystals was easily detected in Fig. 13c and d. Theyntirely covered the surface of the HPC. FT-IR spectra, shown inig. 14, compare the HPC surface after 28 days of curing undermbient conditions (Fig. 14a) or under humid conditions (Fig. 14b).m after peeling: (a) HPC (POM) side: coating residues were detected all over theernal side) after debonding from HPC (PVC): no traces of concrete were detected.
The intensity of the IR band assigned to the silica (at 1070 cm−1)
strongly decreased after humid curing and the weak peak assignedto the portlandite (at 3640 cm−1) could not be detected. We coulddeduce that the compounds made of silica were covered by CaCO3(shown by strong peaks at 1410, 870 and 710 cm−1). Fig. 15 shows
M. Horgnies et al. / Progress in Organ
F(
phtiirut
oTisS77oeocA
ig. 12. Diagram of the HPC/coating system after debonding: (a) HPC (POM); andb) HPC (PVC).
eel curves of coating recorded on the HPC samples cured inumid conditions. The fracture energies were distinct accordingo the type of the mould used to cast the concrete. As shownn Table 3, HPC (PVC) offered a higher adhesion with PU coat-ng (800 ± 100 N/m) than the HPC (POM) (500 ± 100 N/m). Theseesults were different from the ones recorded after storing the HPCnder ambient conditions (in this case, the HPC (POM) had offeredhe best fracture energies during the peel of the coating).
Images presented in Fig. 16a underline that the debondingccurred mainly at the interface between HPC (POM) and coating.his hypothesis was confirmed by FT-IR analysis after debond-ng, detailed in Fig. 17a. The spectrum of the coating (internalide) was not only characteristic of the PU coating after peeling.ome residues of polyurea were detected at 1786, 1680, 764 and52 cm−1 but also bands assigned to CaCO3 (at 1373, 870 and11 cm−1). The strong intensity of the peaks of CaCO3 detectedn the coating side after debonding confirmed the tearing of the
xtreme surface of the HPC sample during the peel test. The surfacef HPC seems to have been weakened by the growth of efflores-ences, made of CaCO3, during the curing under humid conditions.s shown in the image of Fig. 16b, the HPC (PVC) side after debond-Fig. 13. SEM images of the HPC (PVC): (a, b) cured 28 days under ambi
ic Coatings 72 (2011) 360– 379 369
ing was distinct. Half of the HPC surface was clearly covered byresidues from the PU coating. As detailed in the FT-IR analyses ofFig. 17b, only traces of CaCO3 (at 870 cm−1) were detected on theinternal side of the coating after debonding. During the peel tests,the tearing of the extreme surface of HPC (PVC) seemed to be lowerthan the one detected on HPC (POM).
It was not possible to measure any difference in terms of rough-ness or porosity that could explain these results. Measurement ofporosity in the near surface layer of a concrete was problematicbecause it was extremely difficult to make a judgment on howrepresentative the selected sample was (the average size of sam-ples was about 2–3 g). Moreover, the humid conditions of storagecould modify the hydration process of the concrete surface, whichcould influence the adhesion of the coating. In parallel of the testsperformed after humid storage, a HPC (POM) sample (previouslystored 28 days under ambient conditions) was soaked into waterjust before the deposition of PU coating. Fig. 18 compares the peelcurves recorded on reference HPC (POM) with the one recorded onthe HPC (POM) saturated with water. Both the levels of fractureenergy were similar (about 1000 ± 100 N/m): the water saturationof concrete did not affect the adhesion of the PU coating.
Indeed, we can deduce that the growth of efflorescences (duringthe 28 days of storage under humid conditions) was specific on thesurface of HPC (POM), which was more heterogenous and rougherthan the one of the HPC (PVC). In summary, after using POM to castthe HPC, the debonding seems to occur mainly in the weak extreme
surface of HPC, exclusively composed of efflorescences (crystalsgrown during the humid curing). As shown in Fig. 19a, the tear-ing of crystals of CaCO3 from the surface of HPC was probably theorigin of this weak adhesion of the coating. After using PVC to castent conditions; and (c, d) cured 28 days under humid conditions.

370 M. Horgnies et al. / Progress in Organic Coatings 72 (2011) 360– 379
F ditionr the a
tsFt
3c
uaedtas
Fhtw
ig. 14. FTIR spectra of the HPC (PVC): (a, in blue) cured 28 days under ambient coneferences to color in this figure legend, the reader is referred to the web version of
he HPC, the adhesion of PU coating was higher and most of theurface of concrete was covered by coating residues. As shown inig. 19b, while some debonding could be detected at the interface,he failure occurred mainly in the layer of PU coating.
.2.3. HPC aged during 6 months before deposition of the PUoating
The ageing of the HPC samples was undertaken during 6 monthsnder ambient conditions before the deposition of the coating. SEMnd FT-IR analyses (results not shown) did not highlight any differ-nce between these HPC samples compared to the ones cured 28
ays under ambient conditions. However, the peel tests underlinehat the fracture energy decreased drastically if the HPC surface wasged during 6 months before the deposition of the coating. As pre-ented in Fig. 20, the fracture energies recorded on these aged HPC0
200
400
600
800
1000
1200
1400
0 10 20 30 40 50 60 70 80
Leng th of debo nding (mm)
G (N
/m)
(b)
(a)
ig. 15. Peel curves of coating recorded on the HPC samples cured 28 days underumid conditions: (a, in blue) HPC (POM); and (b, in red) HPC (PVC). (For interpre-ation of the references to color in this figure legend, the reader is referred to theeb version of the article.)
s; and (b, in red) cured 28 days under humid conditions. (For interpretation of therticle.)
samples were between 100 and 200 N/m whatever the type of themould (PVC or POM). These low values could be compared to theones obtained after curing the HPC for only 28 days: between 400and 1000 N/m (Fig. 10). Figs. 21 and 22 show FT-IR spectra of theHPC sides and coating sides after debonding. Comparison betweenthe spectra did not evidence any differences according to the age-ing time under ambient conditions. In both the cases, the failureseemed to be interfacial: the ageing did not affect the localizationof the debonding. Fig. 23 represents a drawing of this system afterdebonding. Because the analyses of the HPC before the depositionof the coating did not evidence any differences of roughness norchemical composition, we can hypothesize that the weak adhesionof the coating could be linked to a closer porosity of the surface. Thisclose porosity could be induced by the natural carbonation kinet-ics that usually affects the HPC surface [35,36]. The volume of thehydrates like portlandite (33 cm3 mol−1) is known to be lower thanthe one of the calcium carbonate (37 cm3 mol−1). By closing theporosity of the surface, this carbonation could consequently affectthe diffusion of the liquid coating into the HPC (before crosslink-ing) and limit the mechanical anchorage. We tried to measure byMIP the influence of the carbonation on the porosity of the HPCsample. However, its low intrinsic porosity (8.0% of total poros-ity) and difficulties of sampling concerning the measurement ofsurface porosity (see Section 3.2.2) did not allow determining anydifference according to the ageing of the HPC samples.
3.2.4. HPC surface covered by portlandite crystalsA HPC surface covered by portlandite crystals was used to deter-
mine the influence of these crystals on the adhesion of coating.Fig. 24 shows the hexagonal crystals of portlandite that coveredthe surface of concrete. The PU coating was deposited on the
HPC 28 days after demoulding (curing under ambient conditions).Fig. 25 presents the fracture energy measured during the peel of thecoating from the HPC sample covered by portlandite. This curveunderlines a very low adhesion (less than 100 N/m). The FT-IR
M. Horgnies et al. / Progress in Organic Coatings 72 (2011) 360– 379 371
Fig. 16. Images of the HPC (previously cured 28 days under humid conditions)/coating system after peeling: (a) HPC (POM) side: almost all the debonding was interfacial;(b) HPC (PVC) side: residues of coating partly covered the concrete surface.
Fig. 17. FTIR spectra of the coating (internal side) after debonding from HPC previously cured 28 days under humid conditions: (a) HPC (POM): strong residues of concretewere detected; and (b) HPC (PVC): small amount of CaCO3 residues was detected.

372 M. Horgnies et al. / Progress in Organic Coatings 72 (2011) 360– 379
0
200
400
600
800
100 0
120 0
140 0
0 10 20 30 40 50 60 70 80
Lenght of de bond ing [mm]
G [N
/m]
(a)
(b)
Fig. 18. Peel curves of PU coating recorded on: (a) HPC (POM) previously stored 28days under ambient conditions and soaked in water just before the deposition ofthe coating; (b) reference HPC (POM) stored 28 days under ambient conditions.
Fig. 19. Diagram of the system after the peel of the coating from HPC samples (pre-viously cured in humid conditions): (a) HPC (POM): partial tearing of efflorescencesfrom the HPC surface; and (b) HPC (PVC): some CaCO3 residues were transferredfrom HPC to the coating.
0
200
400
600
800
1000
1200
1400
0 10 20 30 40 50 60 70 80
Leng th of debo ndi ng (mm)
G (N
/m)
(a)
(b)
Fig. 20. Peel curves of coating recorded on the HPC samples aged 6 months underambient conditions: (a, in blue) HPC (POM); and (b, in red) HPC (PVC). (For inter-
Fig. 21. FTIR spectra of the HPC (PVC) side after debonding from coating: (a, in blue) cureconditions. (For interpretation of the references to color in this figure legend, the reader i
pretation of the references to color in this figure legend, the reader is referred to theweb version of the article.)
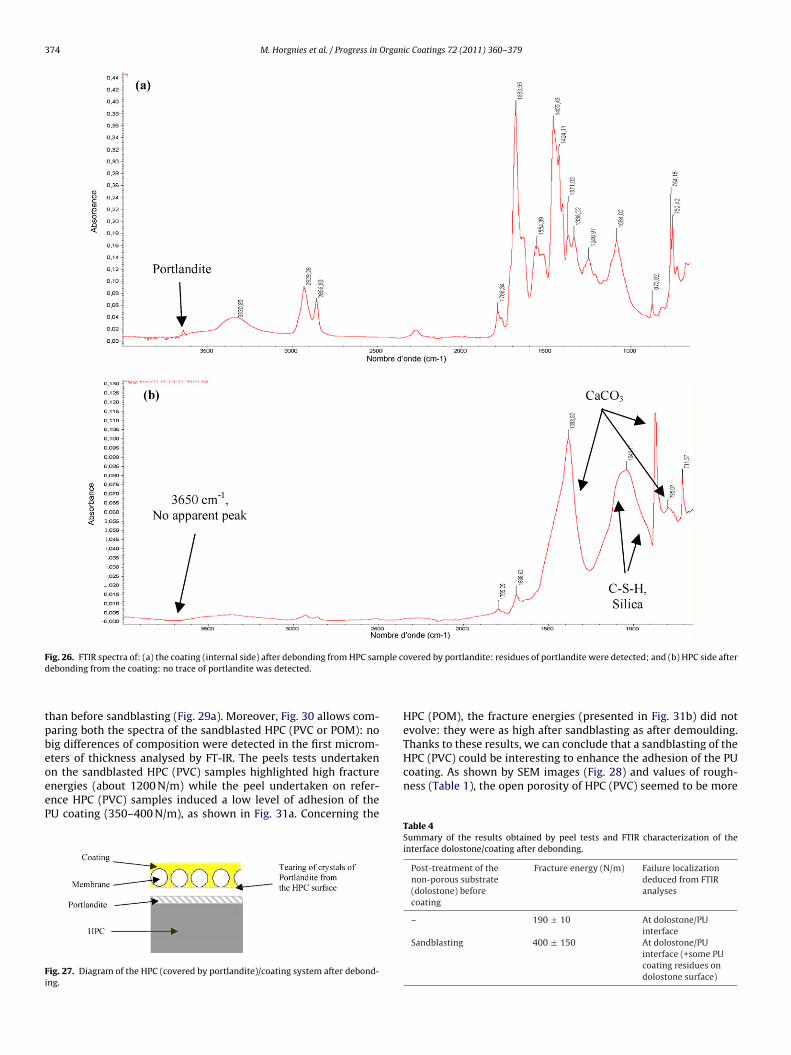
spectrum of the coating (internal side), recorded after debond-ing, highlights that residues of portlandite (band at 3648 cm−1 inFig. 26a) were teared from the HPC surface. Moreover, no pres-ence of portlandite was detected by FT-IR on the HPC side afterdebonding (Fig. 26b). We can deduce that the debonding occurredat the extreme surface of the HPC, composed of large crystalsof portlandite. In fact, as shown in Fig. 27, the weak crystals ofportlandite affected the adhesion of the PU coating. However, thespecific chemical composition induced by these crystals could notentirely explain the low adhesion of the coating. We may hypothe-size that the closer porosity of the HPC covered by portlandite couldaffect the mechanical anchorage. Indeed, the large crystals made ofportlandite could disturb the diffusion of the liquid coating (beforecrosslinking) into the porous surface of HPC. An intrinsic porosity
of 7.8% was measured by MIP on the HPC sample covered by port-landite but this value was too close to the one obtained in referenceto conclude about the hypothesis.d 28 days under ambient conditions; and (b, in red) cured 6 months under ambients referred to the web version of the article.)

M. Horgnies et al. / Progress in Organic Coatings 72 (2011) 360– 379 373
Fig. 22. FTIR spectra of the coating (internal side) after debonding from the HPC (PVC): (under ambient conditions. (For interpretation of the references to color in this figure lege
Fig. 23. Diagram of the HPC (stored 6 months under ambient conditions)/coatingsystem after debonding.
Fig. 24. SEM image of a surface of HPC (PVC) covered by crystals of portlandite.
a, in blue) cured 28 days under ambient conditions; and (b, in red) cured 6 monthsnd, the reader is referred to the web version of the article.)
3.2.5. Influence of the roughness of the substratesThe influence of the roughness was studied by using sandblasted
HPC samples that were previously cured under ambient conditionsduring 28 days. Table 1 summarizes the roughness obtained aftersandblasting, compared to the one before demoulding. The initialroughness was about 0.5–0.7 �m range (depending on the type ofmould used). The roughness of HPC increased to a Ra value of about12 �m after sandblasting (whatever the type of the mould used).SEM was used to determine the influence of the sandblasting onthe morphology of the surface. SEM images presented in Fig. 28could be compared with the ones of the reference HPC samples(Fig. 6). The sandblasted surface was rougher than after demould-ing whatever the type of the mould used. Silica fumes were alsodetected after sandblasting. Fig. 29 compares the FT-IR spectra
recorded on the HPC (PVC) samples before and after sandblasting.The intensity of the FT-IR bands assigned to the CaCO3 compounds(at 1410, 870 and 710 cm−1) decreased after sandblasting whilethe intensity of the bands of alite (at 930–900 cm−1) were higher0
200
400
600
800
100 0
120 0
140 0
0 10 20 30 40 50 60 70 80
Lengh t of debon ding (mm)
G (N
/m)
Fig. 25. Peel curve of coating recorded on the HPC sample covered by crystals ofportlandite.
374 M. Horgnies et al. / Progress in Organic Coatings 72 (2011) 360– 379
Fig. 26. FTIR spectra of: (a) the coating (internal side) after debonding from HPC sample covered by portlandite: residues of portlandite were detected; and (b) HPC side afterd
tpbeoeeP
Fi
HPC (PVC) could be interesting to enhance the adhesion of the PUcoating. As shown by SEM images (Fig. 28) and values of rough-
ebonding from the coating: no trace of portlandite was detected.
han before sandblasting (Fig. 29a). Moreover, Fig. 30 allows com-aring both the spectra of the sandblasted HPC (PVC or POM): noig differences of composition were detected in the first microm-ters of thickness analysed by FT-IR. The peels tests undertakenn the sandblasted HPC (PVC) samples highlighted high fracture
nergies (about 1200 N/m) while the peel undertaken on refer-nce HPC (PVC) samples induced a low level of adhesion of theU coating (350–400 N/m), as shown in Fig. 31a. Concerning theig. 27. Diagram of the HPC (covered by portlandite)/coating system after debond-ng.
HPC (POM), the fracture energies (presented in Fig. 31b) did notevolve: they were as high after sandblasting as after demoulding.Thanks to these results, we can conclude that a sandblasting of the
ness (Table 1), the open porosity of HPC (PVC) seemed to be more
Table 4Summary of the results obtained by peel tests and FTIR characterization of theinterface dolostone/coating after debonding.
Post-treatment of thenon-porous substrate(dolostone) beforecoating
Fracture energy (N/m) Failure localizationdeduced from FTIRanalyses
– 190 ± 10 At dolostone/PUinterface
Sandblasting 400 ± 150 At dolostone/PUinterface (+some PUcoating residues ondolostone surface)

M. Horgnies et al. / Progress in Organic Coatings 72 (2011) 360– 379 375
Fig. 28. SEM images recorded on the HPC samples after sandblasting: (a, b) HPC (POM); and (c, d) HPC (PVC).
Fig. 29. FTIR spectra of HPC (PVC): (a) before sandblasting; and (b) after sandblasting.
376 M. Horgnies et al. / Progress in Organic Coatings 72 (2011) 360– 379
F nd (b,t
i(HFstah
i
Fs
ig. 30. FTIR spectra of the HPC samples after sandblasting: (a, blue) HPC (POM); ahe reader is referred to the web version of the article.)
mportant after the sandblasting (Fig. 28c) than after demouldingFig. 6c). On the contrary, the sandblasting was less helpful with thePC (POM) because the open porosity was a predominant future.T-IR analyses of the HPC sides were performed after peeling (ashown in Fig. 32a and b). Only residues of coating were detected onhese HPC sides (whatever the type of mould used). The debonding
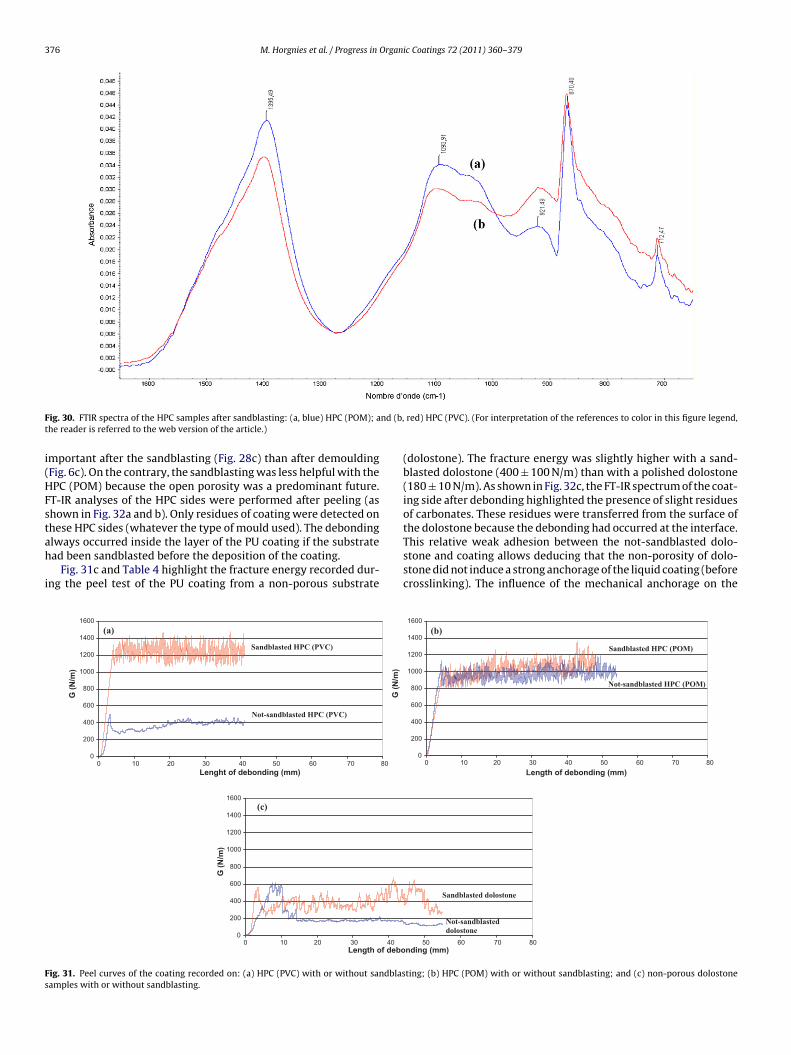
lways occurred inside the layer of the PU coating if the substratead been sandblasted before the deposition of the coating.Fig. 31c and Table 4 highlight the fracture energy recorded dur-ng the peel test of the PU coating from a non-porous substrate
0
200
400
600
800
1000
1200
1400
1600
80706050403020100Lenght of debond ing (mm)
G (N
/m)
G (N
/m)
0
200
400
600
800
1000
1200
1400
1600
403020100Leng th of debo
G (N
/m)
(a)
(c)
Sandblaste d HPC (PVC)
Not-sand bla sted HPC (PVC)
ig. 31. Peel curves of the coating recorded on: (a) HPC (PVC) with or without sandblasamples with or without sandblasting.
red) HPC (PVC). (For interpretation of the references to color in this figure legend,
(dolostone). The fracture energy was slightly higher with a sand-blasted dolostone (400 ± 100 N/m) than with a polished dolostone(180 ± 10 N/m). As shown in Fig. 32c, the FT-IR spectrum of the coat-ing side after debonding highlighted the presence of slight residuesof carbonates. These residues were transferred from the surface ofthe dolostone because the debonding had occurred at the interface.
This relative weak adhesion between the not-sandblasted dolo-stone and coating allows deducing that the non-porosity of dolo-stone did not induce a strong anchorage of the liquid coating (beforecrosslinking). The influence of the mechanical anchorage on the0
200
400
600
800
1000
1200
1400
1600
80706050403020100Length of debon ding (mm)
80706050nding (mm )
(b)
Sand bla sted HPC (POM )
Not-sandbl aste d HPC (POM)
Sandblasted dolostone
Not-sandbl aste d dolo stone
ting; (b) HPC (POM) with or without sandblasting; and (c) non-porous dolostone

M. Horgnies et al. / Progress in Organic Coatings 72 (2011) 360– 379 377
Fig. 32. FTIR spectra after debonding: (a) side of sandblasted HPC (PVC); (b) side of sandblasted HPC (POM); and (c) side of coating after debonding of sandblasted dolostone.
378 M. Horgnies et al. / Progress in Organ
Fs
arl
iuto
4
fimtTsd(adctcocisnoassitct
A
t
[
[
[
[
[
[
[
[
[
[
[
[
[
[
[
[
[
[
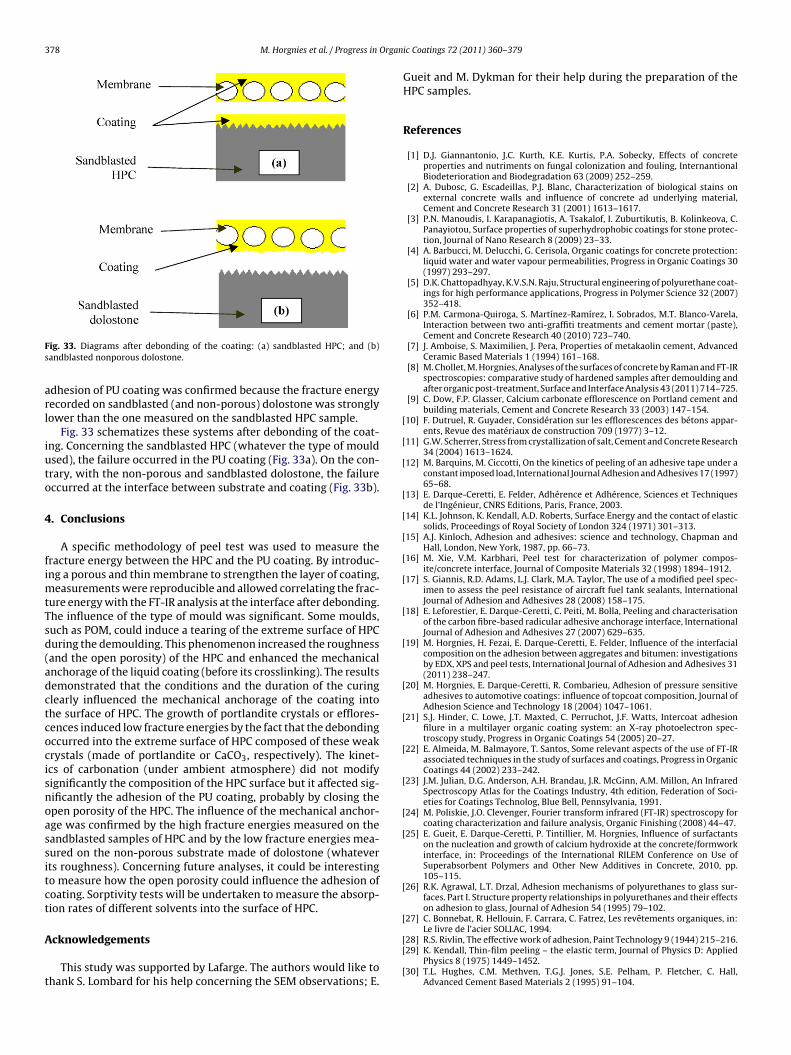
ig. 33. Diagrams after debonding of the coating: (a) sandblasted HPC; and (b)andblasted nonporous dolostone.
dhesion of PU coating was confirmed because the fracture energyecorded on sandblasted (and non-porous) dolostone was stronglyower than the one measured on the sandblasted HPC sample.
Fig. 33 schematizes these systems after debonding of the coat-ng. Concerning the sandblasted HPC (whatever the type of mouldsed), the failure occurred in the PU coating (Fig. 33a). On the con-rary, with the non-porous and sandblasted dolostone, the failureccurred at the interface between substrate and coating (Fig. 33b).
. Conclusions
A specific methodology of peel test was used to measure theracture energy between the HPC and the PU coating. By introduc-ng a porous and thin membrane to strengthen the layer of coating,
easurements were reproducible and allowed correlating the frac-ure energy with the FT-IR analysis at the interface after debonding.he influence of the type of mould was significant. Some moulds,uch as POM, could induce a tearing of the extreme surface of HPCuring the demoulding. This phenomenon increased the roughnessand the open porosity) of the HPC and enhanced the mechanicalnchorage of the liquid coating (before its crosslinking). The resultsemonstrated that the conditions and the duration of the curinglearly influenced the mechanical anchorage of the coating intohe surface of HPC. The growth of portlandite crystals or efflores-ences induced low fracture energies by the fact that the debondingccurred into the extreme surface of HPC composed of these weakrystals (made of portlandite or CaCO3, respectively). The kinet-cs of carbonation (under ambient atmosphere) did not modifyignificantly the composition of the HPC surface but it affected sig-ificantly the adhesion of the PU coating, probably by closing thepen porosity of the HPC. The influence of the mechanical anchor-ge was confirmed by the high fracture energies measured on theandblasted samples of HPC and by the low fracture energies mea-ured on the non-porous substrate made of dolostone (whateverts roughness). Concerning future analyses, it could be interestingo measure how the open porosity could influence the adhesion ofoating. Sorptivity tests will be undertaken to measure the absorp-ion rates of different solvents into the surface of HPC.
cknowledgements
This study was supported by Lafarge. The authors would like tohank S. Lombard for his help concerning the SEM observations; E.
[[
[
ic Coatings 72 (2011) 360– 379
Gueit and M. Dykman for their help during the preparation of theHPC samples.
References
[1] D.J. Giannantonio, J.C. Kurth, K.E. Kurtis, P.A. Sobecky, Effects of concreteproperties and nutriments on fungal colonization and fouling, InternantionalBiodeterioration and Biodegradation 63 (2009) 252–259.
[2] A. Dubosc, G. Escadeillas, P.J. Blanc, Characterization of biological stains onexternal concrete walls and influence of concrete ad underlying material,Cement and Concrete Research 31 (2001) 1613–1617.
[3] P.N. Manoudis, I. Karapanagiotis, A. Tsakalof, I. Zuburtikutis, B. Kolinkeova, C.Panayiotou, Surface properties of superhydrophobic coatings for stone protec-tion, Journal of Nano Research 8 (2009) 23–33.
[4] A. Barbucci, M. Delucchi, G. Cerisola, Organic coatings for concrete protection:liquid water and water vapour permeabilities, Progress in Organic Coatings 30(1997) 293–297.
[5] D.K. Chattopadhyay, K.V.S.N. Raju, Structural engineering of polyurethane coat-ings for high performance applications, Progress in Polymer Science 32 (2007)352–418.
[6] P.M. Carmona-Quiroga, S. Martínez-Ramírez, I. Sobrados, M.T. Blanco-Varela,Interaction between two anti-graffiti treatments and cement mortar (paste),Cement and Concrete Research 40 (2010) 723–740.
[7] J. Amboise, S. Maximilien, J. Pera, Properties of metakaolin cement, AdvancedCeramic Based Materials 1 (1994) 161–168.
[8] M. Chollet, M. Horgnies, Analyses of the surfaces of concrete by Raman and FT-IRspectroscopies: comparative study of hardened samples after demoulding andafter organic post-treatment, Surface and Interface Analysis 43 (2011) 714–725.
[9] C. Dow, F.P. Glasser, Calcium carbonate efflorescence on Portland cement andbuilding materials, Cement and Concrete Research 33 (2003) 147–154.
10] F. Dutruel, R. Guyader, Considération sur les efflorescences des bétons appar-ents, Revue des matériaux de construction 709 (1977) 3–12.
11] G.W. Scherrer, Stress from crystallization of salt, Cement and Concrete Research34 (2004) 1613–1624.
12] M. Barquins, M. Ciccotti, On the kinetics of peeling of an adhesive tape under aconstant imposed load, International Journal Adhesion and Adhesives 17 (1997)65–68.
13] E. Darque-Ceretti, E. Felder, Adhérence et Adhérence, Sciences et Techniquesde l’Ingénieur, CNRS Editions, Paris, France, 2003.
14] K.L. Johnson, K. Kendall, A.D. Roberts, Surface Energy and the contact of elasticsolids, Proceedings of Royal Society of London 324 (1971) 301–313.
15] A.J. Kinloch, Adhesion and adhesives: science and technology, Chapman andHall, London, New York, 1987, pp. 66–73.
16] M. Xie, V.M. Karbhari, Peel test for characterization of polymer compos-ite/concrete interface, Journal of Composite Materials 32 (1998) 1894–1912.
17] S. Giannis, R.D. Adams, L.J. Clark, M.A. Taylor, The use of a modified peel spec-imen to assess the peel resistance of aircraft fuel tank sealants, InternationalJournal of Adhesion and Adhesives 28 (2008) 158–175.
18] E. Leforestier, E. Darque-Ceretti, C. Peiti, M. Bolla, Peeling and characterisationof the carbon fibre-based radicular adhesive anchorage interface, InternationalJournal of Adhesion and Adhesives 27 (2007) 629–635.
19] M. Horgnies, H. Fezai, E. Darque-Ceretti, E. Felder, Influence of the interfacialcomposition on the adhesion between aggregates and bitumen: investigationsby EDX, XPS and peel tests, International Journal of Adhesion and Adhesives 31(2011) 238–247.
20] M. Horgnies, E. Darque-Ceretti, R. Combarieu, Adhesion of pressure sensitiveadhesives to automotive coatings: influence of topcoat composition, Journal ofAdhesion Science and Technology 18 (2004) 1047–1061.
21] S.J. Hinder, C. Lowe, J.T. Maxted, C. Perruchot, J.F. Watts, Intercoat adhesionfilure in a multilayer organic coating system: an X-ray photoelectron spec-troscopy study, Progress in Organic Coatings 54 (2005) 20–27.
22] E. Almeida, M. Balmayore, T. Santos, Some relevant aspects of the use of FT-IRassociated techniques in the study of surfaces and coatings, Progress in OrganicCoatings 44 (2002) 233–242.
23] J.M. Julian, D.G. Anderson, A.H. Brandau, J.R. McGinn, A.M. Millon, An InfraredSpectroscopy Atlas for the Coatings Industry, 4th edition, Federation of Soci-eties for Coatings Technolog, Blue Bell, Pennsylvania, 1991.
24] M. Poliskie, J.O. Clevenger, Fourier transform infrared (FT-IR) spectroscopy forcoating characterization and failure analysis, Organic Finishing (2008) 44–47.
25] E. Gueit, E. Darque-Ceretti, P. Tintillier, M. Horgnies, Influence of surfactantson the nucleation and growth of calcium hydroxide at the concrete/formworkinterface, in: Proceedings of the International RILEM Conference on Use ofSuperabsorbent Polymers and Other New Additives in Concrete, 2010, pp.105–115.
26] R.K. Agrawal, L.T. Drzal, Adhesion mechanisms of polyurethanes to glass sur-faces. Part I. Structure property relationships in polyurethanes and their effectson adhesion to glass, Journal of Adhesion 54 (1995) 79–102.
27] C. Bonnebat, R. Hellouin, F. Carrara, C. Fatrez, Les revêtements organiques, in:Le livre de l’acier SOLLAC, 1994.
28] R.S. Rivlin, The effective work of adhesion, Paint Technology 9 (1944) 215–216.29] K. Kendall, Thin-film peeling – the elastic term, Journal of Physics D: Applied
Physics 8 (1975) 1449–1452.30] T.L. Hughes, C.M. Methven, T.G.J. Jones, S.E. Pelham, P. Fletcher, C. Hall,
Advanced Cement Based Materials 2 (1995) 91–104.

Organ
[
[
[
[
[
M. Horgnies et al. / Progress in
31] R.L. Frost, J. Cejka, M.L. Weier, Molecular structure of the uranyl silicates – aRaman spectroscopic study, Journal of Raman spectroscopy 37 (2005) 538–551.
32] A.L. Daniel-da-Silva, J.M. Martin-Martinez, J.C.M. Bordado, Influence of the stor-
age of reactive urethane quasi-prepolymers in their composition and adhesionproperties, International Journal of Adhesion and Adhesives 28 (2007) 29–37.33] A.L. Daniel-da-Silva, J.C.M. Bordado, J.M. Martin-Martinez, Moisture curingkinetics of isocyanate ended urethane quasi-prepolymers monitored by IRspectroscopy and DSC, Journal of Applied Polymer Science 107 (2007) 700–709.
[
ic Coatings 72 (2011) 360– 379 379
34] K. Agrawal, L. Drzal, Adhesion mechanisms of polurethanes to glass surfaces,Journal of Adhesion Sciences Technology 9 (1995) 1381–1400.
35] M. Thiery, G. Villain, P. Dangla, G. Platet, Investigation of the carbonation front
shape on cementitiuous materials: effects of the chemical kinetics, Cement andConcrete Research 37 (2007) 1047–1058.36] G. Villain, M. Thiery, G. Platet, Measurements methods of carbonation pro-files in concrete: thermogravimetry, chemical analysis and gammadensimetry,Cement and Concrete Research 37 (2007) 1182–1192.