progress report “c!s...progress report “c! s “ los alamos national laboratory is oparated by...
TRANSCRIPT

.● b,
&
LA-91 74-PR
Progress Report
“c!S● “Los Alamos National Laboratory Is oparated by the Unlverslty of California for the United Statee Department of Energy under contract W-7405 -ENG-36.
. .——. .- ... —, .
—— -.— __—
.
K%’$!’w@%%:w&$>w:ti3*,:*:J#,fi;:’wm’’*~:, 3
h Affiitive Action/Eqrsal Ofs@SISdtyEll@OyeS
This work was supported by the US Department of Energy, Nevada Waste StorageInvestigations managed by the Nevada Operations Office.
DISCLAIMER
This report waspreparedas an account of work sponsoredby an agencyof the United States Government.Neitherthe United States Governmentnor any agencythereof, nor any of their employees,makesanywarranty,expressor implied,or assumesany legalliabilityor responsibilityfor the accuracy,completeness,or usefulnessof any information,apparatus,product, or processdisclosed,or representsthat its w wouldnot infringeprivateIyownedrights. Referenceshereinto any specitlccommercialproduct, process,orserviceby trade mme, trademark,manufacturer,or otherwise,doesnot necessarilyconstitute or implyitsendorsement,recommendation,or favoringby the United States Governmentor any asency thereof. Theviewsand opinionsof authors expressedherein do not necessarilystate or reflect those of the UnitedSrateaGovernmentor any agencythereof.

LA-91 74-PRProgress Report
UC-70Issued: February 1982
Effects of Long-Term Exposure of
Tuffs to High-Level Nuclear
Waste-Repository Conditions
Preliminary Report
J. BlacicJ. CarterP. HalleckP. Johnson
T. ShanklandR. Andersen
K SpicochiA. Heller
-.. .—...
—.
. . .1. -_l.
~~~~lk)~~~ LosAlamos,NewMexico875.5Los Alamos National Laboratory

EFFECTS OF LONG-TERM EXPOSURE OF TUFFS TO HIGH-LEVEL NUCLEARWASTE-REPOSITORY CONDITIONS
Preliminary Report
by
J. Blacic, J. Carter, P. Halleck, P. Johnson, T. Shankland,R. Andersen, K. Spicochi, and A. Heller (Geophysics Group ESS-3)
ABSTRACT
Tests have been performed to explore the effects ofextended exposure of tuffs from the southwestern portion ofthe Nevada Test Site to temperatures and pressures similarto those that will be encountered in a high-level nuclearwaste repository. Tuff samples ranging from highly welded,nonzeolitized to unwelded, highly zeolitized varieties weresubjected to temperatures of 80, 120, and 180”C; confiningpressures of 9.7 and 19.7 MPa; and water-pore pressures of0.5 to 19.7 MPa for durations of 2 to 6 months. The follow-ing basic properties were measured before and after exposureand compared: tensile strength, uniaxial compressivestrength, grain density, porosity, mineralogy, permeability,thermal expansion, and thermal conductivity.
Depending on rock type and exposure conditions, sig-nificant changes in ambient tensile strength, compressivestrength, grain density, and porosity were measured. Miner-alogic examination, permeability, and thermal property mea-surements remain to be completed.
I. INTRODUCTION
As part of the Nevada Nuclear Waste Storage Investigations (NNWSI) Pro-
gram, the Los Alamos and Sandia National Laboratories are evaluating the
potential of silicic pyroclastic rocks of the Nevada Test Site (NTS) as
nuclear waste repository media. The program consists of interacting labora-
tory, field, and computer modeling studies designed to establish the necessary
design criteria to assure a safe repository. In particular, thermal and mech-
anical properties of the rock mass used for the repository are critical data
inputs in assessing repository performance.
1

Severa factors can affect the thermomechanical behavior of rocks. Among
these are temperature, stress field, and time. The mechanisms involved are
complex and beyond the scope of this report, but we note that both physical
and chemical processes can result in temporary or permanent changes in the
rocks. Although laboratory measurements are commonly made under a variety of
temperature and stress conditions, the
because the relatively long time scales
equipment that could otherwise be used for
This project was designed to test a
by an extended exposure to the hot, wet,
effect of time is seldom measured
required for such tests immobilize
many shorter tests.
large number of samples at one time
high-stress conditions expected near
a waste repository. The individual tests are designed to cover a range of tem-
perature and pressure conditions simulating varying distances from the waste
canister and different repository depths. Because the properties of tuffs
vary substantially with lithology, a range of “types” covering varying degrees
of welding and postdeposition mineralization were chosen.
The experiments reported here avoid the need for tying up high-tempera-
ture, high-pressure testing equipment by performing most measurements at
ambient conditions. The samples were exposed to repository conditions in a
sealed environment and later removed for testing. This allows a wide range of
tests on a significant number of samples. By comparing the results of these
tests with similar data for control samples, changes caused b.y the exposure
can be detected.
These experiments are intended to be
designed to detect irreversible changes
character of the samples that may indicate
or pressure conditions. Any adverse effects
further by appropriately designed experiments.
collection is at ambient conditions, the data
regarded as engineering data.
II. SAMPLES AND SAMPLE PREPARATION
exploratory in nature. They were
in the physical and mineralogic
potentially troublesome temperature
noted should be investigated
Because for the most part data
presented here should not be
Samples for this study were selected from cores taken from two test holes
at the Yucca Mountain Site at the Nevada Test Site. These holes are UE25a#l
and USW-G1. General petrology and mineralogy of the rock units found in these
cores have been reported elsewhere.1,2
Four units were selected for the tests
shown in Table I. These selections were made to provide a contrast in degree
2

TABLE I
KEY TO TEST CONDITIONS
Test #
1
2
3
4
5
6
7
8
9
10
Temperature
80”C
80 “C
120”C
120“c
120”C
120”C
180“C
180°C
120”C
120”C
Confining Pressure(MPa)
19.7
9.7
19.7
9.7
19.7
9. J
9.7
9.7
19.7
9.7
Pore Pressure
~
5.0
0.5
19.7
0.5
19.7
9.7
9.7
9.7
19.7
9.7
Ouration
Qk?z!!Q
6
6
5-1/2
5-1/2
2-1/2
2-l/2
3-1/2
3-1/2
2
2
8asic mechanical comparisons (compressive strength, tensile strength,density, and porosity) were performed for al 1 tests. Mineral ogic and petro-logic examinations will also be done for all tests. Permeabil ity data wi 11 becollected for tests 3 and 6 and thermal properties for tests 1, 4, and 5.
of welding and zeolite content. In addition, the Bullfrog and Tram units
selected are under consideration as target horizons for field investigations.
The samples exposed to high-temperature, high-pressure conditions were
2.54-cm-diam by 6.5-cm-long cylinders. Control samples
piece of core as the test sample, in most cases cut side
for handling, preparing, and storing the samples are in
plete list of core samples tested is in Table I.
III. EXPOSURE CONDITIONS
came from the same
by side. Procedures
Appendix A. A com-
Test conditions were chosen to simulate different burial depths, water
table levels, and distances from the waste canisters. The three temperatures
(80, 120, and 180°C) reflect current targets for average formation tempera-
tures. Confining pressures of 9.7 and 19.7 MPa simulate burial at 1500 and
3000 ft respectively, and differential pore-water pressures of Q5 and 9.7 MPa
correspond to above- and below-water-table conditions.
Exposure times ranged from 2 to 6 months. A table of these variables,
along with the tests conducted and samples tested under each set of condi-
tions, is given in Appendix B. A schematic of the pressure and temperature
systems and a drawing of the pressure vessels are also in that appendix.
3

Temperatures and pressures were monitored continuously and recorded as
the quality assurance program. These data are available upon request.
IV. TEST PROCEDURES
part of
The characteristics studied were mineralogy, tensile strength, compres-
sive strength, density, porosity, permeability, thermal conductivity, and
thermal expansion. Table I lists the tests run and exposure conditions. Pro-
cedures for each test are given in Appendix C through F. The procedures for
tests on control samples were the same as those for exposed samples.
v* TEST RESULTS
Results of mechanical properties tests are listed in Table II (before
exposure) and Table III (after exposure). A key to the temperature, pressure,
and duration of the tests is given in Table I and key numbers appear in Table
III. For correlation of results, note that all samples of Calico Hills and
Topopah Springs tuffs come from drill hole #UE25a-1 and all samples of Bull-
frog and Tram tuffs come from drill hole #USW-Gl. Individual samples are
numbered by depth as indicated in column one of Tables II and III. Compari-
sons of data from Tables II and III and sumnary histograms given below can be
used to judge the effect of the exposure conditions on the ambient mechanical
properties of each rock. Before doing this in detail, however, sane general
comments about the significance of apparent changes are in order.
Because of the exploratory nature of these tests, the long duration of
each test, and the large number of permutations of rock type and test condi-
tions, extensive statistical testing was not possible. Therefore, there is a
question as to whether or not any apparent changes are statistically signifi-
cant or merely chance. To get some idea of the significance of the results, a
two-sided t test was performed on all the data for which it was applicable.
This tests the null hypothesis that the means of a property measurement before
and after exposure are equal. For instance, a probability of 0.1 (probabili-
ties are listed in Table 111) means that if the true difference in means were
zero, a deviation in either direction as large as that measured, or larger,
would occur by chance only about 10 times in 100. We judge that probabilities
of about O.1 or less indicate a significant difference.

MECHANICAL
Sample Typ$and Depth
(ft)
l/+t3Lk 11
PROPERTIES OF SAMPLES BEFORE TEMPERATURE AND PRESSURE EXPOSURE
Tenstle Strenqth~b Compressive Strength
(MPa) (MPa) #bGrain DensityPorosity
Bulk Density (%)
Topopah Springs680.0 - 680.5
681.1 - 681.6
696.7 - 697.0
708.2 - 708.9
730.3 - 730.9
1089.7 - 1090.3
1091.2 - 1091.6
1100.6 - 1101.6
1101.6 - 1102.1
1105.8 - 1106.8
1247.9 - 1248.1
1285.1 - 1268.0(Vitrophyre)
Calico Hills1394.6 - 1395.2
1423.4 - 1424.2
1446.0 - 1446.8
1460.8 - 1461.6
1478.1 - 1478.7
1513.3 - 1513.9
1566.2 - 1566.7
1611.7 - 1612.7
1640.9 - 1642.1
1657.9 - 1659.0
1667.3 - 1668.4
1680.1 - 1680.9
Bullfrog2380.6 - 2381.2
2387.7 - 2388.3
Tram2772.7 - 2773.3
2944.6 - 2945.0
2958.0 - 2958.4
19.1 f 5.5
18.8 * 3.0
20.5 t 3.7
25.9 t 2.4
17.7 * 5.2
7.6 * 0.1
23.7 i 3.3
11.4 ?. 2.8
8.6 i 1.8
5.3 * 0.8
5.9 *0.9
5.6 ~ l-o
5.8 t 0.8
6.2 f 1.1
5.4 i 0.4
5.1 t 1.0
2.2 t 0.2
2.4 f 0.2
3.7 i 0.4
12.2 * 3.0
9.5 i 1.2
5
5
5
5
5
3
3
4
4
5
5
5
5
5
5
5
10
5
5
4
5
152.2 t 37.8
194.4 ? 25.4
137.7 i 42.8
143.5 * 6.4
242.2 t 90.0
160.9 i48.1
180.3 t 28.6
52.4 * 2.2
91.2 t 3.8
57.8 t 5.6
50.5 ~ 10.6
34.3 + 20.6
123.6 * 53.2
52.0 f 0.4
52.2 f2.4
60.2 f 14.1
30.0 t 3.6
44.3 i 0.1
40.3 k 8.9
86.5 + 18.2
87.4 i 12.2
2
2
2
2
3
2
2
2
2
2
2
2
2
2
2
2
4
2
2
2
2
2.55
2.52
2.52
2.52
2.50
2.54
2.53
2.46
2.56
2.56
2.34
2.20
2.03
2.18
2.21
2.16
2.19
2.23
2.09
2.17
2.04
2.31
2.62
2.62
2.58
2.61
2.61
2.29
2.26
2.22
2.29
2.26
2.26
1.90
2.16
2.29
2.33
2.29
1.57
1.58
1.61
1.56
1.59
1.60
1.65
1.68
1.61
1.56
1.60
1.91
1.94
1.85
2.19
2.15
10.0
10.0
12.0
9.0
10.0
11.0
25.0
12.0
11.0
9.0
1.7
29.0
22.0
26.0
29.0
25.0
27.0
26.0
20.0
26.0
26.0
30.0
26.9
26.1
28.3
16.1
17.7
aKey to tuff units.1. Topopah Springs - Ue25a#l core. Oensely welded. no zeolitization.2. Calico Hills - Ue25a#l core. Unwelded .-highly zeolitized.3. Bullfrog - US14-GI core. Moderately welded, some zeolite.4. Tram - USWG1 core. Moderately welded, some Zeolite.
bNumber of measurements.
5
—

TABLE III
MECHANICAL PROPERTIES OF SAMPLES AFTER TEMPERATURE AND PRESSURE EXPOSURESample Type
and Depth(ft)
681.1 - 681.6
696.7 - 697.0
708.2 - 708.9
708.2 - 708.9
730.3 - 730.9
1089.7 - 1090.3
1089.7 - 1090.3
1091.2 - 1091.6
1100.6 - 1101.6
1100.6 - 1101.6
1101.6 - 1102.1
1105.8 - 1106.8
1247.9 - 1248.1
1285.1 - 1285.6(Vitrophyre)
1285.6 - 1286.0b(Vitmphyre)
Calico Hills1394.6 - 1395.2
1423.4 - 1424.2
1446.0 - 1446.8
1460.8 - 1461.6
1478.1 - 1478.7
1513.3 - 1513.9
1566.2 - 1566.7
1611.7 - 1612.7
1611.7 - 1612.7
1640.9 - 1642.1
1657.9 - 1659.0
1667.3 - 1668.4
1667.3 - 1668.4
1680.1 - 1680.9
8uI 1 frog2380.6 - 2381.2
2380.6 - 2381.2b
2387.7 - 2388.3
2387.7 - 2388.3
Test Tensile Strength Compressive StrengthNo. (MPa) #fPa (MPa) #/Pa
6
2
4
3
6
4
3
5
7
1
7
5
1
2
8
8
2
2
1
1
4
4
3
3
6
6
5
5
7
7
8
8
9
10
19.9 *3.8
19.1 t 4.7
13.5 i 1.4
21.9 t 4.1
13.1 * 2.6
12.9 * 0.4
15.6 * 2.9
6.6 t 0.9
Lost data
6.1 ~ 0.5
6.5 tO.1
5.5 t 1.2
6.1 f 1.4
6.6 t 0.6
5.9 i 1.3
2.4 ~ 0.2
2.5 * 0.1
2.3 * O.Z
2.2 i 0.2
5/0.8
3/0.8
5/0.005
5/0.08
5/0.12
3/0.005
4/0.09
5/0.06
5/0. 7
4/0.1
5/0.7
5/0.8
5/0.004
5/0.5
4/0.11
5/0.002
5/0.6
5/0.14
161.5 t 26.4
218.0
232.4 * 9.1
132.3
237.2 *46.1
138.2 t 48.3
135.9 i 6.6
54.9 * 9.3
Lost data
52.0
38.5 t 12.9
42.1
76.2
55.5 t 6.2
52.7
32.9 i 6.6
39.2 f 1.3
42.3 *0.9
36.8 f 1.5
2/0.8
1
2/0.1
1
2/0.7
2/0.3
2/0.18
2/0. 7
1
2/0.44
1
1
2/0.5
2/0.6
2/0.5
2/0.03
2/0.09
2/0.03
a# - number of measurements. P = probability from t test (see text).
J-13 well water was used in these tests. All other tests used distilled water.
Grain Oensity Bulk OensityPorosity
(%)
2.54
2.54
2.50
2.54
2.57
2.57
2.59
2.34
2.25
2.28
2.28
2.26
2.31
2.25
2.27
2.62
2.62
2.62
2.62
2.29
2.22
2.30
2.31
2.27
2.38
2.32
2.31
1.55
1.66
.
1.68
-
1.73
1.60
1.62
1.62
-
1.93
1.93
1.93
1.92
9.8
12.6
7.9
.
9.2
.
11.9
-
.
7.5
.
10.2
1.4
31.0
27.2
26.5
-
23.5
31.0
27.9
28.6
26.4
26.4
26.3
26.8
6

Sample Typeand Depth
(ft)
Tram2772.7 - 2773.3
2772.7 - 2773.3
2944.6 - 2945.0b
2958.0 - 2958.4
TABLE III (cent)
Test Tensile Strength Compressive StrenqthNo. (MPa) #lPa
Porosity(MPa) #lPa Grain Density Bulk Density (%)
9 3.9 * 0.9 5/0.7 36.8 * 2.4 2/0.7 2.58 1.92 25.9
10 2.6 I 0.7 4/0.03 30.3 * 4.1 2/0.33 2.59 1.90 26.7
8 12.0 * 2.3 5/0.8 90.3 * 8.4 2/0.8 2.61 2.22 14.8
8 12.9 t 2.4 5/0.03 87.6 i 4.7 2/0.8 2.61 2.18 16.6
ab# = number of measurements. P = probability from t test (see text).
J-13 well water was used in these tests. All other tests used distilled water
One of the assumptions of the t test is that the measurements are nor-
mally distributed about the means. The validity of this assumption can be
judged from examples shown in Figs. 1 and 2 for tensile strength. Note that
although the distributions are approximately normal, some skewness is
apparent. The bimodal distribution in Fig. 2 reflects an apparently true
difference in tensile strength of Topopah Springs tuffs at depths @700 ft and
01100 fto The tuffs at these depths are known to be mineralogically and struc-
turally different so a reflection of this in tensile strength (and probably
other physical properties) is not surprising.
A. Results at 80”C
Tensile strength, compressive strength, porosity, and grain density for
exposures of 80”C are summarized in Figs. 3 to 5.
1. Topopah Springs. There is an insignificant change in tensile
strength at 9.7 MPa confining pressure after 6-months’ exposure for the rock
from 681-ft depth. However, for rock from 1106-ft depth exposed at 19.7 MPa
confining pressure, there is a significant increase of 37% in tensile strength.
A decrease in compressive strength of 25% at 9.7 MPa confining pressure
for rock from the 1248-ft depth is marginally significant. The apparent
decrease at 19.7-MPa confining pressure for rock from the 1100-ft depth is
statistically insignificant.
There is little or no change in grain density but a consistent increase
in porosity.
2. Calico Hills. There are essentially no changes in tensile or com-
pressive strength of Calico Hills tuffs at
POrOSity and grain density appear to increase
these exposure
slightly.
conditions. Both
7

3.&4.4 4.4-5.0 6.o-&6 &&6.2 6.2-6.8 6.6-7.4 7.4-S.6 8.0-8.6
TENSILE STRENGTH (MPa)
Fig. 1.Histogram of tensile strengths of Calico Hills tuffs before and after extendedexposure to 120”C0
BEFORE
r JAITER120 c
TOPOPAH SPRINGSTENSILE STRENGTH
6 NIJMBER OFTESTS
6
4
I3
2
1
0 IliLW1l.n 11
k19MI*
TENSiLE STRENGTH (MPa)
Fia. 2.Histogram of tensile strengths of T_6popah Springs tuffs before and afterexten&d exposure to 120°C.
8

BEFORE
TENSILE STRENGTHMPa WC
m ~il-i,l IL .-. .-,
18.
16 iAl
74
12
81 F=
8
4
2
0TOPOPAH SPRINGS TOP13PAHSPRINGS
(cl ID]
1s0 DAYS
Fig. 3.Tensile strengths of Calico Hills and Topopah Springs tuffs before and after180-day exposure to 80”C and confining pressures of approximately 10 and 20MPa. Numbers in parentheses refer to the number of tests at each condition -(C) refers to a depth of @681 ft and (D) to a depth of @l106 ft in dril1 holeUE25a-1.
BEFORE
AFTER
20 MPm
ma
Compressive STRENGTH~ MP8 8(PC
2s0
22s . .-:..
m;.
176~... la.:.
1s0 .;.1. 72)
12s ●’.:.. .. . .
100 :..
B,:..
r . . IL-1=s
so
z
oCAUCOHILIS TOPOPAq:)PRINGS TOPOP~:, SPRINGS
1S0 DAYS
Fig. 4.Compressive strengths of Calico Hills and Topopah Springs tuffs before andafter 180=day exposure to 80”C and confining pressures of approximately 10 and20 MPa. (A) refers to a depth of o11OO ft and (B) to a depth of ~1248 ft indrill hole UE25a-1. Other notations are the same as in Fig. 3.
9

DENSITY AND POROSITY STUDIES
DE XPOSURE AT SO DEGREE CELSIUS
10-20 PP
6-1o DP I I1-6 PD D
1--1 ---- ---—. —- —--— ——-— e —-—-—--—-” ‘CtAONGE
-1-6 I I-6-10I I I
-10-20
CAUCO HILLS1S0 DAYS
TOPOPAH SPRINGS
P/D - POROSllV/DENSITY CHANGE AITER 10 MPa EXPOSUREP/D - POROSllY/DENS~ CHANGE AFTER 20 MPs EXPOSURE
Fiq. 5.Grain density changes (D) and porosity””changes (P) of Calico Hills and TopopahSprings tuffs after 180-day exposure to 80°C and confining pressures ofapproximately 10 and 20 MPa.
ty
B. Results at 120°C
Tensile strength, compressive strength, porosity, and grain dens
changes for exposures at 120°C are summarized in Figs. 6 to 8.
1. Topopah Springs. There is a significant decrease of 15% in tensile
strength for rock from 730-ft depth at 9.7-MPa confining pressure. An ap-
parent increase at these conditions for rock at 680-ft depth is not signifi-
cant. At 19.7-MPa confining pressure, rock from 708-ft depth shows a signifi-
cant decrease of 34% and there is a marginally significant decrease of 26% for
rock from the 1090-ft depth.
None of the slight changes in compressive strength at 9.7-MPa confining
pressure are considered significant. At 19.7-MPa confining pressure there is
an apparently significant increase in compressive strength of 69% for rock
from the 1090-ft depth. This is contradicted by a marginally significant
decrease of 14% for rock from the 1101-ft depth. Inconsistencies such as this
are to be expected for a small number of tests in a rock that is highly
inhomogeneous.
This inconsistency is even more apparent in porosity measurements, espec-
ially at 19.7 MPa. For the rock from 708-ft depth, porosity decreases 12%
10

TENSILE WJR$NGTH
~ MPm
20
18
10
M
12
10
s
a
4
z
o
0EW8E
AFrEn10MP.
i%
COMPRESSIVE STRENGTHlzrc
1==--F1121.-, 1~1
lm In i
lW
la[
z=!”
iS-lSS DAYS 00 DAYSICI
X166 DAYS W DAYS
Fig. 6. Fig. 7.Tensile strengths of Calico Hills, Compressive strengths of CalicoTopopah Springs, Bullfrog, and Tram Hills, Topopah Springs, Bullfrog, andtuffs before and after exposure to Tram tuffs before and after exposure120°c. Other notations are the same to 120°c. Other notations are the
—Fig. 3. same as in Fig. 4.
DENSITY AND POROSITY STUDIESEXTENDED EXPOSURE AT120DEGREES CELSIUS
10-20PP
5-1o DDf)opp P
1-5 DD P
-1-.1 -------- --BDP--- .–9 Dp––- -–~D–-–. ::ANGE
-1-5
-5-10 P pP
-10-20 P
CALICO HILL TOPOPAHSPRINGS BULLFROG TRAM
75-165 DAYs 60 DAYS
p/D-pOROstlY/DENsiwCHANGE AITERIOMPa EXPOSURE
P/D-POROSITY/DENSITY CHANGEA~ER 20 MPa EXPOSURE
Fig. 8.Grain density and porosity changes of Calico Hills, Topopah Springs, Bullfrog,and Tram tuffs before and after exposure to 1.200c0 Notations are the same asin Fig. 5
11

whereas for rock from 1090 ft it increases 8%. Grain densities either remain
the same or increase slightly.
2. Calico Hills. There is a marginally significant increase of 16% in
tensile strength at 9.7-MPa confining pressure; changes at 19.7 MPa are insig-
nificant.
Compressive strength consistently decreases up to 25% at both 9.7- and
19.7-MPa confining pressure, but these changes are only marginally significant.
The most consistent changes occur in grain density and porosity, both of
which increase from 5 to 19% at both confining pressures.
3. Bullfrog. The Bullfrog tuffs exhibit the lowest tensile strengths
of all the units tested. There is a further marginally significant decrease
of 8% at 9.7-MPa confining pressure. A slight decrease at 19.7-MPa confining
pressure is statistically insignificant.
Compressive strength decreases 17% at 9.7-MPa confining pressure and 5%
at 19.7 MPa. Both changes are judged to be statistically significant.
Grain densities are unchanged. Porosities are unchanged or slightly in-
creased.
4. Tram. Results for Tram tuffs are almost identical to those of the
Bullfrog. Tensile strength decreases 30% at 9.7-MPa confining pressure. This
change is judged to be statistically significant. The slight change at
19.7-MPa confining pressure is insignificant.
Compressive strength decreases up to 25% in a manner similar to that for
Bullfrog tuffs; however, the tests cannot be judged to be statistically sig-
nificant in this case.
Grain densities remain unchanged. Porosities decrease up to 9% at both
9.7- and 19.7-MPa confining pressures.
c. Results at 180”C
Tensile strength, compressive strength, porosity, and grain density
changes for exposures at 180°C are summarized in Figs. 9 to 11.
1. Topopah Springs. Tensile strength is reduced 46% after ex~osure at
9.7-MPa confining pressure for 3-1/2 months. This reduction is judged to be
statistically significant.
Compressive strength is reduced 8% in a single test at 9.7-MPa confining
pressure.
Porosity decreased 38% and grain density increased slightly.
12

TENSILE STRENGTH180 DEGREES CELSIUSI 10 MPa
EIEFORE SOAK
m
AFIZR 00AK
~ MEAN STRENGTH lMPd,9,
10
6
0TOPOPAH TRAM TOPOPAH CALICO HILLS BULLFROGSPRINGS SPRING S
VITROPHVRE
TUFF TYPE
110 DAYS
FiQ. 9.Tensile strengths of Calico Hills, To~opah Springs, Bullfrog, and Tram tuffsbefore and after exposure to 180°C. Notations are the same as in Fig. 3.
COMPRESSIVE STRENGTH1S0 DEGREESCElJ51US/10MPa
MEAN STRENGTH (MPoI160, ,.., ,
BEFORE SOAK
m
A17ERSOAK
TUFF TYPE VlmOPHVRE
100 DAYS
Fig. 10.Compressive strengths of Calico Hills, Topopah Springs, Bullfrog, and Tramtuffs before and after exposure to 180”C. Notations are the same as in Fig. 4.

DENSITY AND PO ROSWYEXTENDED EXPOSURE AT 180 C-MPa.
10-20
Iwo
uc1
6-10
z~ 1-s D Do$No c~NGE --- p--- ------ -- D-- -DD--- –D--–-
8z -1-6Ill
P
a.
+10P?
-1o1o
lo-mP P
CAUCO HIUS ;;;3NPGA~H BULLFROG TRAM VITROPHYRE
D-OENSIl’V CHANGE [ TOPOPAH SPRINGS I
P- POROWY CHANGE 110 DAYS
Fig. 11.Grain density and porosity changes of Calico Hills, Topopah Springs, Bullfrog,and Tram tuffs before and after exposure to 180°C. Notations are the same asin Fig. 5.
2. Topopah Springs Vitrophyre. Tensile strength decreased 23% after
exposure of the glassy vitrophyre sample at 9.7-MPa confining pressure. The
change was judged to be statistically significant.
Compressive strength changed slightly with no statistical significance.
The small initial (crack?) porosity decreased 22% with no change in grain
density.
3. Calico Hills. Tensile strength apparently increased slightly, but
this was n~t statistically significant. Similarly, compressive strength
appeared to be reduced after exposure, but this change was also judged not to
be statistically significant.
Porosity was unchanged and grain density increased slightly.
4. Bullfrog. Tensile strength increased up to 14% after exposure at
9.7-MPa confining pressure. Although this increase is small, it was judqed to
be statistically significant.
Compressive strength apparently increased up to 31% after exposure at
9.7-MPa confining pressure. This change was judged to be statistically signifi-
cant.
Grain density remained unchanged but porosity decreased slightly.
14

5. Tram. Tensile strength increased up to 36% after exposure at
9.7-MPa confining pressure. This change was judged to be statistically signifi-
cant.
Compressive strength appeared to increase slightly; however, these
changes were not statistically significant.
Grain density remained unchanged, but porosity decreased up to 8% after
exposure.
VI.
pore
CONCLUSIONS
Exposure of NTS tuffs to temperatures, confining pressures, and water
pressures similar to those expected near a high-level nuclear waste
repository resulted in statistically
strength, compressive strength, grain
occurred over time periods of 2 to 6
consistent, reflecting the inherent
significant changes in ambient tensile
density, and porosity. These changes
months. The changes are not entirely
inhomogeneity of these complex rocks.
Causes of the changes are presently unknown. However, planned permeability
measurements and detailed mineralogic examination of test samples should
identify mechanisms of property change.
VII. OTHER MEASUREMENTS
Mineralogic examination of samples before and after exposure to test
ditions, permeability measurements, and thermal properties measurements
currently being performed. Results will be given in the final report.
REFERENCES
help
con-
are
1. P. 1. Carroll, F. A. Caporuscio, and D. L. Bish, “Further Description ofthe Petrology of the Topopah Spring Member of the Paintbrush Tuff inDrill Holes UE25A-1 and USW-G1, and of the Lithic-Rich Tuff in USW-G1,Yucca Mountain; Nevada,” Los Alamos National Laboratory report LA-9000-MS(November 1981).
2. D. L. Bish, F. A. Caporuscio, J. F. Copp, B. M. Crowe, J. D. Purson, J.R. Smyth, and R. G. Warren, “Preliminary Stratigraphic and PetrologicCharacterization of Core Samples from USW-G1, Yucca Mountain, Nevada,”Los Alamos National Laboratory report LA-8840-MS (November 1981).
75
APPENDIX A
HANDLING, STORAGE, AND SHIPPING PROCEDURE FOR THENEVADA NUCLEAR WASTE STORAGE INVESTIGATIONS PROJECT
1. PURPOSE
The purpose of this procedure is to provide measures for handling, stor-
age, and shipping of geologic materials used on the NNWSIProject.
II. SCOPE
This procedure applies to all geologic materials used on the NNWSI Pro-
ject and controls the material from the time of shipment to Los Alamos
National Laboratory, through the testing phase, and during storage.
III. GENERAL
Geologic materials including hydrologic samples will be identified,
handled, stored, and shipped according to this procedure.
IV. SELECTION AND IDENTIFICATION
Sample material shall be selected by designated qualified personnel.
Samples requiring special handling (for example, wax wrap or inert atmosphere
container) will
selected will be
tainer, and will
(1) Sample
be tagged and documented in field notebooks. Each sample
identified on tape, or a label applied to the sample or con-
bear the following information:
identification number,
(2) Location where taken (that is, drill hole) , ~
(3) Downhole arrow or orientation information where appropriate.
In addition, a log book entry will contain the following information:
(1) Sample identification number,
(2) Footage (from-to) if taken from a dril1 hole,
(3) Number of pieces,
(4) Any special sample characteristics.
Samples lacking any of the above identification requirements upon receipt
at Los Alamos National Laboratory will be segregated and not used in labora-
tory investigations until they can be positively identified.
The assigned identification number will be placed on the container of
each sample cut, ground, or otherwise taken from the parent sample to assure
16

traceability. The identification number will also follow any natural
ground-water samples separated or taken from the main lot. Documentation of
samples taken from a parent sample will be by logging in laboratory notebooks.
v. HANDLING
When handling geologic material samples, care will be taken to not dis-
rupt the continuity and structure of the sample except where investigations
require crushed or ground samples.
If the sample is contained in special atmospheric containers, the con-
tainer will be opened only under suitable atmospheric conditions as determined
by a qualified chemist or geologist. The core may be wrapped in aluminum foil
or other suitable material and dipped in liquified beeswax at the discretion
of the chemist or geologist.
If the sample core is broken to fit a shipping container, the end of
hammer breakage will be painted and will be documented in the field notebook.
If the sample is to be used in certain chemistry investigations where paint is
undesirable, another method of indicating the ends of hammer breakage may be
used. This method will be noted in the field notebook.
Upon receipt of the sample at Los Alamos, a qualified chemist or geolo-
gist will inspect and verify the condition of the sample. This verification
shall be documented in a log entry notebook.
In case of rupture of the container, the Los Alamos National Laboratory
will document in the entry log notebook the condition of the sample. The
sample will be held for disposition decision by the Technical Program Officer
(TPO) or his designate. A Nonconformance Report (NCR) will be initiated if
appropriate.
Accidental droppage of any sample core will be documented in the labora-
tory notebooks and held for disposition decision by the TPO or his designate.
An NCR will be initiated if appropriate.
VI. STORAGE
Upon receipt of a geologic material sample at Los Alamos National Labora-
tory, measures will be established and implemented to assure proper storage at
Los Alamos National Laboratory.
A sample entry log or laboratory notebook will be used to document in-
coming samples and will include as a minimum:
(1)
(2)
(3)
(4)
(5)
(6)
Sample identification number,
Drill hole or area location sample was taken,
Footage (from-to) if taken from a drill hole,
Number of core pieces,
If more than one piece, length of largest piece,
Storage location.
Samples will be protected during storage from
deterioration.
Thin-section slides will be stored in slide
shelf storage location to prevent damage to the s“
weather elements to prevent
containers in a designated
ides. A thin-section slide
log will be kept as a record of all slides examined.
Storage of samples during testing will remain consistent with atmospheric
requirements for that particular experiment.
Sample material used at the Laboratory will be held for disposition
decision by a qualified chemist or geologist upon completion of experiments or
tests. Disposition will be logged in the geologist’s notebook.
An archive sample of the parent material may be taken at the discretion
of the chemist or geologist before experiments or tests.
The identification requirements of Section IV of this procedure will be
applied to all archive samples.
The geologist performing the work will decide the size or amount of
sample to be taken for archive.
Record of archive sample storage location will be made in laboratory
notebooks. All archive samples will be kept together on a designated shelf
location.
VII. SHIPPING
Shipments from the NTS will be properly crated to assure minimal breakage
during transit. Sample cores being hand carried will be crated at the dis-
cretion of the chemist or geologist. In both cases, identification markings
as delineated in Sec. IV of this procedure will appear on all samples.
18

Shipments to and from the Los Alamos National Laboratory will be handled
in the same manner as shipments from the NTS. Samples not having identifica-
tion requirements as delineated in Sec. IV of this procedure will not be
accepted by the receiving group. Transfers of samples will be recorded in
laboratory notebooks.
APPENDIX B
SAMPLE PREPARATION
Samples were selected in pairs
other identification) and either “A”
appropriate soak conditions and then
were tested without soaking.
side by side; otherwise they
as possible. The assignments
in Table II.
Where
AND EXPOSURE CONDITIONS
and marked with core depth in feet (oror ll~all “A” samples were exposed to the
tested according to Table 1. “B” samples
possible, “A” and “B” samples were cut
were taken from the same core as close together
of specific samples to specific tests are shown
Samples were cut to 2.5 cm diam by 6.4 cm long (nominal) under deionized
water and stored in sealed containers with excess water until needed. Samples
to be soaked were placed in annealed copper jackets and sealed into externally
heated pressure vessels (see Fig. B-l), after
with a mechanical pump for 30 to 60 minutes
ducing deionized water.
The equipment used to supply the exposure
(1) Pressure vessels (Fig. B-l),
sealing the vessel by evacuating
at room temperature and intro-
conditions consists of:
(2) Ovens 1 through 4 corresponding to temperatures 1 through 4 (see
Tables I and B-I),
(3) Two confining pressure manifolds supplying nitrogen gas pressures,
(4) Two pore-pressure manifolds supplying water pressures, and
(5) Control/Data Acquisition system to perform continuous leak checks
and record temperature and pressure conditions. Temperatures were
measured by two thermocouples in each oven. Primary measurement of
pressures was
and secondary
test station.
by Heise gauges on each pressure manifold. Leak tests
pressure records are by electrical transducers on each
J9

A schematic diagram of the pressure manifold arrangement
B-2.
Pressurea P = 9.7 MPa P = 19.7 MPaPc = 0.5 MPa
‘(or = Pc)P=
‘(~rg~7P~~
Temperature —
is shown in Fig.
80”C * 10”C Basic parameters ~ Basic parametersthermal parameters
120”C * 10”C Basic parameters + Basic parameters +permeability thermal parameters
120”C * 10”C Basic parameters +(short durationd)
Eastc parameters +thermal parameters permeabl 1 ty
180”C * 10” Basic parameters
SAMPLE J!
SAMP1./
PRESSURE W{
aPc = con fininq pressure; Pp = pore pressure.
bBasic parameters to be measured on all specimens both before and after 6-monthsoak: tensile strength (Brazil), compressive strength, mineralogy/petrology,density, porosity.
cThermal parameters include thermal conductivity and thermal expansion.
‘These short exposures are currently planned for 1 to 2 months. Tests onadditional tuff units may be run sequentially.
\CONHNING PRESSURE PORT
T \
\
(’lEE-
\
>
\
D‘‘.......................................................................................................................................................................................................................................................................................................................................................................“.”.”- “.:.:+33X........... . . .. . .. ........................................................... THER MOCOUPLE WEU. . . . . . . . . . . . . .. . . . . . . . . . . . . . .....................................................................................................................
@
PORE P>ESSURE PORT
c
QA9
❑ Cciqo; Vblvc qfc&s PR,,slmr
8
W3tkAT0R0 WAICR/0A8 OPWSSURC lRJNWKCRSEPbRATCR
❑ PRESWRC VCSSCL v WATCR PRCSWIRCRCGULATO#
Fig. B-1. Fig. B-2.Schematic of individual pressure Plumbing diagram for confining andvessel for temperature and pressure pore-pressure system.exposure of tuff samples.
20

APPENDIX C
BRAZIL INDIRECT STRENGTH TESTS
These tests measure the tensile strength of samples by applying a compres-
sive diametral load to a disk-shaped sample. The procedure followed is that
described in Bieniawski and Hawkesl. Samples are 2.54 cm diam by 1.25 cm
thick prepared by slicing the cylindrical test specimens described above. An
Instron testing machine supplied the load required at a constant displacement
rate of 0.001 cm/s. The load cell was calibrated against dead weights.
Tensile strength was calculated from the equation
where P is the ultimate
is the sample thickness
T = 0.636 P/llt , (c-1)
load in Newtons, D is the sample diameter in mm, and t
in mm.
For each test cylinder (2.54 cm diam by 6.4 cm long) five Brazil test sam-
ples were prepared. The results reported are average values for these five
specimens.
REFERENCE
1. Z. T Bieniawski and I. Hawkes, Int. J. Rock Mech. and Mining Sci. 15,101-103 (1978).
—
APPENDIX D
COMPRESSIVE STRENGTH TESTS
These tests measure the uniaxial compressive strength of small cylindri-
cal samples. The procedure followed is that described in Bieniawski and
Bernealel. Test samples were recored from the original 2.54- by 6.4-cm
cylinders to smaller cyl”
from each original. The
+ 0.01 mm TIR. A servo
control applied load to
riders nominally 1.2 by 3.2 cm. Two samples were cut
ends were prepared by surface grinding to be parallel
controlled testing machine operating in displacement
the samples through a swivel platen. The latter was
built according to specifications in Bieniawski and Berneale. The ultimate
27

strength values reported are averages of the two samples from each original
unless otherwise stated.
REFERENCE
1. Z. T. Bieniawski and M. J. Berneale, Int. J. Rock Mech. and Mining Sci.16, 137 (1979).—
APPENDIX E
PROCEDURE FOR DENSITY AND POROSITY DETERMINATIONS
I. PURPOSE
The purpose of these tests is to measure the bulk density and connected
porosity of rock samples.
II. EQUIPMENT AND PROCEDURE
Equipment consists of an analytical ba”ante (Metier model H31AR). This
balance shall be calibrated in accordance with the requirements of QMI 9-1 of
the Quality Assurance Manual.
Porosity and bulk density measurements will be performed as follows:
Evacuate specimen under fore-pump vacuum for,at least 24 h.
Weigh in air (WDD).
Evaculate in bell jar fitted
Cover with deionized H20 and
Without removing sample from
with H20 access. Use fore-pump vacuum.
release to atmospheric pressure.
water, weigh submerged. Take tare and
III.
buoyance of any supports into account (WSS).
Measure temperature of water.
Remove sample from water and Igently blot the surface with paper
towel .
Weigh in air (WSD).
DATA ANALYSIS
Data will be analyzed as follows:
Calculate “grain density,”
‘w ‘DD‘9 = WDD- ws~ “
(E-1)
22
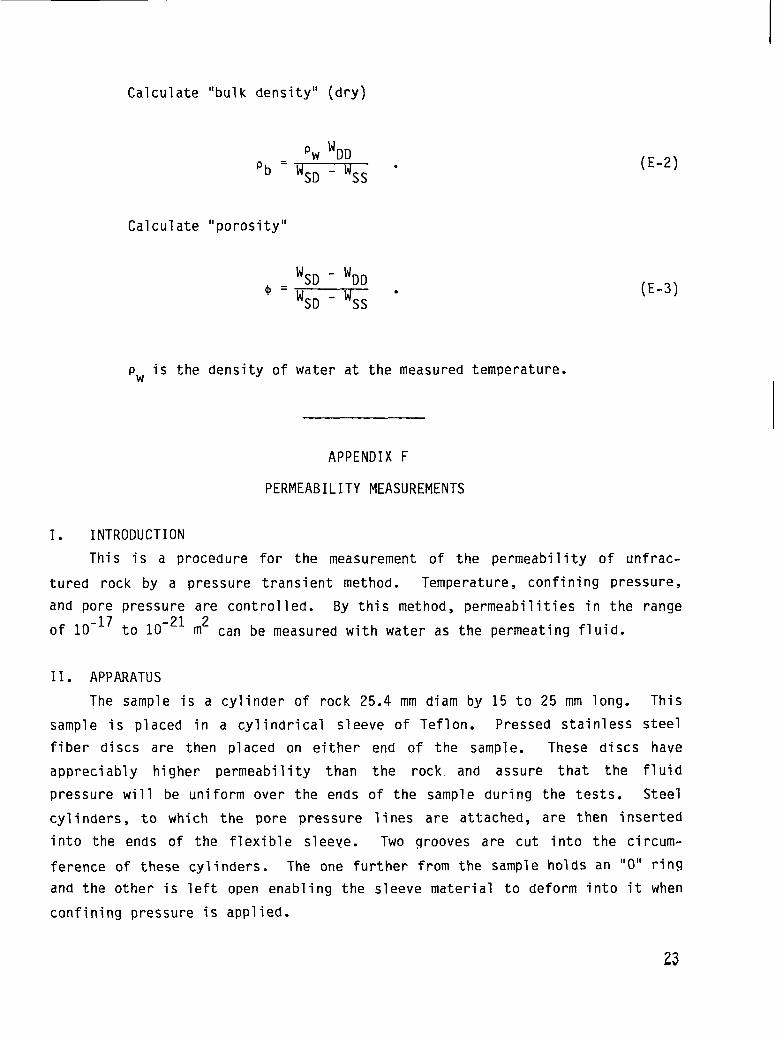
Calculate “bulk density” (dry)
~b =
Calculate “porosity”
$=
CIwis the density of
‘w ‘DD
‘SD - ‘SS “
‘SD - ‘DD
‘SD - ‘SS “
water at the measured temperature.
(E-2)
(E-3)
APPENDIX F
PERMEABILITY MEASUREMENTS
1. INTRODUCTION
This is a procedure for the measurement of the permeability of unfrac-
tured rock by a pressure transient method. Temperature, confining pressure,
and pore pressure are controlled. By this method, permeabilities in the range
of 10-17 to 10-21 2m can be measured with water as the permeating fluid.
110 APPARATUS
The sample is a cylinder of rock 25.4 mm diam by 15 to 25 mm long. This
sample is placed in a cylindrical sleeve of Teflon. Pressed stainless steel
fiber discs are then placed on either
appreciably higher permeability than
pressure will be uniform over the ends
cylinders, to which the pore pressure
into the ends of the flexible sleeve.
end of the sample. These discs have
the rock and assure that the fluid
of the sample during the tests. Steel
lines are attached, are then inserted
Two grooves are cut into the circum-
ference of these cylinders. The one further from the sample holds an “O” ring
and the other is left open enabling the sleeve material to deform into it when
confining pressure is applied.
23

This assembly is placed in a pressure vessel, which is then pressurized
with water. If the confining pressure (pressure in the large vessel) is
maintained above that of the pore pressure, the flexible sleeve forms an
effective seal against the stainless steel cylinders on either end of the
sample and there is no communication between the confining and pore-pressure
fluids.
III. PERMEABILITY MEASUREMENT
For water flowing in the positive x direction and following Dare.y’s law,
the pore pressure as a function of distance x and time t will follow the par-
tial differential equation
a2P/ax2 = [U(BP + e6w)/kl ap/at ,
with the boundary conditions
aP/ax = (pVlpw/Ak) aP/at
(F-1)
(F-2)
for t> Oandx=O, and
aP/ax = (uV28w/Ak) aP/at (F-3)
fort >Oandx=L. Where P is the core pressure, P is the viscosity of the
water, k is the permeability, 6P is the pore compressibility of the sample, e
is the porosity, SW is the compressibility of water, VI and V2 are the volumes
of the upper and lower pore-pressure lines respectively, A is the cross-
sectional area, and L is the length of the sample.
Unfortunately there is no known analytical solution for Eq. F-1. How-
ever, Brace et al.l have suggested that
-at‘1 - Pf = APo[V2/(Vl + V2)I e , (F-4)
where
a = (kA/uBwL)(l/Vl + l/V2) (F-5)
24

is an adequate approximation. Here PI is the pressure in the upper pore pres-
sure volume, Pf is the final pore pressure when the pressure step across the
sample has decayed to zero, and APO is the pressure difference across the sam-
ple at time zero.
From Eq. (F-4) it follows that
AP = APO e- at
9 (F-6)
where AP is the pressure difference across the sample at time t. To check
that Eqs. (F-5) and (F-6) are adequate, a numerical solution for Eqs. (F-1)
-(F-3) was calculated using a finite difference method. The permeability was
then calculated by applying Eqs. (F-5) and (F-6) to the numerically generated
data. For the experimental apparatus used in this study, Eqs. (F-5) and (F-6]
yield permeabilities in agreement with the numerical solution within 6%, pro-
vided at least 20% of the initial pressure step is allowed to decay away
before data gathering begins.
The permeability is therefore obtained by introducing a pressure step of
approximately 1 MPa across the sample and allowing the step in decay to about
0.6 MPa. Thirty pressure measurements are then made at regular time inter-
vals. A least squares fit to Eq. (F-6) is then made to determine a and Eq.
(F-5) is used to calculate k.
Iv. PRESSURE MEASUREMENT
Pressure measurements are made by means of pressure transducers. The
confining pressure is read by a Viatran model 214, the upper pore pressure by
a Precise Sensor model 70053-2, and the difference between the upper and lower
pore-pressure lines by a Viatran model 220-24 differential pressure transducer.
There are three tleise bourdon tube gauges in the system that measure the
confining pressure and upper and lower pore pressures. The transducers measur-
ing the confining pressure and upper pore pressure are restandardized against
these gauges whenever a discrepancy greater than 0.1 MPa exists. The differen-
tial transducer contains a shunt calibration circuit and it is calibrated
using this circuit just before each pressure step is imposed across the sample.
Once a month the Heise gauges and the calibration circuit of the differen-
tial transducer are checked using Heise gauge #72633 as a primary standard.
25

v. TEMPERATURE MEASUREMENT
The temperature is measured by means of a
chromelalumel thermocouple, which was calibrated aga”
ice and lead.
VI. PRESSURE LINE VOLUME DETERMINATION
stainless steel sheathed
nst the melting points of
The volumes the upper and lower pore-pressure lines must be known to cal-
culate permeabilities. Measurement of these volumes is accomplished by means
of a metering valve inserted into the pore-pressure line. By opening and
closing this valve, small well-known stem displacements and hence well-known
changes in volume of the pore-pressure line can be achieved. By changing the
pore-pressure volume in this way and observing the attending pressure change
in the line and knowing the compressibility (Bw) of the water, the volume of
the line can be calculated from the relation
v = Av/BwAp , (F-7)
where V is the volume of the line, AV is the change in the volume due to the
stem displacement of the metering valve, and AP is the corresponding change in
pressure. While making these measurements, the rock sample is replaced by an
impermeable stainless steel cylinder. This method has yielded volume measure-
ments with a precision of about 1%.
REFERENCE
1. W. F. Brace, J. B. Walsh, and W. T. Frangos, “Permeability of GraniteUnder High Pressure,” J. Geophys. Res. 73, 2225-2236 (1968)=—
26*wz.GovER.W-E3T ?RI.NTA-N&-fFFACg:.f s82-o-576-0201t 7

Domestic NTISPaKe Range Price Price Code
001-025 s 5.00 A02026-050 6.00 A03
051.07s 7.00 A04
076-100 8.00 AOS101-125 9.00 A06
126-150 10.00 A07
Printed in the United States of AmericaAvailable from
National Technical Informatbn SeticeUS Deptiment of Cc.mmerce
5285 Pori Royal RoadSprin&teld, VA 22161
Microfiche S3.S0 (AO1 )
Domestic N1-ls D.ameWic NTIS
Page Range Price Mice Code Page Range price Rice Code
151-175 SI1.oo A08 301-325 S17.00 A14
176-200 12.00 A09 326-350 1.s.00 A15
201-225 13.00 AlO 351-37s 19.00 A16
226-250 14.00 All 376400 20.00 A17
2S1-275 1s .00 A12 401425 21.00 A18
276-300 16.00 A13 4264S0 22.00 A19
Domestic NTISPage Ranse Rice Price Code
451475 S23.00 A20476-500 24.oo A21501-525 25.00 A22526-550 26.00 A23551-575 27.00 A24S76-600 28.00 A256014JP t A99
tAdd $1.00 for each additional 25-page increment or portion thereof from 601 pages up.

.— .—.—— .——.. --- ——— —...—..-. ..—.— —..—. .. . —.-—. ———...—
lLosAllallmos