progress report state: new hampshire grant: f-61-r-22
TRANSCRIPT

F-61-RIII-3_19_AR Page 110
PROGRESS REPORT
State: NEW HAMPSHIRE Grant: F-61-R-22/F19AF00061
Grant Title: NEW HAMPSHIRE’S MARINE FISHERIES INVESTIGATIONS
Project III: MULTI-SPECIES EVALUATION
Job 3: ESTUARINE SURVEY OF JUVENILE FINFISH
Objective: To monitor the relative abundance of juvenile finfish
utilizing New Hampshire estuaries for nursery habitat.
Period Covered: January 1, 2019 - December 31, 2019
ABSTRACT
The monitoring of finfish is necessary for the management of riverine,
estuarine, and marine environments. The objective of the beach seine survey,
as described in this report, is to monitor relative abundance of juvenile
finfish that use New Hampshire estuaries for nursery habitat.
A total of 23 finfish species were captured during the 2019 seine survey.
Atlantic Silverside Menidia menidia, Striped Killifish Fundulus majalis,
Rainbow Smelt Osmerus mordax, Atlantic Herring Clupea harengus, and Fourspine
Stickleback Apeltes quadracus accounted for 92.57% of the total catch. Since
the inception of the survey in 1997, Atlantic Silverside have remained the most
abundant finfish species captured. Overall relative abundance in 2019 was below
the 10-year geometric mean CPUE and four of the species of special interest
(Alewife Alosa pseudoharengus, Winter Flounder Pseudopleuronectes americanus,
Atlantic Silverside, and Rainbow Smelt) showed a declining trend. The other
two finfish species of special interest (Blueback Herring Alosa aestivalis and
American Shad Alosa sapidissima) were at or above the 10-year geometric mean
CPUE. Above average temperatures and salinity were recorded in 2019.
INTRODUCTION
Estuaries are highly productive ecosystems, known to provide diverse
habitat utilized as nurseries and forage grounds by an array of estuarine
species. Many of these estuarine species are commercially, recreationally,

F-61-RIII-3_19_AR Page 111
and culturally significant. Monitoring spawning success and recruitment of
finfish species is necessary for the effective management of riverine,
estuarine, and marine environments.
Beach seining is an established sampling method for estuarine-based
juvenile finfish surveys (NHFG 1981, 1982; Howell and Molnar 1993; MD DNR 1994;
Young et al. 1994; NAI 1995). Juvenile finfish captured by beach seine allows
for positive identification and the opportunity to collect important biological
information (e.g., length, weight, and sex). With appropriate sampling
procedures in place, an index of relative abundance can be calculated for each
species. Evaluation of each index can provide an indication of spawning success
and recruitment of important finfish species, such as Alewife Alosa
pseudoharengus, Atlantic Herring Clupea harengus, Bluefish Pomatomus saltatrix,
Striped Bass Morone saxatilis, and Winter Flounder Pseudopleuronectes
americanus, which utilize estuaries on the East Coast as nursery habitat (MD
DNR 1994; Young et al. 1994).
The estuarine survey of juvenile finfish was initiated in 1997. It was
designed as a fixed station survey, as opposed to a stratified random survey,
because strong tidal currents, rocky shorelines, and various anthropogenic
shoreline structures limit the amount of suitable seining areas, particularly
in the Great Bay Estuary. Many fixed sampling locations chosen for this survey
were sites used by beach seine surveys conducted in New Hampshire (NH) estuaries
in the past (NAI 1979; NHFG 1981, 1982; Grout and Heckman 1996). This provides
the opportunity to compare data from the current program with historical survey
data.
The primary objective of this beach seine survey is to monitor relative
abundance of juvenile finfish that utilize NH estuaries for nursery habitat
each year. As designed it is intended to be a general purpose survey, but six
finfish species of special interest are: Alewife, Blueback Herring Alosa
aestivalis, American Shad Alosa sapidissima, Rainbow Smelt Osmerus mordax,
Atlantic Silverside Menidia menidia, and Winter Flounder.
PROCEDURES
A bag seine 30.5 m long and 1.8 m high with 6.4 mm mesh is used to sample
for juvenile finfish in NH tidal waters. A single seine haul is performed each
month from June through November at 15 fixed stations: four in the
Hampton/Seabrook Estuary (HSE), three in Little Harbor (GBE1), three in the
Piscataqua River (GBE2), and five in Little Bay/Great Bay (GBE3) (Table 3.3-1
and Figures 3.3-1 through 3.3-3).

F-61-RIII-3_19_AR Page 112
Seine hauls are performed during daylight between 2 hours before and 2
hours after low tide. Seine hauls are set by boat 15–25 m from shoreline,
ideally in water depths less than 2 m in order to prevent the foot rope of the
seine from lifting off of the bottom.
All captured finfish are identified to the lowest possible taxon, measured
in total length to the nearest millimeter (with a maximum of 25 individual
lengths recorded per species per seine haul), and then enumerated. Water
surface temperature (oC), salinity (ppt), and substrate type are recorded at
each fixed station for each seine haul.
Catch distributions for many forage species or juveniles of some species
can be heavily skewed due to a few large catches as a result of schooling
behavior. In these instances, one or two large catches can often inflate the
value of an arithmetic mean by orders of magnitude resulting in a false
characterization of the true relative abundance of a species. To compensate
for this potential bias, a log transformation of the catch data was used to
produce a normal (as opposed to skewed) catch distribution and the resulting
mean of the log-transformed data can be transformed back to produce a geometric
mean (Sokal and Rohlf 1969). In recent years the geometric mean has often
replaced the arithmetic mean as a measure of relative abundance for juvenile
finfish because it is a more statistically robust value (Howell and Molnar 1993;
MD DNR 1994; Young et al. 1994; NAI 1995).
RESULTS
A total of 15 stations were surveyed once a month from June through
November, resulting in a total of 90 seine hauls. Substrate type is observed
and recorded each year during sampling to identify habitat type and possible
changes in substrate over time (Table 3.3-1). The majority of the stations had
substrate types consisting of “mud/sand”, followed by “sand”, “mud/shell” or
“mud”, and lastly “mud/gravel”.
A total of 23 finfish species were captured in 2019 (Table 3.3-2). The
five most encountered finfish in 2019 were Atlantic Silverside, Striped
Killifish Fundulus majalis, Rainbow Smelt, Atlantic Herring, and Fourspine
Stickleback Apeltes quadracus, accounting for 92.57% of the total finfish catch.
Table 3.3-3 shows the geometric mean of species caught three or more times
between 2009 and 2019; species caught less than 3 times were omitted from the
table, unless caught in the 2019 survey. Overall relative abundance in 2019
was below the 10-year mean CPUE. Two of the six species of special interest,
Blueback Herring and American Shad, exceeded their respective 10-year means,

F-61-RIII-3_19_AR Page 113
while the other four, Alewife, Winter Flounder, Atlantic Silverside, and Rainbow
Smelt, were below. American Shad remain a relatively rare encounter in this
survey with only one individual captured in 2019 (Table 3.3-2). Four of the
remaining 17 finfish species encountered in 2019 decreased, nine increased, and
four were equal in abundance relative to their 10-year geometric means.
Although White Perch Morone americana is not a species of interest in this
study, the geometric mean in 2019 is three times higher than the 10-year mean
(Table 3.3-3).
In comparison to all other stations, Station 33 (Figure 3.3-1) had the
lowest overall geometric mean CPUE and lowest species diversity with only one
species observed (Table 3.3-4). In contrast, Stations 54 and 35 had the highest
abundance levels (Figure 3.3-3). Stations 30, 39, and 147 had the greatest
species diversity, each with 16 different species captured. Atlantic Silverside
dominated the catch composition at most stations. Striped Bass, American shad,
Atlantic Moonfish Selene setapinnis, and Pollock Pollachius virens were each
found at only one station, and it was the first occurrence of Atlantic Moonfish
in the history of the survey (Table 3.3-4). October had the highest geometric
mean CPUE value for all species combined in 2019, while July had the lowest
(Table 3.3-5).
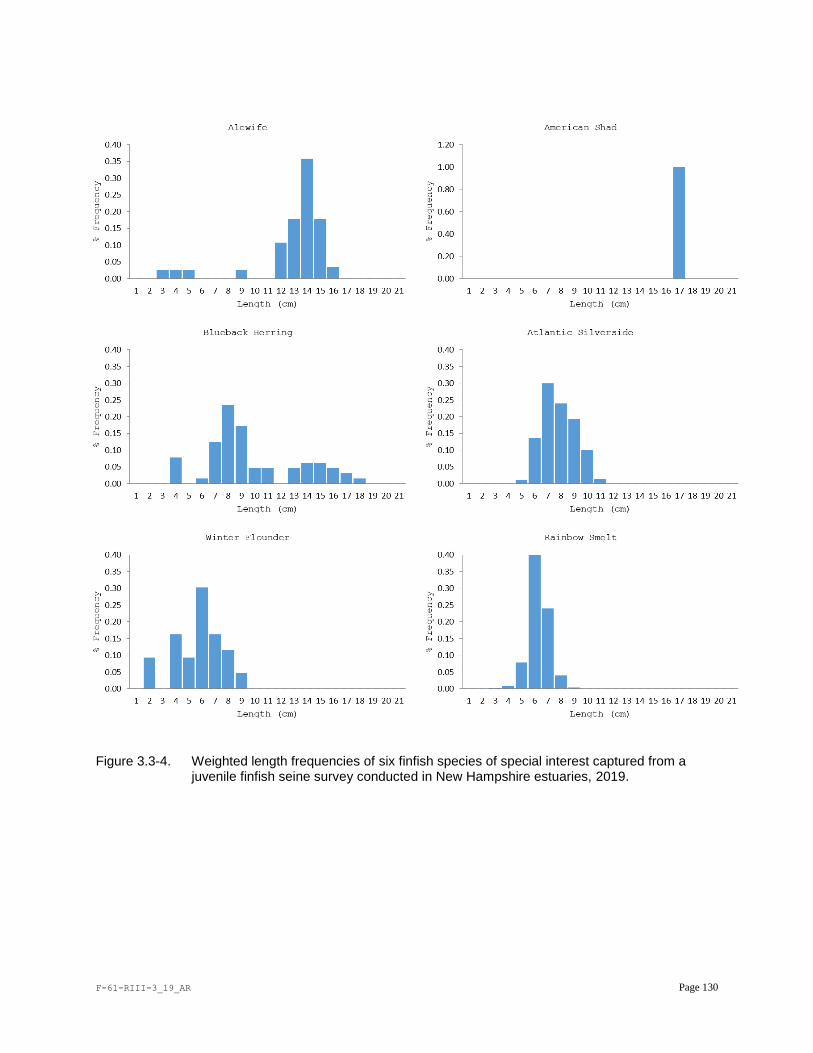
In 2019, 2,660 individual finfish were measured (Table 3.3-6). Length
frequencies were weighted by catch and plotted for the species of special
interest (Figure 3.3-4).
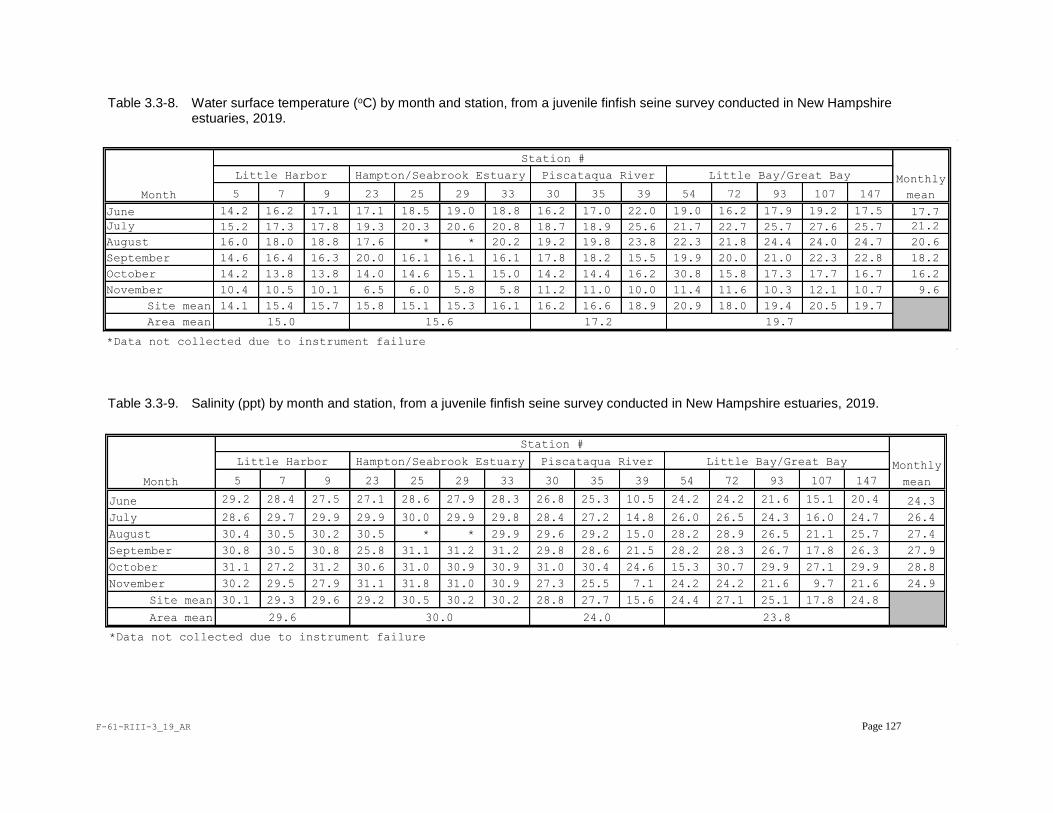
Mean surface water temperature was above average in 2019 with a mean of
17.2oC, a low of 5.8oC at Stations 29 and 33 in November, and a high of 30.8oC
at Station 54 in October (Tables 3.3-7 and 3.3-8). Instrument failure prevented
temperature readings in August at Stations 25 and 29. Little Harbor exhibited
the coldest annual mean surface temperatures of all the areas sampled, yielding
a mean temperature of 15.0oC, followed by the Hampton/Seabrook area with 15.6oC,
and the Piscataqua River with 17.2oC. The Little Bay/Great Bay area exhibited
the warmest annual mean surface temperatures, with a mean temperature of 19.7oC.
Historical annual mean salinity has ranged from 23.7 ppt in 2011 to 29.2
ppt in 2016. The value measured in 2019 (26.6 ppt) is near the mean for the
10-year time series (Table 3.3-7). Salinity in 2019 ranged from 7.1 ppt at
Station 39 to 31.8 ppt at Station 25, both in November (Table 3.3-9). The range
in recorded salinities was greatest at Station 107, ranging from 9.7 ppt to
27.1 ppt, in contrast to Station 5 which experienced a minor difference in
salinity. No salinity data were measured in August 2019 at Stations 25 and 29
due to equipment failure.
F-61-RIII-3_19_AR Page 114
DISCUSSION
The objective of this project is to annually monitor the relative
abundance of juvenile finfish utilizing NH’s estuaries for nursery habitat. As
has been the case since the inception of the survey in 1997, only a few species
account for the vast majority of those captured (Grout and Smith 1998). A total
of 23 finfish species were captured during the 2019 survey season. The diversity
in annual catch is reflective of the general purpose design of the survey, but
Alewife, Blueback Herring, Winter Flounder, Rainbow Smelt, American Shad, and
Atlantic Silverside are the primary species of interest. With the exception of
American Shad, all of these species of interest have been caught in each of the
last ten years of the survey (Table 3.3-3). American shad have been encountered
in three out of the last four years after a 13-year absence. Five finfish
species comprised 92.57% of the total finfish catch: Atlantic Silverside,
Striped Killifish, Rainbow Smelt, Atlantic Herring, and Fourspine Stickleback
(Table 3.3-2). Although inter-annual variation is inherent in natural systems
due to fluctuations in both biotic and abiotic factors, this survey’s ability
to monitor trends in relative abundance for species of interest over time is
informative.
Environmental conditions, both abiotic and biotic, can influence the
distribution of fish, especially in an estuary where these changes can be
abrupt. Overall relative abundance levels in 2019 decreased by 18.53% from
2018 (Table 3.3-3). The majority of species exhibited average or above average
abundance in 2019. The relative abundance compared to the 10-year time series
geometric mean was particularly high for Atlantic Herring and White Perch, which
were 2.1 and 3.0 times their means, respectively. Bluefish remain sparse,
having encountered none during the 2019 sampling season. It is important to
understand that inter-annual variation exists with time series data. Therefore,
while some species exhibit peaks one year and potential lows the next, general
trends over time are the important outcomes by design of this survey.
River herring (collectively Alewife and Blueback Herring) have been
declining since 2003 and are currently listed as a “Species of Concern” by the
National Oceanic and Atmospheric Administration’s Fisheries Service (NOAA
Fisheries) and the NH Fish and Game Department (NHFG). Relative abundance of
both Alewives and Blueback Herring decreased from 2018 by 70% and 50%,
respectively, and Alewives are currently below the 10-year geometric mean CPUE
(Table 3.3-3). Conversely, Blueback Herring were more abundant in 2019 than
the 10-year geometric mean, though their general abundance has decreased in the

F-61-RIII-3_19_AR Page 115
last few years. While no single factor has been determined for the cause of
the general decline, certain factors such as habitat loss and degradation,
impediments to spawning areas, fishing, and predation (e.g., Striped Bass) may
all play a role in the general decline of coast-wide river herring populations
(ASMFC 2012).
Rainbow Smelt is designated as a “Species of Concern” for NOAA Fisheries
and NHFG. Similar to river herring, Rainbow Smelt have been declining over at
least the last 15 years. Two other NHFG surveys that target Rainbow Smelt
illustrate a similar decline, though their spawning and migratory patterns are
poorly understood (See Project I-2 and II-1). It is believed that populations
of Rainbow Smelt throughout the northwest Atlantic have declined over the past
few decades due to overfishing, pollution, unfavorable changes in ocean
conditions (e.g., temperature), poor water quality, physical obstructions
(e.g., poorly designed culverts, dams), and degradation and loss of spawning
habitat (Enterline et al. 2012). In response to the observed decline in adult
Rainbow Smelt populations, the NHFG implemented a catch reduction for
recreational harvest from 10 liquid quarts to 4 liquid quarts in 2015 and are
currently attempting a stocking program to supplement the population. Although
the population remains at low levels compared to those seen prior to 2008,
Rainbow Smelt were one of the top five encountered species in 2019 and their
relative abundance increased from that of 2018 to a value near the 10-year
average, suggesting possible signs of recovery (Table 3.3-3).
Atlantic Silverside accounted for 75.18% of the total catch in 2019 (Table
3.3-2), and is persistently the most numerous species caught in the survey
(Table 3.3-3). Furthermore, it was the most spatially diverse fish species,
having been captured at all stations except one (Table 3.3-4), and was the most
abundant finfish species in most months (Table 3.3-5). Atlantic Silversides
are an important forage fish and documented food source for Bluefish and Striped
Bass (Collette and Klein-MacPhee 2002).
Winter Flounder abundance was higher in this survey prior to 2009 before
remaining fairly low through 2015, and has fluctuated in subsequent years, with
general abundance for 2019 well below the 10-year average (Table 3.3-3). Winter
Flounder were captured each month except June (Table 3.3-5) and encountered at
11 out of the 15 stations, suggesting the species occupies a widespread area of
NH’s estuaries (Tables 3.3-4 and 3.3-5). While a large portion of Winter
Flounder populations are harvested in federal waters, the majority of the stock
is composed of smaller localized populations that return inshore each year to
spawn (ASMFC 2007). The decline in the spawning success and recruitment to the
F-61-RIII-3_19_AR Page 116
localized populations in NH is likely the result of overfishing, pollution,
habitat loss and degradation, and power plant entrainment and impingement (ASMFC
2012).
Water temperature is thought to play an important role in species
abundance and movement (Roessig et al. 2004). Within NH estuaries, finfish
species abundance tended to be greater in the late summer and early fall months.
Geometric mean catch peaked in October, after which water temperatures decreased
notably at all 15 stations (Tables 3.3-5 and 3.3-8). However, it should be
noted that the two species with the highest geometric mean CPUE, Atlantic
Silverside and Striped Killifish, are primarily driving this abundance level in
October. In 2019, annual mean salinity was 26.6 ppt and annual mean temperature
was 17.2oC. The 2019 average temperature was above the 10-year mean while the
salinity was consistent with the time series mean (Table 3.3-7).
In summary, of the 23 finfish captured in the 2019 seine survey, the five
most abundant species were Atlantic Silverside, Striped Killifish, Rainbow
Smelt, Atlantic Herring, and Fourspine Stickleback, representing 92.57% of the
total finfish catch. Overall, relative species abundance was below the 10-year
mean and Atlantic Silverside continues to represent the highest relative
abundance numbers annually. Two of the six species of interest exceeded average
relative abundance while the other four have declined. American Shad was
captured in three out of the last four years after a 13-year absence. Mean
water surface temperature was above average and mean salinity was relatively
consistent with the time-series mean.

F-61-RIII-3_19_AR Page 117
REFERENCES
Atlantic States Marine Fisheries Commission (ASMFC). 2007. Review of the
Atlantic States Marine Fisheries Commission’s Interstate Fishery
Management Plan for Winter Flounder Pseudopleuronectes americanus.
19pp.
Atlantic States Marine Fisheries Commission (ASMFC). 2012. Atlantic States
Marine Fisheries Commission Stock Status Overview. 27pp.
Collette, B. B., and G. Klein–MacPhee. 2002. Bigelow and Schroeder’s Fishes
of the Gulf of Maine. Smithsonian Institution Press, Washington, D.C.
Enterline, Claire L., Bradford C. Chase, Jessica M. Carloni and Katherine E.
Mills. 2012. A Regional Conservation Plan for Anadromous Rainbow
Smelt in the U.S. Gulf of Maine. Maine Department of Marine Resources.
100pp.
Grout, D. and B. W. Smith. 1998. Programs Improving Management of ASMFC
Managed Species in New Hampshire. 1997 Final Report. NMFS Federal Aid
Project NA-335. NH Fish & Game Dept. 44pp.
Grout, D. E. and K. A. Heckman. 1996. Programs Improving Management of
ASMFC Managed Species in New Hampshire. 1995 Final Report. NMFS
Federal Aid Project 3-ACA-006. NH Fish & Game Dept. 34pp.
Howell, P. T. and D. R. Molnar. 1993. A Study of Marine Recreational
Fisheries in Connecticut: Inshore Survey of Juvenile Winter Flounder.
USFWS Federal Aid Project F54R. CT DEP Fisheries Division. 23pp.
Maryland Department of Natural Resources (MD DNR). 1994. Investigations of
Striped Bass in Chesapeake Bay. USFWS Federal Aid Performance Report.
Project No. F-42-R-7. Maryland Department of Natural Resources,
Tidewater Administration, Fisheries Division. 158pp.
New Hampshire Fish and Game Department (NHFG). 1981. Inventory of the
Natural Resources of Great Bay Estuarine System. Volume 1. NH Fish &
Game Dept., Concord. 254pp.
New Hampshire Fish and Game Department (NHFG). 1982. Great Bay Estuary
Monitoring Survey, 1981-1982. NH Fish & Game Dept., Concord. 199pp.
Normandeau Associates, Inc. (NAI). 1979. Piscataqua River Ecological
Studies, 1978 Monitoring Studies, Report No. 9 for Public Service
Company of New Hampshire. Volume I Physical/Chemical Studies and
Biological Studies. Normandeau Assoc., Inc., Bedford, NH.
Normandeau Associates, Inc. (NAI). 1995. Seabrook Environmental Studies,
1994. A Characterization of Environmental Conditions in the Hampton-
Seabrook Area During the Operation of Seabrook Station. Normandeau
Assoc., Inc., Bedford, NH. 346pp.

F-61-RIII-3_19_AR Page 118
Roessig J.M., Woodley C.M., Cech J.J. Jr., and Hansen L.J. 2004. Effects of
Global Climate Change on Marine and Estuarine Fishes and Fisheries.
Reviews in Fish Biology and Fisheries. 14: 251–275.
Sokal, R.R. and Rohlf, F.J. 1969. Biometry. W.H. Freeman and Company, San
Francisco. 776pp.
Young, B.H., K.A. McKnown, and P. Savona. 1994. A Study of the Striped Bass
in the Marine District of New York VII. Annual Report for P.L. 89-304,
Project AFC-18. 133pp.
F-61-RIII-3_19_AR Page 119
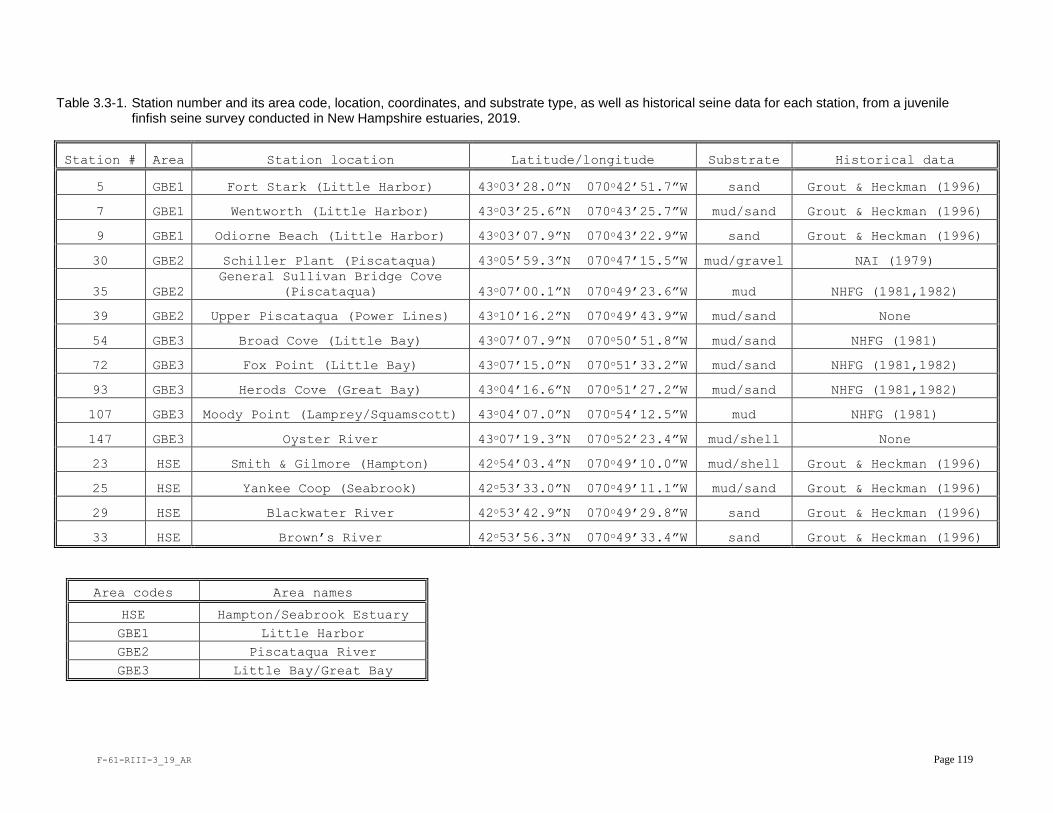
Table 3.3-1. Station number and its area code, location, coordinates, and substrate type, as well as historical seine data for each station, from a juvenile finfish seine survey conducted in New Hampshire estuaries, 2019.
Station # Area Station location Latitude/longitude Substrate Historical data
5 GBE1 Fort Stark (Little Harbor) 43o03’28.0”N 070o42’51.7”W sand Grout & Heckman (1996)
7 GBE1 Wentworth (Little Harbor) 43o03’25.6”N 070o43’25.7”W mud/sand Grout & Heckman (1996)
9 GBE1 Odiorne Beach (Little Harbor) 43o03’07.9”N 070o43’22.9”W sand Grout & Heckman (1996)
30 GBE2 Schiller Plant (Piscataqua) 43o05’59.3”N 070o47’15.5”W mud/gravel NAI (1979)
35 GBE2
General Sullivan Bridge Cove
(Piscataqua) 43o07’00.1”N 070o49’23.6”W mud NHFG (1981,1982)
39 GBE2 Upper Piscataqua (Power Lines) 43o10’16.2”N 070o49’43.9”W mud/sand None
54 GBE3 Broad Cove (Little Bay) 43o07’07.9”N 070o50’51.8”W mud/sand NHFG (1981)
72 GBE3 Fox Point (Little Bay) 43o07’15.0”N 070o51’33.2”W mud/sand NHFG (1981,1982)
93 GBE3 Herods Cove (Great Bay) 43o04’16.6”N 070o51’27.2”W mud/sand NHFG (1981,1982)
107 GBE3 Moody Point (Lamprey/Squamscott) 43o04’07.0”N 070o54’12.5”W mud NHFG (1981)
147 GBE3 Oyster River 43o07’19.3”N 070o52’23.4”W mud/shell None
23 HSE Smith & Gilmore (Hampton) 42o54’03.4”N 070o49’10.0”W mud/shell Grout & Heckman (1996)
25 HSE Yankee Coop (Seabrook) 42o53’33.0”N 070o49’11.1”W mud/sand Grout & Heckman (1996)
29 HSE Blackwater River 42o53’42.9”N 070o49’29.8”W sand Grout & Heckman (1996)
33 HSE Brown’s River 42o53’56.3”N 070o49’33.4”W sand Grout & Heckman (1996)
Area codes Area names
HSE Hampton/Seabrook Estuary
GBE1 Little Harbor
GBE2 Piscataqua River
GBE3 Little Bay/Great Bay

F-61-RIII-3_19_AR Page 120
Table 3.3-2. Geometric mean catch per seine haul, and standard deviation values for all species captured, from a juvenile finfish seine survey
conducted in New Hampshire estuaries, 2019.
Mean SD
Alewife Alosa pseudoharengus 0.07 0.49 38 0.23
Bass, Striped Morone saxatilis 0.01 0.08 1 0.01
Crab, Green Carcinus maenas 1.49 2.07 503 3.09
Crab, Horseshoe Limulus polyphemus 0.04 0.17 5 0.03
Cunner Tautogolabrus adspersus 0.02 0.13 3 0.02
Flounder, Smooth Pleuronectes putnami 0.36 1.04 96 0.59
Flounder, Winter Pseudopleuronectes americanus 0.27 0.61 43 0.26
Grubby Myoxocephalus aenaeus 0.20 0.51 31 0.19
Hake, Red Urophycis chuss 0.10 0.29 13 0.08
Herring, Atlantic Clupea harengus 0.39 1.88 467 2.87
Herring, Blueback Alosa aestivalis 0.17 0.78 64 0.39
Killifish, Striped Fundulus majalis 2.09 3.90 1,408 8.65
Lance, American Sand Ammodytes americanus 0.05 0.29 10 0.06
Menhaden, Atlantic Brevoortia tyrannus 0.09 0.37 17 0.10
Moonfish, Atlantic Selene setapinnis 0.01 0.08 1 0.01
Mummichog Fundulus heteroclitus 0.73 1.29 155 0.95
Perch, White Morone americana 0.24 1.10 120 0.74
Pipefish, Northern Sygnathus fuscus 0.09 0.33 14 0.09
Pollock Pollachius virens 0.02 0.18 4 0.02
Shad, American Alosa sapidissima 0.01 0.08 1 0.01
Silverside, Atlantic Menidia menidia 12.94 11.64 12,233 75.18
Smelt, Rainbow Osmerus mordax 0.29 1.26 744 4.57
Stickleback, Fourspine Apeltes quadracus 0.53 1.44 212 1.30
Stickleback, Ninespine Pungitius pungitius 0.11 0.36 17 0.10
Tomcod, Atlantic Microgadus tomcod 0.23 0.82 72 0.44
All species 42.26 6.73 16,272 100.00
Percentage
of total
catchSpecies Scientific name
Geometric
Total
catch
(N)

F-61-RIII-3_19_AR Page 121
Table 3.3-3. Geometric mean (standard deviation) catch per seine haul for all species caught in juvenile finfish seine survey conducted in New
Hampshire estuaries, 2009–2019.
Species 2009 2010 2011 2012 2013 2014 2015 2016 2017 2018 2019
Mean
(2009-2018)
0.00(0.00) 0.00(0.00) 0.01(0.10) 0.08(0.44)
0.36(1.69) 0.33(1.70) 0.05(0.33) 0.01(0.12) 0.16(0.95) 0.17(0.68) 0.15(0.82) 0.04(0.26) 0.38(1.87) 0.36(2.54) 0.39(1.88) 0.19(1.13)
0.00(0.00) 0.00(0.00) 0.01(0.08) 0.00(0.00) 0.01(0.08) 0.02(0.11) 0.03(0.19) 0.08(0.31)
0.01(0.12) 0.02(0.11) 0.00(0.00) 0.00(0.06)
0.11(0.43) 0.02(0.11) 0.02(0.13) 0.03(0.19) 0.00(0.00) 0.04(0.31) 0.14(0.48) 0.04(0.21) 0.02(0.13) 0.04(0.20) 0.10(0.29) 0.05(0.24)
0.00(0.00) 0.00(0.00) 0.00(0.00) 0.00(0.00) 0.00(0.00) 0.00(0.00) 0.00(0.00) 0.01(0.12)
0.90(1.40) 0.36(0.73) 0.27(0.61) 0.50(0.87)
0.10(0.36) 0.04(0.22) 0.31(0.72) 0.33(0.79) 0.09(0.37) 0.19(0.48) 0.39(0.76) 0.20(0.61) 0.21(0.49) 0.18(0.45) 0.20(0.51) 0.20(0.53)
0.35(0.63) 0.17(0.53) 0.20(0.44) 0.57(0.86) 0.38(0.79) 0.32(0.66) 0.64(0.93) 1.48(1.71)
0.11(0.39) 0.36(1.00) 0.36(1.04) 0.36(0.94)
0.01(0.12) 0.01(0.08) 0.00(0.00) 0.02(0.15) 0.00(0.00) 0.00(0.00) 0.00(0.00) 0.02(0.11) 0.00(0.00) 0.00(0.00) 0.00(0.00) 0.01(0.07)
0.59(1.44) 0.27(0.74) 0.87(1.63) 0.33(0.79) 0.08(0.31) 0.58(1.28) 0.38(1.15) 0.21(0.68)
0.02(0.11) 0.02(0.13) 0.02(0.13) 0.02(0.14)
0.01(0.08) 0.01(0.08) 0.00(0.00) 0.01(0.12) 0.00(0.00) 0.01(0.08) 0.02(0.11) 0.02(0.15) 0.01(0.08) 0.00(0.00) 0.00(0.00) 0.01(0.08)
0.00(0.00) 0.00(0.00) 0.02(0.11) 0.09(0.36) 0.03(0.17) 0.02(0.11) 0.00(0.00) 0.01(0.08)
0.00(0.00) 0.00(0.00) 0.00(0.00) 0.01(0.08)
0.01(0.08) 0.01(0.08) 0.06(0.31) 0.00(0.00) 0.04(0.29) 0.01(0.08) 0.00(0.00) 0.03(0.20) 0.02(0.13) 0.05(0.25) 0.00(0.00) 0.02(0.17)
0.02(0.11) 0.01(0.08) 0.01(0.12) 0.00(0.00) 0.02(0.11) 0.01(0.08) 0.01(0.12) 0.00(0.00)
3.30(2.24) 1.61(1.71) 1.49(2.07) 2.39(2.15)
0.04(0.21) 0.03(0.15) 0.05(0.22) 0.02(0.11) 0.02(0.15) 0.00(0.00) 0.02(0.13) 0.05(0.22) 0.04(0.28) 0.04(0.21) 0.04(0.17) 0.03(0.18)
1.79(1.80) 1.83(2.06) 1.69(1.58) 3.28(2.39) 3.59(2.97) 2.35(2.57) 1.71(1.77) 3.79(2.45)
0.00(0.00) 0.00(0.00) 0.01(0.10)0.00(0.00) 0.03(0.34) 0.01(0.08) 0.00(0.00) 0.01(0.08)0.01(0.08) 0.00(0.00) 0.00(0.00) 0.00(0.00)
0.23(0.88) 0.07(0.49) 0.14(0.74)
0.01(0.08) 0.02(0.18) 0.00(0.00) 0.00(0.00) 0.03(0.15) 0.00(0.00) 0.00(0.00) 0.03(0.20) 0.00(0.00) 0.00(0.00) 0.00(0.00) 0.01(0.10)
0.22(1.49) 0.05(0.25) 0.31(1.09) 0.15(0.96) 0.21(0.93)0.10(0.53) 0.08(0.34) 0.08(0.44) 0.02(0.23)
Grubby
Gunnel, Rock
Hake, Red
Hake, White
Herring, Atlantic
Cunner
Eel, American
Flounder, Smooth
Flounder,
Windowpane
Flounder, Winter
Butterflyfish,
Spotfin
Crab, Green
Crab, Horseshoe
Crab, Jonah
Crab, Rock
Alewife
Anchovy, Bay
Bass, Largemouth
Bass, Striped
Bluefish
0.02(0.13) 0.01(0.08) 0.01(0.08) 0.01(0.07)
0.32(1.08) 0.10(0.48) 0.08(0.37) 0.35(1.14) 0.41(1.22) 0.05(0.33) 0.00(0.00) 0.02(0.13) 0.02(0.15) 0.25(1.09) 0.00(0.00) 0.15(0.65)
0.01(0.12) 0.00(0.00) 0.00(0.00) 0.00(0.00) 0.01(0.08) 0.00(0.00) 0.01(0.08) 0.01(0.08)
0.00(0.00) 0.00(0.00) 0.00(0.00) 0.00(0.02)0.00(0.00) 0.00(0.00) 0.00(0.00) 0.00(0.00) 0.00(0.00) 0.01(0.08) 0.00(0.00) 0.00(0.00)
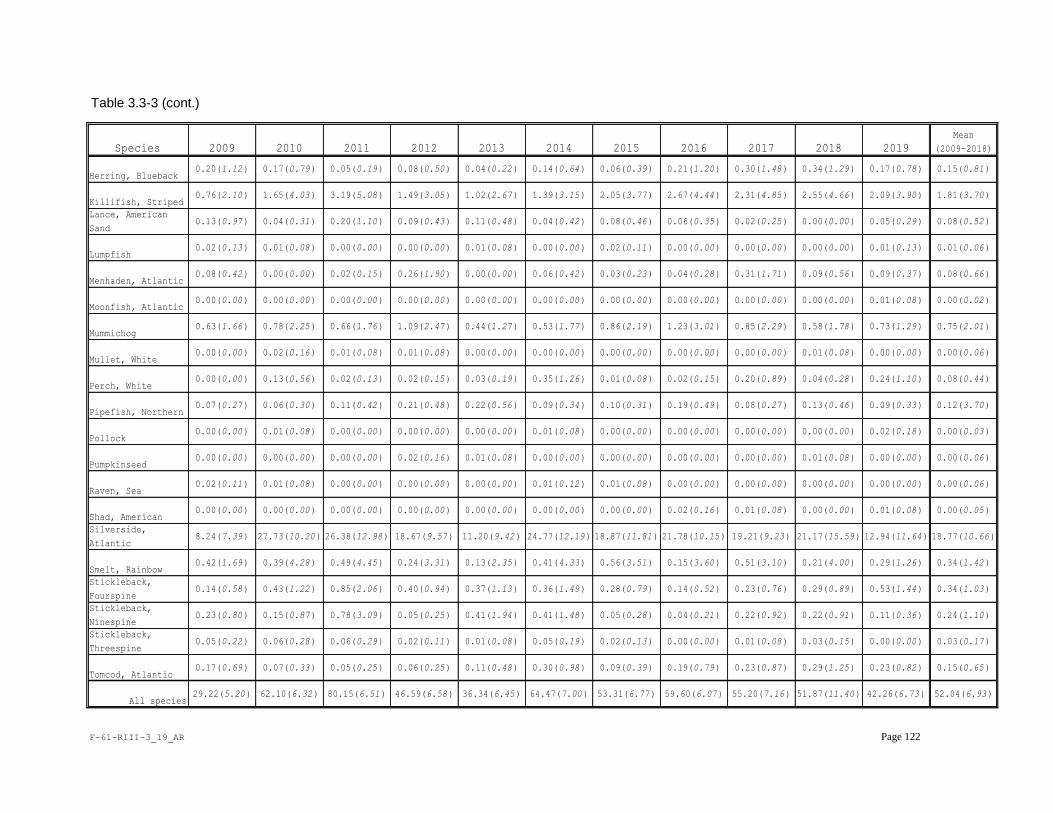
F-61-RIII-3_19_AR Page 122
Table 3.3-3 (cont.)
Stickleback,
Fourspine
Stickleback,
Ninespine
Stickleback,
Threespine
Tomcod, Atlantic
All species
Pumpkinseed
Raven, Sea
Shad, American
Silverside,
Atlantic
Smelt, Rainbow
Mummichog
Mullet, White
Perch, White
Pipefish, Northern
Pollock
Killifish, Striped
Lance, American
Sand
Lumpfish
Menhaden, Atlantic
Moonfish, Atlantic
Herring, Blueback
2010 2011
0.20(1.12) 0.17(0.79) 0.05(0.19) 0.08(0.50) 0.04(0.22) 0.14(0.64) 0.06(0.39) 0.21(1.20) 0.30(1.48) 0.34(1.29) 0.17(0.78) 0.15(0.81)
2.31(4.85) 2.55(4.66) 2.09(3.90) 1.81(3.70)
0.13(0.97) 0.04(0.31) 0.20(1.10) 0.09(0.43) 0.11(0.48) 0.04(0.42) 0.08(0.46) 0.06(0.35) 0.02(0.25) 0.00(0.00) 0.05(0.29) 0.08(0.52)
0.76(2.10) 1.65(4.03) 3.19(5.08) 1.49(3.05) 1.02(2.67) 1.39(3.15) 2.05(3.77) 2.67(4.44)
0.00(0.00) 0.01(0.13) 0.01(0.06)
0.08(0.42) 0.00(0.00)
0.00(0.00) 0.00(0.00) 0.00(0.00) 0.00(0.00) 0.00(0.00) 0.00(0.00) 0.00(0.00) 0.00(0.00) 0.00(0.00) 0.00(0.00) 0.01(0.08) 0.00(0.02)
0.02(0.13) 0.01(0.08) 0.00(0.00) 0.00(0.00) 0.01(0.08) 0.00(0.00) 0.02(0.11)
0.63(1.66) 0.78(2.25) 0.66(1.76) 1.09(2.47) 0.44(1.27) 0.53(1.77) 0.86(2.19) 1.23(3.01)
0.00(0.00)0.00(0.00)
0.85(2.29) 0.58(1.78) 0.73(1.29) 0.75(2.01)
0.02(0.15) 0.26(1.90) 0.00(0.00) 0.06(0.42) 0.03(0.23) 0.04(0.28) 0.31(1.71) 0.09(0.56) 0.09(0.37) 0.08(0.66)
0.00(0.00) 0.01(0.08) 0.00(0.00) 0.00(0.06)
0.00(0.00) 0.13(0.56) 0.02(0.13) 0.02(0.15) 0.03(0.19) 0.35(1.26) 0.01(0.08) 0.02(0.15) 0.20(0.89) 0.04(0.28) 0.24(1.10) 0.08(0.44)
0.00(0.00) 0.02(0.16) 0.01(0.08) 0.01(0.08) 0.00(0.00) 0.00(0.00) 0.00(0.00) 0.00(0.00)
0.08(0.27) 0.13(0.46) 0.09(0.33) 0.12(3.70)
0.00(0.00) 0.01(0.08) 0.00(0.00) 0.00(0.00) 0.00(0.00) 0.01(0.08) 0.00(0.00) 0.00(0.00) 0.00(0.00) 0.00(0.00) 0.02(0.18) 0.00(0.03)
0.07(0.27) 0.06(0.30) 0.11(0.42) 0.21(0.48) 0.22(0.56) 0.09(0.34) 0.10(0.31) 0.19(0.49)
0.00(0.00) 0.01(0.08) 0.00(0.00) 0.00(0.06)
0.02(0.11) 0.01(0.08) 0.00(0.00) 0.00(0.00) 0.00(0.00) 0.01(0.12) 0.01(0.08) 0.00(0.00) 0.00(0.00) 0.00(0.00) 0.00(0.00) 0.00(0.06)
0.00(0.00) 0.00(0.00) 0.00(0.00) 0.02(0.16) 0.01(0.08) 0.00(0.00) 0.00(0.00) 0.00(0.00)
0.00(0.00)
8.24(7.39)
0.42(1.69)
0.14(0.58)
0.23(0.80)
0.05(0.22)
0.17(0.69)
29.22(5.20)
0.00(0.00)
0.39(4.28) 0.49(4.45) 0.24(3.31) 0.13(2.35) 0.41(4.33) 0.56(3.51) 0.15(3.60) 0.51(3.10) 0.21(4.00)
0.02(0.13)0.05(0.19)
0.29(0.89)
0.22(0.91)
0.03(0.15)
0.01(0.08) 0.00(0.05)
27.73(10.20) 26.38(12.98) 18.67(9.57) 11.20(9.42) 24.77(12.19) 18.87(11.81) 21.78(10.15) 19.21(9.23) 21.17(15.59) 12.94(11.64) 18.77(10.66)
0.00(0.00) 0.00(0.00) 0.00(0.00) 0.00(0.00) 0.00(0.00) 0.02(0.16) 0.01(0.08) 0.00(0.00)
0.29(1.26) 0.34(1.42)
0.43(1.22)
0.15(0.87)
0.06(0.28)
0.07(0.33)
62.10(6.32)
0.85(2.06)
0.78(3.09)
0.06(0.29)
0.05(0.25)
80.15(6.51)
0.40(0.94)
0.05(0.25)
0.37(1.13)
0.41(1.94)
0.02(0.11) 0.01(0.08)
0.36(1.49)
0.41(1.48)
0.28(0.79)
0.05(0.28)
0.14(0.52)
0.04(0.21)
0.06(0.25) 0.11(0.48) 0.30(0.98) 0.09(0.39) 0.19(0.79)
0.23(0.76)
0.22(0.92)
0.01(0.08)
0.23(0.87)
0.00(0.00)
0.29(1.25)
0.53(1.44)
0.11(0.36)
0.00(0.00)
0.23(0.82)
0.34(1.03)
0.24(1.10)
0.03(0.17)
0.15(0.65)
52.04(6.93)46.59(6.58) 36.34(6.45) 64.47(7.00) 53.31(6.77) 42.26(6.73)51.87(11.40)55.20(7.16)59.60(6.07)
Species
Mean
(2009-2018)2009 2012 2013 2014 2015 2016 2017 2018 2019

F-61-RIII-3_19_AR Page 123
Table 3.3-4. Geometric mean catch per seine haul, by station and species, for all months combined, from a juvenile finfish seine survey conducted in New Hampshire estuaries, 2019.
5 7 9 23 25 29 33 30 35 39 54 72 93 107 147
Alewife 0.00 0.00 0.00 0.12 0.00 0.00 0.00 0.00 0.00 0.81 0.00 0.12 0.12 0.12 0.00
Bass, Striped 0.00 0.00 0.00 0.00 0.00 0.00 0.00 0.00 0.00 0.12 0.00 0.00 0.00 0.00 0.00
Crab, Green 1.22 1.12 1.53 1.14 1.14 0.12 0.00 14.39 11.26 0.94 0.62 0.93 1.04 0.00 5.08
Crab, Horseshoe 0.00 0.00 0.00 0.00 0.00 0.00 0.00 0.00 0.00 0.00 0.12 0.00 0.41 0.12 0.00
Cunner 0.00 0.00 0.00 0.00 0.00 0.00 0.00 0.12 0.00 0.00 0.00 0.12 0.00 0.00 0.12
Flounder, Smooth 0.00 0.00 0.00 0.00 0.00 0.00 0.00 0.12 1.57 0.35 0.41 0.35 5.20 0.92 0.12
Flounder, Winter 0.12 0.51 0.51 0.00 0.20 0.12 0.00 0.91 0.57 0.12 0.62 0.66 0.00 0.00 0.12
Grubby 0.20 0.47 0.12 0.41 0.00 0.00 0.00 0.78 0.00 0.12 0.00 0.26 0.00 0.00 1.22
Hake, Red 0.00 0.12 0.26 0.00 0.00 0.12 0.00 0.51 0.12 0.12 0.26 0.00 0.00 0.00 0.12
Herring, Atlantic 0.00 0.00 0.00 0.00 0.00 0.00 0.20 0.20 0.69 1.19 0.82 0.82 1.29 0.60 1.24
Herring, Blueback 0.12 0.20 0.00 0.12 0.00 0.00 0.00 0.72 0.00 0.62 0.20 0.53 0.00 0.31 0.00
Killifish, Striped 0.12 0.12 0.00 0.00 0.00 0.00 0.00 0.59 6.43 6.24 21.72 5.93 27.21 5.53 6.07
Lance, American Sand 0.00 0.00 0.12 0.00 0.51 0.26 0.00 0.00 0.00 0.00 0.00 0.00 0.00 0.00 0.00
Menhaden, Atlantic 0.20 0.00 0.00 0.00 0.12 0.00 0.00 0.12 0.26 0.00 0.00 0.00 0.12 0.73 0.00
Moonfish, Atlantic 0.00 0.00 0.00 0.00 0.00 0.00 0.00 0.00 0.00 0.00 0.00 0.00 0.00 0.00 0.12
Mummichog 0.00 0.00 0.12 0.00 0.00 0.00 0.00 0.12 0.41 3.91 2.24 0.78 5.81 2.52 2.15
Perch, White 0.00 0.00 0.00 0.00 0.00 0.00 0.00 0.00 0.00 0.00 0.00 0.00 3.00 5.59 0.00
Pipefish, Northern 0.00 0.00 0.00 0.00 0.00 0.00 0.00 0.12 0.00 0.35 0.12 0.35 0.00 0.12 0.51
Pollock 0.00 0.00 0.00 0.31 0.00 0.00 0.00 0.00 0.00 0.00 0.00 0.00 0.00 0.00 0.00
Shad, American 0.00 0.00 0.00 0.00 0.00 0.00 0.00 0.00 0.00 0.12 0.00 0.00 0.00 0.00 0.00
Silverside, Atlantic 4.05 4.20 21.58 26.76 1.14 1.26 0.00 42.72 39.78 6.64 95.92 48.53 35.34 28.65 25.08
Smelt, Rainbow 0.00 0.00 0.00 0.12 0.00 0.00 0.00 0.78 2.76 0.00 0.59 0.51 0.00 0.12 1.18
Stickleback, Fourspine 0.00 0.00 0.00 0.00 0.00 0.00 0.00 0.12 0.20 3.22 0.74 0.00 1.04 0.78 15.59
Stickleback, Ninespine 0.00 0.00 0.00 0.00 0.00 0.00 0.00 0.00 0.12 0.26 0.35 0.12 0.26 0.00 0.89
Tomcod, Atlantic 0.00 0.00 0.00 0.12 0.00 0.00 0.00 0.12 0.12 0.00 0.78 0.67 0.00 0.41 2.71
All species 11.10 10.87 51.44 54.12 4.86 2.85 0.20 140.78 322.15 53.14 355.70 171.88 188.15 75.31 139.07
Species
Station #
Little Harbor Hampton/Seabrook Estuary Piscataqua River Little Bay/Great Bay

F-61-RIII-3_19_AR Page 124
Table 3.3-5. Geometric Mean catch per seine haul, by species and month, for all stations combined, from a juvenile finfish seine survey
conducted in New Hampshire estuaries, 2019.
Alewife 0.27 0.00 0.05 0.00 0.00 0.15
Bass, Striped 0.00 0.00 0.00 0.00 0.00 0.05
Crab, Green 2.24 4.24 1.65 0.94 0.91 0.43
Crab, Horseshoe 0.15 0.00 0.05 0.05 0.00 0.00
Cunner 0.00 0.00 0.00 0.00 0.10 0.05
Flounder, Smooth 0.81 0.64 0.35 0.25 0.17 0.08
Flounder, Winter 0.00 0.37 0.38 0.37 0.41 0.15
Grubby 0.36 0.40 0.05 0.10 0.13 0.22
Hake, Red 0.05 0.00 0.10 0.10 0.36 0.05
Herring, Atlantic 4.77 0.13 0.08 0.00 0.05 0.00
Herring, Blueback 0.21 0.11 0.00 0.05 0.79 0.00
Killifish, Striped 0.71 0.82 3.76 4.65 4.34 0.93
Lance, American Sand 0.10 0.00 0.00 0.05 0.18 0.00
Menhaden, Atlantic 0.00 0.08 0.00 0.05 0.43 0.05
Moonfish, Atlantic 0.00 0.00 0.00 0.00 0.05 0.00
Mummichog 0.69 1.25 1.18 0.61 0.75 0.16
Perch, White 0.05 0.22 0.42 0.46 0.29 0.08
Pipefish, Northern 0.05 0.21 0.00 0.00 0.26 0.08
Pollock 0.11 0.00 0.00 0.00 0.00 0.00
Shad, American 0.05 0.00 0.00 0.00 0.00 0.00
Silverside, Atlantic 0.45 0.36 34.04 47.33 56.70 37.17
Smelt, Rainbow 0.05 0.10 0.05 0.33 1.48 0.15
Stickleback, Fourspine 0.62 0.63 0.38 0.55 0.47 0.55
Stickleback, Ninespine 0.10 0.13 0.17 0.08 0.13 0.10
Tomcod, Atlantic 0.79 0.29 0.13 0.18 0.13 0.00
All species 19.72 13.34 60.86 76.00 95.06 47.18
June July August September October NovemberSpecies

F-61-RIII-3_19_AR Page 125
Table 3.3-6. Arithmetic mean, minimum, and maximum total length (cm), as well as sample size (N), for all fish species measured, from a juvenile finfish seine survey conducted in New Hampshire estuaries, 2019.
AM Minimum Maximum N
Alewife 13.43 3.60 24.30 29
Bass, Striped 81.30 81.30 81.30 1
Cunner 4.23 3.20 5.20 3
Flounder, Smooth 6.09 2.90 12.20 96
Flounder, Winter 6.65 2.40 25.60 43
Grubby 4.71 2.90 7.40 31
Hake, Red 5.90 2.70 9.00 13
Herring, Atlantic 6.63 4.60 12.20 152
Herring, Blueback 10.44 4.10 24.60 64
Killifish, Striped 5.68 3.50 8.70 155
Lance, American Sand 4.73 2.80 9.70 479
Menhaden, Atlantic 8.70 5.60 10.50 10
Moonfish, Atlantic 9.35 4.10 34.90 17
Mummichog 3.80 3.80 3.80 1
Perch, White 5.72 2.80 28.00 108
Pipefish, Northern 15.69 7.80 20.50 14
Pollock 5.58 5.20 5.80 4
Shad, American 17.60 17.60 17.60 1
Silverside, Atlantic 8.32 3.40 13.60 1,147
Smelt, Rainbow 6.46 3.30 9.00 60
Stickleback, Fourspine 4.00 3.00 5.10 150
Stickleback, Ninespine 4.21 3.00 5.00 16
Tomcod, Atlantic 7.85 4.60 14.00 66
2,660
Total length (cm)
Species
Total

F-61-RIII-3_19_AR Page 126
Table 3.3-7. Mean minimum, and maximum water surface temperature and salinity, from a juvenile finfish seine survey conducted in New Hampshire estuaries, 2009 – 2019.
Mean Min Max Mean Min Max
2009 15.9 6.9 23.8 24.1 2.3 31.5
2010 17.1 7.5 26.7 27.1 9.7 31.2
2011 17.2 5.7 28.2 23.7 1.6 30.2
2012 17.1 6.2 28.2 26.1 4.7 31.1
2013 16.2 3.5 27.9 25.1 2.3 32.1
2014 16.8 7.2 28.1 26.9 6.2 34.4
2015 16.8 10.8 26.2 27.8 9.2 31.9
2016 17.4 8.6 30.6 29.2 11.7 32.3
2017* 16.0 5.6 25.6 28.0 10.4 31.6
2018 17.5 2.4 27.6 24.6 0.2 31.4
2019* 17.2 5.8 30.8 26.6 7.1 31.8
Mean
*Data for some samples not collected due to instrument failure
Year
Temperature (°C) Salinity (ppt)
16.8 26.3
F-61-RIII-3_19_AR Page 127
Table 3.3-8. Water surface temperature (oC) by month and station, from a juvenile finfish seine survey conducted in New Hampshire estuaries, 2019.
Table 3.3-9. Salinity (ppt) by month and station, from a juvenile finfish seine survey conducted in New Hampshire estuaries, 2019.
5 7 9 23 25 29 33 30 35 39 54 72 93 107 147
June 14.2 16.2 17.1 17.1 18.5 19.0 18.8 16.2 17.0 22.0 19.0 16.2 17.9 19.2 17.5 17.7
July 15.2 17.3 17.8 19.3 20.3 20.6 20.8 18.7 18.9 25.6 21.7 22.7 25.7 27.6 25.7 21.2
August 16.0 18.0 18.8 17.6 * * 20.2 19.2 19.8 23.8 22.3 21.8 24.4 24.0 24.7 20.6
September 14.6 16.4 16.3 20.0 16.1 16.1 16.1 17.8 18.2 15.5 19.9 20.0 21.0 22.3 22.8 18.2
October 14.2 13.8 13.8 14.0 14.6 15.1 15.0 14.2 14.4 16.2 30.8 15.8 17.3 17.7 16.7 16.2
November 10.4 10.5 10.1 6.5 6.0 5.8 5.8 11.2 11.0 10.0 11.4 11.6 10.3 12.1 10.7 9.6
Site mean 14.1 15.4 15.7 15.8 15.1 15.3 16.1 16.2 16.6 18.9 20.9 18.0 19.4 20.5 19.7
Area mean
*Data not collected due to instrument failure
15.0 15.6 17.2 19.7
Station #
Little Harbor Hampton/Seabrook Estuary Piscataqua River Little Bay/Great Bay
Month
Monthly
mean
5 7 9 23 25 29 33 30 35 39 54 72 93 107 147
June 29.2 28.4 27.5 27.1 28.6 27.9 28.3 26.8 25.3 10.5 24.2 24.2 21.6 15.1 20.4 24.3
July 28.6 29.7 29.9 29.9 30.0 29.9 29.8 28.4 27.2 14.8 26.0 26.5 24.3 16.0 24.7 26.4
August 30.4 30.5 30.2 30.5 * * 29.9 29.6 29.2 15.0 28.2 28.9 26.5 21.1 25.7 27.4
September 30.8 30.5 30.8 25.8 31.1 31.2 31.2 29.8 28.6 21.5 28.2 28.3 26.7 17.8 26.3 27.9
October 31.1 27.2 31.2 30.6 31.0 30.9 30.9 31.0 30.4 24.6 15.3 30.7 29.9 27.1 29.9 28.8
November 30.2 29.5 27.9 31.1 31.8 31.0 30.9 27.3 25.5 7.1 24.2 24.2 21.6 9.7 21.6 24.9
Site mean 30.1 29.3 29.6 29.2 30.5 30.2 30.2 28.8 27.7 15.6 24.4 27.1 25.1 17.8 24.8
Area mean
*Data not collected due to instrument failure
29.6 30.0 24.0 23.8
Station #
Little Harbor Hampton/Seabrook Estuary Piscataqua River Little Bay/Great Bay
Month
Monthly
mean

F-61-RIII-3_19_AR Page 128
Figure 3.3-1. Sampling stations in Hampton/Seabrook Estuary, from a juvenile finfish seine survey conducted in New Hampshire estuaries, 2019.
Figure 3.3-2. Sampling stations in Little Harbor, from a juvenile finfish seine survey conducted in New Hampshire estuaries, 2019.

F-61-RIII-3_19_AR Page 129
Figure 3.3-3. Sampling stations in the Piscataqua River and Little Bay/Great Bay area from a juvenile finfish seine survey conducted in New Hampshire estuaries, 2019.
F-61-RIII-3_19_AR Page 130
Figure 3.3-4. Weighted length frequencies of six finfish species of special interest captured from a juvenile finfish seine survey conducted in New Hampshire estuaries, 2019.