progress with hbv genotype panels - nibsc - home - sogat xxii rome apr... progress with hbv genotype...
TRANSCRIPT

www.pei.de
Progress with HBV Genotype Panels
SoGAT XXII
14th-15th April 2011, Rome, Italy
M. Chudy, Division of Virology,
Paul-Ehrlich-Institut, Langen, Germany

Virology Division
Worldwide Distribution of HBV Genotypes

Virology Division
Background
Current WHO ISs for HBsAg or HBV-DNA represent HBV
genotype A2
HBV gt A2 in <1% of HBV-infected persons globally
Commutability of gt A2 for other HBV genotypes?
Virology Division
Background
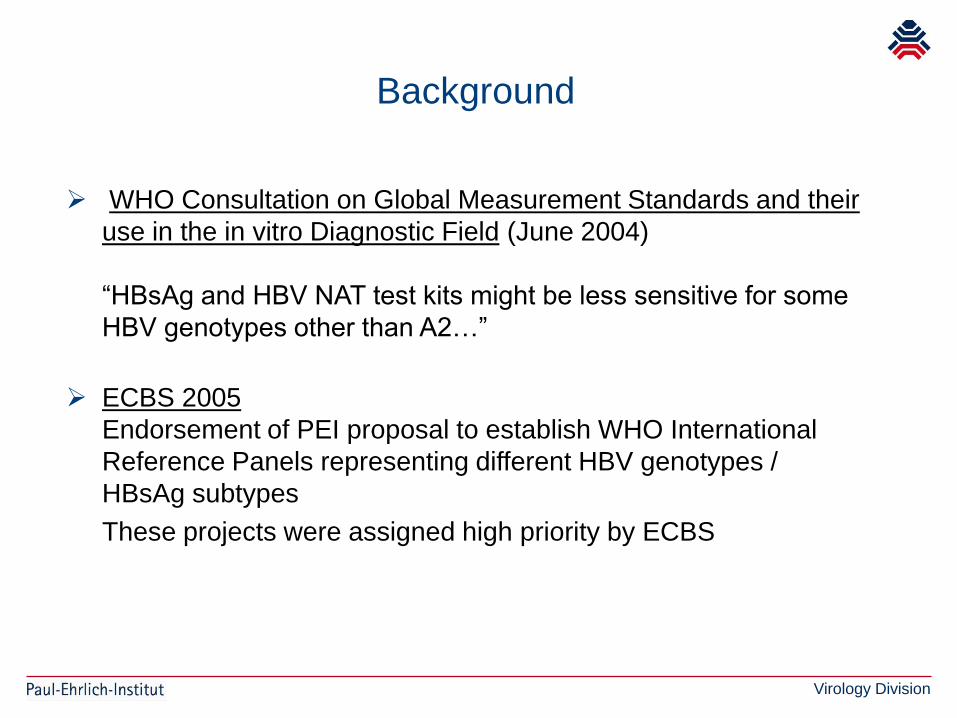
WHO Consultation on Global Measurement Standards and their
use in the in vitro Diagnostic Field (June 2004)
“HBsAg and HBV NAT test kits might be less sensitive for some
HBV genotypes other than A2…”
ECBS 2005
Endorsement of PEI proposal to establish WHO International
Reference Panels representing different HBV genotypes /
HBsAg subtypes
These projects were assigned high priority by ECBS

Virology Division
Design of HBV Genotype Panels
Collection of plasma units from different regions
- HBV DNA/HBsAg high titre plasma samples with sufficient volume
Characterization of 215 potential candidate materials
- quant HBV DNA, quant HBsAg
- Sequencing of entire S ORF
- Analysis for genotype, escape mutations; HBsAg subtyping; HBV-
markers
- HIV-1 RNA, HCV-RNA
HBV genotypes A – G (H)
- One genotype H sample received at late stage, only for HBsAg

Virology Division
Design of HBV Genotype Panels
Project (part 1) ECBS 2009
HBV genotype panel for HBV-DNA tests 15 panel members
Target concentrations: 106 IU HBV-DNA/ml (12)
105 IU HBV-DNA/ml (1)
104 IU HBV-DNA/ml (2)
Project (part 2) proposed for ECBS 2011
HBV genotype panel for HBsAg tests 15 panel members
Reduction of potential infectivity (ultracentrifugation)
Target concentration: 100 IU HBsAg/ml
12 members of each panel have common origin (same donor)
Virology Division
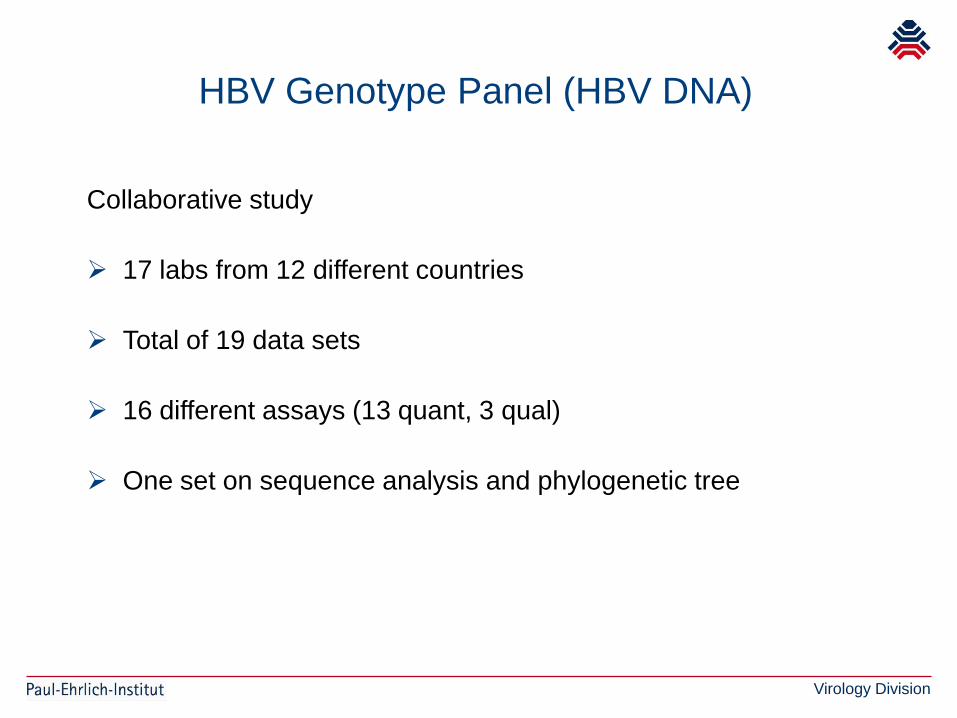
HBV Genotype Panel (HBV DNA)
Collaborative study
17 labs from 12 different countries
Total of 19 data sets
16 different assays (13 quant, 3 qual)
One set on sequence analysis and phylogenetic tree
Virology Division
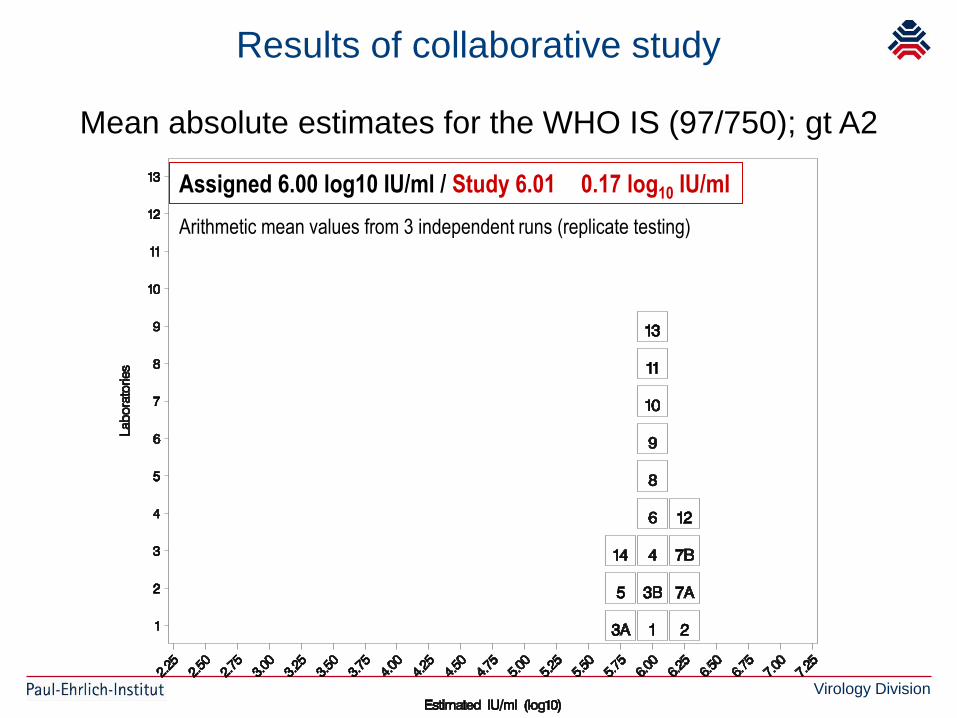
Results of collaborative study
Mean absolute estimates for the WHO IS (97/750); gt A2
Assigned 6.00 log10 IU/ml / Study 6.01 0.17 log10 IU/ml
Arithmetic mean values from 3 independent runs (replicate testing)

Virology Division
Results of collaborative study
Mean estimates relative to WHO IS
Sample 14: gt F2 Sample 15: gt G
6
8
3.78 0.50 log10 IU/ml4.76 0.45 log10 IU/ml
4.86 0.20 log10 IU/ml (excl. Lab 2) 3.85 0.21 log10 IU/ml (excl. Lab 4,6,7B,8)

Virology Division
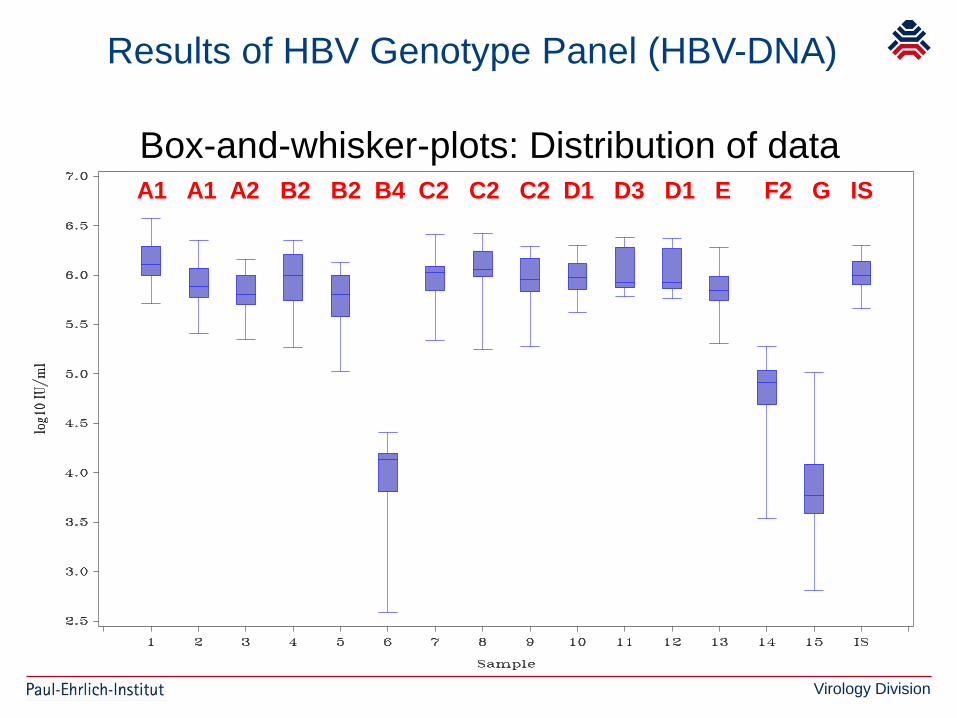
Box Plot
The box-and-whisker-plots show the distribution of the data.
The boxes contain the middle 50 per cent of the results (interquartile range, IQR)
and the median as horizontal line.
The end of the whiskers denote the minimum and maximum values.
Virology Division
Results of HBV Genotype Panel (HBV-DNA)
Box-and-whisker-plots: Distribution of dataA1 A1 A2 B2 B2 B4 C2 C2 C2 D1 D3 D1 E F2 G IS

Virology Division
HBV Genotype Panel (HBV DNA)
Collaborative study - outcome
Overall good correlation in detecting most of the genotypes
Small number of assays detected genotypes F and G less efficiently
Few genotype B, C, and E samples were underquantified by two
methods
Need of a genotype panel confirmed

Virology Division
International Reference Panel for HBV genotypes
- NAT assay -
Panel for NAT tests established by ECBS of WHO in October 2009
Hepatitis B virus DNA; PEI 5086/08; 1st International Reference
Panel 2009
More information about the panel and ordering under:
WHO/BS/09.2121
www.pei.de
www.who.int/biologicals/en/
For future: Proposal to ECBS/WHO for extension (gt H …)
Thanks to the participants of the collaborative study

Virology Division
Design of HBV Genotype Panels
Project (part 2):
HBV genotype panel for HBsAg tests
15 panel members
Reduction of potential infectivity (ultracentrifugation)
Target concentration: 100 IU HBsAg/ml (EIA Architect, Abbott)
Virology Division
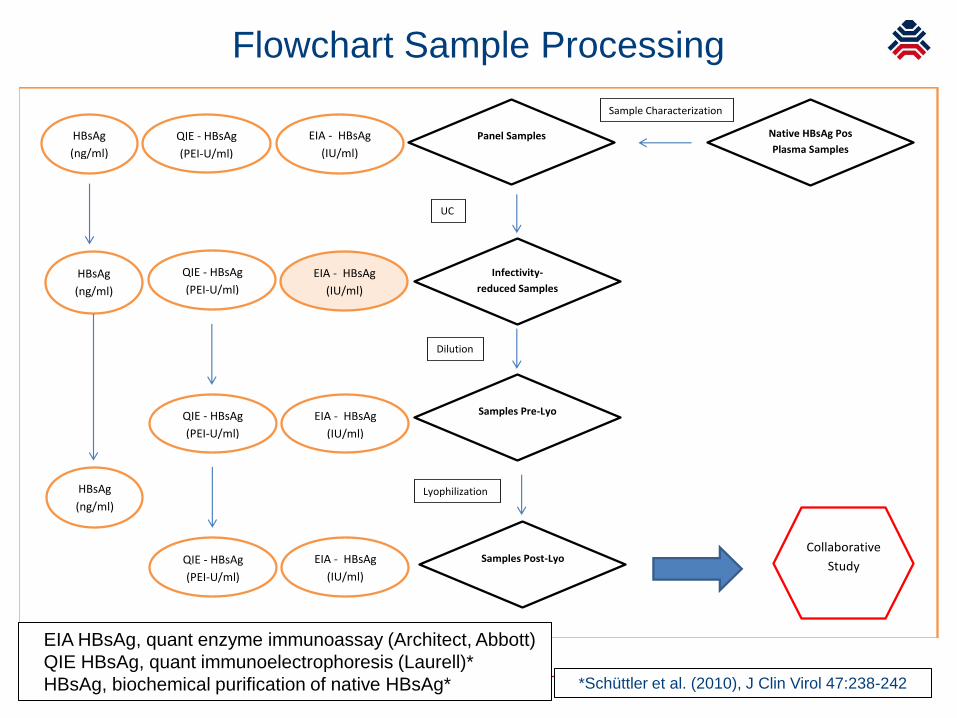
Flowchart Sample Processing
*Schüttler et al. (2010), J Clin Virol 47:238-242
Panel Samples
Infectivity-
reduced Samples
Samples Pre-Lyo
Samples Post-Lyo
Dilution
UC
Lyophilization
QIE - HBsAg
(PEI-U/ml)
HBsAg
(ng/ml)
EIA - HBsAg
(IU/ml)
EIA - HBsAg
(IU/ml)
EIA - HBsAg
(IU/ml)
Collaborative
Study
Native HBsAg Pos
Plasma Samples
Sample Characterization
EIA - HBsAg
(IU/ml)
QIE - HBsAg
(PEI-U/ml)
HBsAg
(ng/ml)
HBsAg
(ng/ml)
QIE - HBsAg
(PEI-U/ml)
QIE - HBsAg
(PEI-U/ml)
EIA HBsAg, quant enzyme immunoassay (Architect, Abbott)
QIE HBsAg, quant immunoelectrophoresis (Laurell)*
HBsAg, biochemical purification of native HBsAg*

Virology Division
HBV Genotype Panel (HBsAg) – Ultracentrifugation
Panel
Member OriginHBsAg
subtype1
HBV Sub-
genotype1HBV DNA (log10 ge/ml)2
Before UC After UC Reduction factor
1/A South Africa adw2 A1 9,52 7,98 1,54
2/A Brazil adw2 A1 9,55 6,04 3,31
3/A Germany adw2 A2 9,60 5,56 4,04
4/B Japan adw2 B1 8,90 7,41 1,49
5/B Japan adw2 B2 9,19 7,59 1,60
6/C Japan adr C2 9,33 5,91 3,42
7/C Japan adr C2 8,83 7,30 1,53
8/C Russia adr C2 9,20 6,85 2,35
9/D Germany ayw2 D1 9,80 6,17 3,63
10/D3 Russia ayw3 D2 4,79
11/D South Africa ayw2 D3 8,75 6,71 2,04
12/E West Africa ayw4 E 9,71 7,84 1,87
13/F Brazil adw4 F2 7,78 5,97 1,81
14/F Brazil adw4 F2 3,70 3,01 0,69
15/H Germany adw4 H 9,78 8,15 1,63
1Sequencing; 2In-house LC HBV NAT (ge/ml), Cobas AmpliPrep/CobasTaqMan HBV Test, v1.0
(Roche Diagnostics; conversion factor 1IU correspond to 5,82 ge); 3no UC.

Virology Division
HBV Genotype Panel (HBsAg)Dilution to 100 IU/ml1 (Pre- and Post-Lyo)
Pre-Lyo Post-Lyo
Panel
Member
HBsAg2
(IU/ml)
HBsAg3
(PEI U/ml)
HBsAg2
(IU/ml)
Loss by
Lyo (%)
HBsAg3,4
(PEI U/ml)
HBsAg5
(ng/ml)
1/A 107,9 60,8 95,4 11,6 53,7 96,68
2/A 100,6 70,0 87,7 12,8 61,0 92,66
3/A 94,5 66,6 80,3 15,0 56,6 75,03
4/B 74,9 45,3 63,3 15,5 38,3 33,94
5/B 88,7 43,0 74,7 15,8 36,2 69,06
6/C 98,5 136,0 87,7 11,0 121,0 180,48
7/C 101,0 85,6 84,2 16,6 71,4 101,36
8/C 100,6 73,9 90,0 10,5 66,1 92,23
9/D 100,9 57,0 83,3 17,4 47,1 78,20
10/D 91,1 105,8 88,2 3,2 102,4 n.a.
11/D 88,4 66,7 72,4 18,1 54,6 60,61
12/E 96,1 71,0 85,5 11,0 63,2 81,26
13/F 100,8 51,2 80,4 20,2 40,9 n.a.
14/F 113,1 56,0 95,0 16,0 47,0 51,36
15/H 102,7 43,0 88,5 13,8 37,1 60,03
1based on EIA (mean Architect values); 2EIA Architect; 3QIE Laurell
immunoelectrophoresis; 4assumed loss (%) as measured by the Architect; 5purified HBsAg;
n.a., not available.

Virology Division
HBV Genotype Panel (HBsAg)
- Collaborative Study -
15 Participants
Japan, USA, UK, NL, Italy, France, Germany
24 qual data sets from 21 different tests
2 data sets (one lab) were not used for the analysis
one data set: no sample cutoff
6 quant data sets from 2 different tests
Serial Dilutions of the 15 panel members and the WHO IS
Qual tests: S/CO
Quant tests: IU/ml
Virology Division
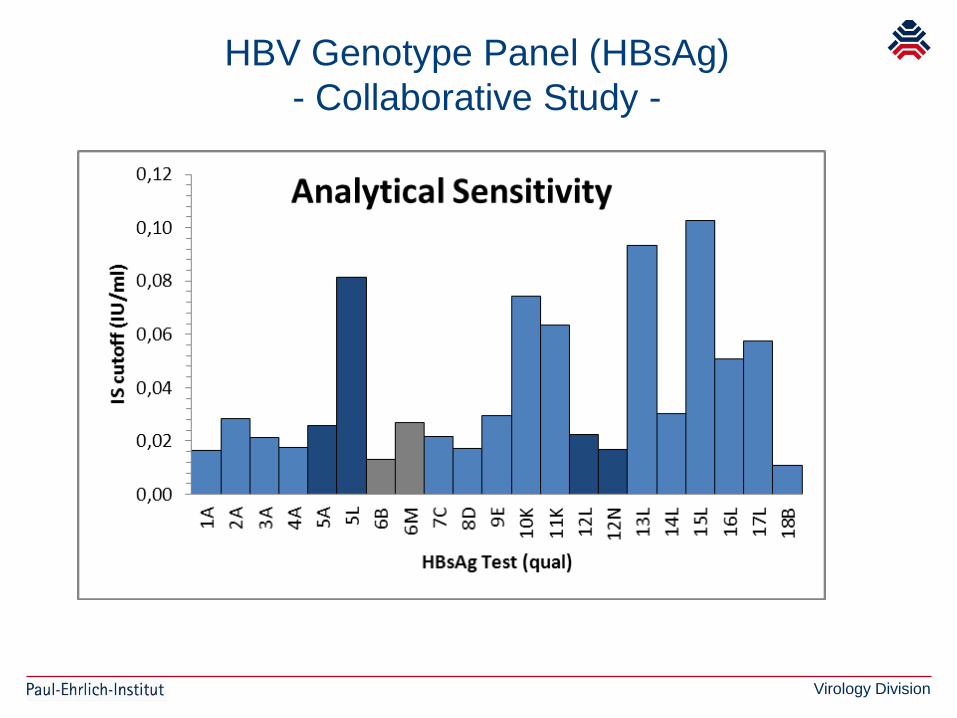
HBV Genotype Panel (HBsAg)
- Collaborative Study -

Virology Division
1/A
11/D10/D9/D6/C 7/C 8/C
15/H14/F13/F
4/B 5/B 12/E2/A 3/A
HBsAg Test (qual)
Sample dilution / IS dilution
at which the S/CO=1.00
Virology Division
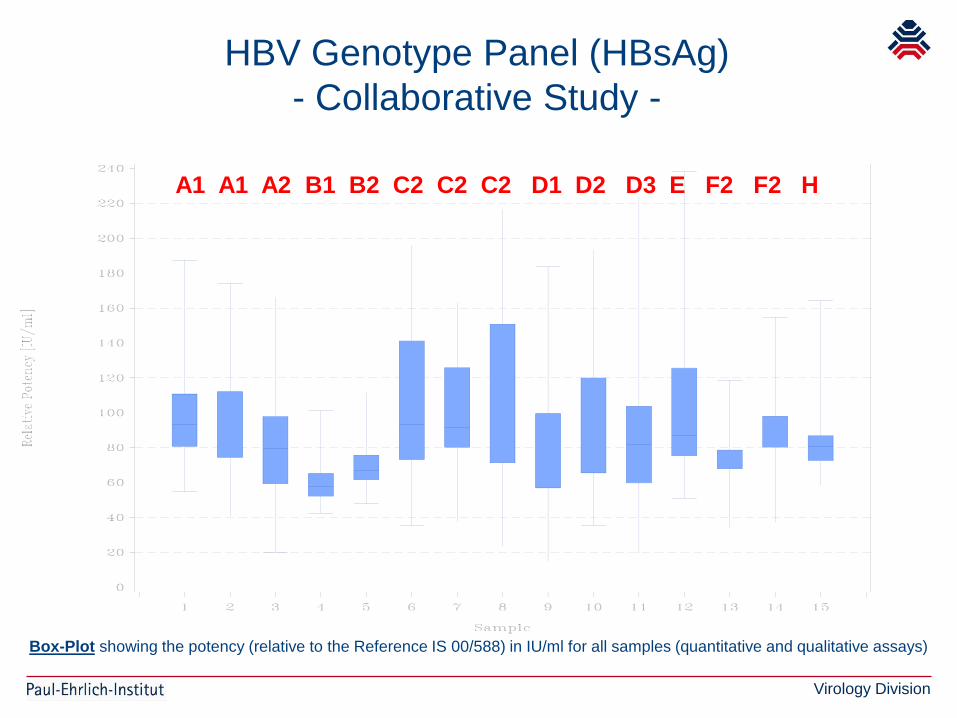
Box-Plot showing the potency (relative to the Reference IS 00/588) in IU/ml for all samples (quantitative and qualitative assays)
A1 A1 A2 B1 B2 C2 C2 C2 D1 D2 D3 E F2 F2 H
HBV Genotype Panel (HBsAg)
- Collaborative Study -
Virology Division
Data analysis in progress
Stability studies are on-going
Submission of the report to ECBS June 2011
HBV Genotype Panel (HBsAg)
- Collaborative Study -
Virology Division
Thanks to the co-operators in the projects
- Prof Gerlich, Institute of Medical Virology, Justus Liebig University Giessen, Germany
- Profs Yoshizawa & Tanaka, Hiroshima University, Japan
- Dr Jochum, Biotest AG, Dreieich, Germany
- Prof Zhibourt, Federal Blood Center, Moscow, Russia
- Drs Sabino & Otani, Fundação Pró-Sangue Homocentro de São Paulo, Brazil
- Dr Schmidt, German Red Cross Blood Donation Center, Frankfurt/Main, Germany
- Drs Cheraghali & Abolghasemi, Iranian Blood Transfusion Organization, Tehran, Iran
- Mrs Sykes & Mr Watts, South African National Blood Service, Weltevreden Park, South Africa
- Dr Phil Minor, NIBSC, UK
- Dr Ana Padilla, WHO, HSS / EMP / QSM, Geneva
- Colleagues from PEI- Section of Molecular Virology
- PEI-IVD
- Section of Statistics
- Administration

Virology Division
Virology Division
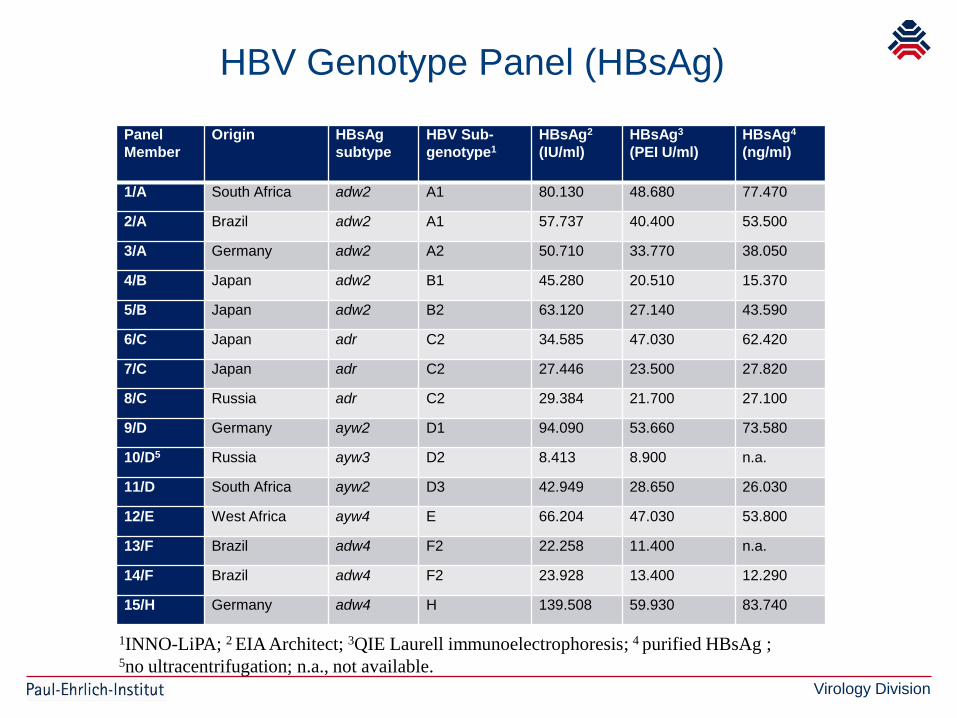
HBV Genotype Panel (HBsAg)
Panel
Member
Origin HBsAg
subtype
HBV Sub-
genotype1
HBsAg2
(IU/ml)
HBsAg3
(PEI U/ml)
HBsAg4
(ng/ml)
1/A South Africa adw2 A1 80.130 48.680 77.470
2/A Brazil adw2 A1 57.737 40.400 53.500
3/A Germany adw2 A2 50.710 33.770 38.050
4/B Japan adw2 B1 45.280 20.510 15.370
5/B Japan adw2 B2 63.120 27.140 43.590
6/C Japan adr C2 34.585 47.030 62.420
7/C Japan adr C2 27.446 23.500 27.820
8/C Russia adr C2 29.384 21.700 27.100
9/D Germany ayw2 D1 94.090 53.660 73.580
10/D5 Russia ayw3 D2 8.413 8.900 n.a.
11/D South Africa ayw2 D3 42.949 28.650 26.030
12/E West Africa ayw4 E 66.204 47.030 53.800
13/F Brazil adw4 F2 22.258 11.400 n.a.
14/F Brazil adw4 F2 23.928 13.400 12.290
15/H Germany adw4 H 139.508 59.930 83.740
1INNO-LiPA; 2 EIA Architect; 3QIE Laurell immunoelectrophoresis; 4 purified HBsAg ; 5no ultracentrifugation; n.a., not available.