project completion report telecommunications development
TRANSCRIPT

SCCD : N.G.
AFRICAN DEVELOPMENT BANK
AFRICAN DEVELOPMENT FUND
PROJECT COMPLETION REPORT
TELECOMMUNICATIONS DEVELOPMENT
BENIN
COUNTRY DEPARTMENT OCDWWEST REGION JUNE 2000

TABLE OF CONTENTSPage
LISTS OF ANNEXES, EQUIVALENTS AND ABBREVIATIONS, SUMMARY, PROJECT BASICDATA, RETROSPECTIVE PROJECT MATRIX....................................................................................(i-viii)
1 INTRODUCTION ........................................................................................................................................ 1
1.1 SOCIO-ECONOMIC BACKGROUND AT APPRAISAL...................................................................................... 11.2 TECHNICAL BACKGROUND ...................................................................................................................... 11.3 BANK GROUP OPERATIONS IN THE TELECOMMUNICATIONS SECTOR ........................................................ 11.4 PROJECT LOCATION ................................................................................................................................. 1
2 PROJECT OBJECTIVE AND FORMULATION .................................................................................... 1
2.1 SECTOR GOAL ......................................................................................................................................... 22.2 PROJECT OBJECTIVE ................................................................................................................................ 22.3 PROJECT DESCRIPTION ............................................................................................................................ 22.4 PROJECT FORMULATION .......................................................................................................................... 2
3 PROJECT IMPLEMENTATION............................................................................................................... 3
3.1 EFFECTIVENESS AND START UP................................................................................................................ 33.2 MODIFICATIONS ...................................................................................................................................... 43.3 IMPLEMENTATION SCHEDULE.................................................................................................................. 43.4 REPORTING.............................................................................................................................................. 43.5 PROCUREMENT ........................................................................................................................................ 53.6 COSTS, SOURCES OF FINANCING AND DISBURSEMENT ............................................................................ 5
4 PROJECT OPERATING PERFORMANCE AND OPERATING RESULTS ...................................... 5
4.1 OVERALL ASSESSMENT ........................................................................................................................... 54.2 OPERATING RESULTS .............................................................................................................................. 64.3 ORGANIZATION AND MANAGEMENT OF EXECUTING AGENCY ................................................................ 64.4 STAFF TRAINING AND RETRAINING ......................................................................................................... 74.5 ACCOUNTING AND VERIFICATION OF ACCOUNTS .................................................................................... 74.6 BILLING AND COLLECTION. ..................................................................................................................... 84.7 TARIFFS ................................................................................................................................................... 84.8 THE PERFORMANCE CONTRACT .............................................................................................................. 84.9 PERFORMANCE OF THE BORROWER ......................................................................................................... 94.10 PERFORMANCE OF THE EXECUTING AGENCY .......................................................................................... 94.11 PERFORMANCE OF CONSULTANTS AND SUPPLIERS.................................................................................. 94.12 COMPARATIVE OPERATING TREND. ........................................................................................................ 94.13 ANALYSIS OF THE FINANCIAL STRUCTURE ........................................................................................... 114.14 PROJECT FINANCIAL RATE OF RETURN ................................................................................................. 11
5 SOCIAL AND ENVIRONMENTAL IMPACT....................................................................................... 11
5.1 SOCIAL IMPACT ..................................................................................................................................... 115.2 ENVIRONMENTAL IMPACT ..................................................................................................................... 12
6 PROJECT SUSTAINABILITY................................................................................................................. 12
7 PERFORMANCE OF THE BANK .......................................................................................................... 12
8 OVERALL PERFORMANCE AND RATING........................................................................................ 13
9 CONCLUSIONS, LESSONS LEARNT AND RECOMMENDATIONS .............................................. 13
9.1 CONCLUSIONS ....................................................................................................................................... 139.2 LESSONS LEARNT................................................................................................................................... 139.3 RECOMMENDATIONS ............................................................................................................................. 14

i
LIST OF ANNEXES
Title Number of Pages
1. Map of the Telecommunications Network 1
2. Priority Investment Programme 2
3. Loan Conditions 1
4. Comparative Implementation Schedule 1
5. Project Costs 1
6. Disbursement Schedule and Financing Plan 1
7. Production Target Indicators 4
8. OPT Organization Chart 1
9. OPT Operating Accounts (1992 – 1997) 1
10. OPT Comparative Balance Sheets (1992 - 1997) 1
11 Calculation of the Financial Rate of Return 2
12. Performance Ratings 4
13 Matrix of Recommendations 1
14 Contractors/Suppliers 2
15 Sources of Information 1
_____________________________________________________________________________This report was prepared by Messrs. D. Nikiema, Telecommunications Engineer, H.R. Heeroo,Electrical Engineer and R. Kpomalegni Financial Analyst (consultant), following a mission toBenin from 14 to 26 March 1999.

ii
EQUIVALENTS AND ABBREVIATIONS
Currency Equivalents
Currency Unit in Benin: CFA Franc
Average in 1990 Average in 1998(at appraisal) (on completion)UA 1 = CFA.F 380.318 UA 1 = CFA.F 796.014
ACRONYMS AND ABBREVIATIONS
ADB : African Development BankADF : African Development FundCAA : Caisse autonome d'amortissement (Sinking Fund)CP : Concentration PointPMC : Principal Maintenance CentreEG : Electric GeneratorEIB : European Investment BankFE : Foreign ExchangeGvt. : GovernmentITU : International Telecommunications UnionLC : Local CurrencyMEUTN : Modernization and Extension of Urban Telecommunications NetworksML : Main LineNMIP : National Maintenance Improvement PlanNTF : Nigeria Trust FundOPT : Office des postes et télécommunications (Posts and
Telecommunications Board)PCR : Project Completion ReportRRS : Radio Relay SystemRTP : Rural Telecommunications ProgrammeSD : Sub-distributionSYNAPOSTEL : Syndicat National des Postes et Télécommunications (National Posts
and Telecommunications Union)SYSCOA : West African Accounting SystemTPC : Telecommunications Projects CoordinationUA : Unit of Account
FISCAL YEAR
At appraisal : 1 January - 31 DecemberOn completion : 1 January - 31 December

iii
SUMMARY
1. The Telecommunications Development Programme is an integral part of theTelecommunications Development Strategy for Benin for a 20-year period (1986-2005). Theproject, approved by the Bank on 18 April 1990, concerned the establishment of the Porto Novolocal network, the procurement of transmission equipment and the rehabilitation of theTelecommunications Vocational Training Centre.
2. The project was completed in December 1998, i.e. five and a half years behind theschedule at appraisal. An initial delay of 2 years was due to the Government’s slowness infulfilling the conditions of loan effectiveness and to the imposition of sanctions on the countrythroughout the period. The remainder, observed during implementation, was due toshortcomings within the Office des Postes et Télécommunications (OPT), the Project ExecutingAgency, and the time taken by the Bank to approve certain contracts.
3. The total project cost was UA 14.78 million compared with an estimate at appraisal ofUA 15.48 million. ADF and NTF financed the project foreign exchange costs to the tune of UA6.43 million and 6.71 million respectively, compared with estimates at appraisal of UA 6.92 and7.00 million. The local currency costs, estimated at UA 1.56 million at appraisal, were borne byOPT and, on completion, stood at UA 1.637 million.
4. The project objectives were attained and exceeded in the case of some components.Benin was provided with a modern telecommunications infrastructure and OPT was able to meetunsatisfied expressed demand while improving the quality of service to subscribers. Thefinancial internal rate of return on completion was 27% compared with 20.27% at appraisal.

iv
PROJECT BASIC DATA
1. Loan Numbers ADF : F/BEN/TEL/90/22NTF : N/BEN/TEL/90/1
2. Borrower : Government of the Republic of Benin3. Beneficiary : Office des Postes et Télécommunications4. Executing Agency : Office des Postes et Télécommunications
5. Loans
5.1 ADF Loan
Estimate at Appraisal ActualAmount (in UA) 6 926 311.00 6 426 186.83Commission on amountsdisbursed and outstanding
0.75 % 0.75 %
Interest Rates 1% from the elevenththrough the twentieth yearand 3% thereafter.
1% from the elevenththrough the twentieth yearand 3% thereafter.
Repayment periodincluding the 10-yeargrace period
50 years 50 years
Loan Negotiation Date : 23 March 1990Loan Approval Date : 18 April 1990Loan Signature Date : 30 November 1990Effectiveness Date : 14 July 1992
5.2 NTF Loan
Estimate at Appraisal ActualAmount (in UA) 7 000 000 6 716 556.57Commission onundisbursed balances ofthe maximum amount ofthe loan
0.75 % 0.75 %
Interest Rates 4 % 4 %Repayment Periodincluding the 5-year graceperiod
25 years 20 years
Loan Negotiation Date : 23 March 1990Loan Approval Date : 18 April 1990Loan Signature Date : 30 May 1990Effectiveness Date : 30 June 1992

v
6. Total Cost (in thousand UA)
Estimate at Appraisal Actual
Foreign Exchange 13 926 13 143
Local Currency 1 561 1 637Total 15 487 14 780
7. Financing Plan (in thousand UA)
Sources Estimate at Appraisal ActualF.E. L.C. Total F.E. L.C. Total
ADF 6 926 - 6 926 6 426 6 426NTF 7 000 7 000 6 717 6 717OPT - 1 561 1 561 1 637 1 637Total 13 926 1 561 15 487 13 143 1 637 14 780
8. Effective Date of First Disbursement : 13 October 1992
9. Effective Date of Last Disbursement : 6 January 1998
10. Commencement of Project Activities : 22 July 1992
11. Date of Completion of Project Activities : December 1998
12. Performance Indicators1. Cost Underrun : -4.5 %2 Time Overrun : 140 % (5 yr. on 3 yr. and 5 months)
Slippage on Loan Effectiveness : 1 year and 7 monthsSlippage on the Completion Date : 5 yearsSlippage on the Deadline forthe Last Disbursement : 4 yearsNumber of Extensions of the Deadline forthe Last Disbursement : 3
3. Project Implementation Status : completed4. Institutional Performance : partially satisfactory5. Engineering Consultant’s Performance : satisfactory6. Contractors’ Performance : partially satisfactory
Apprais. RAP7. Financial Internal Rate of Return : 0.27 % 27%

vi
13. Missions
Number ofPersons
Composition Staff/weeks
Appraisal 2 1 telecomm engineer1 financial analyst
4
Reappraisal 1 1 telecomm engineer 1.5Supervision 1 1 telecomm engineer 2
1 1 telecomm engineer 21 1 telecomm engineer 21 1 telecomm engineer 2
Completion 3 1 telecomm engineer1 electrical engineer1 financial analyst
4
Total 10 17.5
14. Project Disbursement Schedule (in thousand UA)
Source ofFinancing
Year Total1991 1992 1993 1994 1995 1996 1997 1998
EstimatedatAppraisal
ADF 3 953 2 479 494 6 926NTF 2 045 4 247 708 7 000OPT 397 911 253 1 561Total 6 395 7 637 1 455 15 487% 41 48 9 100
Actual ADF 711 1 110 1 959 1 601 856 189 6 426NTF 2 544 625 1 088 1 555 845 60 6 717OPT 327 246 164 409 264 227 1 637TOTAL 711 3 981 2 830 2 853 2 820 1 298 287 14 780
% 5 27 19 19 19 9 2 100
15. Contractors/Suppliers (ref. Annex 14)

vii
Retrospective Project MatrixPrepared by: D. Nikiema, OCOD.3 and H.R. Heeroo, OCDW.6
Hierarchy of Objectives (HO) Objectively Verifiable Indicators (OVI) Means of Verification (MOV) Important Assumptions/Risks
Sector Goal Impact on Super Goal
1 To improve the efficiency andprofitability of the country’sdifferent economic operators
Annual 5% increase in GDP.1.1 Report of the Ministry of the Economy.
Project Objectives Impact on Sector Goal
1 To meet additional demand in PortoNovo.
1.1 Connection of an additional 3090 subscribers in 1995 1.1 OPT Annual Activity Report. 1 Enhanced telecommunications will improve theefficiency of the country’s economy.
2 To build OPT’s institutional capacity 2.1 Reduction in the number of employees per 1000 lines from 106 in1989 to 28 in 1996.
2.1 OPT Annual Activity Report
3 To help to improve OPT’s financialsituation.
3.1 Improvement in OPT’s management ratios by 1995 as follows:working : 0.48operating : 0.89LMT debt: 1.31Liquidity : 1.37
3.2 Rate of return on fixed assets exceeds 15% as from 1997
3.1 and 3.2
OPT’s operating accounts and balance sheets.
4 To improve the quality of services 4.1 100 % of faults recorded in 5 days as from 1995. 4.1 OPT’s Annual Activity Report
Outputs Impact on Project Objective
1 Porto Novo network rehabilitated 1.1 18 km of clad ducts, 45 km of light ducts and 127 splicechambers built.
1.1 Periodic Activity Reports andSupervision Missions.
1 OPT shall remain a competent operator in thetelecommunications sector
1.2 17 subdistribution cupboards and 418 concentration pointsinstalled.
1.2 Periodic Activity Reports andSupervision Missions.
2 The project installations shall be well maintainedand regularly updated in line with technical progress.
1.3 2800 transmission pairs and 13000 distribution output pairs. 1.3 Periodic Activity Reports andSupervision Missions.
3. The staff trained will be motivated and continue towork for OPT.
2 Training carried out 2.1 Factory training of 12 works engineers for 2 months. 2.1 Periodic Activity Reports.
2.2 On-site training of 12 works engineers and 16 supervisory stafffor 3 months.
2.2 Periodic Activity Reports.
2.3 Radio relay station school set up.
2.4 7 experts from the engineering consultant’s office recruited toassist the Training Centre.
2.3 Periodic Activity Reports andSupervision Missions.
2.4 Periodic Activity Reports.
3 Works supervision carried out byengineering consultants and OPTaccounts audited.
3.1 Experts of the firm of engineering consultants in the field for thesupervision of the transmission component; receipt vouchers.
3.1 Periodic Activity Reports.

viii
Retrospective Project MatrixPrepared by: D. Nikiema, OCOD.3 and H.R. Heeroo, OCDW.6
Hierarchy of Objectives (HO) Objectively Verifiable Indicators (OVI) Means of Verification (MOV) Important Assumptions/Risks
3.2 Audit Firms recruited to carry out the audit of OPT’s accountsfor the 1989, 1990 and 1991 fiscal years and to carry out thefinancial and accounting and physical audit of the ADB project.
3.2 Periodic Activity Reports.
4 Project Unit Operational. 4.1 Office equipment 3 light vehicles made available to themanagement unit of the transmission component.
4.1 Periodic activity reports and supervisionmissions.
5 Transmission equipment installedand operational.
5.1 Procurement and installation of equipment:
- digital radio relay systems for 19 new routes;
5.1 Periodic Activity Reports andSupervision Missions.
Activities Impact on Outputs
1.1 Procure equipment and implementworks.
1.2 Recruit the engineering consultancyfirm.
1.3 Recruit the engineering consultancyand audit firms.
1.4 Procure the office equipment andvehicles.
1.5 Procure goods and services.
Costs (in thousand UA)F.E. L.C. Total
Porto Novo Networks 4679 335 5014Training 1619 465 2084Engineering Consultants 53 42 95Project Management Unit 75 0 75Transmission 6717 795 7512Total 13143 1637 14780
Financing Plan (in thousand UA)F.E. L.C. Total
ADF 6426 - 6426NTF 6717 - 6717OPT 1637 1637
Total 13143 1637 14780
1.1 Borrower’s Completion Report
1.2 Bank’s Completion Report
1. Availability of counterpart funds.
2. Project completed in conformity with the plannedschedule and the established financing plan.
3. Executing Agency capable of coordinating theimplementation units managing the different projectcomponents.

1
1 INTRODUCTION
1.1 Socioeconomic Background at Appraisal
1.1.1 When the project was appraised in 1988, economic growth in Benin was negative. Overthe 1983-1988 period, GDP had declined by an annual average of 0.7%. This trend was affectedby many global and sectoral fluctuations stemming mainly from the effects of rainfall on therural sector, which accounts for approximately 48% of GDP.
1.1.2 To address the situation, the Authorities negotiated several structural adjustmentprogrammes with donors which led to the privatization and winding down of about one hundredpublic enterprises, the restructuring of an overstaffed civil service with subsequent job losses.Since 1990, the country has focused on a liberal economic policy characterized by Statedisengagement from productive sectors in favour of the private sector. The upturn in economicgrowth was the salient feature as from that year; indeed, the average GDP growth rate over the1991-1997 period was 4.6%. Against that background, the Government decided, in 1994, toreform the telecommunications sector to avoid marginalizing OPT in the face of keeninternational competition in the sector.
1.2 Technical Background at Appraisal
1.2.1 At the time of project appraisal, the national telecommunications network was facedwith serious problems, namely: saturation, overloading and the under-sizing of sometelephone exchanges; the saturation of local networks; outmoded technology of switchingfacilities.
1.2.2 63% of demand was met, while unmet expressed demand was 7500. With theadopted growth rate of 6.1%, it was expected that 28112 main lines would be connectedcountry-wide in 1998. The staff productivity index of 108 employees per 1000 main lineswas significantly above the ITU average for Africa of 60 employees per 1000 lines. Theproject was appraised against this background.
1.3 Bank Group Operations in the Telecommunications Sector.
To date, the three Bank Group operations in the Telecommunications Sector in Beninrepresent total commitments of UA 25.338 million, comprising UA 18.338 million (72.37%)from ADF resources and UA 7.00 million (27.63 %) from NTF. The said operations are: (i)the National Maintenance Improvement Plan (NMIP) is completed and the completion reportprepared; this project made it possible to establish standards and practices for themaintenance of the network; (ii) the feasibility study on cellular radiotelephony and ruralcommunications is also completed; it permitted the establishment of a mobile cellulartelephony system and the restructuring of rural telecommunications; and (iii) the project,which is the subject of this completion report, constitutes the Bank Group’s third operation inthe sector.
1.4 Project Location
The project is located in the following provinces: Atlantique, Mono, Oueme and Zou,but impacts on the entire national network.
2 PROJECT OBJECTIVE AND FORMULATION

2
2.1 Sector Goal
2.1.1 The project sector goal was to improve the efficiency and profitability of the differentbusiness concerns in the country by reducing the management costs of enterprises throughforeign exchange savings from the use of telecommunications in preference to other means ofcommunications.
2.1.2 To attain that goal, Benin prepared a Telecommunications Master Plan (1985-2005),accompanied by a short-term plan for the 1988-1993 period. This short-term plan focuses onurgent needs. The Telecommunications Development Project was in keeping with theemergency measures of the short-term plan.
2.2 Project Objective
The project objective was to provide the country with the means of moderntelecommunications vital for its economic and social development in order to:
i) meet demand in the region of Porto Novo and its vicinity and facilitate accessto the national network by high quality links;
ii) build OPT’s institutional capacity through the establishment of a trainingstructure;
iii) help to improve OPT’s financial situation; and
iv) improve the quality of service and meet additional demand until 1995.
2.3 Project Description
2.3.1 As defined in the appraisal report, the project comprised the establishment of the localPorto Novo network, the procurement of transmission equipment and the rehabilitation of theTelecommunications Vocational Training Centre.
2.3.2 It comprised the following five components:
A Porto Novo Network: rehabilitation of the Porto Novo local networks.
B Training: the training of 12 works engineers, the recruitment of a transmissionexpert for the training of 28 technicians, the acquisition of a radio relay stationschool and strengthening of the Cotonou Telecommunications VocationalTraining Centre.
C Engineering Consultants : supervision of the “Transmission” component andthe recruitment of a firm of external auditors.
D Project Management Unit: procurement of 3 light vehicles and officeequipment for the operation of the Project Management Unit.
E Transmission : procurement and installation of transmission equipment
2.4 Project Formulation
Origin

3
2.4.1 Alongside the preparation of the National Maintenance Improvement Plan (NMIP), thesubject of the Bank’s first operation in the country, Benin with the support of UNDP, establisheda plan for the development of telecommunications over a twenty-year period (1986-2005). Ameeting of donors, including ADB, was convened in November 1987 to discuss the plan andagree on a common strategy for the development of the telecommunications sector.
2.4.2 The deliberations of the meeting led to the implementation of a short-term plan (1988-1993) which took into consideration the country’s economic climate, OPT’s financial situationand the financial and management performances required. The volume of investments for thatprogramme was fixed at US $60 million and primarily covered the construction of digitalexchanges in Cotonou and Porto Novo, local networks and the required transmission equipment,rural telephony, as well as support measures for the restructuring of OPT in respect of all aspectsof personnel, financial and commercial management. Details of the costs of the programme areset out in Annex 2.
2.4.3 Following a request from the Government to the Bank Group for the financing of theproject, a mission visited Benin in March/April 1988, and the project was adopted in agreementwith the Government.
2.4.4 The engineering study for the local networks component was conducted on World Bankfunding. The Training Centre component was based on a study conducted in 1985 by theTechnical Cooperation Department of the ITU during the preparation of theTelecommunications Master Plan (1986-2005). The engineering study for the transmissioncomponent was conducted by OPT experts.
Preparation, Appraisal, Negotiation and Approval
2.4.5 On the basis of available studies and the Telecommunications Master Plan prepared byITU experts, the Bank appraised the project in March/April 1988. Owing to difficulties infinalizing the financing plan, a reappraisal mission visited Benin in January 1990.
2.4.6 The negotiations took place on 1 August 1988 in Abidjan but, owing to sanctions on thecountry, the loans were renegotiated on 22 and 23 March 1990, following the reappraisalmission. These negotiations did not affect the substance of the conclusions of the appraisalmission or the conditions precedent. At its meeting of 18 April 1990, the Board of Directorsapproved the two ADF (UA 6.926 million) and NTF (UA 7.00 million) loans.
3 PROJECT IMPLEMENTATION
3.1 Effectiveness and Start Up
3.1.1 The NTF Loan Agreement was signed on 30 May 1990, whereas the ADF LoanAgreement was signed on 30 November 1990. Problems concerning ADF V commitmentcapacity resulted in the delay between the signings of the two Loan Agreements. The NTFLoan became effective on 30 June 1992 and the ADF loan on 14 July 1992. The loan conditionsare set out in Annex 3.
3.1.2 The conditions precedent to the first disbursement were fulfilled and the loans becameeffective 25 months following the signing of the NTF Loan and 20 months following the signingof the ADF Loan Agreement. This slippage on loan effectiveness impacted considerably on theproject implementation period and was due to the difficulties encountered by the Authorities infulfilling the conditions, and, in particular, to the sanctions imposed on the country during thesame period. On completion, condition (ii) concerning the establishment of three separate unitsof the components and a coordination unit does not appear to have been relevant. This unwieldy

4
structure never functioned owing, among others, to the failure to clearly define theresponsibilities (failure to provide terms of reference for the units) of each unit.
3.1.3 The first bidding documents for Bank-financed procurements were approved inNovember 1990 and the first contracts signed in 1992, i.e. 19 months after the signing of theLoan Agreement.
3.2 Modifications
With the exception of the revisions of the lists of goods and services which made itpossible to procure additional equipment, none of the project’s components were modified.Thus, in May 1993, the Bank approved the procurement of 150 cardphones, 50 coin-box setsand 200 telephone booths. The Bank also approved the procurement in 1994 of transmissionequipment for the establishment of supplementary links.
3.3 Implementation Schedule
3.3.1 The project, which was scheduled for completion in May 1993, was only completed inNovember 1998. The slippage on start up was due to the time taken by the Government tofulfill the conditions precedent to loan effectiveness, sanctions on the country and problemsrelating to the availability of ADF V resources. During implementation, the project fell furtherbehind schedule, mainly as a result of administrative delays within OPT concerning theapplication of the rules of procedure for the procurement of goods and services, the non-operation of the Project Management Units, OPT’s failure to apply penalty clauses and thoseconcerning the termination of disputed contracts. The works on component A (the Porto Novonetwork) started on 12 April 1992 and were completed on 31 January 1996. Component B(Training) was completed in October 1995. Component C (Engineering Consultants) wascompleted in September 1996. Component D (Project Unit) was completed in 1993.Component E (transmission) was completed in December 1998 with the commissioning of thecoastal station over two years behind schedule because of the need for a second round ofinternational competitive bidding and delays in the commissioning of buildings and theprovision of electric power supply. A comparison between the estimated and actualimplementation schedules is presented in Annex 4.
3.3.2 It should be underscored that the time taken by the Bank to approve certain contracts hascontributed to the slippage on project implementation.
3.4 Reporting
3.4.1 Only two (2) quarterly activity reports were prepared by OPT in 1996 and 1997. Despitemany reminders from the Bank, OPT did not submit any further quarterly activity report on theproject. This situation arose because the Project Management Units were not operational. Thisshortcoming was offset by the regular submission of consultants’ reports on the Porto Novonetworks and the transmission equipment.
3.4.2 In terms of quality, the reports submitted were clear and detailed and made it possible toeffectively monitor works status from the technical and disbursement standpoints, and to be keptinformed of problems which might arise, as well as of corrective measures.
3.4.3 The OPT audit reports were prepared by the consultants recruited under the project.Despite many reminders by the Bank, OPT only produced a single audit report on the projectaccounts. This was obtained following the suspension by the Bank of loan disbursements for theproject.

5
3.5 Procurement
3.5.1 Goods and services were procured in conformity with the Bank’s procedures and theprovisions of the Appraisal Report and the Loan Agreement. In general, internationalcompetitive bidding was used, except for buildings, energy and refrigeration equipment,earthing materials, vehicles and office equipment, for which local shopping was organized.
3.5.2 Bid evaluation and the recommendations for the award of contracts raised no majorobjections on the part of ADF. Because of the limited number of suppliers submitting bids andthe shortcomings of the only bid received, the procurement of equipment for the coastal stationwas made following a second round of international shopping, which was conclusive.
3.6 Cost, Sources of Financing and Disbursements
Project Cost
3.6.1 At Appraisal, the project cost, net of taxes, was estimated at UA 15.487 million inforeign exchange, including UA 1.561 million in local currency. The comparison between theestimated and actual costs is presented in Annex 5. The total project cost of UA 14.780 millionwas below the estimate by UA 0.703 million, i.e. 4.5%. Total Bank commitments were UA13.143 million compared with an estimated UA 13.922 million, which led to an unspent balanceof UA 0.779 million, which would be cancelled. Commitments on the local currency part wereslightly above the estimate owing to slippage on project implementation and the change in theparity of the CFA franc. The overrun was UA 0.076 million.
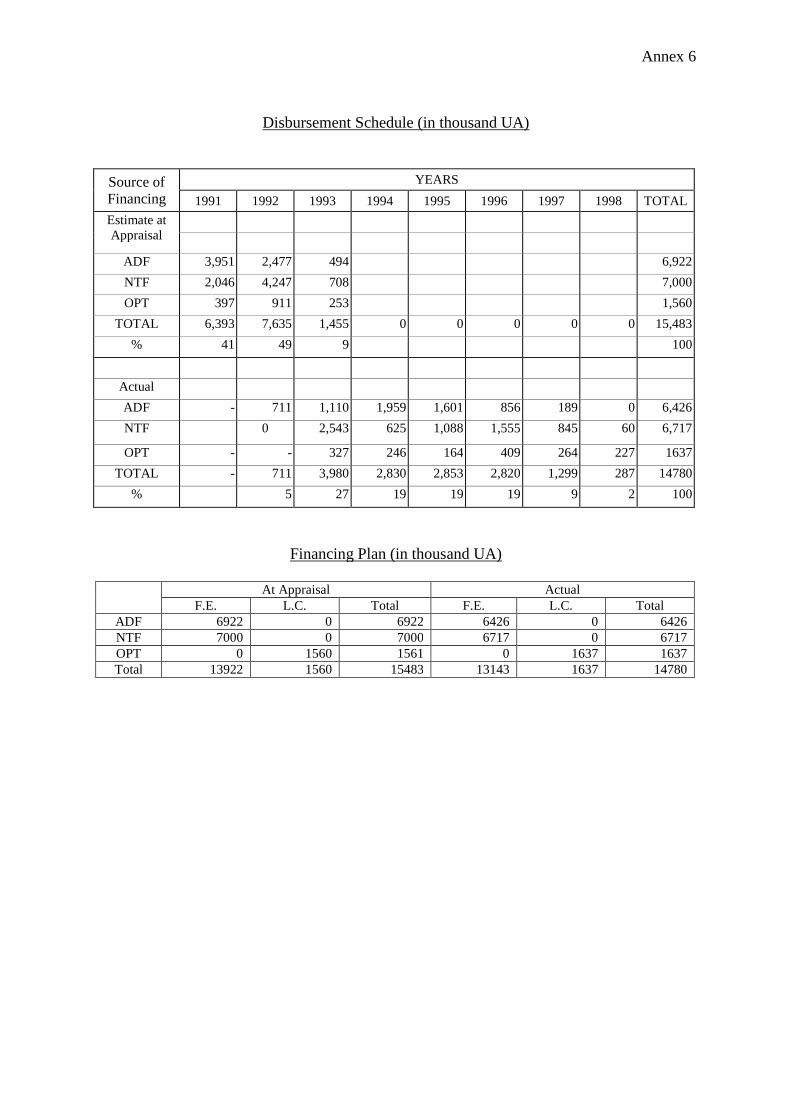
Disbursements
3.6.2 The disbursement schedule at appraisal compared with that of actual expenditure ispresented in Annex 6. While there was slippage of one year on the first disbursements, it shouldbe noted that, throughout the project period, the other disbursements were only released slowly.Indeed, the project should have been implemented over a three-year period. It took over sixyears. The delay was due to the length of time taken to approve modifications to somecomponents and non-compliance with deadlines by some suppliers.
Sources of Financing
3.6.3 The actual financing plan, compared with the estimate at appraisal, is presented inAnnex 6. On completion, the Bank had financed the project to the tune of UA 13.143 million(excluding unspent balances to be cancelled) compared with UA 13.926 million at appraisal.The different modifications made at the Borrower’s request did not lead to any overrun on thefunding of the project since they were contained within the initial estimates. The Bank’scontribution to the project financing was 89% of the total cost compared with an estimate of90%. OPT’s participation was 11% compared with an estimate of 10%. In relation to thetotal project cost the implementation rate was 95% for all sources of financing. It should benoted that the devaluation of the CFA franc in 1994 had little impact on the project cost for,at the time, the major contracts had been already signed and made out in foreign exchange.
4 PROJECT OPERATING PERFORMANCE AND OPERATING RESULTS
4.1 Overall Assessment
4.1.1 As mentioned in point 4.1.3, the conditions precedent to loan effectiveness were fulfilledby the Borrower within 19 months of the signing of the Loan Agreement. Nevertheless, the

6
project physical components were implemented within the deadlines and without any foreignexchange cost overrun, but with a local currency overrun..
4.1.2 The equipment installed is operating satisfactorily and enables OPT to attain its growthtargets. The training centre is well equipped for the continuing training of OPT staff.
4.2 Operating Results
4.2.1 The Telecommunications Development Programme has provided Benin with a moderntelecommunications infrastructure and has enabled OPT to meet unmet expressed demand whileimproving the quality of service provided to subscribers. At appraisal, it was estimated that28112 main lines (ML) would be connected country-wide in 1998. On completion, this figurewas 38354. For Porto Novo it was noted that, instead of the estimated 5749 MLs, 5064 hadbeen connected by 1998. The saturation of the network explains this situation, for unmetexpressed demand in Porto Novo is significant (1065 applications pending as of 31 December1998). There was an improvement in the staff productivity index from 108 employees/1000 MLat appraisal to 28 employees/1000 ML as of 31 December 1998. The principal productionindicators are detailed in Annex 7.
4.2.2 The rural telephony installations in the provinces of Atlantique and Mono regularlybreak down owing to atmospheric disturbances. Research should, therefore, be conducted todetermine the causes of these faults. The one plus one configuration of links by the addition of aradio protection channel and the establishment of an adequate spare parts stock managementstructure would make it possible to considerably reduce the inconveniences to subscriberscaused by outages. The coastal station has commenced commercial operations since December1998 and traffic is steadily rising.
Institutional Performance
4.3 Organization and Management of the Executing Agency
4.3.1 The legal and institutional framework of the Office des Postes et Télécommunications(OPT) has considerably evolved since appraisal. The institutional framework was modified byOrders in Council no 89-156 and no 89-157 of 25 April 1989 concerning respectively approvalof the new Charter of OPT and establishing its new equity capital as CFA.F 7850 million (1991)compared with CFA.F 5200 million in 1990 on the one hand, and a “Performance Contract”which should lead to the financial and organizational restructuring of OPT with donor support.The changes thus effected and the new legal framework within which the Executing Agencywill now evolve, have turned it into a commercial public enterprise which should be managed asa private company. Since 1991, OPT has remained under the supervision of the Ministry ofCulture and Telecommunications, which acts as the chair of the Board of Directors comprisingseven members appointed by Order in Council.
4.3.2 The Government, in a P&T sectoral policy declaration, adopted Order in Council no 94-361 of 4 November 1994 as the basis for its reform of the sector. This reform was tocomprise (i) the establishment of a new regulatory framework; (ii) the splitting of OPT into twoseparate bodies, telecommunications and postal and financial postal services; and iii)liberalization of the telecommunications sector. On World Bank financing, a consultant(DETECON) conducted studies concerning implementation of the reform.
4.3.3 Against this background, and by Order in Council n° 97-516 of 17 October 1997, aSteering Committee on the Reform of the Posts and Telecommunications Sector wasestablished. Its objective was to; i) consider and assess the conclusions and recommendations of

7
DETECON’s work; (ii) specify and endorse the objectives of the reform of the postal andtelecommunications services; (iii) endorse bills prepared by the German consulting firm,DETECON, on the basis of recommendations on the projected development of the sector; iv)make recommendations on the implementation schedule of the sectoral reform and on therequired support measures. This Committee prepared a “Strategy Note” in which the objectivesunderlying the telecommunications reform are analyzed. According to the schedule in this note,the regulatory body was expected to be established by July 1999 and OPT split into two bodiesby December 1999.
4.3.4 Prior to the establishment of the regulatory framework for the coordination of all themeasures of the reform programme, the Government recently authorized a company in additionto the usual company (OPT), to operate the mobile phone network. This authorization seemspremature and could upset the interplay of competition and undermine the authority of the futureregulatory body.
4.3.5 The OPT organization chart on completion in Annex 8 comprises five directoratescompared with two at appraisal. A Sub-Directorate for Planning and Designs was establishedwithin it, under the responsibility of the Director for Telecommunications. Under theresponsibility of the same Director are three other independent structures dealing with projectimplementation. They are the Sub-Directorate for the Coordination of RuralTelecommunications Projects (CPT), the Rural Telecommunications Division (PTR) and theDivision for the Project concerning the Modernization and Extension of UrbanTelecommunications Networks (MERUT). This structure is too cumbersome and cannot dealwith all the problems raised in a consistent manner. In the organization chart being prepared,OPT will have to consider the possibility of accommodating in a single structure all the partiesoperating in the project cycle.
4.4 Staff Training and Retraining
4.4.1 The Staff Rules were also modified under this new legal framework for OPT. In fact,the staff, originally governed by the rules for permanent officials of the State, now have theirown collective labour agreement which was signed on 17 August 1995 between the GeneralDirectorate and the Trade Union (SYNAPOSTEL) representing OPT staff.
4.4.2 As at 31 December 1998, OPT's telecommunications services have a staff of 1267comprising 142 managerial staff, 87 supervisory staff and 850 operators. At appraisal, therewere 1274 employees broken down as follows: 93 managerial staff, 128 supervisory staff and1053 operators. The productivity index improved considerably as a result of the increase andmodernization of the equipment and a policy of zero recruitment. In fact, the number ofemployees per 1000 lines fell from 108 in 1989 to 28 in 1998, and OPT’s target for 2000 is 20.The personnel receives technical, computer and financial training. The project made it possibleto train trainers and equip the vocational training centre accordingly.
4.4.3 The staff renewal programme begun in 1998 by the OPT authorities will have to focuson the recruitment of young engineers capable of monitoring the trend observed in thetelecommunications and computer sector on the one hand, and of taking over in 2004 whenmany retirements are scheduled.
4.5 Accounting and Verification of Accounts
4.5.1 OPT’s accounts are prepared by the Financial and Accounting Directorate in conformitywith Benin’s existing accounting plan. The SYSCOA (West African Accounting System) planhas been in force since January 1998, and is being extended to the rest of the country. The

8
accounting year coincides with the calendar year. This Directorate also prepares the accounts ofPostal Services Directorate and the Caisse Nationale d’Epargne.
4.5.2 The accounts are systematically verified at two levels: i) internally through theManagement Control and Internal Audit Directorate; ii) externally, by two external auditors withthree year terms of office. Under this project, the 1987 to 1994 accounts were audited by anexternal audit firm. A special audit of the accounts of the different projects was conducted by anexternal firm in 1996. This audit noted shortcomings related to the archiving of documents,delays in the settlement of payment requests, discrepancies between the payments effected byADF and those requested by OPT, most of which have been settled.
4.5.3 The general computerization programme of OPT, which was in operation at the time ofappraisal has not changed. The processing equipment is obsolete (over 10 years old). It shouldbe replaced in order to improve the processing of information with a view to increasing thedifferent outputs. In this context, the OPT authorities recently decided to: i) make the ComputerServices Division into a Directorate, under the direct supervision of the General Directorate; ii)beef up its personnel both qualitatively and quantitatively; and iii) schedule the procurement ofnew computer software and hardware before the end of the current financial year.
4.6 Billing and Collection.
4.6.1 The fully computerized billing is centralized at OPT’s headquarters in Cotonou. It isstill on a two monthly basis. All the centres are required to submit subscribers’ consumption tothe headquarters for the preparation of bills which are subsequently returned to them. Whilebilling and distribution times have improved since appraisal, they were, however, affected overthe period by faults on computers and power outages in early 1998.
4.6.2 OPT now enjoys the same privileges as the Public Treasury in respect of debt collection,namely Act N 90-026 of 17/09/90 which confers upon it the right to take action against certaininsolvent private sector debtors. Seizure of immovable property and vehicles is carried out bybailiffs on its behalf, in conformity with the accelerated procedure defined under this Act. Thishas enabled it to improve its collection rate which, while below the estimated 93 % for theperiod, is approximately 90%.
4.7 Tariffs
Domestic tariffs are fixed by the Board of Directors on the recommendation of theManaging Director. International tariffs are fixed by agreements between the differentTelecommunications Authorities. At appraisal, the base charge (BC) was CFA.F 50, excludingVAT. It remained unchanged until the change in the parity of the CFA franc. Increases of 20%and 10% , i.e. 60 and 66 CFA francs occurred in July 1994 and January 1995. On 1 May 1995,OPT decided to reduce international tariffs by 20%, followed in July 1996 by a modulated tarifftime-slot (1 P.M. to 3 P.M.) with reductions of between 20 to 50% depending on the time of dayand day of the week.
4.8 The Performance Contract
The first performance contract linking OPT to the State expired on 31/12/91. Thiscontract focused in particular on the settlement of reciprocal commitments of both parties to thecontract. This enabled OPT to improve its collection targets with regard to the Administrationas a result of compensatory payments made in 1991; the net balance of the operation as at31/12/91 was in favour of the State. In all, OPT’s performance under the first contract led to a

9
second performance contract which took into consideration developments within the Board. Itwas approved by Order in Council no. 93-9 of 21/01/93.
4.9 Performance of the Borrower
The involvement of the Borrower in this project concerned the conditions precedent toloan effectiveness which were fulfilled after 19 months from the date of signature of the LoanAgreement. It may be noted that, with respect to the performance contract between the Stateand OPT, the Government is up to date, and sometimes early, with the payment of itstelecommunications consumption. Despite the slippage on loan effectiveness, it may be saidthat the Borrower’s performance was satisfactory.
4.10 Performance of the Executing Agency
4.10.1 With regard to project management, at appraisal it was planned to establish three unitsfor the “Local Porto Novo Networks”, “ Training” and “ Transmission” components. Thesethree sectoral units were to be headed by a World Bank-financed Coordination Unit. Thoughestablished, none of these units is operational, despite reminders from the Bank’s differentsupervision missions. Consequently, no OPT structure has complete information on the project.Project implementation was thus affected by an attenuation of responsibility. This representednon-compliance with the conditions of loan effectiveness. The failure to apply the provisions ofcontracts, to produce quarterly project activity reports, as well as the scattering of information onthe projects are the direct consequences of the situation.
4.10.2 This institutional shortcoming noted during the Bank’s first operation (NMIP) haspersisted and is due to the turnover in staff following implementation of this second project, thehigh concentration of decision-making powers and the failure to motivate the personnelconcerned.
4.10.3 In general, OPT effectively monitored the financial performance of the 25 projectcontracts but lacked rigour in the management of some suppliers’ contracts. Contract periodswere, therefore, exceeded without the application of penalty clauses or termination of contract.OPT’s performance is considered partially satisfactory.
4.11 Performance of Consultants and Suppliers
4.11.1 The performance of the engineering consultants is considered satisfactory. They made aconsiderable contribution to works supervision. The audit firms submitted all their reportswithin the allotted time frames.
4.11.2 On the whole, the performance of the suppliers is satisfactory. All the suppliers involvedin implementing the project performed their contracts within the given time frames or onlyslightly behind schedule with the exception of one company (Sindus Equip), which not onlyexceeded the contractual periods, but failed to dispel the reservations expressed at the time ofprovisional acceptance. This impacted severely on the performance of the other contracts. Thecompany’s performance is considered unsatisfactory. It should be emphasized that this samecompany’s performance was mediocre in respect of contracts awarded to it under the NMIPproject.
FINANCIAL PERFORMANCE
4.12 Comparative Operating Trend.

10
4.12.1 A review of the comparative statements from 1992 to 1997 in Annex 9 shows that theestimated operating accounts prepared at appraisal were, on the whole, attained, and sometimesexceeded, with regard to revenue, operating results and net profits. Apart from a poorperformance (-3%) in 1992 with regard to actual revenue, the actual figures of the other accountsare above the estimates at appraisal. The average increase was 25% over the period. Net profits,compared with the estimates for the same period, quadrupled in 1992 but were down by 18% in1994. Furthermore, losses of CFA.F 1637 million in 1993 were due to the high rate of riskprovisioning following the change in parity of the CFA franc in 1994 (since the 1993 balancesheet was presented in 1994). These figures rose steadily from 1994-1997 to a level of CFA.F7849 million compared with an estimated CFA.F 6624 million. On average they represented18% of revenue from 1994-1997, which constitutes a good performance.
4.12.2 In addition to appropriations for amortization and provisions, the other costs were, on thewhole, contained within the objectives defined at appraisal. Personnel costs were relatively wellcontrolled from 1992 to 1993, before rising as from 1994 following the release of promotionback pay, the readjustment in line with the change in parity of the CFA franc and the payment oftraining scholarships for managerial staff in 1994. Financial costs were successfully controlled.Their increase in 1994 for reasons similar to those already mentioned (change in the parity of theCFA franc), was offset by an increase in interest income and funds from INTELSAT.

11
4.13 Analysis of the Financial Structure
4.13.1 OPT’s balance sheets (Annex 10) compared with the estimates at appraisal show afavourable trend of the accounts, reflected in the consolidation of all the financial parameters.The average liquidity ratio is approximately 1.50%, which indicates steady working capital anda comfortable level of liquidity. On the whole, OPT’s cash position situation is more thanadequate.
4.13.2 The return on fixed assets has constantly remained above the estimates at appraisal forall the financial years, with the exception of 1997. There was an irregular variation in the rate ofreturn on fixed assets, with an exceptional drop in 1993 at the same time as the losses made inthat year, automatically reducing the cash flow. This rate stabilized from 1996 and attained 23%in 1997 which was a noteworthy performance above the Bank’s recommended average of 10%in the case of public service tariffing. On the other hand, the debt ratio rose steadily form 1992to 1995 before settling at 69% in 1996. The ratio peaked at 71% (1994 and 1995) following theimpact of devaluation.
4.14 Project Financial Rate of Return.
4.14.1 The financial rate of return was calculated on the basis of the additional cash flowgenerated by new investments over a 15-year period. (Annex 11). On completion, the projectfinancial rate of return was 27%, which represents a good performance compared with a rate of20.27% at the time of appraisal.
ECONOMIC PERFORMANCE
4.14.2 Several economic benefits have accrued from the project. It provided modern reliableand efficient means of communication which were essential to the country’s economic recovery,and improved productivity of firms. The development of rural telephony, in particular, reducedthe travel requirements of subscribers and thus led to savings in the transport sector (fuelsavings, fewer road accidents, slower depreciation of privately-owned vehicles, etc). Theimproved flow of information in the project area has facilitated commercial transactions andenabled the Administration to coordinate its activities with the central authorities.
4.14.3 The project enabled OPT to increase its turnover and profits. While exempt from taxpayments, the OPT often intervenes in collective projects from its own resources and contributesto the operation of the State budget.
4.14.4 The introduction of new means of mobile maritime telecommunications could in timecompete with the services provided by the coastal station. However, through the commercialtraffic it will ensure, the coastal station will enable Benin to comply with the internationalregulations on the safety of shipping and the protection of human lives off the country’s coast.
5 SOCIAL AND ENVIRONMENTAL IMPACTS
5.1 Social Impact
5.1.1 The social benefits of the project include the strengthening of ties and contacts betweenfamily members living outside the area, a sense of security, time savings with regard tocommercial activities, and ease of access to all types of economic, administrative and politicalinformation. Overall, the project has made it possible to make up the shortcomings of the roadssector.

12
5.1.2 Telephone facilities have made it easier for women and children to contact primary andsecondary health care centres. It may also be emphasized that their use for family reasonsconstitutes an element of satisfaction and security for this most vulnerable segment of thepopulation.
5.2 Environmental Impact
5.2.1 The project was classified in Category 3 and has little negative impact on theenvironment. The cables were buried, the rural telecommunications equipment installed inexisting buildings or in shelters, and the erection of pylons on new sites required slightdeforestation which has been offset by tree planting. In addition, OPT has completed thefencing of the sites and there is no risk of accidents to animals and human beings.
5.2.2 The modernization of the Porto Novo local networks required civil works. The piping,whether clad or lightened, was buried and the soil compacted. The road crossings were remadein keeping with good practices. These works did not cause any erosion.
6 PROJECT SUSTAINABILITY
6.1 OPT staff have been trained, either in the context of the different contracts awarded orunder the project training component. This know-how acquired has made it possible toensure sound maintenance of the installations. The Training Centre’s continuous trainingprogram is rich and makes it possible to periodically enhance the technical skills of staff.
6.2 Furthermore, OPT’s annual budget provides for the necessary appropriations for theprocurement of spare parts for the maintenance of the facilities. The fleet of maintenancevehicles has just been renewed, thus guaranteeing rapid intervention to detect faults.Furthermore, the necessary resources were made available under the restructuring to ensure aregular supply of spare parts for the maintenance of the facilities.
6.3 The new means of telecommunications (mobile land-based and maritime satellitelinks) will, in the medium term, compete with the operation of the coastal station. OPT hasalready taken the necessary steps to solve energy-related problems which have, in the past,caused damage to the equipment of the coastal station.
7 PERFORMANCE OF THE BANK
7.1 The Bank responded to all the Borrower’s requests. In its completion report, theExecuting Agency mentioned the length of time taken by the Bank to approve the differentstages of the contract award procedure.
7.2 It should be noted that the Bank carried out four (4) supervision and two (2) portfolioreview missions during the 8 years of project implementation. This was insufficient given theoverall project implementation period, but would be satisfactory if the periods when the countrywas under sanction were not included. The absence of a financial analyst and a disbursementofficer in the composition of the supervision missions meant that it was not possible to cover allthe aspects of the project.
7.3 It should, however, be underlined that, owing to rapidly rising demand, the installedcapacity of the Porto Novo networks is already below requirements. The Bank did notanticipate this demand and recommend the procurement of the necessary additional equipment.The Bank’s performance is considered as being partially satisfactory. Nor was it able to foreseethe major structural changes in the sector.

13
8 OVERALL PERFORMANCE AND RATING
8.1 The detailed ratings tables of the different project performances are set out in Annex12 of this report.
8.2 The implementation performance has been assessed as satisfactory overall, despitethe slippage on implementation and inadequate supervision. This positive outcome is theresult of strict adherence to the cost schedule and the satisfactory operation of the projectfacilities.
8.3 The overall assessment of the Bank’s performance is considered satisfactory. TheBank’s shortcomings in respect of supervision were more than offset by the soundperformance at identification and at appraisal.
8.4 A satisfactory rating is awarded to the overall assessment of the project’s impact ondevelopment. Indeed the project is highly sustainable and has a satisfactory internal rate ofreturn. In addition, the relevance and attainment of the project objectives are confirmed.However, the institutional development as a result of the project is unsatisfactory.
9. CONCLUSIONS, LESSONS LEARNT AND RECOMMENDATIONS
9.1 Conclusions
The Benin Telecommunications Development Project, though completed 5 yearsbehind schedule, has made it possible to attain and exceed the objectives of somecomponents. In fact, this delay should be qualified, for most of the work was completed 3years behind schedule. The remaining activities concerned the coastal station, the equipmentfor which was procured following a second round of bidding owing to the poor performanceof a local contractor in delivering the buildings, as well as in supplying and installing thepower and refrigeration equipment. This project was a key element in the revitalization oftelecommunications in Benin.
9.2 Lessons Learnt
Several lessons can be drawn from this project:
Concerning Telecommunications Projects
9.2.1 The rapid technological progress in the telecommunications sector implies the timelyimplementation of projects. Indeed, the greater the slippage on implementation, the morelikely the equipment will be obsolete when it comes on stream.

14
9.2.2 The absence of project management units for this second Bank operation in the sector,considerably impeded the implementation of the project and constitutes an institutionalshortcoming which will have to be corrected if the Bank decides to intervene again in thesector.
Concerning Bank-financed Projects
9.2.3 Slippage on the fulfillment of the conditions precedent to loan effectiveness is one ofthe most serious causes of delay experienced by Bank–financed projects. It would, therefore,be useful were the Bank to attach greater importance to this phase of the project by fielding astart-up mission to the borrowers in the case of projects with difficulties related to thefulfillment of the conditions precedent.
9.2.4 The existence of a Project Implementation Unit is the best guarantee for the ongoingmonitoring of project activities, the sustainability of the experience acquired and the mosteffective transfer of know-how. In addition to increasing the number of supervision missionsthey should be beefed up to include the necessary expertise to cover all aspects of the project.
9.2.5 The objective application of the clauses of contracts will make it possible to limit thedelays and improve revenue. It will also compel contractors to honour their undertakings andnot to obtain contracts by playing on this factor.
9.3 Recommendations
To the Borrower
It is recommended to:
i) take the necessary measures to rapidly fulfill the conditions precedent toeffectiveness of the loans granted to it and to involve itself more closely inproject implementation;
ii) speed up the work of the Steering Committee on the Reform of the Sector andthe support measures, especially the regulatory framework; and
iii) confirm the effective establishment of the project implementation units.
To the Executing Agency
It is recommended to:
i) group together under a single structure activities relating to project planningdesigns and engineering. The adoption of this approach will improve theimplementation of projects, and retention of their memory in a single location;
ii) objectively apply the clauses of the contracts awarded to suppliers and, in future,exclude from bidding those which have displayed incompetence or have beenunable to deliver within the contractual periods;
iii) improve the management of spare parts for rural telephony links and seeksolutions which will make it possible to improve the availability of such links;and

15
iv) replace computer hardware and software with a view to improving dataprocessing.
To the Bank
It is recommended to:
i) organize training for staff of the project units on the Bank’s rules of procedurefor the procurement of goods and works, for the use of consultants anddisbursements;
ii) contribute to the rapid resolution of problems encountered by projects, byimproving its response time and by organizing more regular supervisionmissions of the projects financed by it;
iii) rapidly answer payment requests from the loan beneficiary, by sending to itcopies of the corresponding disbursement slips to enable it to keep its accountsup to date;
iv) beef up the composition of supervision missions to enable them to carry out acomprehensive review of all project implementation-related issues;
v) continue its support to the development of the telecommunications sector inBenin in order to attain its development objectives especially in rural areas.

Annex 1
REPUBLIC OF BENINTELECOMMUNICATIONS DEVELOPMENT PROJECT
This map has been drawn by the ADB Group exclusively for the use of the readers of the report to which it is attached. The names used and the bordersshown do not imply on the part of the Bank and its members any judgement concerning the legal status of a territory nor any approval or acceptance of itsborders.

Annex 2
PRIORITY INVESTMENT PROGRAMME (1988-1993)
I Programme Description
(a) extension and rehabilitation of the Cotonou and Porto Novo local networks to meetdemand until the year 2000;
(b) replacement and modernization of the automatic telephone exchanges in Cotonouand Porto Novo with digital equipment to meet demand until 1995;
(c) interconnection of Cotonou and Porto Novo switching equipment by optical fibrelinks;
(d) digitization of the transmission link between Cotonou and Porto Novo;(e) procurement of spare parts, vehicles and buildings;(f) establishment of rural telephony links;(g) technical assistance;(h) equipment and technical assistance for the OPT training centre
II Programme Cost (in million US $)
Local Currency Foreign Exchange Total
Local Networks 6.8 18.2 25.0Transmission 1.7 9.9 11.6Switching 1.9 7.7 9.0
Rural Telephony 0.3 1.5 1.8Institutional Support 0.5 3.7 4.2Training Centre 0.5 1.4 1.9Basic Total 11.7 41.8 53.5Physical Contingency 0.9 3.0 3.9Price Contingency 2.5 5.4 7.9Total 15.1 50.2 65.3
III Financing Plan (in million US$)
Source of Financing Local Currency FE Total
IDA 3.5 12.5 16.0CCCE 1.3 7.7 9.0ADB 16.0 16.0EIB 3.1 10.9 14.0CIDA 0.7 2.8 3.5FAC 0.3 0.3OPT 6.5 6.5Total 15.1 50.2 65.3

Annex 3
CONDITIONS PRECEDENT TO THE FIRST DISBURSEMENT AND OTHER CONDITIONS
A. Conditions Precedent to the First Disbursement
The conditions precedent to the first disbursement were undertakings by the Borrower to:
i) furnish proof that it has on-lent the loans to OPT at a rate equal to at least 7.50%,repayable over a period of twenty (20) years including a grace period of four (4) years.The draft onlending agreements shall be submitted to ADF and NTF for approval;
ii) furnish ADF and NTF with proof of the establishment of the overall projectcoordination unit and the three implementation units of the three components (network,transmission and training centre). The curricula vitae of the heads of these units shallbe submitted to ADF and NTF for approval; and
iii) provide NTF with a copy of the bidding documents and related procedure concerningthe procurement of goods and services.
B. Other conditions
The other conditions were as follows:
i) regularly transmit to ADF and NTF reports on the audit of OPT and the projectaccounts;
ii) submit to ADF and NTF quarterly progress reports on the projects financed by theWorld Bank, EIB and the CCCE;
iii) transmit to the Bank for approval, no later than 30 September 1991, the draftperformance contract for the 1992-1994 period; and
iv) transmit to the Bank for approval, no later than the 31 October of each year, OPT’sfinancial forecasts for the following year as well as any proposed tariff adjustments,enabling it to attain a return of at least 15% per year on its reevaluated fixed assets from1991 until the completion of the project.

Annex 4Page 1 of 2
Comparative Implementation Schedule
1990 1991 1992 1993 1994 1995 1996 1997 19981 2 3 4 1 2 3 4 1 2 3 3 1 2 3 4 1 2 3 4 1 2 3 4 1 2 3 4 1 2 3 4 1 2 3 4
Local Networks1 Preparation and Approval of
Bidding Documents
2 Signature of Loan Agreement
3 Issue of Invitations to Bid
4 Evaluation
5 Negotiation of Contract andApproval
6 Mobilization
7 Civil Works and Cabling
8 Connection
Training CentreStrengthening of the Centre

Annex 4Page 2 of 2
Comparative Implementation Schedule1990 1991 1992 1993 1994 1995 1996 1997 1998
1 2 3 4 1 2 3 4 1 2 3 4 1 2 3 4 1 2 3 4 1 2 3 4 1 2 3 4 1 2 3 4 1 2 3 4
Transmission1 Preparation of Bidding
Documents
2 Issue of Invitations to Bid
3 Evaluation (opening)
4 Negotiation of Contract andApprovals
5 Manufacture and Delivery toSite
6 Installation andCommissioning

Annex 5
Project Costs (in thousand UA)
Components Estimate at Appraisal Actual Costs Difference
F.E. L.C. Total F.E. L.C. Total
ADF
A. Porto-Novo Networks 4325 304 4,629 4679 335 5014 385.00
B. Training 1369 346 1,715 1619 465 2084 369.00
C. Engineering Consultants 317 32 349 53 42 95 - 254.00
D. Project Management Unit 42 0 42 75 0 75 33.00
Physical Contingency 432 31 463 0 0 0 - 463.00
Price Contingency 437 61 498 0 0 0 - 498.00
Total 692290%
77410%
7,696100%
642688%
84212%
7268100%
- 428.00-6%
NTF
E. Transmission 6317 616 6,933 6717 795 7512 579.00
Physical Contingency 250 62 312 0 0 0 - 312.00
Price Contingency 433 109 542 0 0 0 267.00
Total 700090%
78710%
7,787100%
6,71789%
79511%
751296%
- 275.00-3.53%
CUMUL 13922 1561 15483 13143 1637 14780 -703
Annex 6
Disbursement Schedule (in thousand UA)
Source ofFinancing
YEARS
1991 1992 1993 1994 1995 1996 1997 1998 TOTAL
Estimate atAppraisal
ADF 3,951 2,477 494 6,922
NTF 2,046 4,247 708 7,000
OPT 397 911 253 1,560
TOTAL 6,393 7,635 1,455 0 0 0 0 0 15,483
% 41 49 9 100
Actual
ADF - 711 1,110 1,959 1,601 856 189 0 6,426
NTF 0 2,543 625 1,088 1,555 845 60 6,717
OPT - - 327 246 164 409 264 227 1637
TOTAL - 711 3,980 2,830 2,853 2,820 1,299 287 14780
% 5 27 19 19 19 9 2 100
Financing Plan (in thousand UA)
At Appraisal ActualF.E. L.C. Total F.E. L.C. Total
ADF 6922 0 6922 6426 0 6426NTF 7000 0 7000 6717 0 6717OPT 0 1560 1561 0 1637 1637Total 13922 1560 15483 13143 1637 14780

Annex 7Page 1 of 4
Production Target Indicators
Overall Network
YearMain Lines Connected at Appraisal
(Estimates)Main Lines Connected on Completion
Telephone Telex Telephone Telex
1987 12848 278 13122
1988 13619 293 13577
1989 13858 309 14161
1990 14640 325 14687
1991 17244 342 14919
1992 18865 360 15654
1993 20697 380 20334
1994 21960 400 23899 225
1995 23537 422 28159 207
1996 24973 445 32679 195
1997 26496 469 36453 185
1998 28112 494 38354 181
1999 29827 521
2000 31050 549
2001 32944 579
2002 34954 610
2003 37086 643
2004 39348 678
2005 42235 714
2006 44811 753
2007 47544 794

Annex 7Page 2 of 4
Production Target Indicators
For Porto Novo
Year Main Lines ConnectedAt appraisal (Estimates)
Main Lines Connectedon Completion
Telephone Telephone
1987 2086 2126
1988 2149 2086
1989 2277 2265
1990 3100 2235
1991 3500 2048
1992 3800 2155
1993 4500 2240
1994 4779 2204
1995 4800 2761
1996 5098 3795
1997 5414 4611
1998 5749 5064
1999 6106
2000 6500
2001 6903
2002 7331
2003 7785
2004 8268
2005 8800
2006 9346
2007 9925

Annex 7Page 3 of 4
Production Target Indicators
Number of Main Lines: 1986 - 1998
TOWN NUMBER NUMBER NUMBER NUMBER NUMBER NUMBER CONNECTED CONNECTED CONNECTED CONNECTED CONNECTED CONNECTED CONNECTEDCENTRE OF ML OF ML OF ML OF ML OF ML OF ML CAPACITY CAPACITY CAPACITY CAPACITY CAPACITY CAPACITY CAPACITY
DEC 1986 DEC 1987 DEC 1988 DEC 1989 DEC 1990 DEC 1991 DEC 1992 DEC 1993 DEC 1994 DEC 1995 DEC 1996 DEC 1997 DEC 1998ALLADA 74 81 86 86 83 127 136 139 141 159 181 203 208
OUIDAH 275 270 288 278 287 291 314 334 376 392 395 397 397
COTONOU-GANHI 3055 3157 2984 2995 3127 3064 3119 3325 3769 4,575 5079 5,508 5,583
COTONOU-AKPAKPA
1547 1601 1707 1841 1982 1990 1988 3447 4482 5,157 5804 6,172 6,503
COTONOU-JERICHO 1652 1646 1840 1840 1893 1982 1937 2799 3542 3,917 4281 4,556 4,735
COTONOU-CADJEHOUN
1342 1390 1561 1705 1881 1899 1983 3213 3818 4,545 5265 5,961 6,205
CALAVI 148 171 180 170 200 257 292 239 346 410 527 644 708
8.1.1 GODOMEY 352 469 657 831 965 980
PORTO-NOVO.OGANLA
1814 2126 2086 2265 2235 2084 2155 2240 936 1,541 1497 1,752 1,901
PORTO-NOVO.KANDEVIE 0 1268 1,220 2298 2,859 3,163
POBE 86 87 109 113 105 125 141 144 193 216 254 306 360
IGOLO 74 82 99 92 90 46 46 44 68 84 85 100 109
SAKETE 66 65 80 81 81 92 97 94 105 113 117 124 140
ADJOHOUN 40 39 45 48 43 20 20 20 49 56 59 85 94
SEME 11 13 23 25 24 23 19 14 17 34 53 76 86
KETOU 0 0 40 74 98 121
LOKOSSA 173 203 218 234 233 233 237 263 285 333 394 460 481
COME 59 67 71 58 61 68 72 124 163 195 259 296 288
DOGBO 32 35 34 40 44 45 54 59 64 64 83 103 108
ABOMEY 398 344 367 387 392 387 414 431 445 572 692 807 861
BOHICON 372 381 366 365 382 368 454 502 528 673 813 985 1,078
COVE 80 83 82 92 100 136 165 173 179 184 194 200 202
DASSA 97 105 104 103 102 106 113 131 145 165 198 195 203

Annex 7Page 4 of 4
SAVALOU 93 99 103 104 106 168 222 224 232 258 283 310 326
SAVE 49 54 55 60 61 95 120 130 131 137 140 155 160
PARAKOU 506 523 558 595 612 616 729 1022 1165 1,295 1474 1,584 1,631
KANDI 68 65 67 92 90 95 108 121 125 139 159 193 189
MALANVILLE 31 40 41 49 51 63 77 84 92 105 120 137 142
NIKKI 30 32 36 40 40 69 68 70 71 77 75 83 91
BEMBEREKE 40 38
BANIKOARA 11 13 19 24 25 38 44 45 46 52 55 69 63
SEGBANA 13 14 15 20 20 19 21 22 23 25 27 28 27
NATITINGOU 197 229 242 243 212 243 300 311 344 424 461 518 574
DJOUGOU 103 107 111 116 119 125 134 150 170 246 343 410 473
TANGUIETA 6 45 75 68 112 99 109 114 126
ANALOGEXCHANGES
12,496 13,122 13,577 14,161 14,687 14,919 15,654 4,719 5,269 6,137 7,097 8,036 8,576
DIGITAL EXCHANGE 15,615 18,630 22,022 25,582 28,417 29,778
TOTAL EXCHANGES 12,496 13,122 13,577 14,161 14,687 14,919 15,654 20,334 23,899 28,159 32,679 36,453 38,354
COTONOU 7,744 7,965 8,272 8,551 9,083 9,192 9,319 13,375 16,426 19,261 21,787 23,806 24,714
ATLANTIQUE 8,093 8,316 8,646 8,915 9,453 9,610 9,769 13,848 16,943 19,812 22,363 24,406 25,319
OUEME 2,091 2,412 2,442 2,624 2,578 2,390 2,478 2,556 2,636 3,304 4,437 5,400 5,974
MONO 264 305 323 332 338 346 363 446 512 592 736 859 877
ZOU 1,089 1,066 1,077 1,111 1,143 1,260 1,488 1,591 1,660 1,989 2,320 2,652 2,830
BORGOU 659 687 736 820 838 900 1,047 1,364 1,522 1,693 1,910 2,134 2,181
ATACORA 300 336 353 359 337 413 509 529 626 769 913 1,042 1,173

Annex 8

Annex 9
Comparative Operating Accounts of OPT, 1992-1997 (in thousand UA)
1992 1993 1994 1995 1996 1997
Estimated Actual Estimated Actual Estimated Actual Estimated Actual Estimated Actual Estimated Actual
Production sold 8524 8262 9567 10758 10276 14456 10728 18174 11004 20746 26045 24299
Purchases of cons. 2589 1458 2736 2121 2752 2698 2969 2879 3187 3153 4794 3618
Value Added 5935 6804 6831 8637 7524 11758 7759 15295 7817 17593 21251 20681
Income and Profits 426 41 478 798 513 920 536 748 550 60 719 390
Interest and Div.Received
193 450 202 666 212 722 223 402 234 513 2509 1297
Renewal Reserves. 0 0 0 0 0 0 0 0 0 0 0 0
Pers. Costs. 2477 2499 2526 2559 2548 2971 2598 3179 2650 3816 4191 4032
Other Costs 0 118 0 126 0 210 0 301 0 163 2829 234
Approp. Amort. AndProv.
2223 2598 2446 6928 2555 2639 2728 2292 2715 2578 6844 2804
Financial Charges 1460 309 1650 798 1578 1288 1930 1605 2120 2497 2175 3241
S/Total -5541 -5033 -5942 -8947 -5956 -5466 -6497 -6227 -6701 -8481 -12811 -8624
Operating Income 394 1771 889 -310 1568 6292 1262 9068 1116 9112 8440 12057
NonrecurringIncome.
0 13 0 -1333 0 -5011 0 -6985 0 -4795 -1816 -4208
Income from Sales. 0 0 0 6 0 0 2 0 0 0
Net/ex income. 394 1784 889 -1637 1568 1281 1262 2085 1116 4317 6624 7849
Cash Flow 2617 4382 3335 5291 4123 3920 3990 4377 3831 6895 13468 10653
Working Ratio. 0.27 0.30 0.25 0.22 0.23 0.20 0.23 0.18 0.22 0.19 0.24 0.16
Operating Ratio 0.96 0.80 0.91 1.03 0.86 0.61 0.89 0.53 0.91 0.57 0.71 0.54
Return on FixedAssets.
0.07 0.22 0.08 0.24 0.10 0.14 0.09 0.12 0.08 0.18 0.29 0.23
Net Fixed Assets 36185 19647 40652 22067 42825 28062 44998 35488 46016 39191 47166 45442

Annex 10
Comparative Balance Sheets of OPT, 1992-1997 (in thousand UA)
1992 1993 1994 1995 1996 1997
Estimated Actual Estimated Actual Estimated Actual Estimated Actual Estimated Actual Estimated Actual
Assets
a. Net Fixed Assets 36185 19647 40652 22067 42825 28062 44998 35488 46016 39191 54793 45442
b.Operating Assets. 304 427 308 185 323 214 325 446 326 984 700 1224
c.Current Assets 26746 7432 27065 8767 28399 27849 28630 30563 28670 27457 33425 31501
d.Liquid Assets 3343 4859 3383 15246 3550 14985 3579 32058 3584 36299 32941 34432
Total 66578 32365 71408 46265 75097 71110 77532 98555 78596 103931 121859 112599
Liabilities
e.Net Worth 28729 15096 33184 12817 35534 13812 37361 15233 37421 18606 22775 24661
f.MLT Debts 17344 9896 16694 14641 16956 33452 16434 37935 16251 40660 51055 41961
g.Loss Provisioning 0 0 0 3423 0 6849 0 10436 0 179 0 1380
h.ST Debts 20505 7373 21530 15384 22607 16997 23737 34951 24924 44486 48029 44597
Total 66578 32365 71408 46265 75097 71110 77532 98555 78596 103931 121859 112599
Working Capital 30393 12718 30756 20775 32272 36199 32534 52631 32580 64561 67066 65777
LiquidityRatio=b+c+d/h
1.48 1.72 1.43 1.57 1.43 2.53 1.37 1.80 1.31 1.46 1.40 1.51
Debt Ratio=f/e+f 0.38 0.40 0.33 0.53 0.32 0.71 0.31 0.71 0.30 0.69 0.69 0.63
Net Income 394 1784 889 -1636 1568 1281 1262 2086 1116 4317 6624 7850

Annex 11Page 1 of 2
Calculation of the Internal Rate of Return
1. ASSUMPTIONS AT APPRAISAL
The objectives of this development project include improved quality of service and satisfactionof the additional demand of the different economic agents. It is an integrative part of a globalcomplementary investment programme. Considering, therefore, that all the projects contribute inthe same way to the development of OPT’s activities, the indicator, considered to be the mostrealistic, is the Internal Rate of Return (IRR). It is calculated on the basis of the followingassumptions.
1.1 At appraisal, the revenue assumptions were based on the following factors:
1994 1995 1996 andbeyond
Additional Capacity 1068 3090 4540Average Annual Revenue (in million CFA.F) 1196 1793 2575Other Revenue (telex, maritime radio, etc.) 228 238 246Total/Revenue 1424 2031 2821Variations (%) - 43 39
1.2 The corresponding costs are based on a 5% increase in consumption, 10% per year increasein personnel and other operating costs, and a 1% appropriation for amortization and provisions.
2. SITUATION ON PROJECT COMPLETION
2.1 Technical Outcomes
Number of additional subscribers for all projects:
Without Project With Project Supplementary Lines
Telephone 11 496 26 557 16 174
1992 1993 1994 1995 1996 1997Revenue (million CFA.F) 0 0 1446 1817 3112 4860Costs (million CFA.F) 320 454 619 699 796 796

Annex 11Page 2 of 2
2.2 Revenue and Costs
On the basis of those indicators, the following has been retained:
Revenue : the share of the project in revenue is far above the estimates. In conformity with theimplementation schedule, it represented 10% in 1994, 15% in 1995 and 20% in the other years totake into consideration the performance of all the investments commissioned by the end of 1995.
Costs: Costs and revenue were determined on the basis of the outputs over the period. A 2%distribution rate was retained for operating costs and 1% for appropriations for amortization andprovisions from 1994 to 1995. A 5% increase was retained for the other financial years.
The following table provides a breakdown of the calculations.
Year In million CFA.F
Investment Operating Costs. Income Cash flow
1992 711.00 320.00 0.00 -1031.00
1993 3980.00 454.00 0.00 -4434.00
1994 2830.00 619.00 1865.00 -1584.00
1995 2853.00 699.00 2466.00 -1086.00
1996 2820.00 796.00 4133.00 517.00
1997 1299.00 796.00 6052.00 3957.00
1998 287.00 875.60 5749.40 4586.80
1999 963.16 5750.00 4786.84
2000 1059.48 5750.00 4690.52
2001 1165.42 5750.00 4584.58
2002 1281.97 5750.00 4468.03
2003 1410.16 5750.00 4339.84
2004 1551.18 5750.00 4198.82
2005 1706.30 5750.00 4043.70
2006 1876.93 5750.00 3873.07
IRR 0.27

Annex 12Page 1 of 4
PERFORMANCE RATINGSFORM 1
IMPLEMENTATION PERFORMANCE
EVALUATION CRITERIA RATING OBSERVATIONS
1. Adherence to the implementation schedule 1 The actual slippage on implementationexceeds the initially plannedimplementation period at appraisal by over100%.
2. Adherence to the cost schedule 4 There was a 4.1% variation in cost from thecost estimates at appraisal.
3. Fulfillment of the conditions of the Loan Agreement 2 On completion, not all the conditionsprecedent contained in the Loan Agreementhad been fulfilled
4. Adequacy of supervision and reporting 1 Supervision was inadequate owing to theshortcomings of the project implementationunits.
5. Operations satisfactory 3 The project achieved the principalobjectives assigned at appraisal.
Overall Assessment of Implementation Performance 2.2 Category S (satisfactory).

Annex 12Page 2 of 4
PERFORMANCE RATINGS
FORM 2
PERFORMANCE OF THE BANK
EVALUATION CRITERIA RATING OBSERVATIONS
1. At Identification 3 The project was among the Government’s priorities.
2. At Preparation N.A. There was no project preparation mission.
3. At Appraisal 3 The quality of the project appraisal is satisfactory.
4. At Supervision 2 The Bank carried out 4 supervision missions over a 5-year implementation period.
Overall Assessment of the Bank’sPerformance
2.67 Category S (satisfactory).

Annex 12Page 3 of 4
PERFORMANCE RATINGS
FORM 3
IMPACT ON DEVELOPMENT
EVALUATION CRITERIA RATING OBSERVATIONS
1. Relevance and Attainment of Objectives
(i) Macroeconomic Policy
(ii) Sectoral Policy
(iii) Physical Achievements
(iv) Financial Outcomes
(v) Poverty Reduction, Social Aspects, Women inDevelopment
(vi) Environment
(vii) Development of the Private Sector
3
3
3
3
3
3
3
3
Project completion coincides with a satisfactorycountry macroeconomic performance.
The objective of providing the country withmodern telecommunications systems which arevital for its economic and social developmentwas fully in keeping with the sectoral policyaimed at improving the efficiency and theprofitability of the different economic operatorsin the country by reducing the managementcosts of enterprises through foreign exchangesavings resulting from the use oftelecommunications instead of other means ofcommunication.
The physical components of the project wereimplemented within the norms but some ruraltelephony installations often break down owingto atmospheric disturbances.
The accounting estimates at appraisal were, onthe whole, attained and sometimes exceeded inrespect of revenue, operating income and netprofits.
The social benefits of the project are thestrengthening of ties and contacts betweenfamily members living outside the area, thefeeling of security, time savings for commercialactivities and more rapid access to all economic,administrative and political information. As aresult of the project, women and children haveeasier access to primary and secondary healthcare centres.
Appropriate measures were taken to mitigate thenegative impacts of the project.
The project contributed to an improvement inthe productivity of enterprises.

Annex 12Page 4 of 4
2. Institutional Development
(i) Institutional framework including restructuring
(ii) Financial Information and Management Systems
(iii) Transfer of Technology
(iv) Human Resources
2
1
1
3
3
The 3 sectoral implementation units and thecoordination unit planned at appraisal did notoperate effectively.
The same computer system has been operationalsince appraisal and is now obsolete.The staff productivity index has improvedconsiderably. In fact the ratio of the number ofemployees per 1000 lines fell from 108 in 1989to 28 in 1998.
Idem
3. Sustainability
(i) Continuing Commitment of the Borrower
(ii) Political Environment
(iii) Institutional Framework
(iv) Technical Viability and Supervision of Personnel
(v) Financial Viability including the cost recoverysystems
(vi) Economic Viability
(vii) Environmental Viability
(viii) Operation and Maintenance
2.86
3
2
2
3
4
3
N.A.
3
The Executing Agency (OPT) makes thenecessary budgetary provisions for themaintenance of the facilities.
Since 1994, the Government has undertaken toreform the sector but the related bills are stillbeing drafted.
A sectoral reform committee has beenestablished. However, cellular telephony wasopened to competition prior to the establishmentof the Regulatory Agency
A well-equipped training centre providescontinuing training for OPT personnel.
There has been a significant improvement in therevenue collection rate.
The project has contributed to the improvementof productivity of enterprises and thus to thecountry’s economic recovery. The developmentof rural telephony, in particular, has limitedsubscribers’ travel needs and has thereforegenerated savings in the transport sector.
The installations are properly maintained.
4. Internal Rate of Return4 The project was completed without any cost
overrun and provided the expected profits. Thefinancial rate of return on completion was 27%,which compares favourably with the rate of 20%calculated at appraisal.
Overall Assessment of the Impact onDevelopment
2.97 Category S (satisfactory).

Annex 13
MATRIX OF RECOMMENDATIONS AND FOLLOW-UP MEASURES
PRINCIPALFINDINGS AND CONCLUSIONS
RECOMMENDATIONS FOLLOW-UP MEASURES RESPONSIBILITY
1. Project Formulation and Rationale1.1 The project has made it possible to attain andexceed the objectives set in some components.
1.1.1 Continuing support to the telecommunicationssector in Benin in order to attain the developmentobjectives of the sector, especially in rural areas.
1.1.1.1.1 Bank Group
2. Project Implementation2.1. No OPT structure has completeinformation on the project.
2.2 One company considerably overran thecontractual deadlines and failed to remove thereservations expressed at the time ofprovisional acceptance.2.3 OPT complained that it never received thesupporting documents concerning certaindisbursements.
2.4 The time taken by the Bank to approvesome contracts resulted in slippage on projectimplementation.
2.5 There were unspent loan balances.
2.1.1 Group together in a single structure activitiesrelating to project planning, design and engineering.2.2.1 Objectively apply the clauses of the contractsawarded to suppliers.
2.3.1 Send to the loan beneficiaries copies of thesupporting documents corresponding to the paymentrequests to enable them to update their accounts.
2.4.1 Help to rapidly find solutions to the problemsencountered by projects by shortening the time takento respond to problems raised.
2.5.1 Cancel unspent balances.
.
2.2.1.1 Eliminate from future bidding supplierswhich have displayed incompetence or inability toadhere to contractual deadlines.
2.3.1.1 Verification by the supervision missions thatthe Bank’s shortcomings do not affect the updatingof the project accounts.
2.4.1.1 More frequent organization by the Bank ofthe project supervision missions financed by it.
2.1.1.1.1 OPT
2.2.1.1.1 OPT
2.3.1.1.1 ADF and NTF
2.4.1.1.1 ADF and NTF
2.5.1.1.1 ADF and NTF
3. Compliance with Conditions of the LoanAgreement3.1 The Borrowers took a long time to fulfill theconditions precedent to loan effectiveness.
3.1.1 Take the necessary measures to ensure the rapideffectiveness of the loan conditions precedent.3.1.2 Become more closely involved in projectimplementation.
3.1.1.1 and 3.1.2.1 Government of Benin
4. Assessment of Project Performances andOutcomes4.1 Some telephony installations regularly breakdown as a result of atmospheric disturbances.
4.1.1 Improve the organization of the management ofspare parts for rural telephony links.
4.1.1.1 Seek solutions which will improve theavailability of such links 4.1.1.1.1 O.P.T
5. Sustainability5.1 Development of the institutionalframework of telecommunications.
Speed up the deliberations of the Steering Committeeon the reform of the sector and the support measures,especially the regulatory framework.
5.1.1. Have the laws governing the new institutionalframework adopted by the legislative bodies
5.1.1.1.1 Government of Benin

Annex 14Page 1 of 2
List of Contractors and Suppliers
Name Responsibility Date ofContractSignature
Date ofContractExpiry
ContractDuration
Contract Value
1 Local Networks1.1 TCIL Supply of materials and equipment; work
on the rehabilitation of the local networksof telephone cables in Porto Novo.
15 April1992
31 January1996
12months
FF 26 938 966.532
2 Training2.1 SONAEC Supply of two vehicles 5 November
199316 June
1994CFAF 10 891 600
2.2 IAT Supply of Computer Equipment 12 August1993
28September
1995
CFA.F 3 195 000
2.3 Air Group Supply of Audio-visual Equipment 12 August1993
22 March1995
CFAF 2 037 198
2.4 SOFRECOM Training of Trainers and Staff 23 January1993
26December
1996
CFAF 9 050 000
2.5 ITU Equipment for the Vocational TrainingCentre
7 August1992
10September
1993
CFAF 90 000000
3. Services3.1 Arthur
AndersenAudit of Accounts 26 March
199222 February
19933
monthsCFAF13 500 000
3.2 PriceWaterhouse
Audit of Accounts 17 June1995
9 September1997
12months
CFAF 159 883 500
4. Project Management Unit4.1 K.ALA.F Purchase of a Photocopier 23
December1993
3 March1994
CFA.F 2 905 811
5. Transmission5.1 SECMAT NT Supply, installation and commissioning of
maritime and land radiocommunications2 December
1994December
19989
monthsFF 18 161 086
5.2 SINDUSEQUIP
Supply of materials for the constructionof the Calavi local networks, batches ofcables and connection materials.
9 November1994
FF 1 103 474.25
5.3 STA Supply and erection of pylons for thedigital radio relay system
30November
1992
April 1998 9months
FF 5 613 440
5.4 SINDUSEQUIP
Construction of the transmission of theCotonou Coastal Station
20 April1995
September1997
3months
CFAF 17 637 015
5.5 SINDUSEQUIP
Rehabilitation of buildings of theReception/Operations Centre of theCotonou Coastal Station.
20 April1995
September1996
3months
CFAF 29 233 173
5.6 SINDUSEQUIP
Supply, installation and commissioning ofenergy equipment, emergency lighting,false floors and ceilings for theReception/Operations Centre of theCotonou Coastal Station.
13 January1995
March 1998 150days
CFAF165 925 901
5.7 SEIB Supply installation and commissioning ofair-conditioning equipment of thetransmission centre of the CotonouCoastal Station.
5 January1995
April 1997 CFAF 60 254 650

Annex 14Page 2 of 2
5.8 MED’SGROUP
Supply and installation of earthingequipment and lightning arresters.
18 July 1996 May 1998 150days
CFAF 195 981 200
5.9 BETELCOM Monitoring the establishment of digitalradio relay systems and the maritimeradiocommunications coastal station.
26 February1993
19 July 1996 BF11 401 933
5.10 TRT Supply, installation and commissioningof 19 digital microwave relaytransmission links using TDMAtechnology
30 November1992
23 March1992
FF 25 348 120

Annex 15
Sources of Information
1. Appraisal Report on the Benin Telecommunications Development Project. Ref:ADF/BD/WP/87/94 of 25 August 1987.
2. Loan Agreements F/BEN/TEL/90/22 and N/BEN/TEL/90/1
3. OPT Intermediate Works Status Reports.
4. OPT Project Completion Report
5. ADB Supervision, Monitoring and Portfolio Review Reports.
6. OPT’s Annual Telecommunications Statistics
7. Bank-financed Contracts
8. Statements of Disbursements Effected by the Bank
9. Performance Contracts 1 & 2 and Implementation Decrees
10. Balance Sheets and Operating Accounts from 1988 to 1994
11. OPT Audited Accounts for 1988 to 1994
12 Miscellaneous Documents and Information Collected during the Completion ReportMission.
13. Bank Archives