project feasibilty study and evaluation . aj. chaiyawat thongintr. mae fah luang university (mfu)...
DESCRIPTION
Zdravo Siam team1. Mr. SRIRAMET BOONTHANAROM ID:49312030982. Mr. WIWAT TANGPRASOPCHOT ID:49312031013. Miss SIRILUCK WONGMEEBOON ID:49312031084. Mr. SIWAT TANTALELAR ID:49312031105. Mr. JIRAYU BUTHKHUNTHONG ID:4931203174TRANSCRIPT

I
I
MEMBER
1. Mr. SRIRAMET BOONTHANAROM
ID:4931203098
2. Mr. WIWAT TANGPRASOPCHOT
ID:4931203101
3. Miss SIRILUCK WONGMEEBOON
ID:4931203108
4. Mr. SIWAT TANTALELAR
ID:4931203110
5. Mr. JIRAYU BUTHKHUNTHONG
ID:4931203174
Business Administration
Mae Fah Luang University

II
Preface
Zdravo siam are the project feasibility study in the term to study the feasibility
in opening up an ice cream business at ABAC Plaza. Which ice cream can be seen as
cold and sweet but the way in studying the feasibility of this Zdravo Siam project are
not as sweet as the project name. It is expected that the studying on this project
feasibility study will help any people who wanted to start ice cream business to read
and be a part of the inspiration of the reader.

III
Excutive summary
This consists of a feasibility study of an ice cream shop opening up as the ice
cream market in Thailand nowadays, ice-cream business still one of the business that
many people also interested to go for. The origins of ice cream can be traced back to
at least the 4th century B.C. Early references include the Roman emperor Nero (A.D.
37-68) who ordered ice to be brought from the mountains and combined with fruit
toppings, and King Tang (A.D. 618-97) of Shang, China who had a method of
creating ice and milk concoctions. Ice cream was likely brought from China back to
Europe. Over time, recipes for ices, sherbets, and milk ices evolved and served in the
fashionable Italian and French royal courts. Ice cream was imported to Thailand in
Phra Chulachom Klao Chaoyuhua or King Rama V era
Project Objective are to analyze The feasibility of an ice cream industry and to
provide the project feasibility study Thai people is consumption rate are at 6.0 liter
per year. The consumption rates are rising by 5.0% per year. When compare the
consumption rate of ice cream of Thai people to neighbor’s rate. Thailand ice cream
consumption rate are the lowest when compare with Malaysia which the ice cream
consumption rate is 3 liter per year or Japan which is 7 liter per year and still very low
when comparing to other country which are in Europe area the highest rate of ice
cream consumption is USA which reach to 24 liter for person per year and Australia
consumption rate is 18 liter for person per year.
So this are the interested point to show that there are an opportunity to built a
profit from ice cream in this report it will illustrate about what strategy that been use
how ice cream are made what is the marketing mix including the 3C analysis. Thus, it
also tell about the financial analysis and shown every financial statement in monthly
base. And in also provide the risk management that will tell how to deal with the
problem for the certainty risk and uncertainty risk.

IV
Table of content Chapter1 ......................................................................................................................... 2
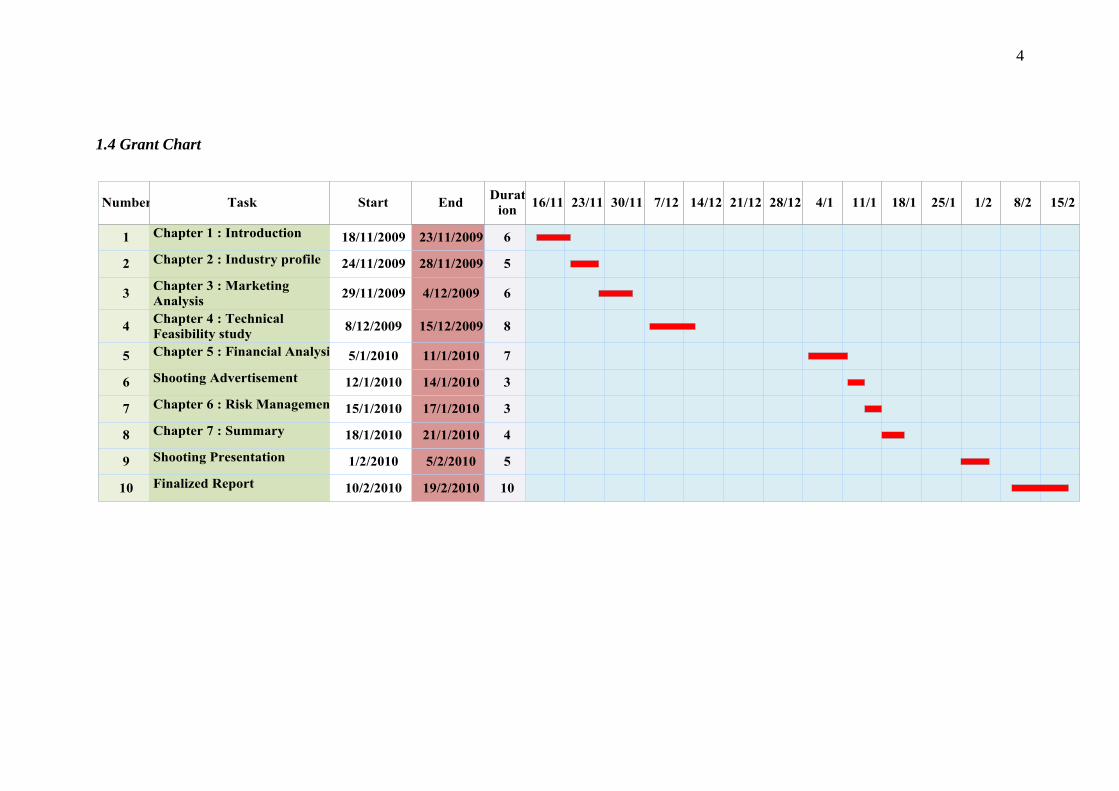
1.1 Background and Significance of the Project ........................................................ 2
1.2 Project Objective .................................................................................................. 3
1.3 Benefits of Project................................................................................................ 3
1.4 Grant Chart........................................................................................................... 4
Chapter 2 ........................................................................................................................ 6
2.1 Nature of Industry ................................................................................................ 6
2.1.1 Frozen custard, French ice cream or French custard ice cream .................... 6
2.1.2 Low fat ice cream.......................................................................................... 6
2.1.3 Non fat ice cream .......................................................................................... 6
2.1.4 Gelato ............................................................................................................ 7
2.1.5 Bulky flavored ice cream .............................................................................. 7
2.1.6 Soft serve ...................................................................................................... 7
2.1.7 Fruit Sherbet.................................................................................................. 7
2.1.8 Sorbet ............................................................................................................ 7
2.1.9 Frozen yogurt ................................................................................................ 8
2.1.10 Granite......................................................................................................... 8
2.1.11 Water ice or ice ........................................................................................... 8
2.2 Situation of Industry ............................................................................................ 9
2.3 Product/Service (in General).............................................................................. 10
2.3.1 Ice Cream .................................................................................................... 10
2.4 Vision of your Organization .............................................................................. 11
2.5 Mission ............................................................................................................... 11
2.6 Strategy .............................................................................................................. 11
2.6.1 Corporate Level .......................................................................................... 11
2.6.2 Business Level ............................................................................................ 12
2.6.3 Functional Level ......................................................................................... 13
Chapter3 ....................................................................................................................... 16
3.1 Market Analysis ................................................................................................. 16
3.1.1 General Environment Analysis ................................................................... 16
3.1.2 Competition Analysis (3C Analysis) .......................................................... 17
3.2 STP Analysis ...................................................................................................... 20
3.2.1 Segment....................................................................................................... 20
3.2.2 Targeting ..................................................................................................... 20
3.2.3 Positioning .................................................................................................. 20
3.3 Marketing Mix Strategy ..................................................................................... 21
V
3.3.1 Product ........................................................................................................ 21
3.3.2 Price ............................................................................................................ 22
3.3.3 Place ............................................................................................................ 22
3.3.4 Promotion .................................................................................................... 22
3.4Five force model ................................................................................................. 22
3.5 Sales Forecast/Profit Estimation ........................................................................ 25
3.5.1 Time Series Analysis .................................................................................. 26
3.6 Sale Forecast ...................................................................................................... 27
3.7 Conclusion ......................................................................................................... 31
Chapter 4 ...................................................................................................................... 33
4.1 Production and Operations Analysis .................................................................. 33
4.1.1 Product Characteristics ............................................................................... 33
4.1.2Production process ....................................................................................... 34
4.1.3 Life Time .................................................................................................... 42
4.1.4 Ice cream recipe .......................................................................................... 45
4.1.5 Location ...................................................................................................... 51
4.1.6 Facility layout ............................................................................................. 53
4.1.7 Machine Tools and Equipment ................................................................... 58
4.1.8 Facility Management .................................................................................. 65
4.2 Cost of Investment ............................................................................................. 66
4.2.1 Rent ............................................................................................................. 66
4.2.2 Total Pre operation cost .............................................................................. 66
4.3 Investment Cost ................................................................................................. 66
4.3.1 Register’s Price. .......................................................................................... 67
4.3.2 A Fee for establishes a business [Co., ltd.] ................................................. 67
4.3.3 Depreciation ................................................................................................ 71
4.4 Operating Cost ................................................................................................... 72
4.4.1 Raw material Cost ....................................................................................... 72
4.4.2Overhead ...................................................................................................... 78
4.5 Management Analysis ........................................................................................ 78
4.5.1 Administration Cost .................................................................................... 78
4.6 Conclusion ......................................................................................................... 78
Chapter 5 ...................................................................................................................... 81
5.1 Profit and loss statement .................................................................................... 81
5.2Cash flow statement ............................................................................................ 86
5.3 Balance sheet ..................................................................................................... 91
Chapter 6 .................................................................................................................... 101

VI
6.1. Risk analysis of projects ................................................................................. 101
6.1.1. Certainty Risk .......................................................................................... 101
6.1.2. Uncertainty Risk ...................................................................................... 101
6.1.3. Economic Condition ................................................................................... 102
6.1.4. Risks from natural disasters ....................................................................... 103
6.2 Risk management summary ............................................................................. 113
Chapter 7 .................................................................................................................... 115
Reference ................................................................................................................... 122

1
Chapter 1
Introduction
2
Chapter1
1.1 Background and Significance of the Project
People love to eat ice-cream, as same as we are. The origins of ice cream can
be traced back to at least the 4th century B.C. Early references include the Roman
emperor Nero (A.D. 37-68) who ordered ice to be brought from the mountains and
combined with fruit toppings, and King Tang (A.D. 618-97) of Shang, China who had
a method of creating ice and milk concoctions. Ice cream was likely brought from
China back to Europe. Over time, recipes for ices, sherbets, and milk ices evolved and
served in the fashionable Italian and French royal courts. Ice cream was imported to
Thailand in Phra Chulachom Klao Chaoyuhua or King Rama V era Thus; we plan to
make our own ice-cream shop under a name of “The Zdravo Siam”.
“Zdravo” is a word from Slovenian, which mean “Hello” in English. Every
day we meet other, we have to greet each other. As same as our ice-cream shop, when
every customer comes inside, “Zdravo” is a first word that they will hear from any
people who works in a shop.
One of a customer group who loves to eat ice-cream is a group of university
students. The Zdravo will be place in ABAC University bangna campus area which is
ABAC Plaza. The reason we choose this place is we have already make a discussion
from famous university in Bangkok, We decide that this university is a place where
people interest to use a brand name and always seek new things ,Which means we can
take more opportunity for open our brand.
As main products, it is ready to serve customers ice-cream and cake. The
Zdravo Siam proudly presents a variety of ice-cream, which home made by ice-cream
maker. Especially, an ice-cream that make from fruits in Thailand, a shop also has a
secret formula, which can win all of customer’s heart who love their health.
Customers can enjoy The Zdravo Siam with many type of home-made bakery; butter
cake, brownies etc.
All of foods and drinks are stand on a good reasonable price, which everybody
can pay for them. For our ice-cream shop’s style, The Zdravo Siam is put on a
concept of a modern and old-fashioned, which will mix together for the smoothness.
Black & White is main color of a shop’s theme. We designed to use any antiques for
decoration. The Zdravo Siam will serve customers a thousand of songs; Wi-Fi high
speed internet is available anytime.
3
1.2 Project Objective
To analyze The feasibility of an ice cream industry
To provide the project feasibility
1.3 Benefits of Project
Knowing feasibility of the project – Researchers study and analyze with real
situation.
Knowing the situation and the trends of ice cream industry, understanding
behavior of customer, and be able to select and identify the right customer.
To be able to calculate profits and expenses, and find the way to get maximize
profits.
4
1.4 Grant Chart

5
Chapter 2
Industry Profile

6
Chapter 2
2.1 Nature of Industry
Ice cream or ice-cream is a frozen dessert usually made from dairy products,
such as milk and cream, and often combined with fruits or other ingredients and flavors.
Most varieties contain sugar, although some are made with other sweeteners. In some
cases, artificial flavorings and colorings are used in addition to (or in replacement of)
the natural ingredients. This mixture is stirred slowly while cooling to prevent large ice
crystals from forming; the result is a smoothly textured ice cream.
There is no evidence of proofing how did ice cream came in to Thailand but it
might be came in to Thailand after Thailand can produce ice in the age of King
RAMAV the first ice cream that Thai people get usual with it is “Waan Yen” that made
from fruit juice and blend it to freezing point. After that POP Co., LTD, the first
manufacture of ice cream in Thailand, and it is called “PED Ice-Cream” started to use
the milk recipe. Thai people started to adapt the foreign ice cream to become the Thai
recipe ice cream and called coconut Ice cream. By using coconut cream combined with
sugar and spin it till harden. The coconut ice creams are eaten with sticky rice or sugar
palm or some people eat with bread. The homemade ice cream maker are now having
more competitive in the market by using their own brand name which consists of the
new flavor the new taste or a new kind of ice cream which gain the market share of 10%
in the market of premium ice cream which the key to success factor of ice cream
premium is to build the differentiation in the market and to be accepted from customer.
Ice cream can be divined in to 11 types
2.1.1 Frozen custard, French ice cream or French custard ice cream
The mainly ingredient of this ice cream type is yolk and have to use more than 1.4% of
yolk when you eat this kind of ice cream you will felt the smell of yolk
2.1.2 Low fat ice cream
There have to be cholesterol not more that 3g to 4 oz of ice cream
2.1.3 Non fat ice cream
There have to be cholesterol not more than 0.5 g per unit of serving

7
2.1.4 Gelato
Gelato, or the plural gelati, is Italy's regional variant of ice cream. As such, gelato is
made with some of the same ingredients as most other frozen dairy desserts. Milk,
cream, various sugars, flavoring including fruit nut purees and air are the main
ingredients. Gelato, or the plural gelati, is Italy's regional variant of ice cream. As such,
gelato is made with some of the same ingredients as most other frozen dairy desserts.
Milk, cream, various sugars, flavoring including fruit nut purees and air are the main
ingredients.
2.1.5 Bulky flavored ice cream
Bulky Ice-Cream is an ice-cream with any ingredients in maximum, such as fruits,
peanuts or cocoa. Some may have ingredient more than 1.4 of a hundred percent of ice-
cream.
2.1.6 Soft serve
Soft serve is generally lower in milk-fat (3% to 6%) than ice cream (10% to 18%) and is
produced at a temperature of about −4 °C compared to ice cream, which is stored at −15
°C. A warmer temperature allows the taste buds to detect more flavors. Soft serve
contains air introduced at the time of freezing. The air content, called overrun, can vary
from 0% to up to 60% of the total volume of finished product. The amount of air alters
the taste of the finished product. Product with low quantities of air has a heavy, icy taste
and appears more yellow. Product with higher air content tastes creamier, smoother and
lighter and appears whiter. The optimum quantity of air is determined by the other
ingredients and individual taste. It is generally accepted that the ideal air content should
be between 33% and 45% of volume. More than this and the product loses taste, tends
to shrink as it loses air and melts more quickly than that with less air.
2.1.7 Fruit Sherbet
a frozen fruit-flavored mixture, similar to an ice, but with milk, egg white, or gelatin
added.
2.1.8 Sorbet
Sorbet is a frozen dessert made from sweetened water flavored with iced fruit (typically
juice or puree), chocolate, wine, and/or liqueur. The sorbet originated as the Middle

8
Eastern drink charbet, made of sweetened fruit juice and water. Sorbet is sometimes
served between courses as a way to cleanse the palate before the main course.
2.1.9 Frozen yogurt
Also known as frozen yoghurt, froyo or frogurt is a frozen dessert made from, or
containing yogurt or other dairy products. It is slightly tarter than ice cream, as well as
lower in fat (due to the use of milk instead of cream). It differs from ice milk (more
recently termed low-fat or light ice cream), which does not include yogurt as an
ingredient.
2.1.10 Granite
Granite is a rough ice-cream like transparent ice, but, it is a sweetener or fruit juice
and bring it to freeze until it get to freezing point and slice it and mix it as and ice cube.
2.1.11 Water ice or ice
Ice or “Slow Train”, is made from juice that mix together with gelatin and freeze in low
temperat

9
2.2 Situation of Industry
The ice cream industry in Thailand has a stable growth rate in 2009 according to
the research of Kasikorn research center and uniliver company state that the
consumption of ice-cream per one Thai people is 6.0 liter per year. The consumption
rates are rising by 5.0% per year. When compare the consumption rate of ice cream of
Thai people to neighbor’s rate. Thailand ice cream consumption rate are the lowest
when compare with Malaysia which the ice cream consumption rate is 3 liter per year or
Japan which is 7 liter per year and still very low when comparing to other country
which are in Europe area the highest rate of ice cream consumption is USA which reach
to 24 liter for person per year and Australia consumption rate is 18 liter for person per
year (figure.1). Thailand ice cream industry have a lot’s of space to invest and gain
profit and in year 2009 the ice cream market industry is worth 18000 million bath or
when compare with the pass year the ice cream industry in Thailand growth 5% every
year .
Figure1.1: Ice cream consumption rate per person per liter
Ice-cream industry are now interest by the international firm which focused to
entered Thailand ice cream industry because now a days the ice cream industry have a
value of 18000million bath which split in to 3 kind the first one is Upper level have a
value of 3000 million bath and have a growth rate higher than 10% The second one is

10
mass level has a value of 7,000 million bath also have a growth rate between 3-5% the
last one is The lower level has a value of 1,000 million baht the ice cream industry in
Thailand is the most interest industry of the international ice cream manufacture which
occur the flow of premium ice cream into Thailand within several year(figure.2) and it
also expand the Thailand ice cream industry .
Figure1.2: import and export of Thai’s ice cream value
2.3 Product/Service (in General)
2.3.1 Ice Cream
Zdravo siam product are basely sale of an scoops of ice cream which are
guarantee of a high quality of product that come from the fresh material, and Zdravo
siam ice cream will match the need to the trend of the food industry for now.
IMPORT AND EXPORT OF THAI’s ICE-CREAM VALUE
Quantity: ton / value: million
Year Import Export
Quantity Value Quantity Value
2544 457.15 52.72 9335.82 428.14
2545 545.63 64.56 10473.05 491.23
2546 717.32 74.13 13841.00 718.82
2547 1377.10 116.70 14730.82 787.50
2548 1493.04 127.98 14262.27 730.44
Jan.-Nov. 2548 1391.48 118.54 13013.45 665.15
Jan.-Nov. 2549 1821.96 156.06 13972.12 678.20
Source: the Customs Department, collected: Thai Farmer Bank Researcher
11
2.4 Vision of your Organization
To be well known ice-cream shop in ABAC Bangna Campus.
2.5 Mission
Make all customers enjoy and satisfy by giving the best service. All Zdravo
Siam’s products are high quality, and use ingredients from Thai agricultural product.
Respond to ice-cream’s lovers, and also students who live in ABAC Bangna campus
area. Zdravo Siam will work with carefully by always drive out fresh products and seek
for successfully in every time. Customer’s need is the first thing we take care of, follow
by staffs. Zdravo Siam is interesting with a variety of ice-cream flavors. Staff is the
beginning of the way to success.
2.6 Strategy
2.6.1 Corporate Level
The strategy we choose to use in a corporate level is intensive strategies and
mainly focused on strategy that is Product development, because now a day’s ice cream
business has a high level of competition in the market which all of the ice cream shop
have the same taste of an ice cream. Way of making ice cream but for our ice cream
shop we are looking for the gap in the market which it has some space that we can grow
in the market such as a fresh homemade ice cream which we will bring out the new
flavor to the ice cream market by the product development .
The second aim is by the market development by sent the product to the higher
level of market and if our ice cream shops have a stable growth rate in the new upper
level we can aim to opened up a franchise.

12
2.6.2 Business Level
Figure2.1: Porter’s five generic strategies
According to figure.3 we choose to be type 3 which is a differentiation strategy
which now a day’s an ice cream industry are highly competing in cost but the flavor on
an ice-cream are still the same but our ice-cream shop are mainly focus on homemade
ice cream business which made from fruit and there are some gap in the ABAC plaza
market so we can built some differentiation by offering the new flavor of ice cream into
the market and at the same time we can built the differentiation of our brand can be
unique by the style of shop decoration.
13
2.6.3 Functional Level
Administration
For the Zdravo Siam, customer is the first one we care of. Thus, the shop should
be following the best quality of administration process, including the shop decoration
and service.
Business Strategies
- Good shop decoration
- Always offer new promotion for customers
- Build good relationship with customer
Marketing
Now our shop is set at ABAC University, so, the target market of the shop is
teenagers who live around ABAC university area. However, to expand our business to
be well known from many people, we have planned to promote and expand more
branches in the future.
Marketing Strategies
-Making any special Advertising and offer to customers, such as a discount promotion.
-Good service
-Expand more branches, over Bangkok area.
Production
To help Thai farmers and Thai economy, we also use all of Thai ingredient for
our product. A shop has fashionable ice-cream, such as Thai fruit ice-cream. However,
the production quantity will depend on weather and marketing. We will decrease the
production on summer because our customers have no class in the summer season so,
they did not come to the ABAC Campus so, and the demand will decrease. In winter
and rainy season our customer come back to ABAC Campus that is our shop location
so, the demand will increase related to the population of customer too.
Production Strategies
- Production must be support customer’s demand in a hundred percents.
- Cleanness Production
- Good quality of ingredients
- Stable taste of product

14
Human Resources
We pay attention of staff’s performance. They need to develop themselves in
every time, have a clear direction of work and can earn profit to the business. Moreover,
the relationship between staffs is very important, because it can drive the business to be
successful in quickly.
Human Resource Strategies
- Training and repeating all staffs to be always ready to work/.
- Motivating all staffs, by offer them extra cash.
Financial
We should have a good capital which high percentage of securely. It might be come
from entrepreneur or take on loan.
Financial Strategies
- Find the low interest of loan.
- Making a shop account
- Be economical [water and electricity]
15
Chapter 3
Market Feasibility Study

16
Chapter3
3.1 Market Analysis
According to the survey of the area in ABAC Plaza we can divined the market
into main four part of the segment as the following
- Food
- Beverage
- Bakery
- Dessert
- Ice cream
Zdravo siam mainly focused to the Ice cream market share which from the
competitive analyses in the ABAC plaza which are highly compete in the food and
beverage. So, Zdravo Siam has seen the gap in the market which has no any ice-cream
shop in the ABAC plaza area. This is an opportunity in opening up an ice cream shop in
ABAC plaza area which we can see an opportunity that can built a profit for the
investor.
3.1.1 General Environment Analysis
Political
Today, the government has problems in agriculture by using price guarantee, so
result in agricultures have to improve quality to sell more. It makes the advantage for
company because raw materials in production are from domestic agricultural
production. When the outcomes have high quality, it enables to select raw materials to
produce more and better product quality with lower-cost.
Economic
The economic factor will not have an effect on the Zdravo siam because Zdravo
siam located in ABAC Plaza area Althrough, the economic factor didn’t have an effect
to the rate of ice cream consumption is also growing continuously , so it gives the
opportunity for company to get market share.
Social
Today, consumers attend to healthy, so the company has the opportunity to
develop useful products for health such as fruit ice cream, low fat ice cream, high

17
calcium milk ice cream, and sugar-free ice cream. It attract to the consumers of all ages,
whether children, teenager, adults until to the elderly.
Environment
Thailand is a country located in the tropical. It makes demand for consumption
ice cream all the year. Thailand also has fruits and agricultural raw materials to produce
the ice cream. These are strengths of the company to get the opportunities for product
development and export to foreign countries.
Technology
Now process of production for homemade ice cream has been improved by
technology development so the production for ice creams both looks and tastes to meet
the needs of customers who always want the innovation.
3.1.2 Competition Analysis (3C Analysis)
3.1.2.1 Competitor’s analysis
We have position in Zdravo Siam in ABAC plaza which is first mover
advantage because no exist of supply that provides ice cream to the demand on this
market. So, almost of our competitors are substitute competitors. We can analyze the
main competitor into the following which is
S&P
They produce and distribute bakery. Frozen food shelf Products, sausage and
ham pasta line and color, odor, used in food industry under the name "S & P" "Delio"
"Patio" "Vanilla" "Bluecup" and "Royallee" through branches and restaurants bakery
and Super Markets. and export to foreign countries. Almost price of their product start;
cookies 78 baht, cake 325 baht, snack 35 baht, coffee 55 baht and bakery 49 baht.
Coffee world
Coffee World is coffee house that offers a comprehensive range of hot and iced
coffees with fresh complementary foods such as waffles, sandwiches and signature
cakes, muffins and cookies. The company places a lot of emphasis on picking and
roasting the finest Arabica beans to create rich brews prepared by our highly trained
baristas (professional coffee makers).Almost of the price start; cake 70 baht and coffee
65 baht.
18
Deli House
The Deli house is Europe food style restaurant, which has food, bakery and
beverage. The Deli house is soft environment
The many product such as Soft bread texture, Sweet fresh butter, Fine dish,
Sweet Dumpling, cake and pork products such as Latin American Sausage, Smoked
sausage etc. Almost of the price start; foods are 69 baht, bakeries 39 baht and beverages
39 baht.
Blue Coffee
The company's business is the operation of coffee houses serving food and
coffee, located in ABAC plaza. Blue coffee's excellent reputation is based on serving
coffees of the highest quality, with the best aroma and taste, made from 100% fresh
coffee beans. Use the "Menu Explorer" at right to find out about some of the many
delicious beverage items on our menus. Almost of the price start; coffees are 65 baht
and cakes are 39 baht.
Take a Break
The take a break is comfortable style restaurant. The feature of restaurant is fast
but very delicious. Almost of the price start; foods are 49 baht and beverages 35 baht.
Mister Donut
Mister Donut is doughnut franchise shops. Almost of the price start; donuts 10
baht, bakeries 35 baht and beverages 35 baht.
Boost Juice
Boost Juice Bars is an international chain of retail outlets that specialize in
selling fruit juice. Boost Juice Bars was formed in 2000 with the first store located in
Adelaide, South Australia. The company has expanded internationally with stores in
Asia, Europe and the Middle East through franchising. Almost of the price start
beverage at 45 baht.
Squeeze
A subsidiary of Tipco Company mainly focused on sale of natural fruit
smoothies. Almost of the price start beverage at 35 baht.
Aunntie’s Ann
Auntie Anne's has a variety of pretzel products, dipping sauces, and beverages to
choose. Almost of the price start; bakeries are 59 baht and beverage 39 baht.

19
3.1.2.2 Competitive analysis
Ice cream market is a market that is constantly expanding. There are more
current operators because of operate easily. The observation that famous brand open
more branches and begin to development in production, marketing and expanding
distribution channels. Major reputation business has more capital is more aggressive in
market and create distribution channels and distribution to cover thoroughly. At present,
ice cream market in Thailand is quite capable of continuous growth. Benefits of ice
cream market in Thailand can be doing throughout the year because the weather is quite
hot and weather is not different. Many people like to eat ice cream because it makes
them relax and fresh.
Our company is homemade ice cream own position is in the premium ice cream
market. The market value of ice cream premium market is approximately 17% or
approximately 1800 million baths. Market conditions of premium ice cream are serving
sit eating patterns. The major are compete between big 2 companies; Swensen’s ice
cream, Hagen Daze’s ice cream. While the other competitor in ABAC Plaza area is
ignore to compete in the ice cream market.
3.1.2.3 Customer analysis
Company emphasizes in young and working age customers with an average age
ranging from 17-35 years with high purchasing power parity and want innovation. This
easy to bring the product into the consumers know.
From a target group, ABAC students who want to consume premium homemade
ice cream. Because of the gap area ABAC Plaza not supply ice cream to meet existing
demand. The opportunity to visit the company capture market share in this. The market
is a market that is very important due to its ability to target the high spending. Average
income per capita is 10000 baht per month based on the personal costs of ABAC
students. http://www.abaca.au.edu/Abaca/news-au/35abac.php. From expectations of
behavior based on the target, Research on Consumer perception of the nature and
quality of home-made and commercial dairy ice cream of John A. Bower, and Irene A.
Baxter, which shows demand is associated with income. That indicates the relationship
between demands for low cost products when consumers have more income. A position
appropriate its needs and profitable.
20
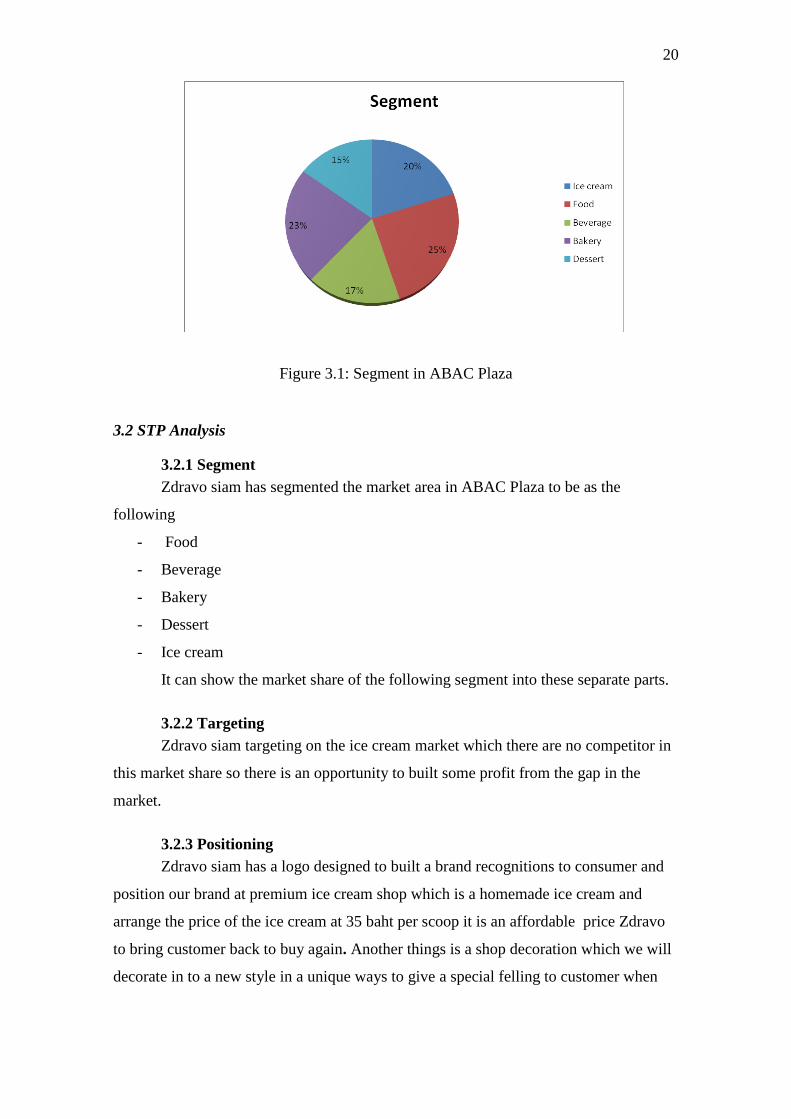
Figure 3.1: Segment in ABAC Plaza
3.2 STP Analysis
3.2.1 Segment
Zdravo siam has segmented the market area in ABAC Plaza to be as the
following
- Food
- Beverage
- Bakery
- Dessert
- Ice cream
It can show the market share of the following segment into these separate parts.
3.2.2 Targeting
Zdravo siam targeting on the ice cream market which there are no competitor in
this market share so there is an opportunity to built some profit from the gap in the
market.
3.2.3 Positioning
Zdravo siam has a logo designed to built a brand recognitions to consumer and
position our brand at premium ice cream shop which is a homemade ice cream and
arrange the price of the ice cream at 35 baht per scoop it is an affordable price Zdravo
to bring customer back to buy again. Another things is a shop decoration which we will
decorate in to a new style in a unique ways to give a special felling to customer when

21
they come Zdravo siam are focused on homemade ice cream to inform to customer that
they are the drive that push the company to the brighter future which it can build the
brand loyalty.
Zdravo siam will positioning by using the blue ocean strategy as shown below to
show that from the survey we can identify the variety of product in ABAC Plaza and
has a gap in the market to gain profit.
Figure 3.2: Blue ocean strategy
From the graph above it can illustrate that the gap in the Abac Plaza Market are
low supply in an ice cream product,so Zdravo Siam aim the gap in the market and will
positioning our self on the ice cream shop that give more supply of an ice cream product
according to the survey from questionnaire from date…-…. Shown that there are a
demand of an ice cream needs.
3.3 Marketing Mix Strategy
3.3.1 Product
Our ice-cream is ice cream for the health. It’s mixture between ice-cream with
many fruits. And the result is the delicious that is valuable for health. We have free

22
water enhance give with a customer. Which these things, we recruit for customer it
more than dessert or ice-cream. But it is modernism, flavors of ice-cream sweetness for
customer.
3.3.2 Price
The majority of the business’ sales will come from ice cream. We use price
strategy 35 Baht. Which we use psychology price in our products and price of our
products are appropriate. For basic price we fix a price by use the capital because almost
business use this method.
3.3.3 Place
We choose ABAC campus because it’s easy to sell image and ABAC bangna
campus is the place which students has influential in goods buying from statistics to
open the shop at ABAC and possibility to make profits by decorate the shop for
customer who wants to relax by provide the music to customer with the chilling music
to and the relaxation atmosphere while waiting to go to class or place to sit back and
relax after the class
3.3.4 Promotion
Zdravo siam will push all of the promotion to built the good relationship with
customer and give the customer good perception to the Zdravo siam brand. Such as a
discount or a promotion that will appeal customer to come and spend the money at
Zdravo siam.
3.4Five force model
Exist competitor
Overview of the ice cream market will find that there are many competitors. Both
small and large. Coupled with the ice cream market rates grasp how early in the 50-80%
level as well as market growth continued and potential future growth rates due to more
consumption of ice cream in Thailand. Current is low compared to other countries. But
the location of the shop area without any ice cream shop opens. So, there are no direct
competitor to compete with Zdravo siam this is the opportunity to gain high sale
volume.

23
New entry barrier
Access to ice cream markets is easy especially in the group of Home-made ice
cream as a less complex production technologies Ice cream business, but business is
similar to other food. Flavor is the highlight. And to derive methods to produce the best
ice cream flavor that require different techniques that have resulted from a long trial.
This may not simply be imitated. And take not less to do. Counterfeit goods to be
Quality, the same level together. For the protection of capital and competitive ability
more the company is focused on building relationships with customers. We have to
focus on marketing promotions that have access needs of students. Exit strategies and
large competitors cannot imitate or emulate difficult. To attract customers to stay with
us such as free print if the purchase of the stores scheduled.
Substitute product
Ice cream is a product that is easy to substitute products. Depending on whether
a product will look kind of ice cream. If any overview food that is sweet and kind one,
products to replace the food is sweet to all. Which a number, If we compare the prices
of existing competitors, we are also in line with cheaper quality compared. We also are
a feature. Home Made Ice Cream. The most competitive products are franchiser. That is
available generally. When viewed from the sweltering weather outside of the university
and ABAC. Ice cream seems to be popular than other dessert.
Power of buyer
The company brand is new and not yet well known and accepted in the market.
The Company is required in areas ABAC Plaza. And store sales. In the drive to
consume. Since the image area of the store is set to see a good image and thus help
support the good image of the store to customers. Later, when the goods have been
more popular. Will contribute to building the company's bargaining power increase.
However, the quality of ice cream flavors are the most important factors to Business in
the long term tend to increase the likelihood of repeat purchases of consumers.

24
Power of supplier
Because raw material production base of the product was not difficult to find,
such as milk, cream, eggs, fresh vegetables, fruits, etc., a product that provides easy and
has many manufacturers in the market for a Supplier bargaining power is low.
Especially the agricultural products. Normal price will fall when the season because of
low productivity into the market once substantial. However, to get a good quality of raw
material quality tests from some manufacturers. To facilitate the quality control of raw
materials.
From the above analysis showed that ice-cream business is an industry of
market has high gravity. Both the production cost per unit low. (Making a gross profit
margin high) into the market is doing. Easy because no barriers to entry. Especially in
the Ice Cream Home-made small and Supplier bargaining power is lower. Because
materials used in manufacturing a product purchased at general and sellers in the market
more. However, the qualities of ice cream flavors are the most important factors to
business in the long term.
25
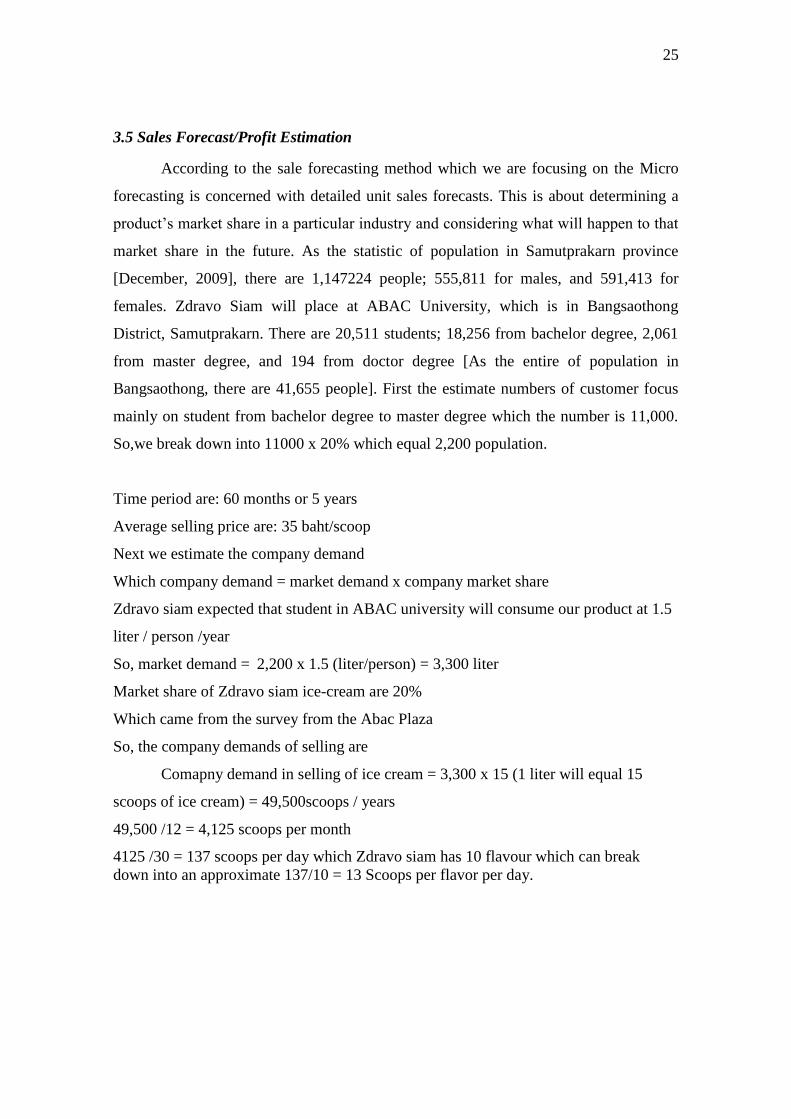
3.5 Sales Forecast/Profit Estimation
According to the sale forecasting method which we are focusing on the Micro
forecasting is concerned with detailed unit sales forecasts. This is about determining a
product’s market share in a particular industry and considering what will happen to that
market share in the future. As the statistic of population in Samutprakarn province
[December, 2009], there are 1,147224 people; 555,811 for males, and 591,413 for
females. Zdravo Siam will place at ABAC University, which is in Bangsaothong
District, Samutprakarn. There are 20,511 students; 18,256 from bachelor degree, 2,061
from master degree, and 194 from doctor degree [As the entire of population in
Bangsaothong, there are 41,655 people]. First the estimate numbers of customer focus
mainly on student from bachelor degree to master degree which the number is 11,000.
So,we break down into 11000 x 20% which equal 2,200 population.
Time period are: 60 months or 5 years
Average selling price are: 35 baht/scoop
Next we estimate the company demand
Which company demand = market demand x company market share
Zdravo siam expected that student in ABAC university will consume our product at 1.5
liter / person /year
So, market demand = 2,200 x 1.5 (liter/person) = 3,300 liter
Market share of Zdravo siam ice-cream are 20%
Which came from the survey from the Abac Plaza
So, the company demands of selling are
Comapny demand in selling of ice cream = 3,300 x 15 (1 liter will equal 15
scoops of ice cream) = 49,500scoops / years
49,500 /12 = 4,125 scoops per month
4125 /30 = 137 scoops per day which Zdravo siam has 10 flavour which can break
down into an approximate 137/10 = 13 Scoops per flavor per day.
26
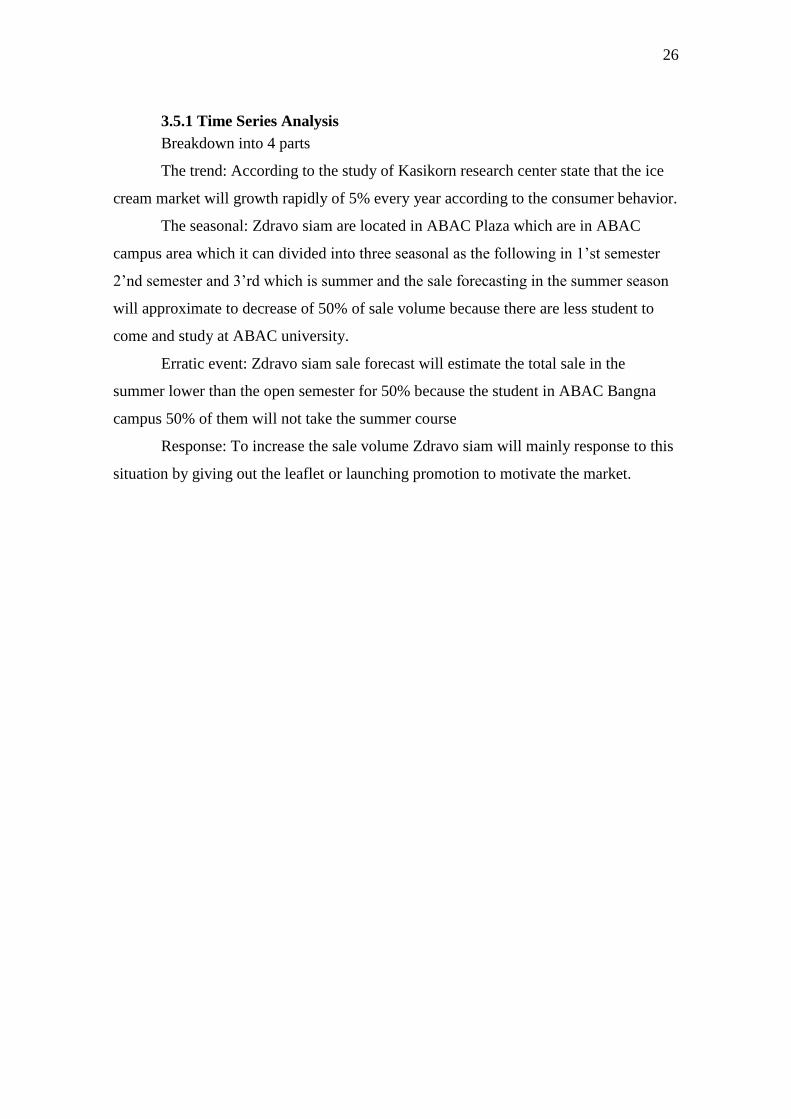
3.5.1 Time Series Analysis
Breakdown into 4 parts
The trend: According to the study of Kasikorn research center state that the ice
cream market will growth rapidly of 5% every year according to the consumer behavior.
The seasonal: Zdravo siam are located in ABAC Plaza which are in ABAC
campus area which it can divided into three seasonal as the following in 1’st semester
2’nd semester and 3’rd which is summer and the sale forecasting in the summer season
will approximate to decrease of 50% of sale volume because there are less student to
come and study at ABAC university.
Erratic event: Zdravo siam sale forecast will estimate the total sale in the
summer lower than the open semester for 50% because the student in ABAC Bangna
campus 50% of them will not take the summer course
Response: To increase the sale volume Zdravo siam will mainly response to this
situation by giving out the leaflet or launching promotion to motivate the market.

27
3.6 Sale Forecast
Year 1 Total sales in cash
Year 2 Total sales in cash
Product JAN FEB MAR APR MAY JUN JUL AUG SEP OCT NOV DEC Total
Rum Raisin 7,182 8,379 3,591 2,394 2,394 11,970 9,576 11,970 14,364 16,758 15,561 15,561 119,700
Golden Fresh milk 6,048 7,056 3,024 2,016 2,016 10,080 8,064 10,080 12,096 14,112 13,104 13,104 100,800
Almond Fresh milk 5,368 6,262 2,684 1,789 1,789 8,946 7,157 8,946 10,735 12,524 11,630 11,630 89,460
Green tea Fresh milk 5,065 5,909 2,533 1,688 1,688 8,442 6,754 8,442 10,130 11,819 10,975 10,975 84,420
Ice tea Fresh milk 5,594 6,527 2,797 1,865 1,865 9,324 7,459 9,324 11,189 13,054 12,121 12,121 93,240
Lynchee Sorbet 2,873 3,352 1,436 958 958 4,788 3,830 4,788 5,746 6,703 6,224 6,224 47,880
Papermint 2,268 2,646 1,134 756 756 3,780 3,024 3,780 4,536 5,292 4,914 4,914 37,800
Vanila 7,560 8,820 3,780 2,520 2,520 12,600 10,080 12,600 15,120 17,640 16,380 16,380 126,000
Chocolate 9,828 11,466 4,914 3,276 3,276 16,380 13,104 16,380 19,656 22,932 21,294 21,294 163,800
Strawberry 10,584 12,348 5,292 3,528 3,528 17,640 14,112 17,640 21,168 24,696 22,932 22,932 176,400
Total 62,370 72,765 31,185 20,790 20,790 103,950 83,160 103,950 124,740 145,530 135,135 135,135 1,039,500
Toatal sale
Product JAN FEB MAR APR MAY JUN JUL AUG SEP OCT NOV DEC Total
Rum Raisin 15,960 19,950 77,976 64,980 29,241 38,988 97,470 272,916 487,350 318,402 438,615 295,659 245,641
Golden Fresh milk 17,640 21,240 12,796 10,826 9,159 17,995 21,668 26,091 31,416 37,828 45,548 54,845 307,051
Almond Fresh milk 12,348 14,868 8,958 7,578 6,411 12,567 15,132 18,221 21,939 26,417 31,809 38,301 214,550
Green tea Fresh milk 22,932 27,612 16,635 14,074 11,906 23,364 28,133 33,875 40,789 49,114 59,138 71,208 398,781
Ice tea Fresh milk 22,932 27,612 16,635 14,074 11,906 23,364 28,133 33,875 40,789 49,114 59,138 71,208 398,781
Lynchee Sorbet 8,820 10,620 6,398 5,413 4,579 8,968 10,799 13,003 15,656 18,852 22,699 27,332 153,140
Papermint 19,404 23,364 14,076 11,908 10,074 19,779 23,816 28,676 34,529 41,577 50,062 60,280 337,546
Vanila 10,584 12,744 7,678 6,495 5,495 10,797 13,001 15,654 18,849 22,697 27,329 32,907 184,231
Chocolate 12,348 14,868 8,958 7,578 6,411 12,567 15,132 18,221 21,939 26,417 31,809 38,301 214,550
Strawberry 22,932 27,612 16,635 14,074 11,906 23,364 28,133 33,875 40,789 49,114 59,138 71,208 398,781
Total 164,052 197,535 119,007 100,680 85,175 167,163 201,281 242,362 291,829 351,391 423,110 509,466 2,853,051
Toatal sale
28
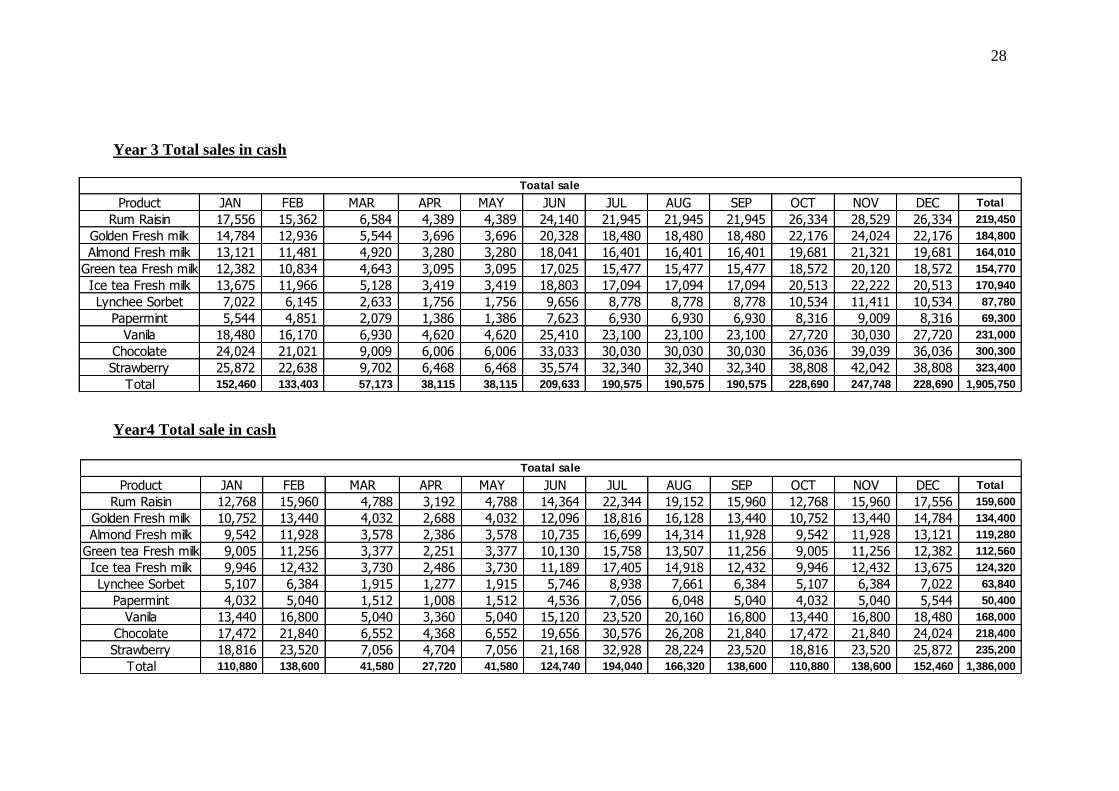
Year 3 Total sales in cash
Year4 Total sale in cash
Product JAN FEB MAR APR MAY JUN JUL AUG SEP OCT NOV DEC Total
Rum Raisin 17,556 15,362 6,584 4,389 4,389 24,140 21,945 21,945 21,945 26,334 28,529 26,334 219,450
Golden Fresh milk 14,784 12,936 5,544 3,696 3,696 20,328 18,480 18,480 18,480 22,176 24,024 22,176 184,800
Almond Fresh milk 13,121 11,481 4,920 3,280 3,280 18,041 16,401 16,401 16,401 19,681 21,321 19,681 164,010
Green tea Fresh milk 12,382 10,834 4,643 3,095 3,095 17,025 15,477 15,477 15,477 18,572 20,120 18,572 154,770
Ice tea Fresh milk 13,675 11,966 5,128 3,419 3,419 18,803 17,094 17,094 17,094 20,513 22,222 20,513 170,940
Lynchee Sorbet 7,022 6,145 2,633 1,756 1,756 9,656 8,778 8,778 8,778 10,534 11,411 10,534 87,780
Papermint 5,544 4,851 2,079 1,386 1,386 7,623 6,930 6,930 6,930 8,316 9,009 8,316 69,300
Vanila 18,480 16,170 6,930 4,620 4,620 25,410 23,100 23,100 23,100 27,720 30,030 27,720 231,000
Chocolate 24,024 21,021 9,009 6,006 6,006 33,033 30,030 30,030 30,030 36,036 39,039 36,036 300,300
Strawberry 25,872 22,638 9,702 6,468 6,468 35,574 32,340 32,340 32,340 38,808 42,042 38,808 323,400
Total 152,460 133,403 57,173 38,115 38,115 209,633 190,575 190,575 190,575 228,690 247,748 228,690 1,905,750
Toatal sale
Product JAN FEB MAR APR MAY JUN JUL AUG SEP OCT NOV DEC Total
Rum Raisin 12,768 15,960 4,788 3,192 4,788 14,364 22,344 19,152 15,960 12,768 15,960 17,556 159,600
Golden Fresh milk 10,752 13,440 4,032 2,688 4,032 12,096 18,816 16,128 13,440 10,752 13,440 14,784 134,400
Almond Fresh milk 9,542 11,928 3,578 2,386 3,578 10,735 16,699 14,314 11,928 9,542 11,928 13,121 119,280
Green tea Fresh milk 9,005 11,256 3,377 2,251 3,377 10,130 15,758 13,507 11,256 9,005 11,256 12,382 112,560
Ice tea Fresh milk 9,946 12,432 3,730 2,486 3,730 11,189 17,405 14,918 12,432 9,946 12,432 13,675 124,320
Lynchee Sorbet 5,107 6,384 1,915 1,277 1,915 5,746 8,938 7,661 6,384 5,107 6,384 7,022 63,840
Papermint 4,032 5,040 1,512 1,008 1,512 4,536 7,056 6,048 5,040 4,032 5,040 5,544 50,400
Vanila 13,440 16,800 5,040 3,360 5,040 15,120 23,520 20,160 16,800 13,440 16,800 18,480 168,000
Chocolate 17,472 21,840 6,552 4,368 6,552 19,656 30,576 26,208 21,840 17,472 21,840 24,024 218,400
Strawberry 18,816 23,520 7,056 4,704 7,056 21,168 32,928 28,224 23,520 18,816 23,520 25,872 235,200
Total 110,880 138,600 41,580 27,720 41,580 124,740 194,040 166,320 138,600 110,880 138,600 152,460 1,386,000
Toatal sale

29
Year 5 Total sale in cash
Product JAN FEB MAR APR MAY JUN JUL AUG SEP OCT NOV DEC Total
Rum Raisin 19,950 15,960 5,985 3,990 3,990 27,930 23,940 15,960 19,950 19,950 21,945 19,950 199,500
Golden Fresh milk 16,800 13,440 5,040 3,360 3,360 23,520 20,160 13,440 16,800 16,800 18,480 16,800 168,000
Almond Fresh milk 14,910 11,928 4,473 2,982 2,982 20,874 17,892 11,928 14,910 14,910 16,401 14,910 149,100
Green tea Fresh milk 14,070 11,256 4,221 2,814 2,814 19,698 16,884 11,256 14,070 14,070 15,477 14,070 140,700
Ice tea Fresh milk 15,540 12,432 4,662 3,108 3,108 21,756 18,648 12,432 15,540 15,540 17,094 15,540 155,400
Lynchee Sorbet 7,980 6,384 2,394 1,596 1,596 11,172 9,576 6,384 7,980 7,980 8,778 7,980 79,800
Papermint 6,300 5,040 1,890 1,260 1,260 8,820 7,560 5,040 6,300 6,300 6,930 6,300 63,000
Vanila 21,000 16,800 6,300 4,200 4,200 29,400 25,200 16,800 21,000 21,000 23,100 21,000 210,000
Chocolate 27,300 21,840 8,190 5,460 5,460 38,220 32,760 21,840 27,300 27,300 30,030 27,300 273,000
Strawberry 29,400 23,520 8,820 5,880 5,880 41,160 35,280 23,520 29,400 29,400 32,340 29,400 294,000
Total 173,250 138,600 51,975 34,650 34,650 242,550 207,900 138,600 173,250 173,250 190,575 173,250 1,732,500
Toatal sale
30
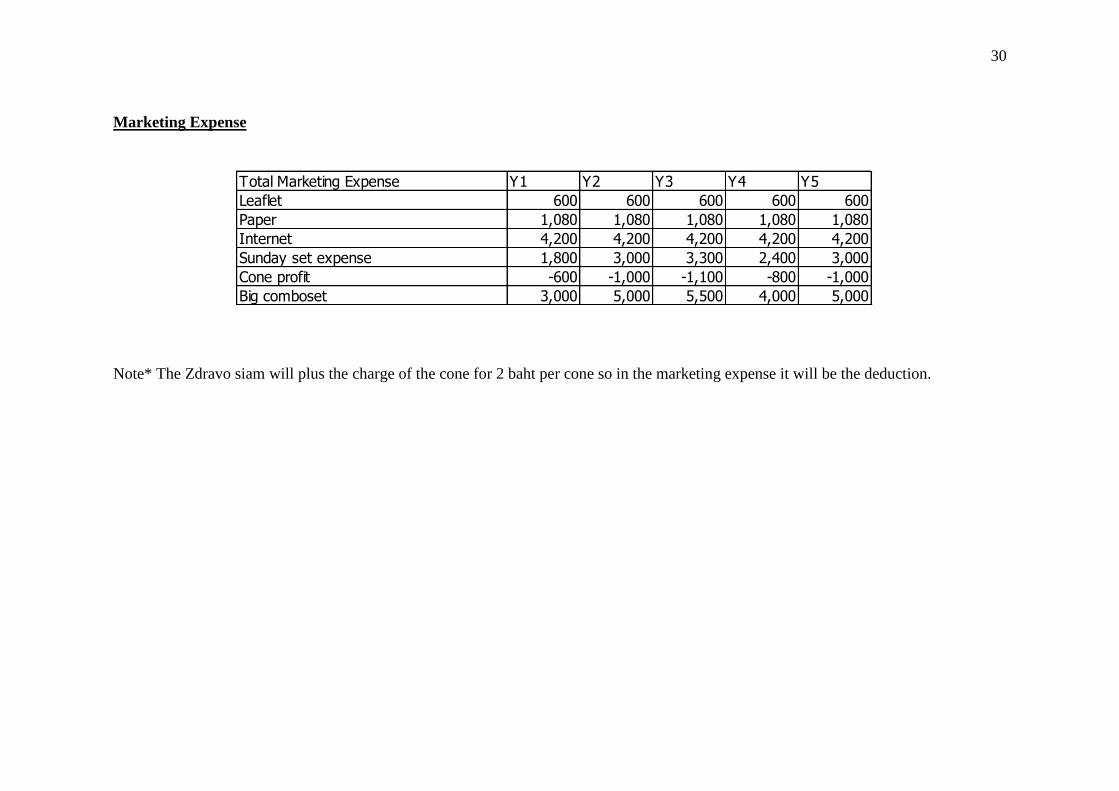
Marketing Expense
Note* The Zdravo siam will plus the charge of the cone for 2 baht per cone so in the marketing expense it will be the deduction.
Total Marketing Expense Y1 Y2 Y3 Y4 Y5
Leaflet 600 600 600 600 600
Paper 1,080 1,080 1,080 1,080 1,080
Internet 4,200 4,200 4,200 4,200 4,200
Sunday set expense 1,800 3,000 3,300 2,400 3,000
Cone profit -600 -1,000 -1,100 -800 -1,000
Big comboset 3,000 5,000 5,500 4,000 5,000

31
0%
5%
10%
15%
20%
25%
Mo
nth
1
Mo
nth
3
Mo
nth
5
Mo
nth
7
Mo
nth
9
Mo
nth
11
Mo
nth
13
Mo
nth
15
Mo
nth
17
Mo
nth
19
Mo
nth
21
Mo
nth
23
Mo
nth
25
Mo
nth
27
Mo
nth
29
Mo
nth
31
Mo
nth
33
Mo
nth
35
Mo
nth
37
Mo
nth
39
Mo
nth
41
Mo
nth
43
Mo
nth
45
Mo
nth
47
Mo
nth
49
Mo
nth
51
Mo
nth
53
Mo
nth
55
Mo
nth
57
Mo
nth
59
Sale
pe
rce
nta
ge
Zdravo siam Growth rate
Zdravo siam
3.7 Conclusion
According to the sale forecasting we it can conclude that the average income of
the total 60 month will be approximate 148,613 baht per month and the seasoning sale
will be shown as the following figure.
Figure 3.3: Zdravo siam Growth rath
As the figure shown above it will show the sharp decrease in sales this happened
because of the season of the university that close for summer. But the advantage are
even the sale are 50% lower than normal but The ABAC plaza will give an exception
not to gather the rent of the summer season.
The total of marketing expense is 60,900 baht and Zdravo siam will plus the
charge of the cone if customer wants to ice cream scoops on cone.

32
Chapter 4
Technical Feasibility Study
33
Chapter 4
4.1 Production and Operations Analysis
4.1.1 Product Characteristics
Zdravo siam product focused on only selling ice cream which generally can be dividend
in to ten flavors
4.1.1.1. Rum raisin
4.1.1.2. Golden ice-cream fresh milk
4.1.1.3. Almond ice-cream fresh milk
4.1.1.4. Green tea ice-cream fresh milk
4.1.1.5. Ice tea Ice-cream
4.1.1.6. Lynches Sorbet
4.1.1.7. Pepper mint ice-cream
4.1.1.8. Ice-cream vanilla
4.1.1.9. Ice-cream chocolate
4.1.1.10. Ice-cream Strawberry
All of Zdravo siam ice cream use a high quality ingredient inside Thailand.

34
4.1.2Production process
The basic steps in the manufacturing of ice cream are generally as follows:
blending of the mix ingredients
pasteurization
homogenization
aging the mix
freezing
packaging
hardening
Figure4.1: Process flow diagram for ice cream manufacture
Process flow diagram for ice cream manufacture: the red section represents the
operations involving raw, unpasteurized mix, the pale blue section represents the
operations involving pasteurized mix, and the dark blue section represents the
operations involving frozen ice cream.
35
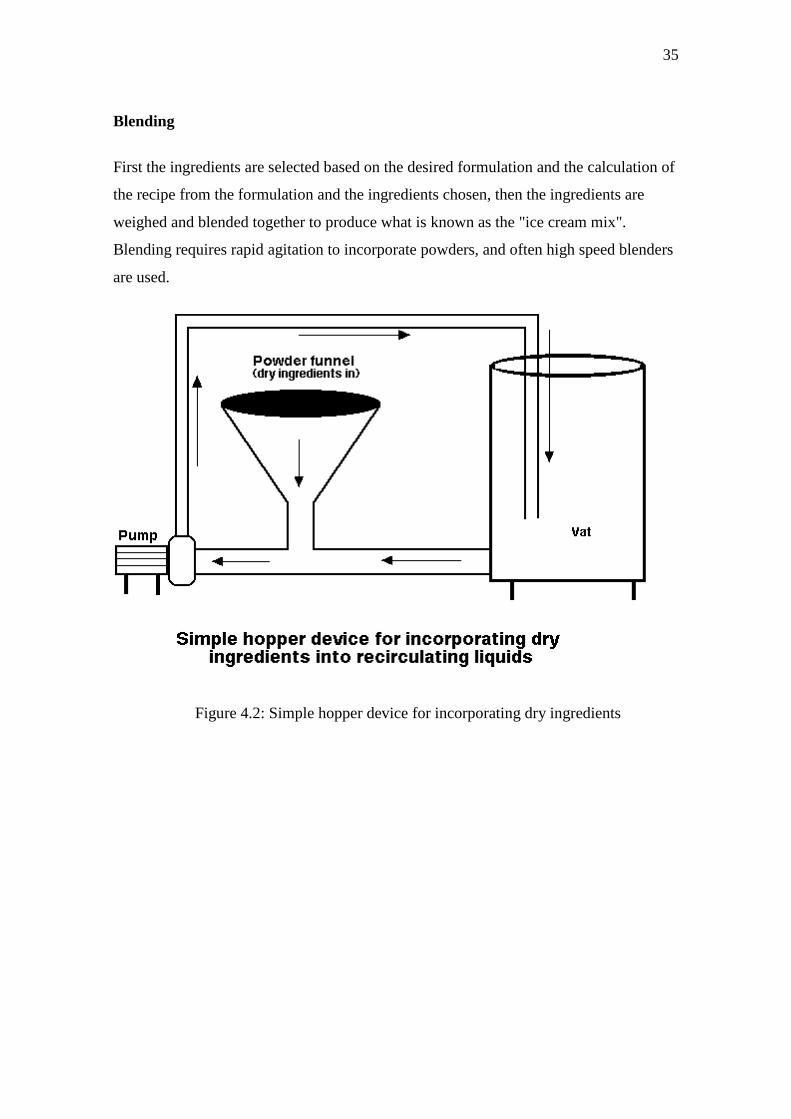
Blending
First the ingredients are selected based on the desired formulation and the calculation of
the recipe from the formulation and the ingredients chosen, then the ingredients are
weighed and blended together to produce what is known as the "ice cream mix".
Blending requires rapid agitation to incorporate powders, and often high speed blenders
are used.
Figure 4.2: Simple hopper device for incorporating dry ingredients
36
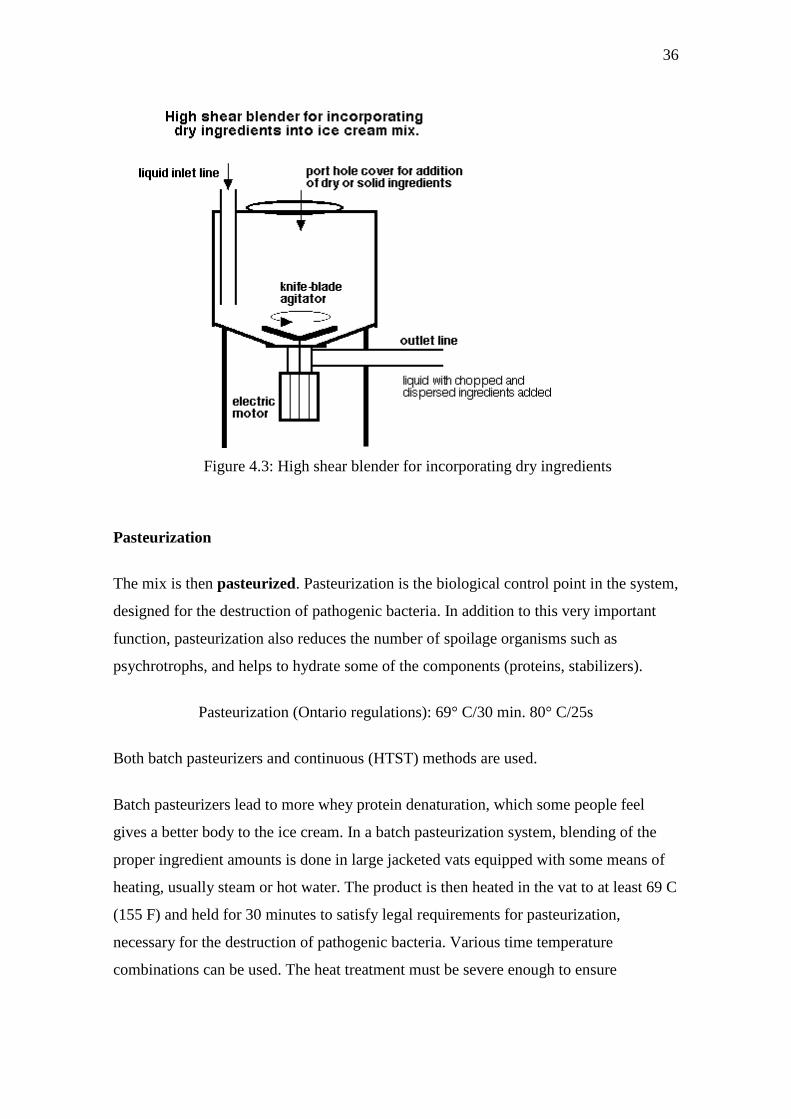
Figure 4.3: High shear blender for incorporating dry ingredients
Pasteurization
The mix is then pasteurized. Pasteurization is the biological control point in the system,
designed for the destruction of pathogenic bacteria. In addition to this very important
function, pasteurization also reduces the number of spoilage organisms such as
psychrotrophs, and helps to hydrate some of the components (proteins, stabilizers).
Pasteurization (Ontario regulations): 69° C/30 min. 80° C/25s
Both batch pasteurizers and continuous (HTST) methods are used.
Batch pasteurizers lead to more whey protein denaturation, which some people feel
gives a better body to the ice cream. In a batch pasteurization system, blending of the
proper ingredient amounts is done in large jacketed vats equipped with some means of
heating, usually steam or hot water. The product is then heated in the vat to at least 69 C
(155 F) and held for 30 minutes to satisfy legal requirements for pasteurization,
necessary for the destruction of pathogenic bacteria. Various time temperature
combinations can be used. The heat treatment must be severe enough to ensure

37
destruction of pathogens and to reduce the bacterial count to a maximum of 100,000 per
gram. Following pasteurization, the mix is homogenized by means of high pressures
and then is passed across some type of heat exchanger (plate or double or triple tube) for
the purpose of cooling the mix to refrigerated temperatures (4 C). Batch tanks are
usually operated in tandem so that one is holding while the other is being prepared.
Automatic timers and valves ensure the proper holding time has been met.
Continuous pasteurization is usually performed in a high temperature short time (HTST)
heat exchanger following blending of ingredients in a large, insulated feed tank. Some
preheating, to 30 to 40 C, is necessary for solubilization of the components. The HTST
system is equipped with a heating section, a cooling section, and a regeneration section.
Cooling sections of ice cream mix HTST presses are usually larger than milk HTST
presses. Due to the preheating of the mix, regeneration is lost and mix entering the
cooling section is still quite warm.
Homogenization
The mix is also homogenized which forms the fat emulsion by breaking down or
reducing the size of the fat globules found in milk or cream to less than 1 µ m. Two
stage homogenization is usually preferred for ice cream mix. Clumping or clustering of
the fat is reduced thereby producing a thinner, more rapidly whipped mix. Melt-down is
also improved. Homogenization provides the following functions in ice cream
manufacture:
Reduces size of fat globules
Increases surface area
Forms membrane
makes possible the use of butter, frozen cream, etc.
By helping to form the fat structure, it also has the following indirect effects: ---
- makes a smoother ice cream
- gives a greater apparent richness and palatability
- better air stability
- increases resistance to melting

38
Homogenization of the mix should take place at the pasteurizing temperature. The high
temperature produces more efficient breaking up of the fat globules at any given
pressure and also reduces fat clumping and the tendency to thick, heavy bodied mixes.
No one pressure can be recommended that will give satisfactory results under all
conditions. The higher the fat and total solids in the mix, the lower the pressure should
be. If a two stage homogenizer is used, a pressure of 2000 - 2500 psi on the first stage
and 500 - 1000 psi on the second stage should be satisfactory under most conditions.
Two stage homogenization is usually preferred for ice cream mix. Clumping or
clustering of the fat is reduced thereby producing a thinner, more rapidly whipped mix.
Melt-down is also improved.
Ageing
The mix is then aged for at least four hours and usually overnight. This allows time for
the fat to cool down and crystallize, and for the proteins and polysaccharides to fully
hydrate. Aging provides the following functions:
Improves whipping qualities of mix and body and texture of ice cream.
providing time for fat crystallization, so the fat can partially coalesce;
allowing time for full protein and stabilizer hydration and a resulting slight
viscosity increase;
allowing time for membrane rearrangement and protein/emulsifier interaction, as
emulsifiers displace proteins from the fat globule surface, which allows for a
reduction in stabilization of the fat globules and enhanced partial coalescence.
Aging is performed in insulated or refrigerated storage tanks, silos, etc. Mix temperature
should be maintained as low as possible without freezing, at or below 5 C. An aging
time of overnight is likely to give best results under average plant conditions. A "green"
or unaged mix is usually quickly detected at the freezer.

39
Freezing and Hardening
Following mix processing, the mix is drawn into a flavour tank where any liquid
flavors, fruit purees, or colours are added. The mix then enters the dynamic freezing
process which both freezes a portion of the water and whips air into the frozen mix. The
"barrel" freezer is a scraped-surface, tubular heat exchanger, which is jacketed with a
boiling refrigerant such as ammonia or freon. Mix is pumped through this freezer and is
drawn off the other end in a matter of 30 seconds, (or 10 to 15 minutes in the case of
batch freezers) with about 50% of its water frozen. There are rotating blades inside the
barrel that keep the ice scraped off the surface of the freezer and also dashers inside the
machine which help to whip the mix and incorporate air.
Figure 4.4: The Continuous Ice Cream Freezer

40
Ice cream contains a considerable quantity of air, up to half of its volume. This gives the
product its characteristic lightness. Without air, ice cream would be similar to a frozen
ice cube. The air content is termed its overrun, which can be calculated mathematically.
As the ice cream is drawn with about half of its water frozen, particulate matter such as
fruits, nuts, candy, cookies, or whatever you like, is added to the semi-frozen slurry
which has a consistency similar to soft-serve ice cream. In fact, almost the only thing
which differentiates hard frozen ice cream from soft-serve, is the fact that soft serve is
drawn into cones at this point in the process rather than into packages for subsequent
hardening.
Hardening
After the particulates have been added, the ice cream is packaged and is placed into a
blast freezer at -30° to -40° C where most of the remainder of the water is frozen. Below
about -25° C, ice cream is stable for indefinite periods without danger of ice crystal
growth; however, above this temperature, ice crystal growth is possible and the rate of
crystal growth is dependant upon the temperature of storage. This limits the shelf life of
the ice cream.
A primer on the theoretical aspects of freezing will help you to fully understand the
freezing and recrystallization process.
Hardening involves static (still, quiescent) freezing of the packaged products in blast
freezers. Freezing rate must still be rapid, so freezing techniques involve low
temperature (-40oC) with either enhanced convection (freezing tunnels with forced air
fans) or enhanced conduction (plate freezers).
41
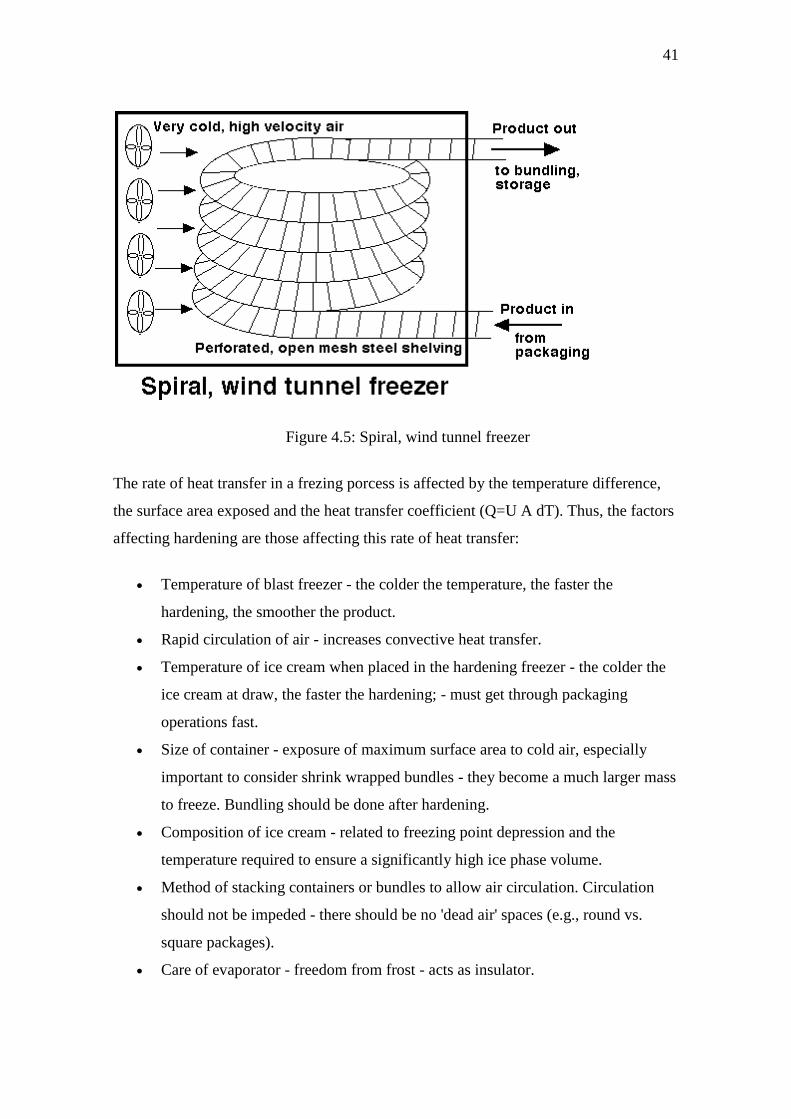
Figure 4.5: Spiral, wind tunnel freezer
The rate of heat transfer in a frezing porcess is affected by the temperature difference,
the surface area exposed and the heat transfer coefficient (Q=U A dT). Thus, the factors
affecting hardening are those affecting this rate of heat transfer:
Temperature of blast freezer - the colder the temperature, the faster the
hardening, the smoother the product.
Rapid circulation of air - increases convective heat transfer.
Temperature of ice cream when placed in the hardening freezer - the colder the
ice cream at draw, the faster the hardening; - must get through packaging
operations fast.
Size of container - exposure of maximum surface area to cold air, especially
important to consider shrink wrapped bundles - they become a much larger mass
to freeze. Bundling should be done after hardening.
Composition of ice cream - related to freezing point depression and the
temperature required to ensure a significantly high ice phase volume.
Method of stacking containers or bundles to allow air circulation. Circulation
should not be impeded - there should be no 'dead air' spaces (e.g., round vs.
square packages).
Care of evaporator - freedom from frost - acts as insulator.

42
Package type, should not impede heat transfer - e.g., styrofoam liner or
corrugated cardboard may protect against heat shock after hardening, but
reduces heat transfer during freezing so not feasible.
Ice cream from the dynamic freezing process (continuous freezer) can also be
transformed into an array of novely/impulse products through a variety of filling and
forming machines, which have ben identified on a separate page.
4.1.3 Life Time
The most frequently occurring textural defect in ice cream is the development of a
coarse, icy texture. Iciness is also the primary limitation to the shelf life of ice cream
and probably also accounts for countless lost sales through customer dissatisfaction with
quality. There is no answer to the question "What is the shelf-life of ice cream?", it
depends entirely on its conditions of storage. It might be one year, or it might be two
weeks or less. Although the source of and the contributing factors to the problem of
icincess are well known, it is also one of the defects about which I am most often asked.
Processor's have known for a long time how to prevent iciness and the answer is still the
same: formulate the ice cream properly to begin with, freeze the ice cream quickly in a
well-maintained barrel freezer, harden the ice cream rapidly, and avoid as much as
possible temperature fluctuations during storage and distribution. Ice crystals need to be
numerous and of small, uniform size so they are not detected when eaten. It is heat
shock, large temperature fluctuations, which is the greatest culprit to the loss of these
small, uniform ice crystal size distributions and resulting coarse, icy texture. Perhaps it
is time another message was added to the prevention of iciness and that is to educate the
retailer's and the consumer about the causes of iciness and preventative action to
maintain a smooth-textured ice cream.
Before we begin looking specifically at shelf-life, you need to re-acquaint yourself with
the freezing aspects of ice cream manufacturing, the structure of ice crystals in ice
cream, and the theoretical aspects of the freezing process.

43
Temperature Fluctuations and Ice Recrystallization
Ice crystals are relatively unstable, and during frozen storage, they undergo changes in
number, size, and shape, known collectively as recrystallization. This is probably the
most important reaction leading to quality losses in all frozen foods. Some
recrystallization occurs naturally at constant temperatures, but by far the majority of
problems are created as a result of temperature fluctuations. If the temperature during
the frozen storage of ice cream increases, some of the ice crystals, particularly the
smaller ones, melt and consequently the amount of unfrozen water in the serum phase
increases. Conversely, as temperatures decrease, water will refreeze but does not
renucleate. Rather, it is deposited on the surface of larger crystals, so the net result is
that the total numbers of crystals diminish and the mean crystal size increases.
Temperature fluctuations are common in frozen storage as a result of the cyclic nature
of refrigeration systems and the need for automatic defrosts. However, mishandling of
product is probably the biggest culprit. The sight of ice cream sitting unrefrigerated on a
loading dock, in the supermarket aisle, in a shopping cart, or in someone's grocery bag
is too common. If one were to track the temperature history of ice cream during
distribution, retailing, and finally consumption, one would find a great number of
temperature fluctuations. Each time the temperature changes, the ice to serum content
changes, and the smaller ice crystals disappear while the larger ones grow even larger.
Recrystallization is minimized by maintaining low and constant storage temperatures.
The graph below provides data to show the increase in size of ice crystals that occurs
with temperature cycles (from the work of A. Flores and H. D. Goff).
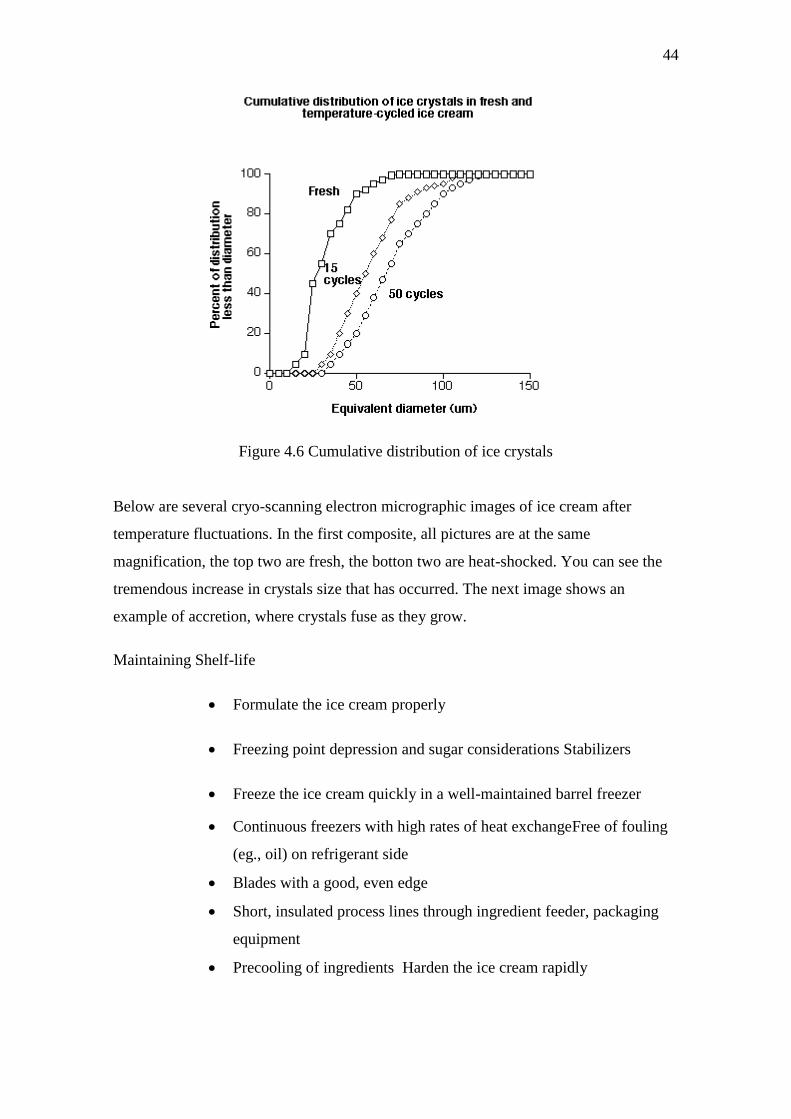
44
Figure 4.6 Cumulative distribution of ice crystals
Below are several cryo-scanning electron micrographic images of ice cream after
temperature fluctuations. In the first composite, all pictures are at the same
magnification, the top two are fresh, the botton two are heat-shocked. You can see the
tremendous increase in crystals size that has occurred. The next image shows an
example of accretion, where crystals fuse as they grow.
Maintaining Shelf-life
Formulate the ice cream properly
Freezing point depression and sugar considerations Stabilizers
Freeze the ice cream quickly in a well-maintained barrel freezer
Continuous freezers with high rates of heat exchangeFree of fouling
(eg., oil) on refrigerant side
Blades with a good, even edge
Short, insulated process lines through ingredient feeder, packaging
equipment
Precooling of ingredients Harden the ice cream rapidly

45
High rates of heat transfer: convection (high ΔT and forced air with
free air flow) or conduction
Importance of thermal centre and shrink-wrapping of bundles
Avoid temperature fluctuations during storage and distribution
Importance of low, constant temperatures
Avoid mishandling at all stages
Educate retailers and consumers about shelf stability
Mishandling is usually not at the manufacturing level but quality
losses affect
4.1.4 Ice cream recipe
Rum raisin
White malt 2 teaspoons
Sugar 1/2 cup
Fresh milk 3 cup
Butter rum Syrup 20 ml
Rum ¼ teaspoon
Whip cream 1/3 cup
Guar Gum 1 tablespoon
Raisin
Directions:
How do the White malt mixed with the fresh milk sugar syrup mixed and rum
flavored cooking set fire hot enough fire gradually. First mixed together to mix. Then
put into cold enough. Mixed with milk, Whip cream, Guar Gum and mix then hold
together enough to cool the tank immersed in approximately time 4 hours and then put
ice cream in shaker. Take approximately time 30-40 minutes after completion may be
mixed currant. Then be refrigerated.

46
Pumpkin ice-cream fresh milk
White malt 2 teaspoons.
Sugar 1/2 cup.
Fresh milk 2 cup.
White chocolate syrup 10 ml.
Pumpkin 3/4 cup.
Whip cream 1/3 cup
Guar Gum 1 tablespoon
Directions:
Bring White malt mixed with sugar. And fresh milk white chocolate. Thereafter bring
pumpkin heated gradually put sugar. After that mix pumpkin and whipping cream and
mix Guar Gum. Thereafter be immersed in the ice tank approximately times 3-4 hours.
Bring ice cream in shaker and then approximately times 30-40 minutes to complete.
Almond ice-cream fresh milk
White malt 2 teaspoons.
Sugar 1/2 cup.
Fresh milk 3 cup.
White chocolate syrup 10 ml.
Caramel 30 ml
Whip cream 1/3 cup
Guar Gum 1 tablespoon
Almond 3/4 cup
Directions:
Bring White malt mixed with sugar. And fresh milk white chocolate. Thereafter bring
almond heated gradually put sugar. After that mix almond and whipping cream and mix
47
Guar Gum. Thereafter be immersed in the ice tank approximately times 4 hours. Bring
ice cream in shaker and then approximately times 30-40 minutes to complete.
Green tea ice-cream fresh milk
Powder green tea 1/3 cup.
White malt 2 teaspoons.
Sugar 1/2 cup.
Fresh milk 3 cup.
White chocolate syrup 15 ml.
Whip cream 1/3 cup
Guar Gum 1 tablespoon
Directions:
Bring White malt mixed with sugar. And fresh milk white chocolate. Thereafter bring
Green tea syrup heated gradually put sugar. After that mix Green tea syrup and
whipping cream and mix Guar Gum. Thereafter be immersed in the ice tank
approximately times 4 hours. Bring ice cream in shaker and then approximately times
30-40 minutes to complete.
Ice tea ice-cream
Ice tea powder 1/3 cup.
White malt 2 teaspoons.
Sugar 1/2 cup.
Fresh milk 3 cup.
White chocolate syrup 10 ml.
Whip cream 1/3 cup
Guar Gum 1 tablespoon

48
Directions:
Bring Ice tea powder and white malt mixed with sugar. And fresh milk white chocolate.
Thereafter bring Green tea syrup heated gradually put sugar. After that mix and
whipping cream and mix Guar Gum. Thereafter be immersed in the ice tank
approximately times 4 hours. Bring ice cream in shaker and then approximately times
30-40 minutes to complete.
Lynches Sorbet
Lynches in syrup 1 can (about 240g lynches and 200 ml syrup)
Castor sugar 20 g
1 egg white
Directions:
1. Puree the Lynches together with the sugar and the syrup.
2. Taste the mixture and adjust sugar if needed. Beat the egg white until almost stiff and
stir in the mixture. Make sure that all the ingredients are thoroughly mixed.
3. Transfer the complete mixture into an ice-cream maker and follow the manufacturer’s
instructions.
4. Puree the Lynches together with the sugar and the syrup. (Use a food processors or
blender)
5. Eat the egg white until almost stiff.
6. Mix the Leeches puree thoroughly with the egg white.
7. Make sure that all the ingredients are thoroughly mixed.
8. Preparation time: about 25-35 minutes.
49
Pepper mint ice-cream
White malt 1 teaspoons.
Sugar 1/3 cup.
Pineapple juice 1/2 cup
Fresh milk 3 cup.
Pepper mint syrup 30 ml.
White chocolate syrup 10 ml.
Whip cream 1/3 cup
Guar Gum 1.5 Tablespoon.
Directions:
Bring white malt mix with sugar. Thereafter bring fresh milk mix with white chocolate
syrup. And bring almonds syrup heated gradually. Mix with milk, whipping cream and
pineapple juice, put to Guar Gum. And cool the tank immersed about 4 hours. Put to
shaker. Approximately 30-40 minutes to complete.
Ice-cream vanilla
Fresh milk 3 cup
Egg 6 eggs
Sugar 1/3 cup
Whipping cream 1/3 cup
Vanilla powder 2 tablespoon
Guar Gum 1.5 Tablespoon.
White chocolate syrup 10 ml.
Directions:
Bring Vanilla powder mix with sugar. Thereafter bring fresh milk mix with white
chocolate syrup. And mix with milk, whipping cream and put to Guar Gum. And cool
the tank immersed about 4 hours. Put to shaker. Approximately 30-40 minutes to
complete.

50
Ice-cream Chocolate
Butter 1 cup
Fresh milk 1 cup
Sugar 1/3 cup
White chocolate syrup 10 ml.
Chocolate powder 2 tablespoon
Guar Gum 1.5 Tablespoon.
Whipping cream 1/3 cup
Directions:
Bring Chocolate powder mix with sugar. Thereafter bring fresh milk mix with white
chocolate syrup. And mix with milk, whipping cream and put to Guar Gum. And cool
the tank immersed about 4 hours. Put to shaker. Approximately 30-40 minutes to
complete.
Ice-cream Strawberry
Egg 3 eggs
Fresh milk 4 cup
Sweet milk 3 cup
whipping cream 1/3 cup
Guar Gum 1.5 Tablespoon
Strawberry 1/2 cup
Sugar 2 tablespoon
Directions:
Bring strawberry mix with sugar. Approximately 1 hour. Thereafter, put to shaker.
Bring fresh milk, corn starch, and salt to melt together and put cream, searched milk and
strawberry to malt together. And cool the tank immersed about 4 hours. Put to shaker.
Approximately 30-40 minutes to complete.

51
4.1.5 Location
Zdravo Siam will be located at ABAC Plaza
This will be inside of this plaza.
Figure4.7: ABAC plaza

52
Our shop opens at room number 41 which have an area of 58 Sq.m.
Figure4.2 Plan ground floor
Figure 4.8: Ground floor plan

53
4.1.6 Facility layout
Due to the design we ask the contractor to estimate the cost of decoration which will be
five hundred thousand. The contractors said that most of the cost that spends on the
decoration is cost of furniture.
Figure 4.9: Layout of Zdravo siam

54
Figure 4.10: Zdravo siam design 1
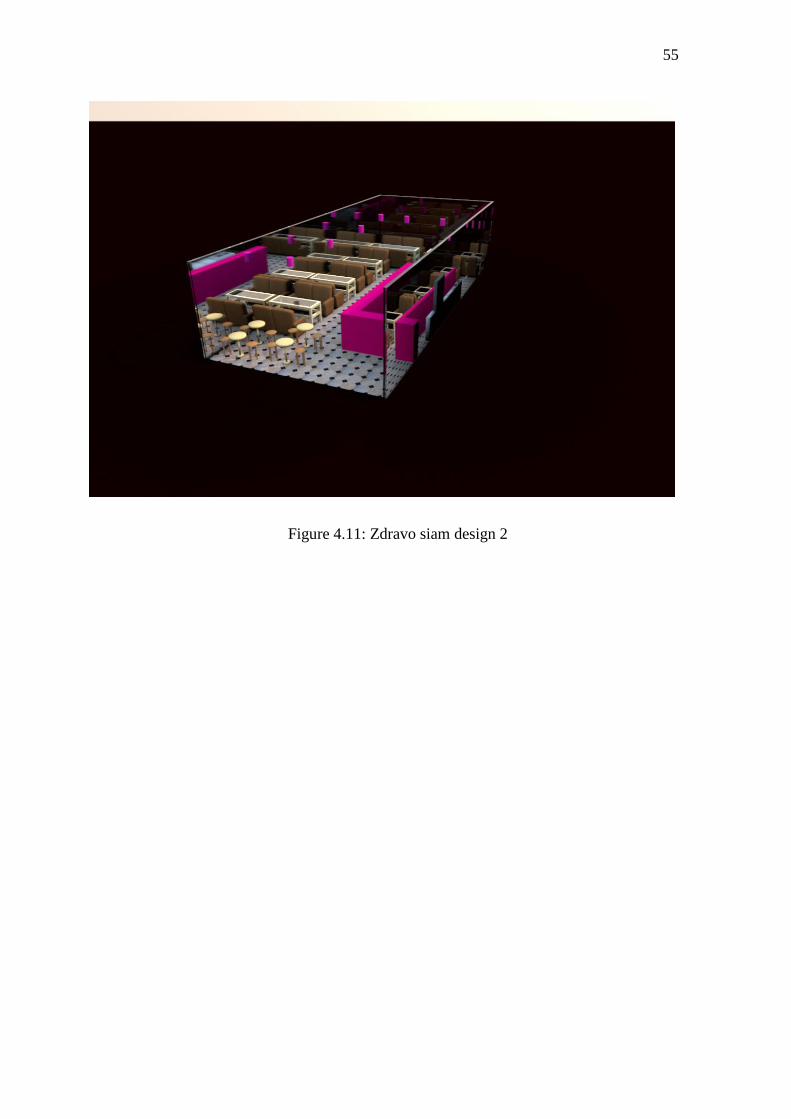
55
Figure 4.11: Zdravo siam design 2

56
Figure4.2: Zdravo siam design 3

57
The logo
Zdravo siam will be use this logo the main color of this logo is gold because we want to
sent out the theme of a high class with a combination of Thai word will give out the
look of high class. It also contain the meaning in each letters
Z- Zenith
D- Dispersion
R - Radical
A - Abet
V - Validness
O - Obdurate
As it shown above it will show the intend of name giving
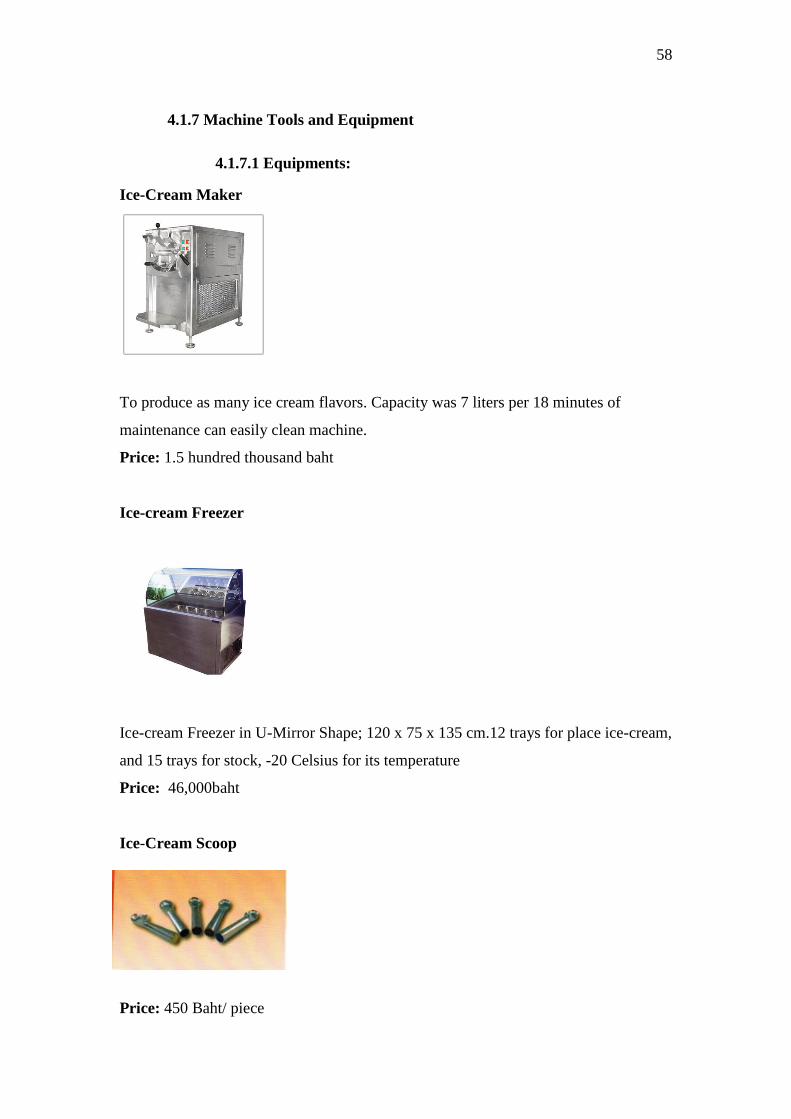
58
4.1.7 Machine Tools and Equipment
4.1.7.1 Equipments:
Ice-Cream Maker
To produce as many ice cream flavors. Capacity was 7 liters per 18 minutes of
maintenance can easily clean machine.
Price: 1.5 hundred thousand baht
Ice-cream Freezer
Ice-cream Freezer in U-Mirror Shape; 120 x 75 x 135 cm.12 trays for place ice-cream,
and 15 trays for stock, -20 Celsius for its temperature
Price: 46,000baht
Ice-Cream Scoop
Price: 450 Baht/ piece

59
Ice-Cream’s tray
An Ice-Cream’s tray; 26 x 16 x 10 cm.
Price: 580 Baht/ tray
Fruit’s tray
A fruit’s tray; 17 x 16 x 10 cm.
Price: 480 Baht/ tray
Cash Register
- JCM GOLD G-485 Dimensions include Drawer: 42 x 42 x 32 cm
Price: 35,000 bath
Blackboard
50 x 90 x 120 cm
Price: 550 Baht
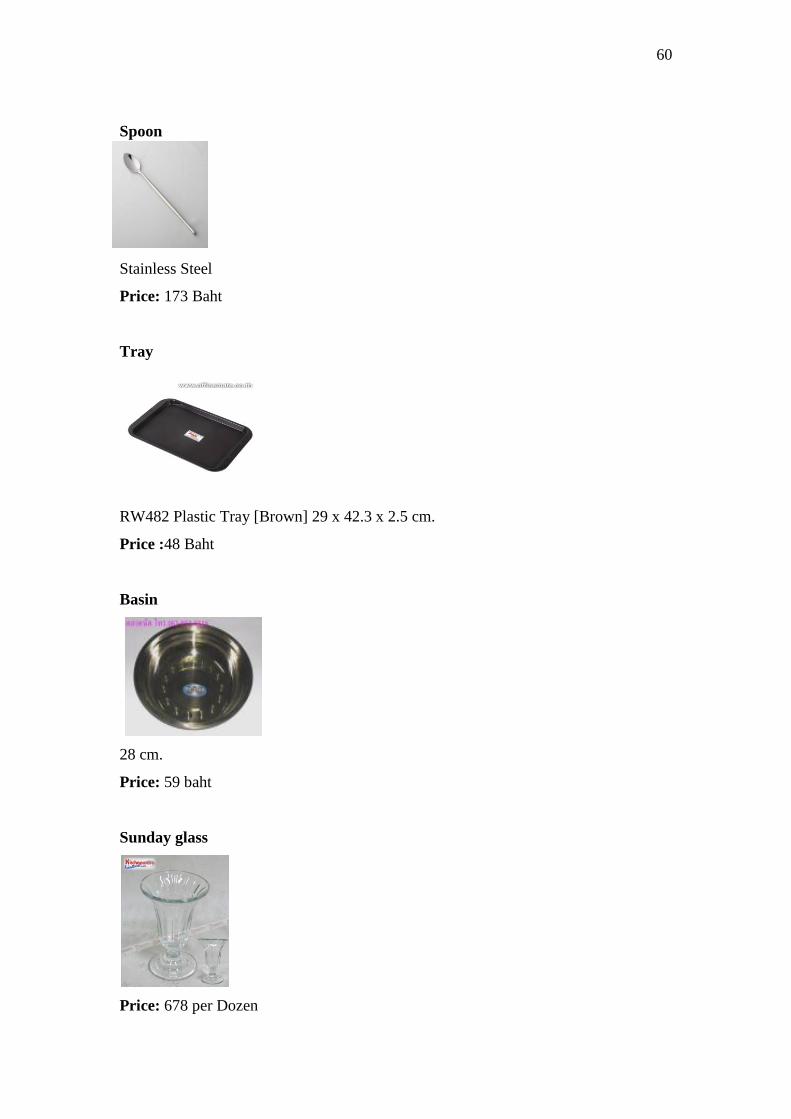
60
Spoon
Stainless Steel
Price: 173 Baht
Tray
RW482 Plastic Tray [Brown] 29 x 42.3 x 2.5 cm.
Price :48 Baht
Basin
28 cm.
Price: 59 baht
Sunday glass
Price: 678 per Dozen
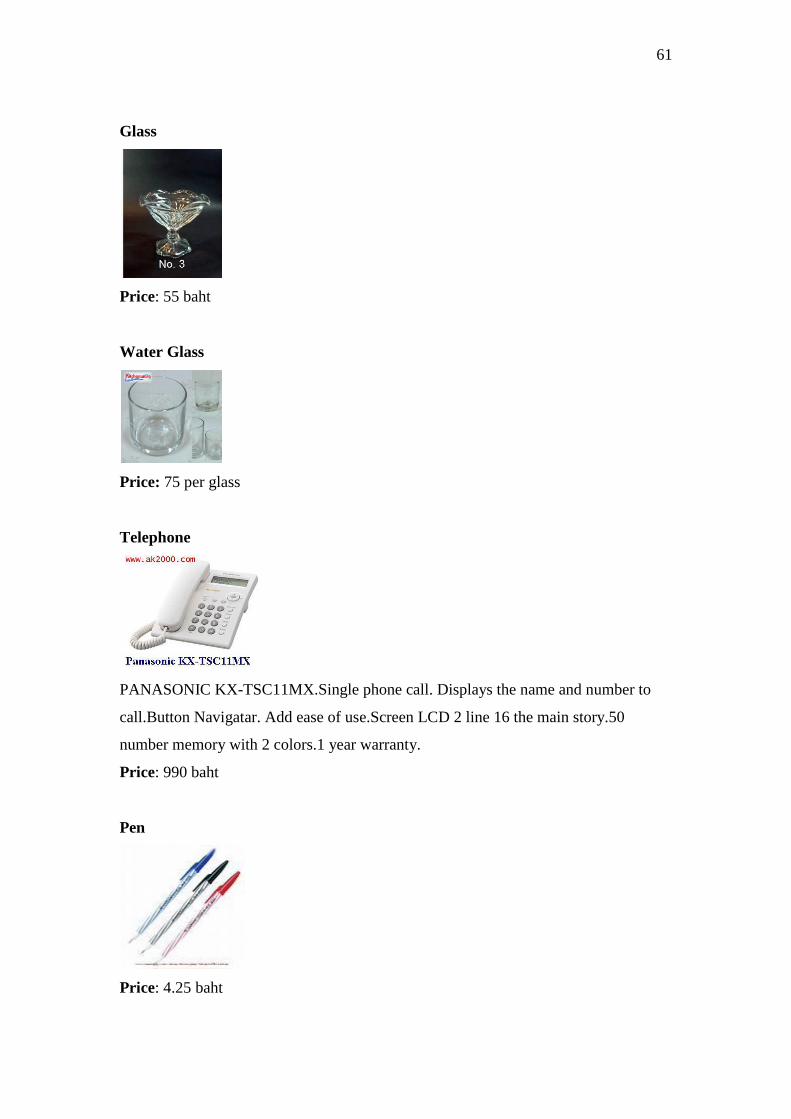
61
Glass
Price: 55 baht
Water Glass
Price: 75 per glass
Telephone
PANASONIC KX-TSC11MX.Single phone call. Displays the name and number to
call.Button Navigatar. Add ease of use.Screen LCD 2 line 16 the main story.50
number memory with 2 colors.1 year warranty.
Price: 990 baht
Pen
Price: 4.25 baht

62
Napkin
Width: 22 inch, Length: 22 inch
Price: 130 baht
Order
Size 3.75” x 5.25”
Price: 25 baht per book
Tissue Paper
1,000 sheet
Price:748 baht
Dishwashing liquid
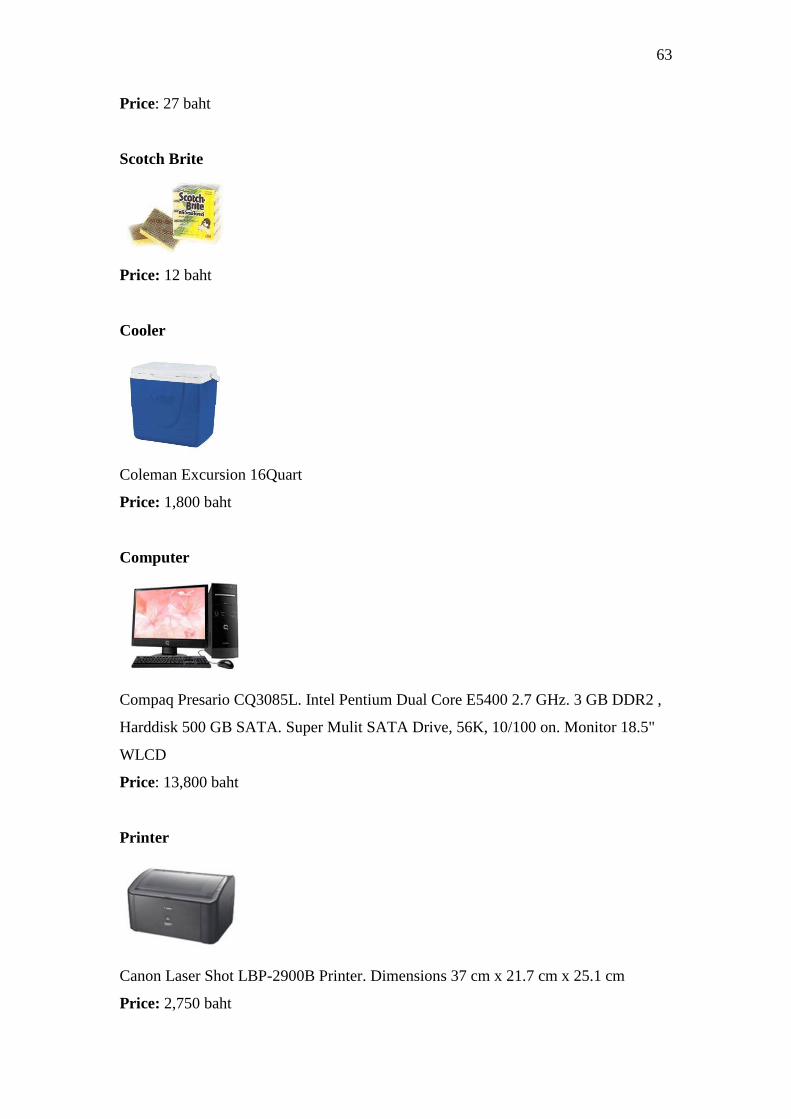
63
Price: 27 baht
Scotch Brite
Price: 12 baht
Cooler
Coleman Excursion 16Quart
Price: 1,800 baht
Computer
Compaq Presario CQ3085L. Intel Pentium Dual Core E5400 2.7 GHz. 3 GB DDR2 ,
Harddisk 500 GB SATA. Super Mulit SATA Drive, 56K, 10/100 on. Monitor 18.5"
WLCD
Price: 13,800 baht
Printer
Canon Laser Shot LBP-2900B Printer. Dimensions 37 cm x 21.7 cm x 25.1 cm
Price: 2,750 baht
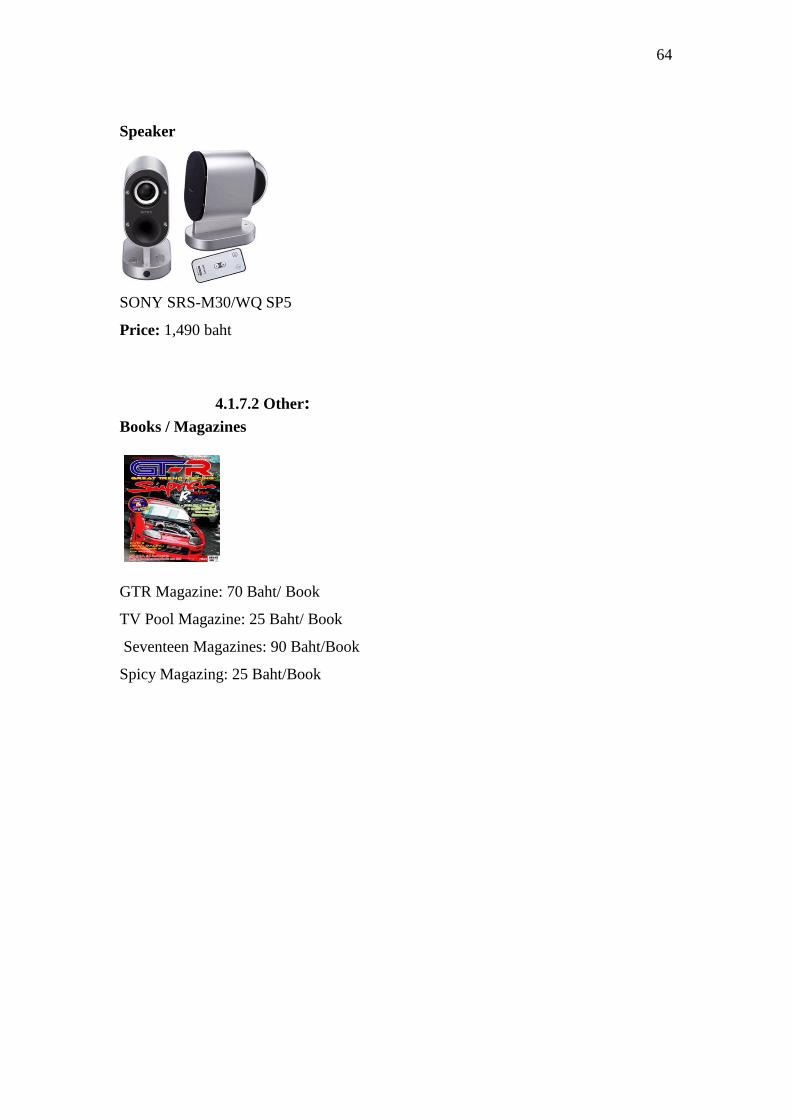
64
Speaker
SONY SRS-M30/WQ SP5
Price: 1,490 baht
4.1.7.2 Other:
Books / Magazines
GTR Magazine: 70 Baht/ Book
TV Pool Magazine: 25 Baht/ Book
Seventeen Magazines: 90 Baht/Book
Spicy Magazing: 25 Baht/Book

65
4.1.8 Facility Management
4.1.8.1 Electricity: Normal Value
Electric
(Baht/Unit)
Service
(Baht
/ Month)
1.1.1 Using electricity lower than 150 units/month 8.19
First 5 Units (Unit 0 - 5) 0
Next 10 Units (Unit 6 - 15) 1.3576
Next 10 Units (Unit 16 – 25) 1.5445
Next 10 Units (Unit 26 – 35) 1.7968
Next 65 Units (Unit 36 - 100) 2.1800
Next 50 Units (Unit 101 - 150) 2.2734
Next 250 Units (Unit 151 - 400) 2.7781
More than 400 Units (Unit 401-XXX) 2.9780
1.1.2 Using electricity more than 150 units/month 40.90
First 150 units (Unit 0 - 150) 1.8047
Next 250 units (Unit 151 - 400) 2.7781
More than 400 units (Unit 401- XXX) 2.9780
4.1.8.2 Advertisement’s Tax
4.1.8.2.1 A board which contain all of Thai language; 3 baht/500cm2
4.1.8.2.2 A board which contain both Thai and English, images or any
signs; 20 baht / 500 cm2
4.1.8.2.3 For these boards; 40 baht / 500 cm2
4.1.8.2.3.1 A board with no Thai language
4.1.8.2.3.2 A board with a few Thai language, and place under or lower
than other language
4.1.8.2.4 For any boards that paid already, you must pay more than the
normal cost, if you fix a board which make a rate of tax paying change; following
[1],[2] and [3].
4.1.8.2.5 The lowest cost of any board is 200 baht.

66
4.2 Cost of Investment
4.2.1 Rent
4.2.1.1 Rental Rate
Rental Fee baht 270/sq.m. Service Charge Baht 120/sq.m. Rental Exemption 4
Months (Holidays): March, April, May and October. According to the plan Zdravo
siam will be placed at room number 41 with the rental fee of 270 Bath / Sq.m. Plus
the service charge for 120 Bath /Sq.m. so the total rent cost per Sq.m. are 390 Bath
/Sq.m. Room number 41 will consists of 54.85 Sq.m. so the total rent for one month
are 390 x 54.85 = 21,391 baht per month, Thus For the whole year of rental cost are
21,391 x 12 = 256,692 but there are an exemption for 4 months on March , April ,
May and October so the total of rental cost will be deduction to 256,692 – (21391 x 4)
= 171,128 baht per year.
4.2.2 Total Pre operation cost
Pre-operation cost Total price
Forward Rental(3month) 64,173
Permission to produce food 800
Sacia Tax 385
Total 65,358
4.3 Investment Cost
Equipment 347,090
Decoration 500,000
Total 847,090
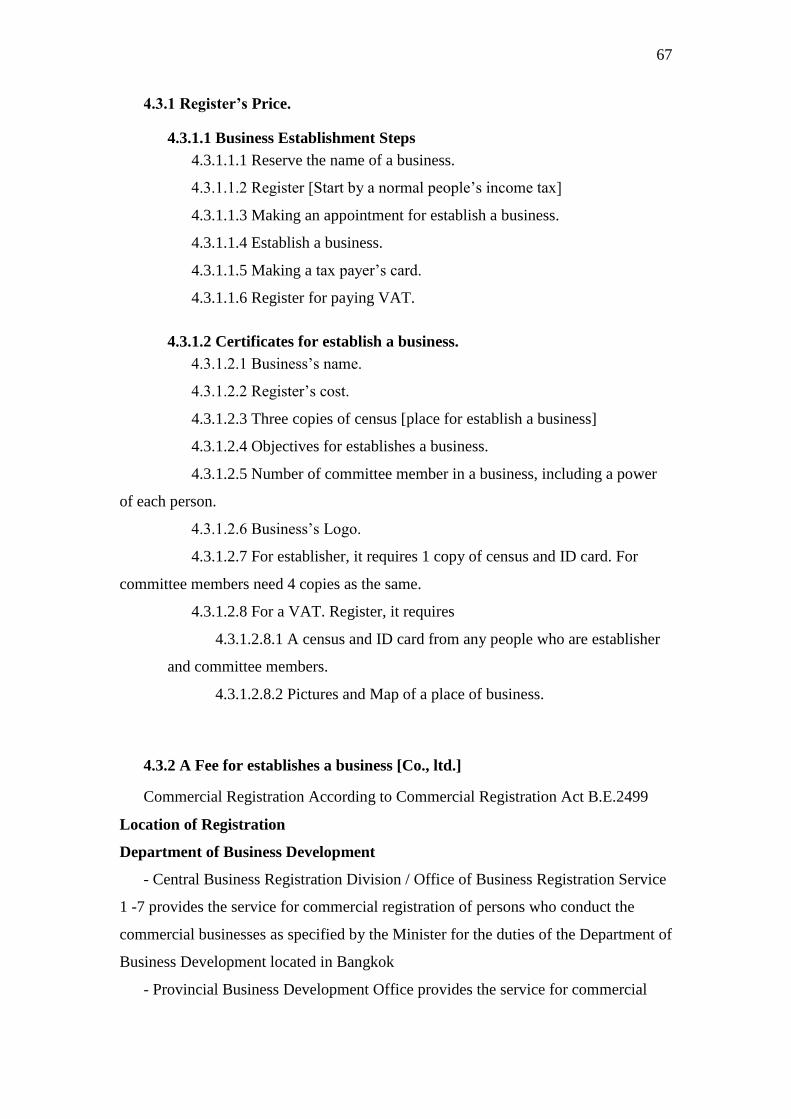
67
4.3.1 Register’s Price.
4.3.1.1 Business Establishment Steps
4.3.1.1.1 Reserve the name of a business.
4.3.1.1.2 Register [Start by a normal people’s income tax]
4.3.1.1.3 Making an appointment for establish a business.
4.3.1.1.4 Establish a business.
4.3.1.1.5 Making a tax payer’s card.
4.3.1.1.6 Register for paying VAT.
4.3.1.2 Certificates for establish a business.
4.3.1.2.1 Business’s name.
4.3.1.2.2 Register’s cost.
4.3.1.2.3 Three copies of census [place for establish a business]
4.3.1.2.4 Objectives for establishes a business.
4.3.1.2.5 Number of committee member in a business, including a power
of each person.
4.3.1.2.6 Business’s Logo.
4.3.1.2.7 For establisher, it requires 1 copy of census and ID card. For
committee members need 4 copies as the same.
4.3.1.2.8 For a VAT. Register, it requires
4.3.1.2.8.1 A census and ID card from any people who are establisher
and committee members.
4.3.1.2.8.2 Pictures and Map of a place of business.
4.3.2 A Fee for establishes a business [Co., ltd.]
Commercial Registration According to Commercial Registration Act B.E.2499
Location of Registration
Department of Business Development
- Central Business Registration Division / Office of Business Registration Service
1 -7 provides the service for commercial registration of persons who conduct the
commercial businesses as specified by the Minister for the duties of the Department of
Business Development located in Bangkok
- Provincial Business Development Office provides the service for commercial
68
registration of persons who conduct the commercial businesses as specified by the
Minister for the duties of the Department of Business Development located in any
provinces
Period of Time for Commercial Registration
The registration of new commercial businesses must be within 30 days from the
starting date of business
Registration for new commercial business as follows:
1. Registration requisition (Print – out 2 pages)
2. Collateral evidence:
2.1 Copy ID card of person who conducts commercial businesses or partner’s
manager responsible progress doing business in Thailand
2.2 Power of Attorney with duty stamps (In case of Power of Attorney)
Commercial Registration Fee
The request for performing according to the Commercial Registration Act shall
pay the fee according to the type as follows:
(1) New commercial registration of 50 Baht
(2) Request for issuance of replacing license of 30 Baht per copy
(3) Request for verifying the documents of person who conducts commercial
businesses for 20 Baht per time
(4) Request for the officer to copy and certify the copy of document for 30 Baht
per copy
Total of Commercial Registration Fee 150 Baht
Company Limited Registration According to the Civil and Commercial Code
Establishment of Company Limited
To establish the company limited, shall process according to the following:
first must have at least 3 persons signing together in order to prepare Memorandum
and then register. Upon receiving the amount of shares, the director must register as
the company within 3 months from the date of company’s meeting to establish the
company.

69
Information used to register the Memorandum
(1) Company’s name
(2) Location of head office
(3) Objective of the company
(4) Registered capital must be divided into each share with the same value
(5) Name, address, age, occupation and number of shares that persons who
start up the company reserve to buy the shares)
(6) Name, address, age
Registration Procedure
Submit in person can perform according to the following :
(1) In case of registering for the establishment or changing the company’s
name, the persons who start up the company or company’s director shall request for
verifying and reserving the company’s name to confide that such name is not
duplicated or similar to other names pervious registered. Upon reserving the name,
shall request for the registration of memorandum of association within 30 days by
reserving the name in person or via internet at www.dbd.go.th .
(2) Purchase the request and form from the Department of Business
Development or any of 7 business development office or provincial business
development office or download from internet from www.dbd.go.th .
(3) Prepare the request for registration and other attachments to the registrar
for consideration.
(4) Pay the fee according to the officer’s order
(5) If aiming to issue the certificate of registered transactions, shall submit the
request and pay the fee to the officers.
(6) Receive the certificate of registration.
Duties of Company
(1) The company limited must prepare the financial statement once a month in
every 12 months and at least one auditor shall audit to propose to the ordinary
shareholder’s meeting to approve the financial statement within 4 months from the
closing date, and submit the financial statement to the business information service
office, department of business development, or any provincial business development
70
office within 1 month from the date of financial statement’s approval although such
businesses have not yet been started or have not ceased temporarily; otherwise, they
shall have the fine penalty of no more than 50,000 Baht.
(2) The director shall prepare the copy of list of all shareholders’ names that are
holding the share at the time of the annual shareholders’ meeting and the list of
persons who are not the shareholders from the date of the last shareholders’ meeting
and submit to the department of business development or any provincial business
development office within 14 days from the date of the meeting; otherwise, they shall
have the fine penalty of no more than 10,000 Baht.
(3) Must arrange the annual shareholders’ meeting within 6 months from the
juristic person’s registration date, and arrange the next meeting of at least one time for
every 12 months; otherwise, they shall have the fine penalty of no more than 20,000
Baht.
The invitation for the shareholders’ meeting shall be advertised on the local
newspaper for at least one time of at least 7 days before the meeting date, and shall
send via reply mail to every shareholder named in the company’s registration for at
least 7 days before the meeting date, except the invitation for the shareholders’
meeting to vote for the extraordinary resolution shall be sent for at least 14 days
before the meeting date.
(4) Must prepare share certificate to the company’s shareholders; otherwise, they
shall have the fine penalty of no more than 10,000 Baht.
(5) Must prepare the book of shareholders’ registration of the company; otherwise,
they shall have the fine penalty of no more than 20,000 Baht.
(6) Any companies that relocate the location of head office must request for the
registration to the registrar; otherwise, they shall have the fine penalty of no more than
20,000 Baht.
For a register’s cost [1 million baht], it can divide to,
- A normal people’s income tax 500 baht
- Business Establishment Cost 5,000 baht
- Tax and Transcript cost 500 baht
Total [Fee cost] around 6,000 baht

71
4.3.3 Depreciation
Year1 January February March April May June July August SeptemberOctober November December Total
Ice cream maker 2500 2500 2500 2500 2500 2500 2500 2500 2500 2500 2500 2500 30000
Ice cream freezer 1508 1508 1508 1508 1508 1508 1508 1508 1508 1508 1508 1508 18096
Ice freezer display 767 767 767 767 767 767 767 767 767 767 767 767 9200
cash registration 583 583 583 583 583 583 583 583 583 583 583 583 7000
Total 5358 5358 5358 5358 5358 5358 5358 5358 5358 5358 5358 5358 64296
Year2 January February March April May June July August SeptemberOctober November December Total
Ice cream maker 2500 2500 2500 2500 2500 2500 2500 2500 2500 2500 2500 2500 30000
Ice cream freezer 1508 1508 1508 1508 1508 1508 1508 1508 1508 1508 1508 1508 18096
Ice freezer display 767 767 767 767 767 767 767 767 767 767 767 767 9200
cash registration 583 583 583 583 583 583 583 583 583 583 583 583 7000
Total 5358 5358 5358 5358 5358 5358 5358 5358 5358 5358 5358 5358 64296
Year3 January February March April May June July August SeptemberOctober November December Total
Ice cream maker 2500 2500 2500 2500 2500 2500 2500 2500 2500 2500 2500 2500 30000
Ice cream freezer 1508 1508 1508 1508 1508 1508 1508 1508 1508 1508 1508 1508 18096
Ice freezer display 767 767 767 767 767 767 767 767 767 767 767 767 9200
cash registration 583 583 583 583 583 583 583 583 583 583 583 583 7000
Total 5358 5358 5358 5358 5358 5358 5358 5358 5358 5358 5358 5358 64296
Year4 January February March April May June July August SeptemberOctober November December Total
Ice cream maker 2500 2500 2500 2500 2500 2500 2500 2500 2500 2500 2500 2500 30000
Ice cream freezer 1508 1508 1508 1508 1508 1508 1508 1508 1508 1508 1508 1508 18096
Ice freezer display 767 767 767 767 767 767 767 767 767 767 767 767 9200
cash registration 583 583 583 583 583 583 583 583 583 583 583 583 7000
Total 5358 5358 5358 5358 5358 5358 5358 5358 5358 5358 5358 5358 64296
Year5 January February March April May June July August SeptemberOctober November December Total
Ice cream maker 2500 2500 2500 2500 2500 2500 2500 2500 2500 2500 2500 2500 30000
Ice cream freezer 1508 1508 1508 1508 1508 1508 1508 1508 1508 1508 1508 1508 18096
Ice freezer display 767 767 767 767 767 767 767 767 767 767 767 767 9200
cash registration 583 583 583 583 583 583 583 583 583 583 583 583 7000
Total 5358 5358 5358 5358 5358 5358 5358 5358 5358 5358 5358 5358 64296

72
4.4 Operating Cost
4.4.1 Raw material Cost
Fruits
Banana
Price: 190 baht / kg
Orange
Price: 24.50 baht / kg
Lynchee
Price: 80 baht / kg
Strawberry
Price: 145 baht / kg

73
White malt
Price: 98 baht
Sugar
Price: 24 baht per kg.
Whole milk power 500 g.
Price: 102 baht
Rum 30 g.
Price: 60 baht
Whip cream 500 g.
Price: 230 baht
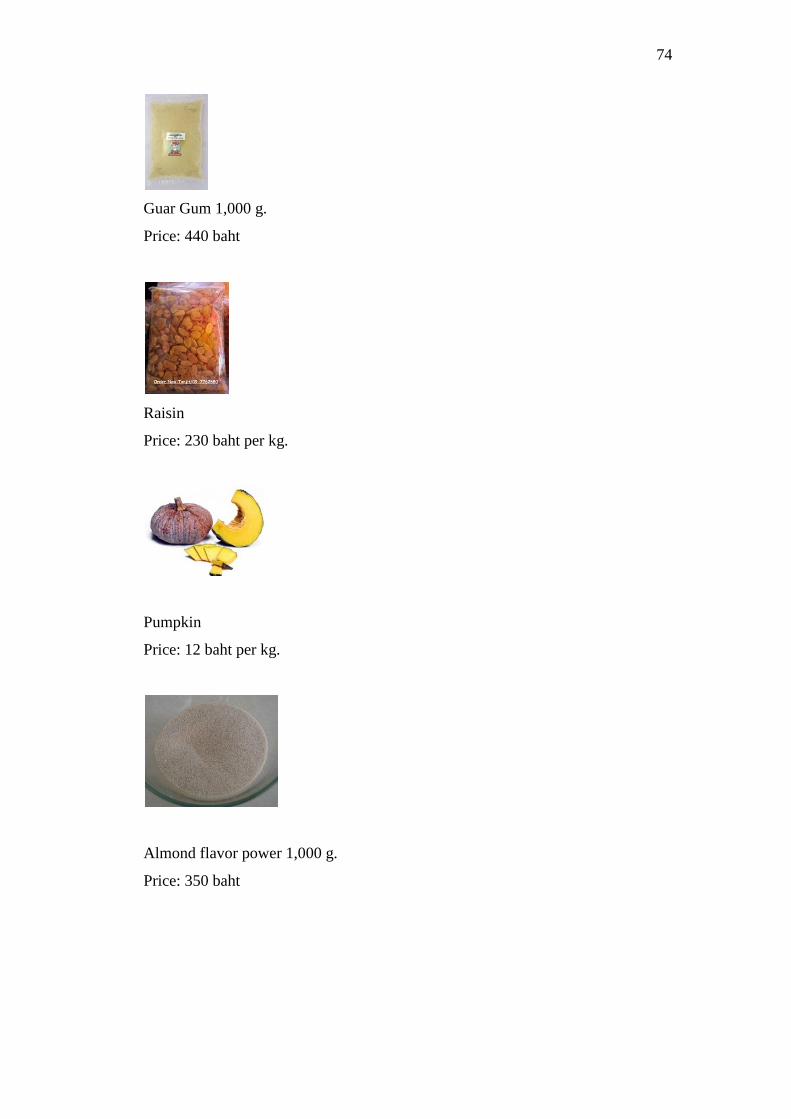
74
Guar Gum 1,000 g.
Price: 440 baht
Raisin
Price: 230 baht per kg.
Pumpkin
Price: 12 baht per kg.
Almond flavor power 1,000 g.
Price: 350 baht

75
Peppermint flavor power 1,000 g.
Price: 350 baht
Green tea power 500 g.
Price: 280 baht
Milk tea power 500 g.
Price 120 baht
Egg
Price: 3.20 baht per egg

76
Pineapple Juice 1,000 ml.
Price: 420 baht per dozen
Vanilla flavor 30 g.
Price: 60 baht
Chocolate flavor
Price: 60 baht
Salt
Price: 10 baht per kg.
Whipping Cream Bottle 1 Liter
Price: 2000 Baht

77
“CHANTYPAK” Whipping Cream
Price 150 Baht/ Box
Gas (use with whipping cream bottom)
Price: 1,700 per ten bottoms
Topping (Chocolate, Butterscotch, Caramel, Pineapple, Blueberry, Strawberry)
Weight 600 g.
Price: 65 baht per bottom
Fresh Milk
Price: 82 baht per dozen
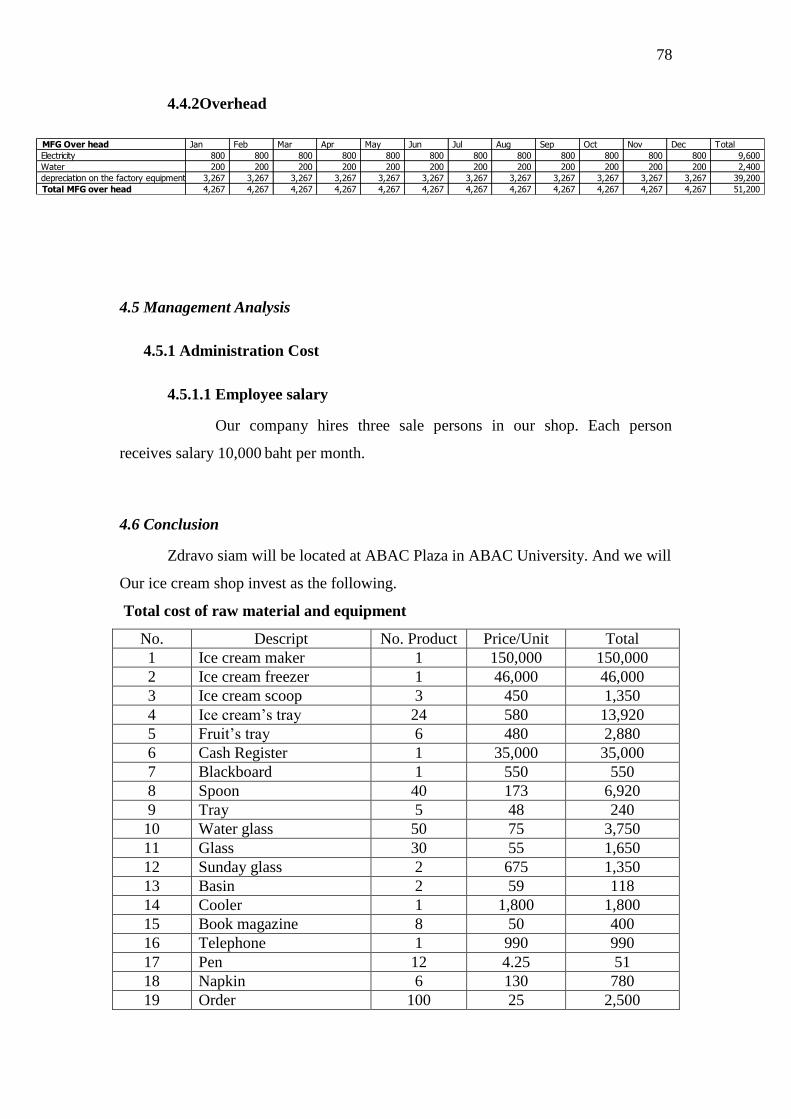
78
4.4.2Overhead
4.5 Management Analysis
4.5.1 Administration Cost
4.5.1.1 Employee salary
Our company hires three sale persons in our shop. Each person
receives salary 10,000 baht per month.
4.6 Conclusion
Zdravo siam will be located at ABAC Plaza in ABAC University. And we will
Our ice cream shop invest as the following.
Total cost of raw material and equipment
No. Descript No. Product Price/Unit Total
1 Ice cream maker 1 150,000 150,000
2 Ice cream freezer 1 46,000 46,000
3 Ice cream scoop 3 450 1,350
4 Ice cream’s tray 24 580 13,920
5 Fruit’s tray 6 480 2,880
6 Cash Register 1 35,000 35,000
7 Blackboard 1 550 550
8 Spoon 40 173 6,920
9 Tray 5 48 240
10 Water glass 50 75 3,750
11 Glass 30 55 1,650
12 Sunday glass 2 675 1,350
13 Basin 2 59 118
14 Cooler 1 1,800 1,800
15 Book magazine 8 50 400
16 Telephone 1 990 990
17 Pen 12 4.25 51
18 Napkin 6 130 780
19 Order 100 25 2,500
MFG Over head Jan Feb Mar Apr May Jun Jul Aug Sep Oct Nov Dec Total
Electricity 800 800 800 800 800 800 800 800 800 800 800 800 9,600
Water 200 200 200 200 200 200 200 200 200 200 200 200 2,400
depreciation on the factory equipment 3,267 3,267 3,267 3,267 3,267 3,267 3,267 3,267 3,267 3,267 3,267 3,267 39,200
Total MFG over head 4,267 4,267 4,267 4,267 4,267 4,267 4,267 4,267 4,267 4,267 4,267 4,267 51,200

79
20 Tissue Paper 12 748 8,976
21 Dishwashing liquid 1 27 27
22 Scotch Brite 2 12 24
23 Banana 5 190 950
24 Orange 5 24.5 122.5
25 Lynches 5 80 400
26 Strawberry 5 145 725
27 White malt 5 98 490
28 Sugar 5 24 120
29 Whole milk 5 102 510
30 Rum 6 60 360
31 Whip cream 6 230 1,380
32 Guar Gum 6 440 2,640
33 Raisin 6 230 1,380
34 Pumpkin 6 12 72
35 Almond 6 350 2,100
36 Green tea flavor 6 280 1,680
37 Milk tea flavor 6 120 720
38 Egg 60 3.20 192
39 Pineapple Juice 1 420 420
40 Vanilla 6 60 360
41 Chocolate 6 60 360
42 salt 1 10 10
43 Whipping Cream Bottom 1 2,000 2,000
44 Whipping Cream 3 150 450
45 Gas 10 170 1,700
46 Topping 6 65 390
47 Fresh Milk 1 82 82
48 Computer 1 13,800 13,800
49 Printer 1 2,750 2,750
50 Speaker 1 1,490 1,490
Total 495 316,930
So the total amount of investment will be equal 816,930+65,385 =882,315 but we will
loan the money from the investor for 900,000
80
Chapter 5
Financial Analysis

81
Year1 January February March April May June July August September October November December
Revenue
Sale 62,370 72,765 31,185 20,790 20,790 103,950 83,160 103,950 124,740 145,530 135,135 135,135
Total Revenue 62,370 72,765 31,185 20,790 20,790 103,950 83,160 103,950 124,740 145,530 135,135 135,135
Cost of goods Sold
Direct Material 10 10 10 10 10 10 10 10 10 10 10 10
Direct Labor 6,000 6,000 6,000 6,000 6,000 6,000 6,000 6,000 6,000 6,000 6,000 6,000
MFG overhead 3,817 3,817 3,817 3,817 3,817 3,817 3,817 3,817 3,817 3,817 3,817 3,817
Total cost of Goods sold 9,827 9,827 9,827 9,827 9,827 9,827 9,827 9,827 9,827 9,827 9,827 9,827
Gross income 52,543 62,938 21,358 10,963 10,963 94,123 73,333 94,123 114,913 135,703 125,308 125,308
Operating Expense
Marketing expense 792 734 666 524 624 860 876 860 1,044 1,028 1,086 986
Rent 21,391 21,391 - - - 21,391 21,391 21,391 21,391 - 21,391 21,391
Depreciation 1,350 1,350 1,350 1,350 1,350 1,350 1,350 1,350 1,350 1,350 1,350 1,350
Selling&Adminstration 30,000 30,000 30,000 30,000 30,000 30,000 30,000 30,000 30,000 30,000 30,000 30,000
Total Operating Expense 53,533 53,475 32,016 31,874 31,974 53,601 53,617 53,601 53,785 32,378 53,827 53,727
Net income before interest & Tax 990- 9,463 10,658- 20,911- 21,011- 40,522 19,716 40,522 61,128 103,325 71,481 71,581
Operating income(loss)
Other income(expense) - - - - - - - - - - - -
Interest expense 11,250 11,123 10,994 10,864 10,732 10,599 10,464 10,327 10,188 10,048 9,906 9,762
Total Operating income 11,250 11,123 10,994 10,864 10,732 10,599 10,464 10,327 10,188 10,048 9,906 9,762
Income (Loss) Before Taxes 12,240- 1,660- 21,652- 31,775- 31,743- 29,923 9,253 30,195 50,940 93,277 61,575 61,819
Provision (Benefit) for income taxes 8,977 9,059 15,282 27,983 18,473 18,546
Net income (Loss) for the year 12,240- 1,660- 21,652- 31,775- 31,743- 20,946 9,253 21,137 35,658 65,294 43,103 43,273
Retained Earning beginning of the months - 12,240- 13,899- 35,551- 67,326- 99,069- 78,123- 68,870- 47,733- 12,075- 53,219 96,321
Retained Earnings 12,240- 13,899- 35,551- 67,326- 99,069- 78,123- 68,870- 47,733- 12,075- 53,219 96,321 139,595
Chapter 5
5.1 Profit and loss statement
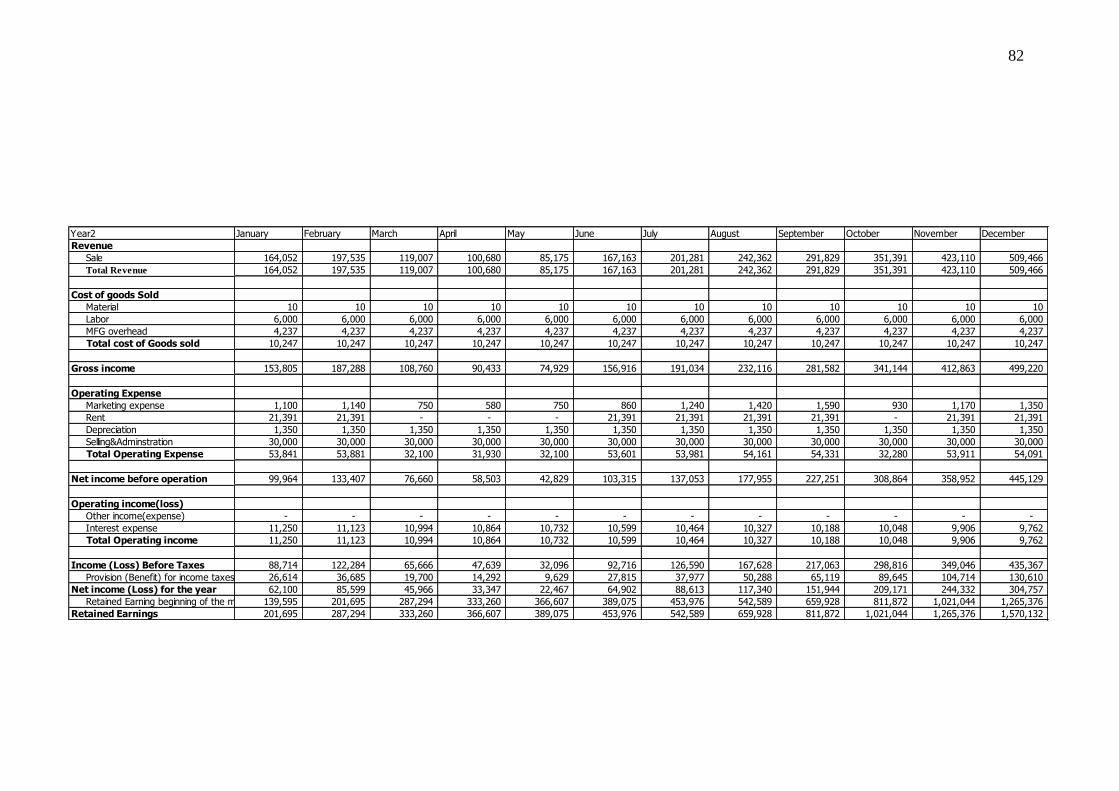
82
Year2 January February March April May June July August September October November December
Revenue
Sale 164,052 197,535 119,007 100,680 85,175 167,163 201,281 242,362 291,829 351,391 423,110 509,466
Total Revenue 164,052 197,535 119,007 100,680 85,175 167,163 201,281 242,362 291,829 351,391 423,110 509,466
Cost of goods Sold
Material 10 10 10 10 10 10 10 10 10 10 10 10
Labor 6,000 6,000 6,000 6,000 6,000 6,000 6,000 6,000 6,000 6,000 6,000 6,000
MFG overhead 4,237 4,237 4,237 4,237 4,237 4,237 4,237 4,237 4,237 4,237 4,237 4,237
Total cost of Goods sold 10,247 10,247 10,247 10,247 10,247 10,247 10,247 10,247 10,247 10,247 10,247 10,247
Gross income 153,805 187,288 108,760 90,433 74,929 156,916 191,034 232,116 281,582 341,144 412,863 499,220
Operating Expense
Marketing expense 1,100 1,140 750 580 750 860 1,240 1,420 1,590 930 1,170 1,350
Rent 21,391 21,391 - - - 21,391 21,391 21,391 21,391 - 21,391 21,391
Depreciation 1,350 1,350 1,350 1,350 1,350 1,350 1,350 1,350 1,350 1,350 1,350 1,350
Selling&Adminstration 30,000 30,000 30,000 30,000 30,000 30,000 30,000 30,000 30,000 30,000 30,000 30,000
Total Operating Expense 53,841 53,881 32,100 31,930 32,100 53,601 53,981 54,161 54,331 32,280 53,911 54,091
Net income before operation 99,964 133,407 76,660 58,503 42,829 103,315 137,053 177,955 227,251 308,864 358,952 445,129
Operating income(loss)
Other income(expense) - - - - - - - - - - - -
Interest expense 11,250 11,123 10,994 10,864 10,732 10,599 10,464 10,327 10,188 10,048 9,906 9,762
Total Operating income 11,250 11,123 10,994 10,864 10,732 10,599 10,464 10,327 10,188 10,048 9,906 9,762
Income (Loss) Before Taxes 88,714 122,284 65,666 47,639 32,096 92,716 126,590 167,628 217,063 298,816 349,046 435,367
Provision (Benefit) for income taxes 26,614 36,685 19,700 14,292 9,629 27,815 37,977 50,288 65,119 89,645 104,714 130,610
Net income (Loss) for the year 62,100 85,599 45,966 33,347 22,467 64,902 88,613 117,340 151,944 209,171 244,332 304,757
Retained Earning beginning of the months 139,595 201,695 287,294 333,260 366,607 389,075 453,976 542,589 659,928 811,872 1,021,044 1,265,376
Retained Earnings 201,695 287,294 333,260 366,607 389,075 453,976 542,589 659,928 811,872 1,021,044 1,265,376 1,570,132
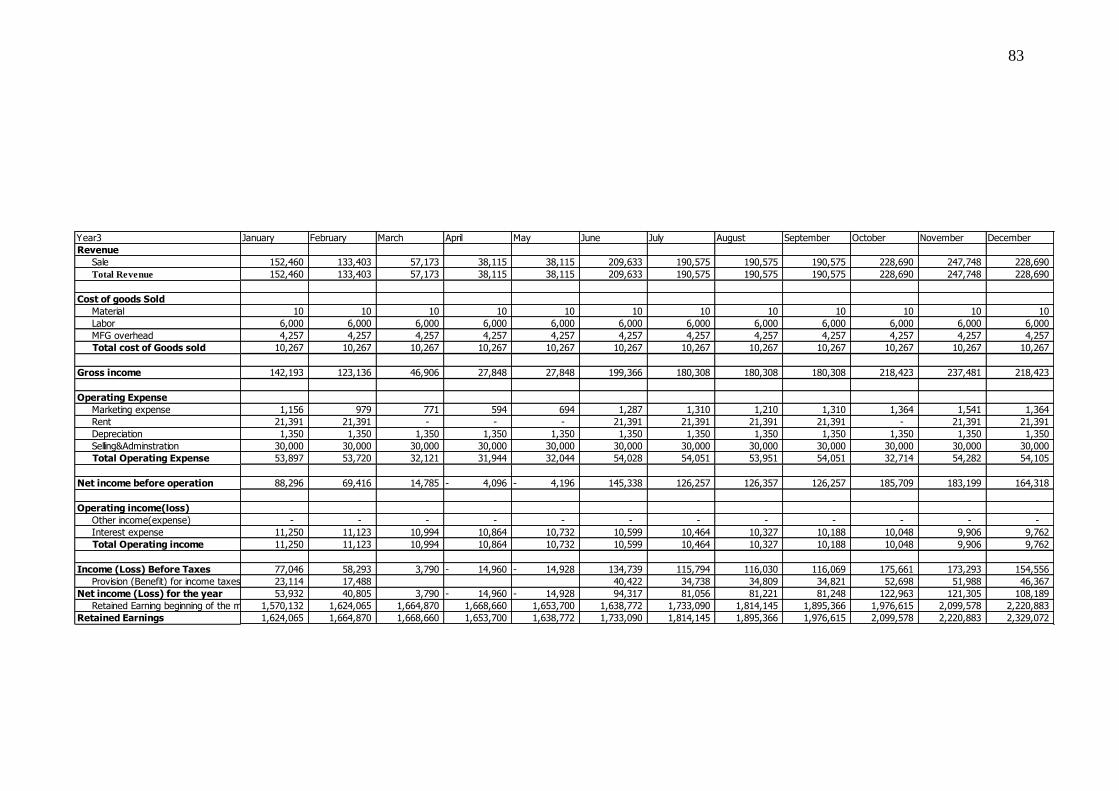
83
Year3 January February March April May June July August September October November December
Revenue
Sale 152,460 133,403 57,173 38,115 38,115 209,633 190,575 190,575 190,575 228,690 247,748 228,690
Total Revenue 152,460 133,403 57,173 38,115 38,115 209,633 190,575 190,575 190,575 228,690 247,748 228,690
Cost of goods Sold
Material 10 10 10 10 10 10 10 10 10 10 10 10
Labor 6,000 6,000 6,000 6,000 6,000 6,000 6,000 6,000 6,000 6,000 6,000 6,000
MFG overhead 4,257 4,257 4,257 4,257 4,257 4,257 4,257 4,257 4,257 4,257 4,257 4,257
Total cost of Goods sold 10,267 10,267 10,267 10,267 10,267 10,267 10,267 10,267 10,267 10,267 10,267 10,267
Gross income 142,193 123,136 46,906 27,848 27,848 199,366 180,308 180,308 180,308 218,423 237,481 218,423
Operating Expense
Marketing expense 1,156 979 771 594 694 1,287 1,310 1,210 1,310 1,364 1,541 1,364
Rent 21,391 21,391 - - - 21,391 21,391 21,391 21,391 - 21,391 21,391
Depreciation 1,350 1,350 1,350 1,350 1,350 1,350 1,350 1,350 1,350 1,350 1,350 1,350
Selling&Adminstration 30,000 30,000 30,000 30,000 30,000 30,000 30,000 30,000 30,000 30,000 30,000 30,000
Total Operating Expense 53,897 53,720 32,121 31,944 32,044 54,028 54,051 53,951 54,051 32,714 54,282 54,105
Net income before operation 88,296 69,416 14,785 4,096- 4,196- 145,338 126,257 126,357 126,257 185,709 183,199 164,318
Operating income(loss)
Other income(expense) - - - - - - - - - - - -
Interest expense 11,250 11,123 10,994 10,864 10,732 10,599 10,464 10,327 10,188 10,048 9,906 9,762
Total Operating income 11,250 11,123 10,994 10,864 10,732 10,599 10,464 10,327 10,188 10,048 9,906 9,762
Income (Loss) Before Taxes 77,046 58,293 3,790 14,960- 14,928- 134,739 115,794 116,030 116,069 175,661 173,293 154,556
Provision (Benefit) for income taxes 23,114 17,488 40,422 34,738 34,809 34,821 52,698 51,988 46,367
Net income (Loss) for the year 53,932 40,805 3,790 14,960- 14,928- 94,317 81,056 81,221 81,248 122,963 121,305 108,189
Retained Earning beginning of the months1,570,132 1,624,065 1,664,870 1,668,660 1,653,700 1,638,772 1,733,090 1,814,145 1,895,366 1,976,615 2,099,578 2,220,883
Retained Earnings 1,624,065 1,664,870 1,668,660 1,653,700 1,638,772 1,733,090 1,814,145 1,895,366 1,976,615 2,099,578 2,220,883 2,329,072
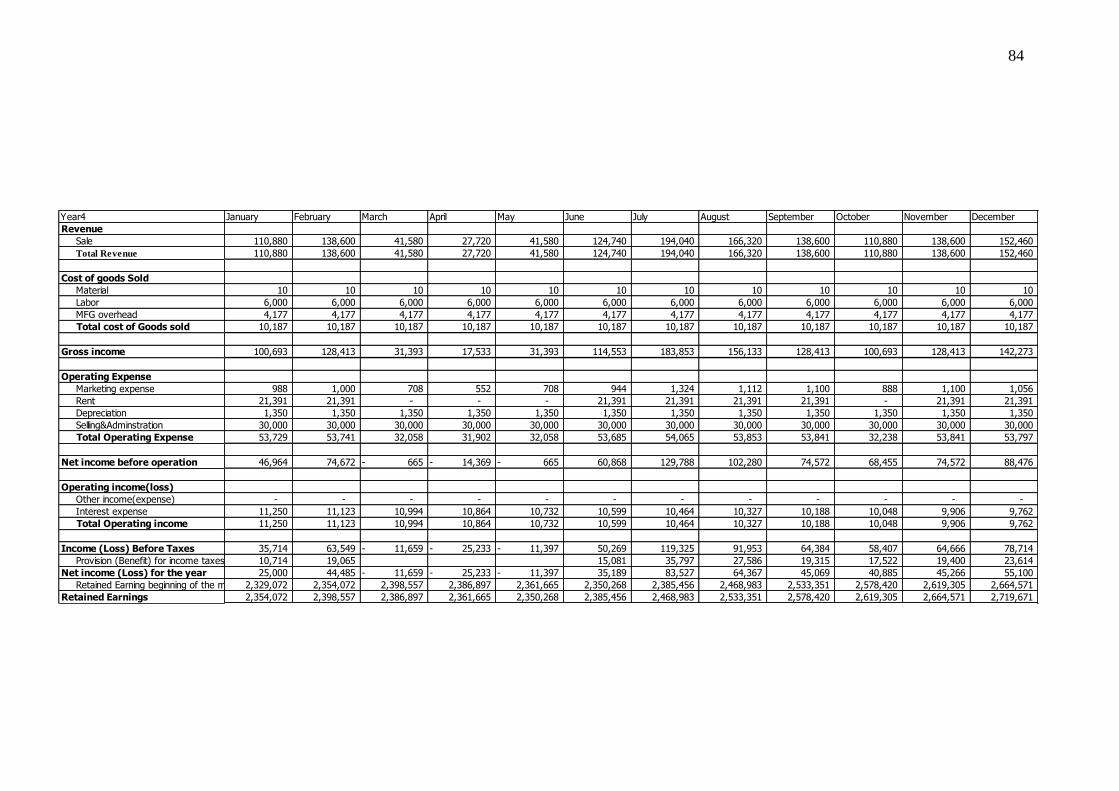
84
Year4 January February March April May June July August September October November December
Revenue
Sale 110,880 138,600 41,580 27,720 41,580 124,740 194,040 166,320 138,600 110,880 138,600 152,460
Total Revenue 110,880 138,600 41,580 27,720 41,580 124,740 194,040 166,320 138,600 110,880 138,600 152,460
Cost of goods Sold
Material 10 10 10 10 10 10 10 10 10 10 10 10
Labor 6,000 6,000 6,000 6,000 6,000 6,000 6,000 6,000 6,000 6,000 6,000 6,000
MFG overhead 4,177 4,177 4,177 4,177 4,177 4,177 4,177 4,177 4,177 4,177 4,177 4,177
Total cost of Goods sold 10,187 10,187 10,187 10,187 10,187 10,187 10,187 10,187 10,187 10,187 10,187 10,187
Gross income 100,693 128,413 31,393 17,533 31,393 114,553 183,853 156,133 128,413 100,693 128,413 142,273
Operating Expense
Marketing expense 988 1,000 708 552 708 944 1,324 1,112 1,100 888 1,100 1,056
Rent 21,391 21,391 - - - 21,391 21,391 21,391 21,391 - 21,391 21,391
Depreciation 1,350 1,350 1,350 1,350 1,350 1,350 1,350 1,350 1,350 1,350 1,350 1,350
Selling&Adminstration 30,000 30,000 30,000 30,000 30,000 30,000 30,000 30,000 30,000 30,000 30,000 30,000
Total Operating Expense 53,729 53,741 32,058 31,902 32,058 53,685 54,065 53,853 53,841 32,238 53,841 53,797
Net income before operation 46,964 74,672 665- 14,369- 665- 60,868 129,788 102,280 74,572 68,455 74,572 88,476
Operating income(loss)
Other income(expense) - - - - - - - - - - - -
Interest expense 11,250 11,123 10,994 10,864 10,732 10,599 10,464 10,327 10,188 10,048 9,906 9,762
Total Operating income 11,250 11,123 10,994 10,864 10,732 10,599 10,464 10,327 10,188 10,048 9,906 9,762
Income (Loss) Before Taxes 35,714 63,549 11,659- 25,233- 11,397- 50,269 119,325 91,953 64,384 58,407 64,666 78,714
Provision (Benefit) for income taxes 10,714 19,065 15,081 35,797 27,586 19,315 17,522 19,400 23,614
Net income (Loss) for the year 25,000 44,485 11,659- 25,233- 11,397- 35,189 83,527 64,367 45,069 40,885 45,266 55,100
Retained Earning beginning of the months2,329,072 2,354,072 2,398,557 2,386,897 2,361,665 2,350,268 2,385,456 2,468,983 2,533,351 2,578,420 2,619,305 2,664,571
Retained Earnings 2,354,072 2,398,557 2,386,897 2,361,665 2,350,268 2,385,456 2,468,983 2,533,351 2,578,420 2,619,305 2,664,571 2,719,671

85
Year5 January February March April May June July August September October November December
Revenue
Sale 173,250 138,600 51,975 34,650 34,650 242,550 207,900 138,600 173,250 173,250 190,575 173,250
Total Revenue 173,250 138,600 51,975 34,650 34,650 242,550 207,900 138,600 173,250 173,250 190,575 173,250
Cost of goods Sold
Material 10 10 10 10 10 10 10 10 10 10 10 10
Labor 6,000 6,000 6,000 6,000 6,000 6,000 6,000 6,000 6,000 6,000 6,000 6,000
MFG overhead 4,237 4,237 4,237 4,237 4,237 4,237 4,237 4,237 4,237 4,237 4,237 4,237
Total cost of Goods sold 10,247 10,247 10,247 10,247 10,247 10,247 10,247 10,247 10,247 10,247 10,247 10,247
Gross income 163,003 128,353 41,728 24,403 24,403 232,303 197,653 128,353 163,003 163,003 180,328 163,003
Operating Expense
Marketing expense 1,240 1,000 750 580 680 1,420 1,380 1,000 1,240 1,140 1,310 1,140
Rent 21,391 21,391 - - - 21,391 21,391 21,391 21,391 - 21,391 21,391
Depreciation 1,350 1,350 1,350 1,350 1,350 1,350 1,350 1,350 1,350 1,350 1,350 1,350
Selling&Adminstration 30,000 30,000 30,000 30,000 30,000 30,000 30,000 30,000 30,000 30,000 30,000 30,000
Total Operating Expense 53,981 53,741 32,100 31,930 32,030 54,161 54,121 53,741 53,981 32,490 54,051 53,881
Net income before operation 109,022 74,612 9,628 7,527- 7,627- 178,142 143,532 74,612 109,022 130,513 126,277 109,122
Operating income(loss)
Other income(expense) - - - - - - - - - - - -
Interest expense 11,250 11,123 10,994 10,864 10,732 10,599 10,464 10,327 10,188 10,048 9,906 9,762
Total Operating income 11,250 11,123 10,994 10,864 10,732 10,599 10,464 10,327 10,188 10,048 9,906 9,762
Income (Loss) Before Taxes 97,772 63,489 1,366- 18,391- 18,359- 167,543 133,069 64,285 98,834 120,465 116,371 99,360
Provision (Benefit) for income taxes 29,332 19,047 50,263 39,921 19,286 29,650 36,140 34,911 29,808
Net income (Loss) for the year 68,441 44,443 1,366- 18,391- 18,359- 117,280 93,148 45,000 69,184 84,326 81,460 69,552
Retained Earning beginning of the months2,719,671 2,788,112 2,832,554 2,831,188 2,812,797 2,794,438 2,911,719 3,004,867 3,049,867 3,119,051 3,203,376 3,284,836
Retained Earnings 2,788,112 2,832,554 2,831,188 2,812,797 2,794,438 2,911,719 3,004,867 3,049,867 3,119,051 3,203,376 3,284,836 3,354,388

86
Operating Cash Flow Jan Feb Mar Apr May Jun Jul Aug Sep Oct Nov Dec
Net Income after Tax - 12,240 - 1,660 - 21,652 - 31,775 - 31,743 20,946 9,253 21,137 35,658 65,294 43,103 43,273+ Depreciation and amortization 5,358 5,358 5,358 5,358 5,358 5,358 5,358 5,358 5,358 5,358 5,358 5,358
+/- Decrease (Increase) in Accounts Receivable+/- Decrease (Increase) in Inventory - 26,220 - 3,432 - 15,312 - 18,282 - 18,282 5,478 - 462 5,478 11,418 17,358 14,388 14,388
+/- Decrease (Increase) in Other Current Assets - - - - - - - - - - - -
+/- Increase (decrease) in Accounts Payable - - - - - - - - - - - - +/- Increase (decrease) in Accrued Expenses - - - - - 8,977 8,977- 9,059 6,224 12,701 9,511- 73 +/- Increase (decrease) in interest paid
Total Operating Cash Flow - 33,102 266 - 31,606 - 44,699 - 44,667 40,759 5,172 41,031 58,658 100,711 53,338 63,093
Investing Cash Flow
+/- Decrease (Increase) in Fixed Assets - 261,160 - - - - - - - - - - -
+/- Decrease (Increase) in Notes Receivable - - - - - - - - - - - - +/- Decrease (Increase) in securities, investments - - - - - - - - - - - - +/- Decrease (Increase) intangible, noncurrent - - - - - - - - - - - -
Total Investing Cash Flow - 261,160 - - - - - - - - - - -
Financing Cash Flow
+/- Increase (decrease) in Borrowings 900,000 - - - - - - - - - - -
Payment in principal - 10,161 - 10,288 - 10,417 - 10,547 - 10,679 - 10,812 - 10,947 - 11,084 - 11,223 - 11,363 - 11,505 - 11,649
- Dividends Paid
Total Financing Cash Flow 889,839 - 10,288 - 10,417 - 10,547 - 10,679 - 10,812 - 10,947 - 11,084 - 11,223 - 11,363 - 11,505 - 11,649
Total Cash Flow 595,577 - 10,022 - 42,023 - 55,246 - 55,346 29,947 - 5,776 29,947 47,435 89,348 41,833 51,444
Cash at beginning of period - 595,577 585,556 543,533 488,288 432,942 462,889 457,114 487,061 534,496 623,844 665,677
Cash at end of period 595,577 585,556 543,533 488,288 432,942 462,889 457,114 487,061 534,496 623,844 665,677 717,121
Y1
5.2Cash flow statement
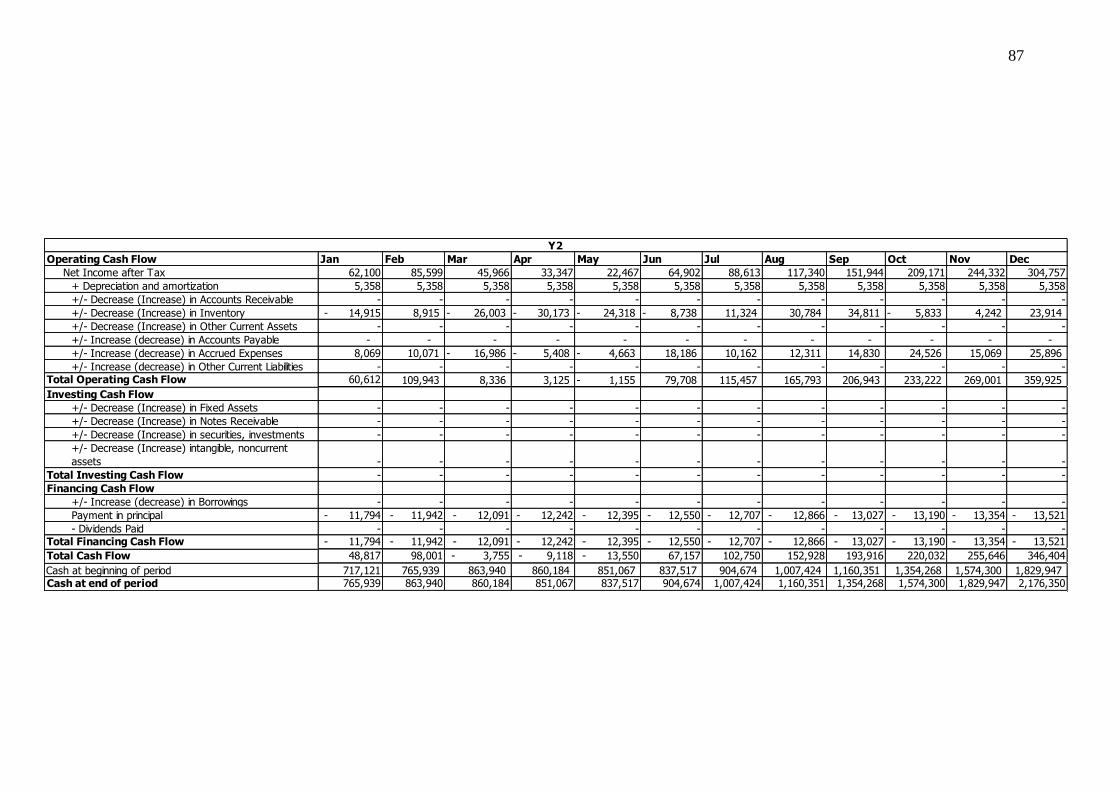
87
Operating Cash Flow Jan Feb Mar Apr May Jun Jul Aug Sep Oct Nov Dec
Net Income after Tax 62,100 85,599 45,966 33,347 22,467 64,902 88,613 117,340 151,944 209,171 244,332 304,757
+ Depreciation and amortization 5,358 5,358 5,358 5,358 5,358 5,358 5,358 5,358 5,358 5,358 5,358 5,358
+/- Decrease (Increase) in Accounts Receivable - - - - - - - - - - - -
+/- Decrease (Increase) in Inventory - 14,915 8,915 26,003- 30,173- 24,318- 8,738- 11,324 30,784 34,811 5,833- 4,242 23,914
+/- Decrease (Increase) in Other Current Assets - - - - - - - - - - - -
+/- Increase (decrease) in Accounts Payable - - - - - - - - - - - -
+/- Increase (decrease) in Accrued Expenses 8,069 10,071 16,986- 5,408- 4,663- 18,186 10,162 12,311 14,830 24,526 15,069 25,896
+/- Increase (decrease) in Other Current Liabilities - - - - - - - - - - - - Total Operating Cash Flow 60,612 109,943 8,336 3,125 1,155- 79,708 115,457 165,793 206,943 233,222 269,001 359,925
Investing Cash Flow
+/- Decrease (Increase) in Fixed Assets - - - - - - - - - - - -
+/- Decrease (Increase) in Notes Receivable - - - - - - - - - - - -
+/- Decrease (Increase) in securities, investments - - - - - - - - - - - -
+/- Decrease (Increase) intangible, noncurrent
assets - - - - - - - - - - - -
Total Investing Cash Flow - - - - - - - - - - - -
Financing Cash Flow
+/- Increase (decrease) in Borrowings - - - - - - - - - - - -
Payment in principal - 11,794 - 11,942 - 12,091 - 12,242 - 12,395 - 12,550 - 12,707 - 12,866 - 13,027 - 13,190 - 13,354 - 13,521
- Dividends Paid - - - - - - - - - - - - Total Financing Cash Flow - 11,794 - 11,942 - 12,091 - 12,242 - 12,395 - 12,550 - 12,707 - 12,866 - 13,027 - 13,190 - 13,354 - 13,521
Total Cash Flow 48,817 98,001 - 3,755 - 9,118 - 13,550 67,157 102,750 152,928 193,916 220,032 255,646 346,404
Cash at beginning of period 717,121 765,939 863,940 860,184 851,067 837,517 904,674 1,007,424 1,160,351 1,354,268 1,574,300 1,829,947 Cash at end of period 765,939 863,940 860,184 851,067 837,517 904,674 1,007,424 1,160,351 1,354,268 1,574,300 1,829,947 2,176,350
Y2

88
Operating Cash Flow Jan Feb Mar Apr May Jun Jul Aug Sep Oct Nov Dec
Net Income before Tax 53,932 40,805 3,790 - 14,960 - 14,928 94,317 81,056 81,221 81,248 122,963 121,305 108,189
+ Depreciation and amortization 5,358 5,358 5,358 5,358 5,358 5,358 5,358 5,358 5,358 5,358 5,358 5,358
+/- Decrease (Increase) in Accounts Receivable - - - - - - - - - - - -
+/- Decrease (Increase) in Inventory - 32,424 4,630- 26,363- 31,545- 31,229- 18,088 12,462 12,338 12,214 22,982 28,197 22,470
+/- Decrease (Increase) in Other Current Assets - - - - - - - - - - - -
+/- Increase (decrease) in Accounts Payable - - - - - - - - - - - -
+/- Increase (decrease) in Accrued Expenses - 107,496 5,626- 17,488- - - 40,422 5,684- 71 12 17,878 711- 5,621-
+/- Increase (decrease) in Other Current Liabilities - - - - - - - - - - - - Total Operating Cash Flow - 80,630 35,907 - 34,703 - 41,147 - 40,799 158,185 93,192 98,988 98,832 169,181 154,150 130,397
Investing Cash Flow
+/- Decrease (Increase) in Fixed Assets - - - - - - - - - - - -
+/- Decrease (Increase) in Notes Receivable - - - - - - - - - - - -
+/- Decrease (Increase) in securities, investments - - - - - - - - - - - -
+/- Decrease (Increase) intangible, noncurrent
assets - - - - - - - - - - - -
Total Investing Cash Flow - - - - - - - - - - - -
Financing Cash Flow
+/- Increase (decrease) in Borrowings - - - - - - - - - - - -
Payment in principal - 13,690 - 13,861 - 14,035 - 14,210 - 14,388 - 14,568 - 14,750 - 14,934 - 15,121 - 15,310 - 15,501 - 15,695
- Dividends Paid - - - - - - - - - - - - Total Financing Cash Flow - 13,690 - 13,861 - 14,035 - 14,210 - 14,388 - 14,568 - 14,750 - 14,934 - 15,121 - 15,310 - 15,501 - 15,695
Total Cash Flow - 94,320 22,046 - 48,738 - 55,357 - 55,187 143,617 78,442 84,054 83,711 153,871 138,648 114,702
Cash at beginning of period 2,176,350 2,082,030 2,104,076 2,055,338 1,999,982 1,944,795 2,088,412 2,166,854 2,250,908 2,334,619 2,488,490 2,627,138 Cash at end of period 2,082,030 2,104,076 2,055,338 1,999,982 1,944,795 2,088,412 2,166,854 2,250,908 2,334,619 2,488,490 2,627,138 2,741,840
Y3

89
Operating Cash Flow Jan Feb Mar Apr May Jun Jul Aug Sep Oct Nov Dec
Net Income before Tax 25,000 44,485 - 11,659 - 25,233 - 11,397 35,189 83,527 64,367 45,069 40,885 45,266 55,100
+ Depreciation and amortization 5,358 5,358 5,358 5,358 5,358 5,358 5,358 5,358 5,358 5,358 5,358 5,358
+/- Decrease (Increase) in Accounts Receivable - - - - - - - - - - - -
+/- Decrease (Increase) in Inventory - 4,168 4,128 23,964- 25,767- 19,488- 6,026 25,283 15,088 5,810 2,633- 5,524 8,987
+/- Decrease (Increase) in Other Current Assets - - - - - - - - - - - -
+/- Increase (decrease) in Accounts Payable - - - - - - - - - - - -
+/- Increase (decrease) in Accrued Expenses - 35,653 8,351 19,065- - - 15,081 20,717 8,211- 8,271- 1,793- 1,878 4,214
+/- Increase (decrease) in Other Current Liabilities - - - - - - - - - - - - Total Operating Cash Flow - 9,462 62,321 - 49,330 - 45,642 - 25,527 61,653 134,885 76,602 47,966 41,817 58,026 73,659
Investing Cash Flow
+/- Decrease (Increase) in Fixed Assets - - - - - - - - - - - -
+/- Decrease (Increase) in Notes Receivable - - - - - - - - - - - -
+/- Decrease (Increase) in securities, investments - - - - - - - - - - - -
+/- Decrease (Increase) intangible, noncurrent
assets - - - - - - - - - - - -
Total Investing Cash Flow - - - - - - - - - - - -
Financing Cash Flow
+/- Increase (decrease) in Borrowings - - - - - - - - - - - -
Payment in principal - 15,891 - 16,090 - 16,291 - 16,495 - 16,701 - 16,909 - 17,121 - 17,335 - 17,552 - 17,771 - 17,993 - 18,218
- Dividends Paid - - - - - - - - - - - - Total Financing Cash Flow - 15,891 - 16,090 - 16,291 - 16,495 - 16,701 - 16,909 - 17,121 - 17,335 - 17,552 - 17,771 - 17,993 - 18,218
Total Cash Flow - 25,353 46,231 - 65,621 - 62,137 - 42,228 44,744 117,764 59,267 30,414 24,046 40,033 55,441
Cash at beginning of period 2,741,840 2,716,487 2,762,718 2,697,097 2,634,960 2,592,733 2,637,476 2,755,241 2,814,508 2,844,922 2,868,969 2,909,002 Cash at end of period 2,716,487 2,762,718 2,697,097 2,634,960 2,592,733 2,637,476 2,755,241 2,814,508 2,844,922 2,868,969 2,909,002 2,964,443
Y4

90
Operating Cash Flow Jan Feb Mar Apr May Jun Jul Aug Sep Oct Nov Dec
Net Income before Tax 68,441 44,443 - 1,366 - 18,391 - 18,359 117,280 93,148 45,000 69,184 84,326 81,460 69,552
+ Depreciation and amortization 5,358 5,358 5,358 5,358 5,358 5,358 5,358 5,358 5,358 5,358 5,358 5,358
+/- Decrease (Increase) in Accounts Receivable - - - - - - - - - - - -
+/- Decrease (Increase) in Inventory 8,425 1,727- 26,426- 30,583- 29,665- 30,625 19,806 588- 9,329 9,049 13,728 8,366
+/- Decrease (Increase) in Other Current Assets - - - - - - - - - - - -
+/- Increase (decrease) in Accounts Payable - - - - - - - - - - - -
+/- Increase (decrease) in Accrued Expenses 5,717 10,285- 19,047- - - 50,263 10,342- 20,635- 10,365 6,489 1,228- 5,103-
+/- Increase (decrease) in Other Current Liabilities - - - - - - - - - - - - Total Operating Cash Flow 87,941 37,788 - 41,480 - 43,616 - 42,666 203,526 107,969 29,135 94,236 105,223 99,318 78,173
Investing Cash Flow
+/- Decrease (Increase) in Fixed Assets - - - - - - - - - - - -
+/- Decrease (Increase) in Notes Receivable - - - - - - - - - - - -
+/- Decrease (Increase) in securities, investments - - - - - - - - - - - -
+/- Decrease (Increase) intangible, noncurrent
assets - - - - - - - - - - - -
Total Investing Cash Flow - - - - - - - - - - - -
Financing Cash Flow
+/- Increase (decrease) in Borrowings - - - - - - - - - - -
Payment in principal - 18,446 - 18,676 - 18,910 - 19,146 - 19,385 - 19,628 - 19,873 - 20,122 - 20,373 - 20,628 - 20,886 - 21,147
- Dividends Paid - - - - - - - - - - - - Total Financing Cash Flow - 18,446 - 18,676 - 18,910 - 19,146 - 19,385 - 19,628 - 19,873 - 20,122 - 20,373 - 20,628 - 20,886 - 21,147
Total Cash Flow 69,496 19,112 - 60,390 - 62,762 - 62,052 183,898 88,096 9,013 73,863 84,595 78,432 57,026
Cash at beginning of period 2,964,443 3,033,939 3,053,051 2,992,660 2,929,899 2,867,847 3,051,745 3,139,841 3,148,855 3,222,717 3,307,312 3,385,744 Cash at end of period 3,033,939 3,053,051 2,992,660 2,929,899 2,867,847 3,051,745 3,139,841 3,148,855 3,222,717 3,307,312 3,385,744 3,442,770
Y5

91
Y1 Jan Feb Mar Apr May Jun Jul Aug Sep Oct Nov Dec
ASSET
Curent Assets
Cash 595,577 585556 543,533 488,288 432,942 462,889 457,114 487,061 534,496 623,844 665,677 717,121
Account Receivable - - - - - - - - - - - -
Inventories (Ending Inventory) 26,220 29652 44,964 63,246 81,528 76,050 76,512 71,034 59,616 42,258 27,870 13,482
Total Current Assets 621,797 615208 588,497 551,534 514,470 538,939 533,626 558,095 594,112 666,102 693,547 730,603
Non Current Assets
Property and Equipment
Machinery and Equipment 261,160 261160 261,160 261,160 261,160 261,160 261,160 261,160 261,160 261,160 261,160 261,160
Total Property and Equipment - 0 - - - - - - - - - -
Less: Accumulated Depreciation 5,358 10716 16,074 21,432 26,790 32,148 37,506 42,864 48,222 53,580 58,938 64,296
Total non current asset 255,802 250444 245,086 239,728 234,370 229,012 223,654 218,296 212,938 207,580 202,222 196,864
TOTAL ASSETS 877,599 865652 833,583 791,262 748,840 767,951 757,280 776,391 807,050 873,682 895,769 927,467
LIABILITY AND EQUITY
LIABILITY
Current Liability
Accounts Payable - - - - - - - - - - - -
Wages Payable - - - - - - - - - - - -
Taxes Payable - - - - - 8,977 - 9,059 15,282 27,983 18,473 18,546
Total Current Liabilities - - - - - 8,977 - 9,059 15,282 27,983 18,473 18,546
Non Current Liability - - - - - - - - - - - -
Long-Term Liability
Long Term Debt 889,839 879,551 869,135 858,588 847,909 837,097 826,150 815,066 803,843 792,480 780,975 769,327
Total Long-term Liability 889,839 879551 869,135 858,588 847,909 837,097 826,150 815,066 803,843 792,480 780,975 769,327
Total Liabilities 889,839 879551 869,135 858,588 847,909 846,074 826,150 824,125 819,125 820,464 799,448 787,872
EQUITY
Capital (asstet-liability) - - - - - - - - - - - -
Retaines Earnings 12,240- -13899 35,551- 67,326- 99,069- 78,123- 68,870- 47,733- 12,075- 53,219 96,321 139,595
Total Equity 12,240- -13899 35,551- 67,326- 99,069- 78,123- 68,870- 47,733- 12,075- 53,219 96,321 139,595
Total liabilities & Equity 877,599 865652 833,583 791,262 748,840 767,951 757,280 776,391 807,050 873,682 895,769 927,467
5.3 Balance sheet
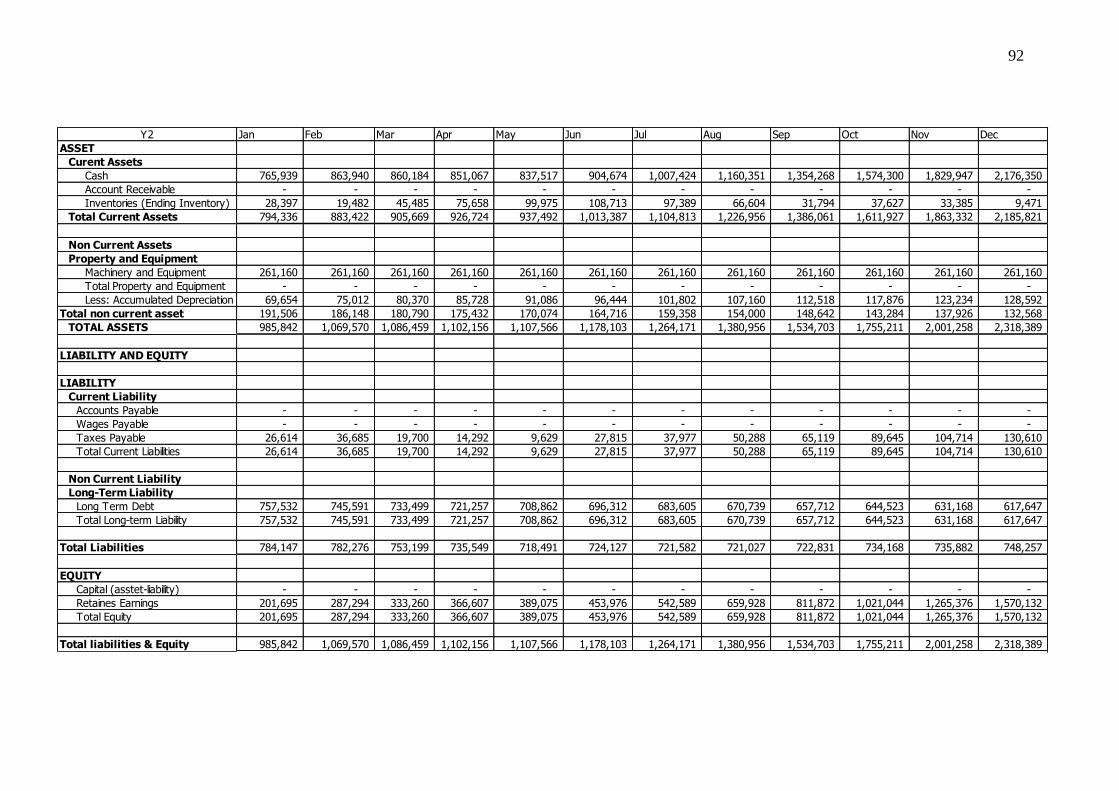
92
Y2 Jan Feb Mar Apr May Jun Jul Aug Sep Oct Nov Dec
ASSET
Curent Assets
Cash 765,939 863,940 860,184 851,067 837,517 904,674 1,007,424 1,160,351 1,354,268 1,574,300 1,829,947 2,176,350
Account Receivable - - - - - - - - - - - -
Inventories (Ending Inventory) 28,397 19,482 45,485 75,658 99,975 108,713 97,389 66,604 31,794 37,627 33,385 9,471
Total Current Assets 794,336 883,422 905,669 926,724 937,492 1,013,387 1,104,813 1,226,956 1,386,061 1,611,927 1,863,332 2,185,821
Non Current Assets
Property and Equipment
Machinery and Equipment 261,160 261,160 261,160 261,160 261,160 261,160 261,160 261,160 261,160 261,160 261,160 261,160
Total Property and Equipment - - - - - - - - - - - -
Less: Accumulated Depreciation 69,654 75,012 80,370 85,728 91,086 96,444 101,802 107,160 112,518 117,876 123,234 128,592
Total non current asset 191,506 186,148 180,790 175,432 170,074 164,716 159,358 154,000 148,642 143,284 137,926 132,568
TOTAL ASSETS 985,842 1,069,570 1,086,459 1,102,156 1,107,566 1,178,103 1,264,171 1,380,956 1,534,703 1,755,211 2,001,258 2,318,389
LIABILITY AND EQUITY
LIABILITY
Current Liability
Accounts Payable - - - - - - - - - - - -
Wages Payable - - - - - - - - - - - -
Taxes Payable 26,614 36,685 19,700 14,292 9,629 27,815 37,977 50,288 65,119 89,645 104,714 130,610
Total Current Liabilities 26,614 36,685 19,700 14,292 9,629 27,815 37,977 50,288 65,119 89,645 104,714 130,610
Non Current Liability
Long-Term Liability
Long Term Debt 757,532 745,591 733,499 721,257 708,862 696,312 683,605 670,739 657,712 644,523 631,168 617,647
Total Long-term Liability 757,532 745,591 733,499 721,257 708,862 696,312 683,605 670,739 657,712 644,523 631,168 617,647
Total Liabilities 784,147 782,276 753,199 735,549 718,491 724,127 721,582 721,027 722,831 734,168 735,882 748,257
EQUITY
Capital (asstet-liability) - - - - - - - - - - - -
Retaines Earnings 201,695 287,294 333,260 366,607 389,075 453,976 542,589 659,928 811,872 1,021,044 1,265,376 1,570,132
Total Equity 201,695 287,294 333,260 366,607 389,075 453,976 542,589 659,928 811,872 1,021,044 1,265,376 1,570,132
Total liabilities & Equity 985,842 1,069,570 1,086,459 1,102,156 1,107,566 1,178,103 1,264,171 1,380,956 1,534,703 1,755,211 2,001,258 2,318,389

93
Y3 Jan Feb Mar Apr May Jun Jul Aug Sep Oct Nov Dec
ASSET
Curent Assets
Cash 2,082,030 2,104,076 2,055,338 1,999,982 1,944,795 2,088,412 2,166,854 2,250,908 2,334,619 2,488,490 2,627,138 2,741,840
Account Receivable - - - - - - - - - - - -
Inventories (Ending Inventory) 41,895 46,525 72,888 104,433 135,662 117,574 105,112 92,775 80,560 57,578 29,381 6,911
Total Current Assets 2,123,925 2,150,601 2,128,227 2,104,415 2,080,457 2,205,986 2,271,966 2,343,683 2,415,180 2,546,068 2,656,520 2,748,751
Non Current Assets
Property and Equipment
Machinery and Equipment 261,160 261,160 261,160 261,160 261,160 261,160 261,160 261,160 261,160 261,160 261,160 261,160
Total Property and Equipment - - - - - - - - - - - -
Less: Accumulated Depreciation 133,950 139,308 144,666 150,024 155,382 160,740 166,098 171,456 176,814 182,172 187,530 192,888
Total non current asset 127,210 121,852 116,494 111,136 105,778 100,420 95,062 89,704 84,346 78,988 73,630 68,272
TOTAL ASSETS 2,251,135 2,272,453 2,244,721 2,215,551 2,186,235 2,306,406 2,367,028 2,433,387 2,499,526 2,625,056 2,730,150 2,817,023
LIABILITY AND EQUITY
LIABILITY
Current Liability
Accounts Payable - - - - - - - - - - - -
Wages Payable - - - - - - - - - - - -
Taxes Payable 23,114 17,488 - - - 40,422 34,738 34,809 34,821 52,698 51,988 46,367
Total Current Liabilities 23,114 17,488 - - - 40,422 34,738 34,809 34,821 52,698 51,988 46,367
Non Current Liability
Long-Term Liability
Long Term Debt 603,957 590,095 576,060 561,850 547,462 532,895 518,145 503,211 488,090 472,780 457,279 441,584
Total Long-term Liability 603,957 590,095 576,060 561,850 547,462 532,895 518,145 503,211 488,090 472,780 457,279 441,584
Total Liabilities 627,071 607,583 576,060 561,850 547,462 573,316 552,883 538,020 522,911 525,479 509,267 487,951
EQUITY
Capital (asstet-liability) - - - - - - - - - - - -
Retaines Earnings 1,624,065 1,664,870 1,668,660 1,653,700 1,638,772 1,733,090 1,814,145 1,895,366 1,976,615 2,099,578 2,220,883 2,329,072
Total Equity 1,624,065 1,664,870 1,668,660 1,653,700 1,638,772 1,733,090 1,814,145 1,895,366 1,976,615 2,099,578 2,220,883 2,329,072
Total liabilities & Equity 2,251,135 2,272,453 2,244,721 2,215,551 2,186,235 2,306,406 2,367,028 2,433,387 2,499,526 2,625,056 2,730,150 2,817,023

94
Y4 Jan Feb Mar Apr May Jun Jul Aug Sep Oct Nov Dec
ASSET
Curent Assets
Cash 2,716,487 2,762,718 2,697,097 2,634,960 2,592,733 2,637,476 2,755,241 2,814,508 2,844,922 2,868,969 2,909,002 2,964,443
Account Receivable - - - - - - - - - - - -
Inventories (Ending Inventory) 11,079 6,951 30,915 56,682 76,170 70,144 44,861 29,773 23,963 26,596 21,072 12,085
Total Current Assets 2,727,565 2,769,669 2,728,012 2,691,642 2,668,903 2,707,621 2,800,102 2,844,281 2,868,885 2,895,565 2,930,074 2,976,528
Non Current Assets
Property and Equipment
Machinery and Equipment 261,160 261,160 261,160 261,160 261,160 261,160 261,160 261,160 261,160 261,160 261,160 261,160
Total Property and Equipment - - - - - - - - - - - -
Less: Accumulated Depreciation 198,246 203,604 208,962 214,320 219,678 225,036 230,394 235,752 241,110 246,468 251,826 257,184
Total non current asset 62,914 57,556 52,198 46,840 41,482 36,124 30,766 25,408 20,050 14,692 9,334 3,976
TOTAL ASSETS 2,790,479 2,827,225 2,780,210 2,738,482 2,710,385 2,743,745 2,830,868 2,869,689 2,888,935 2,910,257 2,939,408 2,980,504
LIABILITY AND EQUITY
LIABILITY
Current Liability
Accounts Payable - - - - - - - - - - - -
Wages Payable - - - - - - - - - - - -
Taxes Payable 10,714 19,065 - - - 15,081 35,797 27,586 19,315 17,522 19,400 23,614
Total Current Liabilities 10,714 19,065 - - - 15,081 35,797 27,586 19,315 17,522 19,400 23,614
Non Current Liability
Long-Term Liability
Long Term Debt 425,693 409,603 393,312 376,818 360,117 343,208 326,087 308,752 291,200 273,430 255,436 237,218
Total Long-term Liability 425,693 409,603 393,312 376,818 360,117 343,208 326,087 308,752 291,200 273,430 255,436 237,218
Total Liabilities 436,407 428,668 393,312 376,818 360,117 358,289 361,884 336,338 310,516 290,952 274,836 260,833
EQUITY
Capital (asstet-liability) - - - - - - - - - - - -
Retaines Earnings 2,354,072 2,398,557 2,386,897 2,361,665 2,350,268 2,385,456 2,468,983 2,533,351 2,578,420 2,619,305 2,664,571 2,719,671
Total Equity 2,354,072 2,398,557 2,386,897 2,361,665 2,350,268 2,385,456 2,468,983 2,533,351 2,578,420 2,619,305 2,664,571 2,719,671
Total liabilities & Equity 2,790,479 2,827,225 2,780,210 2,738,482 2,710,385 2,743,745 2,830,868 2,869,689 2,888,935 2,910,257 2,939,408 2,980,504

95
Y5 Jan Feb Mar Apr May Jun Jul Aug Sep Oct Nov Dec
ASSET
Curent Assets
Cash 3,033,939 3,053,051 2,992,660 2,929,899 2,867,847 3,051,745 3,139,841 3,148,855 3,222,717 3,307,312 3,385,744 3,442,770
Account Receivable - - - - - - - - - - - -
Inventories (Ending Inventory) 3,659 5,387 31,813 62,395 92,061 61,436 41,630 42,219 32,889 23,840 10,112 1,746
Total Current Assets 3,037,598 3,058,438 3,024,473 2,992,294 2,959,908 3,113,181 3,181,472 3,191,073 3,255,607 3,331,152 3,395,856 3,444,516
Non Current Assets
Property and Equipment
Machinery and Equipment 261,160 261,160 261,160 261,160 261,160 261,160 261,160 261,160 261,160 261,160 261,160 261,160
Total Property and Equipment - - - - - - - - - - - -
Less: Accumulated Depreciation 262,542 267,900 273,258 278,616 283,974 289,332 294,690 300,048 305,406 310,764 316,122 321,480
Total non current asset 1,382- 6,740- 12,098- 17,456- 22,814- 28,172- 33,530- 38,888- 44,246- 49,604- 54,962- 60,320-
TOTAL ASSETS 3,036,216 3,051,698 3,012,375 2,974,838 2,937,094 3,085,009 3,147,942 3,152,185 3,211,361 3,281,548 3,340,894 3,384,196
LIABILITY AND EQUITY
LIABILITY
Current Liability
Accounts Payable - - - - - - - - - - - -
Wages Payable - - - - - - - - - - - -
Taxes Payable 29,332 19,047 - - - 50,263 39,921 19,286 29,650 36,140 34,911 29,808
Total Current Liabilities 29,332 19,047 - - - 50,263 39,921 19,286 29,650 36,140 34,911 29,808
Non Current Liability
Long-Term Liability
Long Term Debt 218,773 200,096 181,187 162,041 142,655 123,027 103,154 83,033 62,660 42,032 21,147 0-
Total Long-term Liability 218,773 200,096 181,187 162,041 142,655 123,027 103,154 83,033 62,660 42,032 21,147 0-
Total Liabilities 248,104 219,143 181,187 162,041 142,655 173,290 143,075 102,318 92,310 78,172 56,058 29,808
EQUITY
Capital (asstet-liability) - - - - - - - - - - - -
Retaines Earnings 2,788,112 2,832,554 2,831,188 2,812,797 2,794,438 2,911,719 3,004,867 3,049,867 3,119,051 3,203,376 3,284,836 3,354,388
Total Equity 2,788,112 2,832,554 2,831,188 2,812,797 2,794,438 2,911,719 3,004,867 3,049,867 3,119,051 3,203,376 3,284,836 3,354,388
Total liabilities & Equity 3,036,216 3,051,698 3,012,375 2,974,838 2,937,094 3,085,009 3,147,942 3,152,185 3,211,361 3,281,548 3,340,894 3,384,196

96
Interest Paid Installment paid Total
0 900,000฿
1 1 11,250 10,161 21,411 889,839 11,250
2 1 11,123 10,288 21,411 879,551 22,373
3 1 10,994 10,417 21,411 869,135 33,367
4 1 10,864 10,547 21,411 858,588 44,232
5 1 10,732 10,679 21,411 847,909 54,964
6 1 10,599 10,812 21,411 837,097 65,563
7 1 10,464 10,947 21,411 826,150 76,026
8 1 10,327 11,084 21,411 815,066 86,353
9 1 10,188 11,223 21,411 803,843 96,542
10 1 10,048 11,363 21,411 792,480 106,590
11 1 9,906 11,505 21,411 780,975 116,496
12 1 9,762 11,649 21,411 769,327 126,258
13 2 9,617 11,794 21,411 757,532 135,875
14 2 9,469 11,942 21,411 745,591 145,344
15 2 9,320 12,091 21,411 733,499 154,664
16 2 9,169 12,242 21,411 721,257 163,832
17 2 9,016 12,395 21,411 708,862 172,848
18 2 8,861 12,550 21,411 696,312 181,709
19 2 8,704 12,707 21,411 683,605 190,413
20 2 8,545 12,866 21,411 670,739 198,958
21 2 8,384 13,027 21,411 657,712 207,342
22 2 8,221 13,190 21,411 644,523 215,563
23 2 8,057 13,354 21,411 631,168 223,620
24 2 7,890 13,521 21,411 617,647 231,510
25 3 7,721 13,690 21,411 603,957 239,230
26 3 7,549 13,861 21,411 590,095 246,780
27 3 7,376 14,035 21,411 576,060 254,156
28 3 7,201 14,210 21,411 561,850 261,357
29 3 7,023 14,388 21,411 547,462 268,380
30 3 6,843 14,568 21,411 532,895 275,223
31 3 6,661 14,750 21,411 518,145 281,884
32 3 6,477 14,934 21,411 503,211 288,361
33 3 6,290 15,121 21,411 488,090 294,651
34 3 6,101 15,310 21,411 472,780 300,752
35 3 5,910 15,501 21,411 457,279 306,662
36 3 5,716 15,695 21,411 441,584 312,378
37 4 5,520 15,891 21,411 425,693 317,898
38 4 5,321 16,090 21,411 409,603 323,219
39 4 5,120 16,291 21,411 393,312 328,339
40 4 4,916 16,495 21,411 376,818 333,255
41 4 4,710 16,701 21,411 360,117 337,966
42 4 4,501 16,909 21,411 343,208 342,467
43 4 4,290 17,121 21,411 326,087 346,757
44 4 4,076 17,335 21,411 308,752 350,833
45 4 3,859 17,552 21,411 291,200 354,693
46 4 3,640 17,771 21,411 273,430 358,333
47 4 3,418 17,993 21,411 255,436 361,750
48 4 3,193 18,218 21,411 237,218 364,943
49 5 2,965 18,446 21,411 218,773 367,909
50 5 2,735 18,676 21,411 200,096 370,643
51 5 2,501 18,910 21,411 181,187 373,145
52 5 2,265 19,146 21,411 162,041 375,409
53 5 2,026 19,385 21,411 142,655 377,435
54 5 1,783 19,628 21,411 123,027 379,218
55 5 1,538 19,873 21,411 103,154 380,756
56 5 1,289 20,122 21,411 83,033 382,045
57 5 1,038 20,373 21,411 62,660 383,083
58 5 783 20,628 21,411 42,032 383,866
59 5 525 20,886 21,411 21,147 384,392
60 5 264 21,147 21,411 0 384,656
Period Year
Installment
Principle
Accumulate
Interest
Financial analysis
All of the zdravo siam loan amount will be total of 900,000 and we will give back the
interest rate at 15% for the maximum rate according to the Thai law. The table below
will show the payment table of the return.

97
Current Ratio = Total Current Assets = 730,603 = 2,185,821 = 2,748,751 = 2,976,528 = 3,444,516
Total Current Liabilities 18,546 130,610 46,367 23,614 29,808
= 39.39 = 16.74 = 59.28 = 126.05 = 115.56
Quick Ratio = Current Assets - Inventory = 717,121 = 2,176,350 = 588,521 = 610,941 = 638,966
Total Current Liabilities 18,546 130,610 279,428 298,506 319,802
= 38.67 = 16.66 = 2.11 = 2.05 = 2.00
Liquidity Ratios Y1 Y2 Y3 Y4 Y5
= 117,920 = 122,960 = 123,200 = 122,240 = 122,960
Inventory Turnover Ratio = Cost of Goods Sold 13,482 9,471 6,911 12,085 1,746
Average Inventory
= 8.75 = 12.98 = 17.83 = 10.12 = 70.43
Inventory Period = 365 = 365 = 365 = 365 = 365 = 365
Inventory Turnover 8.75 12.98 17.83 10.12 70.43
= 41.73 = 28.11 = 20.48 = 36.08 = 5.18
Total Assets Turnover = Sales = 135,135 = 509,466 = 228,690 = 152,460 = 173,250
Total Assets 927,467 2,318,389 2,817,023 2,980,504 3,384,196
= 0.15 = 0.22 = 0.08 = 0.05 = 0.05
Y3 Y4 Y5Efficiency Ratios Y1 Y2
Gross Profit Margin = Sales - Cost of Goods Sold = 125,308 = 499,220 = 218,423 = 142,273 = 163,003
Sales 1,039,500 2,853,051 1,905,750 1,386,000 1,732,500
= 12% = 17% = 11% = 10% = 9%
Net Profit Margin = Net Profit = 139,595 = 1,626,336 = 1,766,414 = 2,263,551 = 2,257,200
Sales 1,039,500 80,148,010 84,155,411 90,193,968 91,368,731
= 13% = 2% = 2% = 3% = 2%
Operating Profit Margin = Operating Profit = 126,258 = 126,258 = 126,258 = 126,258 = 126,258
Sales 1,039,500 2,853,051 1,905,750 1,386,000 1,732,500
= 12% = 4% = 7% = 9% = 7%
Return on Assets = Net Profit = 139,595 = 1,430,537 = 758,940 = 390,599 = 634,717
Average on Assets 927,467 2,318,389 2,817,023 2,980,504 3,384,196
= 15% = 62% = 27% = 13% = 19%
Y1 Y2 Y3 Y4 Y5Profitability Ratio
Debt Ratio = Total Liabilities = 787,872 = 748,257 = 487,951 = 260,833 = 29,808
Total Assets 927,467 2,318,389 2,817,023 2,980,504 3,384,196
= 0.85 = 0.32 = 0.17 = 0.09 = 0.01
Times interest-earned Ratio = Net Income = 139,595 = 1,430,537 = 758,940 = 390,599 = 634,717
Annual Interest Expense 237,914 2,043,625 1,095,384 578,694 923,074
= 0.59 = 0.70 = 0.69 = 0.67 = 0.69
Y3 Y4 Y5Leverage Ratio Y1 Y2
And these are the financial ratio analysis of the Zdravo siam

98
Current ratio mainly used to give an idea of the company's ability to pay back its
short-term liabilities (debt and payables) with its short-term assets (cash, inventory,
receivables). The higher the current ratio, the more capable the company is of paying
its obligations.
Quick ratio is viewed as a sign of company's financial strength or weakness (higher
number means stronger, lower number means weaker.
Inventory turnover ratio measures the number of times, on average, the inventory is
sold during the period. Its purpose is to measure the liquidity of the inventory. A
popular variant of the Inventory turnover ratio is to convert it into an average days to
sell the inventory in terms of days.
Total asset turnover ratio this is a measure of how well assets are being used to
produce revenue.
Gross profit margin show remains from sales after a company pays out the cost of
goods sold.
Net profit margin this number is an indication of how effective a company is at cost
control. The higher the net profit margin is, the more effective the company is at
converting revenue into actual profit.
Operating profit margin indicates how effective a company is at controlling the
costs and expenses associated with their normal business operations.
Return on asset a measure of a company's profitability, equal to a fiscal year's
earnings divided by its total assets, expressed as a percentage.
Debt ratio This will tell you how much the company relies on debt to finance assets.
In general, the lower the company's reliance on debt for asset formation, the less risky
the company is since excessive debt can lead to a very heavy interest and principal
repayment burden.
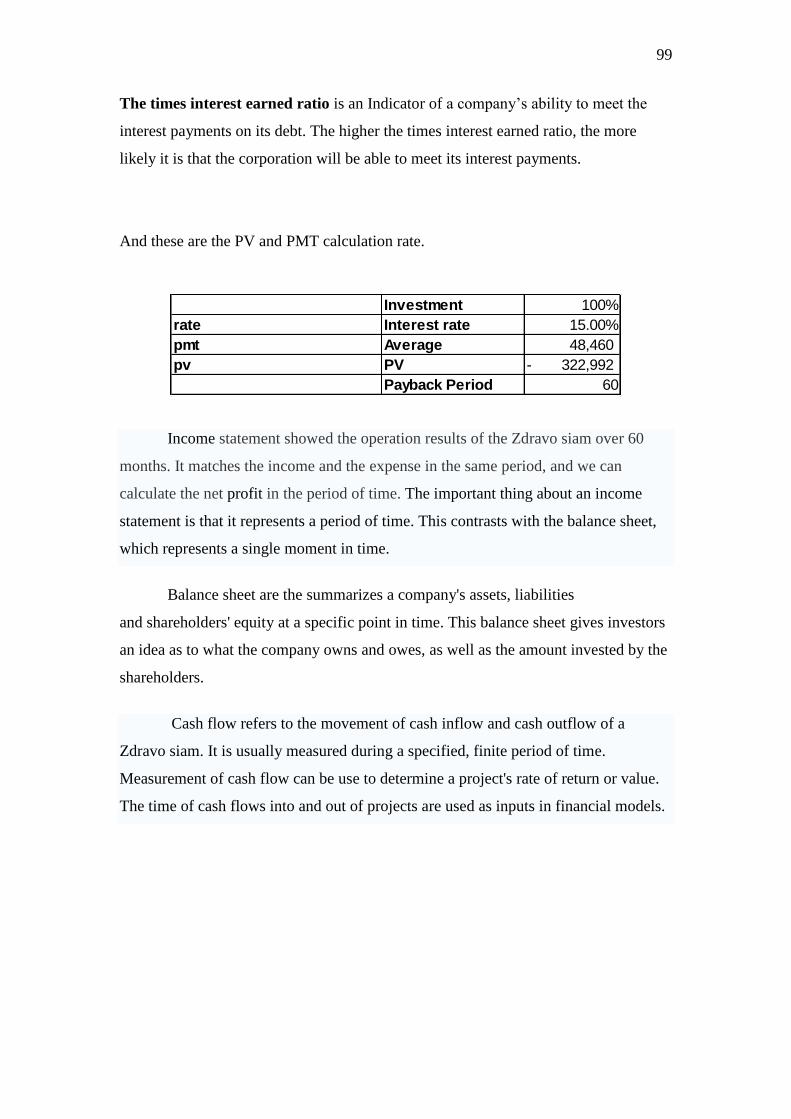
99
Investment 100%
rate Interest rate 15.00%
pmt Average 48,460
pv PV 322,992-
Payback Period 60
The times interest earned ratio is an Indicator of a company’s ability to meet the
interest payments on its debt. The higher the times interest earned ratio, the more
likely it is that the corporation will be able to meet its interest payments.
And these are the PV and PMT calculation rate.
Income statement showed the operation results of the Zdravo siam over 60
months. It matches the income and the expense in the same period, and we can
calculate the net profit in the period of time. The important thing about an income
statement is that it represents a period of time. This contrasts with the balance sheet,
which represents a single moment in time.
Balance sheet are the summarizes a company's assets, liabilities
and shareholders' equity at a specific point in time. This balance sheet gives investors
an idea as to what the company owns and owes, as well as the amount invested by the
shareholders.
Cash flow refers to the movement of cash inflow and cash outflow of a
Zdravo siam. It is usually measured during a specified, finite period of time.
Measurement of cash flow can be use to determine a project's rate of return or value.
The time of cash flows into and out of projects are used as inputs in financial models.

100
Chapter 6
Risk Management

101
Chapter 6
6.1. Risk analysis of projects
Risk of Zdravo siam, It’s mean opportunity of Zdravo siam will face
problems that are expected to occur in the future. Operating loss or business cannot
operate successfully according to plan. Or target. Activities every activity will risks in
the 2 types of risk is the first risk that the course Certainty Risk is caused by Zdravo
siam. It’s occur within Zdravo siam the surely we have and can be avoided. These
risks can arise from the first phase of operations and currently operating. The second
is Uncertainty Risk or the risks arising from external factors. Zdravo siam cannot be
predicted and are beyond the control, but can prevent or eliminate the risks incurred
them.
6.1.1. Certainty Risk
6.1.1.1 Human Resources
Risks associated with employees working within the Zdravo siam. Which risk
that every organization. The recruitment in each position because the Zdravo siam
cannot predict the performance of employees that will be the performance in that
position. And Zdravo siam can be selected as a feature only. It may still not know the
true capabilities of each employee in the appropriate position. Sometimes it may be of
service to Zdravo siam not fully effective
Therefore, management should provide employees with benefits such as
housing costs for food. In addition, to reward outstanding employees with the
responsibility to pay diligent, responsible to the people that works outside during
working hours. The pay is 2 times per hour worked. Zdravo siam make satisfy the
employees to be encouraged to continue.
6.1.2. Uncertainty Risk
6.1.2.1 Changing in Customer Need
Demand for purchase ice-cream of customers may vary with different causes.
Which can be a direct risk to business, including.

102
6.1.2.1.1. Customers turn to the same category because customers
prefer traditional flavors.
6.1.2.1.2. Service, dissatisfaction with the service or customer thinks
service not good enough.
6.1.2.1.3. Customers may be bias to retail customers don’t like
styles of store or the flavor of Zdravo siam.
From the reasons above factors affect the purchasing behavior of customers
change. All of which have an effect on quantities of products sales and revenues. So
the Zdravo siam is considering the needs of customers is a cornerstone.
1.) Zdravo siam use pricing strategy and discount support prices to be reasonable
to ice-cream and reduce customers' attitudes to the price of goods.
2.) In the management and operations. From the allocation of duties to employees
and clearly highlights our services
6.1.3. Economic Condition
In the current economic volatility is relatively more frequent. Because of
political conflicts, social problems, people with extravagant spending, values in the
consumer products overseas and money flowing out of the country. Result in some
customers to save money on the purchase of necessary and important to do really.
Therefore affect the sales of goods decrease. In investment the plants risks in the loan
from the bank's credit department of investor because the economic situation of the
country to be uncertain of the reasons above.
Therefore, the facility is monitoring the economic situation of the country and
in Bangkok. And define appropriate strategies. Zdravo Siam support promotion and
advertising. Describes the features and benefits of ice-cream that help good health, not
serious, and Social. The financial management, the plant is strong. The selection
expert strategies and we have good staff support part of the look. Affect the financial
condition of the Zdravo Siam is strong and stable. Investor is confident that the
Zdravo Siam will refund in time to be agreed.
103
6.1.4. Risks from natural disasters
Season and climate is uncertain and cannot predict all that will occur when a
natural disaster. Because problems flood, air pollution problems and traffic jam.
Zdravo siam will be floods, pollution problems, traffic jam and problems from our
negligence. Not aware of people such as fire, power failure etc. So the factory
measures protect the natural disaster. Zdravo siam has already in store and fire
insurance issues.

104
Year5 January February March April May June July August September October November December
Revenue
Sale 164,588 131,670 49,376 32,918 32,918 230,423 197,505 131,670 164,588 164,588 181,046 164,588
Total Revenue 164,588 131,670 49,376 32,918 32,918 230,423 197,505 131,670 164,588 164,588 181,046 164,588
Cost of goods Sold
Material 10 10 10 10 10 10 10 10 10 10 10 10
Labor 6,000 6,000 6,000 6,000 6,000 6,000 6,000 6,000 6,000 6,000 6,000 6,000
MFG overhead 4,237 4,237 4,237 4,237 4,237 4,237 4,237 4,237 4,237 4,237 4,237 4,237
Total cost of Goods sold 10,247 10,247 10,247 10,247 10,247 10,247 10,247 10,247 10,247 10,247 10,247 10,247
Gross income 154,341 121,423 39,130 22,671 22,671 220,176 187,258 121,423 154,341 154,341 170,800 154,341
Operating Expense
Marketing expense 1,205 972 740 573 673 1,371 1,338 972 1,205 1,105 1,272 1,105
Rent 21,391 21,391 - - - 21,391 21,391 21,391 21,391 - 21,391 21,391
Depreciation 1,350 1,350 1,350 1,350 1,350 1,350 1,350 1,350 1,350 1,350 1,350 1,350
Selling&Adminstration 30,000 30,000 30,000 30,000 30,000 30,000 30,000 30,000 30,000 30,000 30,000 30,000
Total Operating Expense 53,946 53,713 32,090 31,923 32,023 54,112 54,079 53,713 53,946 32,455 54,013 53,846
Net income before operation 100,395 67,710 7,040 9,252- 9,352- 166,064 133,179 67,710 100,395 121,886 116,787 100,495
Operating income(loss)
Other income(expense) - - - - - - - - - - - -
Interest expense 11,250 11,123 10,994 10,864 10,732 10,599 10,464 10,327 10,188 10,048 9,906 9,762
Total Operating income 11,250 11,123 10,994 10,864 10,732 10,599 10,464 10,327 10,188 10,048 9,906 9,762
Income (Loss) Before Taxes 89,145 56,587 3,954- 20,116- 20,085- 155,465 122,716 57,383 90,207 111,838 106,881 90,733
Provision (Benefit) for income taxes 26,743 16,976 46,639 36,815 17,215 27,062 33,551 32,064 27,220
Net income (Loss) for the year 62,401 39,611 3,954- 20,116- 20,085- 108,825 85,901 40,168 63,145 78,286 74,817 63,513
Retained Earning beginning of the months2,527,609 2,590,011 2,629,622 2,625,667 2,605,551 2,585,467 2,694,292 2,780,193 2,820,361 2,883,506 2,961,792 3,036,609
Retained Earnings 2,590,011 2,629,622 2,625,667 2,605,551 2,585,467 2,694,292 2,780,193 2,820,361 2,883,506 2,961,792 3,036,609 3,100,122
If sale decrease by 5%
The profit and loss statement will be as the following and Zdravo siam retain earning at the end of year five will be as the following that show in
the statement.

105
Year5 January February March April May June July August September October November December
Revenue
Sale 155,925 124,740 46,778 31,185 31,185 218,295 187,110 124,740 155,925 155,925 171,518 155,925
Total Revenue 155,925 124,740 46,778 31,185 31,185 218,295 187,110 124,740 155,925 155,925 171,518 155,925
Cost of goods Sold
Material 10 10 10 10 10 10 10 10 10 10 10 10
Labor 6,000 6,000 6,000 6,000 6,000 6,000 6,000 6,000 6,000 6,000 6,000 6,000
MFG overhead 4,237 4,237 4,237 4,237 4,237 4,237 4,237 4,237 4,237 4,237 4,237 4,237
Total cost of Goods sold 10,247 10,247 10,247 10,247 10,247 10,247 10,247 10,247 10,247 10,247 10,247 10,247
Gross income 145,678 114,493 36,531 20,938 20,938 208,048 176,863 114,493 145,678 145,678 161,271 145,678
Operating Expense
Marketing expense 1,170 944 729 566 666 1,322 1,296 944 1,170 1,070 1,233 1,070
Rent 21,391 21,391 - - - 21,391 21,391 21,391 21,391 - 21,391 21,391
Depreciation 1,350 1,350 1,350 1,350 1,350 1,350 1,350 1,350 1,350 1,350 1,350 1,350
Selling&Adminstration 30,000 30,000 30,000 30,000 30,000 30,000 30,000 30,000 30,000 30,000 30,000 30,000
Total Operating Expense 53,911 53,685 32,079 31,916 32,016 54,063 54,037 53,685 53,911 32,420 53,974 53,811
Net income before operation 91,767 60,808 4,452 10,978- 11,078- 153,985 122,826 60,808 91,767 113,258 107,297 91,867
Operating income(loss)
Other income(expense) - - - - - - - - - - - -
Interest expense 11,250 11,123 10,994 10,864 10,732 10,599 10,464 10,327 10,188 10,048 9,906 9,762
Total Operating income 11,250 11,123 10,994 10,864 10,732 10,599 10,464 10,327 10,188 10,048 9,906 9,762
Income (Loss) Before Taxes 80,517 49,685 6,543- 21,842- 21,810- 143,386 112,363 50,481 81,579 103,210 97,391 82,105
Provision (Benefit) for income taxes 24,155 14,906 43,016 33,709 15,144 24,474 30,963 29,217 24,632
Net income (Loss) for the year 56,362 34,780 6,543- 21,842- 21,810- 100,371 78,654 35,337 57,105 72,247 68,174 57,474
Retained Earning beginning of the months2,335,547 2,391,909 2,426,689 2,420,147 2,398,305 2,376,495 2,476,865 2,555,519 2,590,856 2,647,961 2,720,209 2,788,382
Retained Earnings 2,391,909 2,426,689 2,420,147 2,398,305 2,376,495 2,476,865 2,555,519 2,590,856 2,647,961 2,720,209 2,788,382 2,845,856
If sale decrease by 10%
The profit and loss statement will be as the following and Zdravo siam retain earning at the end of year five will be as the following that show in
the statement.
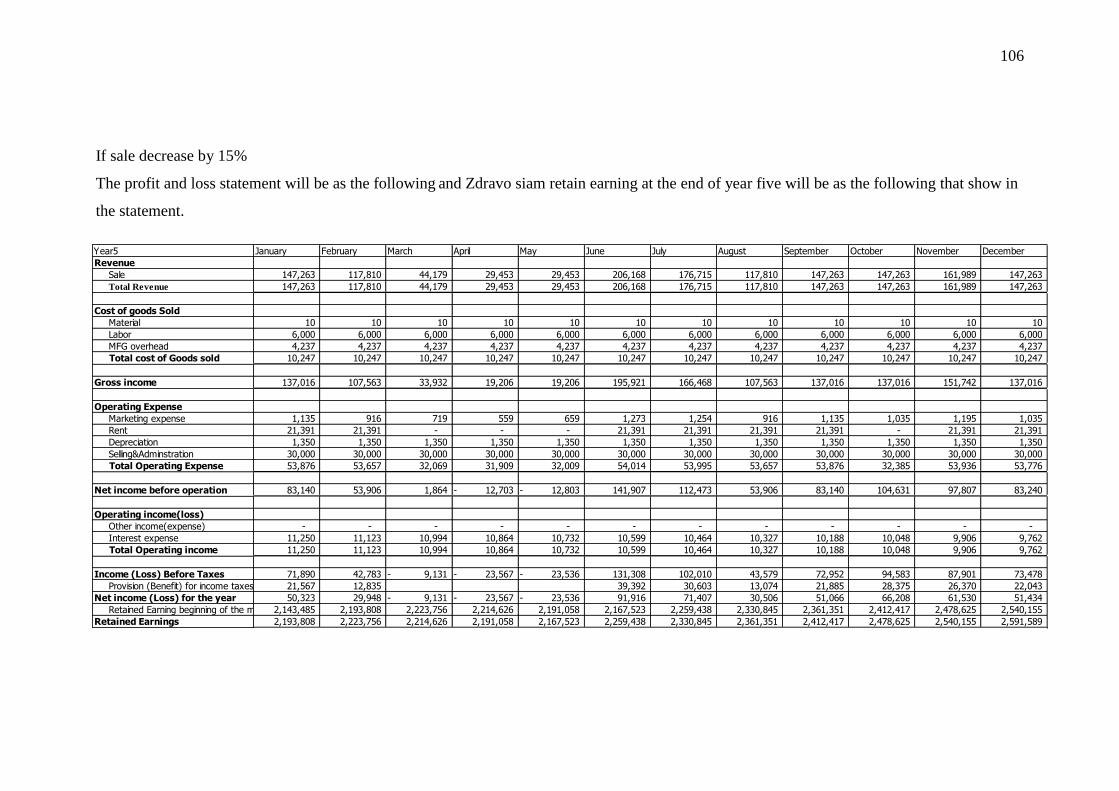
106
Year5 January February March April May June July August September October November December
Revenue
Sale 147,263 117,810 44,179 29,453 29,453 206,168 176,715 117,810 147,263 147,263 161,989 147,263
Total Revenue 147,263 117,810 44,179 29,453 29,453 206,168 176,715 117,810 147,263 147,263 161,989 147,263
Cost of goods Sold
Material 10 10 10 10 10 10 10 10 10 10 10 10
Labor 6,000 6,000 6,000 6,000 6,000 6,000 6,000 6,000 6,000 6,000 6,000 6,000
MFG overhead 4,237 4,237 4,237 4,237 4,237 4,237 4,237 4,237 4,237 4,237 4,237 4,237
Total cost of Goods sold 10,247 10,247 10,247 10,247 10,247 10,247 10,247 10,247 10,247 10,247 10,247 10,247
Gross income 137,016 107,563 33,932 19,206 19,206 195,921 166,468 107,563 137,016 137,016 151,742 137,016
Operating Expense
Marketing expense 1,135 916 719 559 659 1,273 1,254 916 1,135 1,035 1,195 1,035
Rent 21,391 21,391 - - - 21,391 21,391 21,391 21,391 - 21,391 21,391
Depreciation 1,350 1,350 1,350 1,350 1,350 1,350 1,350 1,350 1,350 1,350 1,350 1,350
Selling&Adminstration 30,000 30,000 30,000 30,000 30,000 30,000 30,000 30,000 30,000 30,000 30,000 30,000
Total Operating Expense 53,876 53,657 32,069 31,909 32,009 54,014 53,995 53,657 53,876 32,385 53,936 53,776
Net income before operation 83,140 53,906 1,864 12,703- 12,803- 141,907 112,473 53,906 83,140 104,631 97,807 83,240
Operating income(loss)
Other income(expense) - - - - - - - - - - - -
Interest expense 11,250 11,123 10,994 10,864 10,732 10,599 10,464 10,327 10,188 10,048 9,906 9,762
Total Operating income 11,250 11,123 10,994 10,864 10,732 10,599 10,464 10,327 10,188 10,048 9,906 9,762
Income (Loss) Before Taxes 71,890 42,783 9,131- 23,567- 23,536- 131,308 102,010 43,579 72,952 94,583 87,901 73,478
Provision (Benefit) for income taxes 21,567 12,835 39,392 30,603 13,074 21,885 28,375 26,370 22,043
Net income (Loss) for the year 50,323 29,948 9,131- 23,567- 23,536- 91,916 71,407 30,506 51,066 66,208 61,530 51,434
Retained Earning beginning of the months2,143,485 2,193,808 2,223,756 2,214,626 2,191,058 2,167,523 2,259,438 2,330,845 2,361,351 2,412,417 2,478,625 2,540,155
Retained Earnings 2,193,808 2,223,756 2,214,626 2,191,058 2,167,523 2,259,438 2,330,845 2,361,351 2,412,417 2,478,625 2,540,155 2,591,589
If sale decrease by 15%
The profit and loss statement will be as the following and Zdravo siam retain earning at the end of year five will be as the following that show in
the statement.
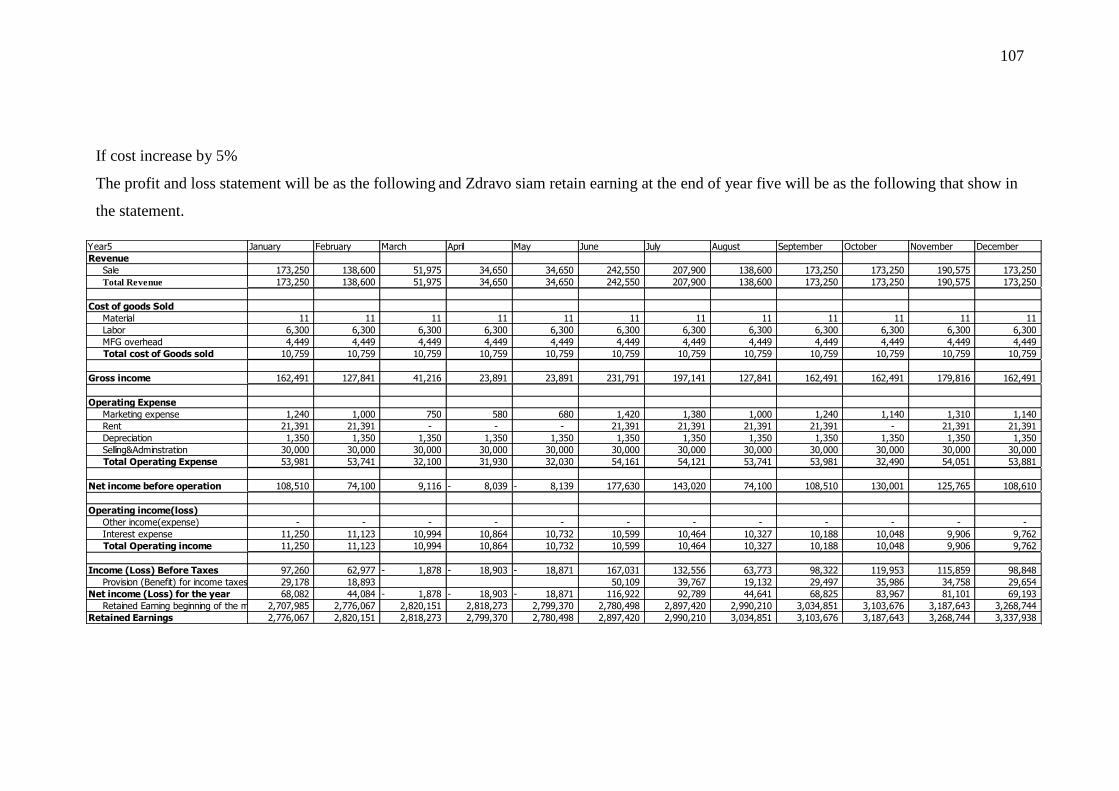
107
Year5 January February March April May June July August September October November December
Revenue
Sale 173,250 138,600 51,975 34,650 34,650 242,550 207,900 138,600 173,250 173,250 190,575 173,250
Total Revenue 173,250 138,600 51,975 34,650 34,650 242,550 207,900 138,600 173,250 173,250 190,575 173,250
Cost of goods Sold
Material 11 11 11 11 11 11 11 11 11 11 11 11
Labor 6,300 6,300 6,300 6,300 6,300 6,300 6,300 6,300 6,300 6,300 6,300 6,300
MFG overhead 4,449 4,449 4,449 4,449 4,449 4,449 4,449 4,449 4,449 4,449 4,449 4,449
Total cost of Goods sold 10,759 10,759 10,759 10,759 10,759 10,759 10,759 10,759 10,759 10,759 10,759 10,759
Gross income 162,491 127,841 41,216 23,891 23,891 231,791 197,141 127,841 162,491 162,491 179,816 162,491
Operating Expense
Marketing expense 1,240 1,000 750 580 680 1,420 1,380 1,000 1,240 1,140 1,310 1,140
Rent 21,391 21,391 - - - 21,391 21,391 21,391 21,391 - 21,391 21,391
Depreciation 1,350 1,350 1,350 1,350 1,350 1,350 1,350 1,350 1,350 1,350 1,350 1,350
Selling&Adminstration 30,000 30,000 30,000 30,000 30,000 30,000 30,000 30,000 30,000 30,000 30,000 30,000
Total Operating Expense 53,981 53,741 32,100 31,930 32,030 54,161 54,121 53,741 53,981 32,490 54,051 53,881
Net income before operation 108,510 74,100 9,116 8,039- 8,139- 177,630 143,020 74,100 108,510 130,001 125,765 108,610
Operating income(loss)
Other income(expense) - - - - - - - - - - - -
Interest expense 11,250 11,123 10,994 10,864 10,732 10,599 10,464 10,327 10,188 10,048 9,906 9,762
Total Operating income 11,250 11,123 10,994 10,864 10,732 10,599 10,464 10,327 10,188 10,048 9,906 9,762
Income (Loss) Before Taxes 97,260 62,977 1,878- 18,903- 18,871- 167,031 132,556 63,773 98,322 119,953 115,859 98,848
Provision (Benefit) for income taxes 29,178 18,893 50,109 39,767 19,132 29,497 35,986 34,758 29,654
Net income (Loss) for the year 68,082 44,084 1,878- 18,903- 18,871- 116,922 92,789 44,641 68,825 83,967 81,101 69,193
Retained Earning beginning of the months2,707,985 2,776,067 2,820,151 2,818,273 2,799,370 2,780,498 2,897,420 2,990,210 3,034,851 3,103,676 3,187,643 3,268,744
Retained Earnings 2,776,067 2,820,151 2,818,273 2,799,370 2,780,498 2,897,420 2,990,210 3,034,851 3,103,676 3,187,643 3,268,744 3,337,938
If cost increase by 5%
The profit and loss statement will be as the following and Zdravo siam retain earning at the end of year five will be as the following that show in
the statement.

108
Year5 January February March April May June July August September October November December
Revenue
Sale 173,250 138,600 51,975 34,650 34,650 242,550 207,900 138,600 173,250 173,250 190,575 173,250
Total Revenue 173,250 138,600 51,975 34,650 34,650 242,550 207,900 138,600 173,250 173,250 190,575 173,250
Cost of goods Sold
Material 11 11 11 11 11 11 11 11 11 11 11 11
Labor 6,600 6,600 6,600 6,600 6,600 6,600 6,600 6,600 6,600 6,600 6,600 6,600
MFG overhead 4,660 4,660 4,660 4,660 4,660 4,660 4,660 4,660 4,660 4,660 4,660 4,660
Total cost of Goods sold 11,271 11,271 11,271 11,271 11,271 11,271 11,271 11,271 11,271 11,271 11,271 11,271
Gross income 161,979 127,329 40,704 23,379 23,379 231,279 196,629 127,329 161,979 161,979 179,304 161,979
Operating Expense
Marketing expense 1,240 1,000 750 580 680 1,420 1,380 1,000 1,240 1,140 1,310 1,140
Rent 21,391 21,391 - - - 21,391 21,391 21,391 21,391 - 21,391 21,391
Depreciation 1,350 1,350 1,350 1,350 1,350 1,350 1,350 1,350 1,350 1,350 1,350 1,350
Selling&Adminstration 30,000 30,000 30,000 30,000 30,000 30,000 30,000 30,000 30,000 30,000 30,000 30,000
Total Operating Expense 53,981 53,741 32,100 31,930 32,030 54,161 54,121 53,741 53,981 32,490 54,051 53,881
Net income before operation 107,998 73,588 8,604 8,551- 8,651- 177,118 142,508 73,588 107,998 129,489 125,253 108,098
Operating income(loss)
Other income(expense) - - - - - - - - - - - -
Interest expense 11,250 11,123 10,994 10,864 10,732 10,599 10,464 10,327 10,188 10,048 9,906 9,762
Total Operating income 11,250 11,123 10,994 10,864 10,732 10,599 10,464 10,327 10,188 10,048 9,906 9,762
Income (Loss) Before Taxes 96,748 62,465 2,391- 19,416- 19,384- 166,519 132,044 63,261 97,809 119,441 115,347 98,335
Provision (Benefit) for income taxes 29,024 18,739 49,956 39,613 18,978 29,343 35,832 34,604 29,501
Net income (Loss) for the year 67,723 43,725 2,391- 19,416- 19,384- 116,563 92,431 44,283 68,467 83,608 80,743 68,835
Retained Earning beginning of the months2,696,300 2,764,023 2,807,748 2,805,358 2,785,942 2,766,558 2,883,122 2,975,552 3,019,835 3,088,301 3,171,910 3,252,653
Retained Earnings 2,764,023 2,807,748 2,805,358 2,785,942 2,766,558 2,883,122 2,975,552 3,019,835 3,088,301 3,171,910 3,252,653 3,321,487
If cost increase by 10%
The profit and loss statement will be as the following and Zdravo siam retain earning at the end of year five will be as the following that show in
the statement.

109
Year5 January February March April May June July August September October November December
Revenue
Sale 173,250 138,600 51,975 34,650 34,650 242,550 207,900 138,600 173,250 173,250 190,575 173,250
Total Revenue 173,250 138,600 51,975 34,650 34,650 242,550 207,900 138,600 173,250 173,250 190,575 173,250
Cost of goods Sold
Material 12 12 12 12 12 12 12 12 12 12 12 12
Labor 6,900 6,900 6,900 6,900 6,900 6,900 6,900 6,900 6,900 6,900 6,900 6,900
MFG overhead 4,872 4,872 4,872 4,872 4,872 4,872 4,872 4,872 4,872 4,872 4,872 4,872
Total cost of Goods sold 11,784 11,784 11,784 11,784 11,784 11,784 11,784 11,784 11,784 11,784 11,784 11,784
Gross income 161,466 126,816 40,191 22,866 22,866 230,766 196,116 126,816 161,466 161,466 178,791 161,466
Operating Expense
Marketing expense 1,240 1,000 750 580 680 1,420 1,380 1,000 1,240 1,140 1,310 1,140
Rent 21,391 21,391 - - - 21,391 21,391 21,391 21,391 - 21,391 21,391
Depreciation 1,350 1,350 1,350 1,350 1,350 1,350 1,350 1,350 1,350 1,350 1,350 1,350
Selling&Adminstration 30,000 30,000 30,000 30,000 30,000 30,000 30,000 30,000 30,000 30,000 30,000 30,000
Total Operating Expense 53,981 53,741 32,100 31,930 32,030 54,161 54,121 53,741 53,981 32,490 54,051 53,881
Net income before operation 107,485 73,075 8,091 9,064- 9,164- 176,605 141,995 73,075 107,485 128,976 124,740 107,585
Operating income(loss)
Other income(expense) - - - - - - - - - - - -
Interest expense 11,250 11,123 10,994 10,864 10,732 10,599 10,464 10,327 10,188 10,048 9,906 9,762
Total Operating income 11,250 11,123 10,994 10,864 10,732 10,599 10,464 10,327 10,188 10,048 9,906 9,762
Income (Loss) Before Taxes 96,235 61,952 2,903- 19,928- 19,896- 166,006 131,532 62,748 97,297 118,928 114,834 97,823
Provision (Benefit) for income taxes 28,871 18,586 49,802 39,459 18,825 29,189 35,678 34,450 29,347
Net income (Loss) for the year 67,365 43,367 2,903- 19,928- 19,896- 116,205 92,072 43,924 68,108 83,250 80,384 68,476
Retained Earning beginning of the months2,684,614 2,751,979 2,795,345 2,792,442 2,772,514 2,752,618 2,868,823 2,960,895 3,004,819 3,072,927 3,156,177 3,236,561
Retained Earnings 2,751,979 2,795,345 2,792,442 2,772,514 2,752,618 2,868,823 2,960,895 3,004,819 3,072,927 3,156,177 3,236,561 3,305,037
If cost increase by 15%
The profit and loss statement will be as the following and Zdravo siam retain earning at the end of year five will be as the following that show in
the statement.

110
Year5 January February March April May June July August September October November December
Revenue
Sale 173,250 138,600 51,975 34,650 34,650 242,550 207,900 138,600 173,250 173,250 190,575 173,250
Total Revenue 173,250 138,600 51,975 34,650 34,650 242,550 207,900 138,600 173,250 173,250 190,575 173,250
Cost of goods Sold
Material 10 10 10 10 10 10 10 10 10 10 10 10
Labor 6,000 6,000 6,000 6,000 6,000 6,000 6,000 6,000 6,000 6,000 6,000 6,000
MFG overhead 4,237 4,237 4,237 4,237 4,237 4,237 4,237 4,237 4,237 4,237 4,237 4,237
Total cost of Goods sold 10,247 10,247 10,247 10,247 10,247 10,247 10,247 10,247 10,247 10,247 10,247 10,247
Gross income 163,003 128,353 41,728 24,403 24,403 232,303 197,653 128,353 163,003 163,003 180,328 163,003
Operating Expense
Marketing expense 1,240 1,000 750 580 680 1,420 1,380 1,000 1,240 1,140 1,310 1,140
Rent 21,391 21,391 - - - 21,391 21,391 21,391 21,391 - 21,391 21,391
Depreciation 1,350 1,350 1,350 1,350 1,350 1,350 1,350 1,350 1,350 1,350 1,350 1,350
Selling&Adminstration 30,000 30,000 30,000 30,000 30,000 30,000 30,000 30,000 30,000 30,000 30,000 30,000
Total Operating Expense 53,981 53,741 32,100 31,930 32,030 54,161 54,121 53,741 53,981 32,490 54,051 53,881
Net income before operation 109,022 74,612 9,628 7,527- 7,627- 178,142 143,532 74,612 109,022 130,513 126,277 109,122
Operating income(loss)
Other income(expense) - - - - - - - - - - - -
Interest expense 15,000 14,853 14,703 14,550 14,395 14,238 14,078 13,915 13,750 13,581 13,410 13,236
Total Operating income 15,000 14,853 14,703 14,550 14,395 14,238 14,078 13,915 13,750 13,581 13,410 13,236
Income (Loss) Before Taxes 94,022 59,760 5,074- 22,077- 22,022- 163,904 129,454 60,697 95,273 116,932 112,867 95,886
Provision (Benefit) for income taxes 28,207 17,928 49,171 38,836 18,209 28,582 35,080 33,860 28,766
Net income (Loss) for the year 65,816 41,832 5,074- 22,077- 22,022- 114,733 90,618 42,488 66,691 81,852 79,007 67,120
Retained Earning beginning of the months2,584,726 2,650,542 2,692,374 2,687,299 2,665,222 2,643,200 2,757,933 2,848,551 2,891,039 2,957,730 3,039,583 3,118,589
Retained Earnings 2,650,542 2,692,374 2,687,299 2,665,222 2,643,200 2,757,933 2,848,551 2,891,039 2,957,730 3,039,583 3,118,589 3,185,710
If interest increase by 5%
The profit and loss statement will be as the following and Zdravo siam retain earning at the end of year five will be as the following that show in
the statement.

111
Year5 January February March April May June July August September October November December
Revenue
Sale 173,250 138,600 51,975 34,650 34,650 242,550 207,900 138,600 173,250 173,250 190,575 173,250
Total Revenue 173,250 138,600 51,975 34,650 34,650 242,550 207,900 138,600 173,250 173,250 190,575 173,250
Cost of goods Sold
Material 10 10 10 10 10 10 10 10 10 10 10 10
Labor 6,000 6,000 6,000 6,000 6,000 6,000 6,000 6,000 6,000 6,000 6,000 6,000
MFG overhead 4,237 4,237 4,237 4,237 4,237 4,237 4,237 4,237 4,237 4,237 4,237 4,237
Total cost of Goods sold 10,247 10,247 10,247 10,247 10,247 10,247 10,247 10,247 10,247 10,247 10,247 10,247
Gross income 163,003 128,353 41,728 24,403 24,403 232,303 197,653 128,353 163,003 163,003 180,328 163,003
Operating Expense
Marketing expense 1,240 1,000 750 580 680 1,420 1,380 1,000 1,240 1,140 1,310 1,140
Rent 21,391 21,391 - - - 21,391 21,391 21,391 21,391 - 21,391 21,391
Depreciation 1,350 1,350 1,350 1,350 1,350 1,350 1,350 1,350 1,350 1,350 1,350 1,350
Selling&Adminstration 30,000 30,000 30,000 30,000 30,000 30,000 30,000 30,000 30,000 30,000 30,000 30,000
Total Operating Expense 53,981 53,741 32,100 31,930 32,030 54,161 54,121 53,741 53,981 32,490 54,051 53,881
Net income before operation 109,022 74,612 9,628 7,527- 7,627- 178,142 143,532 74,612 109,022 130,513 126,277 109,122
Operating income(loss)
Other income(expense) - - - - - - - - - - - -
Interest expense 18,750 18,590 18,427 18,261 18,091 17,917 17,740 17,560 17,375 17,187 16,995 16,798
Total Operating income 18,750 18,590 18,427 18,261 18,091 17,917 17,740 17,560 17,375 17,187 16,995 16,798
Income (Loss) Before Taxes 90,272 56,022 8,799- 25,787- 25,718- 160,225 125,792 57,053 91,647 113,327 109,283 92,324
Provision (Benefit) for income taxes 27,082 16,807 48,067 37,738 17,116 27,494 33,998 32,785 27,697
Net income (Loss) for the year 63,191 39,215 8,799- 25,787- 25,718- 112,157 88,054 39,937 64,153 79,329 76,498 64,627
Retained Earning beginning of the months2,448,215 2,511,405 2,550,621 2,541,822 2,516,034 2,490,317 2,602,474 2,690,529 2,730,465 2,794,618 2,873,947 2,950,445
Retained Earnings 2,511,405 2,550,621 2,541,822 2,516,034 2,490,317 2,602,474 2,690,529 2,730,465 2,794,618 2,873,947 2,950,445 3,015,072
If interest increase by 10%
The profit and loss statement will be as the following and Zdravo siam retain earning at the end of year five will be as the following that show in
the statement.

112
Year5 January February March April May June July August September October November December
Revenue
Sale 173,250 138,600 51,975 34,650 34,650 242,550 207,900 138,600 173,250 173,250 190,575 173,250
Total Revenue 173,250 138,600 51,975 34,650 34,650 242,550 207,900 138,600 173,250 173,250 190,575 173,250
Cost of goods Sold
Material 10 10 10 10 10 10 10 10 10 10 10 10
Labor 6,000 6,000 6,000 6,000 6,000 6,000 6,000 6,000 6,000 6,000 6,000 6,000
MFG overhead 4,237 4,237 4,237 4,237 4,237 4,237 4,237 4,237 4,237 4,237 4,237 4,237
Total cost of Goods sold 10,247 10,247 10,247 10,247 10,247 10,247 10,247 10,247 10,247 10,247 10,247 10,247
Gross income 163,003 128,353 41,728 24,403 24,403 232,303 197,653 128,353 163,003 163,003 180,328 163,003
Operating Expense
Marketing expense 1,240 1,000 750 580 680 1,420 1,380 1,000 1,240 1,140 1,310 1,140
Rent 21,391 21,391 - - - 21,391 21,391 21,391 21,391 - 21,391 21,391
Depreciation 1,350 1,350 1,350 1,350 1,350 1,350 1,350 1,350 1,350 1,350 1,350 1,350
Selling&Adminstration 30,000 30,000 30,000 30,000 30,000 30,000 30,000 30,000 30,000 30,000 30,000 30,000
Total Operating Expense 53,981 53,741 32,100 31,930 32,030 54,161 54,121 53,741 53,981 32,490 54,051 53,881
Net income before operation 109,022 74,612 9,628 7,527- 7,627- 178,142 143,532 74,612 109,022 130,513 126,277 109,122
Operating income(loss)
Other income(expense) - - - - - - - - - - - -
Interest expense 22,500 22,335 22,165 21,991 21,813 21,630 21,443 21,251 21,055 20,853 20,646 20,435
Total Operating income 22,500 22,335 22,165 21,991 21,813 21,630 21,443 21,251 21,055 20,853 20,646 20,435
Income (Loss) Before Taxes 86,522 52,278 12,537- 29,518- 29,440- 156,512 122,089 53,361 87,968 109,660 105,631 88,688
Provision (Benefit) for income taxes 25,957 15,683 46,954 36,627 16,008 26,390 32,898 31,689 26,606
Net income (Loss) for the year 60,566 36,594 12,537- 29,518- 29,440- 109,558 85,462 37,353 61,577 76,762 73,942 62,081
Retained Earning beginning of the months2,310,393 2,370,959 2,407,553 2,395,017 2,365,499 2,336,059 2,445,618 2,531,080 2,568,433 2,630,010 2,706,773 2,780,714
Retained Earnings 2,370,959 2,407,553 2,395,017 2,365,499 2,336,059 2,445,618 2,531,080 2,568,433 2,630,010 2,706,773 2,780,714 2,842,796
If interest increase by 15%
The profit and loss statement will be as the following and Zdravo siam retain earning at the end of year five will be as the following that show in
the statement.
113
6.2 Risk management summary
According to the risk that has been demonstrate above the most risk that Zdravo siam
will mostly concern is the change in the change in demand for purchase ice-cream of
customers may vary. Thus, it can illustrate that customer who buys or drinks coffee
will not going to buy an ice cream so Zdravo siam will have to face the change the
need of customer if the trend or most demand of customers turns to coffee.
Zdravo siam will face the hard time in doing business Zdravo siam will use
pricing strategy and discount support prices to be reasonable to ice-cream and reduce
customers' attitudes to the price of goods. In the management and operations. From
the allocation of duties to employees and clearly highlights our services
From the Financial risk that illustrate above Zdravo siam will not concern
about it because even if the sale decrease , Cost increase and interest rate increase it
will have an effect to the retain earning not very much .

114
Chapter 7
Summary

115
0%
5%
10%
15%
20%
25%
Mo
nth
1
Mo
nth
3
Mo
nth
5
Mo
nth
7
Mo
nth
9
Mo
nth
11
Mo
nth
13
Mo
nth
15
Mo
nth
17
Mo
nth
19
Mo
nth
21
Mo
nth
23
Mo
nth
25
Mo
nth
27
Mo
nth
29
Mo
nth
31
Mo
nth
33
Mo
nth
35
Mo
nth
37
Mo
nth
39
Mo
nth
41
Mo
nth
43
Mo
nth
45
Mo
nth
47
Mo
nth
49
Mo
nth
51
Mo
nth
53
Mo
nth
55
Mo
nth
57
Mo
nth
59
Sale
pe
rce
nta
ge
Zdravo siam Growth rate
Zdravo siam
Chapter 7 Summary
As the market share in Thailand in nowadays, ice-cream business still one of the
business that many people also need. They will face with a variety of ice-cream flavors,
and a lot of hand-made cakes. The specialty of Zdravo Siam is all of ice-cream is daily
fresh. All ingredients to make ice-cream are 100 percents made in Thailand [Fruits and
any mixers]. In finally, the shop hope to give joyfulness and satisfy to all of customers
with the best services as much as possible.
Figure 7.1: Zdravo siam Growth rate
According to the sale forecasting it can conclude that the average income of the
total 60 month will be approximate 148,613 baht per month and the seasoning sale will
be shown as the following but the sharp decrease in sales this happened because it is
summer season But the advantage are even the sale are 50% lower than normal in every
years because of the closing of the University but the advantage is the ABAC plaza will
exempt the rental on these summers times. But The ABAC plaza will give an exception
not to gather the rent of the summer season.
The total of marketing expense is 60,900 baht and these will help Zdravo saim to
reach the sale forecast as also this marketing expense are used to the support through the
strategy that are specially selected to use in the effort to maintain the high volume of
slaes and customer demand.

116
As in the first time of opening Zdravo siam selected to be located at ABAC Plaza in
ABAC University. And these are the list in investing on Zdravo Siam shop as the
following.
No. Descript No. Product Price/Unit Total
1 Ice cream maker 1 150,000 150,000
2 Ice cream freezer 1 46,000 46,000
3 Ice cream scoop 3 450 1,350
4 Ice cream’s tray 24 580 13,920
5 Fruit’s tray 6 480 2,880
6 Cash Register 1 35,000 35,000
7 Blackboard 1 550 550
8 Spoon 40 173 6,920
9 Tray 5 48 240
10 Water glass 50 75 3,750
11 Glass 30 55 1,650
12 Sunday glass 2 675 1,350
13 Basin 2 59 118
14 Cooler 1 1,800 1,800
15 Book magazine 8 50 400
16 Telephone 1 990 990
17 Pen 12 4.25 51
18 Napkin 6 130 780
19 Order 100 25 2,500
20 Tissue Paper 12 748 8,976
21 Dishwashing liquid 1 27 27
22 Scotch Brite 2 12 24
23 Banana 5 190 950
24 Orange 5 24.5 122.5
25 Lynches 5 80 400
26 Strawberry 5 145 725
27 White malt 5 98 490
28 Sugar 5 24 120
29 Whole milk 5 102 510
30 Rum 6 60 360
31 Whip cream 6 230 1,380
32 Guar Gum 6 440 2,640
33 Raisin 6 230 1,380
34 Pumpkin 6 12 72
35 Almond 6 350 2,100
36 Green tea flavor 6 280 1,680
37 Milk tea flavor 6 120 720
38 Egg 60 3.20 192
39 Pineapple Juice 1 420 420
40 Vanilla 6 60 360
41 Chocolate 6 60 360

117
Interest Paid Installment paid Total
0 900,000฿
1 1 11,250 10,161 21,411 889,839 11,250
2 1 11,123 10,288 21,411 879,551 22,373
3 1 10,994 10,417 21,411 869,135 33,367
4 1 10,864 10,547 21,411 858,588 44,232
5 1 10,732 10,679 21,411 847,909 54,964
6 1 10,599 10,812 21,411 837,097 65,563
7 1 10,464 10,947 21,411 826,150 76,026
8 1 10,327 11,084 21,411 815,066 86,353
9 1 10,188 11,223 21,411 803,843 96,542
10 1 10,048 11,363 21,411 792,480 106,590
11 1 9,906 11,505 21,411 780,975 116,496
12 1 9,762 11,649 21,411 769,327 126,258
13 2 9,617 11,794 21,411 757,532 135,875
14 2 9,469 11,942 21,411 745,591 145,344
15 2 9,320 12,091 21,411 733,499 154,664
16 2 9,169 12,242 21,411 721,257 163,832
17 2 9,016 12,395 21,411 708,862 172,848
18 2 8,861 12,550 21,411 696,312 181,709
19 2 8,704 12,707 21,411 683,605 190,413
20 2 8,545 12,866 21,411 670,739 198,958
21 2 8,384 13,027 21,411 657,712 207,342
22 2 8,221 13,190 21,411 644,523 215,563
23 2 8,057 13,354 21,411 631,168 223,620
24 2 7,890 13,521 21,411 617,647 231,510
25 3 7,721 13,690 21,411 603,957 239,230
26 3 7,549 13,861 21,411 590,095 246,780
27 3 7,376 14,035 21,411 576,060 254,156
28 3 7,201 14,210 21,411 561,850 261,357
29 3 7,023 14,388 21,411 547,462 268,380
30 3 6,843 14,568 21,411 532,895 275,223
31 3 6,661 14,750 21,411 518,145 281,884
32 3 6,477 14,934 21,411 503,211 288,361
33 3 6,290 15,121 21,411 488,090 294,651
34 3 6,101 15,310 21,411 472,780 300,752
35 3 5,910 15,501 21,411 457,279 306,662
36 3 5,716 15,695 21,411 441,584 312,378
37 4 5,520 15,891 21,411 425,693 317,898
38 4 5,321 16,090 21,411 409,603 323,219
39 4 5,120 16,291 21,411 393,312 328,339
40 4 4,916 16,495 21,411 376,818 333,255
41 4 4,710 16,701 21,411 360,117 337,966
42 4 4,501 16,909 21,411 343,208 342,467
43 4 4,290 17,121 21,411 326,087 346,757
44 4 4,076 17,335 21,411 308,752 350,833
45 4 3,859 17,552 21,411 291,200 354,693
46 4 3,640 17,771 21,411 273,430 358,333
47 4 3,418 17,993 21,411 255,436 361,750
48 4 3,193 18,218 21,411 237,218 364,943
49 5 2,965 18,446 21,411 218,773 367,909
50 5 2,735 18,676 21,411 200,096 370,643
51 5 2,501 18,910 21,411 181,187 373,145
52 5 2,265 19,146 21,411 162,041 375,409
53 5 2,026 19,385 21,411 142,655 377,435
54 5 1,783 19,628 21,411 123,027 379,218
55 5 1,538 19,873 21,411 103,154 380,756
56 5 1,289 20,122 21,411 83,033 382,045
57 5 1,038 20,373 21,411 62,660 383,083
58 5 783 20,628 21,411 42,032 383,866
59 5 525 20,886 21,411 21,147 384,392
60 5 264 21,147 21,411 0 384,656
Period Year
Installment
Principle
Accumulate
Interest
42 salt 1 10 10
43 Whipping Cream Bottom 1 2,000 2,000
44 Whipping Cream 3 150 450
45 Gas 10 170 1,700
46 Topping 6 65 390
47 Fresh Milk 1 82 82
48 Computer 1 13,800 13,800
49 Printer 1 2,750 2,750
50 Speaker 1 1,490 1,490
Total 495 316,930
And the total loan amount will be equal 900,000 baht the table below show the
payment on interest and principal deduction.
And these are the financial ratio analysis of the Zdravo siam

118
Current Ratio = Total Current Assets = 730,603 = 2,185,821 = 2,748,751 = 2,976,528 = 3,444,516
Total Current Liabilities 18,546 130,610 46,367 23,614 29,808
= 39.39 = 16.74 = 59.28 = 126.05 = 115.56
Quick Ratio = Current Assets - Inventory = 717,121 = 2,176,350 = 588,521 = 610,941 = 638,966
Total Current Liabilities 18,546 130,610 279,428 298,506 319,802
= 38.67 = 16.66 = 2.11 = 2.05 = 2.00
Liquidity Ratios Y1 Y2 Y3 Y4 Y5
= 117,920 = 122,960 = 123,200 = 122,240 = 122,960
Inventory Turnover Ratio = Cost of Goods Sold 13,482 9,471 6,911 12,085 1,746
Average Inventory
= 8.75 = 12.98 = 17.83 = 10.12 = 70.43
Inventory Period = 365 = 365 = 365 = 365 = 365 = 365
Inventory Turnover 8.75 12.98 17.83 10.12 70.43
= 41.73 = 28.11 = 20.48 = 36.08 = 5.18
Total Assets Turnover = Sales = 135,135 = 509,466 = 228,690 = 152,460 = 173,250
Total Assets 927,467 2,318,389 2,817,023 2,980,504 3,384,196
= 0.15 = 0.22 = 0.08 = 0.05 = 0.05
Y3 Y4 Y5Efficiency Ratios Y1 Y2
Gross Profit Margin = Sales - Cost of Goods Sold = 125,308 = 499,220 = 218,423 = 142,273 = 163,003
Sales 1,039,500 2,853,051 1,905,750 1,386,000 1,732,500
= 12% = 17% = 11% = 10% = 9%
Net Profit Margin = Net Profit = 139,595 = 1,626,336 = 1,766,414 = 2,263,551 = 2,257,200
Sales 1,039,500 80,148,010 84,155,411 90,193,968 91,368,731
= 13% = 2% = 2% = 3% = 2%
Operating Profit Margin = Operating Profit = 126,258 = 126,258 = 126,258 = 126,258 = 126,258
Sales 1,039,500 2,853,051 1,905,750 1,386,000 1,732,500
= 12% = 4% = 7% = 9% = 7%
Return on Assets = Net Profit = 139,595 = 1,430,537 = 758,940 = 390,599 = 634,717
Average on Assets 927,467 2,318,389 2,817,023 2,980,504 3,384,196
= 15% = 62% = 27% = 13% = 19%
Y1 Y2 Y3 Y4 Y5Profitability Ratio
Debt Ratio = Total Liabilities = 787,872 = 748,257 = 487,951 = 260,833 = 29,808
Total Assets 927,467 2,318,389 2,817,023 2,980,504 3,384,196
= 0.85 = 0.32 = 0.17 = 0.09 = 0.01
Times interest-earned Ratio = Net Income = 139,595 = 1,430,537 = 758,940 = 390,599 = 634,717
Annual Interest Expense 237,914 2,043,625 1,095,384 578,694 923,074
= 0.59 = 0.70 = 0.69 = 0.67 = 0.69
Y3 Y4 Y5Leverage Ratio Y1 Y2

119
Current ratio will increase every year the higher current ratio show that zdravo siam
is capable in paying back the profit
Quick ratio is viewed as a sign of company's financial strength or weakness.
Inventory turnover ratio measures the number of times, on average, the inventory is
sold during the period.
Total asset turnover ratio this is a measure of how well assets are being used to
produce revenue.
Gross profit margin show remains from sales after a company pays out the cost of
goods sold.
Net profit margin this number is an indication of how effective a company is at cost
control. The higher the net profit margin is, the more effective the company is at
converting revenue into actual profit.
Operating profit margin indicates how effective a company is at controlling the
costs and expenses associated with their normal business operations.
Return on asset a measure of a company's profitability, equal to a fiscal year's
earnings divided by its total assets, expressed as a percentage.
Debt ratio This will tell you how much the company relies on debt to finance assets.
In general, the lower the company's reliance on debt for asset formation, the less risky
the company is since excessive debt can lead to a very heavy interest and principal
repayment burden.
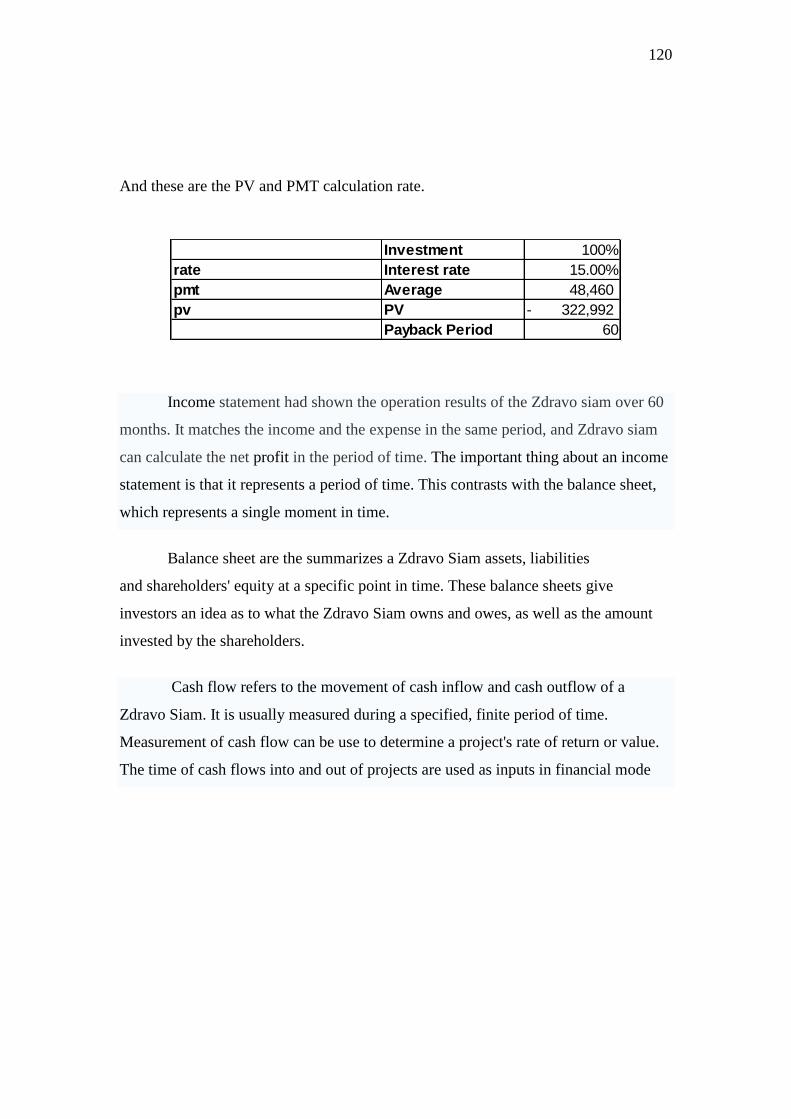
120
Investment 100%
rate Interest rate 15.00%
pmt Average 48,460
pv PV 322,992-
Payback Period 60
And these are the PV and PMT calculation rate.
Income statement had shown the operation results of the Zdravo siam over 60
months. It matches the income and the expense in the same period, and Zdravo siam
can calculate the net profit in the period of time. The important thing about an income
statement is that it represents a period of time. This contrasts with the balance sheet,
which represents a single moment in time.
Balance sheet are the summarizes a Zdravo Siam assets, liabilities
and shareholders' equity at a specific point in time. These balance sheets give
investors an idea as to what the Zdravo Siam owns and owes, as well as the amount
invested by the shareholders.
Cash flow refers to the movement of cash inflow and cash outflow of a
Zdravo Siam. It is usually measured during a specified, finite period of time.
Measurement of cash flow can be use to determine a project's rate of return or value.
The time of cash flows into and out of projects are used as inputs in financial mode

121
Reference

122
Reference apache. (2009). Retrieved from http://www.apache.co.th:
http://www.apache.co.th/showdetail.php?id=213
Bank, K. (n.d.). kasikornresearch. Retrieved from www.kasikornresearch.com:
www.kasikornresearch.com
excelthai. (2008). Retrieved from www.excelthai.com:
www.excelthai.com/2008/03/blog-post_19.html
foodsci. (n.d.). Retrieved from http://www.foodsci.uoguelph.ca:
http://www.foodsci.uoguelph.ca/dairyedu/icmanu.html
icecreamfanclub. (2009). Retrieved from http://www.icecreamfanclub.com:
http://www.icecreamfanclub.com/index.php?name=News&file=article&sid=2
officemate. (n.d.). Retrieved from www.officemate.co.th:
http://www.officemate.co.th/b2cv4/Product.aspx?pgID=00962
pncfurniture. (2009). Retrieved from www.pncfurniture.com:
http://www.pncfurniture.com/index.php?lay=show&ac=article&Ntype=5
Stogo, M. (2008). Ice cream and frozen desserts A commercial guide to production
and marketing.
surveymonkey. (n.d.). surveymonkey. Retrieved from www.surveymonkey.com:
www.surveymonkey.com
taladsimummuang. (2009). Retrieved from www.taladsimummuang.com:
http://www.taladsimummuang.com/dmma/Portals/PriceList.aspx?id=02
thai4promotion. (n.d.). Retrieved from www.thai4promotion.com:
http://www.thai4promotion.com/mbdetail.php?id=Z010409744
thaichefbakery. (n.d.). Retrieved from www.thaichefbakery.com:
http://www.thaichefbakery.com/index.php?lay=show&ac=article&Id=538680877
thaiidea. (2009). Retrieved from www.thaiidea.com:
http://www.thaiidea.com/product-th-159913-2268515-
%E0%B8%81%E0%B8%A3%E0%B8%B0%E0%B8%94%E0%B8%B2%E0%B8%
99%E0%B8%94%E0%B8%B3+50x90x120+cm.html
Thailis. (n.d.). thailis. Retrieved from tdc.thailis.or.th/tdc/basic.php:
tdc.thailis.or.th/tdc/basic.php
twinfishshop. (n.d.). Retrieved from www.twinfishshop.com:
http://www.twinfishshop.com/501-inspiration/104-501-soda-spoon.html
university, A. (n.d.). AU. Retrieved from www.au.edu: www.au.edu
กรมการคาภายใน. (2010). DIT. Retrieved from www.DIT.go.th.
กระทรวงศกษาธการ. (n.d.). Retrieved from www.obec.go.th: www.obec.go.th
123
Appendix

124
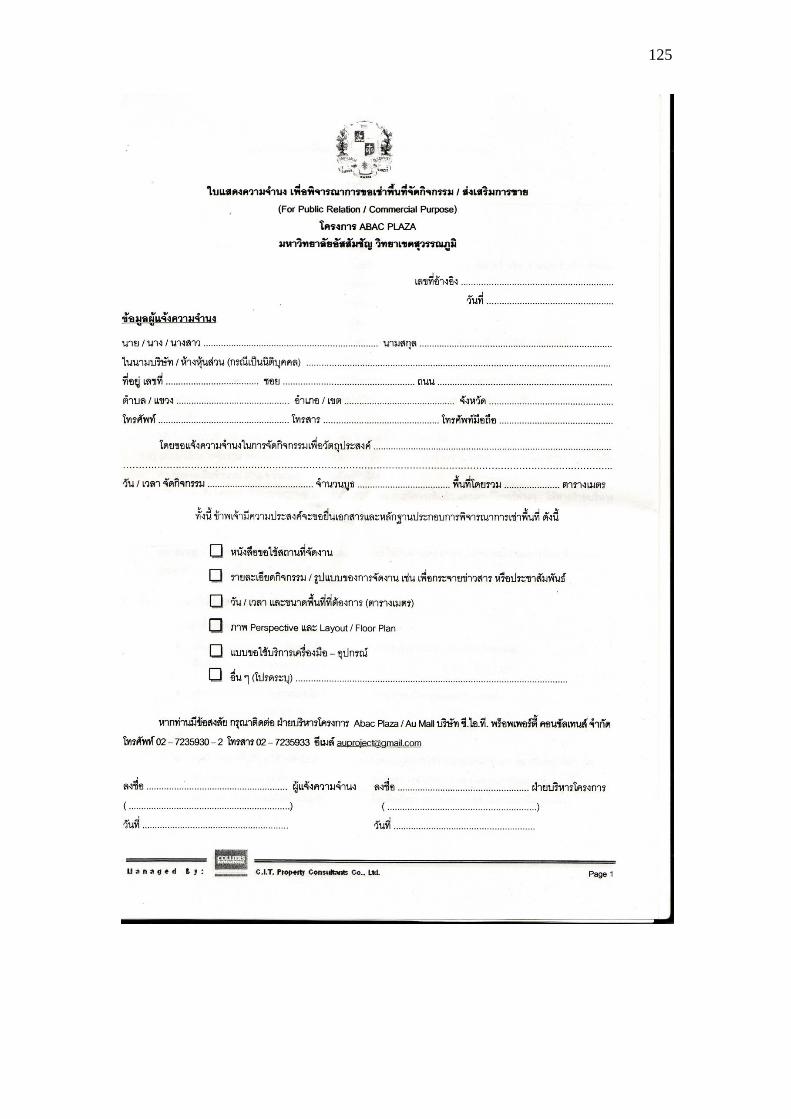
125
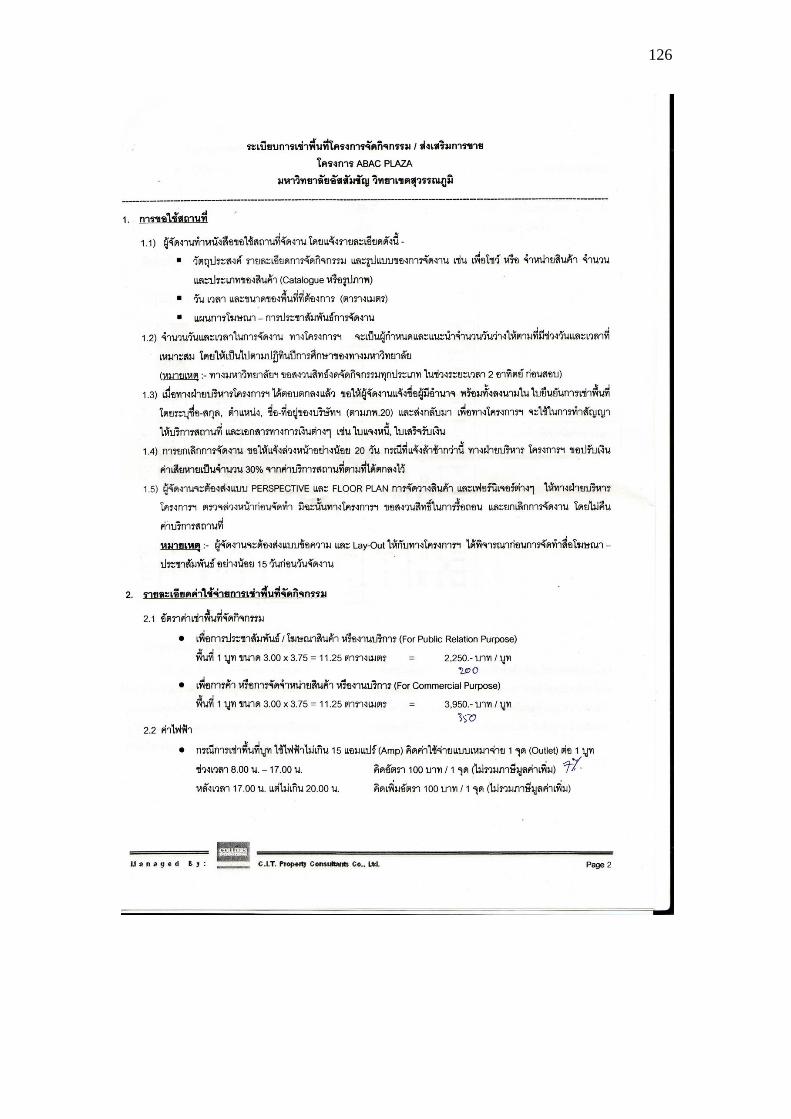
126

127

128
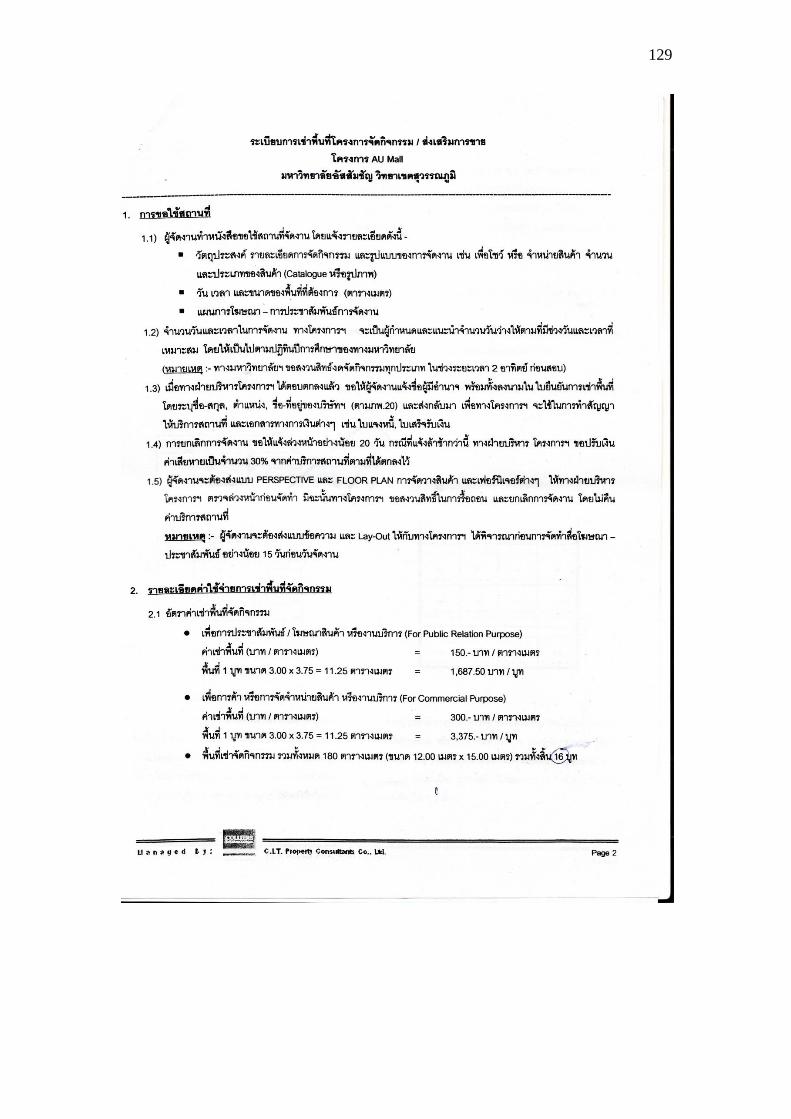
129
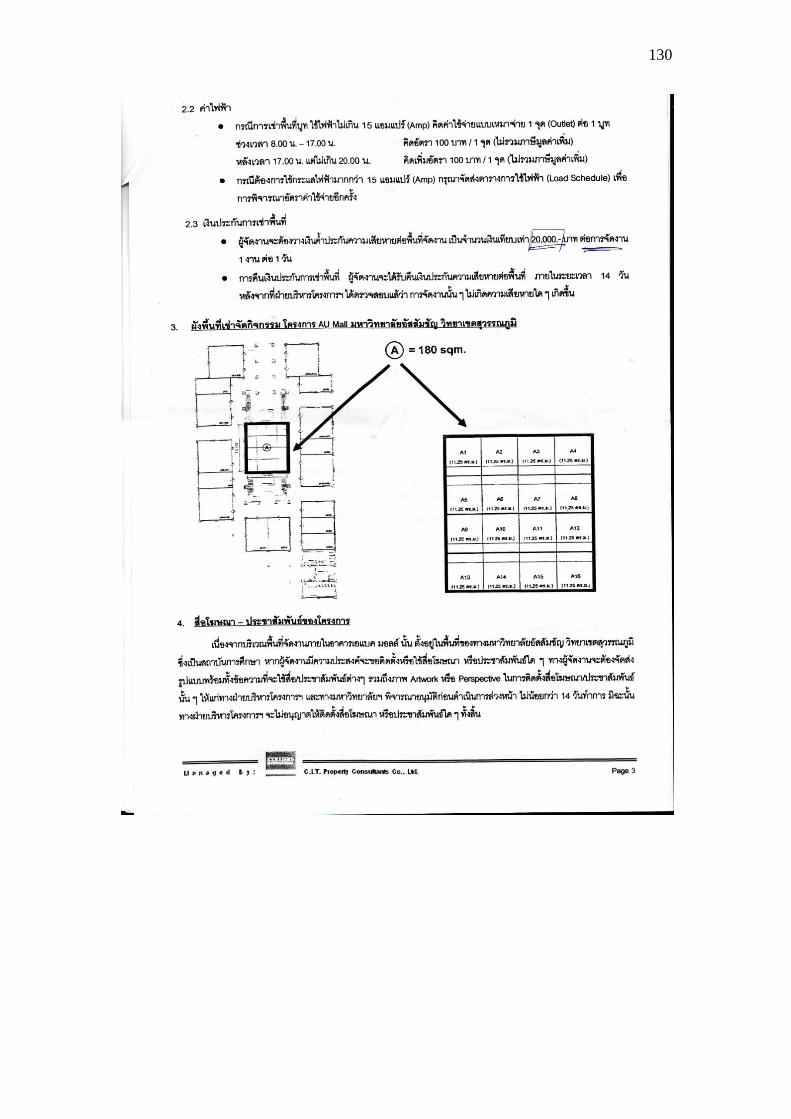
130
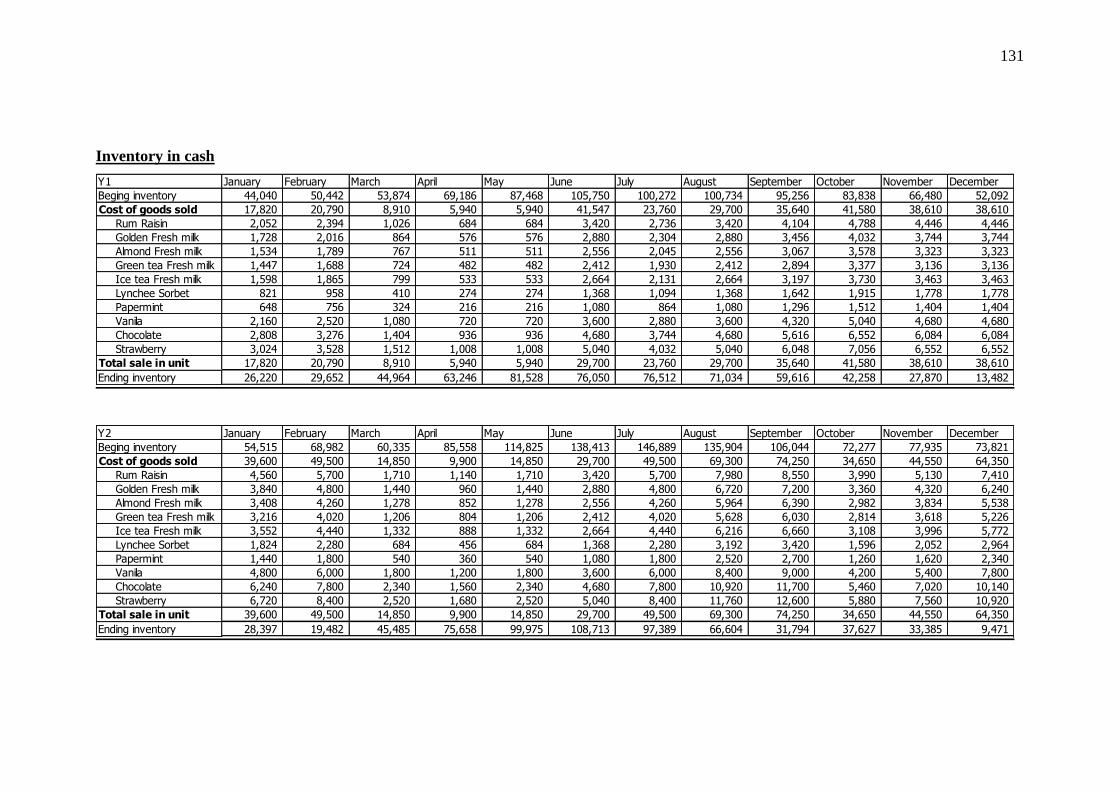
131
Inventory in cash
Y1 January February March April May June July August September October November December
Beging inventory 44,040 50,442 53,874 69,186 87,468 105,750 100,272 100,734 95,256 83,838 66,480 52,092
Cost of goods sold 17,820 20,790 8,910 5,940 5,940 41,547 23,760 29,700 35,640 41,580 38,610 38,610
Rum Raisin 2,052 2,394 1,026 684 684 3,420 2,736 3,420 4,104 4,788 4,446 4,446
Golden Fresh milk 1,728 2,016 864 576 576 2,880 2,304 2,880 3,456 4,032 3,744 3,744
Almond Fresh milk 1,534 1,789 767 511 511 2,556 2,045 2,556 3,067 3,578 3,323 3,323
Green tea Fresh milk 1,447 1,688 724 482 482 2,412 1,930 2,412 2,894 3,377 3,136 3,136
Ice tea Fresh milk 1,598 1,865 799 533 533 2,664 2,131 2,664 3,197 3,730 3,463 3,463
Lynchee Sorbet 821 958 410 274 274 1,368 1,094 1,368 1,642 1,915 1,778 1,778
Papermint 648 756 324 216 216 1,080 864 1,080 1,296 1,512 1,404 1,404
Vanila 2,160 2,520 1,080 720 720 3,600 2,880 3,600 4,320 5,040 4,680 4,680
Chocolate 2,808 3,276 1,404 936 936 4,680 3,744 4,680 5,616 6,552 6,084 6,084
Strawberry 3,024 3,528 1,512 1,008 1,008 5,040 4,032 5,040 6,048 7,056 6,552 6,552
Total sale in unit 17,820 20,790 8,910 5,940 5,940 29,700 23,760 29,700 35,640 41,580 38,610 38,610
Ending inventory 26,220 29,652 44,964 63,246 81,528 76,050 76,512 71,034 59,616 42,258 27,870 13,482
Y2 January February March April May June July August September October November December
Beging inventory 54,515 68,982 60,335 85,558 114,825 138,413 146,889 135,904 106,044 72,277 77,935 73,821
Cost of goods sold 39,600 49,500 14,850 9,900 14,850 29,700 49,500 69,300 74,250 34,650 44,550 64,350
Rum Raisin 4,560 5,700 1,710 1,140 1,710 3,420 5,700 7,980 8,550 3,990 5,130 7,410
Golden Fresh milk 3,840 4,800 1,440 960 1,440 2,880 4,800 6,720 7,200 3,360 4,320 6,240
Almond Fresh milk 3,408 4,260 1,278 852 1,278 2,556 4,260 5,964 6,390 2,982 3,834 5,538
Green tea Fresh milk 3,216 4,020 1,206 804 1,206 2,412 4,020 5,628 6,030 2,814 3,618 5,226
Ice tea Fresh milk 3,552 4,440 1,332 888 1,332 2,664 4,440 6,216 6,660 3,108 3,996 5,772
Lynchee Sorbet 1,824 2,280 684 456 684 1,368 2,280 3,192 3,420 1,596 2,052 2,964
Papermint 1,440 1,800 540 360 540 1,080 1,800 2,520 2,700 1,260 1,620 2,340
Vanila 4,800 6,000 1,800 1,200 1,800 3,600 6,000 8,400 9,000 4,200 5,400 7,800
Chocolate 6,240 7,800 2,340 1,560 2,340 4,680 7,800 10,920 11,700 5,460 7,020 10,140
Strawberry 6,720 8,400 2,520 1,680 2,520 5,040 8,400 11,760 12,600 5,880 7,560 10,920
Total sale in unit 39,600 49,500 14,850 9,900 14,850 29,700 49,500 69,300 74,250 34,650 44,550 64,350
Ending inventory 28,397 19,482 45,485 75,658 99,975 108,713 97,389 66,604 31,794 37,627 33,385 9,471

132
Y3 January February March April May June July August September October November December
Beging inventory 85,455 84,640 89,223 115,323 146,552 177,469 159,562 147,225 135,010 122,918 100,166 72,251
Cost of goods sold 43,560 38,115 16,335 10,890 10,890 59,895 54,450 54,450 54,450 65,340 70,785 65,340
Rum Raisin 5,016 4,389 1,881 1,254 1,254 6,897 6,270 6,270 6,270 7,524 8,151 7,524
Golden Fresh milk 4,224 3,696 1,584 1,056 1,056 5,808 5,280 5,280 5,280 6,336 6,864 6,336
Almond Fresh milk 3,749 3,280 1,406 937 937 5,155 4,686 4,686 4,686 5,623 6,092 5,623
Green tea Fresh milk 3,538 3,095 1,327 884 884 4,864 4,422 4,422 4,422 5,306 5,749 5,306
Ice tea Fresh milk 3,907 3,419 1,465 977 977 5,372 4,884 4,884 4,884 5,861 6,349 5,861
Lynchee Sorbet 2,006 1,756 752 502 502 2,759 2,508 2,508 2,508 3,010 3,260 3,010
Papermint 1,584 1,386 594 396 396 2,178 1,980 1,980 1,980 2,376 2,574 2,376
Vanila 5,280 4,620 1,980 1,320 1,320 7,260 6,600 6,600 6,600 7,920 8,580 7,920
Chocolate 6,864 6,006 2,574 1,716 1,716 9,438 8,580 8,580 8,580 10,296 11,154 10,296
Strawberry 7,392 6,468 2,772 1,848 1,848 10,164 9,240 9,240 9,240 11,088 12,012 11,088
Total sale in unit 43,560 38,115 16,335 10,890 10,890 59,895 54,450 54,450 54,450 65,340 70,785 65,340
Ending inventory 41,895 46,525 72,888 104,433 135,662 117,574 105,112 92,775 80,560 57,578 29,381 6,911
Y4 January February March April May June July August September October November December
Beging inventory 42,759 46,551 42,795 64,602 88,050 105,784 100,301 77,293 63,563 58,276 60,672 55,645
Cost of goods sold 31,680 39,600 11,880 7,920 11,880 35,640 55,440 47,520 39,600 31,680 39,600 43,560
Rum Raisin 3,648 4,560 1,368 912 1,368 4,104 6,384 5,472 4,560 3,648 4,560 5,016
Golden Fresh milk 3,072 3,840 1,152 768 1,152 3,456 5,376 4,608 3,840 3,072 3,840 4,224
Almond Fresh milk 2,726 3,408 1,022 682 1,022 3,067 4,771 4,090 3,408 2,726 3,408 3,749
Green tea Fresh milk 2,573 3,216 965 643 965 2,894 4,502 3,859 3,216 2,573 3,216 3,538
Ice tea Fresh milk 2,842 3,552 1,066 710 1,066 3,197 4,973 4,262 3,552 2,842 3,552 3,907
Lynchee Sorbet 1,459 1,824 547 365 547 1,642 2,554 2,189 1,824 1,459 1,824 2,006
Papermint 1,152 1,440 432 288 432 1,296 2,016 1,728 1,440 1,152 1,440 1,584
Vanila 3,840 4,800 1,440 960 1,440 4,320 6,720 5,760 4,800 3,840 4,800 5,280
Chocolate 4,992 6,240 1,872 1,248 1,872 5,616 8,736 7,488 6,240 4,992 6,240 6,864
Strawberry 5,376 6,720 2,016 1,344 2,016 6,048 9,408 8,064 6,720 5,376 6,720 7,392
Total sale in unit 31,680 39,600 11,880 7,920 11,880 35,640 55,440 47,520 39,600 31,680 39,600 43,560
Ending inventory 11,079 6,951 30,915 56,682 76,170 70,144 44,861 29,773 23,963 26,596 21,072 12,085

133
Y5 January February March April May June July August September October November December
Beging inventory 53,159 44,987 46,663 72,295 101,961 130,736 101,030 81,819 82,389 73,340 64,562 51,246
Cost of goods sold 49,500 39,600 14,850 9,900 9,900 69,300 59,400 39,600 49,500 49,500 54,450 49,500
Rum Raisin 5,700 4,560 1,710 1,140 1,140 7,980 6,840 4,560 5,700 5,700 6,270 5,700
Golden Fresh milk 4,800 3,840 1,440 960 960 6,720 5,760 3,840 4,800 4,800 5,280 4,800
Almond Fresh milk 4,260 3,408 1,278 852 852 5,964 5,112 3,408 4,260 4,260 4,686 4,260
Green tea Fresh milk 4,020 3,216 1,206 804 804 5,628 4,824 3,216 4,020 4,020 4,422 4,020
Ice tea Fresh milk 4,440 3,552 1,332 888 888 6,216 5,328 3,552 4,440 4,440 4,884 4,440
Lynchee Sorbet 2,280 1,824 684 456 456 3,192 2,736 1,824 2,280 2,280 2,508 2,280
Papermint 1,800 1,440 540 360 360 2,520 2,160 1,440 1,800 1,800 1,980 1,800
Vanila 6,000 4,800 1,800 1,200 1,200 8,400 7,200 4,800 6,000 6,000 6,600 6,000
Chocolate 7,800 6,240 2,340 1,560 1,560 10,920 9,360 6,240 7,800 7,800 8,580 7,800
Strawberry 8,400 6,720 2,520 1,680 1,680 11,760 10,080 6,720 8,400 8,400 9,240 8,400
Total sale in unit 49,500 39,600 14,850 9,900 9,900 69,300 59,400 39,600 49,500 49,500 54,450 49,500
Ending inventory 3,659 5,387 31,813 62,395 92,061 61,436 41,630 42,219 32,889 23,840 10,112 1,746

134
หลกกฎหมายเกยวกบสนเชอ
หลกกฎหมายเกยวกบการกยม ในกรณทขาดทนส ารองในการผลตหรอมทนส ารองอยไมเพยงพอทจะลงทน ปรบปรงหรอขยายกจการ อาจไปกยมจากแหลงสนเชอได เชน สถาบนการเงนตางๆ นายทน เปนตน การกยมนกตองด าเนนการตามหลกเกณฑทกฎหมายก าหนด ประมวลกฎหมายแพงและพาณชยถอวา การกยมเปนสญญาประธาน ซงเปนการ ตกลงกนระหวางบคคลสองฝายคอผใหยมและผยม โดยผ ใหยมสญญาจะสงมอบทรพยใหแกผยม และผยมจะสงมอบทรพยนนหรอทรพยอนทมปรมาณอยางเดยวกนคนใหแกผใหยม ในการกยมนน อาจตกลงกบนายทนผใหยมในรป สญญาใชคงรป กลาวคอ ยมสงใดมากจะตองสงใชคนสงนน เชน เกษตรกรขอยมเครองจกรมาใชงานเกษตร เมอใชงานเสรจแลวกตองน าเครองจกรนนมาคนเจาของ หรอยมรถยนตมาขนขาวทนวดแลวน าไปเกบในยง เมอขนขาวเสรจแลวกน ารถยนตคนนนสงคนเจาของเปนตน หรอเกษตรกรอาจตกลงกบนายทน ผใหยมในรปการยมใชสนเปลอง หมายถงการยมเงน ขาวสาร พรก กะป เมอนายทนไดมอบเงน ขาวสาร พรกหรอกะปมาใหแลว เกษตรกรกใชหมดไป การใชคนเกษตรกรตองหาเงน หรอ ธนบตรใบอนในจ านวนเดยวกน หรอขาวสารเมดอน พรก กะปอนทมปรมาณเทากนไปใชคน นายทน 1) หลกเกณฑการกยมสนเชอทเปนเงน
การกยมเงนเปนสญญาซงผใหยมโอนกรรมสทธในเงนนนใหแกผยม และผยมตกลงวาจะคนเงนเปนประเภท ชนดและปรมาณเชนเดยวกนใหแทน ซงในการกยมเงนกนนอาจก าหนดดอกเบยไวในสญญาดวยหรอไมกได โดยถอเปนขอตกลงตางหากจากสญญากยม
การกยมจะตองมการสงมอบเงนทยมใหแกกน กลาวคอ ตราบใดทผใหกยงมได สงมอบเงนใหกแกผยม แมจะไดท าสญญาไวตอกนกตาม จะบงคบเรยกรองใหปฏบตการช าระหนตามสญญานนไมได การกยมเงนเกนกว า 50 บาทขนไปตองท าหลกฐานเปนหนงสอลงลายมอชอผยมไวเปนส าคญมฉะนนผใหกจะฟองรองใหบงคบใหใชเงนยมไมได แตถาหากกยมเงนกนนอยกวา 50 บาท กไมตองท าเปนหนงสอกสามารถฟองรองกนไดโดยเพยงน าพยานบคคลผรเหน มากลาวอางเทานน อนงหลกฐานแหงการกยมนน เพยงแตเปนหนงสอมลายมอชอผยมปรากฏอยกถอเปนหลกฐานได ไมจ าเปนตองท าเปนสญญาแมเพยงบนทก จดหมาย หรอเอกสารอนใด หากบงชวามการกยมกน และปรากฏลายมอชอผยมกถอเปนหลกฐานทใชไดเชนสญญาก
135
หลกฐานสญญากยมเงนตองปดอากรแสตมปทก 200 บาท หรอเศษของ 200 บาทตออากรแสตมป 10 สตางค ในสวนทเกยวกบดอกเบยหากผใหยมกบผยมไดตกลงจะใหแกกน หามมใหผใหกยมเสยดอกเบย เกนกวารอยละ 15 ตอป หากผใหกยมเรยกดอกเบยเกนกวาอตราน ผใหกมความ ผดอาญาฐานเรยกดอกเบยเกดอตรา และจะไมไดรบดอกเบยในการช าระหน คงเรยกช าระหนคนไดเฉพาะตนเงนเทานน เชน นาย ก . ใหนาย ข . ยมเงน 500 บาท โดยก าหนดดอกเบยในอตรารอยละ 10 ตอเดอน เมอค านวณอตราดอกเบยทงปแลวเกนรอยละ 15 ตอปตามทกฎหมายก าหนด เมอถงก าหนดเวลาช าระหนเงนตน นาย ข . มสทธจะไมใหดอกเบยแก นาย ก . เลยกได แตจะ ใชคนเพยงเงนตน 500 บาทเทานน อยางไรกตามส าหรบสถาบนการเงนเพอ การพาณชย เชน ธนาคาร บรษทเงนทนตาง ๆ สามารถเรยกดอกเบยจากผกไดเกนกวารอยละ 15 ตอป ทงน ยอมเปนไปตามกฎหมายพเศษของสถาบนนนทอนญาตใหเรยกดอกเบยเกนกวาอตราดงกลาวได อนง ถามไดก าหนดดอกเบยไวในหลกฐานการกยม และ ตามเจตนาของผกและผก ใหพงสนนษฐานวา ถาคสญญาจะตกลงในดอกเบยแกกนแลว กใหมสทธไดรบเพยงรอยละ เจดครงตอป ในการกยม กฎหมายหามมใหคดดอกเบยทบตน เวนแตผใหกและผกจะไดตกลง ยนยอมกนไวเปนหนงสอ โดยลงลายมอของทง สองฝายเปนส าคญ กรณเชนนจะไมบงคบแกกน การกเงนธนาคารหรอสถาบนการเงนอนโดยวธเบกเงนเกนบญช ผใหกมสทธคดดอกเบยทบตนได ถาในสญญามไดก าหนดเวลาใหผกช าระเงนกคนเมอใดเปนหนาทของผใหกจะตองบอกกลาวใหผกช าระเงนก คนภายในเวลาอนสมควร เชน 7 วน หรอ 30 วนนบแตวนไดรบ ค าบอกกลาว เปนตน ในการช าระหนเงนกตามหลกฐานแสดงการกยมนน จ าตองใหผกลงลายมอชอไว เปนส าคญ หรอใหผใหกมอบหลกฐานการกยมคนแกผยม หรอหมายเหตเพกถอนการกยม ใบหลกฐานเอกสารนนเสยกอน มฉะนน หากเปนคดขนในศาล ผกจะตกเปนฝายเสยเปรยบในคด ถาไดก าหนดไวในหลกฐานการกยมวา ผใหกยนยอมเอาสงของหรอทรพยสนอนใดโดยมใชตวเงนแทนจ านวนเงนทก ซงอาจรวมดอกเบยดวยกได กฎหมายใหคดเปนหนคางช าระโดยจ านวนเทากบราคาทองตลาดแหงสงของหรอทรพยอนนนในเวลาและสถานททสงมอบ และในกรณนถอไดวา หนตามสญญากไดระงบไปเพราะการช าระหนดวยสงของหรอทรพยสนแทน อายความในการฟองใหผกใชเงนคนมก าหนด 10 ป นบแตวนทผใหกมสทธเรยกรองใหผกใชเงนคน เชนวนทหนเงนกถงก าหนดช าระ หรอวนครบก าหนดทผใหกบอกกลาวใหผกคนเงนทก ในกรณหลกฐานการกยมมไดก าหนดเวลาไว