project feasibilty study and evaluation . aj. chaiyawat thongintr. mae fah luang university (mfu)...
DESCRIPTION
Project feasibilty Study and Evaluation . Aj. chaiyawat Thongintr. Mae Fah Luang University (MFU) 2010.Idea PlusTRANSCRIPT

I

II
Table of Content
Title Page
Content of table ........................................................................................................... V
Content of Figure ...................................................................................................... VI
Exclusive Summary ............................................................................................... VIII
Chapter 1: Introduction .............................................................................................. 1
1.1 Background and Significance of the Project .................................................. 1
1.2 Project Objectives ............................................................................................. 2
1.3 Benefit of project .............................................................................................. 2
1.4 Activities / Time Frame .................................................................................... 3
Chapter 2: Industry Profile......................................................................................... 4
2.1 Nature of industry ............................................................................................ 4
2.1.1 Type of packaging ...................................................................................... 5
2.2 Situation of industry ......................................................................................... 8
2.2.1 Leader of Packaging Industries .................................................................. 9
2.2.2 Situation of Packaging Industry in Thailand ............................................ 11
2.2.3 Packaging Business in Thailand (only juristic person) ............................ 12
2.2.4 Average Financial Ratio ........................................................................... 17
2.3 Product/service (in general) ........................................................................... 20
2.3.1 Product: .................................................................................................... 20
2.4 Vision and Mission.......................................................................................... 26
2.5 Strategy ............................................................................................................ 26
2.5.1 Corporate Level ........................................................................................ 26
2.5.2 Business Level.......................................................................................... 28
2.5.3 Functional Level Strategies ...................................................................... 29
III
Table of Content
Title Page
Chapter 3: Market Feasibility Study ....................................................................... 32
3.1 Market Analysis .............................................................................................. 32
3.1.1 General Environment Analysis ................................................................ 32
3.1.2 Competition Analysis ............................................................................... 36
3.2 STP Analysis ................................................................................................... 40
3.2.1 Market segmentation ................................................................................ 40
3.2.2 Target Market ........................................................................................... 42
3.2.3 Product Position ....................................................................................... 43
3.3 Marketing Mix Strategy ................................................................................. 44
3.3.1 Product ..................................................................................................... 44
3.3.2 Price .......................................................................................................... 45
3.3.3 Place ......................................................................................................... 45
3.3.4 Promotion ................................................................................................. 46
3.4 Sale Forecast/Profit Estimation ..................................................................... 47
3.5 Marketing Expense (Sales Incentive) ............................................................ 56
3.5 Market Feasibility Conclusion ...................................................................... 61
Chapter 4: Technical Feasibility Study ................................................................... 62
4.1. Production and Operations Analysis ........................................................... 62
4.1.1 Product Characteristics ............................................................................. 62
4.1.2 Specification/ Feature of each type of paper
we provided to our customers .................................................................. 68
4.1.3 Production and service process ................................................................ 75
4.1.4 Location .................................................................................................... 80
4.1.5 Facility Layout ......................................................................................... 81
4.1.6 Tools / Equipments................................................................................... 88
4.1.7 Logistics management ............................................................................ 118
4.1.8 Facility Management .............................................................................. 120

IV
Table of Content
Title Page
4.2 Cost of Investment ........................................................................................ 125
4.2.1 Pre – Operating Cost .............................................................................. 125
4.3 Investment Cost ............................................................................................ 131
4.3.1 Building Decoration ............................................................................... 131
4.3.2 Tools and Equipments ............................................................................ 133
4.4 Management Analysis .................................................................................. 147
4.4.1 Organization Management ..................................................................... 147
4.5 Technical Feasibility Conclusion ................................................................. 165
Chapter 5: Financial Analysis ................................................................................. 166
Chapter 6: Risk Management ................................................................................. 183
6.1 External Risk management.......................................................................... 184
6.2 Internal Risk Management .......................................................................... 192
6.3 Summary Risk Management ....................................................................... 198
Chapter 7: Summary ............................................................................................... 199
Appendix ......................................................................... Error! Bookmark not defined.

V
Content of table Title Page
Chapter 2
Table 2.1: Registration to establish and close down business…………………..........14
Table 2.2: Table 2.2: Financial Ratio of Total Company...…………………………..16
Table 2.3: Financial Ratio of Small Company……………………………………….17
Chapter 3
Table 3.1: The total number of industries in capital of Chiang Rai 2009……………32
Table 3.2: The Size of business according to the value of fixed asset in
business in Thailand……………………………………………………...39
Chapter 4 Table 4.1: The Standard US Corrugated Flutes……………………………………...70
Table 4.2: The Printing Inks………………………………………………………….76
Table 4.3: The Electricity Peak ….…………………………………………………155
Table 4.4: The Rate of water price…………………………………….....................156
VI
Content of Figure Title Page
Chapter 2
Figure 2.1: The proportion of packaging consumption in each region………………..8
Figure 2.2: The proportion of packaging in each type…………………………….......8
Figure 2.3: Number of packaging business classify
by juristic person category………………………………………………13
Figure 2.4: Number of packaging business classify
by regions of Thailand………...................................................................13
Figure 2.5: Number of packaging business classify
by registered capital…………...................................................................14
Figure 2.6: Number of the remaining packaging business
between 1 999-2009……………………………………………………...15
Figure 2.7: The value of foreign investment…………………………………………15
Figure 2.8: Average main income per company……………………………………..16
Figure 2.9: Financial Ration of Total Business………………………………………17
Figure 2.10: Financial Ratio of Small Business……………………………………...18
Figure 2.11: Corrugated fiberboard box……………………………………………...19
Figure 2.12: Cardboard paper box……………………………………………………21
Figure 2.13: Kraft paper bag…………………………………………………………22
Figure 2.14: Cardboard paper bag……………………………………………………23
Figure 2.15: The other design of packaging………………………………………….24
Figure 2.16: Common Customer Service Complaints……………………………….28
Chapter 3
Figure 3.1: Graph show the total number of industries in capital of
Chiang Rai 2009……………………………………………………........33
Figure 3.2: The King Carton Company........................................................................35
Figure 3.3: The King Carton Company........................................................................35
Figure 3.4: Logo of IDEA Plus+.................................................................................42
Figure 3.5: Website Company: www.ideaplus.com.....................................................44
VII
Content of Figure Title Page
Chapter 4
Figure 4.1: Example of Corrugated fiberboard packaging...........................................61
Figure 4.2 Example of Cardboard paper packaging.....................................................62
Figure 4.3 Example of Cardboard bag packaging........................................................64
Figure 4.4: Example of Kraft paper bag packaging.....................................................66
Figure 4.5: The Premium Kraft-top liner - golden yellow...........................................67
Figure 4.6: The Kraft Top Liner...................................................................................68
Figure 4.7: The Kraft-top liner - bright brown.............................................................68
Figure 4.8: The Kraft-top liner – brown......................................................................68
Figure 4.9: The Corrugated fiberboard........................................................................69
Figure 4.10: The Single Face Corrugated paper...........................................................71
Figure 4.11: The Single Wall Corrugated paper..........................................................72
Figure 4.12: The Corrugated paper Double Wall.........................................................72
Figure 4.13: The Triple Wall Corrugated paper...........................................................72
Figure 4.14: Production and service process................................................................73
Figure 4.15: The production of a corrugated box can follow
many different paths through a corrugating plant’s
various machines...............................................................................75
Figure 4.16: The Location of Idea Plus building..........................................................78
Figure 4.17: The Facility Layout..................................................................................79
Figure 4.18: The Logistics of packaging industry......................................................115
Figure 4.19: The Component of a Customer Order Cycle.........................................116
Figure 4.20: Company’s name signboard / billboard.................................................123
Figure 4.21: TOA Shild-1, Tender Green ES158.......................................................129
Figure 4.22: Cream Nano tile in wooden color..........................................................129
Figure 4.23: Company’s Polo-Shirt: Front.................................................................146
Figure 4.24: Company’s Polo-Shirt: Back.................................................................146
Figure 4.25: Organization Chart................................................................................147

VIII
Exclusive Summary
Packaging is a service function that cannot exist by itself; it needs a product. If
there is no product, there is no need for a package. The packaging businesses in
Chaing Rai are quite less. Packaging may be very different, but its main functions are
still to make products easy to transport, and to protect it until on the hand of
customers, which reduces the amount we waste. There are not sufficiency for products
which are sold among the province and exported to other provinces and countries
because there are various products that available for packaging such as agricultural
products, foods, and souvenirs especially the OTOP products that are more than 700
products which need the packaging for transportation and value adding include
handicraft products, fruit and food processing products, teas, coffees, and ceramic
products, etc.
Nature of industry today is the result of a long development process. It is the
product of continuous research aimed at finding better methods of packaging the
various goods in order to ensure the best protection for them. Type of packaging there
are paper packaging, plastic packaging, metal packaging, and glass. For the situation
of industry, packages in world market: In 2007 the worldwide consumption of 253.5
million tons of packaging and valued US $ 402,500 million and is expected to be
284.9 million tons, or US $ 470,800 million in the year 2012. Then, situation of
packaging industry in Thailand there are about 1,000 paper packaging manufacturers
around the country and most of them are SMEs. In this number, there are more than
500 industrial plants registered in Department of Industrial. Total investment is about
14965 million baht. In the entire manufacturers, there are 30 manufacturers who have
been promoted by the Board of Investment including the big manufacturers who
operate the production since Kraft paper until corrugated fiberboard boxes. The
portion of the paper packaging is the highest which is 40 percent of all packaging. So,
demand in this kind of packages is more than other types of packaging. And also the
product is easy to degradation and can be recycled. These make paper packaging is
more popular because more than environmental friendly, it also support or enhance
the image of the product.

IX
The packaging of our company are produced from papers include Kraft paper,
Cardboard, and Corrugated fiberboard because the paper packaging is unique and
features is more than other types of packaging. It’s low cost, light weight, suitable to
print the text and change the design to be appropriate with the products, can be
recycled and use less time to self-degradation in nature when compared to other
materials. So, it’s the packages that cause less environmental pollution. Moreover, the
new technology evolution can up grade the quality and property of paper packages to
be more durable and protect the goods inside.
Market analysis, we use political environment analysis, economic environment
analysis, social and environment analysis, and technological analysis to analysis
external factor that can effect to our company. The businesses about packaging in
Chiang Rai are quite few that we have only one famous competitor who allocate the
business around Muang district, King Carton Company, who provide quite similar
business, but we employ the King Carton as our production division or we can call
them as supplier instead of competitor. We emphasized on customers in Chiang Rai
who running the industry, and wholesaler& retailer because there are quite more
amount of customers in these businesses. We want to serve the quality products which
meet the customers’ need because we position our products on promoting, adding
value, and environmental friendly for the customers especially the medium and small
businesses by providing product differentiation, and using the friendly materials.
The competitive for this business is quite not too competing strongly although
we have only one supplier, because we plan to employ other suppliers to supply and
running the production for us such as CK Carton in Lumphun. We want to serve the
quality products which meet the customers’ need because we position our products on
promoting, adding value, and environmental friendly for the customers especially the
medium and small businesses by providing product differentiation, and using the
friendly materials. Moreover, we offer our customers with reasonable price which is
depended on the cost of papers, allocate our company at the place where easy and
flexible for customers, distribute our products through Nimseeseng Transportation
Company to our customers directly, and do more aggressive advertising, and promote
our products through the media and sale representatives, which those are our
strategies for marketing that help us to gain more profit by reaching the customers’
mind.

X
For customer analysis, we offer our customers with reasonable price which is
depended on the cost of papers, allocate our company at the place where easy and
flexible for customers, distribute our products through Nimseeseng Transportation
Company to our customers directly, and do more aggressive advertising, and promote
our products through the media and sale representatives, which those are our
strategies for marketing that help us to gain more profit by reaching the customers’
mind. Furthermore, the calculating show that if we get just only 1% of wholesale and
retail sector and industry sector, income will be 3.92 million baht per month which
packaging is more required because there are more trading for both wholesale and
retail including arising of sales for industry.
Idea Plus Company has corrugated fiberboard packaging, Cardboard paper
packaging, bag-cardboard paper. Kraft paper can be utilized for many different
purposes. One of the most common uses of the plain brown Kraft paper is in the
manufacture of paper bags for use in grocery stores. The solid construction of Kraft
paper makes the bags ideal for use with all sorts of grocery items. Kraft paper is also
utilized in other industries as well. In the publishing industry, Kraft paper is often
used as the lining for the inside cover spine of hardback books. In the world of
electronics, Kraft paper is often used as an insulating agent on electrical components,
providing a sturdy yet inexpensive means of protecting the material. Cardboard is a
generic term for heavy-duty paper-based products sometimes made by pasting
together two or more layers of paper. It is used to make playing cards, signs, boxes,
and other things. Synonyms include paperboard and pasteboard. In industry, the term
cardboard is seldom used because it does not denote a specific material. Corrugated
fiberboard can be specified by the construction (single face, single wall, double wall,
etc), flute size, burst strength, edge crush strength, flat crush, basis weights of
components (pounds per thousand square feet, grams per square meter, etc), surface
treatments and coatings, etc. The choice of corrugated medium, flute size, combining
adhesive, and linerboards can be varied to engineer a corrugated board with specific
properties to match a wide variety of potential uses. Double and triple-wall corrugated
board is also produced for high stacking strength and puncture resistance. Box
production process is about the manufacturing sequence can follow many different
paths depending on the nature of a box design and how it is decorated. Board leaving
the corrugating machine might be natural Kraft or any one of the several white

XI
surfaced or solid white Krafts. The top linerboard may be unprinted, or the linerboard
may have been preprinted. For a regular RSC, a flat sheet, cut to the box’s overall
dimensions and with the flap scores in place, is sent through a single machine that
prints, panel-scores and slots, folds, and glues the box in one operation. Die-cut boxes
leave the corrugating machine as flat unscored sheets. They can be decorated by direct
printing or by applying preprinted lithographed labels (litho labeling). After the
appropriate decorating, the blank is sent for die-cutting, folding and gluing. Litho-
laminating is a less common process. It laminates a lithographically printed label
paper (not kraft) to a single faced board, usually using a specialized, small corrugating
machine. The process is most often done with E- or smaller flutes.
Idea Plus Company use logistic for process of planning, implementing, and
controlling the efficient, effective flow and storage of goods, services, and related
information from point of origin to point of consumption for the purpose of
conforming to customer requirements. Logistics’ Idea Plus Company start form
customer order, company has a correct information that customer need such as
number of product, style of product, right time and place for shipment product to
customer. Transportation product, Idea Plus Company use logistic service from Nim
See Seng Transport for shipping our product through customer because Nim See Seng
Transport has a good professional about logistic service. So, Idea Plus Company
outsource the logistics management by contract with Nim See Seng Transport. Thus,
outsourcing for Nim See Seng Transport will make the company pay less expense in
shipping the products to customers.
For Company’s name signboard would be ordered from Klin See Advertising
shop because they provide installation service. Klin See Advertising shop is located at
Moo.4 Phahon Yothin Road, Wieng Sub-District, Muang District, Chiang Rai.
Contact Mr. Somnuek Srisansai, telephone number: 08-1672-1802, email:
[email protected]. The signboard would be light box with white background and
letter would be in green. The letters and picture is made by special sticker which use
for outdoor signboard, long lasting for 5-7 years according to the sun light and the
rain. The total size including background is about 1.5 maters high and 4 maters for
wide (not include picture). The front is settled for 1 mater high. For the picture is
settled for 2 meters wide. Total company’s name signboard is 6 matters wide. The
XII
price for company’s name signboards is 180 baht per square feet, for total is 18,955
baht include installation service.
Company promoters are responsible for registering the company with the
Ministry of Commerce (MOC) and required at least 3 persons singing together. The
promoters must be individuals (not juristic persons) who are 20 years of age or older,
and they must be available to sign documentation during the registration process
which for Idea Plus, the promoter are included five partners for the resolution of the
group, the partners discuss to promote Miss Suratt Sukpueng to be the board of
director which needs to precede the procedures for establishing a company as the
Limited company at Office of Commercial Affairs Chiang Rai Office.
For the orgnization management, Idea Plus company we work in company
as family. We support relationship in organization and we support employees to
concern about organization culture. Thus the company provide company’s Polo-Shirts
for employees to wear in Friday similarly. For this Polo-Shirts, the company provide
2 shirts for each employees annually. These services we can provide under the good
partners for company’s supplier. Then we can sure to fulfill the customers’ orders
because we have not only one suppliers, we deal with both big company for a big
order size such as for some industry which require paper packaging, and also have a
smaller supplier to serve a small order size which some big company cannot produce
in some small order size because they cannot get the profit. In this matter, those make
Idea Plus can provide service for both a small to quite big business customers.
For financial, the company pay back period is with in one year, the
company pay interest15% for investor and pay all initial within tree years. NPV of the
project is 56,943,442.95, IRR is 402.30% and ARR or ROI is 635.57% which mean
this project can be accepted.
Idea Plus Company use risk management analysis that is very helpful in
examining the risks and following a well planned process to hedge the risk. Risk
management analysis is very important for proper application of the risk management
policies. This analysis is necessary because the demand of the market and the trends
are changing constantly and only proper analysis of risks can help the businesses to
achieve the set targets. The strategies to manage risk include transferring the risk to

XIII
another party, avoiding the risk, reducing the negative effect of the risk, and accepting
some or all of the consequences of a particular risk.
1
Chapter 1
Introduction
1.1 Background and Significance of the Project
Packaging is best described as a coordinated system of preparing goods for
transport, distribution, storage, retailing and use. It is a complex, dynamic, scientific,
artistic and controversial business function. In its most fundamental form, packaging
contains, protects/preserves, transports and informs/sells. Packaging is a service
function that cannot exist by itself; it needs a product. If there is no product, there is no
need for a package.
Nowadays, packaging may be very different, but its main functions are still to
make products easy to transport, and to protect it until on the hand of customers, which
reduces the amount we waste. For every £1 spent on packaging, £3 worth of food is
saved. Thus, our company sees that it opportunity to provide packaging because it’s so
important for ensuring that the product reaches the consumer in the same state as it left
the factory, and also help to promote and add value to the product. Moreover, the
packaging businesses in Chaing Rai are quite less. There are not sufficiencies for
products which are sold among the province and exported to other provinces and
countries because there are various products that available for packaging such as
agricultural products, foods, and souvenirs especially the OTOP products that are more
than 700 products which need the packaging for transportation and value adding include
handicraft products, fruit and food processing products, teas, coffees, and ceramic
products, etc. (source: www.thaitambon.com)So, Our company are provide this the
project for packaging to the customer in Chiang Rai and it is increase the value added
for the industry the product in Chiang Rai. The products are green and environmental
friendly position for the customer that interest packaging for environment friendly.
The packaging of our company are produced from papers include Kraft paper,
Cardboard, and Corrugated fiberboard because the paper packaging is unique and
features is more than other types of packaging. It’s low cost, light weight, suitable to
print the text and change the design to be appropriate with the products, can be recycled
and use less time to self-degradation in nature when compared to other materials. So,

2
it’s the packages that cause less environmental pollution. Moreover, the new technology
evolution can up grade the quality and property of paper packages to be more durable
and protect the goods inside.
1.2 Project Objectives 1. Learn about paper packaging industry.
2. Evaluate the situation of paper packaging competition.
3. Consider the market feasibility.
4. Analyze the production process and technical
5. Understanding the management of paper packaging business.
6. Evaluate the feasible in financial and analyze the risk for paper packaging
business.
7. Conclusion the feasibility of business
1.3 Benefit of project 1. Students can identify the opportunity to do a project.
2. Can apply the knowledge to use in the project
3. Know the current situation of the choose industry
4. Know about production process in the chosen product
5. Get more additional knowledge about that product from the professional in that
field.

3
1.4 Activities / Time Frame Gantt chart and Time Frame of the study
Activities
November December January February
Wee
k 1
Wee
k 2
Wee
k 3
Wee
k 4
Wee
k 1
Wee
k 2
Wee
k 3
Wee
k 4
Wee
k 1
Wee
k 2
Wee
k 3
Wee
k 4
Wee
k 1
Wee
k 2
Wee
k 3
Wee
k 4
1. Topic submission 2. Introduction submission - Introduction to project feasibility study
3. Study the industry profile - Product Characteristics
4. Analyze the market feasibility - Market Analysis
5. Topic presentation 6. Study technical Feasibility - Production and Operations - Process of Management
7. Analyze the financial of our business - Financial Statements Generating - Financial Statement Analysis
8. Study and manage the risk of our business - Risk Analysis and Other Analysis
9. Project Advertising - VCD/DVD Ads.
10. Writing and analyze the report
11. Presentation 12. Conclusion the feasibility of business

4
Chapter 2
Industry Profile
2.1 Nature of industry
The packaging as we know it today is the result of a long development process.
It is the product of continuous research aimed at finding better methods of packaging
the various goods in order to ensure the best protection for them. The earliest forms of
packaging were made from animal skins, large leaves and vegetables. Water was kept in
containers made from coconut shells, animal skins or gourds - the hollowed-out dried
skins of fruit and vegetables. The very first people to tread the earth, back in the depths
of prehistory, sought to conserve the surplus food collected during their hunting, fishing
and food-gathering for the longest possible time, so as to be well prepared for any future
food shortage. They used the leaves from trees, woven baskets and animal skins to store
their food. Terracotta was used to make vessels to carry liquids. In the middle ages,
wooden barrels became the most frequently used way of preserving goods. They were
used for storing all kinds of solids and liquids, protecting them from light, heat and
dampness. Their considerable robustness allowed them to be transported on the perilous
roads of the age and to be carried by boat. It was during the industrial revolution in
Europe that packaging really took off. The vast range of products made available to the
consumer brought about a change in lifestyle, providing consumers with greater choice
and allowing trade to flourish. The need for packaging grew. From then on, the rate of
innovation accelerated. The Frenchman Nicolas Appert invented the can in 1810.
Though it was made from glass rather than metal, it represented the birth of a long-term
preservation method for food. Canned food was first put to the test by the army during
the Crimean wars and during the American Civil War before it became available to
consumers. The cardboard box emerged at the end of the 19th century, a simple yet
revolutionary invention. An American, Robert Gair, had the bright idea of
manufacturing in bulk a pre-cut cardboard panel which, once folded, would form a box.
This made the transportation of goods much easier and the box became the most widely
used method of packaging at the beginning of the century due to its very low price and
ease of use. Today, boxes are used to supply us with fragile and high-tech equipment,

5
such as video recorders and computers. In 1920, the invention of transparent cellophane
marked the beginning of the era of plastic. Polyethylene, the first plastic used for
packaging, was discovered in 1933 by mistake Aluminum foil, which came later, made
it possible to effectively seal medications and other sensitive products. From then on, a
large number of technical innovations led to the continued improvement of packaging
and, consequently, to increased choice of food, thus improving our everyday standard of
living. In the 1940s, packaging was developed for frozen food. In 1952 the aerosol came
onto the market. Cans, available from the 1960s, heralded the explosion of the soft
drinks market. Aseptic cartons, invented in 1961, have been used for preserving long-
life milk ever since. This continuous quest by mankind to find new methods of
conserving food and transporting products has allowed us to substantially limit the loss
of our resources over the course of time. It has allowed us to move from a society living
from one day to the next, dependent on available food sources, to a world which
manages its resources in the long term. Efficient packaging, which can be adapted to all
kinds of goods, has made this possible. Modern packaging is what allows us to reheat a
frozen meal, as well as to ensure that the Mona Lisa can be sent to the other side of the
world and arrive in one piece. (Source: The European Organization for Packaging and
the Environment)
2.1.1 Type of packaging
In the present, packaging materials used to produce can be classified into 4
categories: paper, plastic, metal and glass which each category have different
characteristics.

6
1) Paper packaging
Paper is packaging materials that used mostly
and there are many kind which the easily to
printing and beautifully depending on the customer
needs. Papers to meet the unique sensitivity to
moisture, folding and easy to recycling are feature
of paper. While the problems of moisture and gas
that to make packaging production can be limited.
2) Plastic packaging
The Features of plastic are more
developed. The light weight and block gas and
moisture. The diversity is variety of plastics which
plastic packaging found in the general market.
There are 2 type Thermoplastic and Thermoset
plastic.
3) Metal packaging
Metal packaging materials are oldest and very
popular. Its call can which there are 2 characteristics
are Steel and Aluminum.
• Steel
Disadvantages are rust that high costs and find a way to make not rust. It may
use Tin and Chromium for enamel the can. The advantage is stability for high thermal.

7
Food packaging is use high heat and disinfection. Metal is better because it will not easy
to melt.
• Aluminum
The benefits are not rust but expensive. The feature is block to the gas and
moisture better and resistant to oil.
4) Glass
Packaging is sluggishness to react with
biological chemicals when compared with other
packaging. The qualities of products are very
well. The benefit of glass is clear and made many
colors and it can withstand the fragility.
Environment, glass can be used multiple times
return.
According to the global warming trend and EXIM Banks business research, the
consumers pay more attention on green products or environmental friendly products,
either production process, product components or packaging. The packaging need to be
environmental friendly and can be decomposed or reused including give significant to
the symbols of environment standard such as ISO 14000, Carbon Footprint, Eco-
labeling and product packaging also. Paper packaging has unique and features more
than other types of packages such as can be printed the designs, brands, messages on the
box well and can be seen clearly. Also, its lightweight, easy to transport and
inexpensive. So, demand in paper packages is more than other types of packaging. And
also the product is easy to degradation and can be recycled, more environmental
friendly than other type of packages. This can enhance the image of the customers’
products and response to customers psychological need also. These make paper
packaging is more popular.

8
2.2 Situation of industry
Packages in world market: In 2007 the worldwide consumption of 253.5 million
tons of packaging and valued US $ 402,500 million and is expected to be 284.9 million
tons, or US $ 470,800 million in the year 2012. The Asia Pacific region is fastest
growing region which representing 32.4 percent, while the Americas and Europe
accounted for 34.4 percent and 33.2 percent respectively.
Asia-Pacific33%
Americas35%
Ecrope32%
The proportion of packaging consumption in each region
Figure 2.1: The proportion of packaging consumption in each region
Paper packaging is the most used, in the year 2007 the consumption around the
world to package paper products is 130.1 million tons which representing 51.3 percent
of the total market value, while plastic packages are ranked in 3 after metals which
representing 14.6 percent of total market value.
Paper51%
Matal20%
Plastic15%
Glass10%
Other4%
The proportion of packaging in each type
Figure 2.2: The proportion of packaging in each type (Source: Office of Small and Medium Enterprises Promotion)
9
In the global market, packaging is important materials for consumer goods, and
food and beverage industry. The restrictions on the environment about waste from
packages, the manufacturers and buyers have turned to use the packaging made from
raw materials which can be reused or recycle, the people use more in substitute
packages such as use more paper packaging to be an alternative packaging instead of
plastic packaging in food industry. World packaging market is quite spread, although
there are the major manufacturers in the market. The leader in market has only 2.1 per
cent in market share.
2.2.1 Leader of Packaging Industries
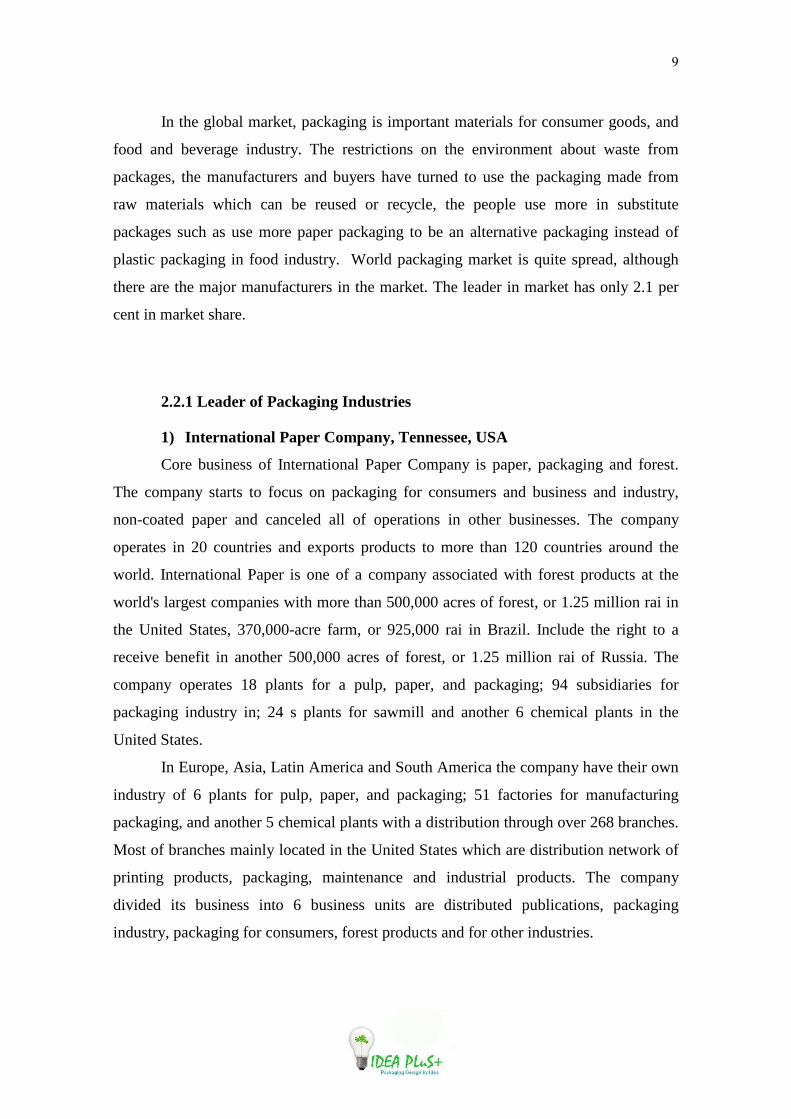
1) International Paper Company, Tennessee, USA
Core business of International Paper Company is paper, packaging and forest.
The company starts to focus on packaging for consumers and business and industry,
non-coated paper and canceled all of operations in other businesses. The company
operates in 20 countries and exports products to more than 120 countries around the
world. International Paper is one of a company associated with forest products at the
world's largest companies with more than 500,000 acres of forest, or 1.25 million rai in
the United States, 370,000-acre farm, or 925,000 rai in Brazil. Include the right to a
receive benefit in another 500,000 acres of forest, or 1.25 million rai of Russia. The
company operates 18 plants for a pulp, paper, and packaging; 94 subsidiaries for
packaging industry in; 24 s plants for sawmill and another 6 chemical plants in the
United States.
In Europe, Asia, Latin America and South America the company have their own
industry of 6 plants for pulp, paper, and packaging; 51 factories for manufacturing
packaging, and another 5 chemical plants with a distribution through over 268 branches.
Most of branches mainly located in the United States which are distribution network of
printing products, packaging, maintenance and industrial products. The company
divided its business into 6 business units are distributed publications, packaging
industry, packaging for consumers, forest products and for other industries.
10
Division of packaging industry has a total capacity of 4.9 million tons per year;
the company is a third largest in U.S for manufacturer of paper packaging. Once of third
outcome are specialty packaging products and 70 percent of production will be
corrugated paper box and other types of packaging with 65 packaging plants in the
United States. The company manufactures paper from the used paper in France. There
are 22 packaging manufacturing plants in France, Ireland, Italy, Spain and Turkey also
Morocco. Moreover the company also has facilities in Chile, Turkey and China, the
company has 8 of the packaging plant in China and 1 in Thailand. This department has
capacity Kraft paper and 405,000 tons per year.
2) Amcor Limited, Victoria, Australia.
Amcor is one of world's largest packaging manufacturers. It operates in 39
countries worldwide in the region of Australasia, Europe, North and South of America.
The company divides their operation into 6 main business units which are Amcor PET,
Amcor Autralasia, Amcor Flexible, Amcor Sunclipese, Amcor Asia and others. Amcor
PET Packaging is a manufacturer of PET (Polyethylene terephthalate) packaging, which
used widely for consumer products. Headquartered in Ann Arbor, Michigan and has
facilities in 46 locations and 36 plants of plastic injection and blow across 21 countries.
The company manufactures PET packaging products to a lot of the food and drink. It
also manufactures products for skin care, chemicals used in homes and agrochemical
industries also.
Amcor Australasia manufactures and distributes packaging in Australia and New
Zealand, including folding boxes, corrugated boxes and metal cans, aluminum. For food
beverage industry and household materials and earthen jar, PET plastic bottles and
metal, glass bottle for wine, multilayer paper bags and cardboard recycled paper. Main
market is the food and beverage industry which he total sale about 70 percent of the
market, headquartered in Victoria, Australia.

11
3) Owens-Illinois. Inc
Owens-Illinois is a packaging and glass containers manufacturer with operations
in North America, Europe, Asia Pacific and South America. And in addition is
manufacture packaging for personal care products including plastic containers for drug
control, medical devices and maintaining various systems. The company has 83
factories in 22 countries and has 18 packaging manufacturing plants which 13 plants are
located in the United States.
The company divided its business into 2 main business units: glass containers
and plastic containers. The company's main products are crystal, which consists of glass
containers for beer, drinking alcohol, wine, food, water, tea, fruits and vegetables juice
and medicine. Company also manufactures glass containers for other no alcohol
beverages. Plastic packaging manufacturing facility located in 5 countries, which the
main product is the packaging for health products and various kinds of medicine.
2.2.2 Situation of Packaging Industry in Thailand
Currently there are about 1,000 paper packaging manufacturers around the
country and most of them are SMEs. In this number, there are more than 500 industrial
plants registered in Department of Industrial. Total investment is about 14965 million
baht and employment is approximately 19,366 employees. They manufacture
corrugated fiberboard boxes which are packaging for transportation. The approximately
600 remaining manufacturer produce paperboard boxes for primary packaging of the
products; multi wall paper sacks which is the packaging for animal feed, cement,
chemicals, plastic; and shopping bag for pack the document and bags for the shopping
mall; and produce corrugated fiberboard to send to packaging industry. In the entire
manufacturers, there are 30 manufacturers who have been promoted by the Board of
Investment including the big manufacturers who operate the production since Kraft
paper until corrugated fiberboard boxes.

12
Production of packaging paper is available materials in Thailand. Especially,
raw material as Kraft paper and cardboard paper which our capacity is up to 2.40
million tons and 0.30 million tons per year which sufficient to supply for the paper
packaging industry but production costs direct variation to raw materials cost (Kraft
paper and card board paper), wages and energy costs. For most of production is to
supply the production of subsidiary and produce as customers’ order (OEM: Original
Equipment Manufacturing). Most market structure is 95 percent is for domestic market
and 5 percent is exported. In the current, productions of industrial and agricultural
sector in Thailand more than 70 percent require packaging. The portion of the paper
packaging is the highest which is 40 percent of all packaging. That because of paper
packaging has unique and features more than other types of packages such as can be
printed the designs, brands, messages on the box well and can be seen clearly. Also, it’s
lightweight, easy to transport and inexpensive. So, demand in this kind of packages is
more than other types of packaging. And also the product is easy to degradation and can
be recycled. These make paper packaging is more popular because more than
environmental friendly, it also support or enhance the image of the product.
2.2.3 Packaging Business in Thailand (only juristic person)
1) Overview of business
Registered juristic person that related to corrugated board manufacturing and
paper packaging and paperboard are classified by Thailand Standard Industrial
Classification 2001). The business of corrugated board, cardboard, cardboard containers
(TSIC 21020) operations associated with corrugated manufacturing, paper containers
made from corrugated paper, paper sacks, paper bags, cases and boxes made of paper
and other containers as well.
13
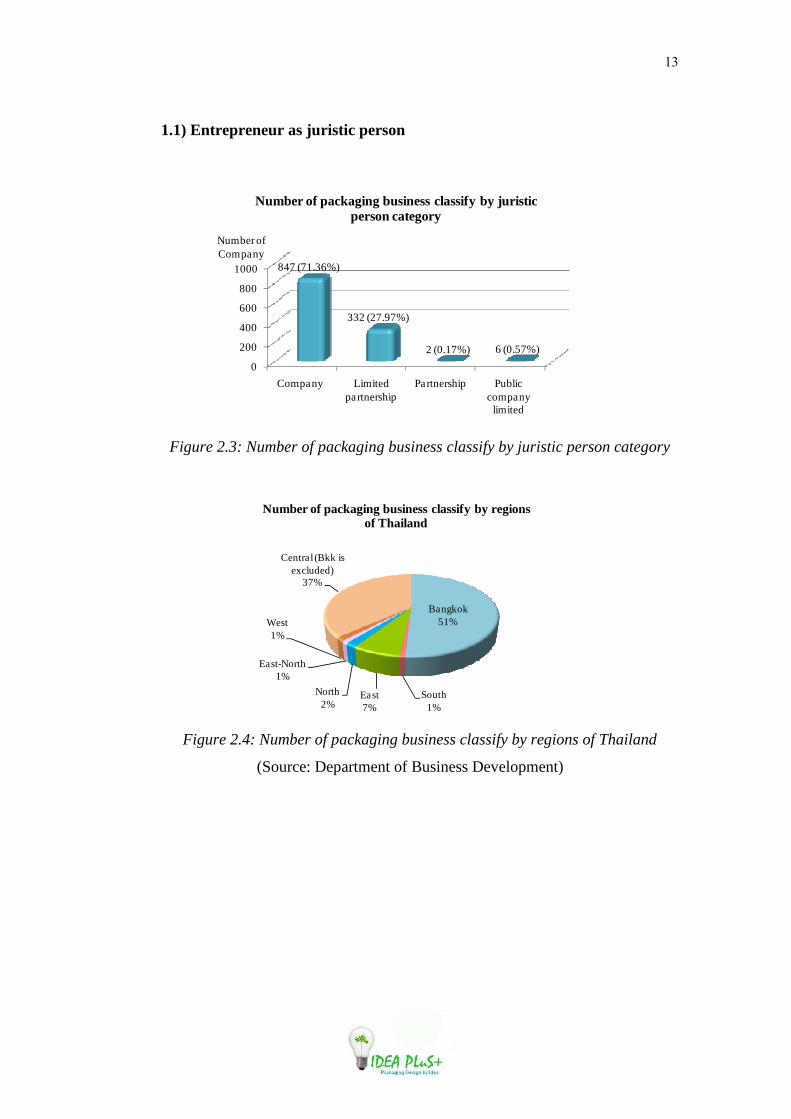
1.1) Entrepreneur as juristic person
0
200
400
600
800
1000
Company Limited partnership
Partnership Public company limited
847 (71.36%)
332 (27.97%)
2 (0.17%) 6 (0.57%)
Number of Company
Number of packaging business classify by juristic person category
Figure 2.3: Number of packaging business classify by juristic person category
Bangkok51%
South1%
East7%
North2%
East-North1%
West1%
Central (Bkk is excluded)
37%
Number of packaging business classify by regions of Thailand
Figure 2.4: Number of packaging business classify by regions of Thailand
(Source: Department of Business Development)
14
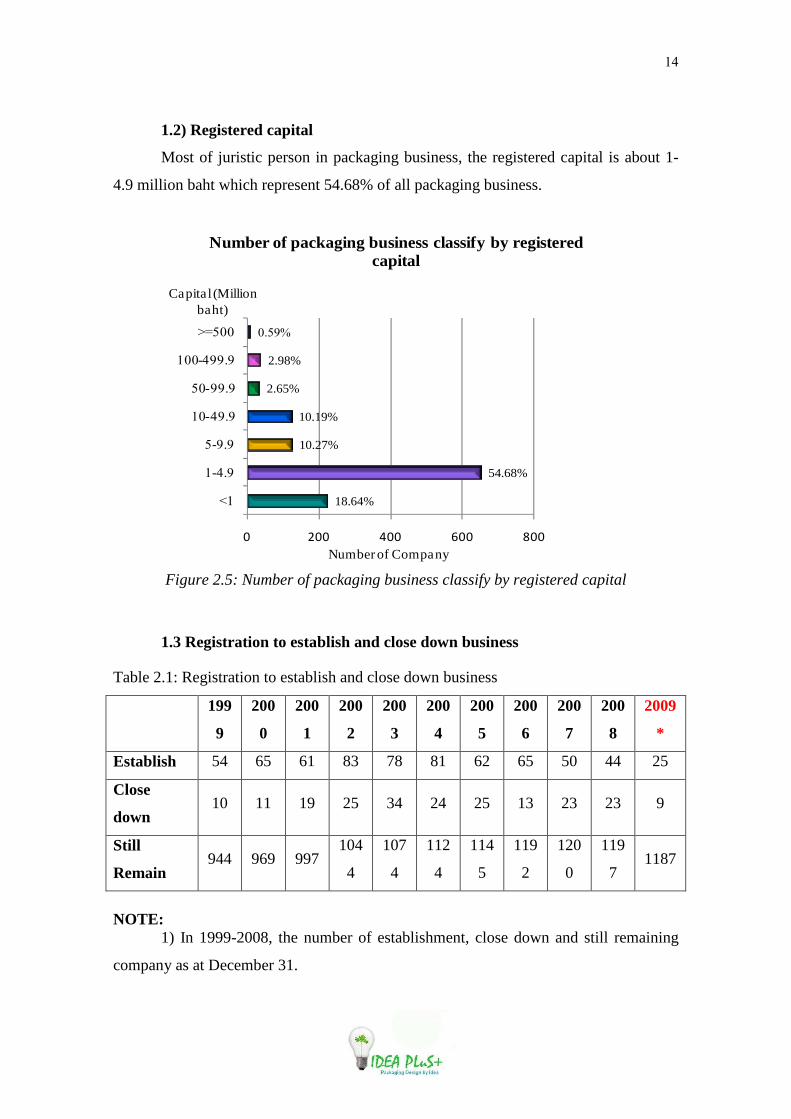
1.2) Registered capital
Most of juristic person in packaging business, the registered capital is about 1-
4.9 million baht which represent 54.68% of all packaging business.
18.64%
54.68%
10.27%
10.19%
2.65%
2.98%
0.59%
0 200 400 600 800
<1
1-4.9
5-9.9
10-49.9
50-99.9
100-499.9
>=500
Number of Company
Capita l (Million baht)
Number of packaging business classify by registered capital
Figure 2.5: Number of packaging business classify by registered capital
1.3 Registration to establish and close down business
Table 2.1: Registration to establish and close down business
199
9
200
0
200
1
200
2
200
3
200
4
200
5
200
6
200
7
200
8
2009
*
Establish 54 65 61 83 78 81 62 65 50 44 25
Close
down 10 11 19 25 34 24 25 13 23 23 9
Still
Remain 944 969 997
104
4
107
4
112
4
114
5
119
2
120
0
119
7 1187
NOTE:
1) In 1999-2008, the number of establishment, close down and still remaining
company as at December 31.

15
2) In 2009, the number of establishment and close down company is during
January 1, 2009- July 31, 2009; the number of still remaining company as at September
11, 2009.
(Source: Department of Business Development)
600
700
800
900
1000
1100
1200
1300
1999 2000 2001 2002 2003 2004 2005 2006 2007 2008 2009*
Number of Company
Number of the remaining packging business between 1999-2009
Figure 2.6: Number of the remaining packaging business between 1 999-2009
From the figure we can see that since 1999 to 2008, number of packaging
company that still remaining is increase continuously, but not to fast because during
those 9 years the number of company increase not so much. However during 2008 –
2009, the number of remaining company decreased because of economic crisis.

16
2) Foreign investment value
55%
22%
9%
6%8%
The value of foreign investment.
Germany
Japan
China
Singapore
Others
5,558 million baht
=100%
Figure 2.7: The value of foreign investment
(Source: Department of Business Development)
17
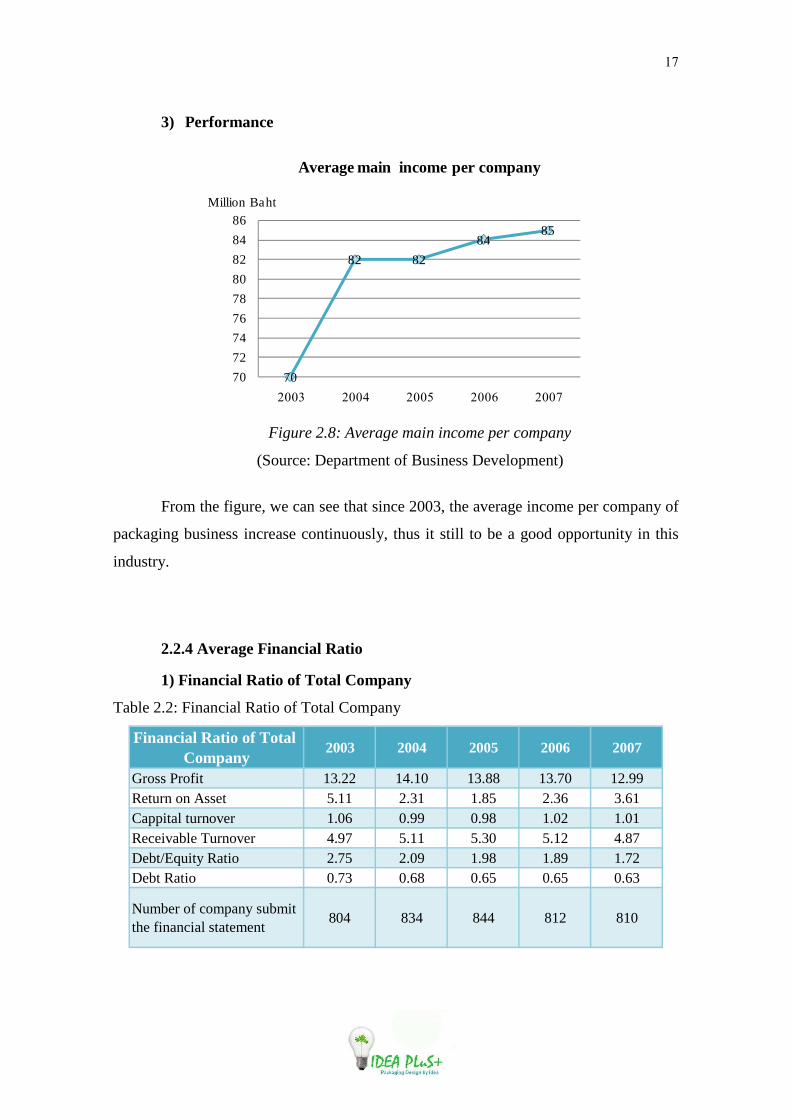
3) Performance
70
82 82
8485
70
72
74
76
78
80
82
84
86
2003 2004 2005 2006 2007
Million Baht
Average main income per company
Figure 2.8: Average main income per company
(Source: Department of Business Development)
From the figure, we can see that since 2003, the average income per company of
packaging business increase continuously, thus it still to be a good opportunity in this
industry.
2.2.4 Average Financial Ratio
1) Financial Ratio of Total Company
Table 2.2: Financial Ratio of Total Company
Financial Ratio of Total Company
2003 2004 2005 2006 2007
Gross Profit 13.22 14.10 13.88 13.70 12.99Return on Asset 5.11 2.31 1.85 2.36 3.61Cappital turnover 1.06 0.99 0.98 1.02 1.01Receivable Turnover 4.97 5.11 5.30 5.12 4.87Debt/Equity Ratio 2.75 2.09 1.98 1.89 1.72Debt Ratio 0.73 0.68 0.65 0.65 0.63
Number of company submit the financial statement
804 834 844 812 810

18
0.00
2.00
4.00
6.00
8.00
10.00
12.00
14.00
16.00
2003 2004 2005 2006 2007
Percentage
Financial Ratio of Total Business
Gross Profit
Return on Asset
Cappital turnover
Receivable Turnover
Debt/Equity Ratio
Debt Ratio
Figure 2.9: Financial Ration of Total Business
(Source: Department of Business Development)
2) Financial Ratio of Small Company
Table 2.3: Financial Ratio of Small Company
Financial Ratio of Small Company
2003 2004 2005 2006 2007
Gross Profit 12.89 13.69 14.32 14.38 15.52Return on Asset 6.18 2.38 2.16 2.15 3.31Cappital turnover 1.34 1.39 1.44 1.43 1.56Receivable Turnover 6.04 6.28 6.41 6.15 5.55Debt/Equity Ratio 3.04 2.48 2.29 2.40 1.73Debt Ratio 0.75 0.71 0.70 0.71 0.63
Number of company submit the financial statement
569 558 555 528 530

19
0.00
2.00
4.00
6.00
8.00
10.00
12.00
14.00
16.00
18.00
2003 2004 2005 2006 2007
Percentage
Financial Ratio of Small Business
Gross Profit
Return on Asset
Cappital turnover
Receivable Turnover
Debt/Equity Ratio
Debt Ratio
Figure 2.10: Financial Ratio of Small Business
(Source: Department of Business Development)
From the financial ratio, we can see that even the financial performance of entire
packaging business is decline in gross profit, but when we consider the small packaging
business , even entire business gross profit decrease, but in small business still increase
continuously and return on asset increase in both section of business.

20
2.3 Product/service (in general)
2.3.1 Product:
1) Box
• Corrugated fiberboard box
Figure 2.11: Corrugated fiberboard box

21
• Cardboard paper box

22
Figure 2.12: Cardboard paper box

23
2) Bag
• Kraft paper bag
Figure 2.13: Kraft paper bag
24
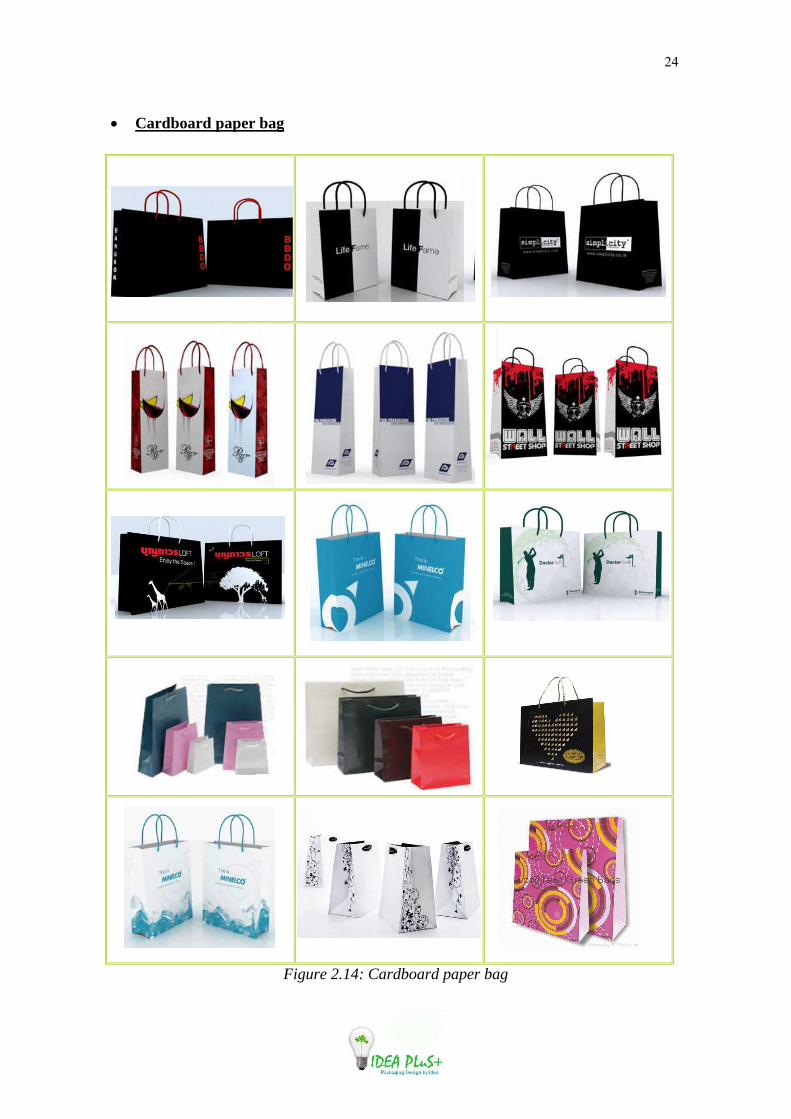
• Cardboard paper bag
Figure 2.14: Cardboard paper bag

25
3) The other design of packaging
Figure 2.15: The other design of packaging

26
2.4 Vision and Mission
1) Vision
“To become a leading provider of paper packaging for our valued clients in
Chiang Rai”
2) Mission
We will provide fully quality products at affordable prices which achieve our
customer’s expectations with professional team and high technology. We take care of
our employees with ethical standards which make them to give us with standard product
and service in return that will keep our profit grows up continuously, and serve the best-
in-class both product and service to our customer that also help us to advantage in
competition. Moreover, we concern to provide the environmental products to the market
which help to save our world.
2.5 Strategy
2.5.1 Corporate Level
There are 4 main strategies in cooperate level
1) Integration Strategies:
- Forward Integration: is increased control over retailers or customer. This will
be use when it is limited and expensive or unreliable in current distributors, they have
high profit margin and the firm has both capital and human resource to manage new
business of distribution.
- Backward Integration: seeking ownership of supplier. This integration will be
used when current suppliers are expensive or unreliable and they have high profit
margin, high growth in that industry sector and the firm has both capital and human
resource to manage new business.

27
- Horizontal Integration: increase control over competitor. This will be used
when gain monopolistic characteristic, compete in growing industry, increased
economies of scale and faltering due to lack of managerial expertise or need for
particular resource.
2) Intensive Strategies:
- Market Penetration: seeking increased market share for present product
through marketing efforts.
- Market Development: introducing present products into new market.
- Product Development: improving present product or developing new ones.
3) Diversification Strategies:
- Concentric (Related): adding new but related products.
- Conglomerate (Unrelated): adding new but not related products.
4) Defensive Strategies:
- Retrenchment: regroup through cost and asset reduction.
- Divestiture: selling a division or part of an organization.
- Liquidation: selling all of a company’s assets.
According to EXIM Banks business research, it found that even the consumers
give significant on products worth and benefit but we cannot reject that the first thing
which attract the consumers decide to buy products are physical appearance and
packaging. It make the consumers pay less attention on the price and quality but pay
more attention on the thing that can response to their psychological needs.
For our business, we provide the paper packaging. There is quite less providers
in the Chiang Rai market while there are a lot of products which need the packaging to
transportation and adding the value of its. Thus, the strategies that we choose for
corporate level are Intensive Strategies:Product Development: improving present
product or developing new ones. We will develop and create new structure design and
function in various shade of packaging color continuously to add the value to our
customers products, be more attractive, and for more convenience of end users such as
provide the various designs and appearance to response customers psychological needs
especially OTOP products which still have to develop the packaging.

28
And another strategy that we choose for corporate level is Diversification
Strategies: Concentric (Related): adding new but related certain products. According
to our target market, we focus on the customers who want the package to add value to
their products. We will add other related service such as provide the packaging for
transportation such as corrugated board box, and handbill printing, label printing are
included.
2.5.2 Business Level
Porter’s five Generic Strategies:
- Type1&2: Cost Leadership Strategies:
It’s conjunction with differentiation talk about, economies or diseconomies of
scale, capacity utilization achieved and linkages between suppliers and distributors.
- Type3: Differentiation Strategies:
This type will use for greater product flexibility, convenience and compatibility,
lower costs, improved service, and more features.
- Type4&5: Focused Strategies:
It is segment of sufficient size for good growth potential and not crucial to
success of major competitors.
In our business, in functional level the strategy that we choose is differentiation
strategies. Because of we use the product development strategy which in this case we
will link with product differentiation strategies, because we develop the product to
create the differentiation. The customers will interest in our product because of its
graphic design, value added and benefits. The design will increase and add the value to
our customers products, so we also have a plan to change packaging appearance; we
need to change the design of our packaging product to be rather than the box in cubic
shape or size. That’s for more attractive, feature, and convenience.
Moreover, we will design the package in a fancy, colorful, and classic style for more
choices and also attract the customers too such as to change the square appearance to
the triangle appearance.

29
2.5.3 Functional Level Strategies
1) Marketing
For our marketing, we provide and emphasis on various activities for product,
price, place, and promotion. First, we promoting and keeping our product in mind of
customers with premium giving to our customers who usually order our products, and to
create the customers loyalty. We will give the customers with special souvenirs such as
the heart box or paper notebook which represent the word “thank you” for their trust
and loyalty that they intend to select our company. Second, we response the customers
with reasonable price which is depend on the cost of raw materials such as the types of
paper, and the size products. Next, for the place which is focused on the problem of
distribution, the late delivery is the most common service complaint and speed of
delivery is the most important service element, Thus we outsource transportation
company to provide service for customers which is most reliability in northern of
Thailand
Late deliverly44%
Product or quality
mistakes31%
Damaged goods12%
Other7%
Frequently cut items6%
Common Customer Service Complaints
Figure 2.16: Common Customer Service Complaints
(Source: Business Logistic Management Subject)

30
Finally about the promotion, we provide advertising which for increasing in
revenue and to make the customers know more about our business. We will do more
aggressive advertising, and promote our products on the radio, billboard, brochure, and
website which reach more customers and facilitate the customers that they can contact
us at anywhere that they want and convenient. Moreover, we suggest providing the sale
representative’s persons for promoting our products with the catalog by door to door
which help to gain more customers directly and closely.
Furthermore, we concern about public relation such as to be a sponsor about
environmental projects such as paper recycle, growing the trees, and saving the world
which those are related to our production’s position that are friendly environmental
directly. It will promote our image and position to our customers to recognize our
products.
2) Finance
The finance function consists of the people, technology, processes, and policies
that dictate tasks and decisions related to financial resources of a company which we
consider the legal investment which protects our business from the illegal policies and
contract. We need to select the projects based on risk and expected return that are the
best use of a company's resources, and to maintain optimum risk-return trade-off that
maximizes shareholder value. We also manage the company cash flow and balancing
the ratio of debt and equity financing to maximize company value, and contract the
financial institutions efficiently.
3) Accounting
Accounting is a service function that provides information of value to all
operating units and to other service functions, such as the headquarters offices of a large
corporation. For the accounting, we provide the formal form of accounts, and present
the accounts for the monthly meeting which to report and recheck the accounts such as
cash flow and balance sheet together with the auditor who help to standardize the
accounts of our company legally.

31
4) Human Resource Management
First, we have to train our employees to serve the service’s mind to our
customers which help to gain the satisfaction from the customers. They will impress and
confident in our service. Second, we also train our employees to good at and have the
knowledge about the graphic design which helps to design and develop our products to
be differentiated and serve the customers’ need directly. Next, we provide the useful
information and knowledge about the packaging to both our employees and customers.
Finally, we will have the performance evaluation of our employees for evaluating the
behavior of employees in working and conducting themselves both for our customers
and coworkers.

32
Chapter 3
Market Feasibility Study
3.1 Market Analysis
3.1.1 General Environment Analysis
It consists of the actors and forces outside marketing that affect marketing
management’s ability to build and opportunities and threats to our business.
1) Political Environment Analysis
Marketing Decisions are strongly affected by political and legal environment
uncertainty. Especially Thailand, the politic very strongly affect to government policy.
This environment is composed of laws, government agencies, and pressure groups that
influence and limit various organizations and individuals.
The standard of design and development for package in SME entrepreneur is
another important policy of government because government by Department of
Industrial Promotion emphasizes the importance of quality and standard as a tool for
develop the district goods industry and wholesaler & retailer such as processed foods,
snack, beverage like vegetable, fruit, herb, wine, and liquor, cosmetics, and seasoning.
In Chiang Rai province has supportive industry and wholesaler & retailer form
government also, it result to economy for small business are strongly. That is a good
opportunity for paper packaging industry because of in Chiang Rai has a little of paper
packaging industries, Idea Plus can get more market share form this market. Idea Plus
Company can improve, adding value, and keep the quality of goods that attractive the
consumers both among the countries and other countries. Moreover, the global warming
is an important policy that many generations and in many countries and also in Thailand
concern about. They try to issue the law about pollution control, have campaign about
save world life, and let the people use paper packaging instead of plastic.

33
2) Economic Environment Analysis
In 2010 year are expected to trend growth form the year 2009, it result of the
economic recovery of both domestic and world. Moreover, Thai government stimulates
economic by Thai Kem Kang Project 2552. That help to Thai industry can export to
other countries.
On the GDP 2553 year growth around 2-3% for the first half of year the
economic growth is a positive forward. Especially the first quarter GDP can growth to
4-4.5%. The second half of year the economic will decrease form the interest cost is
higher, the limitations of the local and international partners is less to order production
from Thailand. So, the rate of economic growth during the second half may be dropped
at 2.0-2.5%.For the Chiang Rai province, Facilities are registered with the industry is
totaling 783 plants (Cumulative total to date 31 May 2551). The most of industries in
Chiang Rai is agriculture industry, food industries, and non-metal industry.
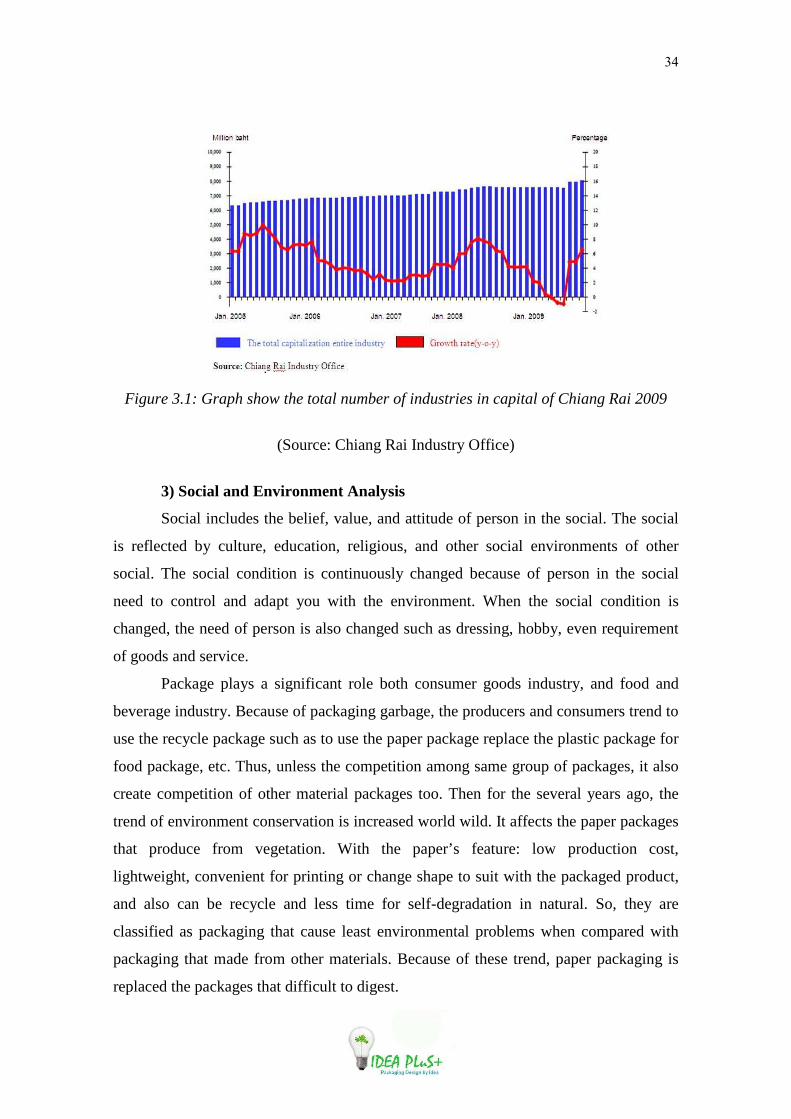
However, On October, 2009 the industry in Chiang Rai is increase when we
compare with the same during at the last year. We consider the industries register that
increase from 7,556.1 t0 8,049.7 million bath. It increases 6.6%. It is good opportunity
for the paper industries in Chiang Rai because Chiang Rai has 13 paper industries. That
is mean to idea plus has a few of paper industry competitor and more chance to get
more market share.
Table 3.1: The total number of industries in capital of Chiang Rai 2009
Data Unit
2008 2009
Oct. All of year Q1 Q2 Jul. Aug. Sept. Q3 Oct.
Total no. Authorized
Million Baht
7,556.80
75,412.20
7,514.20
75,412.20
7,514.20
7,915.00
7,927.20
7,927.20
8,049.70
capital of industry Growth Rate (y-o-y) percentage 4.2 2.2 2 -0.8 -0.9 4.9 4.9 4.9 6.6
Graph shows the total number of industries in capital of Chiang Rai 2009
34
Figure 3.1: Graph show the total number of industries in capital of Chiang Rai 2009
(Source: Chiang Rai Industry Office)
3) Social and Environment Analysis
Social includes the belief, value, and attitude of person in the social. The social
is reflected by culture, education, religious, and other social environments of other
social. The social condition is continuously changed because of person in the social
need to control and adapt you with the environment. When the social condition is
changed, the need of person is also changed such as dressing, hobby, even requirement
of goods and service.
Package plays a significant role both consumer goods industry, and food and
beverage industry. Because of packaging garbage, the producers and consumers trend to
use the recycle package such as to use the paper package replace the plastic package for
food package, etc. Thus, unless the competition among same group of packages, it also
create competition of other material packages too. Then for the several years ago, the
trend of environment conservation is increased world wild. It affects the paper packages
that produce from vegetation. With the paper’s feature: low production cost,
lightweight, convenient for printing or change shape to suit with the packaged product,
and also can be recycle and less time for self-degradation in natural. So, they are
classified as packaging that cause least environmental problems when compared with
packaging that made from other materials. Because of these trend, paper packaging is
replaced the packages that difficult to digest.

35
4) Technological Analysis
The advances of technology are making development to invention and
comfortable for life. Technology provides the quality and standard to produce goods
and services customer needs. The production system produce many products the can be
cheaper. Technology is easy to communication and connections between the world's
population contact information at time together. My business has benefit from several
areas of technology such as:
- Computer Technology is design product to high quality and fewer errors. It has
a samples and work on reality to lower costs of production. The price is reduction of
packaging and increasing to product quality. There are more customer needs which my
company can production on demand.
- Internet Technology is easily to communication with customers that faster and
more complete information. The customer is not order your own which can be receive
and send e-mail directly to company. The Customers feel friendlier that create to
customer royalty.
- Website is the customer easily to view the products and change and improve
the product to available format and can design own products as appropriate. The
company received orders to customer that not only in Chiang Rai but market expansion
has resulted in comprehensive group with more goals.
- Logistic Technology is increase channel of transportation and registration
document number. The checking all the transportation and sent across Thailand. The
easy of transportation and quickly that confidence to the product of lost.

36
3.1.2 Competition Analysis
1) Competitor Analysis
According to our business, we specify in paper packaging. The competitor who
provides quite similar business or product as us, there is one famous company in Chiang
Rai, King Carton.
Figure 3.2: The King Carton Company
For the King Carton’s products, they provide the packaging and graphic
designing from paper such as corrugated and cardboard box, set up and die cut box,
paper bag, paper products etc. Even they produce those products but they do not
produce the paper by themselves, they buy it from Chiang Mai. And they also do not
have their product as they want to sell;
they only produce for their customers’
order. Second the price, they set the
price quite reasonable which depend
on the volumes of the order that the
more volumes give the below price
than the less or few volumes.
Figure 3.3: The King Carton Company
37
Next the place, their shop allocate around the left hand side of King Meng Rai
Monument at Robviang district which quite easy to find out. The customers are easy to
understand and aware the address of their shop. They can contract them easily through
their shop, telephone numbers, and website which providing the information of their
business, products, services, and the knowledge about the paper and packaging such as
the important of packaging, etc. Finally the promotion, they provide the advertising on
the brochure with a half page of information about their logo, slogan, address of their
shop and website, telephone numbers, e-mail, and services, etc.
But, in our production division, we use outsourcing; we employ the King Carton
as our production division or we can call them as supplier. The King Carton is received
our orders then produce them. King Carton will supply the papers and other equipments
for us. We don’t need to build the factory and buy the machines, but we need to design,
distribute, and sell the products to our customers. Thus, the King Carton will be our
supply instead of competitor.
2) Customer Analysis We emphasized on is the customers in Chiang Rai who running the family
business as the mainly customers which one or more members of one or more families
have a significant ownership interest and significant commitments toward the business’
overall well-being. The family businesses in Chiang Rai are such as bakery, handicrafts,
weaving, basketwork, carved wood, etc. which are the vice occupation of customers to
gain more money for their family. The customers usually use the packaging not only for
contain the products, but also help to adding value to their products by the design and
functions of packaging because the important roles of packaging to distribution of
product are increase of the volumes of sale and value added of design product to strong,
beauty and the customers need. Ability to attract customers is attention and trial product
will result in repeat purchases, and also the loyalty of the product which impact to the
increasing sales. (Source: http://www.oknation.net/blog/packaging/2009/10/17/entry-1,
Articles: value-added packaging, 17-10-2009).

38
The most popular products are Oolong tea which commonly consumed and
given as presents. It strengthens health, gets rid of mouth odor, prevents tooth decay,
helps with digesting fat, decreases cholesterol, nourishes the skin, and delays ageing.
Second, cotton’s cloth which is unique, and requires patience meanwhile, it creates
income for community residents. Next, dried vegetables and fruits which attempt to
develop products from raw materials in Chiang Rai and nearby provinces. It aims to
make quality and tasty products that are safe for consumers and easy to eat. And, the
ceramic products which a household production, and has a lot of demands of customers,
but also the carved wood which form of working wood by means of a cutting tool held
in the hand, and resulting in a wooden figure or figurine or in the sculptural
ornamentation of a wooden object. Finally, the food processing which develops the
traditional food, and able to be stored for a long time without stench such as the Fried
Pork Rind which has developed the traditional fried pork rind, and remains crispy for a
long time without stench.. Therefore, we decide to serve both main and vice group of
customers with our packaging which help them to create more value to their products,
and to satisfy their need directly.
3) Competitive Analysis
There are about 1,000 entrepreneurs who provide the paper packaging
businesses in Thailand which mostly are the SMEs, but there are about 597 industries
which have registered to the Department of Industry, and had 14,965 million Baht for
investment and 19,366 people for employment. The industries mostly produce the
corrugated fiberboard boxes for transportation for 600 industries, and others produce the
paperboard boxes for the primary packaging of products, and produce multiwall paper
sacks for contain the cement, animal feed, Chemicals, and plastic, and also produce
shopping bag. Nowadays, the paper packaging of Thailand is ready for material
especially Kraft and paperboard which provide 2.40 and 0.30 million ton of Kraft and
paperboard’s capacity which increasing from year 2003 for 9.7 percent by 95 percent is
the market in country, and 5 percent for exporting.
According to our business, we supply the paper packaging which is the product
that we try to push it to customers and pull customer to us. In Chiang Rai, Paper
packaging industry is not competing strongly. In Muang, Chiang Rai, there is only one
39
famous carton shop: King Carton. But, we employ the King Carton as the supplier who
produces our products to us. Moreover the part of the new entry for packaging business,
it is not easy to invest in this business as the individual business because it is quite high
investment which use too much money for the machines and printers which very
expensive. The potential companies will supply the high and advance technology of
both machines and printers such as CK Carton in Lumphun which is very big and very
advance in production machine and various high printing technique, the customer have
to order in a big lot such as 10,000 or 15,000 unit a time because if just a small unit in
production, it does not break even, they will loss and the customer have to pay at last 50
percent of total cost which is much money. So, those big companies are not point of our
competitor because our customers for our packaging production service is those small
business or family business who cannot order with the big manufacturers, but the
medium and small manufacture of paper packaging is our point, which in Muang
District, Chiang Rai has only one company. Thus, there is a good opportunity to provide
the paper packaging in Chiang Rai which provides more options for customers to select
and order what they really need and want. We will serve the less volumes than the
competitor while serve the large volumes than competitor as well.
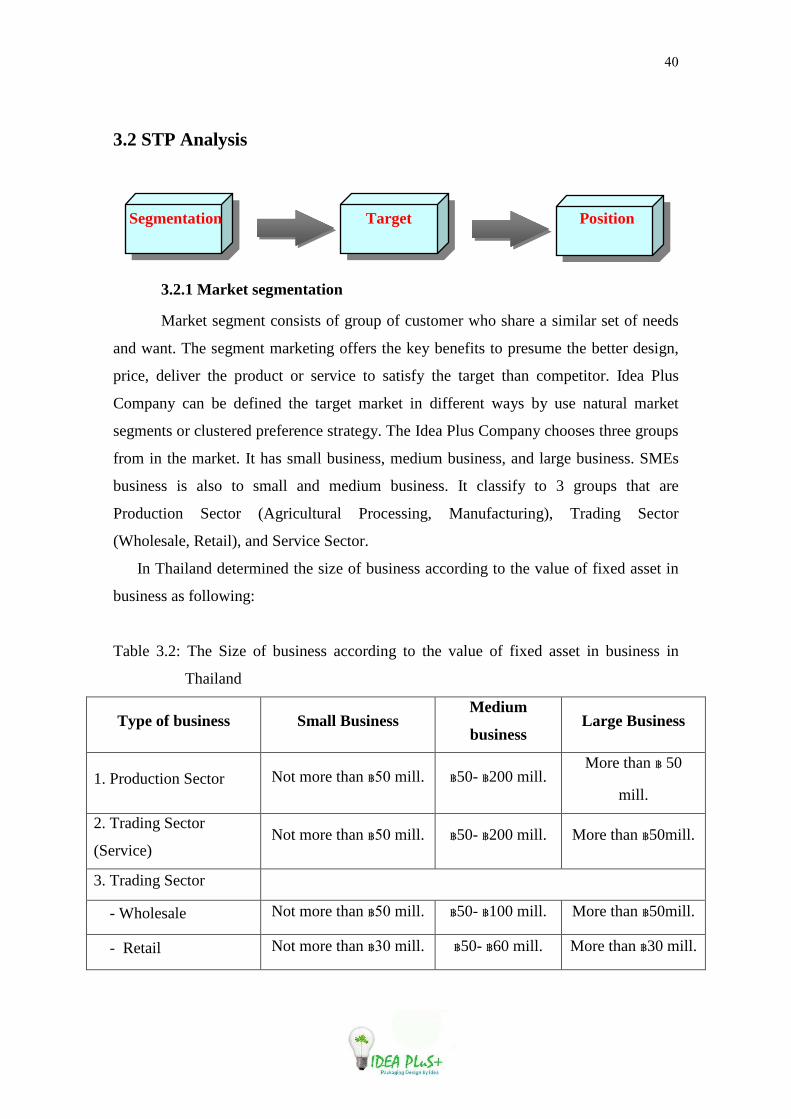
40
3.2 STP Analysis
Segmentation Target Position
3.2.1 Market segmentation
Market segment consists of group of customer who share a similar set of needs
and want. The segment marketing offers the key benefits to presume the better design,
price, deliver the product or service to satisfy the target than competitor. Idea Plus
Company can be defined the target market in different ways by use natural market
segments or clustered preference strategy. The Idea Plus Company chooses three groups
from in the market. It has small business, medium business, and large business. SMEs
business is also to small and medium business. It classify to 3 groups that are
Production Sector (Agricultural Processing, Manufacturing), Trading Sector
(Wholesale, Retail), and Service Sector.
In Thailand determined the size of business according to the value of fixed asset in
business as following:
Table 3.2: The Size of business according to the value of fixed asset in business in
Thailand
Type of business Small Business Medium
business Large Business
1. Production Sector Not more than �50 mill. �50- �200 mill. More than � 50
mill.
2. Trading Sector
(Service) Not more than �50 mill. �50- �200 mill. More than �50mill.
3. Trading Sector
- Wholesale Not more than �50 mill. �50- �100 mill. More than �50mill.
- Retail Not more than �30 mill. �50- �60 mill. More than �30 mill.

41
(Source: www.rd.go.th/publish/fileadmin/user_upload/.../SMEs.pdf)

42
First, the large businesses are containing hung of workers, machines,
equipments, and quite too high investment such as squandering steels’ business. The
customers in this segment will mostly use the packaging for transportation in such a
manner that it may be held, lifted, moved, set down and stowed easily, efficiently and
safely as the main purpose because their products are quite hung and heavy. The
packaging has the mainly function to protect the products during the transportation from
the environment and vice versa. The inward protective function is intended to ensure
full retention of the utility value of the packaged goods. The packaging is thus intended
to protect the goods from loss, damage and theft. Next, the medium businesses have
less workers, machines, equipments, and investment than the large business such as
sugars’ business. Finally, the small businesses which are refer to the family businesses
that process by the workers, and focus on the expertise skills such as handicrafts,
weaving, basketwork, and carved wood. For both the medium and small business, will
mainly use packaging as promoting and adding value to their products. Promotional
material placed on the packaging is intended to attract the potential purchaser's attention
and to have a positive impact upon the purchasing decision. Promotional material on
packaging plays a particularly important role on sales packaging as it is directly
addressed to the consumer. This function is significance in packaging.
3.2.2 Target Market
According to the segments, we are emphasis on the medium and small
businesses as our target markets. Idea Plus Company is especially to SMEs business
which includes both production sector and trading sector as wholesale, retail and service
in Chiang Rai such as small businesses, new businesses, OTOP projects, agriculture
industries, and other business that are small businesses and medium industries. It is a
good opportunity and more market share form packaging paper business because in
Chiang Rai has a few of packaging business company while there are more customer
demand of packaging, they need to add value their products. It result to attract the
potential customer's attention and to have a positive impact upon the purchasing
decision.

43
3.2.3 Product Position
Our business, we provide the paper packaging especially the paper boxes and
bags. We try to create an image or an identity our products, brand or company in our
targeted market’s mind. We position our products on promoting, adding value, and
environmental friendly with various design packages for the customers especially the
medium and small businesses. Thus, our targets become familiar with our products and
recognize it based off of the position. The positioning is the successful creation of a
customer focused value proposition, a cogent reason why the target market should buy
our products. When the customers want to promoting, adding value, and take care of
environment, they recognize our products in their mind for optioning.
44
3.3 Marketing Mix Strategy
3.3.1 Product
We provide the paper packaging products to serve the customers who running in
both small and medium size business which mostly use the packaging for promoting,
adding value, protect product inside and costly and environmental friendly. Our slogan
is “package designed by ideas” Then, our product will be design by our team according
to customers’ need. We are flexible to provide more options of product (packaging)
according to the customers’ need with the product differentiation especially in design,
pattern, style, and function which help to create more value to the products and to
promote the brand, and quality of customers’ products. In this matter, the company also
provides catalog for customers to help them in design their packages. We provide Kraft
paper, cardboard, and corrugated fiberboard with various size and design for more
choices for customers in conducting the paper boxes and bags which friendly with the
environment because we concern with suitable for customer’s products and concern
more in the environment problem so, the paper is quite safes and friendly with the
environment as well as the logo of our company in order to represents the light as light
of idea with a green young plant which represent to environmental friendly.
Figure 3.4: Logo of IDEA Plus+

45
3.3.2 Price
Our company decides to set the reasonable price which is depended on the cost
of raw materials especially the cost of papers such as Kraft paper, cardboard, and
corrugated fiberboard and also printing. The price of our products is various which
customers can choose the types of paper as they need and want through the company’s
catalog. The catalog will provide the design and style of papers such as graphic,
cartoon, silky cloth, and natural which depended on the products and customers’ needs.
3.3.3 Place
Idea Plus Company is located on Phahon Yothin Road, Wiang sub-district,
Muang Chiang Rai district, Chiang Rai. The nearby shops are Porncharoern Mirror shop
on the left hand side, RN Paint and Taweeheng shop is on the right hand side and
opposite to Dunlop Center which quite easy to access and flexible for our customers.
The inventory will be stocked in the 3rd floor in the office. The customers can receive
their products by themselves if they prefer, if not we also provide transportation service
for our customers by Nimseeseng Transportation Company. We distribute our products
through Nimseeseng Transportation Company which distribute the products directly to
the customers as door to door service. Nimseeseng Transportation Company had been
establish for several years which is famous professional company in the Northern part
of Thailand and others part because they have many branches around the country, and
provide door-to-door service with the expert skill of transportation. Thus, we use the
Nimseeseng Transportation Company for distribute and transport our products to
customers.

46
3.3.4 Promotion
Ideas Plus Company is emphasis on advertising which for increasing in revenue
and to make the customers know more about our business. We will do more aggressive
advertising, and promote our products through the billboard, brochure, online marketing
as a website, and local radio. Moreover, we provide the sale representatives for
promoting our products with the catalog by door-to-door which help us to gain more
customers directly and closely.
For online marketing, we register our website with HostingLotus that contain
with 10 GB unlimited data transfer, 50 email accounts, and domain. Our website helps
us to distribute our product via the website of our company (www.ideaplus.com) which
customers can contact us at anywhere that they want and convenient. It helps us to reach
more customers and facilitate our customers. Next, we promote our company by Chiang
Rai Radio of Thailand (FM95.75 MHz) for every Saturday and Sunday which quite
popular among our customers.
Figure 3.5: Website Company: www.ideaplus.com
Figure 3.5: Website Company: www.ideaplus.com
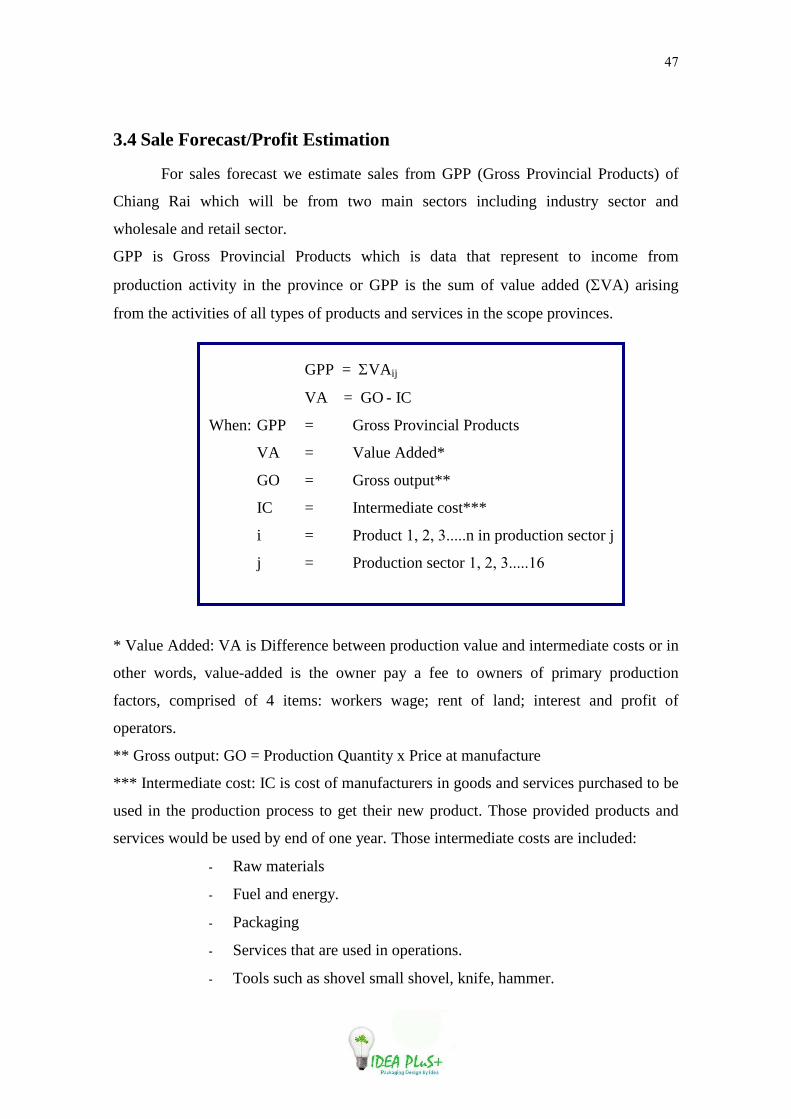
47
3.4 Sale Forecast/Profit Estimation
For sales forecast we estimate sales from GPP (Gross Provincial Products) of
Chiang Rai which will be from two main sectors including industry sector and
wholesale and retail sector.
GPP is Gross Provincial Products which is data that represent to income from
production activity in the province or GPP is the sum of value added (ΣVA) arising
from the activities of all types of products and services in the scope provinces.
GPP = ΣVA ij
VA = GO - IC
When: GPP = Gross Provincial Products
VA = Value Added*
GO = Gross output**
IC = Intermediate cost***
i = Product 1, 2, 3.....n in production sector j
j = Production sector 1, 2, 3.....16
* Value Added: VA is Difference between production value and intermediate costs or in
other words, value-added is the owner pay a fee to owners of primary production
factors, comprised of 4 items: workers wage; rent of land; interest and profit of
operators.
** Gross output: GO = Production Quantity x Price at manufacture
*** Intermediate cost: IC is cost of manufacturers in goods and services purchased to be
used in the production process to get their new product. Those provided products and
services would be used by end of one year. Those intermediate costs are included:
- Raw materials
- Fuel and energy.
- Packaging
- Services that are used in operations.
- Tools such as shovel small shovel, knife, hammer.

48
- Maintenance and repair costs
- Uniform and worn of staff required to work such as gloves, shoes,
rubber topcoat.
(Source: Ministry of finance)
In 2009, GPP of Chiang Rai is 48,184 million baht (Source: Office of
Commercial Affairs Chiang Rai) that means sum of value added of products (∑VA) are
48,184 million baht.
According to the interview of Mr. Boramudpong PolYiam, Senior Officer in
Bureau of Price and Quantity Administration, Department of Internal Trade, Ministry of
Commerce on 7th February 2010, for general products the total profit is approximately
three times of total cost.
Thus, if value added or profit is 48,184 million baht, total cost would be approximately:
48,184 million divided by 3 = 16,061.33 million baht
Price = Cost + Profit
Thus, total value in overall market would be = 48,184 ml bht + 16,061.33 ml bht
= 64,245.33 million baht
That’s total value in overall market, but for Idea Plus, we expected the sales
from two main sectors including industry sector and wholesale and retail sector. Office
of Commercial Affairs Chiang Rai announced that wholesale and retail sector is 16.78%
of GPP and industry sector is 7.63 % of GPP, which means value of these two sectors
would be:
Sector Percentage Value in market
(million baht)
Total value in market 100% 64,245.33
- Wholesale and retail sector 16.78% 10,780.366
- Industry sector 7.63 % 4,901.919
According to the interview of Mr. Damrongpol Kamhangwong, the packaging
lecture from Postharvest and Packaging Technology, School of Agro Industry, Mae Fah
Luang University on Tuesday 1st December 2009, we found that, the packaging cost of
general products is about 30% of the price (accept perfume 70% - 80%)
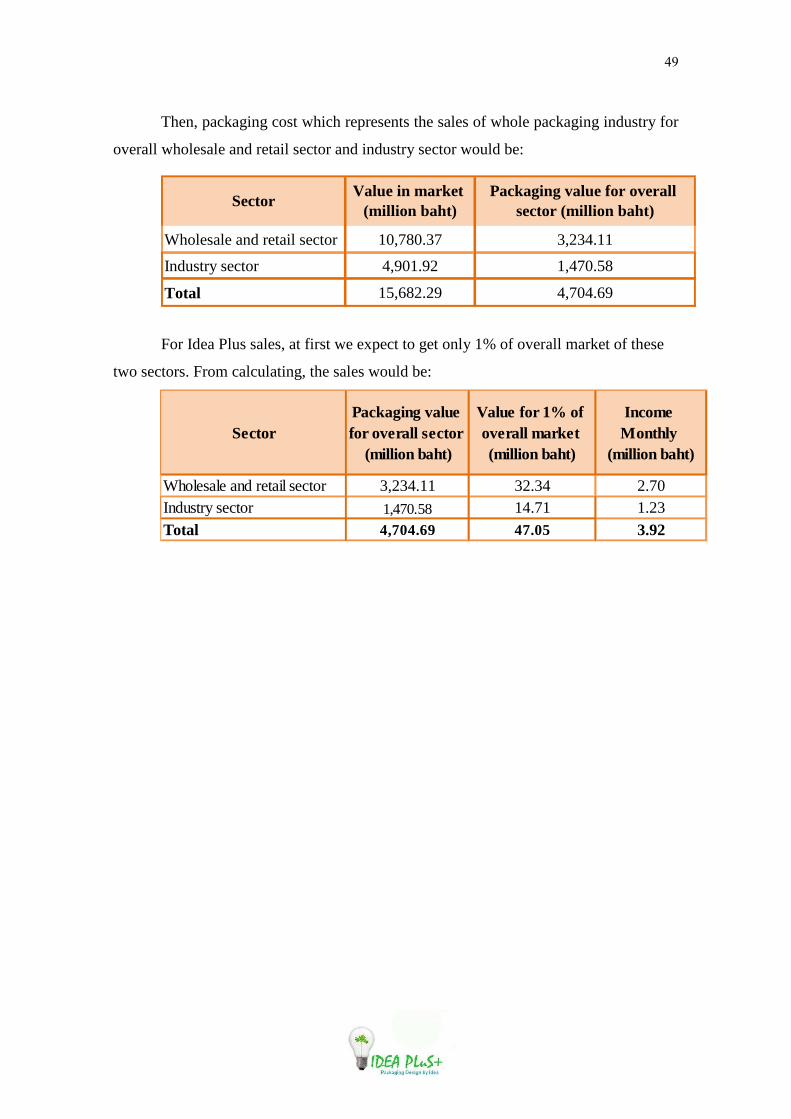
49
Then, packaging cost which represents the sales of whole packaging industry for
overall wholesale and retail sector and industry sector would be:
Wholesale and retail sector 10,780.37 3,234.11
Industry sector 4,901.92 1,470.58
Total 15,682.29 4,704.69
SectorPackaging value for overall
sector (million baht)Value in market
(million baht)
For Idea Plus sales, at first we expect to get only 1% of overall market of these
two sectors. From calculating, the sales would be:
SectorPackaging value for overall sector
(million baht)
Value for 1% of overall market (million baht)
Income Monthly
(million baht)
Wholesale and retail sector 3,234.11 32.34 2.70Industry sector 1,470.58 14.71 1.23
Total 4,704.69 47.05 3.92
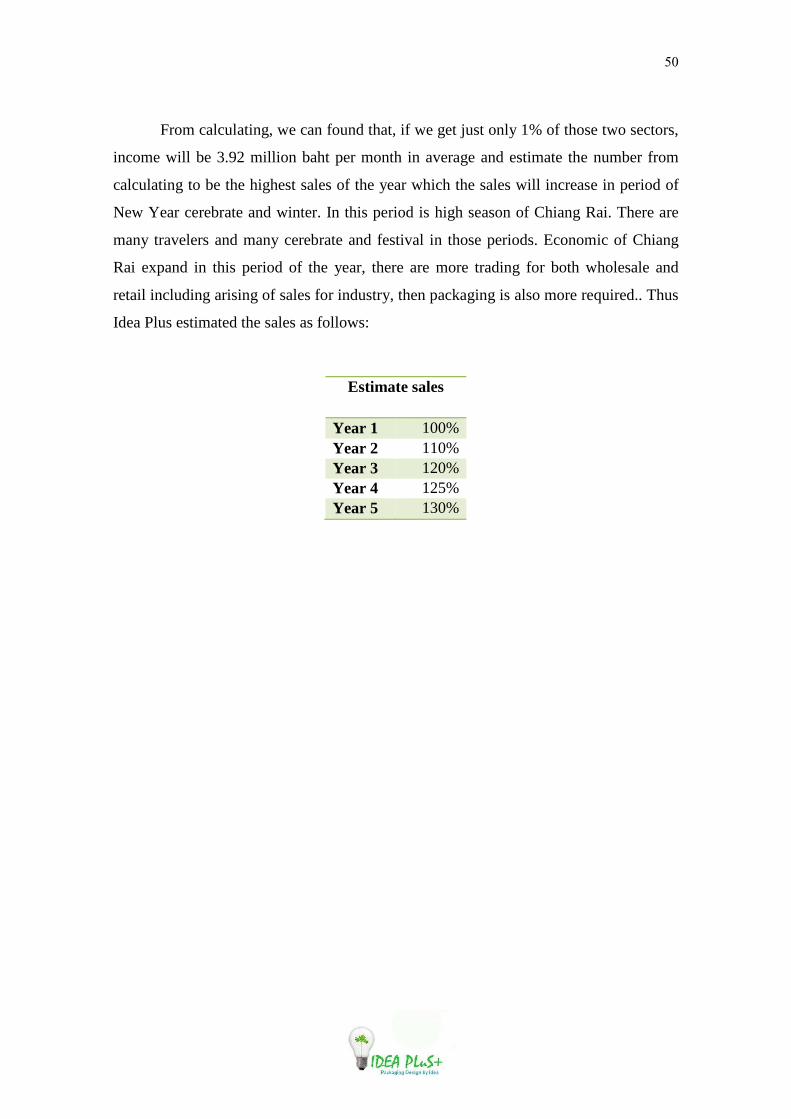
50
From calculating, we can found that, if we get just only 1% of those two sectors,
income will be 3.92 million baht per month in average and estimate the number from
calculating to be the highest sales of the year which the sales will increase in period of
New Year cerebrate and winter. In this period is high season of Chiang Rai. There are
many travelers and many cerebrate and festival in those periods. Economic of Chiang
Rai expand in this period of the year, there are more trading for both wholesale and
retail including arising of sales for industry, then packaging is also more required.. Thus
Idea Plus estimated the sales as follows:
Estimate sales
Year 1 100% Year 2 110% Year 3 120% Year 4 125% Year 5 130%

51
Estimation: Sales (Baht)
Sales forecast year1
Sales Year 1 Jan Feb Mar Apr May Jun Jul Aug Sep Oct Nov Dec Total Wholesale and retail sector
2,602,928 2,409,075 2,260,300 2,053,512 2,096,129 2,145,846 2,264,841 2,173,539 2,309,379 2,574,881 2,681,544 2,695,092 28,267,065
Industry sector 1,183,572 1,095,425 1,027,776 933,748 953,126 975,734 1,029,841 988,325 1,050,093 1,170,819 1,219,320 1,225,480 12,853,260Total 3,786,500 3,504,500 3,288,076 2,987,260 3,049,255 3,121,580 3,294,682 3,161,864 3,359,472 3,745,700 3,900,864 3,920,571 41,120,324

52
Sales forecast year2
SalesYear 2 Jan Feb Mar Apr May Jun Jul Aug Sep Oct Nov Dec Total Wholesale and retail sector
2,863,221 2,649,982 2,486,330 2,258,863 2,305,741 2,360,431 2,491,325 2,390,892 2,540,317 2,832,369 2,949,699 2,964,601 31,093,771
Industry sector 1,301,929 1,204,968 1,130,554 1,027,1231,048,439 1,073,307 1,132,825 1,087,158 1,155,102 1,287,901 1,341,252 1,348,028 14,138,586Total 4,165,150 3,854,950 3,616,884 3,285,986 3,354,181 3,433,738 3,624,150 3,478,050 3,695,419 4,120,270 4,290,950 4,312,629 45,232,357

53
Sales forecast year3
Sales Year 3 Jan Feb Mar Apr May Jun Jul Aug Sep Oct Nov Dec Total Wholesale and retail sector
3,123,513 2,890,889 2,712,360 2,464,214 2,515,354 2,575,016 2,717,809 2,608,246 2,771,255 3,089,857 3,217,853 3,234,110 33,920,477
Industry sector 1,420,287 1,314,511 1,233,332 1,120,498 1,143,752 1,170,880 1,235,809 1,185,990 1,260,112 1,404,983 1,463,184 1,470,576 15,423,912Total 4,543,800 4,205,400 3,945,691 3,584,712 3,659,106 3,745,896 3,953,618 3,794,237 4,031,366 4,494,840 4,681,037 4,704,686 49,344,389

54
Sales forecast year4 Sales Year 4 Jan Feb Mar Apr May Jun Jul Aug Sep Oct Nov Dec Total Wholesale and retail sector
3,253,660 3,011,343 2,825,375 2,566,890 2,620,161 2,682,308 2,831,051 2,716,923 2,886,724 3,218,601 3,351,930 3,368,865 35,333,831
Industry sector 1,479,465 1,369,282 1,284,720 1,167,1851,191,408 1,219,667 1,287,301 1,235,407 1,312,616 1,463,524 1,524,150 1,531,850 16,066,575Total 4,733,125 4,380,625 4,110,095 3,734,075 3,811,569 3,901,975 4,118,353 3,952,330 4,199,340 4,682,125 4,876,080 4,900,714 51,400,406
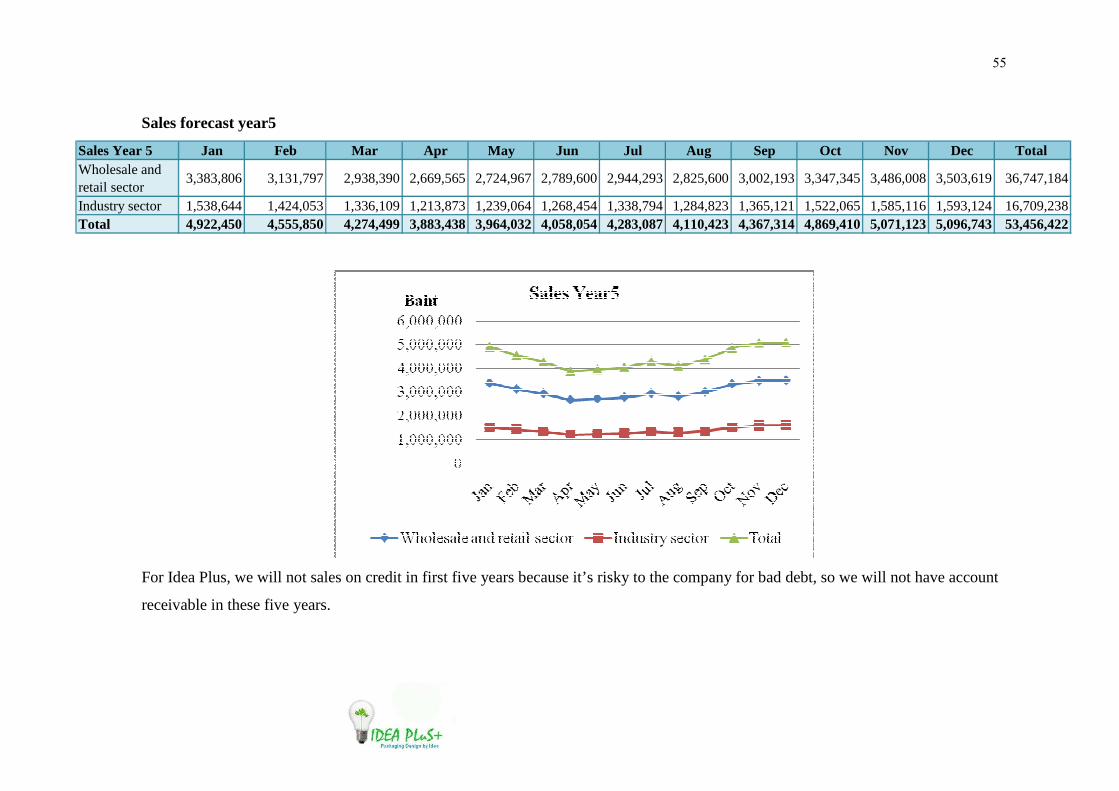
55
Sales forecast year5
Sales Year 5 Jan Feb Mar Apr May Jun Jul Aug Sep Oct Nov Dec Total Wholesale and retail sector
3,383,806 3,131,797 2,938,390 2,669,565 2,724,967 2,789,600 2,944,293 2,825,600 3,002,193 3,347,345 3,486,008 3,503,619 36,747,184
Industry sector 1,538,644 1,424,053 1,336,109 1,213,8731,239,064 1,268,454 1,338,794 1,284,823 1,365,121 1,522,065 1,585,116 1,593,124 16,709,238Total 4,922,450 4,555,850 4,274,499 3,883,438 3,964,032 4,058,054 4,283,087 4,110,423 4,367,314 4,869,410 5,071,123 5,096,743 53,456,422
For Idea Plus, we will not sales on credit in first five years because it’s risky to the company for bad debt, so we will not have account
receivable in these five years.

56
3.5 Marketing Expense (Sales Incentive)
Sale commission is 2% of sales
Advertising cost year 1 = 100%, Advertising cost year 2 =110%, Advertising cost year 3 = 115%, Advertising cost year 4 = 120%,
Advertising cost year 5= 125%
** Except radio and website is fix rate advertising payment
Marketing Expense Year 1 Year 1 Jan Feb Mar Apr May Jun Jul Aug Sep Oct Nov Dec Total
Marketing expense Selling expense Sale commission 75,730 70,090 65,762 59,745 60,985 62,432 65,894 63,237 67,189 74,914 78,017 78,411 822,406 Other selling expense Total selling Expense 75,730 70,090 65,762 59,745 60,985 62,432 65,894 63,237 67,189 74,914 78,017 78,411 822,406 Advertising expense Radio local 3,000 3,000 3,000 3,000 3,000 3,000 3,000 3,000 3,000 3,000 3,000 3,000 36,000 Brochure 1,000 0 0 1,000 0 0 1,000 0 0 1,500 0 0 4,500 Plate/Poster/Vinyl 0 0 0 0 9,000 0 0 0 0 15,000 0 15,000 39,000 Souvenir 0 0 0 0 0 0 0 0 0 0 0 10,000 10,000 Public relation 1,000 1,000 1,000 1,000 1,000 1,000 1,000 1,000 1,000 1,000 1,000 1,000 12,000 Website 2,345 0 0 0 0 0 0 0 0 0 0 0 2,345 Total advertising expense 7,345 4,000 4,000 5,000 13,000 4,000 5,000 4,000 4,000 20,500 4,000 29,000 103,845
Total marketing expense 83,075 74,090 69,762 64,745 73,985 66,432 70,894 67,237 71,189 95,414 82,017 107,411 926,251

57
Marketing Expense Year 2
Year 2 Jan Feb Mar Apr May Jun Jul Aug Sep Oct Nov Dec Total Marketing expense Selling expense Sale commission 83,303 77,099 72,338 65,720 67,084 68,675 72,483 69,561 73,908 82,405 85,819 86,253 904,647 Other selling expense 0 Total selling Expense 83,303 77,099 72,338 65,720 67,084 68,675 72,483 69,561 73,908 82,405 85,819 86,253 904,647 Advertising expense Radio local 3,000 3,000 3,000 3,000 3,000 3,000 3,000 3,000 3,000 3,000 3,000 3,000 3,000 Brochure 1,100 0 0 1,100 0 0 1,100 0 0 1,650 0 0 4,950 Plate/Poster/Vinyl 0 0 0 0 9,900 0 0 0 0 16,500 0 16,500 42,900 Souvenir 0 0 0 0 0 0 0 0 0 0 0 11,000 11,000 Public relation 1,100 1,100 1,100 1,100 1,100 1,100 1,100 1,100 1,100 1,100 1,100 1,100 13,200 Website 0 0 0 0 0 0 0 0 0 0 0 0 0 Total advertising expense 5,200 4,100 4,100 5,200 14,000 4,100 5,200 4,100 4,100 22,250 4,100 31,600 108,050
Total marketing expense 88,503 81,199 76,438 70,920 81,084 72,775 77,683 73,661 78,008 104,655 89,919 117,853 1,012,697

58
Marketing Expense Year 3
Year 3 Jan Feb Mar Apr May Jun Jul Aug Sep Oct Nov Dec Total Marketing expense Selling expense Sale commission 90,876 84,108 78,914 71,694 73,182 74,918 79,072 75,885 80,627 89,897 93,621 94,094 986,888 Other selling expense 0 Total selling Expense 90,876 84,108 78,914 71,694 73,182 74,918 79,072 75,885 80,627 89,897 93,621 94,094 986,888 Advertising expense Radio local 3,000 3,000 3,000 3,000 3,000 3,000 3,000 3,000 3,000 3,000 3,000 3,000 36,000 Brochure 1,150 0 0 1,150 0 0 1,150 0 0 1,725 0 0 5,175 Plate/Poster/Vinyl 0 0 0 0 10,350 0 0 0 0 17,250 0 17,250 44,850 Souvenir 0 0 0 0 0 0 0 0 0 0 0 11,500 11,500 Public relation 1,150 1,150 1,150 1,150 1,150 1,150 1,150 1,150 1,150 1,150 1,150 1,150 13,800 Website 1,000 0 0 0 0 0 0 0 0 0 0 0 1,000 Total advertising expense 6,300 4,150 4,150 5,300 14,500 4,150 5,300 4,150 4,150 23,125 4,150 32,900 112,325
Total marketing expense 97,176 88,258 83,064 76,994 87,682 79,068 84,372 80,035 84,777 113,022 97,771 126,994 1,099,213
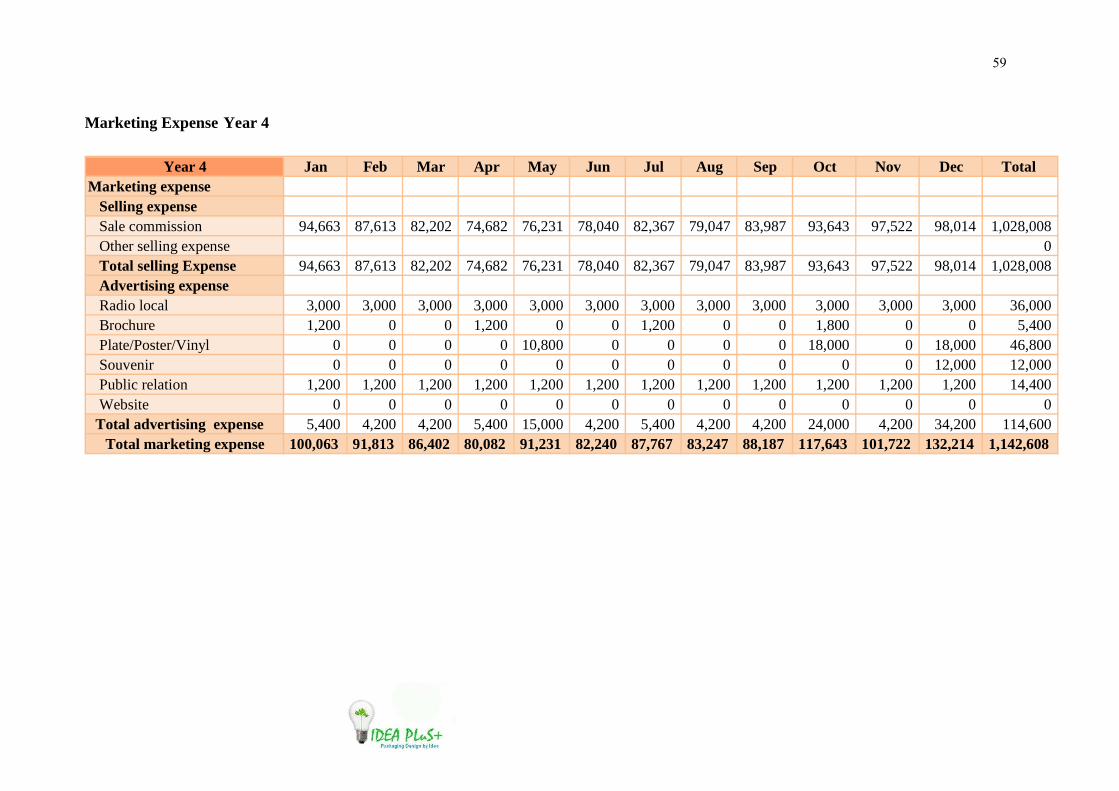
59
Marketing Expense Year 4
Year 4 Jan Feb Mar Apr May Jun Jul Aug Sep Oct Nov Dec Total Marketing expense Selling expense Sale commission 94,663 87,613 82,202 74,682 76,231 78,040 82,367 79,047 83,987 93,643 97,522 98,014 1,028,008 Other selling expense 0 Total selling Expense 94,663 87,613 82,202 74,682 76,231 78,040 82,367 79,047 83,987 93,643 97,522 98,014 1,028,008 Advertising expense Radio local 3,000 3,000 3,000 3,000 3,000 3,000 3,000 3,000 3,000 3,000 3,000 3,000 36,000 Brochure 1,200 0 0 1,200 0 0 1,200 0 0 1,800 0 0 5,400 Plate/Poster/Vinyl 0 0 0 0 10,800 0 0 0 0 18,000 0 18,000 46,800 Souvenir 0 0 0 0 0 0 0 0 0 0 0 12,000 12,000 Public relation 1,200 1,200 1,200 1,200 1,200 1,200 1,200 1,200 1,200 1,200 1,200 1,200 14,400 Website 0 0 0 0 0 0 0 0 0 0 0 0 0 Total advertising expense 5,400 4,200 4,200 5,400 15,000 4,200 5,400 4,200 4,200 24,000 4,200 34,200 114,600
Total marketing expense 100,063 91,813 86,402 80,082 91,231 82,240 87,767 83,247 88,187 117,643 101,722 132,214 1,142,608

60
Marketing Expense Year 5
Year 5 Jan Feb Mar Apr May Jun Jul Aug Sep Oct Nov Dec Total Marketing expense Selling expense Sale commission 98,449 91,117 85,490 77,669 79,281 81,161 85,662 82,208 87,346 97,388 101,422 101,935 1,069,128 Other selling expense 0 Total selling Expense 98,449 91,117 85,490 77,669 79,281 81,161 85,662 82,208 87,346 97,388 101,422 101,935 1,069,128 Advertising expense Radio local 3,000 3,000 3,000 3,000 3,000 3,000 3,000 3,000 3,000 3,000 3,000 3,000 36,000 Brochure 1,250 0 0 1,250 0 0 1,250 0 0 1,875 0 0 5,625 Plate/Poster/Vinyl 0 0 0 0 11,250 0 0 0 0 18,750 0 18,750 48,750 Souvenir 0 0 0 0 0 0 0 0 0 0 0 12,500 12,500 Public relation 1,250 1,250 1,250 1,250 1,250 1,250 1,250 1,250 1,250 1,250 1,250 1,250 15,000 Website 500 0 0 0 0 0 0 0 0 0 0 0 500 Total advertising expense 6,000 4,250 4,250 5,500 15,500 4,250 5,500 4,250 4,250 24,875 4,250 35,500 118,375
Total marketing expense 104,449 95,367 89,740 83,169 94,781 85,411 91,162 86,458 91,596 122,263 105,672 137,435 1,187,503

61
3.5 Market Feasibility Conclusion
For the general environment for our business in political, economic, social and
environment, and technology environment are provided quite good opportunity, and
support our company to do this business. Moreover, the businesses about packaging in
Chiang Rai are quite few that we have only one famous competitor who allocate the
business around Muang district, King Carton Company, who provide quite similar
business, but we employ the King Carton as our production division or we can call them
as supplier instead of competitor. We emphasized on customers in Chiang Rai who
running the industry, and wholesaler& retailer because there are quite more amount of
customers in these businesses. However, the competitive for this business is quite not
too competing strongly although we have only one supplier, because we plan to employ
other suppliers to supply and running the production for us such as CK Carton in
Lumphun. We want to serve the quality products which meet the customers’ need
because we position our products on promoting, adding value, and environmental
friendly for the customers especially the medium and small businesses by providing
product differentiation, and using the friendly materials. Moreover, we offer our
customers with reasonable price which is depended on the cost of papers, allocate our
company at the place where easy and flexible for customers, distribute our products
through Nimseeseng Transportation Company to our customers directly, and do more
aggressive advertising, and promote our products through the media and sale
representatives, which those are our strategies for marketing that help us to gain more
profit by reaching the customers’ mind.
Furthermore, the calculating show that if we get just only 1% of wholesale and
retail sector and industry sector, income will be 3.92 million baht per month which
packaging is more required because there are more trading for both wholesale and retail
including arising of sales for industry.

62
Chapter 4
Technical Feasibility Study
4.1. Production and Operations Analysis
4.1.1 Product Characteristics
• Box
Raw Material Size Price (Starting price)
- Corrugated fiberboard
- Cardboard paper
Smaller than 16 x 24
x 9 cm
16 x 24 x 9 cm
20.5 x 25 x 9cm
17 x 25 x 9 cm
13 x 28 x 10 cm
12 x 12 x 15 cm
10 x 5 x 16 cm
10 x 8 x 12 cm
30 x 42 x 30cm or
bigger
2 Baht
3.80 Baht
4.50 Baht
4.20 Baht
3.50 Baht
3.50 Baht
3.50 Baht
3.50 Baht
5 Baht
Note** The price may be changed, depends on size, design, raw material and order size

63
Example of Corrugated fiberboard packaging:
Figure4.1: Example of Corrugated fiberboard packaging

64
Example of Cardboard paper packaging:
Figure 4.2 Example of Cardboard paper packaging

65
• Bag - Cardboard paper
Raw Material Size Price (Starting price)
• Cardboard paper
Smaller than 12/15 x 5
x 14 cm
12/15 x 5 x 14 cm
16/20 x 6 x 20 cm
24/30 x 9 x 35 cm
9.5 x 5 x 15 cm
14 x 5 x 19.5 cm
18 x 6 x 30 cm or
bigger
1 Baht
4 Baht
4.50 Baht
5 Baht
5.75 Baht
6.75 Baht
7.50 Baht
Note** The price may be changed, depends on size, design, raw material and order size
Example of Cardboard bag packaging:

66
Figure4.3 Example of Cardboard bag packaging

67
• Bag - Kraft paper
Raw Material Size Price
• Kraft paper bag packaging
Smaller than 12/15 x 5
x 14 cm
12/15 x 5 x 14 cm
16/20 x 6 x 20 cm
24/30 x 9 x 35 cm
9.5 x 5 x 15 cm
14 x 5 x 19.5 cm
18 x 6 x 30 cm or
bigger
1 Baht
1.75 Baht
2.25 Baht
2.75 Baht
3 Baht
4 Baht
5 Baht
Note** The price may be changed, depends on size, design, raw material and order size
Example of Kraft paper bag packaging:

68
Figure 4.4: Example of Kraft paper bag packaging
4.1.2 Specification/ Feature of each type of paper we provided to our
customers
1) Kraft paper
Kraft paper can be utilized for many different purposes. One of the most
common uses of the plain brown Kraft paper is in the manufacture of paper bags for use
in grocery stores. The solid construction of Kraft paper makes the bags ideal for use
with all sorts of grocery items. While many grocers have switched to the use of plastic
bags, many supermarket chains continue to offer customers the option of receiving their
purchases in bags made from Kraft paper. Butcher shops often make use of the bleached
Kraft paper as a wrap from fresh cuts of meat. For many years, consumers would place
meats sealed in Kraft paper in the freezer, if the intent was to prepare the meat over the
next few days. While many meat counters at supermarkets now use plastic trays and
plastic seal wrap with their meats, many independent grocers and butcher shops still use
the familiar Kraft paper.

69
Kraft paper is sometimes used for home crafts as well. A section of craft paper is
an ideal medium for the creation of homemade costumes for Halloween or a costume
party. Children can draw on bleached or unbleached Kraft paper without a lot of worry
about markers leaking through to tabletops. People who want to be more natural and
creative with their gift wrap may choose to use inexpensive Kraft paper for wrapping
gifts, often embellishing with other natural elements or using markers or stencils to
create a unique design. Kraft paper is also utilized in other industries as well. In the
publishing industry, Kraft paper is often used as the lining for the inside cover spine of
hardback books. In the world of electronics, Kraft paper is often used as an insulating
agent on electrical components, providing a sturdy yet inexpensive means of protecting
the material. Envelopes for both mailing and use as interoffice communications are
often made with Kraft paper, owing to the relative thickness and sturdy nature of the
paper.
1.1) Kraft Paper Quality:
High quality liner board for quality product
• KA – Confident
Premium Kraft-top liner - golden yellow - Special shade indicating highest
strength class, enduring impact and stacking load very well. Strictly controlled for
consistent color shade and humidity resistance. The first grade officially certified
Thailand Green Label. Ideal for packaging of high-
value or heavy products that require strong packaging
and maximum confidence.
Standard grammage: 125,150,185,230
Figure 4.5: The Premium Kraft-top liner – golden yellow

70
• KS – Supreme
Kraft Top Liner - White bleached virgin pulp top ply provides both very clean
surface and very strong sheet, enduring impact and stacking load as well as resistance
against humidity. Best for packaging of high-value products requiring clean image e.g.
food, frozen food, medical apparatus, exported goods
showing premium image and colorful print graphic.
Standard grammage : 140,170
Figure 4.6: The Kraft Top Liner
• KI – Image
Kraft-top liner - bright brown. The clean bright natural brown look is
achieved by virgin pulp top ply with no use of any dye !
The sheet is also strong, bearing impact & stacking load
very well. Perfect alternative for packaging with colorful
print graphic, due to light and bright shade substrate.
Standard grammage : 125,150,185
Figure 4.7: The Kraft-top liner - bright brown
• KP-Pan Pacific
Kraft-top liner - brown. With unbleached long fiber pulp top ply, it looks
similar to papers in USA or packaging of products exported
there. It also has high strength, withstanding impact and
stacking very well. Suitable for heavy goods for export.
Standard grammage : 125,150,175,250,275
Figure 4.8: The Kraft-top liner - brown

71
2) Cardboard Paper
Cardboard is a generic term for heavy-duty paper-based products sometimes
made by pasting together two or more layers of paper. It is used to make playing cards,
signs, boxes, and other things. Synonyms include paperboard and pasteboard. In
industry, the term cardboard is seldom used because it does not denote a specific
material.
Paperboard is a paper-based material, usually less than about ten mils (0.010-
inches (0.25-mm)) in thickness. It is often used for folding cartons, set-up boxes, carded
packaging, etc. Cardboard boxes are industrially prefabricated boxes, primarily used for
packaging goods and materials.
3) Corrugated fiberboard
Figure 4.9: The Corrugated fiberboard
Corrugated fiberboard can be specified by the construction (single face, single
wall, double wall, etc), flute size, burst strength, edge crush strength, flat crush, basis
weights of components (pounds per thousand square feet, grams per square meter, etc),
surface treatments and coatings, etc. The choice of corrugated medium, flute size,
combining adhesive, and linerboards can be varied to engineer a corrugated board with
specific properties to match a wide variety of potential uses. Double and triple-wall
corrugated board is also produced for high stacking strength and puncture resistance.
Common flute sizes are "A", "B", "C", "E" and "F" or micro flute. The letter
designation relates to the order that the flutes were invented, not the relative sizes. Flute
size refers to the number of flutes per lineal foot, although the actual flute dimensions

72
for different corrugators manufacturers may vary slightly. Measuring the number of
flutes per lineal foot is a more reliable method of identifying flute size than measuring
board thickness, which can vary due to manufacturing conditions. The most common
flute size in corrugated boxes is "C" flute.
3.1) The Standard US Corrugated Flutes
Table 4.1: The Standard US Corrugated Flutes
Flute Designation Flutes / Metre Flute thickness (mm)
A flute 100-120 4.67
B flute 145-165 2.46
C flute 120-140 3.36
E flute 280-310 1.19
F flute 410-435 0.8
A flute – can be overlapped for many items and can protect the goods inside. A
flute is the original and largest flute. When combined the flute with both inside and
outside cover, it will be the most thickness of corrugated with about 36 flutes a foot.
When take the A flute to produce a corrugated paper box, will be able to receive the
shock and can be most layer overlapped. It’s ideal for packing fragile products because
a flute has high level of strength. So, a flute has been applied for a variety of customer
needs.
B flute - stabbing penetration resistance, mostly used, suitable for packing
canned goods. B flute is the second flute that used in the corrugated industry. The flute
height is less than A flute and there are more flute per foot which means B flute has
more point that the flute connect to the cover. That makes B flute has strong surface,
more taut and smooth. This will result in print quality out beautifully. When applied to
Die-Cut boxes, you will have a beautiful box with shock resistance and can receive
many layers overlapping. Moreover B flute is suitable for automatic high speed
packaging machine. And also often bring to produce partitions and pads and other

73
components in the box. More B flute is suitable for packing the canned food and also
for produce complicate Die-Cut box and beverage tray.
C flute – can be overlaid and protect the goods well, the most popular used,
suitable for packaging furniture and glassware. C flute was later discovered to include
the difference between flute A and B together. A flute has 42 flutes per foot. Less
thickness than A flute but more than flute B. That makes flute C has feature in receive
the shock and overlapping force. Printing quality is mix seamlessly. So flute C is the
most popular used in the present. When compared with other corrugated flute,
approximately 80% of corrugated paper packaging today are produced from flute C
corrugated paper.
E flute – Micro flute, lightweight, high-quality printing suitable for producing
Die-Cut box. E flute has approximately 94 flutes per foot. E flute is very high shock
resistance, tight smooth surface, resulting in high print quality. E flute has thickness
only 1/4 of C flute. So, E flute corrugated box is small, save storage area. Because of
the feature in very high shock resistance, C flute can be used instead of corrugated
boxes or fibers packaging, E flute packaging, such as cosmetics, glassware and
porcelain.
3.2) Types of Corrugated Paper
There are 4 types of corrugated paper are used currently:
1. Single Face Corrugated paper
Corrugated paper is consisting of 1 side of paper as
a cover and the corrugated flute.
Figure 4.10: The Single Face Corrugated paper

74
2. Single Wall Corrugated paper
Is a consisting of front and backside of covering.
The middle is corrugated flute which those flute
depending on the user who want to use and may be flute
B, C or A.
Figure 4.11: The Single Wall Corrugated paper
3. Corrugated paper Double Wall
Corrugated paper is consisting of 3 covers and 2
layers of corrugated flute. It is produced for use with
corrugated boxes that require high loads, which is often
used flute B and C mainly.
Figure 4.12: The Corrugated paper Double Wall
4. Triple Wall Corrugated paper
Corrugated paper is produced for heavy industry
that receives a large package weight such as machine in
industry. This kind of corrugated paper is consisting of 4
layers of covering and 3 layers of corrugated flute.
Figure 4.13: The Triple Wall Corrugated paper
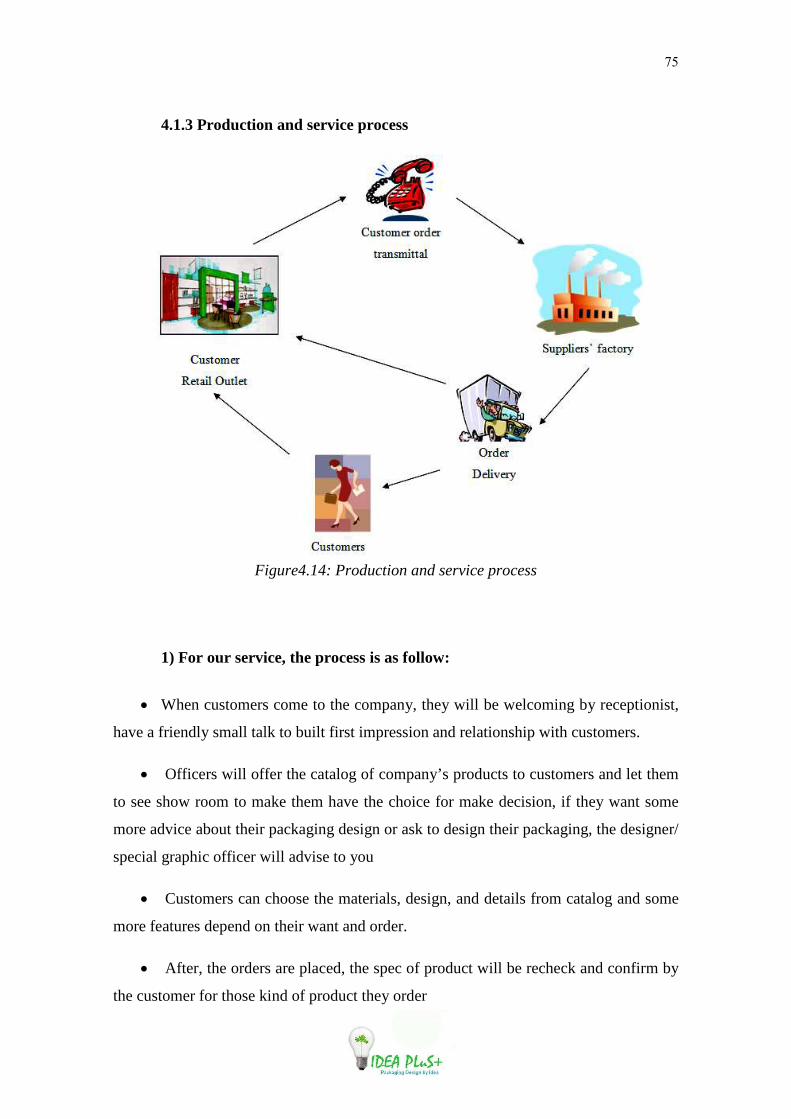
75
4.1.3 Production and service process
Figure4.14: Production and service process
1) For our service, the process is as follow:
• When customers come to the company, they will be welcoming by receptionist,
have a friendly small talk to built first impression and relationship with customers.
• Officers will offer the catalog of company’s products to customers and let them
to see show room to make them have the choice for make decision, if they want some
more advice about their packaging design or ask to design their packaging, the designer/
special graphic officer will advise to you
• Customers can choose the materials, design, and details from catalog and some
more features depend on their want and order.
• After, the orders are placed, the spec of product will be recheck and confirm by
the customer for those kind of product they order

76
• After customer place order, even come to see us at the company, or via sales
person, or other way, Idea Plus will transmit customer order to the suppliers to produce
• After the finish order, it will be serve to customers or will be stock at the
company and customers come to get it by themselves, depend on the contact.
• The customers would be prepaid for 50%
• The order must place before shipping date at least 7 days.
• The company will not response for the mistake that checked and confirm by
customers be for production.
2) The Box Production Process
The manufacturing sequence can follow many different paths depending on the
nature of a box design and how it is decorated. Board leaving the corrugating machine
might be natural Kraft or any one of the several white surfaced or solid white Krafts.
The top linerboard may be unprinted, or the linerboard may have been preprinted. For a
regular RSC, a flat sheet, cut to the box’s overall dimensions and with the flap scores in
place, is sent through a single machine that prints, panel-scores and slots, folds, and
glues the box in one operation. An RSC that has a preprinted liner already in place as it
leaves the corrugating machine needs to be panel scored and slotted, folded, and glued.
Preprinted blanks intended for complex box designs other than RSC styles are sent for
rotary or flat-bed die-cutting and then folding and gluing. Die-cut boxes leave the
corrugating machine as flat unscored sheets. They can be decorated by direct printing or
by applying preprinted lithographed labels (litho labeling). After the appropriate
decorating, the blank is sent for die-cutting, folding and gluing. Litho-laminating is a
less common process. It laminates a lithographically printed label paper (not kraft) to a
single faced board, usually using a specialized, small corrugating machine. The process
is most often done with E- or smaller flutes.
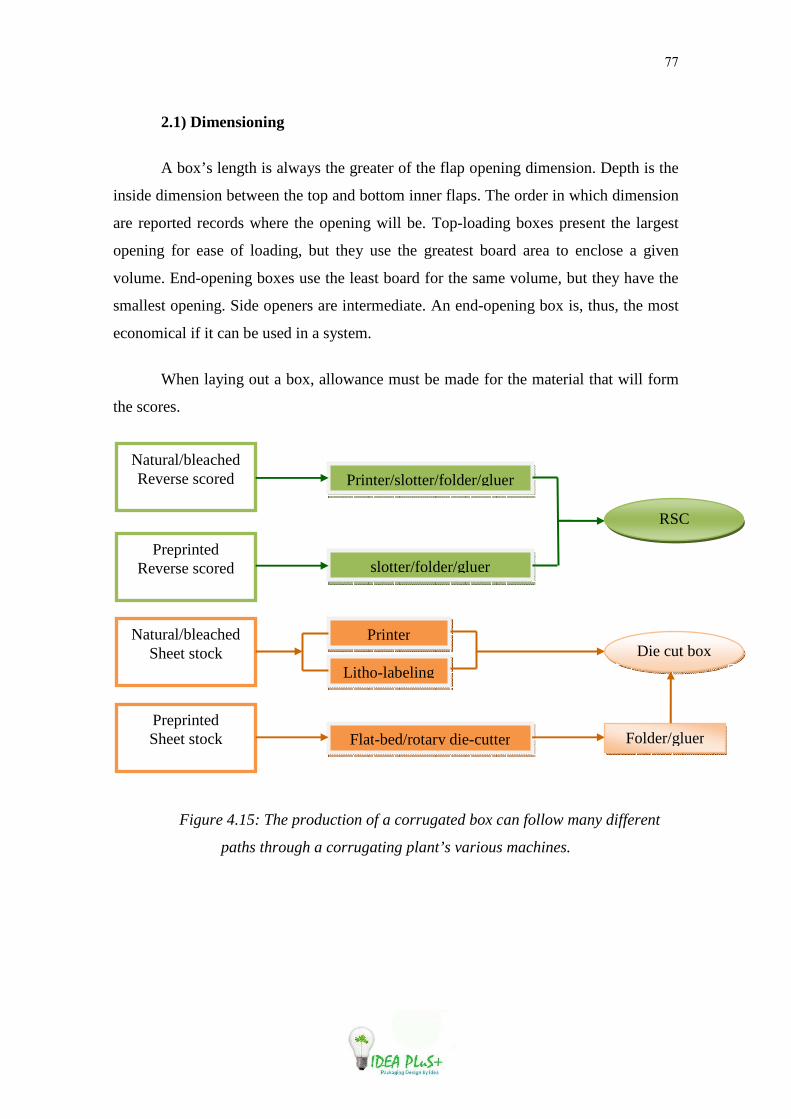
77
2.1) Dimensioning
A box’s length is always the greater of the flap opening dimension. Depth is the
inside dimension between the top and bottom inner flaps. The order in which dimension
are reported records where the opening will be. Top-loading boxes present the largest
opening for ease of loading, but they use the greatest board area to enclose a given
volume. End-opening boxes use the least board for the same volume, but they have the
smallest opening. Side openers are intermediate. An end-opening box is, thus, the most
economical if it can be used in a system.
When laying out a box, allowance must be made for the material that will form
the scores.
Figure 4.15: The production of a corrugated box can follow many different
paths through a corrugating plant’s various machines.
Natural/bleached Reverse scored
Preprinted Reverse scored
Natural/bleached Sheet stock
Preprinted Sheet stock
Printer/slotter/folder/gluer
slotter/folder/gluer
Flat-bed/rotary die-cutter
Printer
Litho-labeling
Folder/gluer
RSC
Die cut box

78
Corrugated board folds by collapsing in on its, and the lines drawn on a flat
sheet will not be equal to the finished box dimensions. Scoring allowances (K) are
added, based on the box design, flute, material, and on the type of scoring wheels used.
When discussing box sizes with a supplier, it always sends the product or a sample box.
In the event that you must size a box accurately, follow these directions:
1. Tear or cut the box open at the manufacturer’s joint and lay it face down.
2. Determine box style, board and flute.
3. Accurately mark the exact center line of the panel and flap scores.
4. Accurately measure between the centers marks of the second and third panels.
Do not measure the first or fourth panels.
5. Subtract scoring allowances as dictated by step 2. The result is the box length
and width.
6. Repeat steps4 and5, measuring between the end scores. The result is the box
depth.
2.2) Printing Inks
A typical printing ink contains the following ingredient classes:
Table 4.2: The Printing Inks
Pigments Ingredients that provide the color
Vehicle A resinous component that binds pigment particles and
adhere them to the substrate.
Solvents Dissolves resins and fluidizes the formula so it will flow and
wet the substrate.
Additives Wetting agents, dryers, antioxidants, viscosity control agents
and testifiers.

79
Inks solidify by the following processes:
• Evaporation of a solvent or water.
• Absorption of a solvent or water.
• Oxidation.
• Chemical reaction.
Most inks solidify by a combination of several mechanisms. Inks are formulated
for specific substrates, and an ink for one paper or plastic will not necessarily work well
with another. Trapping refers to an ink’s ability to print evenly over both previously
inked areas and bare substrate with the same amount of ink transferring to each. A
serious problem occurs, particularly on high-speed printing machines, when less ink
transfers to an already inked area. Improperly formulated inks will trap poorly and result
in poor color reproduction. Unfortunately, some of the most brightly colored and light-
stable materials are oxides and compounds derived from metals such as lead, mercury,
bismuth, antimony, chromium and cadmium. Considerable efforts are being made to
eliminate the use of these metal pigments. The most biologically active of these are in
fact rarely if ever used in printing inks. Wherever practical, specify inks with no
appreciable amounts of what some call “heavy” metals. Some of the organic pigments
that have replaced metal-based pigments are not as stable toward light, specifically UV
light. Outdoor exposure can result in unacceptable fading. The increasing popularity of
UV-cured surface varnishes requires these inks to be tested for fading. The resin
component of ink is selected to be compatible (create a bond) with the substrate. Most
ink vehicles are synthetic resins that need to be dissolved with solvent. Again,
environment concerns are directing development of resins that use easily controlled
solvents or solvents that can be dispersed with water. Some resins based on acrylic
emulsions have achieved notable success. However, water-based inks are still not
available for all applications and will probably not be universally available for some
time. Vegetable-oil-based inks have received wide publicity, but have limitations. In
many instances, they are heavily modified or are used in small quantities. Although
some authorities doubt that their use has significant environmental benefits, efforts are
still being made in this area.

80
4.1.4 Location
For location, Idea Plus building is the green two blogs with tree floors building
which is located on Phahon Yothin Road, Wiang sub-district, Muang Chiang Rai
district, Chiang Rai. The nearby shops are Porncharoern Mirror shop on the left hand
side, RN Paint and Taweeheng shop is on the right hand side and opposite to Dunlop
Center.
Figure 4.16: The Location of Idea Plus building
King Meng Rai
Monument
St. Peter Hospital
Porncharoern Mirror shop
Idea Plus
RN Paint
Taweeheng
Mae Sai
Chiang Rai
N
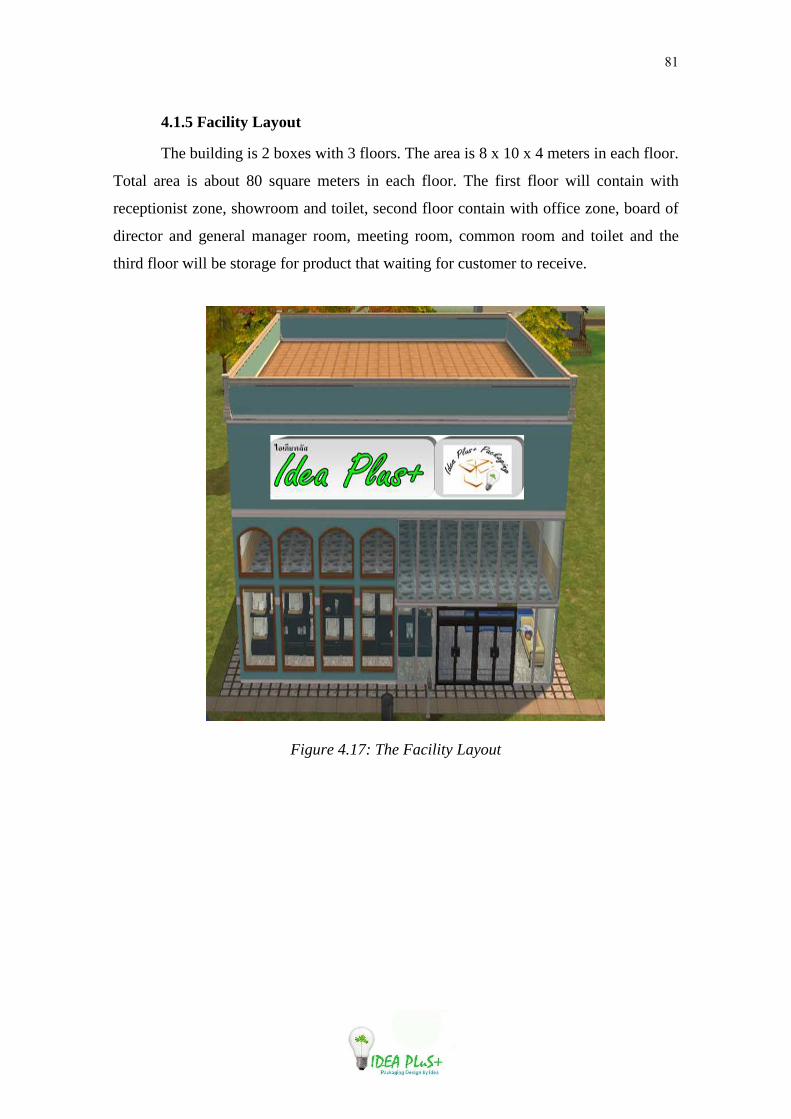
81
4.1.5 Facility Layout
The building is 2 boxes with 3 floors. The area is 8 x 10 x 4 meters in each floor.
Total area is about 80 square meters in each floor. The first floor will contain with
receptionist zone, showroom and toilet, second floor contain with office zone, board of
director and general manager room, meeting room, common room and toilet and the
third floor will be storage for product that waiting for customer to receive.
Figure 4.17: The Facility Layout

82
• Layout inside
First floor
Dry Chemical Fire Extinguisher

83
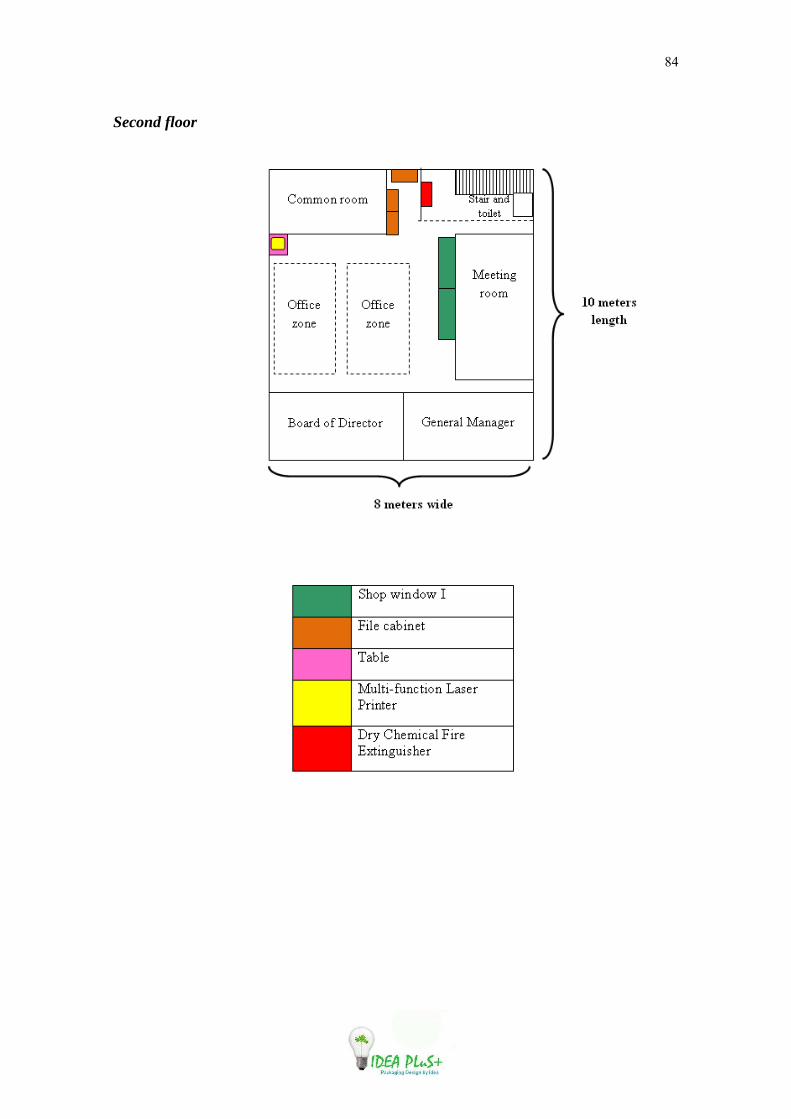
84
Second floor

85
1. Board of director and general manager room 2. Meeting Room

86
3. Common Room
4. Office zone

87
5. Toilet zone
Third floor
For third floor is warehouse which used for store inventoty that waiting for
receive by customers (not stock inventory for sale)
Plastic Pallet
Dry Chemical Fire
Extinguisher

88
4.1.6 Tools / Equipments
First
Floor Item Picture Detail Units
Price per
unit (Baht)
Total
(Baht)
First
floor
Receptionist zone
Reception
Counter
- Fully cotton and PVC cushioned seat and back - High-impact plastic arms - Melamine desk with rubble
1 3,5000 3,5000
Desktop PC I
- Intel Celeron Dual-Core E1200 (1.6 GHz), HD: 80 GB (7200rpm) - Ram: 256 MB - Card graphic on board 6 USB 2.0, LAN port, 56k Modem,17 W CRT Combo Drive,512 MB - 1 year warranty
1 11,499 11,499
Telephone
- Ringer Volume Control - 9-station One-Touch - 10-station Two-Touch - Hand-free speaker-phone Flash Redial
1 499 499
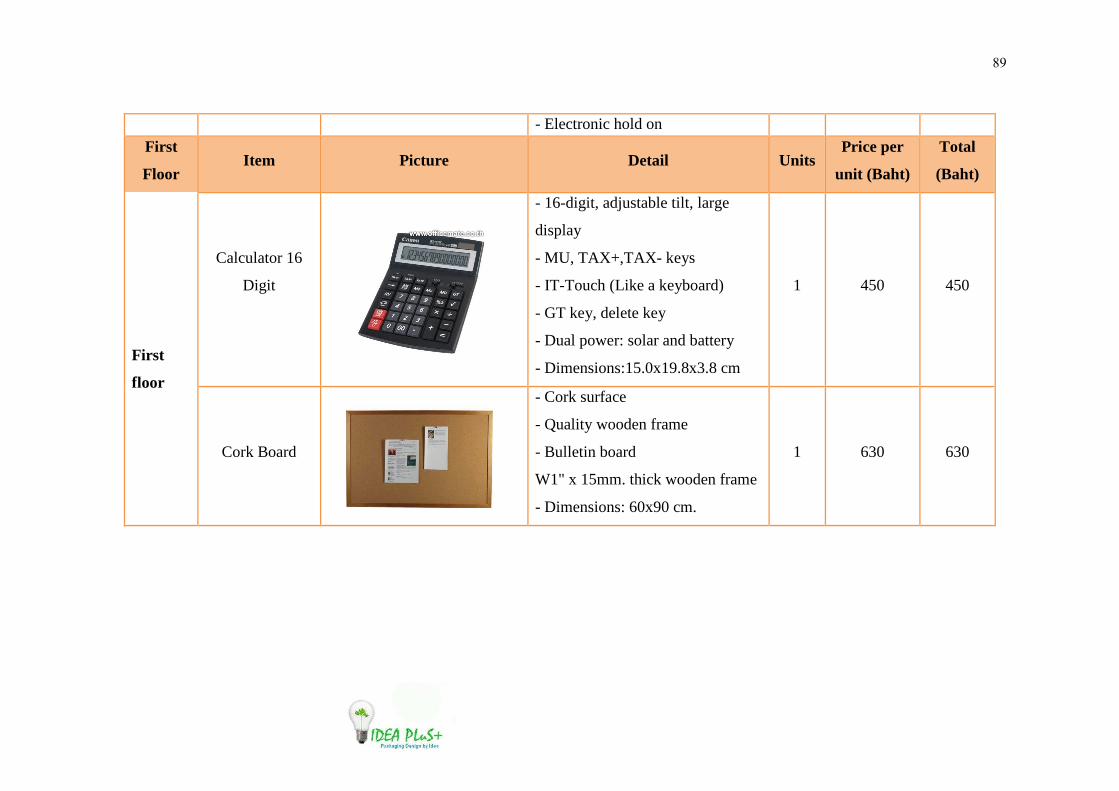
89
- Electronic hold on
First
Floor Item Picture Detail Units
Price per
unit (Baht)
Total
(Baht)
First
floor
Calculator 16
Digit
- 16-digit, adjustable tilt, large
display
- MU, TAX+,TAX- keys
- IT-Touch (Like a keyboard)
- GT key, delete key
- Dual power: solar and battery
- Dimensions:15.0x19.8x3.8 cm
1 450 450
Cork Board
- Cork surface
- Quality wooden frame
- Bulletin board
W1" x 15mm. thick wooden frame
- Dimensions: 60x90 cm.
1 630 630
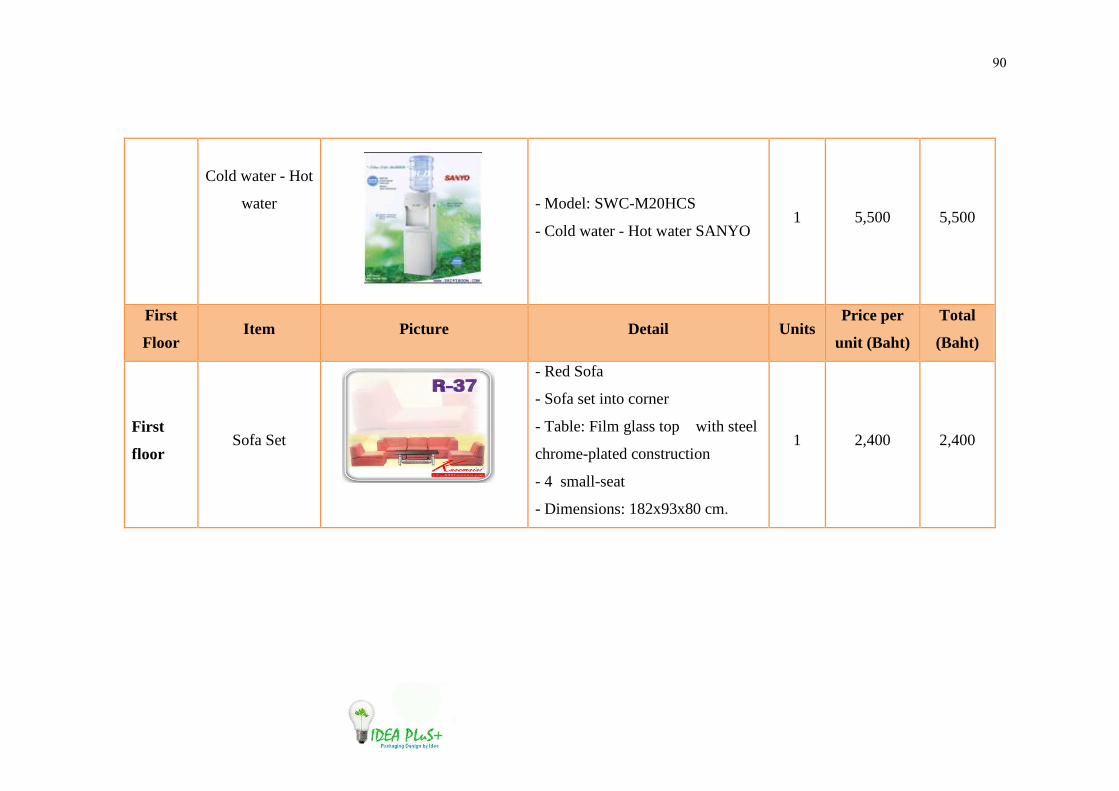
90
Cold water - Hot
water
- Model: SWC-M20HCS
- Cold water - Hot water SANYO 1 5,500 5,500
First
Floor Item Picture Detail Units
Price per
unit (Baht)
Total
(Baht)
First
floor Sofa Set
- Red Sofa
- Sofa set into corner
- Table: Film glass top with steel
chrome-plated construction
- 4 small-seat
- Dimensions: 182x93x80 cm.
1 2,400 2,400

91
Show Room
Shop window I
- Size 200 x185 x 50 cm.
- 4 pieces of glass 5 2,000 10,000
Shop window II
- Color: Cream
- Size: 140 x 200 x 45 cm 3 3,000 9,000
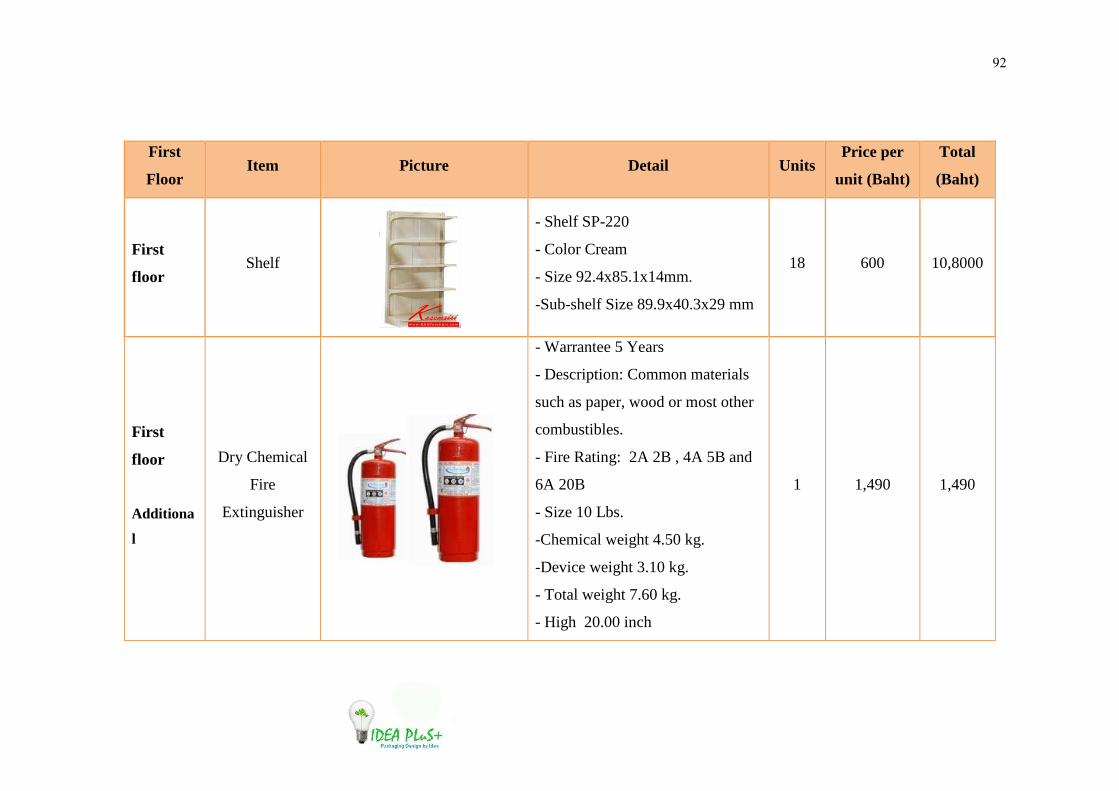
92
First
Floor Item Picture Detail Units
Price per
unit (Baht)
Total
(Baht)
First
floor Shelf
- Shelf SP-220
- Color Cream
- Size 92.4x85.1x14mm.
-Sub-shelf Size 89.9x40.3x29 mm
18 600 10,8000
First
floor
Additiona
l
Dry Chemical
Fire
Extinguisher
- Warrantee 5 Years
- Description: Common materials
such as paper, wood or most other
combustibles.
- Fire Rating: 2A 2B , 4A 5B and
6A 20B
- Size 10 Lbs.
-Chemical weight 4.50 kg.
-Device weight 3.10 kg.
- Total weight 7.60 kg.
- High 20.00 inch
1 1,490 1,490

93
First
Floor Item Picture Detail Units
Price per
unit (Baht)
Total
(Baht)
First
floor Air conditioner
Already provided in the building - - -
First
floor
Toilet ** Toilet is already provided in the building don’t need to build a new one**
Flush toilet
Already provided in the building - - -
Mirror
Already provided in the building - - -
Sink clean
Already provided in the building - - -
** Toilet is already provided in the building don’t need to build a new one**
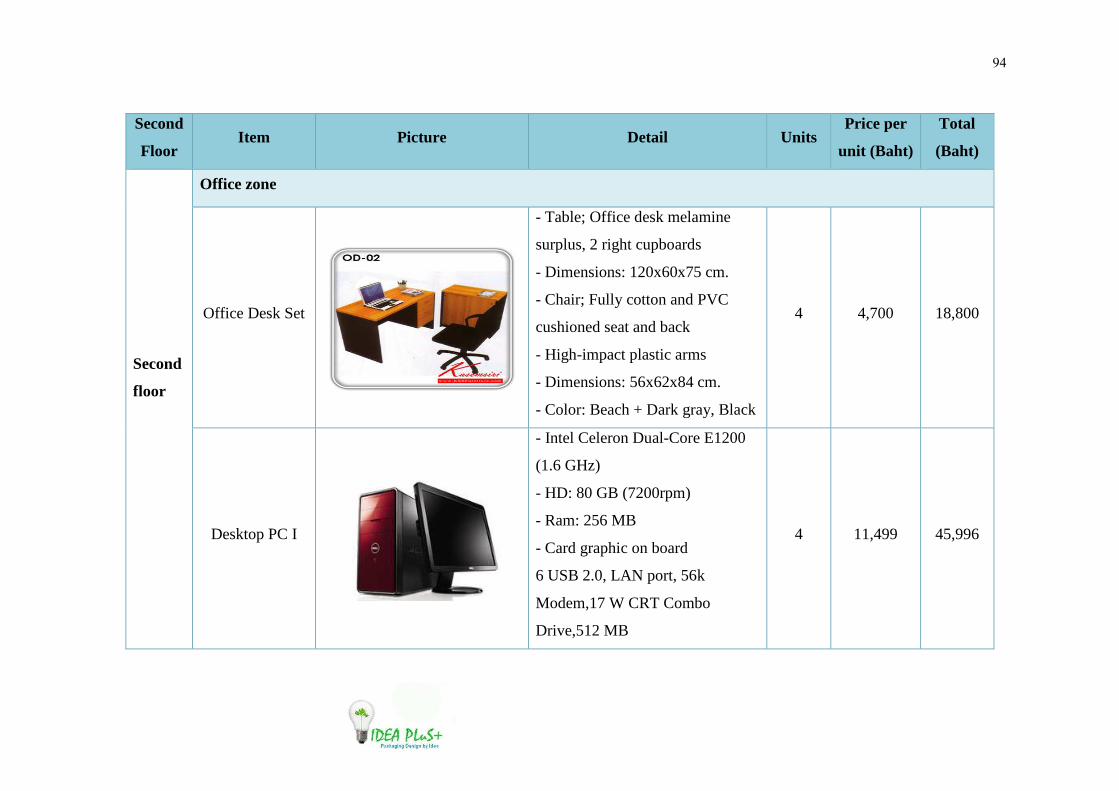
94
Second
Floor Item Picture Detail Units
Price per
unit (Baht)
Total
(Baht)
Second
floor
Office zone
Office Desk Set
- Table; Office desk melamine
surplus, 2 right cupboards
- Dimensions: 120x60x75 cm.
- Chair; Fully cotton and PVC
cushioned seat and back
- High-impact plastic arms
- Dimensions: 56x62x84 cm.
- Color: Beach + Dark gray, Black
4 4,700 18,800
Desktop PC I
- Intel Celeron Dual-Core E1200
(1.6 GHz)
- HD: 80 GB (7200rpm)
- Ram: 256 MB
- Card graphic on board
6 USB 2.0, LAN port, 56k
Modem,17 W CRT Combo
Drive,512 MB
4 11,499 45,996

95
Second
Floor Item Picture Detail Units
Price per
unit (Baht)
Total
(Baht)
Second
floor
Telephone
- Ringer Volume Control
- 9-station One-Touch
- 10-station Two-Touch
- Hand-free speaker-phone Flash
Redial
- Electronic hold on
4 499 1,996
Calculator 16
Digit
- 16-digit, adjustable tilt, large
display
- MU, TAX+,TAX- keys
- IT-Touch (Like a keyboard)
- GT key, delete key
- Dual power: solar and battery
- Dimensions:15.0x19.8x3.8 cm
3 450 1,350
Office Partition
- Partition Series 1
- 156 cm. Height * (40, 60, 75, 80,
90, 100, 120 cm. Width)
20 1,400 28,000

96
Second
Floor Item Picture Detail Units
Price per
unit (Baht)
Total
(Baht)
Second
floor
Cork Board
- Cork surface
- Quality wooden frame
- Bulletin board
W1" x 15mm. thick wooden frame
- Dimensions:
60x90 cm.
2 631 1,262
Drawing Table
- Thick melamine top, still to hold
on equipment and
Steel frame for drop foot.
- Dimension:
120x60x75 cm.
- Color: Light blue
1 3,500 3,500
File cabinet
- 25mm thick melamine top
- Multi-function to stock
document
- Dimensions: 80x40x160 cm.
- Color: Cherry + Black
7 3,190 22,330

97
Second
Floor Item Picture Detail Units
Price per
unit (Baht)
Total
(Baht)
Second
floor
Multi-function
Laser Printer
- Pint/ Fax/ Copy/ Scan/ PC Fax
- Print Speed: up to 22 ppm (A4)
Memory: 16 MB
- Copy Speed: up to 20 ppm
- Fax Transmission Speed: 6 spp
- Automatic Document Feeder
Capacity: 35 sheet
- 3-year warranty
1 6,990 6,990
Shop window I
- Size 200 x185 x 50 cm.
- 4 pieces of glass 2 2,000 4,000
Second Item Picture Detail Units Price per Total

98
Floor unit (Baht) (Baht)
Second
floor
Meeting Room
Office
Meeting Set
- 2 semicircle tables and 2
rectangle tables and 12 chairs
- 28 mm thick melamine top
- Seat Dimensions: 93x93x80 cm.
- Dimensions: 370 x 130 cm
- Color: Beach + Dark gray+
Black
1 14,090 14,090
Computer
Desk
- Particleboard with 25mmthick
melamine top
- Computer desk with sliding
keyboard tray
- Dimensions: 80x60x75 cm.
1 950 950
Blinds
- Durable vertical blinds have
vinyl vanes
- Smooth or embossed
(beautifully textured) PVC
1 3,390 3,390

99
Second
Floor Item Picture Detail Units
Price per
unit (Baht)
Total
(Baht)
Second
floor
Desktop PC I
- Intel Celeron Dual-Core E1200
(1.6 GHz)
- HD: 80 GB (7200rpm)
- Ram: 256 MB
- Card graphic on board6 USB
2.0, LAN port,56k Modem,17 W
CRT
Combo Drive,512 MB
1 11,499 11,499
Common Room
Cold water -
Hot water
- Model: SWC-M20HCS
- Cold water - Hot water SANYO 1 5,500 5,500

100
Second
Floor Item Picture Detail Units
Price per
unit (Baht)
Total
(Baht)
Second
floor
Microwave
- LG Microwave
MS-2127CW
- size 21 liters
1 2,190 2,190
Kitchen
cabinet
- Finest materials
- High durability 1 2,800 2,800
Refrigerator
- Refrigerator MITSUBISHI MR-
14B - 4.9 Q.
- 555x1016x588
- 31 kg.
-65 W
1 5,490 5,490

101
Second
Floor Item Picture Detail Units
Price per
unit (Baht)
Total
(Baht)
Second
floor
Dining Table
- Come with 4 chairs
- Made from Rubber wood
- Elegant and concise fashion
modeling appearance
2 3,500 7,000
Board of Director and General Manger Room
Manager
Chair
- Fully cotton and PVC cushioned
seat and back
- Melamine desk with rubble
- Dimensions: 61x67x112 cm.
- Color: Beach + Black
2 4,100 8,200
File cabinet
- 25mm thick melamine top
- Multi-function to stock
document
- Dimensions: 80x40x160 cm.
- Color: Cherry + Black
2 3,190 6,380

102
Second
Floor Item Picture Detail Units
Price per
unit (Baht)
Total
(Baht)
Second
floor
Telephone
- Ringer Volume Control
- 9-station One-Touch
- 10-station Two-Touch
- Hand-free speaker-phone Flash
Redial
- Electronic hold on
2 499 998
Desktop PC I
- Intel Celeron Dual-Core E1200
(1.6 GHz)
- HD: 80 GB (7200rpm)
- Ram: 256 MB
- Card graphic on board 6 USB 2.0,
LAN port, 56k Modem,17 W CRT
Combo Drive,512 MB
2 11,499 22,998
Second Item Picture Detail Units Price per Total

103
Floor unit (Baht) (Baht)
Air
conditioner
Already provided in the building - - -
Second
floor
Toilet ** Toilet is already provided in the building don’t need to build a new one**
Flush toilet
Already provided in the building - - -
Mirror
Already provided in the building - - -
Sink clean
Already provided in the building - - -

104
First
Floor Item Picture Detail Units
Price per
unit (Baht)
Total
(Baht)
Second
floor
Additional
Dry
Chemical
Fire
Extinguisher
- Warrantee 5 Years
- Description: Common materials
such as paper, wood or most other
combustibles.
- Fire Rating: 2A 2B , 4A 5B and
6A 20B
- Size 10 Lbs.
-Chemical weight 4.50 kg.
-Device weight 3.10 kg.
- Total weight 7.60 kg.
- High 20.00 inch
- Pressure 400 Lbs./inch2
1 1490 1490
First Floor Item Picture Detail Units Price per Total

105
unit (Baht) (Baht)
Third
floor
Warehousing
Plastic Pallet
- Lightweight Plastic Pallet
- Durable high density
- high impact plastic
10 400 4,000
Third
floor
Additional
Dry
Chemical
Fire
Extinguisher
- Warrantee 5 Years
- Description: Common materials such
as paper, wood or most other
combustibles.
- Fire Rating: 2A 2B , 4A 5B and 6A
20B
- Size 10 Lbs. High 20.00 inch
-Chemical weight 4.50 kg.
-Device weight 3.10 kg.
- Total weight 7.60 kg.
- Pressure 400 Lbs./inch2
1 1,490 1,490

106
Equipments
Floor Zone No. Item UnitsPrice per
unit (Baht)Total (Baht)
1 Reception Counter 1 35,000 35,0002 Desktop PC I 1 11,499 11,4993 Telephone 1 499 4994 Calculator 16 Digit 1 450 4505 Cork Board 1 630 6306 Cold water - Hot water 1 5500 5,5007 Sofa Set 1 2,400 2,4008 Shop window I 5 2,000 10,0009 Shop window II 3 3,000 9,00010 Shelf 18 600 10,800
Additional 11Dry Chemical Fire Extinguisher
1 1,490 1,490
First floor
Receptionist zone
Show Room
12 Office Desk Set 4 4,700 18,80013 Desktop PC I 4 11,499 45,99614 Telephone 4 499 1,99615 Calculator 16 Digit 3 450 1,35016 Office Partition 20 1,400 28,00017 Cork Board 2 631 1,26218 Drawing Table 1 3,500 3,50019 File cabinet 7 6,580 46,06020 Multi-function Laser 1 6,990 6,99021 Shop window I 2 2,000 4,00031 Manager Chair 2 4,100 8,20032 File cabinet 2 6,580 13,16033 Telephone 2 499 99834 Desktop PC I 2 11,499 22,99822 Office Meeting Set 1 14,090 14,09023 Computer Desk 1 950 95024 Blinds 1 3,390 3,39025 Desktop PC I 1 11,499 11,49926 Cold water - Hot water 1 5500 5,50027 Microwave 1 2190 2,19028 Kitchen cabinet 1 2800 2,80029 Refrigerator 1 5,490 5,49030 Dining Table 2 3,500 7,000
Additional 35Dry Chemical Fire Extinguisher
1 1,490 1,490
Common Room
Second floor
Office zone
Meeting Room
Board of Director and
General Manger Room

107
Warehousing 36 Plastic Pallet 10 400 4,000
Additional 37Dry Chemical Fire Extinguisher
1 1,490 1,490
Total equipments cost 350,467
Third floor

108
Office Supplies
No. Item Picture Detail Units Price per
unit (Baht)
1 Lancer Spiral
- 0.5 mm.
- Ribbed barrel for skip-free writing
- Color: blue, red, and black
box
225
2 Correction Pen
- 22 ml. bottle
- Extra fine point correction tip for extra
precision
- Quick-drying and non-clogging
- Super smooth coverage Ozone safe
box 270
3 Post-it Note
- Size: 2"x3" pack
109

109
No. Item Picture Detail Units Price per
unit (Baht)
4 Folder
- Hard cover with graphic pattern and
corrosion-resistant, Nickel clip for extra
durability
- Strength and
- Durability with reinforced gussets
- 6/pack, 4 packs/box
packs 329
5 Time Card
- Standard Time Card 100/pk
pack 118
6 Highlighter
- 2-5 mm.
- Ideal for plain paper or fax paper
- Large ink supply for longer writing over
450m.
Color: blue, green, yellow, pink, orange
box 204
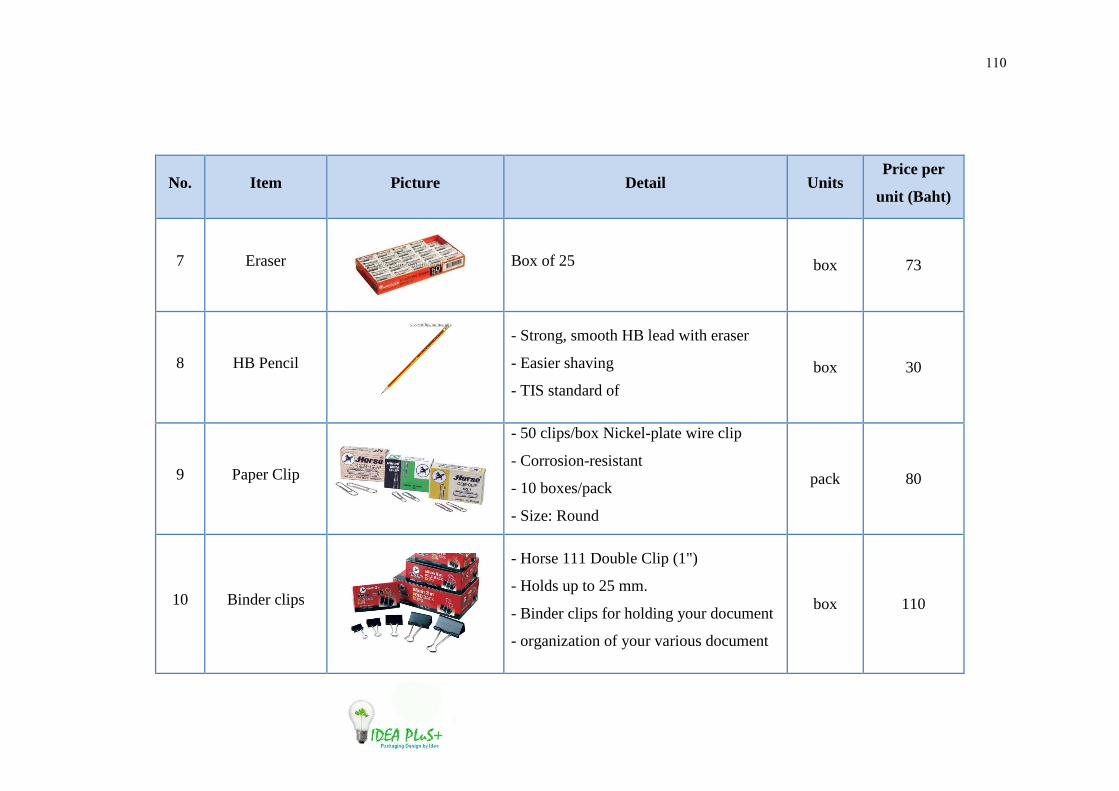
110
No. Item Picture Detail Units Price per
unit (Baht)
7 Eraser
Box of 25 box 73
8 HB Pencil
- Strong, smooth HB lead with eraser
- Easier shaving
- TIS standard of
box 30
9 Paper Clip
- 50 clips/box Nickel-plate wire clip
- Corrosion-resistant
- 10 boxes/pack
- Size: Round
pack 80
10 Binder clips
- Horse 111 Double Clip (1")
- Holds up to 25 mm.
- Binder clips for holding your document
- organization of your various document
box 110

111
No. Item Picture Detail Units Price per
unit (Baht)
11 A4 Paper
- A4 (210x297 mm.) , 80 gsm.
- Smooth surface
- 5000 sheets/ream,
- 5 reams/case
case 407
12 Stapler
- High-quality steel construction
- Compatible with staple no. 10
- Staples up to 18 sheets 50-staple
loaded
item 39
13 Quick Rubber
Stamp
- Self-inking stamp
- Clear impression
- Refillable All-day cap less without
drying
- Various stamps’ types - ������ก ����� ����� �ก���ก ���� � �������
item 99

112
No. Item Picture Detail Units Price per
unit (Baht)
14 Staple
- Max 10-1M, for small stapler
- Staples up to 25 sheets
- 24 boxes/pack
pack 95
15 Paper Punch
- Made from durable metal construction
- Punches up to 25 sheets
- Adjustable paper guide
- Dimensions: 10.5x9.7x8.7 cm.
item 148
16 Scissors
- Quality stainless steel cutter with color
plastic handle
- 8.5" Body Orange
item 30
17 Cutter
- Corrosion-resistant
- stainless-steel construction with ABS
reinforced body
- Blade pocket
item 29

113
No. Item Picture Detail Units Price per
unit (Baht)
18 Cutter Blade
- High-quality steel with extra-sharp
blade
Corrosion-resistant
pack 30
19 Cutting Matt
- 3 mm. thickness quality rubber made
- Ideal for cutting film or paper
- A variety of sizes
- Size: 30x45 cm.(A3)
item 270
20 Bill Rack
- 8" H
- Corrosion-resistant
- Steel rack
- Standard color
item 20
21 Stainless Ruler
- Stainless Ruler 12"
- Made from corrosion-resistant
- Durable steel
item 32

114
No. Item Picture Detail Units Price per
unit (Baht)
22 Fingertip
Moistener
- Moisture for easy filing
- Counting, collating and sorting item 30
23 Organizer Tray
- For organizing stationery e.g. pens,
pencil, etc Easy-to-use
- Tape dispenser for 1" core tape
- Size: 12.5x21x8.5 cm
item 130
24 Document Tray
- 3-tray, Durable plastic construction
- For holding documents
- Contemporary and sleek design
item 190
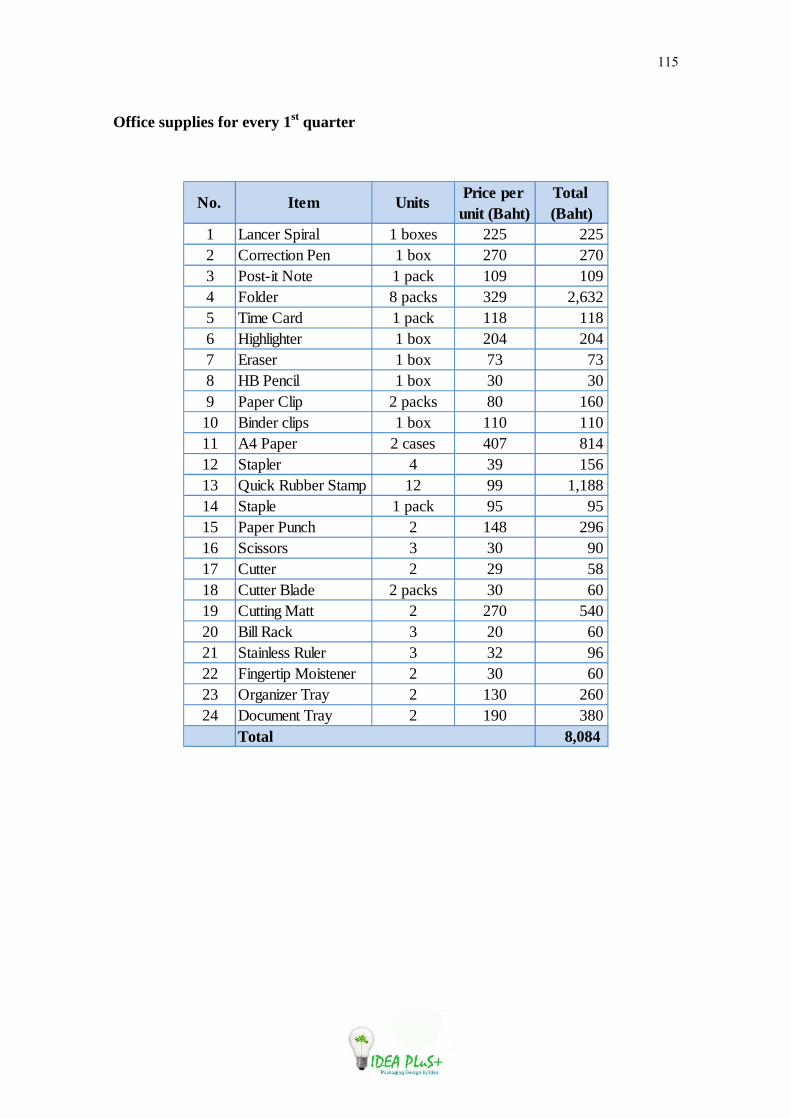
115
Office supplies for every 1st quarter
No. Item UnitsPrice per unit (Baht)
Total (Baht)
1 Lancer Spiral 1 boxes 225 2252 Correction Pen 1 box 270 2703 Post-it Note 1 pack 109 1094 Folder 8 packs 329 2,6325 Time Card 1 pack 118 1186 Highlighter 1 box 204 2047 Eraser 1 box 73 738 HB Pencil 1 box 30 309 Paper Clip 2 packs 80 16010 Binder clips 1 box 110 11011 A4 Paper 2 cases 407 81412 Stapler 4 39 15613 Quick Rubber Stamp 12 99 1,18814 Staple 1 pack 95 9515 Paper Punch 2 148 29616 Scissors 3 30 9017 Cutter 2 29 5818 Cutter Blade 2 packs 30 6019 Cutting Matt 2 270 54020 Bill Rack 3 20 6021 Stainless Ruler 3 32 9622 Fingertip Moistener 2 30 6023 Organizer Tray 2 130 26024 Document Tray 2 190 380
8,084 Total

116
Office supplies for every 2nd, 3rd, and 4th quarter
No. Item UnitsPrice per unit (Baht)
Total (Baht)
1 Lancer Spiral 1 boxes 225 2252 Correction Pen 1 box 270 2703 Post-it Note 1 pack 109 1094 Time Card 1 pack 118 1185 Highlighter 1 box 204 2046 Eraser 1 box 73 737 HB Pencil 1 box 30 308 Paper Clip 2 packs 80 1609 Binder clips 1 box 110 11010 A4 Paper 2 cases 407 81411 Staple 1 pack 95 9512 Cutter 2 29 5813 Cutter Blade 2 packs 30 6014 Fingertip Moistener 2 30 60
2,386 Total
15,242 Total office supplies cost in each year

117
Figure 4.18: Logistics of packaging industry

118
4.1.7 Logistics management
Component of a Customer Order Cycle
Figure 4.19: Component of a Customer Order Cycle
Logistic is defined as a business planning framework for the management of
material, service, information and capital flows. It includes the increasingly complex
information, communication and control systems required in today's business
environment.
Idea Plus Company use logistic for process of planning, implementing, and
controlling the efficient, effective flow and storage of goods, services, and related
information from point of origin to point of consumption for the purpose of conforming
to customer requirements. Logistics’ Idea Plus Company start form customer order,
company has a correct information that customer need such as number of product, style
Customer Retail
Outlet
Customer order
transmittal
Suppliers) factory
Customers
Order
Delivery

119
of product, right time and place for shipment product to customer. Transportation
product, Idea Plus Company use logistic service from Nim See Seng Transport for
shipping our product through customer because Nim See Seng Transport has a good
professional about logistic service. So, Idea Plus Company outsource the logistics
management by contract with Nim See Seng Transport. Then, Idea Plus don’t have to
hold the cost of the vehicle which means we don’t have to buy many cars or truck and
drivers to transport to the customers and don’t need to take the risk or some expense
like fuel cost, maintenance cost, registration and car insurance cost, depreciation and
other more in each year. Thus, outsourcing for Nim See Seng Transport will make the
company pay less expense in shipping the products to customers.
Furthermore, we consider about our suppliers which are not only King Carton
Company, but also CK Carton which allocate around Au-Mong district, Lamphun
province. They produce paper and paper boxes by them which quite famous and large
company among the Northern part. And Lampang Packaging Company Limited who
produce and provide paper boxes which allocate around Munag district, Lampang
province. They produce the corrugated paper, and cardboard paper products which
registration in year 1988. Next, The Box Company Limited who also produce and
provide paper boxes. They allocate around Munag district, Lampang province too, etc.
We consider to seek more suppliers because we want to have the quality products and
protect the over demand to delivery our products in the right place at the right time.
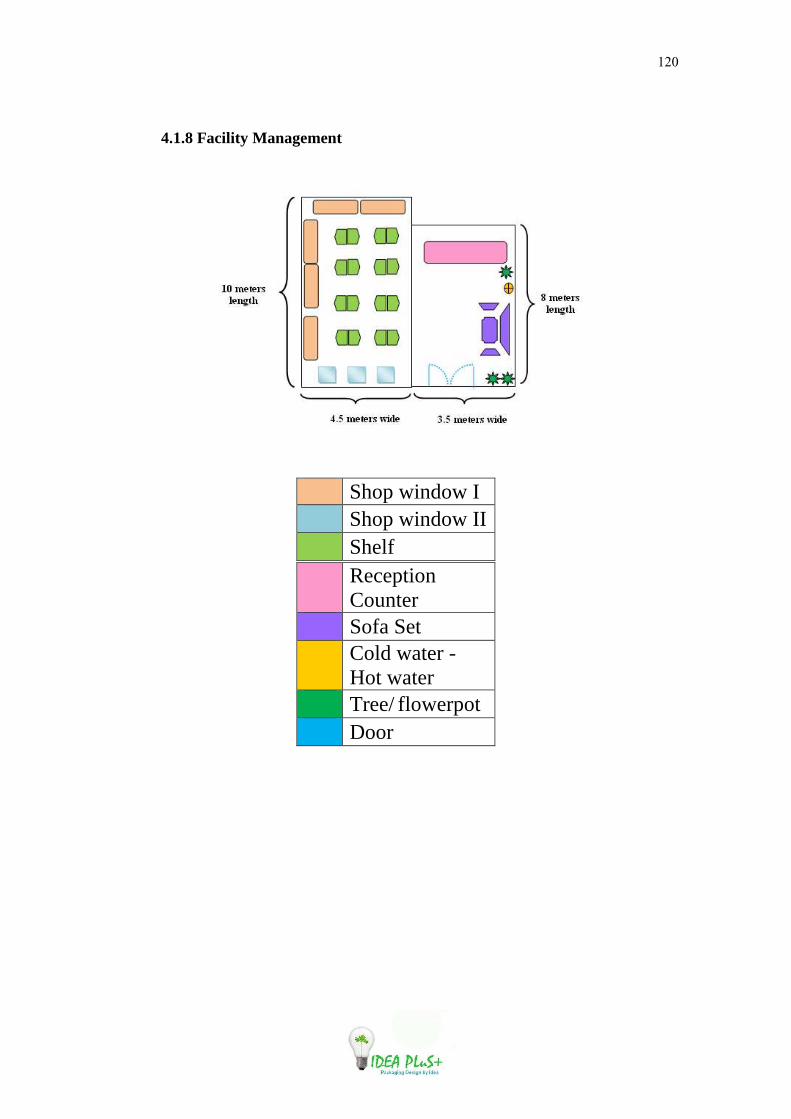
120
4.1.8 Facility Management
Shop window I Shop window II Shelf
Reception Counter
Sofa Set Cold water -
Hot water Tree/ flowerpot Door

121
First
Floor Item Picture Detail Units
Price per
unit (Baht)
Total
(Baht)
First
floor
Receptionist zone
Reception
Counter
- Fully cotton and PVC cushioned seat and back - High-impact plastic arms - Melamine desk with rubble
1 3,5000 3,5000
Desktop PC I
- Intel Celeron Dual-Core E1200 (1.6 GHz), HD: 80 GB (7200rpm) - Ram: 256 MB - Card graphic on board 6 USB 2.0, LAN port, 56k Modem,17 W CRT Combo Drive,512 MB - 1 year warranty
1 11,499 11,499
Telephone
- Ringer Volume Control - 9-station One-Touch - 10-station Two-Touch - Hand-free speaker-phone Flash Redial - Electronic hold on
1 499 499

122
First Floor Item Picture Detail Units Price per
unit (Baht)
Total
(Baht)
First floor
Calculator 16
Digit
- 16-digit, adjustable tilt, large
display
- MU, TAX+,TAX- keys
- IT-Touch (Like a keyboard)
- GT key, delete key
- Dual power: solar and battery
- Dimensions:15.0x19.8x3.8 cm
1 450 450
Cork Board
- Cork surface
- Quality wooden frame
- Bulletin board
W1" x 15mm. thick wooden frame
- Dimensions: 60x90 cm.
1 630 630
Cold water -
Hot water
- Model: SWC-M20HCS
- Cold water - Hot water SANYO 1 5,500 5,500

123
First Floor Item Picture Detail Units Price per
unit (Baht)
Total
(Baht)
First floor
Sofa Set
- Red Sofa
- Sofa set into corner
- Table: Film glass top with steel
chrome-plated construction
- 4 small-seat
- Dimensions: 182x93x80 cm.
1 2,400 2,400
Show Room
Shop window
I
- Size 200 x185 x 50 cm.
- 4 pieces of glass 5 2,000 10,000
Shop window
II
- Color: Cream
- Size: 140 x 200 x 45 cm 3 3,000 9,000

124
First
Floor Item Picture Detail Units
Price per
unit (Baht)
Total
(Baht)
First floor Shelf
- Shelf SP-220
- Color Cream
- Size 92.4x85.1x14mm.
-Sub-shelf Size 89.9x40.3x29 mm
18 600 10,8000
First floor
Additional
Dry Chemical
Fire
Extinguisher
- Warrantee 5 Years
- Description: Common materials
such as paper, wood or most other
combustibles.
- Fire Rating: 2A 2B , 4A 5B and
6A 20B
- Size 10 Lbs.
-Chemical weight 4.50 kg.
-Device weight 3.10 kg.
- Total weight 7.60 kg.
- High 20.00 inch
- Pressure 400 Lbs./inch2
1 1,490 1,490

125
4.2 Cost of Investment
4.2.1 Pre – Operating Cost
1) Company’s name signboard / billboard
Figure 4.20: Company’s name signboard / billboard
For Company’s name signboard would be ordered from Klin See Advertising
shop because they provide installation service. Klin See Advertising shop is located at
Moo.4 Phahon Yothin Road, Wieng Sub-District, Muang District, Chiang Rai. Contact
Mr. Somnuek Srisansai, telephone number: 08-1672-1802, email: [email protected].
The signboard would be light box with white background and letter would be in green.
The letters and picture is made by special sticker which use for outdoor signboard, long
lasting for 5-7 years according to the sun light and the rain. The total size including
background is about 1.5 maters high and 4 maters for wide (not include picture). The
front is settled for 1 mater high. For the picture is settled for 2 meters wide. Total
company’s name signboard is 6 matters wide. The price for company’s name signboards
is 180 baht per square feet, for total is 18,955 baht include installation service.
2) Company’s name signboard tax
Signboard is means board to show the name, the brand name or trademark used
in commercial operations and advertising or activities to earn money and other
revenue. Whether it is ads to show on the material or any picture or mark with letters
written inscription carved or made visible by other means.
Idea plus company name’s signboard is made in Thai and English language
including picture, thus we are according to second kind of signboard which is including
���������
126
the Thai letter mix with foreign language or mix with other pictures or signs, tax rate
would be 20 bath per 500 square centimeters. For Idea Plus’s signboard size is 90,000
(from 600 cm2 * 150 cm2) square centimeters. Then, signboard tax would be 3,600 baht.
For this matter, the tax will be paid at Department of revenue development,
Bureau of financial, Chiang Rai Sub-district Administration Organization. Telephone
no. 0-5374-2663
3) Document for signboard tax payment
For new installation signboard, the documents for tax payer are as follow:
1) Personal identity card
2) Copy of Household Registration
3) VAT Registration
4) Certificate of partnership
5) License tag, or install a receipt from signboard maker shop
4) Rubber stamp
For rubber stamp, it is required as a significant sign
when for register for Juristic Person. It is the sign to show
the right, privilege and responsibilities of company as
Juristic Person and to stamp on important document in the
sign mane of company. For this rubber stamp, is ordered
from Jumnong -Karnchang shop where is located at 498/9 Chedyord Road, Wieng Sub-
District, Muang District, Chiang Rai. Contact Mr. Worachat Limcharoon, telephone and
fax number is 0-5371-6677 and mobile phone number is 08-1884-4133. In the rubber
stamp is including the mane of company as “Idea Plus packaging” and the logo of the
company to show the customers or seeing person as our logo, our brand to easy to
remember. The size of this stamp wide is 5 centimeters and high is 3.5 centimeters and
the cost is 150 baht per each.
127
5) Registration
5.1) Types of Business Organizations
Limited company is which shareholders enjoy limited liability, i.e. limited to the
remaining unpaid amount, if any, of the par value of their shares. The liability of the
directors, however, may be unlimited if stipulated. Limited company is managed by a
board of directors in accordance with the company's charter and by-laws.
5.2) Company Limited Registration
� The company’s name is: Idea Plus+, located on Phahon Yothin Road, Wiang
sub-district, Muang Chiang Rai district, Chiang Rai.
� Promoters
Company promoters are responsible for registering the company with the
Ministry of Commerce (MOC) and required at least 3 persons singing together. The
promoters must be individuals (not juristic persons) who are 20 years of age or older,
and they must be available to sign documentation during the registration process which
for Idea Plus, the promoter are included five partners as followed:
1. Miss Suratt Sukpueng
2. Miss Pajaree Zongsri
3. Miss Pattarairi Peathong
4. Miss Surarat Ruankaew
5. Miss Ajcharapun Paewkasem
For the resolution of the group, the partners discuss to promote Miss Suratt
Sukpueng to be the board of director which needs to precede the procedures for
establishing a company as the Limited company at Office of Commercial Affairs
Chiang Rai Office.

128
� The company's objectives:
1. For funding the Idea Plus Company Limited
2. Provide the profit for investor and stakeholders
� Total capital investment: is 1,300,000 baht
� The sign the names of the promoters
1. Suratt Sukpueng
2. Pajaree Zongsri
3. Pattarairi Peathong
4. Surarat Ruankaew
5. Ajcharapun Paewkasem
The memorandum registration fee is 50 baht per 100,000 baht of registered
capital. The minimum fee is 500 baht and the maximum fee is 25,000 baht. Although
there are no minimum capital requirements, the amount of capital should be respectable
and adequate for the intended business operation.
For register for company limited’s establishment fee is 500 baht per 100,000
baht of registered capital. The minimum fee is 500 baht and the maximum fee is 25,000.
For Idea Plus, total fee for memorandum and company limited registration is
1,750 baht. (The fee rate for registering company limited is in appendix)
6) Benefit Divided
For stakeholders and investors in Idea Plus will benefit from this investment.
These people will get benefit return from investment which will come from income of
company. Idea Plus divides income in to 3 parts which the first is for principle and 15%
interest investors. After pay interest for investor the money will be allocated 55% for
promoters or shareholders equally and another 45% is for company to maintain liquidity
in invest in next year in company.

129
7) Telephone installation
For telephone, we contact with TT & T Center in Sri sai moon, Chiang Rai for
installation. The TT&T office is located at 110/3 Moo11 Nongbua Road, Robciang Sub-
District, Muang Distric, Chiang rai Telephone number at the office is 0-5374-7003-4.
The documents for telephone installation for justice person are as follow:
1) A copy of a certificate of justice person, not exceeding 90 days
2) A copy of identification card of authorized representative signing entity.
3) If you need to authorize to representative of the company, the copy of ID card
of authorized person is required
4.) Company seal and signed copy of a valid certificate.
Payment in installation: in case of including install internal electric line in the
building
Details Price (baht) Cost of setting from telephone exchange to Telephone
Arrester Box 3,350
VAT 7% 234.50
Costs of Telephone Arrester Box 100
Costs of install internal electric line in the building 320
Total 4004.5
Note** to install the phone calls, the distance must be distributed no more than
300 meters. If the distance is more than 300 meters, it will be cost 350 baht for each 50
meters. (The last distance, if less than 25 meters will not be charged).
But the distance is no more than 300 meters because we have the near electric
line such as Taweeheng, Porncharoen mirror and St. Peter hospital, then Idea Plus does
not need to pay more for charge in addition.

130
8) Internet installation
For internet, use the service and installed the internet by TT & T which serve
Maxnet Broadband Internet at center service in Sri sai moon, Chiang Rai for
installation. The TT&T office is located at 110/3 Moo11 Nongbua Road, Robciang Sub-
District, Muang Distric, Chiang rai Telephone number at the office is 0-5374-7003-4,
similar to installation of the phone call.
The internet package that we choose is 3BB Indy- Indy 4 Mb. Speed is 4096/512
kbps and the price is 590 baht per month (not include VAT). For this package, there are
no fees for register; installation; arrester tools and installation internal electric line, all of
these are free but need for 1 month prepaid.
Total Pre-Operating Cost
No. Detail Cost1 Company's Signboard 18955.002 Signboard tax 3,600.00 3 Rubber stamp 150.00 4 Registration fee 7,150.00 5 Telephone installation 4,004.50 6 Internet installation* -
Total 33,859.50
* No installation fee but need 1 month prepaid which is 590 baht per month plus
VAT 7%, thus equal to 631.30 baht.
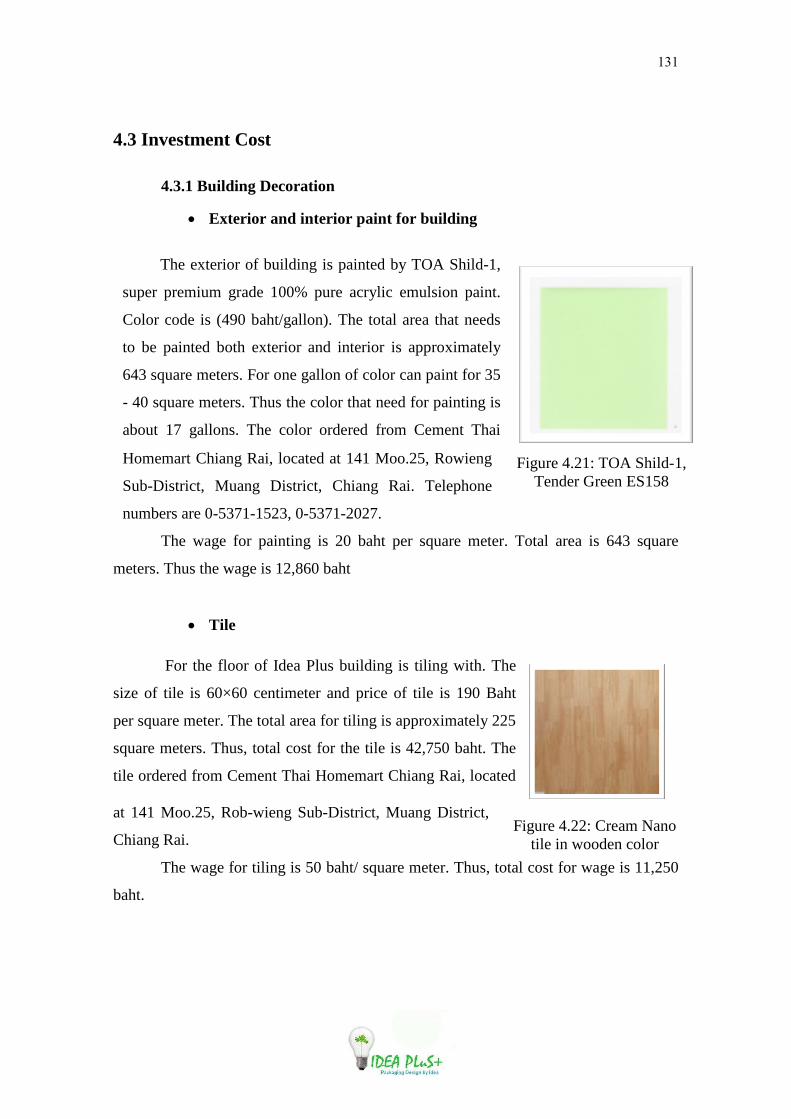
131
Figure 4.21: TOA Shild-1, Tender Green ES158
Figure 4.22: Cream Nano tile in wooden color
4.3 Investment Cost
4.3.1 Building Decoration
• Exterior and interior paint for building
The exterior of building is painted by TOA Shild-1,
super premium grade 100% pure acrylic emulsion paint.
Color code is (490 baht/gallon). The total area that needs
to be painted both exterior and interior is approximately
643 square meters. For one gallon of color can paint for 35
- 40 square meters. Thus the color that need for painting is
about 17 gallons. The color ordered from Cement Thai
Homemart Chiang Rai, located at 141 Moo.25, Rowieng
Sub-District, Muang District, Chiang Rai. Telephone
numbers are 0-5371-1523, 0-5371-2027.
The wage for painting is 20 baht per square meter. Total area is 643 square
meters. Thus the wage is 12,860 baht
• Tile
For the floor of Idea Plus building is tiling with. The
size of tile is 60×60 centimeter and price of tile is 190 Baht
per square meter. The total area for tiling is approximately 225
square meters. Thus, total cost for the tile is 42,750 baht. The
tile ordered from Cement Thai Homemart Chiang Rai, located
at 141 Moo.25, Rob-wieng Sub-District, Muang District,
Chiang Rai.
The wage for tiling is 50 baht/ square meter. Thus, total cost for wage is 11,250
baht.

132
• Aluminum mirror installation
The Aluminum mirror will be installed for frontal of the building. The
thickness of the mirror is 5 mm for approximately 24 square meters and 2 meters wide
for the swing door. Another installation is for interior of building and window which are
approximately 20 square meters. The cost for installation of mirror is 5,000 per square
meter including UPVC and service. Thus, total cost is 230,000 baht. The aluminuim
mirror will be provided by HEVTA Engineering Team which located at 35/183 moo.2,
Ekachai--Bangbon Rd., Bangkok. Contact at HEVTA Call Center: 085-0707990 (-1)
and email is [email protected]
Decoration CostColor cost 8,330 Wage for painting 12,860
Tile 42,750 Wage for tiling 11,250 Aluminum mirror installation 230,000
Total 305,190

133
4.3.2 Tools and Equipments
Floor Zone No. Item UnitsPrice per
unit (Baht)Total (Baht)
1 Reception Counter 1 35,000 35,0002 Desktop PC I 1 11,499 11,4993 Telephone 1 499 4994 Calculator 16 Digit 1 450 4505 Cork Board 1 630 6306 Cold water - Hot water 1 5500 5,5007 Sofa Set 1 2,400 2,4008 Shop window I 5 2,000 10,0009 Shop window II 3 3,000 9,00010 Shelf 18 600 10,800
Additional 11Dry Chemical Fire Extinguisher
1 1,490 1,490
First floor
Receptionist zone
Show Room
12 Office Desk Set 4 4,700 18,80013 Desktop PC I 4 11,499 45,99614 Telephone 4 499 1,99615 Calculator 16 Digit 3 450 1,35016 Office Partition 20 1,400 28,00017 Cork Board 2 631 1,26218 Drawing Table 1 3,500 3,50019 File cabinet 7 3,190 22,33020 Multi-function Laser 1 6,990 6,99021 Shop window I 2 2,000 4,00031 Manager Chair 2 4,100 8,20032 File cabinet 2 3,190 6,38033 Telephone 2 499 99834 Desktop PC I 2 11,499 22,998
Office zone
Board of Director and
General Manger Room
Second floor

134
Floor Zone No. Item UnitsPrice per
unit (Baht)Total (Baht)
22 Office Meeting Set 1 14,090 14,09023 Computer Desk 1 950 95024 Blinds 1 3,390 3,39025 Desktop PC I 1 11,499 11,49926 Cold water - Hot water 1 5500 5,50027 Microwave 1 2190 2,19028 Kitchen cabinet 1 2800 2,80029 Refrigerator 1 5,490 5,49030 Dining Table 2 3,500 7,000
Additional 35Dry Chemical Fire Extinguisher
1 1,490 1,490
Warehousing 36 Plastic Pallet 10 400 4,000
Additional 37Dry Chemical Fire Extinguisher
1 1,490 1,490
Total equipments cost 319,957
Second floor Common
Room
Third floor
Meeting Room

135
• Office Supplies
No. Item UnitsPrice per
unit (Baht)Total (Baht)
1 Lancer Spiral 1 boxes 225 2252 Correction Pen 1 box 270 2703 Post-it Note 1 pack 109 1094 Folder 8 packs 329 2,6325 Time Card 1 pack 118 1186 Highlighter 1 box 204 2047 Eraser 1 box 73 738 HB Pencil 1 box 30 309 Paper Clip 2 packs 80 16010 Binder clips 1 box 110 11011 A4 Paper 2 cases 407 81412 Stapler 4 39 15613 Quick Rubber Stamp 12 99 1,18814 Staple 1 pack 95 9515 Paper Punch 2 148 29616 Scissors 3 30 9017 Cutter 2 29 5818 Cutter Blade 2 packs 30 6019 Cutting Matt 2 270 54020 Bill Rack 3 20 6021 Stainless Ruler 3 32 9622 Fingertip Moistener 2 30 6023 Organizer Tray 2 130 26024 Document Tray 2 190 380
8,084 Total
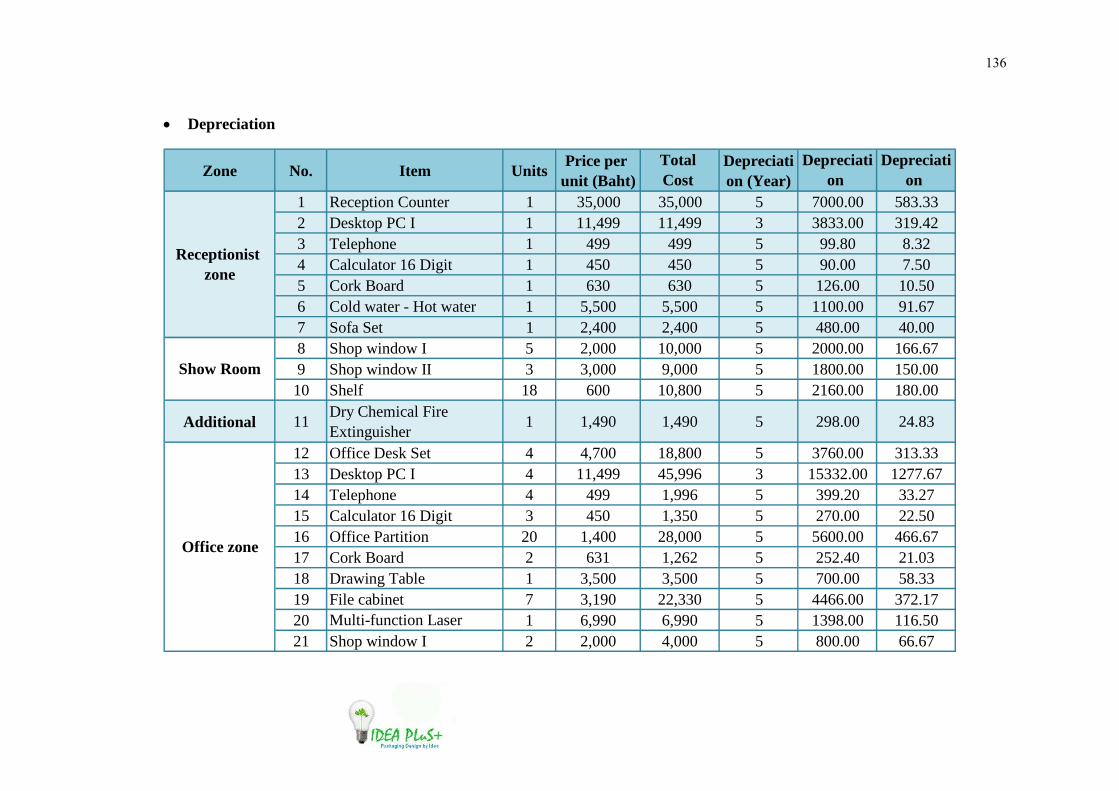
136
• Depreciation
Zone No. Item UnitsPrice per
unit (Baht)Total Cost
Depreciation (Year)
Depreciation
Depreciation
1 Reception Counter 1 35,000 35,000 5 7000.00 583.332 Desktop PC I 1 11,499 11,499 3 3833.00 319.423 Telephone 1 499 499 5 99.80 8.324 Calculator 16 Digit 1 450 450 5 90.00 7.505 Cork Board 1 630 630 5 126.00 10.506 Cold water - Hot water 1 5,500 5,500 5 1100.00 91.677 Sofa Set 1 2,400 2,400 5 480.00 40.008 Shop window I 5 2,000 10,000 5 2000.00 166.679 Shop window II 3 3,000 9,000 5 1800.00 150.0010 Shelf 18 600 10,800 5 2160.00 180.00
Additional 11Dry Chemical Fire Extinguisher
1 1,490 1,490 5 298.00 24.83
12 Office Desk Set 4 4,700 18,800 5 3760.00 313.3313 Desktop PC I 4 11,499 45,996 3 15332.00 1277.6714 Telephone 4 499 1,996 5 399.20 33.2715 Calculator 16 Digit 3 450 1,350 5 270.00 22.5016 Office Partition 20 1,400 28,000 5 5600.00 466.6717 Cork Board 2 631 1,262 5 252.40 21.0318 Drawing Table 1 3,500 3,500 5 700.00 58.3319 File cabinet 7 3,190 22,330 5 4466.00 372.1720 Multi-function Laser 1 6,990 6,990 5 1398.00 116.5021 Shop window I 2 2,000 4,000 5 800.00 66.67
Receptionist zone
Show Room
Office zone

137
Zone No. Item UnitsPrice per
unit (Baht)Total Cost
Depreciation (Year)
Depreciation
Depreciation
31 Manager Chair 2 4,100 8,200 5 1640.00 136.6732 File cabinet 2 3,190 6,380 5 1276.00 106.3333 Telephone 2 499 998 5 199.60 16.6334 Desktop PC I 2 11,499 22,998 3 7666.00 638.8322 Office Meeting Set 1 14,090 14,090 5 2818.00 234.8323 Computer Desk 1 950 950 5 190.00 15.8324 Blinds 1 3,390 3,390 5 678.00 56.5025 Desktop PC I 1 11,499 11,499 3 3833.00 319.4226 Cold water - Hot water 1 5,500 5,500 5 1100.00 91.6727 Microwave 1 2,190 2,190 5 438.00 36.5028 Kitchen cabinet 1 2,800 2,800 5 560.00 46.6729 Refrigerator 1 5,490 5,490 5 1098.00 91.5030 Dining Table 2 3,500 7,000 5 1400.00 116.67
Additional 35Dry Chemical Fire Extinguisher
1 1,490 1,490 5 298.00 24.83
Warehousing 36 Plastic Pallet 10 400 4,000 5 800.00 66.67
Additional 37Dry Chemical Fire Extinguisher
1 1,490 1,490 5 298.00 24.83
Total 319,957 76257.00 6354.75
Meeting Room
Common Room
Board of Director and
General Manger Room

138
Depreciation Year1
Zone No. Item UnitsTotal Cost
(Baht)Jan Feb Mar Apr May Jun Jul Aug Sep Oct Nov Dec Total
1 Reception Counter 1 35,000 583.33 583.33 583.33 583.33 583.33 583.33 583.33 583.33 583.33 583.33 583.33 583.33 7,000.00 2 Desktop PC I 1 11,499 319.42 319.42 319.42 319.42 319.42 319.42 319.42 319.42 319.42 319.42 319.42 319.42 3,833.00 3 Telephone 1 499 8.32 8.32 8.32 8.32 8.32 8.32 8.32 8.32 8.32 8.32 8.32 8.32 99.80 4 Calculator 16 Digit 1 450 7.50 7.50 7.50 7.50 7.50 7.50 7.50 7.50 7.50 7.50 7.50 7.50 90.00 5 Cork Board 1 630 10.50 10.50 10.50 10.50 10.50 10.50 10.50 10.50 10.50 10.50 10.50 10.50 126.00
6Cold water - Hot water
1 5,500 91.67 91.67 91.67 91.67 91.67 91.67 91.67 91.67 91.67 91.67 91.67 91.67 1,100.00
7 Sofa Set 1 2,400 40.00 40.00 40.00 40.00 40.00 40.00 40.00 40.00 40.00 40.00 40.00 40.00 480.00 8 Shop window I 5 10,000 166.67 166.67 166.67 166.67 166.67 166.67 166.67 166.67 166.67 166.67 166.67 166.67 2,000.00 9 Shop window II 3 9,000 150.00 150.00 150.00 150.00 150.00 150.00 150.00 150.00 150.00 150.00 150.00 150.00 1,800.00 10 Shelf 18 10,800 180.00 180.00 180.00 180.00 180.00 180.00 180.00 180.00 180.00 180.00 180.00 180.00 2,160.00
Additional 11Dry Chemical Fire Extinguisher
1 1,490 24.83 24.83 24.83 24.83 24.83 24.83 24.83 24.83 24.83 24.83 24.83 24.83 298.00
12 Office Desk Set 4 18,800 313.33 313.33 313.33 313.33 313.33 313.33 313.33 313.33 313.33 313.33 313.33 313.33 3,760.00 13 Desktop PC I 4 45,996 1,277.67 1,277.67 1,277.67 1,277.67 1,277.67 1,277.67 1,277.67 1,277.67 1,277.67 1,277.67 1,277.67 1,277.67 15,332.00 14 Telephone 4 1,996 33.27 33.27 33.27 33.27 33.27 33.27 33.27 33.27 33.27 33.27 33.27 33.27 399.20 15 Calculator 16 Digit 3 1,350 22.50 22.50 22.50 22.50 22.50 22.50 22.50 22.50 22.50 22.50 22.50 22.50 270.00 16 Office Partition 20 28,000 466.67 466.67 466.67 466.67 466.67 466.67 466.67 466.67 466.67 466.67 466.67 466.67 5,600.00 17 Cork Board 2 1,262 21.03 21.03 21.03 21.03 21.03 21.03 21.03 21.03 21.03 21.03 21.03 21.03 252.40 18 Drawing Table 1 3,500 58.33 58.33 58.33 58.33 58.33 58.33 58.33 58.33 58.33 58.33 58.33 58.33 700.00 19 File cabinet 7 22,330 372.17 372.17 372.17 372.17 372.17 372.17 372.17 372.17 372.17 372.17 372.17 372.17 4,466.00
20Multi-function Laser Printer
1 6,990 116.50 116.50 116.50 116.50 116.50 116.50 116.50 116.50 116.50 116.50 116.50 116.50 1,398.00
21 Shop window I 2 4,000 66.67 66.67 66.67 66.67 66.67 66.67 66.67 66.67 66.67 66.67 66.67 66.67 800.00 31 Manager Chair 2 8,200 136.67 136.67 136.67 136.67 136.67 136.67 136.67 136.67 136.67 136.67 136.67 136.67 1,640.00 32 File cabinet 2 6,380 106.33 106.33 106.33 106.33 106.33 106.33 106.33 106.33 106.33 106.33 106.33 106.33 1,276.00 33 Telephone 2 998 16.63 16.63 16.63 16.63 16.63 16.63 16.63 16.63 16.63 16.63 16.63 16.63 199.60 34 Desktop PC I 2 22,998 638.83 638.83 638.83 638.83 638.83 638.83 638.83 638.83 638.83 638.83 638.83 638.83 7,666.00 22 Office Meeting Set 1 14,090 234.83 234.83 234.83 234.83 234.83 234.83 234.83 234.83 234.83 234.83 234.83 234.83 2,818.00 23 Computer Desk 1 950 15.83 15.83 15.83 15.83 15.83 15.83 15.83 15.83 15.83 15.83 15.83 15.83 190.00 24 Blinds 1 3,390 56.50 56.50 56.50 56.50 56.50 56.50 56.50 56.50 56.50 56.50 56.50 56.50 678.00 25 Desktop PC I 1 11,499 319.42 319.42 319.42 319.42 319.42 319.42 319.42 319.42 319.42 319.42 319.42 319.42 3,833.00
26Cold water - Hot water
1 5,500 91.67 91.67 91.67 91.67 91.67 91.67 91.67 91.67 91.67 91.67 91.67 91.67 1,100.00
27 Microwave 1 2,190 36.50 36.50 36.50 36.50 36.50 36.50 36.50 36.50 36.50 36.50 36.50 36.50 438.00 28 Kitchen cabinet 1 2,800 46.67 46.67 46.67 46.67 46.67 46.67 46.67 46.67 46.67 46.67 46.67 46.67 560.00 29 Refrigerator 1 5,490 91.50 91.50 91.50 91.50 91.50 91.50 91.50 91.50 91.50 91.50 91.50 91.50 1,098.00 30 Dining Table 2 7,000 116.67 116.67 116.67 116.67 116.67 116.67 116.67 116.67 116.67 116.67 116.67 116.67 1,400.00
Additional 35Dry Chemical Fire Extinguisher
1 1,490 24.83 24.83 24.83 24.83 24.83 24.83 24.83 24.83 24.83 24.83 24.83 24.83 298.00
Warehousing 36 Plastic Pallet 10 4,000 66.67 66.67 66.67 66.67 66.67 66.67 66.67 66.67 66.67 66.67 66.67 66.67 800.00
Additional 37Dry Chemical Fire Extinguisher
1 1,490 24.83 24.83 24.83 24.83 24.83 24.83 24.83 24.83 24.83 24.83 24.83 24.83 298.00
Total 319,957 6,354.75 6,354.75 6,354.75 6,354.75 6,354.75 6,354.75 6,354.75 6,354.75 6,354.75 6,354.75 6,354.75 6,354.75 76,257.00
Office zone
Meeting Room
Common Room
Board of Director and
General Manger Room
Receptionist zone
Show Room

139
Depreciation Year2
Zone No. Item UnitTotal Cost
(Baht)Depre
(Annually)Accu Depre
Savage value
1 Reception Counter 1 35,000 7,000 14,000 21,000 2 Desktop PC I 1 11,499 3,833 7,666 3,833 3 Telephone 1 499 100 200 299 4 Calculator 16 Digit 1 450 90 180 270 5 Cork Board 1 630 126 252 378 6 Cold water - Hot water 1 5,500 1,100 2,200 3,300 7 Sofa Set 1 2,400 480 960 1,440 8 Shop window I 5 10,000 2,000 4,000 6,000 9 Shop window II 3 9,000 1,800 3,600 5,400 10 Shelf 18 10,800 2,160 4,320 6,480
Additional 11Dry Chemical Fire Extinguisher
1 1,490 298 596 894
12 Office Desk Set 4 18,800 3,760 7,520 11,280 13 Desktop PC I 4 45,996 15,332 30,664 15,332 14 Telephone 4 1,996 399 798 1,198 15 Calculator 16 Digit 3 1,350 270 540 810 16 Office Partition 20 28,000 5,600 11,200 16,800 17 Cork Board 2 1,262 252 505 757 18 Drawing Table 1 3,500 700 1,400 2,100 19 File cabinet 7 22,330 4,466 8,932 13,398 20 Multi-function Laser 1 6,990 1,398 2,796 4,194 21 Shop window I 2 4,000 800 1,600 2,400
Receptionist zone
Show Room
Office zone
31 Manager Chair 2 8,200 1,640 3,280 4,920 32 File cabinet 2 6,380 1,276 2,552 3,828 33 Telephone 2 998 200 399 599 34 Desktop PC I 2 22,998 7,666 15,332 7,666
Board of Director and
General Manger Room

140
Depreciation Year2 (continue)
Zone No. Item UnitTotal Cost
(Baht)Depre
(Annually)Accu Depre
Savage value
22 Office Meeting Set 1 14,090 2,818 5,636 8,454 23 Computer Desk 1 950 190 380 570 24 Blinds 1 3,390 678 1,356 2,034 25 Desktop PC I 1 11,499 3,833 7,666 3,833 26 Cold water - Hot water 1 5,500 1,100 2,200 3,300 27 Microwave 1 2,190 438 876 1,314 28 Kitchen cabinet 1 2,800 560 1,120 1,680 29 Refrigerator 1 5,490 1,098 2,196 3,294 30 Dining Table 2 7,000 1,400 2,800 4,200
Additional 35Dry Chemical Fire Extinguisher
1 1,490 298 596 894
Warehousing 36 Plastic Pallet 10 4,000 800 1,600 2,400
Additional 37Dry Chemical Fire Extinguisher
1 1,490 298 596 894
Total 319,957 76,257 152,514 167,443
Meeting Room
Common Room
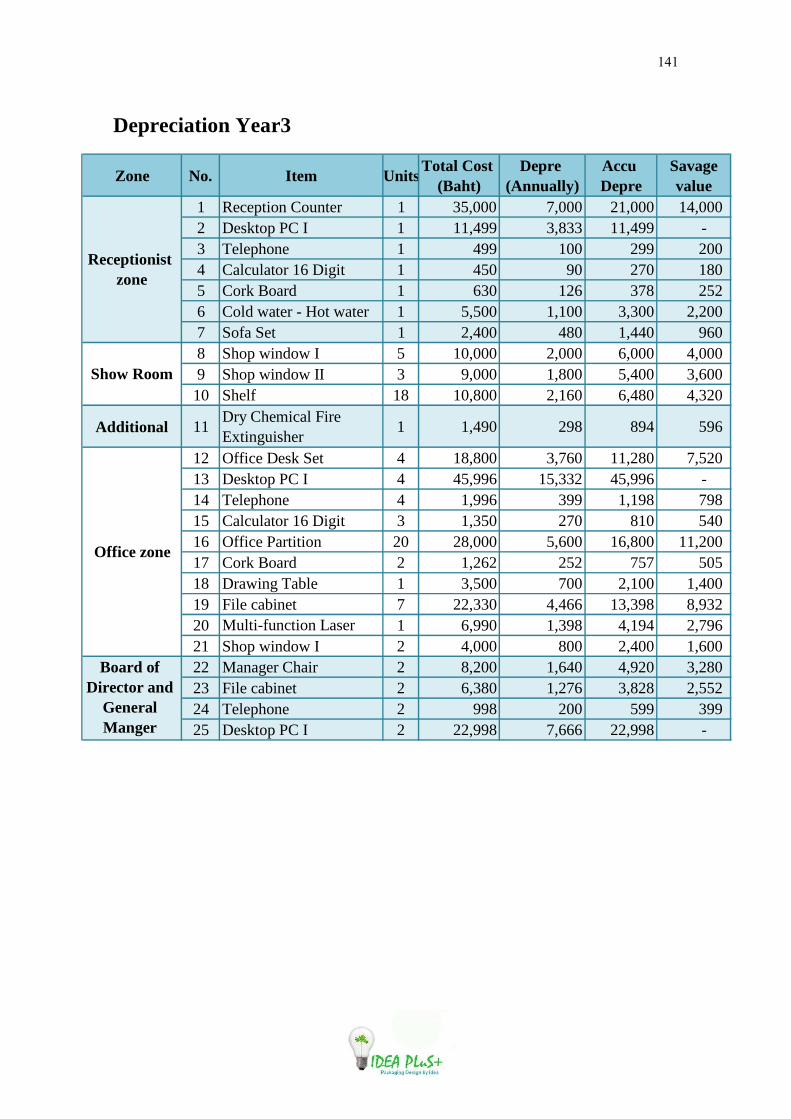
141
Depreciation Year3
Zone No. Item UnitsTotal Cost
(Baht)Depre
(Annually)Accu Depre
Savage value
1 Reception Counter 1 35,000 7,000 21,000 14,000 2 Desktop PC I 1 11,499 3,833 11,499 - 3 Telephone 1 499 100 299 200 4 Calculator 16 Digit 1 450 90 270 180 5 Cork Board 1 630 126 378 252 6 Cold water - Hot water 1 5,500 1,100 3,300 2,200 7 Sofa Set 1 2,400 480 1,440 960 8 Shop window I 5 10,000 2,000 6,000 4,000 9 Shop window II 3 9,000 1,800 5,400 3,600 10 Shelf 18 10,800 2,160 6,480 4,320
Additional 11Dry Chemical Fire Extinguisher
1 1,490 298 894 596
12 Office Desk Set 4 18,800 3,760 11,280 7,520 13 Desktop PC I 4 45,996 15,332 45,996 - 14 Telephone 4 1,996 399 1,198 798 15 Calculator 16 Digit 3 1,350 270 810 540 16 Office Partition 20 28,000 5,600 16,800 11,200 17 Cork Board 2 1,262 252 757 505 18 Drawing Table 1 3,500 700 2,100 1,400 19 File cabinet 7 22,330 4,466 13,398 8,932 20 Multi-function Laser 1 6,990 1,398 4,194 2,796 21 Shop window I 2 4,000 800 2,400 1,600 22 Manager Chair 2 8,200 1,640 4,920 3,280 23 File cabinet 2 6,380 1,276 3,828 2,552 24 Telephone 2 998 200 599 399 25 Desktop PC I 2 22,998 7,666 22,998 -
Show Room
Office zone
Board of Director and
General Manger Room
Receptionist zone

142
Depreciation Year3 (continue)
Zone No. Item UnitTotal Cost
(Baht)Depre
(Annually)Accu Depre
Savage value
26 Office Meeting Set 1 14,090 2,818 8,454 5,636 27 Computer Desk 1 950 190 570 380 28 Blinds 1 3,390 678 2,034 1,356 29 Desktop PC I 1 11,499 3,833 11,499 - 30 Cold water - Hot water 1 5,500 1,100 3,300 2,200 31 Microwave 1 2,190 438 1,314 876 32 Kitchen cabinet 1 2,800 560 1,680 1,120 33 Refrigerator 1 5,490 1,098 3,294 2,196 34 Dining Table 2 7,000 1,400 4,200 2,800
Additional 35Dry Chemical Fire Extinguisher
1 1,490 298 894 596
Warehousing 36 Plastic Pallet 10 4,000 800 2,400 1,600
Additional 37Dry Chemical Fire Extinguisher
1 1,490 298 894 596
Total 319,957 76,257 228,771 91,186
Meeting Room
Common Room

143
Depreciation Year4
Zone No. Item UnitTotal Cost
(Baht)Depre
(Annually)Accu Depre
Savage value
1 Reception Counter 1 35,000 7,000 28,000 7,000 2 Desktop PC I 1 11,499 0 0 - 3 Telephone 1 499 100 399 100 4 Calculator 16 Digit 1 450 90 360 90 5 Cork Board 1 630 126 504 126 6 Cold water - Hot water 1 5,500 1,100 4,400 1,100 7 Sofa Set 1 2,400 480 1,920 480 8 Shop window I 5 10,000 2,000 8,000 2,000 9 Shop window II 3 9,000 1,800 7,200 1,800 10 Shelf 18 10,800 2,160 8,640 2,160
Additional 11Dry Chemical Fire Extinguisher
1 1,490 298 1,192 298
12 Office Desk Set 4 18,800 3,760 15,040 3,760 13 Desktop PC I 4 45,996 0 0 - 14 Telephone 4 1,996 399 1,597 399 15 Calculator 16 Digit 3 1,350 270 1,080 270 16 Office Partition 20 28,000 5,600 22,400 5,600 17 Cork Board 2 1,262 252 1,010 252 18 Drawing Table 1 3,500 700 2,800 700 19 File cabinet 7 22,330 4,466 17,864 4,466
20Multi-function Laser Printer
1 6,990 1,398 5,592 1,398
21 Shop window I 2 4,000 800 3,200 800 22 Manager Chair 2 8,200 1,640 6,560 1,640 23 File cabinet 2 6,380 1,276 5,104 1,276 24 Telephone 2 998 200 798 200 25 Desktop PC I 2 22,998 0 0 -
Show Room
Office zone
Board of Director and
General Manger Room
Receptionist zone

144
Depreciation Year4 (continue)
26 Office Meeting Set 1 14,090 2,818 11,272 2,818 27 Computer Desk 1 950 190 760 190 28 Blinds 1 3,390 678 2,712 678 29 Desktop PC I 1 11,499 0 0 - 30 Cold water - Hot water 1 5,500 1,100 4,400 1,100 31 Microwave 1 2,190 438 1,752 438 32 Kitchen cabinet 1 2,800 560 2,240 560 33 Refrigerator 1 5,490 1,098 4,392 1,098 34 Dining Table 2 7,000 1,400 5,600 1,400
Additional 35Dry Chemical Fire Extinguisher
1 1,490 298 1,192 298
Warehousing 36 Plastic Pallet 10 4,000 800 3,200 800
Additional 37Dry Chemical Fire Extinguisher
1 1,490 298 1,192 298
Total 319,957 45,593 182,372 45,593
Meeting Room
Common Room
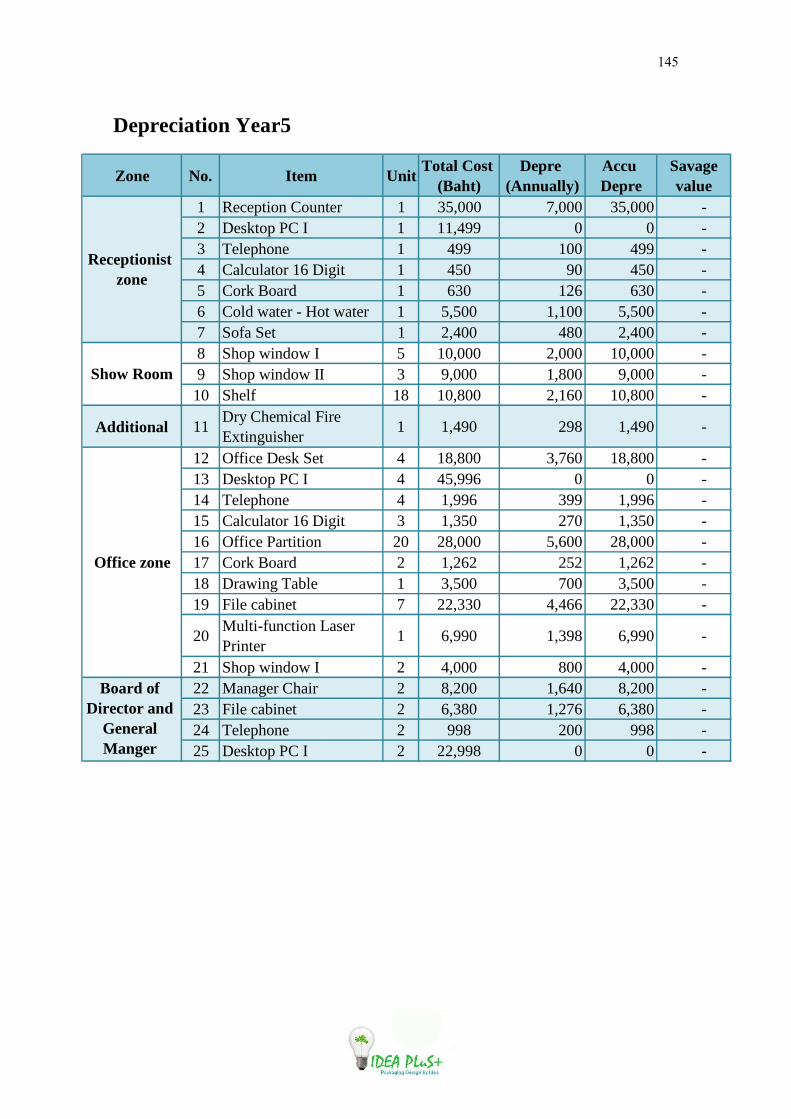
145
Depreciation Year5
Zone No. Item UnitTotal Cost
(Baht)Depre
(Annually)Accu Depre
Savage value
1 Reception Counter 1 35,000 7,000 35,000 - 2 Desktop PC I 1 11,499 0 0 - 3 Telephone 1 499 100 499 - 4 Calculator 16 Digit 1 450 90 450 - 5 Cork Board 1 630 126 630 - 6 Cold water - Hot water 1 5,500 1,100 5,500 - 7 Sofa Set 1 2,400 480 2,400 - 8 Shop window I 5 10,000 2,000 10,000 - 9 Shop window II 3 9,000 1,800 9,000 - 10 Shelf 18 10,800 2,160 10,800 -
Additional 11Dry Chemical Fire Extinguisher
1 1,490 298 1,490 -
12 Office Desk Set 4 18,800 3,760 18,800 - 13 Desktop PC I 4 45,996 0 0 - 14 Telephone 4 1,996 399 1,996 - 15 Calculator 16 Digit 3 1,350 270 1,350 - 16 Office Partition 20 28,000 5,600 28,000 - 17 Cork Board 2 1,262 252 1,262 - 18 Drawing Table 1 3,500 700 3,500 - 19 File cabinet 7 22,330 4,466 22,330 -
20Multi-function Laser Printer
1 6,990 1,398 6,990 -
21 Shop window I 2 4,000 800 4,000 - 22 Manager Chair 2 8,200 1,640 8,200 - 23 File cabinet 2 6,380 1,276 6,380 - 24 Telephone 2 998 200 998 - 25 Desktop PC I 2 22,998 0 0 -
Receptionist zone
Show Room
Office zone
Board of Director and
General Manger Room

146
Depreciation Year5 (continue)
26 Office Meeting Set 1 14,090 2,818 14,090 - 27 Computer Desk 1 950 190 950 - 28 Blinds 1 3,390 678 3,390 - 29 Desktop PC I 1 11,499 0 0 - 30 Cold water - Hot water 1 5,500 1,100 5,500 - 31 Microwave 1 2,190 438 2,190 - 32 Kitchen cabinet 1 2,800 560 2,800 - 33 Refrigerator 1 5,490 1,098 5,490 - 34 Dining Table 2 7,000 1,400 7,000 -
Additional 35Dry Chemical Fire Extinguisher
1 1,490 298 1,490 -
Warehousing 36 Plastic Pallet 10 4,000 800 4,000 -
Additional 37Dry Chemical Fire Extinguisher
1 1,490 298 1,490 -
Total 319,957 45,593 227,965 -
Meeting Room
Common Room

147
4.4 Management Analysis
Idea Plus is the company which registers to be justice person as company limited
with 2,000,000 baht for authorized capital. Limited company is which shareholders
enjoy limited liability. Idea Plus is justice person as company limited, and then
company has to pay income tax
For Idea Plus, there are 5 partnerships in company are as following:
1) Miss Suratt Sukpueng
2) Miss Pajaree Zongsri
3) Miss Pattarairi Peathong
4) Miss Surarat Ruankaew
5) Miss Ajcharapun Paewkasem
All partnerships agree to promote Miss Suratt Sukpueng to be board of director
in Idea Plus Company Limited who is representative or delegate of the company to
register in company limited establishment at Office of Commercial Affairs, Chiang Rai
Office and have authority to sign the name as the Idea Plus company when do the
business with others, moreover, she can check any documents in business operation of
the company.
4.4.1 Organization Management Idea Plus company we work in company as family. We support relationship in
organization, so we try to have activities together among employees in each department
in company such as we provide common room for our employees to let them have lunch
together, aunual party and we also provide social security insurance for our employees.
Moreover we support employees to concern about organization culture. Thus the
company provide company’s Polo-Shirts for employees to wear in Friday similarly. For
this Polo-Shirts, the company provide 2 shirts for each employees annually.

148
• Company’s Polo-Shirt
The shirt will be blue with company logo in the front and company mane and
slogan on the back
Figure 4.23: Company’s Polo-Shirt: Front
• • • • • • • • •
Figure 4.24: Company’s Polo-Shirt: Back
Company Logo
Idea PlusIdea PlusIdea PlusIdea Plus+
Package Design by Idea
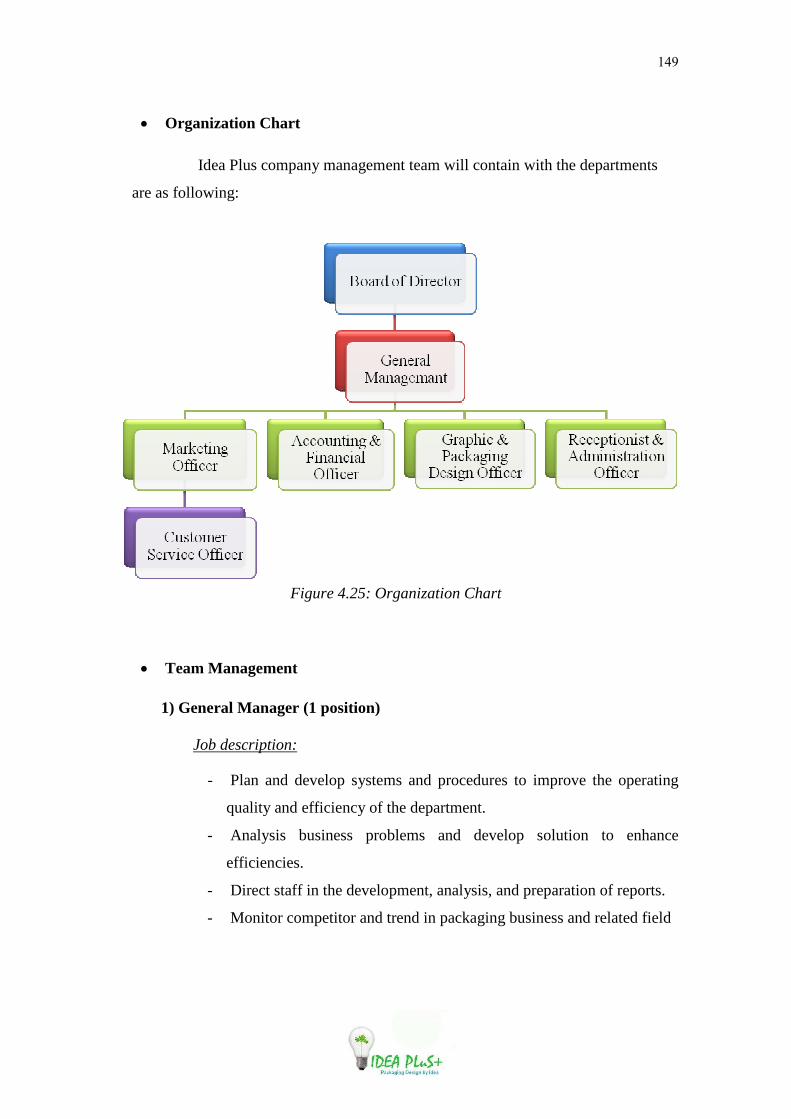
149
• Organization Chart
Idea Plus company management team will contain with the departments
are as following:
Figure 4.25: Organization Chart
• Team Management
1) General Manager (1 position)
Job description:
- Plan and develop systems and procedures to improve the operating
quality and efficiency of the department.
- Analysis business problems and develop solution to enhance
efficiencies.
- Direct staff in the development, analysis, and preparation of reports.
- Monitor competitor and trend in packaging business and related field
150
Qualifications:
- Male/Female, Thai nationality
- Age over 30 years old.
- Bachelor’s Degree or higher in Business Administration or related
field
- Have experience at least 3 years in management working.
- Good command of English and computer literacy
- More knowledge about paper packaging business will be advantage
2) Accounting and financial officer (1 position)
Job description:
- Account payable related to transaction process
- Preparation TAX forms, social security payment , keep record and
clear all account documents, monthly end closing and reporting
- Preparation for monthly financial statement.
- Control cash and budget
- Good at computer literacy
Qualifications:
- Male/Female, Thai nationality
- Age between 25-35 years old
- Bachelor’s Degree in Accounting or Financial with some accounting
background
- At least 1-3 experience in Accounting
- Good command of English and computer literacy
- Computer skill in Microsoft Office and accounting program
- Can work under pressure

151
3) Sale and marketing officer (1 position)
Job description:
- Contributing to and developing marketing plans and strategies
- PR and communications work
- Monitoring competitor activity and customer order
- Maintaining and updating customer databases
- Support customer requirement and contact with customers for new
order
Qualifications:
- Male/Female
- Age over 24 years old
- Bachelor’s Degree in Marketing or related field
- 2 years working experience
- Exhibition organizer is a plus
- Good interpersonal and communication skill
- Good command in English and computer literacy
4) Customer service officer (1 position)
Job description:
- To serve as the main point of contract for customers request and need
- Responsible for answering calls in order
- Willing to build a long-term relationship with the customers
- Checking stock that waiting for receiving by customers
- Give information to customers

152
Qualifications:
- Male
- Age 25 years or older
- Bachelor’s Degree in Marketing, Statistic or related field
- Good command of English and computer literacy
- Strong in inter-personality and supervisory
- Good characteristic and fast learning and service mind
5) Graphic & Packaging Design Officer (1 position)
Job description:
- Design and develop packaging
- Using computer software to execute designs
- Brainstorming and mocking up design ideas
Qualifications:
- Male/Female
- Bachelor's Degree in Arts Graphic or related field.
- Fresh graduated are welcome
- Good knowledge in IT and designing and computer programs such as
Adobe illustrator, Photoshop, Nedgraphic, etc.
- Good command in English
153
6) Reception & Administration officer (1 position)
Job description:
- Answer telephone and provide information to customers
- Greet persons entering organization, taking care of visitor
- General administrative and clerical support
- Maintain appointment diary either manually or electronically
- Communicate and coordinate with internal and external related
departments
- Coordinate between related department
Qualifications:
- Female, 22 years old up
- Need to have service mind and good human relations, good
characteristic and interpersonal
- Bachelor degree
- Good computer literacy
- Good command in English will be advantage
7) House keeper
Job description:
- Prepare rooms for meetings, and arrange decorations, media
equipment, and furniture for social or business functions.
- Replenish supplies and such as drinking glasses, linens, writing
supplies, and bathroom items.
- Clean rooms, hallways, lobbies, lounges, restrooms, corridors,
elevators, stairways, locker rooms and other work areas so that health
standards are met.
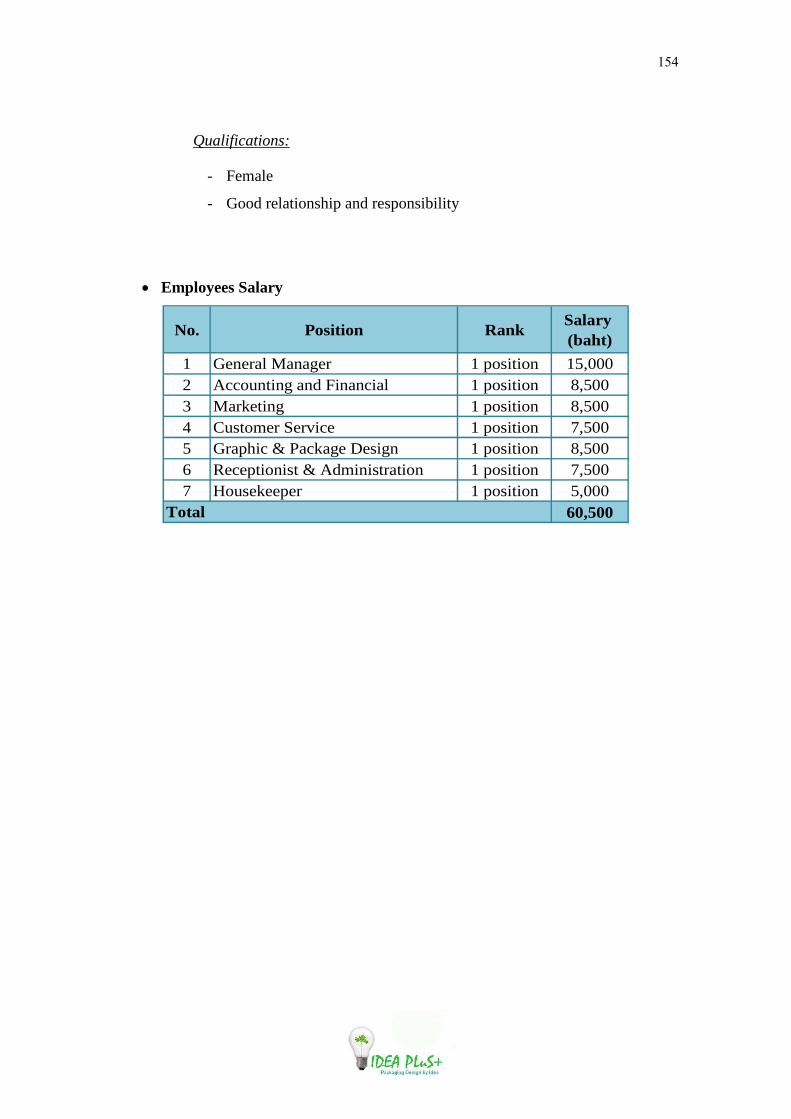
154
Qualifications:
- Female
- Good relationship and responsibility
• Employees Salary
No. Position RankSalary (baht)
1 General Manager 1 position 15,0002 Accounting and Financial 1 position 8,5003 Marketing 1 position 8,5004 Customer Service 1 position 7,5005 Graphic & Package Design 1 position 8,5006 Receptionist & Administration 1 position 7,5007 Housekeeper 1 position 5,000
60,500Total
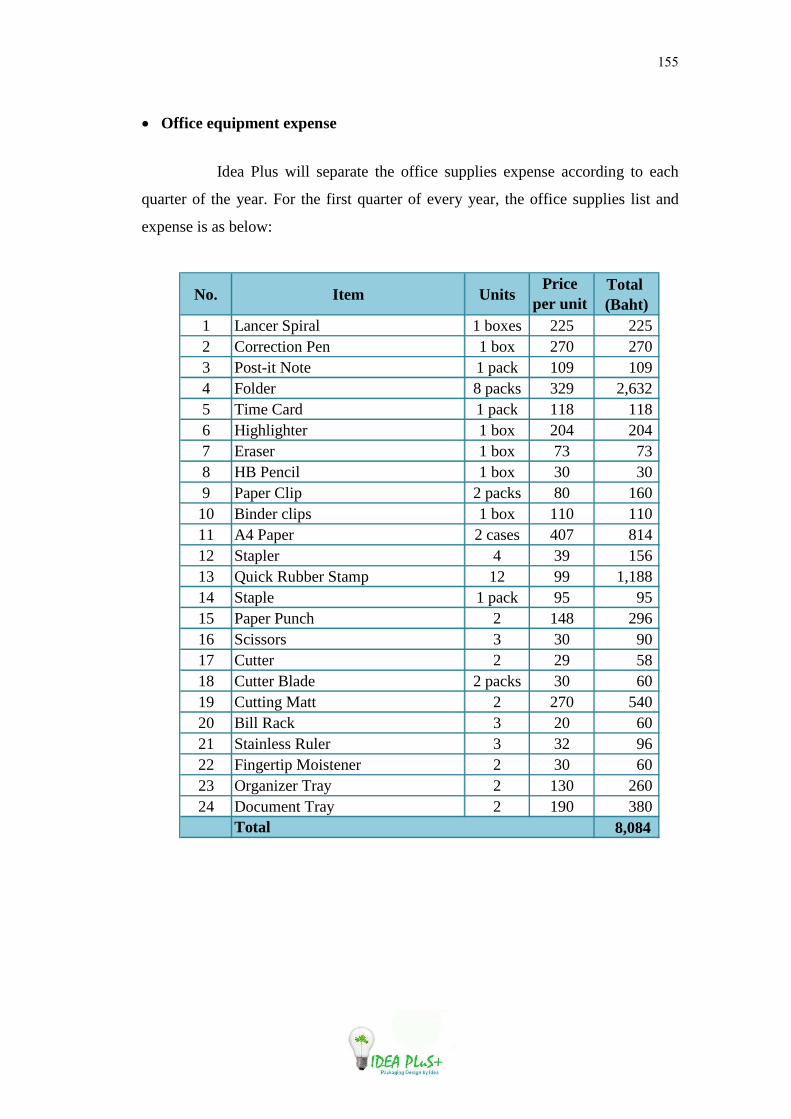
155
• Office equipment expense
Idea Plus will separate the office supplies expense according to each
quarter of the year. For the first quarter of every year, the office supplies list and
expense is as below:
No. Item UnitsPrice
per unit Total (Baht)
1 Lancer Spiral 1 boxes 225 2252 Correction Pen 1 box 270 2703 Post-it Note 1 pack 109 1094 Folder 8 packs 329 2,6325 Time Card 1 pack 118 1186 Highlighter 1 box 204 2047 Eraser 1 box 73 738 HB Pencil 1 box 30 309 Paper Clip 2 packs 80 16010 Binder clips 1 box 110 11011 A4 Paper 2 cases 407 81412 Stapler 4 39 15613 Quick Rubber Stamp 12 99 1,18814 Staple 1 pack 95 9515 Paper Punch 2 148 29616 Scissors 3 30 9017 Cutter 2 29 5818 Cutter Blade 2 packs 30 6019 Cutting Matt 2 270 54020 Bill Rack 3 20 6021 Stainless Ruler 3 32 9622 Fingertip Moistener 2 30 6023 Organizer Tray 2 130 26024 Document Tray 2 190 380
8,084 Total

156
For the second, third and fourth quarter of every year, the office supplies
expense will be as following:
No. Item UnitsPrice
per unit Total (Baht)
1 Lancer Spiral 1 boxes 225 2252 Correction Pen 1 box 270 2703 Post-it Note 1 pack 109 1094 Time Card 1 pack 118 1185 Highlighter 1 box 204 2046 Eraser 1 box 73 737 HB Pencil 1 box 30 308 Paper Clip 2 packs 80 1609 Binder clips 1 box 110 11010 A4 Paper 2 cases 407 81411 Staple 1 pack 95 9512 Cutter 2 29 5813 Cutter Blade 2 packs 30 6014 Fingertip Moistener 2 30 60
2,386 Total
15,242 Total office supplies cost in each year
• Rental Free
The Idea Plus building is 3 floors with 2 boxes building. The area is about 8
meters x 10 meters each floor. The rental for each month is 25,000 baht per month, and
the rental contact is for at least 5 years rent. Moreover, the company has to make a
prepaid payment for 6 months. Then the total rental fee per year is 25,000 x 12=
300,000 baht per year
For following administrative expense, the company estimate as following and would
be increase 10% per year
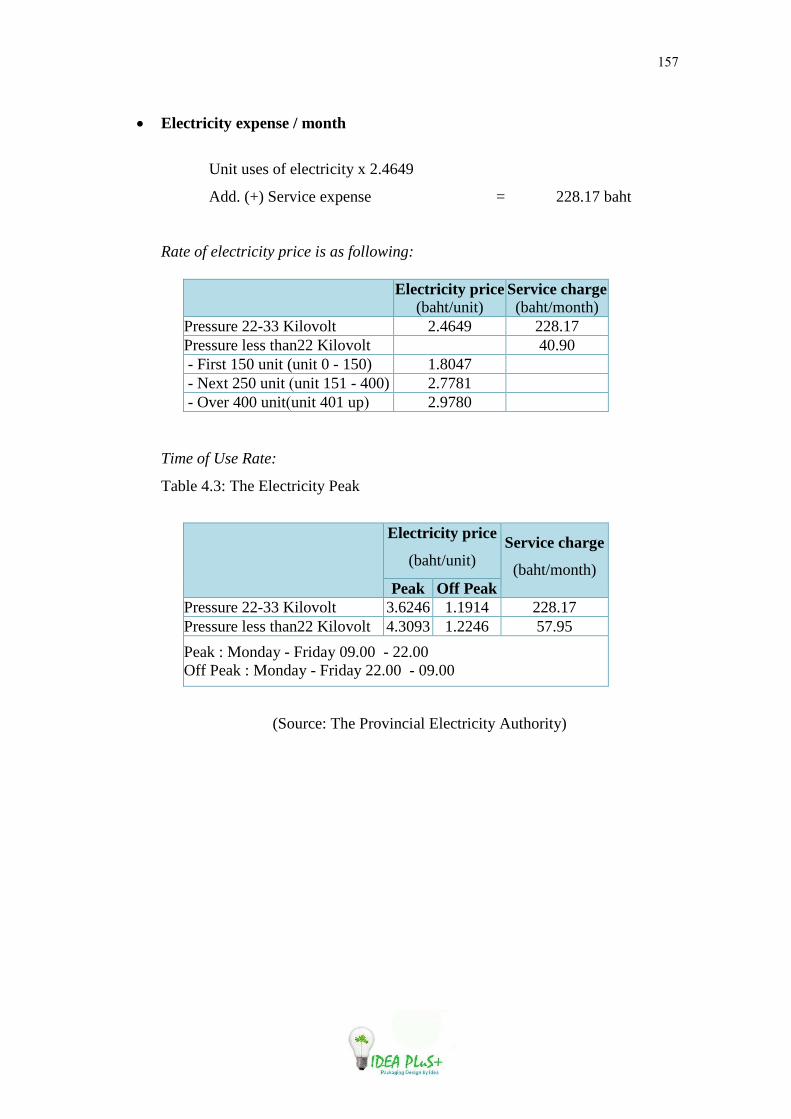
157
• Electricity expense / month
Unit uses of electricity x 2.4649
Add. (+) Service expense = 228.17 baht
Rate of electricity price is as following:
Electricity price (baht/unit)
Service charge (baht/month)
Pressure 22-33 Kilovolt 2.4649 228.17 Pressure less than22 Kilovolt 40.90 - First 150 unit (unit 0 - 150) 1.8047 - Next 250 unit (unit 151 - 400) 2.7781 - Over 400 unit(unit 401 up) 2.9780
Time of Use Rate:
Table 4.3: The Electricity Peak
Electricity price
(baht/unit) Service charge
(baht/month) Peak Off Peak
Pressure 22-33 Kilovolt 3.6246 1.1914 228.17 Pressure less than22 Kilovolt 4.3093 1.2246 57.95
Peak : Monday - Friday 09.00 - 22.00 Off Peak : Monday - Friday 22.00 - 09.00
(Source: The Provincial Electricity Authority)
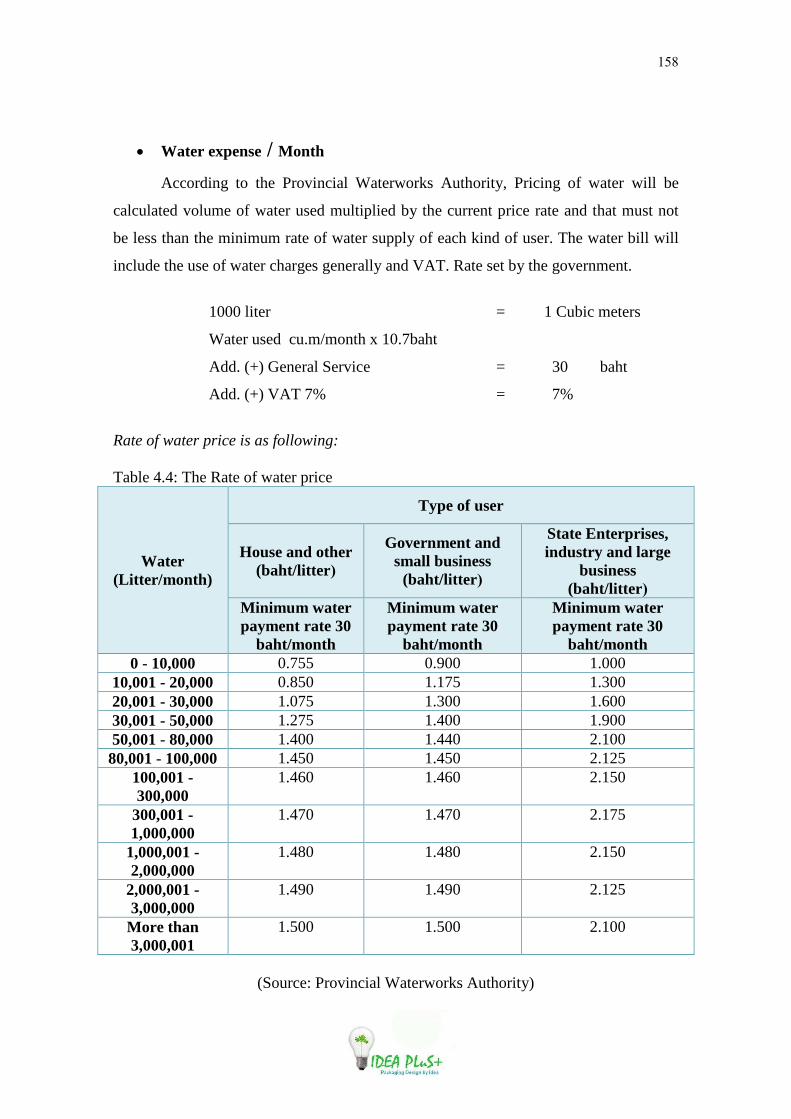
158
• Water expense / Month
According to the Provincial Waterworks Authority, Pricing of water will be
calculated volume of water used multiplied by the current price rate and that must not
be less than the minimum rate of water supply of each kind of user. The water bill will
include the use of water charges generally and VAT. Rate set by the government.
1000 liter = 1 Cubic meters
Water used cu.m/month x 10.7baht
Add. (+) General Service = 30 baht
Add. (+) VAT 7% = 7%
Rate of water price is as following:
Table 4.4: The Rate of water price
Water (Litter/month)
Type of user
House and other (baht/litter )
Government and small business (baht/litter )
State Enterprises, industry and large
business (baht/litter )
Minimum water payment rate 30
baht/month
Minimum water payment rate 30
baht/month
Minimum water payment rate 30
baht/month 0 - 10,000 0.755 0.900 1.000
10,001 - 20,000 0.850 1.175 1.300 20,001 - 30,000 1.075 1.300 1.600 30,001 - 50,000 1.275 1.400 1.900 50,001 - 80,000 1.400 1.440 2.100 80,001 - 100,000 1.450 1.450 2.125
100,001 - 300,000
1.460 1.460 2.150
300,001 - 1,000,000
1.470 1.470 2.175
1,000,001 - 2,000,000
1.480 1.480 2.150
2,000,001 - 3,000,000
1.490 1.490 2.125
More than 3,000,001
1.500 1.500 2.100
(Source: Provincial Waterworks Authority)

159
• TT&T internet and telephone expense/month
Internet expense (include VAT) = 631.50 baht/month
Telephone expense = 1,500 baht/month
Maintenance costs = 100 baht/month
Fax *(2baht/time) = 200 baht/month
Total = 2,431.50 baht/month
For total utility expense is approximately 8,500 baht per month
Administrative expense rate each year is as follows:
Administrative cost Year1 100% Administrative cost Year2 110% Administrative cost Year3 120% Administrative cost Year4 130% Administrative cost Year5 140%

160
Administrative expense Year1
Year 1 Jan Feb Mar Apr May Jun Jul Aug Sep Oct Nov Dec Total General manager salary 15,000 15,000 15,000 15,000 15,000 15,000 15,000 15,000 15,000 15,000 15,000 15,000 180,000Marketing officer salary 8,500 8,500 8,500 8,500 8,500 8,500 8,500 8,500 8,500 8,500 8,500 8,500 102,000Accounting officer salary 8,500 8,500 8,500 8,500 8,500 8,500 8,500 8,500 8,500 8,500 8,500 8,500 102,000Reception and administration officer salary
7,000 7,000 7,000 7,000 7,000 7,000 7,000 7,000 7,000 7,000 7,000 7,000 84,000
Graphic and package designer salary
8,500 8,500 8,500 8,500 8,500 8,500 8,500 8,500 8,500 8,500 8,500 8,500 102,000
Customer service officer salary 7,500 7,500 7,500 7,5007,500 7,500 7,500 7,500 7,500 7,500 7,500 7,500 90,000Housekeeper salary 5,000 5,000 5,000 5,000 5,000 5,000 5,000 5,000 5,000 5,000 5,000 5,000 60,000Social security insurance (per month)
3,000 3,000 3,000 3,000 3,000 3,000 3,000 3,000 3,000 3,000 3,000 3,000 36,000
Office supplies 8,084 0 0 2,386 0 0 2,386 0 0 2,386 0 0 15,242Utility expense 8,500 8,500 8,500 8,500 8,500 8,500 8,500 8,500 8,500 8,500 8,500 8,500 102,000Reatal building (6 month prepaid) 150,000 0 0 0 0 0 25,00025,000 25,000 25,000 25,000 25,000 300,000Fire insurance 2,579 0 0 0 0 0 0 0 0 0 0 0 2,579Administrative Depreciation 6,355 6,355 6,355 6,355 6,355 6,355 6,355 6,355 6,355 6,355 6,355 6,355 76,257 Total adminstrative expense 238,517 77,855 77,855 80,241 77,855 77,855 105,241 102,855 102,855 105,241 102,855 102,855 1,252,078

161
Administrative expense Year 2
Year 2 Jan Feb Mar Apr May Jun Jul Aug Sep Oct Nov Dec Total General manager salary 16,500 16,500 16,500 16,500 16,500 16,500 16,500 16,500 16,500 16,500 16,500 16,500 198,000Marketing officer salary 9,350 9,350 9,350 9,350 9,350 9,350 9,350 9,350 9,350 9,350 9,350 9,350 112,200Accounting officer salary 9,350 9,350 9,350 9,350 9,350 9,350 9,350 9,350 9,350 9,350 9,350 9,350 112,200Reception and administration officer salary
7,700 7,700 7,700 7,700 7,700 7,700 7,700 7,700 7,700 7,700 7,700 7,700 92,400
Graphic and package designer salary
9,350 9,350 9,350 9,350 9,350 9,350 9,350 9,350 9,350 9,350 9,350 9,350 112,200
Customer service officer salary 8,250 8,250 8,250 8,2508,250 8,250 8,250 8,250 8,250 8,250 8,250 8,250 99,000Housekeeper salary 5,500 5,500 5,500 5,500 5,500 5,500 5,500 5,500 5,500 5,500 5,500 5,500 66,000Social security insurance (per month)
3,300 3,300 3,300 3,300 3,300 3,300 3,300 3,300 3,300 3,300 3,300 3,300 39,600
Office supplies 8,892 0 0 2,625 0 0 2,625 0 0 2,625 0 0 16,766Utility expense 9,350 9,350 9,350 9,350 9,350 9,350 9,350 9,350 9,350 9,350 9,350 9,350 112,200Rental building 25,000 25,000 25,000 25,000 25,000 25,00025,000 25,000 25,000 25,000 25,000 25,000 300,000Fire insurance 2,579 0 0 0 0 0 0 0 0 0 0 0 2,579Administrative Depreciation 6,355 6,355 6,355 6,355 6,355 6,355 6,355 6,355 6,355 6,355 6,355 6,355 76,257 Total adminstrative expense 121,476 110,005 110,005 112,629 110,005 110,005 112,629 110,005 110,005 112,629 110,005 110,005 1,339,402
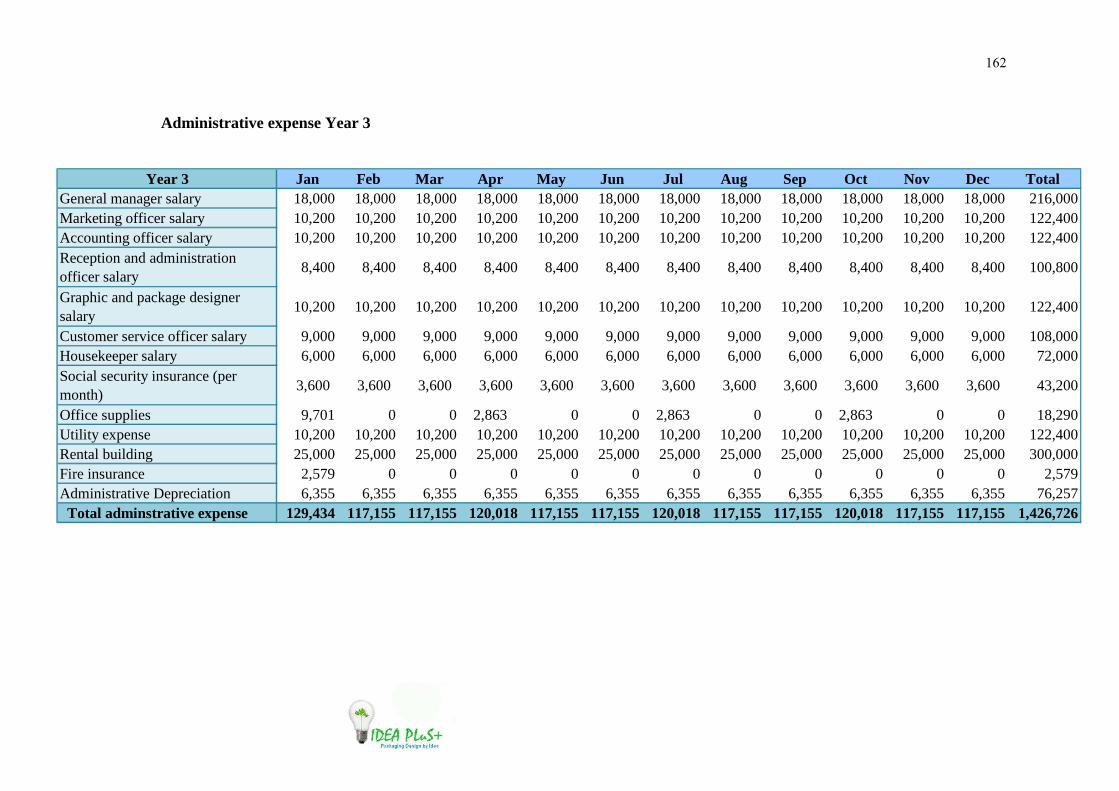
162
Administrative expense Year 3
Year 3 Jan Feb Mar Apr May Jun Jul Aug Sep Oct Nov Dec Total General manager salary 18,000 18,000 18,000 18,000 18,000 18,000 18,000 18,000 18,000 18,000 18,000 18,000 216,000Marketing officer salary 10,200 10,200 10,200 10,200 10,200 10,200 10,200 10,200 10,200 10,200 10,200 10,200 122,400Accounting officer salary 10,200 10,200 10,200 10,200 10,200 10,200 10,200 10,200 10,200 10,200 10,200 10,200 122,400Reception and administration officer salary
8,400 8,400 8,400 8,400 8,400 8,400 8,400 8,400 8,400 8,400 8,400 8,400 100,800
Graphic and package designer salary
10,200 10,200 10,200 10,200 10,200 10,200 10,200 10,200 10,200 10,200 10,200 10,200 122,400
Customer service officer salary 9,000 9,000 9,000 9,0009,000 9,000 9,000 9,000 9,000 9,000 9,000 9,000 108,000Housekeeper salary 6,000 6,000 6,000 6,000 6,000 6,000 6,000 6,000 6,000 6,000 6,000 6,000 72,000Social security insurance (per month)
3,600 3,600 3,600 3,600 3,600 3,600 3,600 3,600 3,600 3,600 3,600 3,600 43,200
Office supplies 9,701 0 0 2,863 0 0 2,863 0 0 2,863 0 0 18,290Utility expense 10,200 10,200 10,200 10,200 10,200 10,20010,200 10,200 10,200 10,200 10,200 10,200 122,400Rental building 25,000 25,000 25,000 25,000 25,000 25,00025,000 25,000 25,000 25,000 25,000 25,000 300,000Fire insurance 2,579 0 0 0 0 0 0 0 0 0 0 0 2,579Administrative Depreciation 6,355 6,355 6,355 6,355 6,355 6,355 6,355 6,355 6,355 6,355 6,355 6,355 76,257 Total adminstrative expense 129,434 117,155 117,155 120,018 117,155 117,155 120,018 117,155 117,155 120,018 117,155 117,155 1,426,726

163
Administrative expense Year 4
Year 4 Jan Feb Mar Apr May Jun Jul Aug Sep Oct Nov Dec Total General manager salary 19,500 19,500 19,500 19,500 19,500 19,500 19,500 19,500 19,500 19,500 19,500 19,500 234,000Marketing officer salary 11,050 11,050 11,050 11,050 11,050 11,050 11,050 11,050 11,050 11,050 11,050 11,050 132,600Accounting officer salary 11,050 11,050 11,050 11,050 11,050 11,050 11,050 11,050 11,050 11,050 11,050 11,050 132,600Reception and administration officer salary
9,100 9,100 9,100 9,100 9,100 9,100 9,100 9,100 9,100 9,100 9,100 9,100 109,200
Graphic and package designer salary
11,050 11,050 11,050 11,050 11,050 11,050 11,050 11,050 11,050 11,050 11,050 11,050 132,600
Customer service officer salary 9,750 9,750 9,750 9,7509,750 9,750 9,750 9,750 9,750 9,750 9,750 9,750 117,000Housekeeper salary 6,500 6,500 6,500 6,500 6,500 6,500 6,500 6,500 6,500 6,500 6,500 6,500 78,000Social security insurance (per month)
3,900 3,900 3,900 3,900 3,900 3,900 3,900 3,900 3,900 3,900 3,900 3,900 46,800
Office supplies 10,509 0 0 3,102 0 0 3,102 0 0 3,102 0 0 19,815Utility expense 11,050 11,050 11,050 11,050 11,050 11,05011,050 11,050 11,050 11,050 11,050 11,050 132,600Rental building 25,000 25,000 25,000 25,000 25,000 25,00025,000 25,000 25,000 25,000 25,000 25,000 300,000Fire insurance 2,579 0 0 0 0 0 0 0 0 0 0 0 2,579Administrative Depreciation 3,799 3,799 3,799 3,799 3,799 3,799 3,799 3,799 3,799 3,799 3,799 3,799 45,593 Total adminstrative expense 134,837 121,749 121,749 124,851 121,749 121,749 124,851 121,749 121,749 124,851 121,749 121,749 1,483,386

164
Administrative expense Year 5
Year 5 Jan Feb Mar Apr May Jun Jul Aug Sep Oct Nov Dec Total General manager salary 21,000 21,000 21,000 21,000 21,000 21,000 21,000 21,000 21,000 21,000 21,000 21,000 252,000Marketing officer salary 11,900 11,900 11,900 11,900 11,900 11,900 11,900 11,900 11,900 11,900 11,900 11,900 142,800Accounting officer salary 11,900 11,900 11,900 11,900 11,900 11,900 11,900 11,900 11,900 11,900 11,900 11,900 142,800Reception and administration officer salary
9,800 9,800 9,800 9,800 9,800 9,800 9,800 9,800 9,800 9,800 9,800 9,800 117,600
Graphic and package designer salary
11,900 11,900 11,900 11,900 11,900 11,900 11,900 11,900 11,900 11,900 11,900 11,900 142,800
Customer service officer salary 10,500 10,500 10,500 10,500 10,500 10,500 10,500 10,500 10,500 10,500 10,500 10,500 126,000Housekeeper salary 7,000 7,000 7,000 7,000 7,000 7,000 7,000 7,000 7,000 7,000 7,000 7,000 84,000Social security insurance (per month)
4,200 4,200 4,200 4,200 4,200 4,200 4,200 4,200 4,200 4,200 4,200 4,200 50,400
Office supplies 11,318 0 0 3,340 0 0 3,340 0 0 3,340 0 0 21,339Utility expense 11,900 11,900 11,900 11,900 11,900 11,90011,900 11,900 11,900 11,900 11,900 11,900 142,800Rental building 25,000 25,000 25,000 25,000 25,000 25,00025,000 25,000 25,000 25,000 25,000 25,000 300,000Fire insurance 2,579 0 0 0 0 0 0 0 0 0 0 0 2,579Administrative Depreciation 3,799 3,799 3,799 3,799 3,799 3,799 3,799 3,799 3,799 3,799 3,799 3,799 45,593 Total adminstrative expense 142,796 128,899 128,899 132,240 128,899 128,899 132,240 128,899 128,899 132,240 128,899 128,899 1,570,711

165
4.5 Technical Feasibility Conclusion
Idea Plus Company Limited is located on Phahon Yothin Road, Wiang sub-
district, Muang Chiang Rai district, Chiang Rai. The nearby shops are Porncharoern
Mirror shop on the left hand side, RN Paint and Taweeheng shop is on the right hand
side and opposite to Dunlop Center. The company provides various packaging design to
the customers. The main products is including the paper box and paper bag packaging
which various design and material, which the customers can choose by themselves from
the catalog such as the graphic design, size, type of paper and color. If not, the customer
can ask for special design for their product which we also provide this service for the
customers. Not only box and bag, Idea Plus also provides the label design and
production for the customers who want to have their brand or label for their own
products. These services we can provide under the good partners for company’s
supplier. Then we can sure to fulfill the customers’ orders because we have not only one
suppliers, we deal with both big company for a big order size such as for some industry
which require paper packaging, and also have a smaller supplier to serve a small order
size which some big company cannot produce in some small order size because they
cannot get the profit. In this matter, those make Idea Plus can provide service for both a
small to quite big business customers
For transportation, we can sure for serve many customers in the same time,
because we provide the effective transportation company that is Nim See Seng which is
a company that gain a big market in the North of Thailand and they know almost of
Chiang Rai and nearby province and they have many truck and car to provide service to
the customers. This will make the company save the cost than by own vehicles to
transport the goods to customers in the same times.
About the management, Idea Plus is register as the company limited with Office
of commercial Affiars Chiangrai, in company there are 7 officers (Board of Director is
exclude) that the company recruit by the qualification and define the job responsibility
to work with Idea Plus company. In company, we have performance evaluation to
motivate the officer to work effectively.

166
Chapter 5
Financial Analysis
For the cost of goods are estimated as follow:
sales 100%
Profit estimated 30%
spend for transportation cost
5%
Cost of goods 70%
Total cost 75% Total profit 25%
Start up
Total investment and expense 899,253
Cash requirement to maintain
liquidity
500,000
Total cash requirement 1,399,253
Loan 2,000,000
Interest (per year) 15%
Interest (per month) 1.25%
Income tax 30%
Total principle and interest 2,300,000
Repayment (years) 3
Repayment (Month) 36
Total principle and interest per
month
63,889

167
Idea Plus Company Income Statement Year1
Year 1 Jan Feb Mar Apr May Jun Jul Aug Sep Oct Nov Dec Total Sales 3,786,500 3,504,500 3,288,076 2,987,260 3,049,255 3,121,580 3,294,682 3,161,864 3,359,472 3,745,700 3,900,864 3,920,571 41,120,324
Cost of goods sold 2,839,875 2,628,375 2,466,057 2,240,445 2,286,941 2,341,185 2,471,012 2,371,398 2,519,604 2,809,275 2,925,648 2,940,429 30,840,243Gross margin 946,625 876,125 822,019 746,815 762,314 780,395 823,671 790,466 839,868 936,425 975,216 980,143 10,280,081Selling expense 0 Sale commission 75,730 70,090 65,762 59,745 60,985 62,432 65,894 63,237 67,189 74,914 78,017 78,411 822,406 Radio local 3,000 3,000 3,000 3,000 3,000 3,000 3,000 3,000 3,000 3,000 3,000 3,000 36,000 Brochure 1,000 0 0 1,000 0 0 1,000 0 0 1,500 0 0 4,500 Plate/Poster/Vinyl 0 0 0 0 9,000 0 0 0 0 15,000 0 15,000 39,000 Souvenir 0 0 0 0 0 0 0 0 0 0 0 10,000 10,000 Public relation 1,000 1,000 1,000 1,000 1,000 1,000 1,000 1,000 1,000 1,000 1,000 1,000 12,000 Website 2,345 0 0 0 0 0 0 0 0 0 0 0 2,345Total selling expense 83,075 74,090 69,762 64,745 73,985 66,432 70,894 67,237 71,189 95,414 82,017 107,411 926,251Administrative Expense General manager salary 15,000 15,000 15,000 15,000 15,000 15,000 15,000 15,000 15,000 15,000 15,000 15,000 180,000 Marketing officer salary 8,500 8,500 8,500 8,500 8,500 8,500 8,500 8,500 8,500 8,500 8,500 8,500 102,000 Accounting officer salary 8,500 8,500 8,500 8,500 8,500 8,500 8,500 8,500 8,500 8,500 8,500 8,500 102,000 Reception and administration officer salary 7,000 7,000 7,000 7,000 7,000 7,000 7,000 7,000 7,000 7,000 7,000 7,000 84,000 Graphic and package designer salary 8,500 8,500 8,500 8,500 8,500 8,500 8,500 8,500 8,500 8,500 8,500 8,500 102,000 Customer service officer salary 7,500 7,500 7,500 7,500 7,500 7,500 7,500 7,500 7,500 7,500 7,500 7,500 90,000 Housekeeper salary 5,000 5,000 5,000 5,000 5,000 5,000 5,000 5,000 5,000 5,000 5,000 5,000 60,000 Social security insurance (per month) 3,000 3,000 3,000 3,000 3,000 3,000 3,000 3,000 3,000 3,000 3,000 3,000 36,000 Office supplies 8,084 0 0 2,386 0 0 2,386 0 0 2,386 0 0 15,242 Utility expense 8,500 8,500 8,500 8,500 8,500 8,500 8,500 8,500 8,500 8,500 8,500 8,500 102,000 Rental (building) 150,000 0 0 0 0 0 25,000 25,000 25,000 25,000 25,000 25,000 300,000 Fire insurance 2,579 0 0 0 0 0 0 0 0 0 0 0 2,579 Administrative Depreciation 6,355 6,355 6,355 6,355 6,355 6,355 6,355 6,355 6,355 6,355 6,355 6,355 76,257 Total adminstrative expense 238,517 77,855 77,855 80,241 77,855 77,855 105,241 102,855102,855 105,241 102,855 102,855 1,252,078Selling and administrative expense 321,592 151,945 147,616 144,986 151,840 144,286 176,134 170,092 174,044 200,655 184,872 210,266 2,178,329 Earning before interest and Tax 625,033 724,180 674,403 601,829 610,474 636,109 647,536 620,374 665,824 735,770 790,344 769,877 8,101,752 Interest and principle loan expense 63,889 63,889 63,889 63,889 63,889 63,889 63,889 63,889 63,889 63,889 63,889 63,889 766,667 Afetr interest income 561,144 660,291 610,514 537,940546,585 572,220 583,647 556,485 601,935 671,881 726,455 705,988 7,335,085 Income Tax (30%) 168,343 198,087 183,154 161,382 163,976 171,666 175,094 166,946 180,580 201,564 217,937 211,7962,200,526Net income 392,801 462,204 427,360 376,558 382,610 400,554 408,553 389,540 421,354 470,317 508,519 494,191 5,134,560

168
Idea Plus Company
Income Statement Year2 Year 2 Jan Feb Mar Apr May Jun Jul Aug Sep Oct Nov Dec Total
Sales 4,165,150 3,854,950 3,616,884 3,285,986 3,354,181 3,433,738 3,624,150 3,478,050 3,695,419 4,120,270 4,290,950 4,312,629 45,232,357
Cost of goods sold 3,123,863 2,891,213 2,712,663 2,464,490 2,515,635 2,575,304 2,718,113 2,608,538 2,771,564 3,090,203 3,218,213 3,234,471 33,924,268Gross margin 1,041,288 963,738 904,221 821,497 838,545 858,435 906,038869,513 923,855 1,030,068 1,072,738 1,078,157 11,308,089Selling expense 0 Sale commission 83,303 77,099 72,338 65,720 67,084 68,675 72,483 69,561 73,908 82,405 85,819 86,253 904,647 Radio local 3,000 3,000 3,000 3,000 3,000 3,000 3,000 3,000 3,000 3,000 3,000 3,000 3,000 Brochure 1,100 0 0 1,100 0 0 1,100 0 0 1,650 0 0 4,950 Plate/Poster/Vinyl 0 0 0 0 9,900 0 0 0 0 16,500 0 16,500 42,900 Souvenir 0 0 0 0 0 0 0 0 0 0 0 11,000 11,000 Public relation 1,100 1,100 1,100 1,100 1,100 1,100 1,100 1,100 1,100 1,100 1,100 1,100 13,200 Website 0 0 0 0 0 0 0 0 0 0 0 0 0Total selling expense 88,503 81,199 76,438 70,920 81,084 72,775 77,683 73,661 78,008 104,655 89,919 117,853 1,012,697Administrative Expense General manager salary 16,500 16,500 16,500 16,500 16,500 16,500 16,500 16,500 16,500 16,500 16,500 16,500 198,000 Marketing officer salary 9,350 9,350 9,350 9,350 9,350 9,350 9,350 9,350 9,350 9,350 9,350 9,350 112,200 Accounting officer salary 9,350 9,350 9,350 9,350 9,350 9,350 9,350 9,350 9,350 9,350 9,350 9,350 112,200 Reception and administration officer salary 7,700 7,700 7,700 7,700 7,700 7,700 7,700 7,700 7,700 7,700 7,700 7,700 92,400 Graphic and package designer salary 9,350 9,350 9,350 9,350 9,350 9,350 9,350 9,350 9,350 9,350 9,350 9,350 112,200 Customer service officer salary 8,250 8,250 8,250 8,250 8,250 8,250 8,250 8,250 8,250 8,250 8,250 8,250 99,000 Housekeeper salary 5,500 5,500 5,500 5,500 5,500 5,500 5,500 5,500 5,500 5,500 5,500 5,500 66,000 Social security insurance (per month) 3,300 3,300 3,300 3,300 3,300 3,300 3,300 3,300 3,300 3,300 3,300 3,300 39,600 Office supplies 8,892 0 0 2,625 0 0 2,625 0 0 2,625 0 0 16,766 Utility expense 9,350 9,350 9,350 9,350 9,350 9,350 9,350 9,350 9,350 9,350 9,350 9,350 112,200 Rental (building) 25,000 25,000 25,000 25,000 25,000 25,000 25,000 25,000 25,000 25,000 25,000 25,000 300,000 Fire insurance 2,579 0 0 0 0 0 0 0 0 0 0 0 2,579 Administrative Depreciation 6,355 6,355 6,355 6,355 6,355 6,355 6,355 6,355 6,355 6,355 6,355 6,355 76,257 Total adminstrative expense 121,476 110,005 110,005 112,629 110,005 110,005 112,629 110,005 110,005 112,629 110,005 110,005 1,339,402Selling and administrative expense 209,979 191,204 186,442 183,549 191,088 182,780 190,312 183,666 188,013 217,285 199,924 227,857 2,352,099 Earning before interest and Tax 831,309 772,534 717,778 637,947 647,457 675,655 715,725 685,847 735,842 812,783 872,814 850,300 8,955,990
Interest and principle loan expense 63,889 63,889 63,889 63,889 63,889 63,889 63,889 63,889 63,889 63,889 63,889 63,889 766,667
Afetr interest income 767,420 708,645 653,890 574,059583,568 611,766 651,836 621,958 671,953 748,894 808,925 786,411 8,189,324 Income Tax (30%) 230,226 212,593 196,167 172,218 175,070 183,530 195,551 186,587 201,586 224,668 242,677 235,9232,456,797Net income 537,194 496,051 457,723 401,841 408,498 428,236 456,285 435,371 470,367 524,226 566,247 550,488 5,732,526

169
Idea Plus Company Income Statement Year3
Year 3 Jan Feb Mar Apr May Jun Jul Aug Sep Oct Nov Dec Total Sales 4,543,800 4,205,400 3,945,691 3,584,712 3,659,106 3,745,896 3,953,618 3,794,237 4,031,366 4,494,840 4,681,037 4,704,686 49,344,389
Cost of goods sold 3,407,850 3,154,050 2,959,268 2,688,534 2,744,330 2,809,422 2,965,214 2,845,678 3,023,525 3,371,130 3,510,778 3,528,514 37,008,292Gross margin 1,135,950 1,051,350 986,423 896,178 914,777 936,474 988,405 948,559 1,007,842 1,123,710 1,170,259 1,176,171 12,336,097Selling expense 0 Sale commission 90,876 84,108 78,914 71,694 73,182 74,918 79,072 75,885 80,627 89,897 93,621 94,094 986,888 Radio local 3,000 3,000 3,000 3,000 3,000 3,000 3,000 3,000 3,000 3,000 3,000 3,000 36,000 Brochure 1,150 0 0 1,150 0 0 1,150 0 0 1,725 0 0 5,175 Plate/Poster/Vinyl 0 0 0 0 10,350 0 0 0 0 17,250 0 17,250 44,850 Souvenir 0 0 0 0 0 0 0 0 0 0 0 11,500 11,500 Public relation 1,150 1,150 1,150 1,150 1,150 1,150 1,150 1,150 1,150 1,150 1,150 1,150 13,800 Website 1,000 0 0 0 0 0 0 0 0 0 0 0 1,000Total selling expense 97,176 88,258 83,064 76,994 87,682 79,068 84,372 80,035 84,777 113,022 97,771 126,994 1,099,213Administrative Expense General manager salary 18,000 18,000 18,000 18,000 18,000 18,000 18,000 18,000 18,000 18,000 18,000 18,000 216,000 Marketing officer salary 10,200 10,200 10,200 10,200 10,200 10,200 10,200 10,200 10,200 10,200 10,200 10,200 122,400 Accounting officer salary 10,200 10,200 10,200 10,200 10,200 10,200 10,200 10,200 10,200 10,200 10,200 10,200 122,400 Reception and administration officer salary 8,400 8,400 8,400 8,400 8,400 8,400 8,400 8,400 8,400 8,400 8,400 8,400 100,800 Graphic and package designer salary 10,200 10,200 10,200 10,200 10,200 10,200 10,200 10,200 10,200 10,200 10,200 10,200 122,400 Customer service officer salary 9,000 9,000 9,000 9,000 9,000 9,000 9,000 9,000 9,000 9,000 9,000 9,000 108,000 Housekeeper salary 6,000 6,000 6,000 6,000 6,000 6,000 6,000 6,000 6,000 6,000 6,000 6,000 72,000 Social security insurance (per month) 3,600 3,600 3,600 3,600 3,600 3,600 3,600 3,600 3,600 3,600 3,600 3,600 43,200 Office supplies 9,701 0 0 2,863 0 0 2,863 0 0 2,863 0 0 18,290 Utility expense 10,200 10,200 10,200 10,200 10,200 10,200 10,200 10,200 10,200 10,200 10,200 10,200 122,400 Rental (building) 25,000 25,000 25,000 25,000 25,000 25,000 25,000 25,000 25,000 25,000 25,000 25,000 300,000 Fire insurance 2,579 0 0 0 0 0 0 0 0 0 0 0 2,579 Administrative Depreciation 6,355 6,355 6,355 6,355 6,355 6,355 6,355 6,355 6,355 6,355 6,355 6,355 76,257 Total adminstrative expense 129,434 117,155 117,155 120,018 117,155 117,155 120,018 117,155 117,155 120,018 117,155 117,155 1,426,726Selling and administrative expense 226,610 205,413 200,219 197,012 204,837 196,223 204,390 197,189 201,932 233,040 214,925 244,148 2,525,939 Earning before interest and Tax 909,340 845,937 786,204 699,166 709,940 740,251 784,014 751,370 805,910 890,670 955,334 932,023 9,810,158
Interest and principle loan expense 63,889 63,889 63,889 63,889 63,889 63,889 63,889 63,889 63,889 63,889 63,889 63,889 766,667
Afetr interest income 845,451 782,048 722,315 635,277646,051 676,362 720,125 687,481 742,021 826,781 891,445 868,134 9,043,492 Income Tax (30%) 253,635 234,615 216,695 190,583 193,815 202,909 216,038 206,244 222,606 248,034 267,433 260,4402,713,048Net income 591,816 547,434 505,621 444,694 452,236 473,454 504,088 481,237 519,414 578,747 624,011 607,694 6,330,444
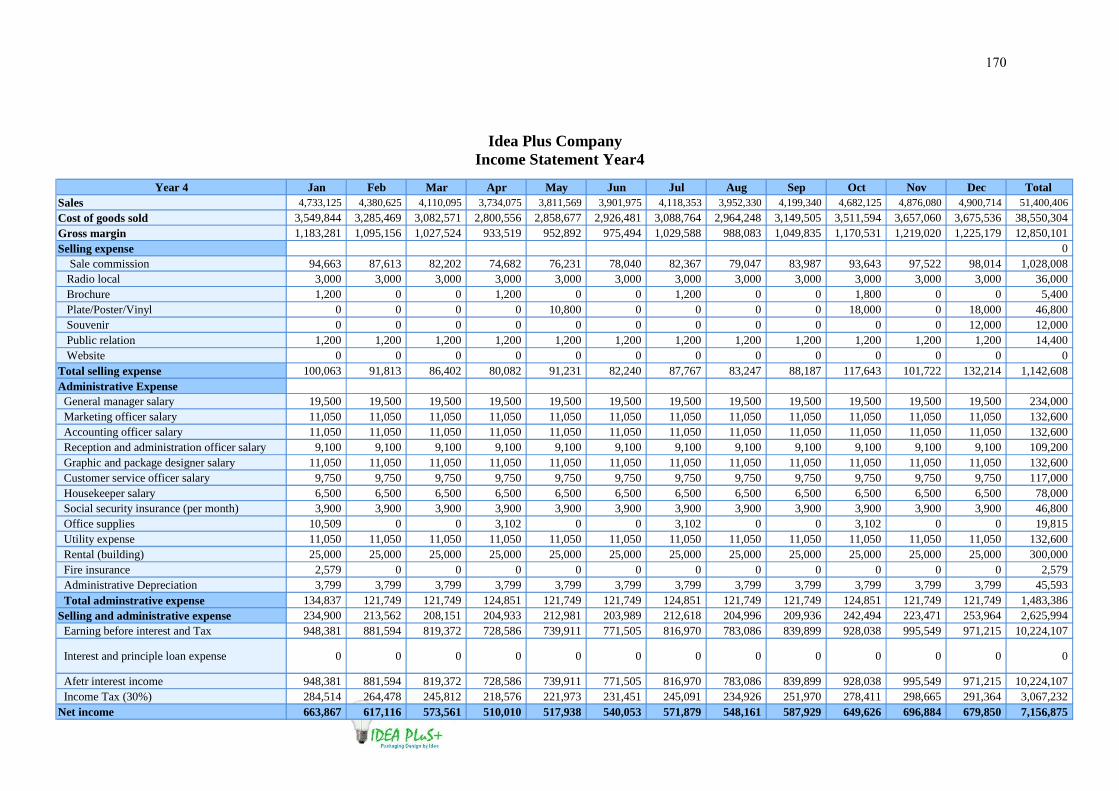
170
Idea Plus Company
Income Statement Year4
Year 4 Jan Feb Mar Apr May Jun Jul Aug Sep Oct Nov Dec Total Sales 4,733,125 4,380,625 4,110,095 3,734,075 3,811,569 3,901,975 4,118,353 3,952,330 4,199,340 4,682,125 4,876,080 4,900,714 51,400,406
Cost of goods sold 3,549,844 3,285,469 3,082,571 2,800,556 2,858,677 2,926,481 3,088,764 2,964,248 3,149,505 3,511,594 3,657,060 3,675,536 38,550,304Gross margin 1,183,281 1,095,156 1,027,524 933,519 952,892 975,494 1,029,588 988,083 1,049,835 1,170,531 1,219,020 1,225,179 12,850,101Selling expense 0 Sale commission 94,663 87,613 82,202 74,682 76,231 78,040 82,367 79,047 83,987 93,643 97,522 98,014 1,028,008 Radio local 3,000 3,000 3,000 3,000 3,000 3,000 3,000 3,000 3,000 3,000 3,000 3,000 36,000 Brochure 1,200 0 0 1,200 0 0 1,200 0 0 1,800 0 0 5,400 Plate/Poster/Vinyl 0 0 0 0 10,800 0 0 0 0 18,000 0 18,000 46,800 Souvenir 0 0 0 0 0 0 0 0 0 0 0 12,000 12,000 Public relation 1,200 1,200 1,200 1,200 1,200 1,200 1,200 1,200 1,200 1,200 1,200 1,200 14,400 Website 0 0 0 0 0 0 0 0 0 0 0 0 0Total selling expense 100,063 91,813 86,402 80,082 91,231 82,240 87,767 83,247 88,187 117,643 101,722 132,214 1,142,608Administrative Expense General manager salary 19,500 19,500 19,500 19,500 19,500 19,500 19,500 19,500 19,500 19,500 19,500 19,500 234,000 Marketing officer salary 11,050 11,050 11,050 11,050 11,050 11,050 11,050 11,050 11,050 11,050 11,050 11,050 132,600 Accounting officer salary 11,050 11,050 11,050 11,050 11,050 11,050 11,050 11,050 11,050 11,050 11,050 11,050 132,600 Reception and administration officer salary 9,100 9,100 9,100 9,100 9,100 9,100 9,100 9,100 9,100 9,100 9,100 9,100 109,200 Graphic and package designer salary 11,050 11,050 11,050 11,050 11,050 11,050 11,050 11,050 11,050 11,050 11,050 11,050 132,600 Customer service officer salary 9,750 9,750 9,750 9,750 9,750 9,750 9,750 9,750 9,750 9,750 9,750 9,750 117,000 Housekeeper salary 6,500 6,500 6,500 6,500 6,500 6,500 6,500 6,500 6,500 6,500 6,500 6,500 78,000 Social security insurance (per month) 3,900 3,900 3,900 3,900 3,900 3,900 3,900 3,900 3,900 3,900 3,900 3,900 46,800 Office supplies 10,509 0 0 3,102 0 0 3,102 0 0 3,102 0 0 19,815 Utility expense 11,050 11,050 11,050 11,050 11,050 11,050 11,050 11,050 11,050 11,050 11,050 11,050 132,600 Rental (building) 25,000 25,000 25,000 25,000 25,000 25,000 25,000 25,000 25,000 25,000 25,000 25,000 300,000 Fire insurance 2,579 0 0 0 0 0 0 0 0 0 0 0 2,579 Administrative Depreciation 3,799 3,799 3,799 3,799 3,799 3,799 3,799 3,799 3,799 3,799 3,799 3,799 45,593 Total adminstrative expense 134,837 121,749 121,749 124,851 121,749 121,749 124,851 121,749 121,749 124,851 121,749 121,749 1,483,386Selling and administrative expense 234,900 213,562 208,151 204,933 212,981 203,989 212,618 204,996 209,936 242,494 223,471 253,964 2,625,994 Earning before interest and Tax 948,381 881,594 819,372 728,586 739,911 771,505 816,970 783,086 839,899 928,038 995,549 971,215 10,224,107
Interest and principle loan expense 0 0 0 0 0 0 0 0 0 0 0 0 0
Afetr interest income 948,381 881,594 819,372 728,586739,911 771,505 816,970 783,086 839,899 928,038 995,549 971,215 10,224,107 Income Tax (30%) 284,514 264,478 245,812 218,576 221,973 231,451 245,091 234,926 251,970 278,411 298,665 291,3643,067,232Net income 663,867 617,116 573,561 510,010 517,938 540,053 571,879 548,161 587,929 649,626 696,884 679,850 7,156,875

171
Idea Plus Company Income Statement Year5
Year 5 Jan Feb Mar Apr May Jun Jul Aug Sep Oct Nov Dec Total
Sales 4,922,450 4,555,850 4,274,499 3,883,438 3,964,032 4,058,054 4,283,087 4,110,423 4,367,314 4,869,410 5,071,123 5,096,743 53,456,422
Cost of goods sold 3,691,838 3,416,888 3,205,874 2,912,579 2,973,024 3,043,541 3,212,315 3,082,817 3,275,485 3,652,058 3,803,342 3,822,557 40,092,316Gross margin 1,230,613 1,138,963 1,068,625 970,860 991,008 1,014,514 1,070,772 1,027,606 1,091,828 1,217,353 1,267,781 1,274,186 13,364,105Selling expense 0 Sale commission 98,449 91,117 85,490 77,669 79,281 81,161 85,662 82,208 87,346 97,388 101,422 101,935 1,069,128 Radio local 3,000 3,000 3,000 3,000 3,000 3,000 3,000 3,000 3,000 3,000 3,000 3,000 36,000 Brochure 1,250 0 0 1,250 0 0 1,250 0 0 1,875 0 0 5,625 Plate/Poster/Vinyl 0 0 0 0 11,250 0 0 0 0 18,750 0 18,750 48,750 Souvenir 0 0 0 0 0 0 0 0 0 0 0 12,500 12,500 Public relation 1,250 1,250 1,250 1,250 1,250 1,250 1,250 1,250 1,250 1,250 1,250 1,250 15,000 Website 500 0 0 0 0 0 0 0 0 0 0 0 500Total selling expense 104,449 95,367 89,740 83,169 94,781 85,411 91,162 86,458 91,596 122,263 105,672 137,435 1,187,503Administrative Expense General manager salary 21,000 21,000 21,000 21,000 21,000 21,000 21,000 21,000 21,000 21,000 21,000 21,000 252,000 Marketing officer salary 11,900 11,900 11,900 11,900 11,900 11,900 11,900 11,900 11,900 11,900 11,900 11,900 142,800 Accounting officer salary 11,900 11,900 11,900 11,900 11,900 11,900 11,900 11,900 11,900 11,900 11,900 11,900 142,800 Reception and administration officer salary 9,800 9,800 9,800 9,800 9,800 9,800 9,800 9,800 9,800 9,800 9,800 9,800 117,600 Graphic and package designer salary 11,900 11,900 11,900 11,900 11,900 11,900 11,900 11,900 11,900 11,900 11,900 11,900 142,800 Customer service officer salary 10,500 10,500 10,500 10,500 10,500 10,500 10,500 10,500 10,500 10,500 10,500 10,500 126,000 Housekeeper salary 7,000 7,000 7,000 7,000 7,000 7,000 7,000 7,000 7,000 7,000 7,000 7,000 84,000 Social security insurance (per month) 4,200 4,200 4,200 4,200 4,200 4,200 4,200 4,200 4,200 4,200 4,200 4,200 50,400 Office supplies 11,318 0 0 3,340 0 0 3,340 0 0 3,340 0 0 21,339 Utility expense 11,900 11,900 11,900 11,900 11,900 11,900 11,900 11,900 11,900 11,900 11,900 11,900 142,800 Rental (building) 25,000 25,000 25,000 25,000 25,000 25,000 25,000 25,000 25,000 25,000 25,000 25,000 300,000 Fire insurance 2,579 0 0 0 0 0 0 0 0 0 0 0 2,579 Administrative Depreciation 3,799 3,799 3,799 3,799 3,799 3,799 3,799 3,799 3,799 3,799 3,799 3,799 45,593 Total adminstrative expense 142,796 128,899 128,899 132,240 128,899 128,899 132,240 128,899 128,899 132,240 128,899 128,899 1,570,711Selling and administrative expense 247,245 224,266 218,639 215,409 223,680 214,310 223,402 215,358 220,496 254,503 234,572 266,334 2,758,214 Earning before interest and Tax 983,368 914,696 849,985 755,451 767,328 800,203 847,370 812,248 871,333 962,849 1,033,209 1,007,851 10,605,892
Interest and principle loan expense 0 0 0 0 0 0 0 0 0 0 0 0 0
Afetr interest income 983,368 914,696 849,985 755,451767,328 800,203 847,370 812,248 871,333 962,849 1,033,2091,007,851 10,605,892 Income Tax (30%) 295,010 274,409 254,996 226,635 230,198 240,061 254,211 243,674 261,400 288,855 309,963 302,3553,181,767Net income 688,357 640,287 594,990 528,816 537,129 560,142 593,159 568,574 609,933 673,995 723,246 705,496 7,424,124

172
Idea Plus Company Cash flow Year1
Year 1 Jan Feb Mar Apr May Jun Jul Aug Sep Oct Nov Dec Total CF1 Cash flows from operating activity Cash inflow Cash recived on sales 3,786,500 3,504,500 3,288,0762,987,260 3,049,255 3,121,580 3,294,682 3,161,864 3,359,472 3,745,700 3,900,864 3,920,571 41,120,324 Cash from account receivable 0 0 0 0 0 0 0 0 0 0 0 0 0 Adjust office supplies 0 0 0 0 0 0 0 0 0 0 0 0 0 Adjust rental builging 0 0 0 0 0 0 0 0 0 0 0 0 0 Adjust depreciation 6,355 6,355 6,355 6,355 6,355 6,355 6,355 6,355 6,355 6,355 6,355 6,355 76,257 Other Cash inflow from operating activity 3,792,855 3,510,855 3,294,431 2,993,615 3,055,610 3,127,935 3,301,037 3,168,219 3,365,827 3,752,055 3,907,219 3,926,926 41,196,581 Cash out flow Cost of goods sold 2,839,875 2,628,375 2,466,057 2,240,445 2,286,941 2,341,185 2,471,012 2,371,398 2,519,6042,809,275 2,925,648 2,940,429 30,840,243 Marketing expense 83,075 74,090 69,762 64,745 73,985 66,432 70,894 67,237 71,189 95,414 82,017 107,411 926,251 Administrative expense 238,517 77,855 77,855 80,241 77,855 77,855 105,241 102,855 102,855 105,241 102,855 102,855 1,252,078 Cash paid for income tax 168,343 198,087 183,154 161,382 163,976 171,666 175,094 166,946 180,580 201,564 217,937 211,796 2,200,526 Other cash expense 0 Cash out flow from operating activity 3,329,811 2,978,407 2,796,827 2,546,813 2,602,757 2,657,137 2,822,240 2,708,436 2,874,229 3,211,494 3,328,457 3,362,491 35,219,098Net cash flows fom operating activity 463,044 532,448 497,603 446,802 452,853 470,797 478,797 459,783 491,598 540,561 578,762 564,435 5,977,483Cash inflow from investing activity Cash inflow Cash received from sold equipment 0 0 0 0 0 0 0 0 0 0 0 0 0 Other 0 0 0 0 0 0 0 0 0 0 0 0 0 Cash inflow from investing activity 0 0 0 0 0 0 0 0 0 0 0 0 0 Cash outflow Cash paid on administrative investment 633,231 0 0 0 0 0 0 0 0 0 0 0 633,231 Cash outflow from investment activity 633,231 0 0 0 0 0 0 0 0 0 0 0 633,231Net cash flows fom investing activity -633,231 0 0 0 0 0 0 0 0 0 0 0 -633,231Cash flows fom financing activity cash inflow Cash Loan 2,000,000 0 0 0 0 0 0 0 0 0 0 0 2,000,000 Other 0 Cash inflow from financing activity 2,000,000 0 0 0 0 0 0 0 0 0 0 0 2,000,000cash outflow Repayment for interest and principle loan 63,889 63,889 63,889 63,889 63,889 63,889 63,889 63,889 63,889 63,889 63,889 63,889 766,667 Cash outflow from financing activity 63,889 63,889 63,889 63,889 63,889 63,889 63,889 63,889 63,889 63,889 63,889 63,889 766,667Net cash flows from financing activity 1,936,111 -63,889 -63,889 -63,889 -63,889 -63,889 -63,889 -63,889 -63,889 -63,889 -63,889 -63,889 1,233,333Net cash increase or decrease 1,765,924 468,559 433,714 382,913 388,964 406,909 414,908395,894 427,709 476,672 514,873 500,546 6,577,586Beginning cash 0 1,765,924 2,234,483 2,668,197 3,051,110 3,440,075 3,846,983 4,261,891 4,657,785 5,085,494 5,562,166 6,077,039 0Ending cash 1,765,924 2,234,483 2,668,197 3,051,110 3,440,075 3,846,983 4,261,891 4,657,785 5,085,494 5,562,166 6,077,039 6,577,586 6,577,586
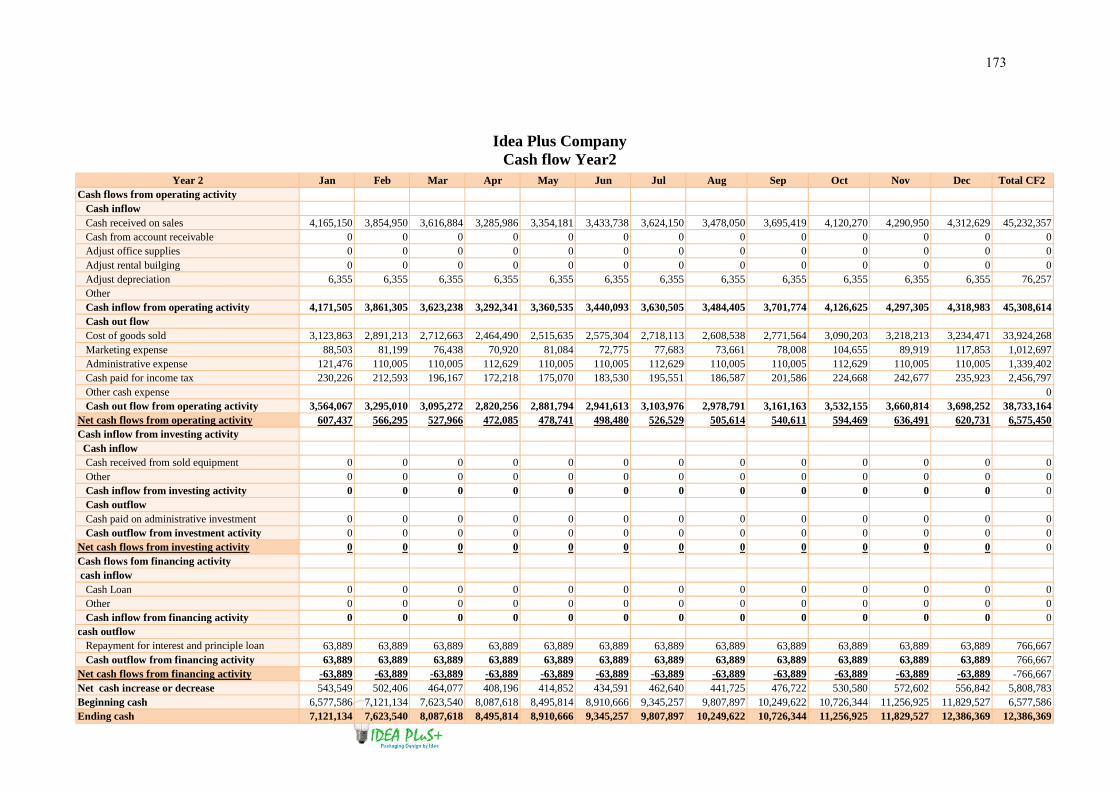
173
Idea Plus Company
Cash flow Year2 Year 2 Jan Feb Mar Apr May Jun Jul Aug Sep Oct Nov Dec Total CF2
Cash flows from operating activity Cash inflow Cash received on sales 4,165,150 3,854,950 3,616,884 3,285,986 3,354,181 3,433,738 3,624,150 3,478,050 3,695,419 4,120,270 4,290,950 4,312,629 45,232,357 Cash from account receivable 0 0 0 0 0 0 0 0 0 0 0 0 0 Adjust office supplies 0 0 0 0 0 0 0 0 0 0 0 0 0 Adjust rental builging 0 0 0 0 0 0 0 0 0 0 0 0 0 Adjust depreciation 6,355 6,355 6,355 6,355 6,355 6,355 6,355 6,355 6,355 6,355 6,355 6,355 76,257 Other Cash inflow from operating activity 4,171,505 3,861,305 3,623,238 3,292,341 3,360,535 3,440,093 3,630,505 3,484,405 3,701,774 4,126,625 4,297,305 4,318,983 45,308,614 Cash out flow Cost of goods sold 3,123,863 2,891,213 2,712,663 2,464,490 2,515,635 2,575,304 2,718,113 2,608,538 2,771,5643,090,203 3,218,213 3,234,471 33,924,268 Marketing expense 88,503 81,199 76,438 70,920 81,084 72,775 77,683 73,661 78,008 104,655 89,919 117,853 1,012,697 Administrative expense 121,476 110,005 110,005 112,629 110,005 110,005 112,629 110,005 110,005 112,629 110,005110,005 1,339,402 Cash paid for income tax 230,226 212,593 196,167 172,218 175,070 183,530 195,551 186,587 201,586 224,668 242,677 235,923 2,456,797 Other cash expense 0 Cash out flow from operating activity 3,564,067 3,295,010 3,095,272 2,820,256 2,881,794 2,941,613 3,103,976 2,978,791 3,161,163 3,532,155 3,660,814 3,698,252 38,733,164Net cash flows from operating activity 607,437 566,295 527,966 472,085 478,741 498,480 526,529 505,614 540,611 594,469 636,491 620,731 6,575,450Cash inflow from investing activity Cash inflow Cash received from sold equipment 0 0 0 0 0 0 0 0 0 0 0 0 0 Other 0 0 0 0 0 0 0 0 0 0 0 0 0 Cash inflow from investing activity 0 0 0 0 0 0 0 0 0 0 0 0 0 Cash outflow Cash paid on administrative investment 0 0 0 0 0 0 0 0 0 0 0 0 0 Cash outflow from investment activity 0 0 0 0 0 0 0 0 0 0 0 0 0Net cash flows from investing activity 0 0 0 0 0 0 0 0 0 0 0 0 0Cash flows fom financing activity cash inflow Cash Loan 0 0 0 0 0 0 0 0 0 0 0 0 0 Other 0 0 0 0 0 0 0 0 0 0 0 0 0 Cash inflow from financing activity 0 0 0 0 0 0 0 0 0 0 0 0 0cash outflow Repayment for interest and principle loan 63,889 63,889 63,889 63,889 63,889 63,889 63,889 63,889 63,889 63,889 63,889 63,889 766,667 Cash outflow from financing activity 63,889 63,889 63,889 63,889 63,889 63,889 63,889 63,889 63,889 63,889 63,889 63,889 766,667Net cash flows from financing activity -63,889 -63,889 -63,889 -63,889 -63,889 -63,889 -63,889 -63,889 -63,889 -63,889 -63,889 -63,889 -766,667Net cash increase or decrease 543,549 502,406 464,077 408,196 414,852 434,591 462,640 441,725 476,722 530,580 572,602 556,842 5,808,783Beginning cash 6,577,586 7,121,134 7,623,540 8,087,618 8,495,814 8,910,666 9,345,257 9,807,897 10,249,622 10,726,344 11,256,92511,829,527 6,577,586Ending cash 7,121,134 7,623,540 8,087,618 8,495,814 8,910,666 9,345,257 9,807,897 10,249,622 10,726,344 11,256,925 11,829,527 12,386,369 12,386,369

174
Idea Plus Company
Cash flow Year3
Year 3 Jan Feb Mar Apr May Jun Jul Aug Sep Oct Nov Dec Total CF3Cash flows from operating activity Cash inflow Cash received on sales 4,543,800 4,205,400 3,945,691 3,584,712 3,659,106 3,745,896 3,953,618 3,794,237 4,031,366 4,494,840 4,681,037 4,704,686 49,344,389 Cash from account receivable 0 0 0 0 0 0 0 0 0 0 0 0 0 Adjust office supplies 0 0 0 0 0 0 0 0 0 0 0 0 0 Adjust rental building 0 0 0 0 0 0 0 0 0 0 0 0 0 Adjust depreciation 6,355 6,355 6,355 6,355 6,355 6,355 6,355 6,355 6,355 6,355 6,355 6,355 76,257 Other Cash inflow from operating activity 4,550,155 4,211,755 3,952,046 3,591,067 3,665,461 3,752,251 3,959,973 3,800,592 4,037,721 4,501,195 4,687,392 4,711,041 49,420,646 Cash out flow Cost of goods sold 3,407,850 3,154,050 2,959,268 2,688,534 2,744,330 2,809,422 2,965,214 2,845,678 3,023,5253,371,130 3,510,778 3,528,514 37,008,292 Marketing expense 97,176 88,258 83,064 76,994 87,682 79,068 84,372 80,035 84,777 113,022 97,771 126,994 1,099,213 Administrative expense 129,434 117,155 117,155 120,018 117,155 117,155 120,018 117,155 117,155 120,018 117,155117,155 1,426,726 Cash paid for income tax 253,635 234,615 216,695 190,583 193,815 202,909 216,038 206,244 222,606 248,034 267,433 260,440 2,713,048 Other cash expense 0 Cash out flow from operating activity 3,888,096 3,594,077 3,376,182 3,076,129 3,142,982 3,208,553 3,385,642 3,249,111 3,448,063 3,852,204 3,993,137 4,033,103 42,247,278Net cash flows fom operating activity 662,059 617,677 575,864 514,937 522,479 543,697 574,331 551,480 589,658 648,991 694,255 677,937 7,173,368Cash inflow from investing activity Cash inflow Cash received from sold equipment 0 0 0 0 0 0 0 0 0 0 0 0 0 Other 0 0 0 0 0 0 0 0 0 0 0 0 Cash inflow from investing activity 0 0 0 0 0 0 0 0 0 0 0 0 0 Cash outflow Cash paid on administrative investment 0 0 0 0 0 0 0 0 0 0 0 0 0 Cash outflow from investment activity 0 0 0 0 0 0 0 0 0 0 0 0 0Net cash flows fom investing activity 0 0 0 0 0 0 0 0 0 0 0 0 0Cash flows fom financing activity cash inflow Cash Loan 0 0 0 0 0 0 0 0 0 0 0 0 0 Other 0 0 0 0 0 0 0 0 0 0 0 0 0 Cash inflow from financing activity 0 0 0 0 0 0 0 0 0 0 0 0 0cash outflow Repayment for interest and principle loan 63,889 63,889 63,889 63,889 63,889 63,889 63,889 63,889 63,889 63,889 63,889 63,889 766,667 Cash outflow from financing activity 63,889 63,889 63,889 63,889 63,889 63,889 63,889 63,889 63,889 63,889 63,889 63,889 766,667Net cash flows from financing activity -63,889 -63,889 -63,889 -63,889 -63,889 -63,889 -63,889 -63,889 -63,889 -63,889 -63,889 -63,889 -766,667Net cash increase or decrease 598,170 553,789 511,975 451,049 458,590 479,808 510,443 487,591 525,769 585,102 630,366 614,049 6,406,701Beginning cash 12,386,369 12,984,540 13,538,328 14,050,304 14,501,352 14,959,942 15,439,751 15,950,193 16,437,785 16,963,554 17,548,656 18,179,022 12,386,369Ending cash 12,984,540 13,538,328 14,050,304 14,501,352 14,959,942 15,439,751 15,950,193 16,437,785 16,963,554 17,548,656 18,179,022 18,793,070 18,793,070

175
Idea Plus Company
Cash flow Year4 Year 4 Jan Feb Mar Apr May Jun Jul Aug Sep Oct Nov Dec Total CF4
Cash flows from operating activity Cash inflow Cash received on sales 4,733,125 4,380,625 4,110,095 3,734,075 3,811,569 3,901,975 4,118,353 3,952,330 4,199,340 4,682,125 4,876,080 4,900,714 51,400,406 Cash from account receivable 0 0 0 0 0 0 0 0 0 0 0 0 0 Adjust office supplies 0 0 0 0 0 0 0 0 0 0 0 0 0 Adjust rental building 0 0 0 0 0 0 0 0 0 0 0 0 0 Adjust depreciation 3,799 3,799 3,799 3,799 3,799 3,799 3,799 3,799 3,799 3,799 3,799 3,799 45,593 Other Cash inflow from operating activity 4,736,924 4,384,424 4,113,894 3,737,874 3,815,368 3,905,774 4,122,152 3,956,129 4,203,139 4,685,924 4,879,879 4,904,514 51,445,999 Cash out flow Cost of goods sold 3,549,844 3,285,469 3,082,571 2,800,556 2,858,677 2,926,481 3,088,764 2,964,248 3,149,5053,511,594 3,657,060 3,675,536 38,550,304 Marketing expense 100,063 91,813 86,402 80,082 91,231 82,240 87,767 83,247 88,187 117,643 101,722 132,214 1,142,608 Administrative expense 134,837 121,749 121,749 124,851 121,749 121,749 124,851 121,749 121,749 124,851 121,749121,749 1,483,386 Cash paid for income tax 284,514 264,478 245,812 218,576 221,973 231,451 245,091 234,926 251,970 278,411 298,665 291,364 3,067,232 Other cash expense 0 Cash out flow from operating activity 4,069,258 3,763,509 3,536,534 3,224,065 3,293,631 3,361,922 3,546,474 3,404,169 3,611,411 4,032,499 4,179,196 4,220,864 44,243,531Net cash flows fom operating activity 667,666 620,915 577,360 513,810 521,737 543,853 575,678 551,960 591,729 653,426 700,684 683,650 7,202,468Cash inflow from investing activity Cash inflow Cash received from sold equipment 0 0 0 0 0 0 0 0 0 0 0 0 0 Other 0 0 0 0 0 0 0 0 0 0 0 0 Cash inflow from investing activity 0 0 0 0 0 0 0 0 0 0 0 0 0 Cash outflow Cash paid on administrative investment 0 0 0 0 0 0 0 0 0 0 0 0 0 Cash outflow from investment activity 0 0 0 0 0 0 0 0 0 0 0 0 0Net cash flows fom investing activity 0 0 0 0 0 0 0 0 0 0 0 0 0Cash flows fom financing activity cash inflow Cash Loan 0 0 0 0 0 0 0 0 0 0 0 0 0 Other 0 0 0 0 0 0 0 0 0 0 0 0 0 Cash inflow from financing activity 0 0 0 0 0 0 0 0 0 0 0 0 0cash outflow Repayment for interest and principle loan 0 0 0 0 0 0 0 0 0 0 0 0 0 Cash outflow from financing activity 0 0 0 0 0 0 0 0 0 0 0 0 0Net cash flows from financing activity 0 0 0 0 0 0 0 0 0 0 0 0 0Net cash increase or decrease 667,666 620,915 577,360 513,810 521,737 543,853 575,678 551,960 591,729 653,426 700,684 683,650 7,202,468Beginning cash 18,793,070 19,460,737 20,081,652 20,659,012 21,172,822 21,694,559 22,238,412 22,814,091 23,366,050 23,957,779 24,611,205 25,311,888 18,793,070Ending cash 19,460,737 20,081,652 20,659,012 21,172,822 21,694,559 22,238,412 22,814,091 23,366,050 23,957,779 24,611,205 25,311,888 25,995,538 25,995,538

176
Idea Plus Company
Cash flow Year5
Year 5 Jan Feb Mar Apr May Jun Jul Aug Sep Oct Nov Dec Total CF5Cash flows from operating activity Cash inflow Cash received on sales 4,922,450 4,555,850 4,274,499 3,883,438 3,964,032 4,058,054 4,283,087 4,110,423 4,367,314 4,869,410 5,071,123 5,096,743 53,456,422 Cash from account receivable 0 0 0 0 0 0 0 0 0 0 0 0 0 Adjust office supplies 0 0 0 0 0 0 0 0 0 0 0 0 0 Adjust rental building 0 0 0 0 0 0 0 0 0 0 0 0 0 Adjust depreciation 3,799 3,799 3,799 3,799 3,799 3,799 3,799 3,799 3,799 3,799 3,799 3,799 45,593 Other Cash inflow from operating activity 4,926,249 4,559,649 4,278,298 3,887,237 3,967,831 4,061,853 4,286,886 4,114,223 4,371,113 4,873,209 5,074,923 5,100,542 53,502,015 Cash out flow Cost of goods sold 3,691,838 3,416,888 3,205,874 2,912,579 2,973,024 3,043,541 3,212,315 3,082,817 3,275,4853,652,058 3,803,342 3,822,557 40,092,316 Marketing expense 104,449 95,367 89,740 83,169 94,781 85,411 91,162 86,458 91,596 122,263 105,672 137,435 1,187,503 Administrative expense 142,796 128,899 128,899 132,240 128,899 128,899 132,240 128,899 128,899 132,240 128,899128,899 1,570,711 Cash paid for income tax 295,010 274,409 254,996 226,635 230,198 240,061 254,211 243,674 261,400 288,855 309,963 302,355 3,181,767 Other cash expense 0 Cash out flow from operating activity 4,234,093 3,915,563 3,679,509 3,354,622 3,426,902 3,497,912 3,689,928 3,541,850 3,757,381 4,195,415 4,347,877 4,391,247 46,032,298Net cash flows fom operating activity 692,157 644,087 598,789 532,615 540,929 563,942 596,958 572,373 613,732 677,794 727,046 709,295 7,469,717Cash inflow from investing activity Cash inflow Cash received from sold equipment 0 0 0 0 0 0 0 0 0 0 0 0 0 Other 0 0 0 0 0 0 0 0 0 0 0 0 Cash inflow from investing activity 0 0 0 0 0 0 0 0 0 0 0 0 0 Cash outflow Cash paid on administrative investment 0 0 0 0 0 0 0 0 0 0 0 0 0 Cash outflow from investment activity 0 0 0 0 0 0 0 0 0 0 0 0 0Net cash flows fom investing activity 0 0 0 0 0 0 0 0 0 0 0 0 0Cash flows fom financing activity cash inflow Cash Loan 0 0 0 0 0 0 0 0 0 0 0 0 0 Other 0 0 0 0 0 0 0 0 0 0 0 0 0 Cash inflow from financing activity 0 0 0 0 0 0 0 0 0 0 0 0 0cash outflow Repayment for interest and principle loan 0 0 0 0 0 0 0 0 0 0 0 0 0 Cash outflow from financing activity 0 0 0 0 0 0 0 0 0 0 0 0 0Net cash flows from financing activity 0 0 0 0 0 0 0 0 0 0 0 0 0Net cash increase or decrease 692,157 644,087 598,789 532,615 540,929 563,942 596,958 572,373 613,732 677,794 727,046 709,295 7,469,717Beginning cash 25,995,538 26,687,695 27,331,782 27,930,571 28,463,186 29,004,115 29,568,056 30,165,015 30,737,388 31,351,120 32,028,914 32,755,960 25,995,538Ending cash 26,687,695 27,331,782 27,930,571 28,463,186 29,004,115 29,568,056 30,165,015 30,737,388 31,351,120 32,028,914 32,755,960 33,465,255 33,465,255
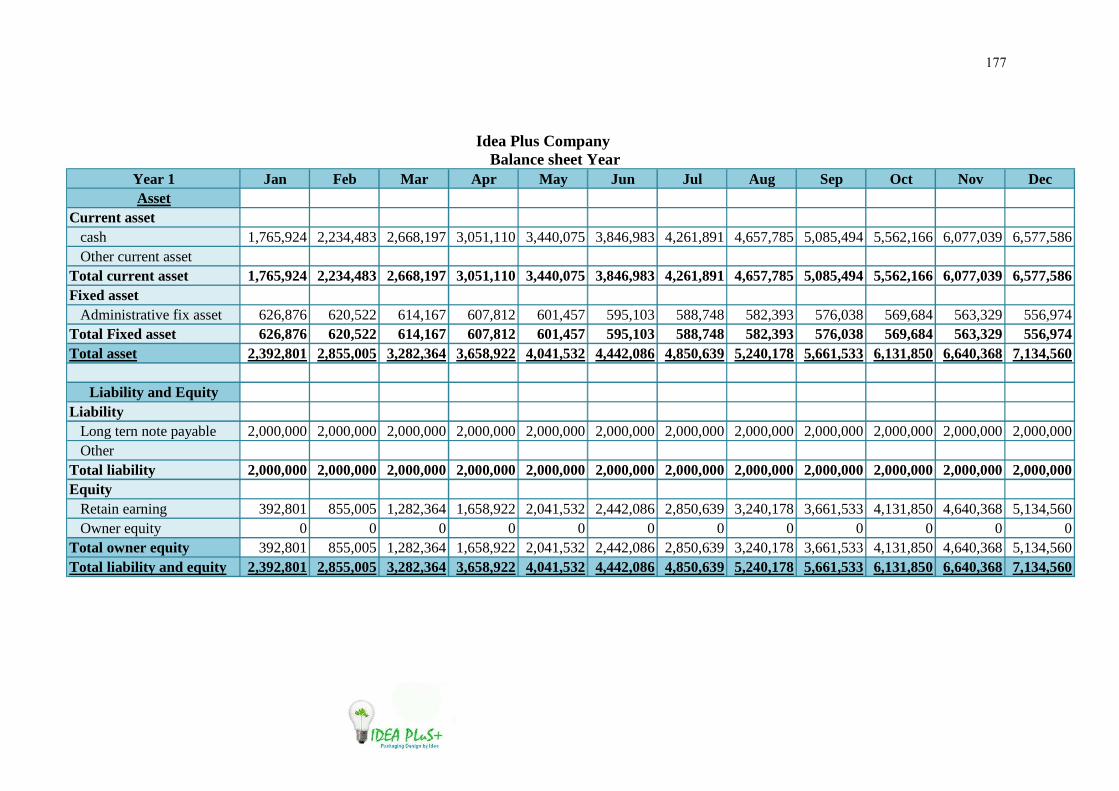
177
Idea Plus Company
Balance sheet Year Year 1 Jan Feb Mar Apr May Jun Jul Aug Sep Oct Nov DecAsset
Current asset cash 1,765,924 2,234,483 2,668,197 3,051,110 3,440,075 3,846,983 4,261,891 4,657,785 5,085,494 5,562,166 6,077,039 6,577,586 Other current assetTotal current asset 1,765,924 2,234,483 2,668,197 3,051,110 3,440,075 3,846,983 4,261,891 4,657,785 5,085,494 5,562,166 6,077,039 6,577,586Fixed asset Administrative fix asset 626,876 620,522 614,167 607,812 601,457 595,103 588,748 582,393 576,038 569,684 563,329 556,974Total Fixed asset 626,876 620,522 614,167 607,812 601,457 595,103 588,748 582,393 576,038 569,684 563,329 556,974Total asset 2,392,801 2,855,005 3,282,364 3,658,922 4,041,532 4,442,086 4,850,639 5,240,178 5,661,533 6,131,850 6,640,368 7,134,560
Liability and EquityLiability Long tern note payable 2,000,000 2,000,000 2,000,000 2,000,000 2,000,000 2,000,000 2,000,000 2,000,000 2,000,000 2,000,000 2,000,000 2,000,000 OtherTotal liability 2,000,000 2,000,000 2,000,000 2,000,0002,000,000 2,000,000 2,000,000 2,000,000 2,000,000 2,000,000 2,000,000 2,000,000Equity Retain earning 392,801 855,005 1,282,364 1,658,922 2,041,532 2,442,086 2,850,639 3,240,178 3,661,533 4,131,850 4,640,368 5,134,560 Owner equity 0 0 0 0 0 0 0 0 0 0 0 0Total owner equity 392,801 855,005 1,282,364 1,658,922 2,041,532 2,442,086 2,850,639 3,240,178 3,661,533 4,131,850 4,640,368 5,134,560Total liability and equity 2,392,801 2,855,005 3,282,364 3,658,922 4,041,532 4,442,086 4,850,639 5,240,178 5,661,533 6,131,850 6,640,368 7,134,560
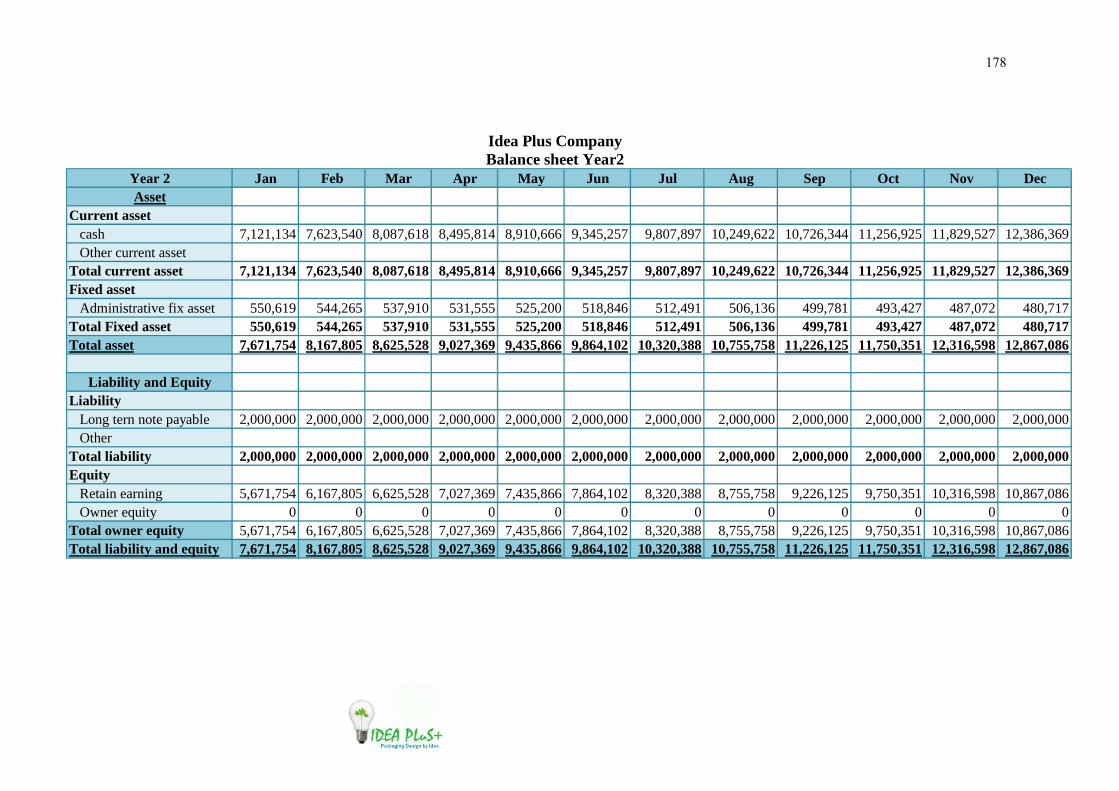
178
Idea Plus Company Balance sheet Year2
Year 2 Jan Feb Mar Apr May Jun Jul Aug Sep Oct Nov DecAsset
Current asset cash 7,121,134 7,623,540 8,087,618 8,495,814 8,910,666 9,345,257 9,807,897 10,249,622 10,726,344 11,256,925 11,829,527 12,386,369 Other current assetTotal current asset 7,121,134 7,623,540 8,087,618 8,495,814 8,910,666 9,345,257 9,807,897 10,249,622 10,726,34411,256,925 11,829,527 12,386,369Fixed asset Administrative fix asset 550,619 544,265 537,910 531,555 525,200 518,846 512,491 506,136 499,781 493,427 487,072 480,717Total Fixed asset 550,619 544,265 537,910 531,555 525,200 518,846 512,491 506,136 499,781 493,427 487,072 480,717Total asset 7,671,754 8,167,805 8,625,528 9,027,369 9,435,866 9,864,102 10,320,388 10,755,758 11,226,125 11,750,351 12,316,598 12,867,086
Liability and EquityLiability Long tern note payable 2,000,000 2,000,000 2,000,000 2,000,000 2,000,000 2,000,000 2,000,000 2,000,000 2,000,000 2,000,000 2,000,000 2,000,000 OtherTotal liability 2,000,000 2,000,000 2,000,000 2,000,0002,000,000 2,000,000 2,000,000 2,000,000 2,000,000 2,000,000 2,000,000 2,000,000Equity Retain earning 5,671,754 6,167,805 6,625,528 7,027,369 7,435,866 7,864,102 8,320,388 8,755,758 9,226,125 9,750,351 10,316,598 10,867,086 Owner equity 0 0 0 0 0 0 0 0 0 0 0 0Total owner equity 5,671,754 6,167,805 6,625,528 7,027,369 7,435,866 7,864,102 8,320,388 8,755,758 9,226,125 9,750,351 10,316,598 10,867,086Total liability and equity 7,671,754 8,167,805 8,625,528 9,027,369 9,435,866 9,864,102 10,320,388 10,755,758 11,226,125 11,750,351 12,316,598 12,867,086

179
Idea Plus Company Balance sheet Year3
Year 3 Jan Feb Mar Apr May Jun Jul Aug Sep Oct Nov DecAsset
Current asset cash 12,984,540 13,538,328 14,050,304 14,501,352 14,959,942 15,439,751 15,950,193 16,437,785 16,963,554 17,548,656 18,179,022 18,793,070 Other current assetTotal current asset 12,984,540 13,538,328 14,050,304 14,501,352 14,959,942 15,439,751 15,950,193 16,437,785 16,963,554 17,548,656 18,179,022 18,793,070Fixed asset Administrative fix asset 474,362 468,008 461,653 455,298 448,943 442,589 436,234 429,879 423,524 417,170 410,815 404,460Total Fixed asset 474,362 468,008 461,653 455,298 448,943 442,589 436,234 429,879 423,524 417,170 410,815 404,460Total asset 13,458,902 14,006,336 14,511,956 14,956,650 15,408,886 15,882,339 16,386,427 16,867,664 17,387,078 17,965,825 18,589,837 19,197,530
Liability and EquityLiability Long tern note payable 2,000,000 2,000,000 2,000,000 2,000,000 2,000,000 2,000,000 2,000,000 2,000,000 2,000,000 2,000,000 2,000,000 2,000,000 OtherTotal liability 2,000,000 2,000,000 2,000,000 2,000,0002,000,000 2,000,000 2,000,000 2,000,000 2,000,000 2,000,000 2,000,000 2,000,000Equity Retain earning 11,458,902 12,006,336 12,511,956 12,956,650 13,408,886 13,882,339 14,386,427 14,867,664 15,387,078 15,965,825 16,589,837 17,197,530 Owner equity 0 0 0 0 0 0 0 0 0 0 0 0Total owner equity 11,458,902 12,006,336 12,511,956 12,956,650 13,408,886 13,882,339 14,386,427 14,867,664 15,387,078 15,965,825 16,589,837 17,197,530Total liability and equity 13,458,902 14,006,336 14,511,956 14,956,650 15,408,886 15,882,339 16,386,427 16,867,664 17,387,078 17,965,825 18,589,837 19,197,530

180
Idea Plus Company Balance sheet Year4
Year 4 Jan Feb Mar Apr May Jun Jul Aug Sep Oct Nov DecAsset
Current asset cash 19,460,737 20,081,652 20,659,012 21,172,822 21,694,559 22,238,412 22,814,091 23,366,050 23,957,779 24,611,205 25,311,888 25,995,538 Other current assetTotal current asset 19,460,737 20,081,652 20,659,012 21,172,822 21,694,559 22,238,412 22,814,091 23,366,050 23,957,779 24,611,205 25,311,888 25,995,538Fixed asset Administrative fix asset 400,661 396,861 393,062 389,262 385,463 381,664 377,864 374,065 370,265 366,466 362,666 358,867Total Fixed asset 400,661 396,861 393,062 389,262 385,463381,664 377,864 374,065 370,265 366,466 362,666 358,867Total asset 19,861,397 20,478,513 21,052,074 21,562,084 22,080,022 22,620,076 23,191,955 23,740,115 24,328,044 24,977,671 25,674,555 26,354,405
Liability and EquityLiability Long tern note payable 2,000,000 2,000,000 2,000,0002,000,000 2,000,000 2,000,000 2,000,000 2,000,000 2,000,000 2,000,000 2,000,000 2,000,000 OtherTotal liability 2,000,000 2,000,000 2,000,000 2,000,000 2,000,000 2,000,000 2,000,000 2,000,000 2,000,000 2,000,000 2,000,000 2,000,000Equity Retain earning 17,861,397 18,478,513 19,052,074 19,562,084 20,080,022 20,620,076 21,191,955 21,740,115 22,328,044 22,977,671 23,674,555 24,354,405 Owner equity 0 0 0 0 0 0 0 0 0 0 0 0Total owner equity 17,861,397 18,478,513 19,052,074 19,562,084 20,080,022 20,620,076 21,191,955 21,740,115 22,328,044 22,977,671 23,674,555 24,354,405Total liability and equity 19,861,397 20,478,513 21,052,074 21,562,084 22,080,022 22,620,076 23,191,955 23,740,115 24,328,044 24,977,671 25,674,555 26,354,405

181
Idea Plus Company Balance sheet Year5
Year 5 Jan Feb Mar Apr May Jun Jul Aug Sep Oct Nov DecAsset
Current asset cash 26,687,695 27,331,782 27,930,571 28,463,186 29,004,115 29,568,056 30,165,015 30,737,388 31,351,120 32,028,914 32,755,960 33,465,255 Other current assetTotal current asset 26,687,695 27,331,782 27,930,571 28,463,186 29,004,115 29,568,056 30,165,015 30,737,388 31,351,120 32,028,914 32,755,960 33,465,255Fixed asset Administrative fix asset 355,068 351,268 347,469 343,669 339,870 336,071 332,271 328,472 324,672 320,873 317,073 313,274Total Fixed asset 355,068 351,268 347,469 343,669 339,870 336,071 332,271 328,472 324,672 320,873 317,073 313,274Total asset 27,042,763 27,683,050 28,278,040 28,806,855 29,343,985 29,904,127 30,497,286 31,065,860 31,675,792 32,349,787 33,073,033 33,778,529
Liability and EquityLiability Long tern note payable 2,000,000 2,000,000 2,000,000 2,000,000 2,000,000 2,000,000 2,000,000 2,000,000 2,000,000 2,000,000 2,000,000 2,000,000 OtherTotal liability 2,000,000 2,000,000 2,000,000 2,000,0002,000,000 2,000,000 2,000,000 2,000,000 2,000,000 2,000,000 2,000,000 2,000,000Equity Retain earning 25,042,763 25,683,050 26,278,040 26,806,855 27,343,985 27,904,127 28,497,286 29,065,860 29,675,792 30,349,787 31,073,033 31,778,529 Owner equity 0 0 0 0 0 0 0 0 0 0 0 0Total owner equity 25,042,763 25,683,050 26,278,040 26,806,855 27,343,985 27,904,127 28,497,286 29,065,860 29,675,792 30,349,787 31,073,033 31,778,529Total liability and equity 27,042,763 27,683,050 28,278,040 28,806,855 29,343,985 29,904,127 30,497,286 31,065,860 31,675,792 32,349,787 33,073,033 33,778,529
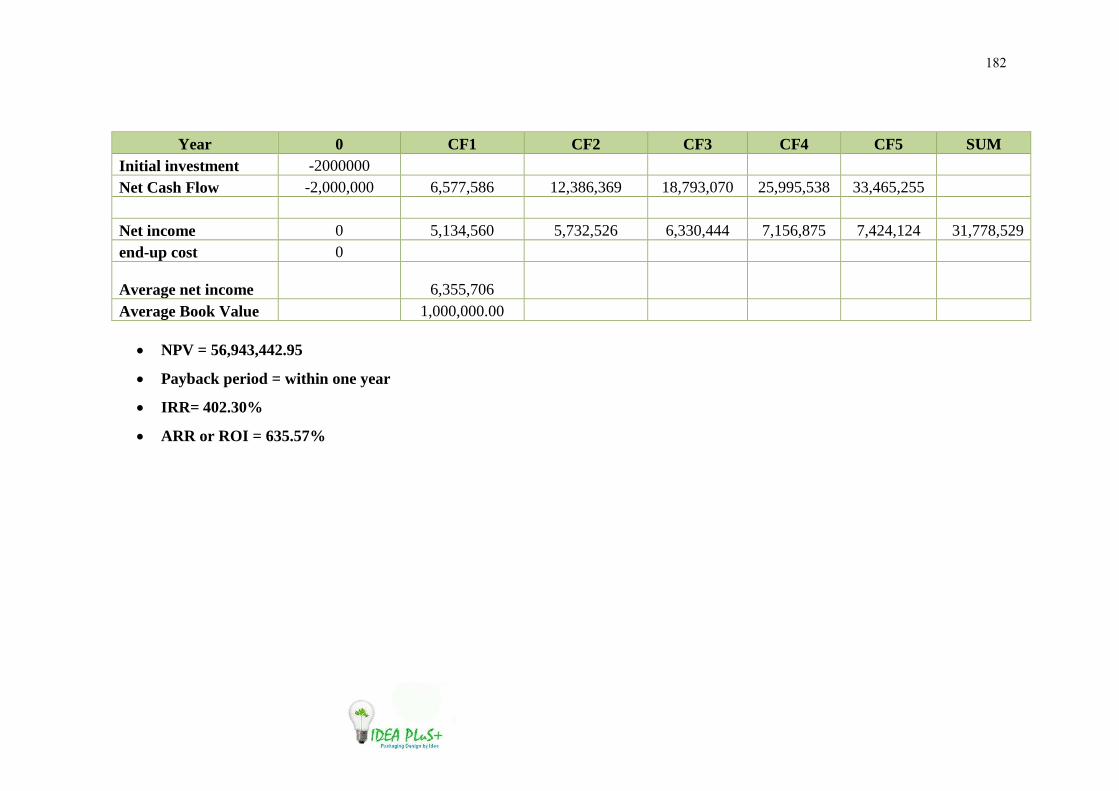
182
Year 0 CF1 CF2 CF3 CF4 CF5 SUM
Initial investment -2000000 Net Cash Flow -2,000,000 6,577,586 12,386,369 18,793,070 25,995,538 33,465,255 Net income 0 5,134,560 5,732,526 6,330,444 7,156,875 7,424,124 31,778,529 end-up cost 0
Average net income
6,355,706 Average Book Value 1,000,000.00
• NPV = 56,943,442.95
• Payback period = within one year
• IRR= 402.30%
• ARR or ROI = 635.57%

183
Chapter 6
Risk Management
Risk Management is a systematic approach to
minimizing an organizations exposure to risk. A risk
management system includes various policies, procedures
and practices that work in unison to identify, analyze,
evaluate, address and monitor risk. Risk management
information is used along with other corporate
information, such as feasibility, to arrive at a risk
management decision. Transferring risk to another party,
lessening the negative affect of risk and avoiding risk
altogether are considered risk management strategies.
Therefore be considered the identification, assessment,
and prioritization of risks followed by coordinated and
economical application of resources to minimize, monitor, and control the probability and/or
impact of unfortunate events or to maximize the realization of opportunities. Risks can come
from uncertainty in financial markets, project failures, legal liabilities, credit risk, accidents,
natural causes and disasters as well as deliberate attacks from an adversary. Risk
management consists of external risk and internal risk:

184
6.1 External Risk management
External risk are beyond human controls that are unexpected in general to be broadly
predictable because the external risk can not to control, manage by manager or employees
such as political, environment, social, technology, and natural disasters. The risk
management encompasses many areas such as finance, politics and national cultures, and
there are many literatures that focus significantly on risk management in each area. For the
packaging business is risky about supplier, technology, third party, political, and customer
change in demand, but our company will plan to solve or prepare for the risks that occur in
the future.
1. Supplier risk
Idea Plus Company has a monopoly of
supplier, it effects to a supplier risk because our
company designs packaging by customer order and
then will send packaging outline to King
Carton Company in Chiang Rai. They are a
paper packaging business that they can
produce paper packaging. It result to our
company reduce overall costs and expand quickly into new markets. Therefore, Idea Plus
Company is highly dependent on suppliers to achieve business and our company has also
exposed to the risk of supplier’s suddenly going bankrupt, closing operations or being
acquired.
Our company will plan the choices to reduce risk in the future by:
• Establish and use benchmarks for measuring supplier performance.
• Creating a system for collaboration and supplier development.
• Creating system suppler networks in the future.
• Give insight to manufacturers to create defensive and offensive strategies that turn
risk into a competitive advantage.
• Improve competitive position in the market
• Position manufactures to better address customer needs by addressing supplier
vulnerabilities before they shut down.

185
2. Outsourcing Risk
Outsourcing a process in which a company
delegates some of its in-house operations/processes to a
third party. Thus, business outsourcing is a transaction
through which one company acquires services from
another while maintaining ownership and ultimate
responsibility for the processes. The company then
informs its provider what it wants and how it wants the
work performed. So, the company can authorize the provider to operate as well as redesign
basic processes in order to ensure even greater cost and efficiency benefits. Idea Plus
Company outsource the transportation with Nim See Seng Transport in Chiang Rai because
Nim See Seng is aleader of logistic service with international standard to satisfy the
customer in Chiang Rai and they have subsidiaries all of part of Thailand. Nim See Seng
constantly serves with quality and all of the businesses in Nim See Seng Groups are well-
organized, being trustful. Under the management of the experts who maintains the
successful of the company on the basis of understanding and mention to be the best.
Therefore, Idea Plus Company believe in Nim See Seng service because our company hasn’t
more experience about logistic and transportation, it result to our company has risks for
shipping product to customers. Then, Idea Plus Company can reduce transportation risk by
use Nim See Seng transport service. Outsourcing has benefits for the company it ensure that
companies can pass the reduced costs for transportation and cost of hiring personal to take
care of goods and shipping product. For the negative effects of outsourcing can be decreased
quality, increase in time-to-market, poorer customer service, hidden costs, loss of control,
unreliable vendors and negative long-term effects on business.

186
3. Customer Perspective Risk
Idea Plus Company uses customer relationship management because it’s a broadly
recognized, widely-implemented strategy for managing and nurturing a company’s
interactions with customers and sales prospects. Idea Plus Company has risky customer
because customer can change in paper packaging demand by other factors such as trend,
competitor, and etc. Customers have opportunity to return buy the original packaging and
customers turn to purchase packaging with competitors or substitute products that it effect to
quantities of sale product and gross profit company. Then, Idea Plus Company used
marketing help to enterprise identify and target its best customers and generate qualified
leads for the sales team by use marketing and customer service to make customer loyalty.
Marketing encompasses capabilities for managing customer loyalty, lists, collateral, and
internal marketing resources. Customer service is an important differentiator, organization
are increasingly turning to technology platforms to help them improve their customers’
experience while increasing efficiency costs. Moreover, company will consider customers
need by
• Use pricing strategy, company charge the price are appropriate with product quality.
• Product quality is the goods features and characteristic of product or service to
customer.
• Use the best way to deliver product to customer.
• Use technologies to design package for customer satisfy.
• Our company will advertise as seasoning for motivate customer.
• Make buyer is satisfied after purchase depends on the offer’s performance in relation
to the buyer’s expectation.

187
4. Competitive Risk
Idea Plus Company use competitor analysis strategy to analysis provides both
offensive and defensive strategic through identify opportunities and threats. Competitor
sources of competitor analysis into one framework in the support of efficient and effective
strategy formulation, implementation, monitoring and adjustment. For the paper packaging
business, it established at the Chiang Rai province. Although a few of competitor in Chiang
Rai, it can risk for Idea Plus company because other packaging business by copy product,
boxes design, promotion can motivate customers than Idea Plus company, and new
businesses can entry in this marker can reduce market share in this packaging businesses
also. So, Idea Plus Company should create new strategies for difference from competitors,
give more qualities for our packaging, monitor about technology for improve our product for
customer, increase channels the ways to contract with customers, find new customers and
increase strategies for respond to more group of customer, and create new styles of
packaging for attraction to customer and difference from competitors and Idea Plus
Company can get more market share in this packaging business.
5. Technology Risk
Technology can be most broadly defined as the
entities, both material and immaterial, created by the
application of mental and physical effort in order to
achieve some value. In this usage, technology refers to tools
and machines that may be used to solve real-world
problems. For The Technology Machine, other
companies challenge readers to understand the spirit and core
drivers of growth: technology, knowledge, and individual
excellence. By combining rigorous research with their
extensive experience with technology advances that have changed industry, Moody and
Morley are able to supply simple guidelines for future growth and detail their keen vision of
future systems, leaders, and workers. It effect to technology are rapidly changing. Then,
technology has effected to the packaging business because technology has helped develop
more improve packaging business. Technology can create new ideas and technology
increase market share and more demand to customer needs our product. So, new technology
188
can increase market share to the company that is the best opportunity for the first one
company use a new technology. Today, technology has a dramatically to change in machine
or software package. Therefore, Idea Plus Company have to monitor the new technology and
collect information what is a trend for customer need.
6. Political Risk
Politics is a process by which groups of people make collective decisions. The term
is generally applied to behavior within civil governments, but politics has been observed in
other group interactions, including corporate, academic and religious institutions. It consists
of "social relations involving authority or power" and refers to the regulation of a political
unit, and to the methods and tactics used to formulate and apply policy.
In Thailand, the politics of Thailand are currently
conducted within the framework of a constitutional
democratic monarchy, whereby the Prime Minister Abhisit
Vejajiva is the head of government and a hereditary monarch is
head of state. Under the present constitution, the Prime
Minister must be a Member of Parliament. Cabinet members do
not have to be Members of Parliament. The legislature can hold
a vote of no-confidence against the Premier and members of his
Cabinet if it has sufficient votes. The judiciaries are independent of the executive and the
legislative branches. According to the constitution, the three major independent authorities
holding the balance of power are executive, legislative, and judicial.

189
Political risk in Thailand, for a business, the implication for political risk is that there
is a measure of likelihood that political events may complicate its pursuit of earnings
through direct impacts (such as taxes or fees) or indirect impacts (such as opportunity cost
forgone). As a result, political risk is similar to an expected value such that the likelihood of
a political event occurring may reduce the desirability of that investment by reducing its
anticipated returns. For the packaging businesses, they are affected form government by
Free Trade Area (FTA). Free Trade Area is the economic integration with 10 countries in
Asian to reduce tariff between with each other and tax rate is higher than the outside the
FTA, which will include a liberalization of trade and service and the investment. The FTA
with Thailand results to packaging business in Thailand compete with other countries such
as New Zealand and Australia. So, the packaging business in Thailand should to increase
potentials to improve packaging business for competitive with other countries by use
technologies to reduce cost, use new innovation to improve business, make products are
several types, and products have standard quality to produce.
7. Economic Risk
Economic is a process that uses resources to create a commodity that is suitable for
exchange. This can include manufacturing, warehousing, shipping, and packaging. Some
economists define production broadly as all economic activity other than consumption. They
see every commercial activity other than the final purchase as some form of production.
Production is a process, and as such it occurs through time and space. Because it is a flow
concept, production is measured as a "rate of output per period of time". Economic can help
us to forecast the opportunity cost expresses the idea that for every choice, the true
economic cost is the next best opportunity. Choices must be made between desirable yet
mutually exclusive actions. It has been described as expressing "the basic relationship
between scarcity and choice." For the economic risk, Economic risks can be manifested in
lower incomes or higher expenditures than expected. The causes can be many, for instance,
the hike in the price for raw materials, the lapsing of deadlines for construction of a new
operating facility, disruptions in a production process, emergence of a serious competitor on
the market, the loss of key personnel, the change of a political regime, or natural disasters.

190
The Ministry of Finance of Thailand
announced that the Thai Economy in 2009 and 2010 is
expected to improve from previous forecast at -2.8
percent in 2009 and 3.5 percent per year in 2010. Thai
economy in 2010 is expected to show an improving
trend, with the positive factors coming from revival
among Thailand’s trading partners that would support
higher export, and an acceleration of public investment
under the “Stronger Thailand 2012” program. Thai
Central Bank officials commented that there were no
signs of upward pressure in commodity prices sufficient to warrant a change in policy at
present. It is believed that, for the foreseeable future, the Monetary Policy Committee policy
interest rate will be held steady and that short term interest rates will rise by only a limited
margin. (Outlook for January 2010) There is growing interest as to whether dollar selling
will recommence. While some are of the opinion that higher US rates will restrict dollar
selling to within a limited range, others feel that there is a significant risk that, against the
backdrop of Thailand's balance of trade surplus, the dollar - baht exchange rate could go
dollar low/ baht high. Nevertheless, risk factors associated with the recovery of the Thai
economy come from the fragility of global economic recovery, higher commodities price as
a result of higher global oil price, and political situation that might delay the recovery in
private sector. Consequently, public sector still has to continue accelerating budget
disbursement in line with the target at the time when private sector does not yet fully
recover, and promote the role of the private sector to be the main engine of Thailand’s
economic growth in the near future.
191
For the paper packaging in Chiang Rai will effect form the oil production are rise
against a background of high oil price and inflation will be the degree to which Mauritania’s
monetary authorities are able to manage the excess liquidity caused by surging oil revenue
that Idea Plus Company expect to spend the cost increase spending and customer reduce for
demand paper packaging from inflation situation also. Idea Plus Company will plan to
increase number of sale by use marketing, customer service and customer relationship to
make customer royalty and attract customer order paper packaging at Idea Plus Company.
Moreover, Idea Plus Company is especially to monitor the technology and trend change for
improve and develop our company is better than competitor.

192
6.2 Internal Risk Management
Risk is a state of uncertainty where some of the possibilities involve a loss,
catastrophe, or other undesirable outcome. Uncertainty must be taken in a sense radically
distinct from the familiar notion of Risk, from which it has never been properly separated.
The internal risk causal relations to the phenomena of our organization can control it such as
employee.
1. Communication Risk
Communication is a process of
transferring information from one entity to
another. Communication processes are sign-
mediated interactions between at least two
agents which share a repertoire of signs and
semiotic rules. Communication can be
perceived better as a two-way process in
which there is an exchange and
progression of thoughts, feelings or ideas (energy) towards a mutually accepted goal or
direction (information). Communication is a process whereby information is enclosed in a
package and is channeled and imparted by a sender to a receiver via some medium. The
receiver then decodes the message and gives the sender a feedback. All forms of
communication require a sender, a message, and a receiver. Communication requires that all
parties have an area of communicative commonality. There are auditory means, such as
speech, song, and tone of voice, and there are nonverbal means, such as body language, sign
language, paralanguage, touch, eye contact, and writing. The communication risk may be
field of communication by distinct into three types there are human communication, mass
communications, and communication disorders. Other factors it may be come from noise of
communication. Noise is anything that interferes with the decoding of messages sent over
the channel by an encoder. There are many kinds of noise for example environment noise,
physiological-impairment noise, semantic noise, organizational noise, cultural noise, and
psychological noise. Therefore, the problem from communication can make the mistake
between person and effect to quality of organization and difficult to improve organization.
193
When an issue has problem, the firm need to show the issue was discussed with the owner.
So, manager should document meeting with owner document or employee in organization to
make sure for understand. Moreover, manager can give activities between employees and
managers in organization by company has party with employee and managers has project to
take employees our company go to other organizations to learn how about their organization
which way to the unity in organization.
2. Employees Risk
Employees are a person who is hired to provide services to a company on a regular
basis in exchange for compensation and who does not provide these services as part of an
independent business. An employer is a person or institution that hires employees or
workers. Employers offer hourly wages or a salary in exchange for the worker's labor power,
depending upon whether the employee is paid by the hour or a set rate per pay period.
Employees may contribute to an enterprise. The employer typically maintains ownership of
intellectual property created by an employee within the scope of employment. Therefore, the
employment relationship necessarily includes conflicts of interests between employers and
employees, and the form of such conflicts. Any conflicts that exist are seen as a
manifestation of poor human resource management policies or interpersonal clashes such as
personality conflicts, both of which can and should be managed away. From the perspective
of pluralist industrial relations, the employment relationship is characterized by a plurality of
stakeholders with legitimate interests and some conflicts of interests are seen as inherent in
the employment relationship (e.g., wages v. profits). Lastly, the critical paradigm
emphasizes antagonistic conflicts of interests between various groups. Idea Plus Company
will plan the solution about conflict between company and employees following:
• Increasing pressure and scrutiny to control employee benefit costs effectively
communicate benefit features and ensure legislative and regulatory compliance – whilst
offering competitive benefits that engage and retain their employees.
• Solutions assist clients to identify, manage, mitigate and transfer risks to their
organization arising through risks to their employees, contractors and visitors. We identify

194
the cost inputs and build a business case for improvements that improve employee
productivity and company profitability.
• Compensation Solutions (WCS) provides a comprehensive approach to workers’
compensation, focusing on continuous improvement to meet specific client needs. Key
services offered include premium and claims reviews, consolidation of national programs,
premium monitoring and premium allocation models, a range of outsourced options, and
program design and review. We can exceed client expectations in minimizing this key
business expense.
Moreover, Idea Plus Company is also must maintain competent employees because
other organizations are also striving our employees. The company can maintain their
employees by give system to provide employees with adequate and equitable rewards for
their contribution to meeting organization goals. Compensation has two kinds. There are
direct financial compensation and indirect compensation. Direct financial compensation pay
to a person receives in the form of wages and salaries. Indirect financial compensation is a
financial rewards that paid by vacations, sick leave, holidays and medical insurance. Then,
Idea Plus Company will safe environment and enjoy good health are more likely to be
productive and yield long-term benefits to the organization that can help company to
increase capacity and retain employees in organization.

195
3. Financial Risk
Finance includes saving money and often includes lending money. The field of
finance deals with the concepts of time, money and risk and how they are interrelated. It also
deals with how money is spent and budgeted. Financial assets, known as investments, are
financially managed with careful attention to financial risk management to control financial
risk. Financial risk is normally any risk associated with any form of financing. Risk is
probability of unfavorable condition; in financial sector it is the probability of actual return
being less than expected return. There will be uncertainty in every business. Financial risk is
the additional risk a shareholder bears when a company uses debt in addition to equity
financing. Companies that issue more debt instruments would have higher financial risk than
companies financed mostly or entirely by equity. Idea Plus Company will reduce financial
risk in the future by:
• The company maintains a conservative capital structure. It has also worked hard to
diversify its business in recent years, in part to reduce its dependence on residential
contractors where it traditionally experiences higher rates of bad debt.
• Currently, the firm is anticipating an economic slowdown. As a result, it's reducing
the time it allows some customers to pay invoices and has been modernizing its
manufacturing equipment.
• Working capital requirements of a business should be monitored at all times to
ensure that there are sufficient funds available to meet short-term expenses.

196
4. Leadership Risk
Leadership has been challenging and depending on the situation. Leadership
establishes processes and transparency in decision-making, to articulate their own values
and visions clearly but not impose them. Leadership is about setting and not just reacting to
agendas, identifying problems, and initiating change that makes for substantial improvement
rather than managing change. A leader is a person who influences a group of people towards
a specific result. It is not dependent on title or formal authority. Leadership can be perceived
as a particularly emotion-laden process, with emotions entwined with the social influence
process. In an organization, the leaders’ mood has some effects on his/her group. These may
be effects to organization there are 3 levels:
1. The mood of individual group members. Group members with leaders in a positive
mood experience more positive mood than do group members with leaders in a negative
mood. The leaders transmit their moods to other group members through the mechanism of
emotional contagion .Mood contagion may be one of the psychological mechanisms by
which charismatic leaders influence followers.
2. The affective tone of the group. Group affective tone represents the consistent or
homogeneous affective reactions within a group. Group affective tone is an aggregate of the
moods of the individual members of the group and refers to mood at the group level of
analysis. Groups with leaders in a positive mood have a more positive affective tone than do
groups with leaders in a negative mood.
3. Group processes like coordination, effort expenditure, and task strategy. Public
expressions of mood impact how group members think and act. When people experience
and express mood, they send signals to others. Leaders signal their goals, intentions, and
attitudes through their expressions of moods. For example, expressions of positive moods by
leaders signal that leaders deem progress toward goals to be good. The group members
respond to those signals cognitively and behaviorally in ways that are reflected in the group
processes.

197
Therefore, Idea Plus Company expects that expressions of positive mood by the
leader improve the performance of the group, although in other sectors there were other
findings. Leaders are recognized by their capacity for caring for others, clear
communication, and a commitment to persist. An individual who is appointed to a
managerial position has the right to command and enforce obedience by virtue of the
authority of his position. However, only authority of position has the backing of formal
sanctions. It follows that whoever wields personal influence and power can legitimize this
only by gaining a formal position in the hierarchy, with commensurate authority. Leadership
can be defined as one's ability to get others to willingly follow.

198
6.3 Summary Risk Management
Risk management analysis is very helpful in examining the risks and following a
well planned process to hedge the risk. Risk management analysis is very important for
proper application of the risk management policies. This analysis is necessary because the
demand of the market and the trends are changing constantly and only proper analysis of
risks can help the businesses to achieve the set targets.
The strategies to manage risk include transferring the risk to another party, avoiding
the risk, reducing the negative effect of the risk, and accepting some or all of the
consequences of a particular risk. Many of the risk management standards have come under
criticism for having no measurable improvement on risk even though the confidence in
estimates and decisions increase.

199
Chapter 7
Summary
Nowadays, the package is very important for a coordinated system of preparing
goods for transport, distribution, storage, retailing and use. It is a complex, dynamic,
scientific, artistic and controversial business function. First, it protects a product from
damage or contamination by micro-organisms and air, moisture and toxins. The product
must be protected against being dropped, crushed, and the vibration it suffers during
transport. Delicate products such as fruits need to be protected by a rigid package such as a
laminated container. The product most also be protected against the climate including high
temperatures, humidity, light and gases in the air. It must also be protected against micro-
organisms, chemicals, soil and insects. Second, it keeps the product together, to contain it
because some shapes cannot be easily packaged, for example, certain vegetables. However,
there are methods of getting around this problem. Suppliers of canned vegetables such as
carrots have developed a particular type of plant that yields carrots that are straight and
smaller than the normal variety. These fit into cans. Some products such as fruit juices and
sausages need to be contained in packages that hold them together and are sealed to prevent
spillage and loss. Next, it identifies the product. Packaging is the main way products are
advertised and identified. To the manufacturer the package clearly identifies the product
inside and it is usually the package that the customer recognizes when shopping. Advertising
is very important when a manufacturer launches a new or existing product. The package,
through its color scheme or logo, is what is normally identified by the customer. The
package will also contain important information including ingredients and ‘sell by date’. It
also helps to protection during transport and ease of transport. A package should be designed
to make it easy to transport, move and lift. A regular shaped package can be stacked without
too much space between each package being wasted. This means that more packages can be
transported in a container of a lorry. Unusually shaped packages can lead to space being
wasted and this can be costly if thousands of the same package are been transported. Finally,
in supermarkets and shops it must be possible to stack packages so that space is not wasted
on the shelves. Lost space on shelves is looked up on a lost opportunity to sell to a customer.
Also, the package must be designed in such a way that all the important information can be
seen by a potential buyer, especially the product name. The next time you visit the
200
supermarket look carefully at the shape of the packages. They are usually the same
rectangular / cuboids shape. It is the selection of colours and shades that determine whether
the product inside is regarded as a quality, sophisticated or cheap item. Often packages are
stacked on top and alongside each other to reduce wasted space. The shape and form of the
package determines how efficiently they can be stacked or stored. Thus, the package is so
important and provides the good reasonable for opportunity to us to do this business.
The packaging as we know it today is the result of a long development process. The
earliest forms of packaging were made from animal skins, large leaves and vegetables, and
then it has developed continuously though technologies and evaluations. Therefore, the
packaging in nowadays contain major manufacturers on total market value in global market
for consumer goods, and food and beverage industry. However in Thailand, there are about
1,000 paper packaging manufacturers around the country and most of them are SMEs with
total investment is about 14965 million baht, and employment is approximately 19,366
employees. It mostly contains for animal feed, cement, chemicals, shopping bag for pack the
document and bags for the shopping mall, and transportation. Production of packaging paper
is available materials in Thailand. Especially, raw material as Kraft paper and cardboard
paper which our capacity is up to 2.40 million tons and 0.30 million tons per year which
sufficient to supply for the paper packaging industry but production costs direct variation to
raw materials cost, but the average income per company of packaging business and return on
asset increase continuously. Thus, our company provides paper boxes such as corrugated
fiberboard box, cardboard paper box, and paper bags such as Kraft paper bag and cardboard
paper bag which we hope those products will give us to become a leading provider of paper
packaging for our valued clients in Chiang Rai. We decide to develop and create new
structure design and function in various shade of packaging color continuously to add the
value to our customers products, be more attractive, and for more convenience of end users
such as provide the various designs and appearance to response customers psychological
needs especially OTOP products which still have to develop the packaging to create the
differentiation. The customers will interest in our product because of its graphic design,
value added and benefits. The design will increase and add the value to our customers
products, so we also have a plan to change packaging appearance; we need to change the
design of our packaging product to be rather than the box in cubic shape or size. Moreover,
we will add other related service such as provide the packaging for transportation such as
201
corrugated board box, and handbill printing, label printing are included which those can be
success through various activities and policies of marketing, financing, accounting, and
human resource functions. Furthermore, we get quite good opportunity from general
environment for our business in political, economic, social and environment, and technology
environment which those are support our business in reasonable. For the political, they
support and too emphasize on the OTOP products in the importance of quality and standard
as a tool for developing which there are related to our target beside of SMEs businesses. As
they more in quality and standard of OTOP products, it the more concern in paper
packaging. And they also try to issue the law about pollution control, have campaign about
save world life, and let the people use paper packaging instead of plastic which those are
more concern in paper packaging and make it awareness for our customers as well as in the
economic factor which the industries register of paper that increase from 7,556.1 t0 8,049.7
million bath. It increases 6.6%. It is good opportunity for the paper industries in Chiang Rai
because Chiang Rai has 13 paper industries. That is mean to idea plus has a few of paper
industry competitors and more chance to get more market share. Those are consistent with
current in trend of environment conservation among the social and world wide in contrast
with the technology which is developed to serve the customers’ need. Technology provides
the quality and standard to produce goods which can be cheaper in term cost of production.
Our business has benefit from several areas of technology such as computer, internet,
website, and logistic technology. Moreover, there are few competitors in Chiang Rai which
only one famous competitor around Muang district names King Carton. King Carton
provides the packaging and graphic designing from paper such as corrugated and cardboard
box, set up and die cut box, paper bag, and other paper products from the customers’
ordering. King Carton set the price depend on the volumes of the, and allocate their
company where is easy for customers with the various channels such as telephone, and
website which providing the information of their business, products, services, and the
knowledge about the paper and packaging, and through the advertising on the brochure with
a half page of information about their logo, slogan, address of their shop and website,
telephone numbers, e-mail, and services, etc. However, we employ the King Carton as our
production division or we can call them as supplier instead of competitor which King Carton
will supply the papers and other equipments for us. We don’t need to build the factory and
buy the machines, but we need to design, distribute, and sell the products to our customers

202
who can be divided into family business as the mainly customers and who provide the
OTOP products which help them to create more value to their products, and to satisfy their
need directly. Those customers can be segmented into 3 groups that are Production Sector
(Agricultural Processing, Manufacturing), Trading Sector (Wholesale, Retail), and Service
Sector which are from three groups in the market. It has small business, medium business,
and large business. But, we totally emphasis on the medium and small businesses as our
target markets because both production sector and trading sector as wholesale, retail and
service in Chiang Rai such as small businesses, new businesses, OTOP projects, agriculture
industries, and other business that are small businesses and medium industries are good
opportunity and more market share form packaging paper business which attract the
potential customer's attention and to have a positive impact upon the purchasing decision.
Thus according to there is one competitor around Muang district and some others few, it
quite not competing strongly because beside of King Carton case, the part of the new entry
for packaging business, it is not easy to invest in this business as the individual business
because it is quite high investment which use too much money for the machines and printers
which very expensive. Therefore, there is a good opportunity to provide the paper packaging
in Chiang Rai which provides more options for customers to select and order what they
really need and want. We will serve the less volumes than the competitor while serve the
large volumes than competitor as well.
Our business tries to create an image or an identity our products, brand or company in
our targeted market’s mind that when the customers want to promoting, adding value, and
take care of environment, they recognize our products in their mind for optioning through
designing by our team according for customers’ need with the product differentiation
especially in design, pattern, style, and function which help to create more value to the
products and to promote the brand, and quality of customers’ products along with the
friendly with the environment because we concern with suitable for customer’s products and
concern more in the environment problem. And we decide to set the reasonable price which
is depended on the cost of raw materials especially the cost of papers, and located on Phahon
Yothin Road, Wiang sub-district, Muang Chiang Rai district, Chiang Rai which the
customers can receive their products by themselves if they prefer, if not we also provide
transportation service for our customers by Nimseeseng Transportation Company which
sending the products directly that make us to save costs. Moreover, we emphasis on
203
advertising which for increasing in revenue and to make the customers know more about our
business through the billboard, brochure, online marketing as a website, and door-to-door
service by our sale representatives. For management, Idea Plus is register as the company
limited with Office of commercial Affiars Chiangrai, in company there are 7 officers (Board
of Director is exclude) that the company recruit by the qualification and define the job
responsibility to work with Idea Plus company. In company, we have performance
evaluation to motivate the officer to work effectively, and divide income in to 3 parts which
the first is for principle and 15% interest investors. After pay interest for investor the money
will be allocated for promoters or shareholders equally and another part is for company to
maintain liquidity in invest in next year in company.

204
Appendix Type of Business Organization
Businesses may be operated in various types from individual as the owner or by
investing with other individuals as the group. In order to decide to choose any type of
businesses, the entrepreneurs must realize various components of business operations
such as nature of businesses, capital, business capability, etc, in order for the success of
businesses and maximization of profit and benefits.
Company Limited Registration
According to the Civil and Commercial Code
205
� Company Limited
Is that kind of company which is formed with a capital divided into equal shares, the
liability of the shareholders being limited to the amount unpaid on the shares respectively
held by them.
� Establishment of Company Limited
To establish the company limited, shall process according to the following:
Must have at least 3 persons signing together in order to prepare Memorandum and then
register. Upon receiving the amount of shares, the director must register as the company
within 3 months from the date of company’s meeting to establish the company.
The promoters must have the following qualifications
(1) Be ordinary person, not juristic person
(2) Be 12 years old or more
(3) Must reserve to buy at least 1 share
Information used to register the Memorandum
(1) Company’s name (the same as the name reserved)
(2) Location of head office (located at which province)
(3) Objective of the company
(4) Registered capital must be divided into each share with the same value (share’s value
must be at least 5 Baht)
(5) Name, address, age, occupation and number of shares that person who start up the
company reserve to buy the shares)
(6) Name, address, age of 2 witnesses

206
When the Memorandum has been registered, shall perform the following:
(1). All promoters manage to reserve and buy all the shares
(2). When all the shares are reserved, the promoters must with out delay hold a
general meeting of subscribers which shall be called the statutory meeting.
Meeting agenda:
(1) The adoption of the regulations of the company, if any.
(2) The ratification of any contracts entered into and any expenses incurred by the
promoters in promoting the company.
(3) The fixing of the amount, if any, to be paid to the promoters.
(4) The fixing of the number of preference shares, if any, to be issued, and the nature
and extent of the preferential rights accruing to them.
(5) The fixing of the number of ordinary shares or preference shares to be allotted as
fully or partly paid-up otherwise than in money, if any, and the amount up to which they
shall be considered as paid-up. The description of the services or property in return for
which such ordinary shares or preference shares shall be allotted as paid-up shall be
expressly laid down before the meeting
(6) The appointment of the first directors and auditors and the fixing of their
respective powers.
No resolutions of the statutory meeting are valid unless passed by a majority
including at least one half of the total number of subscribers entitled to vote, and
representing at least one half of the total number of shares to such subscribers.

207
The promoters shall over the business to the directors.
The directors shall the reupon because the promoters and subscribers to pay forth
with upon each share payable in money such amount, not less than twenty-five percent of
the share's value. When the collection of share’s price is complete, the authorized director
shall prepare the request for the registration of company’s establishment and submit to the
registrar. Regarding the submission for registration, the authorized director shall sign the
name on the request and must submit to register within 3 months from the date of company
statutory meeting. If not registered within the specified period, the company statutory
meeting shall be void and if would like to register to establish the company, shall arrange the
meeting for persons who reserve to buy the shares again. Regarding the company
establishment, if can perform every step as follows within the same day that the promoters
prepare the Memorandum, and the director can request to register the Memorandum and
register the company within the same day.
(1) Shall have the persons reserve to buy all the shares that the company can be
registered.
(2) Arrange the meeting to establish the company to consider various affairs
according to the Civil and Commercial Code, section 1108, and all the persons who start up
the company and all the persons who reserve to buy the shares shall attend the meeting, and
all of them shall agree in the affairs in the meeting.
(3) Persons who start up the company assign all the affairs to the director.
(4) The director call the person who reserves to buy the shares to pay the shares
according to the Civil and Commercial Code, section 1110, section 2 and such share’s price
has already been paid.

208
Registration
Our Company limited’s registration shall be divided into 2 steps as follows:
1. Registering the Memorandum.
2. Registering the company limited’s establishment
The registration of the modification / change or liquidation of the company
limited
In case that the company limited agrees to modify or change any registered
transactions or the shareholders would like to liquidate the business, shall request for the
registration of the modification / change of such transactions or registration of the
company’s liquidation at the company and partnership registration office that the head office
of the company is located on.
The registration to establish and modify any transactions shall be performed
according to the method and criteria specified by the law and the government’s rules.

209
Registered Transaction that the Company has to register to Modify
or Change
1. The modification or change of memorandum before the company’s
establishment
2. Extraordinary resolution to
(1) Increase capital
(2) Decrease capital
(3) Merge the company
3. Company’s merger
4. The modification or change of memorandum of association after the
company’s establishment
5. Capital increase
6. Capital decrease
7. Regulations’ modification
8. Director
9. Number or name of authorized directors
10. Location of head office and / or branches
11. Company’s seal

210
12. Other transactions that should be publicized
Place for Registration (the same as partnership)
Registration Procedure
1. Submit in person can perform according to the following:
(1) In case of registering for the establishment or changing the company’s
name, the persons who start up the company or company’s director shall
request for verifying and reserving the company’s name to confide that such
name is not duplicated or similar to other names pervious registered. Upon
reserving the name, shall request for the registration of memorandum of
association within 30 days by reserving the name in person or via internet at
www.dbd.go.th.
(2) Purchase the request and form from the Department of Business
Development or any of 7 business development office or provincial business
development office or download from internet from www.dbd.go.th.
(3) Prepare the request for registration and other attachments to the
registrar for consideration.
(4) Pay the fee according to the officer’s order
(5) If aiming to issue the certificate of registered transactions shall submit
the request and pay the fee to the officers.
(6) Receive the certificate of registration.
2. Steps for registering partnership and company via internet (see the steps
in partnership)
211
Criteria of Signing the Signature on the Request for Registration
(1) The signature in the request and the attachments, the person shall sign
by him / herself.
(2) The signature in the request, the person shall sign in front of the
registrar and demonstrate the ID card to the registrar for verification. In case
that the person cannot sign the name in front of the registrar, the person who
request shall sign the name in front of the following person:
(2.1) In case of signing in the country
(1) Administration Officer or Senior Police in the area of the person who
requests.
(2) Member of Thai BAR or
(3) Other persons as notified by the central registrar are
- Certified Public Account
- Committee member or officer of the Thai chamber of commerce
or provincial chamber of commerce who can certify the signature of persons
who request for the registration of partnership / company with the head office
located in the province that the Chamber is located according to the notification
of the Central Partnership Registration Office.
(2.2) In case of signing in foreign countries
(1) Authorized officer of the Thai embassy or consulate, or head of the
office under the Minister of Commerce responsible for the operations in any
212
country or other officers authorized to perform on behalf of such
abovementioned person
(2) Person who can completely certify according to the law of that
country and
(3) 2 Reliable persons who can certify in front of the registrar that the
signature is such person’s signature.
Duties of Company
(1) The company limited must prepare the financial statement once a
month in every 12 months and at least one auditor shall audit to propose to the
ordinary shareholder’s meeting to approve the financial statement within 4
months from the closing date, and submit the financial statement to the
business information service office, department of business development, or
any provincial business development office within 1 month from the date of
financial statement’s approval although such businesses have not yet been
started or have not ceased temporarily; otherwise, they shall have the fine
penalty of no more than 50,000 Baht.
(2) The director shall prepare the copy of list of all shareholders’ names
that are holding the share at the time of the annual shareholders’ meeting and
the list of persons who are not the shareholders from the date of the last
shareholders’ meeting and submit to the department of business development
or any provincial business development office within 14 days from the date of
the meeting; otherwise, they shall have the fine penalty of no more than 10,000
Baht
(3) Must arrange the annual shareholders’ meeting within 6 months from
the juristic person’s registration date, and arrange the next meeting of at least

213
one time for every 12 months; otherwise, they shall have the fine penalty of no
more than 20,000 Baht.
The invitation for the shareholders’ meeting shall be advertised on the
local newspaper for at least one time of at least 7 days before the meeting date,
and shall send via reply mail to every shareholder named in the company’s
registration for at least 7 days before the meeting date, except the invitation for
the shareholders’ meeting to vote for the extraordinary resolution shall be sent
for at least 14 days before the meeting date.
(4) Must prepare share certificate to the company’s shareholders;
otherwise, they shall have the fine penalty of no more than 10,000 Baht.
(5) Must prepare the book of shareholders’ registration of the company;
otherwise, they shall have the fine penalty of no more than 20,000 Baht.
(6) Any companies that relocate the location of head office must request
for the registration to the registrar; otherwise, they shall have the fine penalty
of no more than 20,000 Baht.
In case that the juristic person does not submit the yearly financial
statement as specified by the law, such juristic person has offense, and the
managing director or authorized director on behalf of the juristic person shall
also have the offense too.
Businesses that the Law specifies the period of time of submitting
the registration
1) Request for registering the company’s establishment shall be
submitted within 3 months from the date of company’s establishment.
214
2) Request for registering the appointment of new directors or the
resignation of directors shall be submitted within 14 days from the date of
appointment or date of resignation
3) Request for registering the extraordinary resolution of capital increase
or capital decrease of the company limited or the company’s merger shall be
submitted within 14 days from the extraordinary resolution date
4) Request for registering the new regulation or modification of the
company limited’s regulation must be submitted with 14 days from the
extraordinary resolution date
5) Request for registering the company’s merger shall be submitted
within 14 days from the date of merger
6) Request for registering the company’s liquidation shall be submitted
within 14 days from the liquidation date
7) Request for registering the change of liquidator shall be submitted
within 14 days from the date of change
8) Request for registering the modification of liquidator’s authority shall
be submitted within 14 days from the date that the meeting has the resolution
or the court
9) Request for registering the completeness of the company’s liquidation
shall be submitted within 14 days from the date that the meeting has the
resolution

215
10) The submission of the report of partnership’s liquidation shall be
submitted every 3 months and the liquidator shall submit the report within 14
days from the date that the 3-month period expires.

216
Fee Rate for Registering Company Limited
Registration Company Limited Baht
1. Registering the memorandum of association 500.-
1.1 Registered capital of no more than 1,000,000 Baht 50.-
1.2 Every 100,000 Baht of the increase of registered
capital (fraction of 100,000 Baht shall be counted as
100,000 Baht)
50.-
1.3 Registered capital of more than 50,000,000 Baht 25,000.-
2. Register for company limited’s establishment 5,000.-
2.1 Registered capital of no more than 1,000,000 Baht 500.-
2.2 Every 100,000 Baht of the increase of registered
capital (fraction of 100,000 Baht shall be counted as
100,000 Baht)
500.-
2.3 Registered capital of more than 50,000,000 Baht 250,000.-
3. Registering the company’s merger 5,000.-
4. Registering the medication 250,000.-
4.1 Registering the extraordinary resolution
(capital increase / capital decrease / company’s
merger)
400.-
4.2 Registering the capital increase
(calculate according to every 100,000 Baht of the
increase)
500.-
(Increase for more than 50,000,000 Baht) 250,000.-
4.3 Registering the capital decrease 400.-
4.4 Registering the modification of every clause of the
memorandum of association 400.-

217
4.5 Registering the modification of every clause of the
regulation 400.-
4.6 Registering for new directors per
person 400.-
4.7 Registering for partners’ resignation (no limit) 400.-
4.8 Registering the modification of directors’ authority 400.-
4.9 Registering the change of location of head office and
/ or branches 400.-
4.10 Registering the modification of seal 400.-
4.11 Register other transactions that should be publicized 400.-
5. Registering the company’s liquidation 400.-
6. Registering the change of liquidators 400.-
7. Registering the modification of liquidator’s power and
authority 400.-
8. Registering the modification of liquidation office 400.-
9. Registering the completeness of liquidation 400.-
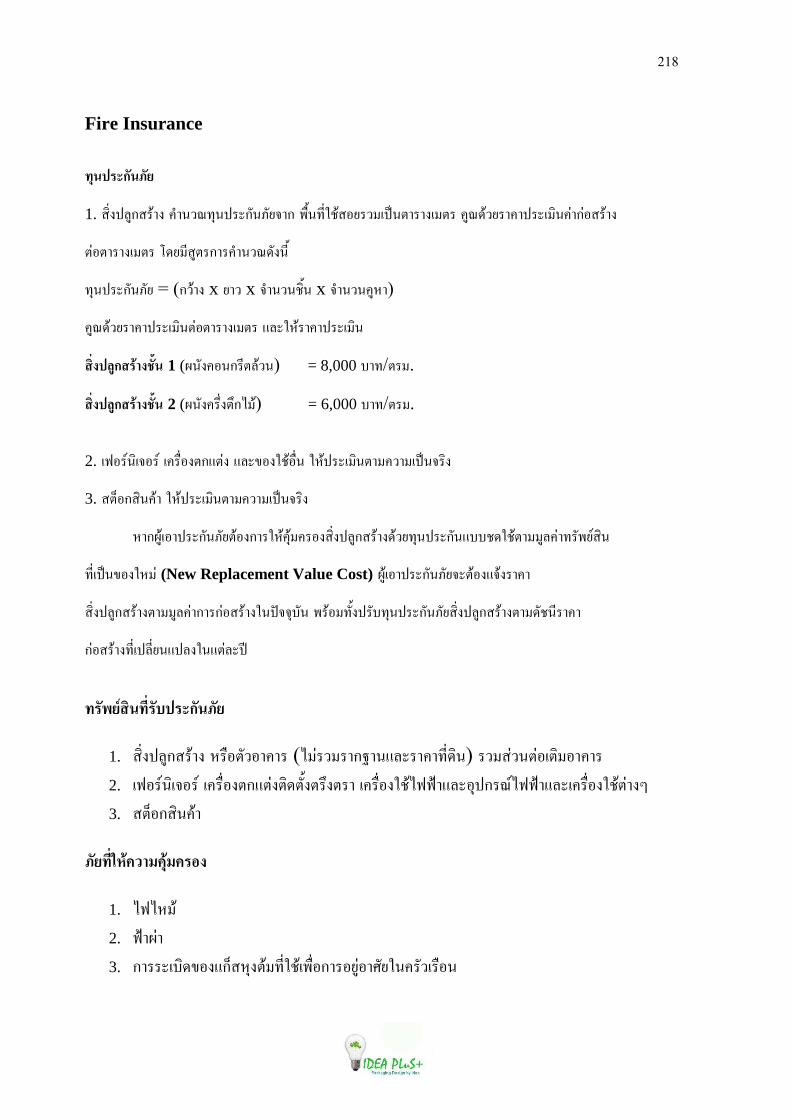
218
Fire Insurance
������ก���
1. �������ก��� � ���������ก�������ก �������������� �!�"��� �" ���#������� ����$�ก$����
"$�"��� �" %#�����"ก�� ����#�����
�����ก����� = (ก��� x ��� x ./01213451 x ./01216780)
679:;2<=060>=?@A41BCDB0=0E@AB= FG?H8;=060>=?@A41
!"#$�%ก '()#*�+, 1 (I1JE6D1ก=LBG;21) = 8,000 M0N/B=A.
!"#$�%ก '()#*�+, 2 (I1JE6=OPEBOกQA;) = 6,000 M0N/B=A.
2. @[email protected]=S @6=TPDEBกFBCE FG?UDEH3;DTP1 H8;>=?@A41B0A620A@>V1.=4E
3. WBXDกW416;0 H8;>=?@A41B0A620A@>V1.=4E
80กI7;@D0>=?กJ1YJ<B;DEก0=H8;6Z;A6=DEW4PE>G7กW=;0E:;2<NZ1>=?กJ1FMM3:H3;B0AA7G6C0N=J[<SW41
NLP@>V1UDEH8AC (New Replacement Value Cost) I7;@D0>=?กJ1YJ<.?B;DEF.;E=060
W4PE>G7กW=;0EB0AA7G6C0ก0=กCDW=;0EH1>\..ZMJ1 [=;DANJ5E>=JMNZ1>=?กJ1YJ<W4PE>G7กW=;0EB0A:J31L=060
กCDW=;0ENLP@>GLP<1F>GEH1FBCG?>]
-'���. !,-�"'�/$'0ก�,1��
1. W4PE>G7กW=;0E 8=TDBJ2D060= (QAC=2A=0ก^01FG?=060NLP:41) =2AWC21BCD@B4AD060= 2. @[email protected]=S @6=TPDEBกFBCEB4:BJ5EB=OEB=0 @6=TPDEH3;QRR_0FG?DZ>ก=9SQRR_0FG?@6=TPDEH3;BC0E`
3. WBXDกW416;0
1��-�"23(45)647(64'�#
1. QRQ8A; 2. R_0IC0 3. ก0==?@M4:UDEFกXW8ZEB;ANLPH3;@[TPDก0=D<7CD0aJ<H16=J2@=TD1
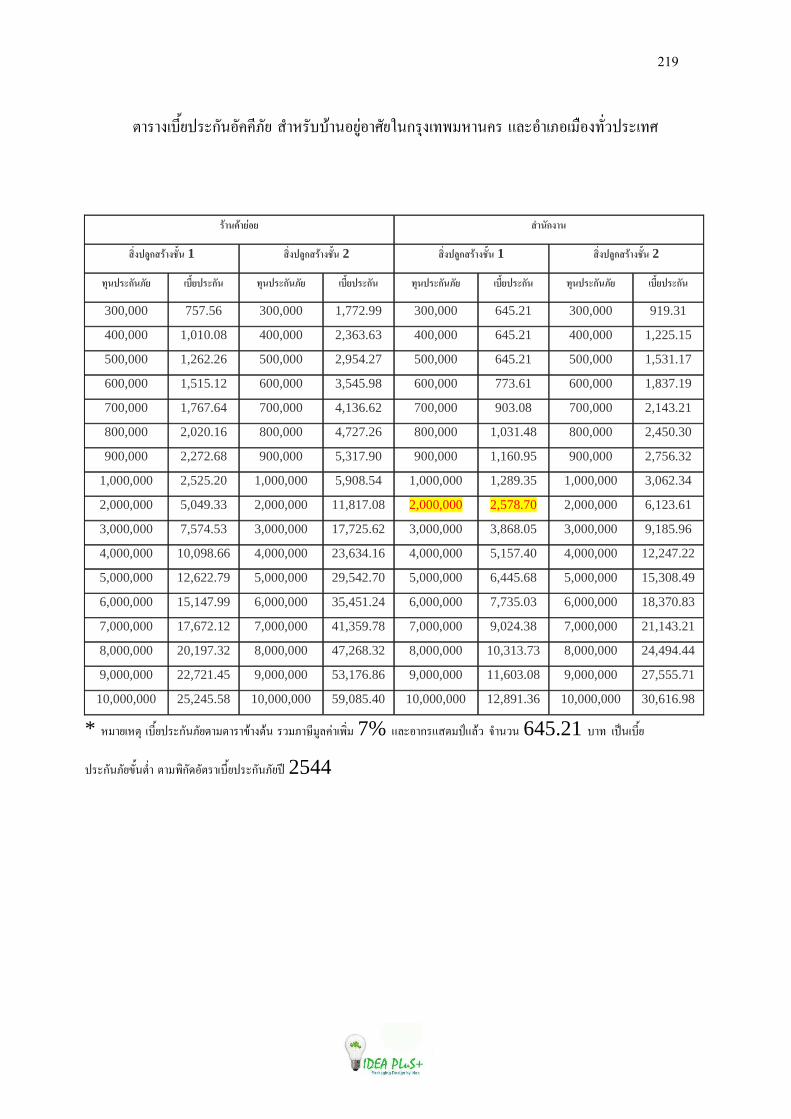
219
B0=0E@ML5<>=?กJ1DJ66LYJ< W/08=JMM;01D<7CD0aJ<H1ก=ZE@N[A8016= FG?D/0@YD@ATDENJP2>=?@Na
* 8A0<@8BZ @ML5<>=?กJ1YJ<B0AB0=0U;0EB;1 =2AY0bLA7G6C0@[4PA 7% FG?D0ก=FWBA>cFG;2 ./0121 645.21 M0N @>V1@ML5<
>=?กJ1YJ<UJ51BP/0 B0A[4กJ:DJB=0@ML5<>=?กJ1YJ<>] 2544
'(),4()�8�� 9),�ก#),
!"#$�%ก '()#*�+, 1 !"#$�%ก '()#*�+, 2 !"#$�%ก '()#*�+, 1 !"#$�%ก '()#*�+, 2
-7,$'0ก�,1�� �/�+�$'0ก�, -7,$'0ก�,1�� �/�+�$'0ก�, -7,$'0ก�,1�� �/�+�$'0ก�, -7,$'0ก�,1�� �/�+�$'0ก�,
300,000 757.56 300,000 1,772.99 300,000 645.21 300,000 919.31
400,000 1,010.08 400,000 2,363.63 400,000 645.21 400,000 1,225.15
500,000 1,262.26 500,000 2,954.27 500,000 645.21 500,000 1,531.17
600,000 1,515.12 600,000 3,545.98 600,000 773.61 600,000 1,837.19
700,000 1,767.64 700,000 4,136.62 700,000 903.08 700,000 2,143.21
800,000 2,020.16 800,000 4,727.26 800,000 1,031.48 800,000 2,450.30
900,000 2,272.68 900,000 5,317.90 900,000 1,160.95 900,000 2,756.32
1,000,000 2,525.20 1,000,000 5,908.54 1,000,000 1,289.35 1,000,000 3,062.34
2,000,000 5,049.33 2,000,000 11,817.08 2,000,000 2,578.70 2,000,000 6,123.61
3,000,000 7,574.53 3,000,000 17,725.62 3,000,000 3,868.05 3,000,000 9,185.96
4,000,000 10,098.66 4,000,000 23,634.16 4,000,000 5,157.40 4,000,000 12,247.22
5,000,000 12,622.79 5,000,000 29,542.70 5,000,000 6,445.68 5,000,000 15,308.49
6,000,000 15,147.99 6,000,000 35,451.24 6,000,000 7,735.03 6,000,000 18,370.83
7,000,000 17,672.12 7,000,000 41,359.78 7,000,000 9,024.38 7,000,000 21,143.21
8,000,000 20,197.32 8,000,000 47,268.32 8,000,000 10,313.73 8,000,000 24,494.44
9,000,000 22,721.45 9,000,000 53,176.86 9,000,000 11,603.08 9,000,000 27,555.71
10,000,000 25,245.58 10,000,000 59,085.40 10,000,000 12,891.36 10,000,000 30,616.98
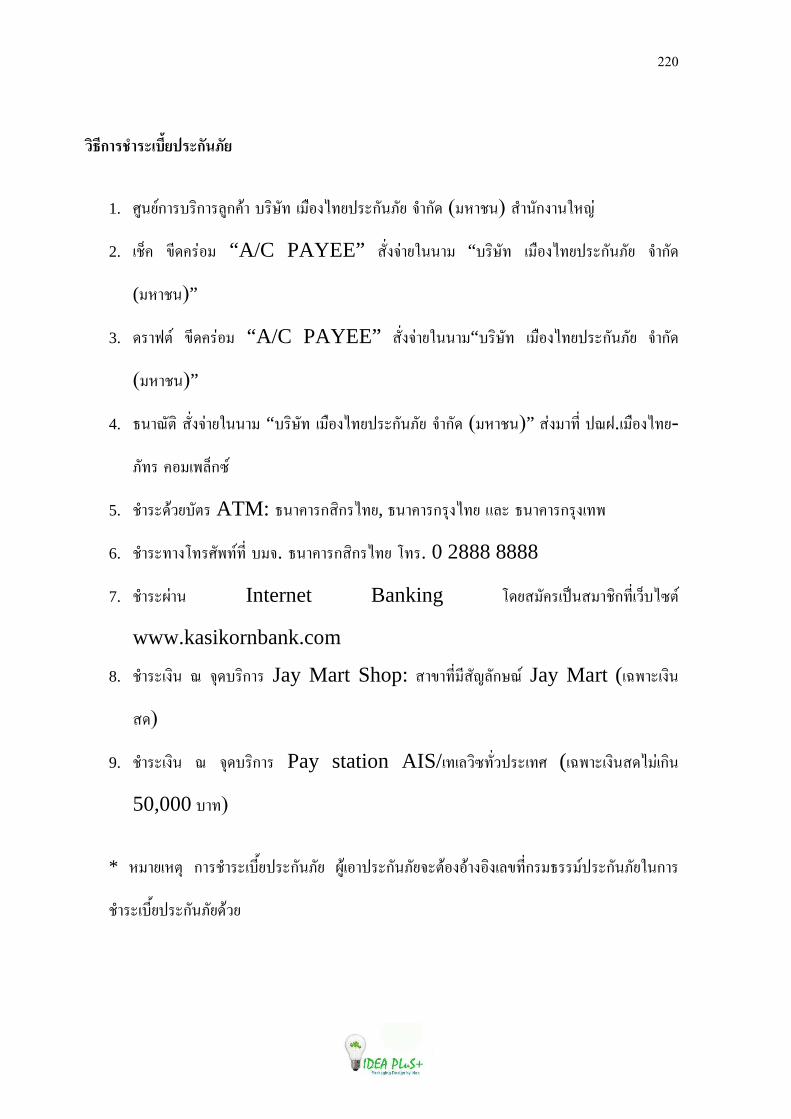
220
5!:�ก)'*9)'0�/�+�$'0ก�,1��
1. a71<Sก0=M=4ก0=G7ก6;0 M=4bJN @ATDEQN<>=?กJ1YJ< ./0กJ: (A8031) W/01JกE01H8dC
2. @3X6 UL:6=CDA “A/C PAYEE” WJPE.C0<H110A “M=4bJN @ATDEQN<>=?กJ1YJ< ./0กJ:
(A8031)”
3. :=0RBS UL:6=CDA “A/C PAYEE” WJPE.C0<H110A“M=4bJN @ATDEQN<>=?กJ1YJ< ./0กJ:
(A8031)”
4. e109JB4 WJPE.C0<H110A “M=4bJN @ATDEQN<>=?กJ1YJ< ./0กJ: (A8031)” WCEA0NLP >9f.@ATDEQN<-
YJN= 6DA@[GXกgS
5. 3/0=?:;2<MJB= ATM: e1060=กW4ก=QN<, e1060=ก=ZEQN< FG? e1060=ก=ZE@N[
6. 3/0=?N0EhN=aJ[NSNLP MA.. e1060=กW4ก=QN< hN=. 0 2888 8888
7. 3/0=?IC01 Internet Banking h:<WAJ6=@>V1WA034กNLP@2XMQgBS
www.kasikornbank.com
8. 3/0=?@E41 9 .Z:M=4ก0= Jay Mart Shop: W0U0NLPALWJdGJกb9S Jay Mart (@i[0?@E41
W:)
9. 3/0=?@E41 9 .Z:M=4ก0= Pay station AIS/@N@G24gNJP2>=?@Na (@i[0?@E41W:QAC@ก41
50,000 M0N)
* 8A0<@8BZ ก0=3/0=?@ML5<>=?กJ1YJ< I7;@D0>=?กJ1YJ<.?B;DED;0ED4E@GUNLPก=Ae==AS>=?กJ1YJ<H1ก0=
3/0=?@ML5<>=?กJ1YJ<:;2<

221
2/49);���)$'0ก�,��44�1�� ( 9)3'�/'(),4()�8��/ 9),�ก#),) U;0[@.;0AL620A>=?WE6S.?GEN?@ML<1@[TPDUD@D0>=?กJ1YJ<กJM M=4bJN @ATDEQN<>=?กJ1YJ< ./0กJ: (A8031) B0A=0<G?@DL<::JE1L5 1. <%(;���)$'0ก�,1�� ���� 10< ���� 10E ���� 10EW02 ���� DTP1` =?MZ...................3TPD ...................................... 10AWกZG................................. @[a ���� 30< ���� 8d4E @GUNLPMJB=>=?3031 □-□□□□-□□□□□-□□-□ 2J1/@:TD1/>]@ก4: ([.a.) ............/............/............ D0<Z....................>] Wj01Y0[.............................D03L[/B/0F81CE......................... GJกb9?E01......................... =0<Q:;/@:TD1............................
hN=aJ[NS....................................................... hN=aJ[NSATDjTD ........................................ e-mail …………………..….…….…….…….. -8),�$=, ���� @.;0UDE ���� I7;@3C0 2. >),-�"?�+#3'@��กA/-'���. !,-�"��)$'0ก�,1�� @GUNLP.............. 8A7CNLP............ 8A7CM;01...............................D060= ....................................... 3J51...................... 8;DE ............... gD< ................... j11 ............................. B/0MG/FU2E.......................D/0@YD/@UB ....................JE82J:.........................=8JWQ>=b9L<S ................. (ก=Z90F1MFI1NLPFW:ENLPBJ5EN=J[<SW41NLP@D0>=?กJ1YJ<:;2<) 3. -�"��%8-�"?!�?8���( ���� NLPD<7C@:L<2กJMU;D 2. (QACB;DEก=Dกg5/0)
���� =?MZ @GUNLP ..................... 8A7CNLP ................ 8A7CM;01.............................D060=............................. 3J51...................8;DE.................... gD< .............................. j11............................. B/0MG/FU2E.............................. D/0@YD/@UB ....................... .JE82J:.....................
=8JWQ>=b9L<S .................. 4. '0�0�5�)��)$'0ก�,1�� 1 $B @=4PAB;12J1NLP ................................... @2G0 16.00 1. W451WZ:2J1NLP ...................................@2G0 16.00 1. 5. ��กCD0 !"#$�%ก '()# �)�7;�# !"#$�%ก '()#..................................$B ;,)��@+,-�"1)�2,�)4)' ก5()# ......................... �6?' �)5.................... �6?' E9),5, ................. *�+, E9),5, ............. 4%3)/3��# '56�@+,-�"2*( ��..................................... ?'.6. f0I1JE � กCDD4^jTD>71 � กCDD4^/QA; 8GJE60 � 6D1ก=LB � ก=?@MT5DE [T51NLP3J51M1 � 6D1ก=LB � QA; � @ANJG3LN � WJEก?WL h6=E8GJE60 � 6D1ก=LB � QA; 6. E9),5,�#!,-�";���)$'0ก�,1�� 6.1 W4PE>G7กW=;0E (QAC=2A^01=0ก) =2AWC21BCD@B4AD060= .................................................................... M0N 6.2 @[email protected]=S @6=TPDEBกFBCEB4:BJ5EB=OEB=0 FG?N=J[<SW41DTP1` ..................................... M0N '56 .................................. M0N 7. <%('�/$'0F�*,. ก=9LB4:./01DE (Wj01MJ1ก0=@E41/14B4MZ66GDTP1) ....................................................................... 8. ;D0,�+-8),6�-9)$'0ก�,1��ก�//'!C�-G 3'@�/'!C�-�@",3'@��68 ก)'$'0ก�,��44�1�� ���� QACAL ���� AL กJMM=4bJN
........................................................................................ ก)'$'0ก�,45)6� �"�#1��-7ก*,!� ���� QACAL ���� AL กJMM=4bJN........................................................................................ ก)'$'0ก�,1��$'0�1-�@", ���� QACAL ���� AL >=?@YN ..................................กJMM=4bJN........................................... 8A0<@8BZ 620A6Z;A6=DE1L5.?ALIGMJE6JMH3; @ATPDHM6/0UD@D0>=?กJ1YJ<NLPj7กB;DEWAM7=9SQ:;=JMก0=[4.0=90D1ZAJB4.0กM=4bJNk @=L<M=;D<FG;2 2J1NLP ............/.........../............ ................................................. (...............................................)

222
G0<ATD3TPDI7;UD@D0>=?กJ1YJ< (W/08=JM@.;081;0NLPM=4bJN) 3TPDI7;WCEE01..........................................=8JWI7;WCEE01 .......................... hN=aJ[NS ...................................... 6/0@BTD1UDEW/01JกE0169?ก==Aก0=ก/0กJMFG?WCE@W=4Aก0=>=?กDMeZ=ก4.>=?กJ1YJ< (6>Y.) I7;@D0>=?กJ1YJ<B;DEBDM6/0j0AH1HM6/0UDH8;B=EB0A620A@>V1.=4E NZก>=?ก0= A4i?1J51M=4bJNk D0.jTD@>V1@8BZ>l4@We620A=JMI4:3DMB0AWJdd0>=?กJ1YJ<Q:;B0A>=?A2Gกm8A0<F[CEFG?[0943<S A0B=0 865

223
Documents to be attached together with the filing of the Application for the
Registration of Employer Form
In the case of registration of the juristic person (must use the annexes for every
defined clause.)
1. A copy or a photocopy of the Certificate of Incorporation of the Juristic Person
together with its corporate objects.
2. A copy or a photocopy of the Value Added Tax (VAT) Certificate (Form Phor.Por.
10); or a copy or a photocopy of the Specific Business Tax Certificate (Form Phor. Chor.
20); or a copy or a photocopy of the License to Operate Factory Business (Ror.Ngor. 4).
3. Sketch map of the location of the place of business.
The Power of Attorney (particularly the granting of authority to others to act on one’s behalf
which requires the duty stamp to be affixed pursuant to the Revenue Code)
In the case of one single owner: (Must use annexes for every defined clause)
1. A copy or photocopy of the Citizenship Identity Card (For a foreign national, use the
passport or the Alien Identity Card).
2. A copy or a photocopy of the House Registration.
3. A copy or a photocopy of the Commercial Registration or a license to operate a
business, which is issued under other law in which the name and address are clearly
specified.
4. A copy of the Taxpayer Identification Card or a copy or a photocopy of the License
to Operate a Factory Business (Ror Ngor. 4) or a copy or a photocopy of the Value Added
Tax Registration (Phor. Por. 20) or a copy or a photocopy of Specific Business Registration
(Phor.Thor. 20).
5. A sketch map of the place of business.
The Power of Attorney (particularly the granting of authority to others to act on
one’s behalf which requires the duty stamp to be affixed pursuant to the Revenue Code.)

224
The Objectives of the Establishment of Social Security Fund
To create assurance and security in making a living for the people by sharing mutual
benefits; by being jointly responsible for society by means of savings and sacrifice for the
common good according to the main principle of encouraging the people to help one another
and help themselves and family in time of lack of income; decline in income or an increase
in expense without creating a burden to others and society. The social security is one of the
measures to build up security in life.
Social security fund
• In the case old-age benefit
• In the case unemployment benefit
• In the child allowance
• In the event of death
• In the event of injury or sickness
• In the invalidity benefit
• In the maternity benefit
225
226

227

228

229

230
Income Statement
Cost decrease 5%
Income Statement Year 1 Year 2 Year 3 Year 4 Year 5 Sales 41,120,324 45,232,357 49,344,389 51,400,406 53,456,422 Cost of goods sold 28,784,227 31,662,650 34,541,073 35,980,284 37,419,495 Gross margin 12,336,097 13,569,707 14,803,317 15,420,122 16,036,927 Selling expense 0 0 0 0 0 Sale commission 822,406 904,647 986,888 1,028,008 1,069,128 Radio local 36,000 3,000 36,000 36,000 36,000 Brochure 4,500 4,950 5,175 5,400 5,625 Plate/Poster/Vinyl 39,000 42,900 44,850 46,800 48,750 Souvenir 10,000 11,000 11,500 12,000 12,500 Public relation 12,000 13,200 13,800 14,400 15,000 Website 2,345 0 1,000 0 500 Total selling expense 926,251 1,012,697 1,099,213 1,142,608 1,187,503 Administrative Expense 0 0 0 0 0 General manager salary 180,000 198,000 216,000 234,000 252,000 Marketing officer salary 102,000 112,200 122,400 132,600 142,800 Accounting officer salary 102,000 112,200 122,400 132,600 142,800 Reception and administration officer salary
84,000 92,400 100,800 109,200 117,600
Graphic and package designer salary
102,000 112,200 122,400 132,600 142,800
Customer service officer salary 90,000 99,000 108,000 117,000 126,000 Housekeeper salary 60,000 66,000 72,000 78,000 84,000 Social security insurance 36,000 39,600 43,200 46,800 50,400 Office supplies 15,242 16,766 18,290 19,815 21,339 Utility expense 102,000 112,200 122,400 132,600 142,800 Rental (building) 300,000 300,000 300,000 300,000 300,000 Fire insurance 2,579 2,579 2,579 2,579 2,579 Administrative Depreciation 76,257 76,257 76,257 45,593 45,593 Total administrative expense 1,252,078 1,339,402 1,426,726 1,483,386 1,570,711 Selling and administrative expense
2,178,329 2,352,099 2,525,939 2,625,994 2,758,214
Earnings before interest and Tax 10,157,768 11,217,608 12,277,378 12,794,127 13,278,713 Interest and principle loan expense
766,667 766,667 766,667 0 0
After interest income 9,391,101 10,450,941 11,510,711 12,794,127 13,278,713 Income Tax (30%) 2,817,330 3,135,282 3,453,213 3,838,238 3,983,614 Net income 6,573,771 7,315,659 8,057,498 8,955,889 9,295,099

231
Cost decrease 10%
Income Statement Year 1 Year 2 Year 3 Year 4 Year 5 Sales 41,120,324 45,232,357 49,344,389 51,400,406 53,456,422 Cost of goods sold 26,728,211 29,401,032 32,073,853 33,410,264 34,746,674 Gross margin 14,392,114 15,831,325 17,270,536 17,990,142 18,709,748 Selling expense 0 0 0 0 0 Sale commission 822,406 904,647 986,888 1,028,008 1,069,128 Radio local 36,000 3,000 36,000 36,000 36,000 Brochure 4,500 4,950 5,175 5,400 5,625 Plate/Poster/Vinyl 39,000 42,900 44,850 46,800 48,750 Souvenir 10,000 11,000 11,500 12,000 12,500 Public relation 12,000 13,200 13,800 14,400 15,000 Website 2,345 0 1,000 0 500 Total selling expense 926,251 1,012,697 1,099,213 1,142,608 1,187,503 Administrative Expense 0 0 0 0 0 General manager salary 180,000 198,000 216,000 234,000 252,000 Marketing officer salary 102,000 112,200 122,400 132,600 142,800 Accounting officer salary 102,000 112,200 122,400 132,600 142,800
Reception and administration officer salary
84,000 92,400 100,800 109,200 117,600
Graphic and package designer salary
102,000 112,200 122,400 132,600 142,800
Customer service officer salary 90,000 99,000 108,000 117,000 126,000 Housekeeper salary 60,000 66,000 72,000 78,000 84,000 Social security insurance 36,000 39,600 43,200 46,800 50,400 Office supplies 15,242 16,766 18,290 19,815 21,339 Utility expense 102,000 112,200 122,400 132,600 142,800 Rental (building) 300,000 300,000 300,000 300,000 300,000 Fire insurance 2,579 2,579 2,579 2,579 2,579 Administrative Depreciation 76,257 76,257 76,257 45,593 45,593 Total administrative expense 1,252,078 1,339,402 1,426,726 1,483,386 1,570,711 Selling and administrative expense
2,178,329 2,352,099 2,525,939 2,625,994 2,758,214
Earning before interest and Tax 12,213,784 13,479,226 14,744,597 15,364,148 15,951,534 Interest and principle loan expense
766,667 766,667 766,667 0 0
After interest income 11,447,118 12,712,559 13,977,931 15,364,148 15,951,534 Income Tax (30%) 3,434,135 3,813,768 4,193,379 4,609,244 4,785,460 Net income 8,012,982 8,898,791 9,784,552 10,754,903 11,166,074

232
Cost decrease 15%
Income Statement Year 1 Year 2 Year 3 Year 4 Year 5 Sales 41,120,324 45,232,357 49,344,389 51,400,406 53,456,422 Cost of goods sold 24,672,195 27,139,414 29,606,634 30,840,243 32,073,853 Gross margin 16,448,130 18,092,943 19,737,756 20,560,162 21,382,569 Selling expense 0 0 0 0 0 Sale commission 822,406 904,647 986,888 1,028,008 1,069,128 Radio local 36,000 3,000 36,000 36,000 36,000 Brochure 4,500 4,950 5,175 5,400 5,625 Plate/Poster/Vinyl 39,000 42,900 44,850 46,800 48,750 Souvenir 10,000 11,000 11,500 12,000 12,500 Public relation 12,000 13,200 13,800 14,400 15,000 Website 2,345 0 1,000 0 500 Total selling expense 926,251 1,012,697 1,099,213 1,142,608 1,187,503 Administrative Expense 0 0 0 0 0 General manager salary 180,000 198,000 216,000 234,000 252,000 Marketing officer salary 102,000 112,200 122,400 132,600 142,800 Accounting officer salary 102,000 112,200 122,400 132,600 142,800
Reception and administration officer salary
84,000 92,400 100,800 109,200 117,600
Graphic and package designer salary
102,000 112,200 122,400 132,600 142,800
Customer service officer salary 90,000 99,000 108,000 117,000 126,000 Housekeeper salary 60,000 66,000 72,000 78,000 84,000 Social security insurance 36,000 39,600 43,200 46,800 50,400 Office supplies 15,242 16,766 18,290 19,815 21,339 Utility expense 102,000 112,200 122,400 132,600 142,800 Rental (building) 300,000 300,000 300,000 300,000 300,000 Fire insurance 2,579 2,579 2,579 2,579 2,579 Administrative Depreciation 76,257 76,257 76,257 45,593 45,593 Total administrative expense 1,252,078 1,339,402 1,426,726 1,483,386 1,570,711 Selling and administrative expense
2,178,329 2,352,099 2,525,939 2,625,994 2,758,214
Earning before interest and Tax 14,269,801 15,740,844 17,211,817 17,934,168 18,624,355 Interest and principle loan expense
766,667 766,667 766,667 0 0
After interest income 13,503,134 14,974,177 16,445,150 17,934,168 18,624,355 Income Tax (30%) 4,050,940 4,492,253 4,933,545 5,380,250 5,587,306 Net income 9,452,194 10,481,924 11,511,605 12,553,917 13,037,048

233
Cost increase 5%
Income Statement Year 1 Year 2 Year 3 Year 4 Year 5 Sales 41,120,324 45,232,357 49,344,389 51,400,406 53,456,422 Cost of goods sold 32,896,260 36,185,886 39,475,511 41,120,324 42,765,137 Gross margin 8,224,065 9,046,471 9,868,878 10,280,081 10,691,284 Selling expense 0 0 0 0 0 Sale commission 822,406 904,647 986,888 1,028,008 1,069,128 Radio local 36,000 3,000 36,000 36,000 36,000 Brochure 4,500 4,950 5,175 5,400 5,625 Plate/Poster/Vinyl 39,000 42,900 44,850 46,800 48,750 Souvenir 10,000 11,000 11,500 12,000 12,500 Public relation 12,000 13,200 13,800 14,400 15,000 Website 2,345 0 1,000 0 500 Total selling expense 926,251 1,012,697 1,099,213 1,142,608 1,187,503 Administrative Expense 0 0 0 0 0 General manager salary 180,000 198,000 216,000 234,000 252,000 Marketing officer salary 102,000 112,200 122,400 132,600 142,800 Accounting officer salary 102,000 112,200 122,400 132,600 142,800 Reception and administration officer salary 84,000 92,400 100,800 109,200 117,600 Graphic and package designer salary 102,000 112,200 122,400 132,600 142,800 Customer service officer salary 90,000 99,000 108,000 117,000 126,000 Housekeeper salary 60,000 66,000 72,000 78,000 84,000 Social security insurance 36,000 39,600 43,200 46,800 50,400 Office supplies 15,242 16,766 18,290 19,815 21,339 Utility expense 102,000 112,200 122,400 132,600 142,800 Rental (building) 300,000 300,000 300,000 300,000 300,000 Fire insurance 2,579 2,579 2,579 2,579 2,579 Administrative Depreciation 76,257 76,257 76,257 45,593 45,593 Total administrative expense 1,252,078 1,339,402 1,426,726 1,483,386 1,570,711 Selling and administrative expense 2,178,329 2,352,099 2,525,939 2,625,994 2,758,214 Earning before interest and Tax 6,045,736 6,694,372 7,342,939 7,654,087 7,933,070 Interest and principle loan expense 766,667 766,667 766,667 0 0 After interest income 5,279,069 5,927,706 6,576,272 7,654,087 7,933,070 Income Tax (30%) 1,583,721 1,778,312 1,972,882 2,296,226 2,379,921 Net income 3,695,348 4,149,394 4,603,391 5,357,861 5,553,149

234
Cost increase 10%
Income Statement Year 1 Year 2 Year 3 Year 4 Year 5 Sales 41,120,324 45,232,357 49,344,389 51,400,406 53,456,422 Cost of goods sold 34,952,276 38,447,503 41,942,731 43,690,345 45,437,959 Gross margin 6,168,049 6,784,854 7,401,658 7,710,061 8,018,463 Selling expense 0 0 0 0 0 Sale commission 822,406 904,647 986,888 1,028,008 1,069,128 Radio local 36,000 3,000 36,000 36,000 36,000 Brochure 4,500 4,950 5,175 5,400 5,625 Plate/Poster/Vinyl 39,000 42,900 44,850 46,800 48,750 Souvenir 10,000 11,000 11,500 12,000 12,500 Public relation 12,000 13,200 13,800 14,400 15,000 Website 2,345 0 1,000 0 500 Total selling expense 926,251 1,012,697 1,099,213 1,142,608 1,187,503 Administrative Expense 0 0 0 0 0 General manager salary 180,000 198,000 216,000 234,000 252,000 Marketing officer salary 102,000 112,200 122,400 132,600 142,800 Accounting officer salary 102,000 112,200 122,400 132,600 142,800 Reception and administration officer salary 84,000 92,400 100,800 109,200 117,600 Graphic and package designer salary 102,000 112,200 122,400 132,600 142,800 Customer service officer salary 90,000 99,000 108,000 117,000 126,000 Housekeeper salary 60,000 66,000 72,000 78,000 84,000 Social security insurance 36,000 39,600 43,200 46,800 50,400 Office supplies 15,242 16,766 18,290 19,815 21,339 Utility expense 102,000 112,200 122,400 132,600 142,800 Rental (building) 300,000 300,000 300,000 300,000 300,000 Fire insurance 2,579 2,579 2,579 2,579 2,579 Administrative Depreciation 76,257 76,257 76,257 45,593 45,593 Total administrative expense 1,252,078 1,339,402 1,426,726 1,483,386 1,570,711 Selling and administrative expense 2,178,329 2,352,099 2,525,939 2,625,994 2,758,214 Earning before interest and Tax 3,989,719 4,432,754 4,875,720 5,084,066 5,260,249 Interest and principle loan expense 766,667 766,667 766,667 0 0 After interest income 3,223,053 3,666,088 4,109,053 5,084,066 5,260,249 Income Tax (30%) 966,916 1,099,826 1,232,716 1,525,220 1,578,075 Net income 2,256,137 2,566,261 2,876,337 3,558,846 3,682,175

235
Cost increase 15%
Income Statement Year 1 Year 2 Year 3 Year 4 Year 5 Sales 41,120,324 45,232,357 49,344,389 51,400,406 53,456,422 Cost of goods sold 37,008,292 40,709,121 44,409,950 46,260,365 48,110,780 Gross margin 4,112,032 4,523,236 4,934,439 5,140,041 5,345,642 Selling expense 0 0 0 0 0 Sale commission 822,406 904,647 986,888 1,028,008 1,069,128 Radio local 36,000 3,000 36,000 36,000 36,000 Brochure 4,500 4,950 5,175 5,400 5,625 Plate/Poster/Vinyl 39,000 42,900 44,850 46,800 48,750 Souvenir 10,000 11,000 11,500 12,000 12,500 Public relation 12,000 13,200 13,800 14,400 15,000 Website 2,345 0 1,000 0 500 Total selling expense 926,251 1,012,697 1,099,213 1,142,608 1,187,503 Administrative Expense 0 0 0 0 0 General manager salary 180,000 198,000 216,000 234,000 252,000 Marketing officer salary 102,000 112,200 122,400 132,600 142,800 Accounting officer salary 102,000 112,200 122,400 132,600 142,800 Reception and administration officer salary 84,000 92,400 100,800 109,200 117,600 Graphic and package designer salary 102,000 112,200 122,400 132,600 142,800 Customer service officer salary 90,000 99,000 108,000 117,000 126,000 Housekeeper salary 60,000 66,000 72,000 78,000 84,000 Social security insurance 36,000 39,600 43,200 46,800 50,400 Office supplies 15,242 16,766 18,290 19,815 21,339 Utility expense 102,000 112,200 122,400 132,600 142,800 Rental (building) 300,000 300,000 300,000 300,000 300,000 Fire insurance 2,579 2,579 2,579 2,579 2,579 Administrative Depreciation 76,257 76,257 76,257 45,593 45,593 Total administrative expense 1,252,078 1,339,402 1,426,726 1,483,386 1,570,711 Selling and administrative expense 2,178,329 2,352,099 2,525,939 2,625,994 2,758,214 Earning before interest and Tax 1,933,703 2,171,137 2,408,500 2,514,046 2,587,428 Interest and principle loan expense 766,667 766,667 766,667 0 0 After interest income 1,167,037 1,404,470 1,641,833 2,514,046 2,587,428 Income Tax (30%) 350,111 421,341 492,550 754,214 776,228 Net income 816,926 983,129 1,149,283 1,759,832 1,811,200

236
Sale decrease 5%
Income Statement Year 1 Year 2 Year 3 Year 4 Year 5 Sales 41,120,324 43,176,341 47,288,373 51,400,406 51,400,406 Cost of goods sold 30,840,243 32,382,256 35,466,280 38,550,304 38,550,304 Gross margin 10,280,081 10,794,085 11,822,093 12,850,101 12,850,101 Selling expense 0 0 0 0 0 Sale commission 822,406 863,527 945,767 1,028,008 1,028,008 Radio local 36,000 3,000 36,000 36,000 36,000 Brochure 4,500 4,950 5,175 5,400 5,625 Plate/Poster/Vinyl 39,000 42,900 44,850 46,800 48,750 Souvenir 10,000 11,000 11,500 12,000 12,500 Public relation 12,000 13,200 13,800 14,400 15,000 Website 2,345 0 1,000 0 500 Total selling expense 926,251 971,577 1,058,092 1,142,608 1,146,383 Administrative Expense 0 0 0 0 0 General manager salary 180,000 198,000 216,000 234,000 252,000 Marketing officer salary 102,000 112,200 122,400 132,600 142,800 Accounting officer salary 102,000 112,200 122,400 132,600 142,800 Reception and administration officer salary 84,000 92,400 100,800 109,200 117,600 Graphic and package designer salary 102,000 112,200 122,400 132,600 142,800 Customer service officer salary 90,000 99,000 108,000 117,000 126,000 Housekeeper salary 60,000 66,000 72,000 78,000 84,000 Social security insurance 36,000 39,600 43,200 46,800 50,400 Office supplies 15,242 16,766 18,290 19,815 21,339 Utility expense 102,000 112,200 122,400 132,600 142,800 Rental (building) 300,000 300,000 300,000 300,000 300,000 Fire insurance 2,579 2,579 2,579 2,579 2,579 Administrative Depreciation 76,257 76,257 76,257 45,593 45,593 Total administrative expense 1,252,078 1,339,402 1,426,726 1,483,386 1,570,711 Selling and administrative expense 2,178,329 2,310,979 2,484,819 2,625,994 2,717,094 Earning before interest and Tax 8,101,752 8,483,106 9,337,275 10,224,107 10,133,008 Interest and principle loan expense 766,667 766,667 766,667 0 0 After interest income 7,335,085 7,716,440 8,570,608 10,224,107 10,133,008 Income Tax (30%) 2,200,526 2,314,932 2,571,182 3,067,232 3,039,902 Net income 5,134,560 5,401,508 5,999,426 7,156,875 7,093,105

237
Sale decrease 10%
Income Statement Year 1 Year 2 Year 3 Year 4 Year 5 Sales 41,120,324 41,120,324 45,232,357 47,288,373 49,344,389 Cost of goods sold 30,840,243 30,840,243 33,924,268 35,466,280 37,008,292 Gross margin 10,280,081 10,280,081 11,308,089 11,822,093 12,336,097 Selling expense 0 0 0 0 0 Sale commission 822,406 822,406 904,647 945,767 986,888 Radio local 36,000 3,000 36,000 36,000 36,000 Brochure 4,500 4,950 5,175 5,400 5,625 Plate/Poster/Vinyl 39,000 42,900 44,850 46,800 48,750 Souvenir 10,000 11,000 11,500 12,000 12,500 Public relation 12,000 13,200 13,800 14,400 15,000 Website 2,345 0 1,000 0 500 Total selling expense 926,251 930,456 1,016,972 1,060,367 1,105,263 Administrative Expense 0 0 0 0 0 General manager salary 180,000 198,000 216,000 234,000 252,000 Marketing officer salary 102,000 112,200 122,400 132,600 142,800 Accounting officer salary 102,000 112,200 122,400 132,600 142,800 Reception and administration officer salary 84,000 92,400 100,800 109,200 117,600 Graphic and package designer salary 102,000 112,200 122,400 132,600 142,800 Customer service officer salary 90,000 99,000 108,000 117,000 126,000 Housekeeper salary 60,000 66,000 72,000 78,000 84,000 Social security insurance 36,000 39,600 43,200 46,800 50,400 Office supplies 15,242 16,766 18,290 19,815 21,339 Utility expense 102,000 112,200 122,400 132,600 142,800 Rental (building) 300,000 300,000 300,000 300,000 300,000 Fire insurance 2,579 2,579 2,579 2,579 2,579 Administrative Depreciation 76,257 76,257 76,257 45,593 45,593 Total administrative expense 1,252,078 1,339,402 1,426,726 1,483,386 1,570,711 Selling and administrative expense 2,178,329 2,269,858 2,443,698 2,543,754 2,675,973 Earning before interest and Tax 8,101,752 8,010,223 8,864,391 9,278,340 9,660,124 Interest and principle loan expense 766,667 766,667 766,667 0 0 After interest income 7,335,085 7,243,556 8,097,724 9,278,340 9,660,124 Income Tax (30%) 2,200,526 2,173,067 2,429,317 2,783,502 2,898,037 Net income 5,134,560 5,070,489 5,668,407 6,494,838 6,762,087
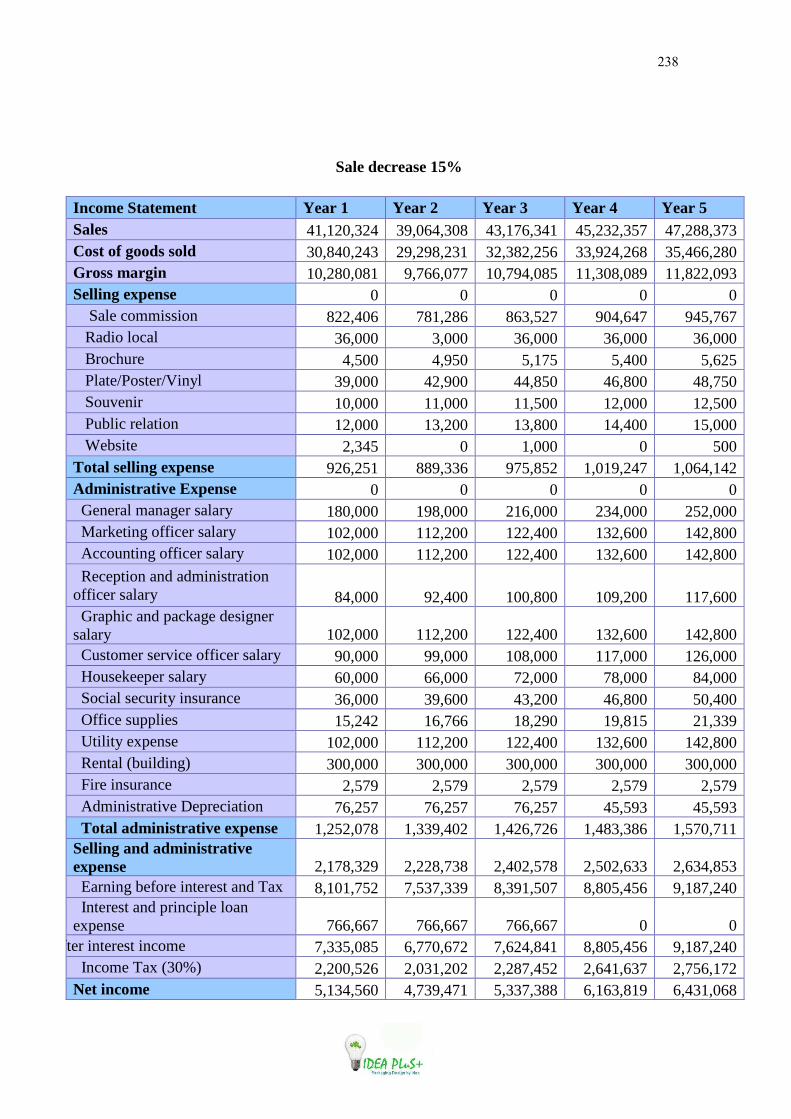
238
Sale decrease 15%
Income Statement Year 1 Year 2 Year 3 Year 4 Year 5 Sales 41,120,324 39,064,308 43,176,341 45,232,357 47,288,373 Cost of goods sold 30,840,243 29,298,231 32,382,256 33,924,268 35,466,280 Gross margin 10,280,081 9,766,077 10,794,085 11,308,089 11,822,093 Selling expense 0 0 0 0 0 Sale commission 822,406 781,286 863,527 904,647 945,767 Radio local 36,000 3,000 36,000 36,000 36,000 Brochure 4,500 4,950 5,175 5,400 5,625 Plate/Poster/Vinyl 39,000 42,900 44,850 46,800 48,750 Souvenir 10,000 11,000 11,500 12,000 12,500 Public relation 12,000 13,200 13,800 14,400 15,000 Website 2,345 0 1,000 0 500 Total selling expense 926,251 889,336 975,852 1,019,247 1,064,142 Administrative Expense 0 0 0 0 0 General manager salary 180,000 198,000 216,000 234,000 252,000 Marketing officer salary 102,000 112,200 122,400 132,600 142,800 Accounting officer salary 102,000 112,200 122,400 132,600 142,800 Reception and administration officer salary 84,000 92,400 100,800 109,200 117,600 Graphic and package designer salary 102,000 112,200 122,400 132,600 142,800 Customer service officer salary 90,000 99,000 108,000 117,000 126,000 Housekeeper salary 60,000 66,000 72,000 78,000 84,000 Social security insurance 36,000 39,600 43,200 46,800 50,400 Office supplies 15,242 16,766 18,290 19,815 21,339 Utility expense 102,000 112,200 122,400 132,600 142,800 Rental (building) 300,000 300,000 300,000 300,000 300,000 Fire insurance 2,579 2,579 2,579 2,579 2,579 Administrative Depreciation 76,257 76,257 76,257 45,593 45,593 Total administrative expense 1,252,078 1,339,402 1,426,726 1,483,386 1,570,711 Selling and administrative expense 2,178,329 2,228,738 2,402,578 2,502,633 2,634,853 Earning before interest and Tax 8,101,752 7,537,339 8,391,507 8,805,456 9,187,240 Interest and principle loan expense 766,667 766,667 766,667 0 0
After interest income 7,335,085 6,770,672 7,624,841 8,805,456 9,187,240 Income Tax (30%) 2,200,526 2,031,202 2,287,452 2,641,637 2,756,172 Net income 5,134,560 4,739,471 5,337,388 6,163,819 6,431,068

239
Sale increase 5%
Income Statement Year 1 Year 2 Year 3 Year 4 Year 5 Sales 41,120,324 47,288,373 51,400,406 53,456,422 55,512,438 Cost of goods sold 30,840,243 35,466,280 38,550,304 40,092,316 41,634,329 Gross margin 10,280,081 11,822,093 12,850,101 13,364,105 13,878,110 Selling expense 0 0 0 0 0 Sale commission 822,406 945,767 1,028,008 1,069,128 1,110,249 Radio local 36,000 3,000 36,000 36,000 36,000 Brochure 4,500 4,950 5,175 5,400 5,625 Plate/Poster/Vinyl 39,000 42,900 44,850 46,800 48,750 Souvenir 10,000 11,000 11,500 12,000 12,500 Public relation 12,000 13,200 13,800 14,400 15,000 Website 2,345 0 1,000 0 500 Total selling expense 926,251 1,053,817 1,140,333 1,183,728 1,228,624 Administrative Expense 0 0 0 0 0 General manager salary 180,000 198,000 216,000 234,000 252,000 Marketing officer salary 102,000 112,200 122,400 132,600 142,800 Accounting officer salary 102,000 112,200 122,400 132,600 142,800 Reception and administration officer salary 84,000 92,400 100,800 109,200 117,600 Graphic and package designer salary 102,000 112,200 122,400 132,600 142,800 Customer service officer salary 90,000 99,000 108,000 117,000 126,000 Housekeeper salary 60,000 66,000 72,000 78,000 84,000 Social security insurance (per month) 36,000 39,600 43,200 46,800 50,400 Office supplies 15,242 16,766 18,290 19,815 21,339 Utility expense 102,000 112,200 122,400 132,600 142,800 Rental (building) 300,000 300,000 300,000 300,000 300,000 Fire insurance 2,579 2,579 2,579 2,579 2,579 Administrative Depreciation 76,257 76,257 76,257 45,593 45,593 Total administrative expense 1,252,078 1,339,402 1,426,726 1,483,386 1,570,711 Selling and administrative expense 2,178,329 2,393,219 2,567,059 2,667,115 2,799,334 Earning before interest and Tax 8,101,752 9,428,874 10,283,042 10,696,991 11,078,775 Interest and principle loan expense 766,667 766,667 766,667 0 0 After interest income 7,335,085 8,662,207 9,516,376 10,696,991 11,078,775 Income Tax (30%) 2,200,526 2,598,662 2,854,913 3,209,097 3,323,633 Net income 5,134,560 6,063,545 6,661,463 7,487,894 7,755,143
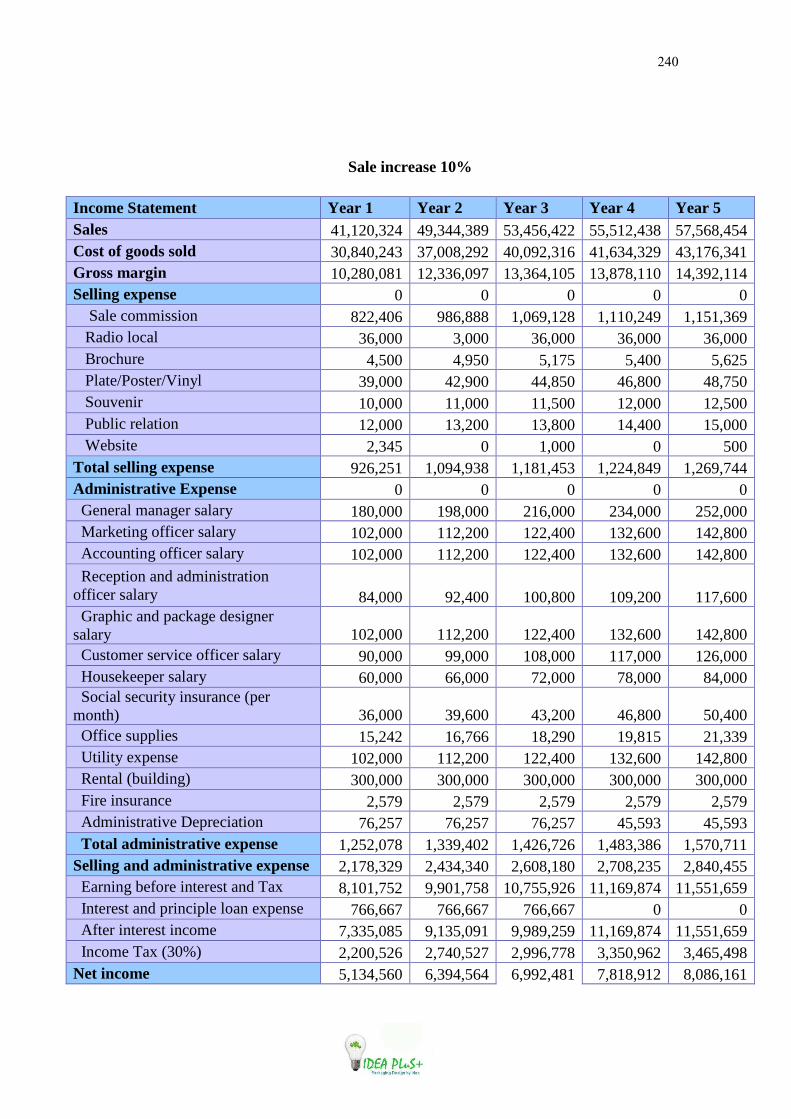
240
Sale increase 10%
Income Statement Year 1 Year 2 Year 3 Year 4 Year 5 Sales 41,120,324 49,344,389 53,456,422 55,512,438 57,568,454 Cost of goods sold 30,840,243 37,008,292 40,092,316 41,634,329 43,176,341 Gross margin 10,280,081 12,336,097 13,364,105 13,878,110 14,392,114 Selling expense 0 0 0 0 0 Sale commission 822,406 986,888 1,069,128 1,110,249 1,151,369 Radio local 36,000 3,000 36,000 36,000 36,000 Brochure 4,500 4,950 5,175 5,400 5,625 Plate/Poster/Vinyl 39,000 42,900 44,850 46,800 48,750 Souvenir 10,000 11,000 11,500 12,000 12,500 Public relation 12,000 13,200 13,800 14,400 15,000 Website 2,345 0 1,000 0 500 Total selling expense 926,251 1,094,938 1,181,453 1,224,849 1,269,744 Administrative Expense 0 0 0 0 0 General manager salary 180,000 198,000 216,000 234,000 252,000 Marketing officer salary 102,000 112,200 122,400 132,600 142,800 Accounting officer salary 102,000 112,200 122,400 132,600 142,800 Reception and administration officer salary 84,000 92,400 100,800 109,200 117,600 Graphic and package designer salary 102,000 112,200 122,400 132,600 142,800 Customer service officer salary 90,000 99,000 108,000 117,000 126,000 Housekeeper salary 60,000 66,000 72,000 78,000 84,000 Social security insurance (per month) 36,000 39,600 43,200 46,800 50,400 Office supplies 15,242 16,766 18,290 19,815 21,339 Utility expense 102,000 112,200 122,400 132,600 142,800 Rental (building) 300,000 300,000 300,000 300,000 300,000 Fire insurance 2,579 2,579 2,579 2,579 2,579 Administrative Depreciation 76,257 76,257 76,257 45,593 45,593 Total administrative expense 1,252,078 1,339,402 1,426,726 1,483,386 1,570,711 Selling and administrative expense 2,178,329 2,434,340 2,608,180 2,708,235 2,840,455 Earning before interest and Tax 8,101,752 9,901,758 10,755,926 11,169,874 11,551,659 Interest and principle loan expense 766,667 766,667 766,667 0 0 After interest income 7,335,085 9,135,091 9,989,259 11,169,874 11,551,659 Income Tax (30%) 2,200,526 2,740,527 2,996,778 3,350,962 3,465,498 Net income 5,134,560 6,394,564 6,992,481 7,818,912 8,086,161

241
Sale increase 15%
Income Statement Year 1 Year 2 Year 3 Year 4 Year 5 Sales 41,120,324 51,400,406 55,512,438 57,568,454 59,624,470
Cost of goods sold 30,840,243 38,550,304 41,634,329 43,176,341 44,718,353 Gross margin 10,280,081 12,850,101 13,878,110 14,392,114 14,906,118
Selling expense 0 0 0 0 0 Sale commission 822,406 1,028,008 1,110,249 1,151,369 1,192,489
Radio local 36,000 3,000 36,000 36,000 36,000 Brochure 4,500 4,950 5,175 5,400 5,625
Plate/Poster/Vinyl 39,000 42,900 44,850 46,800 48,750 Souvenir 10,000 11,000 11,500 12,000 12,500
Public relation 12,000 13,200 13,800 14,400 15,000 Website 2,345 0 1,000 0 500
Total selling expense 926,251 1,136,058 1,222,574 1,265,969 1,310,864 Administrative Expense 0 0 0 0 0 General manager salary 180,000 198,000 216,000 234,000 252,000 Marketing officer salary 102,000 112,200 122,400 132,600 142,800 Accounting officer salary 102,000 112,200 122,400 132,600 142,800
Reception and administration officer salary 84,000 92,400 100,800 109,200 117,600
Graphic and package designer salary 102,000 112,200 122,400 132,600 142,800
Customer service officer salary 90,000 99,000 108,000 117,000 126,000 Housekeeper salary 60,000 66,000 72,000 78,000 84,000
Social security insurance (per month) 36,000 39,600 43,200 46,800 50,400
Office supplies 15,242 16,766 18,290 19,815 21,339 Utility expense 102,000 112,200 122,400 132,600 142,800
Rental (building) 300,000 300,000 300,000 300,000 300,000 Fire insurance 2,579 2,579 2,579 2,579 2,579
Administrative Depreciation 76,257 76,257 76,257 45,593 45,593 Total administrative expense 1,252,078 1,339,402 1,426,726 1,483,386 1,570,711
Selling and administrative expense 2,178,329 2,475,460 2,649,300 2,749,355 2,881,575
Earnings before interest and Tax 8,101,752 10,374,641 11,228,810 11,642,758 12,024,543 Interest and principle loan expense 766,667 766,667 766,667 0 0
After interest income 7,335,085 9,607,975 10,462,143 11,642,758 12,024,543 Income Tax (30%) 2,200,526 2,882,392 3,138,643 3,492,827 3,607,363
Net income 5,134,560 6,725,582 7,323,500 8,149,931 8,417,180

242
Cash Flow
Cost decrease 5%
Cost decrease 5%
Cash flow Year 1 Year 2 Year 3 Year 4 Year 5 Cash flows from operating activity
0 0 0 0 0
Cash inflow 0 0 0 0 0
Cash received on sales 41,120,324 45,232,357 49,344,389 51,400,406 53,456,422
Cash from account receivable 0 0 0 0 0
Adjust office supplies 0 0 0 0 0
Adjust rental building 0 0 0 0 0
Adjust depreciation 76,257 76,257 76,257 45,593 45,593
Other 0 0 0 0 0 Cash inflow from operating activity
41,196,581 45,308,614 49,420,646 51,445,999 53,502,015
Cash out flow 0 0 0 0 0
Cost of goods sold 28,784,227 31,662,650 34,541,073 35,980,284 37,419,495
Marketing expense 926,251 1,012,697 1,099,213 1,142,608 1,187,503
Administrative expense 1,252,078 1,339,402 1,426,726 1,483,386 1,570,711
Cash paid for income tax 2,817,330 3,135,282 3,453,213 3,838,238 3,983,614
Other cash expense 0 0 0 0 0 Cash out flow from operating activity 33,779,887 37,150,031 40,520,225 42,444,516 44,161,323
Net cash flows fom operating activity 7,416,695 8,158,583 8,900,422 9,001,482 9,340,692
Cash inflow from investing activity
0 0 0 0 0
Cash inflow 0 0 0 0 0 Cash received from sold equipment
0 0 0 0 0
Other 0 0 0 0 0 Cash inflow from investing activity
0 0 0 0 0
Cash outflow 0 0 0 0 0 Cash paid on administrative investment
633,231 0 0 0 0
Cash outflow from investment activity
633,231 0 0 0 0
Net cash flows from investing activity
-633,231 0 0 0 0

243
Cash flows from financing activity
0 0 0 0 0
cash inflow 0 0 0 0 0
Cash Loan 2,000,000 0 0 0 0
Other 0 0 0 0 0 Cash inflow from financing activity
2,000,000 0 0 0 0
cash outflow 0 0 0 0 0
Repayment for interest and principle loan
766,667 766,667 766,667 0 0
Cash outflow from financing activity
766,667 766,667 766,667 0 0
Net cash flows from financing activity
1,233,333 -766,667 -766,667 0 0
Net cash increase or decrease
8,016,797 7,391,916 8,133,755 9,001,482 9,340,692
Beginning cash 0 8,016,797 15,408,713 23,542,468 32,543,950
Ending cash 8,016,797 15,408,713 23,542,468 32,543,950 41,884,642

244
Cost decrease 10%
Cash flow Year 1 Year 2 Year 3 Year 4 Year 5 Cash flows from operating activity 0 0 0 0 Cash inflow 0 0 0 0 0 Cash received on sales 41,120,324 45,232,357 49,344,389 51,400,406 53,456,422 Cash from account receivable 0 0 0 0 0 Adjust office supplies 0 0 0 0 0 Adjust rental building 0 0 0 0 0 Adjust depreciation 76,257 76,257 76,257 45,593 45,593 Other 0 0 0 0 0 Cash inflow from operating activity 41,196,581 45,308,614 49,420,646 51,445,999 53,502,015 Cash out flow 0 0 0 0 0 Cost of goods sold 26,728,211 29,401,032 32,073,853 33,410,264 34,746,674 Marketing expense 926,251 1,012,697 1,099,213 1,142,608 1,187,503 Administrative expense 1,252,078 1,339,402 1,426,726 1,483,386 1,570,711 Cash paid for income tax 3,434,135 3,813,768 4,193,379 4,609,244 4,785,460
Other cash expense 0 0 0 0 0 Cash out flow from operating activity 32,340,675 35,566,899 38,793,171 40,645,502 42,290,348 Net cash flows from operating activity 8,855,906 9,741,715 10,627,475 10,800,496 11,211,667 Cash inflow from investing activity 0 0 0 0 0 Cash inflow 0 0 0 0 0 Cash received from sold equipment 0 0 0 0 0 Other 0 0 0 0 0 Cash inflow from investing activity 0 0 0 0 0 Cash outflow 0 0 0 0 0 Cash paid on administrative investment 633,231 0 0 0 0 Cash outflow from investment activity 633,231 0 0 0 0 Net cash flows from investing activity -633,231 0 0 0 0

245
Cash flows from financing activity 0 0 0 0 0 cash inflow 0 0 0 0 0 Cash Loan 2,000,000 0 0 0 0 Other 0 0 0 0 0 Cash inflow from financing activity 2,000,000 0 0 0 0 cash outflow 0 0 0 0 0
Repayment for interest and principle loan 766,667 766,667 766,667 0 0 Cash outflow from financing activity 766,667 766,667 766,667 0 0 Net cash flows from financing activity 1,233,333 -766,667 -766,667 0 0 Net cash increase or decrease 9,456,008 8,975,048 9,860,809 10,800,496 11,211,667 Beginning cash 0 9,456,008 18,431,057 28,291,865 39,092,362 Ending cash 9,456,008 18,431,057 28,291,865 39,092,362 50,304,028

246
Cost decrease 15%
Cash flow Year 1 Year 2 Year 3 Year 4 Year 5 Cash flows from operating activity 0 0 0 0 0 Cash inflow 0 0 0 0 0 Cash received on sales 41,120,324 45,232,357 49,344,389 51,400,406 53,456,422 Cash from account receivable 0 0 0 0 0 Adjust office supplies 0 0 0 0 0 Adjust rental building 0 0 0 0 0 Adjust depreciation 76,257 76,257 76,257 45,593 45,593 Other 0 0 0 0 0 Cash inflow from operating activity 41,196,581 45,308,614 49,420,646 51,445,999 53,502,015 Cash out flow 0 0 0 0 0 Cost of goods sold 24,672,195 27,139,414 29,606,634 30,840,243 32,073,853 Marketing expense 926,251 1,012,697 1,099,213 1,142,608 1,187,503 Administrative expense 1,252,078 1,339,402 1,426,726 1,483,386 1,570,711 Cash paid for income tax 4,050,940 4,492,253 4,933,545 5,380,250 5,587,306
Other cash expense 0 0 0 0 0 Cash out flow from operating activity 30,901,464 33,983,766 37,066,118 38,846,488 40,419,373 Net cash flows from operating activity 10,295,117 11,324,848 12,354,529 12,599,510 13,082,641 Cash inflow from investing activity 0 0 0 0 0 Cash inflow 0 0 0 0 0 Cash received from sold equipment 0 0 0 0 0 Other 0 0 0 0 0 Cash inflow from investing activity 0 0 0 0 0 Cash outflow 0 0 0 0 0 Cash paid on administrative investment 633,231 0 0 0 0 Cash outflow from investment activity 633,231 0 0 0 0 Net cash flows from investing activity -633,231 0 0 0 0 Cash flows from financing activity 0 0 0 0 0
cash inflow 0 0 0 0 0

247
Cash Loan 2,000,000 0 0 0 0 Other 0 0 0 0 0 Cash inflow from financing activity 2,000,000 0 0 0 0 cash outflow 0 0 0 0 0
Repayment for interest and principle loan 766,667 766,667 766,667 0 0 Cash outflow from financing activity 766,667 766,667 766,667 0 0 Net cash flows from financing activity 1,233,333 -766,667 -766,667 0 0 Net cash increase or decrease 10,895,220 10,558,181 11,587,862 12,599,510 13,082,641 Beginning cash 0 10,895,220 21,453,401 33,041,263 45,640,773 Ending cash 10,895,220 21,453,401 33,041,263 45,640,773 58,723,415
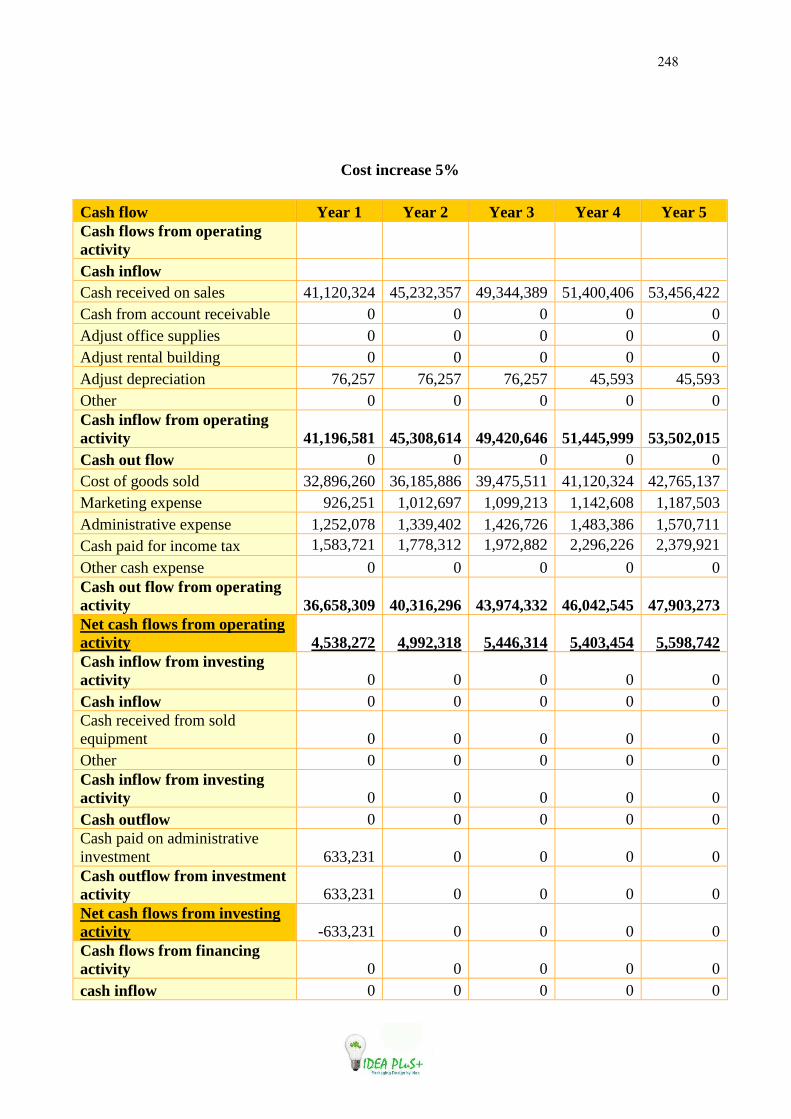
248
Cost increase 5%
Cash flow Year 1 Year 2 Year 3 Year 4 Year 5 Cash flows from operating activity Cash inflow Cash received on sales 41,120,324 45,232,357 49,344,389 51,400,406 53,456,422 Cash from account receivable 0 0 0 0 0 Adjust office supplies 0 0 0 0 0 Adjust rental building 0 0 0 0 0 Adjust depreciation 76,257 76,257 76,257 45,593 45,593 Other 0 0 0 0 0 Cash inflow from operating activity 41,196,581 45,308,614 49,420,646 51,445,999 53,502,015 Cash out flow 0 0 0 0 0 Cost of goods sold 32,896,260 36,185,886 39,475,511 41,120,324 42,765,137 Marketing expense 926,251 1,012,697 1,099,213 1,142,608 1,187,503 Administrative expense 1,252,078 1,339,402 1,426,726 1,483,386 1,570,711 Cash paid for income tax 1,583,721 1,778,312 1,972,882 2,296,226 2,379,921
Other cash expense 0 0 0 0 0 Cash out flow from operating activity 36,658,309 40,316,296 43,974,332 46,042,545 47,903,273 Net cash flows from operating activity 4,538,272 4,992,318 5,446,314 5,403,454 5,598,742 Cash inflow from investing activity 0 0 0 0 0 Cash inflow 0 0 0 0 0 Cash received from sold equipment 0 0 0 0 0 Other 0 0 0 0 0 Cash inflow from investing activity 0 0 0 0 0 Cash outflow 0 0 0 0 0 Cash paid on administrative investment 633,231 0 0 0 0 Cash outflow from investment activity 633,231 0 0 0 0 Net cash flows from investing activity -633,231 0 0 0 0 Cash flows from financing activity 0 0 0 0 0 cash inflow 0 0 0 0 0
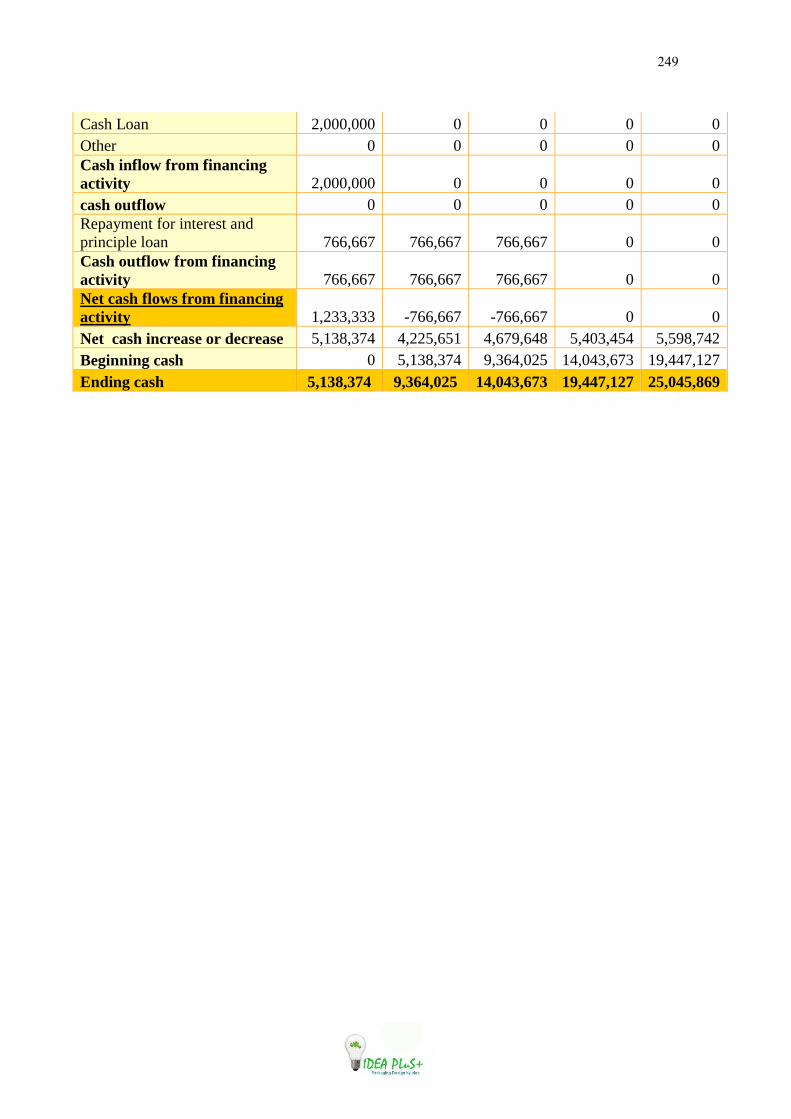
249
Cash Loan 2,000,000 0 0 0 0 Other 0 0 0 0 0 Cash inflow from financing activity 2,000,000 0 0 0 0 cash outflow 0 0 0 0 0 Repayment for interest and principle loan 766,667 766,667 766,667 0 0 Cash outflow from financing activity 766,667 766,667 766,667 0 0 Net cash flows from financing activity 1,233,333 -766,667 -766,667 0 0 Net cash increase or decrease 5,138,374 4,225,651 4,679,648 5,403,454 5,598,742 Beginning cash 0 5,138,374 9,364,025 14,043,673 19,447,127 Ending cash 5,138,374 9,364,025 14,043,673 19,447,127 25,045,869

250
Cost increase 10%
Cash flow Year 1 Year 2 Year 3 Year 4 Year 5 Cash flows from operating activity Cash inflow Cash received on sales 41,120,324 45,232,357 49,344,389 51,400,406 53,456,422 Cash from account receivable 0 0 0 0 0 Adjust office supplies 0 0 0 0 0 Adjust rental building 0 0 0 0 0 Adjust depreciation 76,257 76,257 76,257 45,593 45,593 Other 0 0 0 0 0 Cash inflow from operating activity 41,196,581 45,308,614 49,420,646 51,445,999 53,502,015 Cash out flow 0 0 0 0 0 Cost of goods sold 34,952,276 38,447,503 41,942,731 43,690,345 45,437,959 Marketing expense 926,251 1,012,697 1,099,213 1,142,608 1,187,503 Administrative expense 1,252,078 1,339,402 1,426,726 1,483,386 1,570,711 Cash paid for income tax 966,916 1,099,826 1,232,716 1,525,220 1,578,075
Other cash expense 0 0 0 0 0 Cash out flow from operating activity 38,097,521 41,899,429 45,701,386 47,841,559 49,774,247 Net cash flows from operating activity 3,099,061 3,409,185 3,719,261 3,604,439 3,727,768 Cash inflow from investing activity 0 0 0 0 0 Cash inflow 0 0 0 0 0 Cash received from sold equipment 0 0 0 0 0 Other 0 0 0 0 0 Cash inflow from investing activity 0 0 0 0 0 Cash outflow 0 0 0 0 0 Cash paid on administrative investment 633,231 0 0 0 0 Cash outflow from investment activity 633,231 0 0 0 0 Net cash flows from investing activity -633,231 0 0 0 0 Cash flows from financing activity 0 0 0 0 0 cash inflow 0 0 0 0 0

251
Cash Loan 2,000,000 0 0 0 0 Other 0 0 0 0 0 Cash inflow from financing activity 2,000,000 0 0 0 0 cash outflow 0 0 0 0 0 Repayment for interest and principle loan 766,667 766,667 766,667 0 0 Cash outflow from financing activity 766,667 766,667 766,667 0 0 Net cash flows from financing activity 1,233,333 -766,667 -766,667 0 0 Net cash increase or decrease 3,699,163 2,642,518 2,952,594 3,604,439 3,727,768 Beginning cash 0 3,699,163 6,341,681 9,294,275 12,898,715 Ending cash 3,699,163 6,341,681 9,294,275 12,898,715 16,626,482

252
Cost increase 15%
Cash flow Year 1 Year 2 Year 3 Year 4 Year 5 Cash flows from operating activity Cash inflow Cash received on sales 41,120,324 45,232,357 49,344,389 51,400,406 53,456,422 Cash from account receivable 0 0 0 0 0 Adjust office supplies 0 0 0 0 0 Adjust rental bulging 0 0 0 0 0 Adjust depreciation 76,257 76,257 76,257 45,593 45,593 Other 0 0 0 0 0 Cash inflow from operating activity 41,196,581 45,308,614 49,420,646 51,445,999 53,502,015 Cash out flow 0 0 0 0 0 Cost of goods sold 37,008,292 40,709,121 44,409,950 46,260,365 48,110,780 Marketing expense 926,251 1,012,697 1,099,213 1,142,608 1,187,503 Administrative expense 1,252,078 1,339,402 1,426,726 1,483,386 1,570,711 Cash paid for income tax 350,111 421,341 492,550 754,214 776,228
Other cash expense 0 0 0 0 0 Cash out flow from operating activity 39,536,732 43,482,561 47,428,439 49,640,573 51,645,222 Net cash flows from operating activity 1,659,849 1,826,053 1,992,207 1,805,425 1,856,793 Cash inflow from investing activity 0 0 0 0 0 Cash inflow 0 0 0 0 0 Cash received from sold equipment 0 0 0 0 0 Other 0 0 0 0 0 Cash inflow from investing activity 0 0 0 0 0 Cash outflow 0 0 0 0 0 Cash paid on administrative investment 633,231 0 0 0 0 Cash outflow from investment activity 633,231 0 0 0 0 Net cash flows from investing activity -633,231 0 0 0 0 Cash flows from financing activity 0 0 0 0 0 cash inflow 0 0 0 0 0

253
Cash Loan 2,000,000 0 0 0 0 Other 0 0 0 0 0 Cash inflow from financing activity 2,000,000 0 0 0 0 cash outflow 0 0 0 0 0 Repayment for interest and principle loan 766,667 766,667 766,667 0 0 Cash outflow from financing activity 766,667 766,667 766,667 0 0 Net cash flows from financing activity 1,233,333 -766,667 -766,667 0 0 Net cash increase or decrease 2,259,952 1,059,386 1,225,540 1,805,425 1,856,793 Beginning cash 0 2,259,952 3,319,338 4,544,878 6,350,303 Ending cash 2,259,952 3,319,338 4,544,878 6,350,303 8,207,096

254
Sales decrease 5%
Cash flow Year 1 Year 2 Year 3 Year 4 Year 5 Cash flows from operating activity Cash inflow Cash received on sales 41,120,324 43,176,341 47,288,373 51,400,406 51,400,406 Cash from account receivable 0 0 0 0 0 Adjust office supplies 0 0 0 0 0 Adjust rental building 0 0 0 0 0 Adjust depreciation 76,257 76,257 76,257 45,593 45,593 Other 0 0 0 0 0 Cash inflow from operating activity 41,196,581 43,252,598 47,364,630 51,445,999 51,445,999 Cash out flow 0 0 0 0 0 Cost of goods sold 30,840,243 32,382,256 35,466,280 38,550,304 38,550,304 Marketing expense 926,251 971,577 1,058,092 1,142,608 1,146,383 Administrative expense 1,252,078 1,339,402 1,426,726 1,483,386 1,570,711 Cash paid for income tax 2,200,526 2,314,932 2,571,182 3,067,232 3,039,902
Other cash expense 0 0 0 0 0 Cash out flow from operating activity 35,219,098 37,008,166 40,522,281 44,243,531 44,307,300 Net cash flows from operating activity 5,977,483 6,244,432 6,842,349 7,202,468 7,138,698 Cash inflow from investing activity 0 0 0 0 0 Cash inflow 0 0 0 0 0 Cash received from sold equipment 0 0 0 0 0 Other 0 0 0 0 0 Cash inflow from investing activity 0 0 0 0 0 Cash outflow 0 0 0 0 0 Cash paid on administrative investment 633,231 0 0 0 0 Cash outflow from investment activity 633,231 0 0 0 0 Net cash flows from investing activity -633,231 0 0 0 0 Cash flows from financing activity 0 0 0 0 0 cash inflow 0 0 0 0 0

255
Cash Loan 2,000,000 0 0 0 0 Other 0 0 0 0 0 Cash inflow from financing activity 2,000,000 0 0 0 0 cash outflow 0 0 0 0 0 Repayment for interest and principle loan 766,667 766,667 766,667 0 0 Cash outflow from financing activity 766,667 766,667 766,667 0 0 Net cash flows from financing activity 1,233,333 -766,667 -766,667 0 0 Net cash increase or decrease 6,577,586 5,477,765 6,075,683 7,202,468 7,138,698 Beginning cash 0 6,577,586 12,055,351 18,131,033 25,333,501
Ending cash 6,577,586 12,055,351 18,131,033 25,333,501 32,472,200
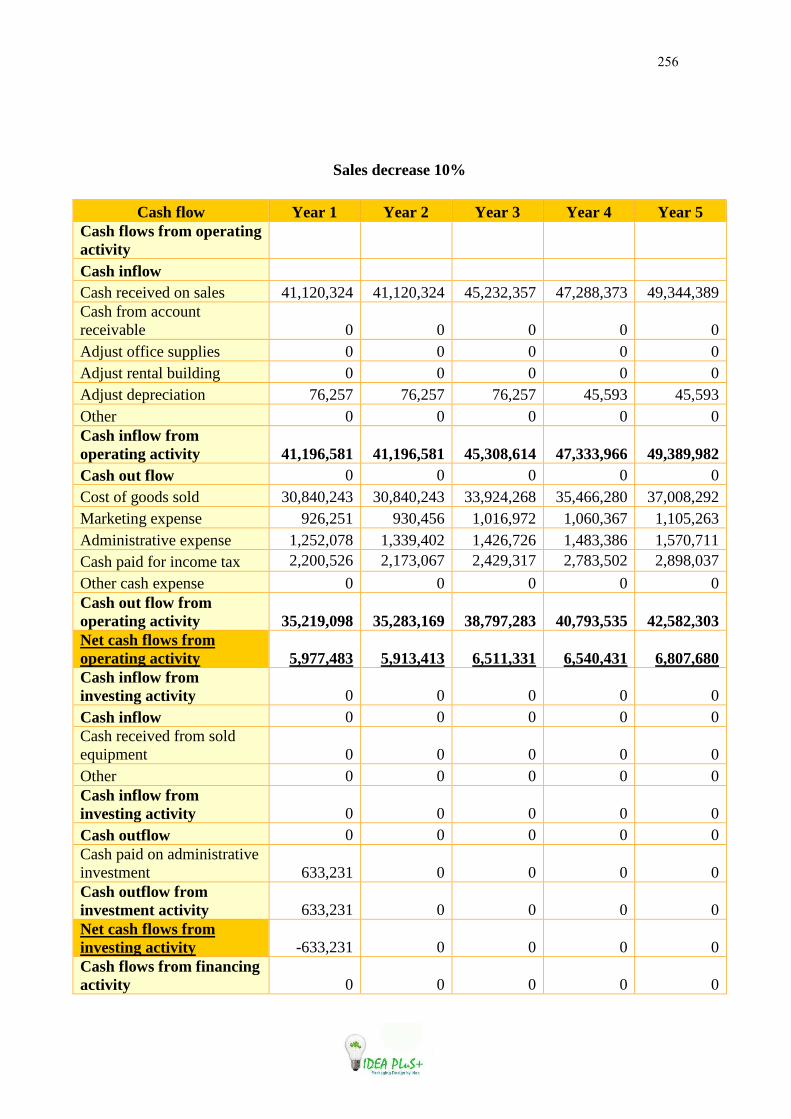
256
Sales decrease 10%
Cash flow Year 1 Year 2 Year 3 Year 4 Year 5 Cash flows from operating activity Cash inflow Cash received on sales 41,120,324 41,120,324 45,232,357 47,288,373 49,344,389 Cash from account receivable 0 0 0 0 0 Adjust office supplies 0 0 0 0 0 Adjust rental building 0 0 0 0 0 Adjust depreciation 76,257 76,257 76,257 45,593 45,593 Other 0 0 0 0 0 Cash inflow from operating activity 41,196,581 41,196,581 45,308,614 47,333,966 49,389,982 Cash out flow 0 0 0 0 0 Cost of goods sold 30,840,243 30,840,243 33,924,268 35,466,280 37,008,292 Marketing expense 926,251 930,456 1,016,972 1,060,367 1,105,263 Administrative expense 1,252,078 1,339,402 1,426,726 1,483,386 1,570,711 Cash paid for income tax 2,200,526 2,173,067 2,429,317 2,783,502 2,898,037
Other cash expense 0 0 0 0 0 Cash out flow from operating activity 35,219,098 35,283,169 38,797,283 40,793,535 42,582,303 Net cash flows from operating activity 5,977,483 5,913,413 6,511,331 6,540,431 6,807,680 Cash inflow from investing activity 0 0 0 0 0 Cash inflow 0 0 0 0 0 Cash received from sold equipment 0 0 0 0 0 Other 0 0 0 0 0 Cash inflow from investing activity 0 0 0 0 0 Cash outflow 0 0 0 0 0 Cash paid on administrative investment 633,231 0 0 0 0 Cash outflow from investment activity 633,231 0 0 0 0 Net cash flows from investing activity -633,231 0 0 0 0 Cash flows from financing activity 0 0 0 0 0

257
cash inflow 0 0 0 0 0 Cash Loan 2,000,000 0 0 0 0 Other 0 0 0 0 0 Cash inflow from financing activity 2,000,000 0 0 0 0 cash outflow 0 0 0 0 0 Repayment for interest and principle loan 766,667 766,667 766,667 0 0 Cash outflow from financing activity 766,667 766,667 766,667 0 0 Net cash flows from financing activity 1,233,333 -766,667 -766,667 0 0 Net cash increase or decrease 6,577,586 5,146,746 5,744,664 6,540,431 6,807,680 Beginning cash 0 6,577,586 11,724,332 17,468,996 24,009,427 Ending cash 6,577,586 11,724,332 17,468,996 24,009,427 30,817,106

258
Sales decrease 15%
Cash flow Year 1 Year 2 Year 3 Year 4 Year 5 Cash flows from operating activity Cash inflow Cash received on sales 41,120,324 39,064,308 43,176,341 45,232,357 47,288,373 Cash from account receivable 0 0 0 0 0 Adjust office supplies 0 0 0 0 0 Adjust rental building 0 0 0 0 0 Adjust depreciation 76,257 76,257 76,257 45,593 45,593 Other 0 0 0 0 0 Cash inflow from operating activity 41,196,581 39,140,565 43,252,598 45,277,950 47,333,966 Cash out flow 0 0 0 0 0 Cost of goods sold 30,840,243 29,298,231 32,382,256 33,924,268 35,466,280 Marketing expense 926,251 889,336 975,852 1,019,247 1,064,142 Administrative expense 1,252,078 1,339,402 1,426,726 1,483,386 1,570,711 Cash paid for income tax 2,200,526 2,031,202 2,287,452 2,641,637 2,756,172
Other cash expense 0 0 0 0 0 Cash out flow from operating activity 35,219,098 33,558,171 37,072,286 39,068,538 40,857,305 Net cash flows from operating activity 5,977,483 5,582,394 6,180,312 6,209,412 6,476,661 Cash inflow from investing activity 0 0 0 0 0 Cash inflow 0 0 0 0 0 Cash received from sold equipment 0 0 0 0 0 Other 0 0 0 0 0 Cash inflow from investing activity 0 0 0 0 0 Cash outflow 0 0 0 0 0 Cash paid on administrative investment 633,231 0 0 0 0 Cash outflow from investment activity 633,231 0 0 0 0 Net cash flows from investing activity -633,231 0 0 0 0 Cash flows from financing activity 0 0 0 0 0

259
cash inflow 0 0 0 0 0 Cash Loan 2,000,000 0 0 0 0 Other 0 0 0 0 0 Cash inflow from financing activity 2,000,000 0 0 0 0 cash outflow 0 0 0 0 0 Repayment for interest and principle loan 766,667 766,667 766,667 0 0 Cash outflow from financing activity 766,667 766,667 766,667 0 0 Net cash flows from financing activity 1,233,333 -766,667 -766,667 0 0 Net cash increase or decrease 6,577,586 4,815,728 5,413,645 6,209,412 6,476,661 Beginning cash 0 6,577,586 11,393,313 16,806,959 23,016,371
Ending cash 6,577,586 11,393,313 16,806,959 23,016,371 29,493,032

260
Sales increase 5%
Cash flow Year 1 Year 2 Year 3 Year 4 Year 5 Cash flows from operating activity Cash inflow Cash received on sales 41,120,324 47,288,373 51,400,406 53,456,422 55,512,438 Cash from account receivable 0 0 0 0 0 Adjust office supplies 0 0 0 0 0 Adjust rental building 0 0 0 0 0 Adjust depreciation 76,257 76,257 76,257 45,593 45,593 Other 0 0 0 0 0 Cash inflow from operating activity 41,196,581 47,364,630 51,476,663 53,502,015 55,558,031 Cash out flow 0 0 0 0 0 Cost of goods sold 30,840,243 35,466,280 38,550,304 40,092,316 41,634,329 Marketing expense 926,251 1,053,817 1,140,333 1,183,728 1,228,624 Administrative expense 1,252,078 1,339,402 1,426,726 1,483,386 1,570,711 Cash paid for income tax 2,200,526 2,598,662 2,854,913 3,209,097 3,323,633
Other cash expense 0 0 0 0 0 Cash out flow from operating activity 35,219,098 40,458,161 43,972,276 45,968,528 47,757,295 Net cash flows from operating activity 5,977,483 6,906,469 7,504,387 7,533,487 7,800,736 Cash inflow from investing activity 0 0 0 0 0 Cash inflow 0 0 0 0 0 Cash received from sold equipment 0 0 0 0 0 Other 0 0 0 0 0 Cash inflow from investing activity 0 0 0 0 0 Cash outflow 0 0 0 0 0 Cash paid on administrative investment 633,231 0 0 0 0 Cash outflow from investment activity 633,231 0 0 0 0 Net cash flows from investing activity -633,231 0 0 0 0 Cash flows from financing activity 0 0 0 0 0

261
cash inflow 0 0 0 0 0 Cash Loan 2,000,000 0 0 0 0 Other 0 0 0 0 0 Cash inflow from financing activity 2,000,000 0 0 0 0 cash outflow 0 0 0 0 0 Repayment for interest and principle loan 766,667 766,667 766,667 0 0 Cash outflow from financing activity 766,667 766,667 766,667 0 0 Net cash flows from financing activity 1,233,333 -766,667 -766,667 0 0 Net cash increase or decrease 6,577,586 6,139,802 6,737,720 7,533,487 7,800,736 Beginning cash 0 6,577,586 12,717,388 19,455,108 26,988,594 Ending cash 6,577,586 12,717,388 19,455,108 26,988,594 34,789,330

262
Sales increase 10%
Cash flow Year 1 Year 2 Year 3 Year 4 Year 5 Cash flows from operating activity Cash inflow Cash received on sales 41,120,324 49,344,389 53,456,422 55,512,438 57,568,454 Cash from account receivable 0 0 0 0 0 Adjust office supplies 0 0 0 0 0 Adjust rental building 0 0 0 0 0 Adjust depreciation 76,257 76,257 76,257 45,593 45,593 Other 0 0 0 0 0 Cash inflow from operating activity 41,196,581 49,420,646 53,532,679 55,558,031 57,614,047 Cash out flow 0 0 0 0 0 Cost of goods sold 30,840,243 37,008,292 40,092,316 41,634,329 43,176,341 Marketing expense 926,251 1,094,938 1,181,453 1,224,849 1,269,744 Administrative expense 1,252,078 1,339,402 1,426,726 1,483,386 1,570,711 Cash paid for income tax 2,200,526 2,740,527 2,996,778 3,350,962 3,465,498
Other cash expense 0 0 0 0 0 Cash out flow from operating activity 35,219,098 42,183,159 45,697,274 47,693,526 49,482,293 Net cash flows from operating activity 5,977,483 7,237,487 7,835,405 7,864,505 8,131,754 Cash inflow from investing activity 0 0 0 0 0 Cash inflow 0 0 0 0 0 Cash received from sold equipment 0 0 0 0 0 Other 0 0 0 0 0 Cash inflow from investing activity 0 0 0 0 0 Cash outflow 0 0 0 0 0 Cash paid on administrative investment 633,231 0 0 0 0 Cash outflow from investment activity 633,231 0 0 0 0 Net cash flows from investing activity -633,231 0 0 0 0 Cash flows from financing activity 0 0 0 0 0 cash inflow 0 0 0 0 0

263
Cash Loan 2,000,000 0 0 0 0 Other 0 0 0 0 0 Cash inflow from financing activity 2,000,000 0 0 0 0 cash outflow 0 0 0 0 0 Repayment for interest and principle loan 766,667 766,667 766,667 0 0 Cash outflow from financing activity 766,667 766,667 766,667 0 0 Net cash flows from financing activity 1,233,333 -766,667 -766,667 0 0 Net cash increase or decrease 6,577,586 6,470,821 7,068,738 7,864,505 8,131,754 Beginning cash 0 6,577,586 13,048,406 20,117,145 27,981,650 Ending cash 6,577,586 13,048,406 20,117,145 27,981,650 36,113,404
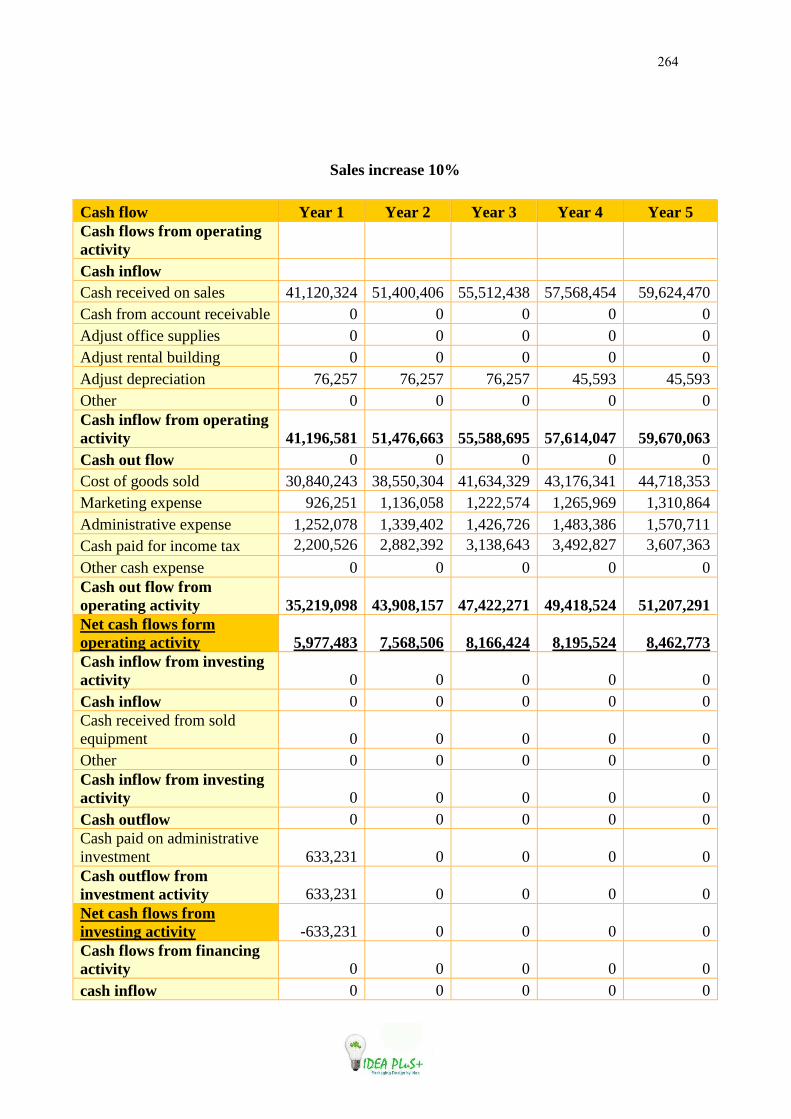
264
Sales increase 10%
Cash flow Year 1 Year 2 Year 3 Year 4 Year 5 Cash flows from operating activity Cash inflow Cash received on sales 41,120,324 51,400,406 55,512,438 57,568,454 59,624,470 Cash from account receivable 0 0 0 0 0 Adjust office supplies 0 0 0 0 0 Adjust rental building 0 0 0 0 0 Adjust depreciation 76,257 76,257 76,257 45,593 45,593 Other 0 0 0 0 0 Cash inflow from operating activity 41,196,581 51,476,663 55,588,695 57,614,047 59,670,063 Cash out flow 0 0 0 0 0 Cost of goods sold 30,840,243 38,550,304 41,634,329 43,176,341 44,718,353 Marketing expense 926,251 1,136,058 1,222,574 1,265,969 1,310,864 Administrative expense 1,252,078 1,339,402 1,426,726 1,483,386 1,570,711 Cash paid for income tax 2,200,526 2,882,392 3,138,643 3,492,827 3,607,363
Other cash expense 0 0 0 0 0 Cash out flow from operating activity 35,219,098 43,908,157 47,422,271 49,418,524 51,207,291 Net cash flows form operating activity 5,977,483 7,568,506 8,166,424 8,195,524 8,462,773 Cash inflow from investing activity 0 0 0 0 0 Cash inflow 0 0 0 0 0 Cash received from sold equipment 0 0 0 0 0 Other 0 0 0 0 0 Cash inflow from investing activity 0 0 0 0 0 Cash outflow 0 0 0 0 0 Cash paid on administrative investment 633,231 0 0 0 0 Cash outflow from investment activity 633,231 0 0 0 0 Net cash flows from investing activity -633,231 0 0 0 0 Cash flows from financing activity 0 0 0 0 0 cash inflow 0 0 0 0 0
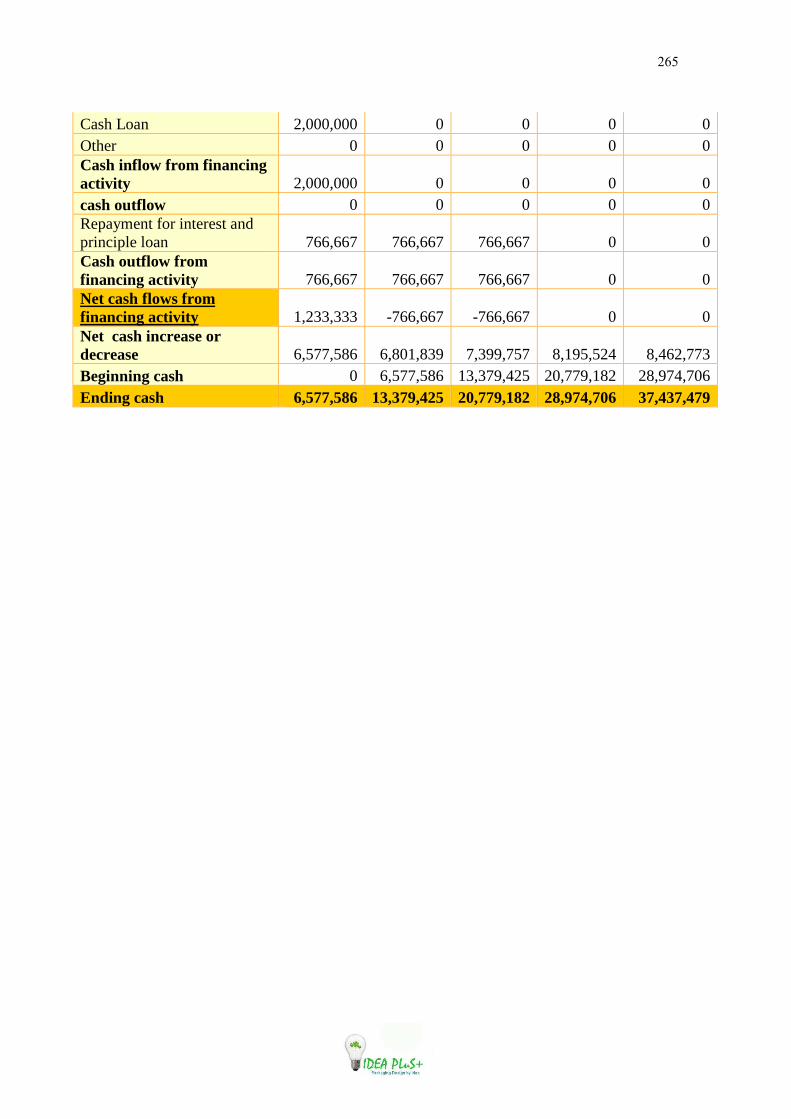
265
Cash Loan 2,000,000 0 0 0 0 Other 0 0 0 0 0 Cash inflow from financing activity 2,000,000 0 0 0 0 cash outflow 0 0 0 0 0 Repayment for interest and principle loan 766,667 766,667 766,667 0 0 Cash outflow from financing activity 766,667 766,667 766,667 0 0 Net cash flows from financing activity 1,233,333 -766,667 -766,667 0 0 Net cash increase or decrease 6,577,586 6,801,839 7,399,757 8,195,524 8,462,773 Beginning cash 0 6,577,586 13,379,425 20,779,182 28,974,706 Ending cash 6,577,586 13,379,425 20,779,182 28,974,706 37,437,479

266
Cost decrease 5%
Balance sheet Year 1 Year 2 Year 3 Year 4 Year 5 Asset 0 0 0 0 0 Current asset 0 0 0 0 0 cash 58,397,804 143,197,225 236,617,506 339,817,853 449,989,788 Other current asset 0 0 0 0 0 Total current asset 58,397,804 143,197,225 236,617,506 339,817,853 449,989,788 Fixed asset 0 0 0 0 0 Administrative fix asset 7,103,102 6,188,018 5,272,934 4,557,166 4,010,050 Total Fixed asset 7,103,102 6,188,018 5,272,934 4,557,166 4,010,050 Total asset 65,500,905 149,385,243 241,890,439 344,375,018 453,999,837 0 0 0 0 0 Liability and Equity 0 0 0 0 0 Liability 0 0 0 0 0 Long tern note payable 24,000,000 24,000,000 24,000,000 24,000,000 24,000,000 Other 0 0 0 0 0 Total liability 24,000,000 24,000,000 24,000,000 24,000,000 24,000,000 Equity 0 0 0 0 0 Retain earning 41,500,905 125,385,243 217,890,439 320,375,018 429,999,837 Owner equity 0 0 0 0 0 Total owner equity 41,500,905 125,385,243 217,890,439 320,375,018 429,999,837 Total liability and equity 65,500,905 149,385,243 241,890,439 344,375,018 453,999,837

267
Cost decrease 10%
Balance sheet Year 1 Year 2 Year 3 Year 4 Year 5 Asset 0 0 0 0 0 Current asset 0 0 0 0 0 cash 67,566,873 170,553,737 283,888,515 408,271,959 540,490,517 Other current asset 0 0 0 0 0 Total current asset 67,566,873 170,553,737 283,888,515 408,271,959 540,490,517 Fixed asset 0 0 0 0 0 Administrative fix asset 7,103,102 6,188,018 5,272,934 4,557,166 4,010,050 Total Fixed asset 7,103,102 6,188,018 5,272,934 4,557,166 4,010,050 Total asset 74,669,974 176,741,755 289,161,448 412,829,124 544,500,567 0 0 0 0 0 Liability and Equity 0 0 0 0 0 Liability 0 0 0 0 0 Long tern note payable 24,000,000 24,000,000 24,000,000 24,000,000 24,000,000 Other 0 0 0 0 0 Total liability 24,000,000 24,000,000 24,000,000 24,000,000 24,000,000 Equity 0 0 0 0 0 Retain earning 50,669,974 152,741,755 265,161,448 388,829,124 520,500,567 Owner equity 0 0 0 0 0 Total owner equity 50,669,974 152,741,755 265,161,448 388,829,124 520,500,567 Total liability and equity 74,669,974 176,741,755 289,161,448 412,829,124 544,500,567

268
Cost decrease 15%
Balance sheet Year 1 Year 2 Year 3 Year 4 Year 5 Asset Current asset cash 76,735,942 197,910,249 331,159,524 476,726,065 630,991,247 Other current asset 0 0 0 0 0 Total current asset 76,735,942 197,910,249 331,159,524 476,726,065 630,991,247 Fixed asset 0 0 0 0 0 Administrative fix asset 7,103,102 6,188,018 5,272,934 4,557,166 4,010,050 Total Fixed asset 7,103,102 6,188,018 5,272,934 4,557,166 4,010,050 Total asset 83,839,043 204,098,267 336,432,457 481,283,230 635,001,297 0 0 0 0 0 Liability and Equity 0 0 0 0 0 Liability 0 0 0 0 0 Long tern note payable 24,000,000 24,000,000 24,000,000 24,000,000 24,000,000 Other 0 0 0 0 0 Total liability 24,000,000 24,000,000 24,000,000 24,000,000 24,000,000 Equity 0 0 0 0 0 Retain earning 59,839,043 180,098,267 312,432,457 457,283,230 611,001,297 Owner equity 0 0 0 0 0 Total owner equity 59,839,043 180,098,267 312,432,457 457,283,230 611,001,297 Total liability and equity 83,839,043 204,098,267 336,432,457 481,283,230 635,001,297

269
Cost increase 10%
Balance sheet Year 1 Year 2 Year 3 Year 4 Year 5 Asset Current asset cash 30,890,597 61,127,689 94,804,479 134,455,535 178,487,598 Other current asset 0 0 0 0 0 Total current asset 30,890,597 61,127,689 94,804,479 134,455,535 178,487,598 Fixed asset 0 0 0 0 0 Administrative fix asset 7,103,102 6,188,018 5,272,934 4,557,166 4,010,050 Total Fixed asset 7,103,102 6,188,018 5,272,934 4,557,166 4,010,050 Total asset 37,993,698 67,315,706 100,077,412 139,012,700 182,497,648 0 0 0 0 0 Liability and Equity 0 0 0 0 0 Liability 0 0 0 0 0 Long tern note payable 24,000,000 24,000,000 24,000,000 24,000,000 24,000,000 Other 0 0 0 0 0 Total liability 24,000,000 24,000,000 24,000,000 24,000,000 24,000,000 Equity 0 0 0 0 0 Retain earning 13,993,698 43,315,706 76,077,412 115,012,700 158,497,648 Owner equity 0 0 0 0 0 Total owner equity 13,993,698 43,315,706 76,077,412 115,012,700 158,497,648 Total liability and equity 37,993,698 67,315,706 100,077,412 139,012,700 182,497,648

270
Cost increase 15%
Balance sheet Year 1 Year 2 Year 3 Year 4 Year 5 Asset Current asset cash 21,721,528 33,771,176 47,533,470 66,001,429 87,986,869 Other current asset 0 0 0 0 0 Total current asset 21,721,528 33,771,176 47,533,470 66,001,429 87,986,869 Fixed asset 0 0 0 0 0 Administrative fix asset 7,103,102 6,188,018 5,272,934 4,557,166 4,010,050 Total Fixed asset 7,103,102 6,188,018 5,272,934 4,557,166 4,010,050 Total asset 28,824,629 39,959,194 52,806,403 70,558,594 91,996,918 0 0 0 0 0 Liability and Equity 0 0 0 0 0 Liability 0 0 0 0 0 Long tern note payable 24,000,000 24,000,000 24,000,000 24,000,000 24,000,000 Other 0 0 0 0 0 Total liability 24,000,000 24,000,000 24,000,000 24,000,000 24,000,000 Equity 0 0 0 0 0 Retain earning 4,824,629 15,959,194 28,806,403 46,558,594 67,996,918 Owner equity 0 0 0 0 0 Total owner equity 4,824,629 15,959,194 28,806,403 46,558,594 67,996,918 Total liability and equity 28,824,629 39,959,194 52,806,403 70,558,594 91,996,918

271
Sales decrease 5%
Balance sheet Year 1 Year 2 Year 3 Year 4 Year 5 Asset Current asset cash 49,228,735 113,731,827 183,265,388 263,419,300 349,435,725 Other current asset 0 0 0 0 0 Total current asset 49,228,735 113,731,827 183,265,388 263,419,300 349,435,725 Fixed asset 0 0 0 0 0 Administrative fix asset 7,103,102 6,188,018 5,272,934 4,557,166 4,010,050 Total Fixed asset 7,103,102 6,188,018 5,272,934 4,557,166 4,010,050 Total asset 56,331,836 119,919,844 188,538,321 267,976,466 353,445,775 0 0 0 0 0 Liability and Equity 0 0 0 0 0 Liability 0 0 0 0 0 Long tern note payable 24,000,000 24,000,000 24,000,000 24,000,000 24,000,000 Other 0 0 0 0 0 Total liability 24,000,000 24,000,000 24,000,000 24,000,000 24,000,000 Equity 0 0 0 0 0 Retain earning 32,331,836 95,919,844 164,538,321 243,976,466 329,445,775 Owner equity 0 0 0 0 0 Total owner equity 32,331,836 95,919,844 164,538,321 243,976,466 329,445,775 Total liability and equity 56,331,836 119,919,844 188,538,321 267,976,466 353,445,775

272
Sales decrease 10%
Balance sheet Year 1 Year 2 Year 3 Year 4 Year 5 Asset Current asset cash 49,228,735 111,622,941 177,184,278 251,257,082 331,437,946 Other current asset 0 0 0 0 0 Total current asset 49,228,735 111,622,941 177,184,278 251,257,082 331,437,946 Fixed asset 0 0 0 0 0 Administrative fix asset 7,103,102 6,188,018 5,272,934 4,557,166 4,010,050 Total Fixed asset 7,103,102 6,188,018 5,272,934 4,557,166 4,010,050 Total asset 56,331,836 117,810,959 182,457,212 255,814,247 335,447,996 0 0 0 0 0 Liability and Equity 0 0 0 0 0 Liability 0 0 0 0 0 Long tern note payable 24,000,000 24,000,000 24,000,000 24,000,000 24,000,000 Other 0 0 0 0 0 Total liability 24,000,000 24,000,000 24,000,000 24,000,000 24,000,000 Equity 0 0 0 0 0 Retain earning 32,331,836 93,810,959 158,457,212 231,814,247 311,447,996 Owner equity 0 0 0 0 0 Total owner equity 32,331,836 93,810,959 158,457,212 231,814,247 311,447,996 Total liability and equity 56,331,836 117,810,959 182,457,212 255,814,247 335,447,996

273
Sales decrease 15%
Balance sheet Year 1 Year 2 Year 3 Year 4 Year 5 Asset Current asset cash 49,228,735 109,514,055 171,103,169 241,203,749 317,412,390 Other current asset 0 0 0 0 0 Total current asset 49,228,735 109,514,055 171,103,169 241,203,749 317,412,390 Fixed asset 0 0 0 0 0 Administrative fix asset 7,103,102 6,188,018 5,272,934 4,557,166 4,010,050 Total Fixed asset 7,103,102 6,188,018 5,272,934 4,557,166 4,010,050 Total asset 56,331,836 115,702,073 176,376,103 245,760,915 321,422,440 0 0 0 0 0 Liability and Equity 0 0 0 0 0 Liability 0 0 0 0 0 Long tern note payable 24,000,000 24,000,000 24,000,000 24,000,000 24,000,000 Other 0 0 0 0 0 Total liability 24,000,000 24,000,000 24,000,000 24,000,000 24,000,000 Equity 0 0 0 0 0 Retain earning 32,331,836 91,702,073 152,376,103 221,760,915 297,422,440 Owner equity 0 0 0 0 0 Total owner equity 32,331,836 91,702,073 152,376,103 221,760,915 297,422,440 Total liability and equity 56,331,836 115,702,073 176,376,103 245,760,915 321,422,440

274
Sales decrease 5%
Balance sheet Year 1 Year 2 Year 3 Year 4 Year 5 Asset Current asset cash 49,228,735 117,949,599 195,427,606 281,417,079 373,514,614 Other current asset 0 0 0 0 0 Total current asset 49,228,735 117,949,599 195,427,606 281,417,079 373,514,614 Fixed asset 0 0 0 0 0 Administrative fix asset 7,103,102 6,188,018 5,272,934 4,557,166 4,010,050 Total Fixed asset 7,103,102 6,188,018 5,272,934 4,557,166 4,010,050 Total asset 56,331,836 124,137,616 200,700,539 285,974,245 377,524,663 0 0 0 0 0 Liability and Equity 0 0 0 0 0 Liability 0 0 0 0 0 Long tern note payable 24,000,000 24,000,000 24,000,000 24,000,000 24,000,000 Other 0 0 0 0 0 Total liability 24,000,000 24,000,000 24,000,000 24,000,000 24,000,000 Equity 0 0 0 0 0 Retain earning 32,331,836 100,137,616 176,700,539 261,974,245 353,524,663 Owner equity 0 0 0 0 0 Total owner equity 32,331,836 100,137,616 176,700,539 261,974,245 353,524,663 Total liability and equity 13,198,105 124,137,616 200,700,539 285,974,245 377,524,663
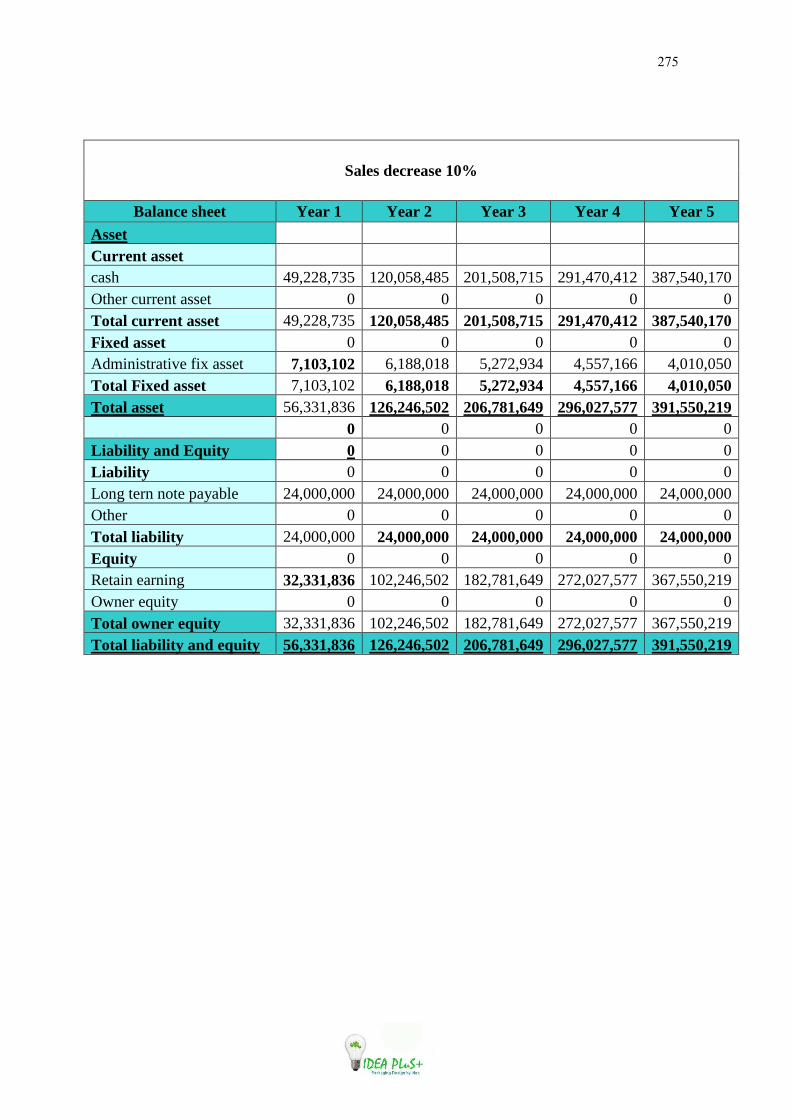
275
Sales decrease 10%
Balance sheet Year 1 Year 2 Year 3 Year 4 Year 5 Asset Current asset cash 49,228,735 120,058,485 201,508,715 291,470,412 387,540,170 Other current asset 0 0 0 0 0 Total current asset 49,228,735 120,058,485 201,508,715 291,470,412 387,540,170 Fixed asset 0 0 0 0 0 Administrative fix asset 7,103,102 6,188,018 5,272,934 4,557,166 4,010,050 Total Fixed asset 7,103,102 6,188,018 5,272,934 4,557,166 4,010,050 Total asset 56,331,836 126,246,502 206,781,649 296,027,577 391,550,219 0 0 0 0 0 Liability and Equity 0 0 0 0 0 Liability 0 0 0 0 0 Long tern note payable 24,000,000 24,000,000 24,000,000 24,000,000 24,000,000 Other 0 0 0 0 0 Total liability 24,000,000 24,000,000 24,000,000 24,000,000 24,000,000 Equity 0 0 0 0 0 Retain earning 32,331,836 102,246,502 182,781,649 272,027,577 367,550,219 Owner equity 0 0 0 0 0 Total owner equity 32,331,836 102,246,502 182,781,649 272,027,577 367,550,219 Total liability and equity 56,331,836 126,246,502 206,781,649 296,027,577 391,550,219

276
Sales decrease 15%
Balance sheet Year 1 Year 2 Year 3 Year 4 Year 5 Asset Current asset cash 49,228,735 122,167,370 207,589,824 301,523,744 401,565,726 Other current asset 0 0 0 0 0 Total current asset 49,228,735 122,167,370 207,589,824 301,523,744 401,565,726 Fixed asset 0 0 0 0 0 Administrative fix asset 7,103,102 6,188,018 5,272,934 4,557,166 4,010,050 Total Fixed asset 7,103,102 6,188,018 5,272,934 4,557,166 4,010,050 Total asset 56,331,836 128,355,388 212,862,758 306,080,910 405,575,775 0 0 0 0 0 Liability and Equity 0 0 0 0 0 Liability 0 0 0 0 0 Long tern note payable 24,000,000 24,000,000 24,000,000 24,000,000 24,000,000 Other 0 0 0 0 0 Total liability 24,000,000 24,000,000 24,000,000 24,000,000 24,000,000 Equity 0 0 0 0 0 Retain earning 32,331,836 104,355,388 188,862,758 282,080,910 381,575,775 Owner equity 0 0 0 0 0 Total owner equity 32,331,836 104,355,388 188,862,758 282,080,910 381,575,775 Total liability and equity 56,331,836 128,355,388 212,862,758 306,080,910 405,575,775
277
Reference
- About Paperboard Packaging (Access date: November, 28, 2009) Available from:
http://www.paperboardpackaging.org/about_paperboard/index.html
- Annual Report-Thai Cane Paper 2007(Access date: November, 16, 2009) Available
from: www.thaicane.com/AR-Thai_Cane_Paper_2007_for_Web.pdf
- Cardboard (Access date: November, 2, 2009) Available from:
http://en.wikipedia.org/wiki/Cardboard
- Corrugated Fiberboard, 2010 (Access date: November, 2, 2009) Available from:
http://en.wikipedia.org/wiki/Corrugated_fiberboard
- Corrugated packaging (Access date: November, 2, 2009) Available from:
http://www.thaiprint.org/viewnews.php?newsid=121
- Electric Equipments (Access date: February, 3, 2010) Available from:
http://www.sripiboon.com/?lang=en,
http://www.yello.co.th/th/viewad.php?cat1=mechandise&id=367858, and
http://www.sripiboon.com/
- Equipment in Toilet (Access date: February, 3, 2010) Available from:
http://www.grandhomemart.com/productdetail.aspx?id=609&catid=1
- Fire Insurance (Access date: January, 18, 2010) Available from:
http://www.muangthaiinsurance.com/products_small_business.htm
- Instructions For Recycling Cardboard (corrugated and paperboard) (Access date:
December, 16, 2009) Available from:
http://www.cityofmemphis.org/pdf_forms/CardboardInstructionsA.pdf
- Internet Host (Access date: January 22, 2010) Available from:
http://www.csloxinfo.com/dialupsme_e.asp
- Maxnet SME (Access date: January 22, 2010) Available from:
http://songkhlatoday.com/paper/5792
- Office Equipments (Access date: February, 3, 2010) Available from:
http://www.officemate.co.th/b2cv4/ofm.aspx?lang=en
278
- Packaging Suppliers (Access date: January 22, 2010) Available from:
http://www.yellowpages.co.th/
- Paperboard (Access date: November, 28, 2009) Available from:
http://en.wikipedia.org/wiki/Paperboard
- Paper & Cardboard(Access date: November, 28, 2009) Available from:
www.cleanup.org.au/.../cua-paper-and-cardboard-fact-sheet.pdf
- Paper Industry (Access date: November, 12, 2009) Available from:
http://www.thaiprint.org/viewindspending.php?indspendid=2
- Pulp (paper) (Access date: November, 6, 2009) Available from:
http://en.wikipedia.org/wiki/Pulp_(paper)
- The results of the production of paper packaging in 2001-2003 (Access date: January
23, 2010) Available from: http://www.thaiprint.org/viewnews.php?newsid=121
- Type of packaging (Access date: November, 23, 2009) Available from:
http://www.prt.kmutt.ac.th/My%20web%20graphic%20on%20package/s6.htm
- Web Packaging links (Access date: December, 2, 2009) Available from:
http://www.asiapaperbag.com/boxes.html, http://www.always-art.com/calendar.html,
http://www.kingcarton.com, and http://www.paperbag.com/index.htm
- What is packaging design? (Access date: November 13, 2009) Available from:
http://www.thaisme.info/2009/07/what-is-packaging-design.html#more
- ก0=24.J<FG?[Jn10M==.ZYJ9oSW416;0W/08=JMI7;>=?กDMก0=SMEs B0Ah6=Eก0=OPOI
h=EE01@W;18ALP.OE60<@g;E .JE82J:W=?MZ=L (Access date: November, 14, 2009) Available
from: http://www.thaisme.info
- ก0=DDกFMMกGCDEก=?:0bG7กR7ก (Access date: December, 6, 2009) Available from:
http://www.scpaperpack.co.th/index.php/620A=7;NLPG7ก6;062=N=0M/620A=7;NLPG7ก6;062=N=0M

279
- ก0=DDกFMMM==.ZYJ9oS (Access date: December, 12, 2009) Available from:
http://www.prc.ac.th/web_pd/package02.html
- U;DA7G./0121>=?30ก=FG?M;01 9 eJ1206A 2552 ก=Aก0=>ก6=DE ก=?N=2EA80:QN< (Access date:
December 4, 2009) Available from: http://www.dopa.go.th/cgi-
bin/tstat.sh?level=1&cccode=%E0%AA%D5%C2%A7%C3%D2%C2&hrcode=%E
0%C1%D7%CD%A7&ttcode=&data=3
- U;DA7GFBCG?D/[email protected]:@3L<E=0<:U;DA7GD/0@YD @ATDE (Access date: December 4, 2009)
Available from: http://www.chiangraifocus.com/aumpher.php?aid=1
- U;DA7G=0<3TPDD/0@YD./0121>=?30ก= 6=J2@=TD1>][.a. : 2548 (Access date: November, 24,
2009) Available
from: http://www.chiangrai.net/database45/D45/N10/N1001.aspx?pg=N10
- h6=Eก0=.J:N/0<ZNea0WB=SM=480=1h<M0<ก0=1/0@U;0UDEQN< DZBW08ก==A@6=TPDE.Jก=กG
(Access date: November, 11, 2009) Available from:
http://otp.moc.go.th/save_file.php?filename=modules/datacenter/research_files/res_s
ht_03072006042236.pdf
- h6=EW=;0EUDEIG4BYJ9oSA2G=2A.JE82J:@3L<E=0< (GPP) (Access date: November, 23,
2009) Available from:
http://www.chiangrai.net/dashboard1/Gpp/Import/Gpp1/%7B27683095_2710255210
16468%7D_%7B62301924_25925521045937%7D_Gpp.xls
- h6=EW=;0EW416;0WCEDDก2552 ก=AWCE@W=4Aก0=WCEDDก W4PE[4A[S ก=?:0bFG?M==.ZYJ9oS
(Access date: November, 23, 2009) Available from:
http://www.depthai.go.th/DEP/DOC/52/52000852.doc
- ./01211JกaOกb0 >=?./0>] 2552 24N<0GJ<D03L2aOกb0@3L<E=0< (Access date: November, 3,
2009) Available from:
http://www.cvc.ac.th/cvc/index.php?view=article&catid=29%3Athe-
cms&id=18%3A-m-m-s&format=pdf&option=com_content&Itemid=55
280
- ./01211JกaOกb0=?:JMDZ:AaOกb0 2539-2541 (Access date: November, 3, 2009)
Available from: http://www.onec.go.th/publication/4120002/chapter1.pdf
- ./0121>=?30ก=F<กB0A กGZCAD0<Z (Access date: December 4, 2009) Available from:
http://www.chiangrai.net/new45/main/?Ls=2
- 314:UDEกGCDE กGCDEG7กR7กNLP14<AH3;กJ1NJP2Q> (Access date: December, 3, 2009) Available
from: http://www.tanatach.com/index.php/th/2009-02-02-08-42-
08/2009-02-08-03-39-37
- 314:UDEGD1ก=?:0bG7กR7ก (Access date: December 4, 2009) Available from:
http://www.scpaperpack.co.th/corrugationsflute.html
- ^01U;DA7G24N<014[1eSD4@GXกN=D14กWS (Access date: December 4, 2009) Available from:
http://www.tkc.go.th/thesis/
- :J31L3L5N4aN0E@a=b^ก4. =0<E012J1NLP 4 Aก=06A 2553 (Access date: December 4, 2009)
Available from: www.btsecurities.com/backoffice/data/files/eci-Nov09.pdf
- N/0@1L<Mh=EE01DZBW08ก==A.JE82J:@3L<E=0< 9 31 BZG06A 2550 (Access date:
December 16, 2009) Available from: http://nsp.mfu.ac.th/download/project/factory_c.xls
- N;D> 10 W416;0A0F=E 8GJE24กpB@a=b^ก4. (Access date: December 13, 2009) Available
from: http://www.pandintong.com/ViewContent.php?ContentID=4943
- 1h<M0<=J^M0G 81OPEB/0MG81OPEIG4BYJ9oS (Access date: December 4, 2009) Available
from: http://www.chiangrai.net/CPOC/miniWeb/ImformationLaw/pk30.htm
- M==.ZYJ9oSก=?:0bFG?[G0WB4ก (Access date: December 4, 2009) Available from:
http://cms.sme.go.th/cms/c/portal/layout?p_l_id=25.713
281
- >=?@YNUDEก=?:0bG7กR7ก (Access date: November 3, 2009) Available from:
http://www.thaicorrugated.com/th/knowledge.php?cid=26
- >=?@YNUDEM==.ZYJ9oS (Access date: December 11, 2009) Available from:
http://www.mew6.com/composer/package/package_7.php
- >=?A09ก0=@a=b^ก4.NJ5E>] 2552 FG?F12h1;A>] 2553 (Access date: January 14,
2010) Available from: http://www.nesdb.go.th/
- IG4BYJ9oSA2G=2AH1>=?@Na QB=A0WNLP 3/2552 (Access date: January 14, 2010))
Available from: www.nesdb.go.th/Portals/0/eco_datas/account/qgdp/.../detail_Thai.pdf
- Y0[=2AUDEDZBW08ก==A@<TPDFG?ก=?:0b (Access date: November 15, 2009) Available
from: http://www2.dede.go.th/kmberc/datacenter/factory/paper/chapter1.doc
- <760G4>BJW : ก=?:0b DZBW08ก==A1/0=0<Q:; (Access date: November, 18, 2009)
Available from: http://www.thaigreenagro.com/aticle.aspx?id=2158
- <D:U0<hDNXD> (Access date: December 15, 2009) Available from:
http://pcocreport.moc.go.th/ReportServer/Pages/ReportViewer.aspx?%2fPCOC%2f
OTOPSALE&rs%3aCommand=Render&province=57
- =0<E01U;DA7G./01211JกaOกb0>\..ZMJ1 Y06ก0=aOกb0>G0<>]ก0=aOกb0 2552 (Access date:
December 4 , 2009) Available from:
http://www.mfu.ac.th/center/stic/images/stories/doc/%E0%B8%A7%207647.pdf
- =0<3TPDWA034ก3A=AeZ=ก4.W4PE[4A[SY06@81TD (Access date: November, 22, 2009) Available
from: http://northprinting.com/component/option,com_sobi2/Itemid,41/
- =?MM^01U;DA7GW0=W1@Na ..@3L<E=0< (Access date: December 15, 2009) Available
from: http://www.chiangrai.net/dashboard1/
282
- =0<E01@a=b^ก4.ก0=6;0.JE82J: @3L<EH8AC@:TD1 [pbY06A >] 2552 (Access date:
November, 6, 2009) Available from:
http://pcoc.moc.go.th/WebFS/frm_view.aspx?pv=50&pM=5&p
Y=2009&id=34
- =0<E01>=?A09ก0=@a=b^ก4.QN<>] 2552 FG? 2553 (Access date: January 15, 2010)
Available from:
http://www.thaipr.net/nc/readnews.aspx?newsid=F48DCC77EFE5C6B57CBA20500
6B7FDFE
- =0<E01iMJMWAM7=9Sก0=aOกb024.J< “ WY02?DZBW08ก==AM==.ZYJ9oSก=?:0b” (Access date:
November, 15, 2009) Available from:
http://www.thaipack.or.th/main/images/download/paper.pdf
- =0<E01Y0[=2AeZ=ก4.M==.ZYJ9oS (Access date: November, 11, 2009) Available from:
http://www.dbd.go.th/mainsite/fileadmin/statistic/statistic_bycategory/0007/1_200
90924.pdf
- =0<E01Wj01ก0=9SDZBW08ก==A .JE82J:@3L<E=0< >] 2550 (Access date: November, 24,
2009) Available from: http://www.industry.go.th/DocLib13/@81TD/@3L<E=0<.doc
- =2A^01U;DA7G@3L<E=0< (Access date: November, 28, 2009) Available from:
http://www.chiangrai.net/new45/main/?Ls=3
- a71<S=2AU;DA7G@a=b^ก4.ก0=6;0.JE82J: (Access date: December, 28, 2009) Available
from: http://pcoc.moc.go.th/pcoc/index_n.aspx
- Wj4B4DZBW08ก==A (Access date: November, 29, 2009) Available from:
http://www.oie.go.th/industrystat_th.asp
- WA06AM==.ZYJ9oSk@BTD1 250M.=?2JEGENZ1>]1L5F[6@ก..45EhBG:GE (Access date:
November, 9, 2009) Available from: http://www.matichon.co.th/prachachart

283
- W=Z>Y02?@a=b^ก4.DZBW08ก==AQB=A0WNLP 3 (ก=กm06A — กJ1<0<1) [.a.
2552(DZBW08ก==A@<TPDก=?:0b ก=?:0b FG?W4PE[4A[S) (Access date: December 2 , 2009)
Available from: http://www.ryt9.com/s/oie/760827
- W=Z>Y02?@a=b^ก4.DZBW08ก==AQN<>] 2550 FG?F12h1;A>] 2551(DZBW08ก==A@<TPD
ก=?:0b ก=?:0b FG?W4PE[4A[S) (Access date: December 2 , 2009) Available from:
http://www.ryt9.com/s/oie/293779
- W=Z>Y02?@a=b^ก4.DZBW08ก==AQN<>] 2552 FG?F12h1;A>] 2553(DZBW08ก==A@<TPDก=?:0b ก=?:0b FG?
W4PE[4A[S) (Access date: December 2 , 2009) Available from:
http://www.ryt9.com/s/oie/781443
- W=Z>IGก0=W/0=2.U;DA7G1JกaOกb0H8AC 24N<0GJ<@กbB=FG?@N6h1hG<L@3L<E=0< (Access date:
November, 17, 2009) Available from:
http://202.143.140.84/research50/student47.pdf
- W=Z>Wj01ก0=9SDZBW08ก==AW4PE[4A[S (Access date: November, 14, 2009) Available
from: www.oie.go.th/industrystatus2/7.doc
- W4PE[4A[Shqb90<JEQACRrs1B0A@a=b^ก4. QN<<JEF3A>cWCEDDกH1@D@3L<D06@1<S (Access date:
November, 14, 2009) Available from: http://internet1.off.fti.or.th/ftinews/pressrelease/news_detail.aspx?id=2761
- 8Z;1@:C1 MAI, ก/0Q=hB 51%, PER BP/0 @[L<E 8.9 @NC0FG?>\1IGW7E 7% (Access
date: November, 20, 2009) Available from:
http://kelive.kimeng.co.th/kelive/userview/DetailPage.jsp?cntry=TL&lang=th&cat=S
F&contId=4846
- DZBW08ก==Aก=?:0b (Access date: December 1, 2009) Available from:
http://library.dip.go.th/multim/edoc/08974.doc

284
- @DWgL.L @>@>D=S'AJP1H.>]81;0iGZ< (Access date: November 16 , 2009) Available from:
http://www.thanonline.com/index.php?option=com_content&view=article&id=1252
2:2009-11-16-02-37-27&catid=88:2009-02-08-11-23-46&Itemid=418
- 7,000 h=EE01DD=S@:D=S[ZCE!:J31L@3TPDAJP1N?GZ 80% (Access date: November, 22, 2009)
Available from:
http://investment.ic.or.th/InvestmentWindow/slidnews/viewall.php?newsid=2089

285
-
Idea PluS+ Company
1. Pajaree Zongsri ID: 4931203054
2. Pattarasiri Peathong ID: 4931203079
3. Surarat Ruenkaew ID: 4931203121
4. Ajcharapun Paewkasem ID: 4931203131
5. Suratt Sukpeung ID: 4931203213

286