project number: jyp 1302 reclamation of power in ... · reclamation of power in wastewater...
TRANSCRIPT

Project Number: JYP 1302
Reclamation of Power in Wastewater
Treatment Facilities
A MAJOR QUALIFYING PROJECT SUBMITTED TO THE FACULITY OF
WORCESTER POLYTECHNIC INSTITUTE
In partial fulfillment of the requirements for the Degree of Bachelor of Science
Submitted by:
Marissa Capua
Jessica Dzwonkoski
Christopher Harris
Advisor:
Jeanine D. Plummer
Date: March 7, 2014

ii
ABSTRACT
This project explored the feasibility of implementing hydroelectric turbine systems in wastewater
treatment facilities in Massachusetts. An inventory of treatment plant information was obtained,
and the Upper Blackstone Water Pollution Abatement District in Millbury, MA was selected for
a case study analysis. Based on flow and head data, 19.9 kW of power could be produced,
generating 1.1% of the facility’s electricity needs; however, the available head was slightly
below the turbine specifications. Payback periods were calculated to determine hydropower
feasibility for other Massachusetts plants, and 30.9% were potentially feasible based on flow but
depending on head.
iii
CAPSTONE DESIGN
This Major Qualifying Project evaluated the feasibility of energy reclamation at existing
Wastewater Treatment Facilities by means of a hydroelectric turbine in the effluent channel of a
plant. Large plants around the country and New England, such as Deer Island Wastewater
Treatment Plant, have already found ways to use renewable energy. Upper Blackstone Water
Pollution Abatement District (UPWPAD) was used as a case study for this project.
First, flow data and the hydraulic profile of UPWPAD were gathered and used to calculate power
generation in kilowatt-hours. Flow and head were the parameters needed to find an appropriate
hydroelectric turbine for this scenario.
Cost-effective hydroelectric turbines for use in wastewater plant were evaluated on payback
periods. The Toshiba Hydro-eKIDS turbine was selected for this case since it allowed for low
head scenarios.
A cost analysis was conducted for the UBWPAD. This analysis considered the turbine cost,
piping cost, concrete cost, labor cost, and a project contingency cost, and it showed a payback
period of 2.84 years. However, the available head at the facility was slightly below the turbine
specifications and therefore further analysis would be needed to determine feasibility. Lastly,
payback periods were calculated for hypothetical combinations of flow and head to demonstrate
potential feasibility of implementing hydroelectric power recovery at other wastewater treatment
plants.
This MQP fulfilled the requirements of a major capstone design experience. This project
included project management operations, as the primary topic for this project was to perform a
feasibility study. This project also considered sustainability as part of the design by analyzing the
use of a parallel pipe system to house a turbine and reclaim energy that would be wasted
otherwise. Lastly, this project considered economic elements by developing cost estimation and
generating tables for different head and flow cases.

iv
EXECUTIVE SUMMARY
Total energy production and consumption in the United States have increased substantially since
the middle of the twentieth century. In 1949, both consumption and production were
approximately 32 quadrillion Btu. By 2011, production reached 78 quadrillion Btu (144%
increase), while consumption reached over 97 quadrillion Btu (203% increase) (U.S. Energy
Information Administration, 2012). Of the energy consumed in the U.S. in 2011, 79.8% came
from fossil fuels (petroleum, coal, and natural gas) (U.S. Energy Information Administration,
2011). Fossil fuels emit polluting byproducts that cause environmental and health issues, and the
resources are finite. Renewable energy helps to address emission problems through sustainable
energy production from wind, hydroelectric, and solar sources.
Hydropower is a form of renewable energy that is harnessed from the movement of water. A
hydroelectric turbine converts kinetic energy from the moving water into mechanical energy,
which powers an electrical generator. The electrical energy is transmitted to an electrical grid for
distribution. Hydropower systems can be designed to use moving waters, storage dams, or using
pumped storage. Moving water can be found naturally in rivers, streams, and oceans, and also in
man-made conduits where water is flowing constantly. The wastewater treatment facility at Deer
Island in Boston, MA installed hydropower systems in 2002 to generate 5.1% of the electricity
that is used at Deer Island per year. However, few facilities in the United States reclaim energy
through turbines.
The goal of this project was to conduct a study on the feasibility of installing a hydroelectric
turbine system into the effluent pipe of a wastewater treatment facility. This study included
calculating the amount of potential power generated from a turbine, selecting an appropriate
turbine, designing a new effluent pipe to house the turbine, and executing a cost analysis. These
tasks were completed by performing a site-specific case study. Following this study, the analysis
was extended to various flow conditions.
The case study was performed on the Upper Blackstone Water Pollution Abatement District
(UBWPAD) in Millbury, MA to explore the feasibility of the turbine installation. This plant
discharges to the Blackstone River. Hydraulic data (chlorine contact chamber dimensions, weir
height, and flow data), the available head, and average electricity costs per month were obtained
from the plant manager. Yearly power potential was calculated based on the average flow and
head under normal river conditions. With an available head of 5.6 feet and an average flow
volume of 32 million gallons per day, a hydroelectric turbine of 85% efficiency at the UBWPAD
would have the potential to generate 19.9 kilowatts of electricity. The electricity generated would
make up about 1.1% of the electricity that is consumed at this facility.
The next task was the selection of appropriate turbine and the design of the effluent structure to
incorporate the turbine. The Toshiba Hydro-eKIDS micro turbine was selected because it is

v
relatively inexpensive compared to similar turbines manufactured by other companies, and it
accommodates the 32-MGD flow rate at the UBWPAD. A separate, enclosed pipe was designed
to channel the flow into the turbine for maximum efficiency. The piping material, smoothed
cement, was selected based on the friction losses due to material roughness, cost, and durability.
A wall was implemented into the entrance of the existing effluent pipe in order to divert the flow
into the new effluent pipe containing the turbine.
A preliminary cost analysis was completed to include the cost of the turbine and generator
system, the cost for new piping structures, and the cost of the concrete slab upon which the new
pipe and turbine would rest. The Toshiba Hydro-eKIDS turbines’ costs can range from $7,000 to
$30,000 (including installation costs) depending on the selected turbine size, this case study
required the largest turbine therefore the price was assumed to be $30,000. The cost for the
concrete foundation ($242) was determined based on the required dimensions of the slab, which
were dependent on the size and weight of the turbine. Piping costs were determined based on the
average cost per foot of a 4-foot diameter smoothed concrete pipe, and totaled $9,380, for a 35’
pipe. With a 25% contingency for unexpected costs that may occur during construction, the total
cost estimate was $49,500. State and Environmental Protection Agency funding may be available
for small hydroelectric projects.
The next objective was to calculate how much money the plant would save each year based on
the amount of power produced and sold to the grid. This value was compared with cost to
purchase the total amount of electricity consumed at the plant each year. The UBWPAD could
potentially generate up to 19.9 kW (approximately 174,000 kWh) of electricity per year. Selling
it back to the grid at $0.10 per kWh, the UBWPAD could save approximately $17,400 on
electricity costs each year. Thus the payback period would be 2.84 years.
While the UBWPAD case study analysis appeared favorable, the head at the plant was slightly
below the minimum turbine specifications. The final goal of this project was to extend the
analysis performed at the UBWPAD to other wastewater treatment facilities. Hypothetical flow
and head cases of 2-46 million gallons per day and 6-50 feet (respectively) were analyzed. The
flow cases were based off of those at the different wastewater treatment facilities in
Massachusetts; however, the available head at these facilities was not provided, so hypothetical
head cases were based off of the applicable head specifications of the selected turbine. A total of
299 hypothetical flow and head combinations were analyzed, and 86.3% of these cases were
determined to be feasible based on their payback periods. Massachusetts wastewater facilities
may refer to these hypothetical cases to determine the feasibility of implementing this
hydropower project at their facilities.
This study concluded that there are many facilities that would have the potential to implement
hydropower technology into pre-existing systems. This technology, as well as other renewable

vi
energy technologies, offers a way for wastewater treatment plants to become more self-sufficient
in green energy production and consumption.

vii
TABLE OF CONTENTS
ABSTRACT .................................................................................................................................... ii
CAPSTONE DESIGN ................................................................................................................... iii
EXECUTIVE SUMMARY ........................................................................................................... iv
LIST OF FIGURES ....................................................................................................................... ix
LIST OF TABLES .......................................................................................................................... x
1. RENEWABLE ENERGY ........................................................................................................... 1
1.1 Renewable Energy in the United States ................................................................................ 3
1.2 Hydropower ........................................................................................................................... 4
1.2.1 Run of River Hydropower Systems ................................................................................ 5
1.2.2 Storage Hydropower Systems ........................................................................................ 7
1.2.3 Pump Storage Hydropower Systems .............................................................................. 7
1.3 Hydroelectric Power at Treatment Plants.............................................................................. 8
1.4 Hydroelectric Power Feasibility in Wastewater Treatment Plants in MA .......................... 10
2. INVENTORY OF WASTEWATER TREATMENT FACILITIES ........................................ 11
2.1 Wastewater Treatment Facility Inventory ........................................................................... 11
2.2 Selection of Facility for Case Study Analysis ..................................................................... 12
3. CASE STUDY: UPPER BLACKSTONE WATER POLLUTION ABATEMENT
DISTRICT ................................................................................................................................ 13
3.1 UBWPAD Overview ........................................................................................................... 13
3.2 Potential Power Output ....................................................................................................... 14
3.3 Turbine Selection ................................................................................................................ 17
3.4 Design Considerations......................................................................................................... 22
3.5 Piping Material Selection .................................................................................................... 23
3.6 Operational and Maintenance Considerations..................................................................... 27
4. ECONOMICS ........................................................................................................................... 28
4.1 System Installation Costs at UBWPAD .............................................................................. 28
4.1.1 Turbine and Generator System ..................................................................................... 29
4.1.2 Piping ............................................................................................................................ 29
4.1.3 Concrete ........................................................................................................................ 29

viii
4.1.4 Contingency .................................................................................................................. 29
4.2 Electricity Benefit ............................................................................................................... 30
4.2.1 Consumption Costs to Facility ..................................................................................... 30
4.2.2 Production from Hydropower ....................................................................................... 30
4.3 Payback Period .................................................................................................................... 30
4.4 Permits, Regulations, and Incentives .................................................................................. 31
5. EXTENDED ANALYSIS USING HYPOTHETICAL FLOW AND HEAD CASES ............ 33
5.1 Hypothetical Flow and Head Cases .................................................................................... 33
5.2 Feasibility of Hypothetical Hydropower Scenarios ............................................................ 33
5.3 Feasibility of Massachusetts Wastewater Treatment Facilities........................................... 35
6. CONCLUSIONS AND RECOMMENDATIONS ................................................................... 36
6.1 Feasibility at UBWPAD ...................................................................................................... 36
6.2 Feasibility at Other Wastewater Treatment Plants .............................................................. 36
6.3 Recommendations ............................................................................................................... 37
6.3.1 Deer Island Energy Reclamation .................................................................................. 37
6.3.2 Potential for Energy Reclamation at UBWPAD .......................................................... 37
BIBLIOGRAPHY ......................................................................................................................... 39
Appendix A: Deer Island Electricity Usage .................................................................................. 44
Appendix B: Massachusetts Municipal Wastewater Treatment Plants ........................................ 46
Appendix C: UBWPAD Influent Flow Data ................................................................................ 71
Appendix D: Manufacturer Information ....................................................................................... 73
Appendix E: Solid Model Drawings ............................................................................................. 88
Appendix F: Hypothetical Case Tables ........................................................................................ 92

ix
LIST OF FIGURES
Figure 1 - U.S. Total Energy Consumption and Production from 1950-2010 (Adapted from
U.S. Energy Information Administration, 2012) ............................................................ 1
Figure 2 - Projected Growth of Electricity Generation by Source (Adapted from U.S. Energy
Information Administration, 2013) ................................................................................ 2
Figure 3 - Primary U.S. Energy Consumption by Sector (a) and Source (b), 2011 (Adapted
from U.S. Energy Information Administration, 2011) ................................................... 3
Figure 4 - Schematic of Run-of-River Project (Adapted from AltaGas Ltd., 2014) ...................... 6
Figure 5 - Schematic of a Hydroelectric Dam (Adapted from Combs, 2008) ................................ 7
Figure 6 - Schematic of Pump Storage (Adapted from Federal Energy Regulatory
Commission, 2014) ........................................................................................................ 8
Figure 7 - Deer Island Treatment Plant Improvement Plan (Adapted from Massachusetts
Water Resources Authority, 2013) ................................................................................. 9
Figure 8 - Variations in Flow Rate through Sewer System at UBWPAD throughout 24-Hour
Period (Adapted from UBWPAD Data Found in Appendix C) ................................... 16
Figure 9 - Horizontal Hydro-eKIDS L-Type Turbine (Adapted from United States
Environmental Protection Agency, 2013) .................................................................... 21
Figure 10 - Model of Chlorine Contact Chamber at UBWPAD and Redesigned Effluent. ......... 22
Figure 11 - The Moody Diagram (Unaltered from Diagramme, 2013) ........................................ 25
Figure 12 - Potential Energy Reclamation Systems at UBWPAD ............................................... 38

x
LIST OF TABLES
Table 1 - Primary U.S. Energy Consumption by Source and Sector, 2011 (Adapted from U.S.
Energy Information Administration, 2011) ..................................................................... 4
Table 2 - Timeline of Growing Use of Hydropower in the United States (Adapted from U.S.
Department of Energy, 2011) .......................................................................................... 5
Table 3 - Deer Island Total Electricity Consumption and Hydropower (Adapted from
Massachusetts Water Resources Authority, 2013) .......................................................... 9
Table 4 - Grouped Wastewater Treatment Facilities in Massachusetts ........................................ 11
Table 5 - Facility Information ....................................................................................................... 12
Table 6 - Change in Water Density with Respect to Temperature ............................................... 15
Table 7 - Power Potential Based on Available Head at UBWPAD .............................................. 17
Table 8 - Power Potential for Varying Flow Rates for UBWPAD ............................................... 17
Table 9 - Turbine Operational Head Specifications ..................................................................... 18
Table 10 - Micro Turbine Model Specifications (United States Environmental Protection
Agency, 2013) ............................................................................................................. 20
Table 11 - Dimension Specifications of Toshiba Micro Turbines (Adapted From Toshiba
Corporation et al., 2014) ............................................................................................. 21
Table 12 - Frictional Characteristics of Different Piping Materials ............................................. 26
Table 13 - Estimated System Installation Costs for UBWPAD (Waier, 2011) ............................ 28
Table 14 - Feasibility Chart for Varying Hypothetical Flow and Head Cases ............................. 34
Table 15 - UBWPAD Wastewater Influent Flow Data ................................................................ 72
Table 16 - Potential Power Generation (kWh) of Hypothetical Flow and Head Cases ................ 93
Table 17 - Annual Savings for Hypothetical Flow and Head Cases............................................. 94
Table 18 - Payback Periods (Years) of Hypothetical Flow and Head Cases ................................ 95
1
1. RENEWABLE ENERGY
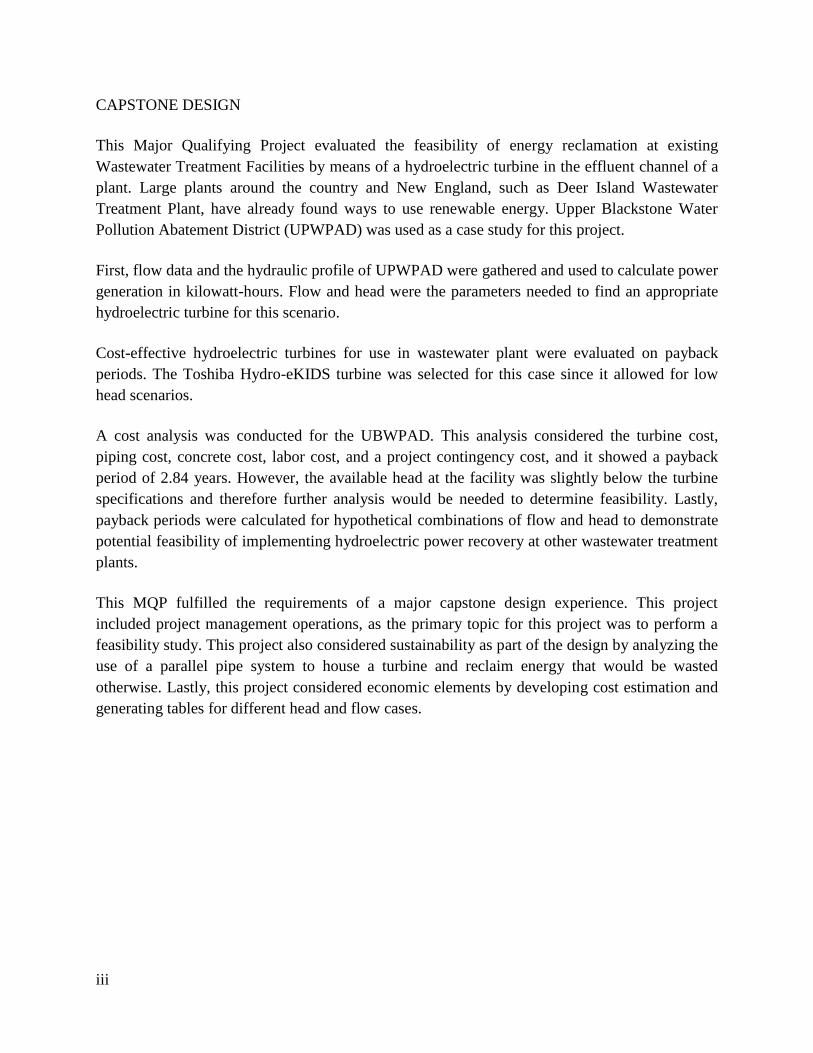
Within the last century, the use of energy worldwide has grown significantly. In developed
countries such as the United States, both consumption and production have dramatically
increased, as displayed in Figure 1. From 1950 to 2010, energy production in the U.S. has more
than doubled, from just over 30 quadrillion Btu to nearly 80 quadrillion Btu. Energy
consumption has tripled from just over 30 quadrillion Btu to just under 100 quadrillion Btu.
Figure 1 - U.S. Total Energy Consumption and Production from 1950-2010 (Adapted from U.S.
Energy Information Administration, 2012)
Coal, natural gas, and oil became the primary energy sources because these sources are abundant
in supply for the mass production of energy, which is able to support a large population.
However, these sources are considered non-renewable; the rate at which the sources are created
is much slower than the rate at which they are consumed. According to the United States
reserves-to-production ratio for 2010, U.S. supplies of oil are expected to be exhausted in 11.3
years, natural gas in 12.6 years, and coal in 241 years (Energy Realities, 2013). These non-
renewable sources also have harmful effects on the environment, putting environmental
sustainability for future generations at risk. These harmful effects may include climate change,
acid rain, oil spills, and the deterioration of air, water, and soil quality (Union of Concerned
Scientists, 2002).
The development of new technologies, in combination with old techniques, brought about the
idea to harness energy using renewable sources and processes naturally provided by the earth.
2
For example, the harnessing of wind energy dates as far back as 5000 B.C. with the propulsion of
boats on the Nile River, followed by the invention of windmills for pumping water and grinding
grains by 200 B.C. (U.S Department of Energy, 2011). Industrialization in Europe led to the
development of the first electricity-generating wind turbine in Denmark in 1890 (U.S.
Department of Energy, 2011). Additionally, energy from moving water was harnessed for
grinding wheat into flour over 2,000 years ago, eventually leading to the operation of the world’s
first hydroelectric power plant on the Fox River in Appleton, WI in 1882 (U.S. Department of
Energy, 2011).
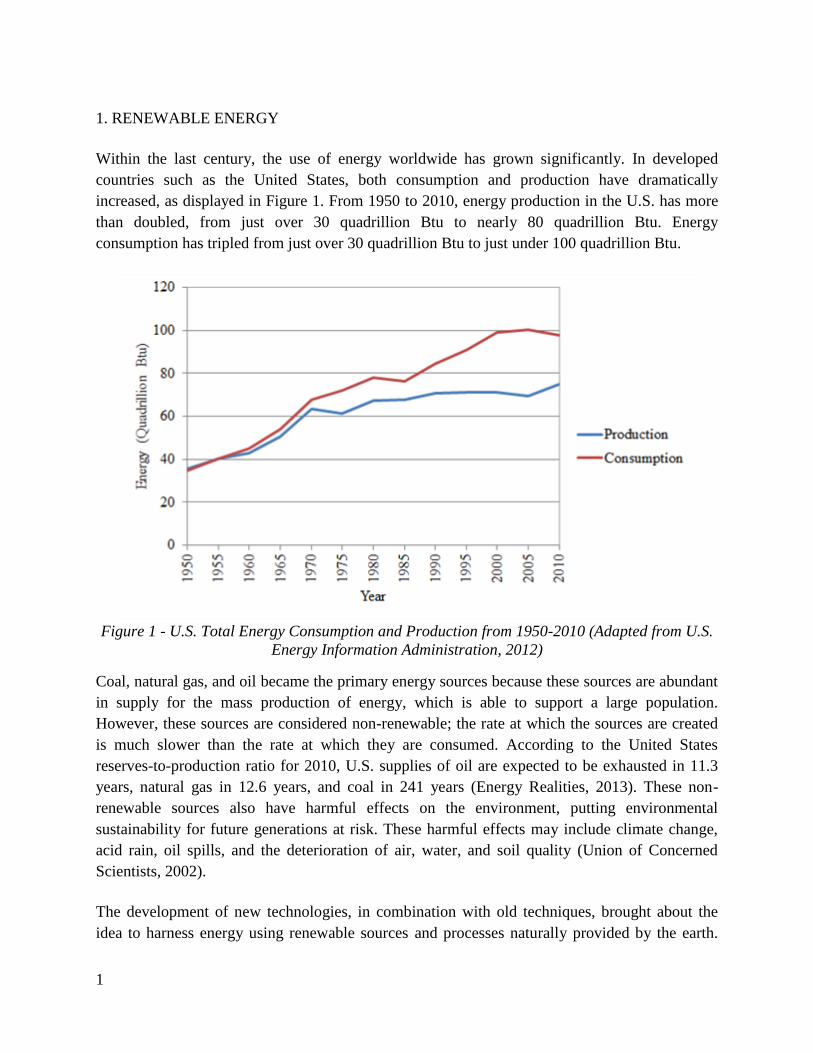
Renewable energy sources — coming from flowing water, moving winds, sunlight, and more —
are increasing in use to harness energy in an effort to provide a more sustainable future. Figure 2
illustrates the projected growth of the generation of electricity from various energy sources in the
United States. By the year 2000, renewables accounted for 9% of electricity generation —
approximately 340 billion kilowatt hours. In 2012, these sources generated 12% of the country’s
electricity. The U.S. Energy Information Administration predicts that by the year 2040,
renewable energy sources will generate 16% of the electricity produced in the United States.
That is about 830 billion kilowatt hours of electricity, and 2.4 times more electricity generated by
renewable sources than in 1990 (U.S. Energy Information Administration, 2013).
Figure 2 - Projected Growth of Electricity Generation by Source (Adapted from U.S. Energy
Information Administration, 2013)

3
1.1 Renewable Energy in the United States
Figure 3 outlines the energy consumption in the United States by source and sector for 2011. As
shown, renewable energy makes up 9% of the total energy consumed in the U.S., while coal,
natural gas, and petroleum comprise approximately 80% of U.S. energy. Of the renewable
energy that is consumed, 54% is consumed by the power industry. Considering all electric power
sources, renewable energy accounts for 13% of the total power sources, while the remaining
percentage comes from petroleum, natural gas, coal, and nuclear energy.
Figure 3 - Primary U.S. Energy Consumption by Sector (a) and Source (b), 2011 (Adapted from
U.S. Energy Information Administration, 2011)

4
Renewable energy can be broken down into multiple categories. Wind, solar, and hydropower
are the most commonly known examples of renewable energy sources, but there is also
geothermal energy, biofuels, and more. Of these sources, hydroelectric power generates the
majority of renewable energy, as shown in Table 1, while the rest is made up by wood, biofuels,
wind, waste, geothermal, and solar power.
Table 1 - Primary U.S. Energy Consumption by Source and Sector, 2011 (Adapted from U.S.
Energy Information Administration, 2011)
Renewable Energy Source Share of Total Primary
Energy Consumption (%)
Solar/Photovoltaic 2
Geothermal 2
Waste 5
Wind 13
Biofuels 21
Wood 22
Hydroelectric Power 35
1.2 Hydropower
A commonly known and used form of renewable energy is hydropower, which generates power
using the kinetic energy of moving water. Table 2 outlines historical highlights of hydropower
usage since the development of the world’s first hydropower plant in 1882. Today, hydropower
systems are utilized in rivers, reservoirs, and sometimes oceans.
The drop in percentage of U.S. electricity generated by hydropower from 1940 to 2003 can be
attributed to the rapid growth of other energy sources. From 1949 to 2011, the production of
electricity from coal and natural gas increased by 85% and 337%, respectively, while electricity
produced from hydropower grew by 123%. Total energy production has increased by nearly
150% (U.S. Energy Information Administration, 2011).
Hydropower systems operate with the use of a water turbine, which is selected based on different
values of flow rate and drop height, or head. Kinetic energy in the form of falling water moves
through the turbine, converting it to mechanical energy as the turbine spins. The spinning turbine

5
powers an electric generator, and a transformer then converts the voltage from the generator into
mains voltage, producing electrical energy.
Table 2 - Timeline of Growing Use of Hydropower in the United States (Adapted from U.S.
Department of Energy, 2011)
Year Event
1882 Operation of world’s first hydroelectric power plant begins on Fox River in
Appleton, WI
1886 About 45 hydroelectric power plants in operation in the U.S. and Canada
1889 Hydropower used for some or all electricity generation in 200 U.S. power plants
1907 15% of U.S. electricity generated by hydropower
1920 25% of U.S. electricity generated by hydropower
1937 Operation of Bonneville Dam begins on Columbia River (first Federal dam)
1940 40% of U.S. electricity generated by hydropower
2003 10% of U.S. electricity generated by hydropower
Power generated in hydropower systems can be calculated using Equation 1 (De Vooght, 2013):
(Equation 1)
Where:
P is power (kW)
η is the efficiency of the turbine (unitless)
ρw is the density of the water (kg/m3)
g is the acceleration due to gravity (m/s2)
Q is the flow of water through the turbine (m3/s)
H is the head (m).
Different types of hydropower systems are used based on the flow behavior of water. These
systems are further described in sections 1.2.1 through 1.2.3.
1.2.1 Run of River Hydropower Systems
Run-of-river power turbines utilize the natural flow of water down a river, and they can operate
with essentially zero head. With a low head, the amount of power is more dependent on the flow
of the river and the velocity through the turbine. Run-of-river turbines work best on rivers with a
6
steep grade or large streams where flow is confined in a narrow area. A narrow riverbed will
cause the water to flow more quickly and with greater force, due to an increase in pressure
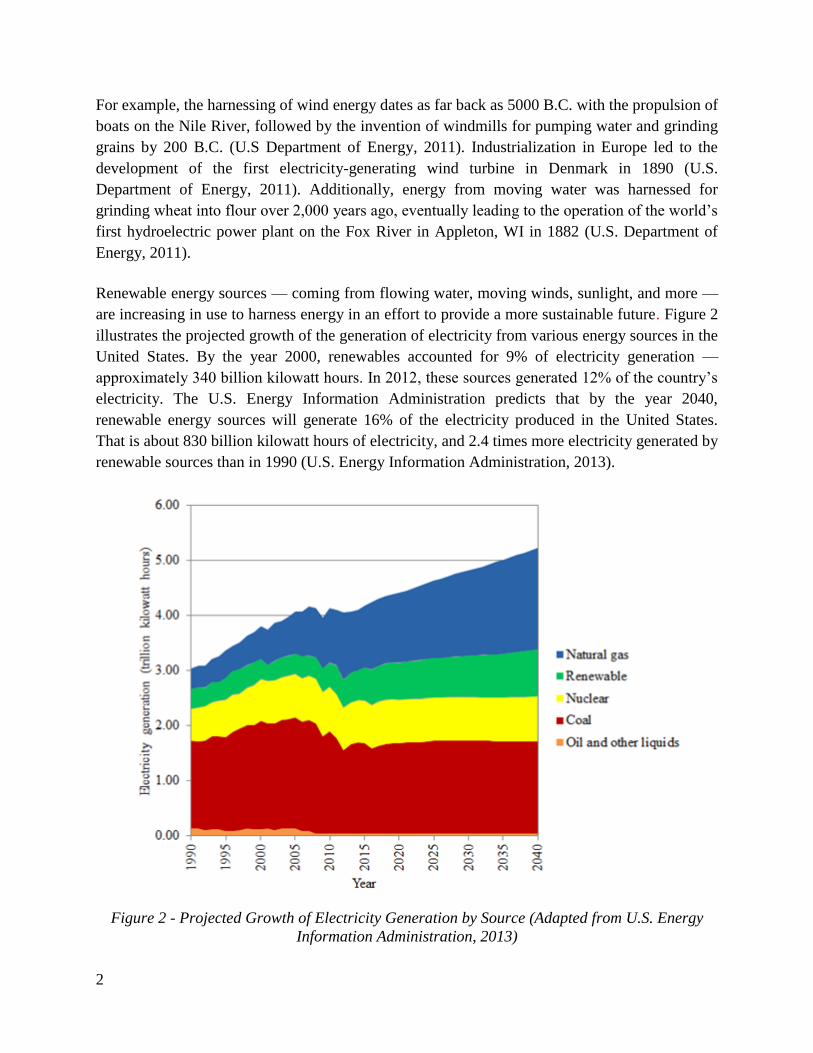
(Combs, 2008). A schematic of a run-of-river project is shown in Figure 4.
Figure 4 - Schematic of Run-of-River Project (Adapted from AltaGas Ltd., 2014)
In Figure 4, the penstock — also known as the intake channel — is where the water is channeled
into the turbine. The tailrace is where the water that flows through the turbine exits the plant and
discharges to the river. This is also known as the outlet.
Because the water naturally loses its potential energy as it flows down a river, run-of-river
hydropower systems harness less power than other types of hydropower systems (Freris &
Infield, 2008). The Bonneville Dam on the Columbia River, the first Federal dam in the United
States, uses a series of run-of-river hydroelectric turbines in order to generate electricity in the
Pacific Northwest. The dam has two powerhouses at separate parts of the river. The first
powerhouse was completed in 1938, and it contains ten generators that produce 660 megawatts
of electricity. Construction of the second powerhouse was completed in 1981, producing an
additional 558 megawatts of electricity from its eight generators (U.S. Army Corps of

7
Engineers).
1.2.2 Storage Hydropower Systems
Storage hydropower plants, typically in the form of a dam, are able to generate larger amounts of
power output than run-of-river hydropower systems. These dams take advantage of both a large
head and the volume of stored water in the reservoir to create pressure on the water flowing
through its turbine. Figure 5 depicts the basic schematics of a dam and how the water flows from
the intake through the turbine and into the river. A dam similar to the figure is present in
Holyoke, MA, spanning the width of the Connecticut River. This dam was initially built in 1848,
but following construction, the dam’s flood gates were closed, and the river exerted too much
force on the dam, resulting in its destruction. A second construction attempt was successfully
made in 1876, and the dam provided 22 megawatts of electricity to the multiple paper mills
located in the city (O’Donnell, 1876).
Figure 5 - Schematic of a Hydroelectric Dam (Adapted from Combs, 2008)
1.2.3 Pump Storage Hydropower Systems
Another way to generate hydroelectric power is through the process of pump storage. A pump
storage system requires two reservoirs at different elevations. Using excess electric generation
capacity, the water is pumped from the lower reservoir to the upper reservoir during hours of low
demand for electricity. When the electrical demand is high or at its peak, the water is released
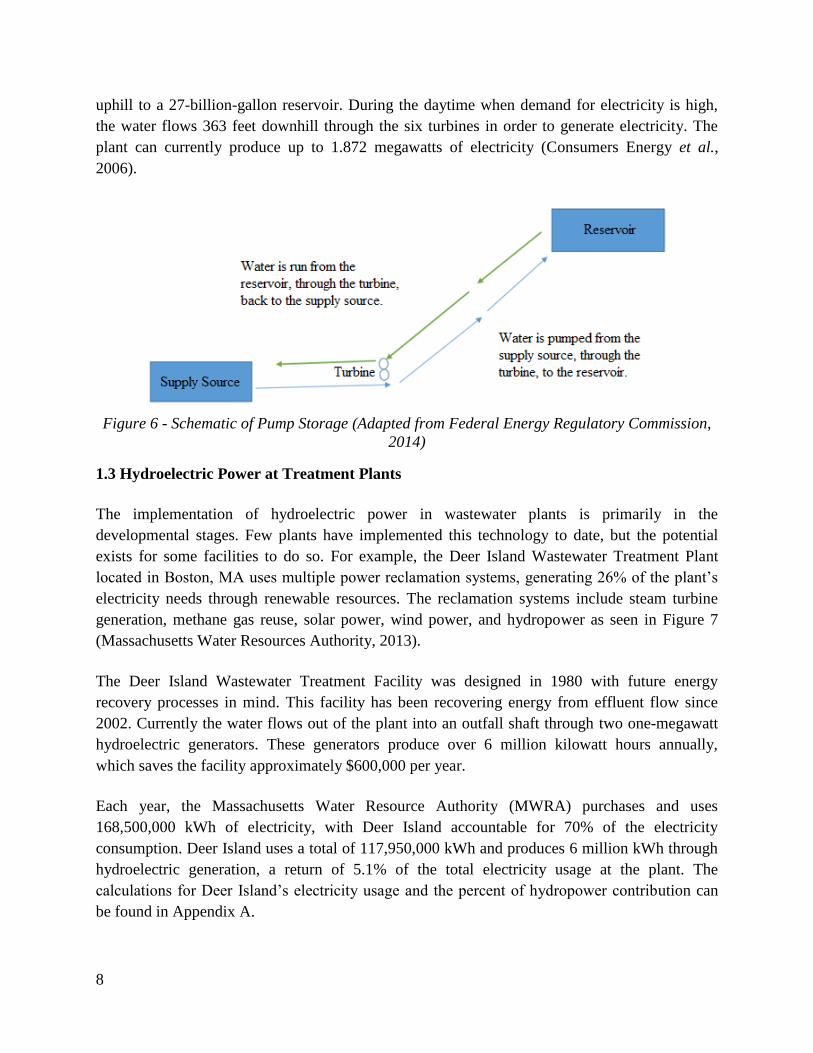
through a turbine from the upper reservoir to the lower reservoir. Figure 6 shows a diagram of
how a pump storage system works (Federal Energy Regulatory Commission, 2014).
One example of a large pump storage plant in the United States today is the Ludington Pump
Storage Plant located in Ludington, MI. The plant uses six turbines that also act as pumps. When
electricity demand is low — typically overnight — the turbines pump water from Lake Michigan
8
uphill to a 27-billion-gallon reservoir. During the daytime when demand for electricity is high,
the water flows 363 feet downhill through the six turbines in order to generate electricity. The
plant can currently produce up to 1.872 megawatts of electricity (Consumers Energy et al.,
2006).
Figure 6 - Schematic of Pump Storage (Adapted from Federal Energy Regulatory Commission,
2014)
1.3 Hydroelectric Power at Treatment Plants
The implementation of hydroelectric power in wastewater plants is primarily in the
developmental stages. Few plants have implemented this technology to date, but the potential
exists for some facilities to do so. For example, the Deer Island Wastewater Treatment Plant
located in Boston, MA uses multiple power reclamation systems, generating 26% of the plant’s
electricity needs through renewable resources. The reclamation systems include steam turbine
generation, methane gas reuse, solar power, wind power, and hydropower as seen in Figure 7
(Massachusetts Water Resources Authority, 2013).
The Deer Island Wastewater Treatment Facility was designed in 1980 with future energy
recovery processes in mind. This facility has been recovering energy from effluent flow since
2002. Currently the water flows out of the plant into an outfall shaft through two one-megawatt
hydroelectric generators. These generators produce over 6 million kilowatt hours annually,
which saves the facility approximately $600,000 per year.
Each year, the Massachusetts Water Resource Authority (MWRA) purchases and uses
168,500,000 kWh of electricity, with Deer Island accountable for 70% of the electricity
consumption. Deer Island uses a total of 117,950,000 kWh and produces 6 million kWh through
hydroelectric generation, a return of 5.1% of the total electricity usage at the plant. The
calculations for Deer Island’s electricity usage and the percent of hydropower contribution can
be found in Appendix A.

9
Figure 7 - Deer Island Treatment Plant Improvement Plan (Adapted from Massachusetts Water
Resources Authority, 2013)
Table 3 - Deer Island Total Electricity Consumption and Hydropower (Adapted from
Massachusetts Water Resources Authority, 2013)
Category kWh Percentage of Total MWRA
Total MWRA Electricity
Purchased Annually
168,500,000 100
Deer Island Electricity
Consumption
117,950,000 70
Deer Island Hydropower
Electricity Generation
6,000,000 3.6
Another example of hydropower at wastewater treatment facilities exists in Point Loma, San
Diego, CA. This facility utilizes hydroelectric turbines in its effluent flow to generate up to 1.35
megawatts of electricity, which is then sold to the San Diego Gas and Electric Company (United
States Environmental Protection Agency, 2013).

10
1.4 Hydroelectric Power Feasibility in Wastewater Treatment Plants in MA
There are 110 municipally owned wastewater plants located in Massachusetts, treating flows that
range from 0.02 million gallons per day to 365 million gallons per day (U.S. Environmental
Protection Agency-New England, 2011). The water flowing through these treatment plants
provides a potential source of energy that may be reclaimed and transformed into electricity. The
purpose of this project was to determine the feasibility of implementing a hydroelectric turbine
system in the effluent of municipal wastewater treatment facilities in Massachusetts. The
electricity generated from the system may then be used to contribute to the demand of the
treatment plant either through net metering or by selling the electricity back to the supplier.
Some states allow for commercial and industrial facilities to establish net metering. This allows
facilities to feed electricity into the grid and establish a credit with the supplier. A facility is then
allowed to pull electricity from the grid until the credit has expired (Solar Energy Industries
Association, 2014). Massachusetts currently has a net metering program for most renewable
energy technologies, including hydroelectric power generation, for a variety of sectors (U.S.
Department of Energy et al., 2013). This program allows for renewable energy technologies to
install a net metering system to record the amount of energy produced and subtract it from the
amount of energy consumed.
In order to determine the feasibility of implementing hydroelectric power at wastewater
treatment facilities, the following tasks were completed:
● Inventory wastewater treatment facilities in Massachusetts and select facility for case
study
● Perform case study analysis on selected facility
○ Gather information on monthly electric costs
○ Gather data on hydraulic profile and daily flow
○ Analyze cost of equipment, construction, maintenance, permits, and labor versus
payback period
● Extend analysis to other treatment plants using hypothetical cases of head and flow
The overall goal was to make recommendations for hydropower implementation based on the
treatment plant flow, head, costs, and payback period so that facilities are able to make informed
decisions about whether or not the turbine installation would be a feasible project and
worthwhile investment.

11
2. INVENTORY OF WASTEWATER TREATMENT FACILITIES
The first step in conducting a feasibility study is to gain information that is site-specific,
followed secondly by creating an estimate of the power potential, and thirdly by conducting an
economic analysis. This standard of conducting a feasibility study is validated by the U.S.
Department of Agriculture (Brockhouse et al., 2010). Before proceeding with the feasibility
study, a wastewater treatment facility in Massachusetts was to be selected for analysis. In order
to select a treatment plant, an inventory of systems in Massachusetts was compiled, and then a
facility was selected based on size, location, and data availability.
2.1 Wastewater Treatment Facility Inventory
Specific information about registered wastewater treatment plants in the state of Massachusetts
was obtained from the Environmental Protection Agency (U.S. Environmental Protection
Agency-New England, 2011). As shown in Appendix B, available information included the plant
name, location, contact information, and permit number. Additionally, information on treatment
processes, flow, and discharge location were provided. There are 110 treatment plants in
Massachusetts, with average daily flows ranging from 0.016 to 365 million gallons per day. The
facilities were grouped into 6 categories based on daily flows as shown in Table 4.
Table 4 - Grouped Wastewater Treatment Facilities in Massachusetts
Flow Range
(MGD)
Number of
Treatment
Plants
Percentage of
Treatment
Plants
Number of
Plants
Contacted
Number of
Responses
>10 12 10.90 12 5
5.0-9.99 8 7.27 2 1
1.0-4.99 45 40.90 11 2
0.5-0.99 13 11.81 3 0
0.1-0.49 25 22.72 6 0
<0.1 7 6.36 1 0
In order to conduct a feasibility study, additional information from treatment plants on head,
flow variations, and electricity usage was needed from treatment plants. All the treatment plants
with flows greater than 10 MGD flow were contacted because the hydroelectric generation
would be greatest with these relatively high flow ranges. In addition, one quarter of the plants
from each flow range category were contacted to equally represent each category. Table 4 shows
that responses were received from 3 small treatment plants and 5 treatment plants with flows
greater than 10 MGD. Information gathered from these communications is discussed in section
2.2.

12
2.2 Selection of Facility for Case Study Analysis
Of the plants that were contacted, responses were received from 8 treatment plants as shown in
Table 4. From this list, a facility was chosen for an in-depth study based on the average flow,
head values, and data availability. Table 5 summarizes the data that was received from the plants
that were contacted.
Table 5 - Facility Information
Facility Location Average Daily Flow
(MGD)
Approximate
Available Head (ft)
Deer Island WWTP Boston 365 9
Upper Blackstone
WPAD
Millbury 32 5.4
Lowell Regional WW
Utility
Lowell 25 10
Lynn Regional WF Lynn 21 17
Haverhill WWTP Haverhill 10 Not Available
Holyoke WWTP Holyoke 8 4
Amherst WWTP Amherst 4.2 Not Available
Ayer WWTP Ayer 1.2 Not Available
The UBWPAD in Millbury, MA is located less than 7 miles from Worcester Polytechnic
Institute in Worcester, MA, where the feasibility study was conducted. A visit to the facility was
made due to its close proximity, and the visit allowed for easier visualization of the wastewater
treatment processes and the discharge route of the water. It also allowed for in-person contact
with Mark Johnson, the Plant Manager at UBWPAD.
Treating an average of 32 million gallons of wastewater per day, the UBWPAD was selected
because it is the facility that services the city of Worcester, MA, which is the second largest city
in the state and in New England. Boston, the largest city in Massachusetts and in New England,
is serviced by the Massachusetts Water Resources Authority at Deer Island, where hydropower
technology already exists. Chapter 3 provides the case study analysis for the UBWPAD.

13
3. CASE STUDY: UPPER BLACKSTONE WATER POLLUTION ABATEMENT DISTRICT
The case study analysis was conducted on the Upper Blackstone Water Pollution Abatement
District (UBWPAD) in Millbury, MA. Information was gathered from the plant staff, and an
estimate of the power potential was created. Then, a turbine was selected, a design was
considered, and piping material was chosen.
3.1 UBWPAD Overview
The UBWPAD serves a number of cities and towns in Massachusetts, including Auburn, Cherry
Valley Sewer District, Holden, Millbury, Rutland, West Boylston, and Worcester. Portions of
Oxford, Paxton, Shrewsbury, and Sutton are also served by this wastewater treatment facility
(Upper Blackstone Water Pollution Abatement District, 2013). Some households in these towns
may have septic tanks instead of being directly connected to the sewer system. Although not all
of the households are directly connected to the sewer, the sewage water from septic tanks is also
transported to the UBWPAD for treatment (Johnson, 2013).
The UBWPAD collects used water from residential homes, commercial buildings, industrial
companies, and storm water. The wastewater is treated by various processes before it is
discharged into the Blackstone River. First, the wastewater goes through preliminary treatment,
which consists of bar screens and grit chambers, where large objects and grit are removed to
reduce wear and damage to mechanical components in the treatment system. The wastewater
then travels to primary treatment, where some suspended solids and organic material are
removed by settling. The water then goes to biological nutrient removal, where fine solids,
chemicals, and organic matter are removed via bio-reactors, which provide necessary oxygen to
sustain living organisms such as bacteria and plankton that digest the remaining organic material.
This process is also known as activated sludge. After this stage, the water flows to secondary
clarifiers, where the cell biomass settles out of the water. After secondary treatment, the water
travels to the chlorine contact chamber, where the water is treated with sodium hypochlorite to
inactivate pathogens in the water. At the UBWPAD facility, this stage is performed seasonally
because there is less recreational use of the receiving water body in the winter than in the
summer. After the wastewater is disinfected, it is dechlorinated with sodium bisulfite. Finally,
the wastewater flows through an effluent discharge out to the Blackstone River (Upper
Blackstone Water Pollution Abatement District, 2013).
If a turbine system were to be implemented at this facility, it could be placed at the end of the
disinfection process in the effluent channel. The effluent channel would be ideal location for a
turbine because of the quality of the water. The suspended solids concentration in the influent of
the UBWPAD is 140 mg/L, and the effluent suspended solid concentration is 2.7 mg/L (Upper
Blackstone Water Pollution Abatement District, 2013). Suspended solids could create wear on
the turbine blades, so placing the turbine in the effluent channel would reduce the possibility of
14
turbine damage.
Information on the UBWPAD facility was gathered to determine whether or not the integration
of a hydroelectric turbine system was economically viable for this site. This information included
the available head in varying flood conditions, dimensions of the chlorine contact chamber, weir
height, effluent channel and culvert specifications, plant electricity costs, and flow data. The
effluent flow data and the average electric costs per month for operations were directly obtained
from the plant staff. The available head, dimensions of the chlorine contact chamber, weir
height, and effluent channel and culvert specifications were determined using detailed drawings
and the hydraulic profile provided by plant staff (Johnson, 2013). After this information was
gathered, the potential power output was calculated. A site visit provided information about the
space available to implement the turbine, how the treatment plant operates, and the design of the
existing effluent channel.
3.2 Potential Power Output
As shown in the EPA listing of Massachusetts treatment plants (Appendix B), the flow through
the UBWPAD averages 32 million gallons per day. The average flow value was used in power
calculations because it provides a long term assessment of power generation capabilities.
Dimensions of the chlorine contact chamber, weir, and the effluent channel were obtained from
detailed drawings provided by the plant staff. These detailed drawings are provided as
Supplementary Documents to this report. The chlorine contact chamber, where water is
disinfected before its discharge, has dimensions of 90 feet by 50 feet. The weir is the wall
located at the end of the tank where the water spills over into the effluent channel and out to the
river, and its height is 9.9 feet. The effluent channel, where water flows out after treatment, is 50
feet long and 12 feet wide.
The hydraulic profile is a document providing elevation information with respect to the weir and
the effluent discharge channel at varying flood conditions. The UBWPAD hydraulic profile is
provided as a Supplementary Document to this report. The available head is measured as the
elevation difference from the water height in the chlorine contact chamber (410.0 feet) to the
water height at the end of the effluent discharge (404.4 feet). Using the hydraulic profile, normal
river height, defined as the height of the river under no flood conditions, yields a total available
head of 5.6 feet, and a 5-year flood yields a total head of 1.1 feet. However, the 25- and 50-year
floods yields negative values for elevation because the water in the river rises higher than the
height of the water in the chlorine contact tank. As a result under these two conditions, the river
floods the chlorine contact chamber and the area surrounding the tank.
Based on head, flow, and constants pertaining to the water density, gravitational acceleration,
and efficiency, the power that can be generated from a turbine at the UBWPAD was determined

15
using Equation 1.
(Equation 1)
Where:
P is power (kW)
η is the efficiency of the turbine (unitless)
ρw is the density of the water (kg/m3)
g is the acceleration due to gravity (m/s2)
Q is the flow of water through the turbine (m3/s)
H is the head (m).
For efficiency (η), a value of 85% was assumed. This value is commonly used by engineering
firms to determine the approximate power generation produced by the system (De Vooght,
2013). The efficiency is a factor of safety accounting for losses due to friction through the
turbine and the piping system (De Vooght, 2013).
The next variable is the density of the water flowing through the turbine system (ρw). The density
of the water is approximately 1000 kg/m3. As shown in Table 6, density changes by less than 1%
with a 40-degree change in temperature. Therefore, density was used as a constant value in
Equation 1.
Table 6 - Change in Water Density with Respect to Temperature
Temperature (°C) Density (kg/m3) % Change of Density
0 999.8 0
10 999.7 0.01
20 998.2 0.16
30 995.7 0.41
40 992.2 0.76
The third variable is gravitational acceleration (g), which is constant at 9.81 m/s2. Next is the
volumetric flow rate (Q). The flow rate of wastewater through the UBWPAD changes
throughout the day depending on local water usage. Daily influent flow data for 2012 was
provided by the UBWPAD staff, and one day without rain and with minimal snow melt was
chosen at random to best represent the average influent flow trends of the treatment plant. The
peak flows happen between 1 PM and 4 PM, and the minimum flows happen between 3 AM and
7 AM (see Figure 8). The maximum values are correlated to when people are using the most

16
water throughout the day. These flow variations are important when conducting an in-depth
feasibility study because the variations will affect the amount of potential energy the water
contains. The UBWPAD designed the chlorine contact chamber to accommodate the peak flow,
max daily flow, average flow, and the minimum flow. For this study, the average volumetric
flow rate of 32 million gallons per day (1.40 m3/s) at the UBWPAD was used.
Figure 8 - Variations in Flow Rate through Sewer System at UBWPAD throughout 24-Hour
Period (Adapted from UBWPAD Data Found in Appendix C)
Finally, the head (H) at normal river height is 5.6 feet, or 1.7 meters. The preliminary
calculations and design were based on the normal river height as this represents typical operating
conditions. Under these conditions, the system has the maximum potential for energy production.
Combining all of the variables and constants discussed above, a potential power output was
calculated using Equation 1.
(Equation 1)
At normal river height, a turbine installed at the UBWPAD has the potential to produce up to

17
19.9 kW of electricity. The results for the remaining river heights are summarized in Table 7.
Table 7 - Power Potential Based on Available Head at UBWPAD
Flood Case Flood Case
Height (ft)
Available Head
(ft)
Available Head
(m)
Power Potential
(kW)
Normal River
Height
405.0 5.6 1.7 19.9
5-Year Flood 409.5 1.1 0.33 3.9
25-Year Flood 412.0 -1.4 -0.42 N/A
100-Year Flood 414.3 -3.7 -1.12 N/A
With the information above, and assuming normal river height and 85% efficiency, the potential
power generation for the minimum, average, maximum, and peak hour flow was calculated. The
range of flows will affect the power that the turbine will be able to produce. The results are
shown in Table 8
Table 8 - Power Potential for Varying Flow Rates for UBWPAD
Flow Condition Flow Rate (MGD) Flow Rate (m3/s)
Power Generation
Potential (kW)
Minimum Flow 25.6 1.12 15.9
Average Flow 32.0 1.40 19.9
Maximum Flow 80.0 3.51 49.8
Peak Hour Flow 120 5.26 74.6
The power generation potential contributes to the total annual revenue generated from the turbine
system. Flows will vary with seasons and times of the day. These variations will need to be
analyzed when performing a complete feasibility study. This feasibility study only accounts for
average numbers in order to provide baseline information for the UBWPAD.
3.3 Turbine Selection
There are two main classes of turbines: impulse turbines and reaction turbines. Impulse turbines
use the velocity of moving water to rotate the turbine blades and generate electricity, and they
are typically used in high head and low flow applications. Pelton wheels and cross-flow turbines
are considered impulse turbines. The pelton wheel typically has at least one free jet that

18
discharges water into an area which fills the buckets of the runner. The cross-flow turbine is
shaped like a drum and uses a jet to discharge water against the runner. This turbine allows for
the water to pass through the runner two different times, once when the water flows from the
outside to the inside of the blade and the second time is when the water flows from the inside to
the outside of the blades. Cross-flow turbines were developed to accommodate higher flows and
lower heads than the pelton wheel (U.S. Department of Energy, 2014).
The other major class of turbines is reaction turbines, in which power is generated using the
pressure of moving water. The runner is located in the water stream, which flows over the runner
as opposed to striking each blade individually. These turbines are generally implemented in
lower head and higher flow applications than impulse turbines. The francis, kinetic, and propeller
turbines are all considered reaction turbines. The francis turbine has fixed buckets or runner
vanes, and water is released above and around the runner, causing the buckets to fill and the
runner to spin. Propeller turbines have a variety of types, such as Kaplan turbines and bulb
turbines (micro turbines). Both of these turbines have a runner with three to six blades, and these
adjustable blades maintain contact with the water at all times (U.S. Department of Energy, 2014).
The orientation of these two types of turbines is different; Kaplan turbines are placed vertically
in the flow of the water while bulb turbines, which are typically used for low flow applications,
can be integrated directly into horizontal flows. Vertical orientation requires that the direction of
the flow be changed from horizontal to vertical. Horizontal orientation allows for turbines to be
directly integrated into pipes with horizontal flows (U.S. Department of Energy, 2014).
The head specifications for different impulse and reaction turbines are presented in Table 9.
These specifications were used to determine what type of turbine would be best suited for the
UBWPAD case study analysis. The information in Table 9 suggests that the cross flow and the
bulb turbines would be suited based on the applicable head ranges.
Table 9 - Turbine Operational Head Specifications
Class Turbine Type Head Range (m)
Impulse Pelton Wheel 200-1800
Cross Flow 2.5-200
Reaction
Francis 40-600
Kaplan 15-50
Bulb <30
The cross flow turbine is categorized as an impulse turbine, where the bulb turbine is categorized
as a reaction turbine. Both of these turbines operate under different conditions. Impulse turbines

19
change the direction of the flow with a high velocity jet positioned at the bottom of the runner.
The impulse from the water spins the runner by increasing the velocity of the water being
discharged onto the runner. Reaction turbines use the pressure of the water to develop torque that
rotates the runner. Because of the pressure, reaction turbines need to be completely submerged
into the fluid. This allows for the turbine to be implemented into a pipe system, whereas the
cross flow turbine would not be able to be placed in a closed pipe system. Therefore the reaction
bulb turbine would be best suited for the UBWPAD case study analysis (Prakash, 2014).
Bulb turbines, also known as micro turbines, are generally used in low-head applications — less
than 30 meters — and flow rates from 2 MGD to 80 MGD. If there are conditions that are over
30 meters or 80 MGD, these turbines can be put in parallel arrangements for higher flows, or in
series for a greater effective head. The different types represent different turbine sizes, which are
designed to operate in a wide range of flow and head conditions, allowing for high efficiency.
The runner design of these turbines is an essential contribution to the high efficiency; the runner
blades are designed to adjust the angle due to the flow variations, making the turbine and
generator 94% efficient (Voith Siemens Hydro, 2008). These turbine-generator packages allow
for low installation costs and simple maintenance procedures because the straight pipe for the
water passage simplifies construction work. This design also reduces the concrete volume by
mounting the generator on the turbine structure. Maintenance for the turbines (Appendix D)
consists of replacing bearings and the mechanical seal every 5 years, and transmission belts and
lubrication oil annually (Toshiba Corporation et al., 2014).
Micro turbines have a presence in large wastewater treatment plants. The wastewater treatment
facility in Point Loma, San Diego, CA uses the flow of water through the facility to create
electricity to sell back to the San Diego Gas and Electric Company. The project totaled $1.2
million, including turbine cost, piping cost, electrical cost, transmission lines, engineering time
and other labor associated with the project. This was partially funded by the California Energy
Commission and the State of California, totaling $780,000. This treatment facility generates 1.35
megawatts of renewable energy using hydroelectric turbines (United States Environmental
Protection Agency, 2013). This application is an example of a large treatment plant integrating
hydroelectric turbine technologies into an already existing system.
A number of manufacturers that provide micro turbines were contacted, and their turbines were
researched to determine the best fit for this project (Appendix D). These manufacturers include
Energy Systems and Design, Power Pal, Canyon Hydro, Toshiba International, VLH Turbine,
Voith Siemens, and HydroCoil. These manufacturers design and produce micro tubular turbines
for different applications. The micro tubular turbine models from these manufacturers are listed
with their specifications in Table 10. The turbines manufactured by Voith Siemens and Toshiba
were applicable to case study at UBWPAD because this plant operates with a flow of 32 million
gallons per day, which falls between the flow ranges of these two models.

20
Table 10 - Micro Turbine Model Specifications (United States Environmental Protection Agency,
2013)
Manufacturer/
Model
Applicable Head
(feet)
Applicable Flow
(MGD)
Cost Power Output
(kW)
Energy Systems
and Design
Model LH 1000
10 1.3 $3,000 1
Power Pal Model
MHG 1000LH
5 3.2 $4,000 1
Canyon Hydros
Kaplan Turbine
30 - 50 64.6 - 258.5 $30,000 -
$500,000
unavailable
Toshiba
International
Horizontal
Hydro-eKIDS
6.6 - 49.2 0.6 - 77.6 $7,000 - $30,000 5 - 250
VLH Turbine 4.2 - 10.5 0.2 - 0.5 $575,000 -
$1,100,000
100 - 500
Voith Siemens 6 - 66 2.3 - 91.3 $650,000 -
$800,000
unavailable
HydroCoil 10 - 60 0.8 unavailable unavailable
Most manufacturers provided limited specifications that did not include the price for their
turbines. Therefore, turbine manufacturers were contacted. Chirag Panchal, an engineer at Voith
Siemens, provided a quote that was between $650,000 and $800,000 for a micro tubular turbine
with installation fees included, but piping costs were not included (Panchal, 2013). The
Environmental Protection Agency published a document referring to Toshiba as a turbine
manufacturer that produces micro tubular turbine models similar to the models by Voith
Siemens. The Toshiba models were quoted between $7,000 and $30,000 for turbine and
installation fees (United States Environmental Protection Agency, 2013). Toshiba Hydro-eKIDS
micro turbines come in three different sizes: S-Type, M-Type, and L-Type. Specifications for
these turbine types are displayed in Table 11. Toshiba was contacted directly, but a quote was
not received to determine the exact price for this micro turbine. Due to the dramatic price
difference between the turbine models manufactured by Voith Siemens and Toshiba, the Toshiba
turbine model was selected for the UBWPAD case study.

21
Table 11 - Dimension Specifications of Toshiba Micro Turbines (Adapted From Toshiba
Corporation et al., 2014)
Specification L-type M-type S-type
Inlet Diameter (ft) 4.43 1.97 0.99
Outlet Diameter (ft) 3.29 1.97 0.99
Width (ft) 5.25 3.64 1.97
Length (ft) 15.09 6.73 4.13
Height (ft) 8.20 5.57 3.28
Weight (tons) 7.5 3.1 1.0
Discharge Range
(MGD)
22.82 - 79.89 2.28 - 31.95 2.28 - 6.85
Head Range (ft) 6.56 - 49.21 6.56 - 49.21 6.56 - 49.21
Power Generation
Range (kW)
10 - 200 5 - 100 5 - 25
Toshiba International Horizontal Hydro-eKIDS turbines are propeller turbines that are best
suited installation in pipes. This particular turbine has adjustable runner blades to adapt to the
conditions in the effluent pipe, and it can be installed in parallel or in series to maximize the
usage of the equipment. Figure 9 depicts a basic schematic of the Horizontal Hydro-eKIDS L-
Type Turbine.
Figure 9 - Horizontal Hydro-eKIDS L-Type Turbine (Adapted from United States Environmental
Protection Agency, 2013)
The dimension specifications vary among the different types of turbines (Appendix D), and
different types of turbines are selected for projects based on the potential power, flow, and
available head. Turbine types do not vary significantly across different manufacturers.

22
The L-Type turbine was selected for analysis because this size turbine accommodates the 32-
MGD flow rate at the UBWPAD. The S-Type and the M-Type do not accommodate the flow
range for the UBWPAD. The minimum head specification for the L-Type turbine exceeds the
available head at UBWPAD by approximately one foot, which will likely have an effect on the
turbine efficiency. This was not considered for this feasibility study. The L-Type turbine has an
inlet diameter of 4.43 feet and outlet diameter of 3.29 feet. Because a quote was not provided by
Toshiba, the highest price was used because the largest turbine was selected for this case study
analysis (see Chapter 4).
3.4 Design Considerations
The pipe size that was chosen for this turbine was 4.0 feet in diameter. Although the turbine inlet
diameter is 4.43 feet, a pipe with this diameter is not a standard size. This size pipe would need
to be custom ordered to fit this application. To accommodate the size difference from the pipe to
the turbine inlet, a change over fitting would need to be installed.
To ensure that the pipe containing the turbine is consistently full (promoting maximum
efficiency), a stationary weir was designed to be implemented in the pre-existing effluent outfall
in order to divert the water into the turbine effluent discharge pipe. The height of this wall was
determined to be equal to the diameter of the turbine effluent discharge pipe, or 4.0 feet using the
L-Type turbine. The height of the wall will contain the water in the outfall unless the flow is
large enough to spill over the wall. In the case of an overflow, the water will flow over the weir
and into the pre-existing effluent channel depicted in Figure 10. The complete solid model
design and detailed drawings can be found in Appendix E.
Figure 10 - Model of Chlorine Contact Chamber at UBWPAD and Redesigned Effluent.

23
Valves are to be installed at both ends of the channel, with the turbine located between these
valves. The first valve at the higher end of the discharge pipe is a gate valve. This valve can be
manually opened or closed by the plant operators in order to manage or stop the flow of water
through the discharge pipe. The second valve at the lower end of the pipe is a check valve. This
valve prevents any water from flowing into the pipe in the opposite direction of the water
flowing out from the plant.
3.5 Piping Material Selection
Some materials that are commonly used in wastewater treatment systems are steel, lined ductile
iron, and smoothed cement. Selecting the pipe material is an important factor for this project
because the friction losses through a pipe may affect the power output of the turbine. The
material of the pipe was chosen based on these criteria: the amount of friction losses that occur,
the pricing of the materials, and the lifespan of the piping material.
The Darcy-Weisbach Equation (Equation 2) was used determine the friction losses through the
pipe.
(Equation 2)
Where:
hf is the head loss due to friction (ft, m)
L is the length of the pipe (ft, m)
D is the diameter of the pipe (ft, m)
V is the average velocity of the fluid flow (ft/s, m/s)
g is the local acceleration due to gravity (ft/s2, m/s
2)
fD is the Darcy friction factor coefficient (unitless)
For this calculation, a length of 35 feet (10.67 m) was used because this is the length of pipe
needed for the UBWPAD. The total length of the outfall is 50 feet, but the turbine itself is 15 feet
long, so only 35 feet of pipe is necessary for the design. The diameter used in this calculation
was 4.0 feet because this is size pipe used for the case study analysis. The velocity was calculated
using Equation 3.
(Equation 3)
Where:
V is the velocity (m/s)
Q is the volumetric flow rate (m3/s)

24
A is the cross-sectional area of the pipe (m2)
In this equation, the volumetric flow rate (Q) is equal to 32 million gallons per day, which
converts to 1.40 m3/s. The cross sectional area refers to that of the pipe, and it is dependent on
the diameter of the pipe, which is 4.00 feet (1.22 m). The cross sectional area of this pipe is 1.17
m2. Therefore, the velocity of the fluid flow through the pipe is 1.2 m/s.
The Darcy friction factor (fD) was determined from the Moody Diagram based on the Reynolds
Number and the relative roughness. There are multiple steps to determining the Darcy friction
factor. First, the Reynolds Number was calculated using Equation 4.
(Equation 4)
Where:
Re is the Reynolds Number (unitless)
ρ is the density of the water (kg/m3, lbm/ft
3)
V is the velocity (ft/s, m/s)
dh is the hydraulic diameter (ft, m)
μ is the dynamic viscosity (Ns/m2, lbm/s ft)
The density (ρ) of the water was assumed to be 1000 kg/m3, under the same assumptions
discussed in section 3.1. Velocity (V) is consistent with the velocity used in Equation 2, which is
1.2 m/s. The hydraulic diameter (dh) is equal to the diameter of the pipe, 1.22 meters. Finally, the
dynamic viscosity (μ) of water at 20 degrees Celsius (the same temperature used for the density
of water) is 1.002 Ns/m2. Substituting these values back into Equation 4, the Reynolds is
calculated:
(Equation 4)
Flow is considered laminar, transitional (transient), or turbulent if the Reynolds numbers are less
than 2,300, between 2,300 and 4,000, or greater than 4,000, respectively. This Reynolds Number
suggests that the water flowing through the pipe is laminar because the value is less than 2,300.
25
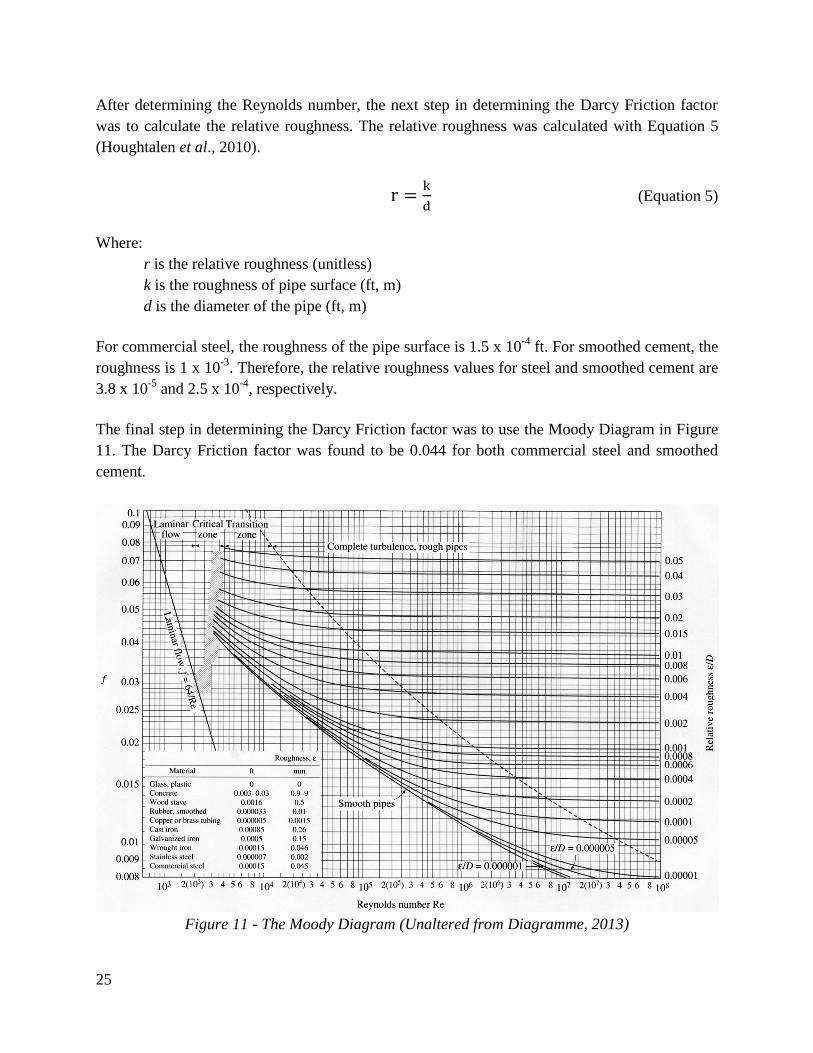
After determining the Reynolds number, the next step in determining the Darcy Friction factor
was to calculate the relative roughness. The relative roughness was calculated with Equation 5
(Houghtalen et al., 2010).
(Equation 5)
Where:
r is the relative roughness (unitless)
k is the roughness of pipe surface (ft, m)
d is the diameter of the pipe (ft, m)
For commercial steel, the roughness of the pipe surface is 1.5 x 10⁻⁴
ft. For smoothed cement, the
roughness is 1 x 10⁻³
. Therefore, the relative roughness values for steel and smoothed cement are
3.8 x 10⁻⁵
and 2.5 x 10⁻⁴
, respectively.
The final step in determining the Darcy Friction factor was to use the Moody Diagram in Figure
11. The Darcy Friction factor was found to be 0.044 for both commercial steel and smoothed
cement.
Figure 11 - The Moody Diagram (Unaltered from Diagramme, 2013)

26
Since the flow through the pipe is laminar (Re < 2,300), a simpler method can be used to
determine the frictional losses. With laminar flow, the friction factor can be calculated using
Equation 6:
(Equation 6)
Since the Reynolds number is dependent on the flow and not on the type of piping material, it
remains the same for all piping materials. Using Equation 6, the Darcy friction factor will be
0.044 for any piping material used under the specifications at UBWPAD.
The losses due to friction were determined using Darcy-Weisbach Equation (Equation 2).
(Equation 2)
(
) (
( )
)
Table 12 represents the pipe materials with frictional head losses and price per foot for 4.0 foot
diameter and 35 foot long pipes.
Table 12 - Frictional Characteristics of Different Piping Materials
Surface Roughness
Coefficient
(ft)
Relative
Roughness
Re Darcy
Friction
Factor
Head loss
due to
friction (m)
Price Per
Foot
Commercial
Steel
1.5 x 10⁻⁴
3.8 x 10⁻⁵
1461 0.044 0.028 $595
Smoothed
Cement
1 x 10⁻³
2.5 x 10⁻⁴
1461 0.044 0.028 $268
Commercial steel and smoothed cement both experience 0.028 meters, or 1.1 inches, of head loss
due to the friction over a pipe length of 35 feet. Since friction losses are the same for all
materials with laminar flow, the price per foot and lifespan are the criteria for the choice of
piping material. According to Table 12, smoothed cement would be the best choice of piping
material due to the lower price per foot. The general lifespan of commercial steel is between 50

27
and 70 years (Baird, 2011). The general lifespan of smoothed cement is greater, ranging between
70 and 100 years. Therefore, the selected pipe material for UBWPAD is smoothed cement.
Smoothed cement also has a compressive strength ranging between 4,000 psi to 8,000 psi. The
compressive strength is the capacity of the material to withstand loads that reduce the size of the
material (American Concrete Pipe Association, 2014). A combination of cement and steel piping
is used at Deer Island Wastewater Treatment Facility as the inlet and piping for the turbines.
Where steel is used in this application, epoxy is applied to help resist the corrosion of the pipe
(O’Brien, 2014).
3.6 Operational and Maintenance Considerations
This system was designed to be installed in the effluent of a wastewater treatment system rather
than the influent because of the quality of the water. The concentration of suspended solids in the
influent of a wastewater treatment plant is much greater than the concentration of suspended
solids in the effluent. Suspended solids could create wear on the turbine blades, so placing the
turbine in the effluent channel will not wear the turbine blades down as quickly as if it were
placed in the influent channel. This design consideration will help to save money on maintenance
costs. This assumption can be made across the nation because influent and effluent
characteristics show minimal variations regardless of the region (Davis, 2009).
Instead of incorporating the turbine into the pre-existing effluent channel, the separate discharge
channel was designed to provide accessibility to the turbine and generator for maintenance. If the
turbine is located in the existing effluent channel, maintenance issues could potentially arise. By
installing a separate channel for the turbine, the flow is able to be controlled or stopped for
maintenance. The maintenance of this system follows a schedule provided by the turbine supplier
and may vary depending on the type and manufacturer.
Another reason for implementing this system into a separate channel was to control flooding. In
this system, there are valves located at both ends of the channel, and the turbine is located
between these valves. This setup allows for water to be diverted if necessary, such as in the case
of flooding. The valve at the lower end of the discharge pipe would be a check valve. This valve
would only allow for water to flow one way out of the pipe, and it would prevent water from
flowing up the pipe during natural flooding conditions. The valve located at the higher end of the
turbine effluent discharge would be a gate valve, which would allow the operator to manually
close the valve to reduce or shut down the flow into the turbine effluent discharge pipe.

28
4. ECONOMICS
The costs that are associated with implementing hydroelectric power recovery at a wastewater
treatment facility consist of turbine cost, turbine foundation cost, piping system cost, and project
contingency, which make up the system installation costs. These costs are offset by the benefit of
electricity being sold back to the grid comparing the costs and the benefits allows for assessment
of the feasibility of the project. There are also yearly operating and maintenance costs which
were not considered for this case study analysis because more information would be necessary to
create a specific maintenance schedule. General maintenance may consist of replacing belts,
bearings, and runner blades.
4.1 System Installation Costs at UBWPAD
The system installation costs are composed of the turbine system, turbine foundation, piping
system, and contingency factor. The cost of the turbine system includes the turbine itself,
electrical panels, transmission lines and engineering. The foundation for the turbine is a poured
concrete slab. The dimensions of the concrete slab, which will determine the cost of the concrete
and labor, are provided by the turbine manufacturer. The piping costs are determined based on
the length and diameter of the pipe. Costs for the turbine system, concrete, and piping are
inclusive of installation fees. After the costs for the turbine system, concrete slab, and piping
system are determined, a contingency percentage is added as a safety factor for any blind costs
that may occur during the project. A summary of system installation costs for the Upper
Blackstone Water Pollution Abatement District is shown in Table 13, which shows installation
costs of approximately $49,500. Details on each of these costs are provided in the following
sections.
Table 13 - Estimated System Installation Costs for UBWPAD (Waier, 2011)
Component Specification Cost
Turbine 15.09’ x 5.25’ x 8.20’ $30,000
Concrete 15.1’ x 5.3’ x 1.0’ $242
Piping 35’ length; 4’ Smoothed Concrete $9,380
Subtotal - $39,622
Contingency 25% $9,906
TOTAL - $49,528
29
4.1.1 Turbine and Generator System
The turbine system chosen for this application is manufactured by Toshiba. Therefore, the price
range used for the selected turbine was determined from the Renewable Energy Fact Sheet: Low
Head Hydropower from Wastewater in August of 2013 by the United States Environmental
Protection Agency, which shows Toshiba’s turbine system costing from $7,000 to $30,000
(United States Environmental Protection Agency, 2013). The cost used in the feasibility analysis
was based on the maximum cost of the turbine because the selected size of the turbine was the
largest option available. The $30,000 price covers the turbine itself, electrical panels, installation,
and engineering fees.
4.1.2 Piping
The piping cost is dependent on the selected material, length, and diameter. For UBWPAD, the
selected material of the pipe is smoothed cement, with a length of 35 feet, and a diameter 4.00
feet. This material has a price of $268 per foot, including material and labor costs (Waier, 2011).
Smoothed cement was selected as the piping material for this project because it costs less per
foot. The material cost per length foot will increase with an increase in diameter. With a larger
diameter inlet and outlet of the turbine, the choice of pipe material may vary depending on the
price difference between materials. Depending on the effluent flow rate, the piping diameter will
change to accommodate the hydraulics of the system. The inlet and outlet diameters of the
turbines manufactured by Toshiba range from one foot to five feet. Pipes with diameter greater
than five feet can be accommodated to these turbines using tapered fittings.
4.1.3 Concrete
The cost for concrete is dependent on the dimensions of the required concrete slab, which is
dependent on the size of the turbine and the location of the anchor bolts. For this case, the cost of
the cement is a rough estimate due to certain constraints. In order to come up with a more
accurate cost for the concrete slab, the manufacturer must supply system drawings and system
specifications, which will give the location of the anchor bolts and the correct dimensions of the
turbine footings. This information was not made available by the manufacturer, so the concrete
slab cost shown in Table 13 is a rough estimate based on the turbine weight of 7 tons and the
turbine dimensions of 15.09 feet long by 5.25 feet wide. A concrete slab with dimensions of
15.1’ x 5.3’ x 1.0’ will accommodate the size and weight of the turbine (Toshiba Corporation et
al., 2014). Based on these dimensions, the total cost for concrete materials would be $242
(Waier, 2011).
4.1.4 Contingency
The total cost of this project includes a 25% contingency plan. This 25% is based on the average
contingency percentage that contractors use when implementing a startup project. As a project is
developed, the contingency will drop over time, but a higher contingency is initially used to

30
avoid overrun fees. This buffer compensates for unplanned costs that may arise throughout the
design and construction of a project (Connecticut Department of Transportation, 2013).
4.2 Electricity Benefit
Once the Toshiba Hydro-eKIDS turbine goes online, power generated, by the turbine will offset
electricity costs at the UBWPAD. The amount of money that is saved on electricity consumption
depends on how much can be generated from the turbine, the percentage of the total energy
consumption that hydroelectric power production would cover, and the price of electricity.
4.2.1 Consumption Costs to Facility
Electricity consumption costs per year will vary depending on the facility. Facilities use
electricity to keep plant operations running continuously, as well as to power the offices and
buildings in which employees work.
Mark Johnson, a plant staff member at the UBWPAD, provided the plant’s electricity usage from
January 2012 until December 2012. The electricity used in 2012 at the UBWPAD totaled
16,400,000 kWh. In the state of Massachusetts, the consumption cost per kWh of electricity is
$0.15, meaning that in 2012, the UBWPAD spent approximately $2.5 million on electricity
costs.
4.2.2 Production from Hydropower
Theoretically, the calculations made in section 3.2 state that a hydroelectric turbine at the
UBWPAD would generate 19.9 kW at an average flow of 32 MGD, which is approximately
174,000 kWh of electricity per year.
Selling it back to the grid at $0.10 per kWh, the UBWPAD could save approximately $17,400 on
electricity costs each year (Site Based Energy, 2013). Based on the 2012 electricity consumption,
a hydroelectric turbine system has the potential to produce roughly 1.1% of the electricity needs
at the UBWPAD.
4.3 Payback Period
One of the most important factors in determining the economic feasibility of a mechanical
project is the length of the payback period, which is the period of time required for the amount of
money saved to equal the amount of money spent on the project.
Staff members at multiple wastewater treatment facilities in Massachusetts were contacted in
order to determine a reasonable payback period. Dan O’Brien, a plant manager at Deer Island in
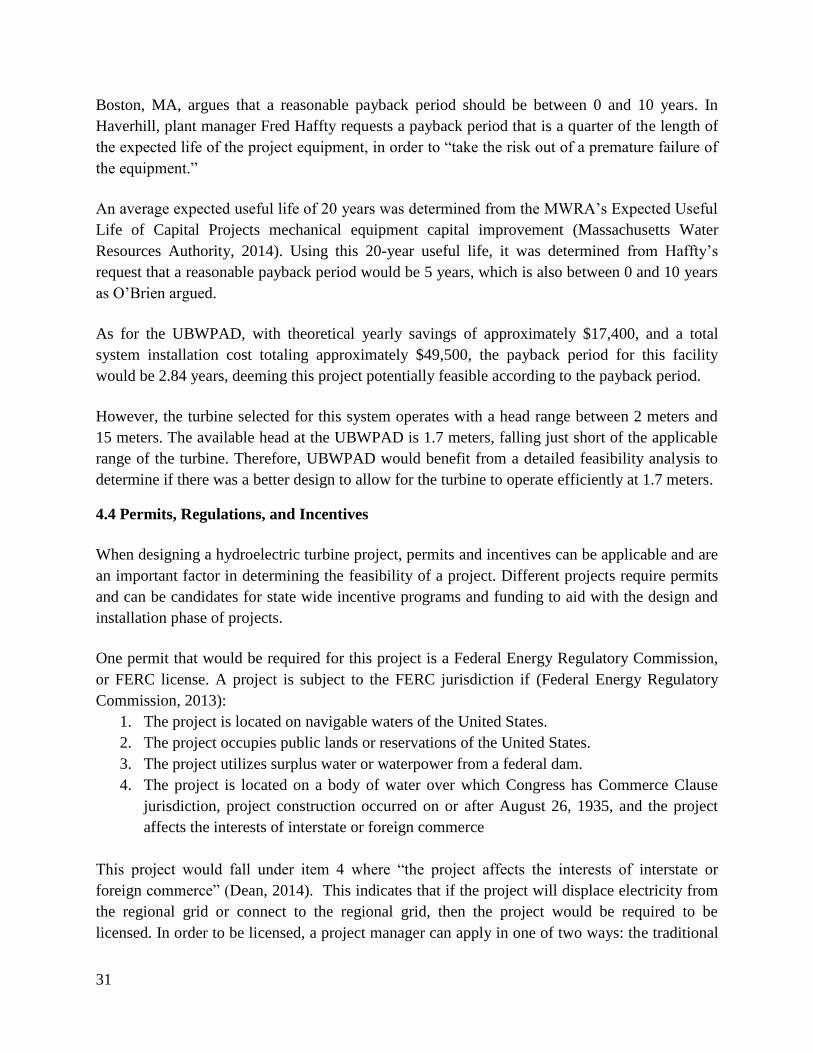
31
Boston, MA, argues that a reasonable payback period should be between 0 and 10 years. In
Haverhill, plant manager Fred Haffty requests a payback period that is a quarter of the length of
the expected life of the project equipment, in order to “take the risk out of a premature failure of
the equipment.”
An average expected useful life of 20 years was determined from the MWRA’s Expected Useful
Life of Capital Projects mechanical equipment capital improvement (Massachusetts Water
Resources Authority, 2014). Using this 20-year useful life, it was determined from Haffty’s
request that a reasonable payback period would be 5 years, which is also between 0 and 10 years
as O’Brien argued.
As for the UBWPAD, with theoretical yearly savings of approximately $17,400, and a total
system installation cost totaling approximately $49,500, the payback period for this facility
would be 2.84 years, deeming this project potentially feasible according to the payback period.
However, the turbine selected for this system operates with a head range between 2 meters and
15 meters. The available head at the UBWPAD is 1.7 meters, falling just short of the applicable
range of the turbine. Therefore, UBWPAD would benefit from a detailed feasibility analysis to
determine if there was a better design to allow for the turbine to operate efficiently at 1.7 meters.
4.4 Permits, Regulations, and Incentives
When designing a hydroelectric turbine project, permits and incentives can be applicable and are
an important factor in determining the feasibility of a project. Different projects require permits
and can be candidates for state wide incentive programs and funding to aid with the design and
installation phase of projects.
One permit that would be required for this project is a Federal Energy Regulatory Commission,
or FERC license. A project is subject to the FERC jurisdiction if (Federal Energy Regulatory
Commission, 2013):
1. The project is located on navigable waters of the United States.
2. The project occupies public lands or reservations of the United States.
3. The project utilizes surplus water or waterpower from a federal dam.
4. The project is located on a body of water over which Congress has Commerce Clause
jurisdiction, project construction occurred on or after August 26, 1935, and the project
affects the interests of interstate or foreign commerce
This project would fall under item 4 where “the project affects the interests of interstate or
foreign commerce” (Dean, 2014). This indicates that if the project will displace electricity from
the regional grid or connect to the regional grid, then the project would be required to be
licensed. In order to be licensed, a project manager can apply in one of two ways: the traditional

32
licensing process (TLP), or the alternate licensing process (ALP). The TLP requires that the
applicant completes a document along with a three stage pre-filing process, 18 CFR 4.38. The
stages for this process are as follows:
First Stage
o Applicant issues notice of intent, preliminary application document, request to use
TLP, and newspaper notice;
o Commission approves use of TLP;
o Applicant conducts joint agency/public meeting and site visit;
o Resource agencies and tribes provide written comments; and
o Agencies, tribes, or applicant request dispute resolution on studies with the
Commission.
Second Stage
o Applicant completes reasonable and necessary studies;
o Applicant provides draft application and study results to resource agencies and
tribes;
o Resource agencies and tribes comment on draft application; and
o Applicant conducts meeting if substantive disagreements exist.
Third Stage
o Applicant files final application with Commission and sends copies to agencies
and tribes.
The ALP is designed to improve the communication between the Commission and the applicant.
This process allows for the applicants to customize the pre-filing consultation process to each
individual case. It also allows for the applicant to combine the environmental review and the pre-
filing process into one process under the National Environmental Policy Act. This process also
allows for the preparation of a preliminary environmental assessment by the applicant or an
environmental impact statement by a contractor that is chosen by the Commission and is paid for
by the applicant. The required documents for this process are located in 18 CFR 4.34 Order No.
596. Building permits may apply to this project but will be specific to the town and region the
project is being constructed.
When designing and constructing a hydropower reclamation project, different incentives can be
applied to the funding and cost of the project. Massachusetts offers different incentives for small
hydropower projects because Massachusetts requires that a portion of electricity shall be
generated from renewable energy sources. This project falls into the RPS Class I program,
allowing the majority of the project to be funded by the state. One of the programs offering
funding for projects that qualify from the RPS Class I criteria are from the Mass Clean Energy
Center under the Commonwealth Hydropower Program. This project offers up to $600,000 for
the design and construction, and up to $40,000 for the feasibility study (U.S. Department of
Energy et al., 2013).

33
5. EXTENDED ANALYSIS USING HYPOTHETICAL FLOW AND HEAD CASES
Different facilities have the potential to generate varying amounts of electricity based on the
volumetric flow rate of water through the plant, as well as the available head from the hydraulics
and structure of the plant. This chapter extends the case study analysis at UBWPAD to the other
treatment facilities in Massachusetts using hypothetical cases of flow and head.
5.1 Hypothetical Flow and Head Cases
The average volumetric flow rates of the 110 wastewater treatment facilities in Massachusetts
were provided by the EPA (U.S. Environmental Protection Agency-New England, 2011);
however, the available head levels at these facilities were not provided. Therefore, the analysis
performed in the UBWPAD case study was extended by the creation of hypothetical head and
flow cases.
The ranges of the hypothetical head cases were based on the applicable ranges within which all
three sizes of the selected Toshiba Hydro-eKIDS turbines operate. All three turbine sizes operate
between 6.56 and 49.21 feet of head. For this analysis, the head range was rounded to 6 to 50
feet, with 2-foot increments from lowest to highest from 6 to 20 feet, then 10-foot increments
from 20 to 50 feet. The ranges of hypothetical flow cases were based on the range of average
flow rates for the 110 treatment facilities in Massachusetts. The average flow rate for these
facilities ranges from 0.016 million gallons per day to 365 million gallons per day. However,
Deer Island, which has the largest flow rate of these facilities (365 MGD), was not included in
this analysis since hydropower already exists at that facility. Therefore, the flow range was
between 0.016 million gallons per day to 45 million gallons per day. For this analysis, the flow
range was rounded to 2 to 46 million gallons per day, with 2-MGD increments from lowest to
highest. The minimum cutoff was 2 MGD because any flow rates lower than this would not be
accommodated by the selected turbine. Any cases that do not fall within these ranges of head and
flow may be deemed not feasible for the installation of this hydropower project using Toshiba
Turbines.
5.2 Feasibility of Hypothetical Hydropower Scenarios
In order to determine the feasibility of installing hydroelectric power generation for the
hypothetical cases of head and flow that were created, three steps were taken. First, potential
power generation (in kWh) was calculated for all possibilities of flow and head combinations
within these ranges. These values were calculated based using Equation 1 (see section 3.1). A
table listing these values can be found in Appendix F. Second, the potential power generation
values were translated into savings, using a retail price of $0.10 per kWh sold to the grid. Yearly
savings (rounded to the nearest dollar) for each combination of artificial head and flow cases are
listed in Appendix F. Finally, the yearly savings were compared to the system installation cost of
$49,500, which was rounded up to $50,000 for convenience. It is recognized that these costs
34
would vary based on site specific features. Payback periods were calculated for each of the cases.
A table of the hypothetical cases and their payback periods can be found in Appendix F.
Cases that had a payback period of five years or fewer were deemed feasible, while cases with
payback periods greater than five years were determined to be potentially feasible with some
modification, or not feasible. One example of a modification that could be made to make the
potential cases feasible includes creating pumped storage tanks to hold the effluent (see Section
1.2.3). This modification would require pumps to be used to transport the water into a holding
tank at night during hours of lower electricity demand. The water would then be discharged to
the turbine during the day when electricity demand is at its peak. However, the addition of
pumps and a storage tank, along with other forms of modifications, would create additional costs
and could potentially affect the payback period, which could in turn affect the feasibility of the
project. Table 14 illustrates the feasibility of the different combinations of hypothetical flow and
head cases, as well as which size of the Hydro-eKIDS turbine would be best suited for each case.
Table 14 - Feasibility Chart for Varying Hypothetical Flow and Head Cases
A total of 299 hypothetical cases were analyzed, with 86.3% of the cases being feasible, 4.3%

35
being potentially feasible with some modification, and 9.4% being not feasible. As displayed in
the table, 100% of flow cases greater than or equal to 16 million gallons per day would be
feasible for the implementation of this hydropower project, as long as the available head is
within the range that the Hydro-eKIDS turbine accommodates. For cases with average flows less
than 16 million gallons per day, 50 out of the 91 cases were feasible (54.9%), and 13 were
potentially feasible with modification (14.3%). Less than a third (30.8%) of the cases with flows
less than 16 million gallons per day were deemed not feasible.
5.3 Feasibility of Massachusetts Wastewater Treatment Facilities
Using the chart generated from hypothetical flow and head combinations, Massachusetts
wastewater treatment facilities have the ability to determine the feasibility of implementing this
hydropower project by comparing real flow and head data from their facilities to the hypothetical
flow and head cases.
In Massachusetts, there are nine wastewater treatment facilities with volumetric flow rates
greater than 16 million gallons per day (not including Deer Island). If these nine plants each have
head values in the range of 6 to 50 feet, then this hydropower project would likely be feasible for
these facilities.
Out of the 110 wastewater facilities in Massachusetts, 76 of them (69.1%) accommodate flow
rates that are less than 2 million gallons per day. Since the Hydro-eKIDS turbine (at any size)
does not operate with flows this low, these 76 facilities were deemed not feasible.
The remaining 34 wastewater treatment plants in Massachusetts have average volumetric flow
rates between 2 and 16 million gallons per day. Depending on the available head at these
facilities, any of them could be deemed as either feasible or not feasible. Those with an available
head between 40 and 50 feet will likely be feasible according to Table 14. However, smaller
head values will decrease the likelihood of feasibility. These 34 facilities would benefit from
conducting an in-depth feasibility study, much like that performed on UBWPAD in Chapters 3
and 4. This in-depth study would provide detailed information about the available head and
flows, which would then assist in determining the power output and the payback period for this
hydropower project.

36
6. CONCLUSIONS AND RECOMMENDATIONS
The purpose of this feasibility study was to determine if hydropower energy recovery was
feasible in wastewater treatment facilities. A case study was examined for a 32-MGD treatment
plant, and then the analysis was extended for hypothetical scenarios of flow and head conditions.
This study examined different factors in conducting a feasibility study such as the cost of
construction of a hydroelectric turbine system, laws and regulations, and the payback period.
6.1 Feasibility at UBWPAD
The UBWPAD is a 32-MGD facility with a chlorine contact chamber as the final process before
discharge. The change in elevation from the top of the weir to the river is 5.5 feet. Using a
horizontal turbine, 19.9 kW would be generated, which would be about 174,000 kWh per year.
The total cost for the turbine system installation would be approximately $49,500, but the
electricity generated on site would save the facility approximately $17,400 each year, resulting in
a payback period of 2.84 years. However, the selected Toshiba turbine is rated for a minimum
head of 2 meters. This facility would benefit from a more detailed analysis to determine whether
or not the Toshiba turbine would function in the facility. Because this turbine’s minimum head
requirement just over the head available at UBWPAD, with some redesign of the effluent, there
is a possibility that this project could be implemented at this facility.
6.2 Feasibility at Other Wastewater Treatment Plants
This feasibility study provided insight into implementing hydroelectric turbines into wastewater
treatment plants to reclaim energy. This project evaluated flow ranges between 2 and 46 million
gallons per day. These values cover a range of flows recorded at wastewater treatment plants
across Massachusetts, excluding Deer Island and excluding plants with flows less than 2 million
gallons per day. The head values of Massachusetts plants were not readily available; therefore,
the head values used in this case were based off of the selected turbine specifications, between 6
feet and 50 feet. From calculations performed for 299 possible head and flow combinations, this
project was able to determine potential cases that would benefit from hydropower energy
recovery systems, with 86.3% of the hypothetical cases deemed feasible.
Using the table produced from the hypothetical head and flow case analysis (Table 14),
Massachusetts treatment plant staff can determine an estimate of the payback period of this
hydropower project at their facilities by matching the available head and average volumetric
flow rate at their wastewater facility to those on this table. If the project is determined as feasible
or potentially feasible, that facility may then perform a more in-depth analysis similar to that
performed on UBWPAD in Chapter 3 and Chapter 4.
37
6.3 Recommendations
Though the implementation of a hydroelectric turbine system may not be feasible for the effluent
pipe of every wastewater treatment facility, there are other options for implementing renewable
energy. A hydroelectric turbine alone may not be economically feasible, but the addition of other
energy reclamation systems could make the investment more worthwhile. The wastewater
treatment facility at Deer Island uses a combination of renewable energy technologies, and these
technologies have the potential to be applied at other wastewater treatment facilities.
6.3.1 Deer Island Energy Reclamation
Deer Island Wastewater Treatment Plant serves the Boston area and treats approximately 365
million gallons of wastewater per day. Deer Island currently uses hydroelectric turbine
technologies in the effluent stream. This technology was implemented in the early 1980s and has
been generating 6,000,000 kWh annually, saving the facility about $600,000 per year in
electricity costs. Deer Island also uses other forms of renewable energy such as methane from the
anaerobic digesters, wind energy, solar energy, and steam turbine generation. With all of these
renewable energy technologies, along with electrical upgrades, Deer Island produces 26% of
their total electricity on site (Massachusetts Water Resources Authority, 2013).
6.3.2 Potential for Energy Reclamation at UBWPAD
The Upper Blackstone Water Pollution Abatement District also has the potential for energy
reclamation on site, other than hydropower. Solar power is in the process of being implemented
to produce up to 337 kW of electricity on site (Upper Blackstone Water Pollution Abatement
District, 2012). During a site visit, plant manager Mark Johnson also suggested that steam
generation (STG) could be a potential source of energy production for UBWPAD. This
technology could be implemented with the on-site incinerator. The incinerator is used to burn
sludge after the sludge-handling process. This sludge is transported to the UBWPAD facility
from across Massachusetts to be incinerated. Figure 12 shows where there is potential for other
renewable technologies at UBWPAD.

38
Figure 12 - Potential Energy Reclamation Systems at UBWPAD

39
BIBLIOGRAPHY
AltaGas, Ltd. (2014). “Run-of-River Hydroelectric.” AltaGas, Ltd. Calgary, Alberta, Canada.
Retrieved from <http://www.altagas.ca/sites/default/files/Run-of-
river.Info%20Sheet.v1.pdf>.
American Concrete Pipe Association. (2014). “Made of Concrete.” American Concrete Pipe
Association. Irving, TX. Retrieved from <http://www.concrete-
pipe.org/pages/why.html>.
Baird. (2011). “The Epidemic of Corrosion, Part 1: Examining Pipe Life.” American Water
Works Association. Denver, CO. Retrieved from
<http://www.agingwaterinfrastructure.org/SiteResource/Site_109155/Customize/Image/fi
le/Alternative%20Materials%20and%20Project%20Delivery%20Methods/AWWA%20D
ec%202011%20The%20Epidemic%20of%20Corrosion%20Part%201%20Examining%2
0Pipe%20Life.pdf>.
Brockhouse; Wadsworth. (2010, December). “Vital Steps: A cooperative feasibility study
guide.” U.S. Department of Agriculture. Washington, D.C. Retrieved from
<http://www.rurdev.usda.gov/rbs/pub/sr58.pdf>.
Canyon Hydro. (2013). “Micro-Hydro Systems.” Canyon Hydro. Retrieved from
<http://www.canyonhydro.com/micro/index.html>.
Combs. (2008, April). “Hydropower.” Window on State Government – Texas Comptroller of
Public Accounts. Austin, Texas. Retrieved from
<http://www.window.state.tx.us/specialrpt/energy/renewable/hydro.php#4>.
Connecticut Department of Transportation. (2013). “2013 Cost Estimating Guidelines.”
Connecticut Department of Transportation. Connecticut. Retrieved from
<http://www.ct.gov/dot/lib/dot/documents/aec/final_2013_guideline.pdf>.
Consumers Energy; DTE Energy. (2006, December). “Ludington Pumped Storage Plant.”
Consumers Energy; DTE Energy. Ludington, MI. Retrieved from
<http://www.consumersenergy.com/uploadedfiles/ceweb/shared/ludingtonpumpedstorage
.pdf>.
De Vooght. (2013, September 12). Coast Mountain Hydro. Email interview.
Dean. (2014, February 6). Massachusetts Clean Energy Center. Email interview.

40
Diagramme. (2013, November 21). “Moody Diagram.” Diagramme: Diagram Resources and
Information. Retrieved from <http://diagramme.info/wp-content/uploads/moody-
diagram-712.jpg>.
Energy Realities. (2013). “Years of Fossil Fuels Remaining” [Infographic]. Energy Realities.
National Geographic Maps. Retrieved from
<http://www.energyrealities.org/chapter/energys-future/item/years-of-fossil-fuels-
remaining/erp6D28994FAAEECC86A>.
Energy Systems & Design. (2011). “LH1000 Low Head Stream Engine.” Energy Systems &
Design. Retrieved from <http://www.microhydropower.com/our-products/low-head-
stream-engine/>.
Federal Energy Regulatory Commission. (2013, September 30). “Licensing Processes.” Federal
Energy Regulatory Commission. Washington, D.C. Retrieved from
<https://www.ferc.gov/industries/hydropower/gen-info/licensing/licen-pro.asp>.
Federal Energy Regulatory Commission. (2014, February). “Pumped Storage Projects.” Federal
Energy Regulatory Commission. Washington, D.C. Retrieved from
<http://www.ferc.gov/industries/hydropower/gen-info/licensing/pump-storage.asp>.
Freris; Infield. (2008). Renewable Energy in Power Systems. West Sussex, United Kingdom.
John Wiley & Sons, Ltd.
Houghtalen; Akan; Hwang. (2010). Fundamentals of Hydraulic Engineering Systems. Upper
Saddle River, NJ. Pearson Higher Education.
HydroCoil Power, Inc. (2014). “HydroCoil ® Turbine for Micro Hydro Electric Power
Generation.” HydroCoil Power, Inc. Retrieved from
<http://www.hydrocoilpower.com/3technology.html>.
Johnson. (2013, September 9). Upper Blackstone Pollution Abatement District. Personal
Interview.
Massachusetts Water Resources Authority. (2014). “Appendix 10: Expected Useful Life of
Capital Projects.” Massachusetts Water Resources Authority. Boston, MA. Retrieved
from <http://www.mwra.com/finance/cip/fy14final/appendix10.pdf>.
Massachusetts Water Resources Authority. (2013, July). “Renewable and Sustainable Energy
Initiatives at Deer Island.” Massachusetts Water Resources Authority. Boston, MA.
Retrieved from <http://www.mwra.state.ma.us/03sewer/html/renewableenergydi.htm>.

41
O’Brien. (2013, September 25). Massachusetts Water Resources Authority. Email interview.
O’Donnell. (1876). The City of Holyoke, Its Water Power and Its Industries, Holyoke,
Massachusetts, U.S.A., 1876. Springfield, MA. Clark W. Bryan & Co. Retrieved from
<http://www.holyokemass.com/hwp_1876/tex2.html>.
Panchal. (2013, November 9). Voith Siemens. Email Interview.
PowerPal. (2014). “PowerPal Low Head.” PowerPal. Retrieved from
<http://www.powerpal.com/lowhead.html>.
Prakash. (2014). "Hydraulics and Hydraulic Modeling." Jawaharlal Nehru National College of
Engineering. Shimoga, Karnataka, India . Retrieved from
<http://elearning.vtu.ac.in/P6/enotes/CV44/Reac_Tur-MNSP.pdf>.
Site Based Energy. (2014). “Hydroelectric Generation at Wastewater Treatment Plants.” Site
Based Energy. Retrieved from
<http://www.sitebasedenergy.com/company/partnerships/hydrogen>.
Solar Energy Industries Association. (2014). “Net Metering.” Solar Energy Industries
Association. Washington, D.C. Retrieved from <http://www.seia.org/policy/distributed-
solar/net-metering>.
Toshiba Corporation; Toshiba Engineering Corporation. (2014). “Hydro-eKIDS: Micro Hydro
Power Generating Equipment.” Toshiba Corporation; Toshiba Engineering Corporation.
Tokyo, Japan. Retrieved from
<http://www.tic.toshiba.com.au/product_brochures_and_reference_lists/ekids.pdf>.
U.S. Army Corps of Engineers. (2014). “Building Strong at Bonneville Lock and Dam.” U.S.
Army Corps of Engineers. Portland District, Portland, OR. Retrieved from
<http://www.nwp.usace.army.mil/Locations/ColumbiaRiver/Bonneville.aspx>.
U.S. Department of Energy. (2011, September). “History of Hydropower.” U.S. Department of
Energy. Washington, D.C. Retrieved from
<http://www1.eere.energy.gov/water/hydro_history.html>.
U.S. Department of Energy. (2011, September). “History of Wind Energy.” U.S. Department of
Energy. Washington, D.C. Retrieved from
<http://www1.eere.energy.gov/wind/wind_history.html>.
42
U.S. Department of Energy. (2014). “Types of Hydropower Turbines.” U.S. Department of
Energy – Office of Energy Efficiency & Renewable Energy. Washington, D.C. Retrieved
from <http://energy.gov/eere/water/types-hydropower-turbines>.
U.S. Department of Energy; Interstate Renewable Energy Council; North Carolina Solar Center.
(2013, March 19). “Commonwealth Hydropower Program.” Database of State Incentives
for Renewables & Efficiency. U.S. Department of Energy; Interstate Renewable Energy
Council; North Carolina Solar Center. Boston, MA. Retrieved from
<http://www.dsireusa.org/incentives/incentive.cfm?Incentive_Code=MA90F&re=1&ee=
1>.
U.S. Department of Energy; Interstate Renewable Energy Council; North Carolina Solar Center.
(2013). “Net Metering.” Database of State Incentives for Renewables & Efficiency. U.S.
Department of Energy; Interstate Renewable Energy Council; North Carolina Solar
Center. North Carolina State University. Raleigh, NC. Retrieved from
<http://www.dsireusa.org/incentives/incentive.cfm?Incentive_Code=MA01R>.
U.S. Energy Information Administration. (2013). “AEO2014 Early Release Overview.” U.S.
Department of Energy. Washington D.C. Retrieved from
<http://www.eia.gov/forecasts/aeo/er/early_elecgen.cfm>.
U.S. Energy Information Administration. (2012, September). “Annual Energy Review 2011.”
U.S. Department of Energy – Office of Energy Statistics. Washington, D.C. Retrieved
from <http://www.eia.gov/totalenergy/data/annual/pdf/aer.pdf>.
U.S. Energy Information Administration. (2011). “Annual Energy Review 2011: Renewable
Energy as Share of Total Primary Energy Consumption, 2011.” U.S. Department of
Energy. Washington, D.C. Retrieved from
<http://www.eia.gov/totalenergy/data/annual/?src=Consumption-f6#consumption>.
U.S. Energy Information Administration. (2011). “Primary Energy Consumption by Source and
Sector, 2011.” U.S. Department of Energy. Washington, D.C. Retrieved from
<http://www.eia.gov/totalenergy/data/annual/?src=Consumption-f6#consumption>.
U.S. Environmental Protection Agency–New England. (2011, September). “Municipally Owned
Wastewater Treatment Facilities In New England.” U.S. Environmental Protection
Agency–New England. Boston, MA.

43
Union of Concerned Scientists. (2002, October). “The Hidden Cost of Fossil Fuels.” Union of
Concerned Scientists. Cambridge, MA. Retrieved from
<http://www.ucsusa.org/clean_energy/our-energy-choices/coal-and-other-fossil-fuels/the-
hidden-cost-of-fossil.html>.
United States Environmental Protection Agency. (2013, August). “Renewable Energy Fact
Sheet: Low-Head Hydropower from Wastewater.” United States Environmental
Protection Agency. Washington, D.C. Retrieved from
<http://water.epa.gov/scitech/wastetech/upload/Low-Head-Hydropower-from-
Wastewater.pdf>.
Upper Blackstone Water Pollution Abatement District. (2012). “Annual Report: Fiscal Year
2012.” Upper Blackstone Water Pollution Abatement District. Millbury, MA. Retrieved
from <http://www.ubwpad.org/news/Final%20signed%202012%20Report.pdf>.
Upper Blackstone Water Pollution Abatement District. (2013). “Upper Blackstone Water
Pollution Abatement District.” Upper Blackstone Water Pollution Abatement District.
Millbury, MA. Retrieved from <http://www.ubwpad.org/index.html>.
Voith Siemens Hydro. (2008, April). “Micro tubular turbines.” Voith Siemens Hydro.
Heidenheim, Germany. Retrieved from
<http://www.matec.com.ph/documents/Micro_Tubular_Turbines.pdf>.
Waier. (2011). Building Construction Cost Data 2011. R.S. Means Co., Inc.

44
Appendix A: Deer Island Electricity Usage

45
Given:
Total MWRA yearly electricity consumption: 168,500,000 kWh
Percentage of total electricity consumption used by Deer Island: 70%
Deer Island yearly hydropower generation: 6,000,000 kWh
Deer Island yearly electricity consumption:
Deer Island hydropower contribution to total MWRA consumption:
Deer Island hydropower contribution to total Deer Island consumption:

46
Appendix B: Massachusetts Municipal Wastewater Treatment Plants
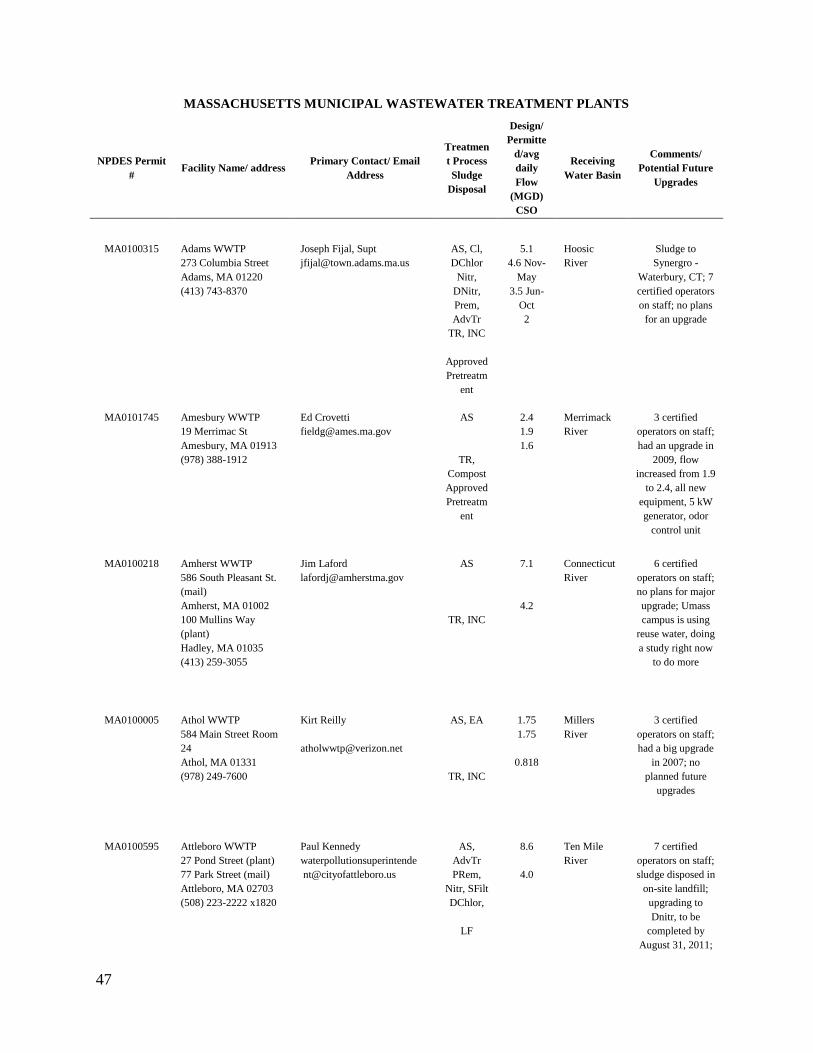
47
MASSACHUSETTS MUNICIPAL WASTEWATER TREATMENT PLANTS
NPDES Permit
# Facility Name/ address
Primary Contact/ Email
Address
Treatmen
t Process
Sludge
Disposal
Design/
Permitte
d/avg
daily
Flow
(MGD)
CSO
Receiving
Water Basin
Comments/
Potential Future
Upgrades
MA0100315 Adams WWTP Joseph Fijal, Supt AS, Cl, 5.1 Hoosic Sludge to
Synergro -
Waterbury, CT; 7
certified operators
on staff; no plans
for an upgrade
273 Columbia Street [email protected] DChlor 4.6 Nov- River
Adams, MA 01220
Nitr, May
(413) 743-8370 DNitr,
Prem,
3.5 Jun-
Oct
AdvTr
TR, INC
Approved
Pretreatm
ent
2
MA0101745 Amesbury WWTP Ed Crovetti AS 2.4 Merrimack 3 certified
operators on staff;
had an upgrade in
2009, flow
increased from 1.9
to 2.4, all new
equipment, 5 kW
generator, odor
control unit
19 Merrimac St [email protected]
1.9 River
Amesbury, MA 01913
1.6
(978) 388-1912
TR,
Compost
Approved
Pretreatm
ent
MA0100218 Amherst WWTP Jim Laford AS 7.1 Connecticut 6 certified
operators on staff;
no plans for major
upgrade; Umass
campus is using
reuse water, doing
a study right now
to do more
586 South Pleasant St.
(mail)
River
Amherst, MA 01002
4.2
100 Mullins Way
(plant)
TR, INC
Hadley, MA 01035
(413) 259-3055
MA0100005 Athol WWTP Kirt Reilly AS, EA 1.75 Millers 3 certified
operators on staff;
had a big upgrade
in 2007; no
planned future
upgrades
584 Main Street Room
1.75 River
Athol, MA 01331
0.818
(978) 249-7600
TR, INC
MA0100595 Attleboro WWTP Paul Kennedy AS, 8.6 Ten Mile 7 certified
operators on staff;
sludge disposed in
on-site landfill;
upgrading to
Dnitr, to be
completed by
August 31, 2011;
27 Pond Street (plant) waterpollutionsuperintende AdvTr
River
77 Park Street (mail) [email protected] PRem, 4.0
Attleboro, MA 02703
Nitr, SFilt
(508) 223-2222 x1820
DChlor,
LF
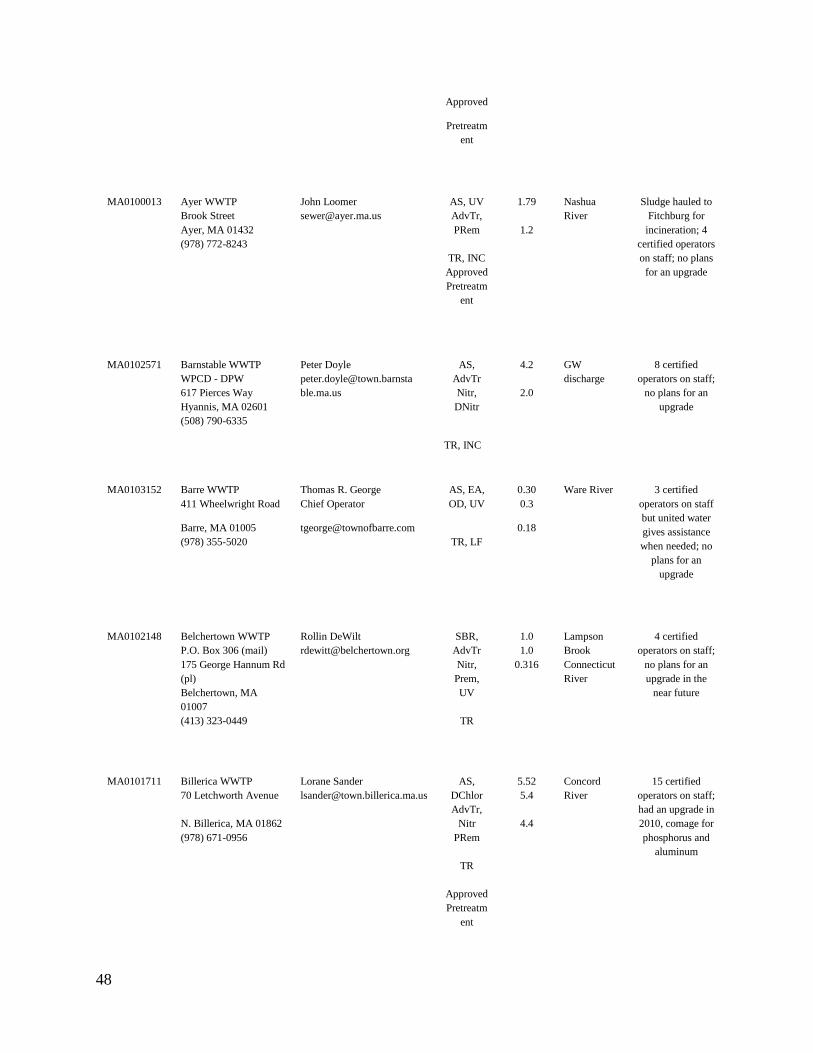
48
Approved
Pretreatm
ent
MA0100013 Ayer WWTP John Loomer AS, UV 1.79 Nashua Sludge hauled to
Fitchburg for
incineration; 4
certified operators
on staff; no plans
for an upgrade
Brook Street [email protected] AdvTr,
River
Ayer, MA 01432
PRem 1.2
(978) 772-8243
TR, INC
Approved
Pretreatm
ent
MA0102571 Barnstable WWTP Peter Doyle AS, 4.2 GW 8 certified
operators on staff;
no plans for an
upgrade
WPCD - DPW [email protected] AdvTr
discharge
617 Pierces Way ble.ma.us Nitr, 2.0
Hyannis, MA 02601
DNitr
(508) 790-6335
TR, INC
MA0103152 Barre WWTP Thomas R. George AS, EA, 0.30 Ware River 3 certified
operators on staff
but united water
gives assistance
when needed; no
plans for an
upgrade
411 Wheelwright Road Chief Operator OD, UV 0.3
Barre, MA 01005 [email protected]
0.18
(978) 355-5020 TR, LF
MA0102148 Belchertown WWTP Rollin DeWilt SBR, 1.0 Lampson 4 certified
operators on staff;
no plans for an
upgrade in the
near future
P.O. Box 306 (mail) [email protected] AdvTr 1.0 Brook
175 George Hannum Rd
(pl)
Nitr,
Prem,
0.316 Connecticut
River
Belchertown, MA
01007
UV
(413) 323-0449
TR
MA0101711 Billerica WWTP Lorane Sander AS, 5.52 Concord 15 certified
operators on staff;
had an upgrade in
2010, comage for
phosphorus and
aluminum
70 Letchworth Avenue [email protected] DChlor
AdvTr,
5.4 River
N. Billerica, MA 01862
Nitr 4.4
(978) 671-0956
PRem
TR
Approved
Pretreatm
ent

49
MA0100641 Bridgewater WWTP Jonas Kazlauskas RBC, 1.44 Town River 6 certified
operators on staff;
currently waiting
for permits from
EPA to make
changes
100 Morris Avenue jkazlauskas@bridgewater AdvTr
Madfield
Bridgewater, MA 02324 ma.org Nitr,
DChlor
0.977 River
Taunton
(508) 697-0937
Compost
River
(508) 697-0910
MA0101010 Brockton WWTP Robert Bacher, proj AS, UV, 18 Salisbury 18 certified
operators on staff;
has been doing 5
years of upgrades;
plant operates well
303 Oak Hill Way manager Prem, 18 Plain River
Brockton, MA 02301 robert.bacher@veoliawater AdvTr 17.2
(508) 580-7885 .na.com Nitr, SFilt
INC, LF
Approved
Pretreatm
ent
MA0103101 Charlemont WWTP Dawn Peters SFilt 0.05 Deerfield 2 certified
operators on staff;
last major upgrade
was in 1998; put
in a solar system
in 2004; no plans
for an upgrade
20 Factory Rd [email protected] UV
River
P.O. Box 137
.02 - .025
Charlemont, MA 01339
TR, INC
(413) 339-5767
MA0102598 Charles River PCD Chari Cousens AS, PT 5.7 Charles Sludge hauled to
an incinerator by
Sinegro; 6
certified operators
on staff; currently
doing a capital
improvement
plans
66 Village Street [email protected] AdvTr, 5.7 River
Medway, MA 02053 et Sfilt, 4.5
(508) 533-6762
Prem, Cl,
Nitr,
DChlor
cloth
filtration
TR, INC
Approved
Pretreatm
ent
MA0101141 Charlton WWTP Sandra Dam, Supt RBC, UV 0.45 Cady Brook Sludge hauled to
upper Blackstone
plant for
incineration
37 Main Street (mail) Jody St. George, Ch Op AdvTr,
Quinebaug
7 Worcester Rd (plant) water.sewer@townofcharlton.
net
Nitr
PRem
River
Charlton, MA 01507
(508) 248-4699
TR, INC
MA0100021 Chatham WPCF Michael B. Keller AS, EA 0.25 GW 3 certified
operators on staff
and 1 pending
operator; currently
going through an
upgrade, flow will
221 Crowell Rd [email protected] AdvTr, 0.15 discharge
Chatham, MA 02633
Nitr, 0.11
59 Sam Ryders Rd
DNitr
West Chatham, MA
02669
TR , LF

50
(508) 945-5153
be upgraded to 1.0
MGD, also all
processes are
going to be
upgraded
MA0101508 Chicopee WWTP Thomas Shea PT, AS 15.5 Connecticut Installed 15MG
CSO by-pass
facility w/Cl &
DChlo to deal with
32 CSOs in
system; permitted
for 25MGD to
secondary
treatment plus an
additional 10MGD
to CSO, $1 million
a month on CSO
project; small
pump station
upgrades
80 Medina Street [email protected] POXF, Cl 25 River
Chicopee, MA 01013
8
(413) 594-3585
TR
Approved
Pretreatm
ent
CSO
facility
MA0100404 Clinton (MWRA)
WWTP
John Riccio TFilt,
AdvTr
3.0 South
Branch of
7 certified
operators on staff;
1 new generator so
now plant can run
on 100% backup
power; has had
some plant
upgrades, bubble
diffuser in
aerators, 2
submersive pumps
into influent and
intermediate net
wells (can pump
3.5 million gal), 3
on influent and 3
for effluent,
upgrade digesters,
designing for new
valves and mixing
system
677 High Street [email protected] PRem,
Nashua
Clinton, MA 01510
Nitr, AS, 2.6 River
(978) 365-7024
DChlor
TR, LF
Approved
Pretreatm
ent
MA0100285 Cohasset WWTP Joseph Hughes Proj Mng AS, UV 0.4 Cohasset Sludge hauled to
Brockton and
incinerated; 2
certified operators
on staff and 1 part
time; operates as
part of united
water; no plans for
an upgrade
43 Rear Elm Street
(plant)
om
Mfilt,
SBR
0.3
Harbor
P.O. Box 253 (mail) Steven Cushing, sup Nitr, 0.22
Cohasset, MA 02025 steven.cushing@united DNitr
(781) 383-1519 water.com TR, INC,
LF
MA0100668 Concord WWTF Mike Thompson TFilt, UV 1.2 Concord Sludge hauled via
Up Blackstone and
inc; comage
509 Bedford Street Chief Operator AdvTr, 1.2 River
Concord, MA 01742 mthompson@woodwardcu PRem 1.1

51
(978) 371-7174 rran.com TR, INC
process
technology for
phosphorus
removal; had an
upgrade 2007; no
plans for an
upgrade
(978) 371-6310 (fax)
MA0101605 Dartmouth WPCF Carlos M. Cardoso AS, UV 4.2 Buzzards 11 certified
operators on staff;
currently doing a
condition survey
report; hired
engineers for a
comprehensive
facility study;
going to do a 3
stage plant
upgrade
759 Russells Mills Road [email protected]
a.us
Bay
Dartmouth, MA 02748
2.5
(508) 999-0740x214
COMP
MA0103284 Deer Island (MWRA)
WWTP
Dan O'Brien, Director & chief
operator
AS, POxF 361 MA Bay Sludge converted
to fertilizer pellet;
47 treatment ops
staff and 20
process control
support staff; 5
permitted CSOs in
system;
undergoing long
term CSO plan
190 Tafts Avenue [email protected] Cl, PT, 1270
Winthrop, MA 02152 a.us Dchlor max
(617) 660-7601 David Duest, Mgr Pelletizat
(617) 660-7870 [email protected] ion
TR, LAPP
Approved
Pretreatm
ent
365
CSO
facility
MA0101095 Douglas WWTP Robert Sullivan SBR 0.60 Mumford 4 certified
operators on staff;
no plans for an
upgrade
Charles Street [email protected]
River
P.O. Box 624
0.2 Upper
East Douglas, MA
01516
TR, INC
Blackstone
River
(508) 476-2400
MA0101478 Easthampton WWTP Carl Williams AS, 3.8 Manhan POTW has 2
separate outfalls;
Senegro hauls
sludge to
incinerator; 7
certified operators
on staff; small
upgrades to the
plant; 10 stations
by the end of 2011
will be portable
generator
accessible
10 Gosselin Drive [email protected] DChlor
River
Easthampton, MA
01027
1.75 Connecticut
River
(413) 529-1426
TR, INC
Approved
Pretreatm
ent
MA0101303 Edgartown WWTP Joe Alasso AS, EA, 0.75 GW 5 certified
operators on staff;
currently looking
at TOC upgrade
West Tisbury Road [email protected] OD
discharge
P.O. Box 1068
AdvTr, 0.2
Edgartown, MA 02539
Nitr
(508) 627-5482
DNitr,
UV

52
TR,
COMP
MA0101516 Erving POTW #1 Arthur Pace AS, UV 1.02 Millers Sludge hauled to
Fitchburg, 100%
organic sludge; 3
certified operators;
upgrade complete
in 2009
16 Public Works
Boulevard
[email protected] DChlor
River
Erving, MA 01344
0.18
(413) 659-3354
TR, INC
Approved
Pretreatm
ent
MA0101052 Erving Center WWTP Peter Coleman, gen op AS, EA, 3.15 Millers Sludge is hauled
by Northeast
Organics, sludge is
composted to fiber
clay and then is
put in steep slopes;
7 certified
operators on staff;
does small
upgrades
97 East Main Street [email protected] AL
River
Erving. MA 01344 pcoleman@ervingpapermill
1.86
(413) 422-2700 x299 .com TR,
(413) 422-2720
COMP
Approved
Pretreatm
ent
MA0100765 Fairhaven WPCF Linda L. Schick AS, UV 5.0 Acushnet 12 certified
operators on staff;
currently working
on a sludge
digester
5 Arsene Street [email protected]
River
Fairhaven, MA 02719 et
3.0
(508) 979-4031
TR, INC
MA0100382 Fall River Regional
WWF
Marc Laferriere AS, POx 30.9 Mt. Hope
Bay
19 CSOs within
system; about 60%
of staff is certified;
pump stations are
being upgraded to
include SCADA;
Contract Ops
1979 Bay Street marc.laferriere@violawater DChlor
Fall River, MA 02724 na.com
23-24
(508) 672-4530
TR, INC,
LF
CSO
facility
Approved
Pretreatm
ent
GW discharge
permit 3-168
Falmouth WWTP Charles Pires, ch op SBR, 1.20 GW Sludge is hauled to
Cranston, RI
POTW for
incineration; 6
certified operators
on staff
(154 Blacksmithshop
Road)
[email protected] DNitr
UV
0.81 Discharge
416 Giford St (mail)
0.4
Falmouth, MA 02540
TR, INC
(508) 540-9437
MA0100986 Fitchburg East WWTP Joseph Schneider AS, 12.4 Nashua 22 CSOs within
system; planning
CSO
improvements; 11
certified operators
on staff; just
started a chemical
enhancement
upgrade,
construction will
start at the end of
718 Main Street (office) [email protected] AdvTr
Nitr,
River
Lanidies Lane (plant)
PRem 7.7
Fitchburg, MA 01420
Cl, CSO
(978) 353-2304
DChlor
INC
Approved
Pretreatm
ent
facility

53
2011/ beginning of
2012
MA0100994 Gardner WPCF John Cormier AS, TFilt, 5.0 Otter River Jan 2006 did a
pilot with
polyaluminum
hydroxychlorides
for a possible
removal upgrade
for phosphorus
and copper
removal
52 Plant Road [email protected] Nitr,
Templeton, MA 01438 m PRem 4.0
(508) 632-4137
DChlo,
AdvTr
TR, LF,
COMP
Approved
Pretreatm
ent
MA0100102 Gilbertville WPC Joseph Farrell AS, EA 0.2 Ware River 2 certified
operators on staff;
main pump station
is going through
an upgrade, new
generator at the
station; plant is old
and aging and
needs an upgrade
in the future
(Hardwick WPC) [email protected]
0.243
P.O. Box 147 et
0.23
Old Mill Rd
TR, INC
Gilbertville, MA 01031
(413) 477-6959
MA0102430 Gilbertville-
Wheelwright WPCF
Joseph Farrell SBR 0.043 Ware River 2 certified
operators on staff;
had a complete
plant upgrade in
2009 to a SBR
facility; Hardwick
employs; possibly
pump station
upgrade in the
future
Pase St. P.O. Box 147 [email protected]
Gilbertville, MA 01031
0.016
(413) 477-6959
TR, INC
MA0100625 Gloucester WPCF PT 7.24 Atlantic
50 Essex Avenue
Ocean
Gloucester, MA 01930
Mass Bay
(978) 281-3741
TR,
Compost
CSO
facility
Approved
Pretreatm
ent
MA0101311 Grafton WWTP Chuck Bohaboy AS 2.4 Blackstone 5 certified
operators on staff;
no plans for an
upgrade
9 Depot Street
River
South Grafton, MA
01560
1.8
(508) 839-8526
TR, INC
MA0101524 Great Barrington
WWTP
Timothy Drumm AS,
DChlor
3.65 Housatonic
River+F261
4 certified
operators on staff;
by 2017 the plant
will be upgraded,
will include
Nitrogen and
100 Bentley Road [email protected] Cl
Great Barrington, MA
01230
1.0
(413) 528-0650
TR, INC

54
Approved
Pretreatm
ent
phosphate removal
M0100447 Greater Lawrence Richard S. Hogan AS 52.0 Merrimack Sludge heat dried
Class A biosolids;
wet weather
expansion to allow
treatment plant to
accept up to
135MGD; 5 CSOs
within system,
currently have
projects working
on CSO control;
18 certified
operators on staff;
Sanitary District Executive Director Cl, 52.0 River
240 Charles Street [email protected] DChlor 30
North Andover, MA
01845
TR
CSO
facility
(978) 685-1612
Approved
Pretreatm
ent
MA0101214 Greenfield WPCP Cliff Bassett, Supt TFilt, 3.5 Deerfield Sludge hauled to
Fitchburg for
incineration; 6
certified operators
on staff; had a
major upgrade in
1999, no plans for
a major upgrade in
future; looking
into alternative
sludge disposal
application
methods
384 Deerfield Street DChlor
River
Greenfield, MA 01301
3.187
(413) 772-1539
TR, INC
MA0100099 Hadley WWTP Dennis Pipczynski EA 0.54 Connecticut 3 certified
operators on staff;
in future may
possibly do some
upgrades to a
couple of pump
stations
230 South Middle Street [email protected]
River+F282
Hadley, MA 01035
0.4
(413) 585-0460
TR
MA0101290 Hatfield WWTP Brian McGraph RBC 0.5 Connecticut Liquid sludge is
hauled to
Fitchburg for
incineration; 1
certified operator
on staff; sewers
are being
extended; no plans
for a future
upgrade
260 Main Street [email protected]
0.38 River
Hatfield, MA 01038
0.18
(413) 247-9844
TR, INC
MA0101621 Haverhill WWTP Fred Haffty AS 18.1 Merrimack 11 certified

55
40 South Porter Street [email protected]
River operators on staff;
no plans for an
upgrade Haverhill, MA 01835
10.0
(978) 374-2382
TR, LF CSO
facility
Approved
Pretreatm
ent
MA0101630 Holyoke WWTP Mike Burke AS, POx 17.5 Connecticut 13 remaining
CSOs in the
collection system;
7 certified
operators on staff;
has under gone
several upgrades
recently including
new pumps, CSO
facility, bar racks,
odor control,
SCADA at pump
stations, and a full
upgrade on one of
the pump stations
One Berkshire Street
River
Holyoke, MA 01040
TR, LF 8.0
(413) 534-2222
Approved
Pretreatm
ent
CSO
facility
MA0100510 Hoosac WQD Bradley Furlon AS, 6.50 Hoosic 6 certified
operators on staff;
just had an
upgrade; with new
phosphorous limits
will need to
upgrade again, but
does not have funs
right not to do so
667 Simonds Road [email protected] PRem River
Williamstown, MA
01267
Cl, DChlo 3.5
(413) 458-8423
COMP
Approved
Pretreatm
ent
MA0102202 Hopedale WWTF Marcel Tremblay AS, PT, 0.588 Mill River Upgrades - Grit
washer, collection
system I&I
removal, RBCs for
enhanced
ammonia nitrogen
removal (or other
method), flow
pacing of chem
feed and ras rate; 3
backup ops
unlicensed
154 Mendon St (plant) [email protected] ST, UV
P.O. Box 7 (mail) m PRem, 0.38
Hopedale, MA 01747
Nitr
(508) 634-2210
TR
MA0101788 Hudson WWTF Anthony Marques TFilt, AS, 3.05 Assabet 4 certified
operators on staff;
just finished a
$161.5 million
upgrade
One Municipal Drive [email protected] AdvTr 3.0 River
Hudson, MA 01749 rg Nitr, 2
(978) 562-9333 [email protected] DNitr
(978) 568-9675
PRem,
DChlor
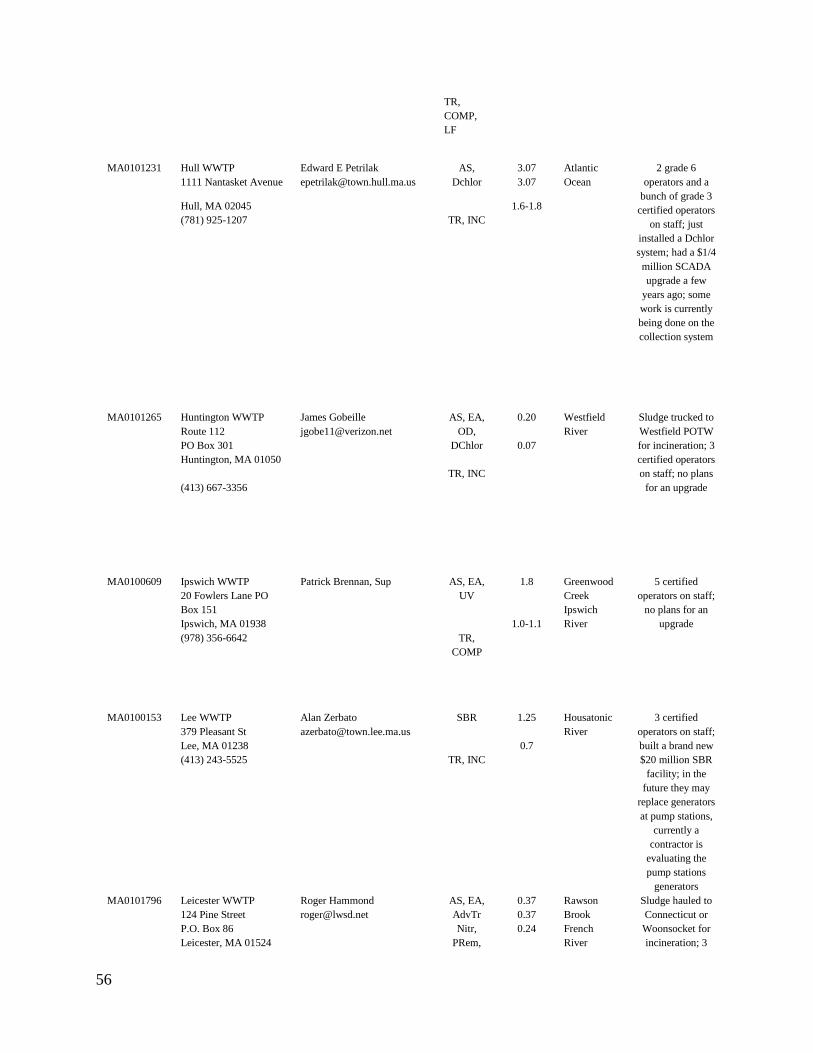
56
TR,
COMP,
LF
MA0101231 Hull WWTP Edward E Petrilak AS, 3.07 Atlantic 2 grade 6
operators and a
bunch of grade 3
certified operators
on staff; just
installed a Dchlor
system; had a $1/4
million SCADA
upgrade a few
years ago; some
work is currently
being done on the
collection system
1111 Nantasket Avenue [email protected] Dchlor 3.07 Ocean
Hull, MA 02045
1.6-1.8
(781) 925-1207
TR, INC
MA0101265 Huntington WWTP James Gobeille AS, EA, 0.20 Westfield Sludge trucked to
Westfield POTW
for incineration; 3
certified operators
on staff; no plans
for an upgrade
Route 112 [email protected] OD,
River
PO Box 301
DChlor 0.07
Huntington, MA 01050
TR, INC
(413) 667-3356
MA0100609 Ipswich WWTP Patrick Brennan, Sup AS, EA, 1.8 Greenwood 5 certified
operators on staff;
no plans for an
upgrade
20 Fowlers Lane PO
Box 151
UV
Creek
Ipswich
Ipswich, MA 01938
1.0-1.1 River
(978) 356-6642
TR,
COMP
MA0100153 Lee WWTP Alan Zerbato SBR 1.25 Housatonic 3 certified
operators on staff;
built a brand new
$20 million SBR
facility; in the
future they may
replace generators
at pump stations,
currently a
contractor is
evaluating the
pump stations
generators
379 Pleasant St [email protected]
River
Lee, MA 01238
0.7
(413) 243-5525
TR, INC
MA0101796 Leicester WWTP Roger Hammond AS, EA, 0.37 Rawson Sludge hauled to
Connecticut or
Woonsocket for
incineration; 3
124 Pine Street [email protected] AdvTr 0.37 Brook
P.O. Box 86
Nitr, 0.24 French
Leicester, MA 01524
PRem, River

57
(508) 892-8484
SFilt
certified operators
on staff; looking at
process changes,
aluminum
problem; currently
looking at
increasing the
amount of flow; it
is an old plant and
is looking to
upgrade in the
future, 1st upgrade
would be to the
headworks system,
possibly in Fiscal
Yr 2013 or 2014
TR, INC
MA0100935 Lenox Center WWTP Jeffrey White AS 1.8 Housatonic 1 CSO in system;
2 certified
operators on staff;
no plans for an
upgrade
239 Crystal St [email protected] Cl, 1.19 River
Lenox, MA 01242 om PRem 0.68
(413) 637-5547
TR, INC CSO
facility
MA0100617 City of Leominster
WPCF
Robert Chalifaux AS,
AdvTr
9.3 North
Branch
8 certified
operators on staff;
by the end of the
year beginning of
next year will be
able to have the
entire plant
operate on backup
power; currently
going through an
upgrade that
includes getting a
new generator at
the plant
436 Mechanic Street robert.chalifaux@veoliawat PRem,
Nashua
Leominster, MA 01453 erna.com Nitr
DChlor
5.29 River
(978) 537-5720
TR, INC
Approved
Pretreatm
ent
MA0100633 Lowell Regional WW
Utility
Mark A. Young PT, AS
Cl,
32 Merrimack
River
8 CSOs remain;
12 certified
operators on staff;
there is a plant
upgrade going on
right now; new
sludge disposal
contract in
October
451 First Street Blvd Rt
110
[email protected] DChlo
TR, LF
32
Lowell, MA 01850
INC 25
(978) 970-4248
Approve
CSO
facility
d
Pretreat
ment
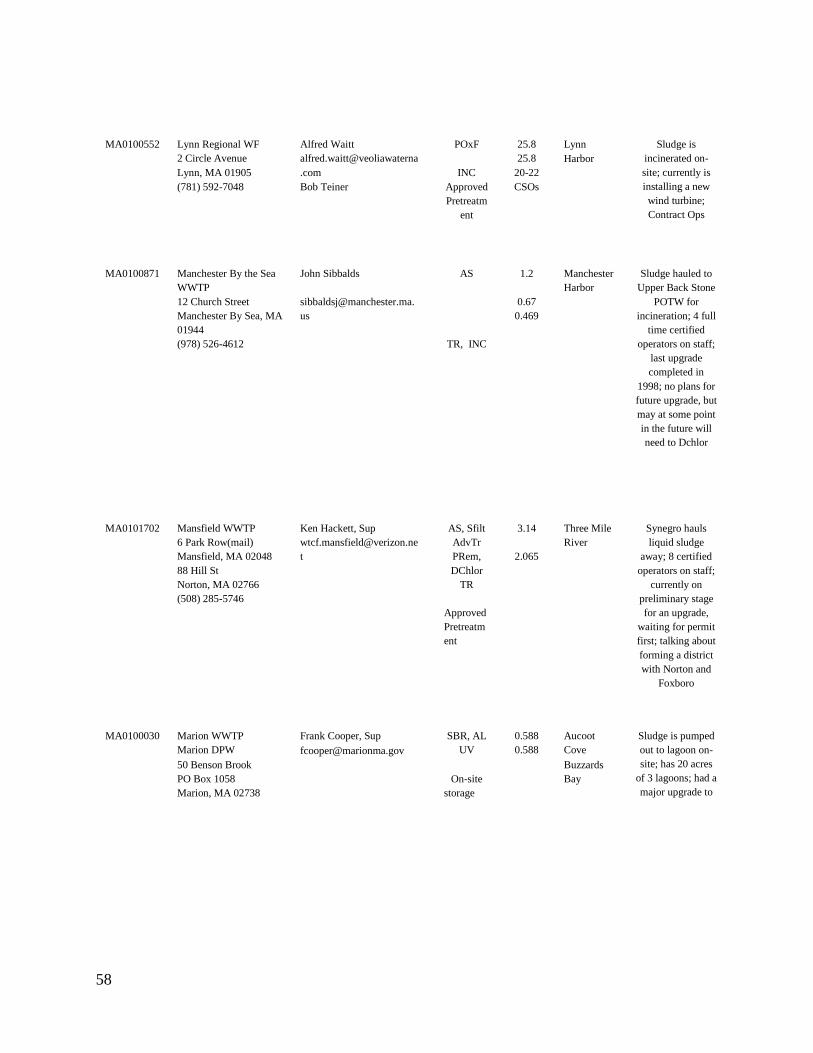
58
MA0100552 Lynn Regional WF Alfred Waitt POxF 25.8 Lynn Sludge is
incinerated on-
site; currently is
installing a new
wind turbine;
Contract Ops
2 Circle Avenue alfred.waitt@veoliawaterna
25.8 Harbor
Lynn, MA 01905 .com INC 20-22
(781) 592-7048 Bob Teiner Approved
Pretreatm
ent
CSOs
MA0100871 Manchester By the Sea
WWTP
John Sibbalds AS 1.2 Manchester
Harbor
Sludge hauled to
Upper Back Stone
POTW for
incineration; 4 full
time certified
operators on staff;
last upgrade
completed in
1998; no plans for
future upgrade, but
may at some point
in the future will
need to Dchlor
12 Church Street [email protected].
0.67
Manchester By Sea, MA
01944
us
0.469
(978) 526-4612
TR, INC
MA0101702 Mansfield WWTP Ken Hackett, Sup AS, Sfilt 3.14 Three Mile Synegro hauls
liquid sludge
away; 8 certified
operators on staff;
currently on
preliminary stage
for an upgrade,
waiting for permit
first; talking about
forming a district
with Norton and
Foxboro
6 Park Row(mail) [email protected] AdvTr
River
Mansfield, MA 02048 t PRem, 2.065
88 Hill St
DChlor
Norton, MA 02766
TR
(508) 285-5746
Approved
Pretreatm
ent
MA0100030 Marion WWTP Frank Cooper, Sup SBR, AL 0.588 Aucoot Sludge is pumped
out to lagoon on-
site; has 20 acres
of 3 lagoons; had a
major upgrade to
Marion DPW [email protected]
UV 0.588 Cove
50 Benson Brook
Buzzards
PO Box 1058
On-site Bay
Marion, MA 02738
storage

59
(508) 748-3540
an SBR facility in
2005; CDM
contract to
relevant I&I; will
be room in the
future for growth
of loading after
I&I is taken care
of; no plans right
now for an
upgrade
MA0100498 Marlborough East
WWTP
Scott Rossi AS,
AdvTr
5.5 Hop Brook 5 certified
operators on staff;
currently is at 30%
design for major
upgrade
860 Boston Post Road
East [email protected]
PRem,
Nitr
Sudbury
River
Marlborough, MA 01752
DChlor 2.8 - 3.0
(508) 624-6920
Compost
TR, LF
MA0100480 Marlborough West
WWTP
Harry Butland, Chief Op AS,
AdvTr
2.89 Assabet
River
4 certified
operators on staff;
is currently going
through an
upgrade, UV
improving
phosphorous;
waiting for permit
to see if they can
increase flow
303 Boundary Street hbutland@marlborough- PRem,
Marlborough, MA 01752 ma.gov
Nitr, UV 2.5
(508) 624-6919
COMP
Approved
Pretreatm
ent
MA0101737 Marshfield WWTF Kevin E. Silvia, Chief Op AS, EA 2.1 MA Bay 5 certified
operators on staff;
currently going
through an
aeration upgrade;
in the future will
do an effluent
pump and
screening upgrade,
has hired an
engineer and are in
the designing
phase
P.O. Box 268 [email protected] UV
Brant Rock, MA 02020
1.4
200 Joseph Dry Beeck
Way
TR, INC
Marshfield, MA 02050
(781) 834-5521
MA0101001 Maynard WWTP David Simmons RBC, 1.45 Assabet Liquid sludge is
hauled to Millbury
or Greater
Lawrence; 5
18 Pine Hill Road [email protected] AdvTr,
River
Maynard, MA 01754
PRem, 1.0
(978) 897-1020
DChlor

60
TR, INC
certified operators
on staff; just went
through generator
upgrade; comag
phosphorous
removal started in
March 2011, 60
day phos avg
0.0959
MA0100978 Medfield WWTP Peter Iofolla AS, EA, 1.52 Charles upgrades were
finished in 2003;
primary tank,
aeration tank,
diffused air, sec
clar, new sfil and
UV, new pump for
PRem, looking to
hire 1 or 2
additional
operators
99 Old Bridge Street
PT, SFilt
River
Medfield, MA 02052
PRem, 1.32
(508) 359-4533
AdTr, UV
(508) 359-6432 (fax)
TR, INC
MA0101150 Merrimac WWTP Barry Theriault AS, EA, 0.45 Merrimack 4 certified
operators on staff 50 Federal Way [email protected] OD
River
Merrimac, MA 01860
0.25-0.35
(978) 346-9988
TR,
Compost
MA0101591 Middleborough WWTP Todd Goldman, Sup PT, AS,
SFilt
2.16 Nemasket
River
5 certified
operators on staff
and 1 in training;
possible future
plant upgrade
Joe Ciaglo Lane
PRem, 2.16
Middleborough, MA
02346
Nitr, Cl
AdvTr,
1.2-1.4
(508) 946-2485
DChlo
TR, LF
Approved
Pretreatm
ent
MA0100579 Milford WWTP John Mainini RBC, 4.3 Charles Sludge is hauled
off site; 11
certified operators
on staff; no plans
for an upgrade at
this time
off Route 140
(Hopedale)
milfordwastewater@milford
ma.com
AdvTr,
TFilt,
River
P.O. Box 644
SFilt, UV, 3.5
Milford, MA 01757
PRem,
(508) 478-0059
Nitr
TR, LF
MA0100188 Monroe WWTP Norman Goodermote RBC, UV
Deerfield Seeking grant
money to upgrade
entire plant
Ecology Dr
0.018 River
Monroe, MA 01350
0.0085
(413) 424-8237
TR, LF
MA0100137 Montague WPCF Robert J. Trombley AS, Cl 1.83 Connecticut Currently sludge is
thickened and
hauled to Franklin
County; in the
future big be using
a new dewatering
34 Greenfield Road wpcfsupt@montague- ST 1.83 River
Montague, MA 01351-
9522
ma.gov
1.0
(413) 773-8865
TR, INC CSO
facility

61
Approved
Pretreatm
ent
system, a sludge
cake fernier rotary
press; 2 CSOs in
system, just
finishing a CSO
project; 5 certified
operators on staff
MA0100781 New Bedford WWTP John P. Caron AS,Cl, 75.0 Outer New Sludge hauled to
Woonsocket, RI
for incineration;
14 certified
operators on staff,
back up operators
from other plants
under Veolia
Water; waiting for
new EPA limits to
see if effluent limit
is changed
Contract Ops
1000 S. Rodney French
Blvd
m
DChlor 30 Bedford
Harbor
New Bedford, MA
24 Buzzards
(508) 991-6164
TR, INC
Bay
Approved
Pretreatm
ent
MA0101427 Newburyport WWTP Joseph Dugan, Ch Op AS 3.4 Estuary to Sludge hauled to
Ipswich for a
resource; 8
certified operators
on staff; currently
going through
phase 1 of a $29
million upgrade,
will have full
backup generator
capability,
SCADA upgrade
for the plant,
liquid sodium
hypochlorite is
used for Cl and
metabisulfite for
DChlor
157 Water Street jdugan@cityofnewburyport. Cl, Dchlo
Merrimack
Newburyport, MA 01950 com
2.34 River
(978) 465-4422
TR,
COMP
Approved
Pretreatm
ent
MA0101036 North Attleborough
WPCF
John K. Horton AS,
AdvTr
4.61 Ten Mile
River
6 certified
operators on staff;
big upgrade
coming up soon,
enhanced
phosphorous and
nitrogen removal
Cedar Rd (plant) jhorton@north- Nitr, 4.6
49 Whiting St (mailing)
attleboro.ma.us
PRem
SFilt, PT
3.3-3.5
North Attleboro, MA
02760
Cl, DChlo
(508) 695-7872
TR
Approved
Pretreatm
ent
MA0101061 North Brookfield
WWTP
Rodney S. Jenkins AS, EA,
UV
0.76 Forget-me-
not Brook
Sludge hauled via
Synagro for
incineration, 4 PO box 236 (mailing) [email protected] AdvTr,

62
59 East Brookfield Rd
plant
Nitr 0.375
certified operators
on staff; no plans
for an upgrade North Brookfield, MA
01535
TR, INC
(508) 867-0211
(508) 867-8196 (fax)
MA0101818 Northampton WWTF George Brehm AS 8.6 Connecticut Plant effluent
pump station
upgrade
33 Hockanum Road [email protected] 8.6 River
Northampton, MA 01060
4.5
(413) 587-1090
TR, LF
Approved
Pretreatm
ent
MA0100722 Northbridge WWTF Mark Kuras SBR, Nitr 2 Unnamed 4 certified
operators on staff;
future sludge
conditioning, new
holding tanks
644 Providence Road Superintendent PRem, 2 Brook
7 Main St (mail) mkuras@northbridgemass. UV 1.2 Blackstone
Whitinsville, MA 01588 org TR, INC
River
(508) 234-2154
MA0100200 Northfield WPCF Chuck Neveu AS, EA 0.275 Connecticut
104 Meadow Street [email protected]
River
Northfield, MA 01360
0.125
(413) 498-5116
TR, INC
Oak Bluffs WWTP Joseph Alosso SBR 0.37 GW 4 certified
operators on staff;
TOC upgrades;
currently adding
more nutrience,
250 gal/day more
Pennsylvania Avenue [email protected] AdvTr,
discharge
Oak Bluffs, MA 02557
Nrem, 0.1
(508) 693-0343
UV
TR
M0101940 Old Deerfield WWTF Donald Chappell AS, EA 0.25 Deerfield Sludge hauled to
Fitchburg for
incineration; 1
certified operator
on staff; no plans
for an upgrade
55 Little Meadow Road
(plant)
River
Old Deerfield, MA
01342
TR, INC 0.15
8 Conway Street
South Deerfield, MA
01373
(413) 774-4595
MA0101257 Orange WWTP Edward Billiel Jr AS, EA 1.1 Millers 3 certified
operators on staff;
looking at plant
upgrade but is
waiting for new
permit before
starting
295 West Main Street
(plant)
[email protected] Cl, PRem
River
PO Box 267 (mail)
0.9
Orange, MA 01364
TR, INC
(978) 544-1114
1-187 Tritown GWPC WWTP James Burgess RBC, UV 0.045 GW
Discharge
Sludge is hauled to
Yarmouth POTW
for composting
and landfill; 5
(Orleans/Brewster/Easth
am)
[email protected] SFilt, PT 0.045

63
P.O. Box 2773 (mail)
0.032
certified operators
on staff; for a year
has been doing a
sewer study; by
2015 this plant
will be shut down
and a new site will
be built to handle
60% of the towns
flow
29 Overland Way (plant)
TR,
COMP,
Orleans, MA 02653
LF
(508) 255-1150
MA0100170 Oxford-Rochdale SD
WPCP
Chief Operator/Supt AS, AE,
AL
0.5 French River 2 certified
operators on staff;
has redone 1 of
their 2 clarifiers so
they are both 45
28 Comins Rd (plant) Robert F. Wilson AdvTr, 0.5
PO Box 246 (mailing) [email protected] SFilt 0.253
Rochdale, MA 01542
Nitr,
(508) 892-9549
PRem
Cl, DChlo
TR, INC
MA0101168 Palmer WWTF Gerald Skowronek AS, 5.6 Chicopee All remaining
CSOs have been
blocked but has
until Dec 16th to
make sure there is
no cross
connection; 5
certified operators
on staff; just got
their permit and is
waiting for
nitrogen level
before an upgrade
One Norbell Street gerrys_palmerwwtp@yaho AdvTr
River
Three Rivers, MA 01080 o.com Prem
Cl, DChlo
1.6
(413) 283-2671
TR, INC CSO
facility
Approved
Pretreatm
ent
MA0100064 Pepperell WWTF Laurie Stevens AS, EA 1.1 Nashua 4 certified
operators on staff;
some sewer work
has been done; no
future upgrades
planned
P.O. Box 319 (mail) [email protected]. UV, 1.1 River
47 Nashua Rd (plant) ma.us PRem 0.5
Pepperell, MA 01463
(978) 433-9859
TR,
COMP
MA0101681 Pittsfield WWTP Thomas Landry, Sup TFilt, 17.0 Housatonic Sludge hauled to
Moretown, VT to
landfill; 14
certified operators
on staff; town is
doing an I&I
study; looking at
new backup power
to replace outdated
generators; in the
middle of a
SCADA project;
901 Holmes Road [email protected] AdvTr, 17.0 River
Pittsfield, MA 01201
Nitr, 12.0
(413) 499-9304
DChlor,
PT, Cl,
Prem
TR, LF
Approved
Pretreatm
ent

64
other upcoming
projects include
new barracks,
solar energy
project, a combine
heat and power
project, and going
to diffused air; in
the long term
primary basins and
grit collectoin
system need to be
upgraded, next 3-4
years
MA0100587 Plymouth WWTF Gary Frizzell SBR, 3.0 Plymouth Sludge in
thickened onsite
and the liquid
sludge is then
hauled to Cranston
RI for
incineration; 7
certified operators
on staff; in the
next few months is
going up to bid for
an additional
pump station on
Long Pond Rd,
about 50% of the
design has been
completed
131 Camelot Drive [email protected] Dchlor
Harbor &
Plymouth, MA 02360 h.ma.us TR, INC 1.7 GW
(508) 830-4159
Approved
Pretreatm
ent
discharge
MA0101923 Rockland WWTP John F. Loughlin, Supt AS, EA, 2.5 French No planned
upgrade at this
time but waiting
for permit
Contract Ops -
Aquaron operating
systems
587 R Summer Street [email protected] PT, Nitr, 2.5 Stream
PO Box 330
PRem 2.4
Rockland, MA 02370
Cl, DChlo
(781) 878-1964
AdvTr,
SIrr
TR,
COMP
Approved
Pretreatm
ent
MA0100145 Rockport WWTP Larry Wonson AS, EA 0.8 Sandy Bay 5 certified
operators on staff;
3 more generators
for pump stations;
has recently
updated most of
equipment so no
plans for an
upgrade
46 Pleasant Street [email protected]
Atlantic
Rockport, MA 01966
TR, 0.85 Ocean
(978) 546-7888
COMP
MA0100161 Royalston WPCF AS, EA 0.03 Millers Sludge hauled to
Templeton Blossom Street
River

65
South Royalston, MA
01374
POTW; planning
installation of new
generator (978) 249-3318
TR, LF
MA0100960 Russell Village WWTF Roger Bush, chief op AS, EA 0.24 Westfield
River
Sludge hauled to
Westfield POTW;
2 certified
operators and 1
part time operator;
no definite plans
for an upgrade just
some
maintenance;
some I&I work is
being done; an
engineer look at
the plant and come
up with a design,
but is too
expensive
200 Main Street [email protected] UV
P.O. Box 131
0.09
Russell, MA 01071
TR, LF
(413) 862-6215
MA0102873 Salisbury WWTF Jeff Ingalls AL, 1.3 Tidal creek 3 certified
operators on staff;
no plans for an
upgrade
125 Elm St [email protected] AdvTr
to
Salisbury, MA 01952
Nitr, UV, 0.75 Merrimack
(978) 465-4058
SFilt
River
On-site
Storage,
TR
MA0102695 Scituate WWTF Robert P. Rowland, DPW AS, 1.6 Title Ditch Sludge hauled to
Borne landfill; 5
certified operators
on staff; allocated
money and will
upgrade the
remaining pump
stations to
SCADA system;
phase 3 of an
expansion of the
collection system,
will be completed
by end of August
2011
161 Driftway Supervisor AdvTr
Herring
Scituate, MA 02066 [email protected] Nitr, 1.183 River
(781) 545-8736 a.us DNitr, UV
North River
TR, LF
Atlantic
Ocean
MA0101044 Shelburne Falls WWTF Daniel M. Fleuier AS, EA 0.25 Deerfield
River
Sludge disposed in
reed beds for
composting;
standby power
upgrade done; 2
certified operators
on staff; 2 reed
beds are scheduled
for emptying in
2013; had a
facility upgrade a
couple years ago
17 State Street (mail) [email protected]
16 Gardener Falls Rd
0.18
Shelburne Falls, MA
01370
COMP
(413) 625-2300
(413) 625-8571 (fax)

66
MA0100676 Somerset WWTF Frank D. Arnold AS 4.2 Taunton No upgrades
planned in near
future
116 Walker Street Harold Gracia DChlor
River
Somerset, MA 02725 [email protected]
3.7
(508) 646-2868
Compost
MA0101648 South Deerfield WWTP Donald Chappell AS, EA,
Cl
0.85 Connecticut
River
Sludge is hauled to
Fitchburg for
incineration; 2
certified operators
on staff; no plans
for an upgrade
150 Sunderland Road
(plant)
Chief Operator
8 Conway Street (mail) [email protected]
0.5
South Deerfield, MA
01373
TR, INC
(413) 665-2651
MA0100501 South Essex Sewerage
District
Harold G. Newhall AS, POx
DChlor
29.71 Salem
Harbor
Contract No. 04-1
upgrade
wastewater
treatment plant
underway;
residuals
management and
odor control
facilities; facility
has 6 chief
operators and 14
operators
50 Fort Avenue Executive Director
P.O. Box 989 [email protected] TR, LF 28.09
Salem, MA 01970
Approved
(978) 744-4550
Pretreatm
ent
MA0100455 South Hadley WWTP Melissa LaBonte -WPA AS, Cl 4.2 Connecticut 3 CSOs
remaining;
implementing a
plant and pump
station upgrade
which will go out
to bid around
March 2006
2 James Street Compliance Manager
River
Chicopee, MA 01020 Mike Cijka - Operations LF 2.5
(413) 538-5040
Approved
Pretreatm
ent
CSO
facility
MA0100901 Southbridge WWTP Paul A. Krasnecky AS, 3.77 Quinebaug 5 certified
operators on staff;
SCADA upgrade;
currently doing a
phosphorous
optimization to see
what the levels are
because of new
limits;
Contract Ops
P.O. Box 1020 (mail) paul.krasnecky@veoliawat AdvTr
River
83 Dresser Hill Rd
(plant)
erna.com PRem,
Nitr, Cl,
2.3
Southbridge, MA 01550
DChlor
BFilt, PT,
(508) 764-4927
ST
COMP
Approved
Pretreatm
ent
MA0100919 Spencer WWTP Mark Robidoux, Supt AS, 1.08 Cranberry 2 certified
operators on staff;
pump station
upgrade, just
started design, will
have some kind of
SCADA at the
plant
69 West Main Street [email protected] AdvTr
Brk
Spencer, MA 01562 v EA, UV 0.4 Seven Mile
(508) 885-7542
Nitr,
PRem
River
TR, INC
MA0101613 Springfield WWTP AS, 64 Connecticut Upgrading

67
Bondi’s Island
AdvTr
River SCADA and
biosolids process;
installing on-line
monitoring
equipment to track
CSOs
Route 5
DChlor,
Springfield, MA 01103
Nitr CSO
(413) 787-6256
TR,
COMP
Approved
Pretreatm
ent
Facility
MA0101087 Stockbridge WWTP Anthony Campetti Sr. AS, EA 0.48 Housatonic Liquid sludge in
hauled to
Fitchburg for
incineration (back
up to Millbury); 3
certified operators
on staff; will
upgrade in the
future if they are
given nitrogen
limits
#1 Rt 102 [email protected] UV, OD 0.3 River
Stockbridge, MA 01262 om PRem 0.18
(413) 298-4067
TR
MA0100421 Sturbridge WPCF Shane Moody AS, EA, 0.75 Quinebaug Sludge hauled to
Cranston WPCF
for INC; now
comage instead of
Sfilt and bimag for
aeration; 5
certified operators
on staff; upgrade
will be completed
by May 2012;
expecting NPDES
for Dec 1st 2011
P.O. Box 975 shane.moody@veoliawater AdvTr (1.4) River
New Boston Rd
Extension
na.com UV, Nitr,
PRem
0.75
0.644
Sturbridge, MA 01566
(508) 347-2513 or 2514
TR, INC
MA0101079 Sunderland WWTP Robert J. Garby AS, EA 0.5 Connecticut Sludge hauled to
Fitchburg WWTP
for incineration;
Changing from
Chlorine gas to
sodium
hypochlorite
113 River Road Chief Operator Cl
River
Sunderland, MA 01375 selectmen@townofsunderland
.us
0.185
(413) 665-1447
TR, INC
MA0100897 Taunton WWTP Darlene Domingos PT, AS, 9 Taunton 1 CSO remaining;
8 certified
operators on staff;
currently the city
is doing a
comprehensive
wastewater plan
for their CSO;
Contract Ops
825 West Water Street darlene.domingos@veoliawat
erna.com
Cl,
DChlor
8.4 River
Taunton, MA 02780
Nitr 7.2
(508) 823-3582
AdvTr,
TR, LF
CSO
Facility
Approved
Pretreatm
ent

68
MA0100340 Templeton WWTP Kent Songer SBR 0.6 Otter River 5 certified
operators on staff;
had an upgrade in
the fall of 2004;
has been doing
minor upgrades
including pump
station upgrades,
currently
upgrading the last
one
33 Reservoir St [email protected] UV
Baldwinville, MA
01436
0.253
(978) 939-2743
LF
MA0102369 Upper Blackstone
WPAD
T. K. Walsh RBC,
AdvTr
45 Blackstone
River
Been in a $180
million upgrade
since 2001, into
phase 3 of 4 for
construction,
phase 3 will be
completed by
2012; 1 CSO
remains, Adv Tr is
seasonal
treatment; 25
certified operators
on staff
50 Route 20 [email protected] Nitr,
Millbury, MA 01527-
2199
www.ubwpad.org DChlor
Prem
32
(508) 755-1286 [email protected] INC CSO
Facility
Approved
Pretreatm
ent
MA0100196 Upton WWTP Ronald San Souci, Sup AS, EA, 0.4 Unnamed Sludge hauled by
Synegro to
incinerator; 5
certified operators
that run both DW
&WW plants; no
plans for an
upgrade
43 Maple Avenue [email protected] Cl, Dchlo 0.4 Brook
West Upton, MA 01568
AdvTr,
PRem,
0.187-
0.23
West River
(508) 529-3993
Nitr, SFilt
TR, INC
MA0102440 Uxbridge WWTF William Buma AS, 2.5 Blackstone 4.5 certified
operators on staff;
waiting for permit
before making any
changes
80 River Road [email protected] AdvTr 2.5 River
Uxbridge, MA 01569
Nitr, 1.1
(508) 278-2887
PRem
TR, INC
MA0100889 Ware WWTP Scott Potter AS, EA, 1.0 Ware River Liquid sludge is
hauled away for
incineration; 3
certified operators
on staff; no plans
for an upgrade
30 Robbins Rd [email protected] AdvTr
Ware, MA 01082
Nitr, 0.628
(413) 967-9624
PRem
Chief Operator
DChlor
TR, INC

69
Approved
Pretreatm
ent
MA0101893 Wareham WPCF Guy Campinna, director AS, EA, 1.6 Agawam Finished upgrade
to UV, PRem and
controlled Nitr;
ERP plan is being
updated
6 Tony’s Lane [email protected] UV 1.56 River
Wareham, MA 02571
AdvTr, 1.1
(508) 295-6144
PRem
Nitr,
DNitr
TR, LF
MA010567 Warren WWTP Shawn Romanski RBC 1.5 Quaboag Sludge hauled to
Upper Blackstone
in Newbury; 3
certified operators
on staff; waiting
for new permit to
see if they need to
upgrade; capital
plan study was
done
PO Box 104 (mail) [email protected] Cl, Dchlo 1.5 River
2527 Main St. (plant)
0.316
West Warren, MA
01092
TR , INC
(413) 436-5796
MAW052725(
60-2)
Wayland/Sudbury
Septage
Leonard Leonardi RBC,
SFilt
0.033 GW
Discharge
Denitrification and
flow increase to
33,000 gpd;
comprehensive
evaluation &
preliminary design
submitted 1/31/06
Treatment Facility
DNitr
490 Boston Post Road
0.0245
Wayland, MA 01778
TR, INC
(508) 358-7328
MA0100439 Webster WWTF Harlan Hilton AS, 6.0 French 5 certified
operators on staff;
just completed an
active flow for
phosphorous
removal upgrade
38 Hill Street (plant) [email protected] AdvTr
River
P.O. Box 793 (mail)
Nitr,
Webster, MA 01570-
0793
DChlor
PRem
(508) 949-3865
TR, INC
Approved
Pretreat
ment
MA0100412 Westborough WWTF Chris Pratt AS, EA, 7.7 Assabet Comprehensive
WW management
plan on-going
238 Turnpike Road
OD, Nitr
River
Westborough, MA
01581
AdvTr,
SFilt,
(508) 366-7615
DChlor
PRem
TR, INC
Approved
Pretreatm
ent
MA0101800 Westfield WPCP Dave Billips AS, Cl, 6.1 Westfield Completed $21M
upgrade and 59 Court Street [email protected]. DChlor
River

70
Westfield, MA 01085 ma.us PRem 4.1
expansion 1/05
(413) 572-6268
Nitr,
DNitr
TR, LF
Approved
Pretreatm
ent
MA0100862 Winchendon WPCF Richard M. Pezzoles AS, EA, 1.1 Millers 2 certified
operators on staff;
had an upgrade in
2006
109 Front Street winchendonwwtp@verizon UV
River
(637 River Street) .net
0.6
Winchendon, MA
01475
TR, INC
(978) 297-0536
MA0103233 Woronoco Village
WWTF
Roger Bush ST, SFilt,
UV
0.021 Westfield
River
Sludge hauled to
Westfield POTW;
2.5 operators
shared with
Russell Village
WWTP; Sfilt sand
will be replaced
soon
200 Main Street [email protected]
P.O. Box 131
0.003
Russell, MA 01071
TR, LF
(413) 862-6215
Yarmouth-Dennis
Septage
Dave Bernier, project
manager
AS, EA,
OD
0.1 GW
discharge
Sludge hauled to
Maine for
composting; 4
certified operators
on staff; upgraded
treatment
processes to
include ozone and
tercerary; possible
upgrade, will be
decided in Sept
2011

71
Appendix C: UBWPAD Influent Flow Data

72
Table 15 - UBWPAD Wastewater Influent Flow Data
Date/Time Hour Hourly Flow
(MGD)
1/1/13 1:00 1 21.93750572
1/1/13 2:00 2 19.66189194
1/1/13 3:00 3 17.82133675
1/1/13 4:00 4 18.89783859
1/1/13 5:00 5 18.48766708
1/1/13 6:00 6 16.46675682
1/1/13 7:00 7 15.47485447
1/1/13 8:00 8 18.01708221
1/1/13 9:00 9 18.87311554
1/1/13 10:00 10 19.72144318
1/1/13 11:00 11 23.760355
1/1/13 12:00 12 22.36583328
1/1/13 13:00 13 31.47485924
1/1/13 14:00 14 31.40472221
1/1/13 15:00 15 26.69984055
1/1/13 16:00 16 31.51247978
1/1/13 17:00 17 26.17496109
1/1/13 18:00 18 24.0252018
1/1/13 19:00 19 24.67366409
1/1/13 20:00 20 27.4358902
1/1/13 21:00 21 23.00626373
1/1/13 22:00 22 21.57201576
1/1/13 23:00 23 19.61362648

73
Appendix D: Manufacturer Information

74
All information provided in this section was not altered in any way and was obtained from
Toshiba’s web site.
Turbine Specifications
Toshiba Hydro-eKIDS Product Range

75
Arrangements
Parallel Arrangement
This arrangement uses multiple units installed in parallel for when water discharge exceeds the
capacity of a single unit. Either unit can easily be started or stopped, depending on the available
flow.
Cascade Arrangement
Cascade arrangement uses multiple units installed in series when the available head exceeds
maximum head of a single unit. Every unit in the series shares water head equally.

76
Basic Installation
Since the turbine and generator are pre-set as a package, Hydro-eKIDS are easily installed on a
simple foundation and require only a small space for installation and no centering-work.
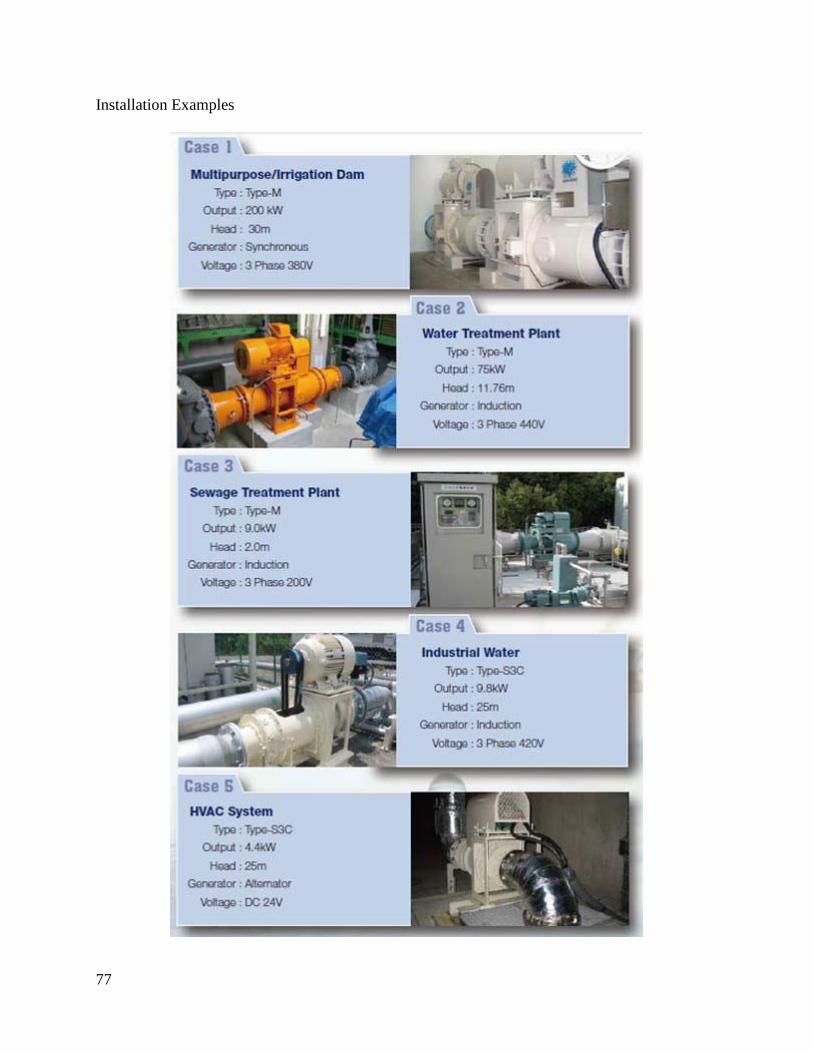
77
Installation Examples

78
Design Features
Runner & Guide Vanes
Optimum selection is selected with a number of: runner blades, adjusting runner blades and
guide vanes opening depending on site conditions such as head, discharge and cavitation.
Runner blades and guide vanes are made from stainless steel castings.
Generator
Optimum selection is a choice between induction and synchronous generators, depending if the
Hydro-eKIDS will be connecting to or independent from the grid.
Bearings are standard roller-type and lubricated with grease.
Turbine shaft
Turbine shaft is designed with vibration analysis by FEM and also static strength analysis so as
to withstand runaway speed such as that in large capacity turbines.
Turbine shaft is made of stainless steel.
Turbine bearing
The bearing system combines a tapered roller type which withstands axial thrust and radial load,
and cylindrical roller type for radial load.
Bearing is lubricated with oil of VG-46 or equivalent.
Shaft seal
Shaft seal is a mechanical type that self-lubricates with water.
Materials are ceramic or carbon.
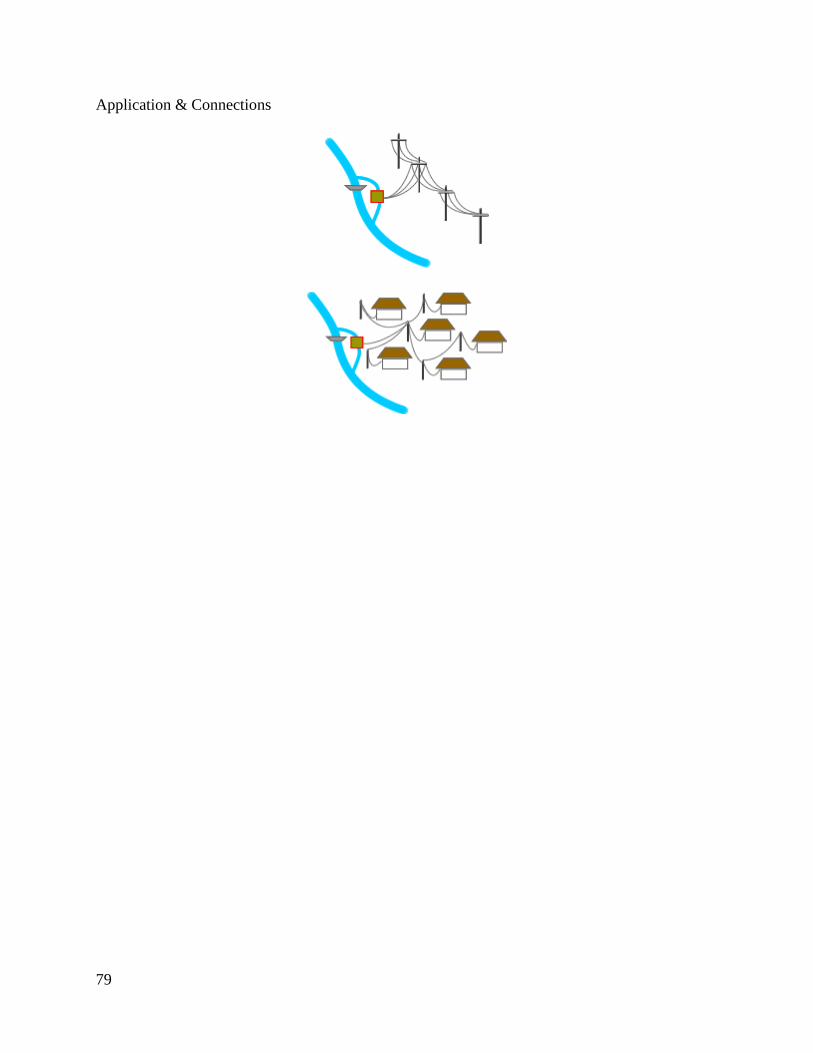
79
Application & Connections

80
Turbine Specifications
Energy Systems & Design

81

82
Turbine Specifications
PowerPal

83
Turbine Specifications
HydroCoil Power, Inc.

84

85

86
Turbine Specifications
Canyon Turbine

87

88
Appendix E: Solid Model Drawings

89

90

91

92
Appendix F: Hypothetical Case Tables

93
Table 16 - Potential Power Generation (kWh) of Hypothetical Flow and Head Cases
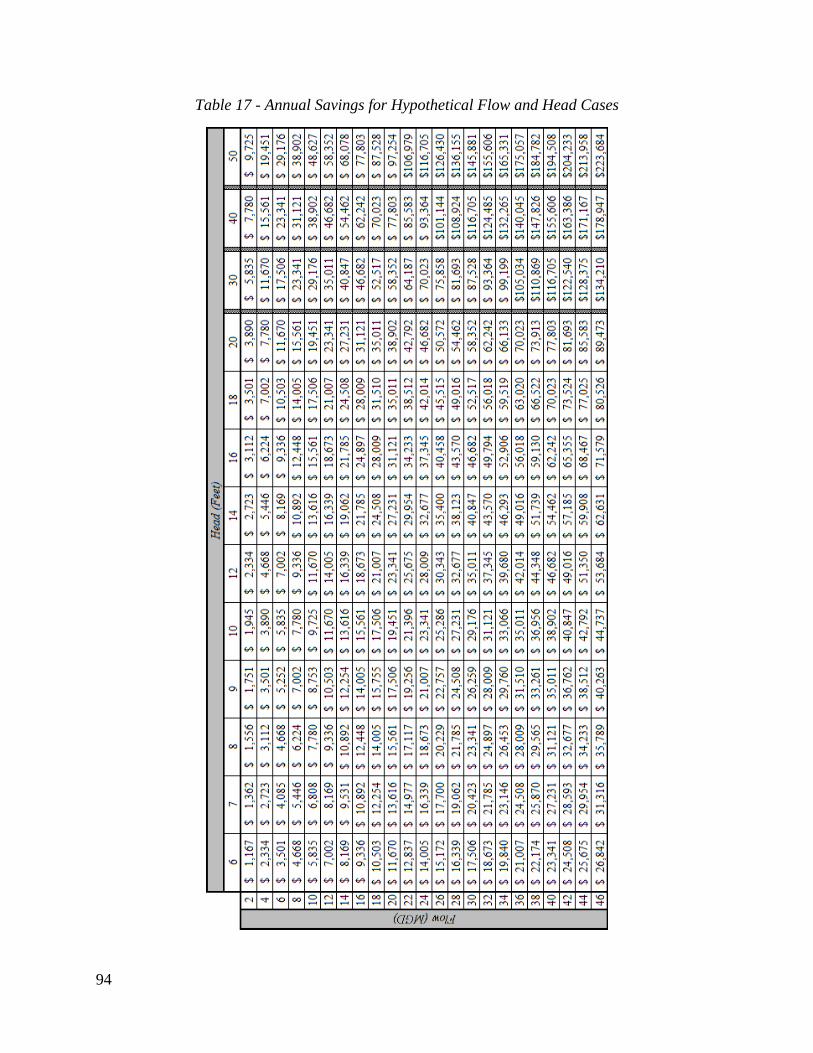
94
Table 17 - Annual Savings for Hypothetical Flow and Head Cases

95
Table 18 - Payback Periods (Years) of Hypothetical Flow and Head Cases