project safe haven - national weather...
TRANSCRIPT

Project Safe Haven:Tsunami Vertical Evacuation in
Washington State

Washington Tsunami Hazard Profile:
Local Source - Cascadia
~30-40 minutes before arrival of first wave
Extremely flat coastal topography coupled with long peninsulas
Majority of Coastal Communities Likely to be Flooded
Vulnerable Populations at RiskSeniorsChildrenEtc.
Untrained Tourist Population thatreaches 100k+ during summer

Tsunami Vertical Evacuation: Why Now?
Cascadia
Subduction
Zone

Ah ha!
Local
Earthquake!
High ground:
You CAN’T get
there from
here!
Bummer!
Current Situation:

Why Now?

Official Engineering/Planning Guidance

Pedestrian evacuation modeling
- Collaboration between WA
EMD, WA DNR, & USGS
- 2011 – Method
development
• Long Beach Peninsula case
study
- 2012 (potential) • Evacuation-time mapping
for entire Washington coast• Decision support tool for
safe haven planning
from Wood and Schmidtlein, Nat. Hazards, 2011

What’s at Risk on the Outer Coast of Washington State?
Populations:
• Residents: ~42,972
• Most 65+ years in age, many renters
• Employees: ~24,934
• Tourists: 100K+ during summer months
• State Parks: ~17,029 people (daily average)
• Other populations:
• Public venues and hotels
• Dependent-population facilities (schools, day cares, etc.)
Economy:
• 33% of workforce in tsunami inundation zone
• Businesses focus on tourism, social services, and manufacturing
Critical and Essential Facilities:
• High number of police stations, fire stations, public-work facilities
• High number of banks, government offices, and markets(Source: Wood &Soulard, 2008)

Project Safe Haven:• Community-based, ‘top-down’ planning approach (hint: the community is at the top)
• All options are on the table for consideration by community participants
•Community members provide 100% of the input, experts are on hand to answer technical questions and facilitate the planning and design meetings.
– After all, this should be the community’splan…
Common Themes:
• School safety!!!• Seniors and special needs populations• More conservative travel times – 15 min. instead of 30 min.• Requested more conservative estimates of elevations

Project Safe Haven Options (from FEMA 646):
Towers –• Limited Space• May Blocks Views• Few Options for Shelter
Buildings –• Expensive
• Better get it right the first time!• Very Large, Likely to Block Views• May require Private Development
• Incentives for Height?
Berms –• A Less Expensive Option• Can be Multi-Purpose• May be Placed to Limit View Blocking

Kick off Meeting with Local Emergency Manager
Community World Café Meeting
(Gather initial community input)
Alternatives Analysis (SWOT )
By Community Members
Community Development of Preferred Alternative
Urban Design Charrette with
Architects
Community Ranking of Locations & Final Plan Development
Safe Haven Planning Process
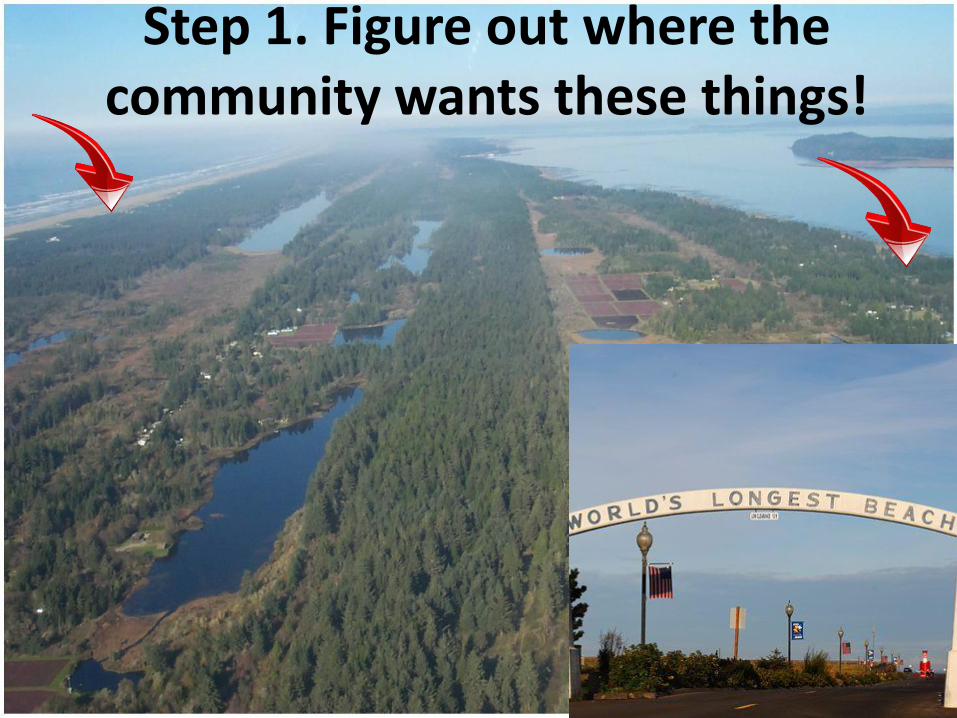
Step 1. Figure out where the community wants these things!

Preferred Strategy
• Five Berms Distributed Along Eastern Extent of
Community
• Potential Public BuildingDevelopment in Center of Town
•Permanent Residents Able to be Served by Structures
•Will accommodate tourists
1. City of Long Beach, WA

2. North Peninsula
Preferred Strategy• Focus on walking routes
• Natural high ground

3. Ilwaco/Seaview, WA
Preferred Strategy
•Abundant natural high ground in Ilwaco
• Vandalia subdivision
• Campgrounds
• Seaview – low elevation

Preferred Strategy
• Focus on towers
that can be used
for bird watching.
• Leverage casino
facility uses and
construct elevated
parking structure.
4. Tokeland/North Cove, WA

Grays Harbor Co. Evacuation Capacity Analysis
Map Number Structure Type Location
Minimumstructure
height Structure Capacity
1 Tower Ocean City 14 300
2 Tower Quinault Beach Resort 14 500
3 Berm North Beach Junior/Senior High School 10 800
4Parking Structure Downtown 10 1700
5 Tower or Berm Golf Course 10 350
6 Tower Ocean Shores Airport 10 350
7 Tower or Berm Ocean Shores Elementary 10 350
8 Tower Ocean Shores Blvd & Taurus Blvd SW 17 350
9 Tower or Berm Blue Wing Loop SE & Duck Lake Drive SW 10 350
10 Tower Cormorant St 10 350
11 Tower Ocean Shores Blvd & Marine View Drive SW 14 350
12 Tower Emeritus Senior Living 10 500
13 Tower Wowona Ave SE & Tonquin Ave SW 14 350
14 Tower or Berm Spinnaker Park 17 500
15 Tower or Berm Ocean City State Park Campground 14 350
16 TowerBetween Lake Bay Loop SE & Pearsall Street on Duck Lake Dr 10 350
17 Tower Trois Court & Inlet Avenue NW 10 350
18 Tower or Berm Ocean Lake Way & N Port Loop 17 350
19 Tower or Berm North Razor Clam Drive & Butterclam St SW 10 350
20 Tower Mt. Olympus 10 350

Step 2. Figure out what the community wants these things to
look like!
OR

Safe Haven Berms

Safe Haven Berms

Safe Haven Berms

Safe Haven Buildings

Safe Haven Towers

Tokeland Tower Options


Step 3. Figure out what the cost is…
(thank you, engineers)

Type Community Site
Min. Structure
Height (feet)
Capacity (# of people)
Estimated Cost
B1 berm Long Beach N Place & 41st Place 12 600 $644,095
B2 berm Long BeachWashington Avenue South & 5th StreetSouth 9 1000 $839,708
B3 berm Long BeachWashington Avenue South & 2nd StreetSouth 12 400 $509,621
B4 berm Long Beach 13th Street South & Washington Avenue 9 700 $546,830B5 berm Long Beach Q Street (Washington) & 26th Street North 9 500 $440,540B6 berm Ocean Park U Street & 227th Place 9 600 $493,685B7 berm Ocean Park SR 103 & 210th Place 12 200 $375,147B8 berm Ocean Park SR 103 & 188th Place 16 200 $522,162B9 berm Ocean Park SR 103 & 162nd Lane 25 150 $879,152B10 berm Ocean Park SR 103 & Cranberry Road 9 400 $387,394B11 berm Ocean Park U Street & 260th Street 20 800 $1,322,779B12 berm Seaview N Place & 37th Place 12 400 $509,621B13 berm Ilwaco Ortelius Drive & Scarboro Lane North 16 300 $608,188T1 tower Tokeland Kindred Avenue (Nelson Crab) 19 100 $104,218T2 tower Tokeland Tokeland Road & Evergreen Street 19 150 $112,770T3 tower Tokeland Tokeland Road & Pine Lane 19 75 $99,942T4 tower North Cove SR 105 & Whipple Avenue 21 100 $105,929T5 tower North Cove SR 105 & Warrenton Cannery Road 23 100 $107,639
PK1parkingstructure Tokeland Shoalwater Bay Casino 25 1000 $828,403
PK2parkingstructure Tokeland Shoalwater Bay Tribal Complex 19 500 $414,201
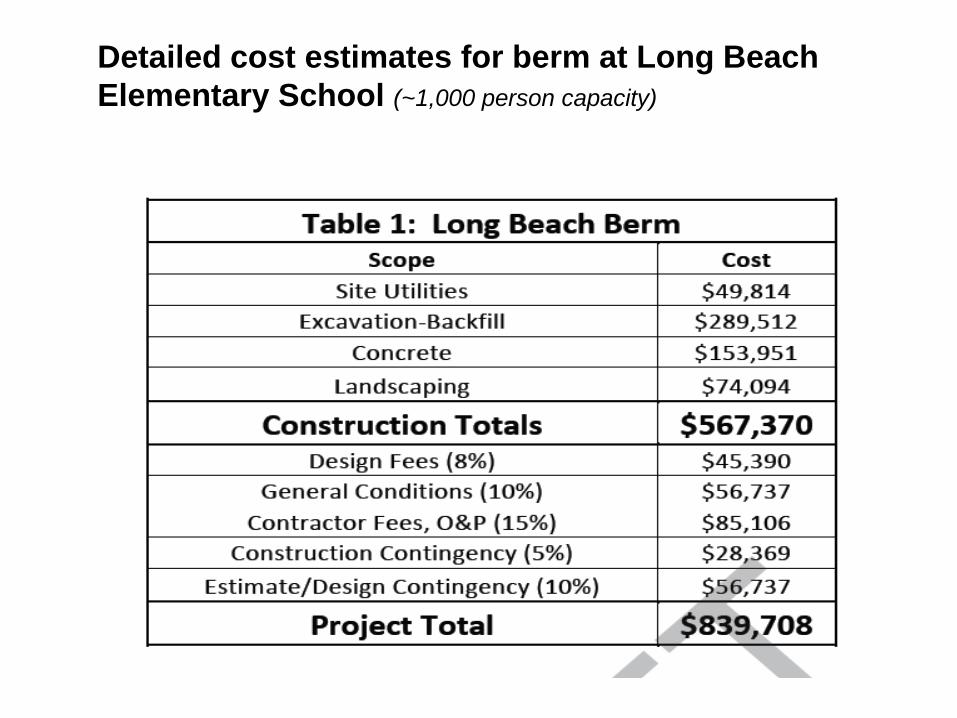
Detailed cost estimates for berm at Long Beach
Elementary School (~1,000 person capacity)

Step 4. Deliver a community based plan…

And how do we know this will work here????

Because we’ve seen it work there!!!
From Stuart Frasier

Tsunami Simulator for Evacuation
Modeling
• Model developed for evacuation by Dr. Harry Yeh, Oregon State University and Tim Feitz, Gartnell Group
• Based on Japanese Modeling/Simulations

• Warning Transmission Facility (AHAB)
• Evacuation Locations
• Residents
• Building
• Road Network
• Tsunami Inundation
• Ortho Photography
• Elevation (DEM)
Tsunami Evacuation Simulator: Data Structure

Locations of Safe Havens Base Case Scenario 1 Scenario 2 Scenario 3
Northern high grounds 2847 2884 2023 1780
67th
Place assembly area 878 649 664 324
HWY 101 high ground 776 722 726 514
Southern high grounds 1520 1273 1243 875
Long Beach refuge --- 850 850 803
Ocean Park refuge --- --- 830 782
Klipsan Beach refuge --- --- --- 724
Seaview refuge --- --- --- 896
Survived outside the safe zones 999 1008 1044 1048
Total survived/dead 7020/2077 7386/1711 7380/1717 7746/1351
Evacuees reaching safe havens (total population of 9097)

So, Where Are We Going From Here?• Finish Clallam County Safe Haven Plan (mid-2012)
– Makah and Quileute Tribes
• Final presentations to County & Tribal Officials
• Additional modeling underway based on new LIDAR to verify minimum heights
• Continue to work with Counties, Tribes, Federal partners, State agencies, Private industry, etc. to seek funding for implementation
• Continue the Outreach - “Like” us on Facebook! www.facebook.com/projectsafehaven