project sg2212/sg3114 development of a navier{stokes
TRANSCRIPT

Computational Fluid Dynamics SG2212/SG3114, Spring 2016 1
Project SG2212/SG3114
Development of a Navier–Stokes solver as a demonstration of concepts
due 23/03/2016
1 Background
The velocity and pressure fields for an incompressible flow can be obtained by solving the Navier–Stokes equations numerically. Under the assumption of constant density (incompressible), thenon-dimensional mass and momentum conservation equations are reduced to
∂ui∂xi
= 0 (1)
∂ui∂t
+∂(uiuj)
∂xj= − ∂P
∂xi+
1
Re
∂2ui∂xj∂xj
+ fi , (2)
with ui denoting the velocity in the direction xi, P the pressure, and the Reynolds number Re.fi is a volume force. Note that the summation convention has been used. The correspondingtransport equation for a scalar θ such as the temperature or pollutant concentration is
∂θ
∂t+∂(ujθ)
∂xj=
1
Pe
∂2θ
∂xj∂xj, (3)
with the Peclet number Pe = Pr · Re and the Prandtl number Pr. In the case of a so-calledactive scalar, the Boussinesq approximation can be used to model the influence of variabledensity onto the momentum equations by setting f2 = Riθ. Here, we assume that the gravityacts in the y = x2 direction, hence the force is applied onto the second component of fi. Finally,Ri denotes the Richardson number.
As can be seen in the above equations, the continuity equation is not an evolution equationanymore as in the case of compressible fluids. This means that mass conservation becomeslike an additional constraint for the momentum conservation equations. This requires extraattention when the equations are solved numerically. For time-dependent flows a common wayto solve the discrete system is the so-called projection or pressure correction method. Sometimesthis method and its generalisations are also called splitting methods. A short description of thismethod is given next.
Let us discretise the above equations using an explicit scheme for time derivatives (explicitEuler)
Un+1 − Un∆t
+N(Un)Un +GPn+1 = f(tn) , (4)
DUn+1 = 0 , (5)
where N(U)U denotes the advection and viscous terms, GP the pressure gradient, ∆t thetime step and f(t) the forcing terms including the boundary conditions. Further, D stands fordivergence operator. Note that the pressure term is discretised using the values at the time stepn+1. The reason for this will become clear later on. Applying the projection method to the set

Computational Fluid Dynamics SG2212/SG3114, Spring 2016 2
of equations above, one can rewrite them as follows. First, in the prediction step an intermediateflow field U∗ is computed which does not necessarily satisfy the continuity equation,
U∗ − Un∆t
+N(Un)Un = f(tn) . (6)
A correction step is then introduced in order to correct for the continuity equation,
Un+1 − U∗
∆t+GPn+1 = 0 . (7)
Applying the divergence operator D to equation (7) and using the divergence-free condition (5),one can derive the following Poisson equation for the pressure,
DGPn+1 = ∆Pn+1 =1
∆t(DU∗) , (8)
using the symbol ∆ for the Laplace operator. The computed pressure from this step can beinserted in equation (7) to obtain Un+1,
Un+1 = U∗ −∆tGPn+1 . (9)
As will be discussed later, in equation (8) homogeneous Neumann boundary conditions areemployed. Note that the pressure is only determined up to an additive constant (only pressurederivatives enter the evolution equations). This means that the pressure must be set explicitlyin one point of the domain to avoid singular expressions.
The solution of the scalar transport equation (3) is simpler than the momentum equations, asthe scalar θ does not need to satisfy the divergence-free condition. Therefore, the integrationcan be done in a straight-forward way using explicit time integration (velocity field from theprevious time step).
2 Simulation code
Your task for this project is to develop a simulation programme that can solve the Navier–Stokesequations in a rectangular domain. This code should be written in MATLAB, based on the tem-plates given on the course homepage and in Appendix B (SG2212 template.m, DD template.m,avg template.m). To summarise, the features of the code are:
• Incompressible Navier–Stokes plus scalar equations (Boussinesq approximation; only forPhD students reading course SG3114),
• Second-order finite difference on a staggered grid,
• Explicit Euler time integration for both advection and viscous terms,
• Sparse matrices for the Poisson equation for the pressure correction,
• Dirichlet and Neumann boundary conditions on a rectangular domain in two dimensions(2D).
As this code is mainly used for educational purposes demonstrating the various concepts usedin CFD, the complexity of the numerical method is intentionally kept on a low level. Therefore,a number of features common in CFD software are not treated in the code:

Computational Fluid Dynamics SG2212/SG3114, Spring 2016 3
• 3D formulation and implicit time stepping for viscous terms,
• CFL condition for time stepping,
• Higher order time integration methods,
• Higher order spatial discretisation,
• more efficient solution strategies, e.g. using a Cholesky decomposition,
• More complex geometries, multiblock distributions, mappings etc.
In order to demonstrate the capabilities of your code we will consider two physical flow caseswhich are introduced in the following Sections 3 and 4. A detailed description of the numericalmethod and its implementation is given in the Appendix.
3 Task 1: Lid-driven cavity (all course participants)
Consider the incompressible flow in a two-dimensional rectangular domain with side length lxand ly. The side and lower walls are all solid and still, requiring no-slip boundary conditions.The top wall is moved with a constant speed u = 1 in the positive x-direction. This flow caseis a common test problem for Navier–Stokes solvers, and usually called the lid-driven cavity. Asketch is given in Figure 1.
lx
ly
u=0, v=0
u=1, v=0
u=0,
v=
0
u=0,
v=
0
Figure 1: Sketch of the lid-driven cavity. The moving top wall is indicated in red.
The mass and momentum conservation equations in non-dimensional form can be written as
∂u
∂x+∂v
∂y= 0 , (10)
∂u
∂t+∂P
∂x= −∂(u2)
∂x− ∂(uv)
∂y+
1
Re
(∂2u
∂x2+∂2u
∂y2
), (11)
∂v
∂t+∂P
∂y= −∂(uv)
∂x− ∂(v2)
∂y+
1
Re
(∂2v
∂x2+∂2v
∂y2
), (12)

Computational Fluid Dynamics SG2212/SG3114, Spring 2016 4
with associated boundary conditions
x = 0 : u = v = 0 (13)
x = lx : u = v = 0 (14)
y = 0 : u = v = 0 (15)
y = ly : u = 1, v = 0. (16)
You can optionally include also the advection of a passive scalar, governed by
∂θ
∂t= −∂(uθ)
∂x− ∂(vθ)
∂y+
1
Pe
(∂2θ
∂x2+∂2θ
∂y2
), (17)
with Pe = Re · Pr. Choose Pr = 0.71 which is a good approximation for air. The boundaryconditions for the temperature θ are
x = 0 : ∂θ/∂x = 0 (adiabatic) (18)
x = lx : ∂θ/∂x = 0 (adiabatic) (19)
y = 0 : θ = 0 (20)
y = ly : θ = 1 . (21)
Initial conditions at t = 0 are non-moving fluid, i.e. u(t = 0) = v(t = 0) = 0. For the scalar,assume a linear profile in the vertical direction, i.e. θ(t = 0) = y/ly.
Your task is to write a MATLAB code which solves the Navier–Stokes equations for the flowcase described above using the projection method on a staggered grid. The implementationof the scalar equation is only compulsive for PhD students (course SG3114). To check yourimplementation, answer Q1–Q5 and run your code for cases A–C given below.
Questions:
Q1) Discuss why the kron operator (Kronecker tensor product) as introduced in Section A.4indeed returns the matrix for the second derivative in the two-dimensional case.
Q2) For case A (spatial discretisation as stated below) determine ”experimentally” the maxi-mum time step ∆t that is stable for the velocity field. Can you relate that maximum timestep to the grid resolution and Reynolds number by considering stability conditions forboth convective and diffusive terms (consider a 2D problem!). Which of the two is morestrict for cases A–C?For PhD students: Choosing Pr = 0.71, is the scalar equation less stable than the mo-mentum equations? Why?
Q3) The boundary conditions for U on the top and bottom boundaries as well as for V on theleft and right boundaries should be imposed by choosing the correct values for the dummycells (cells outside the domain). Write down the expressions for Ui+ 1
2,0 and V0,j+ 1
2at the
dummy cells.
Also the expressions for the pressure at the dummy cells P0,j and Pi,0 should be chosensuch that the Neumann boundary condition at the boundaries is satisfied. Give theexpression for the pressure in the dummy cells and write down the discretised ∇2P1,j forj = 2, · · · , Ny − 1 (Laplace operator including boundary conditions).

Computational Fluid Dynamics SG2212/SG3114, Spring 2016 5
Q4) Place a probe at the domain centre to compare the time history of the horizontal velocity(u)for the flow cases A–C given below. Try to estimate the time it takes for each run to es-tablish a stationary solution. How does this time correlate with the Reynolds number?
Q5) Implement also a moving lower wall using appropriate boundary conditions. Try (atleast) three cases (Re = 100) with the lower wall moving with the same velocity and samedirection as the upper one, with the opposite velocity, and one with a lower velocity at thelower wall. Report plots of your results, and in particular discuss the symmetry propertiesof the resulting flow patterns.
Flow cases:
A) Run the code for Re = 10, lx = ly = 1. Use a total of Nx = Ny = 30 grid cells and a timestep ∆t = 0.001.
For low values of Re, one obtains a flow field which is (nearly) symmetric in the x-direction,see Figure 2, with very little transient behaviour.
B) Run the code for Re = 100, lx = ly = 1, Nx = Ny = 50, ∆t = 0.001.
For these moderate values of Re (≈ 100) the flow becomes asymmetric due to action ofinertia, but it is still steady, see Figures 3. This can be clearly seen by means of a timeseries recorded in the middle of the domain, see Q4.
C) (optional) Run the code for Re = 8000 or even higher Re, lx = ly = 1, Nx = Ny = 100,∆t = 0.001.
Note also that increasing the Reynolds number will give rise to thinner shear layers,which require more grid points to properly resolve them. You can experiment with thecombinations Re, Nx, Ny and ∆t, and observe how the results (and stability) are affected(see Q2).
You should hand in the MATLAB code and a report with answers to questions Q1–Q5 togetherwith a discussion and plots illustrating the flow development for the three cases A–C above. Inorder to give you an idea of how of the flow behaviour, consider Fig. 2 for case A (Re = 10),Fig. 3 for case B (Re = 100) and Fig. 4 for case C (Re = 8000).
Figure 2: Simulation results for the lid-driven cavity, case A (Re = 10). Velocity field (left) andtemperature field (right) at t = 20. The colour scale ranges from 0 (blue) to 1 (red).

Computational Fluid Dynamics SG2212/SG3114, Spring 2016 6
Figure 3: Simulation results for the lid-driven cavity, case B (Re = 100). Velocity field (left)and temperature field (right) at t = 20. The colour scale ranges from 0 (blue) to 1 (red).
Figure 4: Simulation results for the lid-driven cavity, case C (Re = 8000). Velocity field (left)and temperature field (right) at t = 20. The colour scale ranges from 0 (blue) to 1 (red).
A detailed description of the different steps of the algorithm and boundary conditions is given inthe Appendix A. A template for the code is available in Appendix B and the course homepage.

Computational Fluid Dynamics SG2212/SG3114, Spring 2016 7
4 Task 2: Rayleigh-Benard problem(only for PhD students SG3114)
The flow induced by small density variations due to temperature differences between two wallsis called Rayleigh-Benard convection. The control parameter is the so-called Rayleigh numberRa which describes the ratio of buoyancy to viscous forces acting on the flow.
Depending on Ra, various flow regimes can be studied, ranging from stable flow configurationfor low Ra, two-dimensional convection rolls (i.e. large counter-rotating vortices, see below),hexagonal convection cells, and finally for high Ra fully turbulent flow. The major relevancefor us to study this flow is that using comparably simple tools from linear stability analysisthe changeover from stable to unstable (i.e. amplifying) flow can be exactly determined. Tonumerically check this so-called critical Rayleigh number Rac provides a very useful validationof the numerical code.
If the flow field is subjected to a temperature gradient between the two walls, density variationin the flow may be generated. These density variations, due to buoyancy forces, induce motionin the fluid. The corresponding force in the momentum equations can be modelled by meansof the Boussinesq approximation. In order to tackle this flow problem, the governing equations(1)-(2) are thus coupled to the temperature equation (3) using the forcing term f2. Then, aslightly different non-dimensionalisation has to be employed, essentially based on a convectivevelocity scale. The only non-dimensional numbers in the equations are the Rayleigh number Raand the Prandtl number Pr. For a two-dimensional flow the final non-dimensional equationscan be written as
∂u
∂x+∂v
∂y= 0 , (22)
∂u
∂t+∂P
∂x= −∂(u2)
∂x− ∂(uv)
∂y+ Pr
(∂2u
∂x2+∂2u
∂y2
), (23)
∂v
∂t+∂P
∂y= −∂(uv)
∂x− ∂(v2)
∂y+ Pr
(∂2v
∂x2+∂2v
∂y2
)+ f2 , (24)
∂θ
∂t= −∂(uθ)
∂x− ∂(vθ)
∂y+
(∂2θ
∂x2+∂2θ
∂y2
). (25)
The forcing in the normal direction, caused by buoyancy forces, is
f2 = RaPrθ . (26)
The original formulation of the Rayleigh-Benard convection problem is considered as the flowbetween two infinite parallel walls, see the sketch in Fig. 6. However, for the present project,we consider a two-dimensional cavity where the top and bottom walls are kept at differenttemperatures and the side-walls are assumed to be adiabatic ( ∂θ∂n = 0). A sketch of the geometryis given in Figure 5. Here, the boundary conditions are
x = 0 : u = v = 0,∂θ
∂x= 0 , (27)
x = lx : u = v = 0,∂θ
∂x= 0 , (28)
y = 0 : u = v = 0, θ = θB , (29)
y = ly : u = v = 0, θ = θT . (30)

Computational Fluid Dynamics SG2212/SG3114, Spring 2016 8
lx
ly
u=0, v=0, !=!B
u=0, v=0, !=!T
u=0,
v=
0, !
x=0
u=0,
v=
0, !
x=0
Figure 5: Close cavity with non-isothermal walls.
Initial conditions are at t = 0 non-moving fluid, i.e. u(t = 0) = v(t = 0) = 0. For the scalar,assume a linear profile in the vertical direction,
θ(x, y, t = 0) = θB +y
ly(θT − θB) . (31)
! h
"="B
"="T
Stable (σ < 0)
Unstable (σ > 0)
← Neutral curve (σ =0)
← (1708,3.12)
Ra
K
1000 2000 3000 4000 5000 6000 7000 8000
1
2
3
4
5
6
7
8
Figure 6: Top: Sketch of the flow structure (convection cells). Bottom: Stable and unstable(shaded) regions for Rayleigh-Benard problem. Here, λ = 2π/K is the wavelength of theunstable perturbation. The critical Rayleigh number is Rac = 1708 with associated spatialwavenumber K = 2π/λc = 3.12 (λc = 2.01).
For cases where θT > θB, the density is decreasing with increasing height. This corresponds to astate with is called stable stratification, which means that the flow is stable and all disturbances

Computational Fluid Dynamics SG2212/SG3114, Spring 2016 9
will decay eventually. However, if θT < θB, corresponding to unstable stratification, for largeenough values of Ra the flow becomes unstable. A stability diagram for this case is shown inFig. 6. It can be seen that the first instability appears for Rac = 1708 with a wavenumberKc = 3.12, which corresponds to a wavelength of λc = 2.01.
Your task is to include the forcing f2 and the energy equation into the code developed in Task 1and run it for cases A and B given below. Your report should discuss the results for these casestogether with answers to questions Q1–Q3.
For all runs, choose the Prandtl number Pr = 0.71, the box size lx = 10, ly = 1, and theresolution Nx = 200, Ny = 20. The domain thus becomes elongated in the x-direction, imitat-ing an infinite domain. As initial conditions random small-scale noise of moderate amplitude(±0.1(θB − θT )) should be used in order to trigger the instability. The time step ∆t should bechosen such that the time integration remains stable.
t
u(x=
5,y=
0.5,
t)
0 5 10 15 2010
−4
10−3
10−2
Ra=1715Ra=1700
Figure 7: Temporal evolution of the probe signals for two Rayleigh numbers close to the neutrallystable state (Rac = 1708). It can clearly be seen that the supercritical trajectory leads toexponential growth, whereas the subcritical case eventually will exponentially decay.
Questions:
Q1) Give the definitions of the non-dimensional parameters Pr and Ra both in terms of math-ematical symbols and words (physical meaning). Why do the equations not contain anyReynolds number?
Q2) Estimate the wavelength of the instability at Ra = 1715. What boundary conditionsshould be employed (both for velocity and temperature) to exactly reproduce the criticalRayleigh number?
Q3) Based on time signals such as the example given in Figure 7, try to estimate the criticalRayleigh number for your specific discretisation (see description for run B).
Flow cases:
A) Run the code for Ra = 100, 1000, 50000, θT = 1 and θB = 0.
These parameters correspond to stable flow. You should observe that initial disturbanceswill decay due to viscosity. For the case of Ra = 50000 the appropriate time step mustbe selected.

Computational Fluid Dynamics SG2212/SG3114, Spring 2016 10
Figure 8: Stationary flow patterns for large times corresponding to Ra = 1700, Ra = 1715,Ra = 2700 and Ra = 50000 (from top to bottom). Both the velocity distribution and thetemperature field are shown for each Rayleigh number.
B) Run the code for θT = 0 and θB = 1.
Here, if the value of Rayleigh number is large enough (Ra > 1708) flow instability will beobserved. Run the code for different values of Ra and try to find “experimentally” thecritical value Rac. To determine the stability of a specific run, consider the time evolutionof a probe in the flow, see Fig. 7. If you observe exponential growth (solid line in Fig. 7),you are in the unstable regime, otherwise the flow is stable.

Computational Fluid Dynamics SG2212/SG3114, Spring 2016 11
A Solution procedure and implementation
A.1 Grid
In order to avoid spurious checkerboard solution the equations are discretized on a staggeredgrid. Figure 9 shows the numerical domain where the pressure p is defined in cell centres and thevelocities u and v are defined in the centre of the vertical and horizontal cell faces, respectively.Table 1 gives the number of unknowns for each of the flow variables to solve for. Here, Nx and
Table 1: Resolution for the various solution variables.
Variable Interiour resolution Boundary conditions included
P Nx ×Ny (Nx + 2)× (Ny + 2)
U (Nx − 1)×Ny (Nx + 1)× (Ny + 2)
V Nx × (Ny − 1) (Nx + 2)× (Ny + 1)
Ny are the number of cells in the x and y directions, respectively. The coordinates of the gridpoints (cell corners) are given as
Xi = ilxNx
, i = 0, · · · , Nx , (32)
Yj = jlyNy
, j = 0, · · · , Ny , (33)
where lx and ly are the lengths in x and y directions. Note that number of grid points (includingthe boundary points) is Nx + 1 and Ny + 1, respectively.
A.2 Boundary conditions
A.2.1 Velocity
Boundary conditions for both velocity components are given all around the rectangular domain.In the following, these vectors are denoted US for U at the lower boundary (south), VW for Von the left boundary (west), etc. Thus, on each edge a total of (Nx + 1) or (Ny + 1) boundaryvalues are specified on the cell corners. The Dirichlet boundary condition for U on the left andthe right boundaries of computational domain can be directly applied as the velocity nodes lieon those boundaries, see Fig. 9. The same is valid for V on the top and the bottom boundaries.However, the boundary conditions for U on the top and bottom boundaries should be imposedby choosing the correct values for the dummy cells (cells outside the domain) in such a waythat linear interpolation over the boundary will give the correct value at the boundary. Theformulation of the boundary conditions is asked in Q3.
A.2.2 Pressure
As it was shown during the lecture, we have the choice of specifying homogeneous Neumannboundary conditions for the pressure. In other words the normal derivative at the boundaries

Computational Fluid Dynamics SG2212/SG3114, Spring 2016 12
i=0 1 nx nx+1
ny+1
ny
1
j=0
puv
WES
T
NORTH
EAST
SOUTH
Figure 9: Sketch of the staggered grid. Circles are pressure nodes, squares U -velocity, and trian-gles V -velocity. Filled symbols correspond to interiour points, whereas open symbols representthe dummy values. The domain boundary is indicated by the thick blue line, on which also theboundary conditions are given.
should vanish for the pressure, i.e.,∂P
∂n= 0 . (34)
Again, the value for the pressure dummy cells has to be chosen appropriately to fulfill thiscondition. The discrete formulation of this boundary condition should also be given as part ofQ3.
A.3 Data structure
All variables are stored as matrices in MATLAB. Note that the first index in MATLAB denotesthe row and the second index the column, which means that the direction of increasing x isfrom top to bottom in the matrices. Similarly, increasing the y direction is from left to right inthe matrix. Therefore, the storage of variables in the matrices corresponds to the transpose ofthe “physical” domain.
We introduce matrices U and V which only contain the unknown velocity values at the innercells, and not the (known) boundary values. Thus, the size for the matrix U containing the uvelocity is (Nx − 1)×Ny. Similarly, V containing the v velocity has Nx × (Ny − 1) elements.
At time t = 0 the velocities can be initiated with zeros (i.e. fluid at rest) in MATLAB as

Computational Fluid Dynamics SG2212/SG3114, Spring 2016 133.2. FINITE-VOLUME DISCRETIZATIONS OF 2D NS 63
PSfrag replacements
x, x1
y, x2
z, x3
u, u1
v, u2
w, u3
x1
x2
x 0i
ri
(x 0
i , t)
ui
(x 0
i , t)
P(t = 0
)
xu1
u2 > u1
x1
x2
x3
x 0i
ui dtdx 0
i
dui dtri
(dt
)
dri
(dt
)
P1
P2
x1
x2
x3
R3
R2
R1
r3
r2
r1π2 + dϕ12
V (t)S (t)
V (t + ∆t) − V (t)S (t + ∆t)
un
V (t + ∆t)
pT0, U0
Tw
LT0
U0
Gradient fieldswi∂p∂xi
ui
Divergence free vectorfields // to boundary
Lh
x1
x2
p0 > p1
p1
un
dSu · n∆t
xy
u0
p0
η = y√4νt
uu0
y = η√
4νt
tηy
ωz = ω(η)·u0√πνt
tL
}δ
ω ≈ 0U →y, vx, u
LUδ
u0η = y√
νx/u0
f ′ = uu0
Blasius profile
δ∗
xSeparation point
⇐= Pressure forcexy
luT
xy
dxdy
− dxdl = (dx, dy)
n dl = (dy, − dx)
i − 1, j + 1i, j + 1
i + 1, j + 1
cc′
bb′
i − 1, ji + 1, j
i, j
Aabcd
dd′
aa′
i − 1, j − 1i, j − 1
i + 1, j − 1j
ii + 1ui,j
vi,j
pi,j
pi,j
vi,j+1/2
vi,j−1/2
ui−1/2,j
i − 12 i i + 1
2 i + 1 i + 32
j + 12
j
j − 12
j − 1
PSfrag replacements
x, x1
y, x2
z, x3
u, u1
v, u2
w, u3
x1
x2
x 0i
ri
(x 0
i , t)
ui
(x 0
i , t)
P(t = 0
)
xu1
u2 > u1
x1
x2
x3
x 0i
ui dtdx 0
i
dui dtri
(dt
)
dri
(dt
)
P1
P2
x1
x2
x3
R3
R2
R1
r3
r2
r1π2 + dϕ12
V (t)S (t)
V (t + ∆t) − V (t)S (t + ∆t)
un
V (t + ∆t)
pT0, U0
Tw
LT0
U0
Gradient fieldswi∂p∂xi
ui
Divergence free vectorfields // to boundary
Lh
x1
x2
p0 > p1
p1
un
dSu · n∆t
xy
u0
p0
η = y√4νt
uu0
y = η√
4νt
tηy
ωz = ω(η)·u0√πνt
tL
}δ
ω ≈ 0U →y, vx, u
LUδ
u0η = y√
νx/u0
f ′ = uu0
Blasius profile
δ∗
xSeparation point
⇐= Pressure forcexy
luT
xy
dxdy
− dxdl = (dx, dy)
n dl = (dy, − dx)
i − 1, j + 1i, j + 1
i + 1, j + 1
cc′
bb′
i − 1, ji + 1, j
i, jAabcd
dd′
aa′
i − 1, j − 1i, j − 1
i + 1, j − 1j
ii + 1ui,j
vi,j
pi,j
pi,j
vi,j+1/2
vi,j−1/2
ui−1/2,j
i − 12
ii + 1
2
i + 1i + 3
2j + 1
2
jj − 1
2
j − 1control volume for divergence condition.
PSfrag replacements
x, x1
y, x2
z, x3
u, u1
v, u2
w, u3
x1
x2
x 0i
ri
(x 0
i , t)
ui
(x 0
i , t)
P(t = 0
)
xu1
u2 > u1
x1
x2
x3
x 0i
ui dtdx 0
i
dui dtri
(dt
)
dri
(dt
)
P1
P2
x1
x2
x3
R3
R2
R1
r3
r2
r1π2 + dϕ12
V (t)S (t)
V (t + ∆t) − V (t)S (t + ∆t)
un
V (t + ∆t)
pT0, U0
Tw
LT0
U0
Gradient fieldswi∂p∂xi
ui
Divergence free vectorfields // to boundary
Lh
x1
x2
p0 > p1
p1
un
dSu · n∆t
xy
u0
p0
η = y√4νt
uu0
y = η√
4νt
tηy
ωz = ω(η)·u0√πνt
tL
}δ
ω ≈ 0U →y, vx, u
LUδ
u0η = y√
νx/u0
f ′ = uu0
Blasius profile
δ∗
xSeparation point
⇐= Pressure forcexy
luT
xy
dxdy
− dxdl = (dx, dy)
n dl = (dy, − dx)
i − 1, j + 1i, j + 1
i + 1, j + 1
cc′
bb′
i − 1, ji + 1, j
i, j
Aabcd
dd′
aa′
i − 1, j − 1i, j − 1
i + 1, j − 1j
ii + 1ui,j
vi,j
pi,j
pi,j
vi,j+1/2
vi,j−1/2
ui−1/2,j
i − 12
ii + 1
2
i + 1i + 3
2j + 1
2
jj − 1
2
j − 1control volume for divergence condition.
control volume for streamwise momentum equation (u) .
PSfrag replacements
x, x1
y, x2
z, x3
u, u1
v, u2
w, u3
x1
x2
x 0i
ri
(x 0
i , t)
ui
(x 0
i , t)
P(t = 0
)
xu1
u2 > u1
x1
x2
x3
x 0i
ui dtdx 0
i
dui dtri
(dt
)
dri
(dt
)
P1
P2
x1
x2
x3
R3
R2
R1
r3
r2
r1π2 + dϕ12
V (t)S (t)
V (t + ∆t) − V (t)S (t + ∆t)
un
V (t + ∆t)
pT0, U0
Tw
LT0
U0
Gradient fieldswi∂p∂xi
ui
Divergence free vectorfields // to boundary
Lh
x1
x2
p0 > p1
p1
un
dSu · n∆t
xy
u0
p0
η = y√4νt
uu0
y = η√
4νt
tηy
ωz = ω(η)·u0√πνt
tL
}δ
ω ≈ 0U →y, vx, u
LUδ
u0η = y√
νx/u0
f ′ = uu0
Blasius profile
δ∗
xSeparation point
⇐= Pressure forcexy
luT
xy
dxdy
− dxdl = (dx, dy)
n dl = (dy, − dx)
i − 1, j + 1i, j + 1
i + 1, j + 1
cc′
bb′
i − 1, ji + 1, j
i, jAabcd
dd′
aa′
i − 1, j − 1i, j − 1
i + 1, j − 1j
ii + 1ui,j
vi,j
pi,j
pi,j
vi,j+1/2
vi,j−1/2
ui−1/2,j
i − 12
ii + 1
2
i + 1i + 3
2j + 1
2
jj − 1
2
j − 1control volume for divergence condition.
control volume for streamwise momentum equation (u) .control volume for normal momentum equation (v) .
Figure 3.4: Cartesian finite-volume grid where the velocity components and the pressure uses staggeredgrids.
which satisfies the divergence constraint. If it is input into the equation for u and v we find the expression
dg
dt+
8
Re · ∆x2g = 0 ⇒ g = e− 8t
Re·∆x2
Thus we have a spurious solution consisting of checkerboard modes which are damped slowly for velocityand constant in time for the pressure. This mode will corrupt any true numerical solution and yields thisdiscretization unusable as is. These modes are a result of the very weak coupling between nearby finitevolumes or grid points, and can be avoided if they are coupled by one sided differences or if they are dampedwith some type of artificial viscosity.
Staggered cartesian grid
To eliminate the problem with spurious checkerboard modes, we can use a staggered grid as in figure 3.4,where the control volumes for the streamwise, spanwise and pressure are different.
The control volume for the continuity equation is centered abound the pressure point and the discretiza-tion becomes
(ui+ 1
2 ,j − ui− 12 ,j
)∆y +
(vi,j+ 1
2− vi,j− 1
2
)∆x = 0
orui+ 1
2 ,j − ui− 12 ,j
∆x+
vi,j+ 12
− vi,j− 12
∆y= 0
The control volume for the streamwise velocity is centered around the streamwise velocity point andthe discretization becomes
∂ui+1/2,j
∂t+
u2i+1,j − u2
i,j
∆x+
(uv)i+1/2,j+1/2 − (uv)i+1/2,j−1/2
∆y+
pi+1,j − pi,j
∆x−
1
Re
ui+3/2,j − 2ui+1/2,j + ui−1/2,j
∆x2− 1
Re
ui+1/2,j+1 − 2ui+1/2,j + ui+1/2,j−1
∆y2= 0
Figure 10: Sketch of the staggered grid. Open symbols indicate dummy cells situated outsidethe computational domain.
1 U=zeros(nx-1,ny);
2 V=zeros(nx,ny-1);
To perform central difference over the inner points, we need to include the boundary points inU and V. These extended matrices are called Ue and Ve. They can be created by adding theappropriate rows and columns to the U and V matrices. For example for the u velocity this isdone as follows:
1) Add vectors uE and uW containing the boundary values at the right and left boundaries ofthe physical domain, respectively (transposed in MATLAB). In MATLAB code:
1 Ue=[uW ; U ; uE];
2) Introduce dummy cells with values which give the correct boundary conditions on the topand bottom boundaries of the physical domain. The boundary values are stored in vectorsuN and uS as described above.
In MATLAB:
1 Ue=[2uS’-Ue(:,1) Ue 2uN’-Ue(:,end)];
The matrix Ve is built in a similar way. Then, the size of the new matrices will be

Computational Fluid Dynamics SG2212/SG3114, Spring 2016 14
Extrapolation
Extrapolation
Figure 11: Boundary condition treatment of velocity
Ue: (Nx + 1)× (Ny + 2)Ve: (Nx + 2)× (Ny + 1)
The advection (non-linear) terms are calculated using the values of the velocity field on theboundaries of the control volumes which are different from the locations the discrete velocityfield is defined. Therefore, we introduce matrices which contain an averaged value of u and von the boundaries of the control volumes. To generate these data Ue and Ve should be averagedin the x or y direction depending on the term to be evaluated. Here, we define the averagingfunction avg( ) such that
[avg(f)]i =1
2(fi−1 + fi) . (35)
Note that the length of the resulting vector avg(f) is one element less than the length of f .Furthermore, avg(f) can be applied in both the x- and y-directions. In the example below, thefunction makes the averaging in either x or y direction.
In MATLAB:
1 function B=avg(A,idim)
2 if(idim==1)
3 B=1/2 [ A(2:end,:) + A(1:end-1,:) ];
4 elseif(idim==2)
5 B=1/2 [ A(:,2:end) + A(:,1:end-1) ];
6 end;
Applying this function to average the u velocity in the y direction can be achieved as follows inMATLAB:
1 Ua=avg(Ue,2);
After averaging the size of the matrix Ua will be (Nx + 1)× (Ny + 1).

Computational Fluid Dynamics SG2212/SG3114, Spring 2016 15
1/2 1/2
1/2
1/2
Figure 12: Averaging of velocities.
A.4 Construction of Laplace (Lp) operator
One of the most crucial steps of the code is the implementation of the Laplace operator. Weneed to construct that in a efficient way. To save memory and gain speed when the equationsare solved we make use of sparse matrix storage in MATLAB. This can be done in a smartand concise but slightly more complicated way in MATLAB. Let us first define the Laplaceoperator for a one-dimensional case. Using central finite differences second order, with Neumannboundary condition at the two boundaries we can define a derivative matrix with the followingstructure,
D2
=1
h2
−1 11 −2 1
. . .. . .
. . .
1 −1
. (36)
This is implemented in the function DD(n,h), available as template.
To extended this operator for a two-dimensional case, one can use the kron operator in MATLABto perform a Kronecker tensor product,
kron(A,B) =
A(1, 1) ·B A(1, 2) ·B · · ·A(2, 1) ·B A(2, 2) ·B · · ·
......
. . .
. (37)
Then one obtains the derivative matrix to compute Uxx = LP · U by choosing
A = INy×Ny
, B = D2,
and Uyy by choosing
A = D2, B = I
Nx×Nx.
In MATLAB:

Computational Fluid Dynamics SG2212/SG3114, Spring 2016 16
1 Lp=kron(speye(ny),DD(nx,dx))+...
The actual level of the pressure is not determined since only the pressure gradient enters theNavier–Stokes equations, i.e. both P + const. and P satisfy the Poisson equation. Therefore,one needs to fix the value of the pressure at one node, e.g. P1,1 = 0. This is achieved by thefollowing modification of the equation system
Lp(1, :) = 0, Lp(1, 1) = 1, R(1) = 0 .
Ignoring this gives singular matrices. The above observation is of course a general feature: Forany incompressible flow, the pressure is only determined up to a constant.
A.5 Outline of required steps
Assume that we consider an iteration that starts at t = tn with Un, V n and we will marchtowards t = tn+1 = tn + ∆t.
1. Compute the non-linear advection terms, namely NLxn, NLx
n :
NLxn = −((Un)2)x − (UnV n)y (38)
NLyn = −(UnV n)x − ((V n)2)y. (39)
The term NLxn is evaluated on the U velocity grid, similarly NLy
n on the V grid (seeFig. 10). The derivatives should be calculated based on the difference between the velocityvalues at neighbouring velocity nodes. Therefore, the velocities Un and V n need to beinterpolated to the these nodes such that derivatives can be taken. For example for(UnV n)x we proceed as follows:
((UnV n)x)i,j+ 12
=1
hx
[Ui+ 1
2,j+ 1
2Vi+ 1
2,j+ 1
2− Ui− 1
2,j+ 1
2Vi− 1
2,j+ 1
2
](40)
where Ui+ 12,j+ 1
2=
1
2
[Ui+ 1
2,j+1 + Ui+ 1
2,j
](41)
and Vi+ 12,j+ 1
2=
1
2
[Vi+1,j+ 1
2+ Vi,j+ 1
2
]. (42)
In MATLAB:
1 Ua=avg(Ue,2);
2 Va=avg(Ve,1);
3 UVx = 1/dx * diff( Ua.*Va, 1 , 1);
For the terms ((Un)2)x and ((V n)2)y the difference is taken between the pressure nodesonto which the velocity has to be interpolated first.
2. Compute the viscous diffusion terms, namely DIFFnx, DIFFny
DIFFnx =1
Re[Unxx + Unyy] (43)
DIFFny =1
Re[V nxx + V n
yy] . (44)

Computational Fluid Dynamics SG2212/SG3114, Spring 2016 17
For example
[DIFFnx]i+ 12,j =
1
Re
(Ui− 1
2,j − 2Ui+ 1
2,j + Ui+ 3
2,j
h2x+Ui+ 1
2,j−1 − 2Ui+ 1
2,j + Ui+ 1
2,j+1
h2y
).
(45)Use the extended grid and store only interior points.
In MATLAB:
1 viscu = diff( Ue(:,2:end-1),2,1 )/dx^2 + ...
2 diff( Ue(2:end-1,:),2,2 )/dy^2;
The command diff( ) is a built-in MATLAB operator which takes the difference betweenadjacent components. The first argument is the matrix to operate on, the second is theorder of the difference (here 2 for the second derivative) and the third is specifying alongwhich matrix dimension the derivative is taken (1 for x-direction and 2 for y-direction).
3. Compute forcing terms if required, Fnx , Fny .
4. Advance the solution to an intermediate time level (U∗ and V ∗) using explicit Euler
U∗ − Un∆t
= NLnx +DIFFnx + Fnx , (46)
V ∗ − V n
∆t= NLny +DIFFny + Fny . (47)
5. Solve the Poisson equation for the pressure
∆Pn+1 =1
∆t(DxU
∗ +DyV∗) . (48)
Now we need to solve the Poisson equation with homogeneous Neumann conditions forPn+1. Construct the discretised Laplace operator Lp (for details on the structure of theoperator Lp see Section A.4 above) and evaluate DxU
∗ + DyV∗ with central differences
second order.
LpPn+1 = R with R =
1
∆t(DxU
∗ +DyV∗). (49)
⇒ Pn+1 = Lp−1R . (50)
Here, Pn+1 and R are of size Nx×Ny, containing the unknown pressure and the right-handside (r.h.s.) at the cell centres, respectively.
In MATLAB:
1 rhs = (diff([uW ; U ; uE])/dx + ...)/dt;
2 rhs = reshape(rhs,nx*ny,1);
3 P = Lp\rhs;
4 P = reshape(P,nx,ny);
6. Compute the velocity field at time step n+ 1 according to
Un+1 = U∗ −∆tGPn+1 . (51)
Computational Fluid Dynamics SG2212/SG3114, Spring 2016 18
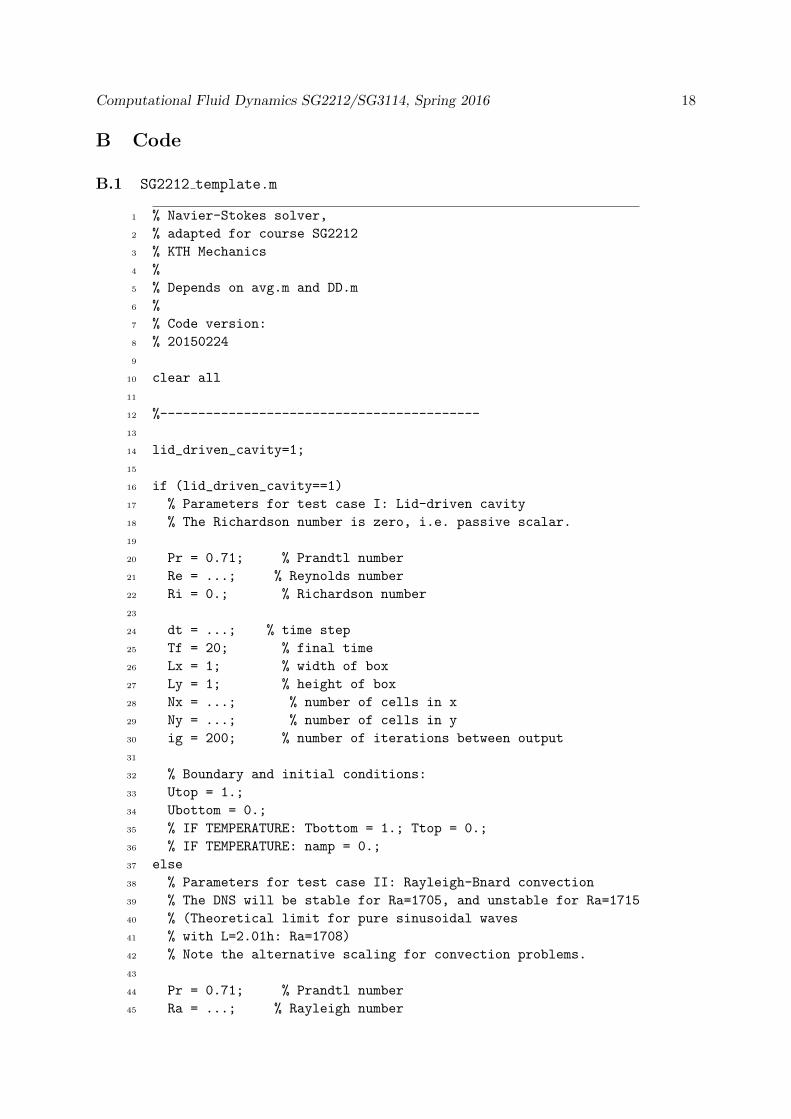
B Code
B.1 SG2212 template.m
1 % Navier-Stokes solver,
2 % adapted for course SG2212
3 % KTH Mechanics
4 %
5 % Depends on avg.m and DD.m
6 %
7 % Code version:
8 % 20150224
9
10 clear all
11
12 %------------------------------------------
13
14 lid_driven_cavity=1;
15
16 if (lid_driven_cavity==1)
17 % Parameters for test case I: Lid-driven cavity
18 % The Richardson number is zero, i.e. passive scalar.
19
20 Pr = 0.71; % Prandtl number
21 Re = ...; % Reynolds number
22 Ri = 0.; % Richardson number
23
24 dt = ...; % time step
25 Tf = 20; % final time
26 Lx = 1; % width of box
27 Ly = 1; % height of box
28 Nx = ...; % number of cells in x
29 Ny = ...; % number of cells in y
30 ig = 200; % number of iterations between output
31
32 % Boundary and initial conditions:
33 Utop = 1.;
34 Ubottom = 0.;
35 % IF TEMPERATURE: Tbottom = 1.; Ttop = 0.;
36 % IF TEMPERATURE: namp = 0.;
37 else
38 % Parameters for test case II: Rayleigh-Bnard convection
39 % The DNS will be stable for Ra=1705, and unstable for Ra=1715
40 % (Theoretical limit for pure sinusoidal waves
41 % with L=2.01h: Ra=1708)
42 % Note the alternative scaling for convection problems.
43
44 Pr = 0.71; % Prandtl number
45 Ra = ...; % Rayleigh number

Computational Fluid Dynamics SG2212/SG3114, Spring 2016 19
46
47 Re = 1./Pr; % Reynolds number
48 Ri = Ra*Pr; % Richardson number
49
50 dt = ...; % time step
51 Tf = 20; % final time
52 Lx = 10.; % width of box
53 Ly = 1; % height of box
54 Nx = ...; % number of cells in x
55 Ny = ...; % number of cells in y
56 ig = 200; % number of iterations between output
57
58 % Boundary and initial conditions:
59 Utop = 0.;
60 Ubottom = 0.;
61 % IF TEMPERATURE: Tbottom = 1.; Ttop = 0.;
62 namp = 0.1;
63 end
64
65
66 %------------------------------------------
67
68 % Number of iterations
69 Nit = ...
70 % Spatial grid: Location of corners
71 x = linspace( ... );
72 y = linspace( ... );
73 % Grid spacing
74
75 dx = ...
76 dy = ...
77 % Boundary conditions:
78 uN = x*0+Utop; vN = avg(x,2)*0;
79 uS = ... vS = ...
80 uW = ... vW = ...
81 uE = ... vE = ...
82 tN = ... tS = ...
83 % Initial conditions
84 U = ...; V = ...;
85 % linear profile for T with random noise
86 % IF TEMPERATURE: T = ... + namp*rand(Nx,Ny)
87 % Time series
88 tser = [];
89 Tser = [];
90
91 %-----------------------------------------
92
93 % Compute system matrices for pressure
94 % First set homogeneous Neumann condition all around

Computational Fluid Dynamics SG2212/SG3114, Spring 2016 20
95 % Laplace operator on cell centres: Fxx + Fyy
96 Lp = kron(speye(Ny), ... ) + kron( ... ,speye(Nx));
97 % Set one Dirichlet value to fix pressure in that point
98 Lp(1,:) = ... ; Lp(1,1) = ... ;
99 % For more speed, you could pre-compute the LU decomposition
100 % [LLp,ULp] = lu(Lp);
101 %-----------------------------------------
102
103 % Progress bar (do not replace the ... )
104 fprintf(...
105 ’[ | | | | ]\n’)
106
107 %-----------------------------------------
108
109 % Main loop over iterations
110
111 for k = 1:Nit
112
113 % include all boundary points for u and v (linear extrapolation
114 % for ghost cells) into extended array (Ue,Ve)
115 Ue = ...
116 Ve = ...
117
118 % averaged (Ua,Va) of u and v on corners
119 Ua = ...
120 Va = ...
121
122 % construct individual parts of nonlinear terms
123 dUVdx = ...
124 dUVdy = ...
125 dU2dx = ...
126 dV2dy = ...
127
128 % treat viscosity explicitly
129 viscu = ...
130 viscv = ...
131
132 % buoyancy term
133 % IF TEMPERATURE: fy = ...
134
135 % compose final nonlinear term + explicit viscous terms
136 U = U + dt/Re*... - dt*(...);
137 V = V + dt/Re*... - dt*(...) + % IF TEMPERATURE: dt*fy;
138
139 % pressure correction, Dirichlet P=0 at (1,1)
140 rhs = (diff( ... )/dx + diff( ... )/dy)/dt;
141 rhs = reshape(rhs,Nx*Ny,1);
142 rhs(1) = ...
143 P = Lp\rhs;

Computational Fluid Dynamics SG2212/SG3114, Spring 2016 21
144 % alternatively, you can use the pre-computed LU decompositon
145 % P = ULp\(LLp\rhs);
146 % or as another alternative, reformulate HW6 as function
147 % and call it here:
148 % [PP,msoriter] = GS_SOR_solver(PP,rhs,Lp,Nx,Ny,dx,dy,1.95,1e-4);
149 P = reshape(P,Nx,Ny);
150
151 % apply pressure correction
152 U = U - ...
153 V = V - ...
154
155 % Temperature equation
156 % IF TEMPERATURE: Te = ...
157 % IF TEMPERATURE: Tu = ...
158 % IF TEMPERATURE: Tv = ...
159 % IF TEMPERATURE: H = ...
160 % IF TEMPERATURE: T = T + dt*H;
161
162 %-----------------------------------------
163
164 % progress bar
165 if floor(51*k/Nit)>floor(51*(k-1)/Nit), fprintf(’.’), end
166
167 % plot solution if needed
168 if k==1|floor(k/ig)==k/ig
169
170 % compute divergence on cell centres
171 if (1==1)
172 div = diff([uW;U;uE])/dx + diff([vS’ V vN’],1,2)/dy;
173
174 figure(1);clf; hold on;
175 contourf(avg(x,2),avg(y,2),div’);colorbar
176 axis equal; axis([0 Lx 0 Ly]);
177 title(sprintf(’divergence at t=%g’,k*dt))
178 drawnow
179 end
180
181 % compute velocity on cell corners
182 Ua = ...
183 Va = ...
184 Len = sqrt(Ua.^2+Va.^2+eps);
185
186 figure(2);clf;hold on;
187 %contourf(avg(x,2),avg(y,2),P’);colorbar
188 contourf(x,y,sqrt(Ua.^2+Va.^2)’,20,’k-’);colorbar
189 quiver(x,y,(Ua./Len)’,(Va./Len)’,.4,’k-’)
190 axis equal; axis([0 Lx 0 Ly]);
191 title(sprintf(’u at t=%g’,k*dt))
192 drawnow

Computational Fluid Dynamics SG2212/SG3114, Spring 2016 22
193
194 % IF TEMPERATURE: % compute temperature on cell corners
195 % IF TEMPERATURE: Ta = ...
196
197 % IF TEMPERATURE: figure(3); clf; hold on;
198 % IF TEMPERATURE: contourf(x,y,Ta’,20,’k-’);colorbar
199 % IF TEMPERATURE: quiver(x,y,(Ua./Len)’,(Va./Len)’,.4,’k-’)
200 % IF TEMPERATURE: axis equal; axis([0 Lx 0 Ly]);
201 % IF TEMPERATURE: title(sprintf(’T at t=%g’,k*dt))
202 % IF TEMPERATURE: drawnow
203
204 % Time history
205 if (1==1)
206 figure(4); hold on;
207 tser = [tser k*dt];
208 Tser = [Tser Ue(ceil((Nx+1)/2),ceil((Ny+1)/2))];
209 plot(tser,abs(Tser))
210 title(sprintf(’Probe signal at x=%g, y=%g’,...
211 x(ceil((Nx+1)/2)),y(ceil((Ny+1)/2))))
212 set(gca,’yscale’,’log’)
213 xlabel(’time t’);ylabel(’u(t)’)
214 end
215 end
216 end
217 fprintf(’\n’)

Computational Fluid Dynamics SG2212/SG3114, Spring 2016 23
B.2 DD template.m
1 function A = DD(n,dx)
2 % DD(n,dx)
3 %
4 % One-dimensional finite-difference derivative matrix
5 % of size n times n for second derivative:
6 % dx^2 * f’’(x_j) = -f(x_j-1) + 2*f(x_j) - f(x_j+1)
7 %
8 % Homogeneous Neumann boundary conditions on the boundaries
9 % are imposed, i.e.
10 % f(x_0) = f(x_1)
11 % if the wall lies between x_0 and x_1. This gives then
12 % dx^2 * f’’(x_j) = + f(x_0) - 2*f(x_1) + f(x_2)
13 % = + f(x_1) - 2*f(x_1) + f(x_2)
14 % = f(x_1) + f(x_2)
15 %
16 % For n=5 and h=1 the following result is obtained:
17 %
18 % A =
19 %
20 % -1 1 0 0 0
21 % 1 -2 1 0 0
22 % 0 1 -2 1 0
23 % 0 0 1 -2 1
24 % 0 0 0 1 -1
25 %
26 % This function belongs to SG2212.m
27
28 A = spdiags( ... )/...;
29
30 % "spdiags" generalises the function "diags" such that multiple
31 % vectors can be provided which are then put on the
32 % respective diagonals. In addition, sparse storage is used.
33 % See "help spdiags" for more information.

Computational Fluid Dynamics SG2212/SG3114, Spring 2016 24
B.3 avg template.m
1 function B = avg(A,idim)
2 % AVG(A,idim)
3 %
4 % Averaging function to go from cell centres (pressure nodes)
5 % to cell corners (velocity nodes) and vice versa.
6 % avg acts on index idim; default is idim=1.
7 %
8 % This function belongs to SG2212.m
9
10 if nargin<2, idim = 1; end
11
12 if (idim==1)
13 B = (A( ... , ... )+A( ... , ... ))/2;
14 elseif (idim==2)
15 B = (A( ... , ... )+A( ... , ... ))/2;
16 else
17 error(’avg(A,idim): idim must be 1 or 2’)
18 end