project title: p1: control methodologies of distributed...
TRANSCRIPT
1
1
Project title: P1: Control methodologies of Distributed Generation for enhanced network stability and control – (UQ)
Milestone 4 Report: Progress on formulation of methodology and preliminary studies (submitted 18 months from the beginning of the project - December 2009)
Project Leader & investigator: Prof. Tapan Saha Investigators: Dr. Mithulan Nadarajah and Dr. Jai Singh PhD Students: Mr. Tareq Aziz & Mr. Sudarshan Dahal,
The University of Queensland, St. Lucia, Brisbane

2
2
1. Introduction
Large scale integration of distributed generation (DG) has the potential to cause major power system
stability issues for a distribution network. For large scale integrations, Voltage-VAR and small signal
stability have been found to be the major issues affecting power system operation. To find solutions to
these issues computer simulations of DG integration into a distribution system have been conducted.
These simulations include various combinations in the number, location and penetration level of
renewable energy sources generating energy into a distribution network. In addition, over the last six
months a number of MATLAB tools have been developed to understand the impacts in a selected
distribution system. It has been identified that low voltage is one of several issues, which can cause the
initiation of load curtailment and is also a trigger to initiating voltage instability or voltage collapse. To
mitigate load curtailment, a new methodology for the optimal placement of capacitors in a distribution
system has been proposed in this report. The report is structured with three subsections as follows:
• Voltage Stability
• Small Signal Stability
• Optimal capacitor placement
Publications arisen from the research during this period:
• T. Aziz, T. K. Saha, N. Mithulan, “Distributed Generators Placement for Loadability
Enhancement based on Reactive Power Margin”, Proceedings of The 9th International Power
and Energy Conference IPEC2010, 27 - 29 October 2010, Singapore.
• S. Dahal, N. Mithulan, T. K. Saha, “Investigation of Small Signal Stability for Renewable
Energy based Electricity Distribution System”, Proceedings of IEEE Power & Energy Society
General Meeting, Minneapolis, USA, July 25-29, 2010.
Three reports have been submitted from project 1 during the first year of research. Those reports included a
literature review and background technology progress on deployment of renewable energy based
distributed generation (DG) at electricity network of distribution voltage level and their consequences in
power systems operation and control. Models of different elements of power systems including DG based
technologies, transmission/distribution networks and loads were reported in one of the previous reports.

3
3
2.0 Voltage Stability Study
2.1 -Introduction
Voltage stability of a power system relates to maintaining control of adequate bus voltage levels over the
entire power system[1]. Any interruption in a power system, which makes the system voltage decay to a
level from which it is unable to recover, is known as voltage instability, and this may lead to a partial or
full power failure in the system, which is popularly known as voltage collapse.
With the increased share of DG in the distribution system, allocation and sizing of DG units has become
the most important concerns for power system stability. Inappropriate selection of location and size of DG
units may lead to increased system losses and an unacceptable voltage profile as have been found in
several studies [3],[4]. Studies on selecting proper location of DG is a comparatively new area of research,
unlike selecting the location for reactive power compensators. The current methodologies can be classified
into two main categories as follows:
(i) Methods based on an artificial intelligence techniques (e.g. genetic algorithm)[6],[7].
However this method demands a large amount of computational time and hence, resulting in slow
convergence.
(ii) Methods using iterative or repetitive load flow techniques.
This analytical method with repetitive load flow stands as the second method to decide the locations
for DG in distribution systems [8-10]. Ref. [8] and [9] however optimizes only location, keeping the
size of DG constant. For example ref. [8] uses tangent vectors for ranking buses and selects the best
location for only one type of DG i.e. synchronous generator keeping its size constant. Ref. [10]
optimizes both location and size but it considers DG as a real power source without considering its
reactive power aspect.
Using selection and placement methods from either category requires a study of the voltage stability for a
distribution system. Voltage stability studies often require detailed analysis of system states, pre-
contingency and post-contingency cases from a static and dynamic perspective. It has been found that
static analysis is computationally less extensive than dynamic analysis and provides a fast global overview
into reactive power problems. Static voltage stability is also more feasible for large studies to understand
the impact of DG units in a radial distribution system [2]. In this study, proper location and size of DG has

4
4
been proposed for maintaining voltage stability and enhancing the loadability of the distribution system
using repetitive load flow techniques from a static perspective.
Although there are different types of electric machines in DG technology [11] most distributed generation
units (wind generation plant, bagasse based plant and hydro power plant) employ induction and
synchronous machines [12]. A synchronous generator injects both real and reactive power into the system,
whereas an induction generator can only inject real power with the consumption of reactive power from the
grid. Drawing reactive power from the grid results in an increased amount of loss to the connected system
[13]. Both types of machines are considered, which ultimately brings in the reactive power issue.
Depending on the chosen voltage stability indices, the buses of a primary distribution system have been
ranked first, which limits their number for placing DG units resulting in a reduced number of load flow
computations. Then based on those results along with loadability study a decision is made for placement
of synchronous (SG) and induction (IG) generators in the system. Finally, the sizes of each DG on specific
buses are determined with an objective of enhancing loadability along with reduction of grid losses below
the base case (with no DG in the system). Once the location and sizing issue has been addressed, the
present study attempts to find out the combined effect of both types of generation on system loadability.
The analysis is concluded by considering the effect of inclusion of photovoltaic plants in the test system on
system loadability.
2.2 Distributed Generators in Study:
A distributed generator is defined as an electric power source connected to a distribution system with
generation from a few kWs up to 50MW [14]. At present, most DG units are employing either
synchronous or induction generators with a variety of primary resources. Synchronous generators
connected to a distribution network are mostly operated with constant active power as their primary fuel
resource is not very volatile (bagasse based CHP plant, gas turbines, solar thermal plants and internal
combustion engines). In recent years, the permanent magnet synchronous generator has been the
conventional one used for variable speed wind turbine with full scale frequency converter [15]. There are
two control strategies adopted for synchronous machines – Voltage regulated strategy and power factor
control strategy [16]. At present, distributed generators are not actively taking part in voltage regulation of
distribution systems [1]. Power factor control mode is usually adopted by the independent power producers
(IPPs) as their target is to maximize the active power production [17]. So the second form of control (i.e.
power factor control mode) has been employed in this research, where the controller set point was set to a

5
5
fixed power factor. The active and reactive power generation of a synchronous generator can be expressed
as given in (2.1) and (2.2), respectively [2].
( )1.2sincos δφt
EsXqE
tI
tE
GP ==
( )2.22
cossinsXtE
tE
sXqE
tI
tE
GQ −== δφ
Where, t
E is the terminal voltage of the generator with per unit system and fd
iad
Xq
E = represents the
excitation voltage due to field currentfd
i . Here, s
X andδ represents synchronous reactance and internal
rotor angle, respectively. But for a given real power output of a synchronous generator the reactive power
generation is bounded by both armature and field heating limits.
Because of the subtle nature of wind, induction generators are largely used in wind power plants [15].
Applications of induction generators are also found in micro turbines of small hydro plants and internal
combustion engines. In this paper, the squirrel cage rotor induction generator has been employed, which
consumes reactive power from the system with an injection of real power. With a terminal voltage t
E and
rotor current2
I , the real and reactive power generated by the induction generator is given in (2.3) and (2.4)
[18].
( )3.2)*2
Re( It
EG
P =
( )4.2)*2
Im( It
EG
Q =
Where
( ) ( )( ) ( )5.2//// 122222ZjXsRjXjXsRjXE mmtI ++++=
And ( )6.2111 jXRZ +=
Here, 1R =Stator resistance, 1X = Stator leakage reactance, mX = Magnetizing reactance, 2R = Rotor
resistance (referred to stator), 2X = Stator leakage reactance (referred to stator).
When an induction generator is placed on a bus, a portion of reactive power is usually locally supplied
[12]. Here the capacitor size will be decided later depending on the grid loss in the presence of the
induction generator. A number of static voltage stability indices are explored in this research and are
presented in detail.

6
6
2.3 Static Voltage Stability and Indices:
Voltage instability leading to voltage collapse is one of the most important concerns in today’s stressed
distribution system. One of the principle factors of voltage collapse has been identified as the increased
load demand, which is generally accompanied by an increase in reactive power demand. So voltage
instability problems can be considered as a problem of shortage of reactive power. Distance to collapse can
be measured in terms of different physical quantities such as loadability, reactive power reserve etc. Also,
a number of performance indices have been developed by researchers to understand proximity to voltage
collapse [19]. Most of these indices are based on classical P-V and Q-V curve analyses. Typical Q-V and
P-V curves are shown in Figs. 2.1 and 2.2, respectively. Fig. 2.1 popularly referred as Q-V curve, which
depicts the variation in bus voltages with respect to changes in loading and reactive power support,
respectively.
Fig.2.1 Sample Q-V curve and reactive power margin
Fig.2.2 Example P-V curve.
On the other hand, Fig. 2.2 shows a P-V or “nose curve” obtained with the help of continuation power flow
or repetitive load flow to get an idea about the loadability of the system.

7
7
A. System Loadability
Loadability limit has been defined as the point where the load demand reaches a maximum value and
beyond that limit the power flow solution fails to converge and the system can no longer operate [2]. If the
load is considered as constant power the loadability limit relates to the maximum deliverable power to a
bus or a set of buses in a system [20]. So maximizing loadability has been a good choice for the
distribution system operator to optimize their resources and maximize their profits.
B. Reactive Power Margin
Reactive power margin is measured as a distance between the lowest MVAr point of the Q-V curve and
voltage axis (Fig. 2.1)[1],[20]. The negative values of reactive supply indicate the increasing reactive load.
Thus reactive power margin indicates how much further the loading on that particular bus can be increased
before its loading limit is exceeded and voltage collapse takes place. Reactive power margins are used in
[21] to evaluate voltage instability problems for coherent bus groups. These margins are based on the
reactive reserves on generators, SVCs and synchronous condensers that exhaust reserves in the process of
computing a Q-V curve at any bus in a coherent group or voltage control area. In this study, this index is
used to measure the strength of buses of a primary distribution system with a single feeder. The validity of
this index in our study will be justified by another index i.e. voltage sensitivity factor which has been used
earlier for the same purpose [8].
C. Voltage Sensitivity Factor
Based on the general concept, SF (sensitivity factor) index for a system represented by ( )λ,zF can be
defined as λd
dzSF = [22]. When SF becomes large, the system becomes insecure and can lead ultimately
to collapse. Here the system voltages are checked with respect to the change in loading as shown in Fig.
2.2, which results in a Voltage Sensitivity Factor (VSF) calculated asdPdV
VSF = . High sensitivity means
even small changes in loading results in large changes of voltage magnitude. Therefore, high voltage
sensitivities are indicative of a weak area in the system. With the combined results from measurement of
these two indices the methodology described in the following section has been used to identify the correct
location and size of DG in the studied distribution system.
2.4 Results and Discussions from Voltage Stability Study: [71]
This section aims at finding the best location first then followed by the sizing issue for loadability
enhancement. The location has been ranked individually for two different types of DG units- Synchronous

8
8
generator and Induction generator with an objective of loadability and reactive power margin
enhancement. Then the size of these machines has been decided with a dual target of maximizing
loadability and minimizing grid losses. Before dealing with the details of stability indices and results, the
studied test system is described in brief and then followed by power flow study with DG penetration and
proper selection of placement and sizes of DG units.
2.4.1 Test Distribution System and Analysis Tool
In this study, the 16 bus distribution as shown in Fig 2.3 is used, which is a 23 kV balanced system with a
total load of 28.7MW and 17.3MVAr. This system is a modified form of the one used in [23]. Detailed
system data has been provided in Table 2.1. The principle reason behind choosing this modified 16 bus
system for the static voltage stability analysis is its simplicity and it is easy to visualize the impact of
distributed generation units. Because of the simplicity the test case offers scope for evaluating various
aspects of voltage stability and load balancing issues.
All the results presented in this report were simulated with the DIgSILENT PowerFactory 14.0 [24] and
also have been verified using the MatLab based PSAT software tool[25].
Fig.2.3. Single line diagram of 16-bus test distribution system

9
9
TABLE 2.1
DATA OF THE TEST EXAMPLE SYSTEM
Bus to
Bus
Section Resistance
(p.u.)
Section Reactance
(p.u.)
End Bus
Load (MW)
End Bus
Load
(MVAr)
End Bus
Capacitor(MVA
r)
4-1 0.075 0.1 0.0 0.0
5-4 0.08 0.11 2.0 1.6
4-6 0.09 0.18 2.0 0.8 1.2
6-7 0.04 0.04 1.5 1.2
2-8 0.11 0.11 4.0 2.7
8-9 0.08 0.11 5.0 3.0 1.2
8-10 0.11 0.11 1.0 0.9
9-11 0.11 0.11 0.6 0.1 0.6
9-12 0.08 0.11 4.5 2.0 3.7
13-3 0.11 0.11 0.0 0.0
14-13 0.09 0.12 1.0 0.9
13-15 0.08 0.11 1.0 0.9
15-16 0.04 0.04 2.1 1.0 1.8
11-5 0.04 0.04 3.0 1.5 1.1
10-14 0.04 0.04 1.0 0.7 1.8
2.4.2 Ranking of Bus Strength Based on Voltage Stability Indices
A ranking of buses in this test system is made using the calculation of reactive power margin and VSF of
system buses. Figs 2.4 and 2.5 show the reactive power margin and VSF, respectively for all the load buses
in the 16 bus system. As can be observed from Fig. 2.4, bus 8 has the highest margin of 150.35MVAr,
whereas bus 7 has the lowest margin of only 22.94MVAr. If we expand the concept of this index it can be
argued that when an amount of reactive power equal to reactive power margin is drawn from that bus by
loads then it may experience voltage collapse. So our study clearly defines bus 8 as the strongest bus and
bus 7 as the weakest bus.
Fig. 2.5 plots VSF of all load buses near to the point of collapse when the maximum value of loadability
or loading point has been reached (here this value is 2.615 times the base load). High sensitivity means
even small changes in loading can cause large changes in voltage magnitude. Therefore, high voltage
sensitivities are indicative of a weak area in the system. Thus bus 7 comes out as the weakest bus while bus

10
10
8 stands out as the strongest bus, even in terms of VSF. After closely examining these two plots together
we can make a ranking of buses based on their strengths. Here, Table 2.2 represents the first four weak
buses whereas Table 2.3 shows the first four strong buses. For example, in Table 2.2 bus 7 stands out as
the weakest bus with the lowest reactive power margin (22.94MVAr) as well as the highest sensitivity
factor (0.038161 p.u. voltage/MW). On the contrary, in Table 2.3 bus 8 appears as the strongest bus with
the highest reactive power margin (150.35MVAr) and the lowest VSF (0.002927p.u. voltage/MW).
Reactive power issues need extra attention while placing DGs on the buses listed in these tables.
Fig. 2.4 Reactive power margin of load buses of the test system
Fig. 2.5 Voltage Sensitivity Factor of load buses of the test system.

11
11
TABLE 2.2
WEAK BUSES
Bus No. Reactive power Margin
(MVAr)
VSF
(Voltage p.u./MW)
7 22.94 0.038161
6 24.41 0.036145
1 27.78 0.028193
4 32.54 0.026833
TABLE 2.3
STRONG BUSES
Bus No. Reactive power Margin (MVAr) VSF
(Voltage p.u./ MW)
8 150.35 0.002927
10 78.22 0.005134
9 74.34 0.006029
14 65.97 0.008107
2.4.3 Selection of proper location for Synchronous and Induction Generator
According to results shown in Table 2.2, the weak buses having low reactive power margins are already
operating with a deficiency in reactive power. So if some DG units which consume reactive power are
placed on these buses it might cause voltage problems and instability. However, we can use the large
reactive margin of strong buses to help these types of DG units. To find the effect of DG units on reactive
power margin, induction (IG) and synchronous (SG) generators are placed separately on weak areas and
the resulting reactive power margins are plotted in Figs 2.6 and 2.7 respectively. Here we have considered
the volatility of primary resources (i.e. wind) for IG which has been reflected in the plot by taking 3
different levels of real power injection. These 3 levels of real power injection have been chosen based on
different percentages of DG penetration into the system. The total system load was 28.7MW i.e. in the

12
12
order of 30MW. So we have chosen 2 different machine sizes - 3MW (around 10% of total demand), 6MW
(around 20% of total demand) and the base case with no DG (0MW representing 0% penetration). This
study can be extended for increasing penetration of DG based on the availability of primary resources. To
keep consistency in comparison of results we have assumed the same value of real power injection from
the SG. As mentioned earlier the synchronous machines used in this study are operated in power factor
control mode with a power factor of 0.8.
Fig. 2.6 Change in Reactive Power Margin in weak area with inclusion of IG.
Fig. 2.7 Change in Reactive Power Margin in weak area with inclusion of SG.
These two plots clearly demonstrate that the inclusion of IG on the weak buses does not improve the
reactive power margin or strength of these buses. For example, the reactive power margin of bus 7 remains
unchanged at around 23 MVAR with the change in real power injection. The same situation exists with
other buses in the weak area. But with the inclusion of SG this margin and strength has great improvement,

13
13
which is more prominent with higher real power injection by the machines. Here it is observed that the
reactive power margin of bus 7 increases from 22.94MVAr to 29.74MVAr with an increase in real power
injection by the synchronous generator from 0MW to 6MW. So the increase in reactive power margin
indicates the growing strength of the weak buses in the presence of the synchronous generator, which is not
achievable with an induction generator on weak buses.
System loadability is clearly affected with the inclusion of a DG into the system. The results have been
shown for two different types of DG units with increasing sizes: synchronous generator in Fig. 2.8 and
induction generator in Fig. 2.9. With the increase of size in SG, loadability improves in every case (greater
than the base case loading margin = 2.615 p.u.). But in this study, it has been found that the rate of increase
of loadability with respect to machine size is higher for the weak buses than the strong buses. In a real
scenario this loadability improvement with increasing machine size is limited by the thermal limit of the
network components.
But as the size of the induction machine is increased the loadability decreases for almost every bus
except the buses in the strong area (as mentioned in Table 2.3). The rate of increase of loadability with IG
is much lower than SG and tends to decrease with machine size.
Fig. 2.8 Variation in Loadability with the change of Synchronous machine size

14
14
Fig. 2.9 Variation of Loadability with the change of Induction machine size.
It can be highlighted that in order to enhance the overall loadability and reactive power reserve of the
studied distribution system, the synchronous generators need to be placed on weak buses (buses 7, 6, 1 and
4 as in Table 2.2) and the induction generators need to be placed on strong buses (buses 8,10,9 and 14 as in
Table 2.3). The next section will demonstrate the study outcome for the determination of size of
synchronous generator, which will be followed by the induction generator for the 16 bus distribution
system.
2.4.4 Determining the Size of Synchronous Generator
As the synchronous machine loadability keeps on improving with increasing machine size, the optimal size
is determined by the size which corresponds to minimum grid loss. It is obvious that with the inclusion of
DG on a bus losses in the system start to decrease, but beyond the optimal size the grid losses may increase
again and may exceed the base case loss. So the optimal size of synchronous generator should be chosen
based on loss minimisation. Fig. 2.10 shows the variation of loss with increasing synchronous machine size
on bus 7. However, in practice another important factor that should be considered is that DG is not
designed to supply reactive power. Usually the grid/feeder is designed to supply the amount of reactive
power required by system demand from the generator and compensating devices. So when SG units are
placed in the system and the total reactive power demand of the system is delivered from that SG then
there will be zero reactive power flow from the remaining grid into the DG connected system. So this is the
maximum size of synchronous machine to be connected on a particular bus in the test system. Based on a
number of load flows with increasing size of synchronous machine the optimal sizes for synchronous
generators are determined and shown in Table 2.4 for all the weak buses in the test system. Any SG with a

15
15
rated value lower/greater than this optimal value will result in a greater amount of real and reactive power
losses in the system. With this optimal size, the reactive power intake of the feeder becomes zero as shown
in Fig. 2.10. According to findings shown in Table 2.4, placement of a synchronous machine of around
10MW on any of the weak buses will reduce the grid loss by more than 50% of the original power loss.
Fig. 2.10 Change in Grid losses and Reactive power intake with Synchronous machine size.
TABLE 2.4
OPTIMAL SIZE OF SYNCHRONOUS GENERATOR
Bus
No.
Machine
Size(MW)
with
p.f.=0.8
Grid loss (MW) Grid loss (MVAr) λ (p.u.)
Without SG With SG Without SG With SG
7 9.81 1.78 0.80 1.95 0.93 3.39
6 9.76 1.78 0.76 1.95 0.89 3.38
1 9.86 1.78 0.81 1.95 0.91 3.22
4 9.68 1.78 0.70 1.95 0.77 3.23
2.4.5 Determining the Size of Induction generator
With the placement of an induction generator the loadability of the system starts to decrease after a certain
machine size as shown in Fig 2.9. So the optimal size would be that size of induction generator, which
corresponds to maximum loadability. The inclusion of an induction machine in the distribution system

16
16
usually results in a greater amount of grid loss as mentioned earlier and this amount of loss is always more
than with a SG in the system. Also the reactive power consumption through the grid tends to increase with
increasing machine size. Fig. 2.11 shows the change in MW loss and reactive power intake in the system
with the increase of induction machine size (rated mechanical power) placed on bus 14. However, it is
possible to limit the amount of grid loss lower than the base case up to the optimal size of the induction
machine on a particular bus. As a result these two issues of loadability and grid loss are combined to
decide the optimal size of the induction generator. With a primary objective of maximizing loadability the
grid loss is calculated with increasing machine sizes. The optimal/maximum size as shown in Table 2.5
represents the machine for specified buses, which offers maximum loadability with grid loss lower than the
base case.
It is interesting to note that the optimal size of induction generator at bus 8, which is the strongest bus in
the system, turns out to be 21MW though the system demand is around 30MW. However, in other
locations, the optimal sizes are in the range of 2.2MW up to 9MW which is around 30% of the total
demand.
Fig. 2.11 Change in Grid losses and reactive power intake with Induction machine size.

17
17
TABLE 2.5
OPTIMAL SIZE OF INDUCTION GENERATOR
Bus No. Machine Size
(MW)
Grid Loss (MW) Grid Loss (MVAr) λ (p.u.)
With
out IG
With IG Without IG With IG
8 21 1.78 1.14 1.95 1.30 2.66
10 9 1.78 1.36 1.95 1.53 2.61
9 7.5 1.78 1.23 1.95 1.34 2.34
14 2.2 1.78 1.62 1.95 1.79 2.58
With an IG connected to the system, if the volatile primary resource (e.g. wind) becomes zero then the
real power injection turns to zero. But the reactive power consumption is still there, which creates a
significant amount of grid loss greater than the base case. To keep the loss always lower than the base case
loss we need to provide reactive power compensators on buses with IG, which can support the worst case.
The minimum values of compensation which will bring the loss to most equal the base case loss has been
worked out and shown in Table 2.6. For example, placing a capacitor with a minimum value of 1.6MVAr
at bus 9 (with the specified size of 7.5MW induction machine) results in a grid loss of 1.78MW at zero real
power injection. This loss equals the amount of loss found with 0% penetration of DG in the system. This
will be further studied in the last section of the report with an optimisation tool.
TABLE 2.6
MINIMUM SIZE OF COMPENSATOR
Bus No. Induction Machine
Size (MW)
Grid Loss (MW)
Compensator size
(MVAr)
With
out IG
With IG (Real
power injection =0)
8 21 1.78 1.78 3
10 9 1.78 1.78 1.9
9 7.5 1.78 1.78 1.6
14 2.2 1.78 1.78 0.5

18
18
2.4.6 Case Study: Combined Effect on System Parameters
Depending on the available resources, there might be various types of DG units available in the same
distribution system. So this part of the study investigates the combined effect of various DG units on the
overall system loadability. Table 2.7 shows the voltage profile on the buses connected to different DG
units. Here the synchronous machine and induction generator with different sizes has been connected to
weak bus 6 and strong bus 10, respectively as proposed from the earlier part of this study. Here 10%
(3MW) and 20% (6MW) inclusion of DG real power has been considered. Table 2.8 includes a
photovoltaic plant of 1MW at bus 7, which operates with unity power factor and it goes through the same
sets of combinations to get the voltage profile and system loadability.
TABLE 2.7
COMBINED EFFECT ON VOLTAGE PROFILE AND LOADING MARGIN BY SG AND IG
IG Size
(MW) at
bus 10
SG Size (MW)
at bus 6 with
pf = 0.8
PV Plant
Size (MW)
with pf=1.0
Loading
margin (p.u.)
Voltage at
Bus 10 (p.u.)
Voltage at
Bus 6 (p.u.)
Voltage at
Bus 7 (p.u.)
0 0 0 2.615 0.948 0.902 0.901
0 3 0 2.855 0.955 0.938 0.937
3 0 0 2.615 0.951 0.904 0.903
3 3 0 2.791 0.959 0.940 0.939
0 6 0 3.094 0.962 0.972 0.970
6 0 0 2.615 0.954 0.906 0.905
TABLE 2.8
COMBINED EFFECT ON VOLTAGE PROFILE AND LOADING MARGIN BY SG, IG AND PV PANEL
IG Size
(MW) at
bus 10
SG Size (MW)
at bus 6 with
pf = 0.8
PV Plant
Size (MW)
with pf=1.0
Loading
margin (p.u.)
Voltage at
Bus 10 (p.u.)
Voltage at
Bus 6 (p.u.)
Voltage at
Bus 7 (p.u.)
0 0 1 2.663 0.949 0.909 0.908
0 3 1 2.919 0.957 0.944 0.944
3 0 1 2.662 0.953 0.911 0.91
3 3 1 2.831 0.96 0.946 0.945
0 6 1 3.159 0.964 0.977 0.976
6 0 1 2.655 0.956 0.913 0.912

19
19
From the results in Table 2.7, it can be summarised that with increasing size of SG machine, both the
loadability and voltage profile improve significantly. Presence of both types of generators with 20% real
power injection results in a loading margin of 2.791 p.u. which is obviously greater than the base case with
no DG (2.615 p.u.). However, Table 2.8 shows that the inclusion of PV panels at bus 7 results in increasing
loadability with increasing size of IG machine, which was almost fixed before the connection of the PV
panels to the system. For example, from Table 2.7 it has been found that a 6MW IG on bus 10 results in a
loading margin of 2.615 whereas, if PV panel of 1MW is present at bus 7, the loading margin goes up to
2.665.
2.5 Summary of Voltage Stability study
The IEEE 16 bus distribution level power network has been investigated with a focus towards voltage-var
issues with different levels of deployment of DG’s at different locations with different size. A
methodology has been developed based on Q-V curve analysis to determine the location and size of two
major classes of DG-synchronous and induction generators considering the reactive power issues of the
system and of these machines. P-V analysis has also been carried out to investigate the loadability of the
system. Proposed algorithms have the potential for ranking the buses, which leads to the final selection of
sites for SG and IG for an overall improvement of reactive power reserve and loadability. It has been
observed that the placement of a synchronous generator on a weak bus improves the loadability of the
system. It is interesting to note that the rate of improvement of loadability for SG on a weak bus is greater
than where SG is placed on a strong bus. On the other hand it has been observed that induction generators
need to be placed on strong buses in order to enhance the loadability. In this study, a sequential increase
and decrease of SG and IG has been investigated for observing its impact on loadability and system loss.
Once the locations have been fixed, the size of these machines have been calculated individually where
loadability and grid loss are considered together to achieve an optimal solution. For fixing the synchronous
machine size, preference has been given to grid loss minimization as loadability continues to improve with
increasing machine size. It has been found that at the optimal size of synchronous machine the reactive
power intake from the feeder becomes zero. For induction machine sizing, preference has been given to
loadability as it tends to decrease after a certain machine size on a specific bus. Two lookup tables - Table
2.4 and Table 2.5 have been formulated which can be used to restrict the size of each type of DG in the
system. However, in reality an independent power producer would opt for the closest match to the sizes
mentioned in the market and deviations in grid loss and loadability due to this choice should be within the
tolerable range. But whenever a new DG comes into the system these tables need to be updated with new

20
20
calculations with the presence of the existing DGs in the system. This work has been accepted for the
proceedings of 9th International Power and Energy Conference IPEC-2010 to be held in Singapore, during
27 - 29 October 2010 [71].
The combined effect of different types of DGs in a single test system has also been explored, which shows
significant effects on system parameters by different penetration levels of DG power. The results found in
this study can be validated in future by applying the proposed methodology to different distribution
systems with varying size and complexity and also with varying load volumes in the system. Further
studies will be carried out with urban and rural distribution networks. The impact of load modelling will
also be carried out in the future. Dynamic voltage stability studies are required to verify the impact of static
voltage stability and this will be conducted in the next reporting period.

21
21
3.0 Investigation of Small Signal Stability of a Renewable Energy based Electricity Distribution
System [72]
3.1 Introduction & Background
The introduction of renewable energy resources has introduced induction generators consuming reactive
power (such as conventional wind generators) and inverter operated static generators (such as solar PV
generators) which do not have rotating mechanical parts. In addition the power injections from these
generators depend upon the weather conditions, i.e. wind velocity and solar irradiation. When these
generators are operated in parallel with conventional synchronous generators they impose new challenges
to stability, operation and control of the power system and its components [26]. With the increasing
penetration of induction machines as wind generators, the concern on rotor oscillations and stability of
induction generators on the distribution system has increased. References [27-29] have reported the
induction machines rotor oscillations, which are relatively less studied than synchronous machine rotor
oscillations. As already mentioned, solar photovoltaic generators are basically treated as inverter based
active power generators without rotating mechanical parts and are modelled as static generators in stability
simulations [30].
Some studies show that the penetration of induction generators increases the damping of the power system
by effectively reducing the inertia of the system [31, 32]. Similar results are reported with the penetration
of PV generators [33]. Results of the analysis depend on the generator model. For example, in the case of
doubly fed induction generator (DFIG) applications, the controllers decouple the mechanical modes with
electrical modes [34]. However for squirrel cage induction generators (SCIG) there is a strong coupling
among rotor mechanical and electrical modes [35]. Hence the two machines act differently in regards to
system stability, i.e. the stability results obtained by employing DFIG cannot be the same for that obtained
by employing SCIG.
The existing literatures mainly deal with the dynamic stability of a large power system focusing on the
stability of synchronous generators [33, 34]. Due to their unregulated power output new generators may
impose a serious threat to the dynamic stability of a distribution system, which has not yet been reported in
detail in the literatures thus far. In this research, small signal stability of a renewable energy based
distribution system is investigated with the aid of a proposed sensitivity parameter.
The next section presents dynamic modelling of the generators, loads and the distribution system, which is
then followed by the oscillatory behaviour of the distribution system by eigenvalue analysis. Then the

22
22
impact of increased penetration of renewable resources on oscillatory modes is investigated and finally
oscillatory behaviour of the system is studied by time domain analysis. Different behaviour of voltage
controlled and power factor controlled synchronous generators is also presented. Finally the conclusions
drawn from the observations are explained.
3.2 System Modelling
For stability studies, power systems are modelled using a set of differential equations and a set of
algebraic equations as given in (3.1) [36].
( )( )⎩
⎨⎧
==
plyxgplyxfx
,,,0,,,& (3.1)
where x is a vector of state variables, y is a vector of algebraic variables, l and p are uncontrollable and
controllable parameters, respectively.
In general, elements that should be considered in the modeling of a power system for various stability
studies are generators, generator controllers, transformers, transmission lines (including subtransmission
lines) and loads. The modeling approach adopted in this report is explained below.
A) Generator Modelling 1) Synchronous generators: Most of the distributed generation applications today employ synchronous
generators for power conversion [26]. They can be used in thermal and hydro power applications.
Since the generators connected at the distribution system do not take part in frequency regulation
the mechanical torque of the generator is assumed constant. In transient stability analysis
synchronous generators are represented by a sixth order model [36]. Usually synchronous
generators are connected to distribution systems as constant active power sources operating at
power factor control mode. However, depending upon their capability they may support the voltage
by providing reactive power as well. In this report both operations of synchronous generator have
been considered. For voltage control mode the reactive power limit has been defined.
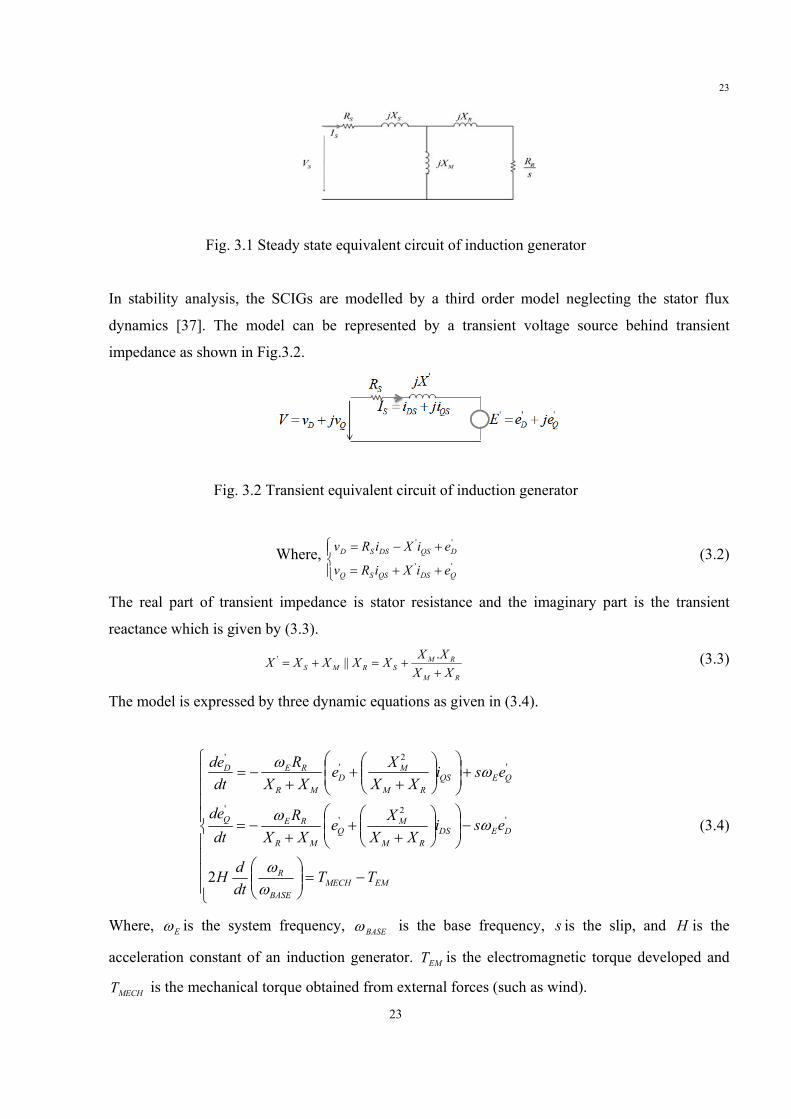
2) Induction Generator: The induction generators are popularly employed in wind power generation
applications, small and micro hydro and some thermal plants[26, 37]. Similar to synchronous
generators, the mechanical torque is assumed to be constant as well. The squirrel cage induction
generator (SCIG) model has been considered. The steady state equivalent circuit of an SCIG is
shown in Fig. 3.1.
23
23
Fig. 3.1 Steady state equivalent circuit of induction generator
In stability analysis, the SCIGs are modelled by a third order model neglecting the stator flux
dynamics [37]. The model can be represented by a transient voltage source behind transient
impedance as shown in Fig.3.2.
Fig. 3.2 Transient equivalent circuit of induction generator
Where, ⎪⎩
⎪⎨⎧
++=
+−=''
''
QDSQSSQ
DQSDSSD
eiXiRv
eiXiRv (3.2)
The real part of transient impedance is stator resistance and the imaginary part is the transient
reactance which is given by (3.3).
RM
RMSRMS XX
XXXXXXX+
+=+=.||' (3.3)
The model is expressed by three dynamic equations as given in (3.4).
⎪⎪⎪⎪
⎩
⎪⎪⎪⎪
⎨
⎧
−=⎟⎟⎠
⎞⎜⎜⎝
⎛
−⎟⎟⎠
⎞⎜⎜⎝
⎛⎟⎟⎠
⎞⎜⎜⎝
⎛+
++
−=
+⎟⎟⎠
⎞⎜⎜⎝
⎛⎟⎟⎠
⎞⎜⎜⎝
⎛+
++
−=
EMMECHBASE
R
DEDSRM
MQ
MR
REQ
QEQSRM
MD
MR
RED
TTdtdH
esiXX
XeXX
Rdt
de
esiXX
XeXX
Rdt
de
ωω
ωω
ωω
2
'2
''
'2
''
(3.4)
Where, Eω is the system frequency, BASEω is the base frequency, s is the slip, and H is the
acceleration constant of an induction generator. EMT is the electromagnetic torque developed and
MECHT is the mechanical torque obtained from external forces (such as wind).

24
24
In (3.4), 'De and '
Qe are −d axis and −q axis back emf’s induced in an induction generator.
⎪⎪⎩
⎪⎪⎨
⎧
+=
+−
=
DRRM
M
BASE
EQ
QRRM
M
BASE
ED
XXX
e
XXX
e
ψωω
ψωω
'
'
(3.5)
Where, DRψ and QRψ are the rotor fluxes. The fluxes are related to stator and rotor currents as
⎪⎪
⎩
⎪⎪
⎨
⎧
++=++=
++=++=
QSMQRMRQR
DSMDRMRDR
QRMQSMSQS
DRMDSMSDS
iXiXXiXiXX
iXiXXiXiXX
)()(
)()(
ψψ
ψψ
(3.6)
3) Solar PV Cells: Solar PV cells generate a DC current, which is then converted into AC current by
power electronics inverter control. The power electronic converters decouple the PV system
dynamics from network dynamics similar to the concept of HVDC. Since no electromechanical
phenomenon occurs in the PV system, the PV generator is considered as a static generator.
The IEEE guidelines for interconnection of distributed resources suggest connecting PV at unity
power factor [30]. Currently most inverters used in PV power conversion are designed to operate at
unity power factor [33, 38]. In this report too, the Solar PV generators are assumed to be constant
active power sources operating at unity power factor. The solar irradiation is assumed constant
throughout the analysis.
B) Load Modelling In steady state analysis, the loads are represented by constant power models [39]. However, in
dynamics analysis, there is no uniformity among literatures in choosing a proper load model. IEEE task
force [39] recommends that the active power loads be represented by constant current models and reactive
power loads be represented by constant impedance models for dynamic simulation. On the other hand,
induction motor dynamics is also popularly used to represent the load dynamics [40, 41]. In recent years,
the composite load models have been widely used where static parts are represented by ZIP and dynamic
parts are represented by induction machines [42, 43].

25
25
The selection of load model obviously affects the result of stability analysis [44-46]. In this study,
dynamics imposed by DGs into the system is of importance. Hence all the loads of the studied system are
modelled by constant impedance to achieve simplicity in analysis[46].
C) Description of Distribution System The configuration of the distribution system which is under study is shown in Fig. 3.3 (the same as Fig.
2.3). The data is previously presented in Table 2.3. It is a modified version of the distribution system
presented in [23]. In this system, three radial feeders are connected by tie lines. The motivation to choose
this system is that it is convenient for studying the dynamic interaction of distant machines located on
different feeders. The total load of the system is 28.7 MW and 17.3 MVAR. The distribution network is
approximately modelled by π -model (assuming the system to be balanced), similar to that of the
transmission system model.
A synchronous generator operating in voltage control mode is connected at Bus 1, supplying 4 MW. It
has a reactive power limit of 3 MVAR. Another synchronous generator operating in power factor control
mode is connected at Bus 3, supplying 5 MW at unity power factor. The system is fed by the grid
substation at Bus 1. The grid substation is supposed to supply power at constant power factor and not
propagate any low frequency oscillations into the distribution system[47]. A 2 MW wind generator is
connected at Bus 6 and a 1 MW solar PV generator is connected at Bus 7. The wind generator is
compensated by a shunt capacitor supplying reactive power equal to one third of the active power
generated [17]. The next section explains the oscillation behaviour of the studied distribution system.
Fig. 3.3 Single line diagram of the test distribution system

26
26
3.3 Oscillations in Distribution System
A. Oscillatory modes observed in distribution system
The differential and algebraic equations (DAEs) of (3.1) can be linearized and rearranged at an operating
point as (3.7).
XAX Δ=Δ & (3.7)
Where, X is the vector of state variables and A is the system state matrix. There are fifteen state variables,
which are numbered and listed as:
1. δ of synchronous generator at Bus 1
2. q1ψ of synchronous generator at Bus 1
3. q2ψ of synchronous generator at Bus 1
4. fdψ of synchronous generator at Bus 1
5. d1ψ of synchronous generator at Bus 1
6. q1ψ of synchronous generator at Bus 3
7. q2ψ of synchronous generator at Bus 3
8. fdψ of synchronous generator at Bus 3
9. d1ψ of synchronous generator at Bus 3
10. δ of synchronous generator at Bus 3
11. 'De : D-axis induced emf of induction generator
12. 'Qe : Q-axis induced emf of induction generator
13. rωΔ of synchronous generator at Bus 3
14. rωΔ of synchronous generator at Bus 1
15. Rω : Speed of induction generator
Eigenvalues of A provide the information of small signal stability. The system under study has fifteen
eigenvalues with all the DGs connected, which are shown in Fig.3.4. Since all the eigenvalues lie on the
left side of the imaginary axis, the system is said to be asymptotically stable.

27
27
-35 -30 -25 -20 -15 -10 -5 0 5-25
-20
-15
-10
-5
0
5
10
15
20
25
Real Axis
Imag
inar
y A
xis
Fig. 3.4 Eigenvalues of the distribution system
Also, three pairs of complex low frequency oscillatory modes are observed, which are summarized in
Table 3.1.
TABLE 3.1
THE OSCILLATORY MODES EXISTING IN THE DISTRIBUTION SYSTEM
Modes
Real
Part
(1/s)
Imaginary
Part
(rad/sec)
Damping
Ratio
Frequency
(Hz)
1, 2 -5.57 20.64 0.26 3.28
3, 4 -4.23 18.15 0.23 2.89
5, 6 -9.81 17.72 0.48 2.82
It is interesting to note that the oscillatory frequencies of all the modes are around 3 Hz, which is more
than the frequency of electromechanical modes of large generators observed in a high voltage transmission
system, typical values of which are between 0.1 to 2 Hz [36]. Some studies with induction generator
applications also show a similar frequency of oscillations in a distribution system [48-50]. Other modes
with lower frequencies are not observed.

28
28
B. Participation factor
The contributions of states on oscillation were observed by evaluating the participation factors (PFs) of
each state on a particular mode. Participation factor gives the relationship among the states and eigenmode
in a dynamic system[36, 44]. The participation of thk state in the thi eigen-mode may be given by
ikkikip ψφ= (3.8)
Where,
kiφ : thk entry of right eigenvector iφ
ikψ : thk entry of left eigenvector iψ
Table 3.2 shows the participation factors of states of the distribution system on oscillatory modes. The
states are represented by numbers which are explained in Section 3.3A.
It is observed that the PFs of state-1 and state-14 for Modes 1, 2 and Modes 3, 4 are 0.2 and 0.46
respectively. Similarly, the PFs of state-10 and state-13 for Modes 1, 2 and Modes 3, 4 are 0.48 and 0.19
respectively. So the dominant states for Modes 1, 2 are the rotor angle and speed deviation of the generator
at Bus 3. The dominant states for Modes 3, 4 are rotor angle and speed deviation of the generator at Bus 1.
The PFs of state-12 and state-15 on Modes 5, 6 are 0.61 and 0.58, respectively. Other states have
negligible participation on this mode. So the dominant states for Modes 5, 6 are the induced emf and rotor
speed of the induction generator. It may be observed that induction generator participates significantly on
system oscillation. Literature [51] presents similar results for a large power system with induction
machine applications. The modes dominated by wind generator states are highly damped as compared to
the modes dominated by synchronous generator states. Solar PV generation does not participate in the
oscillatory modes. The next section describes the impact of penetration level of DG’s on small signal
stability.

29
29
TABLE 3.2
PARTICIPATION FACTORS OF STATE VARIABLES
States
Modes
1, 2
Modes 3,
4
Modes 5,
6
1 0.20 0.46 0.09
2 0.00 0.00 0.00
3 0.05 0.09 0.03
4 0.00 0.01 0.00
5 0.05 0.10 0.03
6 0.00 0.00 0.00
7 0.11 0.03 0.00
8 0.01 0.00 0.00
9 0.12 0.04 0.00
10 0.48 0.19 0.01
11 0.00 0.00 0.01
12 0.00 0.08 0.61
13 0.48 0.19 0.01
14 0.20 0.46 0.09
15 0.00 0.07 0.58
3.4 Impact of Penetration
With the worldwide concern on environmental issues and legislative changes, more renewable energy
resources are likely to be integrated into the distribution system in the future. Many countries have set a
target of supplying at least 20% of their load demand by renewable energy within the next 10 years [52].
Based on these facts, the research has presented three cases for small signal stability analysis.
• Base case: This is the case of the existing scenario.
• 20% wind: The wind power in the system is increased to 6 MW. It is assumed that more wind
generators are connected in parallel at Bus 6. Solar PV output is set constant at 1 MW.
• 20% solar: The solar power in the system is increased to 6 MW. It is assumed that more solar PV
output is connected in parallel at Bus 7. The wind power is set constant at 2 MW.
30
30
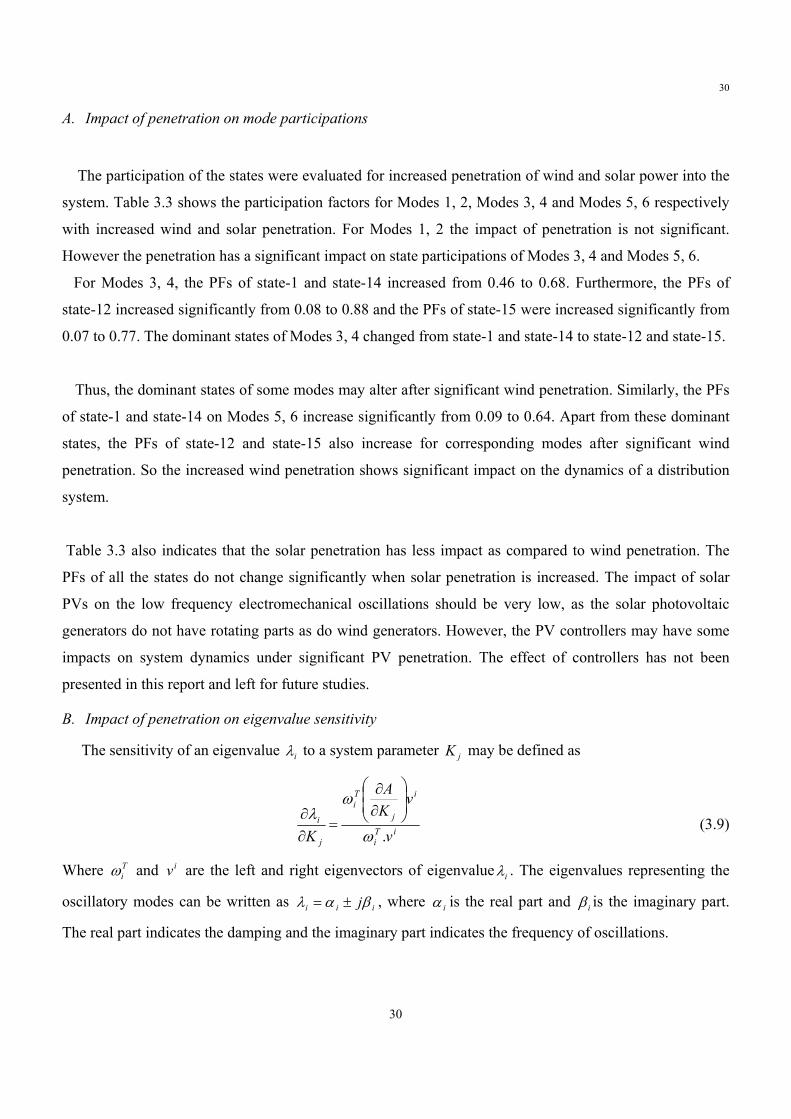
A. Impact of penetration on mode participations
The participation of the states were evaluated for increased penetration of wind and solar power into the
system. Table 3.3 shows the participation factors for Modes 1, 2, Modes 3, 4 and Modes 5, 6 respectively
with increased wind and solar penetration. For Modes 1, 2 the impact of penetration is not significant.
However the penetration has a significant impact on state participations of Modes 3, 4 and Modes 5, 6.
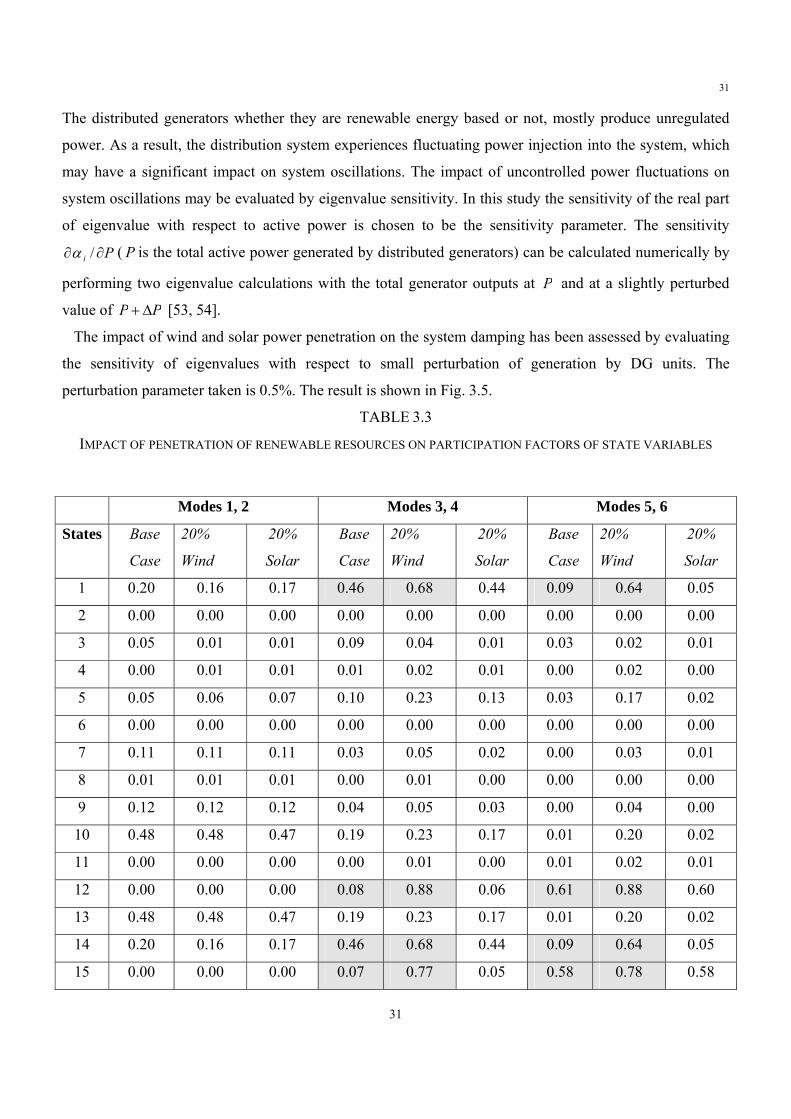
For Modes 3, 4, the PFs of state-1 and state-14 increased from 0.46 to 0.68. Furthermore, the PFs of
state-12 increased significantly from 0.08 to 0.88 and the PFs of state-15 were increased significantly from
0.07 to 0.77. The dominant states of Modes 3, 4 changed from state-1 and state-14 to state-12 and state-15.
Thus, the dominant states of some modes may alter after significant wind penetration. Similarly, the PFs
of state-1 and state-14 on Modes 5, 6 increase significantly from 0.09 to 0.64. Apart from these dominant
states, the PFs of state-12 and state-15 also increase for corresponding modes after significant wind
penetration. So the increased wind penetration shows significant impact on the dynamics of a distribution
system.
Table 3.3 also indicates that the solar penetration has less impact as compared to wind penetration. The
PFs of all the states do not change significantly when solar penetration is increased. The impact of solar
PVs on the low frequency electromechanical oscillations should be very low, as the solar photovoltaic
generators do not have rotating parts as do wind generators. However, the PV controllers may have some
impacts on system dynamics under significant PV penetration. The effect of controllers has not been
presented in this report and left for future studies.
B. Impact of penetration on eigenvalue sensitivity
The sensitivity of an eigenvalue iλ to a system parameter jK may be defined as
iTi
i
j
Ti
j
i
v
vKA
K .ω
ωλ ⎟
⎟⎠
⎞⎜⎜⎝
⎛
∂∂
=∂∂
(3.9)
Where Tiω and iv are the left and right eigenvectors of eigenvalue iλ . The eigenvalues representing the
oscillatory modes can be written as iii jβαλ ±= , where iα is the real part and iβ is the imaginary part.
The real part indicates the damping and the imaginary part indicates the frequency of oscillations.
31
31
The distributed generators whether they are renewable energy based or not, mostly produce unregulated
power. As a result, the distribution system experiences fluctuating power injection into the system, which
may have a significant impact on system oscillations. The impact of uncontrolled power fluctuations on
system oscillations may be evaluated by eigenvalue sensitivity. In this study the sensitivity of the real part
of eigenvalue with respect to active power is chosen to be the sensitivity parameter. The sensitivity
Pi ∂∂ /α ( P is the total active power generated by distributed generators) can be calculated numerically by
performing two eigenvalue calculations with the total generator outputs at P and at a slightly perturbed
value of PP Δ+ [53, 54].
The impact of wind and solar power penetration on the system damping has been assessed by evaluating
the sensitivity of eigenvalues with respect to small perturbation of generation by DG units. The
perturbation parameter taken is 0.5%. The result is shown in Fig. 3.5.
TABLE 3.3
IMPACT OF PENETRATION OF RENEWABLE RESOURCES ON PARTICIPATION FACTORS OF STATE VARIABLES
Modes 1, 2 Modes 3, 4 Modes 5, 6
States Base
Case
20%
Wind
20%
Solar
Base
Case
20%
Wind
20%
Solar
Base
Case
20%
Wind
20%
Solar
1 0.20 0.16 0.17 0.46 0.68 0.44 0.09 0.64 0.05
2 0.00 0.00 0.00 0.00 0.00 0.00 0.00 0.00 0.00
3 0.05 0.01 0.01 0.09 0.04 0.01 0.03 0.02 0.01
4 0.00 0.01 0.01 0.01 0.02 0.01 0.00 0.02 0.00
5 0.05 0.06 0.07 0.10 0.23 0.13 0.03 0.17 0.02
6 0.00 0.00 0.00 0.00 0.00 0.00 0.00 0.00 0.00
7 0.11 0.11 0.11 0.03 0.05 0.02 0.00 0.03 0.01
8 0.01 0.01 0.01 0.00 0.01 0.00 0.00 0.00 0.00
9 0.12 0.12 0.12 0.04 0.05 0.03 0.00 0.04 0.00
10 0.48 0.48 0.47 0.19 0.23 0.17 0.01 0.20 0.02
11 0.00 0.00 0.00 0.00 0.01 0.00 0.01 0.02 0.01
12 0.00 0.00 0.00 0.08 0.88 0.06 0.61 0.88 0.60
13 0.48 0.48 0.47 0.19 0.23 0.17 0.01 0.20 0.02
14 0.20 0.16 0.17 0.46 0.68 0.44 0.09 0.64 0.05
15 0.00 0.00 0.00 0.07 0.77 0.05 0.58 0.78 0.58
δψψfψψψψfψψδ

32
Fig. 3.5 Eigen sensitivities with generation for increased penetration
With increased solar penetration, the eigensensitivity of Modes 1, 2 with respect to active power
generation decrease from 0.34 to 0.2. Similarly, eigensensitivity of Modes 3, 4 decrease from 0.38 to 0.17
and that of Modes 5, 6 decreases from 0.09 to 0.03. It may be observed that eigensensitivity of all the
modes decrease with an increase of solar PV penetration. This indicates that the modes become stronger
with increased solar penetration.
On the other hand, for increased wind penetration, eigensensitivity of Modes 1, 2 decreased from 0.34 to
0.2. The eigensensitivity of Modes 3, 4 decreased from 0.38 to 0.35 and that of Modes 5, 6 decreased from
0.08 to -0.13. So a wind generator can decrease the sensitivity of some modes. They may help in the
damping of some modes of oscillations in distribution systems. Also, the eigensensitivity of Modes 5, 6
reduced from a positive low value to a negative high value. This indicates that wind generator dynamics
are significant in the oscillations of distribution systems.
As discussed previously, most of the generated power in a renewable energy based distribution system is
unregulated and the eigensensitivity with respect to generated power gives the indication of small signal
stability of the distribution system when the injected power is randomly fluctuating with time. In the same
way, the loads of a distribution system also change with time. So the sensitivities of eigenvalues with
respect to active power loading were also evaluated. The result is shown in Fig. 3.6.

33
Fig. 3.6 Eigen sensitivities with loading for increased penetration
Similarly with the previous case, the penetration of solar PV decreases the magnitude of eigen-
sensitivities of Modes 1, 2, Modes 3, 4 and Modes 5, 6. So penetration of solar PV generator makes the
system more small signal stable, similar to the observation from Fig. 3.5. For increased wind penetration,
the sensitivities of some modes are decreased while others are increased. The significant changes in
sensitivities indicate that the wind generator dynamics are still very prominent.
Figs. 3.5 and 3.6 also show that Modes 3, 4 are the most sensitive modes and Modes 5, 6 are the least
sensitive modes. So the oscillatory modes dominated by wind generator states are less sensitive as
compared to the modes dominated by synchronous generator states. This indicates that the location of
damping controllers should be in the vicinity of synchronous generators in the distribution system. To
validate this finding, time domain analysis was performed which is described in the following section.
3.5 Time Domain Analysis
The time domain analysis was performed to visualize the rotor oscillations of synchronous generators
under different wind and solar PV penetrations. For this, a three phase short-circuit fault was applied at
Bus 15 and cleared after 70 ms, to trigger the mode. The rotor speeds of the synchronous generators at
Buses 1 and 3 were observed.
Fig. 3.7 shows the rotor speed of the synchronous generator at Bus 1. This generator is operating in
voltage control mode. It is observed that the damping of the oscillations is improved as wind and solar
penetration is increased. Damping is more pronounced with solar penetration than wind penetration. This

34
is because the output of a PV generator is constant while the reactive power of a wind generator varies
based on the bus voltage and active power generated.
Fig. 3.7 Response of voltage controlled synchronous generator for increased penetration.
Fig. 3.8 shows the response of generator rotor speed of the generator at Bus 3. The generator at Bus 3 is
operated in power factor control mode with unity power factor. It is interesting to observe that the response
does not change even if wind and solar penetration is increased. The power factor of the synchronous
generator was reduced to 0.8 (lag) and again simulated against fault. The result is shown in Fig. 3.9. The
response also shows that the penetration of renewable resources does not affect the damping of the power
factor controller generator. It is likely that the machine dynamics are not affected by penetration of
renewable energy resources, if the synchronous generator is operating at power factor control mode.
Fig. 3.8 Response of power factor controlled synchronous generator for increased penetration (power
factor = unity).

35
If the synchronous generator is supporting reactive power required by the system, the other generators
are likely to have an effect on it. On the other hand, other generators do not affect the synchronous
generator if it is operating in a power factor control mode.
Again the time domain responses, shown in Figs. 3.7, 3.8 and 3.9 have frequency of oscillations around
3 Hz, which is also the range shown by eigenvalue analysis (Table 3.1). Hence it is likely that the
frequency of electromechanical oscillations observed in the distribution system is higher than those
observed in a transmission system.
Fig. 3.9 Response of power factor controlled synchronous generator for increased penetration (power
factor = 0.8, lag).
3.6 Summary of small signal stability research
The small signal stability of a distribution system is investigated with different levels of penetration of
renewable energy resources, which includes wind and solar. Eigensensitivity with respect to active power
fluctuations is proposed as a sensitivity parameter to study the impact of penetration. The sensitivity
parameter and time domain simulation are used for stability analysis.
Low frequency oscillation modes with an approximate frequency of 3 Hz were observed. The results
show that rotor flux variables of wind generators participate significantly in the system oscillations. The
oscillatory modes dominated by wind generator states are less sensitive with power fluctuations and
relatively well damped as compared to the modes dominated by synchronous generator states. Similarly,
increased solar PV penetration decreases the eigensensitivity, improving the small signal performance of
the distribution system.

36
The time domain simulation also confirmed the frequency of oscillations (3 Hz) suggested by eigen-
value analysis. The increased penetration of wind and solar power has a positive impact on the oscillation
damping of the voltage controlled synchronous generator. However the damping of the power factor
controlled synchronous generator is not affected. The work reported in this report has been published in the
proceedings of the IEEE Power and Energy Systems General Meeting, Minneapolis, USA during 25-29
July 2010 [72].
In the present system, the controllers are not installed and the results purely reflect the dynamics of
machines only. Future study will investigate the effect of controllers on small signal stability and the need
for coordinated controllers to enhance the overall performance of the distribution system. The next section
reports the optimum capacitor placement issues to mitigate voltage stability and loadability improvement.

37
4.0 Optimal Placement of Capacitor in Distribution System for Minimization of Load Curtailment
4.1. Introduction
So far, much attention has been given to transmission systems by power engineers and distribution systems
have been ignored because it was assumed they were less sensitive to the disturbances while the
transmission system was more concerned about maintaining the security, stability and reliability. However,
with continuous change in the load pattern and inclusion of different Distributed Generation (DG) sources
[14,55] in the distribution system, it now involves much more complexity than earlier and at the same time
is becoming more sensitive like the transmission system to any disturbances. The introduction of
distributed generation units on the existing power system can significantly impact the flow of power and
voltage conditions at customers and utilities equipment. These impacts may impact either positively or
negatively depending on the characteristics of both the distribution system and the DG units. Due to having
different load types, some of them are very sensitive to change in voltage and so low voltage is one issue
and can cause Load Curtailment (LC) [56, 57, and 58]. Capacitors are often installed in the distribution
system for reactive power compensation to carry out power and energy loss reduction, voltage regulation,
system security improvement and system capacity release. Economic benefits of the capacitor depends
mainly on where and how many of the capacitor are installed and proper control schemes of the capacitors
at different load levels in the distribution system. Load Curtailment (LC) is a control action, which is
imposed to avoid the distribution system from voltage collapse. Voltage collapse is caused by many factors
e.g., insufficient power production, under voltage problems or hitting of any operating limits. The under
voltage problem is caused by insufficient reactive power availability in the system.
In recent years, the increase in peak load demand and power transfers between utilities has elevated
concerns about system security, which finally results in load curtailment. Voltage security is one of the
problems which arise due to lack of reactive power. Voltage security is the ability of the system to
maintain adequate and controllable voltage levels at all system load buses. The main concern is that
voltage levels outside a specified range can affect the operation of the customer’s loads. In this study,
under voltage issue has been considered and remedial action has been suggested to solve this problem.
However several works have been reported in literatures considering a different approach for capacitor
placement for specific objectives.
In [59], a loss based sensitivity method has been used to select the candidate installation locations of the
capacitors to reduce the search space of the Tabu Search (TS) problem. Etemadi et al in [60] suggested a
heuristic method for solving the optimal capacitor placement problem in distribution systems considering
the sum of reliability cost, cost of losses and investment cost. This problem has been solved using a

38
particle swarm optimisation-based algorithm and mix integer programming used for optimal capacitor
placement. Authors in [61] proposed a Genetic Algorithm (GA) based methodology for finding optimum
load shedding strategy for distribution networks with and without installed DGs considering constant and
variable capacity deficiency modelling of Bulked Power Supply points of distribution networks. A
different solution method has been presented in [62] for general formulation of the feeder reconfiguration
problem for loss reduction and load balancing. A simple method of minimizing the losses associated with
the reactive component of branch currents by placing capacitors in a radial distribution system has been
proposed in [63]. The authors in [64], presented a technique for reducing the energy losses arising from the
flow of reactive power in a distribution system by placing compensating capacitors at a few specific
locations in the network, termed "sensitive nodes" to achieve a maximum annual dollar saving. In [65], a
method employing the ant colony search algorithm (ACSA) has been proposed to solve the feeder
reconfiguration and capacitor placement problems and also highlighted the merit of the ACSA as parallel
search and optimization capabilities which were inspired by the observation of the behaviours of ant
colonies. Authors in [66] suggested a sensitivity based method for optimal placement of series FACTS
controller for minimization of load curtailment requirements. In ref. [67], a methodology has been
proposed for an optimal location and sizing of static and switched shunt capacitors in radial distribution
networks. An OPF problem has been formulated to maximize the total savings produced by the reduction
in energy losses and the avoided costs due to investment deferral in the expansion of the network over a
considered period, subject to the whole constraint set of the optimal reactive power flow, the reactive
power balance at each node of the network and the constraints of selecting for each node only one among
the various proposed capacitors banks sizes and types. In [68], a planning method has been proposed for
capacitor installation in a distribution system to reduce the installation costs and minimize the loss of
electrical energy.
In this work, a new methodology based on Lagrange multiplier has been suggested for optimal placement
of capacitors in a distribution system for load curtailment minimization. An Optimal Power Flow (OPF)
problem has been formulated with an objective to minimize the Load Curtailment (LC) in a distribution
system along with optimal capacitor settings. The effect of the proposed method has been investigated on
the IEEE 16-bus system.
4.2. Problem Formulation
A. Proposed Methodology for Optimal Placement of Capacitor
Network configurations of distribution systems are mostly radial type and hence, they need to be treated

39
in a different way compared to a transmission system. An Optimal Power Flow (OPF) problem is
suggested here as an objective to minimize the Load Curtailment (LC) requirement in the system and given
below.
{ }1
b
i i
Nreq avail
D Di
LC P P=
= −∑ (4.1)
Subject to the following constraints:
a) Equality constraints: Power balance equations corresponding to both the real and the reactive powers, as
defined in equations given below, must be satisfied.
{ }1
cos( )b
i Di
Navail
i G i j ij i j iji
P P P V V Y δ δ θ=
= − − ∗ ∗ − −∑ (4.2)
{ } 2
1sin( )
b
i D ii
Navail
i G i j ij i j ij i Ci
Q Q Q V V Y V Bδ δ θ=
= − − ∗ ∗ − − + ∗∑ (4.3)
Where,
Pi, Qi are the real and reactive power mismatches at bus-i,
PGi and QGi are the real and reactive power generations at bus-i,
PDavail, QD
avail are the available real and reactive power demands at bus-i,
Y, θ are the magnitude and angle of admittance matrix,
V, δ are the voltage magnitude and angle at bus-i,
Nb is the total number of buses in the system,
BCi is the susceptance of the Capacitor at bus-i.
b) Inequality constraints: These include the operating limits on various power system variables and the
parameters of capacitor as given below
0 avail reqDi DiP P≤ ≤ i=1, 2, 3... ...Nb
(4.4)
0 avail reqDi DiQ Q≤ ≤ i=1, 2, 3... ...Nb
(4.5) min maxGi Gi GiQ Q Q≤ ≤ i=1, 2, 3... ...NG
(4.6) min max
i i iV V V≤ ≤ i=1, 2, 3... ...Nb
(4.7)
min maxi i iδ δ δ≤ ≤ i=1, 2, 3... ...Nb (4.8)
maxCi Ci0 B B≤ ≤ i=1, 2, 3... ...NC (4.9)
40
Where,
QGimin, QGi
max are the reactive power generation limit at generator buses,
Vimin , Vi
max are the voltage limits at each bus,
δimin
, δimax are angle limits at buses,
BCimax is the capacitive susceptance limit placed at respective buses
c) Power factor constraints: In order to keep the load power factor as constant it is assumed that when a
certain amount of real power has been curtailed at one bus, the corresponding reactive load at that bus will
also be curtailed and this condition can be represented mathematically as
i i
i i
req reqD D
avail availD D
P QP Q= (4.10)
Where,
PDireq , is the real power demand at bus-i,
PDiavail, is the actual real power available to supply at bus-i,
QDireq, is the reactive power demand at bus-i,
QDiavail, is the actual reactive power available to supply at bus-i
To solve the above nonlinear OPF formulation, an augmented objective function can be written as
( ) ( )
( )
( ) ( ) ( )
2
1 1 1
min min
1 1
max max min min max max
1 1 1
b b b
i i i i
b Gi i
G i iii i
G G G
G i i G i i G i ii i i
N N N
i i i G D i i G D i Ci i i
req reqN ND D
avail availi P G GD Di i
N N N
P G G Q G G Q G Gi i i
P
LC P P P Q Q Q V B
P QP PP Q
F P P Q Q Q Q
λ ρ
η μ
μ μ μ
μ
= = =
= =
∗
= = =
+ − + + − + − ∗ +
⎧ ⎫− + − +⎨ ⎬
⎩ ⎭
= − + − + −
+
∑ ∑ ∑
∑ ∑
∑ ∑ ∑
( ) ( ) ( )
( ) ( )
min min
1 1 1
max max max max
1 1
b
Di Di i
G c
i C i ii
NNb Nbavail req avail req
Di Di Q Di Di V i ii i iN N
V i i B C Ci i
P P Q Q V V
V V B B
μ μ
μ μ
= = =
= =
⎧ ⎫⎪ ⎪⎪ ⎪⎪ ⎪⎪ ⎪⎪ ⎪⎪ ⎪⎪ ⎪⎨ ⎬⎪ ⎪⎪ ⎪
− + − + −⎪ ⎪⎪ ⎪⎪ ⎪⎪ ⎪+ − + −⎪ ⎪⎩ ⎭
∑ ∑ ∑
∑ ∑
(4.11)
where, λ, ρ and η are the Lagrange multipliers associated with the equality constraints and
G
minPμ ,
G
maxPμ ,
G
minQμ ,
G
maxQμ ,
D
availPμ ,
D
availQμ , min
Vμ , maxVμ ,
C
minBμ and max
CBμ are the multipliers associated with the
inequality constraints (generators’ real and reactive power limits, real and reactive bus power available,
bus voltage limits and capacitor susceptance limits, respectively). The solution of the OPF has been
obtained using the demo version of GAMS [69] software and it provided the values of these multipliers
and objective values along with the capacitor settings. The Lagrange multipliers, corresponding to the real
and reactive power balance equations at each bus are called dual variables. In this study the Lagrange
multiplier (ρ) has been used for deciding the optimal locations of capacitor placement in the distribution
system.

41
B. Criteria for Optimal Location of Capacitor
The following criteria have been used in this study, while deciding the optimal locations of capacitors
based on proposed factors.
• The feeder and terminating nodes have not been considered for capacitor placement.
• The nodes, having any voltage control devices, have not also been used for capacitor placement.
• The node having the highest negative value of Lagrange multiplier is given first priority for capacitor
placement followed by the second highest and so on.
• The closest node to the feeder bus has been selected based on multiplier (ρ) followed by other nodes.
4.3. System Studies
In this study, the IEEE 16-bus distribution system has been used, which is shown in Fig 4.1. This is a 23
kV, 100 MVA base balanced system with 3 feeders and 13 sectionalizing branches [23]. The system has 3
tie switches for transferring loads to specific buses. In this test case the system has been modified with 2
and all three tie switches connected at a time, which results in a system which is both radial and mesh in
nature. As the tie switches are inherently designed in this system to bring balance in load distribution in the
worst cases, it can deal with the penetration of DG units with the worst possible scenarios, which is
definitely much better in a normal operating state.
Fig 4.1 IEEE 16-bus 3 feeder system

42
TABLE 4.1
DG’S IN STUDY
DG type Electric machine Utility
interface
Model for
PFS Connected bus
Machine
rating for PFS
Variable Speed
Wind Turbine
Doubly Fed
Induction Generator
Rectifier+
Inverter PV node Bus # 3
S= 0.02 pu (2MW)
Pf= 1.0,
Q=0 pu
Fixed Speed Wind
turbine
Squirrel-Cage
Induction Generator Directly PQ node Bus # 15
P=0.01446 pu
(1.446MW)
Q= 0.00715 pu
(0.715 MVAR)
s = 0.005
Solar Panel
in Aggregated
Form
Static Generator Inverter PQ node Bus # 16
P= 0.005 pu
(0.5 MW)
Q= 0 pu
Bagasse based
cogeneration plants
Synchronous
Generator Directly PV node Bus # 2
S= 0.02 pu (2MW)
Pf= 0.8
In this work, the voltage variation has been taken as ± 3% from the nominal value 1.00 pu. The value of
capacitor admittance has been taken between 0 to 0.3 pu for all of the study. For improved study loading,
factor or point of collapse has been obtained with the help of Continuation Power Flow software [70]. For
CPF results, the same rating of capacitor has been used as in the LC minimization study.
C. Optimal Location of Capacitor when Two Tie Switches Closed
The value of load curtailment and loading factor has been found as 6.23 MW and 1.59802 respectively
for the base case loading and without any capacitor. The results have been found for the case when only
two tie switches are closed and considering different DGs and loading combinations and given in Table
4.2. The first two capacitor locations i.e. nodes 8 and 9, are providing zero load curtailment while the other
three locations resulted in reduced LC value compared to that of the case without a capacitor. In addition,
the loading margin (Point of Collapse) has also been enhanced with capacitors at the stated locations.
However, loading factor is not in order, because objective of location is different in this work.

43
TABLE 4.2
RESULTS WITH DGS
Order Line
no
Lagrange
Multiplier (ρ) LC (pu) BC (pu) Loading Factor (pu)
1 8 -0.6250894 0 0.11852 3.36617
2 9 -0.6240513 0 0.14886 4.02048
3 11 -0.4368989 0.009594 0.15291 5.22680
4 5 -0.3684764 0.016919 0.14410 4.42837
5 4 -0.1768232 0.041846 0.12120 2.57980
Results with DG units and at increased load of 50% to the base case load are presented in Table 4.3.
Node-8 (bus 8) is again providing the least load curtailment followed by nodes-10, 11, 5 and 4. Load
margin enhancement has also been given in Table 4.3. Location order is somewhat different compared to
base case loading due to load change.
TABLE 4.3
RESULTS WITH DGS AND AT 50% INCREASED LOAD
Order Line
no
Lagrange
Multiplier (ρ) LC (pu) BC (pu)
Loading Factor (pu)
0.17446 0.574138
1 8 -0.6538674 0.032773 0.28026 1.426060
2 10 -0.6532032 0.035148 0.26648 1.068070
3 11 -0.4616361 0.097911 0.18549 2.578280
4 5 -0.3900021 0.113020 0.17245 2.337850
5 4 -0.1876309 0.149160 0.14071 1.151380
Table 4.4 shows results without any DGs and at base case load. Node-8 is providing the least load
curtailment followed by nodes-10, 11, 5 and 4. Load margin enhancement has also been given in the 6th
column.

44
TABLE 4.4
RESULTS WITHOUT DGS
Order Line
No
Lagrange
Multiplier (ρ) LC (pu) BC (pu)
Loading Factor (pu)
0.058536 0.873145
1 8 -0.5784586 0.007023 0.188930 9.7052
2 10 -0.576222 0 0.12211 1.31045
3 11 -0.4206232 0.027392 0.086493 2.73953
4 5 -0.3566298 0.033492 0.077025 2.37386
5 4 -0.1729574 0.047868 0.064703 1.45021
TABLE 4.5
RESULTS WITHOUT DGS AND AT 50% INCREASED LOAD
Order Line
no
Lagrange
Multiplier (ρ) LC (pu) BC (pu)
Loading Factor (pu)
0.170783
1 9 -0.6235880 0.087359 0.15984 1.02659
2 8 -0.6098275 0.083815 0.25323 0.799022
3 11 -0.4453841 0.123520 0.11819 1.493020
4 5 -0.3783099 0.133960 0.10658 1.249150
5 4 -0.1839802 0.155780 0.084305 0.633507
Table 4.5 shows results without DG but with an increased load by 50% from the base case load. By
location, node-9 is first priority for capacitor placement but node-8 is providing the least load curtailment
followed by nodes-11, 5 and 4. Load margin enhancement has also been given in Table 4.5. Location order
is somewhat different compared to base case loading due to load change. However, from comparison of
results obtained and given in Tables 4.2 to 4.5, node-8 is the most suitable location for the capacitor
placement for minimization of load curtailment. Moreover, loading margin enhancement is also found
significant with capacitor placement at locations obtained by the proposed method.

45
D. Optimal Location of Capacitor for all Three Tie Switches Closed
The proposed method has also been tested on the 16-bus distribution system when all three tie switches
are closed. In this condition, it behaved more like a meshed system. From suggested criteria in section 4.2,
only 10 locations have been selected for capacitor placement and results are given in Figs 4.2 to 4.5 for the
different loadings as well as DGs combinations.
The required load curtailment (LC) and loading margin are 4.33 MW and 1.81682, respectively for the
base case loading and without capacitor placement. In Fig. 4.1, the first four locations showing that load
curtailment requirement is zero with the help of capacitors at nodes-8, 10, 14 and 13. Loading factor
corresponding to Point of Collapse case has also been given by the black bar chart in Fig 4.2. In addition,
loading margin is also improved for the locations obtained by the proposed methodology. However,
location order for loading margin enhancement is not in the expected way because the objective of this
work was to minimize LC.
Fig 4.2 Results without DGs and at base case loading
Without having any DGs but at 50% increased load, results have been shown in Fig 4.3. The required
load curtailment (grey bar chart) and loading factor (black bar chart) are 16.15 MW and 2.57009,
respectively. In this case, node-8 is providing a better result compared to other locations and hence, it is
most suitable for capacitor placement with the suggested objective.

46
Fig 4.3 Results without DGs and at 50% increased load.
Fig 4.4 shows the results with all DGs but base case loading only. The required load curtailment (grey
bar chart) and loading factor (black bar chart) are 5.67 MW and 2.42078, respectively. In this case, there
are 8 nodes providing the required zero load curtailment while node-5 is providing a better loading factor
compared to other locations. By looking at both results, node-5 could be a better option followed by node-
11 for capacitor placement. However, the location order obtained with the suggested objective would
indicate node-8.
Fig 4.4 Results with DGs at base load
Fig 4.5 Results with DGs and at 50% increased load.

47
Fig 4.5 shows results obtained for having all DGs and at 50% increased loading. The required load
curtailment (grey bar chart) and loading factor (black bar chart) are 17.30 MW and 1.15349, respectively.
In this case, node-8 is providing the minimum load curtailment requirement while node-4 is providing a
better loading factor compared to other locations. Node-8 could be a better option followed by node-10 for
capacitor placement to meet the suggested objective in this research.
4.4. Summary of capacitor placement work
A new methodology has been proposed for optimal placement of capacitors to minimize the Load
Curtailment Requirement in a distribution system. The under voltage problem is among several issues,
which can result in load curtailment to avoid voltage instability or voltage collapse and capacitors have
been selected to solve this problem due to less investment cost. The optimal locations of capacitors have
been decided based on obtained Lagrange multipliers corresponding to reactive power equality constraints
for the objective function as the minimization of load curtailment requirements. It has been found that the
locations obtained are providing least load curtailment requirements and hence with less customer load
interruptions. The effectiveness of the proposed method has also been checked for different DGs and
loading combinations. Capacitor placement should also enhance the loading margin of the system.
Therefore, this method could be effectively utilized to place capacitors in a distribution system to avoid or
to minimize the load curtailment requirement by low voltage problems.
5. Conclusions
This report summarises the findings from three different studies on the IEEE 16-bus distribution
network with a number of renewable energy based DG’s of different sizes. These studies were conducted
in parallel and hence similar DG sizes and the same locations were not investigated for three cases.
Moreover, the objectives of the three challenges are different and hence studies could be considered
complementary to each other. When a selected distribution system is required to be investigated for power
system stability improvement, voltage stability and capacitor placement studies should be conducted first
and then these findings can be investigated further for understanding frequency oscillation issues.
Although voltage stability and capacitor placement studies deal with localised bus voltage issues and small
signal stability deals with the global frequency oscillation, an integration of two studies will provide a
better understanding of the renewable energy integration into the distribution grid and this will be studied
in the near future. Flexible AC Transmission System devices commonly used in transmission networks
(e.g. SVC) will be investigated for distribution networks in addition to fixed capacitor bank placements.
Control methodologies will be investigated to help distribution systems alleviate any voltage instability

48
and small signal instability issues arising from integration of renewable energy resources. Furthermore,
two case studies (an urban and a rural distribution system) will be investigated with the concepts developed
in this part of the research, which can be used by utilities to understand instability issues faced by utilities
due to the large scale integration of renewable energy and possible solutions in the form of control
methodologies and compensation devices.
6. References
[1] C. W. Taylor, N. J. Balu, and D. Maratukulam, Power system voltage stability. New York:
McGraw Hill, 1994.
[2] P. Kundur, N. J. Balu, and M. G. Lauby, Power system stability and control. New York: McGraw-
Hill, 1994.
[3] C. L. T. Borges and D. M. Falcao, "Impact of distributed generation allocation and sizing on
reliability, losses and voltage profile," in Power Tech Conference Proceedings, 2003 IEEE
Bologna, 2003, p. 5 pp. Vol.2.
[4] S. K. Salman, "The impact of embedded generation on voltage regulation and losses of distribution
networks," in Embedded Generation on Distribution Networks (Digest No. 1996/194), IEE
Colloquium on the Impact of, 1996, pp. 2/1-2/5.
[5] M. Moghavvemi and M. O. Faruque, "Technique for assessment of voltage stability in ill-
conditioned radial distribution network," Power Engineering Review, IEEE, vol. 21, pp. 58-60,
2001.
[6] G. Celli and F. Pilo, "Optimal distributed generation allocation in MV distribution networks," in
Power Industry Computer Applications, 2001. PICA 2001. Innovative Computing for Power -
Electric Energy Meets the Market. 22nd IEEE Power Engineering Society International
Conference on, 2001, pp. 81-86.
[7] M. Gandomkar, M. Vakilian, and M. Ehsan, "Optimal distributed generation allocation in
distribution network using Hereford Ranch algorithm," in Electrical Machines and Systems, 2005.
ICEMS 2005. Proceedings of the Eighth International Conference on, 2005, pp. 916-918 Vol. 2.
[8] N. Mithulananthan and T. Oo, "Distributed Generator Placement to Maximize the Loadability of
Distribution System " IJEEE, vol. 43, pp. 107-118, April 2006.
[9] W. Caisheng and M. H. Nehrir, "Analytical approaches for optimal placement of distributed
generation sources in power systems," in Power Engineering Society General Meeting, 2005.
IEEE, 2005, p. 2393 Vol. 3.
[10] N. Acharya, P. Mahat, and N. Mithulananthan, "An analytical approach for DG allocation in

49
primary distribution network," International Journal of Electrical Power & Energy Systems, vol.
28, pp. 669-678, 2006.
[11] W. Prommee and W. Ongsakul, "Optimal multi-distributed generation placement by adaptive
weight particle swarm optimization," in Control, Automation and Systems, 2008. ICCAS 2008.
International Conference on, 2008, pp. 1663-1668.
[12] N. Jenkins and Institution of Electrical Engineers., Embedded generation. London: Institution of
Electrical Engineers, 2000.
[13] V. Pongpornsup and B. Eua-Arporn, "Impacts of nonutility induction generator to distribution
network," in Transmission and Distribution Conference and Exhibition 2002: Asia Pacific.
IEEE/PES, 2002, pp. 1352-1356 vol.2.
[14] T. Ackermann, G. Andersson, and L. Söder, "Distributed generation: a definition," Electric Power
Systems Research, vol. 57, pp. 195-204, 2001.
[15] T. Ackermann, Wind power in power systems. Chichester, West Sussex, England: John Wiley,
2005.
[16] S. J. van Zyl and C. T. Gaunt, "Control strategies for distributed generators operating on weak
distribution networks," in Power Tech Conference Proceedings, 2003 IEEE Bologna, 2003, p. 7 pp.
Vol.3.
[17] W. Freitas, J. C. M. Vieira, A. Morelato, L. C. P. da Silva, V. F. da Costa, and F. A. B. Lemos,
"Comparative analysis between synchronous and induction machines for distributed generation
applications," Power Systems, IEEE Transactions on, vol. 21, pp. 301-311, 2006.
[18] V. Akhmatov, Induction generators for wind power. [Brentwood]: Multi-Science Pub., 2005.
[19] "Voltage stability assessment, procedures and guides" IEEE/PES Power System Stability
Subcommittee Technical Report January 2001.
[20] T. Van Cutsem and C. Vournas, Voltage Stability of Electric Power Systems: Kluwer, 1998.
[21] R. A. Schlueter, "A voltage stability security assessment method," Power Systems, IEEE
Transactions on, vol. 13, pp. 1423-1438, 1998.
[22] Y. Mansour, "Suggested techinques for voltage stability analysis," IEEE/PES, Techincal Report
1993.
[23] S. Civanlar, J. J. Grainger, H. Yin, and S. S. H. Lee, "Distribution feeder reconfiguration for loss
reduction," Power Delivery, IEEE Transactions on, vol. 3, pp. 1217-1223, 1988.
[24] DIgSILENTGmbH, "DIgSILENT PowerFactory V14.0 -User Manual," DIgSILENT GmbH, 2008.
[25] F. Milano, "PSAT, Matlab-based Power System Analysis Toolbox," 2002.
[26] N. Jenkins, R. Allan, P. Crossley, D. S. Kirschen, and G. Strbac, Embedded Generations, 1st ed.
50
London, U.K., 2000.
[27] F. P. de Mello, J. W. Feltes, L. N. Hannett, and J. C. White, "Application of Induction Generators
in Power Systems," Power Apparatus and Systems, IEEE Transactions on, vol. PAS-101, pp. 3385-
3393, 1982.
[28] B. M. Nomikos and C. D. Vournas, "Investigation of induction Machine contribution to power
system oscillations," Power Systems, IEEE Transactions on, vol. 20, pp. 916-925, 2005.
[29] R. Stern and D. W. Novotny, "A Simplified Approach to the Determination of Induction Machine
Dynamic Response," Power Apparatus and Systems, IEEE Transactions on, vol. PAS-97, pp.
1430-1439, 1978.
[30] H. L. Willis, "Analytical methods and rules of thumb for modeling DG-distribution interaction," in
Power Engineering Society Summer Meeting, 2000. IEEE, 2000, pp. 1643-1644 vol. 3.
[31] J. G. Slootweg and W. L. Kling, "The impact of large scale wind power generation on power
system oscillations," Electric Power Systems Research, vol. 67, pp. 9-20, 2003.
[32] R. D. Fernández, R. J. Mantz, and P. E. Battaiotto, "Impact of wind farms on a power system. An
eigenvalue analysis approach," Renewable Energy, vol. 32, pp. 1676-1688, 2007.
[33] T. Yun Tiam and D. S. Kirschen, "Impact on the Power System of a Large Penetration of
Photovoltaic Generation," in Power Engineering Society General Meeting, 2007. IEEE, 2007, pp.
1-8.
[34] D. Gautam, V. Vittal, and T. Harbour, "Impact of Increased Penetration of DFIG-Based Wind
Turbine Generators on Transient and Small Signal Stability of Power Systems," Power Systems,
IEEE Transactions on, vol. 24, pp. 1426-1434, 2009.
[35] B. C. Pal and F. Mei, "Modelling adequacy of the doubly fed induction generator for small-signal
stability studies in power systems," Renewable Power Generation, IET, vol. 2, pp. 181-190, 2008.
[36] P. Kundur, "Power System Stability and Control," Electric Power Research Institute.
[37] V. Akhmatov, Induction Generators for Wind Power: Multi-Science Publishing Company Ltd,
2005.
[38] T. Yun Tiam, D. S. Kirschen, and N. Jenkins, "A model of PV generation suitable for stability
analysis," Energy Conversion, IEEE Transactions on, vol. 19, pp. 748-755, 2004.
[39] "Load representation for dynamic performance analysis [of power systems]," Power Systems, IEEE
Transactions on, vol. 8, pp. 472-482, 1993.
[40] A. Borghetti, R. Caldon, A. Mari, and C. A. Nucci, "On dynamic load models for voltage stability
studies," Power Systems, IEEE Transactions on, vol. 12, pp. 293-303, 1997.
[41] L. Pereira, D. Kosterev, P. Mackin, D. Davies, J. Undrill, and Z. Wenchun, "An interim dynamic

51
induction motor model for stability studies in the WSCC," Power Systems, IEEE Transactions on,
vol. 17, pp. 1108-1115, 2002.
[42] J. Wang, R. He, and J. Ma, "Load Modeling Considering Distributed Generation," in Power Tech,
2007 IEEE Lausanne, 2007, pp. 1072-1077.
[43] H. Renmu, J. Ma, and D. J. Hill, "Composite load modeling via measurement approach," Power
Systems, IEEE Transactions on, vol. 21, pp. 663-672, 2006.
[44] M. A. Pai and P. Sauer, Power System Dynamics and Stability. Champaign: Stipes Publishing
L.L.C., 2006.
[45] M. A. Pai, P. W. Sauer, B. C. Lesieutre, and R. Adapa, "Structural stability in power systems-effect
of load models," Power Systems, IEEE Transactions on, vol. 10, pp. 609-615, 1995.
[46] P. M. Anderson and A. A. Fouad, Power System Control and Stability IEEE Press, 2003.
[47] F. Mei and B. Pal, "Modal Analysis of Grid-Connected Doubly Fed Induction Generators," Energy
Conversion, IEEE Transactions on, vol. 22, pp. 728-736, 2007.
[48] L. Rouco and J. L. Zamora, "Dynamic patterns and model order reduction in small-signal models of
doubly fed induction generators for wind power applications," in Power Engineering Society
General Meeting, 2006. IEEE, 2006, p. 8 pp.
[49] L. Sigrist and L. Rouco, "Design of damping controllers for doubly fed induction generators using
eigenvalue sensitivities," in Power Systems Conference and Exposition, 2009. PSCE '09.
IEEE/PES, 2009, pp. 1-7.
[50] F. Mei and B. C. Pal, "Modelling and small-signal analysis of a grid connected doubly-fed
induction generator," in Power Engineering Society General Meeting, 2005. IEEE, 2005, pp. 2101-
2108 Vol. 3.
[51] S. Ahmed-Zaid and O. Awed-Badeeb, "Dynamic interaction of synchronous generators and
induction motor loads," in Circuits and Systems, 1992., Proceedings of the 35th Midwest
Symposium on, 1992, pp. 1432-1435 vol.2.
[52] A. Kent and D. Mercer, "Australia's mandatory renewable energy target (MRET): an assessment,"
Energy Policy, vol. 34, pp. 1046-1062, 2006.
[53] C. Y. Chung, W. Lei, F. Howell, and P. Kundur, "Generation rescheduling methods to improve
power transfer capability constrained by small-signal stability," Power Systems, IEEE Transactions
on, vol. 19, pp. 524-530, 2004.
[54] K. W. Wang, C. Y. Chung, C. T. Tse, and K. M. Tsang, "Multimachine eigenvalue sensitivities of
power system parameters," Power Systems, IEEE Transactions on, vol. 15, pp. 741-747, 2000.

52
[55]. W. El-Khattam, M. M. A. Salama, "Distributed generation technologies, definitions and benefits",
Electric Power Systems Research, Vol. 71, pp. 119-128, 2004
[56]. P. Wang and R. Billinton, “Optimum load-shedding technique to reduce the total customer
interruption cost in a distribution system”, IEE Proc. - Gener. Transm. Distrib, Vol. 147, No. 1, pp. 51-56,
Jan. 2000.
[57]. Ding Xu and Adly Girgis. “Optimal Load Shedding Strategy in Power Systems with Distributed
Generation”, IEEE Winter meeting, Power Engineering Society, Vol. 2, pp.788-792, 2001
[58]. W.P. Luan, M.R. Irving and J.S. Daniel “Genetic algorithm for supply restoration and optimal load
shedding in power system distribution networks”, IEE Proc- Gener. Transm. Distrib, Vol. 149, No. 2,
March 2002.
[59]. Yann-Chang Huang Hong-Tzer Yang, Ching-Lien Huang, “Solving the Capacitor Placement Problem
in a Radial Distribution System Using Tabu Search Approach” IEEE Transactions on Power Systems, Vol.
11, No. 4, pp. 1868-1873, November 1996. A
[60]. A.H. Etemadi and M. Fotuhi-Firuzabad, “Distribution system reliability enhancement using optimal
capacitor placement”, Proc. of IET Gener. Transm. Distrib., Vol. 2, No. 5, pp. 621–631, 2008.
[61]. A. R. Malekpour, A.R. Seifi, M. R. Hesamzadeh, and N. Hosseinzadeh, “An Optimal Load Shedding
Approach for Distribution Networks with DGs considering Capacity Deficiency Modelling of Bulked
Power Supply”, Australasian Universities Power Engineering Conference (AUPEC'08), 2008. C
[62]. M.E. Baran and F.F. Wu, “Network reconfiguration in distribution systems for loss reduction and
load balancing”, IEEE Trans. Power Delivery, Vol. 4, No. 2, pp. 1401–1407, 1989.
[63]. M.H. Haque, “Capacitor placement in radial distribution systems for loss reduction”, IEE Proc. Gen.
Transm. Distrib. Vol. 146, No. 5, pp. 501–505, 1999
[64]. T.S. Abdel-Salam, A.Y. Chikhani, R. Hackam, “A new technique for loss reduction using
compensating capacitors applied to distribution systems with varying load condition”, IEEE Trans. Power
Delivery, Vol. 9, No. 2, pp. 819–827, 1994.
[65]. Chung-Fu Chang, “Reconfiguration and Capacitor Placement for Loss Reduction of Distribution
Systems by Ant Colony Search Algorithm”, IEEE Transactions on Power Systems, Vol. 23, No. 4, pp.
1747-1755, November 2008.
[66]. Hassan W. Qazi, Development of Sensitivity Based Indices for Optimal Placement of UPFC to
Minimize Load Curtailment Requirements, Master Thesis, Electrical Power System, Royal Institute of
Technology-KTH, Stockholm, Sweden Jun 2009.

53
[67]. H. M. Khodr, Zita A. Vale, and Carlos Ramos, “Optimal Cost-Benefit for the Location of Capacitors
in Radial Distribution Systems”, IEEE Transactions on Power Delivery, Vol. 24, No. 2, pp. 787-796, April
2009.
[68]. Jong-Young Park, Jin-Man Sohn and Jong-Keun Park, “Optimal Capacitor Allocation in a
Distribution System Considering Operation Costs”, IEEE Transactions on Power Systems, Vol. 24, No. 1,
pp. 462 - 468, Feb 2009.
[69]. A User’s Guide, Demo version, GAMS Development Corp., 2009.
[70]. “UWFLOW Software: Continuation and direct methods to locate fold bifurcations in AC/DC/FACTS
power systems” by Claudio A. Canizares and Fernando L. Alvarado, available at website
http://www.power.uwaterloo.ca/~claudio/software/.
[71]. T. Aziz, T. K. Saha, N. Mithulan, “Distributed Generators Placement for Loadability Enhancement
based on Reactive Power Margin”, Proceedings of The 9th International Power and Energy
Conference IPEC2010, 27 - 29 October 2010, Singapore.
[72]. S. Dahal, N. Mithulan, T. K. Saha, “Investigation of Small Signal Stability for Renewable Energy
based Electricity Distribution System”, Proceedings of IEEE Power & Energy Society General
Meeting, Minneapolis, USA, July 25-29, 2010.