project title: understanding mushroom nutrition: project ... pa… · • mushroom yields increased...
TRANSCRIPT
Agriculture and Horticulture Development Board 2016. All rights reserved
Project Title: Understanding Mushroom Nutrition: Project aimed at
improving yield, substrate efficiency and utilisation and
flavour
Project Number: M 56
Project Leader: Dr Kerry Burton
East Malling Research (EMR)
Report: Final Report September 2015
Previous Report: Annual Report July 2014
Key Staff: Dr Kerry Burton (EMR)
Dr Ralph Noble (EMR)
Susan Rogers, Sensory Projects Manager, Department
of Consumer & Sensory Sciences, Campden BRI
Location of project: East Malling Research
New Road, East Malling, Kent,
ME19 6BJ
Industry Representative: Dr Jude Wilson
Monaghan Mushrooms
Tyholland, Co. Monaghan, Ireland
Mark Irwin
Greeba Farm Ltd
Main Road, Crosby, Isle of Man,
IM4 2DR
Date project commenced: 1 July 2013
Date project completed: 30 September 2015
Agriculture and Horticulture Development Board 2016. All rights reserved
DISCLAIMER
While the Agriculture and Horticulture Development Board seeks to ensure that the
information contained within this document is accurate at the time of printing, no warranty is
given in respect thereof and, to the maximum extent permitted by law the Agriculture and
Horticulture Development Board accepts no liability for loss, damage or injury howsoever
caused (including that caused by negligence) or suffered directly or indirectly in relation to
information and opinions contained in or omitted from this document.
© Agriculture and Horticulture Development Board 2015. No part of this publication may be
reproduced in any material form (including by photocopy or storage in any medium by
electronic mean) or any copy or adaptation stored, published or distributed (by physical,
electronic or other means) without prior permission in writing of the Agriculture and
Horticulture Development Board, other than by reproduction in an unmodified form for the
sole purpose of use as an information resource when the Agriculture and Horticulture
Development Board or AHDB Horticulture is clearly acknowledged as the source, or in
accordance with the provisions of the Copyright, Designs and Patents Act 1988. All rights
reserved.
All other trademarks, logos and brand names contained in this publication are the
trademarks of their respective holders. No rights are granted without the prior written
permission of the relevant owners.

Agriculture and Horticulture Development Board 2016. All rights reserved
AUTHENTICATION
We declare that this work was done under our supervision according to the procedures
described herein and that the report represents a true and accurate record of the results
obtained.
Dr Kerry Burton
Senior Research Leader
East Malling Research
Signature ............................................................ Date ............................................
Report authorised by:
Dr Mark Else
Programme Leader, Research Efficiency & Crop Production
East Malling Research
Signature ............................................................ Date ............................................

Agriculture and Horticulture Development Board 2016. All rights reserved
CONTENTS
Headline .................................................................................................................. 1
Background ............................................................................................................. 1
Summary ................................................................................................................ 2
Financial Benefits .......................................................................................................... 3
Action Points ........................................................................................................... 4
Introduction ...................................................................................................................... 6
Materials and methods............................................................................................ 7
Results .................................................................................................................. 14
Discussion ............................................................................................................ 35
Conclusions .......................................................................................................... 36
Knowledge and Technology Transfer ................................................................... 38
References ........................................................................................................... 39
Appendix ............................................................................................................... 39

Agriculture and Horticulture Development Board 2016. All rights reserved 1
GROWER SUMMARY
Headline
• Mushroom yields increased 11.5% by addition of protein-based supplements at 1.5%
(ProMycel Gold, Champfood E, MCSubstradd and Natural Gold (a lipid-protein blend) to
phase 3 composts
• The increased mushroom yield is worth 6.4 times the cost of supplement (at 1.5%)
• Protein-based supplements increased mushroom cap density and so improved texture
and picking rates
• Supplementation did not affect mushroom flavour.
Background
The nutrition from compost is a key factor for the successful mushroom growth. A range of
different nutritional supplements are available to the mushroom industry, some reported to
correct possible nutrient deficiencies in compost and others reported to have ‘hormonal’
effects by stimulating extra growth. At the start of this project there was little objective
knowledge on the effects of these supplements in phase 3 compost on mushroom yield,
quality and metabolism. This project evaluated the effects of four different types of compost
supplement (protein-based, lipid-protein blend, carboxylic acid-based and mineral
micronutrients) applied to two different phase 3 composts (horse manure-based and straw-
based). Mushroom yield was measured as weight of mushrooms harvested. Mushroom
quality was measured as mushroom colour, density (related to texture), percentage dry
weight and mushroom flavour. Examining the effects of supplements on flavour is a novel
and important component of the project as flavour is key to consumer acceptance, so it is
important to know whether there are positive or negative effects from supplements.
Because different supplements have reported to have different modes of action (correcting
deficiencies of different nutrients or hormonal) this project also examined the biology of the
A. bisporus mycelia growing in different nutrient conditions to develop our understanding on
mushroom nutrition. This work involved measuring gene expression using microarray
technology.

Agriculture and Horticulture Development Board 2016. All rights reserved 2
The four supplement types under evaluation are available as commercial products:
• Protein-based (largely from soy) – three products tested (ProMycel Gold,
Champfood E, MCSubstradd)
• A blend of lipid and protein-based product (Natural Gold)
• A carboxylic acid-based product ( MycroNutrient)
• Mineral micronutrients, a mix of calcium, magnesium, sulphur, boron, copper, iron,
manganese, molybdenum and zinc salts (Micromax)
Summary
This project examined supplementation of phase 3 compost: a review of current usage, crop
experimentation to identify possible benefits to yield and quality, and laboratory analysis to
examine how supplements may affect the physiology of the mycelium.
Compost supplementation is practiced throughout Europe. There are a range of product
types (protein, lipid/protein blend, carboxylic acids and mineral micronutrients) and different
suppliers. However, there is little objective knowledge on how effective these products are;
most information is provided by the suppliers. The normal rate of use is 1.5% (for protein-
based supplements) on white strains but there is reduced use of supplements for brown
strains.
The four protein-based supplements (ProMycel Gold, Champfood E, MCSubstradd and
Natural Gold) produced an average increase in mushroom yield of 11.5% on white strain
A15. No differences were found between these supplements. This equates to a 6.4 times
multiplier in terms of cost benefit [£1 spent on supplement produces £6.40 of extra
mushrooms]. No increase in yield was detected by supplementation with carboxylic acids
and mineral micronutrients. The carboxylic acids product (MycroNutrient) is marketed as a
‘Casing Supplement’; it was included in these experiments for completeness. Previous
reports from USA have suggested that composts may be deficient in mineral micronutrients,
the evidence from these experiments suggest that the composts used (produced in Britain
and The Netherlands) are not mineral deficient.
The effects of supplements on a range of mushroom quality attributes (mushroom colour,
texture (density), flavour and dry matter content) were investigated. Protein-based
Agriculture and Horticulture Development Board 2016. All rights reserved 3
supplements improved mushroom density by 5.5%, which directly relates to mushroom
texture and also picking rates (more fresh weight picked per mushroom of the same size).
The use of supplements produced only minor or no differences in the other quality
attributes. Two protein supplements (ProMycel Gold and McSubstradd) did make the
mushrooms more yellow coloured, this is probably below the threshold of consumer
detection and the overall whiteness (L value) was unaffected. However, the small effects of
supplements on mushroom yellowness were affected by compost type and flush number
and it is therefore difficult to be sure of an overall trend.
One protein-based supplement was found to increase the yield of the brown strain,
Heirloom. This is of interest to growers of ‘browns’ as they are considered by some to be
unresponsive to supplements.
The compost type was found to influence mushroom quality but not yield: horse-manure-
based composts produced more dense mushrooms while straw-based compost produced
whiter mushrooms.
Gene expression analysis was carried out on the mycelium growing in the differently
supplemented composts to try to identify how the extra yields are achieved. The composts
of the first flush showed that only one gene had different expression levels in the protein
supplemented compost compared with the non-supplemented compost. This was a surprise
and may be because the mycelium has sufficient capacity in terms of enzymes produced to
deal with the extra protein provided. A larger number of genes had changed expression
levels in the lipid/protein treatment compared with the non-supplemented treatment. The up-
regulated genes were largely concerned with nitrogen metabolism while many of the down-
regulated genes had lipid metabolism functions. This is evidence that the lipid/protein
supplement does change the metabolism of the mycelium. However, the yield increase of
the lipid/protein supplement was the same as the protein alone supplement.
Financial Benefits The financial benefits of supplementing phase 3 compost with protein supplement (at 1.5%) to improve yields have been calculated as: that for every £1 spent on protein supplement £6.4 of extra mushrooms are produced. For this calculation Brendan Burns (of Sylvan Inc) kindly provided figures for realistic
approximate costs of supplements and compost and wholesale price of mushrooms.
Agriculture and Horticulture Development Board 2016. All rights reserved 4
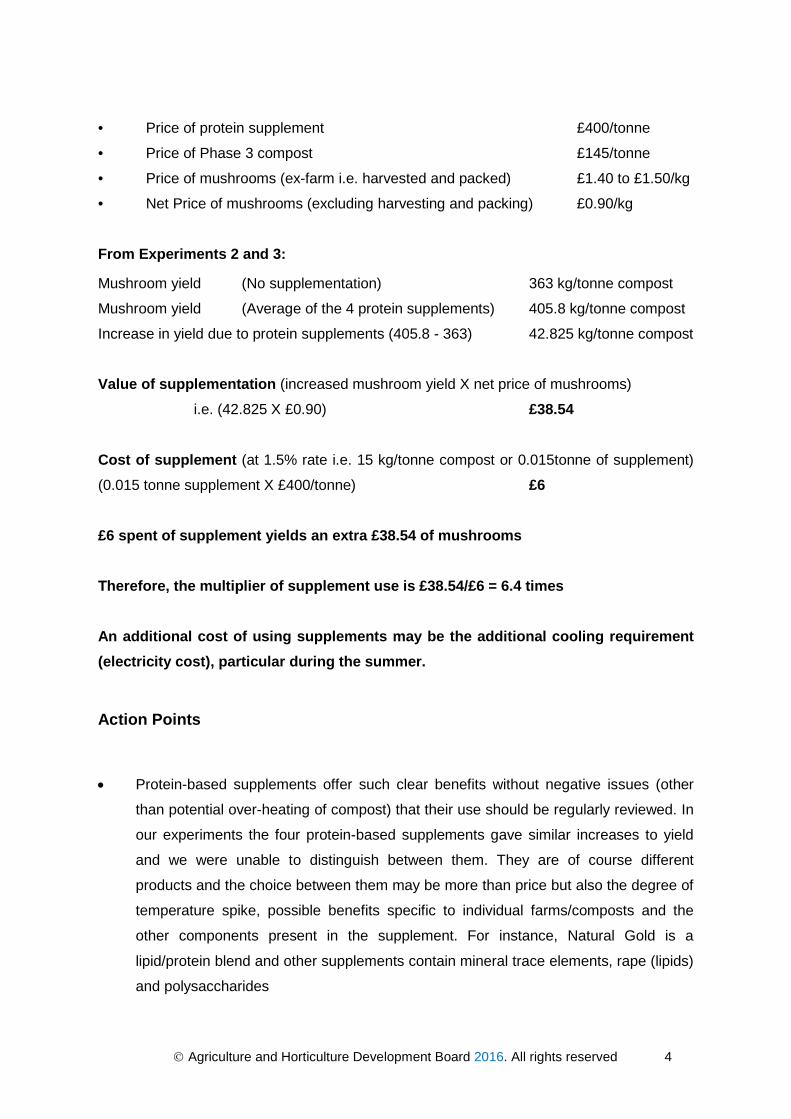
• Price of protein supplement £400/tonne
• Price of Phase 3 compost £145/tonne
• Price of mushrooms (ex-farm i.e. harvested and packed) £1.40 to £1.50/kg
• Net Price of mushrooms (excluding harvesting and packing) £0.90/kg
From Experiments 2 and 3:
Mushroom yield (No supplementation) 363 kg/tonne compost
Mushroom yield (Average of the 4 protein supplements) 405.8 kg/tonne compost
Increase in yield due to protein supplements (405.8 - 363) 42.825 kg/tonne compost
Value of supplementation (increased mushroom yield X net price of mushrooms)
i.e. (42.825 X £0.90) £38.54
Cost of supplement (at 1.5% rate i.e. 15 kg/tonne compost or 0.015tonne of supplement)
(0.015 tonne supplement X £400/tonne) £6
£6 spent of supplement yields an extra £38.54 of mushrooms Therefore, the multiplier of supplement use is £38.54/£6 = 6.4 times An additional cost of using supplements may be the additional cooling requirement (electricity cost), particular during the summer.
Action Points
• Protein-based supplements offer such clear benefits without negative issues (other
than potential over-heating of compost) that their use should be regularly reviewed. In
our experiments the four protein-based supplements gave similar increases to yield
and we were unable to distinguish between them. They are of course different
products and the choice between them may be more than price but also the degree of
temperature spike, possible benefits specific to individual farms/composts and the
other components present in the supplement. For instance, Natural Gold is a
lipid/protein blend and other supplements contain mineral trace elements, rape (lipids)
and polysaccharides
Agriculture and Horticulture Development Board 2016. All rights reserved 5
• There is the possibility that the supplement inclusion rate of 1.5% could be slightly
raised for further increases in yield if the danger of overheating compost can be
controlled
• The gene expression laboratory experiment as part of this project gives good grounds
to believe that supplementation with lipids offers future possibilities of further yield
improvements. Growers are recommended to ‘keep a watching eye’ on this
• The one negative attribute of protein-based supplement was the slight increased
yellowing of mushrooms. It is not believed that this is a problem although growers are
recommended that they again ‘keep a watching eye’ in case yellowing should ever
become a significant quality issue
• Growers of brown strains are recommended to trial protein-based supplements

Agriculture and Horticulture Development Board 2016. All rights reserved 6
SCIENCE SECTION
Introduction
Growth and development of most living organisms are highly dependent on nutrition. This
maxim of biology applies to saprotrophic fungi such as the cultivated mushroom, Agaricus
bisporus, which derives its nutrition from partially degraded leaves. Cereal straw is
composted by a two-step process (before the introduction of A. bisporus inocula) which
changes the structure, chemistry and biology of the substrate so that it is suitable for A.
bisporus mycelial growth. During composting the straw is wetted, opened up both from
macroscopic to molecular scales, the structural polymer, lignocellulose, is partially degraded
and micro-organisms grow sequestering many nutrients such as nitrogen, phosphorus and
sulphur. Some of the by-products of lignin breakdown are humic substances which enable
favourable growth of A. bisporus mycelium compared to any competing fungi.
However, compost that is selective for the growth of A. bisporus mycelium is not necessarily
optimal for the growth of A. bisporus mushrooms. A number of nutritional supplements
products (referred to hereafter as ‘supplements’) are available for the mushroom industry.
Research in the 1980s demonstrated significant increases in mushroom yield by the
addition of protein-based supplements, such as soy products, to phase 2 composts. Since
that time, the industry has largely changed to phase 3 composts and a wider range of
supplements have been made available to the industry. These include:
• Protein-based supplements from soy and biological waste sources
• Lipid-based supplements thought to act in a hormonal manner by changing the
physiology of A. bisporus mycelium
• Carboxylic acid-based products (these are largely marketed as casing supplements)
• Mineral micronutrients (originally derived for crop plant agriculture) to correct mineral
deficiencies which may exist in the compost. Micromax contains mix of calcium,
magnesium, sulphur, boron, copper, iron, manganese, molybdenum and zinc salts
There has been little impartial research on the effectiveness of these products on phase 3
composts, most of the information coming from the supplement producers or held as
proprietary information by growers and composters. The broad aims of this project are to re-
evaluate the use of nutritional supplements in the light of the range of product-types

Agriculture and Horticulture Development Board 2016. All rights reserved 7
available and phase 3 compost. A review was conducted on the range and usage of
supplements in Europe. Experiments were designed and carried out to identify the effects of
supplements on mushroom yield and mushroom quality In addition, research was
conducted to investigate how supplements might change mushroom physiology to improve
yield and quality. Whole genome microarrays (enabled by the successful international
Agaricus Genome Project – completed 2012) were employed to examine gene expression
of A. bisporus genes in composts with different supplement contents.
Materials and Methods
The review of nutritional supplement usage
The review of nutritional supplement usage was conducted by talking to growers in the UK,
Ireland, The Netherlands, Belgium and Poland, at the Mushroom Days exhibition (May
2013), HDC Mushroom Panel meetings, visits to farms and during conversations at the
MushTV project meetings. We also conducted specific consultations with supplement
suppliers (Table 1, below).
Table 1: Supplement suppliers and contact names
Supplement suppliers Contacts Amycel John Kidder, John Clay, Hubert Hay Champfood Eric de Nooij Lambert Scott McIntyre MCSubstradd Havens Bart de Leeuw NutriGain Stuart Whitehall, Frank Parker
The mushroom growth trials
Three mushroom cropping trials were conducted at Moreton Pinkney Mushroom Farm,
Moreton Pinkney, Northamptonshire, UK. For all three trials, three replicate trays were used
for each supplement x compost type, and six replicate trays for un-supplemented controls.
The experimental layout involved ‘blocking’ to improve the statistical analyses: one tray of
each supplemented treatment or two trays of un-supplemented controls were arranged in
three areas (blocks) in the growing room.
Trial One (Oct/Nov 2013) came about due to a delivery error as the phase 3 compost had
been spawned with the brown strain Heirloom. However, the researchers decided to utilise

Agriculture and Horticulture Development Board 2016. All rights reserved 8
the opportunity and investigate the effects of supplements on Heirloom. This straw-based
compost was supplemented as indicated in Table 2 and compared with non-supplemented
phase 3 compost. For comparison, two trays of A15 growing on a horse manure-based
phase 3 compost were also grown and the yields determined. These A15 data are shown in
Figure 2 (in Results section) but have not been subject to statistical analysis due to the low
replication.
Table 2: Supplements and their rate of addition used in Trial 1 (Oct/Nov 2013)
Supplement Type Product Name Rate of Supplementation (w/w)
Protein Champfood E * 1.5% Protein MCSubstradd Soya 1.5% Protein ProMycel Gold * 1.5% Lipid/protein blend Natural Gold 1.5% Carboxylic acid-based Δ MycroNutrient 0.5% Carboxylic acid-based Δ MycroNutrient 0.25% Mineral-based nutrient ‡ Micromax 0.15% Mineral-based nutrient ‡ Micromax 0.23% * At the time of writing, the manufacturer’s respective web-sites describe ProMycel Gold as
“A balanced nutritional content of lipids, carbohydrates, micronutrients, and multiple protein
sources” and Champfood to contain vitamins, minerals and trace elements”
Δ Micronutrient is recommended by manufacturers as a Casing Supplement; it was applied
here to the compost to be comparable with other treatments
‡ Micromax contains mix of calcium, magnesium, sulphur, boron, copper, iron, manganese,
molybdenum and zinc salts.
Trial Two (Jan/Feb 2014): Two phase 3 compost types were used: a straw-based compost
and a horse manure-based compost. The spawn used for both composts was A15 (Sylvan
Inc.). The phase 3 composts were filled into growing trays at 9kg/tray (fill weights of approx.
50kg/m2), either as non-supplemented controls or mixed with supplement at the following
rates (Table 3):
Agriculture and Horticulture Development Board 2016. All rights reserved 9
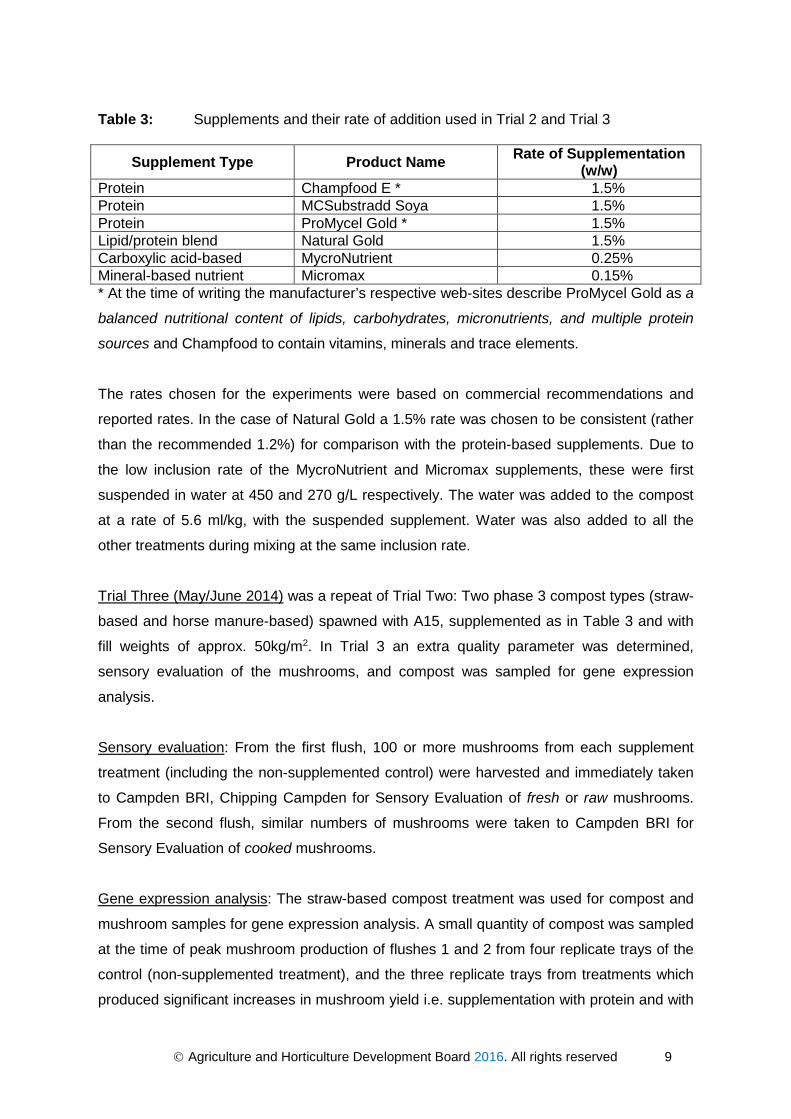
Table 3: Supplements and their rate of addition used in Trial 2 and Trial 3
Supplement Type Product Name Rate of Supplementation (w/w)
Protein Champfood E * 1.5% Protein MCSubstradd Soya 1.5% Protein ProMycel Gold * 1.5% Lipid/protein blend Natural Gold 1.5% Carboxylic acid-based MycroNutrient 0.25% Mineral-based nutrient Micromax 0.15% * At the time of writing the manufacturer’s respective web-sites describe ProMycel Gold as a
balanced nutritional content of lipids, carbohydrates, micronutrients, and multiple protein
sources and Champfood to contain vitamins, minerals and trace elements.
The rates chosen for the experiments were based on commercial recommendations and
reported rates. In the case of Natural Gold a 1.5% rate was chosen to be consistent (rather
than the recommended 1.2%) for comparison with the protein-based supplements. Due to
the low inclusion rate of the MycroNutrient and Micromax supplements, these were first
suspended in water at 450 and 270 g/L respectively. The water was added to the compost
at a rate of 5.6 ml/kg, with the suspended supplement. Water was also added to all the
other treatments during mixing at the same inclusion rate.
Trial Three (May/June 2014) was a repeat of Trial Two: Two phase 3 compost types (straw-
based and horse manure-based) spawned with A15, supplemented as in Table 3 and with
fill weights of approx. 50kg/m2. In Trial 3 an extra quality parameter was determined,
sensory evaluation of the mushrooms, and compost was sampled for gene expression
analysis.
Sensory evaluation: From the first flush, 100 or more mushrooms from each supplement
treatment (including the non-supplemented control) were harvested and immediately taken
to Campden BRI, Chipping Campden for Sensory Evaluation of fresh or raw mushrooms.
From the second flush, similar numbers of mushrooms were taken to Campden BRI for
Sensory Evaluation of cooked mushrooms.
Gene expression analysis: The straw-based compost treatment was used for compost and
mushroom samples for gene expression analysis. A small quantity of compost was sampled
at the time of peak mushroom production of flushes 1 and 2 from four replicate trays of the
control (non-supplemented treatment), and the three replicate trays from treatments which
produced significant increases in mushroom yield i.e. supplementation with protein and with

Agriculture and Horticulture Development Board 2016. All rights reserved 10
lipid/protein blend. The compost from one representative protein treatment was chosen for
gene expression analysis: Champfood E, and the compost supplemented with Natural Gold,
the lipid/protein blend.
The composts were cased with commercial McArdle casing, cacced with phase 3 compost
and mushrooms were grown as per commercial conditions.
Data collected and Measurements made
Compost Temperatures
Temperature probes were inserted into the composts to monitor temperature changes after
supplementation and during mushroom growth.
Compost Analyses
All samples of composts used in the experiments were analysed for moisture, nitrogen,
ammonium-N, and ash contents, pH and electrical conductivity. The moisture content of the
composts was also determined at the end of cropping. The supplements were also
analysed for moisture and ash contents.
Mushroom Yields
In Trials One, Two and Three the mushrooms were harvested over three flushes and the
harvest weights (yields) were measured. The results were analysed by ANOVA.
Mushroom quality (Trials Two and Three) was determined as:
1. Mushroom cap colour using a Minolta meter which measures overall whiteness
(parameter ‘L’) and colour (parameter ‘a’ for red to green, and parameter ‘b’ for
yellow to blue). Three replicate mushrooms were examined from flushes one and
two from each tray. Each mushroom was measured on the top and on two opposite
sides.
2. Mushroom cap density (from the non-supplemented compost, and Promycel Gold,
Natural Gold and Champfood E treatments) by measuring the weight of a 10mm
cube of tissue. Mushroom density is closely correlated with texture or firmness
(McGarry and Burton, 1994). Three replicate mushrooms were examined from
flushes one and two from each tray.
Agriculture and Horticulture Development Board 2016. All rights reserved 11
3. Mushroom Dry Matter content (%): the fresh weight of approx. 150 g of mushrooms
was accurately weighed from each tray and for each flush. The mushrooms were
then oven dried and the dry weights determined.
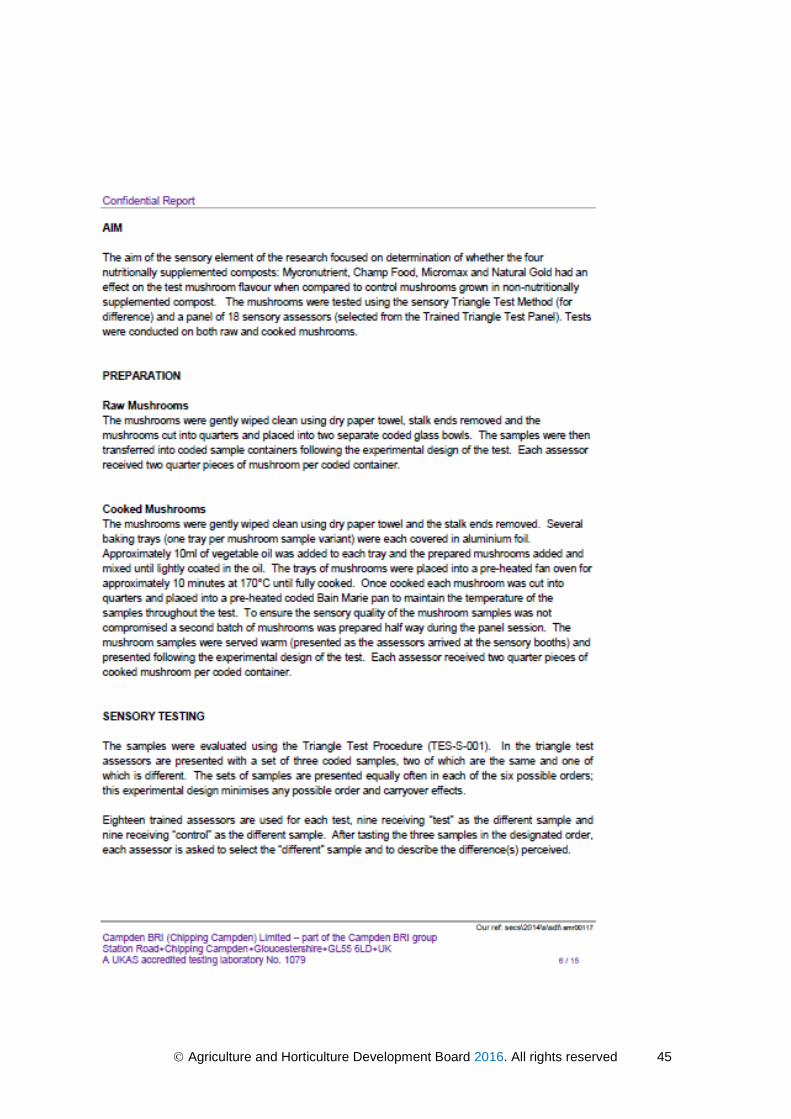
4. Mushroom Sensory Evaluation (flavour) conducted at Campden BRI: The mushroom
sample preparation prior to was as follows:
Raw Mushrooms: The mushrooms were gently wiped clean using dry paper towel,
stalk ends removed and the mushrooms cut into quarters and placed into two
separate coded glass bowls. The samples were then transferred into coded sample
containers following the experimental design of the test. Each assessor received two
quarter pieces of mushroom per coded container.
Cooked Mushrooms: The mushrooms were gently wiped clean using dry paper towel
and the stalk ends removed. Several baking trays (one tray per mushroom sample
variant) were each covered in aluminium foil. Approximately 10ml of vegetable oil
was added to each tray and the prepared mushrooms added and mixed until lightly
coated in the oil. The trays of mushrooms were placed into a pre-heated fan oven for
approximately 10 minutes at 170°C until fully cooked. Once cooked each mushroom
was cut into quarters and placed into a pre-heated coded Bain Marie pan to maintain
the temperature of the samples throughout the test. To ensure the sensory quality of
the mushroom samples was not compromised, a second batch of mushrooms was
prepared half way during the panel session. The mushroom samples were served
warm (presented as the assessors arrived at the sensory booths) and presented
following the experimental design of the test. Each assessor received two quarter
pieces of cooked mushroom per coded container.
Sensory Testing
The samples were evaluated using the Triangle Test Procedure (TES-S-001). In the
triangle test assessors were presented with a set of three coded samples, two of
which were the same and one of which was different. The sets of samples were
presented equally often in each of the six possible orders; this experimental design
minimised any possible order and carryover effects.
Eighteen trained assessors were used for each test, nine received “test” as the
different sample and nine received “control” as the different sample. After tasting the
three samples in the designated order, each assessor was asked to select the
“different” sample and to describe the difference(s) perceived.
Agriculture and Horticulture Development Board 2016. All rights reserved 12
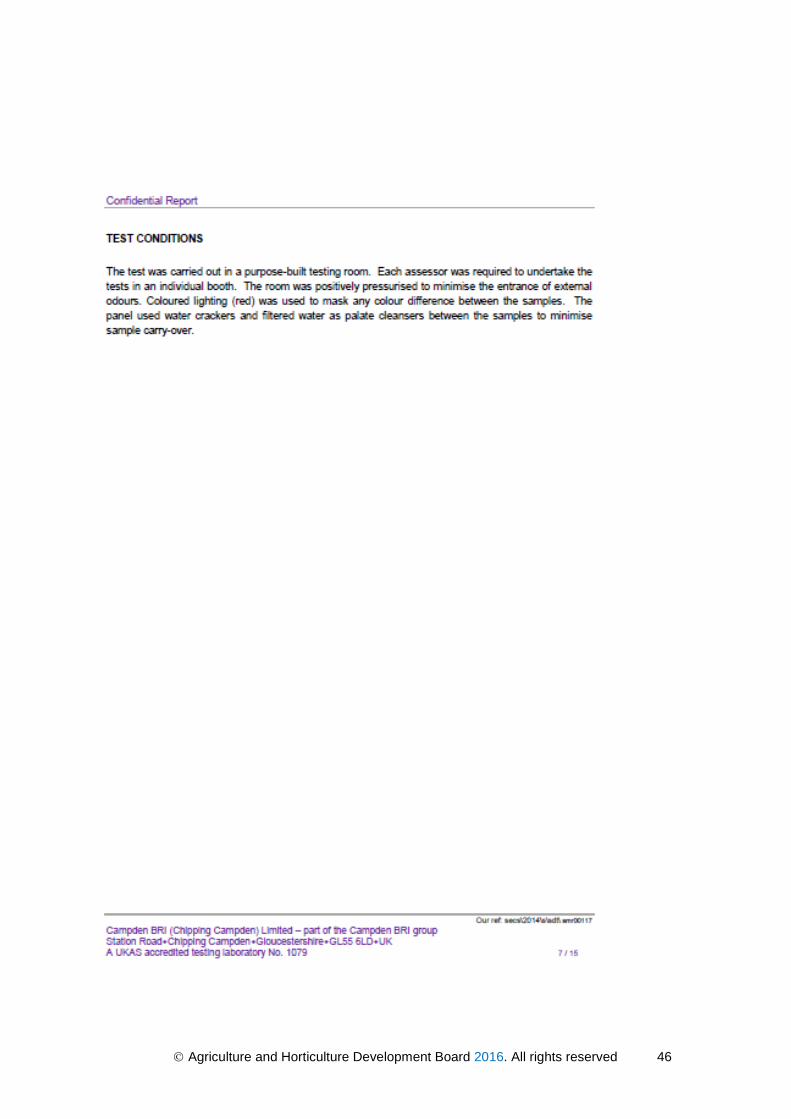
Test Conditions
The test was carried out in a purpose-built testing room. Each assessor was
required to undertake the tests in an individual booth. The room was positively
pressurised to minimise the entrance of external odours. Coloured lighting (red) was
used to mask any colour difference between the samples. The panel used water
crackers and filtered water as palate cleansers between the samples to minimise
sample carry-over.
Gene Expression analysis of composts:
A total of 24 compost samples were collected (three treatments (control, Champfood E and
Natural Gold) ⤬ two flushes ⤬ four replicates).
After harvest, the composts were frozen in liquid nitrogen and transported frozen to East
Malling Research where samples were stored at -800 C until use. RNA was extracted from
the compost using a method developed in the MushTV project; RNA extraction from
mushroom compost involved milling the frozen compost using metal ball bearings,
extraction of RNA with Trizol buffer followed by a clean-up step using silica. Each purified
RNA sample was converted by random priming into cRNA via cDNA, fluorescently-labeled
with cyanine-3, and hybridised to a different microarray. To determine the amount of
hybridiation to each probe, arrays were laser scanned and the resulting images analysed
using commercially available image analysis software. The microarrays were manufactured
by Agilent Technologies (Santa Clara, California, USA) incorporating 10468 in situ
synthesized 60-mer probes. Each probe was replicated five times on each microarray.
Data handling
The data were imported into ‘R’ where normalisation, filtering and statistical analysis were
undertaken using the Bioconductor Limma package (Ritchie et al., 2015).
Normalisation
The data were background corrected using normal exponential convolution with an offset of
50. Between array normalisation was performed using the quantile method.

Agriculture and Horticulture Development Board 2016. All rights reserved 13
Data filtering
To reduce false discovery rate of differentially expressed genes, the data were filtered to
remove features that showed no expression (using the Agilent Well Above Background
Boolean flag).
Each biological replicate set was filtered using an aggressive filter (≥ 50% present) due to
the small number of biological replicates (<=four) for each set (McClintick and Edenberg,
2006). Features failing the filter across all sets were removed before calculating
significance. Control probes were removed prior to normalisation.
Outliers within a technical replicate set were replaced with the median value of that set.
Outliers were defined by two criteria: (1) log expression value greater/less than 1.0 from set
median value and (2) replicate set range greater than 2.0. Technical replicates were then
combined and log expression value replaced with the set median value.
Statistical analysis
Initial analysis identified two arrays as “outliers” with very different expression patterns
compared with comparable arrays, these were then excluded from further analyses.
For statistical analysis and normalisation the data from the remaining 22 microarrays were
combined. Comparisons were made between treated and control samples, with each time-
point taken separately. Differences in transcript levels between the comparisons were
calculated using Empirical Bayes Statistics for Differential Expression (Smyth, 2004) with
Benjamini and Hochberg False Discovery Rate correction for multiple testing (Benjamini
and Hochberg, 1995). Statistical significance was taken as p <= 0.05.
GO functional analysis
GO (Gene Ontology) functional analysis was performed using the BiNGO plugin (2.44) for
Cytoscape 2.8.3 (Maere et al., 2005). Gene Ontology was downloaded from the Gene
Ontology Consortium (geneontology.org/page/downloads) on 07/07/2015. An A. bisporus
gene to GO annotation file was created manually from publically available A. bisporus
functional annotation.
Agriculture and Horticulture Development Board 2016. All rights reserved 14
Statistical Analyses of Yield and Quality Data
For trials 2 and 3 there were three replicate trays per treatment/compost type combination
and six replicate trays for the non-supplemented controls. To account for any within house
variation, the replicate trays were distributed in the mushroom house in replicate blocks. For
Trial One, which examined the effects of supplements on Heirloom growing on straw-based
compost, three replicate trays were used per supplement treatment. However comparisons
cannot be made with A15 performance as only two trays of A15 growing on a horse
manure-based phase 3 compost were grown
Yield data and quality data were analysed by Analysis of Variance (ANOVA) using Genstat
unless stated otherwise.
Results
The review of nutritional supplement usage
Numerous conversations have been held with mushroom growers, compost manufacturers
and supplement suppliers concerning usage of nutritional supplements. The situation is
dynamic with growers and composters prepared to change or look at different supplements,
the partial replacement of soy with keratin-based products and the recent interest in liquid
casing supplements.
The Key findings of these conversations are:
• >90% of phase 3 compost in Europe is supplemented because it is believed that
supplement use has a beneficial effect on quality and production of mushrooms.
- Less supplementation during summer
− Some Heirloom growers have reduced supplement usage particularly in the
summer. A large Pennsylvania grower has informed the authors that in his
experience with trialling supplements with Heirloom, only a small and variable
increase in yields was detected.
− Protein supplement most commonly used
− Rate: 1.4 – 1.5% for protein supplements, 1.2% for Natural Gold
Agriculture and Horticulture Development Board 2016. All rights reserved 15
− Protein from soy and other protein products:
• soy
• soy + various formulations (alternative protein sources and minerals)
• NutriGain products (lipid/protein blend and carboxylic acids) in commercial use
- Cracked maize (Poland)
• There is considerable interest in the potential of liquid supplement for compost
and/or casing
A list of available supplements is given in the table (Table 4) below:
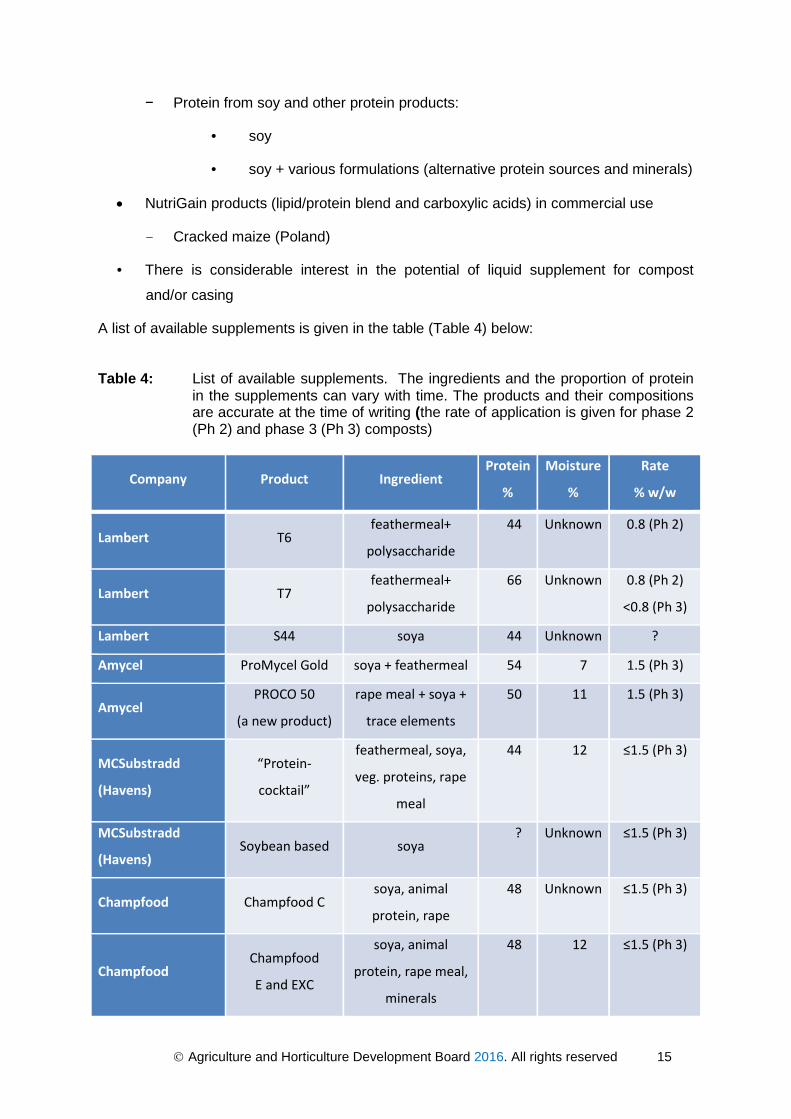
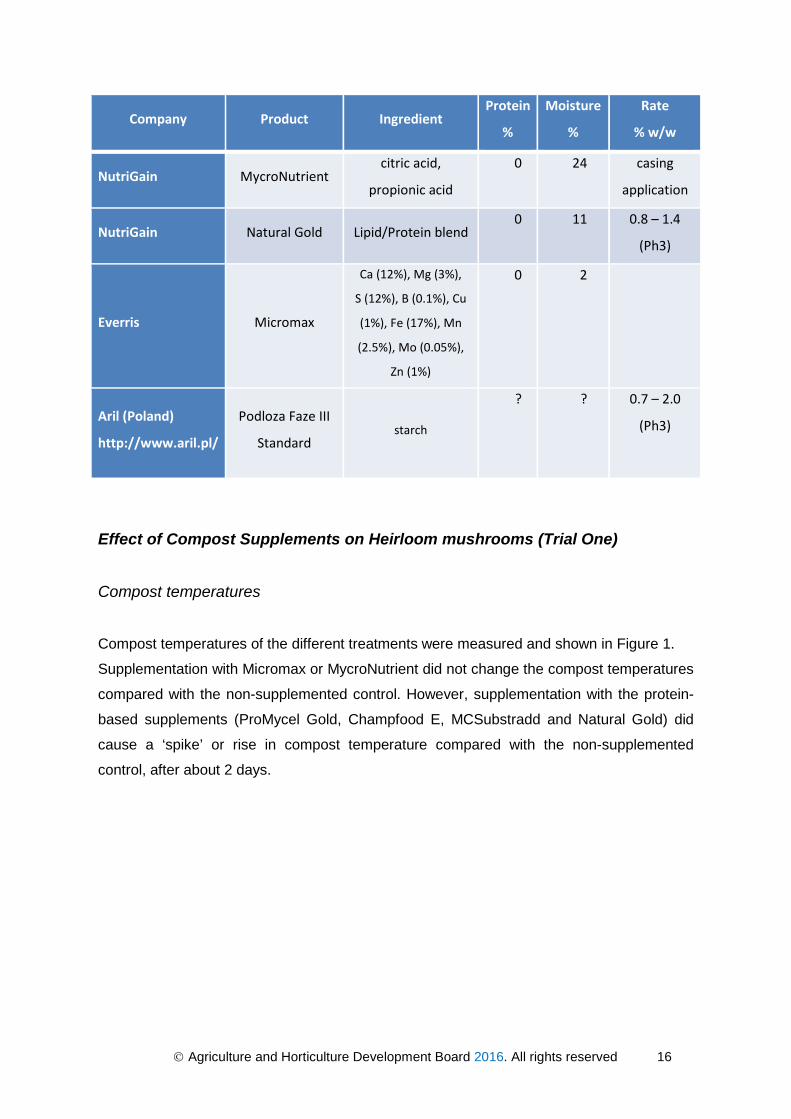
Table 4: List of available supplements. The ingredients and the proportion of protein
in the supplements can vary with time. The products and their compositions are accurate at the time of writing (the rate of application is given for phase 2 (Ph 2) and phase 3 (Ph 3) composts)
Company Product Ingredient Protein %
Moisture %
Rate % w/w
Lambert T6 feathermeal+ polysaccharide
44 Unknown 0.8 (Ph 2)
Lambert T7 feathermeal+ polysaccharide
66 Unknown 0.8 (Ph 2) <0.8 (Ph 3)
Lambert S44 soya 44 Unknown ? Amycel ProMycel Gold soya + feathermeal 54 7 1.5 (Ph 3)
Amycel PROCO 50
(a new product) rape meal + soya +
trace elements 50 11 1.5 (Ph 3)
MCSubstradd
(Havens) “Protein-
cocktail”
feathermeal, soya,
veg. proteins, rape
meal
44 12 ≤1.5 (Ph 3)
MCSubstradd (Havens) Soybean based soya ? Unknown ≤1.5 (Ph 3)
Champfood Champfood C soya, animal
protein, rape 48 Unknown ≤1.5 (Ph 3)
Champfood Champfood E and EXC
soya, animal
protein, rape meal,
minerals
48 12 ≤1.5 (Ph 3)
Agriculture and Horticulture Development Board 2016. All rights reserved 16
Company Product Ingredient Protein %
Moisture %
Rate % w/w
NutriGain MycroNutrient citric acid,
propionic acid 0 24 casing
application
NutriGain Natural Gold Lipid/Protein blend 0 11 0.8 – 1.4
(Ph3)
Everris Micromax
Ca (12%), Mg (3%), S (12%), B (0.1%), Cu
(1%), Fe (17%), Mn
(2.5%), Mo (0.05%),
Zn (1%)
0 2
Aril (Poland)
http://www.aril.pl/
Podloza Faze III
Standard starch
? ? 0.7 – 2.0
(Ph3)
Effect of Compost Supplements on Heirloom mushrooms (Trial One)
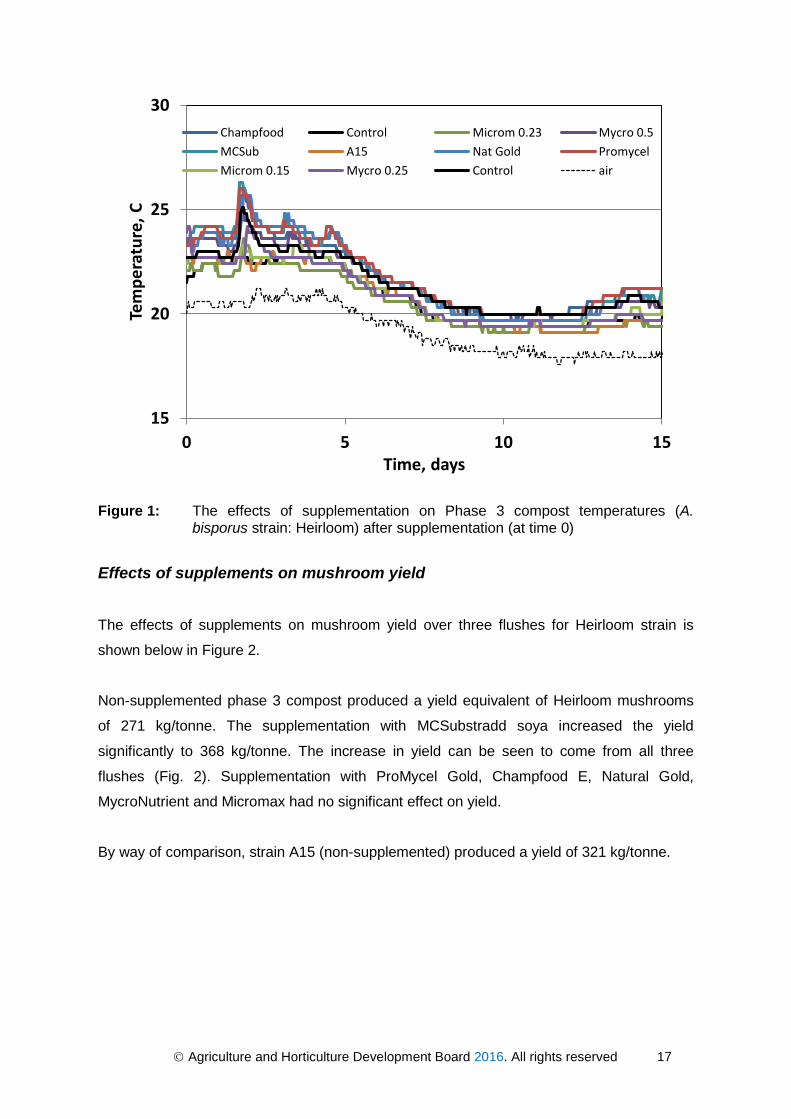
Compost temperatures
Compost temperatures of the different treatments were measured and shown in Figure 1.
Supplementation with Micromax or MycroNutrient did not change the compost temperatures
compared with the non-supplemented control. However, supplementation with the protein-
based supplements (ProMycel Gold, Champfood E, MCSubstradd and Natural Gold) did
cause a ‘spike’ or rise in compost temperature compared with the non-supplemented
control, after about 2 days.
Agriculture and Horticulture Development Board 2016. All rights reserved 17
Figure 1: The effects of supplementation on Phase 3 compost temperatures (A.
bisporus strain: Heirloom) after supplementation (at time 0)
Effects of supplements on mushroom yield
The effects of supplements on mushroom yield over three flushes for Heirloom strain is
shown below in Figure 2.
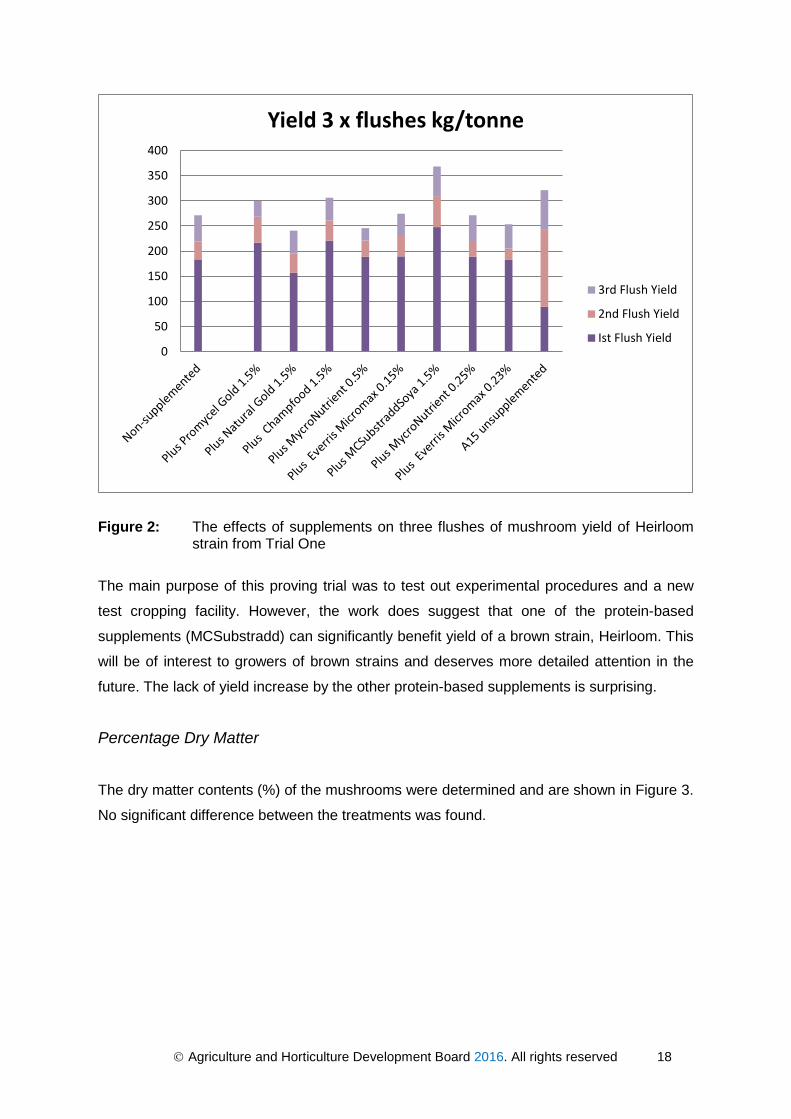
Non-supplemented phase 3 compost produced a yield equivalent of Heirloom mushrooms
of 271 kg/tonne. The supplementation with MCSubstradd soya increased the yield
significantly to 368 kg/tonne. The increase in yield can be seen to come from all three
flushes (Fig. 2). Supplementation with ProMycel Gold, Champfood E, Natural Gold,
MycroNutrient and Micromax had no significant effect on yield.
By way of comparison, strain A15 (non-supplemented) produced a yield of 321 kg/tonne.
15
20
25
30
0 5 10 15
Tem
pera
ture
, C
Time, days
Champfood Control Microm 0.23 Mycro 0.5MCSub A15 Nat Gold PromycelMicrom 0.15 Mycro 0.25 Control air
Agriculture and Horticulture Development Board 2016. All rights reserved 18
Figure 2: The effects of supplements on three flushes of mushroom yield of Heirloom
strain from Trial One
The main purpose of this proving trial was to test out experimental procedures and a new
test cropping facility. However, the work does suggest that one of the protein-based
supplements (MCSubstradd) can significantly benefit yield of a brown strain, Heirloom. This
will be of interest to growers of brown strains and deserves more detailed attention in the
future. The lack of yield increase by the other protein-based supplements is surprising.
Percentage Dry Matter
The dry matter contents (%) of the mushrooms were determined and are shown in Figure 3.
No significant difference between the treatments was found.
0
50
100
150
200
250
300
350
400
Yield 3 x flushes kg/tonne
3rd Flush Yield
2nd Flush Yield
Ist Flush Yield

Agriculture and Horticulture Development Board 2016. All rights reserved 19
Figure 3: The dry matter content (%) of Heirloom mushrooms from Trial 1
Effect of Compost Supplements on A15 mushrooms (Trials 2 and 3)
Unless stated otherwise, the results for Trials 2 and 3 were combined before being
statistically analysed together
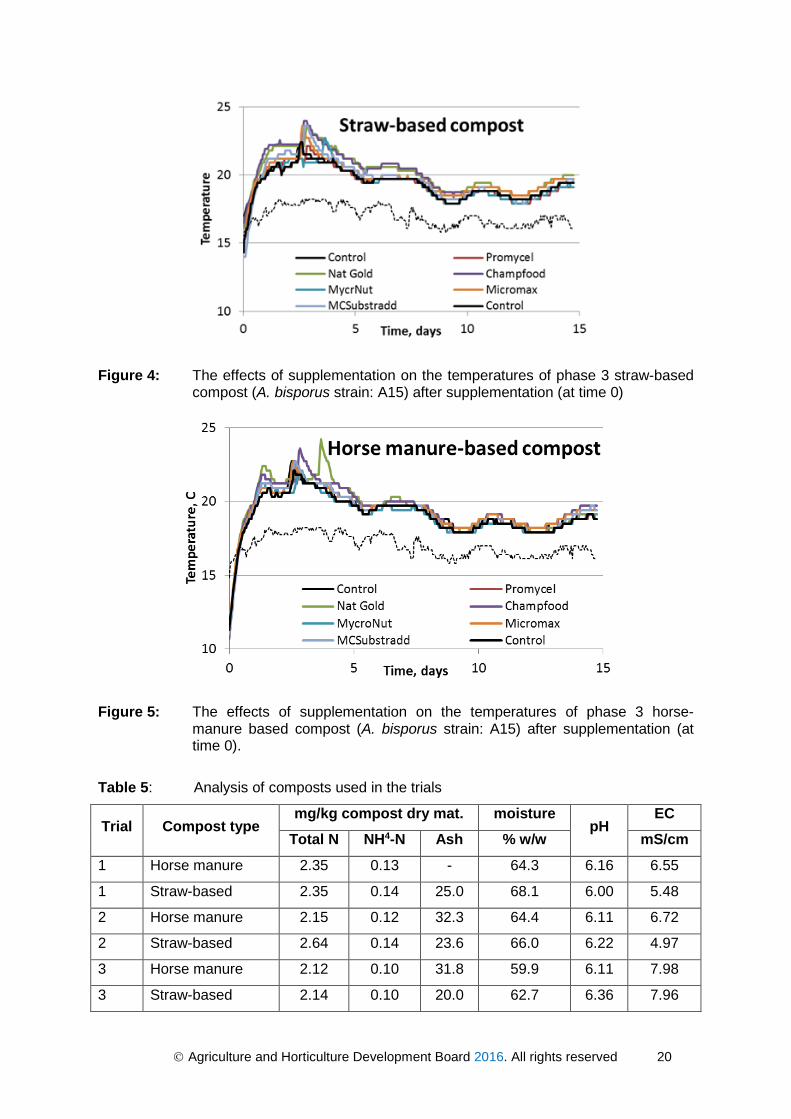
Compost Temperatures Temperature probe read-outs from Trial 2 are shown in Figures 4 and 5. None of the
supplement treatments resulted in very high temperature spikes. Champfood and Natural
Gold treatments resulted in the highest compost temperatures, up to 3C higher than the
unsupplemented control treatment. The MCSubstadd supplement increased compost
temperature by 1-2C above the control treatment.
0.001.002.003.004.005.006.007.008.009.00
% Dry Weight
Ist Flush DW
2nd Flush DW
Agriculture and Horticulture Development Board 2016. All rights reserved 20
Figure 4: The effects of supplementation on the temperatures of phase 3 straw-based
compost (A. bisporus strain: A15) after supplementation (at time 0)
Compost and supplement analyses:.
Figure 5: The effects of supplementation on the temperatures of phase 3 horse-manure based compost (A. bisporus strain: A15) after supplementation (at time 0).
Table 5: Analysis of composts used in the trials
Trial Compost type mg/kg compost dry mat. moisture
pH EC
Total N NH4-N Ash % w/w mS/cm
1 Horse manure 2.35 0.13 - 64.3 6.16 6.55
1 Straw-based 2.35 0.14 25.0 68.1 6.00 5.48
2 Horse manure 2.15 0.12 32.3 64.4 6.11 6.72
2 Straw-based 2.64 0.14 23.6 66.0 6.22 4.97
3 Horse manure 2.12 0.10 31.8 59.9 6.11 7.98
3 Straw-based 2.14 0.10 20.0 62.7 6.36 7.96
Agriculture and Horticulture Development Board 2016. All rights reserved 21
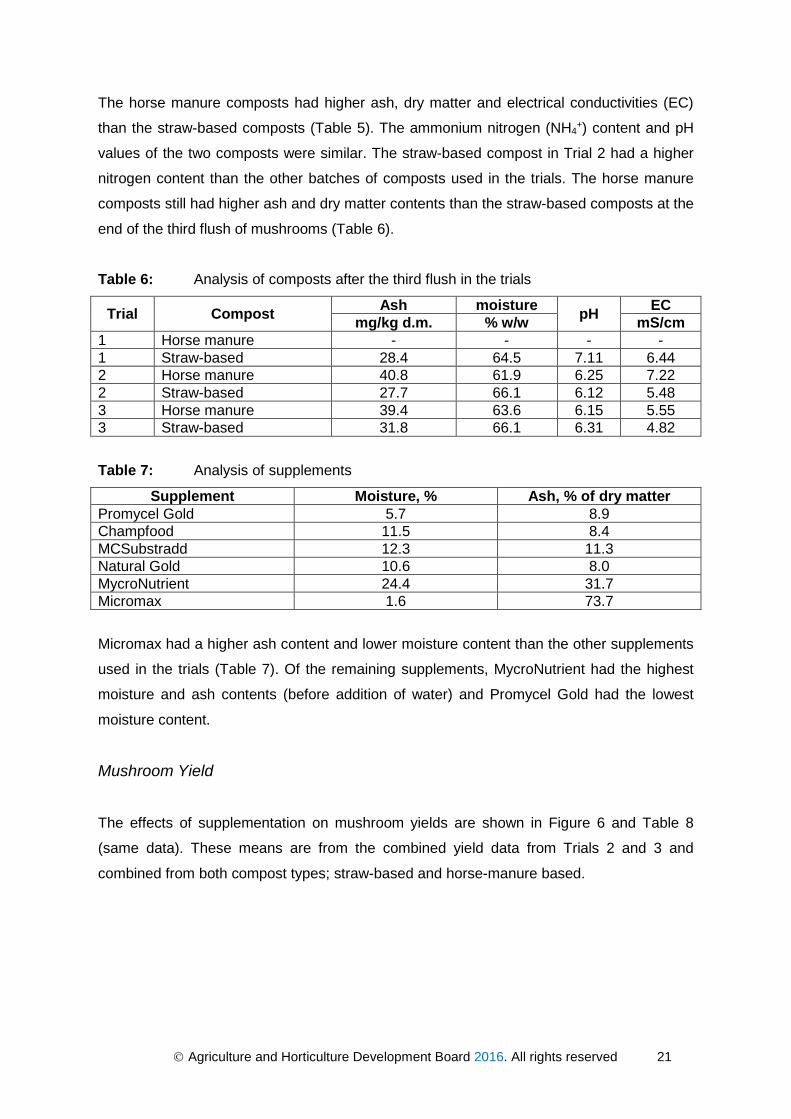
The horse manure composts had higher ash, dry matter and electrical conductivities (EC)
than the straw-based composts (Table 5). The ammonium nitrogen (NH4+) content and pH
values of the two composts were similar. The straw-based compost in Trial 2 had a higher
nitrogen content than the other batches of composts used in the trials. The horse manure
composts still had higher ash and dry matter contents than the straw-based composts at the
end of the third flush of mushrooms (Table 6).
Table 6: Analysis of composts after the third flush in the trials
Trial Compost Ash moisture pH EC mg/kg d.m. % w/w mS/cm
1 Horse manure - - - - 1 Straw-based 28.4 64.5 7.11 6.44 2 Horse manure 40.8 61.9 6.25 7.22 2 Straw-based 27.7 66.1 6.12 5.48 3 Horse manure 39.4 63.6 6.15 5.55 3 Straw-based 31.8 66.1 6.31 4.82
Table 7: Analysis of supplements
Supplement Moisture, % Ash, % of dry matter Promycel Gold 5.7 8.9 Champfood 11.5 8.4 MCSubstradd 12.3 11.3 Natural Gold 10.6 8.0 MycroNutrient 24.4 31.7 Micromax 1.6 73.7
Micromax had a higher ash content and lower moisture content than the other supplements
used in the trials (Table 7). Of the remaining supplements, MycroNutrient had the highest
moisture and ash contents (before addition of water) and Promycel Gold had the lowest
moisture content.
Mushroom Yield
The effects of supplementation on mushroom yields are shown in Figure 6 and Table 8
(same data). These means are from the combined yield data from Trials 2 and 3 and
combined from both compost types; straw-based and horse-manure based.

Agriculture and Horticulture Development Board 2016. All rights reserved 22
Figure 6: The effects of supplementation on mushroom yield of A15 mushrooms from
Trials 2 and 3. Error bars show the Standard Error Table 8: The effects of supplementation on mushroom yield (kg/t) of A15 mushrooms
from Trials 2 and 3 (same data as Figure 6)
The control non-supplemented composts produced an average yield of 363.6 kg/t.
Supplementation with the protein and lipid-protein products significantly increased yields (p
< 0.05) to 402-412 kg/t. The average increase in yield by the four supplements containing
protein was 11.5%. There were no significant differences in the yields between protein-
based supplements. There was no significant yield effect of supplementation with
MycroNutrient or Micromax. It should be emphasized that MycroNutrient is marketed as a
casing supplement, it was included here to make the comparisons of compost supplements
complete.
320
340
360
380
400
420
440
Yieldkg/t
Supplement Type
Con
trol
ProM
ycel
G
old
Nat
ural
G
old
Cha
mpf
ood
E
Myc
ro
Nut
rient
Mic
rom
ax
MC
Su
bstr
add
363.6 403.2 402 405.3 377.7 378.9 412.8

Agriculture and Horticulture Development Board 2016. All rights reserved 23
Effect of compost-type on mushroom yields
Trials 2 and 3 both used two different compost types; straw-based and horse manure
based. No significant differences were found between the compost types on mushroom
yield. However, batch to batch variability was detected as Trial 2 showed a greater yield for
horse manure based compost and Trial 3 showed a greater yield for straw based compost
(Figure 7). This was possibly due to the higher moisture content of the straw-based
composts. In Trial 3, this was beneficial (62.7% for straw-based compost and 59.9% for
horse manure compost). However, in Trial 2, this may have been detrimental (66% for
straw-based compost and 64.7% for horse manure compost).
Figure 7: The effects of compost-type on mushroom yield of strain A15 from Trials 2
and 3. Error bars show the Standard Error.
Mushroom Quality Mushroom quality was measured as: mushroom cap colour, mushroom density, dry matter
content (%) (all combined for Trials 2 and 3) and mushroom sensory analysis (Trial 3 only).
Mushroom cap colour:
Mushroom cap colour was measured using a Minolta meter which produces three
parameters to describe colour: L, a measure of the lightness to darkness, pure white being
a figure of 100; ‘a’ a measure of redness; and ‘b’ a measure of yellowness. Cap colour was
340
350
360
370
380
390
400
410
420
430
Expt 2 Expt 3
Yieldkg/t
Compost Type
Horse manure-based
Straw based
Agriculture and Horticulture Development Board 2016. All rights reserved 24
measured on the tops and the sides of the mushroom as these are known to have different
colour characteristics (Burton, Frost and Atkey, 1987).
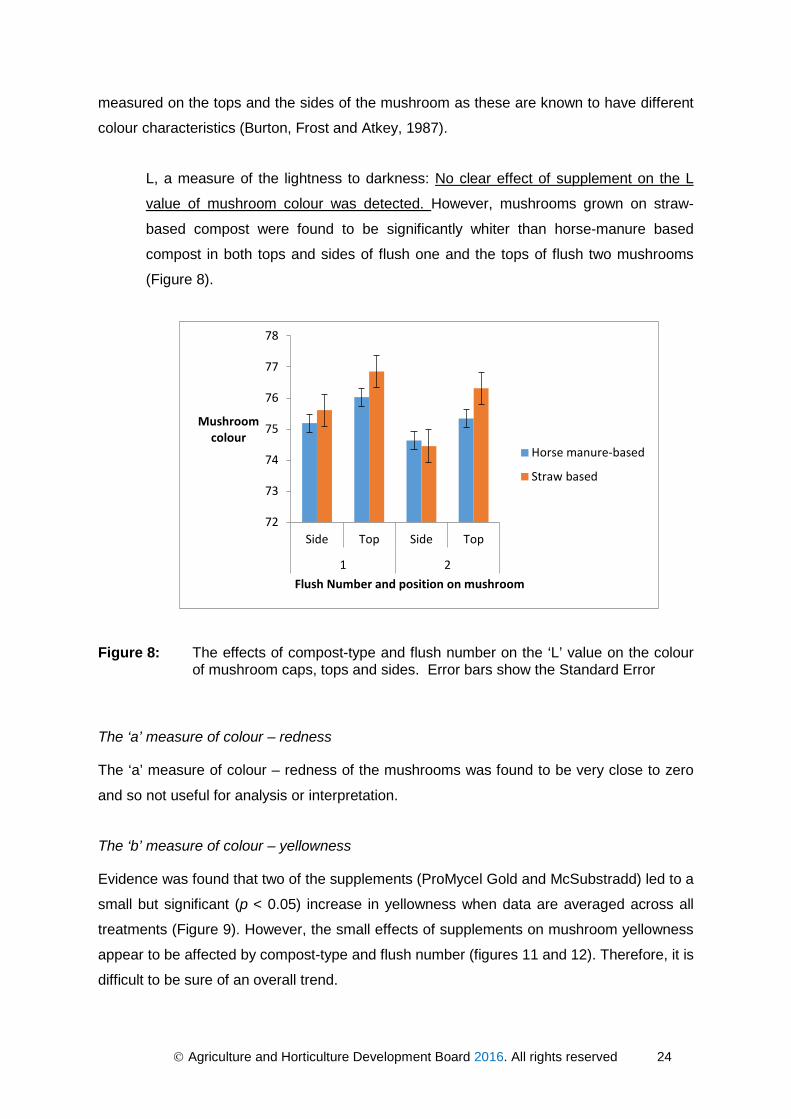
L, a measure of the lightness to darkness: No clear effect of supplement on the L
value of mushroom colour was detected. However, mushrooms grown on straw-
based compost were found to be significantly whiter than horse-manure based
compost in both tops and sides of flush one and the tops of flush two mushrooms
(Figure 8).
Figure 8: The effects of compost-type and flush number on the ‘L’ value on the colour of mushroom caps, tops and sides. Error bars show the Standard Error
The ‘a’ measure of colour – redness
The ‘a’ measure of colour – redness of the mushrooms was found to be very close to zero
and so not useful for analysis or interpretation.
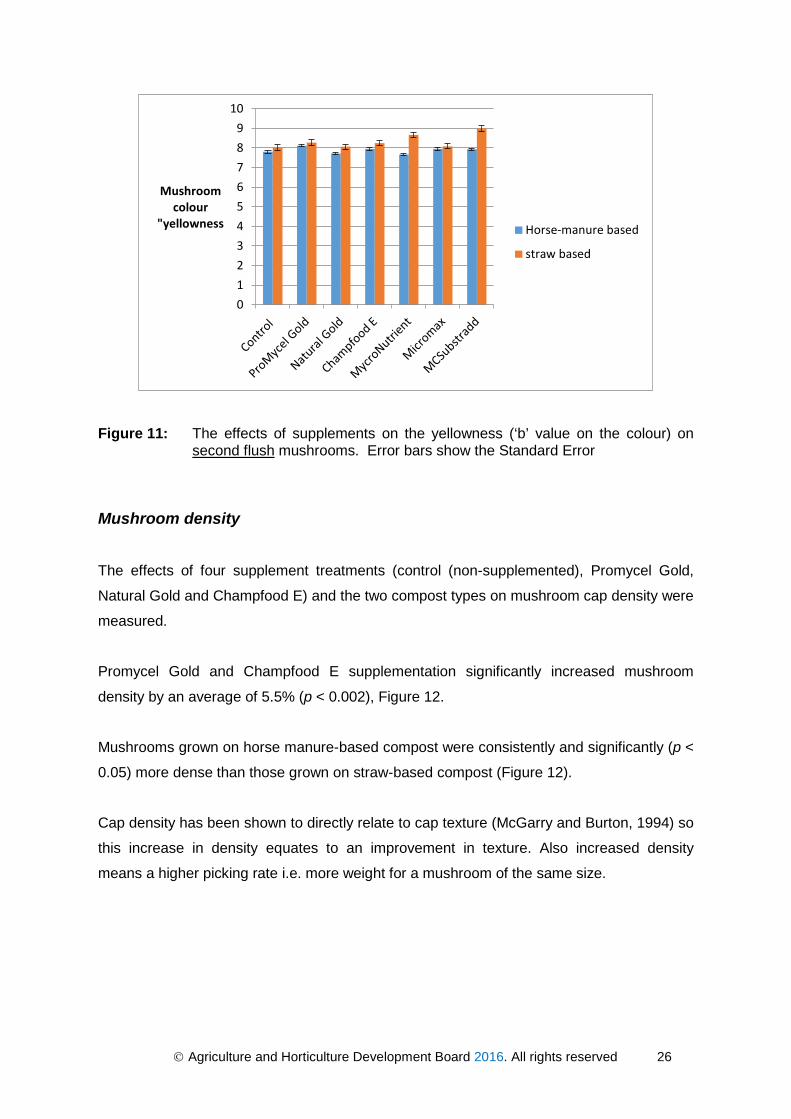
The ‘b’ measure of colour – yellowness
Evidence was found that two of the supplements (ProMycel Gold and McSubstradd) led to a
small but significant (p < 0.05) increase in yellowness when data are averaged across all
treatments (Figure 9). However, the small effects of supplements on mushroom yellowness
appear to be affected by compost-type and flush number (figures 11 and 12). Therefore, it is
difficult to be sure of an overall trend.
72
73
74
75
76
77
78
Side Top Side Top
1 2
Mushroom colour
Flush Number and position on mushroom
Horse manure-based
Straw based

Agriculture and Horticulture Development Board 2016. All rights reserved 25
Figure 9: The effects of supplements on the yellowness (‘b’ value on the colour) on
mushrooms (averaged across Trials 2 & 3, flushes and compost-type). Error bars show the Standard Error.
Figure 10: The effects of supplements on the yellowness (‘b’ value on the colour) on first
flush mushrooms. Error bars show the Standard Error.
7.5
7.6
7.7
7.8
7.9
8
8.1
8.2
8.3
8.4
Mushroom colour
"yellowness
6.87
7.27.47.67.8
88.28.48.68.8
Mushroom colour
"yellowness Horse-manure based
straw based
Agriculture and Horticulture Development Board 2016. All rights reserved 26
Figure 11: The effects of supplements on the yellowness (‘b’ value on the colour) on
second flush mushrooms. Error bars show the Standard Error
Mushroom density The effects of four supplement treatments (control (non-supplemented), Promycel Gold,
Natural Gold and Champfood E) and the two compost types on mushroom cap density were
measured.
Promycel Gold and Champfood E supplementation significantly increased mushroom
density by an average of 5.5% (p < 0.002), Figure 12.
Mushrooms grown on horse manure-based compost were consistently and significantly (p <
0.05) more dense than those grown on straw-based compost (Figure 12).
Cap density has been shown to directly relate to cap texture (McGarry and Burton, 1994) so
this increase in density equates to an improvement in texture. Also increased density
means a higher picking rate i.e. more weight for a mushroom of the same size.
0123456789
10
Mushroom colour
"yellowness Horse-manure based
straw based

Agriculture and Horticulture Development Board 2016. All rights reserved 27
Figure 12: The effects of supplements and compost-type on mushroom density. Error
bars show the Standard Error.
Dry matter Content (%)
There were no significant differences of supplement (p = 0.44) use or compost type (p =
0.066) in the dry matter content (%). First flush mushrooms had a dry matter content of
7.834% while second flush mushrooms it was 7.094%.
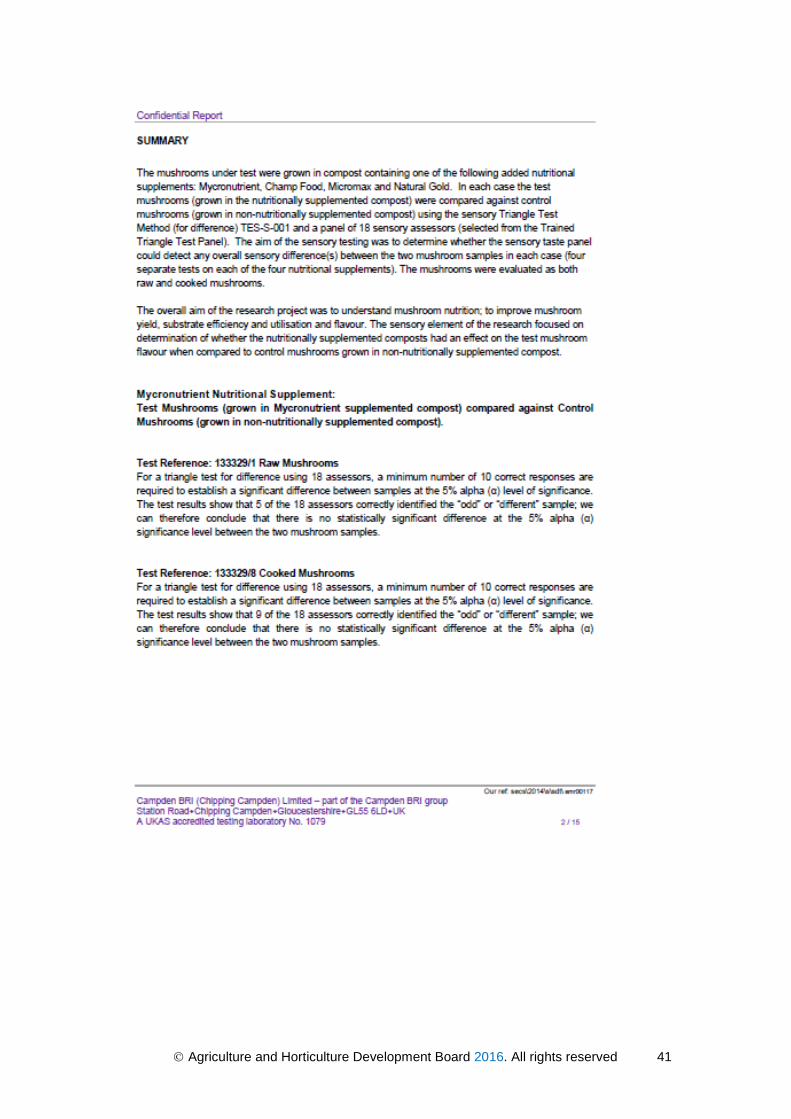
Mushroom Sensory Analysis
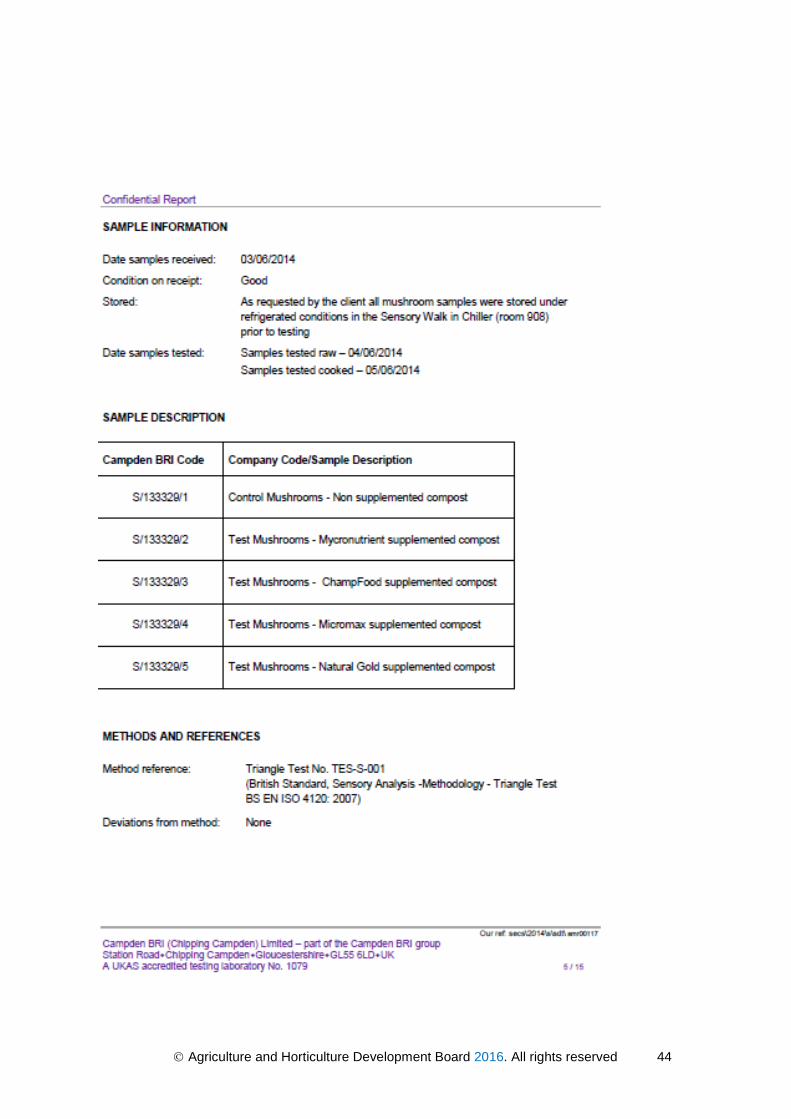
Mushroom samples were sent to Campdens BRI for sensory evaluation to determine
whether nutritional supplementation could affect flavour and any other sensory aspects of
the mushrooms. Mushrooms provided to Campdens BRI were (1) control non-
supplemented; and mushrooms supplemented with (2) Mycronutrient; (3) Champfood (as
an example of the three protein supplements); (4) Micromax and (5) Natural Gold. Two sets
of evaluations were performed on fresh or raw mushrooms and on cooked mushrooms.
The test performed was the Triangle Test e.g. whereby assessors were given (blind) two
control mushrooms and one supplemented mushroom, or vice versa, and try to identify the
‘odd one out’. Using 18 assessors, a minimum number of 10 correct responses are required
to establish a significant difference between samples at the 5% alpha (α) level of
significance.
600
620
640
660
680
700
720
740
Cap densitymg/ml
Supplement Type
Horse manure-based
Straw based
Agriculture and Horticulture Development Board 2016. All rights reserved 28
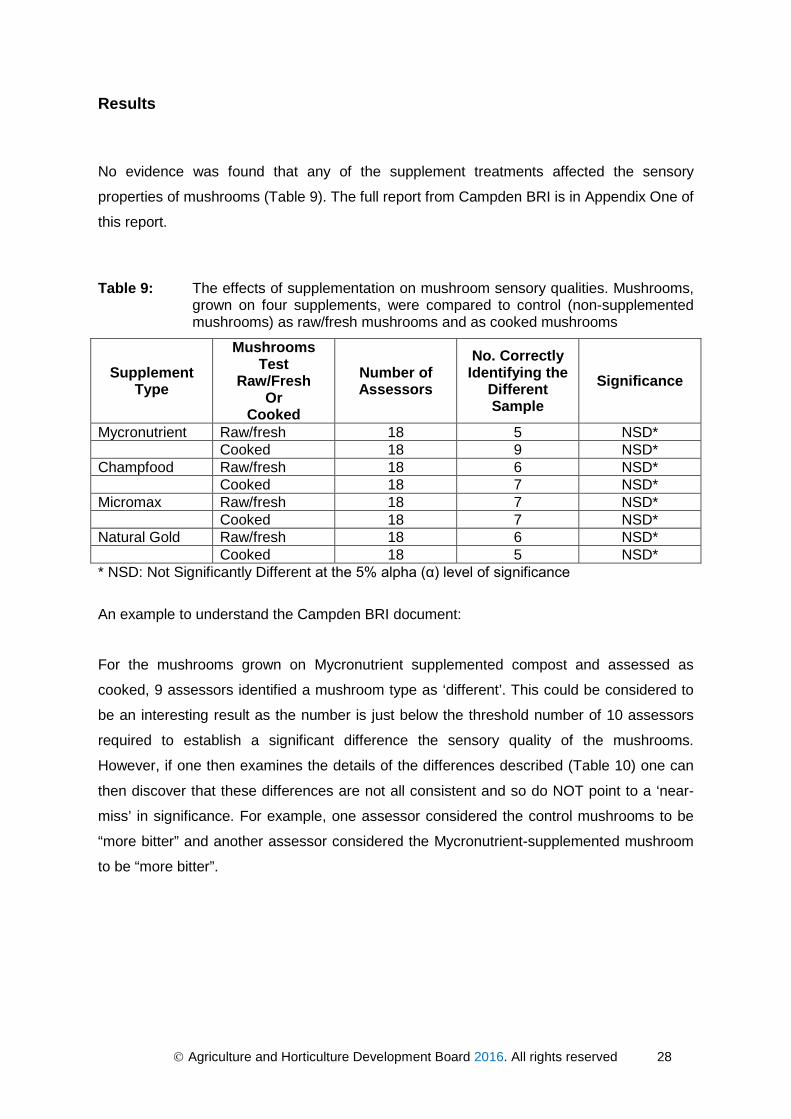
Results
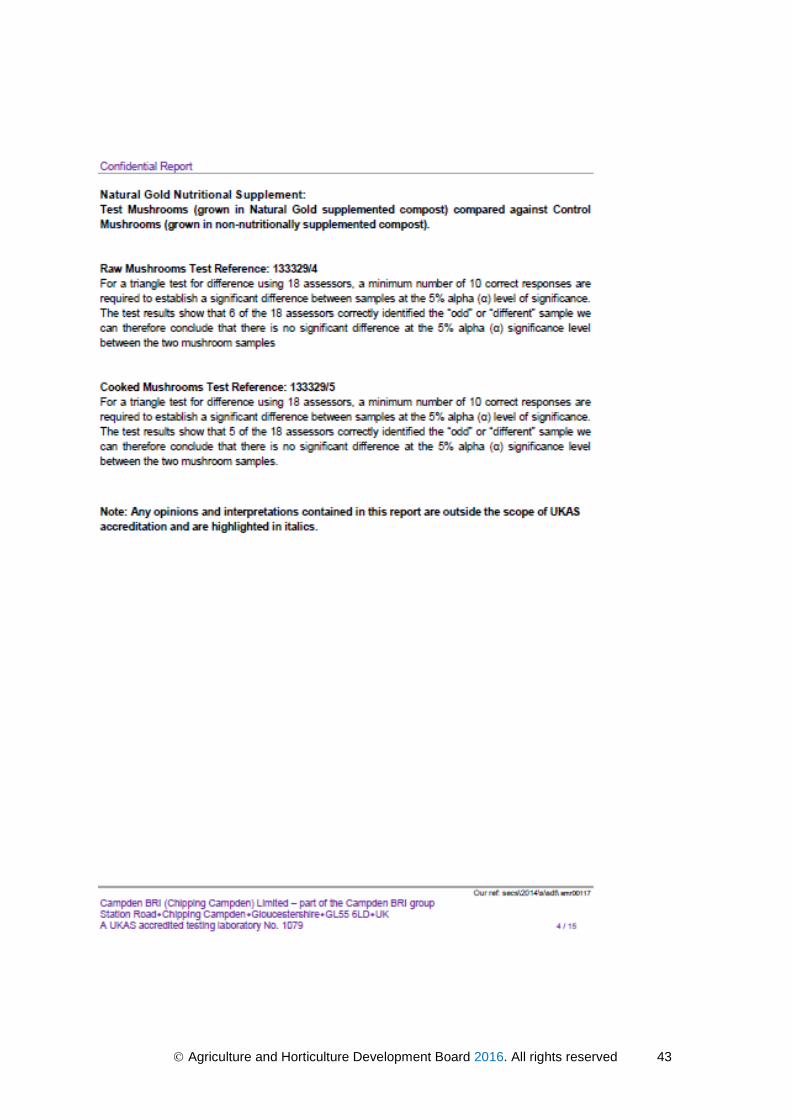
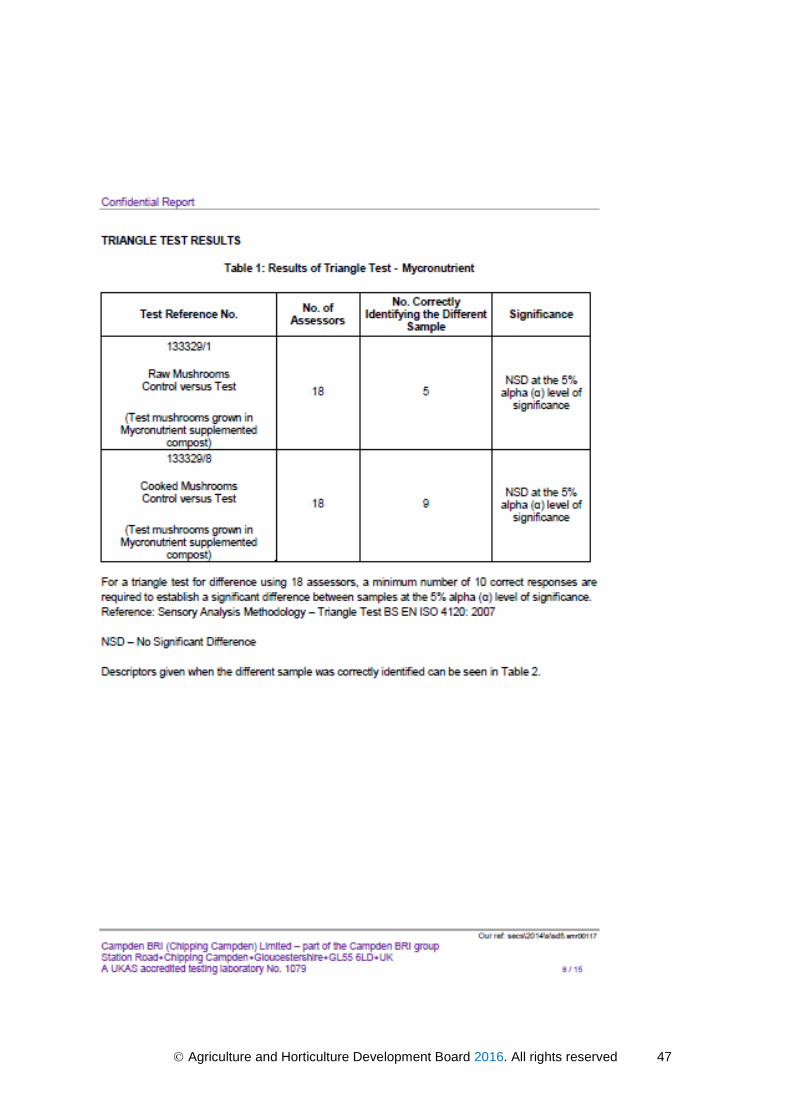
No evidence was found that any of the supplement treatments affected the sensory
properties of mushrooms (Table 9). The full report from Campden BRI is in Appendix One of
this report.
Table 9: The effects of supplementation on mushroom sensory qualities. Mushrooms, grown on four supplements, were compared to control (non-supplemented mushrooms) as raw/fresh mushrooms and as cooked mushrooms
Supplement Type
Mushrooms Test
Raw/Fresh Or
Cooked
Number of Assessors
No. Correctly Identifying the
Different Sample
Significance
Mycronutrient Raw/fresh 18 5 NSD* Cooked 18 9 NSD* Champfood Raw/fresh 18 6 NSD* Cooked 18 7 NSD* Micromax Raw/fresh 18 7 NSD* Cooked 18 7 NSD* Natural Gold Raw/fresh 18 6 NSD*
Cooked 18 5 NSD* * NSD: Not Significantly Different at the 5% alpha (α) level of significance
An example to understand the Campden BRI document:
For the mushrooms grown on Mycronutrient supplemented compost and assessed as
cooked, 9 assessors identified a mushroom type as ‘different’. This could be considered to
be an interesting result as the number is just below the threshold number of 10 assessors
required to establish a significant difference the sensory quality of the mushrooms.
However, if one then examines the details of the differences described (Table 10) one can
then discover that these differences are not all consistent and so do NOT point to a ‘near-
miss’ in significance. For example, one assessor considered the control mushrooms to be
“more bitter” and another assessor considered the Mycronutrient-supplemented mushroom
to be “more bitter”.
Agriculture and Horticulture Development Board 2016. All rights reserved 29
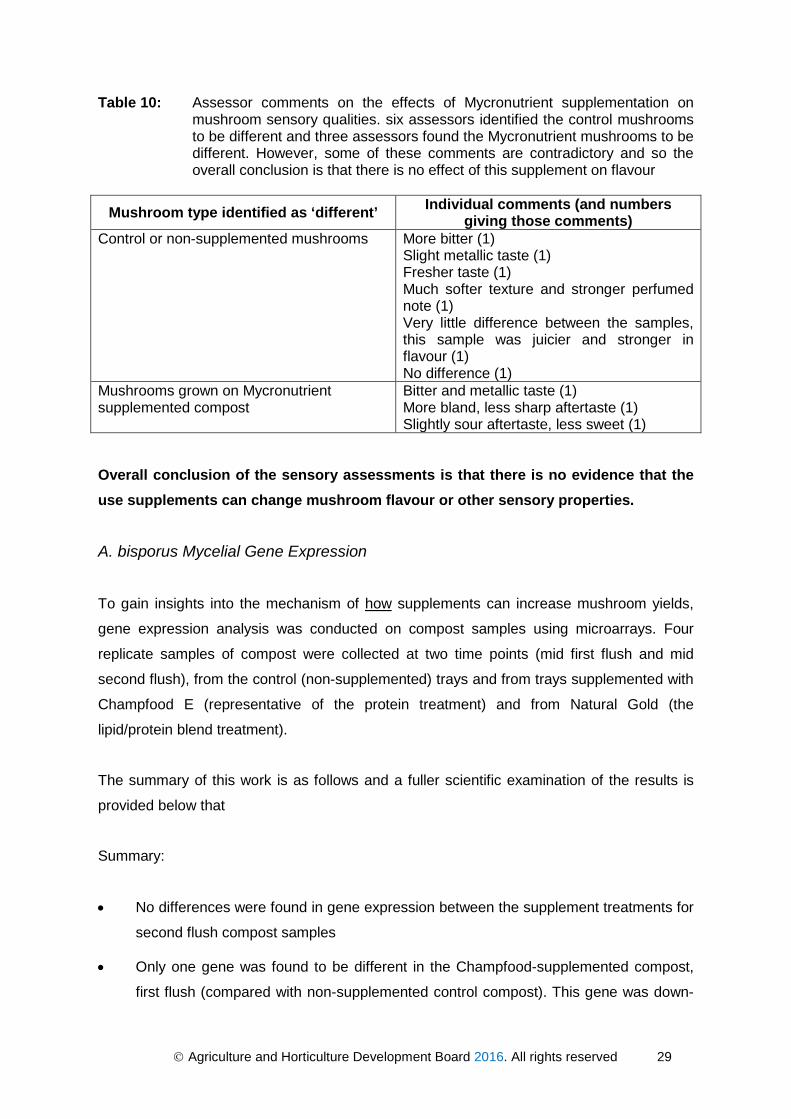
Table 10: Assessor comments on the effects of Mycronutrient supplementation on mushroom sensory qualities. six assessors identified the control mushrooms to be different and three assessors found the Mycronutrient mushrooms to be different. However, some of these comments are contradictory and so the overall conclusion is that there is no effect of this supplement on flavour
Mushroom type identified as ‘different’ Individual comments (and numbers giving those comments)
Control or non-supplemented mushrooms More bitter (1) Slight metallic taste (1) Fresher taste (1) Much softer texture and stronger perfumed note (1) Very little difference between the samples, this sample was juicier and stronger in flavour (1) No difference (1)
Mushrooms grown on Mycronutrient supplemented compost
Bitter and metallic taste (1) More bland, less sharp aftertaste (1) Slightly sour aftertaste, less sweet (1)
Overall conclusion of the sensory assessments is that there is no evidence that the use supplements can change mushroom flavour or other sensory properties.
A. bisporus Mycelial Gene Expression
To gain insights into the mechanism of how supplements can increase mushroom yields,
gene expression analysis was conducted on compost samples using microarrays. Four
replicate samples of compost were collected at two time points (mid first flush and mid
second flush), from the control (non-supplemented) trays and from trays supplemented with
Champfood E (representative of the protein treatment) and from Natural Gold (the
lipid/protein blend treatment).
The summary of this work is as follows and a fuller scientific examination of the results is
provided below that
Summary:
• No differences were found in gene expression between the supplement treatments for
second flush compost samples
• Only one gene was found to be different in the Champfood-supplemented compost,
first flush (compared with non-supplemented control compost). This gene was down-
Agriculture and Horticulture Development Board 2016. All rights reserved 30
regulated (less being made); however the function of the protein encoded by this gene
has not yet been elucidated. This is a surprising result as the protein supplements
caused large and significant increases in yield. A possible explanation is that when A.
bisporus grows in non-supplemented compost it produces sufficient enzymes (to
release the nutrition from the compost) which have capacity to take on and absorb the
extra protein available in the Champfood-supplemented compost
• Supplementing with Natural Gold (the lipid/protein blend) caused six genes to be up-
regulated and 21 genes to be down-regulated compared with non-supplemented
control compost (first flush). This suggests that the Natural Gold elicits a different
response from non-supplemented compost and the protein-only supplemented
compost. The up-regulated genes were involved in nitrogen and carbon metabolism.
Six of the down-regulated genes are involved in lipid metabolism. The conclusion here
is that the Natural Gold is having an additional response on the A. bisporus
metabolism via enzymes produced compared with non-supplemented compost and
supplemented with protein alone.
More Detailed analysis of Gene Expression experiments
Initial analysis identified two microarrays as “outliers” with very different expression patterns
compared with comparable microarrays (Figure 13), these were then excluded from further
analyses.
The statistical analysis indicates that for Flush 2 there were no significant differences in the
gene expression between the supplement treatments. Also large differences were found in
gene expression between first and second flush composts (2,500 genes differentially
regulated in non-supplemented samples between the first and second flushes, (p < 0.01)).
This suggests that the profile of genes (and therefore enzymes) being synthesised in the
compost mycelia are very different between the two flushes and also probably within
flushes.

Agriculture and Horticulture Development Board 2016. All rights reserved 31
Figure 13: Multidimensional scaling plot (Principal Component Analysis) of 1st and 2nd
flush microarray data. Circled samples were excluded from analysis. Individual plots are labelled as supplement type (control; cf = Champfood; ng = Natural Gold) and flush numbers (flush 1 and flush 2)
However, for the first flush statistically significant differences in gene expression were found
between treatments.
First Flush: Champfood vs. Control (non-supplemented)
First flush compost containing Champfood had one gene down-regulated to 29.1%
(significance: p < 0.03) compared to the control. This gene is described by the identifier
Agriculture and Horticulture Development Board 2016. All rights reserved 32
‘KV42663’ but there’s no functional annotation for this gene i.e. we don’t know what it codes
for.
First Flush: Natural Gold vs. Control (non-supplemented)
First flush compost supplemented with Natural Gold had 6 genes up-regulated compared
with the control (Table 11) and 21 genes down-regulated compared with the control (Table
12) (statistical significance: p <= 0.05).
The six up-regulated genes in Natural Gold compost indicate an increased metabolism
particularly nitrogen and sugar utilisation (Table 11).
Glutamate dehydrogenase and glutamine synthetase (Table 11) are enzymes involved in
nitrogen metabolism, possibly ammonia accumulation. The enzyme, hexokinase,
functions in sugar utilisation and carbon source sensing. Coproporphyrinogen oxidase is
an enzyme on the haem synthesis pathway; haem-proteins have a wide range of
functions. Argininosuccinate lyase is a key enzyme on the energy releasing pathway
(Citric acid cycle) at a branch point with the urea cycle (a nitrogen metabolism cycle).
The 21 down-regulated genes in Natural Gold compost are shown in Table 12. Genomic or
transcriptomic analyses such as these are usually examined bioinformatically to draw out
trends or patterns to comprehend the change in biology.
Bioinformatic analysis (Table 13) revealed that 100% of the down-regulated genes code for
proteins with catalytic function involved in metabolic processes which is significantly
different proportion from all genes of the Agaricus bisporus genome (p < 0.01 and p < 0.04
respectively). There is a down-regulation of three genes involved in lipid synthesis (Table
13: genes in rows 7, 8, and 9) (p < 0.04); and 3 genes involved in oxidation pathways of
lipids (Table 13: genes in rows 13, 14, and 17) (p < 0.04).
Clearly, the Natural Gold supplement has stimulated a different response in gene
expression. Analysis of the individual genes reveals that there is increased activity (as in
gene expression) towards nitrogen activity and decreased activity towards lipid metabolism.
This is interesting as Natural Gold is a lipid/protein blend. The supplement appears to
increase capacity of A. bisporus to metabolise the nitrogen (presumably from the added
protein) but changed the profile of lipid metabolism genes which suggests that the A.
bisporus mycelium is responding and utilising the additional lipids from the supplement.

Agriculture and Horticulture Development Board 2016. All rights reserved 33
Table 11: Up-Regulated genes showing significant (p<=0.05) differential expression in Natural Gold treated 1st Flush mushroom samples compared to control samples
Gene ID (EBI) % of
control value
p Description
EKV45647 361 0.05 Glutamate dehydrogenase EKV43005 228 0.04 Predicted glutamine synthetase EKV43879 211 0.04 Hexokinase 1EKV46555 191 0.03 Coproporphyrinogen oxidase 1AW444402/EKV46555 191 0.04 Coproporphyrinogen oxidase EKV50172 189 0.04 Argininosuccinate lyase EKV50704 164 0.04 Unknown 1 Same gene (EKV IDs are from genome project other IDs from other projects) Table 12: Down-Regulated genes showing significant (p<=0.05) differential expression
in Natural Gold treated 1st Flush mushroom samples compared to control samples
Gene ID (EBI) % of
control value
p Description
EKV41797 59 0.05 Unspecific monooxygenase EKV42890 58 0.05 Exoribonucleases producing 5'-
phosphomonoesters EKV49956 54 0.05 Enoyl-CoA hydratase EKV47943 50 0.05 Short-chain acyl-CoA dehydrogenase AW444420/EKV43696 48 0.04 Arylacetamide deacetylase EKV47171 47 0.02 2-methylcitrate dehydratase EKV45111 47 0.05 DNA-directed RNA polymerase EKV50672 45 0.04 3-oxoacyl-[acyl-carrier protein] reductase. AW324531/EKV44017 43 0.05 isocitrate dehydrogenase (NADP+) EKV51564 42 0.02 FAD dependent oxidoreductase/
Microfibrillar-associated protein MFAP1 EKV50887 39 0.05 Enoyl-CoA hydratase EKV49172 36 0.02 Glutathione peroxidase EKV47722 35 0.03 Unknown (DUF1479) EKV51314 32 0.04 Acetyl-CoA C-acyltransferase EKV49647 32 0.04 3-oxoacyl CoA thiolase EKV44080 32 0.05 AAA ATPase containing von
Willebrand factor type A GH158931/EKV48765 32 0.02 4-coumarate CoA ligase EKV47243 25 0.05 Succinate dehydrogenase EKV47643 25 0.03 Protein kinase-like EKV42663 23 0.01 Unknown 2EKV49318 20 0.02 Predicted NAD-dependent oxidoreductase EKV44345 18 0.05 3-oxoacyl-[acyl-carrier protein] reductase EKV45917 17 0.02 IMP dehydrogenase 2AW444428/EKV49318 16 0.04 Predicted NAD-dependent oxidoreductase 2AW444427/EKV49318 16 0.04 Predicted NAD-dependent oxidoreductase EKV50651 10.4 0.05 L-arabinose isomerase 1 Same gene (EKV IDs are from genome project other IDs from other projects) 2 Same gene

Agriculture and Horticulture Development Board 2016. All rights reserved 34
Table 13: GO (Gene Ontology) functional analysis of GO annotated genes with
significant down regulated expression in Natural Gold treated 1st Flush samples compared to control samples, i.e. down regulated genes in table 12. P is Benjamini-Hochburg corrected for false discovery rate. Cluster freq. is the number of genes containing the GO-ID for down regulated genes in table 12. Total freq. is the number of Agaricus bisporus genes containing the GO-ID in the total of GO annotated A bisporus genes
GO Description GO-ID p cluster freq. total freq. in A. bisporus genome
1 catalytic activity 3824 0.01 21/21 100.0% 3152/5039 62.5% 2 oxidoreductase activity 16491 0.03 10/21 47.6% 757/5039 15.0% 3 oxidation-reduction process 55114 0.03 10/21 47.6% 766/5039 15.2% 4 metabolic process 8152 0.04 21/21 100.0% 3572/5039 70.8% 5 oxidoreductase activity,
acting on the CH-OH group of donors, NAD or NADP as acceptor
16616 0.04 4/21 19.0% 118/5039 2.3%
6 oxidoreductase activity, acting on the CH-CH group of donors
16627 0.04 3/21 14.2% 61/5039 1.2%
7 3-oxoacyl-[acyl-carrier-protein] reductase (NADPH) activity
4316 0.04 2/21 9.5% 18/5039 0.3%
8 fatty acid synthase activity 4312 0.04 2/21 9.5% 19/5039 0.3% 9 short-branched-chain-acyl-
CoA dehydrogenase activity 16937 0.04 1/21 4.7% 1/5039 0.0%
10 propionate metabolic process
19541 0.04 1/21 4.7% 1/5039 0.0%
11 propionate catabolic process 19543 0.04 1/21 4.7% 1/5039 0.0% 12 propionate catabolic
process, 2-methylcitrate cycle
19629 0.04 1/21 4.7% 1/5039 0.0%
13 very-long-chain-acyl-CoA dehydrogenase activity
17099 0.04 1/21 4.7% 1/5039 0.0%
14 propionyl-CoA dehydrogenase activity
43820 0.04 1/21 4.7% 1/5039 0.0%
15 thiol-driven fumarate reductase activity
43830 0.04 1/21 4.7% 1/5039 0.0%
16 isocitrate dehydrogenase (NADP+) activity
4450 0.04 1/21 4.7% 1/5039 0.0%
17 long-chain-acyl-CoA dehydrogenase activity
4466 0.04 1/21 4.7% 1/5039 0.0%
18 2-methylcitrate dehydratase activity
47547 0.04 1/21 4.7% 1/5039 0.0%
19 glutathione peroxidase activity
4602 0.04 1/21 4.7% 1/5039 0.0%
20 oxidoreductase activity, acting on CH-OH group of donors
16614 0.04 4/21 19.0% 164/5039 3.2%

Agriculture and Horticulture Development Board 2016. All rights reserved 35
Discussion
This project aimed:
• To evaluate supplement usage
• To ascertain what benefits supplements may offer to phase 3 composts (in terms of
mushroom yield and quality), and
• To add further understanding as to why/how supplements work
Compost supplements are in widespread usage throughout Europe and new products are
entering the market. There has been no or little objective testing of these products
previously.
The results of the trials show that the protein-based supplements in composts (at 1.5%) are
beneficial for the mushroom industry while carboxylic acid based and mineral micronutrient
based supplements in compost have no effect. Protein-based supplements in composts
improve yields by an average of 11.5%, improve mushroom density by 5.5% (with knock-on
effects on improved picking rates) and little or no effects on other quality characteristics
such as flavour, colour and dry matter content. The value of the additional mushrooms
produced by protein supplement use far exceeds the costs of the supplement. It is possible
that further improvements to yield can be achieved by small increases in protein
supplement rates above 1.5%, if compost temperatures can be controlled.
The final aim was to understand how supplements give benefits. As only two supplement
types (protein and lipid/protein blend) were found to improve yields, the effects of these
were examined by mycelial gene expression. The presence of lipids did change the
physiology of the mycelium compared with non-supplemented and protein alone
supplemented composts. This suggests that the lipids are stimulating yield by a different
mechanism to the protein. Therefore, there are grounds to believe that further
improvements in yield can be possible by more development work on the lipid/protein
blends (e.g. formulation and composition).
Agriculture and Horticulture Development Board 2016. All rights reserved 36
Conclusions
Protein-based supplements have been shown to increase yield by an average of 11.5% on
phase 3 composts. This finding was found for straw-based and horse manure-based
composts. Any differences in yields between compost types (looking at Trials 2 and 3
separately) is interpreted as batch-to-batch variation and was possibly related to the
moisture contents of the composts.
The two other supplement types tested, MycroNutrient (a carboxylic acid-based product)
and Micromax (a mix of mineral micronutrients) had no effect on mushroom yields.
MycroNutrient is marketed as a casing supplement, and it was tested here to investigate all
possible supplement options. The negative result as a compost supplement does not
contradict its claims as a casing supplement.
Micromax was tested because there are suggestions in the scientific and mushroom
technology literature that mushroom compost may be deficient in minerals (particularly
manganese) which can affect yielding (Royse and Beelman, 2008; Desrummaux, Calus and
Sedeyn 2000). For some composts mineral nutrient deficiency may be a real problem but
for composts used in these experiments, the input materials (straw, animal manures,
gypsum, peat and lime) appear to have sufficient quantities of mineral micronutrients.
Supplement effects on mushrooms can be summarised as; no effects on flavour or dry
matter content, protein supplements improve density/texture but cause a slight increase in
mushroom yellow colour without affecting overall ‘whiteness’ (L value).
The increase in yield by protein-supplements is accompanied by an increase in
density/texture. So there are three benefits of protein supplement usage: higher yields,
improved texture and greater picking rates.
However, some evidence was found that two of the protein supplements (ProMycel Gold
and McSubstradd) do result in slightly more ‘yellow’ mushrooms. It is not known whether
these differences are noticeable to the consumer, since no differences were found between
supplement use in the overall ‘whiteness’ of the mushrooms. The supplements Champfood
E and the lipid/protein blend supplement (Natural Gold) did not cause mushroom yellowing
but also did not affect overall whiteness.

Agriculture and Horticulture Development Board 2016. All rights reserved 37
The financial benefits of protein-supplement use are a 6.4 times multiplier: i.e. for every
pound spent on protein supplement, £6.4 of extra mushrooms are produced. The limit of
protein supplementation is set by the danger of high compost temperatures. Here, we have
conducted experiments on a 50kg/tonne fill rate. Greater increases in yield are possible
theoretically by increasing the supplement addition rate above 1.5%.
There may appear to be a contradiction between the findings that protein-supplements
increase mushroom density/texture but do not change the dry matter contents. This is not
so, as density relates to the density of cells in a mushroom, while dry matter content relates
to how much of the composition of a cell is water or non-water. The fact that supplements
have no effect on mushroom dry matter content would partially explain the fact that no
flavour differences were found.
The gene expression analysis strongly suggests that the A. bisporus mycelium responds in
a different way to the lipid/protein supplemented compost compared with non-supplemented
compost or compost supplemented with protein alone. The presence of lipid as a nutrient
appears to be detected by the mycelium stimulating a different metabolism. Lipids and their
products have previously been shown to affect mycelial growth and mushroom production
(Parker, 1993, Schisler and Patton, 1970). The 18-carbon lipid oil, linoleic acid, breaks
down naturally to a 10-carbon compound, ODA (Oxa decanoic acid) and an 8-carbon
compound, 1-octen-3-ol. Both of these compounds have been reported to have hormonal
effects, ODA of cell growth and 1-octen-3-ol on mushroom pinning. Recent research
suggests that 1-octen-3-ol is the key controlling factor for pinning with a greater controlling
effect than CO2 or temperature (Noble et al, 2009; Eastwood et al., 2013).
However, despite the evidence that the supplementation with lipid/protein blends can
stimulate a different metabolism in A. bisporus mycelium, the yield increase of the
lipid/protein blend was the same as the protein alone. So at the moment there is no clear
advantage in the use of lipid/protein blends, although the increased yellowing caused by
protein-based supplements was avoided. This new information on the stimulation of a
different metabolism may encourage further development onto the use of lipids as a partial
supplement. The data from this project suggest that both protein and lipid/protein blend are
acting as a direct nutrient source rather than a hormone as the dry weight of the increased
yield is less than the weight of supplement: 15kg/tonne of supplement (or 13kg/tonne dry
weight) yields an extra 42kg mushrooms which at 8% dry matter represents 3.36 kg extra
dry weight.

Agriculture and Horticulture Development Board 2016. All rights reserved 38
It was a surprise to find only one gene differentially expressed in the compost mycelium
between non-supplemented and protein supplemented composts. This could be due to the
mycelium in non-supplemented compost having sufficient enzymic capacity to degrade and
absorb the additional protein. In future it may be necessary to sample the compost more
frequently to fully understand the physiology of mycelial breakdown of nutrient whether this
is for chemical analysis, enzymic or gene expression studies. It was surprising that so many
genes were differentially expressed between flushes 1 and 2. This may be an accurate
result or somewhat influenced by time of sampling.
While no overall yield differences were found between the use of horse manure-based and
straw-based composts, there were significant and consistent differences in quality
attributes. Mushrooms grown on horse manure-based composts had a higher density while
those grown on straw-based composts were whiter. The reasons for these differences are
not known but they are likely to be chemically-based, and offer future opportunities for
quality improvements.
The first trial showed that yield improvements of the brown strain, Heirloom, can be
achieved using protein supplements.
In conclusion, the use of protein containing supplements (at 1.5%) in phase 3 compost was
advantageous in raising the yields of mushrooms by an average of 11.5%. The increase in
density by the use of protein-based supplements improve texture (but this was not detected
by the Sensory Panel) and raise picking rates. The remaining quality attributes (mushroom
colour, flavour and dry matter content) are changed to a small extent or not at all. Gene
expression analysis revealed that the presence of supplemented lipids changed the
metabolism of the mycelium but this was not reflected in any further increase in yield. This
data provides sufficient evidence that further yield increases may be possible by small
adjustments to the supplementation rates and development of lipid/protein supplements.
Knowledge and Technology Transfer
Progress on this project (M 56) has been presented to the HDC Mushroom Panel at
meetings on 2 July 2013, 14 January 2014 and 2 July 2014, 9 October 2014 and 17
February 2015. A 20-minute presentation was made to mushroom growers at the
Mushroom Technical Day, 18 March 2015 in Stratford-upon-Avon.

Agriculture and Horticulture Development Board 2016. All rights reserved 39
References
Benjamini Y. and Hochberg Y. (1995). Controlling the False Discovery Rate: A Practical and Powerful Approach to Multiple Testing. Journal of the Royal Statistical Society Series B (Methodological). 57: 289-300.
Burton, Frost and Atkey (1987). Effect of vacuum cooling on mushroom browning. International Journal of Food Science and Technology, 22, 599-606.
Desrummaux B., Calus A. and Sedeyn P. (2000). Minerals and microelements in the mushroom substrate: a production-limiting factor? Mushroom Science 15, 327-334.
Eastwood D.C., Herman B., Noble R., Dobrovin-Pennington A., Sreenivasaprasad S., and Burton K.S. (2013). Environmental regulation of reproductive phase change in Agaricus bisporus by 1-octen-3-ol, temperature and CO2. Fungal Genetics and Biology, 55, 54-66.
Maere S. et al. (2005). BiNGO: a Cytoscape plugin to assess overrepresentation of gene ontology categories in biological networks. Bioinformatics. 21: 3448-3449.
McClintick J.N. and Edenberg H.J. (2006). Effects of filtering by present call on analysis of microarray experiments. Bmc Bioinformatics. 7.
McGarry A. & Burton K.S. (1994). Mechanical properties of the mushroom, Agaricus bisporus. Mycological Research, 98, 241-245.
Noble R., Dobrovin-Pennington, A., Hobbs, P., Rodger, A. and Pederby J., (2009). Volatile C8 compounds and pseudomonads influence primordium formation of Agaricus bisporus. Mycologia 101, 591–593.
Ritchie M.E. et al. (2015). limma powers differential expression analyses for RNA-sequencing and microarray studies. Nucleic Acids Res. (2015) doi: 10.1093/nar/gkv007
Royse D.J. and Beelman R.B. (2008). Six steps to mushroom farming. Penn State College of Agriculture Sudies, 2nd Edition.
Parker F.H. (1993) Method and composition for promoting mushroom growth. US Patent 5186731.
Schisler L.C. and Patton T.G. (1970). Stimualtion of yield in the cultivated mushroom by vegetable oils. Effects of sterols and ethyl linolate. J. Agric. Food Chem., 18, 1102-1103.
Smyth G.K. (2004). Linear models and empirical Bayes methods for assessing differential expression in microarray experiments. Statistical Applications in Genetics and Molecular Biology. 3.
Appendix
Agriculture and Horticulture Development Board 2016. All rights reserved 40
Agriculture and Horticulture Development Board 2016. All rights reserved 41

Agriculture and Horticulture Development Board 2016. All rights reserved 42
Agriculture and Horticulture Development Board 2016. All rights reserved 43
Agriculture and Horticulture Development Board 2016. All rights reserved 44
Agriculture and Horticulture Development Board 2016. All rights reserved 45
Agriculture and Horticulture Development Board 2016. All rights reserved 46
Agriculture and Horticulture Development Board 2016. All rights reserved 47

Agriculture and Horticulture Development Board 2016. All rights reserved 48

Agriculture and Horticulture Development Board 2016. All rights reserved 49
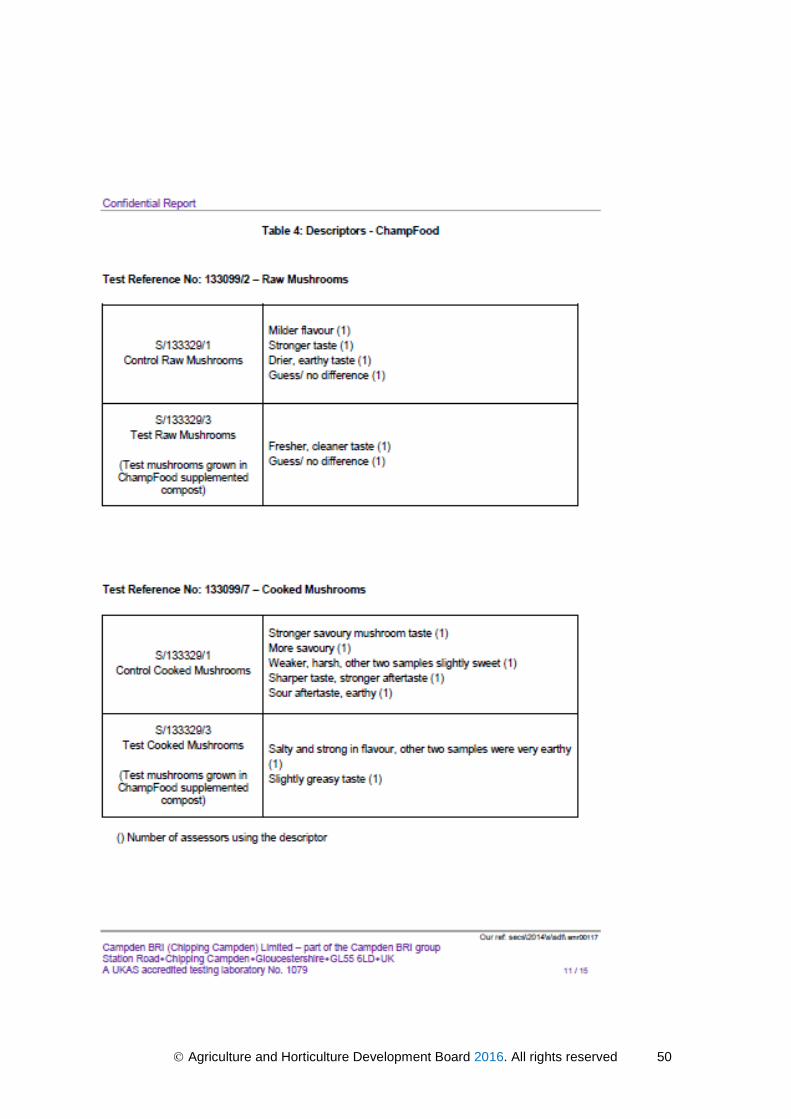
Agriculture and Horticulture Development Board 2016. All rights reserved 50

Agriculture and Horticulture Development Board 2016. All rights reserved 51
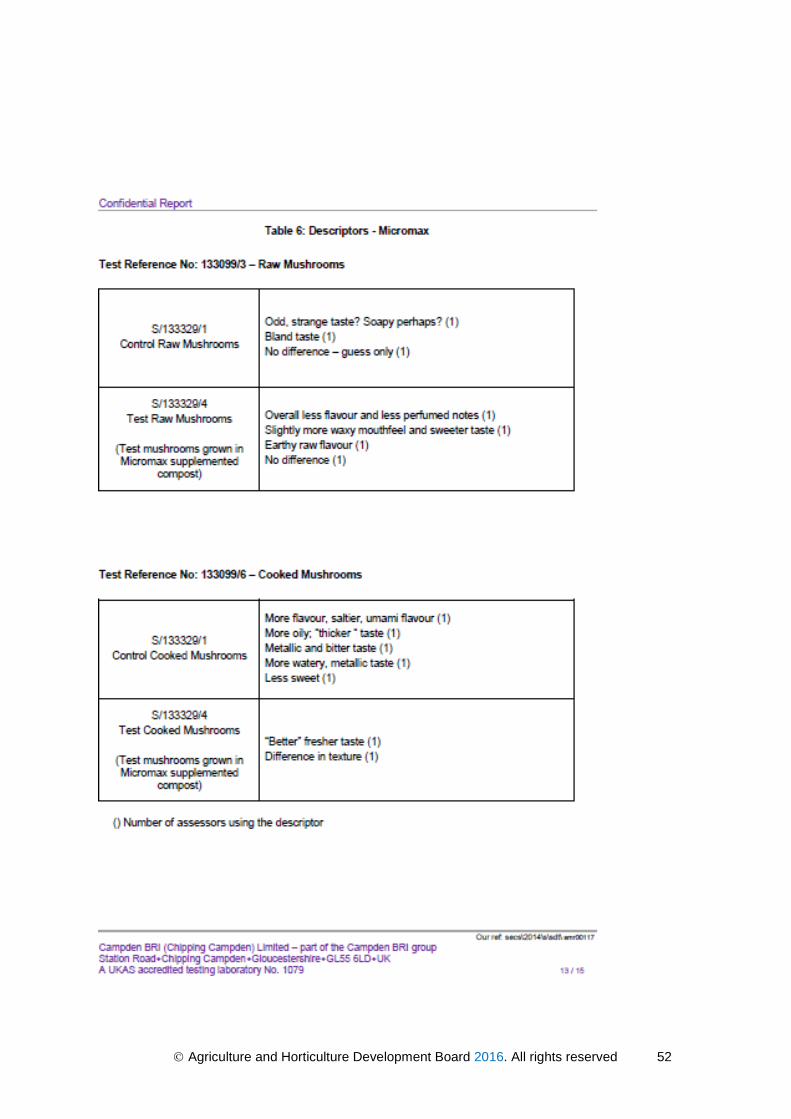
Agriculture and Horticulture Development Board 2016. All rights reserved 52
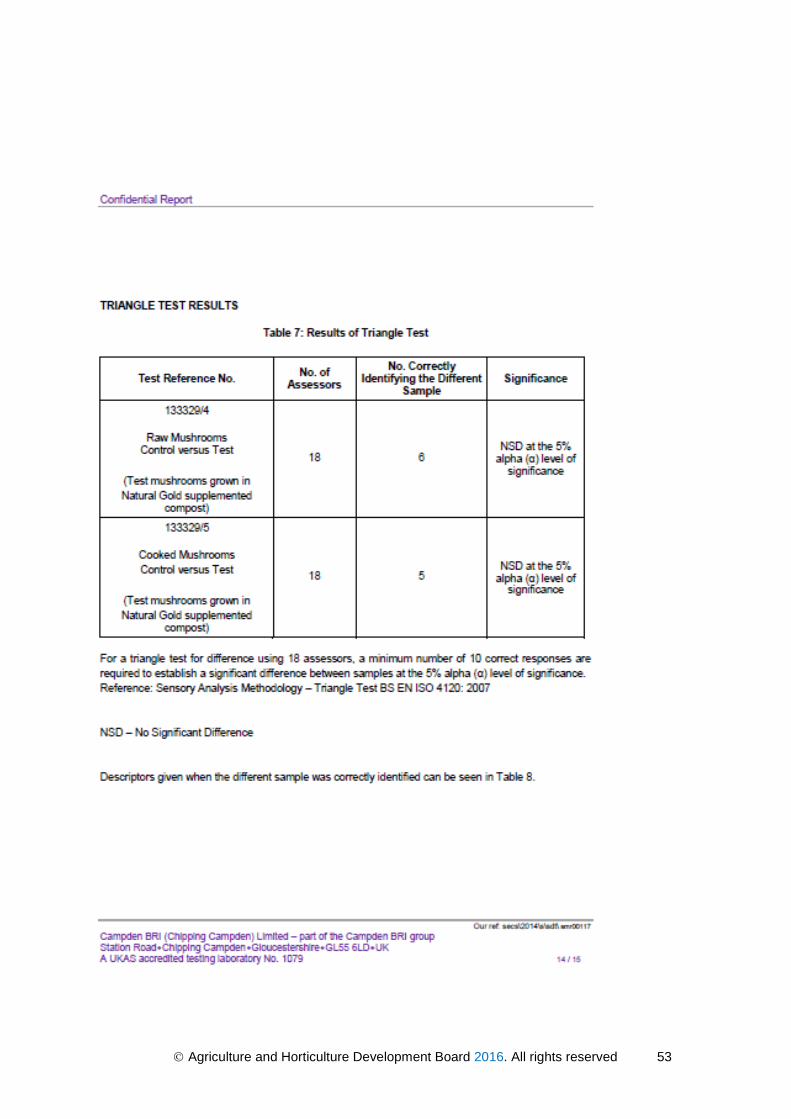
Agriculture and Horticulture Development Board 2016. All rights reserved 53

Agriculture and Horticulture Development Board 2016. All rights reserved 54