project wellness & health center nin
TRANSCRIPT

PROJECT WELLNESS & HEALTH CENTER NIN INFORMATION MEMORANDUM

Strictly confidential
PROJECT HIGHLIGHTS
Executive summary
• Tankerska plovidba d.d. is the largest and most successful shipping company in Croatia. With the
aim to diversify its activities and exploit unique local resources, most notably the famous medicinal
• Wellness and Health Center Nin located in the county of Zadar will represent a unique combination
of traditional natural healing treasure of sea peloid and pleasant Mediterranean climate with a
relaxing stay, hospitable staff, renowned experts and a wealth of accompanying offerings of
animation and entertainment.
• Lavish sandy beaches, thermal and wellness services, swimming pools, saunas and numerous
opportunities for socializing and entertainment allow for guests’ year-round body & soul relaxation.
• The site is approx. 30 minutes away from the Zadar Airport.
• The Center is intended for both guests on curative therapies as well as for leisure guests wishing
preventative health programs or wellness services. It also targets at business meetings and events,
congress services use.
•
• The primary aim is to sell the 100% stake in the project company while the estimated required
investment is approx. mEUR 49.
•
Located in Nin, Zadar County, Croatia
100% owned by Tankerska plovidba d.d.
Therapeutic mud, health and wellness treatments,combined with recreational and sports programs andcongress services.
Healthy peloid used to treat various ailments such asrheumatic and skin diseases, muscular and skeletalsystem problems, spinal deformities.
Site occupies 14 hectares leased to the projectcompany for a period of 70 years.
Based on feasibility studies, the total Project value isestimated at about mEUR 49.
General design completed; location permit from Zadar countycompetent authority applied for; environmental study approved;construction and the relevant resolution on acceptability issued.
Source: Company
sea mud (peloid) of Nin, Tankerska plovidba has set up a project company “Rekreacijsko Turisticki
Centar Nin d.o.o.” for the purpose of establishing the leading Adriatic Health & Spa Resort in
the region (the “Project”, the “Center”). The Company has been incorporated on 17.04.2003 and is
headquartered in Trg Hrvatskih branitelja 1, 23232 Nin, Croatia.
Furthermore, Tankerska plovidba is willing to consider alternative scenarios such as retaining
a minority stake during the development phase of the project in order to support the investor.
Strictly confidential
MAIN CHARACTERISTICS
Project Overview
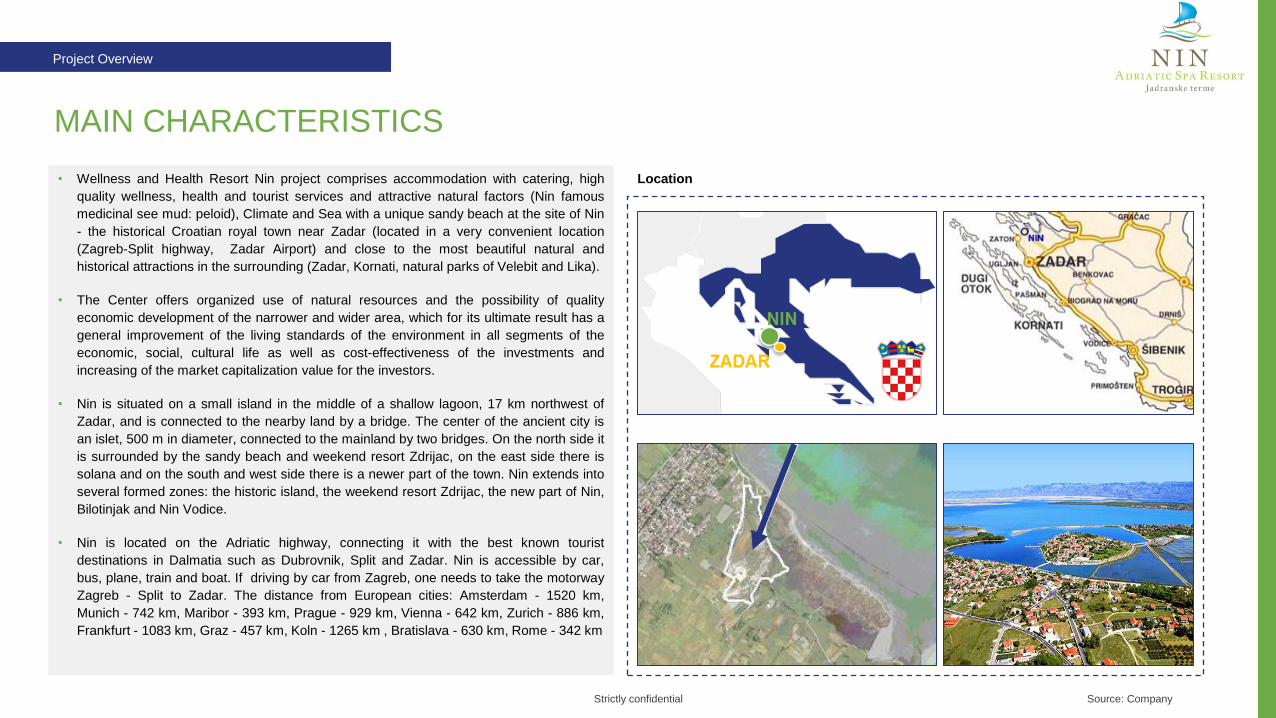
• Wellness and Health Resort Nin project comprises accommodation with catering, high
quality wellness, health and tourist services and attractive natural factors (Nin famous
medicinal see mud: peloid), Climate and Sea with a unique sandy beach at the site of Nin
- the historical Croatian royal town near Zadar (located in a very convenient location
(Zagreb-Split highway, Zadar Airport) and close to the most beautiful natural and
historical attractions in the surrounding (Zadar, Kornati, natural parks of Velebit and Lika).
• The Center offers organized use of natural resources and the possibility of quality
economic development of the narrower and wider area, which for its ultimate result has a
general improvement of the living standards of the environment in all segments of the
economic, social, cultural life as well as cost-effectiveness of the investments and
increasing of the market capitalization value for the investors.
• Nin is situated on a small island in the middle of a shallow lagoon, 17 km northwest of
Zadar, and is connected to the nearby land by a bridge. The center of the ancient city is
an islet, 500 m in diameter, connected to the mainland by two bridges. On the north side it
is surrounded by the sandy beach and weekend resort Zdrijac, on the east side there is
solana and on the south and west side there is a newer part of the town. Nin extends into
several formed zones: the historic island, the weekend resort Zdrijac, the new part of Nin,
Bilotinjak and Nin Vodice.
• Nin is located on the Adriatic highway, connecting it with the best known tourist
destinations in Dalmatia such as Dubrovnik, Split and Zadar. Nin is accessible by car,
bus, plane, train and boat. If driving by car from Zagreb, one needs to take the motorway
Zagreb - Split to Zadar. The distance from European cities: Amsterdam - 1520 km,
Munich - 742 km, Maribor - 393 km, Prague - 929 km, Vienna - 642 km, Zurich - 886 km,
Frankfurt - 1083 km, Graz - 457 km, Koln - 1265 km , Bratislava - 630 km, Rome - 342 km
Location
Source: Company

Strictly confidential
UNIQUE CONCEPT
Project Overview
• The conceptual design of the construction of the Wellness and Health resort Nin is based
on the intertwining of the fitting into the surrounding nature, with the aim that all rooms and
all major programs have a see side or Velebit view and functionally optimum of the
contents providing a high atmosphere (4*+) for the guests and optimization of the
operations throughout the year.
• Description of the concept of the Wellness and Health Center Nin: Wellnes & Health
Center Nin represents a unique combination of traditional natural healing factors such as
sea peloid and pleasant Mediterranean climate with unforgettable and relaxing stay,
hospitable people, recognized experts and a variety of accompanying animation offerings
and fun. Sandy beaches, thermal and wellness services, swimming pools, saunas and
numerous opportunities for socializing and entertainment allow guests to relax the body
and soul - bringing them unforgettable experiences where they can relax from stressful
life and recharge with the new energy, both in summer and winter. Wellness and Health
Center Nin is intended for guests on curative therapies as well as for guests who want to
have a good experience as well as for preventative programs or wellness services. It is
also an ideal destination for organizing business meetings and events since congressional
tourism complement a rich accompanying offers. With quality and extraordinary variety of
services Wellness and Health Center Nin wants to position itself as a hospitable and
comfortable center integrated into the natural environment and complemented by modern
quality catering services and relaxation programs with perfect opportunities for recreation,
business meetings and social gatherings throughout the year.
• Comparative advantages: Wellness and Health Center Nin is the destination on the
Adriatic coast with a complete offer combining the diverse healing effects of natural
factors with a sophisticated offer of relaxation and health services.
• USP (Unique Sales Proposition): A well-known medicinal mud peloid combined with a
sophisticated offer of relaxation and health services.
Structure of the hotel (front side view)
Source: Company

Strictly confidential
ACCOMMODATION & OTHER FACILITIES
Project Overview
The hotel area consists of two separate hotels:
• Wellness hotel - with the complete offer of mind and body therapies and services such
as massages and water therapies, saunas, beauty salons etc., adapted for guests who
love the sea and wellness.
• Health hotel - for preventative, rehabilitation and curative health services based on the
healing effect of the Nin Mud, the Sea and the Climate.
Source: Company
• Restaurants and catering: - a) Health center: 120 indoor seats and 60 outdoor seats on
the restaurant terrace overlooking the sea, b) Wellness restaurant: 390 indoor and 80
outdoor seats on the catering terrace with sea view; c) Hotel a-la-carte restaurant with 60
indoor and 80 outdoor seats on the catering terrace overlooking the sea; d) Piazza a-la-
carte restaurant with 130 indoor and 60 outdoor seats on the catering terrace overlooking
the sea; e) bars, coffee shop.
• Health programs: the most state of the art spectrum of preventative and curative services,
including: diagnostics, therapies (climatology, thalassotherapy, fangotherapy, etc.). Nin
sea medicinal mud (peloid) helps with the following syndromes: rheumatology, spinal
diseases, dermatology, gynaecology, traumatology, neurological diseases, and other.
• Wellness programs: fitness in aerobics, massages, relaxation and mud therapies, rich
sauna world, swimming pools.
• Conference and banqueting center: Within the congress center there is an entrance hall
with the reception, wardrobe and sanitary facilities, a large hall (250 seats) divided into
two parts, 3 smaller halls, two of which have the possibility of connecting into one medium
hall and four smaller rooms for meetings of which two can be merged into one medium
size meeting room.
• Sport and recreation is a part of wellness program. The slogan reads: "A healthy spirit in a
healthy body." The main division of sports and recreational activities is on the inside and
outside. Outside include theme parks, while the inside include aerobics and other fitness
programs. For children: places on different locations indoor and outdoor, children's
playrooms with entertainment and animation. Within the interior areas two rooms are
planned with an area of 80 m2 each for children's playrooms; one for the smaller and one
for a older children. Other areas: urban squares, green areas, pet area and sandy beach
with rich program.
WELLNESS HOTELRooms
total
Share of
rooms
Beds per
room
Beds
total
Share of
beds
Double bed room (double double) 79 40% 2 158 40%
Single bed room (queen size bed) 39 20% 1 39 5%
Double bed room (king size bed) 56 28% 2 112 16%
Junior suite 18 9% 2 36 6%
Senior suite 6 3% 4 24 4%
Total 198 100% 369 100%
HEALTH HOTELRooms
total
Share of
rooms
Beds per
room
Beds
total
Share of
beds
Single bed room (queen size bed) 26 32% 1 26 19%
Double bed room (double double) 56 68% 2 112 81%
Total 82 100% 138 100%
APARTMENTS COMPLEXRooms
total
Share of
rooms
Beds per
room
Beds
total
Share of
beds
Apartment units (three beds) 10 25% 3 30 19%
Apartment units (four beds) 26 65% 4 104 68%
Apartment units (f ive beds) 4 10% 5 20 13%
Total 40 100% 154 100%
I Hotel and catering 21.650,00 m2
II Health center 2.205,00 m2
III Wellness center 6.002,00 m2
IV Garage 5.830,00 m2
V Apartments 2.720,00 m2
38.407,00 m2
VI Outer surface 79.700,00 m2
Total surface 118.107,00 m2
Recap. of the area AREA (net)
Total inside surface

Strictly confidential
NATIONAL ATTRACTIONS NEAR THE TOWN OF NIN
Project Overview
Source: Company, Visit-Croata
Krka River National Park - 90km
Kornati National Park - 25km
Plitvice Lakes National Park - 138km

Strictly confidential
MANAGEMENT & HUMAN RESOURCES
Investment Profile
• The investment project with the working name "Wellness and Health Center Nin" will after
its realization and start-up faze operate through a registered company RTC Nin d.o.o.,
which will be up to 100% owned by a private investor.
• Since the Wellness & Health Center Nin, apart from the accommodation facilities, will
have a whole range of hospitality, wellness, health, animation, sports, conference and
other facilities, its organizational structure will be complex and comparable to the structure
of a large full-service hotel.
• Main premise of the human resources planning is that the services are primarily carried
out with its own staff (all except laundry), all year long operation, and the company's
activities are carried out by its own management or the management company.
• In the company RTC Nin d.o.o. will be a total of 213 people working in permanent
employment with different qualifications. During summer time, for a period of 5 months,
another 55 part time employees would be needed, and as a support for the same period,
additional 39 student-employees. Thus, the total number of employees is set at 307.
• Taking the number of the permanent employees and comparing the coefficient "employee
/ accommodation unit (room)", the Wellness & Health Center Nin has a coefficient of 0.66.
Since the international average of the four-star hotel coefficient is 0.60 to 0.70 (depending
on the complexity and the variety of programs in the hotel) it follows that this coefficient for
Wellness & Health Center Nin is within the norm of the hotel with a full-year operating
time, of complex programming structure and four-star category.
• The total labour costs expressed in the sum of total annual gross wages is EUR
4,061,400. The average monthly gross salary for the permanent employees is EUR 1,428,
which is compared to the average wage in the Republic of Croatia (approx. EUR 1,075 in
2017) 32% above the average.
Number of employees by
department
Average annual gross salaries
Source: Company
*Permanent (+ seasonal) = total
Department Function Total subordinate employees*
Finance & controling Manager 6 FTEs
Reception Head 17 FTEs (+ 2 seasonal) = 19
Food & beverages Head 65 FTEs (+40 seasonal) = 105
Sales & marketing Manager 8 FTEs (+ 5 seasonal) = 13
HR Manager 1 FTE
Wellness & spa Head 29 FTEs (+14 seasonal) = 43
Helth Head 25 FTEs (+ 4 seasonal) = 29
Houskeeping Head 34 FTEs (+12 seasonal) = 46
Maintenance & security Head 16 FTEs (+17 seasonal) = 33
Total 201 FTEs (+94 seasonal)= 307
Educational level FT PT Student
Dr. Spec. 3 - -
VSS - Management 10 - -
VSS 24 7 -
VŠS 36 9 -
SSS 65 19 -
VKV 34 6 -
KV 6 4 -
NKV 35 10 -
Total 213 55 39 307
Number of employees by
educational degree
Average annual gross salary (EUR)
FT 17.132
PT 5.013
Students (5 months) 3.500

Strictly confidential
INVESTMENT PROJECT VALUE
Investment Profile
Preliminary assessment of the investment project value
Source: Company
Investment value Area (net) Value (EUR) GOI works (EUR) Equipment (EUR)
Hotels and catering 21.650,00 m2 23.527.350 18.351.333 5.176.017
Health center 2.205,00 m2 2.548.925 2.090.119 458.807
Wellness center w ith sw imming pools 6.002,00 m2 6.929.155 6.097.656 831.499
Garage 5.830,00 m2 2.474.550 2.474.550 -
Apartments 2.720,00 m2 2.620.200 2.169.526 450.674
Special attraction elements of the interior - 1.100.000 330.000 770
Total inside area 38.407,00 m2 39.200.180 31.513.184 7.686.997
Ootside area 79.700,00 m2 1.894.500 - -
Property & Equipment 118.107,00 m2 41.094.680 - -
Design and project control 3,75% 1.540.000 - -
Marketing, consulting, etc. 3,89% 1.600.000 - -
Utility infrastructure - 1.500.000 - -
Water (contribution) - 732.127 - -
Starting costs (marketing activities, training of staff) - 710.000 - -
Extraordinary costs - 500.000 - -
Working capital - 900.000 - -
Total investment cost 48.576.807

Strictly confidential
II III IV I II III IV I II III IV I II
Designing 323 370 385 370 92 - - - - - - - - 1.54 3,2%
Marketing, consulting, etc. 64 64 64 64 112 176 176 176 176 176 176 176 - 1.6 3,3%
Construction and equipment - - - - - 4.931 5.342 5.753 6.575 6.575 6.986 4.931 - 41.093 84,6%
Utility infrastructure - - - - - - - 705 795 - - - - 1.5 3,1%
Water (contribution) - - - - - - - 439 293 - - - - 732 1,5%
Starting costs (marketing activities, staff training) - - - - - - - - - - - 369 341 710 1,5%
Extraordinary costs - - - - - - - - - - - 165 335 500 1,0%
Working capital - - - - - - - - - - - - 900 900 1,9%
Total quarterly 387 434 449 434 204 5.107 5.518 7.074 7.839 6.751 7.162 5.642 1.576 48.577 100,0%
*The amount of investment costs per year 1.27 11.263 28.826 7.218 48.577
Share
in %ValuePhases
2018 2019 2020 2021
INVESTMENT PROJECT DYNAMICS (1/3)
Investment Profile
Preliminary assessment of the investment dynamics
Source: Company

Strictly confidential
INVESTMENT PROJECT DYNAMICS (2/3)
Investment Profile
Financial plan of the investment implementation
Source: Company
323 370 385 370 92
64 64 64 64 112
176 176 176 176 176 176 176
4.931 5.342
5.753
6.575 6.575 6.986
4.931
705
795
439
293
369
341
165
335
900
0
1.000
2.000
3.000
4.000
5.000
6.000
7.000
8.000
9.000
II III IV I II III IV I II III IV I II
2018 2019 2020 2021
Designin Marketing, program, financial and technical consulting, project management Construction and equipment
Utility infrastructure Water (contribution) Starting costs (marketing activities, staff traininf)
Extraordinary costs Working capital

Strictly confidential
INVESTMENT PROJECT DYNAMICS (3/3)
Investment Profile
• In assessing the success of the investment project, the following dynamic performance
indicators were used: payback period of the investment, the discounted return period of
the investment, the net present value of the project, the internal rate of profitability, the
modified internal rate of profitability and the profitability index. The basis for calculating the
dynamic performance indicators of the investment project is the net cash flow of the
investment project realized through the observed economic life of the project.
• The table below shows a comparative view of the dynamic performance indicators of an
investment project with the management company and without it.
• From the above mentioned comparative overview of the dynamic performance indicators
of the investment project, all indicators point to a better performance with the
management company. Thus, the return period and the discounted return period of the
investment are shorter with the management company, which shortens the period in
which the total investment will be covered by (discounted) cash flow.
• The net present value is higher, and also the profitability index.
• The internal rate of profitability and the modified internal rate of return are higher showing
the bigger difference between them and the weighted average cost of capital (WACC),
lowering the sensitivity of the project to the expected rate of cash flows.
• It can be concluded that the project is economically and financially efficient with and
without the management company while better results are achieved in the case of the
management company and subsequently is recommended the form of management of the
Wellness and Health Center Nin which includes a management company. It is important
to note that the projections made here are indeed conservative and leave enough space
to achieve even better business results and greater investment success.
Dynamic performance indicators of the investment
Source: Company
Key performance indicatorsWithout management
company
With management
company
Period of return on investment (years) 9,11 9,02
Discounted period of return on investment (years) 9,88 9,75
Net present value (EUR) 2.320.505 4.816.533
Internal rate of return (%) 7,49% 8,25%
Modified internal rate of profitability (%) 7,23% 7,70%
Profitability Index 1,05 1,11

Strictly confidential
TOURISM IN CROATIA
Market
• Croatia is a traditionally tourist-oriented country. In recent years, the demand for tourism
has increased in the market for specific types of tourism. Preserved natural resources and
environment, cultural and historical heritage, mild Mediterranean climate, proximity to
European markets, long tradition of tourism - all of Croatia's tourist advantages attractive
to modern tourists, which makes tourism one of the most important branches in Croatia.
• The unique characteristics of the sea and the coast have long been recognized and used
as the main comparative advantages of Croatian tourism. It offers ideal conditions for
beach tourism, but also for the most exclusive nautical tourism. The TOMAS 2014 survey
showed that more than 75 percent of tourists in Croatia are spending their summer
holidays as passive vacations, relaxing and swimming, taking walks and going to
restaurants and cafes.
• In 2016 Croatia has 1,133,751 beds in all types of accommodation, which is a 10% total
increase in the number of beds compared to 2015. The total share of hotel
accommodation in 2016 falls in relation to the previous year, which is inadequate in
relation to market demand, especially in the main season. The largest increase in capacity
is recorded with the rooms and other private renters; their share in 2016 amounts to 59%
of all capacities.
• 39.3% of tourists stayed in private accommodation, recording 3.8 million arrivals (26.6%
growth) and 20.8 million overnight stays (21.4% higher compared to the year before),
followed by hotels with 3.4 million arrivals (12.0% growth) and 10.8 million nights (growth
of 9.8%) camps and campgrounds were chosen by 1.6 million tourists (15.6% growth).
Accommodation capacity structure, 2016
Tourists and overnight stays by types of accommodation facilities, 01-07/2017
Source: Company
• In 2017, there has been continuous growth in the number of arrivals and overnight stays.
In the first eight months, Croatia recorded 9.8 million tourist arrivals, an increase of 18%
over the same period last year. In this period, a total of 45.6 million overnights were
realized, of which foreign tourists realized 42.4 million overnight stays (17% increase) and
domestic 3.3 million, which is 6% more than 2016. The most important tourist countries:
Germany, Italy, Slovenia, Czech Republic, Austria, Hungary, recorded a slight increase in
tourists and the number of new, potentially important markets for Croatia is growing:
France, Great Britain, Denmark, Sweden, Japan and USA
Objects Index Index
2016 2017 2017/16 2016 2017 2017/16
Hotels 3,082,183 3,450,182 111.94 9,875,132 10,846,241 109.84
Camps & campsites 1,413,438 1,633,472 115.57 8,892,018 10,322,869 116.09
Hostels 22,693 253,902 111.89 552,932 637,851 115.36
Spas 12,159 11,706 96.27 85,899 83,465 97.17
Rooms, apartments & holiday homes 3,032,134 3,839,288 126.62 17,160,920 20,828,732 121.37
Other facilities 551,055 586,067 106.35 2,788,243 2,930,139 105.09
Total 8,317,899 9,774,617 117.51 39,355,144 45,650,297 116.00
Tourists Overnights
Index
2015 2016 2016 / 2015 2015 2016
Hotels & appartments 135.322 137.222 101,4 13,1 12,1
Tourist resorts 30.836 30.087 97,6 3,0 2,7
Tourist apartments 15.371 14.753 96 1,5 1,3
Camps 237.758 227.559 95 23,1 20,1
Private rooms 575.428 668.83 116,2 55,9 59,0
Other 34.597 55.300 160 3,4 4,8
Total 1.029.312 1.133.751 110,1 100,00 100,00
CategoryTotal # of beds Share %

Strictly confidential
TOURISM IN ZADAR COUNTY
Market
• According to the data of the Zadar County in 2016, a total of 1,624,401 tourist arrivals (6%
more arrivals than in 2015) were realized in Zadar County and a total of 11,567,486
overnight stays (5% more than previous year). Domestic tourists realized 5% more
arrivals and 2% more nights, while foreign tourists realized 6% more arrivals and 5%
more nights. The County of Zadar thus achieved 9.93% of all tourist arrivals in Croatia
(12.65% overnights).
• The following picture shows the trend of arrivals and departures from 2008 to 2016 in
Zadar County. The number of tourist arrivals increased by 29.27% (475,405) in the
observed period. In the same period, the number of nights increased by 38.57%
(4,461,447).
• In the structure of guests, foreign guests represents 85.71%, of which the largest number
is from Germany (236,8181), Slovenia (189,434), Austria (115,792), Czech Republic
(99,827), Poland (90,255), ... In the analysed period the average number of overnights
rose from 5.9 days in 2008 to 7.1 days in 2016.
Trend of arrivals and overnight stays from 2008 to 2016
Number and categorization of the hotels in Zadar county in 2016
Source: Company
Structure of accommodation capacities
Hotels ## of beds /
places in camps Structure
5* hotels 1 420 0,28
4* hotels 21 3.618 2,41
3* hotels 29 2.947 1,96
2* hotels 2 131 0,09
1* hotels - - 0,00
Integral hotels 1 24 0,02
Diffuse hotels 1 8 0,01
Total 55 7.148 4,76

Strictly confidential
INVESTING IN CROATIA
Market
• Tourism is one of the most important drivers of economic development in Croatia. It
generates around 22% of gross domestic product and more than 40% of total exports.
• Croatia has a well-established institutional legal framework that is currently aligning with
European standards. The government is determined to maintain macroeconomic stability.
The Government is actively encouraging foreign direct investment with various incentive
measures to stimulate the economy. Foreign investors have the same rights, obligations
and legal status in established companies as well as domestic investors.
• Investors are entitled to special tax incentives depending on the nature of the investment
and the activities they carry out in Croatia (for investments in the amount of more than
mEUR 3, the profit tax will be paid at a rate of 0% for a period of 10 years from the start of
the investment with the condition to ensure employment of at least 15 employees in that
period starting from the first year of investment - the Investment Promotion Act
September 22 2015, Article 9).
• Croatia offers a tradition in production, highly educated workforce, modern communication
systems and high standards of transport infrastructure which provide great benefits to
investors.
• The rapid development of tourism provides investors with a unique opportunity to invest in
a dynamic sector that is steadily increasing.
• The geographical position and dynamic market offers a wide range of opportunities.
Source: Company

Strictly confidential
TARGET SALES SEGMENTS WITHOUT MANAGEMENT COMPANY (1/2)
Market
• The table above shows the realization of the individual programs by the motivational segments, sales segments and imitative markets, by months and days for the first four years. A
representative year of business - a typical year of business - is the fourth full year of opening (2025), the year in which the target results are achieved.
• Data on planned realization by individual programs shows a planned number of uses for a particular program and a percentage of occupancy with respect to the maximum possible use of
individual programs. The capacity utilization is increasing. In the first year of business, bed occupancy is planned at 55%, in the second year 59%, in the third year 62%. The planned
occupancy in the typical business year is 64%, representing 154,936 overnight stays and 31,472 guests per year.
• The table also shows the occupancy of individual capacities for other programs in the first four years of operation and the average number of uses per year as well as the total annual physical
turnover per individual program. In the first year of business, is planned on average, 364 overnight stays per day, in the second 392, in the third 411, and in a typical 424 overnight stays per
day.
Source: Company
Annual turnover in individual programs and occupancy
Daily Per year
Total
turnover /
# of uses
in Y1
Occup-
ancy
(%)
# of
uses
per day
Total
turnover /
# of uses
in Y2
Occup-
ancy
(%)
# of
uses
per day
Total
turnover /
# of uses
in Y3
Occup-
ancy
(%)
# of
uses
per day
Total
turnover /
# of uses
in AY
Occup-
ancy
(%)
# of
uses
per day
1 Nights 661 241.265 132.696 55 364 143.051 59 392 150.174 62 411 154.936 64 424
2 Board catering services 661 241.265 132.696 55 364 143.051 59 393 150.174 62 411 139.442 58 382
3 Sw imingpool 1.509 581.889 109.994 19 301 117.649 20 322 123.596 21 339 126.856 22 348
4 Sauna (Wellness) 199 72.720 26.574 37 73 28.506 39 78 29.888 41 82 30.723 42 84
5 Pilates 204 74.460 22.061 30 60 23.414 31 64 24.559 33 67 25.101 34 69
6 Preventive and relaksing therapies (Wellness) 238 86.870 56.662 65 155 60.674 70 166 63.481 73 174 65.227 75 179
7 Curative and i preventive therapies (Nin medicinal mud) 165 60.400 19.219 32 53 20.989 35 58 22.696 38 62 23.476 39 64
8 Curativne and rehabilitative medicial services 213 77.745 22.362 29 61 24.491 32 67 26.567 34 73 27.517 35 75
9 Sport and rekreative services 428 156.268 32.157 21 88 34.126 22 93 35.593 23 98 36.422 23 100
10 A-la-carte restaurants 1.430 522.064 45.146 9 124 48.477 9 133 50.691 10 139 51.997 10 142
11 Kaffees and bars 9318 3.400.900 179.685 5 492 191.796 6 525 201.624 6 552 206.415 6 566
12 Conference and banquet facilities 250 91.250 13.807 15 38 15.248 17 42 15.782 17 43 16.093 18 44
#
Year 1 Year 2 Year 3 Average Year
Maximal capacity

Strictly confidential
TARGET SALES SEGMENTS WITHOUT MANAGEMENT COMPANY (2/2)
Market
• The largest number of overnight stays in the typical business year are realized by the
elderly on healthy vacation and relaxation, while the segments with the least number of
overnight stays in the typical year of business are guests of domestic and foreign
companies and organizations with 4% of the realized overnight stays. Daily guests on
health treatments and daily guests on wellness treatments, recreation, sports, swimming
pools and business events do not get overnight stays but just use some of the Wellness
and Health Center Nin programs.
Source: Company
Segments Year 1 Year 2 Year 3 Year 4
Wellness guests 17% 17% 17% 17%
Young couples and guests on a short break and summer vacation 9% 9% 9% 9%
Guests on preventive healthcare and diagnostics 12% 12% 12% 12%
Guests of domestic and foreign health insurance on rehab 9% 10% 11% 11%
Seniors on vacation and relaxation 17% 17% 17% 17%
Sports and recreation (professional and recreational athletes and others 6% 5% 5% 5%
Families on summer vacation and short relaxation 8% 8% 7% 7%
Tourists w ho are exploring and relaxing 10% 10% 10% 10%
Incentive guests of domestic and foreign companies and organizations 4% 4% 4% 4%
Business guests and conference participants 8% 8% 8% 8%
• In the typical business year it is planned that the largest number of overnight stays would
be realized through tourist agencies representing 35,045 overnight stays, 29,166
overnight stays would be realized through specialized tour operators, 23,686 through
individual reservations (internet etc.), 23,461 through health institutions in Croatia, 19,194
through congress agencies with companies and other organizations, 13,905 through clubs
and associations, 5,995 through healthcare facilities in Europe and 4,484 overnight stays
would be realized by Walk in guests.
• The largest number of overnight stays is expected to be realized by our nearest market,
i.e. Croatia. Larger number of overnight stays are expected from guests from
Scandinavia, Germany, Slovenia, Italy, France and Benelux, Austria, Great Britain and
Ireland, while the largest percentage of guests from the Eastern European countries will
be from the Russian market due to the variety of programs that will represent an important
item in hotel capacity.
# Year 1 Year 2 Year 3 Year 4
Total annually 100% 100% 100% 100%
1 Walk in gusts 3% 3% 3% 3%
2 Specialized Tour Operators 19% 19% 19% 19%
3 Travel agencies 24% 24% 24% 23%
4 Health Institutions in Croatia 14% 14% 15% 15%
5 Health institutions in Europe 4% 4% 4% 4%
6 Congressional agencies, companies, etc. 12% 12% 12% 12%
7 Clubs and Associations 9% 9% 9% 9%
8 Individual Booking (internet etc.) 15% 15% 15% 15%
#
Total 1 132.696 1 143.051 1 150.174 1 154.936
1 Germany 0.1 13.896 0.1 14.919 0.1 15.569 0.1 15.921
2 Slovenia 0.1 12.707 0.1 13.637 0.09 14.222 0.09 14.663
3 Italiy 0.09 12.297 0.09 13.199 0.09 13.777 0.09 14.127
4 Croatia 0.28 36.971 0.28 40.259 0.29 42.92 0.29 45.002
5 Austria 0.08 10.495 0.08 11.268 0.08 11.756 0.08 11.992
6 Great Britain and Ireland 0.07 9.443 0.07 10.135 0.07 10.568 0.07 10.786
7 Scandinavia 0.11 14.429 0.11 15.498 0.11 16.185 0.11 16.574
8 France and Benelux 0.08 10.594 0.08 11.368 0.08 11.854 0.08 12.159
9 Eastern European countries 0.06 7.595 0.06 8.164 0.06 8.525 0.06 8.709
10 Other European countries 0.03 4.268 0.03 4.606 0.03 4.799 0.03 5.003
Year 1 Year 2 Year 3 Year 4
Structure of
the guests by
motive of
arrival in
overnights
Structure of
number of
nights per
year by
individual
sale segment
Planned
number of
nights per
individual
market

Strictly confidential
Daily Per year
Total
turnover /
# of uses
in Y1
Occup-
ancy
(%)
# of
uses
per day
Total
turnover /
# of uses
in Y2
Occup-
ancy
(%)
# of
uses
per day
Total
turnover /
# of uses
in Y3
Occup-
ancy
(%)
# of
uses
per day
Total
turnover /
# of uses
in AY
Occup-
ancy
(%)
# of
uses
per
day
1 Nights 661 241.265 142.306 59 390 153.401 64 420 161.020 67 441 166.133 69 455
2 Board catering services 661 241.265 142.306 59 390 153.401 64 420 161.020 67 441 149.519 62 410
3 Sw imingpool 1.594 581.889 115.299 20 316 123.339 21 338 129.566 22 355 133.519 23 364
4 Sauna (Wellness) 199 72.720 28.234 39 77 30.297 42 83 31.761 44 87 32.658 45 89
5 Pilates 204 74-460 23.062 31 63 24.484 33 67 25.767 34 70 26.252 35 72
6 Preventive and relaksing therapies (Wellness) 238 86.870 60.180 69 165 64.4.453 74 177 67.427 78 185 69.295 80 190
7 Curative and i preventive therapies (Nin medicinal mud) 165 60.400 20.073 33 55 21.919 36 60 23.699 39 65 24.526 41 67
8 Curativne and rehabilitative medicial services 213 77.745 23.389 30 64 25.609 33 70 27.744 36 76 28.784 37 79
9 Sport and rekreative services 428 156.268 34.053 22 93 36.147 23 99 37.695 24 103 38.583 25 106
10 A-la-carte restaurants 1.430 522.064 48.111 9 132 51.684 10 142 54.035 10 148 55.436 11 152
11 Kaffees and bars 9318 3.400.900 188.178 6 516 200.943 6 551 211.201 6 579 216.293 6 593
12 Conference and banquet facilities 250 91.250 15.072 17 41 16.658 8 46 17.237 19 47 17.579 19 48
# Maximal capacity
Year 1 Year 2 Year 3 Average Year
TARGET SALES SEGMENTS WITH MANAGEMENT COMPANY (1/2)
Market
• Data on planned realization by individual programs shows planned number for a particular program and the percentage of occupancy with regard to the foreseen maximum use of the
individual program. The capacity utilization planned for years is increasing.
• In the first year of business, bed occupancy is planned at 59%, in the second year 64%, in the third year 67%. The planned occupancy of beds in a typical business year is 69%, representing
166,133 overnight stays and 34,094 guests per annum.
• The table shows the occupancy of certain capacities for other programs in the first four years of operation and the average number of their uses on an annual basis as well as the total annual
physical turnover per individual program. In the first year of business, there would be 390 stays per night, in the second 420, in the third 441, and in the typical year 455 overnight stays per
day. Most usage / visits per day depend whether there are guests spending the night or whether they are walk in guests.
Source: Company
Annual turnover in individual programs and the occupancy

Strictly confidential
TARGET SALES SEGMENTS WITH MANAGEMENT COMPANY (2/2)
Market
• Planned realization (net income) from the first to the typical year is constantly increasing.
Its movement depends on the physical realization of the years and the average price of
the full board and the extra consumption. In the first year of operation, an annual
realization of EUR 10,821,077 is planned, in the second year EUR 12,023,626, in the third
year EUR 12,934,712 while in the typical year it is planned at EUR 13,450,329.
• The structure of individual programs shows that the incomes from full board
accommodation plus entrance to the hotel pool) amount to 68.7% of all revenues in the
typical year. 31.3% represent services related to extra consumption (entering the Sauna
world, using fitness, preventive and relaxation therapies, curative therapies - Nine mud,
curative and rehabilitative medical services, sports and recreational services, a-la-carte
restaurant, cafes and bars, as well as conference and banqueting facilities).
Source: Company
Total per year 10.821.077 100,0% 12.023.626 100,0% 12.934.712 100,0% 13.450.329 100,0%
Nights 4.906.673 45,3% 5.523.945 45,9% 5.983.871 46,3% 6.389.983 47,5%
Board catering services 1.690.839 15,6% 1.861.016 15,5% 1.983.216 15,3% 1.873.883 13,9%
Sw imingpool 809.131 7,5% 883.347 7,3% 942.095 7,3% 981.561 7,3%
Sauna (Wellness) 268.226 2,5% 293.877 2,4% 312.846 2,4% 326.577 2,4%
Fitnessa (Wellness) 109.544 1,0% 118.747 1,0% 126.456 1,0% 131.260 1,0%
Preventiive and relaksing therapies (Wellness) 824.413 7,6% 901.512 7,5% 957.618 7,4% 997.473 7,4%
Curative therapies (Nin mecicinal mud) 265.272 2,5% 295.82 2,5% 324.848 2,5% 340.794 2,5%
Curative and rehabilitative medical services 597.285 5,5% 666.832 5,5% 733.269 5,7% 768.84 5,7%
Sport and recreative services 149.368 1,4% 161.839 1,3% 171.392 1,3% 178.023 1,3%
A-la-carte restaurants 619.227 5,7% 679.437 5,7% 721.018 5,6% 756.665 5,6%
Caffees and bars 480.874 4,4% 524.147 4,4% 559.233 4,3% 582.222 4,3%
Conference and banquet facilities 100.226 0,9% 113.107 0,9% 118.850 0,9% 123.051 0,9%
Full board total 7.406.642 8.268.308 8.909.182 9.245.427
Other consumption in total 3.414.435 3.755.318 4.025.530 4.204.903
Full or half board consumption/ overnights 52,0 53,9 55,3 55,7
Extra consumption / overnights 24,0 24,5 25,0 25,3
Consumption / overnights total:: 76,0 78,4 80,3 81,0
Full or half board consumption / guest 240,3 253,0 265,0 271,2
Extra consumption / guest 110,8 114,9 119,7 123,3
Consumption / guest 351,0 367,9 384,7 394,5
Full or half board arrival / room 115,3 119,3 122,4 124,9
Daily guests / room 53,2 54,2 55,3 56,8
Arrival/room total: 168,5 173,5 177,6 181,7
Share of the full or half board consumption 68,4% 68,8% 68,9% 68,7%
Share other consumption 31,6% 31,2% 31,1% 31,3%
Achieved price for bed and breakfast 57,25 59,29 60,86 61,22
Year 1 Year 2 Year 3 Average Year
Annual realization and its structure by program (in EUR, without VAT)

Strictly confidential
FINANCING AND P&L PROJECTION
Financials
Source: Company
Source of financing Structure Cost of capital Total (EUR)
Ow n capital 40% 10,96% 19.430.723
Debt capital 60% 4,00% 29.146.084
Total 100% 6,78% 48.576.807
• Planned realization (net income) from the first to the typical year is constantly increasing.
Its movement depends on the physical realization of the years and the average price of
the full board and the extra consumption. In the first year of operation, an annual
realization of EUR 10,821,077 is planned, in the second year EUR 12,023,626, in the third
year EUR 12,934,712 while in the typical year it is planned at EUR 13,450,329.
• The structure of individual programs shows that the incomes from full board
accommodation plus entrance to the hotel pool) amount to 68.7% of all revenues in the
typical year. 31.3% represent services related to extra consumption (entering the sauna
world, using fitness, preventive and relaxation therapies, curative therapies - Nine mud,
curative and rehabilitative medical services, sports and recreational services, a-la-carte
restaurant, cafes and bars, as well as conference and banqueting facilities).
Source of financing Structure Cost of capital Total (EUR)
Equity 40% 10,96% 19.430.723
Debt 60% 4,00% 29.146.084
Total 100% 6,78% 48.576.807

Strictly confidential
Year 2021 2022 2023 2024 2025 2026 2027 2028 2029 2030 2031
Revenue 6.242.424 9.882.406 10.958.141 11.776.334 12.222.590 12.222.590 12.222.590 12.222.590 12.222.590 12.222.590 12.222.590
Operating income 6.162.624 9.745.606 10.821.341 11.639.534 12.085.790 12.085.790 12.085.790 12.085.790 12.085.790 12.085.790 12.085.790
Overnight stays 2.707.381 4.167.218 4.691.728 5.083.011 5.426.045 5.426.045 5.426.045 5.426.045 5.426.045 5.426.045 5.426.045
Board catering services 982.284 1.575.794 1.734.485 1.848.602 1.746.339 1.746.339 1.746.339 1.746.339 1.746.339 1.746.339 1.746.339
Sw imming pool 509.694 772.335 843.052 899.170 936.542 936.542 936.542 936.542 936.542 936.542 936.542
Sauna w orld (Wellness) 130.660 252.452 276.505 294.396 307.233 307.233 307.233 307.233 307.233 307.233 307.233
Fitness (Wellness) 64.332 104.787 113.556 120.952 125.503 125.503 125.503 125.503 125.503 125.503 125.503
Preventive and Relaxation Therapies (Wellness) 481.066 776.287 848.723 901.652 938.903 938.903 938.903 938.903 938.903 938.903 938.903
Curative Therapies (Nin Medicinal Mud) 141.291 254.036 283.327 311.188 326.287 326.287 326.287 326.287 326.287 326.287 326.287
Curative and rehabilitative medical services 301.982 569.498 635.987 699.551 733.138 733.138 733.138 733.138 733.138 733.138 733.138
Sports and recreational services 95.926 141.207 152.955 162.008 168.225 168.225 168.225 168.225 168.225 168.225 168.225
A-la-carte restaurants 382.157 580.866 637.058 676.160 709.213 709.213 709.213 709.213 709.213 709.213 709.213
Cafés and bars 322.193 459.312 500.429 534.027 555.708 555.708 555.708 555.708 555.708 555.708 555.708
Conferences and banquet center 43.659 91.815 103.535 108.816 112.654 112.654 112.654 112.654 112.654 112.654 112.654
Renting 79.800 136.800 136.800 136.800 136.800 136.800 136.800 136.800 136.800 136.800 136.800
OPEX 6.056.310 9.520.232 9.797.096 10.024.650 10.146.360 10.339.733 10.351.819 10.351.819 10.351.819 10.351.819 10.351.819
Costs of materials and services 1.365.976 2.433.817 2.649.760 2.815.480 2.874.427 3.067.800 3.079.886 3.079.886 3.079.886 3.079.886 3.079.886
Variable Costs 1.031.596 1.861.167 2.068.583 2.228.437 2.281.464 2.474.836 2.486.922 2.486.922 2.486.922 2.486.922 2.486.922
Fixed costs 334.379 572.651 581.177 587.043 592.964 592.964 592.964 592.964 592.964 592.964 592.964
Labor costs 2.925.743 4.061.400 4.122.321 4.184.156 4.246.918 4.246.918 4.246.918 4.246.918 4.246.918 4.246.918 4.246.918
Amortization 1.764.592 3.025.015 3.025.015 3.025.015 3.025.015 3.025.015 3.025.015 3.025.015 3.025.015 3.025.015 3.025.015
Profit (loss) from operations 186.114 362.174 1.161.045 1.751.684 2.076.230 1.882.857 1.870.771 1.870.771 1.870.771 1.870.771 1.870.771
Financial expenses 1.062.838 946.638 830.054 713.816 596.658 480.301 363.716 247.321 130.479 25.102 -
Interest on loans 1.062.838 946.638 830.054 713.816 596.658 480.301 363.716 247.321 130.479 25.102 -
Profit (loss) before Tax -876.724 -584.464 330.991 1.037.868 1.479.571 1.402.556 1.507.055 1.623.450 1.740.293 1.845.670 1.870.771
Tax on profit - - - - - - - - - - 445.782
Profit (loss) -876.724 -584.464 330.991 1.037.868 1.479.571 1.402.556 1.507.055 1.623.450 1.740.293 1.845.670 1.424.990
P&L PROJECTION WITHOUT MANAGEMENT COMPANY (1/4)
Financials
Source: Company
Year (in EUR) 2021 2022 2023 2024 2025 2026 2027 2028 2029 2030 2031
Revenue 6.242.424 9.882.406 10.958.141 11.776.334 12.222.590 12.222.590 12.222.590 12.222.590 12.222.590 12.222.590 12.222.590
Operating income 6.162.624 9.745.606 10.821.341 11.639.534 12.085.790 12.085.790 12.085.790 12.085.790 12.085.790 12.085.790 12.085.790
Overnight stays 2.707.381 4.167.218 4.691.728 5.083.011 5.426.045 5.426.045 5.426.045 5.426.045 5.426.045 5.426.045 5.426.045
Board catering services 982.284 1.575.794 1.734.485 1.848.602 1.746.339 1.746.339 1.746.339 1.746.339 1.746.339 1.746.339 1.746.339
Sw imming pool 509.694 772.335 843.052 899.170 936.542 936.542 936.542 936.542 936.542 936.542 936.542
Sauna w orld (Wellness) 130.660 252.452 276.505 294.396 307.233 307.233 307.233 307.233 307.233 307.233 307.233
Fitness (Wellness) 64.332 104.787 113.556 120.952 125.503 125.503 125.503 125.503 125.503 125.503 125.503
Preventive and Relaxation Therapies (Wellness) 481.066 776.287 848.723 901.652 938.903 938.903 938.903 938.903 938.903 938.903 938.903
Curative Therapies (Nin Medicinal Mud) 141.291 254.036 283.327 311.188 326.287 326.287 326.287 326.287 326.287 326.287 326.287
Curative and rehabilitative medical services 301.982 569.498 635.987 699.551 733.138 733.138 733.138 733.138 733.138 733.138 733.138
Sports and recreational services 95.926 141.207 152.955 162.008 168.225 168.225 168.225 168.225 168.225 168.225 168.225
A-la-carte restaurants 382.157 580.866 637.058 676.160 709.213 709.213 709.213 709.213 709.213 709.213 709.213
Cafés and bars 322.193 459.312 500.429 534.027 555.708 555.708 555.708 555.708 555.708 555.708 555.708
Conferences and banquet center 43.659 91.815 103.535 108.816 112.654 112.654 112.654 112.654 112.654 112.654 112.654
Renting 79.800 136.800 136.800 136.800 136.800 136.800 136.800 136.800 136.800 136.800 136.800
OPEX 6.056.310 9.520.232 9.797.096 10.024.650 10.146.360 10.339.733 10.351.819 10.351.819 10.351.819 10.351.819 10.351.819
Costs of materials and services 1.365.976 2.433.817 2.649.760 2.815.480 2.874.427 3.067.800 3.079.886 3.079.886 3.079.886 3.079.886 3.079.886
Variable Costs 1.031.596 1.861.167 2.068.583 2.228.437 2.281.464 2.474.836 2.486.922 2.486.922 2.486.922 2.486.922 2.486.922
Fixed costs 334.379 572.651 581.177 587.043 592.964 592.964 592.964 592.964 592.964 592.964 592.964
Labor costs 2.925.743 4.061.400 4.122.321 4.184.156 4.246.918 4.246.918 4.246.918 4.246.918 4.246.918 4.246.918 4.246.918
Amortization 1.764.592 3.025.015 3.025.015 3.025.015 3.025.015 3.025.015 3.025.015 3.025.015 3.025.015 3.025.015 3.025.015
Profit (loss) from operations 186.114 362.174 1.161.045 1.751.684 2.076.230 1.882.857 1.870.771 1.870.771 1.870.771 1.870.771 1.870.771
Financial expenses 1.062.838 946.638 830.054 713.816 596.658 480.301 363.716 247.321 130.479 25.102 -
Interest on loans 1.062.838 946.638 830.054 713.816 596.658 480.301 363.716 247.321 130.479 25.102 -
Profit (loss) before Tax -876.724 -584.464 330.991 1.037.868 1.479.571 1.402.556 1.507.055 1.623.450 1.740.293 1.845.670 1.870.771
Tax on profit - - - - - - - - - - 445.782
Profit (loss) -876.724 -584.464 330.991 1.037.868 1.479.571 1.402.556 1.507.055 1.623.450 1.740.293 1.845.670 1.424.990

Strictly confidential
P&L PROJECTION WITHOUT MANAGEMENT COMPANY (2/4)
Financials
Source: Company
• As visible from the above projection of the P&L in the first two years (2021 (June-December) - 2022), there is a loss as a result of high financial expenses. Namely, as a result of higher
operating income in relation to operating expenses, profit from operating activities is realized, however, as the company has an obligation to pay interest on long-term loans it results in the
loss of the business year.
• From 2023 to 2025, the gains from operating activities have an increasing trend, and as financial expenses (interest on loans) are decreasing, the profit of the business year is growing, which
in the typical business year (2025 year) amounts to EUR 1,479,571.
• Since 2026, the Company has an obligation to pay communal fees (1.5% of total revenues) and marketing expenses are higher than in the previous year, resulting in an increase in variable
costs and, in spite of the smaller interest rate in 2026, compared to the previous year the profit amounts to EUR 1,402, 556.
• From 2027 to 2029, the company earns a profit in the amount of EUR 1,870,771, which decreases compared to the year 2026 due to higher marketing expenses and interests on loans
decreases throughout the years till the repayment of the last annuity in 2030.
• In 2031, the Company has an obligation to pay income tax in accordance with the Income Tax Act due to the end of the tax incentive period. Therefore, the realized profit for the business year
from 2027 to 2030 ranges from EUR 1,507,055 to EUR 1,845,670 while in 2031 it amounts to EUR 1,424,990. Profit for the year represents undistributed gains intended to repay the principal
of the loan as well as dividend payments to shareholders.
14.000.000
12.000.000
10.000.000
8.000.000
6.000.000
4.000.000
2.000.000
0
2021 2022 2023 2024 2025 2026 2027 2028 2029 2030 2031
2021 2022 2023 2024 2025 2026 2027 2028 2029 2030 2031
2.000.000
1.500.000
1.000.000
500.000
0
- 500.000
- 1.000.000
- 1.500.000
Operating revenues and expenditures (in EUR) Profit (loss) for the operating year (in EUR)

Strictly confidential
CASH FLOW STATEMENT WITHOUT MANAGEMENT COMPANY (3/4)
Financials
Source: Company
Year 2018 2019 2020 2021 2022 2023 2024 2025 2026 2027 2028 2029 2030 2031
Cash flow at the beginning - - - 4.896.838 -4.134.265 -4.608.322 -4.166.924 -3.018.651 -1.428.673 84.289 1.701.750 3.435.607 5.286.305 8.712.914
Operating activities - - -636.990 887.868 2.440.551 3.356.006 4.062.882 4.504.586 4.427.571 4.532.069 4.648.465 4.765.307 4.870.684 4.450.004
a) Receipts - - - 6.242.424 9.882.406 10.958.141 11.776.334 12.222.590 12.222.590 12.222.590 12.222.590 12.222.590 12.222.590 12.222.590
Operating income - - - 6.162.624 9.745.606 10.821.341 11.639.534 12.085.790 12.085.790 12.085.790 12.085.790 12.085.790 12.085.790 12.085.790
Rental income - - - 79.800 136.800 136.800 136.800 136.800 136.800 136.800 136.800 136.800 136.800 136.800
Extraordinary income - - - - - - - - - - - - - -
b) Payments - - 636.990 5.354.556 7.441.855 7.602.135 7.713.451 7.718.004 7.795.019 7.690.520 7.574.125 7.457.283 7.351.906 7.772.586
Variable Costs - - - 1.031.596 1.861.167 2.068.583 2.228.437 2.281.464 2.474.836 2.486.922 2.486.922 2.486.922 2.486.922 2.486.922
Fixed costs - - 58.292 334.379 572.651 581.177 587.043 592.964 592.964 592.964 592.964 592.964 592.964 592.964
Labor costs - - - 2.925.743 4.061.400 4.122.321 4.184.156 4.246.918 4.246.918 4.246.918 4.246.918 4.246.918 4.246.918 4.246.918
Extraordinary expenses - - - - - - - - - - - - - -
Interest - - 578.698 1.062.838 946.638 830.054 713.816 596.658 480.301 363.716 247.321 130.479 25.102 -
Profit tax - - - - - - - - - - - - - 445.782
Investment activities - - -22.141.723 -7.004.362 - - - - - - - - - -
a) Receipts 1.270.000 11.263.670 6.897.053 - - - - - - - - - - -
Ow n capital 1.270.000 11.263.670 6.897.053
Rest value - - - - - - - - - - - - - -
b) Payments 1.270.000 11.263.670 29.038.776 7.004.362 - - - - - - - - - -
Payments for investments 1.270.000 11.263.670 29.038.776 7.004.362 - - - - - - - - - -
Financial activities - - 27.675.551 -2.914.608 -2.914.608 -2.914.608 -2.914.608 -2.914.608 -2.914.608 -2.914.608 -2.914.608 -2.914.608 -1.444.075 -
a) Receipts - - 29.146.084 - - - - - - - - - - -
Loans - - 29.146.084 - - - - - - - - - - -
Financial revenues - - - - - - - - - - - - - -
b) Payments - - 1.470.533 2.914.608 2.914.608 2.914.608 2.914.608 2.914.608 2.914.608 2.914.608 2.914.608 2.914.608 1.444.075 -
Repayment of principal - - 1.470.533 2.914.608 2.914.608 2.914.608 2.914.608 2.914.608 2.914.608 2.914.608 2.914.608 2.914.608 1.444.075 -
Total Cash Flow - - 4.896.838 -9.031.102 -474.057 441.397 1.148.274 1.589.977 1.512.962 1.617.461 1.733.856 1.850.699 3.426.609 4.450.004
Cumulative cash flow - - 4.896.838 -4.134.265 -4.608.322 -4.166.924 -3.018.651 -1.428.673 84.289 1.701.750 3.435.607 5.286.305 8.712.914 13.162.919
Year (in EUR) 2018 2019 2020 2021 2022 2023 2024 2025 2026 2027 2028 2029 2030 2031
Cash flow at the beginning - - - 4.896.838 -4.134.265 -4.608.322 -4.166.924 -3.018.651 -1.428.673 84.289 1.701.750 3.435.607 5.286.305 8.712.914
Operating activities - - -636.990 887.868 2.440.551 3.356.006 4.062.882 4.504.586 4.427.571 4.532.069 4.648.465 4.765.307 4.870.684 4.450.004
a) Receipts - - - 6.242.424 9.882.406 10.958.141 11.776.334 12.222.590 12.222.590 12.222.590 12.222.590 12.222.590 12.222.590 12.222.590
Operating income - - - 6.162.624 9.745.606 10.821.341 11.639.534 12.085.790 12.085.790 12.085.790 12.085.790 12.085.790 12.085.790 12.085.790
Rental income - - - 79.800 136.800 136.800 136.800 136.800 136.800 136.800 136.800 136.800 136.800 136.800
Extraordinary income - - - - - - - - - - - - - -
b) Payments - - 636.990 5.354.556 7.441.855 7.602.135 7.713.451 7.718.004 7.795.019 7.690.520 7.574.125 7.457.283 7.351.906 7.772.586
Variable Costs - - - 1.031.596 1.861.167 2.068.583 2.228.437 2.281.464 2.474.836 2.486.922 2.486.922 2.486.922 2.486.922 2.486.922
Fixed costs - - 58.292 334.379 572.651 581.177 587.043 592.964 592.964 592.964 592.964 592.964 592.964 592.964
Labor costs - - - 2.925.743 4.061.400 4.122.321 4.184.156 4.246.918 4.246.918 4.246.918 4.246.918 4.246.918 4.246.918 4.246.918
Extraordinary expenses - - - - - - - - - - - - - -
Interest - - 578.698 1.062.838 946.638 830.054 713.816 596.658 480.301 363.716 247.321 130.479 25.102 -
Profit tax - - - - - - - - - - - - - 445.782
Investment activities - - -22.141.723 -7.004.362 - - - - - - - - - -
a) Receipts 1.270.000 11.263.670 6.897.053 - - - - - - - - - - -
Ow n capital 1.270.000 11.263.670 6.897.053
Rest value - - - - - - - - - - - - - -
b) Payments 1.270.000 11.263.670 29.038.776 7.004.362 - - - - - - - - - -
Payments for investments 1.270.000 11.263.670 29.038.776 7.004.362 - - - - - - - - - -
Financial activities - - 27.675.551 -2.914.608 -2.914.608 -2.914.608 -2.914.608 -2.914.608 -2.914.608 -2.914.608 -2.914.608 -2.914.608 -1.444.075 -
a) Receipts - - 29.146.084 - - - - - - - - - - -
Loans - - 29.146.084 - - - - - - - - - - -
Financial revenues - - - - - - - - - - - - - -
b) Payments - - 1.470.533 2.914.608 2.914.608 2.914.608 2.914.608 2.914.608 2.914.608 2.914.608 2.914.608 2.914.608 1.444.075 -
Repayment of principal - - 1.470.533 2.914.608 2.914.608 2.914.608 2.914.608 2.914.608 2.914.608 2.914.608 2.914.608 2.914.608 1.444.075 -
Total Cash Flow - - 4.896.838 -9.031.102 -474.057 441.397 1.148.274 1.589.977 1.512.962 1.617.461 1.733.856 1.850.699 3.426.609 4.450.004
Cumulative cash flow - - 4.896.838 -4.134.265 -4.608.322 -4.166.924 -3.018.651 -1.428.673 84.289 1.701.750 3.435.607 5.286.305 8.712.914 13.162.919

Strictly confidential
CASH FLOW STATEMENT WITHOUT MANAGEMENT COMPANY (4/4)
Financials
Source: Company
• As shown in the table above 2018 and 2019 cash income (equity) and payments (investment payments) from investment activities are equalized.
• In the year 2020, cash payments from operating activities relate to fixed costs i.e. to the bank for loan approval (EUR 58,292) and the interests for long-term loans granted during 2020 (EUR
578,698). Payments from financing activities relate to repayment of the principal of the long-term loans (EUR 1,470,533).
• Receipts from investment activities (own capital EUR 6,897,053) and financial activities (loan EUR 29,146,084) will be made available for financing cash and payments from operating and
financial activities and investment costs of EUR 29,038,776 in 2020 and the overall cash flow at the end of the year would also be positive for financing the part of the investment payments in
the first half of 2018.
• In the first year (2021), a positive cash flow from operating activities and negative cash flows from investment (investment expenses) and financial activities (principal repayments) would be
realized, which gives a negative cash flow of EUR -9,031,102, but with cash flow from the beginning of the period (positive cash flow of the previous year) gives a total cash flow of EUR -
4,134,265. In 2022, a cash flow of EUR -474,057 would be realized since the cash flow from operating activities would be lower than the amount needed to repay the loan principal. During
the period from 2023 to 2031, cash flow from the investment activities are not anticipated.
• In the period from 2023 to 2031, the company would realize positive total cash flows ranging from EUR 441,397 in 2011 to EUR 4,450,004 in 2019. Total cash flows have a trend of growth
except for 2026 when due to the obligation to pay the commodity fee and higher market communication expenses compared to the previous year, the variable costs increase and, regardless
of the lower cost of interest, a lower total cash flow would be realized compared to the previous year.
• Cumulative cash flow shows that negative cash flows from previous years as a result of high investment payments or principal repayments in the first years get covered by 2026 and in the
period 2026-2031 they generate positive cumulative cash flow ranging from EUR 84,289 2026 years up to EUR 13,162,919 in year 2031.
• The realized positive cash flows represent free cash intended to pay dividends to shareholders or to invest in the further development of the company.
• It is important to note that the above-mentioned cash flow projection does not include the residual value as a positive cash flow (EUR 40,032,414) from investment activities that would be
realized in 2031 as the final cash flow (estimated market value of the project decreased for the tax on the difference between market and bookkeeping values and increased for the value of
working capital).

Strictly confidential
Year 2021 2022 2023 2024 2025 2026 2027 2028 2029 2030 2031
Revenue 6.907.234 10.957.877 12.160.426 13.071.512 13.587.129 13.587.129 13.587.129 13.587.129 13.587.129 13.587.129 13.587.129
Operating income 6.827.434 10.821.077 12.023.626 12.934.712 13.450.329 13.450.329 13.450.329 13.450.329 13.450.329 13.450.329 13.450.329
Overnight stays 3.177.732 4.906.673 5.523.945 5.983.871 6.389.983 6.389.983 6.389.983 6.389.983 6.389.983 6.389.983 6.389.983
Board catering services 1.050.551 1.690.839 1.861.016 1.983.216 1.873.883 1.873.883 1.873.883 1.873.883 1.873.883 1.873.883 1.873.883
Sw imming pool 532.661 809.131 883.347 942.095 981.561 981.561 981.561 981.561 981.561 981.561 981.561
Sauna w orld (Wellness) 138.583 268.226 293.877 312.846 326.577 326.577 326.577 326.577 326.577 326.577 326.577
Fitness (Wellness) 67.216 109.544 118.747 126.456 131.260 131.260 131.260 131.260 131.260 131.260 131.260
Preventive and Relaxation Therapies (Wellness) 509.253 824.413 901.512 957.618 997.473 997.473 997.473 997.473 997.473 997.473 997.473
Curative Therapies (Nin Medicinal Mud) 146.815 265.272 295.820 324.848 340.794 340.794 340.794 340.794 340.794 340.794 340.794
Curative and rehabilitative medical services 315.568 597.285 666.832 733.269 768.840 768.840 768.840 768.840 768.840 768.840 768.840
Sports and recreational services 101.045 149.368 161.839 171.392 178.023 178.023 178.023 178.023 178.023 178.023 178.023
A-la-carte restaurants 405.188 619.227 679.437 721.018 756.665 756.665 756.665 756.665 756.665 756.665 756.665
Cafés and bars 335.088 480.874 524.147 559.233 582.222 582.222 582.222 582.222 582.222 582.222 582.222
Conferences and banquet center 47.735 100.226 113.107 118.850 123.051 123.051 123.051 123.051 123.051 123.051 123.051
Renting 79.800 136.800 136.800 136.800 136.800 136.800 136.800 136.800 136.800 136.800 136.800
OPEX 6.375.276 10.084.413 10.597.582 10.939.523 11.135.814 11.378.397 11.358.222 11.358.222 11.358.222 11.358.222 11.358.222
Costs of materials and services 1.904.241 3.249.998 3.706.027 3.989.970 4.127.392 4.369.975 4.349.800 4.349.800 4.349.800 4.349.800 4.349.800
Variable Costs 1.565.246 2.669.435 3.116.327 3.393.996 3.525.208 3.767.792 3.747.616 3.747.616 3.747.616 3.747.616 3.747.616
Fixed costs 338.995 580.563 589.700 595.974 602.184 602.184 602.184 602.184 602.184 602.184 602.184
Labor costs 2.706.443 3.809.400 3.866.541 3.924.539 3.983.407 3.983.407 3.983.407 3.983.407 3.983.407 3.983.407 3.983.407
Amortization 1.764.592 3.025.015 3.025.015 3.025.015 3.025.015 3.025.015 3.025.015 3.025.015 3.025.015 3.025.015 3.025.015
Profit (loss) from operations 531.959 873.464 1.562.844 2.131.989 2.451.316 2.208.732 2.228.908 2.228.908 2.228.908 2.228.908 2.228.908
Financial expenses 1.062.838 946.638 830.054 713.816 596.658 480.301 363.716 247.321 130.479 25.102 -
Interest on loans 1.062.838 946.638 830.054 713.816 596.658 480.301 363.716 247.321 130.479 25.102 -
Profit (loss) before Tax -530.879 -73.174 732.790 1.418.173 1.854.657 1.728.432 1.865.191 1.981.587 2.098.429 2.203.806 2.228.908
Tax on profit - - - - - - - - - - 445.782
Profit (loss) -530.879 -73.174 732.790 1.418.173 1.854.657 1.728.432 1.865.191 1.981.587 2.098.429 2.203.806 1.783.126
P&L PROJECTION WITH MANAGEMENT COMPANY (1/4)
Financials
Source: Company
Year (in EUR) 2021 2022 2023 2024 2025 2026 2027 2028 2029 2030 2031
Revenue 6.907.234 10.957.877 12.160.426 13.071.512 13.587.129 13.587.129 13.587.129 13.587.129 13.587.129 13.587.129 13.587.129
Operating income 6.827.434 10.821.077 12.023.626 12.934.712 13.450.329 13.450.329 13.450.329 13.450.329 13.450.329 13.450.329 13.450.329
Overnight stays 3.177.732 4.906.673 5.523.945 5.983.871 6.389.983 6.389.983 6.389.983 6.389.983 6.389.983 6.389.983 6.389.983
Board catering services 1.050.551 1.690.839 1.861.016 1.983.216 1.873.883 1.873.883 1.873.883 1.873.883 1.873.883 1.873.883 1.873.883
Sw imming pool 532.661 809.131 883.347 942.095 981.561 981.561 981.561 981.561 981.561 981.561 981.561
Sauna w orld (Wellness) 138.583 268.226 293.877 312.846 326.577 326.577 326.577 326.577 326.577 326.577 326.577
Fitness (Wellness) 67.216 109.544 118.747 126.456 131.260 131.260 131.260 131.260 131.260 131.260 131.260
Preventive and Relaxation Therapies (Wellness) 509.253 824.413 901.512 957.618 997.473 997.473 997.473 997.473 997.473 997.473 997.473
Curative Therapies (Nin Medicinal Mud) 146.815 265.272 295.820 324.848 340.794 340.794 340.794 340.794 340.794 340.794 340.794
Curative and rehabilitative medical services 315.568 597.285 666.832 733.269 768.840 768.840 768.840 768.840 768.840 768.840 768.840
Sports and recreational services 101.045 149.368 161.839 171.392 178.023 178.023 178.023 178.023 178.023 178.023 178.023
A-la-carte restaurants 405.188 619.227 679.437 721.018 756.665 756.665 756.665 756.665 756.665 756.665 756.665
Cafés and bars 335.088 480.874 524.147 559.233 582.222 582.222 582.222 582.222 582.222 582.222 582.222
Conferences and banquet center 47.735 100.226 113.107 118.850 123.051 123.051 123.051 123.051 123.051 123.051 123.051
Renting 79.800 136.800 136.800 136.800 136.800 136.800 136.800 136.800 136.800 136.800 136.800
OPEX 6.375.276 10.084.413 10.597.582 10.939.523 11.135.814 11.378.397 11.358.222 11.358.222 11.358.222 11.358.222 11.358.222
Costs of materials and services 1.904.241 3.249.998 3.706.027 3.989.970 4.127.392 4.369.975 4.349.800 4.349.800 4.349.800 4.349.800 4.349.800
Variable Costs 1.565.246 2.669.435 3.116.327 3.393.996 3.525.208 3.767.792 3.747.616 3.747.616 3.747.616 3.747.616 3.747.616
Fixed costs 338.995 580.563 589.700 595.974 602.184 602.184 602.184 602.184 602.184 602.184 602.184
Labor costs 2.706.443 3.809.400 3.866.541 3.924.539 3.983.407 3.983.407 3.983.407 3.983.407 3.983.407 3.983.407 3.983.407
Amortization 1.764.592 3.025.015 3.025.015 3.025.015 3.025.015 3.025.015 3.025.015 3.025.015 3.025.015 3.025.015 3.025.015
Profit (loss) from operations 531.959 873.464 1.562.844 2.131.989 2.451.316 2.208.732 2.228.908 2.228.908 2.228.908 2.228.908 2.228.908
Financial expenses 1.062.838 946.638 830.054 713.816 596.658 480.301 363.716 247.321 130.479 25.102 -
Interest on loans 1.062.838 946.638 830.054 713.816 596.658 480.301 363.716 247.321 130.479 25.102 -
Profit (loss) before Tax -530.879 -73.174 732.790 1.418.173 1.854.657 1.728.432 1.865.191 1.981.587 2.098.429 2.203.806 2.228.908
Tax on profit - - - - - - - - - - 445.782
Profit (loss) -530.879 -73.174 732.790 1.418.173 1.854.657 1.728.432 1.865.191 1.981.587 2.098.429 2.203.806 1.783.126

Strictly confidential
P&L PROJECTION WITH MANAGEMENT COMPANY (2/4)
Financials
Source: Company
• As visible from the above projection of the P&L in the first two years (2021 (June-December) - 2022), there is a loss as a result of high financial expenses. Namely, as a result of higher
operating income in relation to operating expenses, profit from operating activities is realized, however, as the company has an obligation to pay interest on long-term loans, the amount of
which is the largest in the first years of the repayment causing the loss of the business year. From 2023 to 2025, the profit from operating activities have an increasing trend, and as financial
expenditures (interest on loans) are decreasing, the profit is generated which in the typical business year (2025) equals to EUR 1,854,657.
• Since 2026, the Company has an obligation to pay communal fees (1.5% of the total revenues) and Incentive Fees (10% GOP - operating profit increased by management and depreciation
costs) due to the higher GOP achieved in the previous year, resulting in increasing the variable costs and regardless of the smaller interest rate in 2026, achieving a lower profit of the
business year compared to the previous year and amounts to EUR 1,728,432.
• Between 2026 and 2031, the company generates operating profit in the amount of EUR 2,228,908 which is increased compared to 2025 due to decreased incentive fee (10% GOP - operating
profit increased for management costs and amortization) and the amount the interest on the loans decreases till 2030 when the last annuity is settled.
• In 2031, the Company has an obligation to pay income tax in accordance with the Income Tax Act due to the end of the tax relief period as an incentive to invest. Therefore, the profit of the
business year from 2027 to 2030 ranges from EUR 1,865,191 to EUR 2,203,806 while in 2031 EUR 1,783,126.
• Profit for the year represents undistributed profit intended to repay the principal of the loan as well as dividend payments to shareholders.
Operating revenues and expenditures (in EUR) Profit (loss) for the operating year (in EUR)
16.000.000
14.000.000
12.000.000
10.000.000
8.000.000
6.000.000
4.000.000
2.000.000
0as
2021 2022 2023 2024 2025 2026 2027
2028 2029 2030 2031
2021
2.500.000
2.000.000
1.500.000
1.000.000
500.000
0
2022 2023 2024 2025 2026 2027 2028 2029 2030 2031
- 500.000

Strictly confidential
Year 2018 2019 2020 2021 2022 2023 2024 2025 2026 2027 2028 2029 2030 2031
Cash flow at the beginning - - - 4.896.838 -3.788.420 -3.751.187 -2.907.991 -1.379.412 585.651 2.424.489 4.400.087 6.492.080 8.700.915 12.485.660
Operating activities - - -636.990 1.233.712 2.951.841 3.757.805 4.443.187 4.879.672 4.753.446 4.890.206 5.006.601 5.123.444 5.228.821 4.808.141
a) Receipts - - - 6.907.234 10.957.877 12.160.426 13.071.512 13.587.129 13.587.129 13.587.129 13.587.129 13.587.129 13.587.129 13.587.129
Operating income - - - 6.827.434 10.821.077 12.023.626 12.934.712 13.450.329 13.450.329 13.450.329 13.450.329 13.450.329 13.450.329 13.450.329
Rental income - - - 79.800 136.800 136.800 136.800 136.800 136.800 136.800 136.800 136.800 136.800 136.800
Extraordinary income - - - - - - - - - - - - - -
b) Payments - - 636.990 5.673.522 8.006.036 8.402.621 8.628.325 8.707.458 8.833.683 8.696.923 8.580.528 8.463.686 8.358.309 8.778.989
Variable Costs - - - 1.565.246 2.669.435 3.116.327 3.393.996 3.525.208 3.767.792 3.747.616 3.747.616 3.747.616 3.747.616 3.747.616
Fixed costs - - 58.292 338.995 580.563 589.700 595.974 602.184 602.184 602.184 602.184 602.184 602.184 602.184
Labor costs - - 0 2.706.443 3.809.400 3.866.541 3.924.539 3.983.407 3.983.407 3.983.407 3.983.407 3.983.407 3.983.407 3.983.407
Extraordinary expenses - - - - - - - - - - - - - -
Interest - - 578.698 1.062.838 946.638 830.054 713.816 596.658 480.301 363.716 247.321 130.479 25.102 -
Profit tax - - - - - - - - - - - - - 445.782
Investment activities - - -22.141.723 -7.004.362 - - - - - - - - - -
a) Receipts 1.270.000 11.263.670 6.897.053 - - - - - - - - - - -
Ow n capital 1.270.000 11.263.670 6.897.053 - - - - - - - - - - -
Rest value - - - - - - - - - - - - - -
b) Payments 1.270.000 11.263.670 29.038.776 7.004.362 - - - - - - - - - -
Payments for investments 1.270.000 11.26367 29.038.776 7.004.362 - - - - - - - - - -
Financial activities - - 27.675.551 -2.914.608 -2.914.608 -2.914.608 -2.914.608 -2.914.608 -2.914.608 -2.914.608 -2.914.608 -2.914.608 -1.444.075 -
a) Receipts - - 29.146.084 - - - - - - - - - - -
Loans - - 29.146.084 - - - - - - - - - - -
Financial revenues - - - - - - - - - - - - - -
b) Payments - - 1.470.533 2.914.608 2.914.608 2.914.608 2.914.608 2.914.608 2.914.608 2.914.608 2.914.608 2.914.608 1.444.075 -
Repayment of principal - - 1.470.533 2.914.608 2.914.608 2.914.608 2.914.608 2.914.608 2.914.608 2.914.608 2.914.608 2.914.608 1.444.075 -
Total Cash Flow - - 4.896.838 -8.685.258 37.232 843.197 1.528.579 1.965.063 1.838.838 1.975.598 2.091.993 2.208.835 3.784.746 4.808.141
Cumulative cash flow - - 4.896.838 -3.788.420 -3.751.187 -2.907.991 -1.379.412 585.651 2.424.489 4.400.087 6.492.080 8.700.915 12.485.660 17.293.801
CASH FLOW STATEMENT WITH MANAGEMENT COMPANY (3/4)
Financials
Source: Company
Year (in EUR) 2018 2019 2020 2021 2022 2023 2024 2025 2026 2027 2028 2029 2030 2031
Cash flow at the beginning - - - 4.896.838 -3.788.420 -3.751.187 -2.907.991 -1.379.412 585.651 2.424.489 4.400.087 6.492.080 8.700.915 12.485.660
Operating activities - - -636.990 1.233.712 2.951.841 3.757.805 4.443.187 4.879.672 4.753.446 4.890.206 5.006.601 5.123.444 5.228.821 4.808.141
a) Receipts - - - 6.907.234 10.957.877 12.160.426 13.071.512 13.587.129 13.587.129 13.587.129 13.587.129 13.587.129 13.587.129 13.587.129
Operating income - - - 6.827.434 10.821.077 12.023.626 12.934.712 13.450.329 13.450.329 13.450.329 13.450.329 13.450.329 13.450.329 13.450.329
Rental income - - - 79.800 136.800 136.800 136.800 136.800 136.800 136.800 136.800 136.800 136.800 136.800
Extraordinary income - - - - - - - - - - - - - -
b) Payments - - 636.990 5.673.522 8.006.036 8.402.621 8.628.325 8.707.458 8.833.683 8.696.923 8.580.528 8.463.686 8.358.309 8.778.989
Variable Costs - - - 1.565.246 2.669.435 3.116.327 3.393.996 3.525.208 3.767.792 3.747.616 3.747.616 3.747.616 3.747.616 3.747.616
Fixed costs - - 58.292 338.995 580.563 589.700 595.974 602.184 602.184 602.184 602.184 602.184 602.184 602.184
Labor costs - - 0 2.706.443 3.809.400 3.866.541 3.924.539 3.983.407 3.983.407 3.983.407 3.983.407 3.983.407 3.983.407 3.983.407
Extraordinary expenses - - - - - - - - - - - - - -
Interest - - 578.698 1.062.838 946.638 830.054 713.816 596.658 480.301 363.716 247.321 130.479 25.102 -
Profit tax - - - - - - - - - - - - - 445.782
Investment activities - - -22.141.723 -7.004.362 - - - - - - - - - -
a) Receipts 1.270.000 11.263.670 6.897.053 - - - - - - - - - - -
Ow n capital 1.270.000 11.263.670 6.897.053 - - - - - - - - - - -
Rest value - - - - - - - - - - - - - -
b) Payments 1.270.000 11.263.670 29.038.776 7.004.362 - - - - - - - - - -
Payments for investments 1.270.000 11.26367 29.038.776 7.004.362 - - - - - - - - - -
Financial activities - - 27.675.551 -2.914.608 -2.914.608 -2.914.608 -2.914.608 -2.914.608 -2.914.608 -2.914.608 -2.914.608 -2.914.608 -1.444.075 -
a) Receipts - - 29.146.084 - - - - - - - - - - -
Loans - - 29.146.084 - - - - - - - - - - -
Financial revenues - - - - - - - - - - - - - -
b) Payments - - 1.470.533 2.914.608 2.914.608 2.914.608 2.914.608 2.914.608 2.914.608 2.914.608 2.914.608 2.914.608 1.444.075 -
Repayment of principal - - 1.470.533 2.914.608 2.914.608 2.914.608 2.914.608 2.914.608 2.914.608 2.914.608 2.914.608 2.914.608 1.444.075 -
Total Cash Flow - - 4.896.838 -8.685.258 37.232 843.197 1.528.579 1.965.063 1.838.838 1.975.598 2.091.993 2.208.835 3.784.746 4.808.141
Cumulative cash flow - - 4.896.838 -3.788.420 -3.751.187 -2.907.991 -1.379.412 585.651 2.424.489 4.400.087 6.492.080 8.700.915 12.485.660 17.293.801

Strictly confidential
CASH FLOW STATEMENT WITH MANAGEMENT COMPANY (4/4)
Financials
Source: Company
• As shown in the table above 2018 and 2019 cash receipts (equity) and payments (investment expense) from investment activities are equalized.
• In the year 2020, payments from operating activities relate to fixed costs i.e. to the bank for loan approval (EUR 58,292) and the interest expense for long-term loans granted during 2020
(EUR 578,698). Payments from financing activities relate to repayment of the principal of the long-term loans (EUR 1,470,533).
• Receipts from investment activities (own capital EUR 6,897,053) and financial activities (loan EUR 29,146,084) will be made available for financing cash and payments from operating and
financial activities and payments for investment of EUR 29,038,776 in 2019 and since the overall cash flow at the end of the year would also be positive for financing the part of the investment
payments in the first half of 2020.
• In the first year (2021), a positive cash flow from operating activities and negative cash flows from investment (investment expenses) and financial activities (principal repayments) would be
realized, which gives a negative cash flow of EUR -8,685,258, but with cash flow from the beginning of the period (positive cash flow of the previous year) gives a total cash flow of EUR -
3,788,420.
• In 2022, a cash flow of EUR 37,232 would be realized since the cash flow from operating activities would be higher than the amount needed to repay the loan principal. During the period from
2022 to 2031, cash flow from the investment activities are not anticipated.
• In the period from 2022 to 2031, the company would realize positive total cash flows ranging from EUR 37,232 in 2022 to EUR 4,808,141 in 2031. Total cash flows have a trend of growth
except for 2026 when due to the obligation to pay the commodity fee and higher Incentive fee compared to the previous year, the variable costs increase and, regardless of the lower cost of
interest, a lower total cash flow would be realized compared to the previous year.
• Cumulative cash flow shows that negative cash flows from previous years as a result of high payments for investment or principal repayments in the first years covers up by 2025 and in the
period 2025-2031 they generate positive cumulative cash flow ranging from EUR 585,651 in 2025 up to EUR 17,293,801 in 2031. The realized positive cash flows represent free cash
intended to pay dividends to shareholders or to invest in the further development of the company.
• It is important to note that the above-mentioned cash flow projection does not include the residual value as a positive cash flow (EUR 40,032,414) from investment activities that would be
realized in 2031 as the final cash flow (estimated market value of the project decreased for the tax on the difference between market and bookkeeping values and increased for the value of
working capital.
Strictly confidential
STATIC EVALUATION OF THE PROJECT
Financials
Source: Company
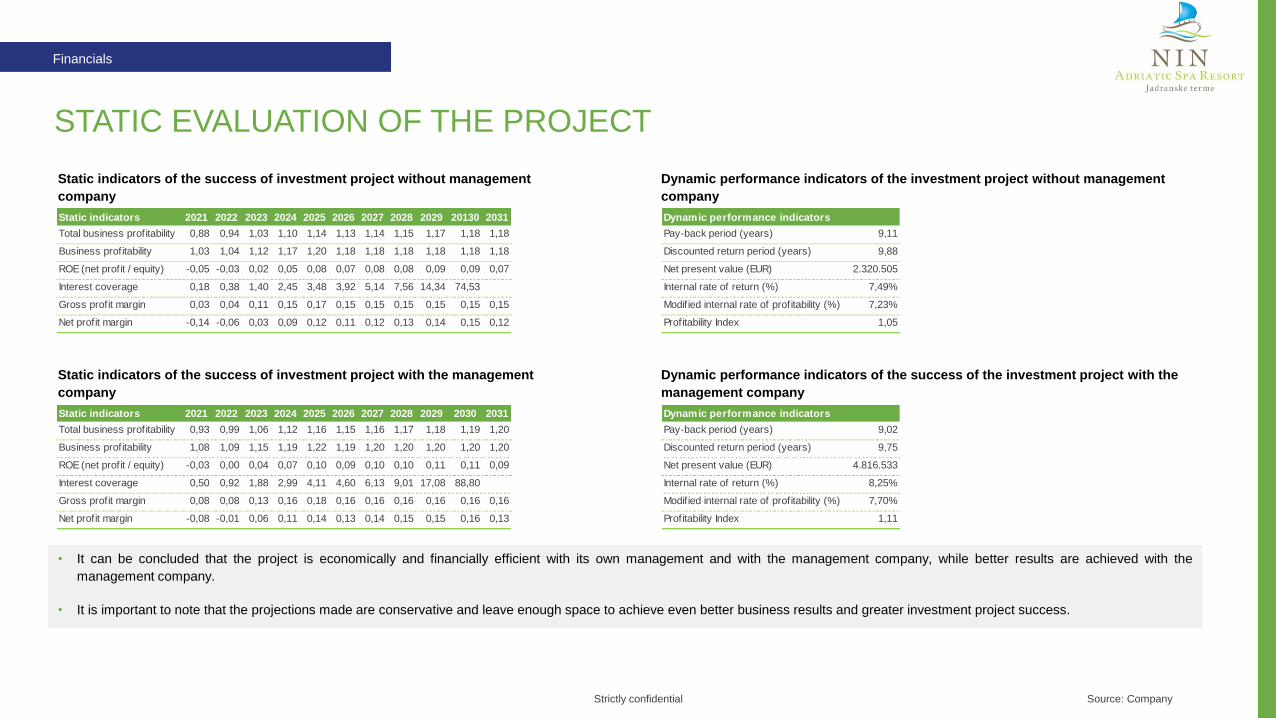
Static indicators of the success of investment project without management
company
Static indicators of the success of investment project with the management
company
• It can be concluded that the project is economically and financially efficient with its own management and with the management company, while better results are achieved with the
management company.
• It is important to note that the projections made are conservative and leave enough space to achieve even better business results and greater investment project success.
Dynamic performance indicators of the investment project without management
company
Dynamic performance indicators of the success of the investment project with the
management company
Static indicators 2021 2022 2023 2024 2025 2026 2027 2028 2029 20130 2031
Total business profitability 0,88 0,94 1,03 1,10 1,14 1,13 1,14 1,15 1,17 1,18 1,18
Business profitability 1,03 1,04 1,12 1,17 1,20 1,18 1,18 1,18 1,18 1,18 1,18
ROE (net profit / equity) -0,05 -0,03 0,02 0,05 0,08 0,07 0,08 0,08 0,09 0,09 0,07
Interest coverage 0,18 0,38 1,40 2,45 3,48 3,92 5,14 7,56 14,34 74,53
Gross profit margin 0,03 0,04 0,11 0,15 0,17 0,15 0,15 0,15 0,15 0,15 0,15
Net profit margin -0,14 -0,06 0,03 0,09 0,12 0,11 0,12 0,13 0,14 0,15 0,12
Static indicators 2021 2022 2023 2024 2025 2026 2027 2028 2029 2030 2031
Total business profitability 0,93 0,99 1,06 1,12 1,16 1,15 1,16 1,17 1,18 1,19 1,20
Business profitability 1,08 1,09 1,15 1,19 1,22 1,19 1,20 1,20 1,20 1,20 1,20
ROE (net profit / equity) -0,03 0,00 0,04 0,07 0,10 0,09 0,10 0,10 0,11 0,11 0,09
Interest coverage 0,50 0,92 1,88 2,99 4,11 4,60 6,13 9,01 17,08 88,80
Gross profit margin 0,08 0,08 0,13 0,16 0,18 0,16 0,16 0,16 0,16 0,16 0,16
Net profit margin -0,08 -0,01 0,06 0,11 0,14 0,13 0,14 0,15 0,15 0,16 0,13
Dynamic performance indicators
Pay-back period (years) 9,11
Discounted return period (years) 9,88
Net present value (EUR) 2.320.505
Internal rate of return (%) 7,49%
Modified internal rate of profitability (%) 7,23%
Profitability Index 1,05
Dynamic performance indicators
Pay-back period (years) 9,02
Discounted return period (years) 9,75
Net present value (EUR) 4.816.533
Internal rate of return (%) 8,25%
Modified internal rate of profitability (%) 7,70%
Profitability Index 1,11