projection of west virginia k-12 (0-19 years old) population
DESCRIPTION
Projection of West Virginia K-12 (0-19 Years Old) Population. Christiadi Bureau of Business and Economic Research College of Business and Economics West Virginia University. Presented at the: WEST VIRGINIA BOARD OF EDUCATION - PowerPoint PPT PresentationTRANSCRIPT
Projection of West Virginia K-12(0-19 Years Old) Population
Christiadi
Bureau of Business and Economic ResearchCollege of Business and Economics
West Virginia University
Presented at the:WEST VIRGINIA BOARD OF EDUCATION
Commission on School District Governance and Administration MeetingCharleston, WV March 27-28, 2014
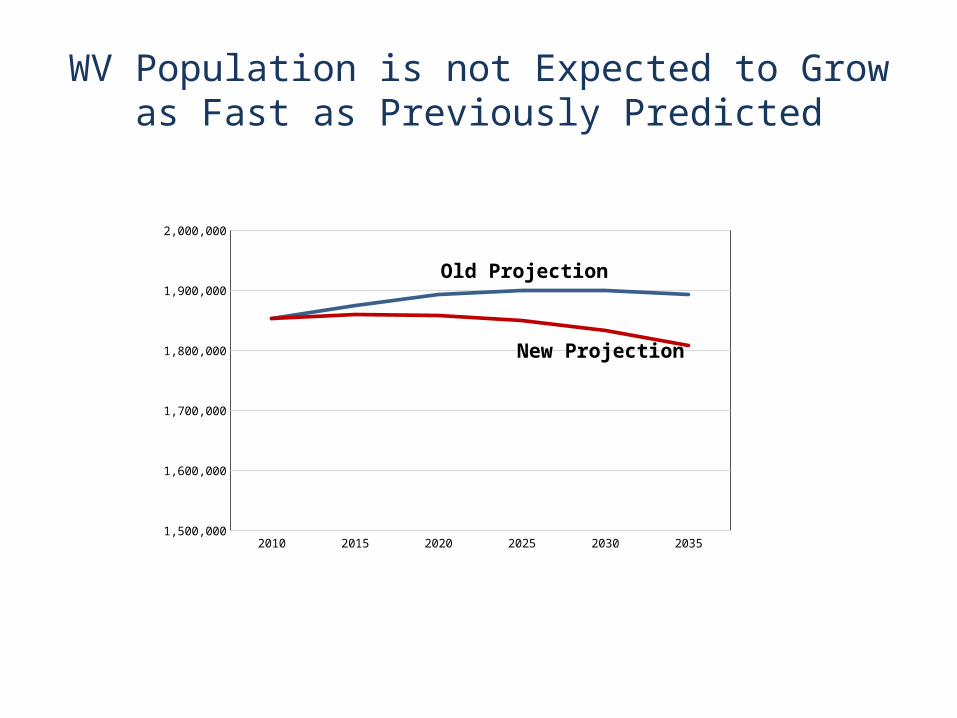
WV Population is not Expected to Grow as Fast as Previously Predicted
2010 2015 2020 2025 2030 20351,500,000
1,600,000
1,700,000
1,800,000
1,900,000
2,000,000
Old Projection
New Projection

WV population has always been among the oldest since 1970.
In 2010: WV median age = 40.5, 3rd in the nation. WV share of 65+ = 16.0 percent, 2nd in the nation.
Both the state and US population are aging. The path of aging, however, is different:
Between 2000 and 2010, the old & young population in the nation are both growing but the old is growing faster.
In the state, older population is growing while young population is declining.
WV vs. US Demographics
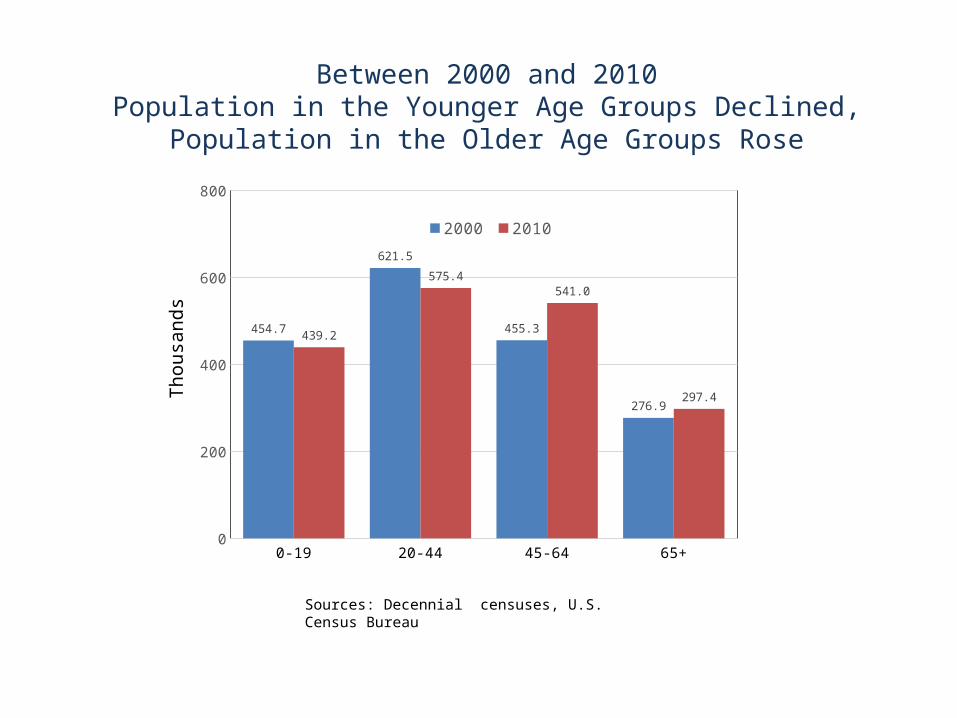
Sources: Decennial censuses, U.S. Census Bureau
Between 2000 and 2010Population in the Younger Age Groups Declined, Population
in the Older Age Groups Rose
0-19 20-44 45-64 65+0
200
400
600
800
454.7
621.5
455.3
276.9
439.2
575.4541.0
297.4
2000 2010
Thousa
nds
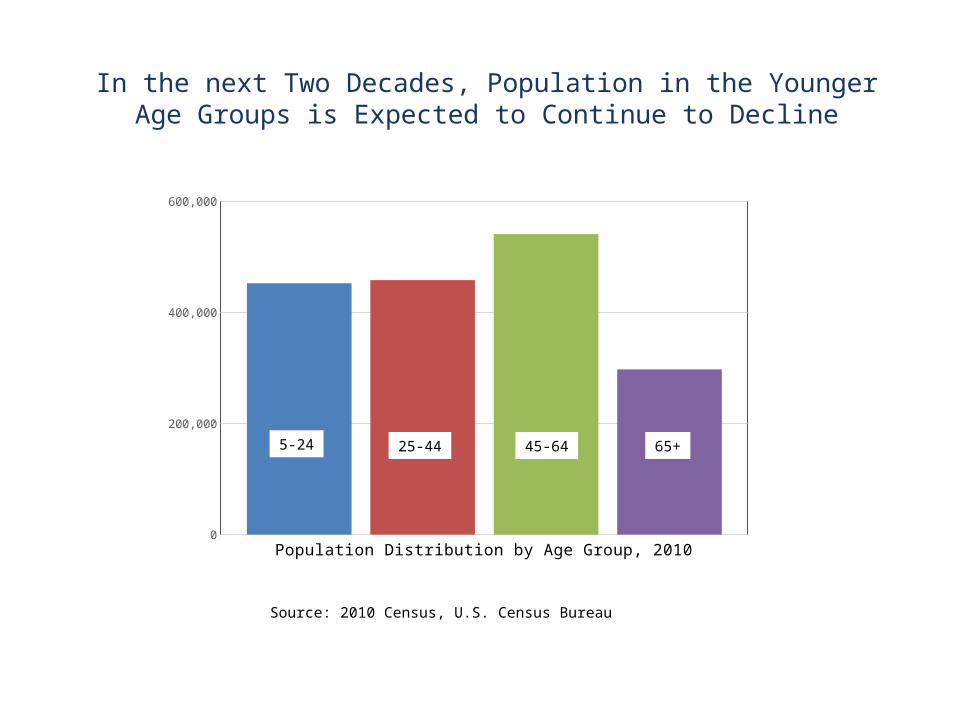
Population Distribution by Age Group, 20100
200,000
400,000
600,000
In the next Two Decades, Population in the Younger Age Groups is Expected to Continue to Decline
Source: 2010 Census, U.S. Census Bureau
5-24 25-44 45-64 65+
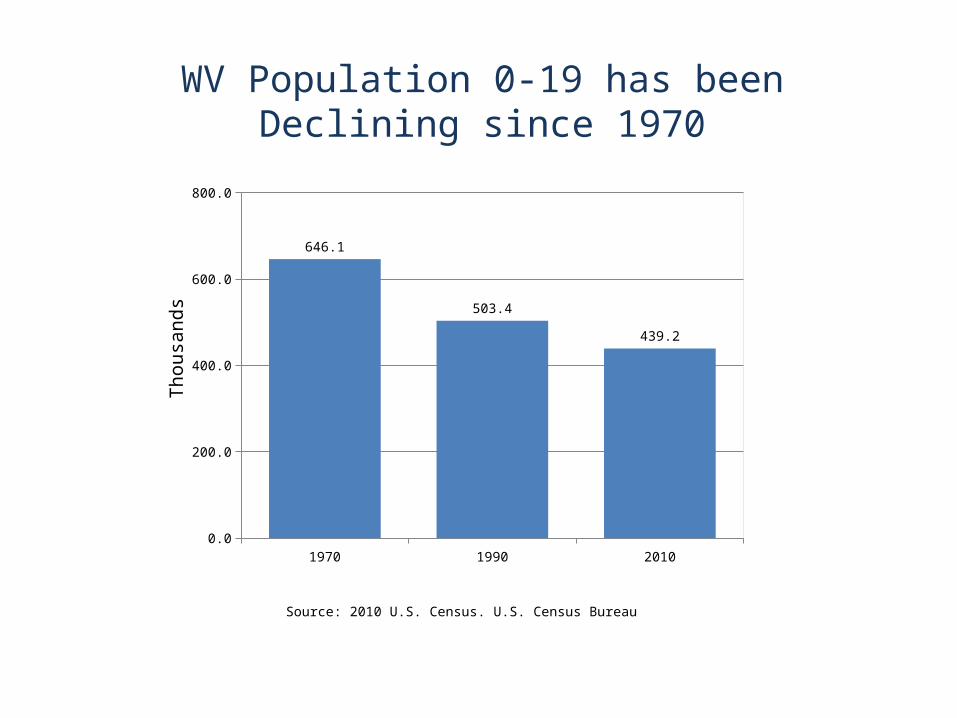
1970 1990 20100.0
200.0
400.0
600.0
800.0
646.1
503.4
439.2
WV Population 0-19 has been Declining since 1970
Source: 2010 U.S. Census. U.S. Census Bureau
Thousa
nds
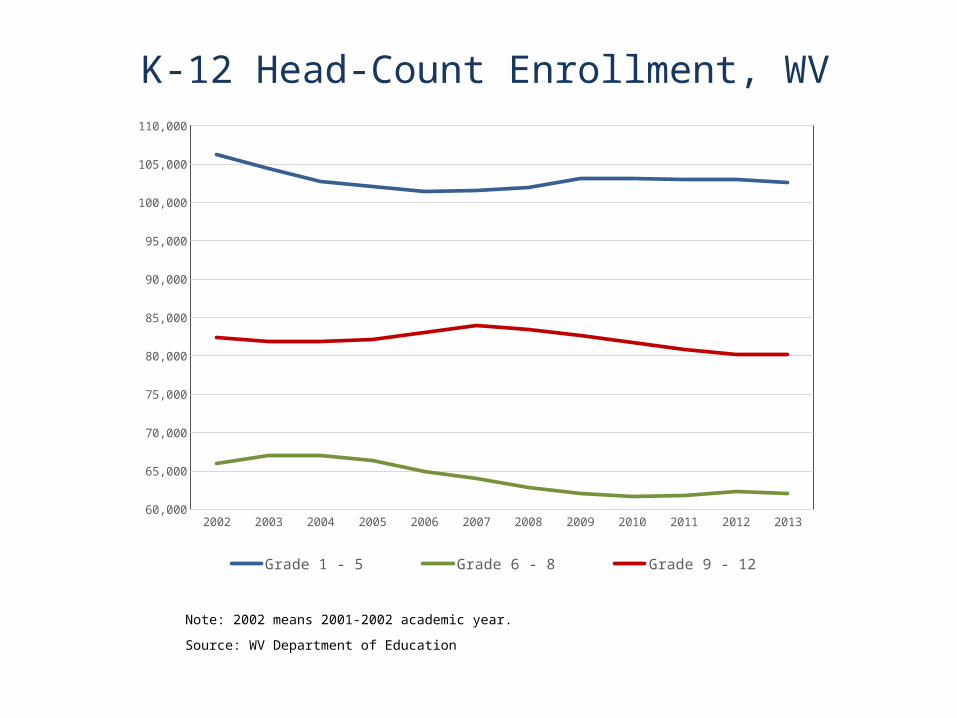
K-12 Head-Count Enrollment, WV
Note: 2002 means 2001-2002 academic year.
Source: WV Department of Education
2002 2003 2004 2005 2006 2007 2008 2009 2010 2011 2012 201360,000
65,000
70,000
75,000
80,000
85,000
90,000
95,000
100,000
105,000
110,000
Grade 1 - 5 Grade 6 - 8 Grade 9 - 12
2003 2004 2005 2006 2007 2008 2009 2010 2011 2012 2013 2014255000
260000
265000
270000
275000
280000
285000
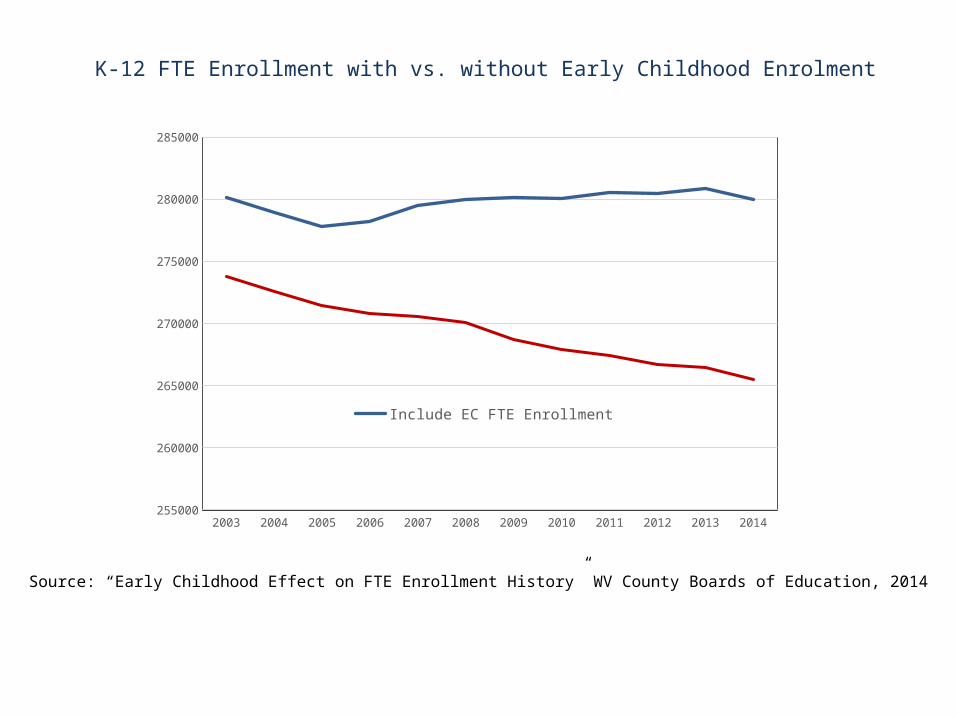
Include EC FTE Enrollment Exclude EC FTE Enrollment
Source: “Early Childhood Effect on FTE Enrollment History” WV County Boards of Education, 2014
K-12 FTE Enrollment with vs. without Early Childhood Enrolment
Gra
de-K
Gra
de-1
Gra
de-2
Gra
de-3
Gra
de-4
Gra
de-5
Gra
de-6
Gra
de-7
Gra
de-8
Gra
de-9
Gra
de-1
0
Gra
de-1
1
Gra
de-1
20.0
5.0
10.0
15.0
20.0
25.0
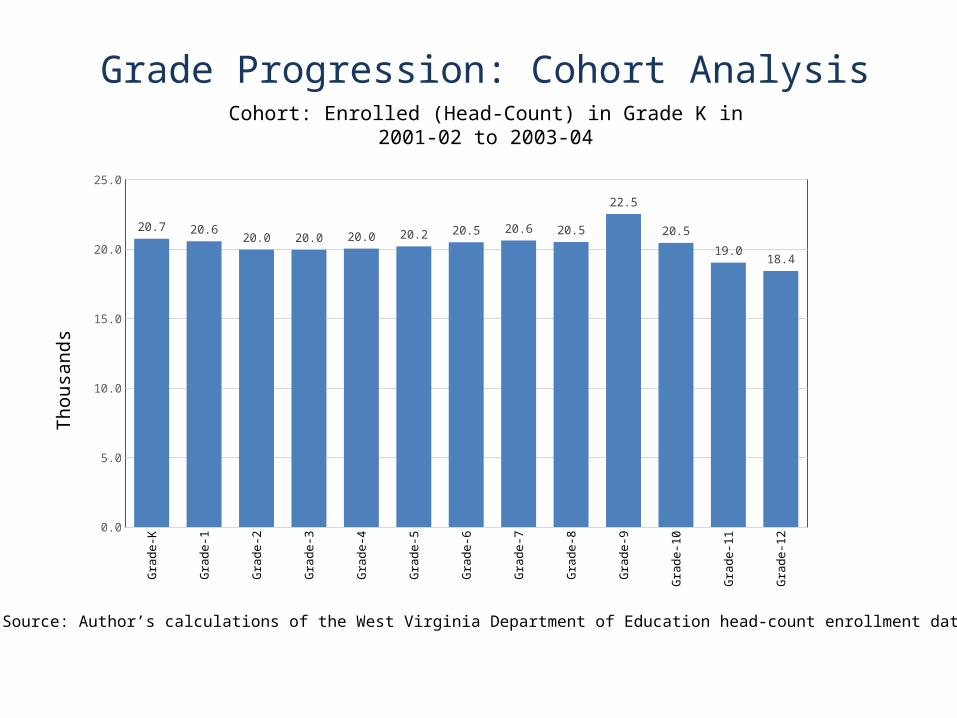
20.7 20.620.0 20.0 20.0 20.2 20.5 20.6 20.5
22.5
20.5
19.018.4
Source: Author’s calculations of the West Virginia Department of Education head-count enrollment data
Cohort: Enrolled (Head-Count) in Grade K in 2001-02 to 2003-04
Grade Progression: Cohort AnalysisThousa
nds

18-24 25+0.0
4.0
8.0
12.0
16.0
14.1
1.3
Estimated Population 18+ Enrolled in High School in 2011Thousa
nds
Source: Author’s calculations of the US Census Bureau’s 2012 American Community Survey data
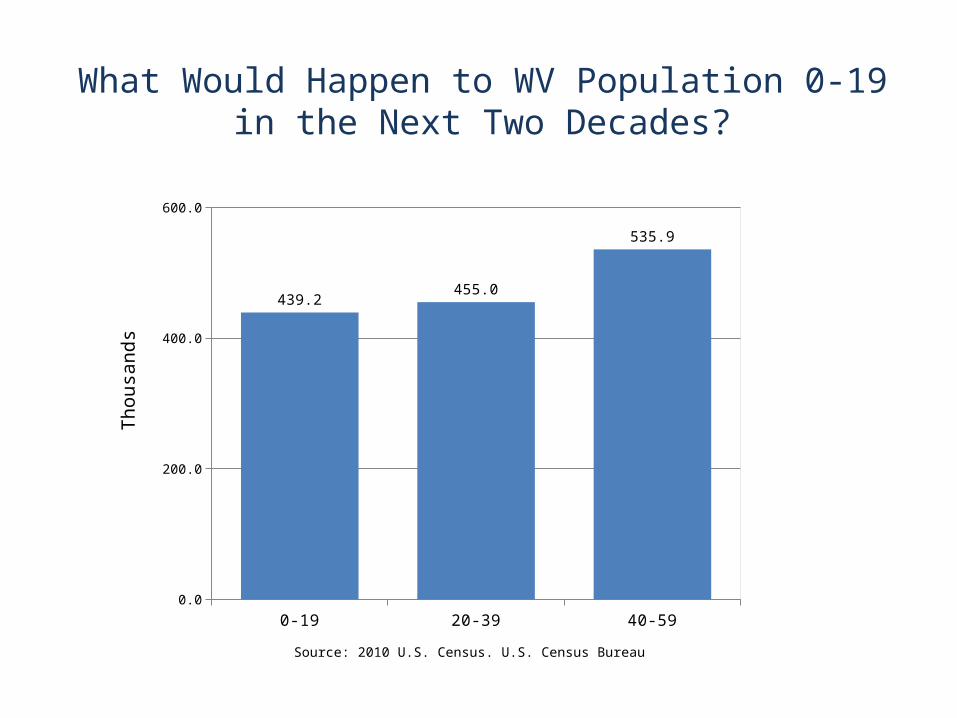
0-19 20-39 40-590.0
200.0
400.0
600.0
439.2455.0
535.9
Source: 2010 U.S. Census. U.S. Census Bureau
Thousa
nds
What Would Happen to WV Population 0-19in the Next Two Decades?

Source: 2010 U.S. Census. U.S. Census Bureau
Thousa
nds
What Would Happen to WV Population 0-19in the Next Two Decades?
Estimated births 2010-2029
0-19 20-39 40-590.0
200.0
400.0
600.0
?

Birth Rate The Number of Women at Child-
bearing Age (15-44) Migration
Factors Determining Population 0-19 in WV

General Fertility Rate, WV and the US
General Fertility Rate = Total Births per 1000 Women 15-44 Years of Age.
Sources: Decennial Censuses, U.S. Census Bureau and U.S. National Center for Health Statistics, National Vital Statistics Reports (NVSR) and the WV Bureau for Public Health, Health Statistics Center

19701972
19741976
19781980
19821984
19861988
19901992
19941996
19982000
20022004
20062008
201015000
20000
25000
30000
35000
WV-births WV-deaths
19701972
19741976
19781980
19821984
19861988
19901992
19941996
19982000
20022004
20062008
201015000
20000
25000
30000
35000
40000
45000
US-births (in 00) US-deaths (in 00)
Births and Deaths, WV vs. the US
West Virginia United States
Sources: U.S. National Center for Health Statistics, National Vital Statistics Reports (NVSR) and the WV Bureau for Public Health, Health Statistics Center.
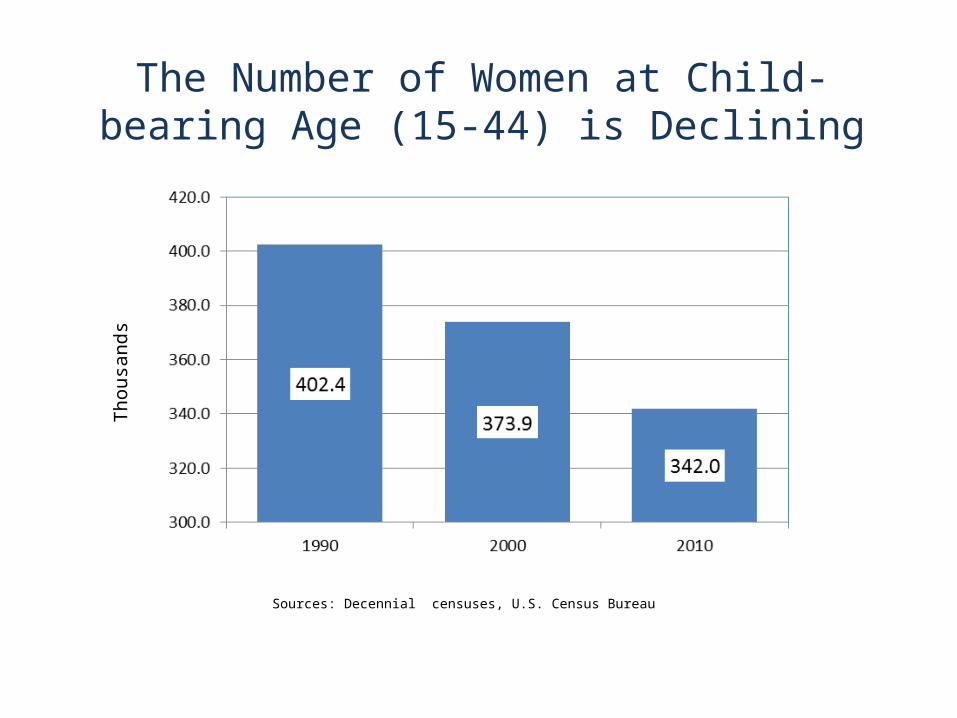
The Number of Women at Child-bearing Age (15-44) is Declining
Sources: Decennial censuses, U.S. Census Bureau
Thousa
nds
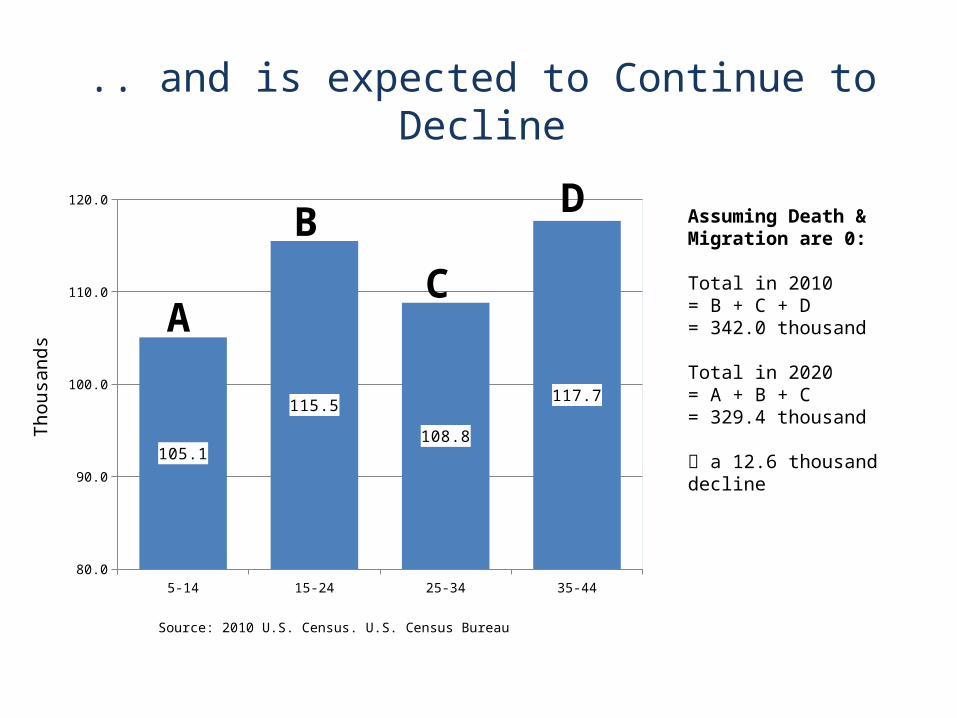
5-14 15-24 25-34 35-4480.0
90.0
100.0
110.0
120.0
105.1
115.5
108.8
117.7
Thousa
nds
.. and is expected to Continue to Decline
Source: 2010 U.S. Census. U.S. Census Bureau
Assuming Death & Migration are 0:
Total in 2010= B + C + D= 342.0 thousand
Total in 2020= A + B + C= 329.4 thousand
a 12.6 thousand decline
A
B
C
D
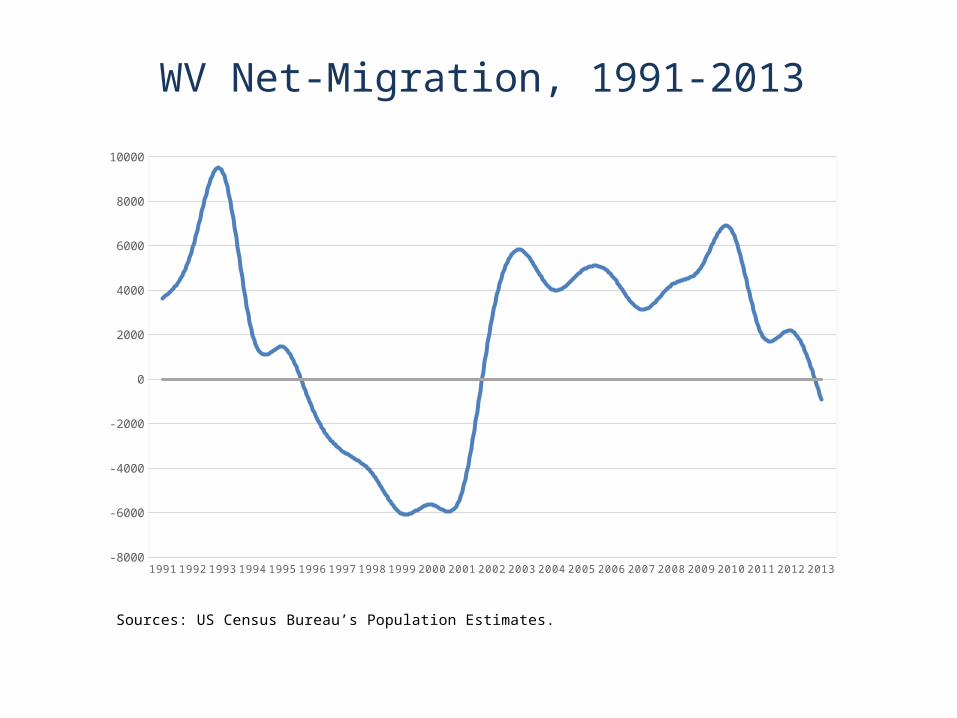
WV Net-Migration, 1991-2013
1991 1992 1993 1994 1995 1996 1997 1998 1999 2000 2001 2002 2003 2004 2005 2006 2007 2008 2009 2010 2011 2012 2013-8000
-6000
-4000
-2000
0
2000
4000
6000
8000
10000
Sources: US Census Bureau’s Population Estimates.
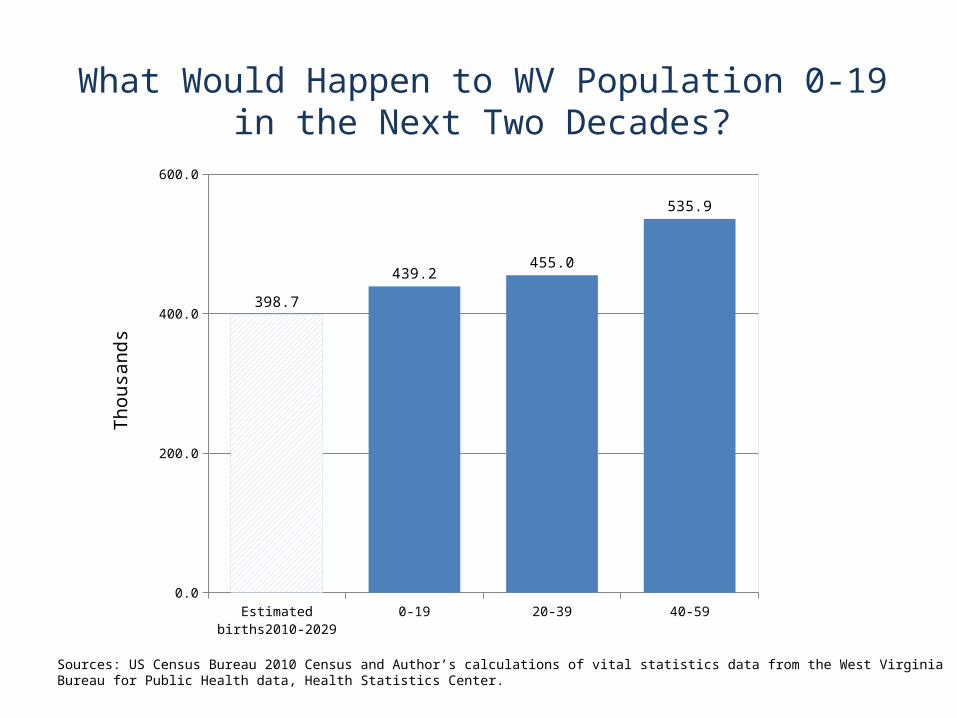
Sources: US Census Bureau 2010 Census and Author’s calculations of vital statistics data from the West VirginiaBureau for Public Health data, Health Statistics Center.
Thousa
nds
Estimated births2010-2029
0-19 20-39 40-590.0
200.0
400.0
600.0
398.7
439.2455.0
535.9
What Would Happen to WV Population 0-19in the Next Two Decades?

1970 1990 2010 20300.0
200.0
400.0
600.0
800.0
1000.0
800.1
539.3
425.0398.7
646.1
503.4
439.2 418.9
20 Year Accumulated Births Pop-0-19
Estimated Accumulated 2010-2029 Births vs.Population 0-19, WV
Thousa
nds
Sources: 2010 Census, U.S. Census Bureau and 2014 WV Population Projection, Bureau of Business and Economic Research
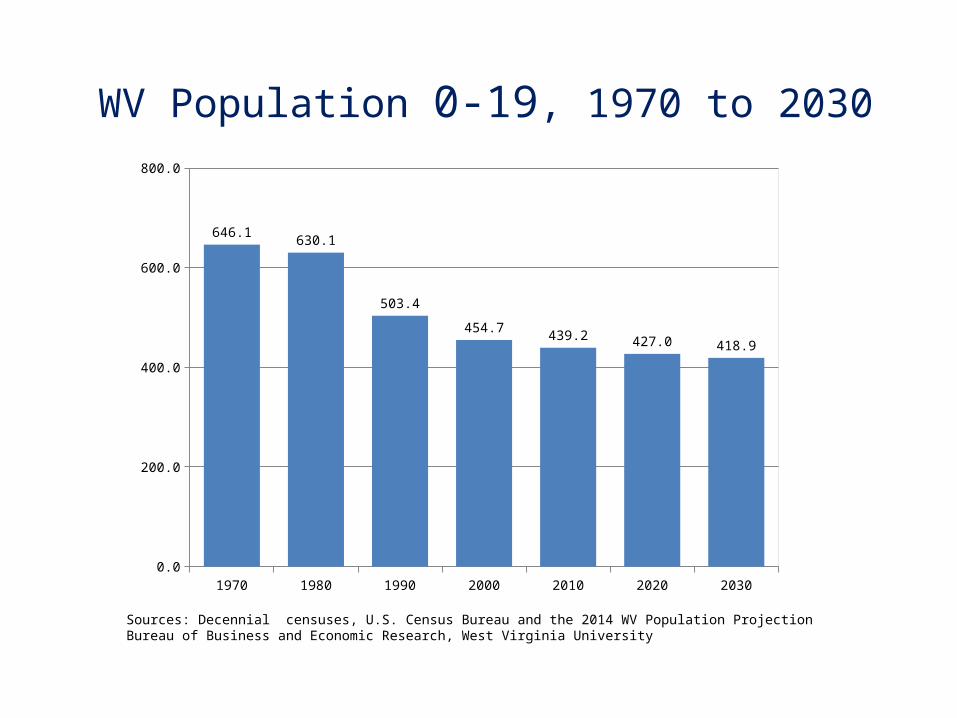
1970 1980 1990 2000 2010 2020 20300.0
200.0
400.0
600.0
800.0
646.1 630.1
503.4
454.7 439.2 427.0 418.9
WV Population 0-19, 1970 to 2030
Sources: Decennial censuses, U.S. Census Bureau and the 2014 WV Population ProjectionBureau of Business and Economic Research, West Virginia University
Randolph
Hardy
Kanawha
GreenbrierFayette
Preston
Grant
Raleigh
Pocahontas
Boone
Clay
Wayne
Nicholas
Roane
Logan
Mingo
Pendleton
Webster
Lewis
Braxton
Mason
Wood Ritchie
Tucker
Monroe
Lincoln
Mercer
Hampshire
Jackson
Wirt
Wyoming
McDowell
Tyler
Wetzel
Gilmer
Harrison
Upshur
Marion
Putnam
Mineral
Cabell
Barbour
Marshall Berkeley
Monongalia
Taylor
Ohio
Summers
Calhoun
Doddridge
Morgan
Jefferson
Pleasants
Brooke
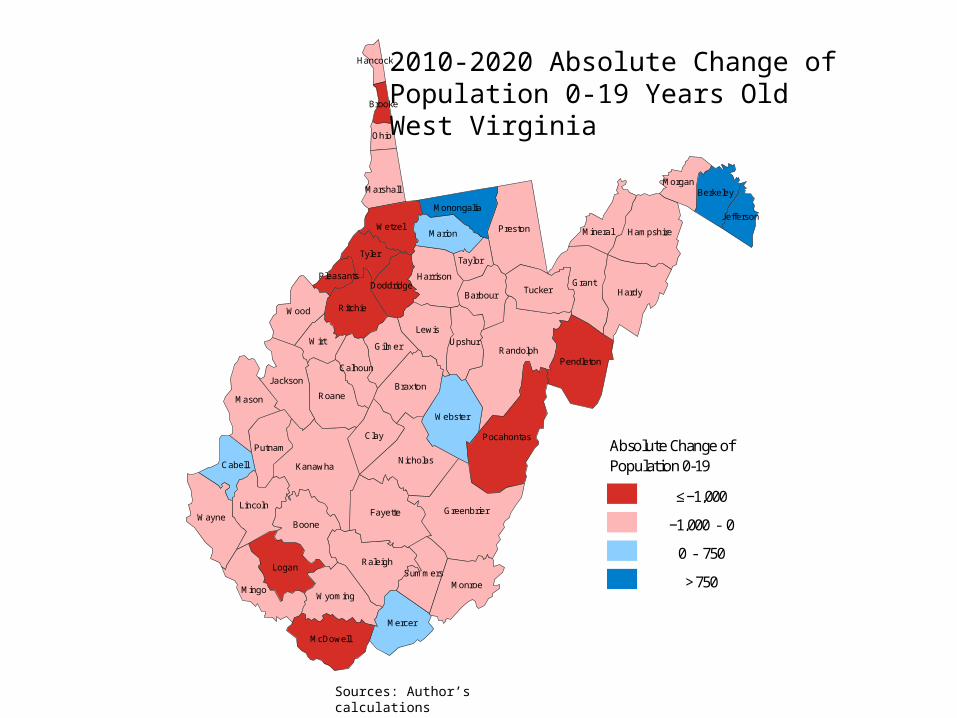
Hancock 2010-2020 Absolute Change of Population 0-19 Years OldWest Virginia
Absolute Change ofPopulation 0-19
> 750
≤ −1,000
−1,000 - 0
0 - 750
Sources: Author’s calculations

Randolph
Hardy
Kanawha
GreenbrierFayette
Preston
Grant
Raleigh
Pocahontas
Boone
Clay
Wayne
Nicholas
Roane
Logan
Mingo
Pendleton
Webster
Lewis
Braxton
Mason
Wood Ritchie
Tucker
Monroe
Lincoln
Mercer
Hampshire
Jackson
Wirt
Wyoming
McDowell
Tyler
Wetzel
Gilmer
Harrison
Upshur
Marion
Putnam
Mineral
Cabell
Barbour
Marshall Berkeley
Monongalia
Taylor
Ohio
Summers
Calhoun
Doddridge
Morgan
Jefferson
Pleasants
Brooke
Hancock 2010-2020 Percent Change of Population 0-19 Years OldWest Virginia
Sources: Author’s calculations
Absolute Change ofPopulation 0-19
> 750
≤ −1,000
−1,000 - 0
0 - 750

2010-20 Percent Change of Population0-19 Years Old by County, WV
Source: Author’s calculations
Mon
onga
liaBe
rkel
eyJe
ffer
son
Cabe
llW
ebst
erM
erce
rM
ario
nRa
leig
hPu
tnam
Har
dyFa
yett
ePr
esto
nG
reen
brie
rN
icho
las
Calh
oun
Mas
onU
pshu
rKa
naw
haSu
mm
ers
Tayl
orM
onro
eH
arri
son
Brax
ton
Tuck
erLe
wis
Clay
Gra
ntRa
ndol
phJa
ckso
nW
ood
Linc
oln
Ohi
oBo
one
Wir
tM
iner
alBa
rbou
rM
orga
nH
amps
hire
Min
goW
yom
ing
Han
cock
Way
neRo
ane
Mar
shal
lG
ilmer
Ritc
hie
Poca
hont
asPe
ndle
ton
McD
owel
lTy
ler
Wet
zel
Dod
drid
gePl
easa
nts
Loga
nBr
ooke
-25.0
-20.0
-15.0
-10.0
-5.0
0.0
5.0
10.0
15.0
20.0

WV population is aging
WV population 0-19 is declining as a result of: Baby boomers get older Decline in births Migration?
WV young population (0-19) is expected to continue to decline at least in the next decade
Maintaining K-12 enrollment will be a challenge
Counties with declining enrollment is expected to see continued decline in enrollment
Summary
For other questions on demographic issues in the state, contact: [email protected]