prolytic gasification of post-consumer polyolefins …...1 pyrolytic gasification of post-consumer...
TRANSCRIPT
1
PYROLYTIC GASIFICATION OF POST-CONSUMER
POLYOLEFINS TO GENERATE CLEAN-BURNING FUELS
A Thesis presented
by
Rasam Soheilian
to
The Department of Mechanical and Industrial Engineering
In partial fulfillment of graduation requirements in
Master of Science
in
Mechanical Engineering
In the field of
Thermofluids
Northeastern University
Boston, Massachusetts
May 2013

2
Copyright (©) 2013 by Rasam Soheilian
All rights reserved. Reproduction in whole or in part in any form requires the prior written
permission of Rasam Soheilian or designated representative.
3
Abstract
Utilization of post-consumer waste plastics as fuels is of technological interest since their energy
contents (heating values) are comparable to those of premium fuels. Pyrolytic gasification of
these solid polymers yields a mixture of predominately gaseous hydrocarbons and hydrogen.
This gaseous fuel mixture can then be suitably blended with air and burned in premixed flames.
Such flames are much less polluting than diffusion flames, which would have been generated had
the polymers been burned in their solid state. In this work an apparatus was designed and built to
continuously process polymers, in pelletized form, and to pyrolytically gasify them at
temperatures in the range of 800-900 ºC in N2 or CO2-containing environments. Subsequently,
the gaseous pyrolyzates were mixed with air, ignited and burned in a Bunsen-type burner.
Polyethylene fueled-flames had a violet/blue tint, whereas polypropylene-fueled flames were
blue with an orange surround. Both flames were fairly-steady and nearly-stoichiometric,
generating effluents with low CO/CO2 ratios. The combustion reactions released heat in a small
water boiler coupled to a miniature steam engine, which produced electricity illustrating the
feasibility of “clean” power generation from waste plastics. As pyrolysis of polyolefins requires a
nominal heat input that amounts to only a minuscule fraction of the heat released during their
combustion, large-scale implementation of this technique is deemed to be technologically viable
and economically favorable.
4
Acknowledgment
I would like to thank my academic advisor, Dr. Yiannis A. Levendis for his help and
guidance which helped me to solve problems. I would like to thank Chuanwei Zhou (PhD
candidate), his help, assistance and experience kept the project on track; Andrew Davies and
Saber Talebi for their support and help on this project as my co-workers; Mehdi Abedi for his
help and guidance on modeling issues that I had which I am really thankful for, and The
Northeastern University machinist Jonathan Doughty for his tremendous help in machining.
Finally, I want to thank my parents for all of their support throughout my life.

5
CONTENTS
Abstract ……………………………………………………………. 3
Acknowledgment ……………………………………………………. 4
Contents ……………………………………………………………. 5
Appendixes ……………………………………………………………. 7
List of Figures …...………………………………………………. 8
List of Tables …...………………………………………………. 10
Chapter 1 (Introduction) ……………………………………………. 11
1.1 Introduction …………………………………………………… 11
Chapter 2 (Experimental Apparatus) …………………………………… 17
2.1 Experimental Apparatus …………………………………… 17
2.2 Characteristics of Polyolefin Feedstocks …………………… 22
2.3 Experimental Procedure …………………………………… 23
Chapter 3 (Results and Discussion) …………………………………… 27
3.1 Results and Discussion …………………………………… 28
3.2 Numerical Simulation …………………………………… 30
3.3 Combustion Effluent Analysis ………………………………… 32
6
3.4 Replacement of Nitrogen Background Gas with Carbon Dioxide … 34
3.5 Conversion of Post-Consumer Plastics to Electricity Proof of Concept
……………………………………………………………. 35
3.6 Economic Considerations …………………………………… 35
3.7 Self Sustaining Power Plant Efficiency Calculations ..………… 37
3.8 Future Consideration …………………………………… 38
Appendix I ……………..….………………………………………. 40
Appendix II …………………………………………………………. 45
Appendix III ………..……………………………………………….. 49
Appendix IV ………..……………………………………………….. 52
References ………..……………………………………………….. 53

7
Appendixes
Appendix I
Required amount of polymer feedstock to operate the Pyrolytic Gasifier without external heating.
Appendix II
Calculation of Self-Sustaining Power Plant Efficiency s
Appendix III
Thermocouple temperature measurement correction for radiation effects.
Appendix IV
Economic Analysis

8
List of Figures
Chapter 1
F-1.1 Direct combustion of post-consumer plastics generates acrid smoke containing
condensed-phase and gas-phase hazardous pollutants. 10
F-1.2 Melting of different plastics (PE, PP and PS) on a stainless steel plate 14
Chapter 2
F-2.1 Laboratory-scale pyrolytic gasification apparatus designed and constructed for the needs
of this study: (a) two dimensional schematic detailing the apparatus architecture and (b)
photograph of the actual system. 18
F-2.2 Pressure holding capability of the furnace tube with time at T=850°C. An initial pressure
of P=.68 atm (10 psi) was applied. 19
F-2.3 Gas temperature gradient at different elevations of the pyrolysis chamber at a furnace set-
point of 950˚C. 20
F-2.4 One-gram quantities of pelletized post-consumer LDPE (left) and PP (right) used in this
work. 22
F-2.5 Feeding characteristics of low density polyethylene (LDPE) polypropylene (PP) pellets
used in this work 23
F-2.6 Demonstration of melting and dripping of polyolefins through the perforated plates used
in the pyrolytic gasifier. 25
Chapter 3
F-3.1 Comparison plot for the effluent of pyrolytic gasification of PE and PP at 900˚C. 29
F-3.2 Nominally-premixed flames of (a) natural gas, (b) PE pyrolyzate gases, (c) PP pyrolyzate
gases. 30
9
F-3.3 Results of numerical analysis (using ANSYS-Fluent) where gas velocity vectors and
contours of static temperature are shown in the pyrolysis chamber. 31
F-3.4 Experimentally-determined CO2/CO vs. equivalence ratio at various furnace set-point
temperatures, with N2 as the carrier gas. 33
F-3.5 The miniature steam engine in action powered by combustion of pyrolyzates of post-
consumer polyethylene in a small burner. The coupled electricity generator powers the
light bulb. 35
F-3.6 Scheme for recirculating CO2 and N2 back in the system 38
Appendixes
Fig. A1 Schematic Picture of Insulation Thickness and Length (Units: inch) 41
Fig. A2 Relation Between the Self-Sustaining Efficiency ηs and the Feeding rate. 46

10
List of Tables
Chapter 3
Table. 3.1 The composition of the effluent of pyrolytic-
gasification of PE and PP at 900 oC. 28
Table. 3.2 Average mole fractions of carbon dioxide and carbon monoxide in the
combustion effluent of PE, along with computed standard deviations . 34
Table. 3.3 List of expenses for scaling up the system. 37
Appendixes
Table A2.1- Comparison between corrected and uncorrected temperature readings. 51
Table A2.2-Costs for scaling up the system. 52
11
Chapter One
(Introduction)
1.1 Introduction
As their resources are finite, it is expected that fossil fuels will become scarce and costly at some
point in the future. To ensure energy sustainability, it is thus imperative not only to improve the
efficiency of energy use but, also, to identify and develop technologies for harnessing alternative
energy sources. Readily-available alternative fuels can be found in municipal/industrial recycling
and waste streams. Nearly 5% of the yearly US petroleum consumption is used to produce
plastics, amounting to approximately 30 million tons [1]. In most applications, plastics are
discarded upon-use. A small fraction (7%) of the discarded plastics are recycled [2], however, as
plastics are degraded upon usage, there are limited markets for the recycled materials. In fact,
most post-consumer plastics end up in landfills or generate ubiquitous litter. As they are non-
biodegradable, they generate a long-term solid waste issue. Direct combustion of post-consumer
plastics in waste incinerators releases their stored internal energy (heating value), which is
comparable to those of premium fuels [3]. However, conventional direct combustion leads to
diffusion flames, forming around the devolatilizing solid plastics, which generate large amounts
of health-hazardous soot, poly-cyclic aromatic hydrocarbons (PAH) and other pollutants.
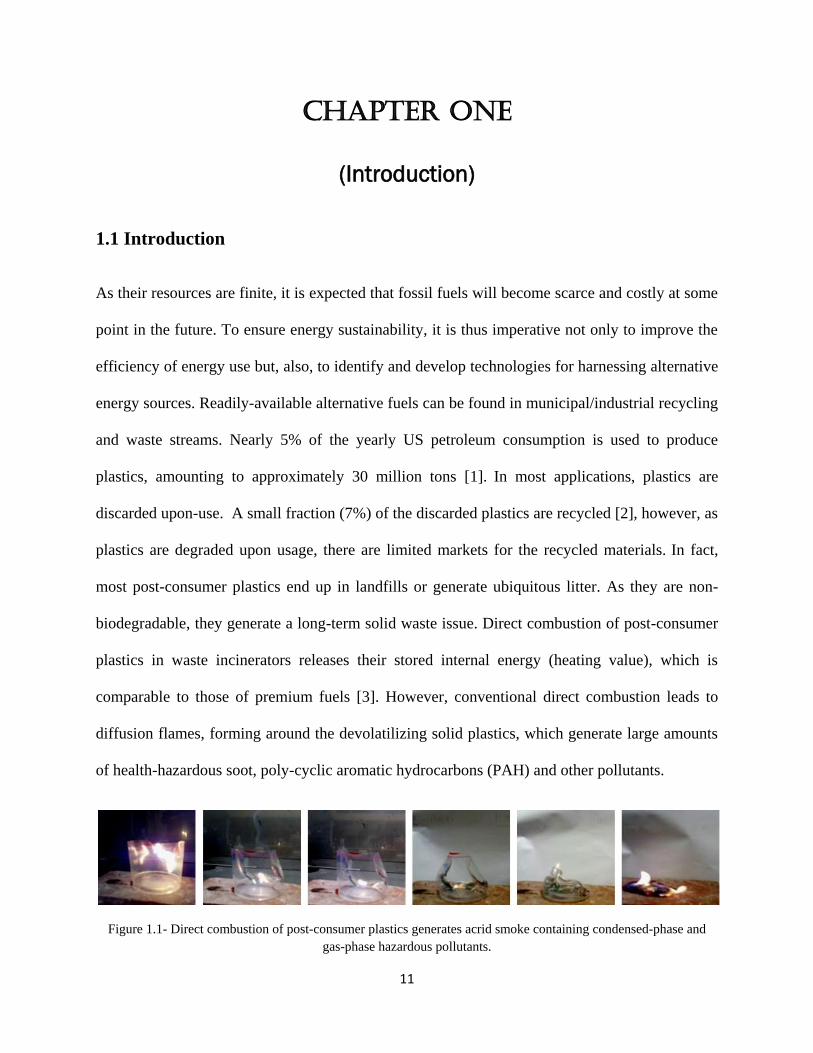
Figure 1.1- Direct combustion of post-consumer plastics generates acrid smoke containing condensed-phase and
gas-phase hazardous pollutants.
12
An alternative indirect combustion technique was followed in this work, which called for a two
step process: pyrolytic gasification of the solid polymers, followed by premixed combustion of
the gaseous pyrolyzates with air. Such conditions afford effective mixing of gaseous fuel
compounds with oxygen and can generate low emissions of pollutants [4-7]. In fact, Goncalves
et al. [6] reported that indirect homogeneous combustion of PE pyrolyzates released 10 times
lower polycyclic aromatic hydrocarbons (PAH) and particulates than direct combustion of the
same polymer, at similar furnace operating conditions.
Indirect combustion of the plastics (pyrolytic gasification followed by combustion of the
pyrolyzate gases) is technically attractive, as Jinno et al. [8,9] reported values for the heat of
pyrolysis of PE and that of PP that are well-under 1 MJ/kg. Even after accounting for the higher
temperatures encountered in pyrolytic gasification herein than those in the aforementioned work,
the heat of pyrolysis of polyolefins is less than 2 MJ/kg, see Appendix 1. Comparing this value
to the heating values (energy contents) of polyolefins, which are in range of 44 - 46 MJ/kg, it
becomes evident that only a small fraction of the heat released during combustion will be needed
to be fed back to pyrolytically gasify them. Therefore, a gaseous fuel stream may be produced
from waste polymeric feedstocks by implementing a heat integration, where only a small penalty
in energy, and thus in the operating cost of a power plant, will be encountered in running the
gasifier. Based on this principle, this study developed and tested a process that accepts post-
consumer plastics and releases their internal energy through environmentally-benign indirect
combustion [4-7]. The feasibility of this process has been proven using polyolefins, the most
voluminous commercial plastics.
Polyolefins is the collective description for plastics types that include polyethylene - low density
polyethylene (LDPE), linear low density polyethylene (LLDPE) and high density polyethylene
13
(HDPE) - and polypropylene (PP). Polyolefins are polymers produced from simple olefins (also
called alkenes with the general formula CnH2n) as monomers. They are produced from oil or
natural gas by polymerization, where short chains of chemicals (monomers) are joined in the
presence of a catalyst to make long chains (polymers). Polyolefins are solid thermoplastics that
can be processed in two ways – by film extrusion or molding. Because of their versatility, low
cost, inertness and excellent chemical resistance, polyolefins are the most popular plastics in use
today. Together they account for nearly half of Europe’s total generation of 24 million tones and
USA’s generation of 30 million tons of all plastics each year [23,24] Applications include: (a)
LDPE: cling film, stretch film, industrial packaging film, carrier bags, agricultural film, milk
carton coatings, electrical cable coating, heavy duty industrial bags, stretch film, industrial
packaging film, thin walled containers, and heavy-duty, medium- and small bags. (b) HDPE:
crates and boxes, bottles (for food products, detergents, cosmetics), food containers, toys, petrol
tanks, industrial wrapping and film, pipes and house ware. (c) PP: food packaging, including
yoghurt, margarine pots, sweet and snack wrappers, microwave-proof containers, carpet fibers,
garden furniture, medical packaging and appliances, luggage, kitchen appliances, and pipes.
Polyethylene (PE), either as high-density (HDPE) or low-density (LDPE), starts decomposing at
290C by scission of weak links and progressively by scission of tertiary carbon bonds or
ordinary carbon bonds in the beta position to tertiary carbons [10]. Extensive weight loss is not
observed until 370C is reached. The main products of its decomposition are: an oil/wax product
dominated by alkenes, alkynes, and alkadienes; a gas consisting mainly of alkanes and alkenes;
and negligible char [4,19]. The monomer precursor ethylene (ethene) is only one of many
constituents of the volatile primary products. For instance, there is also formation of aromatic
species such as benzene and toluene. As the temperature of pyrolysis increases, gaseous products
14
are favored. Extensive work by Conesa and co-workers [7,11] examined the effects of the
polyethylene type, the effects of polymer branching, the effects of batch versus continuous
operation, as well as the effects of the influence of the heating rate on the decomposition yields.
They found variations in both the yields and the composition of the pyrolyzates, with branched
PE yielding 91.8% gas with a higher aromatic content, and less branched PE yielding 97.5% gas
with lower aromatic content, both at 800C. These results are in good agreement with those of
Scott et al. [14] and Kaminsky [12]. Westerhout et al. [13] found that, at 800C, the product
contains more methane than ethylene and low amounts of aromatics and, most importantly, they
determined that the type of pyrolyzed PE, i.e., LDPE or HDPE, had no significant influence on
the product spectrum produced. The effect of the residence time and the temperature of pyrolysis
on the products distribution were studied by Mastral et al. [15] in two free-fall reactors, placed in
series. Their experiments showed that up to 700°C the main products obtained were waxes and
oil fractions; and that the gas yield increased as the temperature increased. The generation of
aromatics was reported to be significant at 800°C and showed an increasing trend with
temperature and residence time. The main compounds in the gas fraction were hydrogen,
methane and acetylene at temperatures up to 1000°C. Longer residence times led to a more
intense cracking of the aliphatic fractions, and the methane and ethylene yields increased
significantly.
Polypropylene (PP), having every other carbon in the main chain as a tertiary carbon is prone to
attack [10]; this lowers the stability of PP as compared to PE. Polypropylene starts decomposing
at 230C by chain scission and chain transfer reactions [10]; volatilization becomes significant
above 300C.

15
Exploratory experiments were conducted in the laboratory to observe the decomposition
behavior of common polymers [25]. To conduct these experiments, pellets were placed in a
stainless steel crucible and were heated by a Bunsen burner flame. A thermocouple was placed in
the fixed bed of particles to monitor temperature, see Fig. 1.2. As the temperature of the bed
increased the plastic pellets softened and melted. Polystyrene melted readily in the neighborhood
of 250 C, polyethylene at a little higher temperature, and polypropylene at yet a higher
temperature. At 300 C all three plastics were found in a liquefied molten state.
Figure1.2- Melting of different plastics (PE, PP and PS) on a stainless steel plate [25]
Polyethylene
Polystyrene
Polypropylene

16
High temperature pyrolysis of PE and PP generates a mix of light hydrocarbon gases, including
methane, ethylene, propylene, butylene, etc. [6,11,13,17,18] and hydrogen [26].
This experimental study aims at demonstrating that a high-energy-content gaseous fuel can be
produced from post-consumer polyolefin feedstocks and can be burned in an environmentally-
benign manner, akin to natural gas, for power generation, process heat or other energy-related
applications. A laboratory-scale system was designed and constructed to pyrolytically gasify
pelletized polymers, at steady-state steady-flow conditions, and to generate a combustible
gaseous fuel and burn it in a miniature steam engine to generate electricity. An energy balance
analysis was performed to assess the net thermal energy output of such process, per unit mass of
waste plastics input to the system. Pyrolytic gasification took place in both N2 and CO2 carrier
gases. The reason being that, whereas N2 has to be purposely procured through a cryogenic
process and is thus costly, a mixture of N2 and CO2 gases can be readily obtained at no cost by
taping to the exhaust effluent of a combustion process. In fact a slipstream of the effluent of the
very same combustion process can be used to supply the pyrolyzer. There may be other
additional benefits to using CO2 as the work of Yamada et al. (16) has shown in the catalysis-
aided reforming of the pyrolyzates of PE to CO and H2 at 950 ˚C.

17
Chapter two
(Experimental Apparatus)
2.1 Experimental Apparatus
A laboratory-scale pyrolytic gasifier system has been designed and constructed to accept
granulated plastics, and sequentially liquefy and gasify them. The gaseous pyrolyzates are then
mixed with air and burned in a nominally-premixed burner. For demonstration purposes, the
burner is also coupled with a miniature steam generator and steam engine setup to produce
electricity (Wilesco D18). The pyrolytic gasifier is shown in Figure 2. Its major components are
a feedstock storing and feeding system and a heating chamber. The feeding system incorporates
a reservoir with a hopper where pelletized polymers are stored, an electric motor, and an
auger/feeding box. Pellets are gravity- fed from the reservoir through the hopper. The variable-
speed electric motor (Leeson Corp. model 985.613F, 8.7 N-m peak torque, 0 – 94 RPM,
continuous duty) drives the horizontally-oriented auger which carries the pellets from the feeding
box to a vertical purge chamber leading to the furnace. The rotating auger uses a sealed bearing
to minimize leakage from the system and, thus, maintain the pressure of the inert carrier gas.
The furnace chamber is defined by a stainless steel tube, whose dimensions are designed to
provide sufficient space for the expansion of a targeted flow rate of polymers upon gasification.
The furnace is heated by electrical resistance elements (ATS Series 3110), rated at 1.43 kW. The
furnace is connected to a proportional integral derivative (PID) loop temperature controller (ATS
Series XT16). This is a feedback controller and it computes the error value based on the
difference between the measured variable and a desired set-point; subsequently, it minimizes the
18
error by varying the inputs. This allows for precise and reliable regulation of system temperature
at any desired set point. The speed of the electric motor that drives the polymer feeding system is
adjusted to obtain the desired mass flow rate of plastic pellets. The direct-drive motor and
screw-type auger system provide a linear relationship between feeding rate and motor speed
(RPM).
Asymmetrically-perforated disks have been inserted at several vertical locations in the tubular
furnace to intercept the falling polymer pellets and facilitate their sequential melting and
gasification. In this manner the particles gasify in the radiation cavity of the furnace, instead of
settling at its cooler bottom. In addition to this feature, the gas exit tube in the chamber is
elevated from the bottom, to prevent its plugging by settling tars, and it is protected by a conical
roof to prevent impingement of any falling molten polymer ligaments. Furthermore, the system
is fitted with two relief valves, to avoid over-pressuring.
The most leak-prone connections in the system are flanges inserted between the gasification and
the purging chambers. High-temperature gaskets (THERMA-PUR style 4122 corrugated metal
gasket, manufactured by Garlock Sealing Technologies) have been used for sealing the flanges.
The system was tested by pressurization, the pressure was turned off and the gradient of the
pressure drop with time is shown in Fig. 2.1. The flange bolts were tightened to 45 N-m (400 in-
lb) and the set pressure was 68.9 kPa (10 psi). The relief valves (rated at 234 kPa/34 psi) were
tested at both STP and 850 °C operating conditions. Maintaining a tight seal on the system is
essential to minimizing the amount of carrier gas and pyrolyzate gas losses through overboard
leakage.

19
Figure 2.1- Laboratory-scale pyrolytic gasification apparatus designed and constructed for the needs of this study:
(a) two dimensional schematic detailing the apparatus architecture and (b) photograph of the actual system.

20
Figure 2.2- Pressure holding capability of the furnace tube with time at T=850°C.
An initial pressure of P=.68 atm (10 psi) was applied.
A typical centerline gas temperature distribution in the furnace, as measured by a type-K
thermocouple (Omega) is shown in Fig. 2.2. In this case, the controller set-point was set to
maintain a constant wall temperature of 950 °C. Temperature measurements were taken at each
of the perforated disks in the chamber in order to gauge the uniformity of the heater. The
temperature gradient plateaued in the bottom-half of the chamber, where the maximum
temperatures prevailed.

21
Figure 2.3- Gas temperature gradient at different elevations of the pyrolysis chamber at a furnace set-point of 950˚C.
As mentioned before, it has been previously reported (8) that the yield of gas from pyrolysis of
PE increases with temperature; it only accounts for 5.7 wt% at 500 °C, reaches a maximum of
96.5 wt% at a Tpyrolysis = 800 °C, and slowly decreases with increasing temperature thereafter.
Therefore, a gas temperature of 800 °C was chosen in this work to maximize the yield of gaseous
PE pyrolyzates, while minimizing the generation of tars and oils. To account for heat losses
throughout the system, the furnace controller set-point was raised to the range of 900-950 °C to
ensure an average gas temperature of 800 °C in the pyrolysis chamber.
22
As mentioned before, it has been previously reported (8) that the yield of gas from pyrolysis of
PE increases with temperature; it only accounts for 5.7 wt% at 500 °C, reaches a maximum of
96.5 wt% at a Tpyrolysis = 800 °C, and slowly decreases with increasing temperature thereafter.
Therefore, a gas temperature of 800 °C was chosen in this work to maximize the yield of gaseous
PE pyrolyzates, while minimizing the generation of tars and oils. To account for heat losses
throughout the system, the furnace controller set-point was raised to the range of 900-950 °C to
ensure an average gas temperature of 800 °C in the pyrolysis chamber.
2.2 Characteristic of Polyolefin Feedstocks
The two polyolefin polymer feedstock materials used in this study were low density polyethylene
(LDPE) with a chemical formula of (C2H4)n, and polypropylene (PP) with a chemical formula of
(C3H6)n. High density polyethylene (HDPE) was not included in this study since it has been
previously reported to decompose in a fashion similar to that of LDPE [11]. Commercially
available post-consumer plastics in pelletized form were obtained by a local supplier and used in
these experiments. LDPE has a density range of 0.91-0.94 g/cm3, whereas PP has a density range
of 0.86-0.95 g/cm3. LDPE can be heated up to 80 °C continuously and 95 °C for a short time. PP
has a melting point range from 130 to 171 °C. PP also has crystallinity between LDPE and
HDPE. One gram quantities of the LDPE and PP polymers used in this study are shown in Fig.
2.4.

23
Figure 2.4: One-gram quantities of pelletized post-consumer LDPE (left) and PP (right) used in this work.
2.3 Experimental Procedure
In each experiment, the pelletized polymers were loaded into the hopper and the feeding system
was sealed. The carrier gas is N2 or CO2 at a flowrate of 1 lpm. These gases were used to purge
the air out of the system and to ensure oxygen-free pyrolysis. Thereafter, the polymer pellets
were introduced to the system at a targeted feeding rate. Typical plots of the feeding mass of
pellets with time are shown in Fig. 2.5. To obtain this data, the feeding system was detached
from the pyrolysis apparatus and was setup in a bench top style experiment, with a calibrated
mass balance (Mettler AE50) positioned to catch and measure the output. The hopper was
loaded with plastic pellets and the drive motor was run at constant speed, with manual data
readings taken every 5 seconds. The plots shown in Fig. 2.5. demonstrate fairly linear overall
rates of pellets in the broad neighborhood of 1 g/min.

24
Figure 2.5- Feeding characteristics of low density polyethylene (LDPE) polypropylene (PP) pellets used in this
work.

25
In all subsequent experiments the feeding rate of solid pelletized polymers in the furnace was set
at 1 g/min, based on experimentally-determined repeatable steady-state operation of the feeder.
This value also matched the capacities of two nominally premixed-flame burners used in this
work, a Bunsen burner and a rectangular burner (measuring 2 x 14 cm) supplied with the
miniature steam engine (Wilesco D18). In this regard, the capabilities of both burners were
tested using bottled ethylene gas (which has been identified as a major pyrolyzate of the
polyolefins). Since the ratio of the volume of solid polymer to the volume of gaseous ethylene
pyrolyzate is inversely proportional to the ratio of their respective densities (e.g., ρsolid PE =940
kg/m3 and ρethylene = 1.178 kg/m
3), the equivalent mass flowrate of ethylene gas to match the
mass flowrate of the 1g/min of polymer pellets was determined to be 830 cm3/min. This flowrate
of ethylene produced steady flames of appropriate intensity for the operation of the miniature
engine.
Additional experiments were also conducted to explore the effect of the carrier gas (N2) on the
flammability and stability of the flames. The motivation being, that reduced inert gas flowrates
are economically advantageous. Experiments were conducted at the aforementioned ethylene gas
flow rate of 0.83 lpm and inert nitrogen flowrates varying by a threefold. These experiments, in
agreement to other pertinent experiments elsewhere [20], showed that the addition of various
amounts of nitrogen inert gas did not significantly affect the flammability of the ethylene gas in
the nominally-premixed burners used herein [21].
The pyrolytic gasification chamber contained five perforated steel plates, placed at different axial
locations in the furnace tube. The free-falling plastic pellets were intercepted by these plates they
heated up and, as they melted, molten mass dripped through the plates, changing state to liquid
and then ultimately to gas subsequently, the effluent pyrolyzate gases (nominally 0.83 lpm),

26
mixed with the carrier gas (1 lpm), and then travelled through the exhaust pipe and entered the
burner.
A brief series of experiments was conducted to visualize the behavior of molten polymers
through the perforated plates. To accomplish this, a quantity of pellets was placed in a stainless
steel crucible whose bottom was perforated with several holes, see Fig. 2.6. A thermocouple was
placed in the fixed bed of particles to monitor temperature. The crucible was then heated by an
electric tape to temperatures approaching 300 C. As the temperature of the bed increased the
plastic pellets softened, melted, liquefied and dripped through the holes. As these experiments
were conducted under a fume hood at STP conditions, the dripping re-solidified. However, inside
the hot environment of the pyrolytic gasifier, it is expected that the drippings will gasify.
Figure 2.6- Demonstration of melting and dripping of polyolefins through the perforated plates used in the pyrolytic
gasifier. [25]

27
Chapter Three
(Results and Discussion)
3.1 Results and Discussion
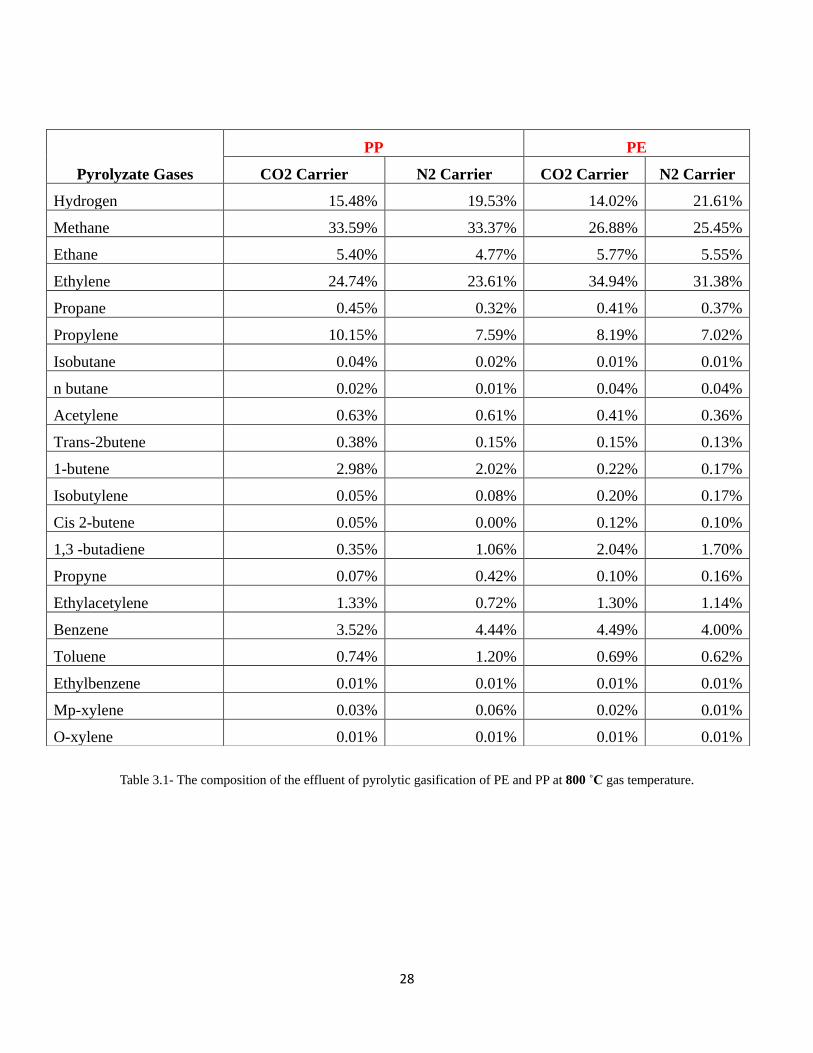
Typical compositions of the pyrolyzates of PE and PP obtained herein are shown in Table 1,
when nitrogen was used as the inert carrier gas. Chemical speciation was conducted with gas
chromatography, using a Hewlett Packard 6890 A instrument with flame-ionization and thermal
conductivity detectors. In the case of PE the major pyrolyzates include methane (25.45%), ethane
(5.55%), ethylene (31.38%), propylene (7.02%), butadiene (3%), ethylacetylene (1.6%) benzene
(4.44%) and hydrogen (21.61%). Mass balances revealed over 95% of the polymer mass was
accounted for in the detected gaseous pyrolyzates. Ethylene has the highest mole fraction in the
pyrolyzate gas mixture, which is consistent with the results obtained elsewhere (Goncalves et al.
[6], Conesa et al. [11], Westerhout[13], Sawaguchi et al. [17,18], etc.). However, the mole
fraction of methane was higher. In the case of PP the major pyrolyzates include methane
(33.37%), ethane (4.77%), ethylene (23.61%), propylene (7.59%), benzene (4.44%) and
hydrogen (19.53%). These results differ from results obtained elsewhere [13,17 and18], where
propylene was found to have the highest mole fraction. However those studies were conducted at
750 °C. Although primary pyrolysis of polyolefins tends to favor their monomers, it has been
reported that higher pyrolysis temperatures [13] and/or longer residence times [27] lead to higher
yields of methane at the expense of ethylene and propylene.
28
Table 3.1- The composition of the effluent of pyrolytic gasification of PE and PP at 800 ˚C gas temperature.
Pyrolyzate Gases
PP PE
CO2 Carrier N2 Carrier CO2 Carrier N2 Carrier
Hydrogen 15.48% 19.53% 14.02% 21.61%
Methane 33.59% 33.37% 26.88% 25.45%
Ethane 5.40% 4.77% 5.77% 5.55%
Ethylene 24.74% 23.61% 34.94% 31.38%
Propane 0.45% 0.32% 0.41% 0.37%
Propylene 10.15% 7.59% 8.19% 7.02%
Isobutane 0.04% 0.02% 0.01% 0.01%
n butane 0.02% 0.01% 0.04% 0.04%
Acetylene 0.63% 0.61% 0.41% 0.36%
Trans-2butene 0.38% 0.15% 0.15% 0.13%
1-butene 2.98% 2.02% 0.22% 0.17%
Isobutylene 0.05% 0.08% 0.20% 0.17%
Cis 2-butene 0.05% 0.00% 0.12% 0.10%
1,3 -butadiene 0.35% 1.06% 2.04% 1.70%
Propyne 0.07% 0.42% 0.10% 0.16%
Ethylacetylene 1.33% 0.72% 1.30% 1.14%
Benzene 3.52% 4.44% 4.49% 4.00%
Toluene 0.74% 1.20% 0.69% 0.62%
Ethylbenzene 0.01% 0.01% 0.01% 0.01%
Mp-xylene 0.03% 0.06% 0.02% 0.01%
O-xylene 0.01% 0.01% 0.01% 0.01%

29
Figure 3.1. Comparison plot for the effluent of pyrolytic gasification of PE and PP at 900˚C.
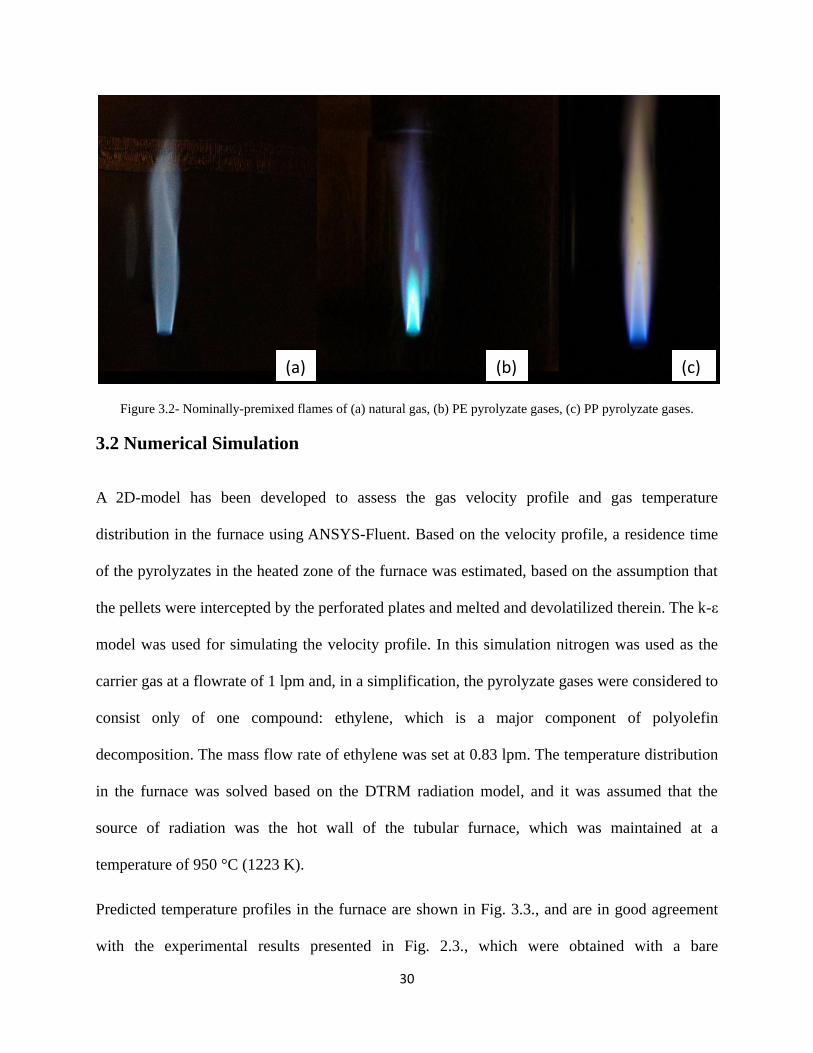
Nominally-premixed flames generated from continuous feeding of polyethylene and
polypropylene in the apparatus, are shown in the photographs of Fig. 3.2, using the Bunsen
burner. In Fig 3.2(a), a flame of natural gas is shown for comparison purposes. Figs 3.2(b) and
3.2(c) show flames of PE and PP, respectively in nitrogen carrier gas. At the estimated nearly-
stoichiometric conditions of this work, the natural gas and the PE flames had violet/blue tints,
whereas the PP flame was blue with a faint orange surround.
30
Figure 3.2- Nominally-premixed flames of (a) natural gas, (b) PE pyrolyzate gases, (c) PP pyrolyzate gases.
3.2 Numerical Simulation
A 2D-model has been developed to assess the gas velocity profile and gas temperature
distribution in the furnace using ANSYS-Fluent. Based on the velocity profile, a residence time
of the pyrolyzates in the heated zone of the furnace was estimated, based on the assumption that
the pellets were intercepted by the perforated plates and melted and devolatilized therein. The k-ε
model was used for simulating the velocity profile. In this simulation nitrogen was used as the
carrier gas at a flowrate of 1 lpm and, in a simplification, the pyrolyzate gases were considered to
consist only of one compound: ethylene, which is a major component of polyolefin
decomposition. The mass flow rate of ethylene was set at 0.83 lpm. The temperature distribution
in the furnace was solved based on the DTRM radiation model, and it was assumed that the
source of radiation was the hot wall of the tubular furnace, which was maintained at a
temperature of 950 °C (1223 K).
Predicted temperature profiles in the furnace are shown in Fig. 3.3., and are in good agreement
with the experimental results presented in Fig. 2.3., which were obtained with a bare
(a) (b) (c)

31
thermocouple placed along the centerline of the furnace. These results confirm that the
temperatures present in the axial and radial directions of the heated section of the furnace are
sufficient for maximum pyrolytic gasification (850 ˚C or 1123 K) yield from the polymer pellets.
In Fig. 3.3., the velocity vectors inside the pyrolysis chamber are also shown. High velocities at
the holes of the perforated plates are predicted, and are expected to enhance the polymer
devolatilization rates. This ANSYS model also predicted a high velocity at the exit of the
pyrolysis chamber, which suggests that the chosen carrier gas flow rate is sufficient to force the
polymer pyrolyzates through the bottom of the chamber, with no potential for recirculation back
up towards the feeding system.
Figure 3.3-Results of numerical analysis (using ANSYS-Fluent) where gas velocity vectors and contours of static
temperature are shown in the pyrolysis chamber.
1170
1090
955
867
750
649
540
431
344
300
Contours of Static
Temperature (K)
0.376
0.339
0.301
0.226
0.188
0.113
0.0941
0.0564
0.0188
Velocity Vectors Colored By Velocity
Magnitude (cm/s)
32
3.3 Combustion Effluent Analysis
Once the feeding system was developed and fine-tuned to provide a continuous flame, a number
of experiments were performed to quantify the affects of different temperatures and carrier
gasses on the levels of CO and CO2 present in the combustion product gases. The gases were
monitored by sampling the effluent of the flames and channeling the slipstream to a California
Analytical Instruments dual CO-CO2 analyzer, model 200. Given the nature of the burners used,
it was not easy to accurately determine the equivalence ratio of their nominally-premixed flames
based on the amounts of reactants. Hence, the equivalence ratio was estimated based on the
measured CO and CO2 combustion products. To achieve this, the partial pressures of the
combustion products of pyrolyzate gasses were calculated using the chemical equilibrium code
STANJAN (22). For this calculation, the pyrolyzate gas mixture composition, documented in
Table 1, was input to the code as reactants (along with the respective carrier gas), and the molar
amounts of the major combustion products (O2, N2, CO, CO2, H2O, NO, NO2) were computed.
The calculation was run over several iterations, with the O2 mole fraction in the reactants altered
to produce a range of CO2/CO ratios. These ratios are plotted against the experimentally-
measured results for comparison purposes in Figure 3.4. It should be mentioned that data points
were obtained at two set-point temperatures of the pyrolytic gasification furnace: 900 and 950
oC. Experiments were run for 20 min and were repeated at in triplicate; average mole fractions
and standard deviations are shown in Figure 3.4. For comparison purposes, experimental data
obtained burning natural gas is also included in Fig. 3.4.
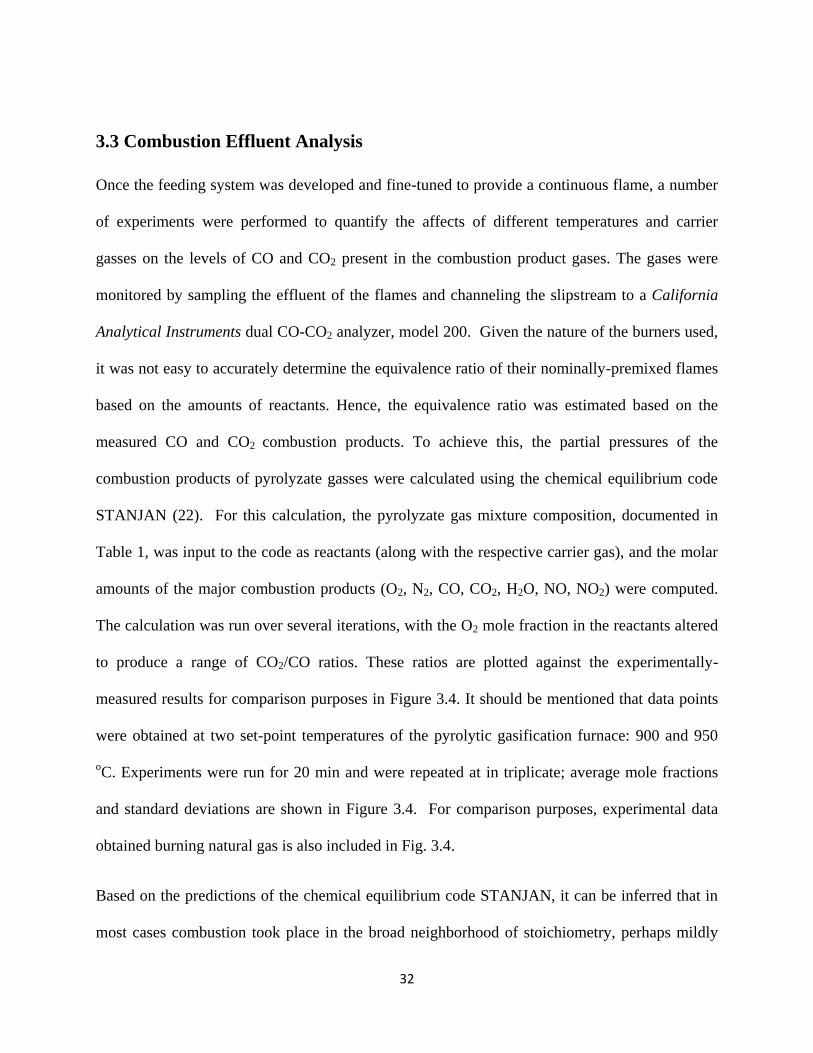
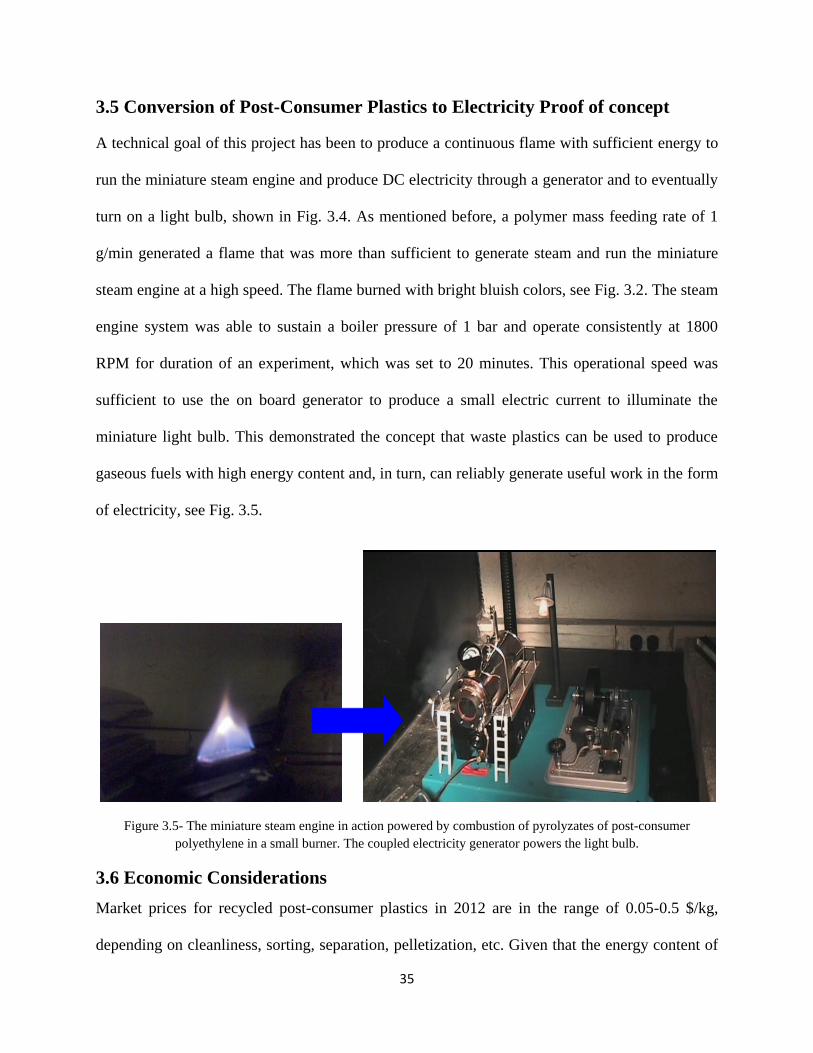
Based on the predictions of the chemical equilibrium code STANJAN, it can be inferred that in
most cases combustion took place in the broad neighborhood of stoichiometry, perhaps mildly
33
fuel-lean. Moreover, there was some scatter in the emissions data which may be attributed to
some unsteadiness in the pellet feeding and devolatilization as well as to mild fluctuations of the
air supply to the Bunsen burner under the operating fume hood. Surprisingly, similar
fluctuations in the emissions data were also observed for the case of the natural gas flames,
suggesting that the latter mechanism was a significant contributor to this scatter. It may also be
observed form these figures that all fuels resulted in comparable CO2/CO ratios, under the
conditions of this work, confirming the effectiveness of combustion of the gaseous pyrolyzates
of post-consumer polyolefins is akin to that of natural gas.
Figure 3.4- Experimentally-determined CO2/CO vs. equivalence ratio at various furnace set-point temperatures, with
N2 as the carrier gas.

34
Furthermore, Fig. 3.4. shows that the furnace set-point temperature in the range of 900°C to
950°C had a beneficial influence on the relative CO2/CO post-flame emissions of the fuels: it
increased this ratio, which is indicative of more complete combustion. This may be attributed to
more effective pyrolysis of the polymer to lighter hydrocarbon species [7, 11-14].
3.4 Replacement of Nitrogen Background Gas with Carbon Dioxide
Substitution of background N2 gas with CO2 was very well tolerated by the flame, producing no
discernible differences. As expected, since CO2 is added to the pyrolytic gasifier input, the
amount of CO2 in the effluent is also higher than in experiments where N2 was used as the carrier
inert gas. Small variations in CO concentrations may be attributed to fluctuations in the polymer
pellet feeding rate. The implication of substitution the nitrogen background inert gas with carbon
dioxide in the pyrolytic gasifier may prove to be important in the economics of an industrial-
scale application. The use of N2 as a carrier gas requires the procurement, maintenance, and
servicing of on-site N2 gas storage. This is costly, takes up space, and diverts valuable resources
to maintaining such a system. CO2 is a byproduct of combustion, and devising a system to
capture the CO2 as produced from combustion gasses to be used as a carrier gas in the system
will present significant cost and resource savings, as the CO2 is produced with no additional cost
and diminishing the supply of it is not a factor, as with storing bottled N2 on site.
CO2 carrier gas N2 carrier gas
Tset point =900 °C Tset point =900 °C
CO2% 14.2 ± 1.04 11.1±0.7
CO% 0.6±0.1 1.5 ±0.5
Table 3.2- Average mole fractions of carbon dioxide and carbon monoxide in the combustion effluent of PE, along
with computed standard deviations.
35
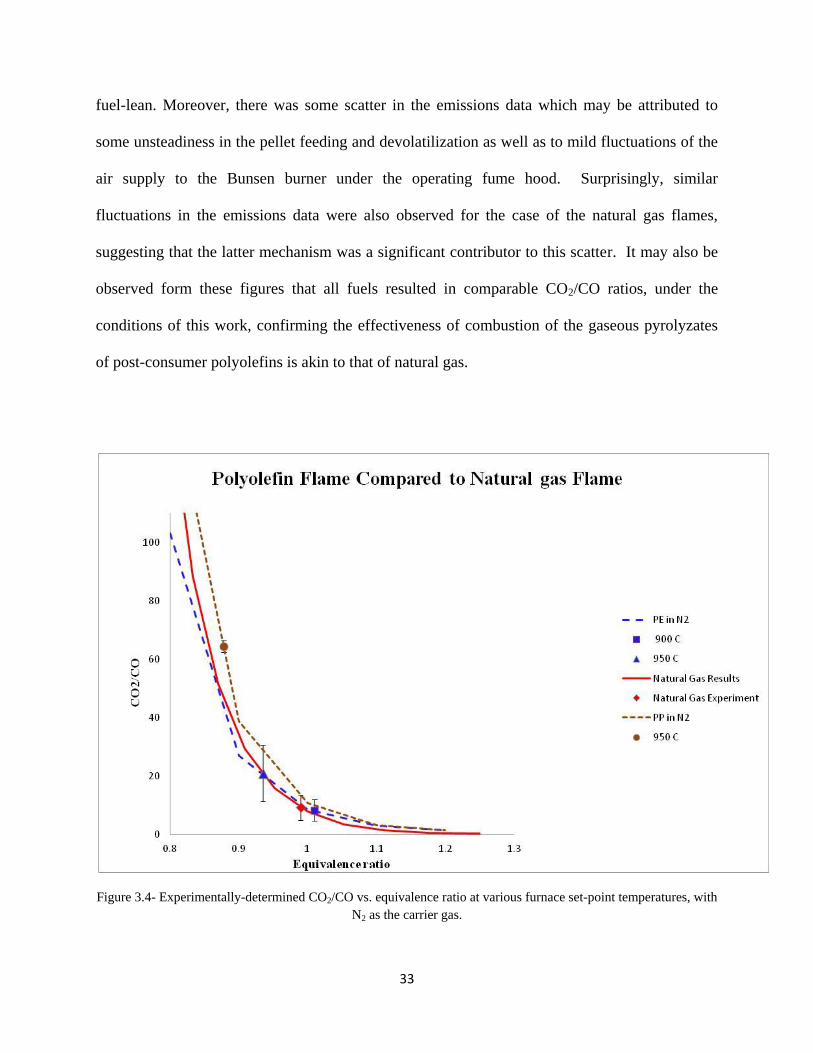
3.5 Conversion of Post-Consumer Plastics to Electricity Proof of concept
A technical goal of this project has been to produce a continuous flame with sufficient energy to
run the miniature steam engine and produce DC electricity through a generator and to eventually
turn on a light bulb, shown in Fig. 3.4. As mentioned before, a polymer mass feeding rate of 1
g/min generated a flame that was more than sufficient to generate steam and run the miniature
steam engine at a high speed. The flame burned with bright bluish colors, see Fig. 3.2. The steam
engine system was able to sustain a boiler pressure of 1 bar and operate consistently at 1800
RPM for duration of an experiment, which was set to 20 minutes. This operational speed was
sufficient to use the on board generator to produce a small electric current to illuminate the
miniature light bulb. This demonstrated the concept that waste plastics can be used to produce
gaseous fuels with high energy content and, in turn, can reliably generate useful work in the form
of electricity, see Fig. 3.5.
Figure 3.5- The miniature steam engine in action powered by combustion of pyrolyzates of post-consumer
polyethylene in a small burner. The coupled electricity generator powers the light bulb.
3.6 Economic Considerations
Market prices for recycled post-consumer plastics in 2012 are in the range of 0.05-0.5 $/kg,
depending on cleanliness, sorting, separation, pelletization, etc. Given that the energy content of

36
polyolefins is in the neighborhood of 45 MJ/kg, then the specific price range of recycled plastics
per energy content is in the range of 1-11 $/GJ. This is analogous to the specific price range of
natural gas, which in the past 10 years fluctuated between 2-14 $/GJ. Hence, for recycled plastics
to have a competitive advantage as a fuel their price should stay as low as possible, preferably as
close as possible to the lowest price, i.e., in the vicinity of 1 $/GJ. Therefore, it is recommended
that a power plant is built in the vicinity of a recycling center, to avoid transportation costs and
other handling costs and maximize profits.
A simple economic model is constructed in Appendix 3 detailing the profit calculations for a
sample setup. Some general assumptions were made on manning (2 eight-hour shifts per day)
and maintenance costs of $600/day as well as efficiency for the electrical power generation. The
running costs are assumed to be $50/hr for labor with 16 hours per day of runtime. To add an
extra measure of conservatism to the estimate, an overall system uptime of 75% is assumed. The
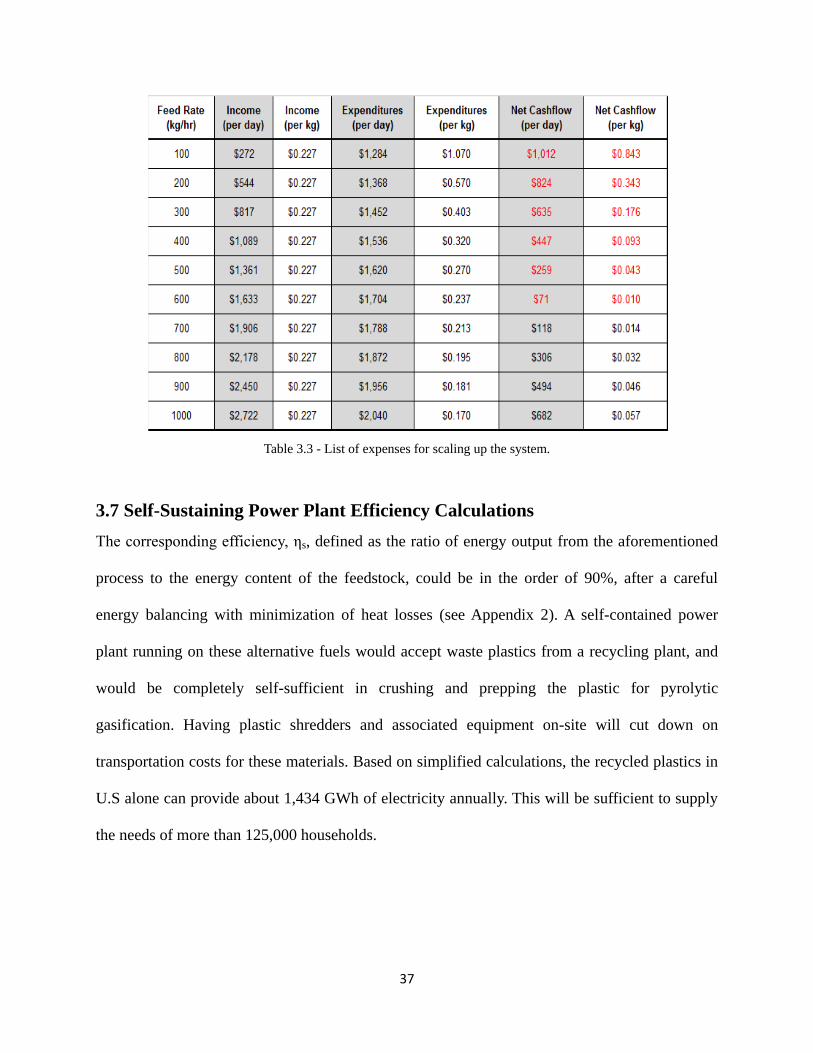
system would need to process in excess of 638 kg/hr in order to turn a profit. The chart below
details the results of the model being run for the cases of 100 – 1000 kg/hr feed rate. The feed
rate was varied and the resulting outputs for both income and expenditures are calculated on a
per kg and per day basis. The net income per kg of plastic is constant, and the running costs are
spread out among the feed rate, thusly resulting in a diminishing running cost per kg as feed rate
increases. As mentioned above, the break-even point is 638 kg/hr. At higher feed rates than this,
the running cost becomes spread more evenly and the per kg running costs become less than the
per kg income.
37
Table 3.3 - List of expenses for scaling up the system.
3.7 Self-Sustaining Power Plant Efficiency Calculations
The corresponding efficiency, ηs, defined as the ratio of energy output from the aforementioned
process to the energy content of the feedstock, could be in the order of 90%, after a careful
energy balancing with minimization of heat losses (see Appendix 2). A self-contained power
plant running on these alternative fuels would accept waste plastics from a recycling plant, and
would be completely self-sufficient in crushing and prepping the plastic for pyrolytic
gasification. Having plastic shredders and associated equipment on-site will cut down on
transportation costs for these materials. Based on simplified calculations, the recycled plastics in
U.S alone can provide about 1,434 GWh of electricity annually. This will be sufficient to supply
the needs of more than 125,000 households.
38
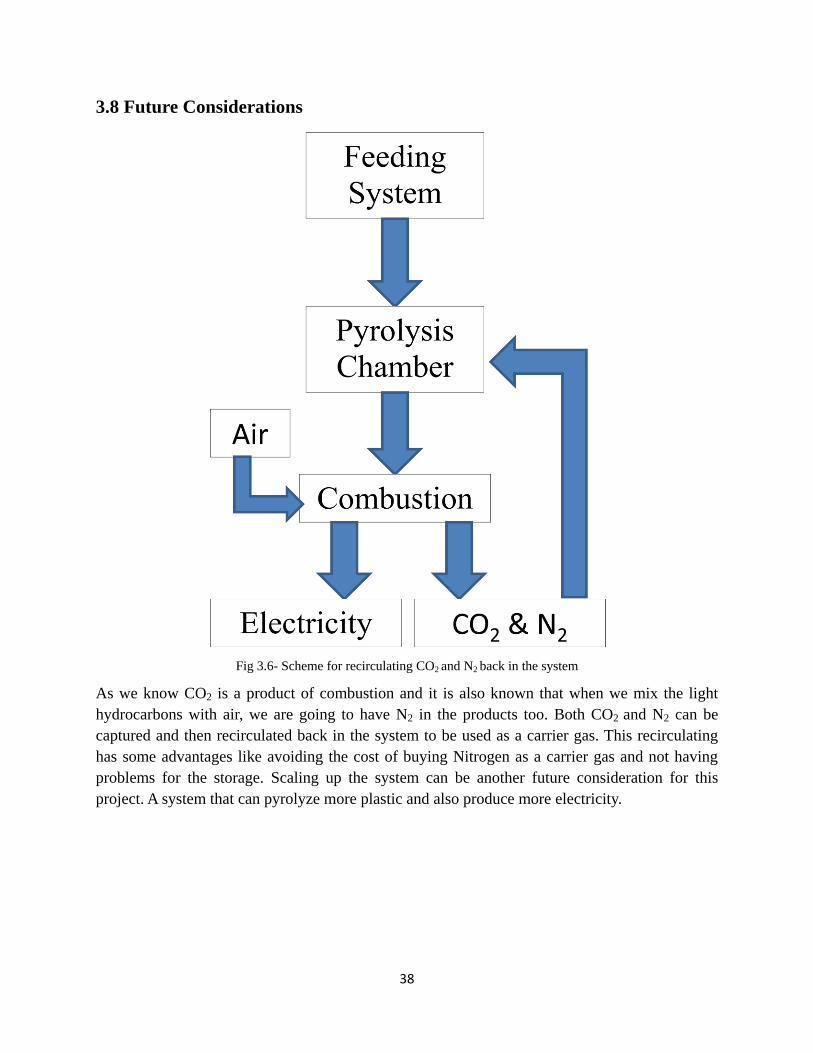
3.8 Future Considerations
Fig 3.6- Scheme for recirculating CO2 and N2 back in the system
As we know CO2 is a product of combustion and it is also known that when we mix the light
hydrocarbons with air, we are going to have N2 in the products too. Both CO2 and N2 can be
captured and then recirculated back in the system to be used as a carrier gas. This recirculating
has some advantages like avoiding the cost of buying Nitrogen as a carrier gas and not having
problems for the storage. Scaling up the system can be another future consideration for this
project. A system that can pyrolyze more plastic and also produce more electricity.
39
APPENDIX I
Required amount of polymer feedstock to operate the Pyrolytic Gasifier
without external heating
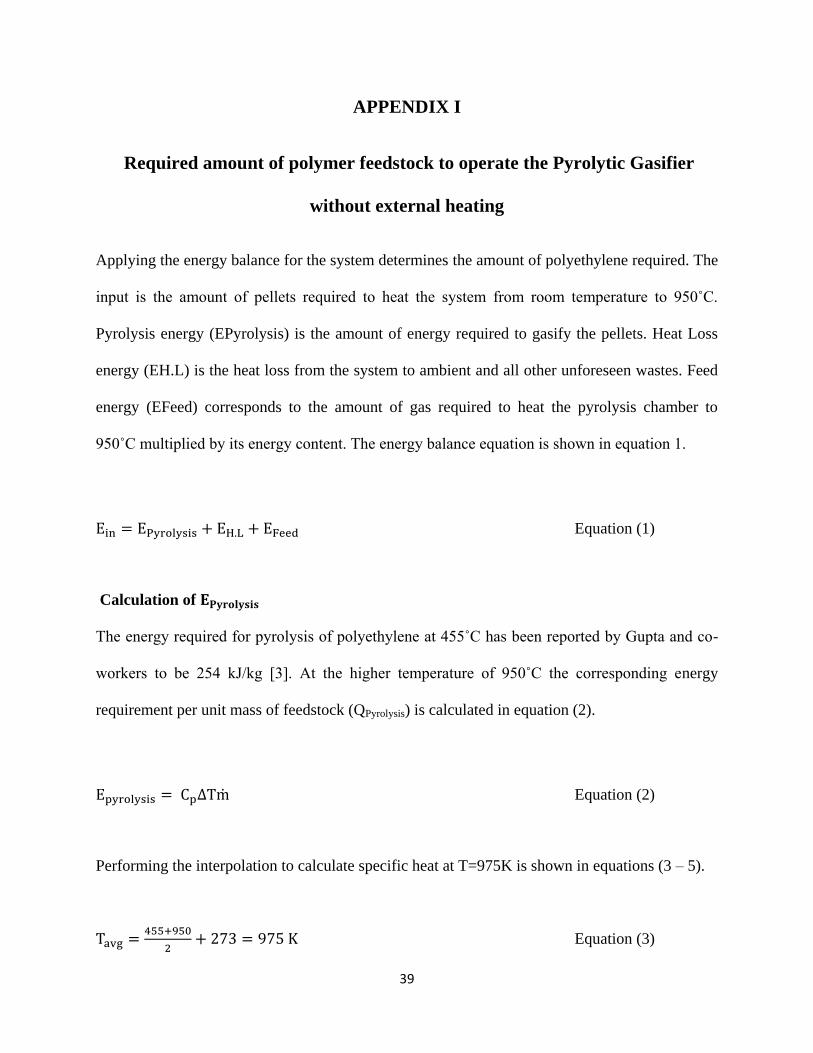
Applying the energy balance for the system determines the amount of polyethylene required. The
input is the amount of pellets required to heat the system from room temperature to 950˚C.
Pyrolysis energy (EPyrolysis) is the amount of energy required to gasify the pellets. Heat Loss
energy (EH.L) is the heat loss from the system to ambient and all other unforeseen wastes. Feed
energy (EFeed) corresponds to the amount of gas required to heat the pyrolysis chamber to
950˚C multiplied by its energy content. The energy balance equation is shown in equation 1.
Equation (1)
Calculation of
The energy required for pyrolysis of polyethylene at 455˚C has been reported by Gupta and co-
workers to be 254 kJ/kg [3]. At the higher temperature of 950˚C the corresponding energy
requirement per unit mass of feedstock (QPyrolysis) is calculated in equation (2).
Equation (2)
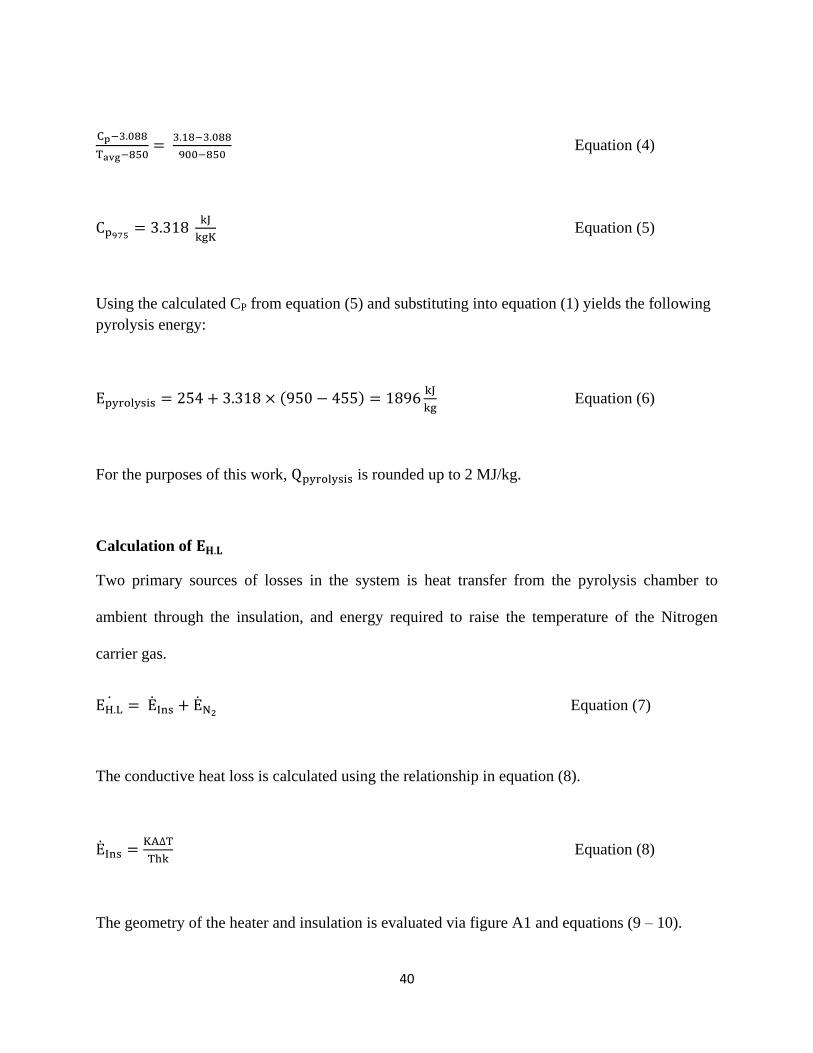
Performing the interpolation to calculate specific heat at T=975K is shown in equations (3 – 5).
Equation (3)
40
Equation (4)
Equation (5)
Using the calculated CP from equation (5) and substituting into equation (1) yields the following
pyrolysis energy:
Equation (6)
For the purposes of this work, is rounded up to 2 MJ/kg.
Calculation of
Two primary sources of losses in the system is heat transfer from the pyrolysis chamber to
ambient through the insulation, and energy required to raise the temperature of the Nitrogen
carrier gas.
Equation (7)
The conductive heat loss is calculated using the relationship in equation (8).
Equation (8)
The geometry of the heater and insulation is evaluated via figure A1 and equations (9 – 10).

41
-3. 5 Equation (9)
0.0254) ( Equation (10)
Equation (11)
Substituting equations (9 – 11) into equation yields the following result:
Equation (12)
The relationship to solve for energy required to heat up the Nitrogen carrier gas in the pyrolyzer
is calculated with the relationship in equation (13).
ρ
Equation (13)
Substituting in known values for specific heat, gas density, flow rate, and temperature yields the
following (equation 14):

42
Or
Equation (14)
The value of is several orders of magnitude less than and thusly is determined to be
negligible. The following relationship is then assumed for (from equation 7):
Equation (15)
Figure A1. Schematic Picture of Insulation Thickness and Length (Units: inch)
Multiplying the total heat loss by a factor of 2 to consider all unpredicted and other unknown
losses yields the following value:
Equation (16)

43
To calculate the overall heat loss in the system, values from equations (6, 16) are used with the
thermal balance equation (1) to perform the following calculation:
Substituting in the energy balance equation;
Equation (17)
This calculation shows that 2 g/min pellets are required to heat this laboratory-scale pyrolyzer to
950˚C. This amount of plastics is required for the system to just break even energy-wise. This
amount of plastics mass flow rate (2 g/min) generates enough energy to sustain its own
operation, i.e., it will be energy self-sufficient. It will take plastics mass feed rates higher than 2
g/min to start generating gaseous fuel for net power generation, i.e., for external applications.

44
APPENDIX II
Calculation of Self-Sustaining Power Plant Efficiency s
The self-sustaining efficiency, ηs is defined as the ratio between the energy output and the
amount of plastic feedstocks necessary to heat and pyrolyzer the feedstocks to the optimal
pyrolysis temperature.
Equation (18)
Wherein Eout is the energy output of the proposed self-sustaining waste-to-energy process.
In the aforementioned process, a small fraction of the energy released by combustion of plastic
pyrolyzates, denoted as EIn herein, is fed-back to pyrolyze the solid plastics feedstock and to
overcome the energy loss of the system. There is unavoidable energy losses involved in this
process, and is denoted as ELoss herein. The represents E per unit time, and refers to E per
unit mass. A simplified energy balance can therefore be obtained as equations (19 – 21):
Equation (19)
Equation (20)
Equation (21)
Using polyethylene (PE) as an example, where the energy content of PE is 4 ,300 kJ/kg,
where the energy needed to pyrolyse PE at its maximum rate (455 C) and to heat it up to desired
temperature (800 C) is:
=
Equation (22)

45
Cp is the heating capacity of materials, and its value of ethylene was used herein as a surrogate
due to the fact that ethylene is the monomer of PE and the major component in the PE
pyrolyzates. Although Cp of ethylene varies and increases along with the temperature, we assume
it increases linearly with the temperature and a conservative simplification use the highest value
available. Thus,
, and Equation (22) yields
= 254 + 3.18× (800-455) kJ/kg =1,352 kJ/kg;
In this study, the energy loss is simplified to be due to the heat loss during the pyrolysis process.
Assuming the heat loss occurs across a cylindrical surface, see Fig. A1 where the dimensions
were marked (inch).
The insulation material was assumed to be calcium silicate with a thermal conductivity
coefficient of k=0.05 W/mK.
Therefore,
Equation (23)
Where , is the heat loss through the insulation per second,
Equation (24)

46
A was defined as the outer surface area of insulation and L as the insulation thickness. ΔT is
temperature difference between heater and ambient. The thickness of insulation is shown in
Figure A1.
3. 5
Therefore, Equation (23) yields the following value for heat loss:
;
In this study, the time needed to feed one kilogram of polyethylene, denoted as t herein, is
t
,
Based on Equation (17)
Equation (26)
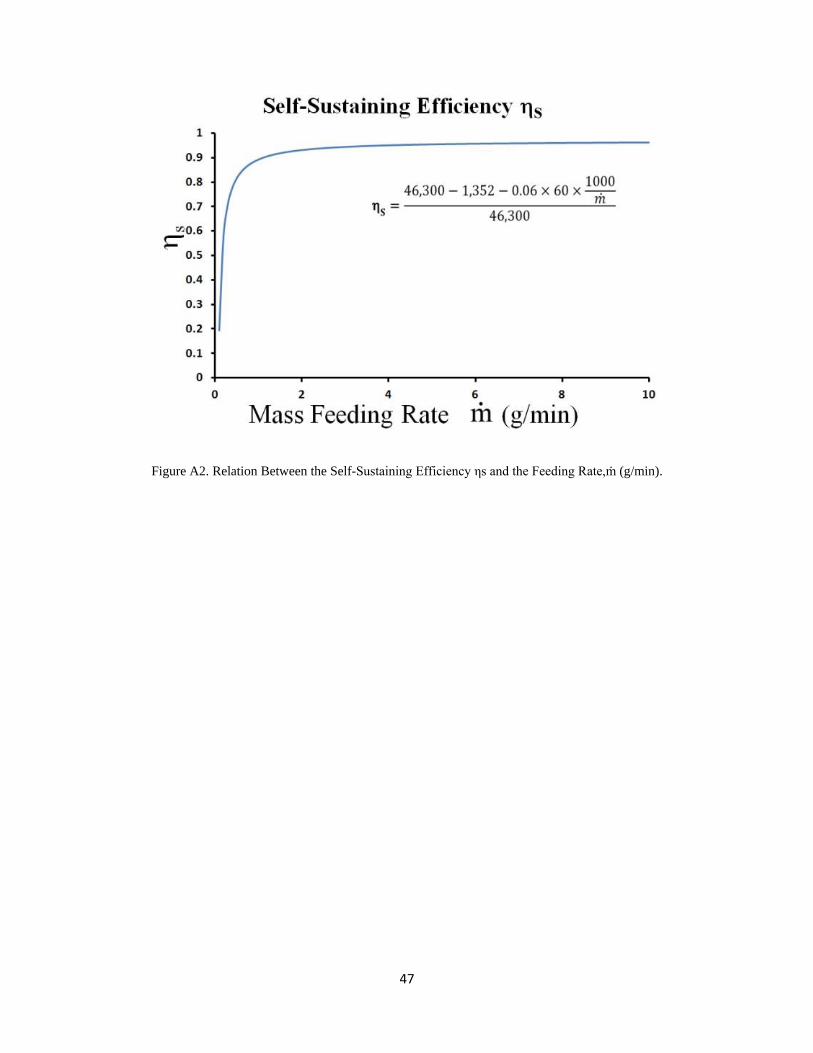
As shown in Equation (9), for the apparatus used in this study, there is a relation between the
self-sustaining efficiency, ηs, and the mass feeding rate, , as shown in Fig. A2. Higher feeding
rate leads to less duration for pyrolyzating the same amount of feedstock, thus higher efficiency.
The ideal efficiency can be as high as 96%, as the feeding rate is larger than 4 g/min.
47
Figure A2. Relation Between the Self-Sustaining Efficiency ηs and the Feeding Rate, (g/min).
48
APPENDIX III
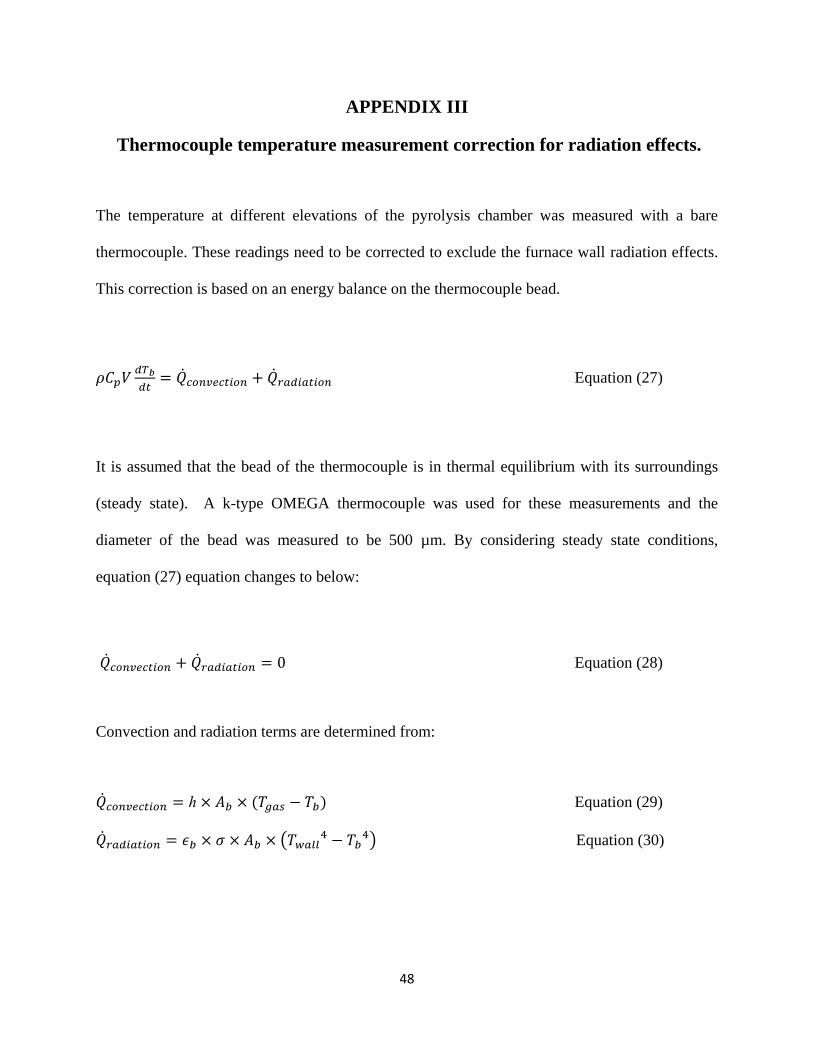
Thermocouple temperature measurement correction for radiation effects.
The temperature at different elevations of the pyrolysis chamber was measured with a bare
thermocouple. These readings need to be corrected to exclude the furnace wall radiation effects.
This correction is based on an energy balance on the thermocouple bead.
Equation (27)
It is assumed that the bead of the thermocouple is in thermal equilibrium with its surroundings
(steady state). A k-type OMEGA thermocouple was used for these measurements and the
diameter of the bead was measured to be 500 µm. By considering steady state conditions,
equation (27) equation changes to below:
Equation (28)
Convection and radiation terms are determined from:
Equation (29)
Equation (30)

49
Where Ab is the area of the bead and Tgas and Tb are temperatures of the gas and bead
respectively. Heat transfer coefficient h can be calculated from equations (31 – 32) by
considering the bead to be a spherical object.
Equation (31)
Equation (32)
Equation 31 is showing the Nusselt number which shows the ratio of the convection to
conduction heat interaction across the fluid layer. Equation 32 is Rayleigh number which is
dimensionless and it is being used for calculating natural convection heat interaction. Pr is also
another dimensionless number which depicts the velocity and thermal boundary layers
thicknesses relatively.
The Nusselt number calculated is valid for RaD < 1011
and Pr > 0.7.
Finally, equation (28) becomes:
Equation (33)
It needs to be mentioned that for obtaining convection coefficient we need to have the thermal
conductivity of the gas. For calculating thermal conductivity there are relations that can be used
and since these relations are based on gas temperature, it is needed to first assume a number for
gas temperature and then by trial and error zero the equation (33). Finally, relations that were
used for obtaining the properties of air have errors since they have been all derived empirically
and this means that corrected gas temperatures can be even lower.

50
Measured Temperature with Thermocouple (oC) Corrected Gas Temperature
(oC)
390 371
610 598
650 639
690 681
790 784
830 825
840 836
855 851
855 851
Table A2.1- Comparison between corrected and uncorrected temperature readings.
51
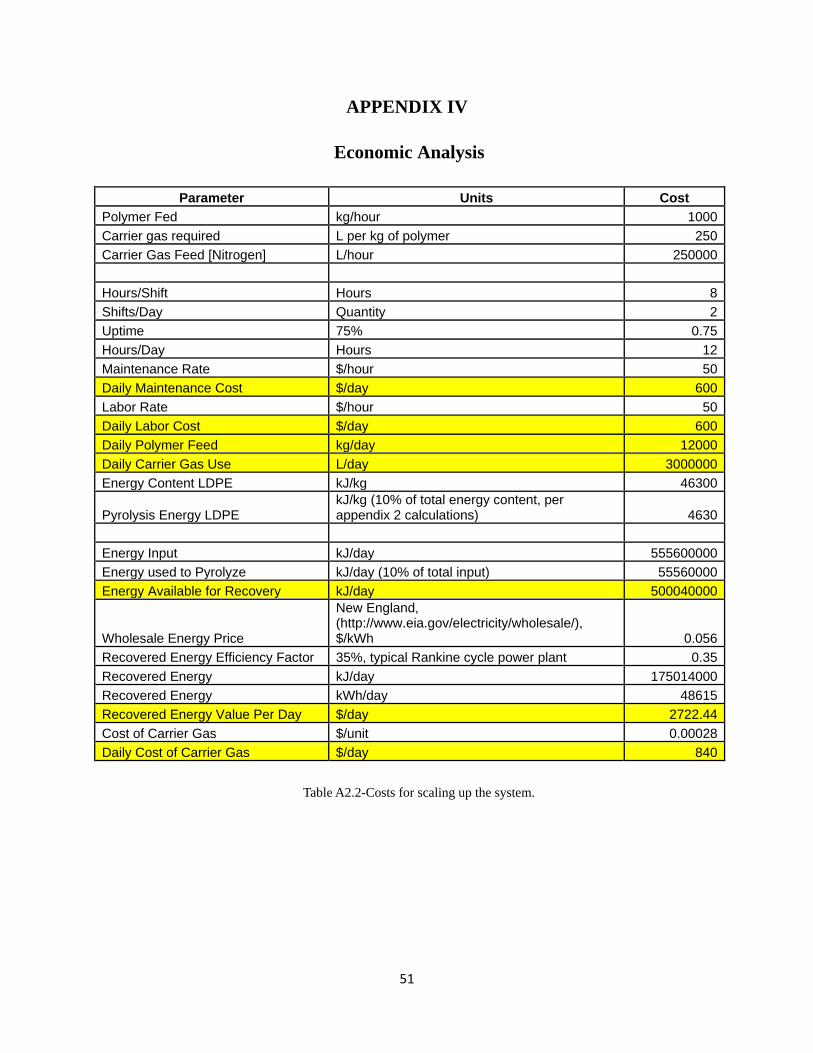
APPENDIX IV
Economic Analysis
Parameter Units Cost
Polymer Fed kg/hour 1000
Carrier gas required L per kg of polymer 250
Carrier Gas Feed [Nitrogen] L/hour 250000
Hours/Shift Hours 8
Shifts/Day Quantity 2
Uptime 75% 0.75
Hours/Day Hours 12
Maintenance Rate $/hour 50
Daily Maintenance Cost $/day 600
Labor Rate $/hour 50
Daily Labor Cost $/day 600
Daily Polymer Feed kg/day 12000
Daily Carrier Gas Use L/day 3000000
Energy Content LDPE kJ/kg 46300
Pyrolysis Energy LDPE kJ/kg (10% of total energy content, per appendix 2 calculations) 4630
Energy Input kJ/day 555600000
Energy used to Pyrolyze kJ/day (10% of total input) 55560000
Energy Available for Recovery kJ/day 500040000
Wholesale Energy Price
New England, (http://www.eia.gov/electricity/wholesale/), $/kWh 0.056
Recovered Energy Efficiency Factor 35%, typical Rankine cycle power plant 0.35
Recovered Energy kJ/day 175014000
Recovered Energy kWh/day 48615
Recovered Energy Value Per Day $/day 2722.44
Cost of Carrier Gas $/unit 0.00028
Daily Cost of Carrier Gas $/day 840
Table A2.2-Costs for scaling up the system.
52
REFERENCES
1. http://www.epa.gov/osw/conserve/materials/plastics.htm, 2012.
2. EPA, Municipal Solid Waste Generation, Recycling, and Disposal in the United States:
Facts and Figures for 2010.
3. Jinno, D.; Gupta, A.K.; and Yoshikawa, K., Thermal decomposition characteristics of
critical components in solid wastes. Environ. Eng. Sci., 2004, 21(1), 65-72.
4. Caponero, J., et al., Emissions of batch combustion of waste tire chips: the pyrolysis effect.
Combust. Sci. Technol., 2005, 177(2), 347-381.
5. Ergut, A.; Levendis, Y.A.; and Carlson, J., Emissions from the combustion of polystyrene,
styrene and ethylbenzene under diverse conditions. Fuel, 2007, 86(12-13), 1789-1799.
6. Gonçalves, C.K., et al., Emissions from Premixed Combustion of Polystyrene. Energy
Fuels, 2007, 22(1), 354-362.
7. Gonçalves, C.K., et al., Emissions from the Premixed Combustion of Gasified
Polyethylene. Energy Fuels, 2007, 22(1), 372-381.
8. Jinno, D.; Gupta, A. K.; Yoshikawa, K. Thermal destruction of surrogate solid waste,
Proceedings of the 26th International Technical Conference on Coal Utilization and Fuel
Systems, Clearwater, FL, 2001.
9. Jinno, D.; Gupta, A. K.; Yoshikawa, K. Thermal destruction of plastic materials in solid
wastes, Proceedings of the 27th International Technical Conference on Coal Utilization
53
and Fuel Systems, Clearwater, FL, 2002.
10. Bayler, G. In Handbook of Fire Protection Engineering; National Fire Protection
Association, Eds.; Society of Fire Protection Engineers: Quincy, MA, 1988; pp 165–187.
11. Conesa, J.A., et al., Pyrolysis of Polyethylene in a Fluidized Bed Reactor. Energy Fuels,
1994. 8(6), 1238-1246.
12. Kaminsky W., Pyrolysis of plastic waste and scrap tyres in a fluid bed reactor,
Resour. RecoVery ConserV., 1980, 5, 205–216.
13. Westerhout R.W.J., Waanders J., Kuipers J.A.M., van Swaaij W.P.M., Recycling of
polyethene and polypropene in a novel bench-scale rotating cone reactor by high-
temperature pyrolysis, Ind. Eng. Chem. Res, 1998, 37(6), 2293–2300.
14. Scott D. S., Czernik S. R., Piskorz J., Radlein A. G., Fast Pyrolysis of Plastic Wastes
Energy Fuels 1990, 4, 407–411.
15. Mastral J. F., Berrueco C., Ceamanos J., Pyrolysis of High-Density Polyethylene in Free-
Fall Reactors in Series, Energy Fuel, 2006, 20, 1365–1371.
16. Yamada H., Mori H., Tagawa T., CO2 reforming of waste plastics, Journal of Industrial
and Engineering Chemistry, 2010, 16, 7-9.
17. Sawaguchi, T.; Inami, T.; Kuroki, T.; Ikemura, T. Studies on Thermal Degradation of
Synthetic Polymers. 12. Kinetic Approach to Intensity Function Concerning Pyrolysis

54
Condition for Polyethylene Low Polymer. Ind. Eng. Chem. Process Des. Dev. 1980, 19,
174-179.
18. Sawaguchi, T.; Suzuki, K.; Kuroki, T.; Ikemura, T. Studies on Thermal Degradation of
Synthetic Polymers. XV. Estimation of the Product Yield on the Basis of Intensity
Function for Thermal Gasification of Isotactic and Atactic PolyPropylenes. J. Appl.
Polym. Sci., 1981, 26, 1267-1274.
19. Sorum L.; Gronli M.G.; Hustad J.E.; Pyrolysis characteristics and kinetics of municipal
solid wastes.; Fuel, 2001, 80, 1217-1227.
20. Kondo S., Takizawa K., Takahashi A., Tokuhashi K., Extended Le Chatelier’s formula
and nitrogen dilution effect on the flammability limits, Fire Safety Journal, 2006, 41 (5),
406-417.
21. Talebi Anaraki, S., Master's Thesis entitled: “Waste to Energy Conversion by Stepwise
Liquefaction, Gasification and ‘Clean’ Combustion of Pelletized Waste Polyethylene for
Electric Power Generation – in a Miniature Steam Engine”, Northeastern University,
2012.
22. Chemical Equilibrium Calculator, http://navier.engr.colostate.edu/~dandy/code/code-
4/index.html, 2012.
55
23. https://www.cia.gov/library/publications/the-world-factbook/rankorder/2174rank.html.
The world factbook Country Comparison Oil – consumption. ISSN 1553-8133, 2012.
24. http://www.epa.gov/osw/conserve/materials/plastics.htm. Wastes - Resource Conservation
- Common Wastes & Materials, 2012.
25. Craver A. Dixon K., Flanagan C. Lynn B., Riley M. “System to Convert Plastics into
Clean Energy” Technical design report, College of Engineering, Northeastern University,
Boston, 2010.
26. Zhuo C., Hall B., Richter H., Levendis Y.A., Synthesis of Carbon Nanotubes from
Sequential Pyrolysis and Combustion of Polyethylene, Carbon, 2010, 48, 2024-2034.
27. Koyo Norinaga, Olaf Deutschmann, Klaus J. Huttinger, Analysis of gas phase compounds
in chemical vapor deposition of carbon from light hydrocarbons, , Carbon, 2006, 44,
1790–1800.