promodel generis - modeling accelerates lean
TRANSCRIPT
1
Generis – 2015 American Manufacturing Summit Bruce Gladwin, ProModel Corporation
2
Introductions: Who, What & Why
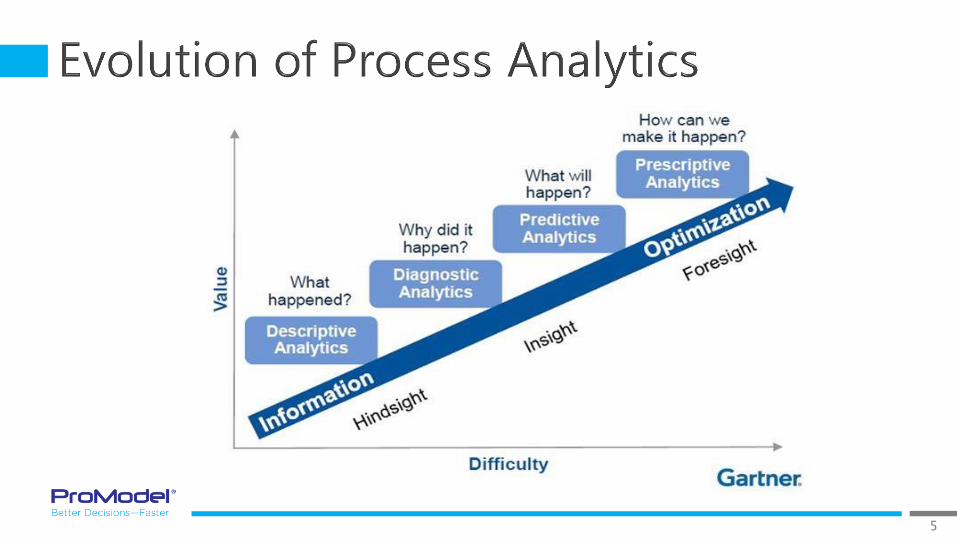
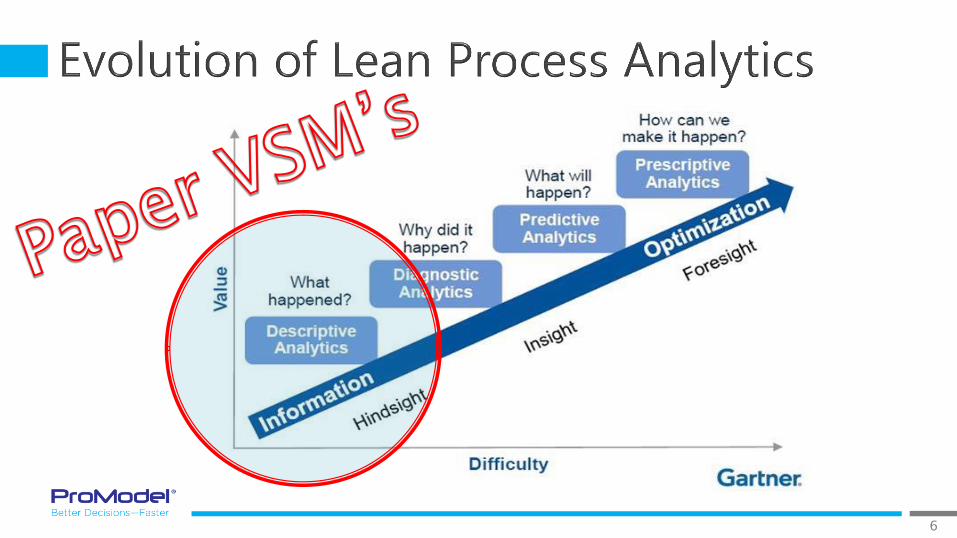
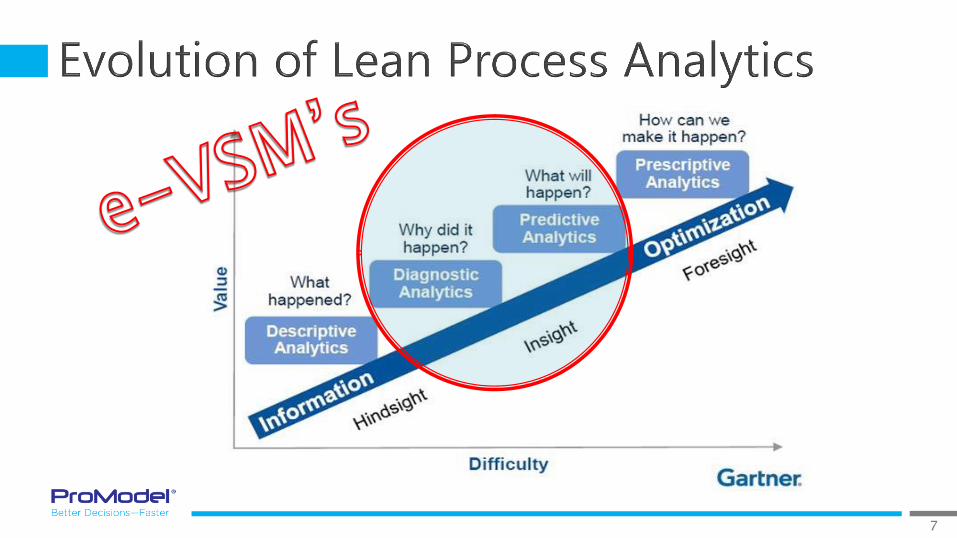
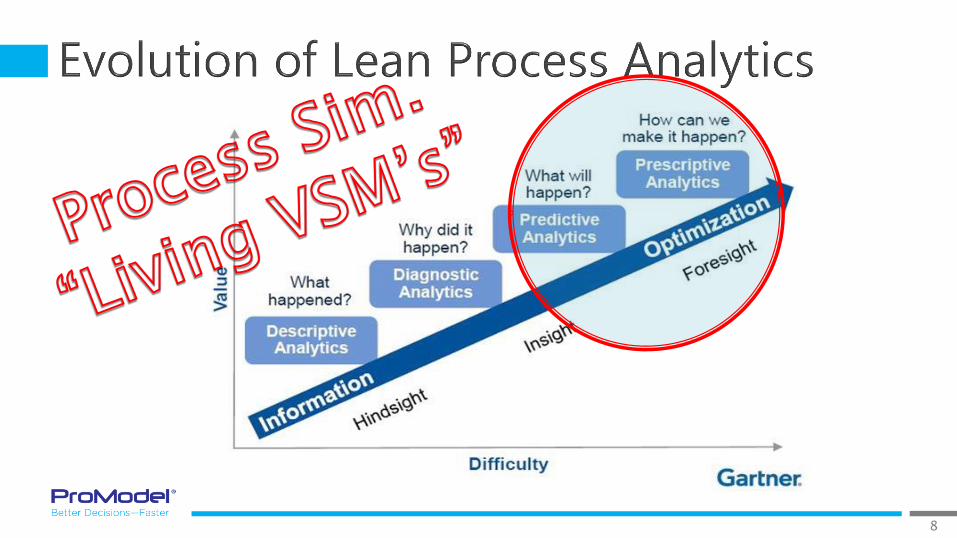
Evolution of (Lean) Process Analytics
Simulation-based “Living VSMs” ◦ Understanding the “Physics of the Process”
The Virtual Kaizen: your insurance policy
Introducing Modeling & Sustaining the Gain
3
Bruce Gladwin – fellow pilgrim on the Lean journey
28 years in process analysis and improvement ◦ Hughes Aircraft – Industrial Engineer Role
◦ GE Global Research – Internal PI Consultant
◦ GE Power Systems – Six Sigma Black Belt
ProModel Corporation – Orem, Utah ◦ Simulation Trainer, Consultant & Project Manager
◦ Product Manager, Process Simulation Tool
◦ Currently VP, Modeling Services Team
4
What? ◦ How modeling tools, specifically discrete-event simulation,
can improve & accelerate your Lean journey
Why? ◦ “The times they are a changin” – Bob Dylan
◦ Early modeling tools were not for “the faint of heart”
◦ Advances in simulation technology have put this valuable
technology within reach of more and more Lean practitioners
Many tools today are “fill in the blank”, no programming required!
5
6
7
8
9
Learning to See – Lean Enterprise Institute
10
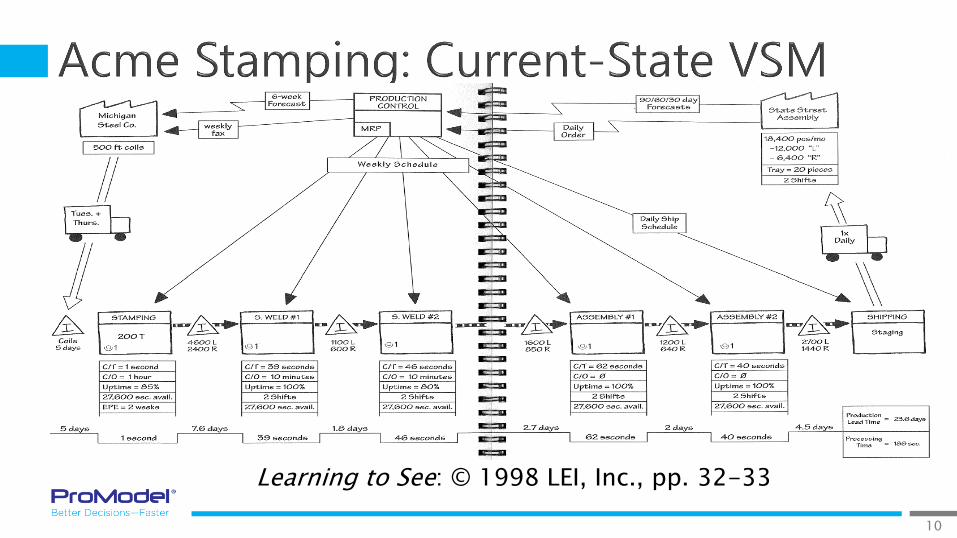
Learning to See: © 1998 LEI, Inc., pp. 32-33
11
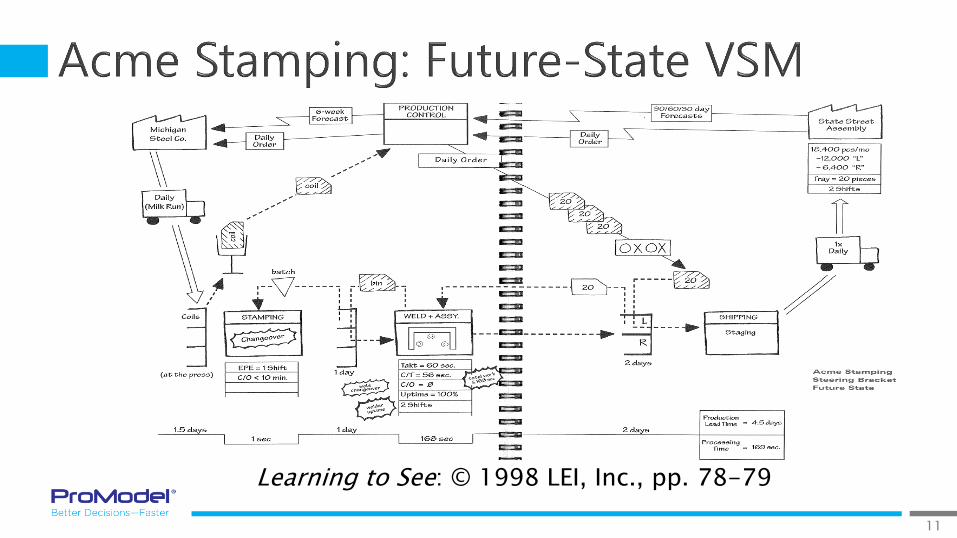
Learning to See: © 1998 LEI, Inc., pp. 78-79
12
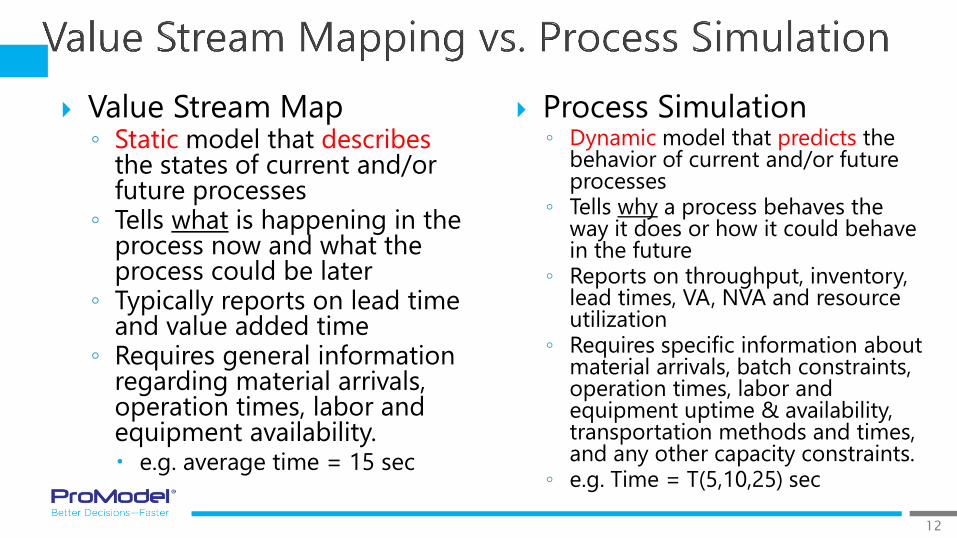
Value Stream Map ◦ Static model that describes
the states of current and/or future processes
◦ Tells what is happening in the process now and what the process could be later
◦ Typically reports on lead time and value added time
◦ Requires general information regarding material arrivals, operation times, labor and equipment availability. e.g. average time = 15 sec
Process Simulation ◦ Dynamic model that predicts the
behavior of current and/or future processes
◦ Tells why a process behaves the way it does or how it could behave in the future
◦ Reports on throughput, inventory, lead times, VA, NVA and resource utilization
◦ Requires specific information about material arrivals, batch constraints, operation times, labor and equipment uptime & availability, transportation methods and times, and any other capacity constraints.
◦ e.g. Time = T(5,10,25) sec
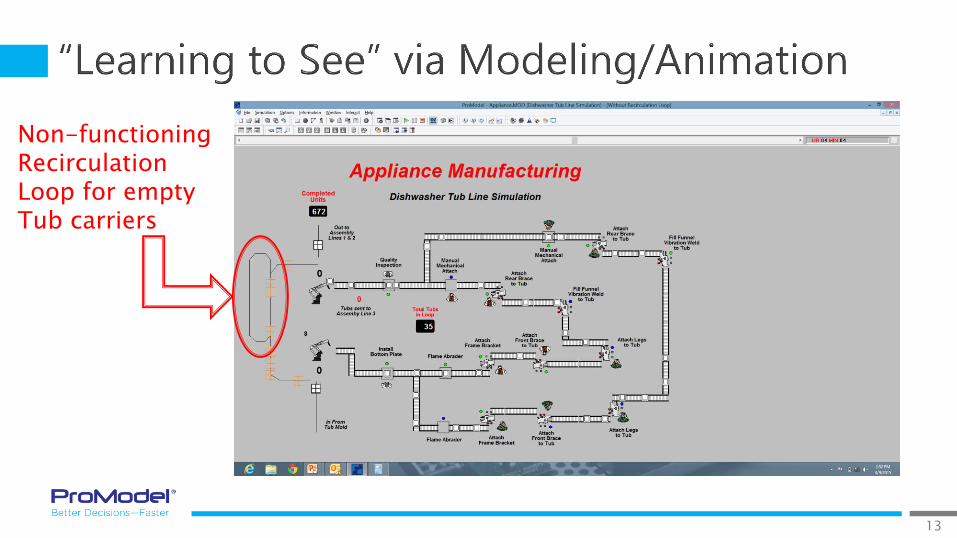
13
Non-functioning Recirculation Loop for empty Tub carriers
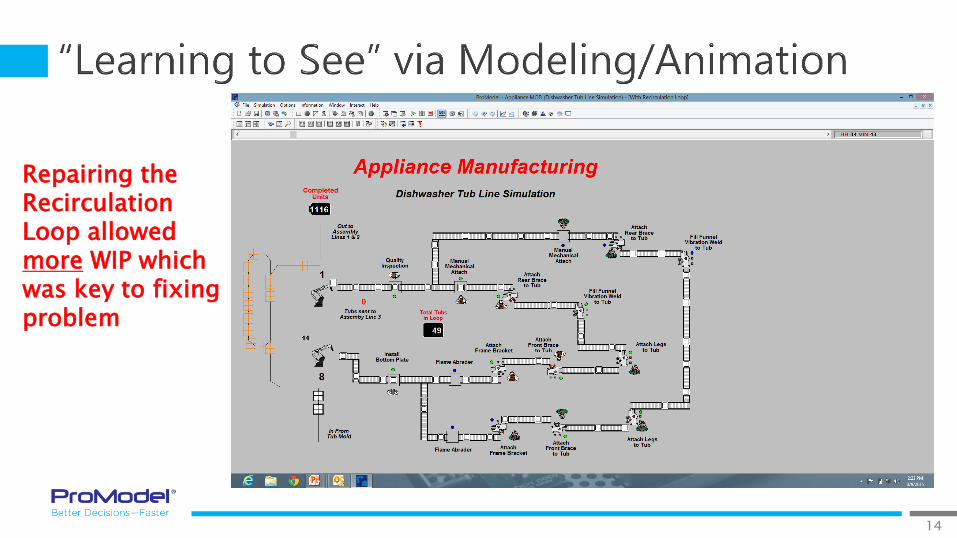
14
Repairing the Recirculation Loop allowed more WIP which was key to fixing problem
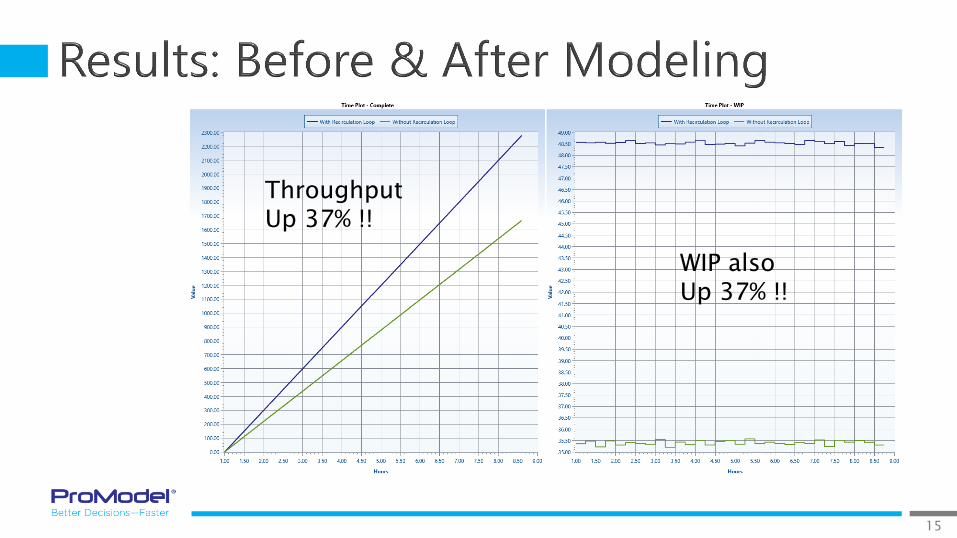
15
Throughput Up 37% !!
WIP also Up 37% !!
16
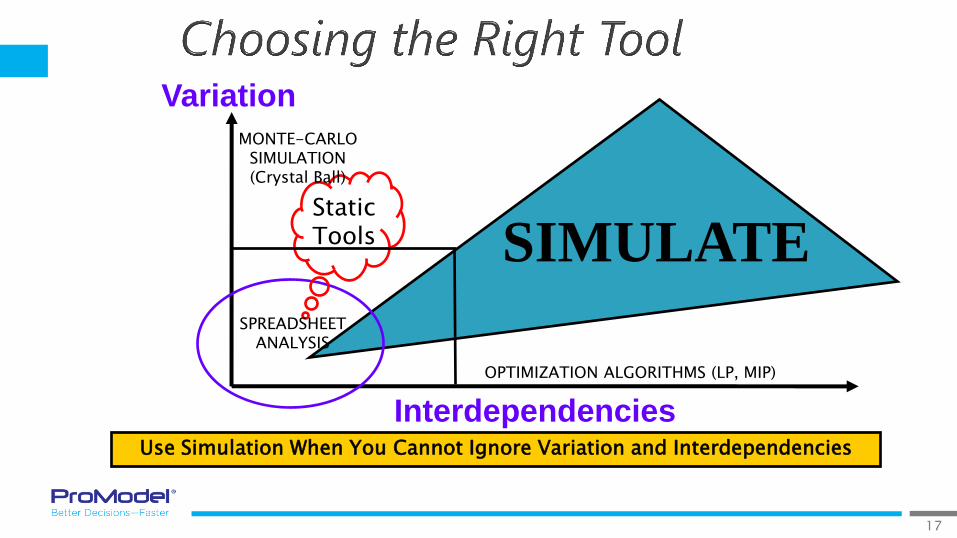
17
Interdependencies
Variation
SIMULATE
Use Simulation When You Cannot Ignore Variation and Interdependencies
Static Tools
SPREADSHEET ANALYSIS
MONTE-CARLO SIMULATION (Crystal Ball)
OPTIMIZATION ALGORITHMS (LP, MIP)
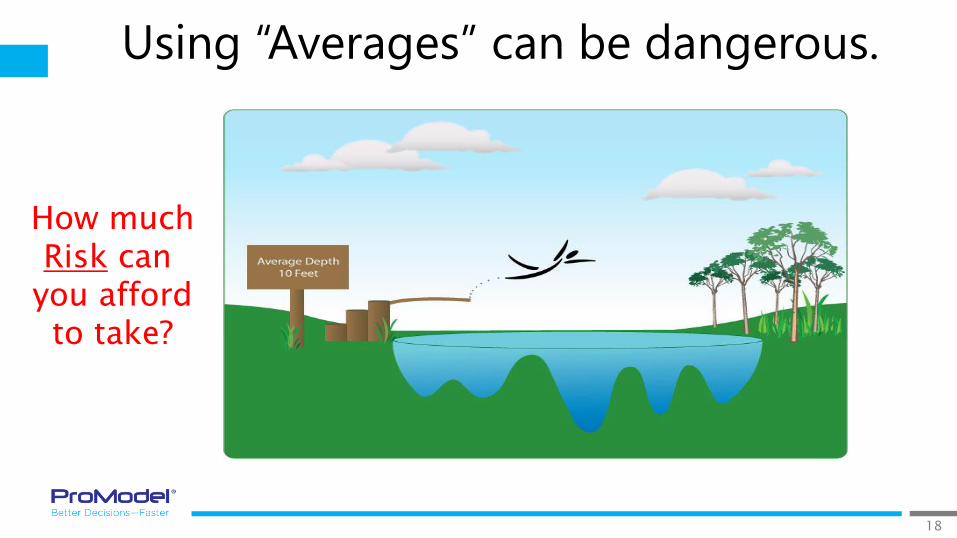
18
Using “Averages” can be dangerous.
How much Risk can
you afford to take?
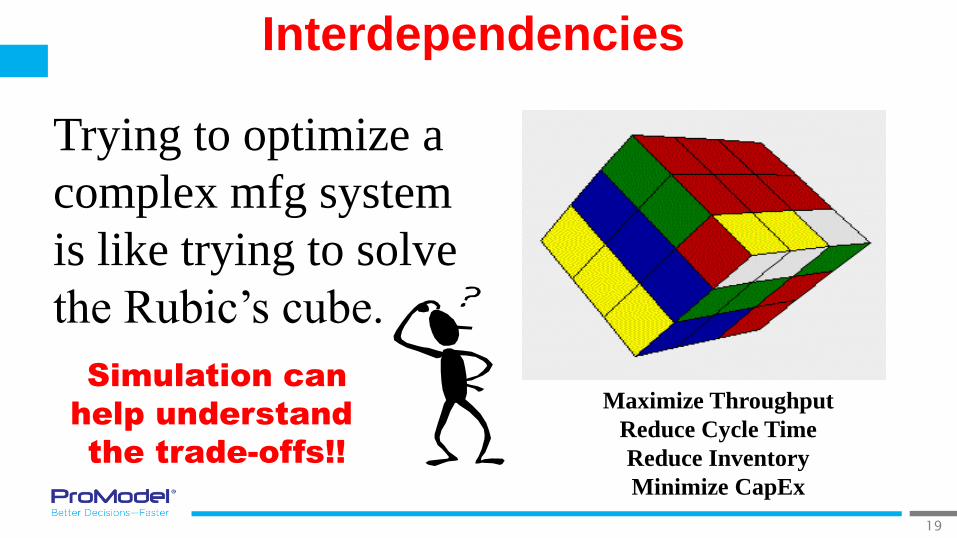
19
Trying to optimize a
complex mfg system
is like trying to solve
the Rubic’s cube.
Simulation can
help understand
the trade-offs!!
Maximize Throughput
Reduce Cycle Time
Reduce Inventory
Minimize CapEx
Interdependencies
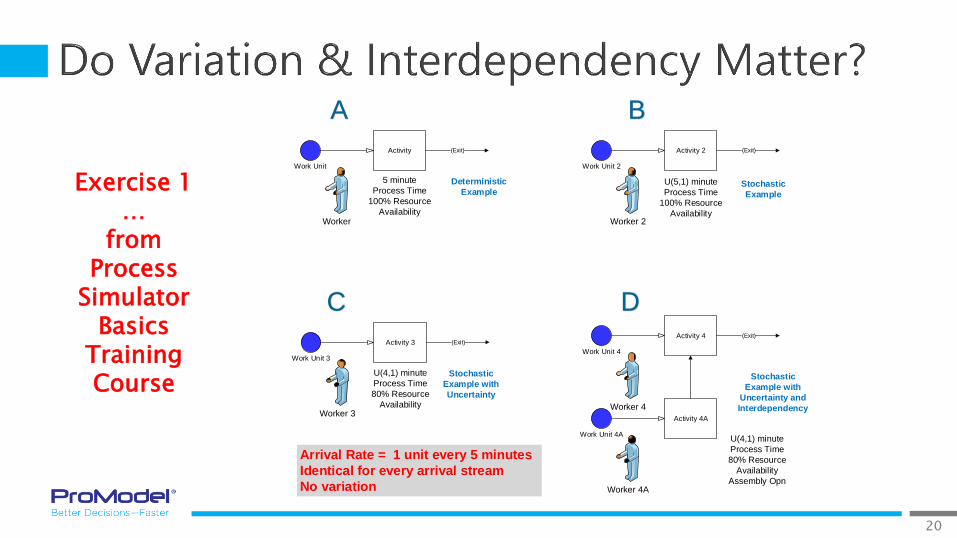
20
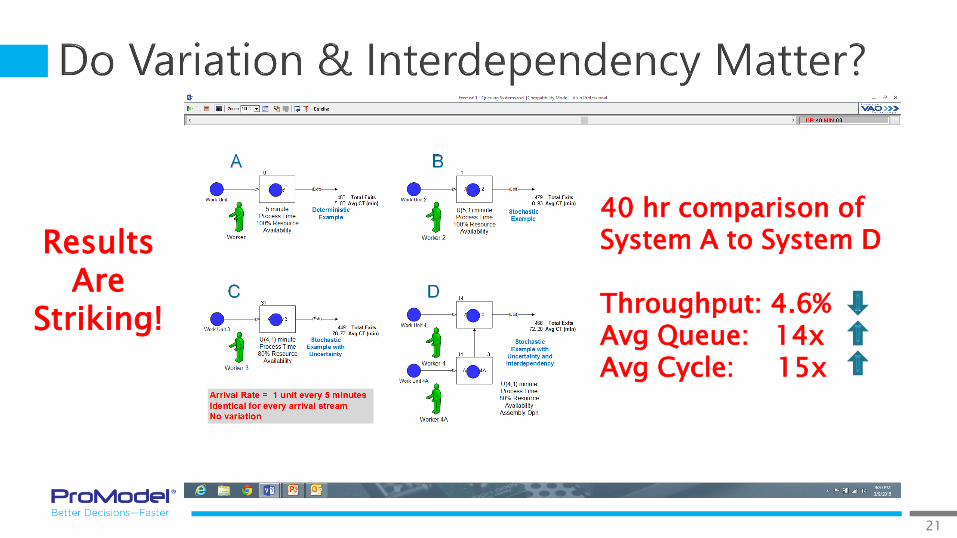
Exercise 1 …
from Process
Simulator Basics
Training Course
Activity
Worker
Work Unit
(Exit)
5 minute
Process Time
100% Resource
Availability
Deterministic
Example
Activity 2
Worker 2
Work Unit 2
(Exit)
U(5,1) minute
Process Time
100% Resource
Availability
Stochastic
Example
Activity 3
Worker 3
Work Unit 3
(Exit)
U(4,1) minute
Process Time
80% Resource
Availability
Stochastic
Example with
Uncertainty
Activity 4
Worker 4
Work Unit 4
(Exit)
U(4,1) minute
Process Time
80% Resource
Availability
Assembly Opn
Stochastic
Example with
Uncertainty and
InterdependencyActivity 4A
Worker 4A
Work Unit 4A
BA
C D
Arrival Rate = 1 unit every 5 minutes
Identical for every arrival stream
No variation
21
Results Are
Striking!
40 hr comparison of System A to System D Throughput: 4.6% Avg Queue: 14x Avg Cycle: 15x
22
23
A Virtual Kaizen is simply using simulation first to
better understand the “Physics of the Process”…
Then design the improved process, to produce the
desired outputs, within expect levels of variation…
All in a risk free environment ◦ No interruptions to the existing line
◦ No need to make physical rearrangements (yet)
◦ Ability to ask “What if…?”
24
Founded in 1975 by former Westinghouse engineers
Ownership: privately held by founders
Location: Pittsburgh area
Employees: 150 total (50 salary, 100 hourly)
Products: ◦ Mechanical Switches for Electric Utility Grids
◦ Automatic Distribution Motor Operators (ADMO)
Allows remote control of switches by utility personnel
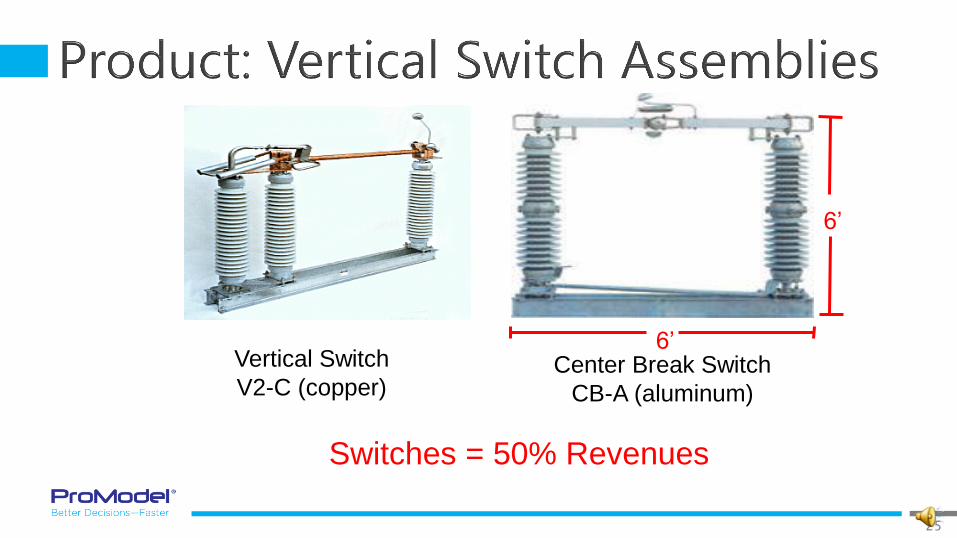
25
Vertical Switch
V2-C (copper) Center Break Switch
CB-A (aluminum)
6’
6’
Switches = 50% Revenues
26
Privately held, debt-free, profitable business with little competition from low cost countries (for now).
Capacity constrained. The market would buy every additional unit that they could produce.
Each additional unit sold would contribute $5k-$10k to their bottom line.
Want to maximize 1st shift capacity before adding additional 2nd shift operations.
Considering 30,000 sf expansion to their existing plant, at a cost of about $1M.
27
Eliminate or Reduce the Risk through a “Virtual Kaizen” using Simulation Technology.
28
29
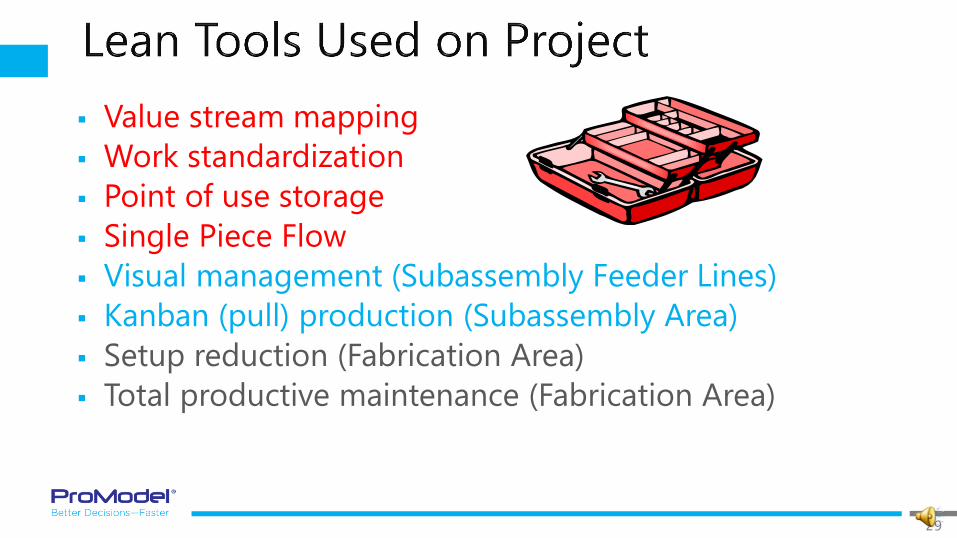
Value stream mapping
Work standardization
Point of use storage
Single Piece Flow
Visual management (Subassembly Feeder Lines)
Kanban (pull) production (Subassembly Area)
Setup reduction (Fabrication Area)
Total productive maintenance (Fabrication Area)
30
31
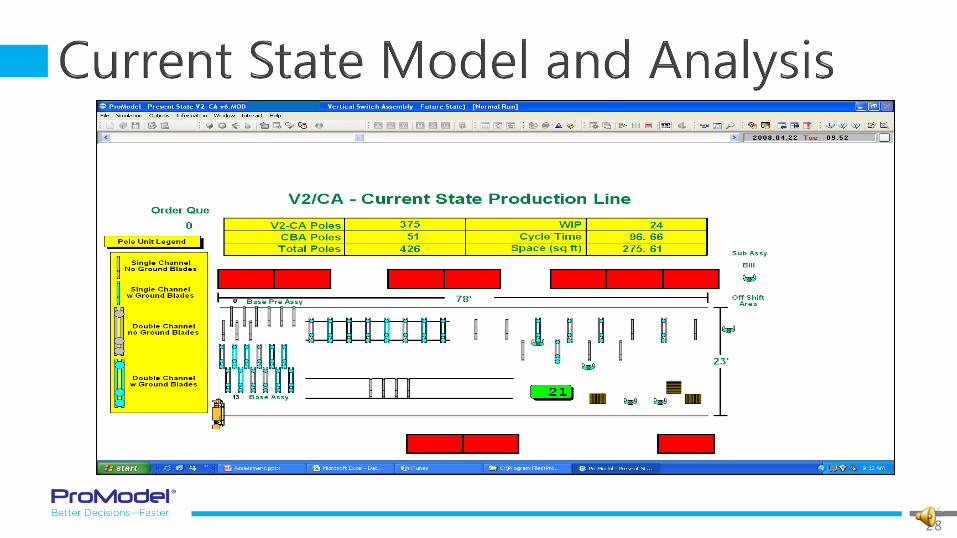
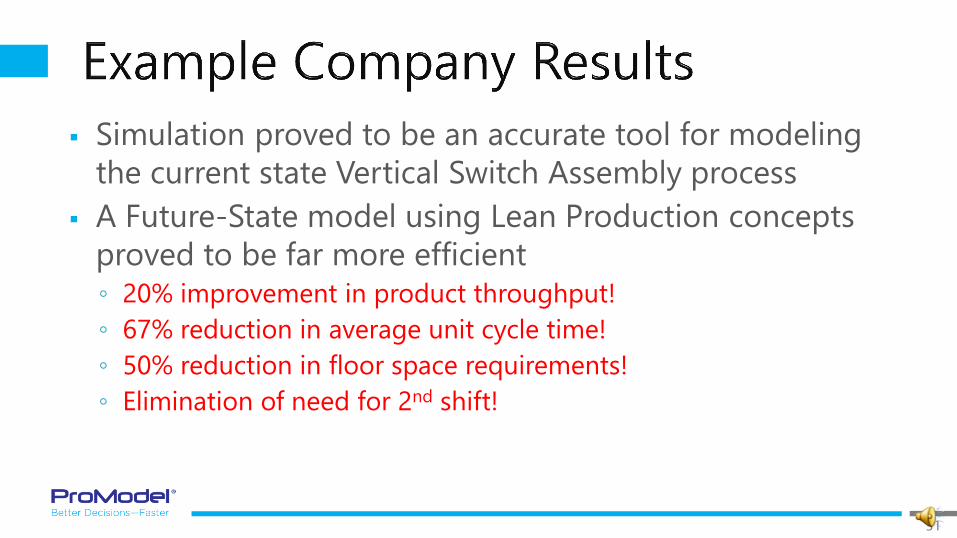
Simulation proved to be an accurate tool for modeling
the current state Vertical Switch Assembly process
A Future-State model using Lean Production concepts
proved to be far more efficient ◦ 20% improvement in product throughput!
◦ 67% reduction in average unit cycle time!
◦ 50% reduction in floor space requirements!
◦ Elimination of need for 2nd shift!
32
Identify the best opportunities ◦ Good ROI potential
Every additional unit produced can be sold
◦ (Fairly) Low Risk
Use a Sensei with years of modeling experience
Involve all stakeholders, especially line operators whenever possible
Be patient and allow your team time to develop modeling skillset. Make modeling a part of every major process change.
33
Update the models regularly so they are always
available to predict the future ◦ More & better data results in better decisions
Link to real-time data sources ◦ More & better data results in more accurate results
◦ Strategic Analysis becomes Tactical Analysis
34
Generis – 2015 American Manufacturing Summit Bruce Gladwin, ProModel Corporation