promoting sustainable energy technology transfers through ... · pdf filepromoting sustainable...
TRANSCRIPT
Promoting Sustainable Energy Technology Transfers
through the CDM:
Converting from a Theoretical Concept to Practical Action
EUROPEAN UNION SIXTH FRAMEWORK PROGRAMME
Specific Support Action
Project Acronym: ENTTRANS
Project full title: The Potential of Transferring and Implementing Sustainable Energy Technologies through the Clean Development Mechanism of the Kyoto Protocol
Contract number: 022673
Duration: January 2006 – December 2007
2
ENTTRANS consortium and advisors
Organisation full name Acronym Experts Country
1. Joint Implementation Network
Co-ordinator
JIN Catrinus J. Jepma
Wytze van der Gaast
Eise Spijker
The Netherlands
2. University of Edinburgh UEDIN Katherine Begg UK
3. Asian Institute for Technology AIT N. Mithulananthan
Animesh Dutta
Sarina Adhikari
Thailand
4. Public Power Corporation S.A. PPC Dimitrios Kaneloppoulos
Dimitris Manolopoulos
Greece
5. Interdisciplinary Center for Technological Analysis and Forecasting
ICTAF Yair Sharan
Asher Vaturi
Israel
6. National Technical University of Athens - Department of Electrical and Computer Engineering
EPU-NTUA Alexandros Flamos
Haris Doukas
Chara Karakosta
Greece
7. Intermediate Technology Development Group East Africa
ITDG EA Daniel Theuri Kenya
8. Cambio Climático y Desarollo CC&D José Eduardo Sanhueza Chile
9. Energy Delta Institute EDI Wim Mallon
Joris Bongenaar
The Netherlands
10. Kunming University of Science and Technology KUST Gang Deng
Liu Peng
Linghong Li
China
Advisors
11. Petr J. Kalas Czech Republic
12. Lubomir Nondek Czech Republic
3
Table of contents ENTTRANS consortium and advisors ............................................................................................ 2 Acronyms ........................................................................................................................... 5 Foreword ........................................................................................................................... 6 EXECUTIVE SUMMARY ............................................................................................................. 7
1. Introduction ................................................................................................................. 7 2. State of play of technology transfer under the CDM.................................................................. 7 3. Technology transfer and innovation insights ........................................................................... 8 4. Country market mapping for technology transfers ...................................................................10 5. Recommendations for accelerating technology transfers............................................................11
5.1. Need for demonstration of reliability and practicality of technology ........................................11 5.2. Energy Service Needs Assessment and familiarisation programme combined with TNA ...................11 5.3. Supporting Actions for successful technology transfer..........................................................12
6. Role of the CDM in acceleration of technology transfer .............................................................15 6.1. CDM Host Country Issues ............................................................................................15 6.2. CDM at the international level .....................................................................................16
7. Final Recommendation at International Level ........................................................................17 1. Introduction ................................................................................................................18 2. The State of Play with the CDM .........................................................................................20
2.1. Introduction..............................................................................................................20 2.2. The CDM pipeline .......................................................................................................20
2.2.1. Overview of projects and countries.............................................................................20 2.2.2. Project scale .......................................................................................................26 2.2.3. Prices of Certified Emission Reductions ........................................................................28
2.3. CDM success factors ....................................................................................................29 2.3.1. Forms of CDM and role of DNA...................................................................................30 2.3.2. CDM technology implementation chain aspects ...............................................................37
2.4. Key points from this Chapter..........................................................................................38 3. Assessing Countries’ Energy Service Needs and Technologies.......................................................39
3.1. Technology needs assessment: experience and literature ........................................................39 3.2. Energy needs assessment approach applied by ENTTRANS........................................................41 3.3. The ESNA approach .....................................................................................................44
4. Energy Needs Assessments in Case Study Countries ..................................................................47 4.1. Introduction..............................................................................................................47 4.2. Chile ......................................................................................................................47
4.2.1. Country context....................................................................................................47 4.2.2. CDM profile .........................................................................................................50 4.2.3. Energy Needs Assessment ........................................................................................51
4.3. China......................................................................................................................52 4.3.1. Country context....................................................................................................52 4.3.2. CDM profile .........................................................................................................55 4.3.3. Energy Needs Assessment ........................................................................................56
4.4. Israel......................................................................................................................61 4.4.1. Country context....................................................................................................61 4.4.2. CDM profile .........................................................................................................62 4.4.3. Energy Needs Assessment ........................................................................................64
4.5. Kenya .....................................................................................................................68 4.5.1. Country context....................................................................................................68 4.5.2. CDM profile .........................................................................................................69 4.5.3. Energy needs assessment.........................................................................................71
4.6. Thailand..................................................................................................................74 4.6.1. Country context....................................................................................................74 4.6.2. CDM profile .........................................................................................................76 4.6.3. Energy Needs Assessment ........................................................................................79
4.7. Discussion and conclusions of a cross-country analysis ............................................................82 4.7.1. Energy service priorities..........................................................................................82 4.7.2. Priority technologies to meet energy service requirements.................................................83
4.8. Exploration of different viewpoints in assessment of technological preferences..............................85 4.9. Overall comparison of ESNA with EGTT procedures................................................................85 4.10. Problems with assessment of preferred technologies ............................................................87 4.11. Conclusions and recommendations..................................................................................88
5. Technology Transfer Aspects: Mapping markets for technologies ..................................................90 5.1. Introduction to technology transfer ..................................................................................90
4
5.1.1. What is technology transfer and what is really transferred? ................................................90 5.1.2. Technology Transfer and Innovation ............................................................................92 5.1.3. Technology transfer and economic growth ....................................................................96 5.1.4. Summary of insights from the literature .......................................................................97
5.2. Market mapping .........................................................................................................98 5.2.1. The Market Mapping Technique .................................................................................98 5.2.2. The market mapping process .................................................................................. 100
6. Low-Carbon Technology Market Mapping in the Case-study Countries........................................... 102 6.1. Market mapping in co-operation with stakeholders.............................................................. 102
6.1.1. Drawing market maps........................................................................................... 102 6.1.2. Comparison of market maps across case study countries .................................................. 113
6.2. Opportunities identified from market mapping................................................................... 115 6.3. Comparison of Barriers/Blockages across countries.............................................................. 118
6.3.1. Overview of barriers and blockages from the case-study country workshops........................... 118 6.3.2. Comparison of blockages for technology transfer from a range of sources.............................. 122 6.3.3. Conclusions and Recommendations on dealing with barriers/blockages................................. 124
6.4. Future steps ........................................................................................................... 124 7. Technology Transfer Acceleration and the Role of the CDM....................................................... 125
7.1. Accelerating technology transfers in developing countries ..................................................... 125 7.1.1. Market Networks................................................................................................. 125 7.1.2. Market information systems and raising awareness......................................................... 125 7.1.3. Investment facilitation.......................................................................................... 125 7.1.4. Supporting the operation of the market...................................................................... 126 7.1.5. Support for host government. ................................................................................. 127
7.2. The role of the CDM in accelerating low-carbon technology transfers ........................................ 127 7.2.1. General aspects related to how the CDM could enhance technology transfer .......................... 128 7.2.2. CDM Host Country Issues........................................................................................ 128 7.2.3. CDM at the international level................................................................................. 129
7.3. Final recommendation at international Level..................................................................... 130 References ...................................................................................................................... 132 Annex 1 – Questionnaire....................................................................................................... 139
5
Acronyms
AIT Asian Institute for Technology
A/R Afforestation /Reforestation
CC&D Cambio Climático y Desarollo
CDM Clean Development Mechanism
CDM EB CDM Executive Board
CNG Compressed natural gas
CO2 Carbon dioxide
COP Conference of the Parties to the UNFCCC
COP/MOP Conference of the Parties serving as the Meeting of the Parties to the Kyoto Protocol
DNA Designated National Authority
DOE Designated Operational Entity
EDI Energy Delta Institute
EPU-NTUA National Technical University of Athens - Department of Electrical and Computer Engineering
ETAP Environmental Technology Action Plan
EU European Union
EU ETS EU Emissions Trading Scheme
GHG Greenhouse gas
ICTAF Interdisciplinary Center for Technological Analysis and Forecasting
ITDG EA Intermediate Technology Development Group East Africa
JIN Foundation Joint Implementation Network
KUST Kunming University of Science and Technology
NPV Net Present Value
PCN Project Concept Note
PDD Project Design Document
PIN Project Identification Note
PPC Public Power Corporation S.A.
QELRC Quantified emission limitation and reduction commitment
RES Renewable Energy Sources
TNA Technology Needs Assessment
UEDIN University of Edinburgh
UNFCCC United Nations Framework Convention on Climate Change
6
Foreword
This document is the final report of the study “The Potential of Transferring and Implementing Sustainable Energy Technologies through the Clean Development Mechanism” (acronym: ENTTRANS), which has been carried out during 2006-2007 as a Specific Support for Policies Action under the EU 6th Framework Programme (contract: ENTTRANS SSA-022673). For this work an international consortium was formed with ten partners (see ENTTRANS consortium and advisors, below).
The objective of ENTTRANS was to analyse how transfer of sustainable energy technologies to developing countries could be supported through the Clean Development Mechanism (CDM) of the Kyoto Protocol. A typical CDM project would involve both a transfer of a low-carbon technology to a developing country which is in accordance with its domestic needs and priorities, and the generation of Certified Emission Reductions. The starting point for the ENTTRANS study was the observation that in actual CDM practice most attention has thus far been paid to the transfer of low-cost emission reduction credits.
In order to analyse how the CDM could address both transfers, the ENTTRANS team assessed, for five potential CDM host countries, how to base the choice of a technology in a CDM project from developing countries’ energy service needs and priorities. After that, it was analysed how the CDM could support the implementation chains for these technologies were analysed in the countries concerned. This action was based on an extensive stakeholder consultation.
Next to an extensive set of deliverables and overall support to building awareness in the case-study countries of technology transfer aspects and the CDM, ENTTRANS has delivered two specific tools to support international policy and decision-making. First, ENTTRANS has developed an Energy Service Needs Assessment (ESNA) approach as a widely applicable tool for future energy technology decision-making in developing (and in developed) countries. ESNA emphasises that technology transfers should be based on countries’ energy service needs and priorities formulated in a participatory approach with countries’ energy and environment decision-making stakeholders. Second, ENTTRANS has developed a tool to systematically map countries’ technology implementation chains and markets, including system blockages and incentives.
We believe that both outputs are important inputs to the work of, e.g., the Expert Group on Technology Transfer of the UNFCCC and individual countries.
For JIN it was a pleasure to work with our consortium partners University of Edinburgh (UK), Asian Institute of Technology (Thailand), Public Power Corporation (Greece), Interdisciplinary Center for Technological Analysis and Forecasting (Israel), National Technical University of Athens - Department of Electrical and Computer Engineering (Greece), Intermediate Technology Development Group East Africa (‘Practical Action’, Kenya), Cambio Climático y Desarollo (Chile), Energy Delta Institute (the Netherlands), and Kunming University of Science and Technology (China), as well as our advisors Peter Kalas and Lubomir Nondek.
Finally, we would like to thank Mr Domenico Rossetti di Valdalbero, Mr Gilles Lequeux, Mr Mats Ericsson and Mr Mathieu Grisel of the European Commission (DG Research) for the co-operation and support.
Catrinus J. Jepma and Wytze van der Gaast
ENTTRANS co-ordination Joint Implementation Network Groningen, 21 November 2008
7
EXECUTIVE SUMMARY
1. Introduction
The objective of the study “The potential of transferring and implementing sustainable energy technologies through the Clean Development Mechanism of the Kyoto Protocol” or ENTTRANS was to explore how the Clean Development Mechanism of the Kyoto Protocol (CDM) could support the transfer of sustainable energy technologies to developing countries. The approach chosen by the consortium was to explore the potential role of the CDM to help potential host countries develop a strategy for sustainable energy technology transfer and implementation. With the above in mind, the following main activities were carried out:
1. Identify for five case-study developing countries, using a questionnaire, energy service needs and priority technologies to meet those needs;
2. Analyse implementation chain circumstances for these priority technologies in the case-study countries by, among others, assessing technology implementation blockages and incentives; and
3. Analyse how the CDM could help in accelerating low-carbon technology transfers by supporting the improvement of technology implementation chains in CDM host countries.
The analysis has been supported by case studies in five developing countries – Chile, China, Israel, Kenya and Thailand – which are located in different parts of the world and have different economic and energy profiles. For each case-study country, a group of stakeholders, with representatives of business community entities (electricity production and distribution, and technology development), as well as key CDM stakeholders (developing country CDM experts, project participants, bi- and multilateral CDM programme officials, financial sector experts, risk management experts, etc.), were consulted to identify countries’ sustainable development priorities and possible sustainable energy technologies. Subsequently, together with stakeholders it has been analysed how implementation chains could be streamlined in order to facilitate the transfer of the priority technologies and what role the CDM could play in this respect.
2. State of play of technology transfer under the CDM
Given the twin objectives of the CDM a typical CDM project would bring together industrialised countries’ demand for certified emission reductions (CERs) and developing countries’ demand for sustainable (energy) technologies and other means to achieve development goals. The resulting technology transfer would be a low-carbon technology that supports the host country’s national needs and priorities. Actual CDM practice, however, has shown that projects are largely initiated by the demand for relatively low-cost CERs and this has resulted in a skewed distribution of projects toward a small group of developing host countries (China, India, Brazil, Mexico and South Korea). Asia and Latin America together have a share in the global CDM project pipeline of almost 95%. Sub-Sahara Africa only has a few projects and most of these are in South Africa. For CDM project investors the general investment climate in host countries is decisive when taking into account performance related risks.
Reasons often quoted for this unbalanced geographic distribution of projects are: Difference in quality of the CDM Designated National Authorities (DNA) in the host countries (in
terms of number of staff, skills, task envisaged, and funding). As a consequence, DNA activities could
8
differ from carrying out the formal tasks required by the CDM EB to actively promoting CDM project opportunities based on what the host country needs.
Scale of the CDM projects; large-scale projects are more popular as the CDM transaction costs related to the CER accounting can be spread across more credits; several small-scale projects are too small in terms of CER revenues to be able to pay for the transaction costs.
Investment climate in the host countries, which does not support technology transfer under the CDM.
The first of these issues has been addressed by some DNA support programmes (such as Capacity Building for the CDM or CD4CDM). Yet, much work remains to be done as there are still many differences in how DNAs operate, i.e. in terms of number of staff, their training background and professionalism, with most Asian and Latin American DNAs being relatively efficient, although some of them have in the meantime had to reform and streamline their procedures, whereas several African DNAs are operated by a limited number of staff who are also responsible for other environmental issues and therefore do not have time to fully focus on the CDM.
The risk of a DNA functioning at the minimally required level (i.e. doing the tasks required by the Marrakech Accords) is that CDM projects in their country become ad-hoc activities without necessarily being in line with the country’s development strategies or leading to adoption of the technology.
DNAs can also extend their required tasks (establishing sustainable development criteria for projects and carrying out project approval procedures) to promotional tasks. This, however, could lead to conflicts of interest because the aim to attract more CDM projects could lead to a less robust project proposal check and approval decision-making. Involving more governmental departments could help prevent such conflicts of interest, but this could make the procedure less efficient.
The CDM EB has recently started to address the second issue by the decision on the eligibility of so-called Programmes of Activities. Such programmes, which can have a lifetime of 28 years, provide a larger scope for very small-scale activities under the CDM, such as technologies for cooling, lighting and cooking, as they enable spreading of transaction costs across a larger range of emission reduction activities. In addition, such programmes may also provide for grouping of a range of similar larger-scale project investments on different locations in the host country. Remaining issues are: who is the programme owner, how will the revenues be spread across the participants?, etc. Nevertheless, such programmes could provide ample opportunities to incorporate the CDM in a host country’s national development strategies.
With respect to the third issue it has long been assumed that technology transfer could be facilitated by the CDM because a project offers CER revenues (in hard foreign currency) and possibly additional training programmes for operation and maintenance to local employees. However, ENTTRANS has shown that for many technologies these benefits are not enough for transfer and adoption of these technologies through CDM projects. In particular, low-carbon technologies that countries are unaware of or have no experience with or that are relatively new to a country and/or that may challenge existing systems in a country are generally not considered for meeting energy service needs. The CDM in its present form is unable to change that picture.
3. Technology transfer and innovation insights
In order to explore how low-carbon technology transfers can be accelerated and what role the CDM could play in that respect, this study has examined the technology transfer process mainly from the point of view of the receiving market and the decisions needed to adopt low-carbon technologies into that system or market. There is no doubt that technology transfer processes are complex and involve multi actor stakeholder networks in both the developed and developing country (Lundvall, 2002). The country context,
9
the institutional business context and particular technology have important characteristics which have to be taken into account in the technology transfer process. For the developing countries studied in this study there are two market forms; one concerned with large-scale technologies which tend to be at the national level and depend heavily on existing infrastructure and policies and the other is at the small-scale technology scale interacting with existing embedded markets and requiring distribution, maintenance and installer networks in the supply chain.
In all cases the literature shows that “Organisations operate in embedded socio-technical networks and tend to re-invest in established competences: disruptive technologies [e.g. renewable energy technologies] rarely make sense to incumbents so their development tends to be left to small outsider organisations.” (Winskel 2006)
Changing investments to low-carbon technologies will therefore be hampered by ingrained habits and training and past knowledge. From the ENTTRANS study it became clear that stakeholders interviewed in the case-study countries gave in several cases low priority to potentially useful technologies for a variety of reasons related to perceptions of readiness for market, costs, lack of knowledge and experience of the technology and the energy services it could provide especially in the country context, historic bad experiences, cultural incompatibility as well as anchoring in existing competences.
Therefore, technology transfer processes as they are currently arranged, including the CDM, will not provide for technology transfer and the innovation processes for low-carbon systems that they require unless additional activities are undertaken to improve knowledge and experience of low carbon technologies in the country context to avoid anchoring in existing systems and know-how.
It was also clear from the analysis of the questionnaires that though there seemed to be little disagreement on what energy service needs were required there was disagreement between different types of stakeholders as well as within the types of stakeholders on what the priority technologies should be. In every case it was important to take account of the existing country context and business environment and the technology priorities reflected these country conditions as well as the existing competences and attitudes.
Market pressures are also a factor where existing players who cannot adapt or foresee economic losses (Gruebler 1997) will bring pressure to stifle competition/innovation and keep the status quo. Market pressure in terms of Intellectual property rights is also used as a blocking tool. Such behaviour is common and can be seen in large existing market players. The sale, by developed countries, of older, less efficient technologies which may be cheaper for developing countries and play to their existing competences and knowledge is also a problem and can be used as a blocking mechanism as lock-in to a high carbon path will then occur. This is reflected in the call in Chapter 7 for avoidance of dumping.
For developing country networks, lack of awareness and experience of low-carbon technologies in the country context and uninformed perceptions of reliability, market readiness and costs need to be addressed in moving to a low carbon future. Rogers (1983) highlighted the importance of relative advantage, risk, complexity of use, compatibility, observability and trialability. In this study the expressed need to see low-carbon technologies demonstrated within the country context confirms the importance of trialability especially for decision making involving large and long term impacts such as future energy supply strategies. The other factors appear to be related to the barriers to adoption of low-carbon technologies also identified in the mapping and other elicitation exercises reported in chapter 6.
Therefore, it is recommended that for innovation for energy systems in a country (industrialised or developing) it is necessary to first of all ensure that all the stakeholders are familiar with, understand and have seen demonstration plants in their country context for alternative technologies not currently under consideration but which have a known potential to contribute to a low carbon future and are reliable and practical in their existing form or can be easily adapted to country conditions.
10
4. Country market mapping for technology transfers
As explained above, the ENTTRANS study developed an approach to assess, with stakeholders, countries’ energy service needs and priorities, such as electricity production for urban and/or rural areas, heating, cooling, industrial energy efficiency, etc. Next, a list of low-carbon technologies was considered by the same stakeholders in terms of their suitability to fulfil these energy service needs. The outcome of this combined participatory exercise was an impression of which low-carbon energy technologies would be suitable for fulfilling country’s energy service priorities.
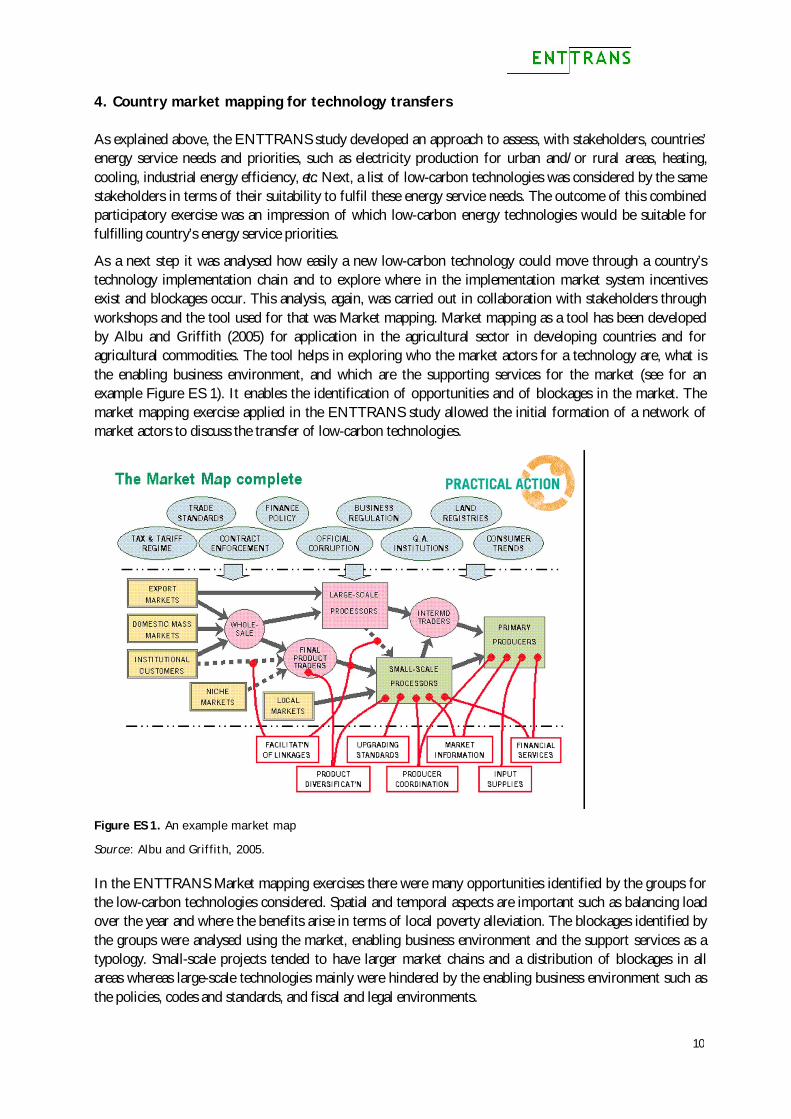
As a next step it was analysed how easily a new low-carbon technology could move through a country’s technology implementation chain and to explore where in the implementation market system incentives exist and blockages occur. This analysis, again, was carried out in collaboration with stakeholders through workshops and the tool used for that was Market mapping. Market mapping as a tool has been developed by Albu and Griffith (2005) for application in the agricultural sector in developing countries and for agricultural commodities. The tool helps in exploring who the market actors for a technology are, what is the enabling business environment, and which are the supporting services for the market (see for an example Figure ES 1). It enables the identification of opportunities and of blockages in the market. The market mapping exercise applied in the ENTTRANS study allowed the initial formation of a network of market actors to discuss the transfer of low-carbon technologies.
Figure ES 1. An example market map
Source: Albu and Griffith, 2005. In the ENTTRANS Market mapping exercises there were many opportunities identified by the groups for the low-carbon technologies considered. Spatial and temporal aspects are important such as balancing load over the year and where the benefits arise in terms of local poverty alleviation. The blockages identified by the groups were analysed using the market, enabling business environment and the support services as a typology. Small-scale projects tended to have larger market chains and a distribution of blockages in all areas whereas large-scale technologies mainly were hindered by the enabling business environment such as the policies, codes and standards, and fiscal and legal environments.
11
There were blockages common to all the case-study countries and some very specific to the country. For example, in Kenya one of the blockages was the lack of investment sources, while in Thailand this was not considered to be a problem. The identification of blockages and activities to improve technology transfer for low-carbon technologies have formed the basis for the following recommendations on activities to improve technology transfer and to improve the ability of the CDM to deliver technology transfer benefits.
5. Recommendations for accelerating technology transfers
As has been pointed out by IPCC (2000) one of the key lessons from the literature on accelerating technology transfers is that networking among stakeholders is essential and the best transfers occur where transfers deliver multiple benefits. The recommendations presented in the following sub-sections are therefore grounded in the studies on technology transfer and innovation and on the insights from the surveys and market mapping exercises performed in this study.
5.1. Need for demonstration of reliability and practicality of technology
To provide for innovation of low carbon systems, existing but less well-known low-carbon technologies need to be introduced and accepted by policymakers and industry through demonstration of reliability and practicality at the country level with a view to specific assessment for inclusion in a) country energy strategies and plans, and b) introduction to the country technology market.
5.2. Energy Service Needs Assessment and familiarisation programme combined with TNA
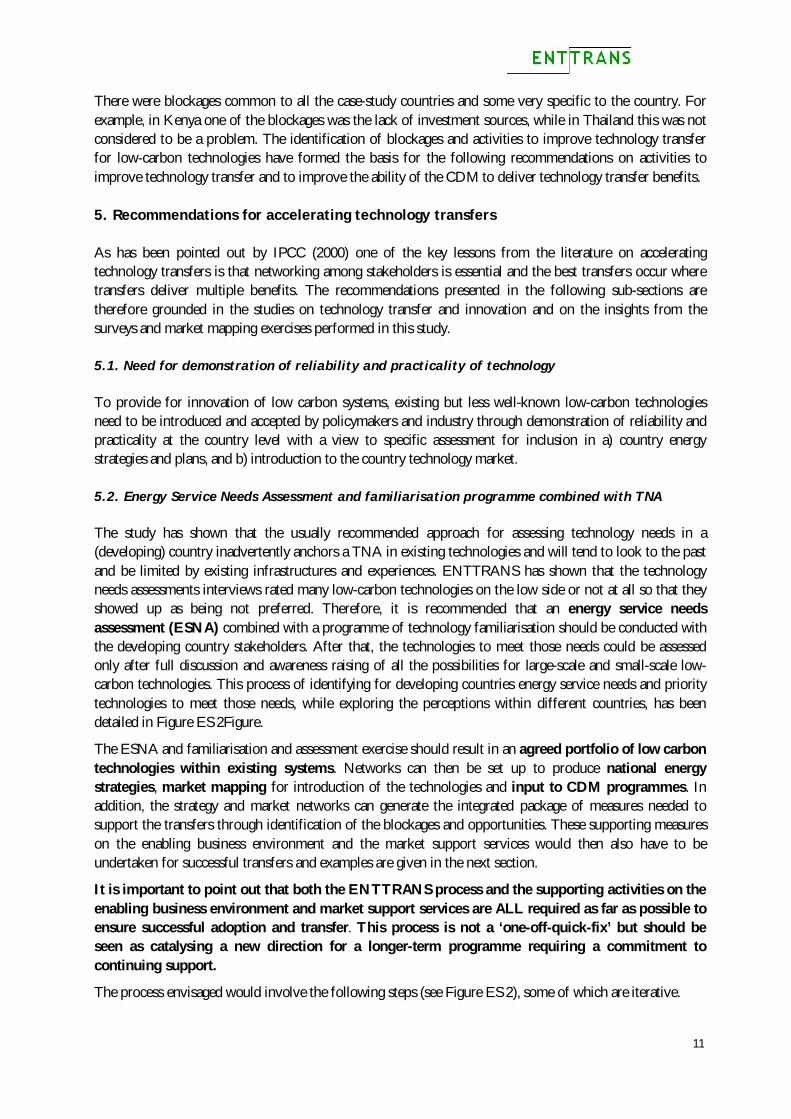
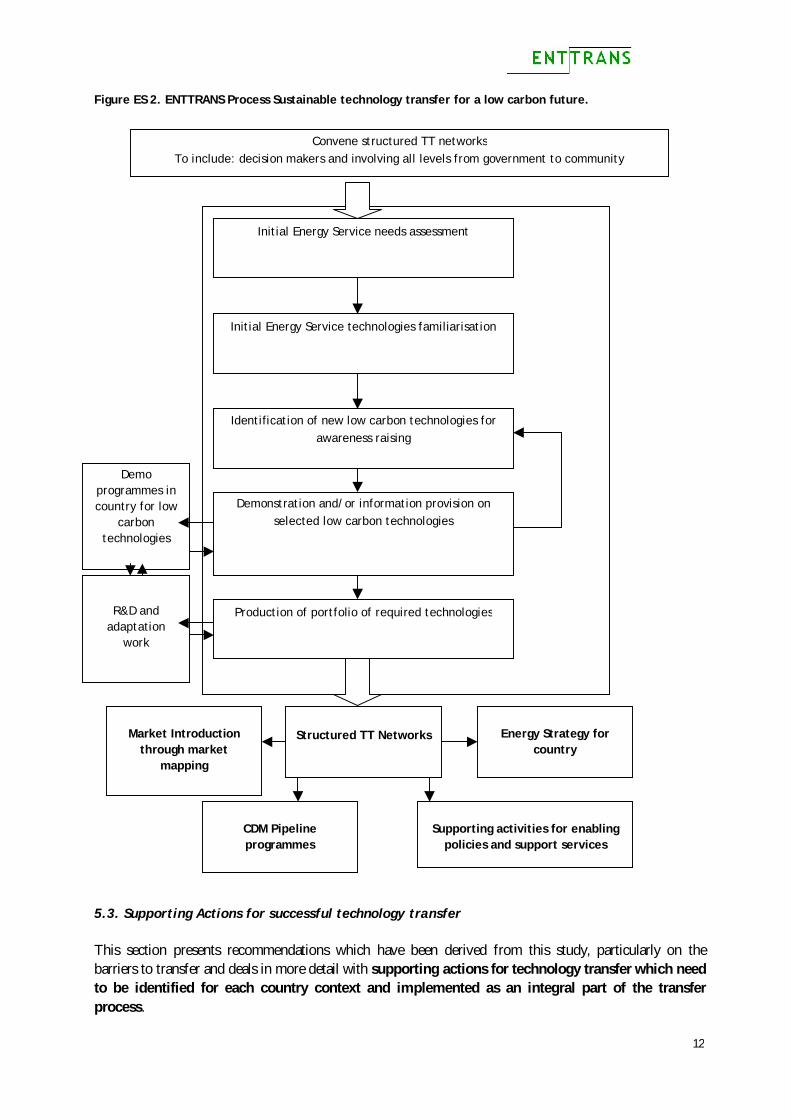
The study has shown that the usually recommended approach for assessing technology needs in a (developing) country inadvertently anchors a TNA in existing technologies and will tend to look to the past and be limited by existing infrastructures and experiences. ENTTRANS has shown that the technology needs assessments interviews rated many low-carbon technologies on the low side or not at all so that they showed up as being not preferred. Therefore, it is recommended that an energy service needs assessment (ESNA) combined with a programme of technology familiarisation should be conducted with the developing country stakeholders. After that, the technologies to meet those needs could be assessed only after full discussion and awareness raising of all the possibilities for large-scale and small-scale low-carbon technologies. This process of identifying for developing countries energy service needs and priority technologies to meet those needs, while exploring the perceptions within different countries, has been detailed in Figure ES 2Figure.
The ESNA and familiarisation and assessment exercise should result in an agreed portfolio of low carbon technologies within existing systems. Networks can then be set up to produce national energy strategies, market mapping for introduction of the technologies and input to CDM programmes. In addition, the strategy and market networks can generate the integrated package of measures needed to support the transfers through identification of the blockages and opportunities. These supporting measures on the enabling business environment and the market support services would then also have to be undertaken for successful transfers and examples are given in the next section.
It is important to point out that both the ENTTRANS process and the supporting activities on the enabling business environment and market support services are ALL required as far as possible to ensure successful adoption and transfer. This process is not a ‘one-off-quick-fix’ but should be seen as catalysing a new direction for a longer-term programme requiring a commitment to continuing support.
The process envisaged would involve the following steps (see Figure ES 2), some of which are iterative.
12
Figure ES 2. ENTTRANS Process Sustainable technology transfer for a low carbon future.
5.3. Supporting Actions for successful technology transfer
This section presents recommendations which have been derived from this study, particularly on the barriers to transfer and deals in more detail with supporting actions for technology transfer which need to be identified for each country context and implemented as an integral part of the transfer process.
Convene structured TT networks To include: decision makers and involving all levels from government to community
Initial Energy Service needs assessment
Initial Energy Service technologies familiarisation
Identification of new low carbon technologies for awareness raising
Demonstration and/or information provision on selected low carbon technologies
Production of portfolio of required technologies
R&D and adaptation
work
Structured TT Networks
Energy Strategy for
country
Market Introduction
through market mapping
CDM Pipeline programmes
Supporting activities for enabling
policies and support services
Demo programmes in country for low
carbon technologies
13
Fostering the creation of networks of market actors to facilitate technology transfer activities through characterisation of the market for the technology
Market Networks – The shaping of a market with its actors and supply chains depends on the technology being transferred and the country context. The formation of networks of market actors through the process of conducting Market Mapping exercises would be needed to first identify the economic actors and then identify, together with these local actors, the possible technology supply chains and their enabling business environment and supporting services. The formation of market networks strengthens the operation of the market and contributes to examination of the existing market chain, e.g. through highlighting blockages and inefficiencies at all levels within the market including at government and regulatory level. Further action can then be generated to address these problems. This is the first part of the diagram in Figure ES 2 above.
Stimulating Market Demand
Market information systems and Raising awareness – Creation of demand and incentives for change is a major element in enabling the market to develop and so it is important to make information available and raise awareness. This would imply a two-pronged approach with awareness raising exercises on a large scale via the media coupled to good market information on reliability and quality of suppliers and systems. Also clear price signals for energy technology and CO2 emission reductions are needed.
Investment facilitation
Risk minimisation – The risk to the investor (both national or international investors) associated with introduction of a new technology needs to be minimised. There are several activities to do this such as by introduction of the technology in an institutional or industry sector context to create a demand and /or through either government/FDI sponsored programmes of demonstration of low carbon technologies or through bundling/ programmatic basis under the CDM. This would provide a ready-made market which generates confidence and awareness. If the technology is properly implemented and is shown to be reliable and useful, then this can assist in a wider dissemination and development. Further participatory consultations with investors in the countries would characterise risk mitigation strategies more fully as a first step. Small-scale businesses are particularly vulnerable. This would also help overcome the problem of first movers taking all the risks while others free ride.
Multiple funding sources – Limited availability of sources of investor funding are a major problem in many countries. Therefore, multiple funding sources and ease of application and information availability would help this development.
Investment Criteria – Technology choices also have to avoid the trap of least financial cost solutions and take account of the externalities. In several countries, there are implicit subsidies for existing technologies and so policies to level the playing field for new market entrants are needed. New approaches to funding demonstration and small-scale projects are also essential with reappraisal of the suitability of other investment criteria such as payback time and other criteria as appropriate.
Supporting the operation of the market.
Transparency control – Good transparency control, especially avoiding corruption on the enforcement side, is extremely important for proper development of a market and for maintaining good reputation and customer relations. Too often, for instance with compact fluorescent lamps (CFLs), there seems to be poor quality control leading to growing resistance to change to CFLs after bad experiences and wasted resources.
14
R&D – Adaptive research and development for low-carbon technologies to ensure suitability for local conditions is needed and to encourage development of new technologies and to build technical capacity.
Training – Appropriate installer, operation, maintenance and servicing, and management skills training would be needed to support the technology transfer and delivery of local benefits. Programmes of training support could be provided alongside the main technology projects or CDM projects. This sort of capacity building is an important component in successful transfer.
Support promising technologies and increase their availability – In some cases, really good technologies with huge potential such as solar thermal for cooling in developing countries are not being used and the fine detail and availability of these systems are not entirely clear. An off-the-shelf solar thermal space cooling option is not really available, e.g. for householders or hoteliers, etc., but a much more focussed development in the country contexts involving manufacturers and suppliers, as well as skills development for installation and design is vital. Integration with architectural practice would also be very good. Targeted investment in the short term to make the technologies fully available would yield large GHG benefits. The same applies to concentrating solar power and to hybrid combinations of renewables to provide integrated solutions. This activity combined with risk minimisation would provide good initial support.
Access of industrial sector to technological knowledge – Support for exhibitions of new technologies and possible discounts and incentives to take part in programmes of projects may be a useful way forward here to encourage manufacturers to change and provide captive short term markets to facilitate investments.
Support for host country government
Host country policy framework – Facilitating countries’ ability to formulate a policy framework, legislative and fiscal incentives and other measures to address countries’ technological needs and gaps. At the Annual Meeting of the World Business Council for Sustainable Development, the EU Development Days in Lisbon, and the World Energy Conference it was recommended by participants, and in particular by industry representatives that government leadership is needed to establish transparent, long-term and stable policy targets and strategies. This also involves an integration of climate change issues in international development co-operation. Consideration also needs to be given to appropriate policies to offset any blocking tactics from monopolies in the market.
Streamlining of countries technology transfer processes – The host government departments involved need to be streamlining and aligning policies, incentives and procedures with regard to their role in and impact on the transfer process so that, e.g., import/export barriers are not counterproductive for low-carbon technology transfers.
Support for capacity building – The host government capacity to make the suggested changes and support for technology transfer will require funding and training
Interface between decentralised systems and the grid – For electricity supply projects the interface between decentralised systems and the grid is an area of concern which could also be assisted by a programme of technology transfer activities which could address issues such as feed-in tariffs and charges for grid connections and the creation of ‘virtual’ power stations and smart metering. Decentralised energy supply technologies and systems can play an important role in the energy security of supply, also in developing countries, because its role is complementary to centralised energy provision (even based on local renewable energy resources).
15
6. Role of the CDM in acceleration of technology transfer
The following recommendations are made against the backdrop that the key parties involved in the CDM (CDM EB, developing countries, and industrialised countries) have a joint responsibility in stimulating low-carbon, sustainable energy technologies to developing countries through CDM projects. The EU could play an important role in supporting each of these responsibilities.
6.1. CDM Host Country Issues
Strengthening the role of the CDM in low-carbon sustainable technology transfers.
1. Promotion/marketing of Designated National Authorities (DNAs) as one-stop-shops for CDM activities. This involves streamlining the process for foreign investors, as well as initiatives to build capacity within DNA and within sectors for project participants for all aspects of the CDM, including bundling of CDM projects and programmatic CDM. It is suggested that DNAs are assisted in achieving these tasks and build capacity (e.g. DGIS in the Netherlands, DANIDA in Denmark, GTZ in Gemany, etc.). It is also important that DNAs do not operate in isolation from other policies and decision makers at the government level (ministries of finance, development planning, energy, agriculture, trade, etc.) and there are integration structures in place.
2. Support is also needed for the formulation of low-carbon CDM strategies by the host country based on national needs and priorities and suitable technologies for which technology implementation chains have been clearly mapped and streamlined along the lines explained in the ENTTRANS process in Figure ES 2. As explained above it is important that these strategies are based on participatory processes and information collection and analysis with good two-way communications. Such strategies also involve awareness creation especially for industry and project proponents with trade associations to be involved. Technology choices also have to avoid the trap of least financial cost solutions and take account of the externalities. These low-carbon CDM strategies thus formulated should lead to a domestic CDM project pipeline in line with priorities identified as well as to market introductions.
3. CDM in its programmatic form could also support programmes of demonstration projects covering a range of sizes, sectors, locations, implementation models and scales of country conditions to prove and adapt the technologies using a participatory process. One-off projects can be useful but a portfolio or programme approach to projects should be preferred where possible.
4. Although formulating CDM strategies is a country-specific exercise depending on the different country contexts, it is also recommended that countries collaborate through regional co-operation in order to share experience and to establish South-South dialogues. For instance, the ENTTRANS analysis in the five case study countries could thus be expanded towards a regional scope: Chile – Latin America; China – Asia (e.g. India); Kenya – Sub-Sahara Africa; Israel – MEDA countries; Thailand – Southeast Asia (e.g. Lao PDR, Vietnam, Nepal, Cambodia). Countries could use the ENTTRANS combined TNA methodology for energy service and technology assessments with market mapping and supporting activities promoting low carbon technology transfers through CDM projects.
5. Assistance to project developers for the preparation of project design documents to reduce transaction costs taking account of language barriers could improve uptake of CDM opportunities. Accessible and simple information for people to undertake a project design document would be a first step. Accessibility is an issue in countries where Internet connections are not reliable. Equally important to reduce costs and stimulate local interest will be support for programmes to develop local accredited validation and verification entities to reduce CDM project cycle costs. Guarantees for the purchase of CERs in this commitment period and after 2012 such as those by the World Bank would also contribute to minimising risks and costs.
16
6. CDM projects to be linked with development initiatives where appropriate. Although CDM projects should not use Official Development Assistance (ODA) funds for the investment and acquisition of CERs, the expertise in development projects would be a valuable input for the CDM projects as suggested at COP-MOP-2 held in Nairobi (Kenya, November 2007). Such deliberate links between CER acquisition and development assistance experts would ensure maximisation of local development benefits under the CDM.
6.2. CDM at the international level
Streamlining CDM procedures to make the mechanism more accessible for investments in, e.g., small-scale projects or energy efficiency activities across a range of installations in an industrial sector is the main aim of the following recommendations:
1. Explicit guidance on Technology Transfer and avoidance of dumping needs to be incorporated into the modalities of the CDM.
2. Review the additionality concept - For some developing countries there are no other projects which would be undertaken in the absence of the project and the country circumstances should be recognised when assessing additionality of emission reductions. It would therefore be better to have a more positive approach to additionality in the sense that a project is additional because it is required: a) to adopt a participatory approach to the project design and development, and b) to establish capacity building actions such as setting up on going training schemes to maximise the transfer and local benefits. This would at the same time stimulate the involvement of local stakeholders in project identification and preparation and would thus enhance participatory process in the preparation of projects.
3. In order to make the CDM fit for technology transfer and for sustainable development it could be used mainly in the programmatic mode. Programmatic CDM can be used to demonstrate new technologies under a range of different
circumstances in the country and this has to be supported by the specific activities detailed under Technology Transfer issues and CDM host country issues (both detailed above) otherwise it will not support technology transfer. These specific supporting actions could themselves become a programmatic CDM project.
Programmatic CDM is very suitable for energy efficiency improvement projects in households (e.g. cooking, lighting) and industry (e.g. one technology applied within an industrial sector at different locations but under similar circumstances), but its applicability needs to be improved by: Streamlined programme approval and registration procedures (presently around 400 days), Allowing more than one methodology for baselines and monitoring for calculating the
emission reductions of activities within the programme (e.g. methodologies for insulation and fuel switch within a built environment retrofit programme), which is presently limited to one methodology only.
Programmatic CDM requires monitoring modalities: case-by-case monitoring of activities’ performance when activities within the programme are large-scale; sample monitoring when activities are small-scale.
4. Enable the development of new methodologies for GHG accounting procedures (including baselines) of CDM projects by experts (as a result of research) to be given to developers and the EB rather than the developers bearing the costs of preparing new methodologies by themselves, as is current practice.
5. Devise alternative schemes to minimise the up front loading of costs of project design documents, for example by using CERs to pay the costs either by paying later or by borrowing or by using an increase in the levy to assist in offsetting the costs as well as by support for increased accreditation of local entities.
17
7. Final Recommendation at International Level
It is suggested that a new initiative be introduced under the UNFCCC to accelerate innovation. This would focus on the ENTTRANS integrated process (FigureFigure ES 2) from technology transfer network formation and ESNA assessment to technology demonstrations, technology needs assessment and final market innovation and supporting activities for the enabling business environment and market services as described above. The market network structures would be designed to link to energy strategies and markets as well as the CDM and would be facilitated by supporting actions for the enabling business environment and market support services. This would assist in accelerating the transfer process for less well known but potentially useful low-carbon technologies. Additional measures to ensure delivery of sustainability benefits and monitoring would have to be built in to such a system.
It would be separate from and in addition to the CDM improvements suggested above, though it could inform a proposed CDM country portfolio.
Such a participatory process to develop low-carbon futures and accelerate the transfer of low-carbon technologies in line with the Bali Roadmap agreement of December 2007 would provide a roadmap for all Parties to move forward and would provide substance to ‘meaningful participation in a post-2012 climate policy regime’ of developing and developed countries.
Possible targets for the amount of low-carbon technologies in the energy service mix over time would provide intermediate goals for eventual decarbonisation of the energy service systems in both developed and developing countries.
18
1. Introduction
The Kyoto Protocol of 1997 contains quantified emission limitation or reduction commitments for greenhouse gases (GHG) for a group of industrialised countries (UNFCCC, 1998). These commitments have been expressed as national GHG emission budgets (so-called assigned amounts); the budgets have been assigned for the period 2008-2012 and have been expressed as percentages of countries’ emission levels in 1990 (or a different base year as for some countries with economies in transition). Developing countries do not have such budgets and, therefore, they do not have quantified commitments.
The Protocol contains the possibility for industrialised countries to increase their emission budgets through emissions trading. This means that they can purchase from other countries credits which are based on GHG emission reductions achieved. One way to trade emission reduction credits is that countries with a surplus within their emissions budget (i.e. actual emissions lower than budget) sell this surplus to other countries, which have surpassed their budget limits. Another way to purchase emission reduction credits is by investing in projects in other countries. By investing in a project in a country with relatively low-cost emission reduction, an industrialised country could fulfil its Kyoto Protocol commitments at lower costs.
The Kyoto Protocol has established two mechanisms for project-based emissions trading. The first one is called Joint Implementation (JI) and enables industrialised countries (with assigned amounts) to jointly establish emission reduction projects. The emission reduction credits of JI projects are added to the emission budgets of the investor countries and deducted from host countries’ assigned amounts. As a result, JI projects do not increase the overall emissions budget of all industrialised countries listed in Annex B. The second mechanism is the Clean Development Mechanism (CDM), which enables project co-operation between industrialised and developing countries. The GHG emission reductions resulting from CDM projects can be sold as credits to an industrialised country. In order to make sure that a CDM project results in a CO2-neutral deal (i.e. the increase in the assigned amount of the industrialised country buying the credits is equal to the CO2-eq. emission reduction claimed by the project participants), rules have been established by the CDM Executive Board (CDM EB) for the accounting of these emission reductions.
In addition to the GHG emission reduction objective, CDM projects, according to the definition of the mechanism in the Kyoto Protocol (UNFCCC, 1998; Article 12.1), must support the sustainable development of the host countries. According to the Marrakech Accords of 2001, which provide further details on the modalities and procedures for the Kyoto Protocol, it is the prerogative of the host countries to assess whether CDM projects support their sustainable development (UNFCCC, 2002). As such, under the CDM sustainable development is considered a country context-specific aspect which could differ across countries. This does not mean that industrialised countries cannot play a role in supporting the contribution of CDM projects to sustainable development. After all, industrialised countries could decide that they only want to participate in projects with a large contribution to local economic development and with low or no negative impacts on the local environment, economy and society. For instance, as part of its CDM programme, the Netherlands Government used, during 2001-2005, a list of priority project categories which they considered to contribute most to sustainable development (VROM, 2003). In 2005, when the CDM market development accelerated (after the entry-into-force of the Kyoto Protocol on 16 February of that year) and competition among industrialised countries for acquisition of emission reduction credits quickly became stronger, the Netherlands Government decided to also purchase credits from projects that were not in the list of priority projects (Netherlands Ministry of Foreign Affairs, 2007).
Given this double-aim objective of the CDM – GHG emission reduction and enhancing sustainable development – a typical CDM project would bring together industrialised countries’ demand of GHG emission reduction credits and developing countries’ need for sustainable (energy) development. Ideally, a
19
CDM project would therefore be based on a clear assessment of both the GHG emission reduction potential and the technology needs and development priorities in the host country.
Since the CDM experience over the past couple of years has shown that several CDM projects are only loosely embedded in host countries’ sustainable energy strategies and mainly selected for their GHG abatement potential (see Chapter 3), this report proposes an approach to, first, assess for a number of CDM host countries their energy service needs and priorities and low-carbon technologies that would meet these, and, second, analyse the circumstances for implementing these technologies in the countries. The final part of the approach is to explore the role of the CDM in streamlining implementation chains in developing countries so that technologies selected based on energy service needs and priorities can be implemented successfully. CDM projects offer the possibility to improve the economics of a technology implementation project (through the value of the CO2 emission reductions) and could demonstrate technologies that decision-makers in the countries are unfamiliar with.
This approach has been developed on the basis of a literature review of existing knowledge, experience and activities, and the collection of new knowledge based on a stakeholder assessments of sustainable development needs and technology transfer aspects in five case study countries. For an assessment of existing information a review has been carried out using such sources as: the several proposals prepared by international researchers on an international climate policy regime for the period after 2012 (‘post-Kyoto’) with a particular focus on their technology orientation; reports on clean energy and development by national governments, multilateral organisations (e.g. World Bank, OECD/IEA, Climate Technology Initiative (CTI), Intergovernmental Panel on Climate Change (IPCC)), UN bodies (UNDP, UNEP), and non-governmental organisations (environmental and research-based NGOs); official documents on technology transfer by UN Conventions on Biological Diversity (CBD) and Climate Change (UNFCCC); reports prepared by the European Commission; and reports provided by international networks for sustainable energy technology knowledge and capacity building (e.g. REN21, REEEP).
The analysis has been supported by case studies in five developing countries – Chile, China, Israel, Kenya and Thailand – which are located in different parts of the world and have different economic and energy profiles. For each case-study country, a group of stakeholders, with representatives of business community entities (electricity production and distribution, and technology development), as well as key CDM stakeholders (developing country CDM experts, project participants, bi- and multi-lateral CDM programme officials, financial sector experts, risk management experts, etc.), were consulted to identify countries’ sustainable development priorities and possible sustainable energy technologies. Subsequently, together with stakeholders it has been analysed how implementation chains could be streamlined in order to facilitate the transfer of the priority technologies and what role the CDM could play in this respect.
The structure of this report is as follows. Chapter 2 presents an overview of the present CDM state-of-play (as per November 2008). Chapter 3 discusses the method of Energy Service Needs Assessments (ESNA) which has been developed by ENTTRANS to explore countries’ energy service needs and priorities. Chapter 4 reports on the stakeholder assessments carried out in the five case-study countries, using ESNA, and reports on the outcome of interviews held with stakeholders from these countries in terms of the countries’ energy service needs and priorities and suitable technologies. Chapter 5 discusses technology transfer and implementation aspects, which is followed by a report in Chapter 6 how these have been discussed with stakeholders in the case study countries. Finally, Chapter 7 presents insights and implications for technology transfer and the CDM from the study. It discusses capacity building needs in developing countries for technology implementation and CDM project development, as well as the possible support that the EU could provide in this context and how through reforms of the CDM the mechanism would be better able to support transfers of sustainable energy technologies to developing countries.
20
2. The State of Play with the CDM
2.1. Introduction
At COP-3 (Kyoto, Japan, December 1997), the CDM was introduced in the Kyoto Protocol as a project-based emissions trading mechanism. Officially, according to Article 12 of the Protocol, CDM projects could generate Certified Emission Reductions (CERs) as of the year 2000 for compliance use during the commitment period 2008-2012. However, the number of CDM projects only accelerated after the entry-into-force of the Kyoto Protocol in February 2005: from around 50 projects then to 4151 projects in November 2008 (projects that have been officially registered as CDM activities by the CDM EB or that are in the process of validation by a designated operation entity, Fenhann (2008)). The CERs can be used both by industrialised countries to comply with their Protocol commitments and by European installations to comply with their CO2 emission caps under the EU emissions trading scheme (ETS).
CDM projects can generate GHG emission reduction credits during a crediting lifetime of seven years, which can be renewed twice. At maximum, a project can thus have a crediting lifetime of 21 years.1 The renewal of the crediting lifetime after each period of seven years can be granted by the CDM EB if the project developers can demonstrate that the project will also for the next period of seven years result in real and additional CO2-eq. emission reductions.
2.2. The CDM pipeline
2.2.1. Overview of projects and countries
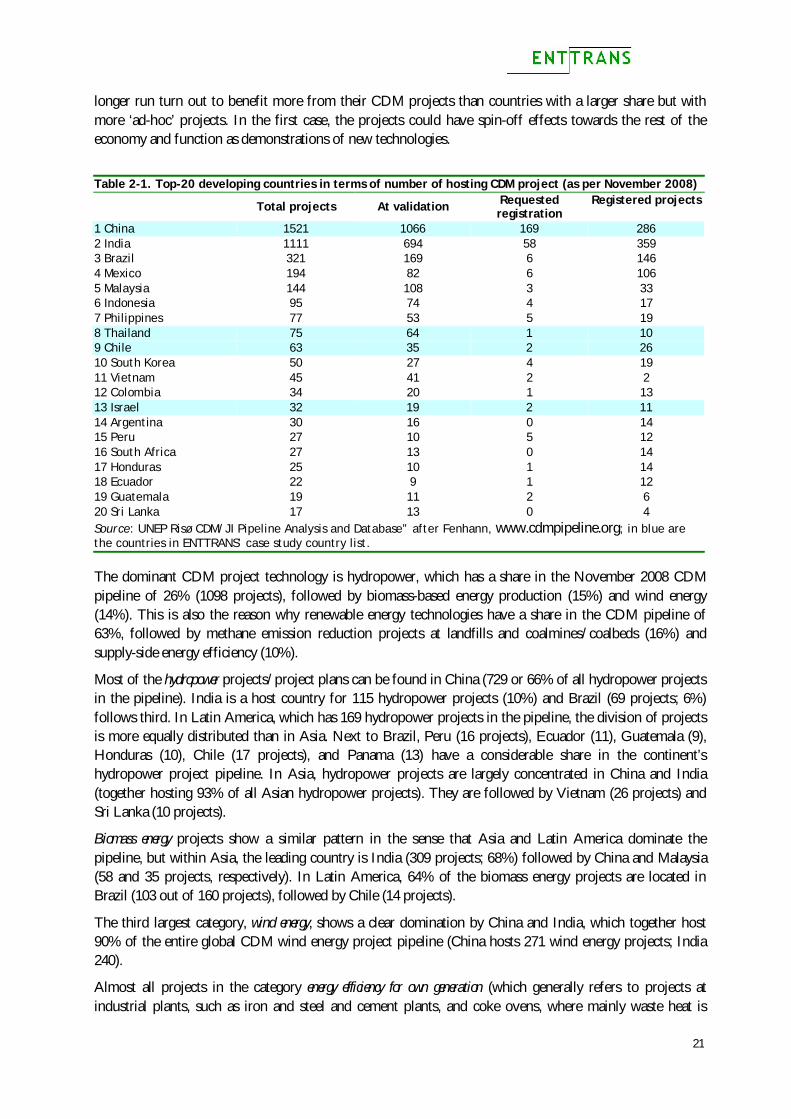
Table 2-1 shows the twenty developing countries that host most CDM projects (as per November 2008). It can be seen from the table that China, India, Brazil and Mexico are the leading host countries with a combined share of 75% of the total project pipeline (74% of projects under validation; 86% of projects for which registration has been requested; 75% of registered projects). From the table it also becomes clear that the top-10 only has three countries from Latin America (Brazil, Chile and Mexico) and none from Africa; South Africa is the only country from the African continent represented in the list.
In terms of division of projects across regions, Asia and the Pacific have 3174 projects in the CDM pipeline (76% of all), Latin America has 798 projects (19%), Africa has 84 projects (2%), the Middle East has 53 projects (1.3%), and Europe and Central Asia have 42 project s(1%). For most regions, the dominance of one or two countries is clear: China and India dominate the Asian region; Brazil and Mexico have most projects in Latin America; South Africa has most projects in Africa (27, followed by Egypt with 11); and in the Middle-East Israel has three times as many projects as the United Arabic Emirates. Only in the European and Central Asian region, there are around five countries with an equal number of projects (around 6).
It is also important to underline that the numbers presented above as such do not fully reveal the chances of a long-term success of a country as a CDM host country. For instance, as Ellis and Kamel (2007) argue, a country with a smaller share in the pipeline but with projects with a high replicability potential may in the
1 UNFCCC, 2002, Decision 17/CP.7-Annex, para.49. However, CDM projects in the field of carbon sequestration through afforestation and reforestation activities can, due to the generally longer lifetime of such activities, have a crediting period of 60 years at maximum.
21
longer run turn out to benefit more from their CDM projects than countries with a larger share but with more ‘ad-hoc’ projects. In the first case, the projects could have spin-off effects towards the rest of the economy and function as demonstrations of new technologies.
Table 2-1. Top-20 developing countries in terms of number of hosting CDM project (as per November 2008)
Total projects At validation Requested registration
Registered projects
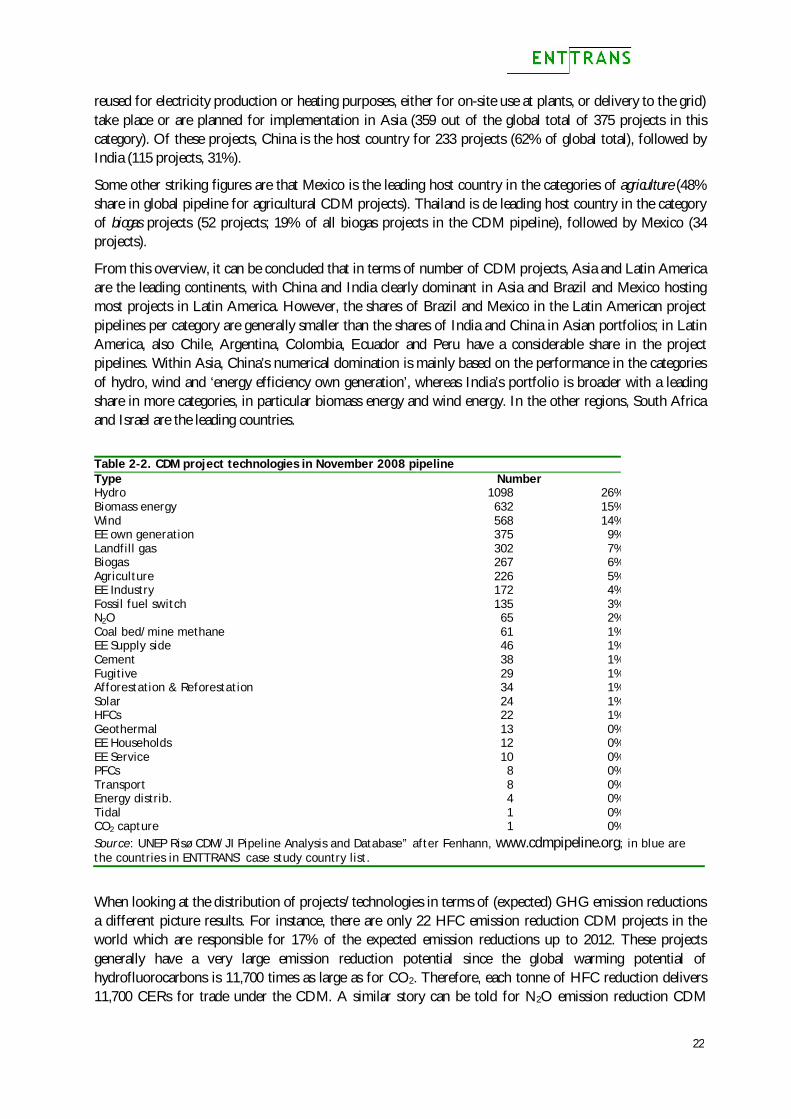
1 China 1521 1066 169 286 2 India 1111 694 58 359 3 Brazil 321 169 6 146 4 Mexico 194 82 6 106 5 Malaysia 144 108 3 33 6 Indonesia 95 74 4 17 7 Philippines 77 53 5 19 8 Thailand 75 64 1 10 9 Chile 63 35 2 26 10 South Korea 50 27 4 19 11 Vietnam 45 41 2 2 12 Colombia 34 20 1 13 13 Israel 32 19 2 11 14 Argentina 30 16 0 14 15 Peru 27 10 5 12 16 South Africa 27 13 0 14 17 Honduras 25 10 1 14 18 Ecuador 22 9 1 12 19 Guatemala 19 11 2 6 20 Sri Lanka 17 13 0 4 Source: UNEP Risø CDM/JI Pipeline Analysis and Database” after Fenhann, www.cdmpipeline.org; in blue are the countries in ENTTRANS’ case study country list. The dominant CDM project technology is hydropower, which has a share in the November 2008 CDM pipeline of 26% (1098 projects), followed by biomass-based energy production (15%) and wind energy (14%). This is also the reason why renewable energy technologies have a share in the CDM pipeline of 63%, followed by methane emission reduction projects at landfills and coalmines/coalbeds (16%) and supply-side energy efficiency (10%).
Most of the hydropower projects/project plans can be found in China (729 or 66% of all hydropower projects in the pipeline). India is a host country for 115 hydropower projects (10%) and Brazil (69 projects; 6%) follows third. In Latin America, which has 169 hydropower projects in the pipeline, the division of projects is more equally distributed than in Asia. Next to Brazil, Peru (16 projects), Ecuador (11), Guatemala (9), Honduras (10), Chile (17 projects), and Panama (13) have a considerable share in the continent’s hydropower project pipeline. In Asia, hydropower projects are largely concentrated in China and India (together hosting 93% of all Asian hydropower projects). They are followed by Vietnam (26 projects) and Sri Lanka (10 projects).
Biomass energy projects show a similar pattern in the sense that Asia and Latin America dominate the pipeline, but within Asia, the leading country is India (309 projects; 68%) followed by China and Malaysia (58 and 35 projects, respectively). In Latin America, 64% of the biomass energy projects are located in Brazil (103 out of 160 projects), followed by Chile (14 projects).
The third largest category, wind energy, shows a clear domination by China and India, which together host 90% of the entire global CDM wind energy project pipeline (China hosts 271 wind energy projects; India 240).
Almost all projects in the category energy efficiency for own generation (which generally refers to projects at industrial plants, such as iron and steel and cement plants, and coke ovens, where mainly waste heat is
22
reused for electricity production or heating purposes, either for on-site use at plants, or delivery to the grid) take place or are planned for implementation in Asia (359 out of the global total of 375 projects in this category). Of these projects, China is the host country for 233 projects (62% of global total), followed by India (115 projects, 31%).
Some other striking figures are that Mexico is the leading host country in the categories of agriculture (48% share in global pipeline for agricultural CDM projects). Thailand is de leading host country in the category of biogas projects (52 projects; 19% of all biogas projects in the CDM pipeline), followed by Mexico (34 projects).
From this overview, it can be concluded that in terms of number of CDM projects, Asia and Latin America are the leading continents, with China and India clearly dominant in Asia and Brazil and Mexico hosting most projects in Latin America. However, the shares of Brazil and Mexico in the Latin American project pipelines per category are generally smaller than the shares of India and China in Asian portfolios; in Latin America, also Chile, Argentina, Colombia, Ecuador and Peru have a considerable share in the project pipelines. Within Asia, China’s numerical domination is mainly based on the performance in the categories of hydro, wind and ‘energy efficiency own generation’, whereas India’s portfolio is broader with a leading share in more categories, in particular biomass energy and wind energy. In the other regions, South Africa and Israel are the leading countries.
Table 2-2. CDM project technologies in November 2008 pipeline Type Number Hydro 1098 26%Biomass energy 632 15%Wind 568 14%EE own generation 375 9%Landfill gas 302 7%Biogas 267 6%Agriculture 226 5%EE Industry 172 4%Fossil fuel switch 135 3%N2O 65 2%Coal bed/mine methane 61 1%EE Supply side 46 1%Cement 38 1%Fugitive 29 1%Afforestation & Reforestation 34 1%Solar 24 1%HFCs 22 1%Geothermal 13 0%EE Households 12 0%EE Service 10 0%PFCs 8 0%Transport 8 0%Energy distrib. 4 0%Tidal 1 0%CO2 capture 1 0%Source: UNEP Risø CDM/JI Pipeline Analysis and Database” after Fenhann, www.cdmpipeline.org; in blue are the countries in ENTTRANS’ case study country list.
When looking at the distribution of projects/technologies in terms of (expected) GHG emission reductions a different picture results. For instance, there are only 22 HFC emission reduction CDM projects in the world which are responsible for 17% of the expected emission reductions up to 2012. These projects generally have a very large emission reduction potential since the global warming potential of hydrofluorocarbons is 11,700 times as large as for CO2. Therefore, each tonne of HFC reduction delivers 11,700 CERs for trade under the CDM. A similar story can be told for N2O emission reduction CDM
23
projects in industrial sectors: there are 65 projects in the global CDM portfolio (1.5%) but since their global warming potential is 310 times that of CO2, the emission reductions result in an expected amount of 9% of all expected CERs up to 2012. On the other hand, the share of hydro (26% in terms of projects) is only 17% in terms of CO2-eq. emission reduction up to 2012. Although since 2005 industrialised countries have shown a strong interest in investing in CDM projects that reduce GHG emissions with a high global warming potential, nowadays a trend can be observed that the share of renewable energy projects is growing, both in terms of project activities and amount of CERs expected during the Kyoto Protocol commitment period 2008-2012.
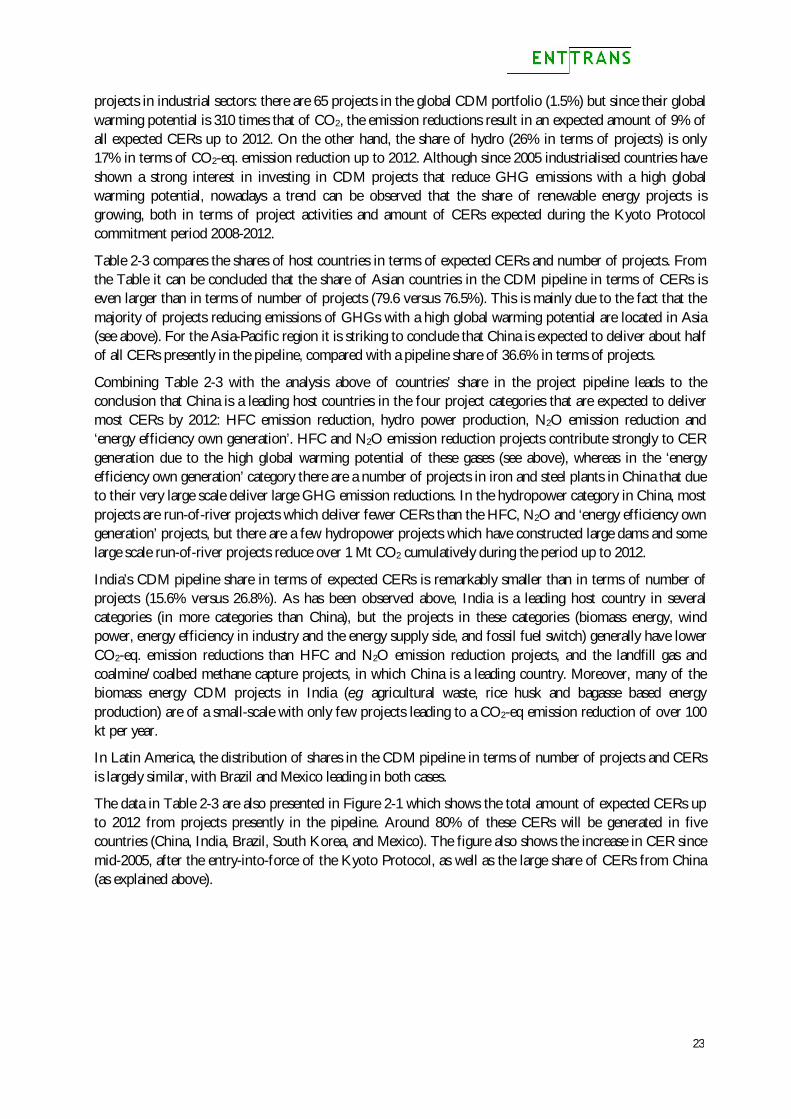
Table 2-3 compares the shares of host countries in terms of expected CERs and number of projects. From the Table it can be concluded that the share of Asian countries in the CDM pipeline in terms of CERs is even larger than in terms of number of projects (79.6 versus 76.5%). This is mainly due to the fact that the majority of projects reducing emissions of GHGs with a high global warming potential are located in Asia (see above). For the Asia-Pacific region it is striking to conclude that China is expected to deliver about half of all CERs presently in the pipeline, compared with a pipeline share of 36.6% in terms of projects.
Combining Table 2-3 with the analysis above of countries’ share in the project pipeline leads to the conclusion that China is a leading host countries in the four project categories that are expected to deliver most CERs by 2012: HFC emission reduction, hydro power production, N2O emission reduction and ‘energy efficiency own generation’. HFC and N2O emission reduction projects contribute strongly to CER generation due to the high global warming potential of these gases (see above), whereas in the ‘energy efficiency own generation’ category there are a number of projects in iron and steel plants in China that due to their very large scale deliver large GHG emission reductions. In the hydropower category in China, most projects are run-of-river projects which deliver fewer CERs than the HFC, N2O and ‘energy efficiency own generation’ projects, but there are a few hydropower projects which have constructed large dams and some large scale run-of-river projects reduce over 1 Mt CO2 cumulatively during the period up to 2012.
India’s CDM pipeline share in terms of expected CERs is remarkably smaller than in terms of number of projects (15.6% versus 26.8%). As has been observed above, India is a leading host country in several categories (in more categories than China), but the projects in these categories (biomass energy, wind power, energy efficiency in industry and the energy supply side, and fossil fuel switch) generally have lower CO2-eq. emission reductions than HFC and N2O emission reduction projects, and the landfill gas and coalmine/coalbed methane capture projects, in which China is a leading country. Moreover, many of the biomass energy CDM projects in India (e.g. agricultural waste, rice husk and bagasse based energy production) are of a small-scale with only few projects leading to a CO2-eq emission reduction of over 100 kt per year.
In Latin America, the distribution of shares in the CDM pipeline in terms of number of projects and CERs is largely similar, with Brazil and Mexico leading in both cases.
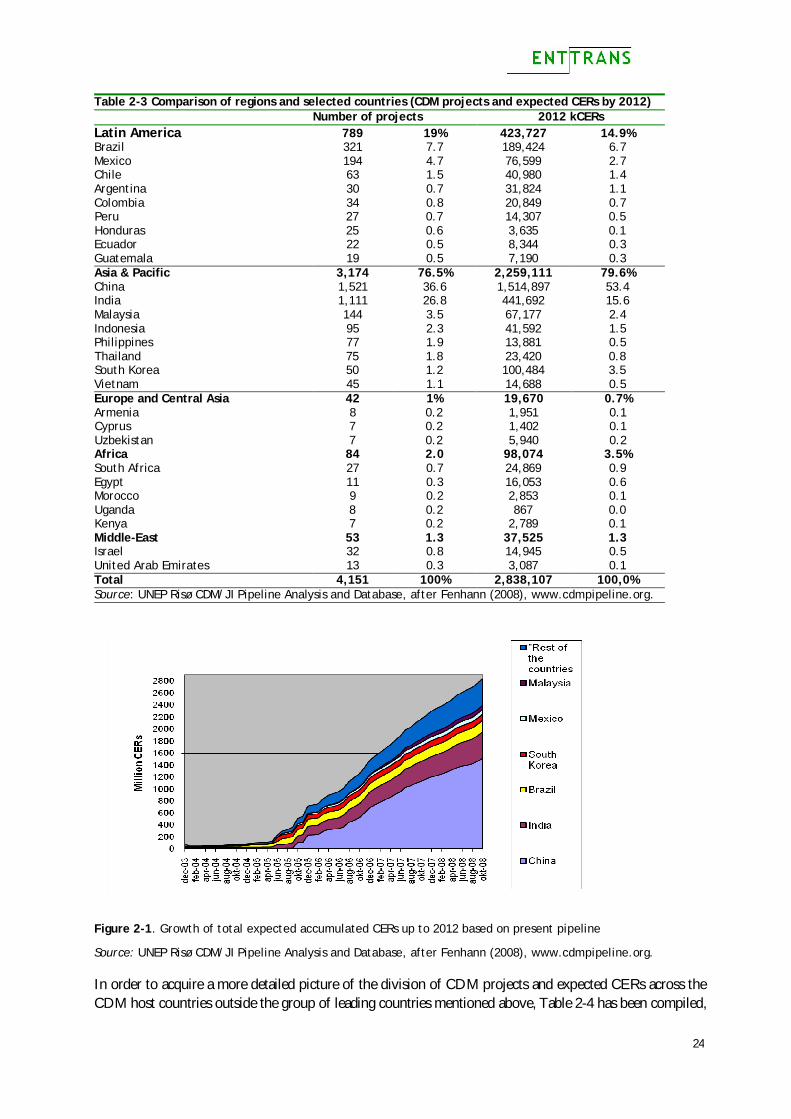
The data in Table 2-3 are also presented in Figure 2-1 which shows the total amount of expected CERs up to 2012 from projects presently in the pipeline. Around 80% of these CERs will be generated in five countries (China, India, Brazil, South Korea, and Mexico). The figure also shows the increase in CER since mid-2005, after the entry-into-force of the Kyoto Protocol, as well as the large share of CERs from China (as explained above).
24
Table 2-3 Comparison of regions and selected countries (CDM projects and expected CERs by 2012) Number of projects 2012 kCERs Latin America 789 19% 423,727 14.9% Brazil 321 7.7 189,424 6.7 Mexico 194 4.7 76,599 2.7 Chile 63 1.5 40,980 1.4 Argentina 30 0.7 31,824 1.1 Colombia 34 0.8 20,849 0.7 Peru 27 0.7 14,307 0.5 Honduras 25 0.6 3,635 0.1 Ecuador 22 0.5 8,344 0.3 Guatemala 19 0.5 7,190 0.3 Asia & Pacific 3,174 76.5% 2,259,111 79.6% China 1,521 36.6 1,514,897 53.4 India 1,111 26.8 441,692 15.6 Malaysia 144 3.5 67,177 2.4 Indonesia 95 2.3 41,592 1.5 Philippines 77 1.9 13,881 0.5 Thailand 75 1.8 23,420 0.8 South Korea 50 1.2 100,484 3.5 Vietnam 45 1.1 14,688 0.5 Europe and Central Asia 42 1% 19,670 0.7% Armenia 8 0.2 1,951 0.1 Cyprus 7 0.2 1,402 0.1 Uzbekistan 7 0.2 5,940 0.2 Africa 84 2.0 98,074 3.5% South Africa 27 0.7 24,869 0.9 Egypt 11 0.3 16,053 0.6 Morocco 9 0.2 2,853 0.1 Uganda 8 0.2 867 0.0 Kenya 7 0.2 2,789 0.1 Middle-East 53 1.3 37,525 1.3 Israel 32 0.8 14,945 0.5 United Arab Emirates 13 0.3 3,087 0.1 Total 4,151 100% 2,838,107 100,0% Source: UNEP Risø CDM/JI Pipeline Analysis and Database, after Fenhann (2008), www.cdmpipeline.org.
Figure 2-1. Growth of total expected accumulated CERs up to 2012 based on present pipeline
Source: UNEP Risø CDM/JI Pipeline Analysis and Database, after Fenhann (2008), www.cdmpipeline.org. In order to acquire a more detailed picture of the division of CDM projects and expected CERs across the CDM host countries outside the group of leading countries mentioned above, Table 2-4 has been compiled,
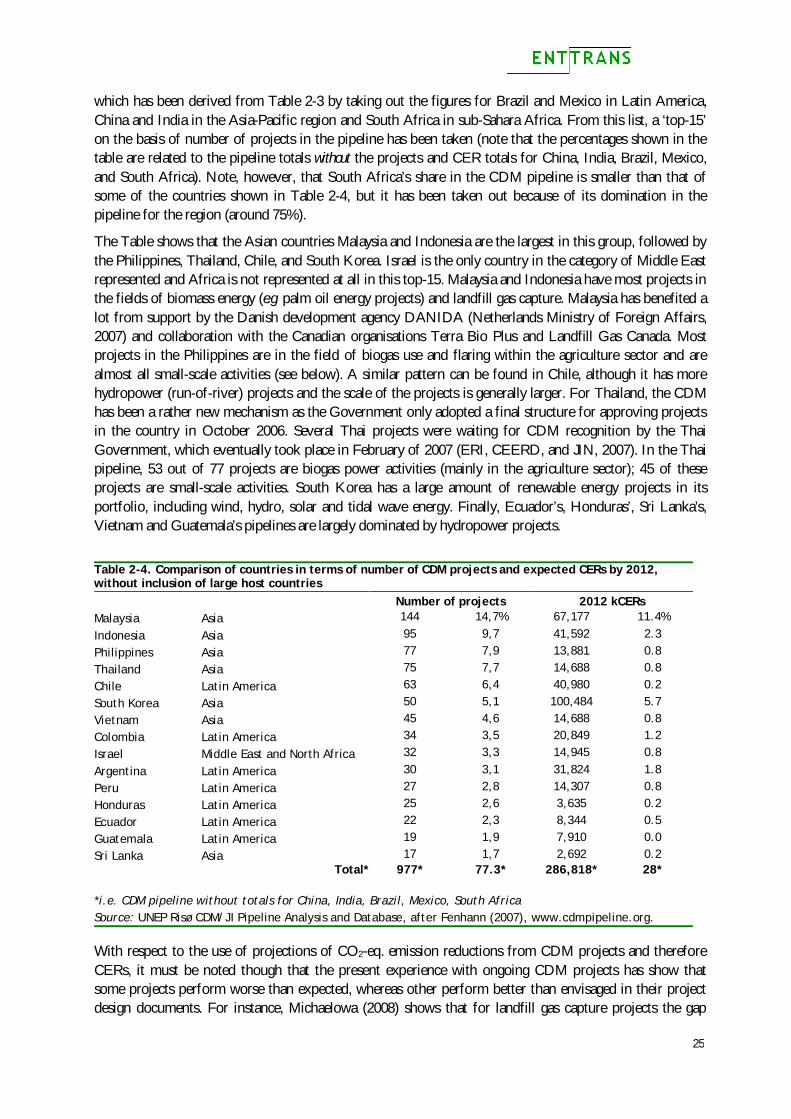
25
which has been derived from Table 2-3 by taking out the figures for Brazil and Mexico in Latin America, China and India in the Asia-Pacific region and South Africa in sub-Sahara Africa. From this list, a ‘top-15’ on the basis of number of projects in the pipeline has been taken (note that the percentages shown in the table are related to the pipeline totals without the projects and CER totals for China, India, Brazil, Mexico, and South Africa). Note, however, that South Africa’s share in the CDM pipeline is smaller than that of some of the countries shown in Table 2-4, but it has been taken out because of its domination in the pipeline for the region (around 75%).
The Table shows that the Asian countries Malaysia and Indonesia are the largest in this group, followed by the Philippines, Thailand, Chile, and South Korea. Israel is the only country in the category of Middle East represented and Africa is not represented at all in this top-15. Malaysia and Indonesia have most projects in the fields of biomass energy (e.g. palm oil energy projects) and landfill gas capture. Malaysia has benefited a lot from support by the Danish development agency DANIDA (Netherlands Ministry of Foreign Affairs, 2007) and collaboration with the Canadian organisations Terra Bio Plus and Landfill Gas Canada. Most projects in the Philippines are in the field of biogas use and flaring within the agriculture sector and are almost all small-scale activities (see below). A similar pattern can be found in Chile, although it has more hydropower (run-of-river) projects and the scale of the projects is generally larger. For Thailand, the CDM has been a rather new mechanism as the Government only adopted a final structure for approving projects in the country in October 2006. Several Thai projects were waiting for CDM recognition by the Thai Government, which eventually took place in February of 2007 (ERI, CEERD, and JIN, 2007). In the Thai pipeline, 53 out of 77 projects are biogas power activities (mainly in the agriculture sector); 45 of these projects are small-scale activities. South Korea has a large amount of renewable energy projects in its portfolio, including wind, hydro, solar and tidal wave energy. Finally, Ecuador’s, Honduras’, Sri Lanka’s, Vietnam and Guatemala’s pipelines are largely dominated by hydropower projects.
Table 2-4. Comparison of countries in terms of number of CDM projects and expected CERs by 2012, without inclusion of large host countries Number of projects 2012 kCERs Malaysia Asia 144 14,7% 67,177 11.4%
Indonesia Asia 95 9,7 41,592 2.3
Philippines Asia 77 7,9 13,881 0.8
Thailand Asia 75 7,7 14,688 0.8
Chile Latin America 63 6,4 40,980 0.2
South Korea Asia 50 5,1 100,484 5.7
Vietnam Asia 45 4,6 14,688 0.8
Colombia Latin America 34 3,5 20,849 1.2
Israel Middle East and North Africa 32 3,3 14,945 0.8
Argentina Latin America 30 3,1 31,824 1.8
Peru Latin America 27 2,8 14,307 0.8
Honduras Latin America 25 2,6 3,635 0.2
Ecuador Latin America 22 2,3 8,344 0.5
Guatemala Latin America 19 1,9 7,910 0.0
Sri Lanka Asia 17 1,7 2,692 0.2 Total*
977* 77.3* 286,818* 28*
*i.e. CDM pipeline without totals for China, India, Brazil, Mexico, South Africa Source: UNEP Risø CDM/JI Pipeline Analysis and Database, after Fenhann (2007), www.cdmpipeline.org. With respect to the use of projections of CO2-eq. emission reductions from CDM projects and therefore CERs, it must be noted though that the present experience with ongoing CDM projects has show that some projects perform worse than expected, whereas other perform better than envisaged in their project design documents. For instance, Michaelowa (2008) shows that for landfill gas capture projects the gap
26
between expected and realised emission reductions can be very large: in several cases, only 10 to 15% of the estimated methane reduction credits could be verified and subsequently issued. This low performance ratio can partly be explained by the problem that it is often difficult to accurately estimate how much methane has actually been built up in the course of time. Often, data on past delivery of waste to landfills does not exist and must be derived from present data based on, e.g., recently installed weighbridges. For HFC-23 emission reduction projects, this ratio is around 75%, whereas for N2O emission reduction project even more CERs are generated than expected.
Fenhann (2008) compares on a monthly basis the difference between initially expected CO2 emission reductions and eventually verified emission reductions and issued CERs (according to the CDM procedure, see below, an external designated entity verifies the emission reductions achieved, after which the CDM EB, based on this verification, issues CERs to the buying entity or country). In his estimate in November 2007, he showed that of the total pipeline of 4151 projects, 412 projects are ongoing and have delivered 204 million CERs. For these projects, a CER issuance success rate of 95.5% has been calculated by Fenhann (2008), although there are strong differences between the project categories. Projects aiming at reducing fugitive gas, HFC and N2O emissions have thus far performed better than expected (between 104 and 118% issuance rate), while, on the other hand, geothermal energy (27%), landfill gas recover (37%), coalmine/-bed methane capture (41%), agriculture (46%), and transport sector project (47%) have a success ratio of less than 50% of initially expected CERs.
2.2.2. Project scale
Finally, the CDM project pipeline can be analysed from the perspective of whether a project is of a large or small scale. According to the Marrakech Accords,2 projects can be considered small-scale CDM projects if they are either renewable energy project activities with a maximum output capacity up to an equivalent of 15 MW, or energy efficiency improvement projects reducing energy consumption (both at supply and demand side) by up to 60 GW/h per year, other projects reducing annual CO2-eq. emissions by 60 ktonnes at maximum. The idea behind this distinction was that for small-scale CDM projects simplified procedures for the accounting of their GHG emission reductions could be used, which would reduce transaction actions during the project preparations (project preparation, monitoring, validation and certification).3
Nondek et al. (2001) have shown that transaction costs are critical factors for small-scale JI/CDM projects which are more vulnerable to uncertainty related to carbon market development (Nondek et al., 2001). They have proposed either bundling of small projects combined with standardisation of the monitoring, validation and certification methodologies, or creation of programmes managed by national energy or environmental funds. Availability of sufficiently trained domestic experts has been identified as another cost cutting prerequisite. In this respect, combination of micro-loans with national/regional programmes promoting small-scale CDM projects seems to be interesting (e.g. local Internet providers using photovoltaic panels or small wind turbines).
At COP-8 in New Delhi (India), one year after the Marrakech Accords, a decision was taken on what such simplified procedures would look have to look like, which was translated into simplified baseline and monitoring procedures by the CDM EB (CDM EB, 2004). As per November 2008, 1905 out 4151 projects were small-scale CDM activities (46%), which are expected to generate around 10% of CERs until 2012.
2 UNFCCC, 2002; Decision 17/CP.7, para 6.c.i. 3 Note that for project categories II and III the upper limits were initially 15 GW/h and <15 ktCO2-eq, respectively. Later, the CDM EB increased these limits to 60 GW/h and 60 ktCO2-eq., see http://cdm.unfccc.int/methodologies/SSCmethodologies/approved.html.
27
Most small-scale projects are in the category of hydropower (30.5%) and biomass-based energy (19%). Mostly, these projects are so-called greenfields because they are new plants or installations that produce power for a grid and that, by doing so, replace capacity that would otherwise (i.e. in the absence of the project) have produced for the grid. The leading host countries in the category of renewable energy small-scale projects are India (694 projects) and China (411). In India, these projects are mainly in the field of hydropower, wind power, and biomass energy. China most of these projects are hydropower activities.
Around 10% of the small-scale projects are in the category of energy efficiency improvement with energy savings of less than 60 GWh. Within this category, most projects are in the field of energy efficiency and fuel switching measures for industrial facilities (e.g. waste heat recovery, replacing old equipment with new ones, etc.). India is the leading host country in this category, followed by Malaysia and Mexico.
The third category, maximum 60 ktonnes CO2 reduction, contains the remaining quarter of small-scale CDM projects. The leading project type in this category is small-scale methane recovery (55% of projects in this category), followed by avoidance of methane production from biomass (16%), and methane recovery in wastewater treatment (10%). Mexico and Philippines are leading host countries in the field of small-scale methane recovery, by hosting several biogas-flaring projects in the agriculture sector.
The above division between small and large-scale CDM projects would suggest that small-scale projects have been able to play a considerable role in the CDM pipeline so far. However, several authors have argued that many (very) small activities that have the potential to reduce GHG emissions cannot be implemented cost-effectively because the transaction costs related to project design, validation and verification costs are too high to be compensated by the project revenues (even when including the CERs) (Ellis, 2006). Well-known examples of these activities are compact fluorescent lamps that replace incandescent light bulbs, green transport plans and agricultural activities, such as biogas installations for farmers.
In order to also incorporate these activities in the CDM, the concept of programmatic CDM has been developed which involves the aggregation of a number of relatively small emission reduction activities in developing countries into a larger bundle (or programme), which is then prepared and submitted to the CDM EB as a single CDM activity with one set of methodologies for baseline determination and monitoring of the project performance.
As Hayashi (2006) mentioned, many renewable energy projects (in particular in rural areas) and energy efficiency improvement projects (in particular in the built environment) are small, although their replicability potential is large. Enabling these activities under the CDM in a bundle or programme would thus contribute strongly to sustainable development in the host countries.
Aggregation under the CDM is not a new phenomenon. For instance, methodological aggregation has been applied through the adoption of baseline methodologies, which can be used for a multitude of projects, e.g. baselines that are calculated using (weighted) average GHG emissions for sectors. Furthermore, the CDM EB has merged baseline and monitoring methodologies, which have been developed over time into consolidated methodologies and which can be used for all projects of the same type. Another reason for bundling of small projects is the possibility to create portfolios with similar projects, which generate CERs with decreased risk. The performance related risk for individual projects is often underestimated by foreign institutional investors (Nondek et al., 2001).
At the policy level, the topic of recognising programmes as stand-alone CDM projects was surrounded by uncertainties, especially in relation to the possible inclusion of government policies in CDM host countries. This uncertainty was based on the question whether a government, which would like to improve the energy efficiency in households, would be allowed to develop such a policy as a CDM project (thereby selling the emission reductions as CERs). At COP/MOP-1 (2005), guidance had been given about the scope of CDM programmes. In Decision 7/CMP.1 it was stated that a local/regional/national policy or standard cannot be
28
considered as a CDM project, but that project activities under a programme of activities can be registered as a single project activity. Although not precisely clear on the difference between a policy and a programme, this decision in principle opened the door for bundles of activities in the fields of, among others, compact fluorescent lamp projects and air conditioning improvements in residential dwellings, but also technology implementation in industrial sectors. At its second session in November 2006, the COP/MOP decided that local/regional/national policies or standards cannot be considered as a CDM project. However, COP/MOP-2 decided that project activities under a programme of activities could be registered as a single CDM project, provided that all activities within the programme would comply with the regular CDM modalities and procedures.
At its thirty-second meeting held on 20-22 June 2007, the CDM EB took a decision on CDM Programmes of Activities under the title “Guidance on the Registration of a Programme of Activities as a Single CDM Project Activity”. In a second document, procedures for registration of such programmes of activities and issuance of their CERs are explained.4 An interesting aspect of this decision is that a programme’s physical boundary may extend to more than one country. A programme must be proposed by a co-ordinating or managing entity which will be the official project participant acting on behalf of the programme’s activities. The duration of a programme will not exceed 28 years, but the participating individual activities will have crediting lifetimes, just as regular CDM projects, of seven years with the possibility of renewal of the project plan twice to a maximum of 21 years (or a crediting period of ten years at maximum without the possibility of renewal). During the lifetime of a programme, activities can still join, but their individual crediting lifetimes are maximised by the time left between entering the programme and its overall finishing date, again with a maximum of 21 years. For afforestation and reforestation (A/R) programmes, the maximum crediting lifetime is 60 years. Finally, the CDM-EB decided that each CDM programme activity shall be monitored, but also stated that the monitoring method to be used could be based on random sampling.
2.2.3. Prices of Certified Emission Reductions
CERs are traded at different prices depending on the status of the project and the risks involved. For instance, CERs that are sold to a buyer before the underlying GHG emission reductions have been achieved (i.e. in a forward transaction), carry a risk of non-delivery (see the discussion above on CER performance ratios of projects). Therefore, prices for these forward CERs are generally lower than CERs already issued because the latter are based on achieved and verified emission reductions (see Box 2-1).
As per November 2008, CER prices were as follows (GTZ Climate Protection Programme, 2008). GHG emission reductions realised by a CDM project, certified by a designated operational entity, and issued by the CDM EB are traded at prices around €15 per CER (= 1 tCO2-eq. emission reduction). CERs expected from projects that have been registered by the CDM EB (i.e. project that have successfully completed their design stage and that comply with all EB requirements) are considered low-risk projects and are traded at €12 to 15 per CER in forward contracts. CERs from projects that have not yet been registered but still at validation or in the process of registration, have prices of between €6 (medium risk) and €14 (low risk) per CER. All these prices are for CERs based on emission reductions achieved or expected to be achieved before 2012 (i.e. to be used for compliance with the Kyoto Protocol commitments). CERs based on expected emission reductions after 2012, i.e. based on projects that are planned to continue after the Kyoto Protocol first commitment period, are presently traded at prices around € 7/CER. The latter price obviously reflects the uncertainty related to future scarcity of emission reduction credits as clarity about the future climate policy regime after 2012 is still lacking.
4 Annex 38 and 39, respectively to the EB’s Meeting Report, see http:// cdm.unfccc.int/EB/032/index.html; see also http://cdm.unfccc.int/EB/028/eb28_repan15.pdf.
29
Box 2-1. From CO2 emission reduction to Assigned Amount Unit or EU Allowance
After having been registered by the CDM EB as a CDM activity, CDM project participants can ask a designated operational entity to verify and certify the GHG emission reductions achieved. Once certified, the emission reductions can be issued as CERs by the CDM EB to the investor.
As a first step in the issuance process, the CERs are placed in the pending account of the EB. At this stage, the Board deducts from the amount of CERs a fee of 2% which is partly used to cover administrative expenses and partly deposited in an adaptation fund to support developing countries vulnerable for the consequences of climate change (UNFCCC, 1997, Article 12.8). Subsequently, the remaining CERs are put in the GHG registry of the investing country (or in the registry of the host country if the CDM activity is unilateral, see elsewhere in this Chapter) from where they can be added to the investor country’s assigned amount or transferred to a company within that country for compliance with the EU emissions trading scheme (ETS) commitments. The latter forms the connection between the Kyoto Protocol’s CDM on the one hand (where the governments of the Parties are the end of the CER transfer chain), and the EU ETS on the other hand.
The connection between CDM projects and the assigned amount registries of industrialised countries takes place via the Kyoto Protocol’s International Transaction Log (ITL). Through the ITL all CERs (as well as other emissions trading credits under the Kyoto Protocol, such as from JI projects or green investment scheme emissions trading) can be transferred between countries and tracked and traced using serial numbers. For enabling trade of CERs on the EU ETS market, the ITL will be connected to the EU Community Independent Transactions Log (CITL).
2.3. CDM success factors
Based on the information in Section 3.2 it can be concluded that the distribution of CDM projects between host countries is biased towards a relatively small number of developing countries. To a large extent, this phenomenon can be explained by the size of these countries and their economies which provide a larger scope for emission reduction activities in energy production, industrial sectors, and demand-side management. However, China, India, Brazil, South Korea and Mexico have also been able to smoothen their CDM project identification and approval procedures at an early stage (i.e. before or shortly after the entry-into-force of the Kyoto Protocol in 2005), so that could quickly approve identified projects. Moreover, these countries offered several large-scale project opportunities which are generally attractive as they enable investors to spread project transaction costs across a larger number of CERs. However, a country with potential projects of a smaller scale could, in theory, successfully compete with a large country if its CDM governance structure and domestic project implementation chains were more efficient.
An example of a study which analysed major barriers for CDM projects is Nondek and Arquit Niederberger (2005). They analysed major barriers identified by CDM stakeholders in 18 countries which passed through the World Bank’s JI/CDM National Strategy Studies programme (JI/CDM NSS). Two distinct groups were identified with respect to their capacity development phases. Countries in the first group were between the conceptual and policy-building stage, while countries in the more advanced second group were approaching implementation stage (project development, revenue optimisation, etc.). It was shown that although existence of DNA and familiarity of national experts with CDM project development is a key factor regardless size of the country, those human resources can be more easily organised in larger countries.
This leads to the identification of the following two key factors for successful CDM project implementation in developing countries: 1. Host countries’ arrangement of the CDM system, including ways to co-operation with other entities
and countries in projects and the set-up of the designated national CDM authority (DNA), and 2. Implementation chains for projects and technologies in the countries.
These factors are discussed in further detail below.
30
2.3.1. Forms of CDM and role of DNA
The traditional way of developing CDM projects is that an entity from an investor country co-operates with an entity from the host country, under the supervision of both governments. This form of bilateral co-operation was practiced mostly during the pilot phase for the Kyoto flexibility mechanisms, called Activities Implemented Jointly (AIJ, which lasted from 1995 to approximately 2000).
In the course of time, also multilateral CDM co-operation gained importance, especially through the activities of the World Bank which have now developed into the World Bank’s Carbon Finance Programme.5 Multilateral CDM funds collect investment money from governments and non-governmental entities which are interested in buying CERs, and invest this money into CDM projects. The advantage for the CER buyers is that they do not need to enter into the project preparation and implementation activities themselves but can leave this to the Funds’ specialists.
With bilateral and multilateral co-operation, it is common practice that the CER buyers or their representatives (under multilateral co-operation) are involved in the project as of the early stages of the activity. For instance, in a bilateral CDM context, an investor country interested in buying CERs explores the possibilities of becoming engaged in CDM projects (e.g. through a tender). Project developers subsequently offer project ideas to the investor country from which a number of ideas are selected. These ideas are worked out into full CDM proposals and require the approval of the host country. Once approved, the project proposal will have to be validated by a designated operation entity and subsequently registered by the CDM EB. In case of multilateral CDM, the fund selects the projects on behalf of the investor countries by which it has been contracted (some investor countries participate in the approval process). Contractual arrangements with the host country participants are subsequently made by the multilateral fund.
In actual practice, however, there are several CDM projects for which the CER buyers are not yet known by the time the project is implemented. Such cases are referred to as unilateral CDM projects, i.e. projects that have been approved by the host country government, implemented, and for which CERs a buyer is sought only upon certification of the emission reductions and/or issuance of the CERs to a buyer (which could take place annually or by the end of the project’s crediting lifetime).
The roots of unilateral CDM can be traced back into the AIJ pilot phase. In 1995, Costa Rica introduced Certifiable Tradable Offsets (CTOs) for its forest management programme as a unilateral anticipation of an international crediting system. A national umbrella finance fund administered the projects. By selling only a part of all possible reductions as CTOs, the fund could bear the risks of project delay or failure. International investors could buy the CTOs and Costa Rica was able to realise projects according to its own economic necessities and political preferences. This particular system highlighted an important window of opportunity for unilateral action.
It is difficult to exactly calculate how many of the present CDM projects can be labelled as unilateral CDM, since many projects have been established in co-operation with specialised intermediary companies from industrialised countries. In many cases, these companies have developed project portfolios which include emission reduction activities in a particular developing country. Before the project starts, the companies pay the host country partners a price for expected CERs and sell the CERs later to countries with Kyoto Protocol commitments or EU ETS companies against spotmarket prices. The risk of project failure is thus taken over by these brokers but they also have opportunities to sell CERs at higher prices. For instance, CDM intermediary company Ecosecurities have a portfolio of projects for which it purchases CERs at 30 to 40% of the price paid for CERs at spot markets (Bryan, Garnier&Co, 2006). In order to have the CERs
5 See http://www.carbonfinance.org
31
eligible for trade after their certification, the companies must ask an approval of the project by their own government, which, since most of these brokers are London-based, is often the UK Government. This also explains why in several CDM overviews, the UK is shown as the largest CDM investor countries; not because it will use the CERs for its own Kyoto Protocol compliance, but because it approves the CERs traded by London-based brokers. It has been estimated that about half of the CDM pipeline consists of such unilateral projects (i.e. without a known buying country) (ERI, CEERD, JIN, 2007).
For some time, it was unclear whether unilateral CDM would be legally possible, given that the Marrakech Accords require a written approval of voluntary participation from the DNA of each Party involved in a CDM project. However, the moment at which an investor country would have to provide this approval was not defined. At its 18th meeting, on 25 February 2005, the CDM EB supported the idea of unilateral CDM and “agreed that the registration of a project activity can take place without an Annex I Party being involved at the stage of registration”6. This basically implies that it has now become possible to set up CDM projects whereby: some, or even all equity, comes from host country actors; only the approval of the host country DNA is required prior to CDM EB registration; and CER buyers only become formally involved when the first CERs become available for sale.
Several authors have argued that unilateral CDM would have the benefit that projects are better in line with the host countries’ sustainable technology needs (Nondek et al., 2001; Figueres, 2004; Laseur, 2005; Jahn et al., 2004). Another benefit could be that unilateral CDM provides developing countries that have not been able to participate in the CDM on a large scale thus far, with an opportunity to also enter the CDM market. Unilateral CDM could open a promising window of opportunities for ambitious businesses and consultants in developing countries to take initiatives to get the CDM machinery really going, without being dependent on procedural involvement by ‘competing’ experts in industrialised countries (Jepma, 2005). Local consultants can learn to perform the tasks that are presently mostly executed by experts from the North. In fact, “[…] it may help non-Annex I Party country participants to get rid of the feeling of being patronized by foreign CDM consultants” (2005).
In addition, transaction costs could be reduced because the experts from the developing countries are most likely not only cheaper, but probably also better informed about the situation in their home countries and may have different risk perceptions so that for them the minimally required internal rate of return may be lower than for a foreign investor. This could largely reduce CDM transaction costs; especially search costs (i.e. a local non-Annex I entity would generally be better aware of investment opportunities) and negotiation costs (i.e. negotiations would only involve talks about prices and quantities since unilateral CDM projects would have no or considerably less risks in terms of project risk and delivery risks). The potential reduction in transaction costs due to unilateral CDM could also stimulate the development of small-scale CDM projects (see above for a discussion of small scale projects).
Unilateral CDM also offers CDM project developers in developing countries the possibility to keep the CERs in their own accounts and sell them at the point of issuance at spot market prices. Selling CERs after the realisation of the emission reductions implies supplying risk-free carbon credits on the market. At that point, spot market CERs would have the same low risk profile as EU ETS allowances. This creates arbitrage opportunities for developing country entities, among others through the Linking Directive. In this ‘pure’ type of unilateral CDM, CERs are thus not sold through forward contracts to international brokers but are kept within the country. The Costa Rican CTO system could serve as a model for managing such unilateral projects and programmes.
Generally, however, unilateral CDM is surrounded by two important disadvantages. First, although developing country entities would have the possibility to sell CERs at a later stage, and thus can benefit 6 See: http://cdm.unfccc.int.
32
from higher prices, they also run the risk that the CER price will drop or that the project fails. Second and partly as a consequence of the higher price and project performance risks, unilateral CDM could lead to a bias towards purchasing technologies that stakeholders in the host countries are familiar with and that require less training and operation and maintenance costs (Liu Deshun, 2001). Without the agreed purchase of the CERs from a project by an Annex I Party entity at an agreed forward price, it could become more difficult for the host country project participants to attract funding (e.g. loans) from domestic or international financial institutes to purchase an international state-of-the-art technology and/or to acquire spare parts during the project lifetime. Instead, in order to reduce the upfront risks and increase the internal rate of return, the project developers may decide to purchase domestic technologies for the unilateral project, which could be less advanced than the international state-of-the-art and with which the governments and stakeholders in the country are more familiar. As such, unilateral CDM could lead to lost opportunities to support host countries’ sustainable development.
Implications for the CDM project cycle
The development, implementation and completion of a CDM project follows a project cycle with a number of steps, which are in accordance with the Marrakech Accords (UNFCCC, 2002). The first step is the identification of a project by either an entity from the host country, or from abroad. Under regular bilateral CDM deals, potential CER buyers typically ask for a Project Idea Note (PIN). Once the PIN is accepted by the investor country (in most cases this means short listed from longer list of project ideas; for PIN acceptance it is also generally recommended that the host country government has given its approval to the project idea), a Project Concept Note (PCN) is generally requested which requires more detailed information from the project developer, including a clear calculation of the expected GHG emission reduction and contribution to sustainable development in the host country. Once the envisaged CER buyer has accepted the project, the project participants will sign an emission reduction purchase agreement (ERPA), which is the basic contractual arrangement of the amount of CERs that will be transferred to the buyer once the emission reductions have been certified. It usually also includes a price for the CERs.
For validation by a designated operational entity and registration of the project by the CDM EB, the PCN needs to be elaborated on into a Project Design Document (PDD), which is the basic format for submitting the project plan to the CDM EB. The role of the host country government could be rather passive during this project development stage, but a project cannot be submitted for registration to the CDM EB without a formal approval from the host country’s DNA. For this, the host country DNA must submit a Letter of Approval for the project, which does not only confirm the host country’s voluntary participation in the activity, but also states that the project contributes to the host’s sustainable development.7 If any Annex I Party is officially involved as a project participant at this stage, a Letter of Approval from that Party’s DNA is required as well.8 During the validation of a project by a designated operational entity, a public comment period of 30 days is foreseen and the entity takes comments into consideration.
Subsequently, a CDM project plan, accompanied by a Letter of Approval from the DNAs of the participating countries and validated by the designated operational entity, can be officially registered by the CDM EB.9 For this registration, the project developers need to pay a fee, which is proportional to the size of the project. As explained above in this Chapter, usually annually or biannually, the project’s generated 7 This is in accordance with Kyoto Protocol Art.12.2. 8 The Marrakech Accords require the approval from the DNA “of each Party involved” (UNFCCC (2001), Draft decision -/CMP.1 (Article 12), Annex, §40a). Notably, Annex I Party approval cannot be circumvented, but only delayed. 9 The extent of initial DOE validation fees approximately varies from €5,000 to €30,000, depending on various factors, among which the most important are: the project’s complexity, the time needed, and the costs of site visits. Source: personal communications with DOE representatives. Site visits are more likely to be necessary if a project’s baseline is based on existing actual or historical emissions (UNFCCC (2002), Draft decision -/CMP.1 (Article 12), Annex, §48a) than if it is based on emissions data of a technology (ibed., §48b) or similar projects (ibed., §48c) .
33
GHG emission reductions are to be verified and certified by a designated operational entity, after which the CDM EB can issue the CERs to the investor country.
The CDM project cycle contains several points of uncertainty which implies risks for the project developers. One risk category is the position of the host country government towards the project. This is why most CDM buyers under bilateral or multilateral deals want to receive from the host country governments Letter of No Objection to the project prior to the Letter of Approval (Laseur, 2005). Another risk would be the validation and registration of the project and the delay that may be caused by the workload of the CDM EB (see elsewhere in this Chapter). A final risk during the project design phase is whether the full financing of the overall project investment will be secured.
During the implementation phase, there are risks related to the performance of projects. For instance, a project’s state-of-the-art technology may encounter technical problems during the installation, and operation and management phases. Sometimes, projects may have to be stopped for a few weeks or months, so that the contracted forward CERs will have to be adjusted downwards, which is sometimes even accompanied by clauses for non-delivery. There could also be other risks related to regular foreign direct investments, such as host country political and legal risks.
These CDM related investment risks must be considered within the host country context and are generally perceived differently by CDM project investors, depending on their objectives with a project. For instance, according to Nondek et al. (2001), CDM project investors can be categorised as either direct investors increasing the net present value of their investment, or investors mainly interested in acquiring CERs, or large institutional investors like governments, international financial institutions, etc. Generally, host country risk profiles depend upon many factors and can be expressed according to a composite investment ranking (Fankhauser and Lavric, 2003).
With a view to the revenue side of the projects, project participants may face risks related to the follow-up of the Kyoto Protocol (see above under ‘CER prices’). For projects that envisage delivery of credits beyond 2012 (i.e. projects that have chosen a 21-year crediting lifetime for the GHG emission reductions), it is very important that the emission reductions to be achieved then will still be tradable as CERs to countries with commitments. Also the CER price remains uncertain as it largely depends on the eventual demand and supply figures for GHG emission titles during the Kyoto Protocol commitment period 2008-2012.
Through learning by doing, with an increasing number of projects in a host country, these risks could probably already be mitigated to some extent. For instance, specialised institutes would be able to assess domestic investment risks and know their way towards the CER buyers, as well as when to sell the CERs. In general, a country that wants the CDM to work throughout its economy is likely to install a DNA that can do a lot more than passively executing its formal responsibility of appraising incoming CDM project proposals. However, having to manage increasing responsibilities obviously puts supplementary strains on the already-limited resource base of most developing countries. Castro and Figueres (2002) have proposed that a DNA should preferably first occupy itself with the prescribed evaluation and approval functions and only later, as experience accumulates, take on the additional responsibilities that are needed for unilateral CDM. Jahn et al. (2004) have also emphasized the advantage that some host countries have had from their previous experiences with AIJ and CDM project development.
Role of DNA
Each country that wants to become involved in a CER transaction must establish a DNA for the CDM.10 The DNA has regulatory tasks in terms of approving CDM projects (a host country DNA must have approved the project before it can be registered by the CDM EB; an investor/buyer country DNA must 10 UNFCCC, 2002, Decision 17/CP.7, Annex, para 29; see for an overview, http://cdm.unfccc.int/DNA
34
approve of the project before the CERs can be issued to that country), determining criteria for project selection and approval, reporting on a country’s CDM involvement to the CDM EB, and ensuring that the projects have been implemented on a voluntary basis (Castro and Figueres, 2002). From the CDM practice, it has become clear that developing countries with well-designed and transparent procedures for project approval have been more successful in attracting projects than projects with long-lasting, complex and non-transparent DNA procedures. In the case of Thailand, for instance, the former DNA process required that each CDM project proposal had to be approved by the Cabinet of Ministers. In October 2006, this procedure was simplified by reducing the number of ‘decision making layers’ in the procedure and maximising the approval time for project design documents to 30 working days, which led to an acceleration of Thai CDM projects during 2007-2008.
According to ERI et al. (2007, Chapter 3), most CDM host countries have a two-step approval procedure with screening of project ideas and a final approval of project design documents. The initial screening is meant to inform project developers about the feasibility of a project as CDM activity in the country and therefore could help avoid wasting time and resources to fully develop a project idea that might not be approved in the end (Castro and Figueres, 2002). Some developing countries, however, such as Brazil, only consider a project after a DOE has validated it, which implies an additional risk for project developers as they have to pay for the validation without knowing for sure whether the project will be approved by the Brazilian DNA.
An important factor in the success of a DNA is that it finds a balance between speed and quality. The pressure on the DNAs in the host countries with the largest share in the CDM pipeline (e.g, China, India, Brazil) is very large, as they have to assess over 100 project plans per year on their suitability with CDM criteria and contribution to sustainable development. Assessing a PDD (with an average size of 50-60 pages) requires specialised knowledge of a range of technologies and how these have an impact on countries’ sustainable development. Moreover, host countries are free to determine criteria for CDM projects’ contribution to sustainable development, which could theoretically lead to procedures in which project approval is quickened by applying fewer criteria for sustainable development.
Determining projects’ sustainable development contribution differs between countries and one indication of this has been given by a study on the expected sustainable development contribution of CDM projects in which the Netherlands Governments acts as an investor. The study (Netherlands Ministry of Foreign Affairs, 2007) is based on over 40 CDM projects in ten project categories and 18 host countries. Based on the analysis, host countries assess, through their DNAs, projects contribution to sustainable development in the following ways: 1. Use of specific lists of sustainable development criteria when judging proposed CDM projects. 2. Assessment of whether projects meet the needs and priorities in terms of energy service and
economic welfare improvement or poverty alleviation. This category resembles the first category but does not contain clear checklists with sustainable development criteria.
3. Assessment of projects with a view to possible negative environmental impacts and whether they are in accordance (i.e. comply) with national and/or local government legislation.
Of these categories, the former two require project participants to specifically address a number of criteria and/or specifically support national or local needs and priorities. In the latter case, the contribution to a government’s strategy to phase-out fossil fuels and increasingly deploy renewable energy resources may qualify as such. In the third category, the DNA assesses projects in a more passive way by checking whether they do not have negative environmental impacts in the countries and whether they are in accordance with applicable legislation.
Of the 18 countries included for analysis, eight countries have published specific criteria for the sustainable development contribution that CDM projects must deliver: Brazil, China, Colombia, India, Indonesia, the
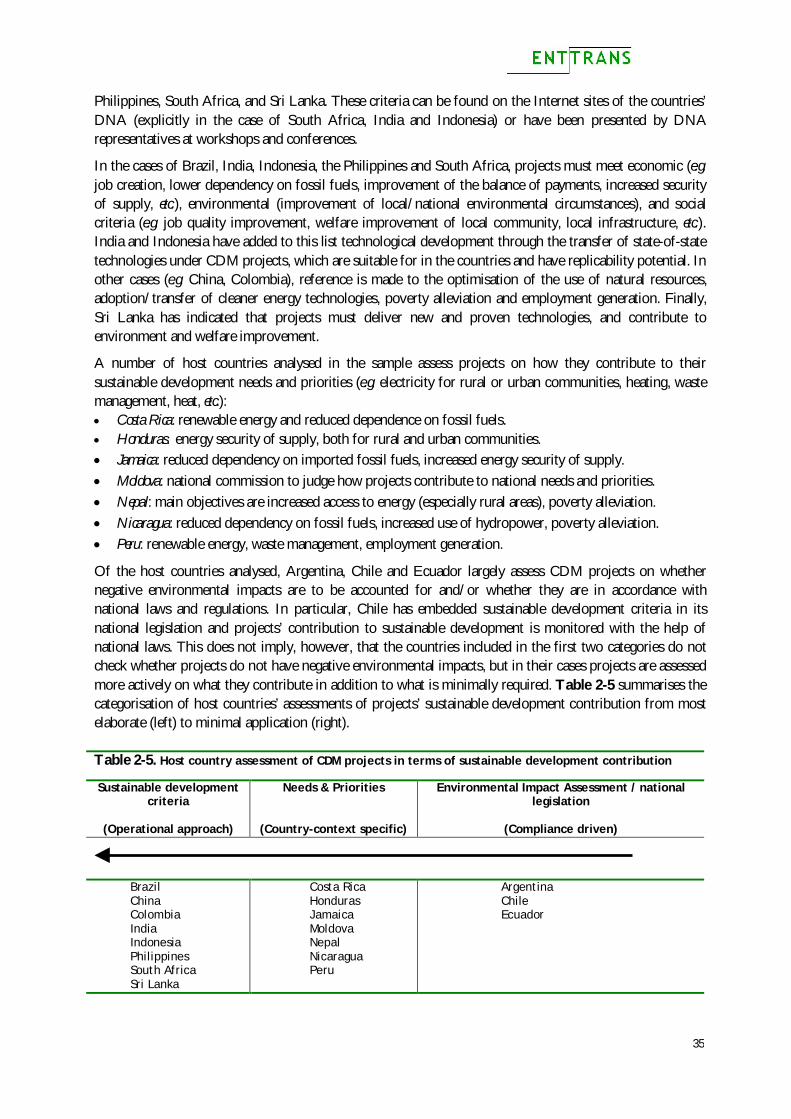
35
Philippines, South Africa, and Sri Lanka. These criteria can be found on the Internet sites of the countries’ DNA (explicitly in the case of South Africa, India and Indonesia) or have been presented by DNA representatives at workshops and conferences.
In the cases of Brazil, India, Indonesia, the Philippines and South Africa, projects must meet economic (e.g. job creation, lower dependency on fossil fuels, improvement of the balance of payments, increased security of supply, etc.), environmental (improvement of local/national environmental circumstances), and social criteria (e.g. job quality improvement, welfare improvement of local community, local infrastructure, etc.). India and Indonesia have added to this list technological development through the transfer of state-of-state technologies under CDM projects, which are suitable for in the countries and have replicability potential. In other cases (e.g. China, Colombia), reference is made to the optimisation of the use of natural resources, adoption/transfer of cleaner energy technologies, poverty alleviation and employment generation. Finally, Sri Lanka has indicated that projects must deliver new and proven technologies, and contribute to environment and welfare improvement.
A number of host countries analysed in the sample assess projects on how they contribute to their sustainable development needs and priorities (e.g. electricity for rural or urban communities, heating, waste management, heat, etc.): Costa Rica: renewable energy and reduced dependence on fossil fuels. Honduras: energy security of supply, both for rural and urban communities. Jamaica: reduced dependency on imported fossil fuels, increased energy security of supply. Moldova: national commission to judge how projects contribute to national needs and priorities. Nepal: main objectives are increased access to energy (especially rural areas), poverty alleviation. Nicaragua: reduced dependency on fossil fuels, increased use of hydropower, poverty alleviation. Peru: renewable energy, waste management, employment generation.
Of the host countries analysed, Argentina, Chile and Ecuador largely assess CDM projects on whether negative environmental impacts are to be accounted for and/or whether they are in accordance with national laws and regulations. In particular, Chile has embedded sustainable development criteria in its national legislation and projects’ contribution to sustainable development is monitored with the help of national laws. This does not imply, however, that the countries included in the first two categories do not check whether projects do not have negative environmental impacts, but in their cases projects are assessed more actively on what they contribute in addition to what is minimally required. Table 2-5 summarises the categorisation of host countries’ assessments of projects’ sustainable development contribution from most elaborate (left) to minimal application (right). Table 2-5. Host country assessment of CDM projects in terms of sustainable development contribution
Sustainable development criteria
(Operational approach)
Needs & Priorities
(Country-context specific)
Environmental Impact Assessment / national legislation
(Compliance driven)
Brazil China Colombia India Indonesia Philippines South Africa Sri Lanka
Costa Rica Honduras Jamaica Moldova Nepal Nicaragua Peru
Argentina Chile Ecuador
36
Next to the mandatory regulatory role of DNAs in terms of judging whether proposed CDM projects contribute to host countries’ sustainable development (the criteria for which countries can determine for themselves) and giving a final approval to projects before official registration by the CDM EB, DNAs may also decide to perform promotional functions. Through such promotional activities, the DNA could play an active role in promoting the country as an attractive CDM host country. Such promotional DNA functions could consist of (ERI et al., 2007): Managing data on projects carried out in the country, so that these could serve as
examples/demonstrations for other investors who might be interested in projects in the country. This database management activity could be supported by an active Internet site and a newsletter, as
well as seminars and training. Building of market networks for the country and/or region, including actions to co-ordinate different
policies and programmes related to sustainable development. Providing assistance to project developers in terms of providing data for baseline calculations, such as
CO2 emission factors for grids and data on existing plants and/or recently built plants. Support to the development of domestic project development support, as well as of domestic
operational entities to be designated by the CDM EB for project plan validation and project performance verification.
Design of model contracts and support to local entities in building negotiation capacity. Marketing of the project opportunities within the country, such as identification of potential projects
and making this information available to potential investors, e.g., through participation in carbon fairs and exploring opportunities via the DNA Internet site.
In actual practice, the development of tasks of DNAs generally shows a sequence of starting with the regulatory role first, then, once the organization has been settled, expanding activities to a more detailed assessment of sustainable development contribution of projects, and after that starting to develop a outreach programme aiming at promoting CDM projects in the countries and attracting investors (Castro and Figueres, 2002; Findsen, 2005).
Finally, two issues should be mentioned with respect to these DNA roles. First, DNA role expansion is often constrained by capacity limitations (and training requirements for stakeholders and staff) and countries may only be willing to expand a DNA if it knows that a considerable number of CDM projects may result from that with a significant contribution to local sustainable development. Several DNAs in the Latin American and Central Americas regions have actively performed promotional functions and have benefited from that in terms of project development (see Table 2-3 and Table 2-4) (see ERI et al., 2007, Chapter 3).
Second, there could be a conflict of interest if the DNA both wants to promote project investment opportunities and must approve them as CDM projects. This could lead to situations in which the DNA approves of projects that either are not fully in accordance with domestic sustainable development criteria, or that do not comply with CDM EB accounting rules, such as additionality of the GHG emission reductions claimed, or both. Consequently, projects may not contribute to the national sustainable development strategy (which could be enhanced if lobby groups would put pressure on DNA approval procedures) and/or may not be validated by the designated operational entities or rejected by the CDM EB when registration of the project is requested. The latter could create frustration among investors and cause a boomerang effect because the DNA’s creditability among project developers would decrease. It has therefore been suggested (Lee (ed.), 2004) to split DNA activities in two parts, e.g., by assigning the regulatory tasks to a government department that is responsible for climate policy (since this department is generally most knowledgeable of climate change and environmental issues), and assigning the promotional tasks to another department or even contract a non-governmental agency for this task. For example, the
37
Peruvian DNA, the National Environmental Council (CONAM: Consejo Nacional del Ambiente), has been entrusted with only regulatory functions whereas promotional functions have been assigned to the National Environmental Fund (FONAM: Fondo Nacional del Ambiente-Perú) (Chaparro, 2006; Figueres and Olivas, 2002). However, as Ellis et al. (2004) argue, since governance structures and responsibilities are different across countries, efficient DNA structures are also likely to vary.
2.3.2. CDM technology implementation chain aspects
The above Sections have shown an unequal geographical distribution of projects. It has also been shown that in some countries a few technologies are clearly dominant (e.g. hydro and wind power in China; biomass energy in India; landfill gas capture in Brazil), whereas these technologies are lagging behind in other countries. Generally, it is assumed that the distribution of projects among host countries is largely determined by the potential for (large-scale) GHG emission reductions at relatively low costs and by how smoothly a country’s CDM institutional procedures function; countries with smooth DNA procedures and action project promotion activities are more attractive to do CDM business with.
However, DNA procedures and basic CER potential may not tell the entire story since also a country’s overall investment climate and potential to implement new technologies are important. Therefore, for a complete insight into the potential of developing countries to host CDM projects in different project categories, also technology implementation conditions need to be explored. A study by Ellis and Kamel (2007) has shown that some barriers cannot easily be resolved be adding a monetary value to the investment profile of projects. The study assesses whether and to what extent the CDM development in ‘underrepresented’ CDM host countries (i.e. developing countries with a small share in the CDM pipeline, see Table 2-3) can be explained by barriers to developing projects. Ellis and Kamel (2007) distinguish between specific CDM barriers (DNA operation, project identification and GHG accounting, including validation and verification) and barriers that are of a more general nature such as: Stability of laws in host countries and the ability to enforce these; Tax policies and import tariffs, which in some countries make alternatives to sustainable energy
technologies relatively cheap by subsidising fossil fuel consumption and taxing clean technologies (e.g. through import tariffs);
Inconsistent government policies, such as subsidies for clean power production (through feed-in tariffs), while at the same time levying an import tariff on the technologies needed for the power production;
Unclear ownership structures for the technology and the CERs; The extent to which decentralised energy and cogeneration plants will acquire access to the grid; and The possible problems with power production permits, complex custom formalities (in particular in
sub-Saharan countries), and corruption.
The aim of including an analysis of implementation chain aspects for low-carbon technologies is to explore how developing countries could optimise the circumstances of hosting CDM projects and accompanying technologies. The CDM experience described above has shown that streamlining CDM governance structures is a necessary but not sufficient condition for being a successful CDM host country. A country that both has its DNA promotion and procedural functions in order and improves its investment climate for CDM project technologies by, e.g., removing policy inconsistencies (e.g. sustainable technologies taxed and non-sustainable energy use subsidised), making permit systems less complex, reducing customs bureaucracy, clarifying property rights, and enhancing law enforcement has a higher chance to attract state-of-the-art low carbon technologies than countries with good DNA structures but insufficiently streamlined investment circumstances.
38
2.4. Key points from this Chapter
CDM project division is skewed toward a small group of developing host countries (China, India, Brazil, and Mexico). Asia and Latin America together have a share in the global CDM project pipeline of almost 95%. Sub-Sahara Africa only has a few projects and most of these are in South Africa. For CDM project investors the general investment climate in host countries is decisive when taking into account performance related risks.
Most projects are in the category of renewable energy and biomass energy production, whereas in terms of expected CER delivery, HFC, PFC, CH4 and N2O emission reduction projects have a relatively large market share, which is mainly due to these gases’ high global warming potential.
An important factor for the success of a country as a CDM host country is the organisation of the DNA. Although many developing countries have now announced the establishment of a DNA to the CDM EB, there are large difference between countries in terms of DNA office equipment (number of staff, their training background and professionalism); most Asian and Latin American DNAs are relatively efficient, although some of them have in the meantime had to reform and streamline their procedures, whereas several African DNAs are operated by a limited number of staff who are also responsible for other environmental issues and therefore do not have time to fully focus on the CDM.
CDM projects add value to an investment through the CER revenues. However, some barriers to technology implementation cannot be removed by solely adding the hard-currency denoted CER revenues to the investment capital and by offering training programmes for operation and maintenance to local employees. In such cases, a further assessment of the implementation chain of a technology in the country is needed in terms of finding blockages and incentives for low-carbon technologies. Once these blockages and incentives have been identified, strategies could be formulated to improve the implementation chain, including how the CDM could support this improvement.
39
3. Assessing Countries’ Energy Service Needs and Technologies
3.1. Technology needs assessment: experience and literature
The origin of transferring sustainable energy technologies in the context of the international climate co-operation and in particular from industrialised countries to developing countries lies in Article 4.5 of the UNFCCC:
“The developed country Parties and other developed Parties included in Annex II shall take all practicable steps to promote, facilitate and finance, as appropriate, the transfer of, or access to, environmentally sound technologies and know-how to other Parties, particularly developing country Parties, to enable them to implement the provisions of the Convention. In this process, the developed country Parties shall support the development and enhancement of endogenous capacities and technologies of developing country Parties. Other Parties and organizations in a position to do so may also assist in facilitating the transfer of such technologies.” (UN, 1992)
In the context of the Marrakech Accords of 1991, a decision was adopted by the seventh Conference of Parties to the UNFCCC (COP-7) on a framework for meaningful and effective actions to enhance the implementation of UNFCCC Article 4.5.11 As part of this decision, an expert group on technology transfer was established with the objective to analyse ways to facilitate the transfer of environmentally sound technologies to developing countries. In this decision COP-7 called upon assessments of technology needs in order to determine the mitigation and adaptation technology priorities of developing countries (and countries with economies in transition). These technology needs assessments (TNA) involve, according to the decision, “different stakeholders in a consultative process to identify the barriers to technology transfer and measures to address these barriers through sectoral analyses.”12
The purpose of a TNA is to identify technologies that are needed or prioritised in meeting a country’s sustainable development needs. One example of a TNA exercise within developing countries has been shown in the “Synthesis Report on Technology Needs identified by Parties not Included in Annex I to the Convention” by the UNFCCC Subsidiary Body for Scientific and Technological Advice (SBSTA), presented at its twenty-fourth session in 2006 (UNFCCC, 2006). The report was based on TNAs undertaken by 23 non-Annex I Parties (Africa: 8; Asia and the Pacific: 6; Latin America and the Caribbean: 6; and Europe: 3) and 26 initial National Communications to the UNFCCC by developing country Parties. Most of the Parties (92%) indicated that their technology priorities are in the energy sector (mainly renewable energy, combined heat and power and demand-side management); 79% of the countries (also) included industry sector technologies in their priority list; about half of the countries included transport sector technologies in their assessments.
In terms of technological options identified in the TNAs, it was generally recognised by the participating countries that their presently used technologies for energy generation, transport, and industrial production are generally “outdated and inefficient and that they would benefit from access to the efficient technologies available elsewhere.” (UNFCCC, 2006, p.18) Particular priority technology categories mentioned by the countries were renewable energy technologies, co-generation, demand-side management measures, and advanced fossil-fuel combustion or gasification technologies. Among other countries, Chile and Kenya mentioned mini- and micro-hydropower plants as priority technologies. Kenya was also among the
11 FCCC/CP/2001/13/Add.1, Decision 4/CP.7, Annex. 12 FCCC/CP/2001/13/Add.1, Decision 4/CP.7, Annex, para. 3.
40
countries that mentioned the need for demand-side management, especially for commercial lighting and refrigeration. China identified their preference for fossil-fuel technologies and supply chain improvements, such as fuel preparation and control of fugitive gases. Chile mentioned improved stoves and ovens as a need (using charcoal, biomass, liquefied petroleum gas). In cement production, Kenya mentioned the need to replace wet cement production with ‘dry-based’ (and more efficient) technologies. In transport, China specifically mentioned the need for improvement of mass transport systems (railway networks and other transportation).
In terms of barriers to technology transfers, Chile mainly mentioned economic/market-based and technical barriers. Kenya mentioned inefficient market structures (e.g. lack of financial resources, lack of incentive, incompatible prices, subsidies and tariffs), limited awareness of technologies, policy and regulatory inconsistencies, institutional limitations, and technical problems as barriers to technology implementation in the country. China mentioned the same categories of barriers as Kenya, but added lack of trained workers for the operation and maintenance of new technologies.
Of the measures suggested to address barriers, regulatory measures were mentioned most often by all non-Annex I Parties that conducted a TNA (almost 80% of the country TNA reports mentioned this), followed by policy measures, raising awareness among population and stakeholders (70%), measures to improve market conditions for technologies (70%), technical and institutional measures (both around 55%), human capital improvement (45%), and infrastructure improvement (mentioned in 25% of the TNAs).
In the above, some basic elements of a TNA have been introduced: key sectors or services are identified and for these sectors/services preferred technologies are explored, as well as barriers to their implementation and how to overcome these. The main advantage of a TNA approach is that it places a strong emphasis on the domestic circumstances in a country and explores what people and institutions within a country consider important. As such, a regular TNA approach would be very suitable for developing countries when assessing and selecting CDM projects on their territory.
In the literature, there are a number of sources that explain the steps in a TNA. For example, UNDP, together with the Global Environment Facility (GEF) and the Climate Technology Initiative (CTI), prepared a handbook for “Assessing Technology Needs for Climate Change.” (Bonduki, 2003) CTI also published their own report with “Methods for Climate Change Technology Transfer Needs Assessments and Implementing Activities.” (CTI, 2002) Other models for TNA have been prepared by UNEP and the UN Commission on Sustainable Development (UNCSD) (Zou JI, 2002).
Although all models incorporate the TNA steps and elements mentioned above, there are differences between them in terms of starting points and the sequence of actions. For instance, the CTI model starts, after having established a group of stakeholders, with establishing criteria for selecting technology transfer priorities, followed by defining priority sectors and sub-sectors. Within these sectors, market information (incentives, financial market structure, market actors, energy companies, etc.) is collected and subsequently priority technologies are selected. For these technologies, barrier assessments are carried out and actions to overcome these barriers explored and recommended.
Bonduki (2003) starts with an assessment of sectors that are affected by both climate change mitigation and adaptation. Examples of the sectors mentioned in the handbook are energy production and transmission, transport, climate technology industries, built environment, and health. The handbook suggests that priority sectors are selected on the basis of the information in the IPCC Assessment Reports13 which show the possible effect of climate change on each sector by region and outline possible technological options for adaptation and mitigation. Within the prioritised sectors, technologies are assessed based on criteria, such as: development benefits, reducing harm to the environment, social acceptability and suitability for country 13 http://www.ipcc.ch
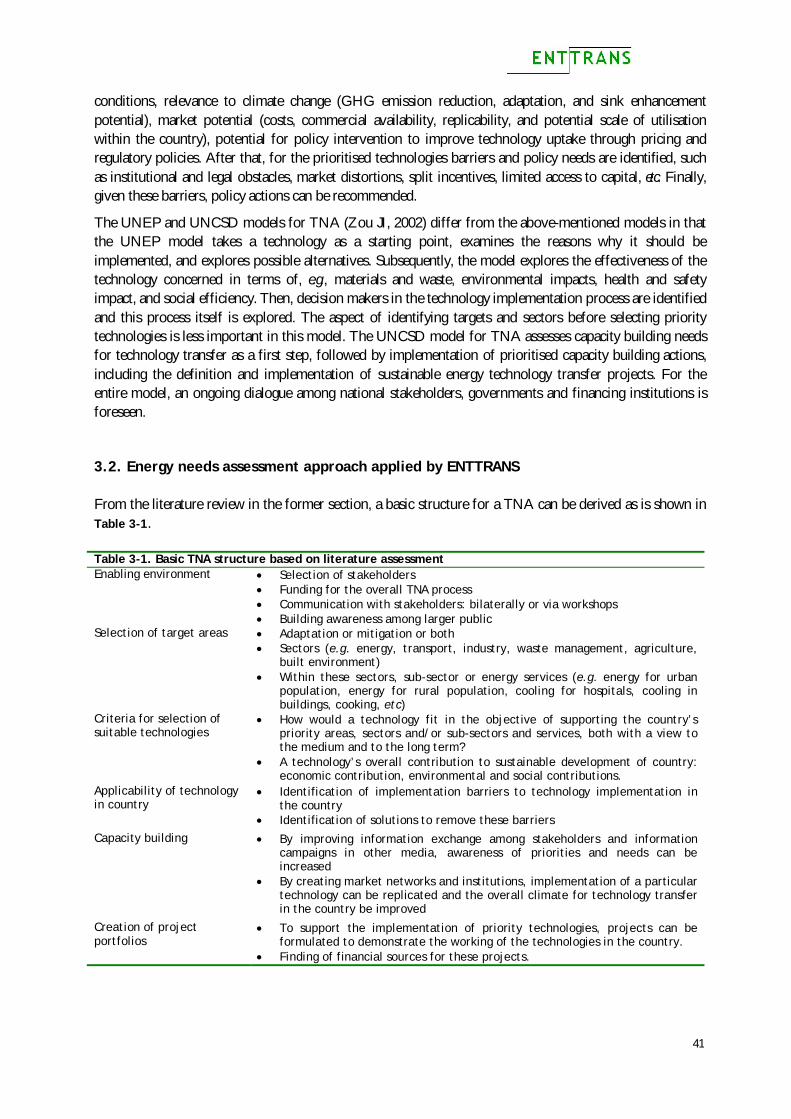
41
conditions, relevance to climate change (GHG emission reduction, adaptation, and sink enhancement potential), market potential (costs, commercial availability, replicability, and potential scale of utilisation within the country), potential for policy intervention to improve technology uptake through pricing and regulatory policies. After that, for the prioritised technologies barriers and policy needs are identified, such as institutional and legal obstacles, market distortions, split incentives, limited access to capital, etc. Finally, given these barriers, policy actions can be recommended.
The UNEP and UNCSD models for TNA (Zou JI, 2002) differ from the above-mentioned models in that the UNEP model takes a technology as a starting point, examines the reasons why it should be implemented, and explores possible alternatives. Subsequently, the model explores the effectiveness of the technology concerned in terms of, e.g., materials and waste, environmental impacts, health and safety impact, and social efficiency. Then, decision makers in the technology implementation process are identified and this process itself is explored. The aspect of identifying targets and sectors before selecting priority technologies is less important in this model. The UNCSD model for TNA assesses capacity building needs for technology transfer as a first step, followed by implementation of prioritised capacity building actions, including the definition and implementation of sustainable energy technology transfer projects. For the entire model, an ongoing dialogue among national stakeholders, governments and financing institutions is foreseen.
3.2. Energy needs assessment approach applied by ENTTRANS
From the literature review in the former section, a basic structure for a TNA can be derived as is shown in Table 3-1. Table 3-1. Basic TNA structure based on literature assessment Enabling environment Selection of stakeholders
Funding for the overall TNA process Communication with stakeholders: bilaterally or via workshops Building awareness among larger public
Selection of target areas Adaptation or mitigation or both Sectors (e.g. energy, transport, industry, waste management, agriculture,
built environment) Within these sectors, sub-sector or energy services (e.g. energy for urban
population, energy for rural population, cooling for hospitals, cooling in buildings, cooking, etc)
Criteria for selection of suitable technologies
How would a technology fit in the objective of supporting the country’s priority areas, sectors and/or sub-sectors and services, both with a view to the medium and to the long term?
A technology’s overall contribution to sustainable development of country: economic contribution, environmental and social contributions.
Applicability of technology in country
Identification of implementation barriers to technology implementation in the country
Identification of solutions to remove these barriers Capacity building By improving information exchange among stakeholders and information
campaigns in other media, awareness of priorities and needs can be increased
By creating market networks and institutions, implementation of a particular technology can be replicated and the overall climate for technology transfer in the country be improved
Creation of project portfolios
To support the implementation of priority technologies, projects can be formulated to demonstrate the working of the technologies in the country.
Finding of financial sources for these projects.
42
One important insight from the above is that an assessment of technology needs cannot take place without considering the context of the country concerned, and not without full discussion and awareness raising of all the possibilities for large scale and small scale decentralised technologies. Just selecting a technology and exploring how this could be implemented in the country might easily overlook that for a country’s sustainable development this technology may not be most suitable or that it might not deliver an optimal contribution to meeting a country’s energy service needs. Therefore, the ENTTRANS study has chosen to carry out an Energy Service Needs Assessment (ESNA) before identifying suitable low-carbon technologies in a country. An assessment of energy service needs and priorities would provide important insights into what energy policy and decision makers consider important aspects of a country’s sustainable energy strategy.
As a next step, possible technologies to meet those energy service needs could be examined only after full discussion and awareness raising of all the possibilities for large scale and small scale decentralised technologies. This process would allow policy makers and industry players to become familiar with these new medium and long-term technology possibilities for innovation of low carbon systems. Awareness raising should take the form of information dissemination coupled to programmes of visits to existing demonstrations of technologies and also demonstration of reliability and practicality at the country level for very new technologies. Once this process of introduction and acceptance by policymakers and industry has been carried out, then a TNA can be carried out for inclusion of low carbon technologies in a) country energy strategies and plans, and b) introduction to the country technology market.
For the ESNA in the ENTTRANS study, a broad range of sub-sectors or energy services have been identified for the study: Electricity for industrial appliances; Electricity for agricultural production; Electricity for households, both in rural communities and urban communities; Electricity for service sectors; Heat delivery for industry; Heat delivery for households; Heat delivery for service sectors; Energy for cooling purposes (e.g. medicines); Efficient design of buildings; Energy for cooking; and Municipal solid waste management.
All these services have in common that they could be delivered by technologies which switch from centralised to decentralised systems or switch from fossil fuels to renewable energy sources or from one fossil fuel to another fossil fuel with a lower carbon content. Carbon capture and storage can be linked to some of these services, in particular when the CO2 can be captured during the energy production process, such as in the case of switching from conventional pulverising coal technologies to cleaner coal-based technologies with a connection to a CO2 capture technology. Transport was originally not included in this basic list of technologies but in the bilateral interviews several stakeholders added this service, given the potential in the transport sector for fuel switch.
The selection of technologies in ENTTRANS to be discussed with country stakeholders has been rather broad by identifying from a range of literature sources (e.g. Abare, 2006; Martinot, 2006; Matysek et al., 2006; WADE, 2003; World Bank, 2005; World Coal Institute, 2004) clean, sustainable energy technologies that might be applicable (see Table 3-2). The list has been included in the questionnaire used for bilateral stakeholder interviews (see Annex 1).
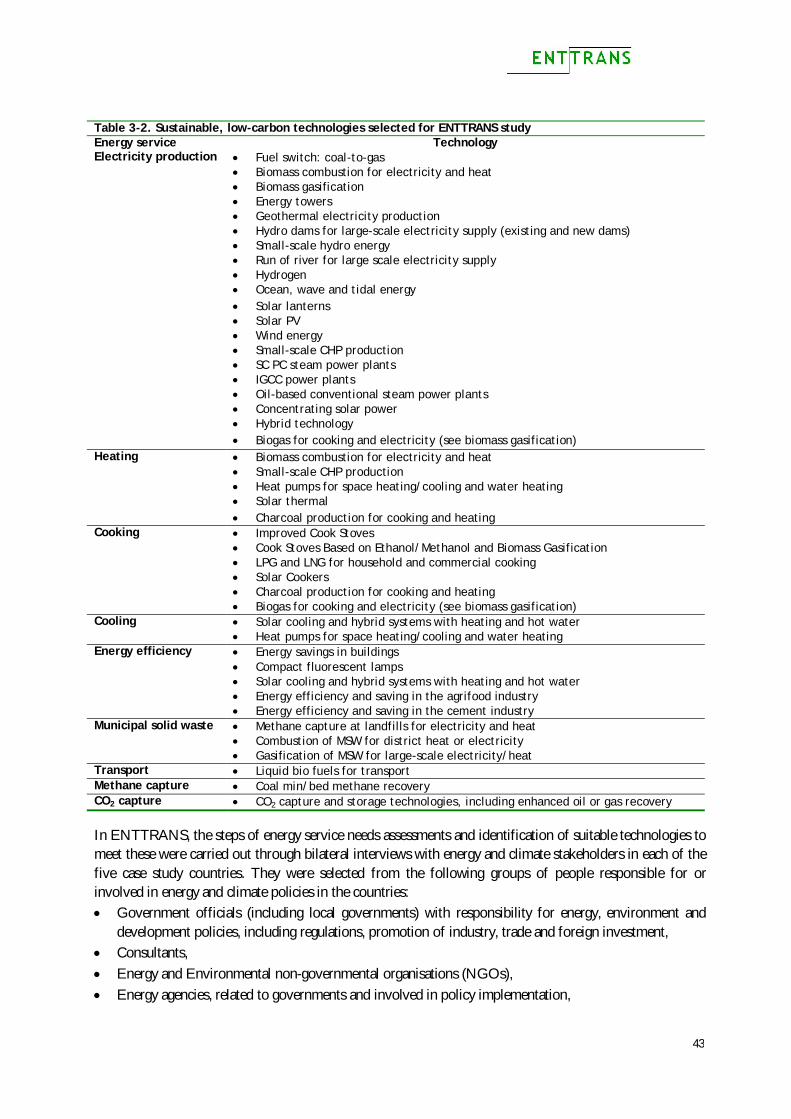
43
Table 3-2. Sustainable, low-carbon technologies selected for ENTTRANS study Energy service Technology Electricity production Fuel switch: coal-to-gas Biomass combustion for electricity and heat Biomass gasification Energy towers Geothermal electricity production Hydro dams for large-scale electricity supply (existing and new dams) Small-scale hydro energy Run of river for large scale electricity supply Hydrogen Ocean, wave and tidal energy Solar lanterns Solar PV Wind energy Small-scale CHP production SC PC steam power plants IGCC power plants Oil-based conventional steam power plants Concentrating solar power Hybrid technology Biogas for cooking and electricity (see biomass gasification) Heating Biomass combustion for electricity and heat Small-scale CHP production Heat pumps for space heating/cooling and water heating Solar thermal Charcoal production for cooking and heating Cooking Improved Cook Stoves Cook Stoves Based on Ethanol/Methanol and Biomass Gasification LPG and LNG for household and commercial cooking Solar Cookers Charcoal production for cooking and heating Biogas for cooking and electricity (see biomass gasification) Cooling Solar cooling and hybrid systems with heating and hot water Heat pumps for space heating/cooling and water heating Energy efficiency Energy savings in buildings Compact fluorescent lamps Solar cooling and hybrid systems with heating and hot water Energy efficiency and saving in the agrifood industry Energy efficiency and saving in the cement industry Municipal solid waste Methane capture at landfills for electricity and heat Combustion of MSW for district heat or electricity Gasification of MSW for large-scale electricity/heat Transport Liquid bio fuels for transport Methane capture Coal min/bed methane recovery CO2 capture CO2 capture and storage technologies, including enhanced oil or gas recovery In ENTTRANS, the steps of energy service needs assessments and identification of suitable technologies to meet these were carried out through bilateral interviews with energy and climate stakeholders in each of the five case study countries. They were selected from the following groups of people responsible for or involved in energy and climate policies in the countries: Government officials (including local governments) with responsibility for energy, environment and
development policies, including regulations, promotion of industry, trade and foreign investment, Consultants, Energy and Environmental non-governmental organisations (NGOs), Energy agencies, related to governments and involved in policy implementation,
44
Industry supply chain companies, Industry associations, International donor organisations, Local (grassroots) organisations, Consumer groups, and Academic organisations, industrial R&D organisations.
Before describing the outcomes of the stakeholder assessments of technology needs within the case-study contexts, some limitations to the concept of ESNA in general and applied under ENTTRANS in particular must be mentioned. First, although the group of stakeholders in each country has brought together considerable knowledge of a country’s needs and energy and climate context, the number is too little for extensive statistical analysis. The results presented in the next chapter are therefore mainly qualitative interpretations of the answers given and feedback provided by stakeholders.
Second, during the interviews it could sometimes be observed that stakeholders’ perceptions of particular developments differed from actual practice (e.g. when government officials mentioned that a electricity provision for a particular was no priority issue anymore because problems were thought to have been solved, whereas other stakeholders gave a high priority to this sector because they were aware of still existing problems). Moreover, in some cases, stakeholders gave a higher priority to technologies that they were more familiar with; there seemed to be tendency to give lower scores to unfamiliar technologies.
Third, since the case-study countries have been selected based on their different profiles as CDM host countries, inter-country analysis is complicated as differences in terms of priorities and technologies found between, e.g., China and Kenya are difficult to compare since the countries are entirely different from each other. However, in a follow up action, the scope of the analysis might be broadened to countries with comparable contexts. For example, results for Kenya may be useful for neighbouring countries in East-Africa, such as Uganda and Tanzania.
Despite these limitations, the strength of the approach lies in the fact that resources have been available to have in-depth discussions with key stakeholders on energy services and a range of low-carbon technologies to meet these. As such, the approach enables a disclosure of best available knowledge of low-carbon energy technologies in each country.
3.3. The ESNA approach
The Energy Service Needs Assessment (ESNA) approach developed in this Chapter as a process of identifying developing countries’ energy service needs and technologies to meet those needs, while exploring the perceptions within different countries, has been detailed in Figure 3-1. It is noted here that the energy service needs assessments carried out in the five case study countries are discussed in the next Chapter, while the Market Mapping element in Figure 3-1 will be discussed in Chapter 5 (theoretical background) and Chapter 6 (application with case-study country stakeholders). The connection between ESNA and the CDM will be discussed in Chapter 7.
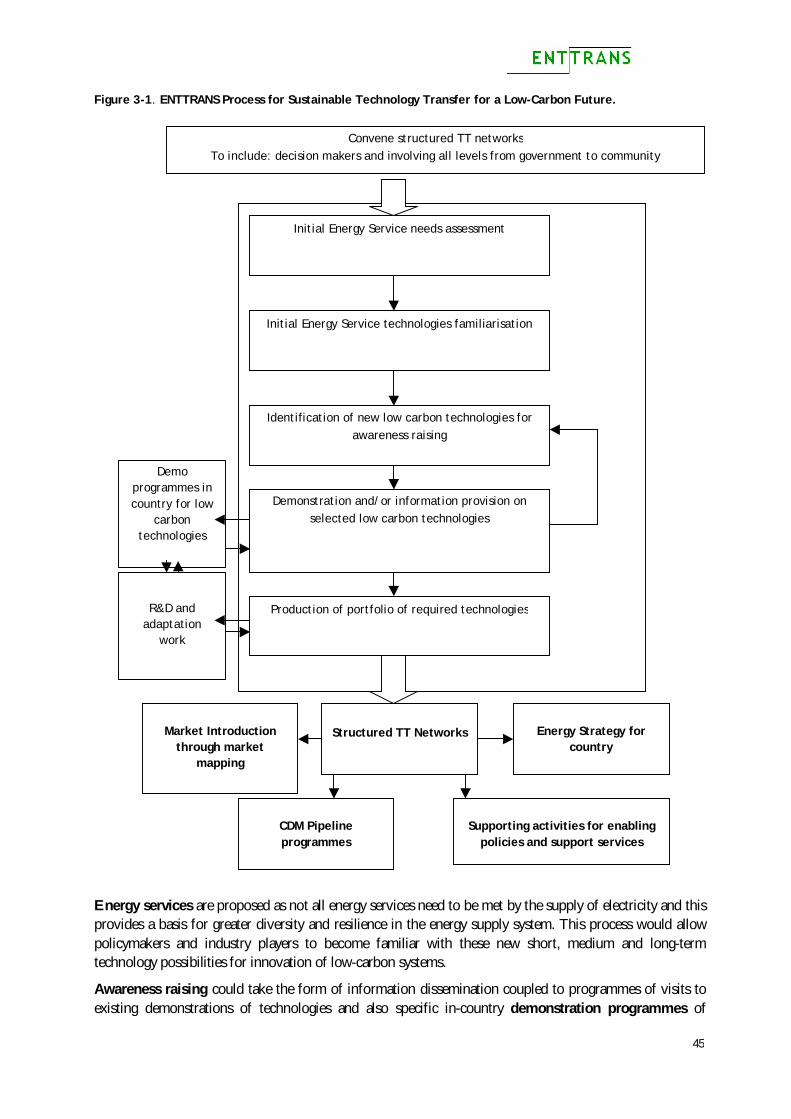
45
Figure 3-1. ENTTRANS Process for Sustainable Technology Transfer for a Low-Carbon Future.
Energy services are proposed as not all energy services need to be met by the supply of electricity and this provides a basis for greater diversity and resilience in the energy supply system. This process would allow policymakers and industry players to become familiar with these new short, medium and long-term technology possibilities for innovation of low-carbon systems.
Awareness raising could take the form of information dissemination coupled to programmes of visits to existing demonstrations of technologies and also specific in-country demonstration programmes of
Convene structured TT networks To include: decision makers and involving all levels from government to community
Initial Energy Service needs assessment
Initial Energy Service technologies familiarisation
Identification of new low carbon technologies for awareness raising
Demonstration and/or information provision on selected low carbon technologies
Production of portfolio of required technologies
R&D and adaptation
work
Structured TT Networks
Energy Strategy for
country
Market Introduction
through market mapping
CDM Pipeline programmes
Supporting activities for enabling
policies and support services
Demo programmes in country for low
carbon technologies
46
reliability and practicality coupled to any adaptation of the technology required. Therefore, there should be a link to R&D.
Once this process of introduction and acceptance by policymakers and industry has been carried out, it can be followed by the assessment of the technologies to meet the energy service needs for inclusion of low carbon technologies in a) country energy strategies and plans, and b) introduction to the country technology market. This process has to engage stakeholders at all levels from government to local communities to ensure that choices deliver the required sustainability benefits.
The ESNA and familiarisation and assessment exercise should result in an agreed portfolio of low carbon technologies within existing systems. Networks can then be set up to produce national energy strategies, market mapping for introduction of the technologies and input to CDM programmes. In addition, the strategy and market networks can generate the integrated package of measures needed to support the transfers through identification of the blockages and opportunities. These supporting measures on the enabling business environment and the market support services would then also have to be undertaken for successful transfers. Examples are given in the next section.
It is important to point out that both the ENTTRANS process and the supporting activities on the enabling business environment and market support services are ALL required as far as possible to ensure successful adoption and transfer. This process is not a ‘one-off-quick-fix’ but should be seen as catalysing a new direction for a longer-term programme requiring a commitment to continuing support.
This is in line with Philibert (2006) who, in addressing the problems of solar thermal energy in his report to the UNFCCC, pointed out that all of the activities to remove barriers are needed if successful transfer is to occur.
47
4. Energy Needs Assessments in Case Study Countries
4.1. Introduction
After the description of the ENTTRANS approach for assessments of energy service needs and of technologies to meet these, this Chapter contains the results of applying this approach to the five case-study countries. The questionnaire analysis with country stakeholders, used in this Chapter, has been supported by a brief analysis of the country contexts in terms of energy, economic, and climate policy profiles. Through such analyses, a first assessment can be made of countries’ energy mix with dominating energy sources and technologies, indigenous energy resources, and the need to import energy from other countries.
Regarding the questionnaire, it must be remarked that respondents have been asked to rank energy services (question 1), technology suitability (question 2), and sustainable development contribution of selected technologies (question 3) on a scale of 5 to 1, with ‘5’ meaning ‘very high’ and ‘1’ meaning ‘very low’ (the answer ‘0’ would mean ‘not relevant for the country’). The ranking method used is a cardinal interval scale, which means that respondents were not asked to rank services in order of priority (as with ordinal scale), but to give their opinions in terms of how important a particular energy service is for the country or how suitable they think a particular technology would be. A rank ‘4’ would thus not say that a technology is second best for the country, but that its contribution to the country’s sustainable development could be high (not ‘very high’ as with ‘5’, but neither ‘medium’ as with ‘3’). It also implies that if one energy service or technology receives a five, the second best could be ranked, e.g., ‘2’ if stakeholders consider their contribution low.
4.2. Chile
4.2.1. Country context
Chile is an open economy that has been growing during the past decade by an average rate of 3.9% per annum. The mining of copper and several other minerals is a vital element of the Chilean economy. Other strong sectors, also based on natural resources, are agriculture (Chile is one of the world’s largest fruit exporters), forestry (about 20% of the land surface is covered with forests), and fishery. The economic growth has been accompanied by a similar growth pattern, which is projected to continue into the future. In terms of energy supply, Chile has a significant share of hydroelectricity in its power production portfolio, which is complemented by coal and natural gas imported from abroad.
According to Chile’s First National Communication to the UNFCCC (Government of Chile, 2000), the country’s CO2 emissions in 1994 amounted to about 95 Mt of which about one-third came from the energy sector and two-thirds from non-energy sectors. As shown in Table 4-1, Chile’s extensive forest area and other natural sinks (mainly vegetation) causes absorption of 87.8 Mt CO2 in 1994 so that the country’s net CO2 emissions were about 7.4 Mt. The emissions of CH4 and N2O amounted to 6.5 and almost 8 Mt in terms of CO2-eq. which was mainly caused by non-energy sectors. The transportation sector is responsible for most of Chile’s CO2-eq. emissions (37%), followed by manufacturing and construction (26%) and energy production (24%). Commercial, residential, institutional, and agriculture activities were responsible for about 13% of emissions (Government of Chile, 2000).
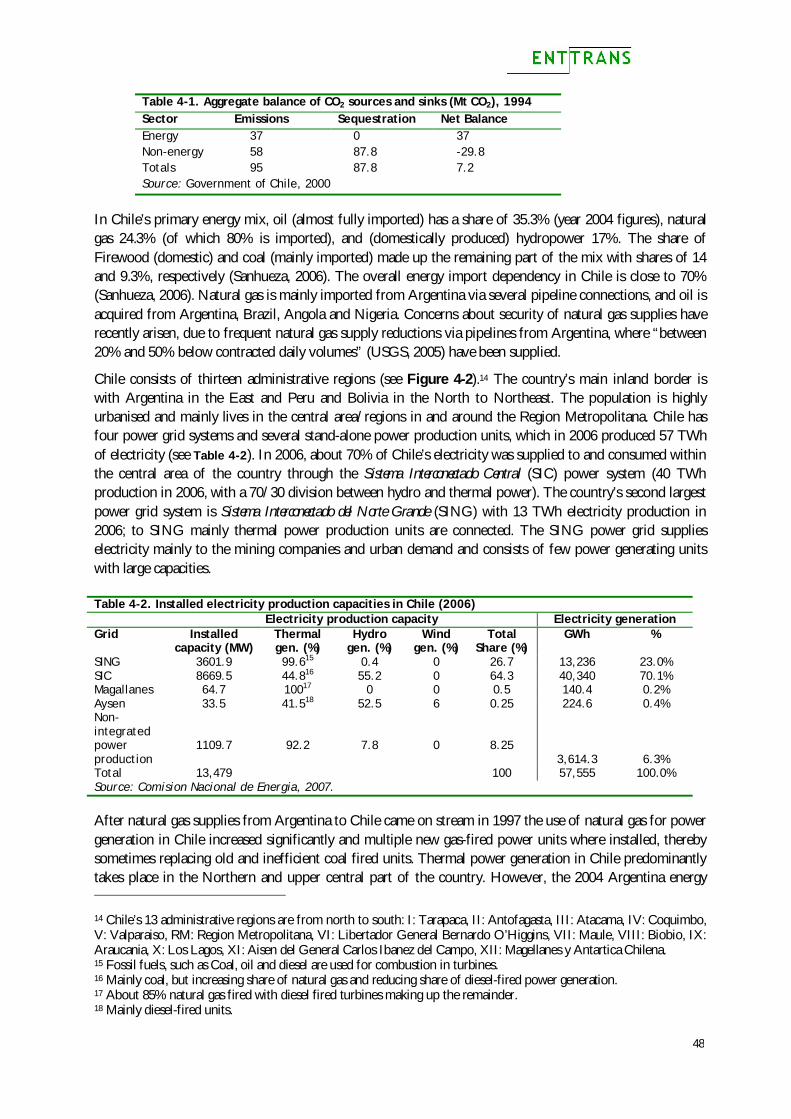
48
Table 4-1. Aggregate balance of CO2 sources and sinks (Mt CO2), 1994 Sector Emissions Sequestration Net Balance Energy 37 0 37 Non-energy 58 87.8 -29.8 Totals 95 87.8 7.2 Source: Government of Chile, 2000
In Chile’s primary energy mix, oil (almost fully imported) has a share of 35.3% (year 2004 figures), natural gas 24.3% (of which 80% is imported), and (domestically produced) hydropower 17%. The share of Firewood (domestic) and coal (mainly imported) made up the remaining part of the mix with shares of 14 and 9.3%, respectively (Sanhueza, 2006). The overall energy import dependency in Chile is close to 70% (Sanhueza, 2006). Natural gas is mainly imported from Argentina via several pipeline connections, and oil is acquired from Argentina, Brazil, Angola and Nigeria. Concerns about security of natural gas supplies have recently arisen, due to frequent natural gas supply reductions via pipelines from Argentina, where “between 20% and 50% below contracted daily volumes” (USGS, 2005) have been supplied.
Chile consists of thirteen administrative regions (see Figure 4-2).14 The country’s main inland border is with Argentina in the East and Peru and Bolivia in the North to Northeast. The population is highly urbanised and mainly lives in the central area/regions in and around the Region Metropolitana. Chile has four power grid systems and several stand-alone power production units, which in 2006 produced 57 TWh of electricity (see Table 4-2). In 2006, about 70% of Chile’s electricity was supplied to and consumed within the central area of the country through the Sistema Interconectado Central (SIC) power system (40 TWh production in 2006, with a 70/30 division between hydro and thermal power). The country’s second largest power grid system is Sistema Interconectado del Norte Grande (SING) with 13 TWh electricity production in 2006; to SING mainly thermal power production units are connected. The SING power grid supplies electricity mainly to the mining companies and urban demand and consists of few power generating units with large capacities. Table 4-2. Installed electricity production capacities in Chile (2006) Electricity production capacity Electricity generation Grid Installed
capacity (MW) Thermal gen. (%)
Hydro gen. (%)
Wind gen. (%)
Total Share (%)
GWh %
SING 3601.9 99.615 0.4 0 26.7 13,236 23.0% SIC 8669.5 44.816 55.2 0 64.3 40,340 70.1% Magallanes 64.7 10017 0 0 0.5 140.4 0.2% Aysen 33.5 41.518 52.5 6 0.25 224.6 0.4% Non-integrated power production
1109.7
92.2
7.8
0
8.25 3,614.3 6.3%
Total 13,479 100 57,555 100.0% Source: Comision Nacional de Energia, 2007. After natural gas supplies from Argentina to Chile came on stream in 1997 the use of natural gas for power generation in Chile increased significantly and multiple new gas-fired power units where installed, thereby sometimes replacing old and inefficient coal fired units. Thermal power generation in Chile predominantly takes place in the Northern and upper central part of the country. However, the 2004 Argentina energy 14 Chile’s 13 administrative regions are from north to south: I: Tarapaca, II: Antofagasta, III: Atacama, IV: Coquimbo, V: Valparaiso, RM: Region Metropolitana, VI: Libertador General Bernardo O’Higgins, VII: Maule, VIII: Biobio, IX: Araucania, X: Los Lagos, XI: Aisen del General Carlos Ibanez del Campo, XII: Magellanes y Antartica Chilena. 15 Fossil fuels, such as Coal, oil and diesel are used for combustion in turbines. 16 Mainly coal, but increasing share of natural gas and reducing share of diesel-fired power generation. 17 About 85% natural gas fired with diesel fired turbines making up the remainder. 18 Mainly diesel-fired units.
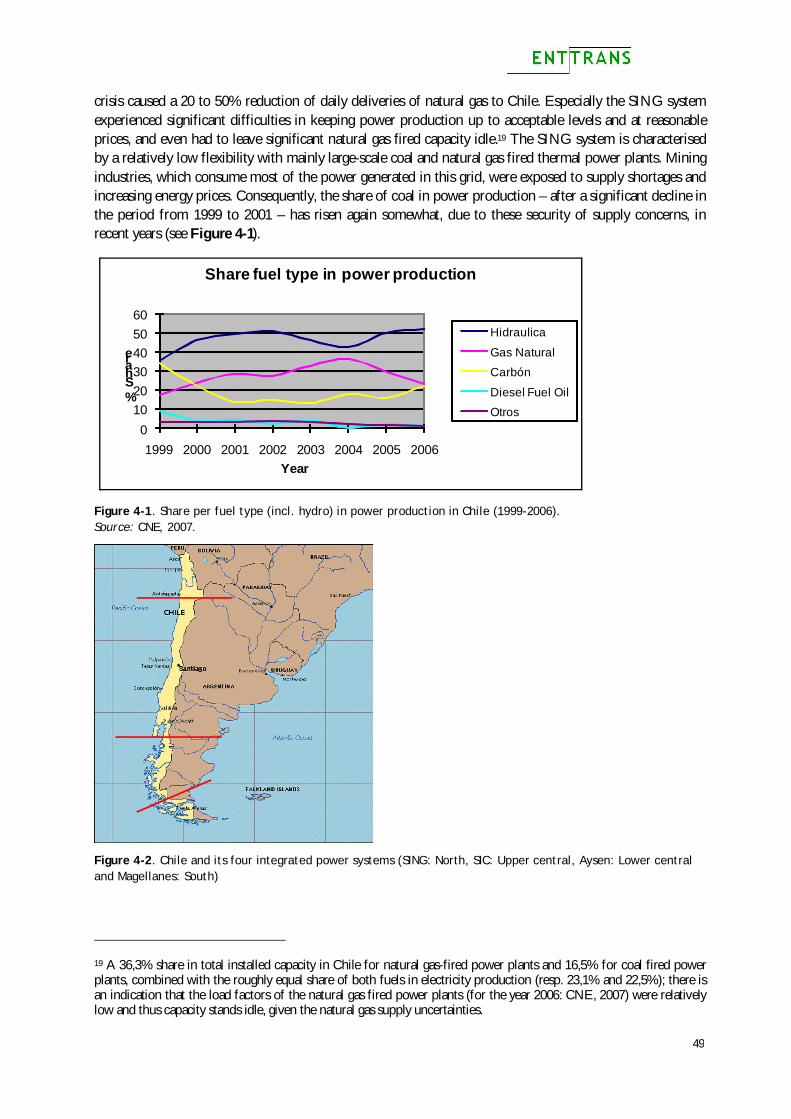
49
crisis caused a 20 to 50% reduction of daily deliveries of natural gas to Chile. Especially the SING system experienced significant difficulties in keeping power production up to acceptable levels and at reasonable prices, and even had to leave significant natural gas fired capacity idle.19 The SING system is characterised by a relatively low flexibility with mainly large-scale coal and natural gas fired thermal power plants. Mining industries, which consume most of the power generated in this grid, were exposed to supply shortages and increasing energy prices. Consequently, the share of coal in power production – after a significant decline in the period from 1999 to 2001 – has risen again somewhat, due to these security of supply concerns, in recent years (see Figure 4-1).
0102030405060
1999 2000 2001 2002 2003 2004 2005 2006
% Share
Year
Share fuel type in power production
Hidraulica
Gas NaturalCarbón
Diesel Fuel OilOtros
Figure 4-1. Share per fuel type (incl. hydro) in power production in Chile (1999-2006). Source: CNE, 2007.
Figure 4-2. Chile and its four integrated power systems (SING: North, SIC: Upper central, Aysen: Lower central and Magellanes: South)
19 A 36,3% share in total installed capacity in Chile for natural gas-fired power plants and 16,5% for coal fired power plants, combined with the roughly equal share of both fuels in electricity production (resp. 23,1% and 22,5%); there is an indication that the load factors of the natural gas fired power plants (for the year 2006: CNE, 2007) were relatively low and thus capacity stands idle, given the natural gas supply uncertainties.
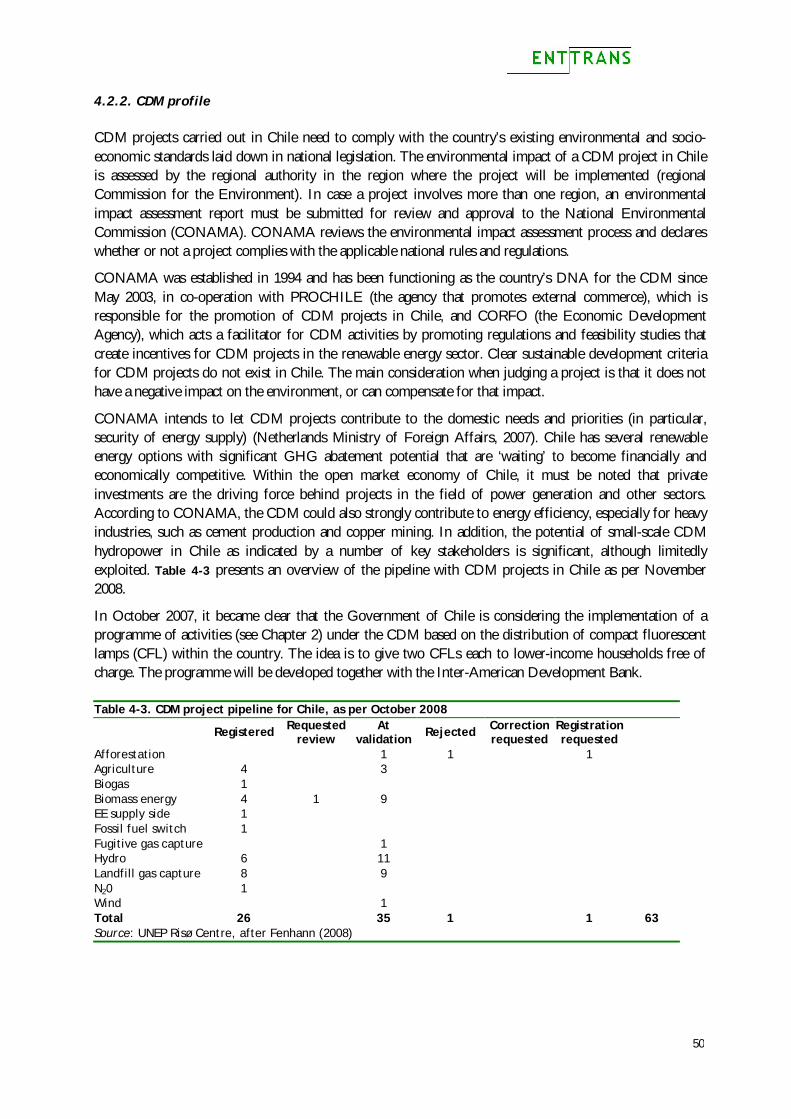
50
4.2.2. CDM profile
CDM projects carried out in Chile need to comply with the country’s existing environmental and socio-economic standards laid down in national legislation. The environmental impact of a CDM project in Chile is assessed by the regional authority in the region where the project will be implemented (regional Commission for the Environment). In case a project involves more than one region, an environmental impact assessment report must be submitted for review and approval to the National Environmental Commission (CONAMA). CONAMA reviews the environmental impact assessment process and declares whether or not a project complies with the applicable national rules and regulations.
CONAMA was established in 1994 and has been functioning as the country’s DNA for the CDM since May 2003, in co-operation with PROCHILE (the agency that promotes external commerce), which is responsible for the promotion of CDM projects in Chile, and CORFO (the Economic Development Agency), which acts a facilitator for CDM activities by promoting regulations and feasibility studies that create incentives for CDM projects in the renewable energy sector. Clear sustainable development criteria for CDM projects do not exist in Chile. The main consideration when judging a project is that it does not have a negative impact on the environment, or can compensate for that impact.
CONAMA intends to let CDM projects contribute to the domestic needs and priorities (in particular, security of energy supply) (Netherlands Ministry of Foreign Affairs, 2007). Chile has several renewable energy options with significant GHG abatement potential that are ‘waiting’ to become financially and economically competitive. Within the open market economy of Chile, it must be noted that private investments are the driving force behind projects in the field of power generation and other sectors. According to CONAMA, the CDM could also strongly contribute to energy efficiency, especially for heavy industries, such as cement production and copper mining. In addition, the potential of small-scale CDM hydropower in Chile as indicated by a number of key stakeholders is significant, although limitedly exploited. Table 4-3 presents an overview of the pipeline with CDM projects in Chile as per November 2008.
In October 2007, it became clear that the Government of Chile is considering the implementation of a programme of activities (see Chapter 2) under the CDM based on the distribution of compact fluorescent lamps (CFL) within the country. The idea is to give two CFLs each to lower-income households free of charge. The programme will be developed together with the Inter-American Development Bank. Table 4-3. CDM project pipeline for Chile, as per October 2008
Registered Requested review
At validation Rejected Correction
requested Registration requested
Afforestation 1 1 1 Agriculture 4 3 Biogas 1 Biomass energy 4 1 9 EE supply side 1 Fossil fuel switch 1 Fugitive gas capture 1 Hydro 6 11 Landfill gas capture 8 9 N20 1 Wind 1 Total 26 35 1 1 63 Source: UNEP Risø Centre, after Fenhann (2008)
51
4.2.3. Energy Needs Assessment
In Chile, during September 2006 and May 2007, 30 stakeholders were interviewed for the ENTTRANS study and asked which energy services would need to be paid most attention to, which low-carbon technology would be most suitable for the Chilean context and what sustainable development contribution each of the highly ranked technologies would, in their view, deliver.
Of the listed energy services in question 1 of the questionnaire, energy efficiency in industry, electricity provision for households (rural areas) and electricity for industry were considered by stakeholders as important priorities (with average scores of 4.4, 4.2, 4.2, and 4.0, respectively; remember from Chapter 3 that scores could range along a cardinal scale from 1 to 5). Energy efficiency in industry (cement, iron&steel, agro&food (e.g. sugar), and chemical sectors) was given the highest score by 23 out of 30 stakeholders, while electricity for industry was considered a very important energy service by 20 stakeholders. Electricity provision for the agriculture sector was considered of medium to high importance (average of 3.8), as well as municipal solid waste management (3.68) and heat for industry (average of 3.56).
About one-third of the Chilean stakeholders also considered energy efficiency or fuel switch technologies in the transport sector important to very important. Other energy services which stakeholders considered important to very important are: energy efficiency in the production of minerals, which is, as mentioned above, an important economic sector in Chile; refrigeration in the agro-industry, desalination technologies, demand-side management at households and the service sector (schools and hospitals).
It was also analysed how the energy service needs and priorities were distributed across the groups of stakeholders. Among the people from academic institutions interviewed (five persons), all services listed in question 1 were on average considered imported to very important, with an average score of 4.3. Representatives of consulting organisations (6) were more selective and gave the highest scores to energy efficiency in industry and electricity for households (important to very important), followed by heating for industry and municipal solid waste management (important). Electricity for agriculture and services, heating for households and services, and energy for cooling purposes was considered of medium importance.
Government representatives (8 interviewed) attached the highest priority to energy for cooling (3.8), and electricity for agriculture and households in rural areas (between medium importance and important). Not surprisingly, industry respondents (7) found energy efficiency in industry very important (4.9 average score), followed by electricity for industry and households, and heating for industry (important). Finally, the representatives of several organisations (NGOs and international organisations such as UNIDO; 4 interviewed) were of the opinion that electricity for industry and energy efficiency improvement in industry are very important, followed by municipal solid waste management (between important and very important) and electricity for agriculture. Heating was given low importance scores (average 1.5) and the other services were considered by these interviewees as being of around medium importance.
Overall, the answers to question 1 from Chilean stakeholders show that, as said above, electricity for households and industry, energy efficiency in industry and municipal solid waste are important energy services for the country. These answers are in line with the growing concern in Chile about energy delivery through imports (e.g. disrupted natural gas from Argentina, see section 5.2.1) and the consequences this may have for security of electricity supply for households and industry. Heating and cooling generally receive lower scores from Chilean stakeholders.
When comparing the scores across stakeholders, it can be seen that the interviewees from academic and research institutes consider more services important to very important than stakeholders from governments do; the latter group generally gave lower (around medium importance) scores to the energy services listed in the question. Of the other stakeholder groups, the consultants gave answers that were closest to the overall
52
average scores found for Chile; industrial stakeholders gave high importance score for energy services related to industry’s energy use.
In question 2 (suitability of technologies), stakeholders were asked which technologies they considered suitable for the energy services explored in question 1. The most suitable technology for Chile that came out of the interviews was energy saving lamps, such as CFL (average score of 4.65) followed by sustainable design of building technologies and passive cooling technologies (4.54 and 4.39, respectively). These three technologies, aiming at reducing energy demand, were mainly considered very suitable for the priority of increased security of electricity supply for households. Use of biomass (from forest residues and agriculture waste) for electricity, capture of landfill gas, wind power, methane combustion, mini/micro hydropower, and energy conservation technologies in the agro-food (e.g. sugar) cement, iron & steel, and chemical sectors, geothermal power, solar thermal, and biogas technologies were considered suitable (scores between 4 and 4.36).
The wind power and biomass boiler technologies were even ranked as very important (5) by around half of the stakeholders. With the methane combustion from coal seams and oil it must be remarked that about one-third of the stakeholders indicated that they were too unfamiliar with the technology to be able to give it a rank, which created a bias in the high score since the stakeholders that were familiar with the technology also considered it important to very important. This pattern was largely found for the different stakeholder groups, with the difference that governmental stakeholders, academic stakeholders and consultants focussed more on technologies to increase electricity security of supply for households and industry when considering suitability, whereas industry stakeholders had a clearer preference for focussing on energy efficiency improvement technologies in industry.
Low importance in terms of electricity production was given to coal-to-gas conversion, oil- and coal-steam improvement, energy towers, and coalmine methane technologies, although the latter score was biased downwards since over one-third of the stakeholders were not familiar with the technology, whereas stakeholders who were familiar with it gave it a low score.
Finally, stakeholders considered sustainable development aspects of the technologies considered ‘important/suitable’ and ‘very important/very suitable’ in question 2. On average, stakeholders suggested that the preferred technologies would deliver large sustainable benefits, although they considered benefits in terms of economic and environmental aspects of slightly more importance than social benefits.
4.3. China
4.3.1. Country context
On 30 August 2002, the Government of the People’s Republic of China (hereafter China) approved the Kyoto Protocol. China had already been a Party to the UNFCCC since 5 January 1993. According to China’s Initial National Communication on Climate Change to the UNFCCC, population growth, increasing urbanisation, changing patterns of economic development and consumption, technological progress, and changes in forestry are the principle factors behind the future development of GHG emissions in China. It is stated that, on the one hand, GHG emissions will grow due to an increase in economic activity, but, on the other hand, the growth rate in GHG emissions could be reduced through technological development and the Government’s strive for sustainable development.
Tentative estimates suggest that China’s annual GHG emissions in 2004 amounted to about 6.1 Gton/CO2-eq. (CO2: 5 Gt). According to China’s National Climate Change Programme, from 1994 to 2004, the annual growth rate of GHG emissions was around 4% and the share of CO2 in total GHG emissions increased
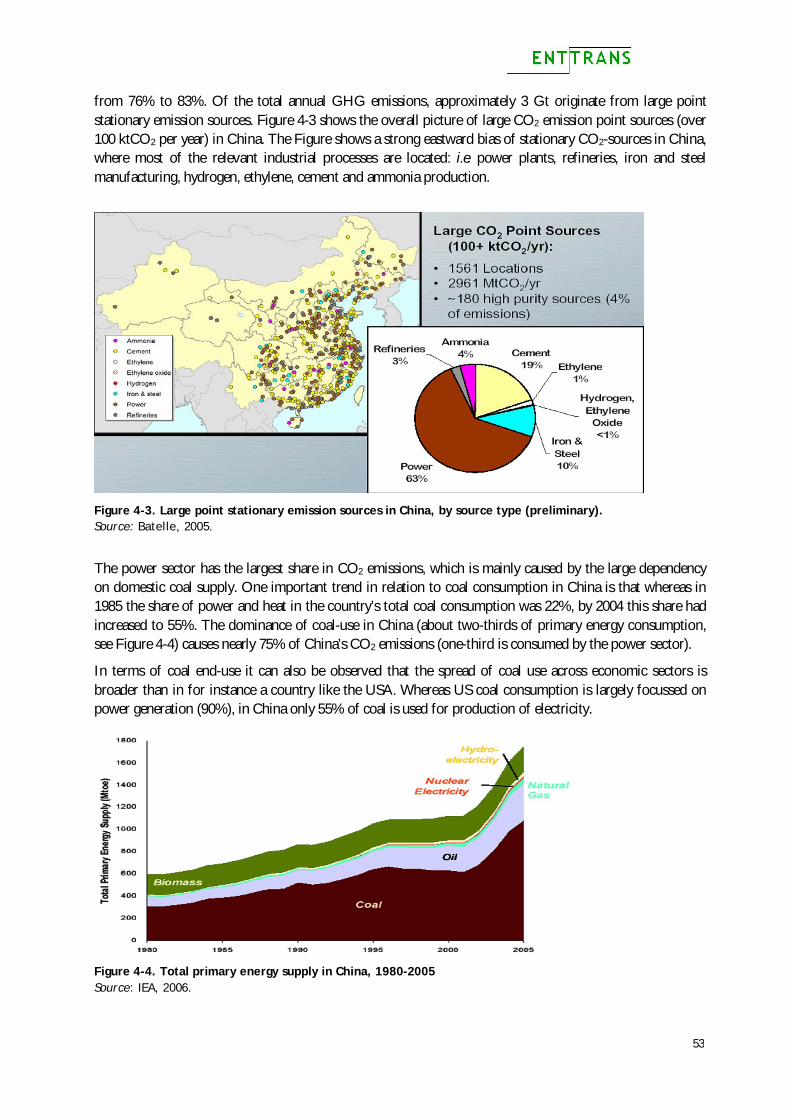
53
from 76% to 83%. Of the total annual GHG emissions, approximately 3 Gt originate from large point stationary emission sources. Figure 4-3 shows the overall picture of large CO2 emission point sources (over 100 ktCO2 per year) in China. The Figure shows a strong eastward bias of stationary CO2-sources in China, where most of the relevant industrial processes are located: i.e. power plants, refineries, iron and steel manufacturing, hydrogen, ethylene, cement and ammonia production.
Figure 4-3. Large point stationary emission sources in China, by source type (preliminary). Source: Batelle, 2005.
The power sector has the largest share in CO2 emissions, which is mainly caused by the large dependency on domestic coal supply. One important trend in relation to coal consumption in China is that whereas in 1985 the share of power and heat in the country’s total coal consumption was 22%, by 2004 this share had increased to 55%. The dominance of coal-use in China (about two-thirds of primary energy consumption, see Figure 4-4) causes nearly 75% of China’s CO2 emissions (one-third is consumed by the power sector).
In terms of coal end-use it can also be observed that the spread of coal use across economic sectors is broader than in for instance a country like the USA. Whereas US coal consumption is largely focussed on power generation (90%), in China only 55% of coal is used for production of electricity.
Figure 4-4. Total primary energy supply in China, 1980-2005 Source: IEA, 2006.
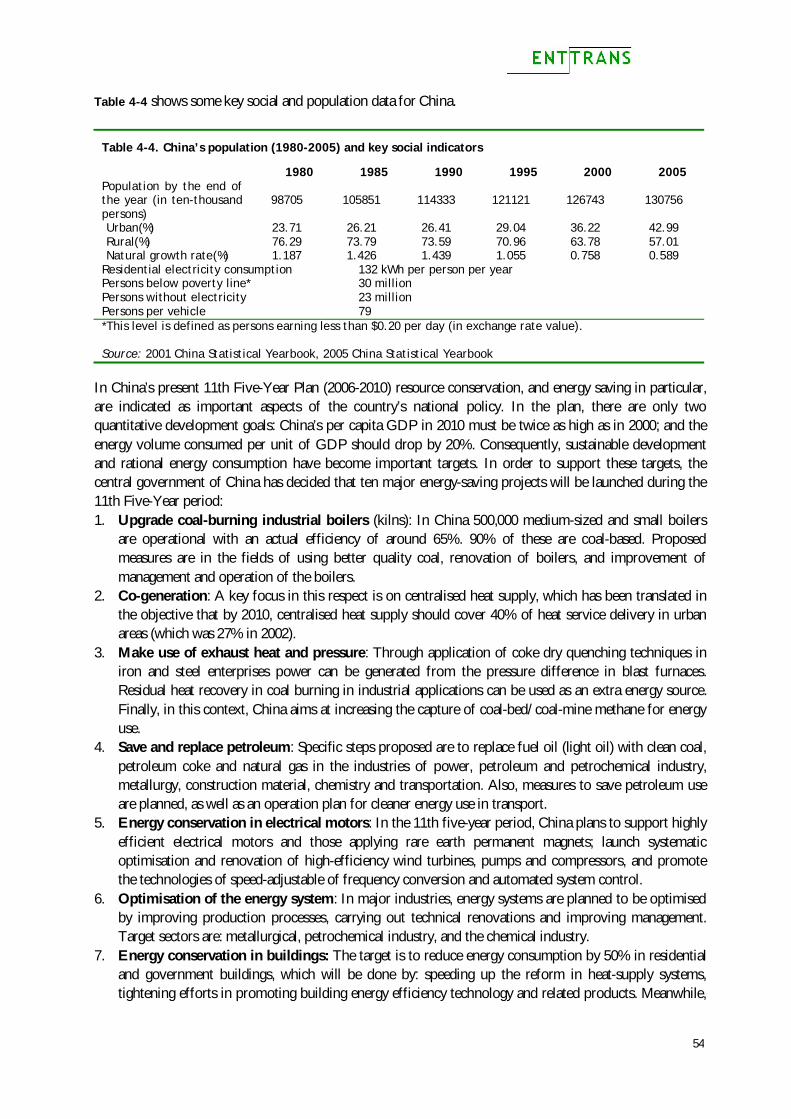
54
Table 4-4 shows some key social and population data for China.
Table 4-4. China’s population (1980-2005) and key social indicators
1980 1985 1990 1995 2000 2005 Population by the end of the year (in ten-thousand persons)
98705 105851 114333 121121 126743 130756
Urban(%) 23.71 26.21 26.41 29.04 36.22 42.99 Rural(%) 76.29 73.79 73.59 70.96 63.78 57.01 Natural growth rate(%) 1.187 1.426 1.439 1.055 0.758 0.589
Residential electricity consumption 132 kWh per person per year Persons below poverty line* 30 million Persons without electricity 23 million Persons per vehicle 79 *This level is defined as persons earning less than $0.20 per day (in exchange rate value). Source: 2001 China Statistical Yearbook, 2005 China Statistical Yearbook
In China’s present 11th Five-Year Plan (2006-2010) resource conservation, and energy saving in particular, are indicated as important aspects of the country’s national policy. In the plan, there are only two quantitative development goals: China’s per capita GDP in 2010 must be twice as high as in 2000; and the energy volume consumed per unit of GDP should drop by 20%. Consequently, sustainable development and rational energy consumption have become important targets. In order to support these targets, the central government of China has decided that ten major energy-saving projects will be launched during the 11th Five-Year period: 1. Upgrade coal-burning industrial boilers (kilns): In China 500,000 medium-sized and small boilers
are operational with an actual efficiency of around 65%. 90% of these are coal-based. Proposed measures are in the fields of using better quality coal, renovation of boilers, and improvement of management and operation of the boilers.
2. Co-generation: A key focus in this respect is on centralised heat supply, which has been translated in the objective that by 2010, centralised heat supply should cover 40% of heat service delivery in urban areas (which was 27% in 2002).
3. Make use of exhaust heat and pressure: Through application of coke dry quenching techniques in iron and steel enterprises power can be generated from the pressure difference in blast furnaces. Residual heat recovery in coal burning in industrial applications can be used as an extra energy source. Finally, in this context, China aims at increasing the capture of coal-bed/coal-mine methane for energy use.
4. Save and replace petroleum: Specific steps proposed are to replace fuel oil (light oil) with clean coal, petroleum coke and natural gas in the industries of power, petroleum and petrochemical industry, metallurgy, construction material, chemistry and transportation. Also, measures to save petroleum use are planned, as well as an operation plan for cleaner energy use in transport.
5. Energy conservation in electrical motors: In the 11th five-year period, China plans to support highly efficient electrical motors and those applying rare earth permanent magnets; launch systematic optimisation and renovation of high-efficiency wind turbines, pumps and compressors, and promote the technologies of speed-adjustable of frequency conversion and automated system control.
6. Optimisation of the energy system: In major industries, energy systems are planned to be optimised by improving production processes, carrying out technical renovations and improving management. Target sectors are: metallurgical, petrochemical industry, and the chemical industry.
7. Energy conservation in buildings: The target is to reduce energy consumption by 50% in residential and government buildings, which will be done by: speeding up the reform in heat-supply systems, tightening efforts in promoting building energy efficiency technology and related products. Meanwhile,
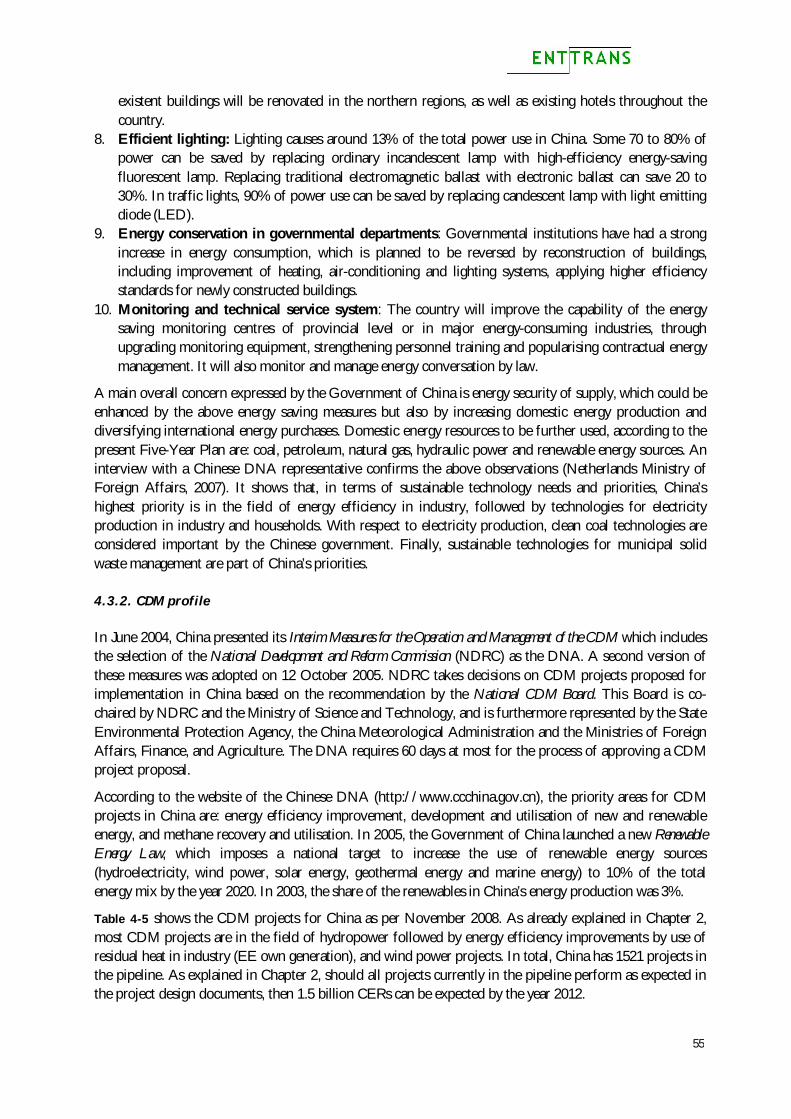
55
existent buildings will be renovated in the northern regions, as well as existing hotels throughout the country.
8. Efficient lighting: Lighting causes around 13% of the total power use in China. Some 70 to 80% of power can be saved by replacing ordinary incandescent lamp with high-efficiency energy-saving fluorescent lamp. Replacing traditional electromagnetic ballast with electronic ballast can save 20 to 30%. In traffic lights, 90% of power use can be saved by replacing candescent lamp with light emitting diode (LED).
9. Energy conservation in governmental departments: Governmental institutions have had a strong increase in energy consumption, which is planned to be reversed by reconstruction of buildings, including improvement of heating, air-conditioning and lighting systems, applying higher efficiency standards for newly constructed buildings.
10. Monitoring and technical service system: The country will improve the capability of the energy saving monitoring centres of provincial level or in major energy-consuming industries, through upgrading monitoring equipment, strengthening personnel training and popularising contractual energy management. It will also monitor and manage energy conversation by law.
A main overall concern expressed by the Government of China is energy security of supply, which could be enhanced by the above energy saving measures but also by increasing domestic energy production and diversifying international energy purchases. Domestic energy resources to be further used, according to the present Five-Year Plan are: coal, petroleum, natural gas, hydraulic power and renewable energy sources. An interview with a Chinese DNA representative confirms the above observations (Netherlands Ministry of Foreign Affairs, 2007). It shows that, in terms of sustainable technology needs and priorities, China’s highest priority is in the field of energy efficiency in industry, followed by technologies for electricity production in industry and households. With respect to electricity production, clean coal technologies are considered important by the Chinese government. Finally, sustainable technologies for municipal solid waste management are part of China’s priorities.
4.3.2. CDM profile
In June 2004, China presented its Interim Measures for the Operation and Management of the CDM which includes the selection of the National Development and Reform Commission (NDRC) as the DNA. A second version of these measures was adopted on 12 October 2005. NDRC takes decisions on CDM projects proposed for implementation in China based on the recommendation by the National CDM Board. This Board is co-chaired by NDRC and the Ministry of Science and Technology, and is furthermore represented by the State Environmental Protection Agency, the China Meteorological Administration and the Ministries of Foreign Affairs, Finance, and Agriculture. The DNA requires 60 days at most for the process of approving a CDM project proposal.
According to the website of the Chinese DNA (http://www.ccchina.gov.cn), the priority areas for CDM projects in China are: energy efficiency improvement, development and utilisation of new and renewable energy, and methane recovery and utilisation. In 2005, the Government of China launched a new Renewable Energy Law, which imposes a national target to increase the use of renewable energy sources (hydroelectricity, wind power, solar energy, geothermal energy and marine energy) to 10% of the total energy mix by the year 2020. In 2003, the share of the renewables in China’s energy production was 3%.
Table 4-5 shows the CDM projects for China as per November 2008. As already explained in Chapter 2, most CDM projects are in the field of hydropower followed by energy efficiency improvements by use of residual heat in industry (EE own generation), and wind power projects. In total, China has 1521 projects in the pipeline. As explained in Chapter 2, should all projects currently in the pipeline perform as expected in the project design documents, then 1.5 billion CERs can be expected by the year 2012.
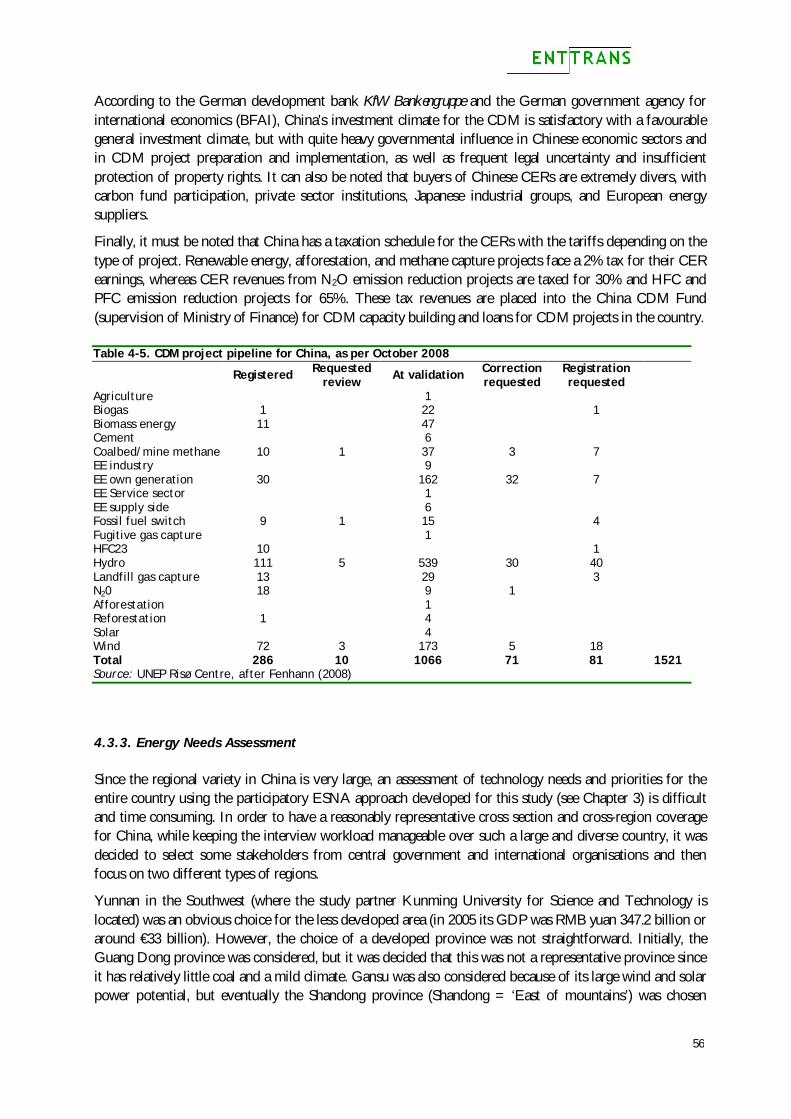
56
According to the German development bank KfW Bankengruppe and the German government agency for international economics (BFAI), China’s investment climate for the CDM is satisfactory with a favourable general investment climate, but with quite heavy governmental influence in Chinese economic sectors and in CDM project preparation and implementation, as well as frequent legal uncertainty and insufficient protection of property rights. It can also be noted that buyers of Chinese CERs are extremely divers, with carbon fund participation, private sector institutions, Japanese industrial groups, and European energy suppliers.
Finally, it must be noted that China has a taxation schedule for the CERs with the tariffs depending on the type of project. Renewable energy, afforestation, and methane capture projects face a 2% tax for their CER earnings, whereas CER revenues from N2O emission reduction projects are taxed for 30% and HFC and PFC emission reduction projects for 65%. These tax revenues are placed into the China CDM Fund (supervision of Ministry of Finance) for CDM capacity building and loans for CDM projects in the country. Table 4-5. CDM project pipeline for China, as per October 2008
Registered Requested review At validation Correction
requested Registration requested
Agriculture 1 Biogas 1 22 1 Biomass energy 11 47 Cement 6 Coalbed/mine methane 10 1 37 3 7 EE industry 9 EE own generation 30 162 32 7 EE Service sector 1 EE supply side 6 Fossil fuel switch 9 1 15 4 Fugitive gas capture 1 HFC23 10 1 Hydro 111 5 539 30 40 Landfill gas capture 13 29 3 N20 18 9 1 Afforestation 1 Reforestation 1 4 Solar 4 Wind 72 3 173 5 18 Total 286 10 1066 71 81 1521 Source: UNEP Risø Centre, after Fenhann (2008)
4.3.3. Energy Needs Assessment
Since the regional variety in China is very large, an assessment of technology needs and priorities for the entire country using the participatory ESNA approach developed for this study (see Chapter 3) is difficult and time consuming. In order to have a reasonably representative cross section and cross-region coverage for China, while keeping the interview workload manageable over such a large and diverse country, it was decided to select some stakeholders from central government and international organisations and then focus on two different types of regions.
Yunnan in the Southwest (where the study partner Kunming University for Science and Technology is located) was an obvious choice for the less developed area (in 2005 its GDP was RMB yuan 347.2 billion or around €33 billion). However, the choice of a developed province was not straightforward. Initially, the Guang Dong province was considered, but it was decided that this was not a representative province since it has relatively little coal and a mild climate. Gansu was also considered because of its large wind and solar power potential, but eventually the Shandong province (Shandong = ‘East of mountains’) was chosen
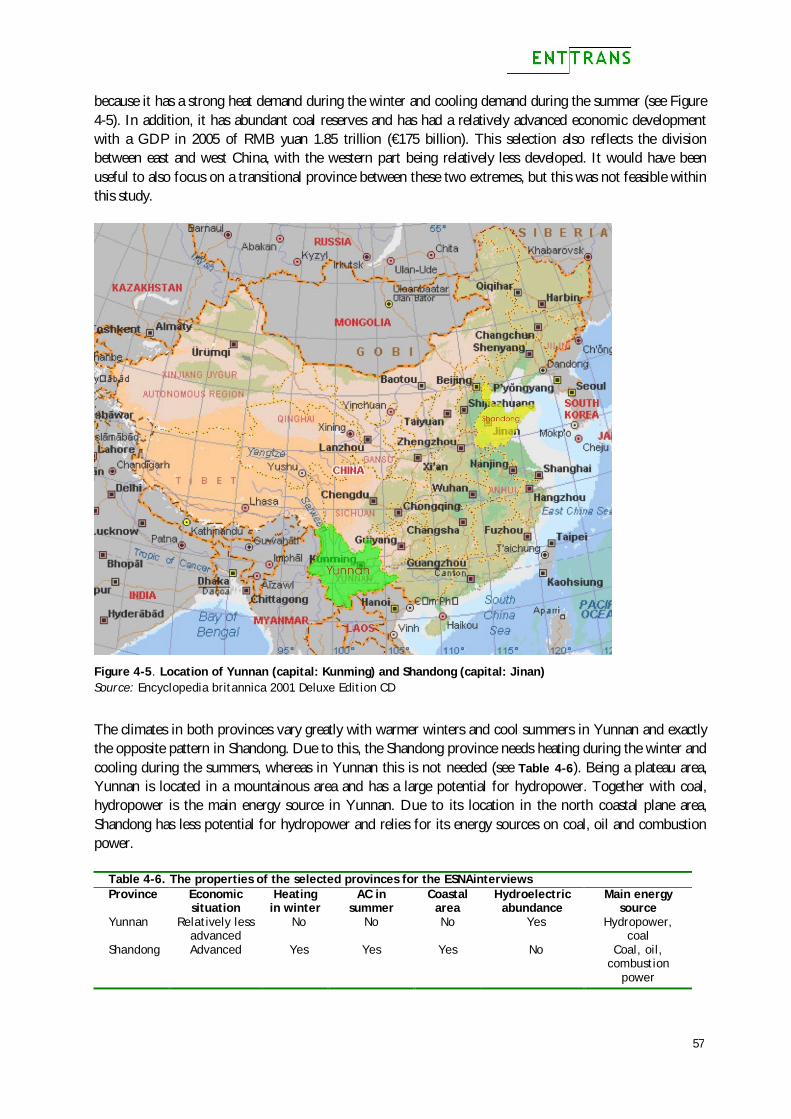
57
because it has a strong heat demand during the winter and cooling demand during the summer (see Figure 4-5). In addition, it has abundant coal reserves and has had a relatively advanced economic development with a GDP in 2005 of RMB yuan 1.85 trillion (€175 billion). This selection also reflects the division between east and west China, with the western part being relatively less developed. It would have been useful to also focus on a transitional province between these two extremes, but this was not feasible within this study.
Figure 4-5. Location of Yunnan (capital: Kunming) and Shandong (capital: Jinan) Source: Encyclopedia britannica 2001 Deluxe Edition CD
The climates in both provinces vary greatly with warmer winters and cool summers in Yunnan and exactly the opposite pattern in Shandong. Due to this, the Shandong province needs heating during the winter and cooling during the summers, whereas in Yunnan this is not needed (see Table 4-6). Being a plateau area, Yunnan is located in a mountainous area and has a large potential for hydropower. Together with coal, hydropower is the main energy source in Yunnan. Due to its location in the north coastal plane area, Shandong has less potential for hydropower and relies for its energy sources on coal, oil and combustion power.
Table 4-6. The properties of the selected provinces for the ESNAinterviews Province Economic
situation Heating
in winter AC in
summer Coastal
area Hydroelectric
abundance Main energy
source Yunnan Relatively less
advanced No No No Yes Hydropower,
coal Shandong Advanced Yes Yes Yes No Coal, oil,
combustion power
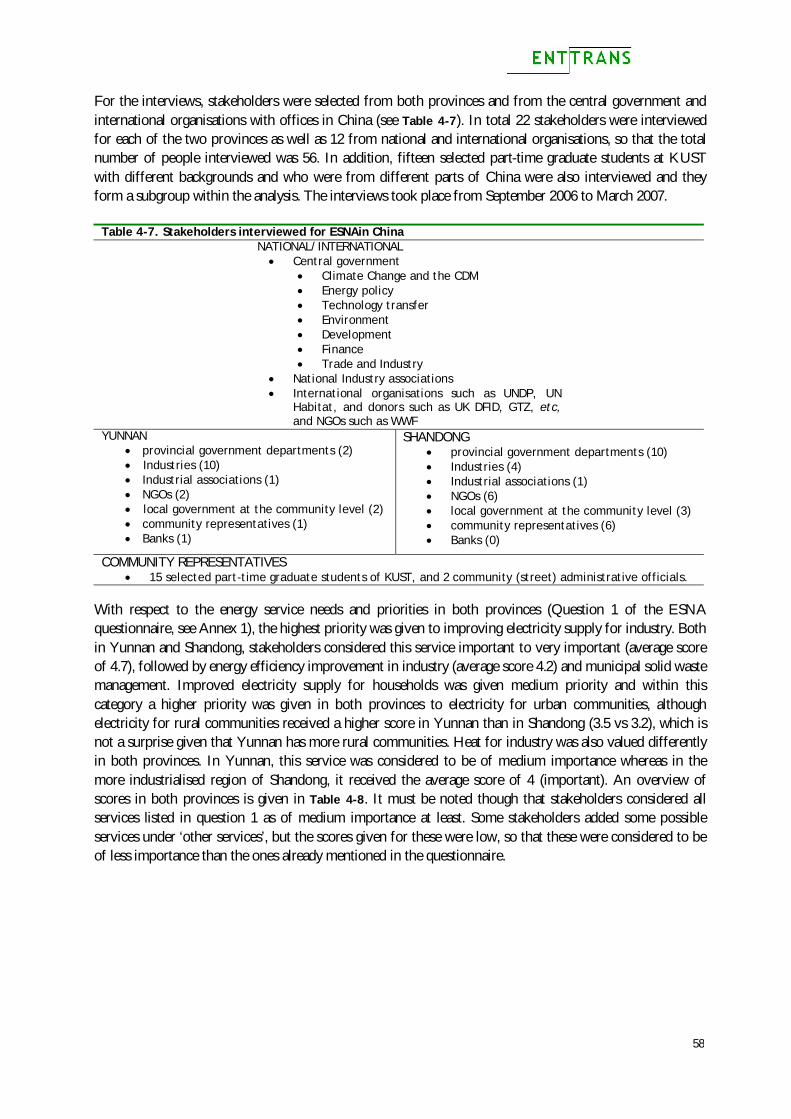
58
For the interviews, stakeholders were selected from both provinces and from the central government and international organisations with offices in China (see Table 4-7). In total 22 stakeholders were interviewed for each of the two provinces as well as 12 from national and international organisations, so that the total number of people interviewed was 56. In addition, fifteen selected part-time graduate students at KUST with different backgrounds and who were from different parts of China were also interviewed and they form a subgroup within the analysis. The interviews took place from September 2006 to March 2007.
Table 4-7. Stakeholders interviewed for ESNAin China NATIONAL/INTERNATIONAL Central government
Climate Change and the CDM Energy policy Technology transfer Environment Development Finance Trade and Industry
National Industry associations International organisations such as UNDP, UN
Habitat, and donors such as UK DFID, GTZ, etc, and NGOs such as WWF
YUNNAN provincial government departments (2) Industries (10) Industrial associations (1) NGOs (2) local government at the community level (2) community representatives (1) Banks (1)
SHANDONG provincial government departments (10) Industries (4) Industrial associations (1) NGOs (6) local government at the community level (3) community representatives (6) Banks (0)
COMMUNITY REPRESENTATIVES 15 selected part-time graduate students of KUST, and 2 community (street) administrative officials.
With respect to the energy service needs and priorities in both provinces (Question 1 of the ESNA questionnaire, see Annex 1), the highest priority was given to improving electricity supply for industry. Both in Yunnan and Shandong, stakeholders considered this service important to very important (average score of 4.7), followed by energy efficiency improvement in industry (average score 4.2) and municipal solid waste management. Improved electricity supply for households was given medium priority and within this category a higher priority was given in both provinces to electricity for urban communities, although electricity for rural communities received a higher score in Yunnan than in Shandong (3.5 vs 3.2), which is not a surprise given that Yunnan has more rural communities. Heat for industry was also valued differently in both provinces. In Yunnan, this service was considered to be of medium importance whereas in the more industrialised region of Shandong, it received the average score of 4 (important). An overview of scores in both provinces is given in Table 4-8. It must be noted though that stakeholders considered all services listed in question 1 as of medium importance at least. Some stakeholders added some possible services under ‘other services’, but the scores given for these were low, so that these were considered to be of less importance than the ones already mentioned in the questionnaire.
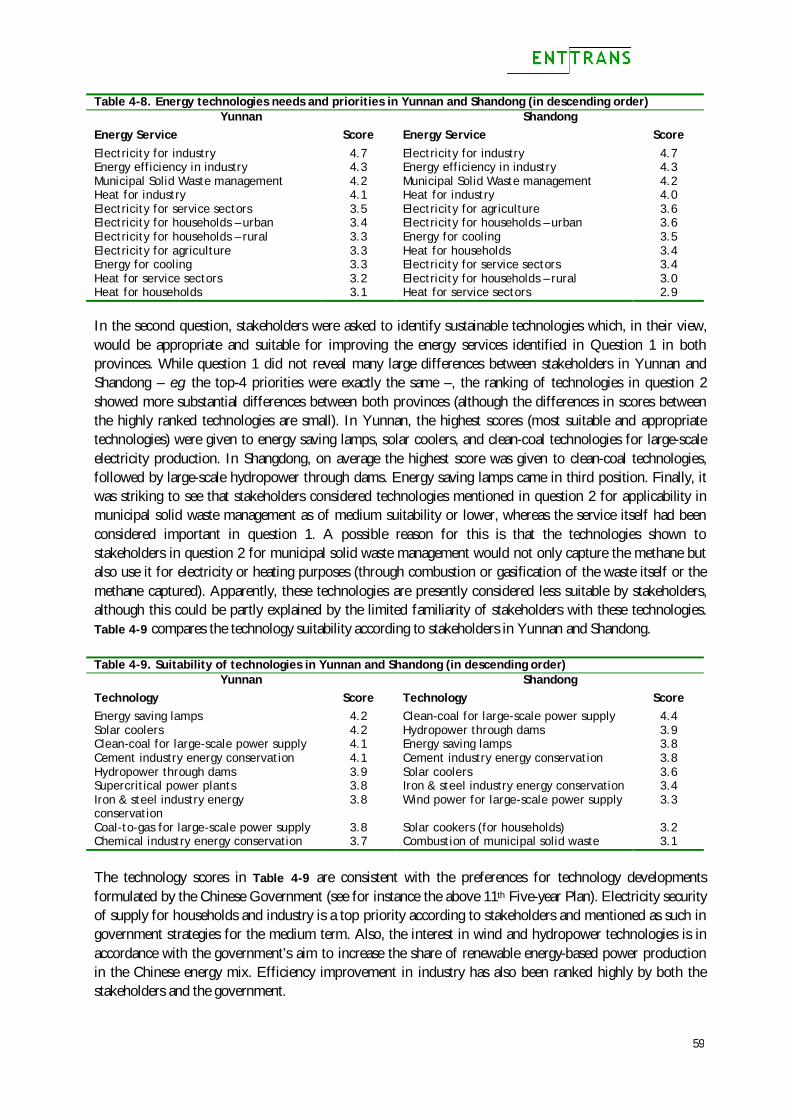
59
Table 4-8. Energy technologies needs and priorities in Yunnan and Shandong (in descending order) Yunnan Shandong
Energy Service Score Energy Service Score Electricity for industry 4.7 Electricity for industry 4.7 Energy efficiency in industry 4.3 Energy efficiency in industry 4.3 Municipal Solid Waste management 4.2 Municipal Solid Waste management 4.2 Heat for industry 4.1 Heat for industry 4.0 Electricity for service sectors 3.5 Electricity for agriculture 3.6 Electricity for households – urban 3.4 Electricity for households – urban 3.6 Electricity for households – rural 3.3 Energy for cooling 3.5 Electricity for agriculture 3.3 Heat for households 3.4 Energy for cooling 3.3 Electricity for service sectors 3.4 Heat for service sectors 3.2 Electricity for households – rural 3.0 Heat for households 3.1 Heat for service sectors 2.9 In the second question, stakeholders were asked to identify sustainable technologies which, in their view, would be appropriate and suitable for improving the energy services identified in Question 1 in both provinces. While question 1 did not reveal many large differences between stakeholders in Yunnan and Shandong – e.g. the top-4 priorities were exactly the same –, the ranking of technologies in question 2 showed more substantial differences between both provinces (although the differences in scores between the highly ranked technologies are small). In Yunnan, the highest scores (most suitable and appropriate technologies) were given to energy saving lamps, solar coolers, and clean-coal technologies for large-scale electricity production. In Shangdong, on average the highest score was given to clean-coal technologies, followed by large-scale hydropower through dams. Energy saving lamps came in third position. Finally, it was striking to see that stakeholders considered technologies mentioned in question 2 for applicability in municipal solid waste management as of medium suitability or lower, whereas the service itself had been considered important in question 1. A possible reason for this is that the technologies shown to stakeholders in question 2 for municipal solid waste management would not only capture the methane but also use it for electricity or heating purposes (through combustion or gasification of the waste itself or the methane captured). Apparently, these technologies are presently considered less suitable by stakeholders, although this could be partly explained by the limited familiarity of stakeholders with these technologies. Table 4-9 compares the technology suitability according to stakeholders in Yunnan and Shandong. Table 4-9. Suitability of technologies in Yunnan and Shandong (in descending order)
Yunnan Shandong Technology Score Technology Score Energy saving lamps 4.2 Clean-coal for large-scale power supply 4.4 Solar coolers 4.2 Hydropower through dams 3.9 Clean-coal for large-scale power supply 4.1 Energy saving lamps 3.8 Cement industry energy conservation 4.1 Cement industry energy conservation 3.8 Hydropower through dams 3.9 Solar coolers 3.6 Supercritical power plants 3.8 Iron & steel industry energy conservation 3.4 Iron & steel industry energy conservation
3.8 Wind power for large-scale power supply 3.3
Coal-to-gas for large-scale power supply 3.8 Solar cookers (for households) 3.2 Chemical industry energy conservation 3.7 Combustion of municipal solid waste 3.1 The technology scores in Table 4-9 are consistent with the preferences for technology developments formulated by the Chinese Government (see for instance the above 11th Five-year Plan). Electricity security of supply for households and industry is a top priority according to stakeholders and mentioned as such in government strategies for the medium term. Also, the interest in wind and hydropower technologies is in accordance with the government’s aim to increase the share of renewable energy-based power production in the Chinese energy mix. Efficiency improvement in industry has also been ranked highly by both the stakeholders and the government.
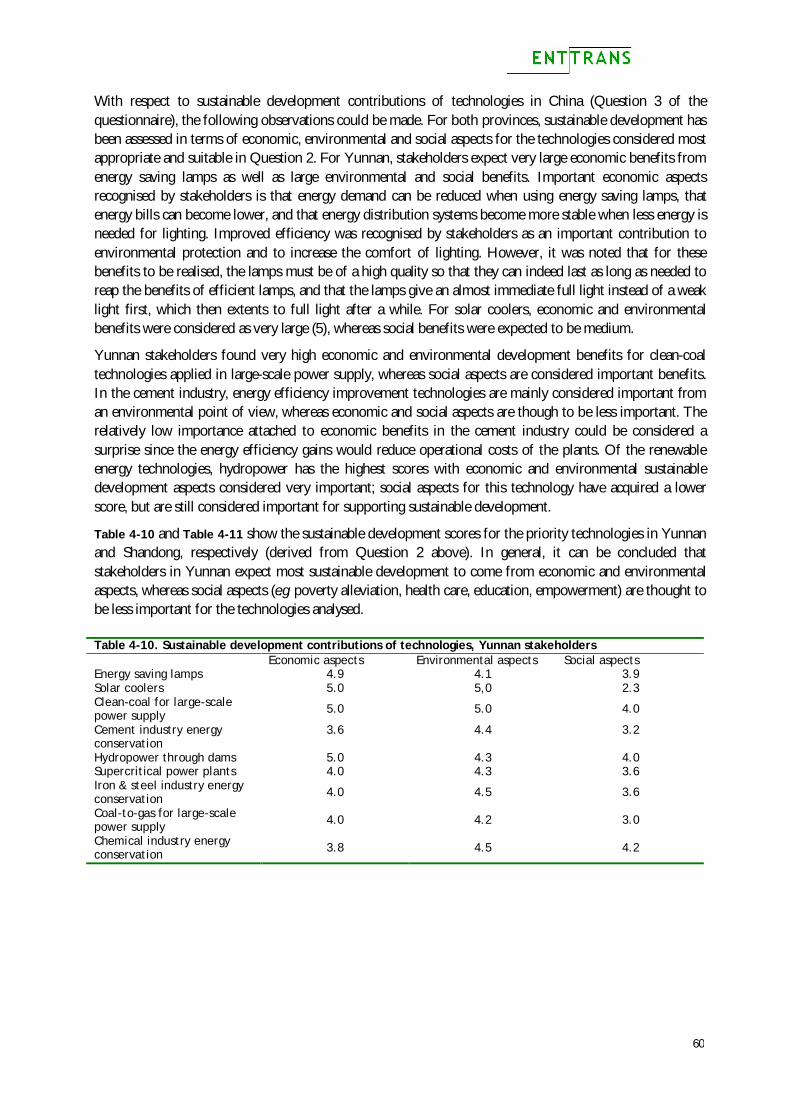
60
With respect to sustainable development contributions of technologies in China (Question 3 of the questionnaire), the following observations could be made. For both provinces, sustainable development has been assessed in terms of economic, environmental and social aspects for the technologies considered most appropriate and suitable in Question 2. For Yunnan, stakeholders expect very large economic benefits from energy saving lamps as well as large environmental and social benefits. Important economic aspects recognised by stakeholders is that energy demand can be reduced when using energy saving lamps, that energy bills can become lower, and that energy distribution systems become more stable when less energy is needed for lighting. Improved efficiency was recognised by stakeholders as an important contribution to environmental protection and to increase the comfort of lighting. However, it was noted that for these benefits to be realised, the lamps must be of a high quality so that they can indeed last as long as needed to reap the benefits of efficient lamps, and that the lamps give an almost immediate full light instead of a weak light first, which then extents to full light after a while. For solar coolers, economic and environmental benefits were considered as very large (5), whereas social benefits were expected to be medium.
Yunnan stakeholders found very high economic and environmental development benefits for clean-coal technologies applied in large-scale power supply, whereas social aspects are considered important benefits. In the cement industry, energy efficiency improvement technologies are mainly considered important from an environmental point of view, whereas economic and social aspects are though to be less important. The relatively low importance attached to economic benefits in the cement industry could be considered a surprise since the energy efficiency gains would reduce operational costs of the plants. Of the renewable energy technologies, hydropower has the highest scores with economic and environmental sustainable development aspects considered very important; social aspects for this technology have acquired a lower score, but are still considered important for supporting sustainable development.
Table 4-10 and Table 4-11 show the sustainable development scores for the priority technologies in Yunnan and Shandong, respectively (derived from Question 2 above). In general, it can be concluded that stakeholders in Yunnan expect most sustainable development to come from economic and environmental aspects, whereas social aspects (e.g. poverty alleviation, health care, education, empowerment) are thought to be less important for the technologies analysed. Table 4-10. Sustainable development contributions of technologies, Yunnan stakeholders Economic aspects Environmental aspects Social aspects Energy saving lamps 4.9 4.1 3.9 Solar coolers 5.0 5,0 2.3 Clean-coal for large-scale power supply 5.0 5.0 4.0
Cement industry energy conservation
3.6 4.4 3.2
Hydropower through dams 5.0 4.3 4.0 Supercritical power plants 4.0 4.3 3.6 Iron & steel industry energy conservation 4.0 4.5 3.6
Coal-to-gas for large-scale power supply 4.0 4.2 3.0
Chemical industry energy conservation 3.8 4.5 4.2
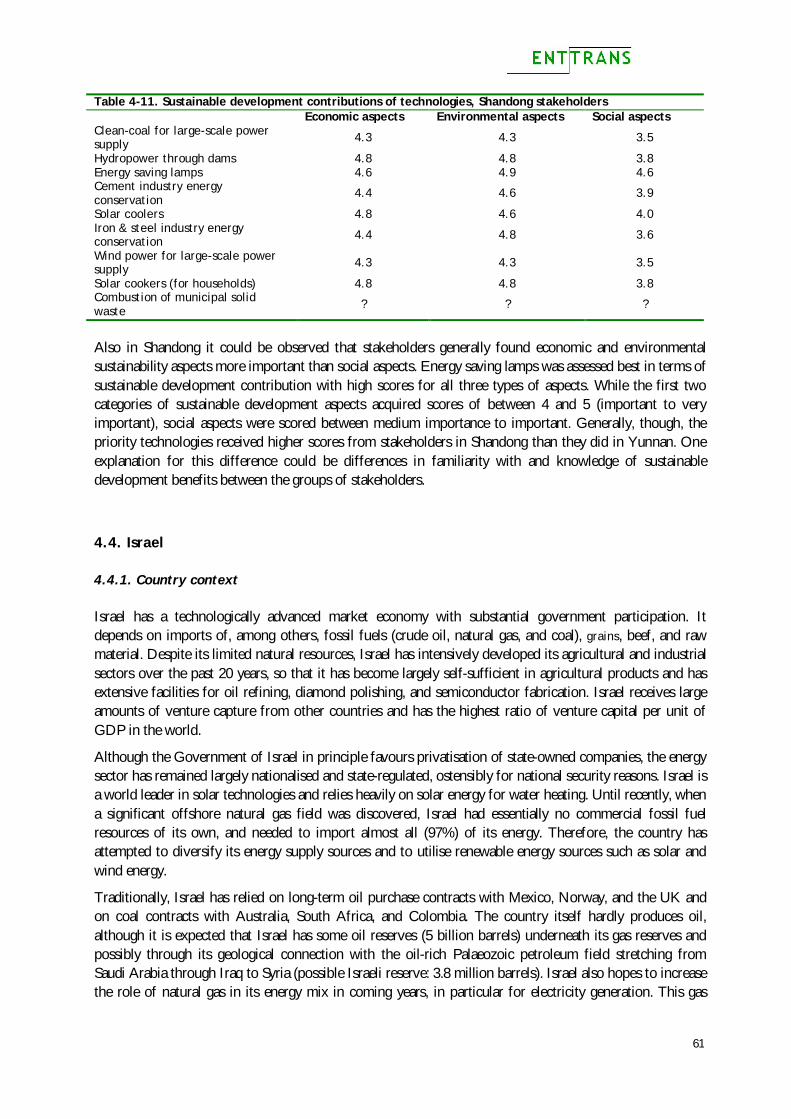
61
Table 4-11. Sustainable development contributions of technologies, Shandong stakeholders Economic aspects Environmental aspects Social aspects Clean-coal for large-scale power supply 4.3 4.3 3.5
Hydropower through dams 4.8 4.8 3.8 Energy saving lamps 4.6 4.9 4.6 Cement industry energy conservation
4.4 4.6 3.9
Solar coolers 4.8 4.6 4.0 Iron & steel industry energy conservation 4.4 4.8 3.6
Wind power for large-scale power supply 4.3 4.3 3.5
Solar cookers (for households) 4.8 4.8 3.8 Combustion of municipal solid waste
? ? ?
Also in Shandong it could be observed that stakeholders generally found economic and environmental sustainability aspects more important than social aspects. Energy saving lamps was assessed best in terms of sustainable development contribution with high scores for all three types of aspects. While the first two categories of sustainable development aspects acquired scores of between 4 and 5 (important to very important), social aspects were scored between medium importance to important. Generally, though, the priority technologies received higher scores from stakeholders in Shandong than they did in Yunnan. One explanation for this difference could be differences in familiarity with and knowledge of sustainable development benefits between the groups of stakeholders.
4.4. Israel
4.4.1. Country context
Israel has a technologically advanced market economy with substantial government participation. It depends on imports of, among others, fossil fuels (crude oil, natural gas, and coal), grains, beef, and raw material. Despite its limited natural resources, Israel has intensively developed its agricultural and industrial sectors over the past 20 years, so that it has become largely self-sufficient in agricultural products and has extensive facilities for oil refining, diamond polishing, and semiconductor fabrication. Israel receives large amounts of venture capture from other countries and has the highest ratio of venture capital per unit of GDP in the world.
Although the Government of Israel in principle favours privatisation of state-owned companies, the energy sector has remained largely nationalised and state-regulated, ostensibly for national security reasons. Israel is a world leader in solar technologies and relies heavily on solar energy for water heating. Until recently, when a significant offshore natural gas field was discovered, Israel had essentially no commercial fossil fuel resources of its own, and needed to import almost all (97%) of its energy. Therefore, the country has attempted to diversify its energy supply sources and to utilise renewable energy sources such as solar and wind energy.
Traditionally, Israel has relied on long-term oil purchase contracts with Mexico, Norway, and the UK and on coal contracts with Australia, South Africa, and Colombia. The country itself hardly produces oil, although it is expected that Israel has some oil reserves (5 billion barrels) underneath its gas reserves and possibly through its geological connection with the oil-rich Palaeozoic petroleum field stretching from Saudi Arabia through Iraq to Syria (possible Israeli reserve: 3.8 million barrels). Israel also hopes to increase the role of natural gas in its energy mix in coming years, in particular for electricity generation. This gas
62
could be imported from Egypt’s Nile Delta and offshore regions, but recently an offshore gas field on Israel’s own territory has been discovered with a proven reserve of almost 42 billion m3.
Israel meets approximately 30% of its energy demand requirements by burning coal (primarily for electric power generation), of which it imports 93%: in 2001, about 47% of these imports came from South Africa, with the rest coming from Colombia (21%), Australia (16%), and Indonesia (16%). In order to further diversify the import portfolio, Israel has also begun importing coal, or is planning to do so, from the USA, China, and Poland.
In 2001, the total energy requirement was 19.435 million tonnes of oil equivalent (MToe), of which 60.9% was supplied by oil, 36.2% by coal and the remaining part by renewables (mainly solar water heating). In 2004, 67.1% of the electricity produced by the IEC (Israel’s Electricity Corporation) was generated by coal and fuel oil, 18.4% by natural gas turbines, and 14.5% by combined cycle plants. However, these percentages are changing in the direction of a larger share for natural gas and a smaller share for oil and diesel-fired generators. IEC plans to spend about € 1 billion over the next ten years to help reduce emissions from its power plants. New coal plants are to be equipped with flue gas desulphurisation and combustion systems, and most of IEC’s existing gas turbines have been retrofitted with low nitrogen combustion systems. Most of the coal ash waste produced by IEC’s three coal-fired power plants is sold to the cement industry.
Israel is a world leader in solar technology development and relies heavily on solar energy for water heating, which is required for most domestic users in the building standards. The present share of renewable energy in primary energy is approximately 3.1%.
As part of an effort to increase privatisation of the country’s power sector, Israel’s Ministry of Energy has directed IEC to purchase at least 900 MW of power from independent power producers by the year 2005 (of which possibly 150 MW are expected to come from solar and wind facilities, with the rest mainly natural gas-fuelled).
Israel is a non-Annex I country under the UNFCCC, which it ratified on 4 June 1996, and a Party to the Kyoto Protocol, which it ratified on 15 March 2004. The Ministry of the Environment was established by government decision on 25 December 1988 and is responsible for the national co-ordination of all environmental issues, including Climate Change. The Ministry of National Infrastructures supervises the energy sector, by the means of the ‘Fuel Authority’ for the oil sector and the ‘Electricity Authority’ for the electricity sector; the development of gas projects depends on the ‘Natural Gas Projects Management’.
4.4.2. CDM profile
Israel's Designated National Authority for the CDM (DNA) was established in 2004 within the Ministry of Environment, with representatives of several governmental and public bodies: the Ministry of the Environment, Ministry of Transportation, Ministry of Industry and Trade, Ministry of National Infrastructures, Ministry of Finance, Ministry of Agriculture, the Manufacturers Association of Israel, IEC, and the environmental NGO Zalul. The DNA has established procedures for the assessment of CDM project proposals and their alignment with national sustainable development criteria. It also serves as ‘service platform’ to assist project developers during the CDM project cycle.
The main function of the DNA is to determine whether a proposed CDM project complies with sustainable development criteria. For this purpose, the Israeli DNA has formulated sustainable development indicators, which will be used in the assessment process of the Project Design Document: Economic and technological impacts: development and transfer of technology, infrastructure, utilisation of
resources,
63
Social sustainability impacts: improvement of employment, living standards, human and institutional capacity such as education and welfare services, and
Local, regional and global environmental impacts: improvement of air quality by reduction of emissions of pollutants (such as radiation), and biodiversity increase.
Possible CDM project opportunities in Israel can be found in a wide array of categories: Energy: Use of renewable energy sources such as solar energy, geothermal energy, wind turbines,
hydroelectric stations, utilisation of waste heat, biomass, etc. Transportation: Establishment of a mass transit system, switch to clean vehicles fuelled by cleaner fuels. Waste: Collection of methane gas from landfills and wastewater treatment plants, generation of energy
from waste, treatment of livestock waste, etc. Industrial and public buildings: Installation of energy saving lighting, installation of solar collectors, etc. Industry: Increasing production efficiency and saving on fossil fuel combustion, transfer to dry
production processes in the cement industry, etc. Land-use changes: primarily reforestation and afforestation projects.
Although these project categories offer a considerable CDM potential, two areas with a particularly large potential are highlighted below (information provided by ENTTRANS partner ICTAF): Waste management: Israel has made major strides in its waste management over the past decade by closing
77 large waste dumps and replacing them with state-of-the-art central landfills with systems for leachate collection and treatment, leakage prevention and collection of gas emissions. However, the methane captured from the waste decomposition is hardly used anywhere in Israel for heat and electricity generation. However, some 90% of the country’s waste is still landfilled in a less controlled way; only a few of the sites extract and utilise methane. Consequently, this sector is a strong contributor to Israel’s GHG emissions, also due to the high global warming potential of methane (21 times that of CO2).
Energy: The rate of growth of electricity consumption in Israel has been among some 6% per annum during the last decade. Emissions from this sector may be reduced by two means: changes and improvements in the electricity production system and use of renewable energy.
Within the above overview of possible CDM categories, the following areas/market niches where renewable and new energy efficient services could be successfully launched, possibly through the CDM, can be identified: Large public buildings (such as universities), Isolated areas such as unrecognised Bedouin villages, Energy conservation in arid areas, Solar collectors for water heating for residences, hotels, and medical centres, and Solar collectors for water heating at high temperature for industrial use.
Up to November 2008, 32 CDM projects in Israel have entered the pipeline of projects that are either under validation, or have been registered, or are in a process of registration (see Table 4-12). All these projects have in the meantime been approval as eligible CDM projects by the Israeli DNA. Fourteen of these projects are at the stage of validating the project design document including the calculations of the expected GHG emission reductions. The other seven projects have been registered by the CDM EB as official CDM projects. In total, should these projects perform as planned in their design documents, it is expected that they will generate 10.6 million CERs by the year 2012, which can then be transferred to industrialised countries with quantified commitments. Moreover, most of the projects have a lifetime that goes beyond the year 2012 (the end of the Kyoto Protocol commitment period) and will continue generating emission reductions and thus CERs. Again assuming full performance, the projects will deliver 31.7 million CERs by 2030. However, as noted in Chapter 3, in actual practice CDM projects hardly perform according to plan with some project performing below and others even above expectations. In
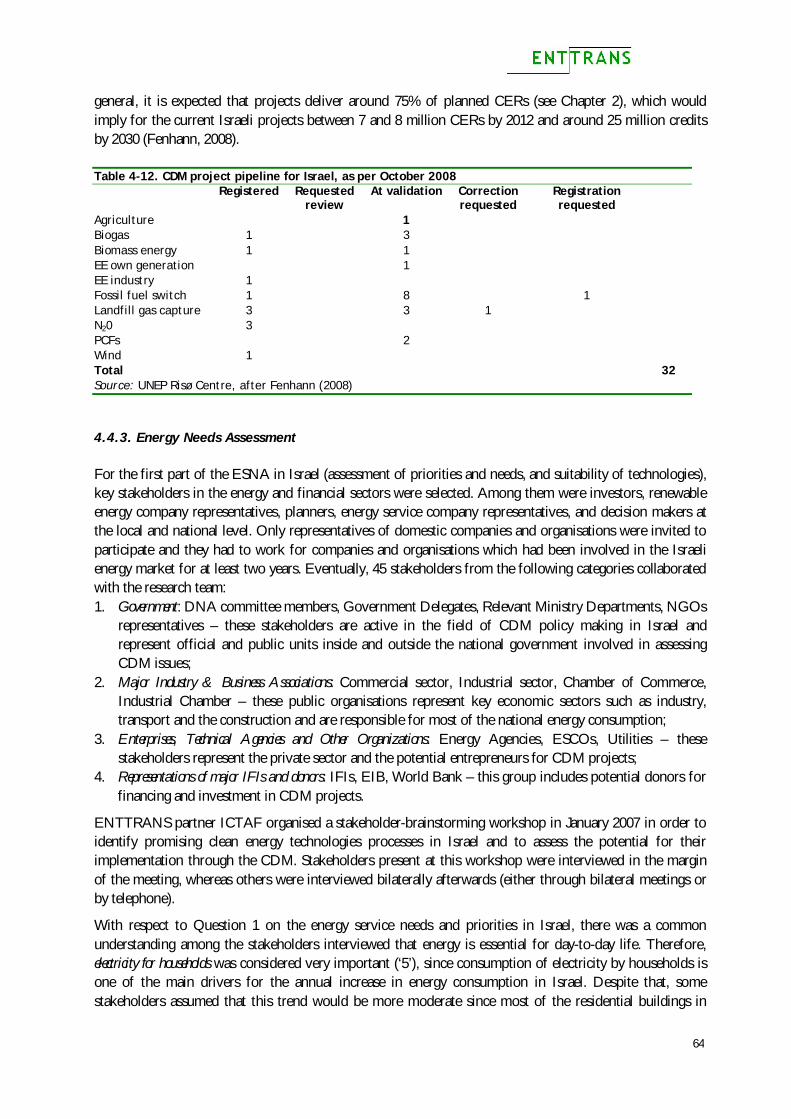
64
general, it is expected that projects deliver around 75% of planned CERs (see Chapter 2), which would imply for the current Israeli projects between 7 and 8 million CERs by 2012 and around 25 million credits by 2030 (Fenhann, 2008). Table 4-12. CDM project pipeline for Israel, as per October 2008
Registered Requested
review At validation Correction
requested Registration requested
Agriculture 1 Biogas 1 3 Biomass energy 1 1 EE own generation 1 EE industry 1 Fossil fuel switch 1 8 1 Landfill gas capture 3 3 1 N20 3 PCFs 2 Wind 1 Total 32 Source: UNEP Risø Centre, after Fenhann (2008)
4.4.3. Energy Needs Assessment
For the first part of the ESNA in Israel (assessment of priorities and needs, and suitability of technologies), key stakeholders in the energy and financial sectors were selected. Among them were investors, renewable energy company representatives, planners, energy service company representatives, and decision makers at the local and national level. Only representatives of domestic companies and organisations were invited to participate and they had to work for companies and organisations which had been involved in the Israeli energy market for at least two years. Eventually, 45 stakeholders from the following categories collaborated with the research team: 1. Government: DNA committee members, Government Delegates, Relevant Ministry Departments, NGOs
representatives – these stakeholders are active in the field of CDM policy making in Israel and represent official and public units inside and outside the national government involved in assessing CDM issues;
2. Major Industry & Business Associations: Commercial sector, Industrial sector, Chamber of Commerce, Industrial Chamber – these public organisations represent key economic sectors such as industry, transport and the construction and are responsible for most of the national energy consumption;
3. Enterprises, Technical Agencies and Other Organizations: Energy Agencies, ESCOs, Utilities – these stakeholders represent the private sector and the potential entrepreneurs for CDM projects;
4. Representations of major IFIs and donors: IFIs, EIB, World Bank – this group includes potential donors for financing and investment in CDM projects.
ENTTRANS partner ICTAF organised a stakeholder-brainstorming workshop in January 2007 in order to identify promising clean energy technologies processes in Israel and to assess the potential for their implementation through the CDM. Stakeholders present at this workshop were interviewed in the margin of the meeting, whereas others were interviewed bilaterally afterwards (either through bilateral meetings or by telephone).
With respect to Question 1 on the energy service needs and priorities in Israel, there was a common understanding among the stakeholders interviewed that energy is essential for day-to-day life. Therefore, electricity for households was considered very important (‘5’), since consumption of electricity by households is one of the main drivers for the annual increase in energy consumption in Israel. Despite that, some stakeholders assumed that this trend would be more moderate since most of the residential buildings in
65
Israel already use air conditioning systems, so that the electricity demand will become more stable. In general, the interviews did not show a clear distinction between rural and urban communities.
The interviewees also gave a very high importance to the service of electricity for service sectors (‘5’), which was mainly based on the argument that recent national economic developments have shown a shift from agriculture and industry towards commercial and health service activities. There was a consensus among stakeholders interviewed that the need for electricity in this sector is high and will remain high in the short to medium term, while there have been no incentives to cut electricity usage in these sectors.
Energy efficiency in industry was also given a score of ‘5’ (very important energy service for Israel) as improvement of energy consumption systems for more efficient energy use was considered critical for the industrial sector, both from an economic and environmental point of view. Most of the interviewees emphasised the importance of investing in provision of efficient energy technologies as the preferred solution to reduce energy costs and CO2 emissions. Since the steps taken by the government and the private sector have thus far not been sufficient, additional measures in this direction are needed.
Electricity for industry received a score of 4.5, which was explained by stakeholders because of the high annual rate of industrial growth and consequently the growing need for electricity. This growth is largely accompanied by an increased use of automatic machines such as robots, in particular in high-tech industries. Many of the high-tech industries consume mainly electricity for air conditioning and heating so that their energy needs profile is comparable to that of service sectors. According to some stakeholders, co-generation systems in industry would have good potential in Israeli industrial sectors.
The opinions on heat for industry differed in the sense that in some industries heat is much needed, whereas in other industries the need for heat is very low. Despite the trend of moving from traditional industries to high-tech and services, there is an essential need for efficient heat technologies in the heavy industries. Some stakeholder mentioned the potential for co-generation systems in industrial sectors, which would combine the need for heat with the need for electricity in industrial sectors. Nonetheless, this service was considered important by Israeli stakeholders (‘4’).
Energy service needs that were considered by stakeholder as either of medium importance, or important (‘3.5’ on average) were: Electricity for agriculture: On the one hand, the agriculture sector in Israel has become smaller annually,
and plays a minor role today in the Israeli economy. On the other hand, the remaining agricultural branches use more electronic and other sophisticated equipment than before (for example, use of lightning and temperature control systems), so the consumption of electricity per capita is higher. Therefore, the interviewed stakeholders tended to give this energy technology need a medium ranking.
Energy for cooling purposes (e.g. medicines): Energy for cooling is needed mainly for space acclimatisation. Energy for other cooling purposes such as storage of food or medicines is also essential, but its overall impact on the use of energy technologies is minor.
Municipal solid waste management: There was disagreement among the interviewees regarding the need for energy technologies for solid waste management. While some interviewees emphasised that Israel has developed advanced relevant technologies for this service, and that the country could largely improve waste management, others were more sceptical because of the limited sources of waste in a small country like Israel.
Finally, heat for households and for the service sectors was considered unimportant (‘2’) by stakeholder as these services are generally well covered in Israel through application of air-conditioning systems and radiators.
In Question 2, stakeholders assessed the suitability of clean energy technologies for fulfilling the services addressed in Question 1. Three categories of technologies were found very suitable with a score of ‘5’: solar
66
based technologies, energy efficiency improvement in residential dwellings, and coal-to-gas fuel switch technologies: Solar: solar photovoltaic (PV) and solar thermal for water heating were particularly mentioned, in
particular due to the high potential for solar-based technologies in Israel. It was nonetheless mentioned that suitability of PV technologies might be somewhat threatened by the rather high costs associated with this technology. Solar thermal for water heating is already applied in Israel (see Section 5.4.1) and has thus been relatively well proven.
Efficiency improvement in buildings: sustainable building design, improved air conditioning and energy-saving lamps were considered very suitable technologies for Israel (‘5’), in particular with the objective to reduce energy demand in households, which was considered a very import priority in Question 1 (not the improvement of electricity delivery, but the reduction of electricity demand for the same services was meant in Question 1). Some stakeholders explained that sustainable building design would fit well in the new Israeli building standards which encourage energy use reduction in buildings. A similar reasoning was given by stakeholders for passive cooling technologies and solar cooling technologies (rated around ‘4.5’ in terms of suitability within the Israeli context). Both technologies contribute to energy efficiency and have already been applied in construction of buildings in Israel. Although climate control in buildings (e.g. through cooling or air-conditioning) was not considered a energy service for which measures were recommended in Question 1, air-conditioning is one of the main sources of energy use and stakeholders recommend that more efficient systems would increase energy efficiency in households and thus reduce the pressure on electricity demand by households and institutions. The main support of air-conditioning improvement came from interviewees of ESCO companies. Finally, while lightning is regarded as one of the main energy areas that needs to be more efficient, there was a consensus about the potential of energy-saving lamps in Israel. Some of the interviewees remarked that the main obstacle for implementation of this technology is the high price of the lamps.
Coal to gas: There was a consensus among the interviewees that the current process of switching from coal to gas in energy production in Israel will continue according to the energy plan of the government and IEC (see Section 5.4.1). Coal to gas technologies therefore suit well in this strategy.
Wind energy was ranked ‘4.6’ in terms of suitability, although thus far only a small amount of wind energy capacity has been installed in Israel in specific high areas. Most of the interviewees were convinced that if Israel were able to overcome some technological and political obstacles (see Chapter 6), wind power could be a more important source of clean energy in Israel.
A similar suitability rank was given to methane combustion technologies (‘4.5’), although municipal solid waste management as a service was ranked relatively low (‘3.5’). Stakeholders acknowledged the high potential of this technology in terms of ecological and economic gains, in particular under the CDM, as it would also contribute to additional low-carbon energy production.
Solar lanterns were considered a suitable (‘4’) technology particularly for remote areas in the country that are not connected to the grid, but also for remote bus stations, agricultural infrastructures and selected motorways. Most of the survey interviewees were aware that the use of solar lanterns increases every year in Israel, mainly in arid areas in the south of the country, but they also mentioned that the impact of the technology is very much limited to specific areas and applications and that the impact on overall energy saving in Israel is modest.
Medium suitability (‘3’) was considered for clean coal technologies, coal steam improvement, hydropower through dams, solar towers, and biogas for electricity generation. Regarding clean coal technologies, the most significant characteristic of the answers was the lack of knowledge of the technologies and their potential implementation in Israel. In fact, even those experts who were familiar with clean-coal technologies agreed
67
that the implementation potential is not high. The main use of these technologies is by the national electricity company IEC in support of its aim to reduce emissions of pollutants from its coal power plants. Although IEC considers clean coal technologies as one of the most promising energy technology types, the overall potential has thus far been expected as rather small. Regarding coal steam improvement most of the interviewees agreed that this technology fulfils mainly the needs of countries in which electricity generation is based on coal. In Israel, the technology could be applied in some of the coal-fired plants, as well as in some textile industries.
Since there are almost no rivers with a topographic potential for production of hydro energy except for the north part of the Jordan River, the suitability of hydropower technologies is not high in Israel. However, this situation might change if a World Bank programme to explore construction of a canal between the Red Sea and the Dead Sea along the border between Israel and Jordan, will deliver favourable results. Implementation of that project would include the building of some hydropower installations.
The solar tower technology has been developed in Israel and theoretically has a large potential in the country. However, the technology has not yet been implemented in the country, except for a model at the Weizmann Institute for Science (information provided by ENTTRANS partner ICTAF). Recently, there has been an initiative for implementing the technology in Spain. Against this backdrop, stakeholders had a mixed attitude towards this technology: possibly a large potential, but there were doubts about its practical applicability.
On biogas for electricity generation technology, stakeholders mentioned a very high potential for this technology in solid waste and sewage systems, with the advantage mainly in environmental, rather than economic terms. This technology is considered more appropriate for the rural rather than the urban society of Israel.
Low suitability scores were given to geothermal energy (2.5), combined heat and power production (1.5), and geothermal heat pumps (1). The potential of geothermal energy production is a bit ambiguous. While the Israeli company Ormat is one of the world leaders in geothermal technology production, geothermal energy production in Israel is very limited. Some of the interviewees clearly expressed that this technology is not at all relevant for Israel; others were convinced that geothermal energy application could be possible if local physical conditions could be better dealt with. Regarding geothermal heat pumps, there was no significant belief in its applicability in Israel. Combined heat and power production or co-generation has been supported by the Government of Israel with two resolutions, which aimed at stimulating electricity production by private producers in general (in 1999), and through co-generation in particular (in 2002). However, the familiarity with the technologies among most interviewees was low and therefore the average suitability was ranked relatively low.
Above, in Section 4.4.1, it was explained that Israel has a rapidly growing energy need, mainly in the field of electricity security of supply for industrial and household sectors, including for heating and cooling purposes. Solar thermal systems are needed for water heating, LPG is needed for cooking needs and finally coal and natural gas are needed for electricity generation. In addition, there is a need for petrol for transportation. All other energy needs detailed in the stakeholder questionnaire are related to needs in rural (agricultural) communities.
The suitability and appropriateness of sustainable energy technologies in Israel is generally not limited by the level of knowledge and R&D activities in the areas of clean energy technologies in the country. Instead, the opportunities for implementation of most technologies are limited since they are not always suitable for the local geographic, climate, and socio-economic circumstances in Israel.
One interesting outcome of the survey is the lack of knowledge and familiarity among most of the interviewees (60%) regarding the less well-known energy technologies. In general, the representatives of R&D organisations and the government experts were familiar with almost all technologies while NGOs and commercial organisation/consultancy representatives were not and mainly focused on their ‘own’ specific
68
technology, e.g., solar PV, bio-diesel or fuel cells. This aspect will be paid attention to in the market mapping exercise for Israel in Chapter 5, where improvement could be found by arranging awareness raising activities.
4.5. Kenya
4.5.1. Country context
Kenya lies in Eastern Africa bordering the Indian Ocean (see Figure 4-6). It became independent from the UK on 12 December 1963. Kenya’s landscape varies from a low coastal plain to plateaus with altitudes of over 3 km in inland regions. The country has a region of fertile grasslands in the southwest region, and several forest areas (3% of the country is covered by forest) and mountains in the other regions. The southwest of Kenya is considered one of the most successful agricultural production regions in Africa (Library of Congress, 2007). Kenya’s climate varies from tropical along the coast to arid in the interior, especially in the north and northeast. A main problem with the climate is that rainfall patterns cause some parts of the country to become very dry during dry seasons. Only the southwest region and the coastal area receive more or less reliable rainfall. Kenya has a rich agricultural land and a unique physiography and wildlife, which is attractive for tourists (Library of Congress, 2007). However, Kenya has not many mineral resources.
The environment in Kenya is generally threatened by problems such as deforestation (the country’s forest coverage was reduced by half during the last three decades), soil erosion, desertification, water shortage and degraded water quality, poaching, and domestic and industrial pollution (Library of Congress, 2007). In particular, the availability of water is expected to become a problem in the future since water resources have been polluted by agricultural chemicals and urban and industrial wastes. Because of deforestation, erosion of land takes place, as well as silting of dams and flooding.
Despite its economic growth during 2004-2006 (between 2.3 and 6%), Kenya’s economies is among the worst performing economies in Africa and particularly dependent on the production of the agricultural sector and performance of the tourist sector. It is therefore dependent on such factors as the weather and fluctuations in world prices for agricultural products. Agriculture is an important economic sector in Kenya, which employs 75% of the country’s population. However, the service sector (largely built around tourism) produces 63% of Kenya’s GDP. Due to rapid population growth, unemployment and poverty have increased. By 2000 57% of the people lived below poverty lines, with 23% living on less than USD 1 per day (Library of Congress, 2007). Another problem for the functioning of Kenya’s economy is corruption. According to Transparency International, Kenya ranks among the six most corrupt countries in the world.20 Recent economic performance improvement has been supported by a strong performance in tourism, an increase in telecommunication and good results in, among others, the tea sector.
Kenya has a modest industrial sector (responsible for 14% of gross domestic product), which is still larger than in the neighbouring countries in East Africa. Important blockages for industrial sector growth are the limited supply of hydroelectric power, high energy costs, insufficient transport structure, corruption and the relatively low prices of imported products which put pressure on the prices of domestically produced commodities. Nairobi, Mombasa and Kisumu are large urban centres where most of the industrial activities take place. The main activities within the industrial sectors are grain milling, beer production, sugarcane crushing, and the fabrication of consumer goods (Library of Congress, 2007).
20 http://www.transparency.org/.
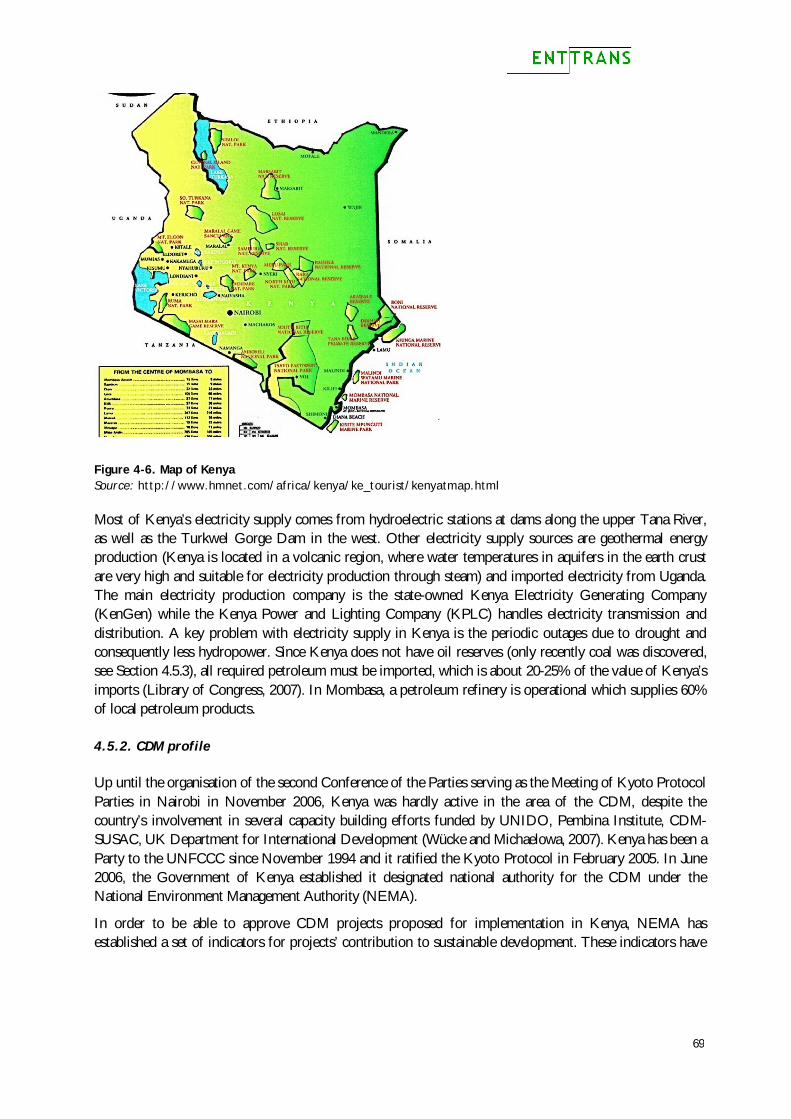
69
Figure 4-6. Map of Kenya Source: http://www.hmnet.com/africa/kenya/ke_tourist/kenyatmap.html Most of Kenya’s electricity supply comes from hydroelectric stations at dams along the upper Tana River, as well as the Turkwel Gorge Dam in the west. Other electricity supply sources are geothermal energy production (Kenya is located in a volcanic region, where water temperatures in aquifers in the earth crust are very high and suitable for electricity production through steam) and imported electricity from Uganda. The main electricity production company is the state-owned Kenya Electricity Generating Company (KenGen) while the Kenya Power and Lighting Company (KPLC) handles electricity transmission and distribution. A key problem with electricity supply in Kenya is the periodic outages due to drought and consequently less hydropower. Since Kenya does not have oil reserves (only recently coal was discovered, see Section 4.5.3), all required petroleum must be imported, which is about 20-25% of the value of Kenya’s imports (Library of Congress, 2007). In Mombasa, a petroleum refinery is operational which supplies 60% of local petroleum products.
4.5.2. CDM profile
Up until the organisation of the second Conference of the Parties serving as the Meeting of Kyoto Protocol Parties in Nairobi in November 2006, Kenya was hardly active in the area of the CDM, despite the country’s involvement in several capacity building efforts funded by UNIDO, Pembina Institute, CDM-SUSAC, UK Department for International Development (Wücke and Michaelowa, 2007). Kenya has been a Party to the UNFCCC since November 1994 and it ratified the Kyoto Protocol in February 2005. In June 2006, the Government of Kenya established it designated national authority for the CDM under the National Environment Management Authority (NEMA).
In order to be able to approve CDM projects proposed for implementation in Kenya, NEMA has established a set of indicators for projects’ contribution to sustainable development. These indicators have
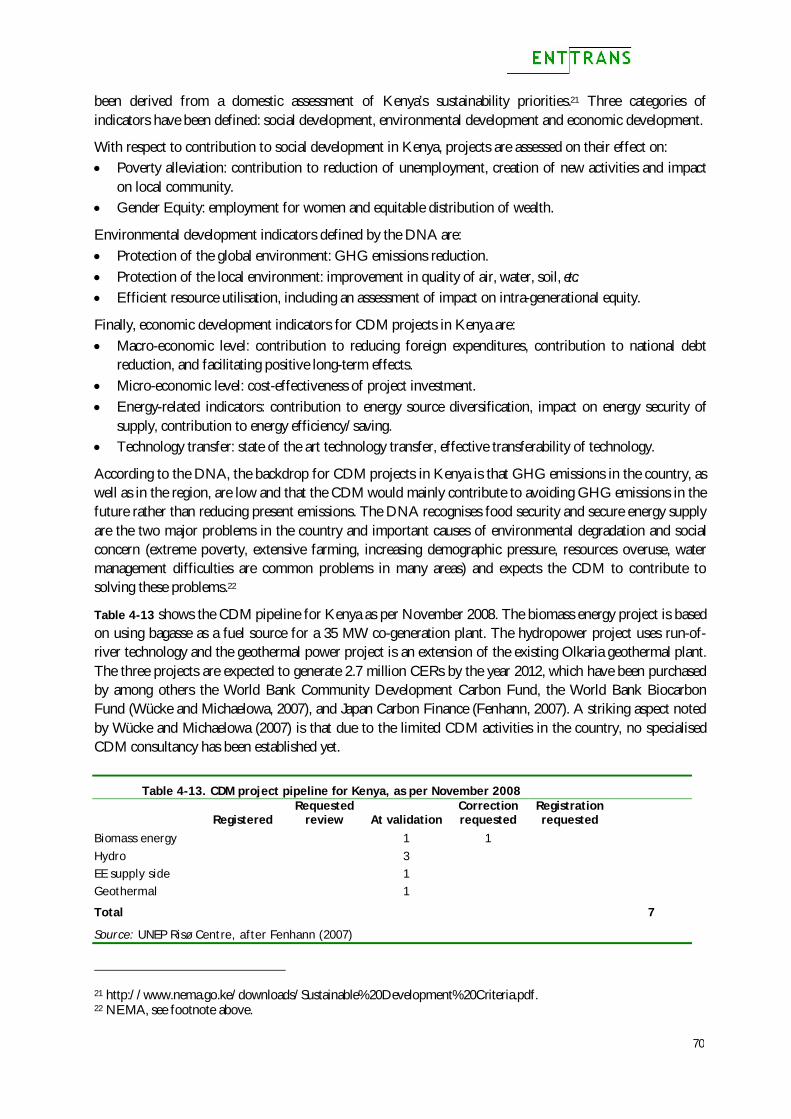
70
been derived from a domestic assessment of Kenya’s sustainability priorities.21 Three categories of indicators have been defined: social development, environmental development and economic development.
With respect to contribution to social development in Kenya, projects are assessed on their effect on: Poverty alleviation: contribution to reduction of unemployment, creation of new activities and impact
on local community. Gender Equity: employment for women and equitable distribution of wealth.
Environmental development indicators defined by the DNA are: Protection of the global environment: GHG emissions reduction. Protection of the local environment: improvement in quality of air, water, soil, etc. Efficient resource utilisation, including an assessment of impact on intra-generational equity.
Finally, economic development indicators for CDM projects in Kenya are: Macro-economic level: contribution to reducing foreign expenditures, contribution to national debt
reduction, and facilitating positive long-term effects. Micro-economic level: cost-effectiveness of project investment. Energy-related indicators: contribution to energy source diversification, impact on energy security of
supply, contribution to energy efficiency/saving. Technology transfer: state of the art technology transfer, effective transferability of technology.
According to the DNA, the backdrop for CDM projects in Kenya is that GHG emissions in the country, as well as in the region, are low and that the CDM would mainly contribute to avoiding GHG emissions in the future rather than reducing present emissions. The DNA recognises food security and secure energy supply are the two major problems in the country and important causes of environmental degradation and social concern (extreme poverty, extensive farming, increasing demographic pressure, resources overuse, water management difficulties are common problems in many areas) and expects the CDM to contribute to solving these problems.22
Table 4-13 shows the CDM pipeline for Kenya as per November 2008. The biomass energy project is based on using bagasse as a fuel source for a 35 MW co-generation plant. The hydropower project uses run-of-river technology and the geothermal power project is an extension of the existing Olkaria geothermal plant. The three projects are expected to generate 2.7 million CERs by the year 2012, which have been purchased by among others the World Bank Community Development Carbon Fund, the World Bank Biocarbon Fund (Wücke and Michaelowa, 2007), and Japan Carbon Finance (Fenhann, 2007). A striking aspect noted by Wücke and Michaelowa (2007) is that due to the limited CDM activities in the country, no specialised CDM consultancy has been established yet.
Table 4-13. CDM project pipeline for Kenya, as per November 2008
Registered Requested
review At validation Correction requested
Registration requested
Biomass energy 1 1 Hydro 3 EE supply side 1 Geothermal 1
Total 7
Source: UNEP Risø Centre, after Fenhann (2007) 21 http://www.nema.go.ke/downloads/Sustainable%20Development%20Criteria.pdf. 22 NEMA, see footnote above.
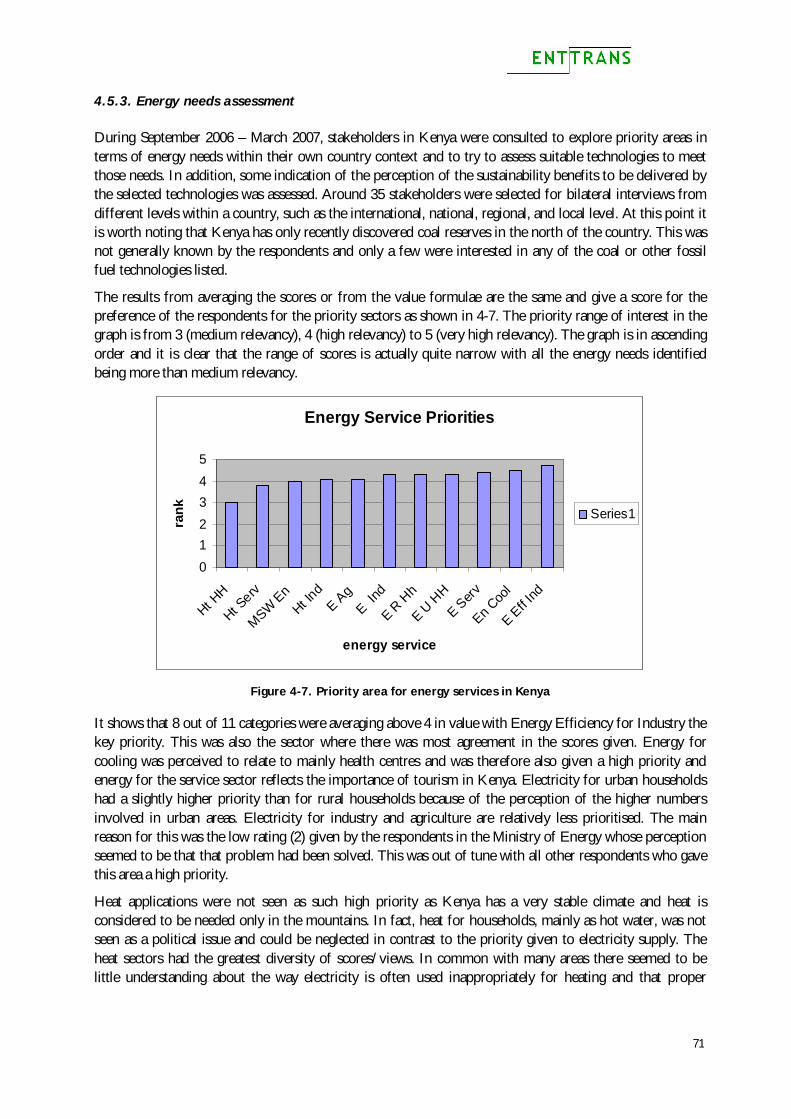
71
4.5.3. Energy needs assessment
During September 2006 – March 2007, stakeholders in Kenya were consulted to explore priority areas in terms of energy needs within their own country context and to try to assess suitable technologies to meet those needs. In addition, some indication of the perception of the sustainability benefits to be delivered by the selected technologies was assessed. Around 35 stakeholders were selected for bilateral interviews from different levels within a country, such as the international, national, regional, and local level. At this point it is worth noting that Kenya has only recently discovered coal reserves in the north of the country. This was not generally known by the respondents and only a few were interested in any of the coal or other fossil fuel technologies listed.
The results from averaging the scores or from the value formulae are the same and give a score for the preference of the respondents for the priority sectors as shown in 4-7. The priority range of interest in the graph is from 3 (medium relevancy), 4 (high relevancy) to 5 (very high relevancy). The graph is in ascending order and it is clear that the range of scores is actually quite narrow with all the energy needs identified being more than medium relevancy.
Energy Service Priorities
012345
Ht HH
Ht Serv
MSW EnHt In
dE Ag
E Ind
E R H
h
E U H
HE Serv
En Coo
l
E Eff Ind
energy service
rank Series1
Figure 4-7. Priority area for energy services in Kenya
It shows that 8 out of 11 categories were averaging above 4 in value with Energy Efficiency for Industry the key priority. This was also the sector where there was most agreement in the scores given. Energy for cooling was perceived to relate to mainly health centres and was therefore also given a high priority and energy for the service sector reflects the importance of tourism in Kenya. Electricity for urban households had a slightly higher priority than for rural households because of the perception of the higher numbers involved in urban areas. Electricity for industry and agriculture are relatively less prioritised. The main reason for this was the low rating (2) given by the respondents in the Ministry of Energy whose perception seemed to be that that problem had been solved. This was out of tune with all other respondents who gave this area a high priority.
Heat applications were not seen as such high priority as Kenya has a very stable climate and heat is considered to be needed only in the mountains. In fact, heat for households, mainly as hot water, was not seen as a political issue and could be neglected in contrast to the priority given to electricity supply. The heat sectors had the greatest diversity of scores/views. In common with many areas there seemed to be little understanding about the way electricity is often used inappropriately for heating and that proper
72
management of the heat sector would be beneficial for electricity production, as well as a Demand side management measures and for the general efficiency of the use of primary energy sources.
As there were four people from the ministry of energy in the sample analysed, it was possible to see that although there was agreement between them on some issues they also maintained a range of views on most of the areas. There did not seem to be any bias from a ‘ministry of energy’ political line.
Additional priority areas of interest were: Transport, Water for irrigation, Food processing, and Energy for schools.
Experience in Kenya showed that respondents were unfamiliar with some of the technologies listed in the questionnaire, e.g., clean coal, heat pumps, solar thermal for space heating and cooling and industrial use (food applications), solar towers and solar thermal for electricity, boiler upgrades, municipal solid waste management, and biogas technologies. This unfamiliarity affected stakeholders’ perception and their ability to rank the technologies. The ratings on the technologies over all the final respondents (22) are given in Figure 4-8.
Energy Service Technology Priorities
012345
coali
mpCMM
coal
to ga
s
ethsto
ve
methco
mb
microC
HP
gasfc
biosto
veoil
imp
clean
coal
CSP/Tower
htpum
pcoo
l
biogas
elect
heatp
ump
htpum
pgrid
MSWcapt
biomas
sboil
er
MSWcomb
solco
oker
stboile
rup
sustb
uildc
ool
MSWgasif
n
Hydrolar
ge
sustb
uildh
t
biogas
heat
solth
cooler
biogas
cookwind
biomCHP
solla
ntern
effiro
nind
MSWbio
gas
geoth
elec
EffChem
ind
effch
arcoal
LPGco
ok
ICStove
s
effce
mentin
d
EffAgin
dmini
ESLamps
solth
heat
solPVMHP
Technology
Sco
re
Series1
Figure 4-8. Technology priorities in Kenya.
The technology with the highest score was micro-hydro power. There are 13 technologies with an overall ranking above 4 (high) and these are given in red in Table 4-14. Solar thermal for heating is the only technology not in line with the energy service priorities perceived in Figure 4-8.
However, as was mentioned for the energy service needs assessments carried out for the other case-study countries in this Chapter, respondents’ individual priorities varied depending on their knowledge and experience and any particular interests and enthusiasms, e.g., for solar. Therefore, the priority list of technologies should be taken in combination with further qualification.
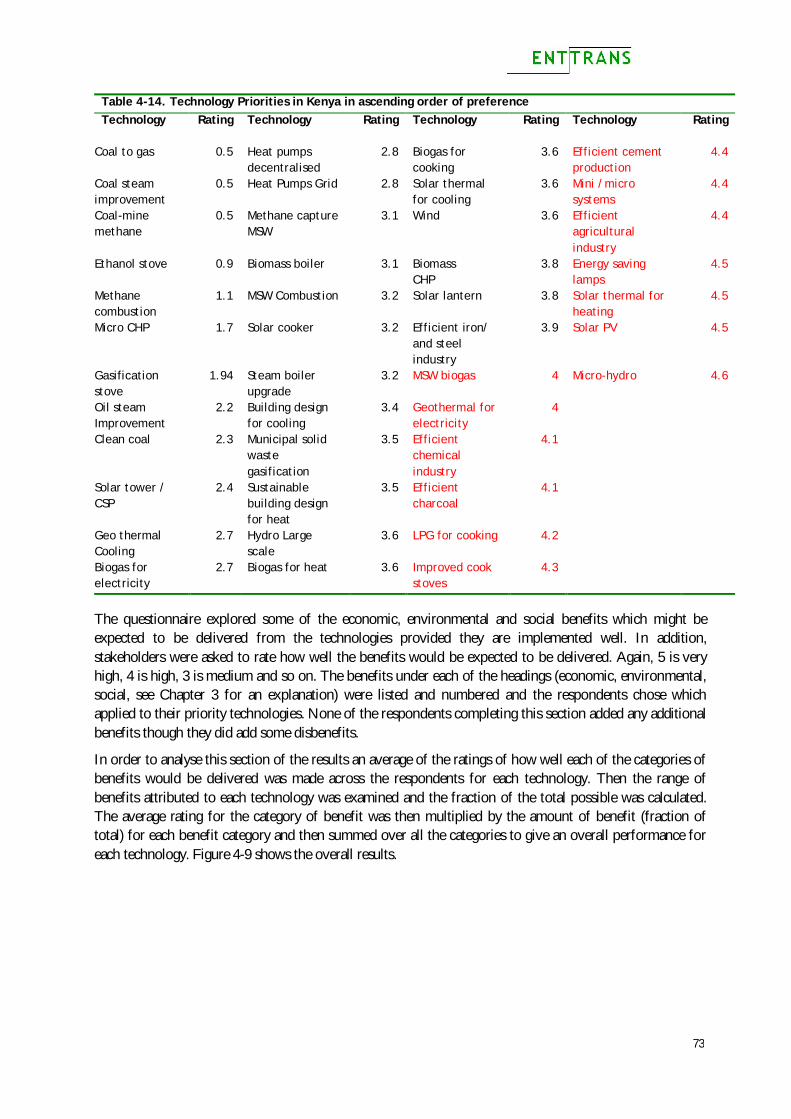
73
Table 4-14. Technology Priorities in Kenya in ascending order of preference Technology
Rating
Technology
Rating
Technology
Rating
Technology
Rating
Coal to gas 0.5 Heat pumps decentralised
2.8 Biogas for cooking
3.6 Efficient cement production
4.4
Coal steam improvement
0.5 Heat Pumps Grid 2.8 Solar thermal for cooling
3.6 Mini /micro systems
4.4
Coal-mine methane
0.5 Methane capture MSW
3.1 Wind
3.6 Efficient agricultural industry
4.4
Ethanol stove 0.9 Biomass boiler 3.1 Biomass CHP
3.8 Energy saving lamps
4.5
Methane combustion
1.1 MSW Combustion 3.2 Solar lantern 3.8 Solar thermal for heating
4.5
Micro CHP 1.7 Solar cooker 3.2 Efficient iron/ and steel industry
3.9 Solar PV 4.5
Gasification stove
1.94 Steam boiler upgrade
3.2 MSW biogas 4 Micro-hydro 4.6
Oil steam Improvement
2.2 Building design for cooling
3.4 Geothermal for electricity
4
Clean coal 2.3 Municipal solid waste gasification
3.5 Efficient chemical industry
4.1
Solar tower / CSP
2.4 Sustainable building design for heat
3.5 Efficient charcoal
4.1
Geo thermal Cooling
2.7 Hydro Large scale
3.6 LPG for cooking 4.2
Biogas for electricity
2.7 Biogas for heat 3.6 Improved cook stoves
4.3
The questionnaire explored some of the economic, environmental and social benefits which might be expected to be delivered from the technologies provided they are implemented well. In addition, stakeholders were asked to rate how well the benefits would be expected to be delivered. Again, 5 is very high, 4 is high, 3 is medium and so on. The benefits under each of the headings (economic, environmental, social, see Chapter 3 for an explanation) were listed and numbered and the respondents chose which applied to their priority technologies. None of the respondents completing this section added any additional benefits though they did add some disbenefits.
In order to analyse this section of the results an average of the ratings of how well each of the categories of benefits would be delivered was made across the respondents for each technology. Then the range of benefits attributed to each technology was examined and the fraction of the total possible was calculated. The average rating for the category of benefit was then multiplied by the amount of benefit (fraction of total) for each benefit category and then summed over all the categories to give an overall performance for each technology. Figure 4-9 shows the overall results.
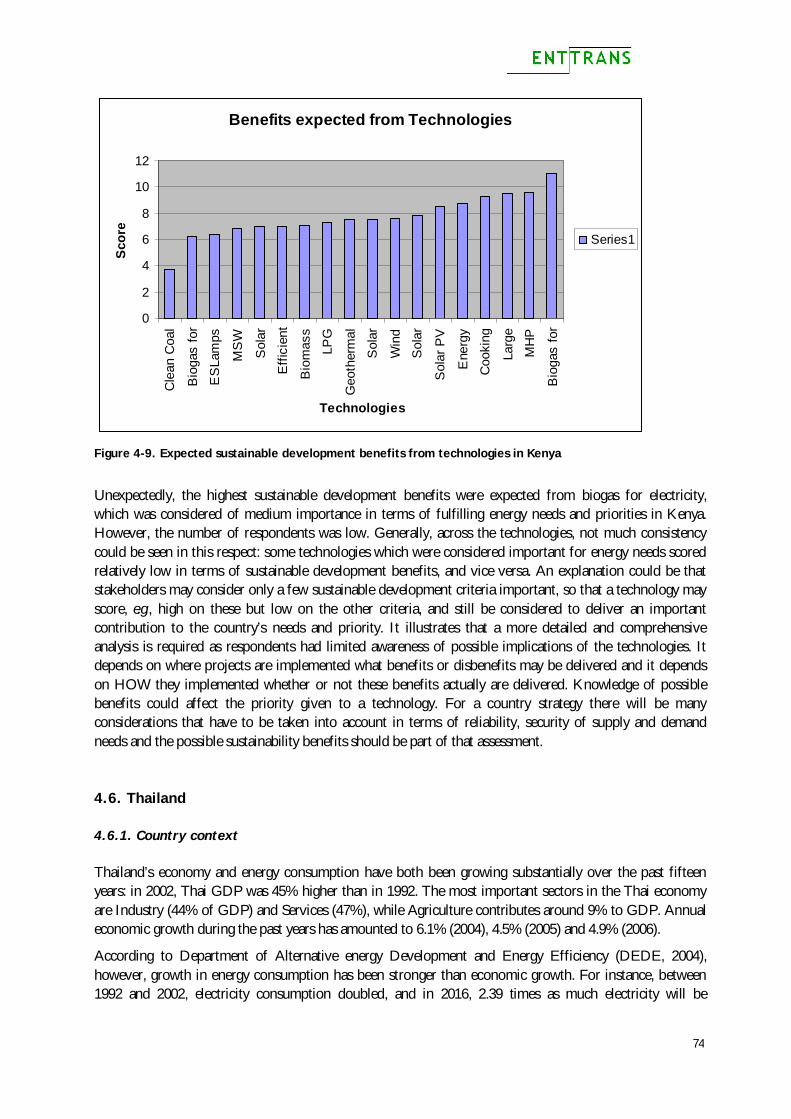
74
Benefits expected from Technologies
0
2
4
6
8
10
12C
lean
Coa
l
Bio
gas
for
ES
Lam
ps
MS
W
Sol
ar
Effi
cien
t
Bio
mas
s
LPG
Geo
ther
mal
Sol
ar
Win
d
Sol
ar
Sol
ar P
V
Ene
rgy
Coo
king
Larg
e
MH
P
Bio
gas
for
Technologies
Scor
e
Series1
Figure 4-9. Expected sustainable development benefits from technologies in Kenya
Unexpectedly, the highest sustainable development benefits were expected from biogas for electricity, which was considered of medium importance in terms of fulfilling energy needs and priorities in Kenya. However, the number of respondents was low. Generally, across the technologies, not much consistency could be seen in this respect: some technologies which were considered important for energy needs scored relatively low in terms of sustainable development benefits, and vice versa. An explanation could be that stakeholders may consider only a few sustainable development criteria important, so that a technology may score, e.g., high on these but low on the other criteria, and still be considered to deliver an important contribution to the country’s needs and priority. It illustrates that a more detailed and comprehensive analysis is required as respondents had limited awareness of possible implications of the technologies. It depends on where projects are implemented what benefits or disbenefits may be delivered and it depends on HOW they implemented whether or not these benefits actually are delivered. Knowledge of possible benefits could affect the priority given to a technology. For a country strategy there will be many considerations that have to be taken into account in terms of reliability, security of supply and demand needs and the possible sustainability benefits should be part of that assessment.
4.6. Thailand
4.6.1. Country context
Thailand’s economy and energy consumption have both been growing substantially over the past fifteen years: in 2002, Thai GDP was 45% higher than in 1992. The most important sectors in the Thai economy are Industry (44% of GDP) and Services (47%), while Agriculture contributes around 9% to GDP. Annual economic growth during the past years has amounted to 6.1% (2004), 4.5% (2005) and 4.9% (2006).
According to Department of Alternative energy Development and Energy Efficiency (DEDE, 2004), however, growth in energy consumption has been stronger than economic growth. For instance, between 1992 and 2002, electricity consumption doubled, and in 2016, 2.39 times as much electricity will be
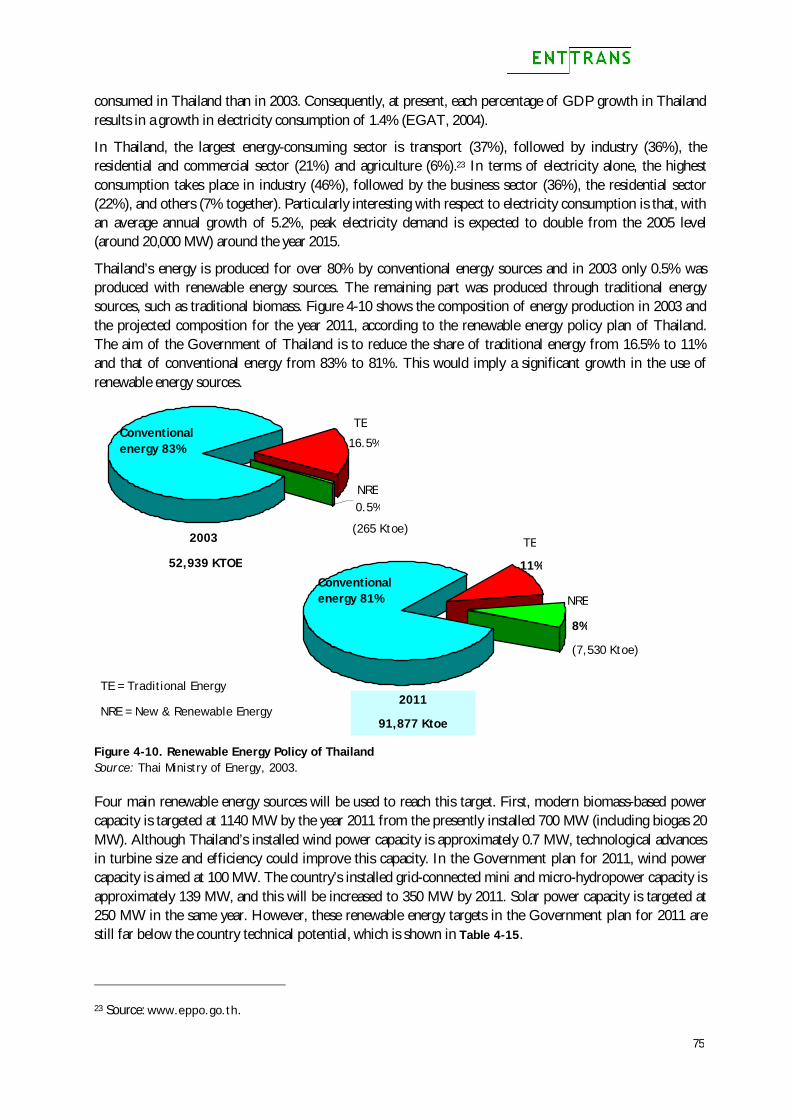
75
consumed in Thailand than in 2003. Consequently, at present, each percentage of GDP growth in Thailand results in a growth in electricity consumption of 1.4% (EGAT, 2004).
In Thailand, the largest energy-consuming sector is transport (37%), followed by industry (36%), the residential and commercial sector (21%) and agriculture (6%).23 In terms of electricity alone, the highest consumption takes place in industry (46%), followed by the business sector (36%), the residential sector (22%), and others (7% together). Particularly interesting with respect to electricity consumption is that, with an average annual growth of 5.2%, peak electricity demand is expected to double from the 2005 level (around 20,000 MW) around the year 2015.
Thailand’s energy is produced for over 80% by conventional energy sources and in 2003 only 0.5% was produced with renewable energy sources. The remaining part was produced through traditional energy sources, such as traditional biomass. Figure 4-10 shows the composition of energy production in 2003 and the projected composition for the year 2011, according to the renewable energy policy plan of Thailand. The aim of the Government of Thailand is to reduce the share of traditional energy from 16.5% to 11% and that of conventional energy from 83% to 81%. This would imply a significant growth in the use of renewable energy sources.
Figure 4-10. Renewable Energy Policy of Thailand Source: Thai Ministry of Energy, 2003. Four main renewable energy sources will be used to reach this target. First, modern biomass-based power capacity is targeted at 1140 MW by the year 2011 from the presently installed 700 MW (including biogas 20 MW). Although Thailand’s installed wind power capacity is approximately 0.7 MW, technological advances in turbine size and efficiency could improve this capacity. In the Government plan for 2011, wind power capacity is aimed at 100 MW. The country’s installed grid-connected mini and micro-hydropower capacity is approximately 139 MW, and this will be increased to 350 MW by 2011. Solar power capacity is targeted at 250 MW in the same year. However, these renewable energy targets in the Government plan for 2011 are still far below the country technical potential, which is shown in Table 4-15.
23 Source: www.eppo.go.th.
TE
11%
NRE
8%
(7,530 Ktoe)
Conventional energy 81%
52,939 KTOE
2003 (265 Ktoe)
2011
91,877 Ktoe
NRE 0.5%
TE
16.5% Conventional energy 83%
TE = Traditional Energy
NRE = New & Renewable Energy
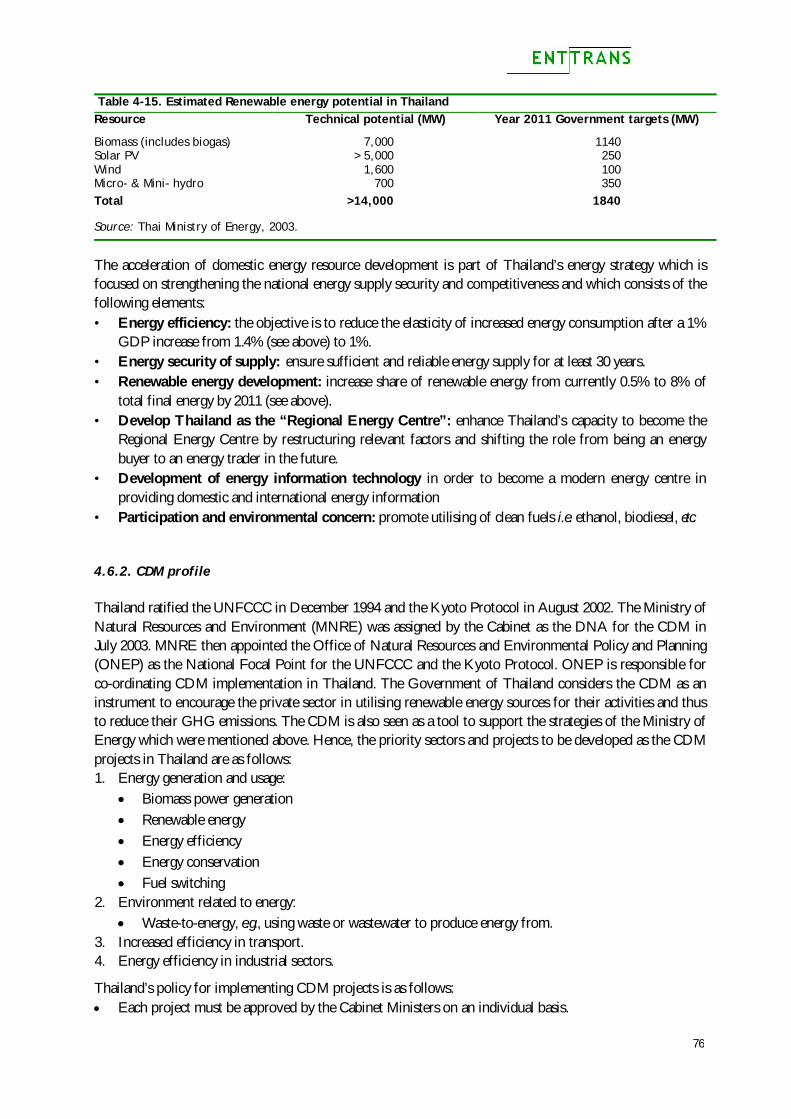
76
Table 4-15. Estimated Renewable energy potential in Thailand Resource Technical potential (MW) Year 2011 Government targets (MW)
Biomass (includes biogas) Solar PV Wind Micro- & Mini- hydro
7,000 > 5,000
1,600 700
1140 250 100 350
Total >14,000 1840
Source: Thai Ministry of Energy, 2003.
The acceleration of domestic energy resource development is part of Thailand’s energy strategy which is focused on strengthening the national energy supply security and competitiveness and which consists of the following elements: • Energy efficiency: the objective is to reduce the elasticity of increased energy consumption after a 1%
GDP increase from 1.4% (see above) to 1%. • Energy security of supply: ensure sufficient and reliable energy supply for at least 30 years. • Renewable energy development: increase share of renewable energy from currently 0.5% to 8% of
total final energy by 2011 (see above). • Develop Thailand as the “Regional Energy Centre”: enhance Thailand’s capacity to become the
Regional Energy Centre by restructuring relevant factors and shifting the role from being an energy buyer to an energy trader in the future.
• Development of energy information technology in order to become a modern energy centre in providing domestic and international energy information
• Participation and environmental concern: promote utilising of clean fuels i.e. ethanol, biodiesel, etc.
4.6.2. CDM profile
Thailand ratified the UNFCCC in December 1994 and the Kyoto Protocol in August 2002. The Ministry of Natural Resources and Environment (MNRE) was assigned by the Cabinet as the DNA for the CDM in July 2003. MNRE then appointed the Office of Natural Resources and Environmental Policy and Planning (ONEP) as the National Focal Point for the UNFCCC and the Kyoto Protocol. ONEP is responsible for co-ordinating CDM implementation in Thailand. The Government of Thailand considers the CDM as an instrument to encourage the private sector in utilising renewable energy sources for their activities and thus to reduce their GHG emissions. The CDM is also seen as a tool to support the strategies of the Ministry of Energy which were mentioned above. Hence, the priority sectors and projects to be developed as the CDM projects in Thailand are as follows: 1. Energy generation and usage:
Biomass power generation Renewable energy Energy efficiency Energy conservation Fuel switching
2. Environment related to energy: Waste-to-energy, e.g., using waste or wastewater to produce energy from.
3. Increased efficiency in transport. 4. Energy efficiency in industrial sectors.
Thailand’s policy for implementing CDM projects is as follows: Each project must be approved by the Cabinet Ministers on an individual basis.
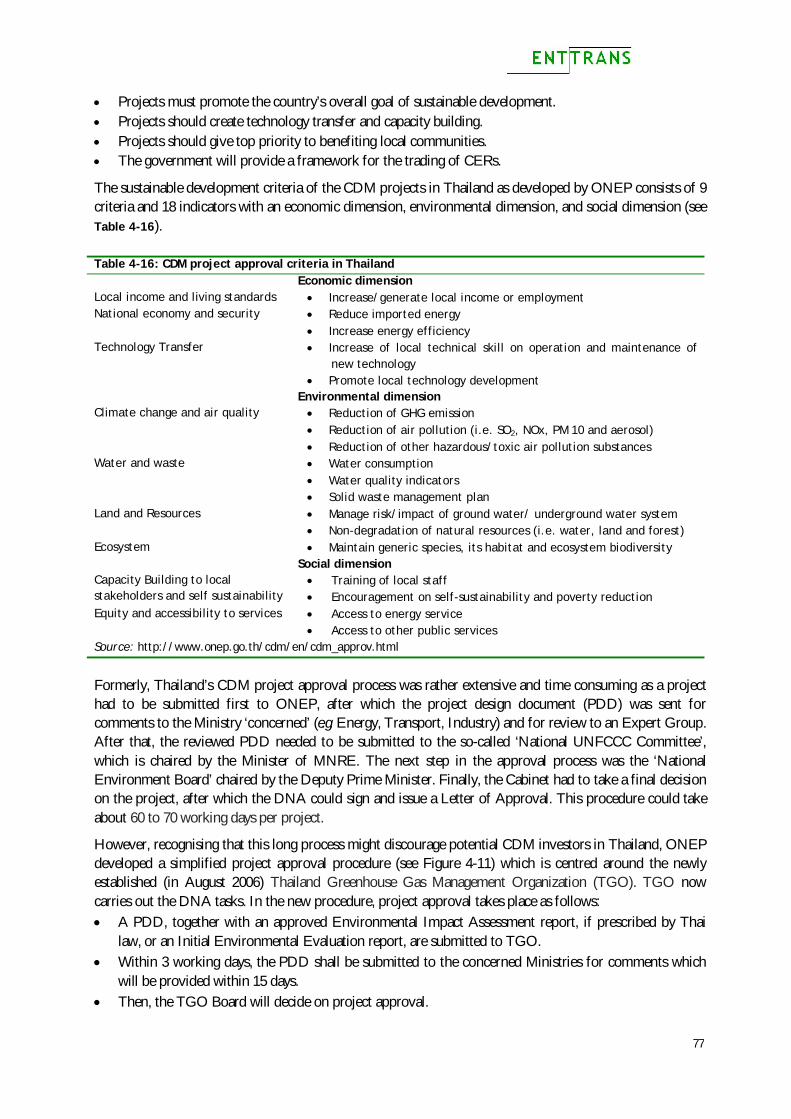
77
Projects must promote the country’s overall goal of sustainable development. Projects should create technology transfer and capacity building. Projects should give top priority to benefiting local communities. The government will provide a framework for the trading of CERs.
The sustainable development criteria of the CDM projects in Thailand as developed by ONEP consists of 9 criteria and 18 indicators with an economic dimension, environmental dimension, and social dimension (see Table 4-16).
Formerly, Thailand’s CDM project approval process was rather extensive and time consuming as a project had to be submitted first to ONEP, after which the project design document (PDD) was sent for comments to the Ministry ‘concerned’ (e.g. Energy, Transport, Industry) and for review to an Expert Group. After that, the reviewed PDD needed to be submitted to the so-called ‘National UNFCCC Committee’, which is chaired by the Minister of MNRE. The next step in the approval process was the ‘National Environment Board’ chaired by the Deputy Prime Minister. Finally, the Cabinet had to take a final decision on the project, after which the DNA could sign and issue a Letter of Approval. This procedure could take about 60 to 70 working days per project.
However, recognising that this long process might discourage potential CDM investors in Thailand, ONEP developed a simplified project approval procedure (see Figure 4-11) which is centred around the newly established (in August 2006) Thailand Greenhouse Gas Management Organization (TGO). TGO now carries out the DNA tasks. In the new procedure, project approval takes place as follows: A PDD, together with an approved Environmental Impact Assessment report, if prescribed by Thai
law, or an Initial Environmental Evaluation report, are submitted to TGO. Within 3 working days, the PDD shall be submitted to the concerned Ministries for comments which
will be provided within 15 days. Then, the TGO Board will decide on project approval.
Table 4-16: CDM project approval criteria in Thailand Economic dimension
Local income and living standards Increase/generate local income or employment National economy and security Reduce imported energy
Increase energy efficiency Technology Transfer Increase of local technical skill on operation and maintenance of
new technology Promote local technology development
Environmental dimension Climate change and air quality Reduction of GHG emission
Reduction of air pollution (i.e. SO2, NOx, PM 10 and aerosol) Reduction of other hazardous/toxic air pollution substances
Water and waste Water consumption Water quality indicators Solid waste management plan
Land and Resources Manage risk/impact of ground water/ underground water system Non-degradation of natural resources (i.e. water, land and forest)
Ecosystem Maintain generic species, its habitat and ecosystem biodiversity Social dimension
Capacity Building to local stakeholders and self sustainability
Training of local staff Encouragement on self-sustainability and poverty reduction
Equity and accessibility to services Access to energy service Access to other public services
Source: http://www.onep.go.th/cdm/en/cdm_approv.html
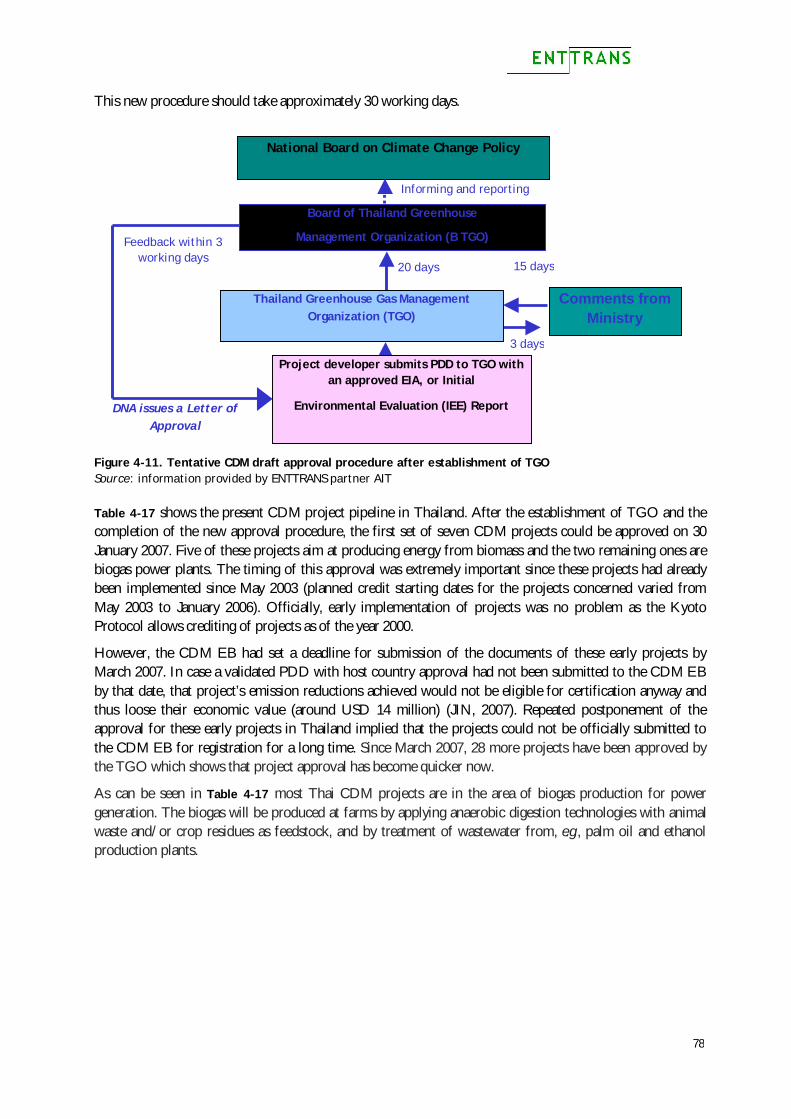
78
This new procedure should take approximately 30 working days.
Figure 4-11. Tentative CDM draft approval procedure after establishment of TGO Source: information provided by ENTTRANS partner AIT
Table 4-17 shows the present CDM project pipeline in Thailand. After the establishment of TGO and the completion of the new approval procedure, the first set of seven CDM projects could be approved on 30 January 2007. Five of these projects aim at producing energy from biomass and the two remaining ones are biogas power plants. The timing of this approval was extremely important since these projects had already been implemented since May 2003 (planned credit starting dates for the projects concerned varied from May 2003 to January 2006). Officially, early implementation of projects was no problem as the Kyoto Protocol allows crediting of projects as of the year 2000.
However, the CDM EB had set a deadline for submission of the documents of these early projects by March 2007. In case a validated PDD with host country approval had not been submitted to the CDM EB by that date, that project’s emission reductions achieved would not be eligible for certification anyway and thus loose their economic value (around USD 14 million) (JIN, 2007). Repeated postponement of the approval for these early projects in Thailand implied that the projects could not be officially submitted to the CDM EB for registration for a long time. Since March 2007, 28 more projects have been approved by the TGO which shows that project approval has become quicker now.
As can be seen in Table 4-17 most Thai CDM projects are in the area of biogas production for power generation. The biogas will be produced at farms by applying anaerobic digestion technologies with animal waste and/or crop residues as feedstock, and by treatment of wastewater from, e.g., palm oil and ethanol production plants.
15 days
3 days
20 days
DNA issues a Letter of Approval
Project developer submits PDD to TGO with an approved EIA, or Initial
Environmental Evaluation (IEE) Report
Comments from Ministry
National Board on Climate Change Policy
Board of Thailand Greenhouse
Management Organization (B TGO)
Informing and reporting
Feedback within 3
working days
Thailand Greenhouse Gas Management Organization (TGO)
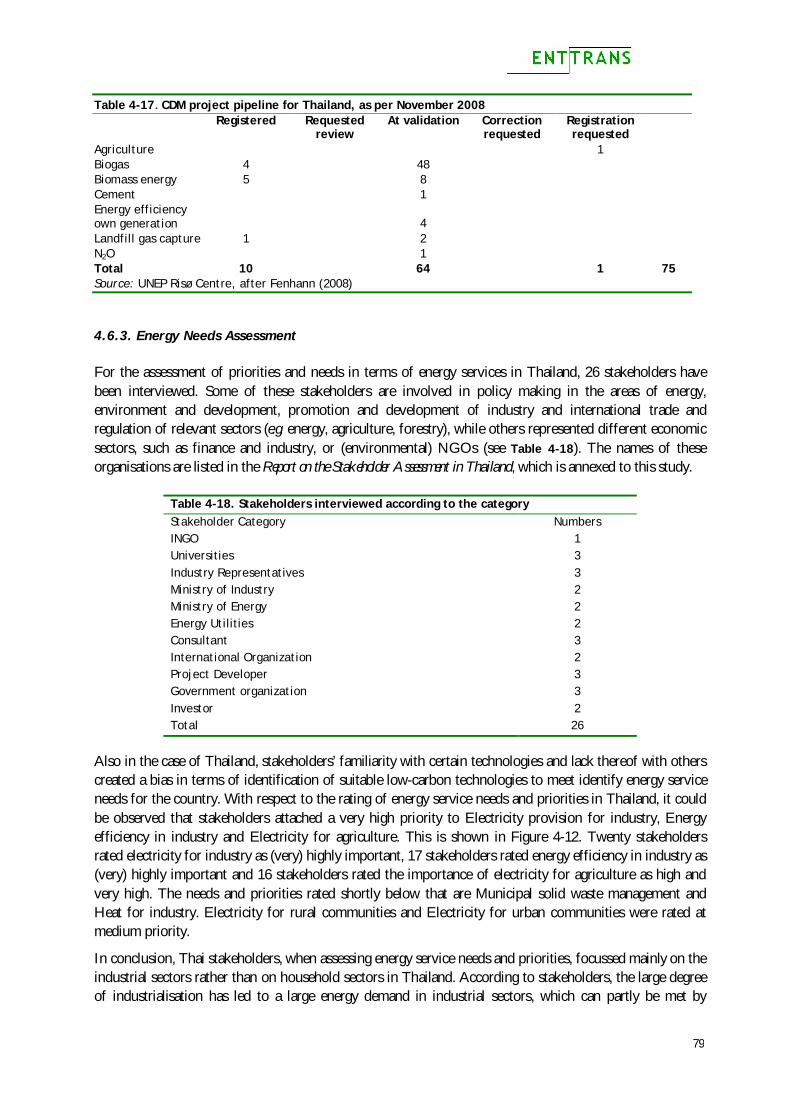
79
Table 4-17. CDM project pipeline for Thailand, as per November 2008
Registered Requested
review At validation Correction
requested Registration requested
Agriculture 1 Biogas 4 48 Biomass energy 5 8 Cement 1 Energy efficiency own generation 4 Landfill gas capture 1 2 N2O 1 Total 10 64 1 75 Source: UNEP Risø Centre, after Fenhann (2008)
4.6.3. Energy Needs Assessment
For the assessment of priorities and needs in terms of energy services in Thailand, 26 stakeholders have been interviewed. Some of these stakeholders are involved in policy making in the areas of energy, environment and development, promotion and development of industry and international trade and regulation of relevant sectors (e.g. energy, agriculture, forestry), while others represented different economic sectors, such as finance and industry, or (environmental) NGOs (see Table 4-18). The names of these organisations are listed in the Report on the Stakeholder Assessment in Thailand, which is annexed to this study.
Table 4-18. Stakeholders interviewed according to the category Stakeholder Category Numbers INGO 1 Universities 3 Industry Representatives 3 Ministry of Industry 2 Ministry of Energy 2 Energy Utilities 2 Consultant 3 International Organization 2 Project Developer 3 Government organization 3 Investor 2 Total 26
Also in the case of Thailand, stakeholders’ familiarity with certain technologies and lack thereof with others created a bias in terms of identification of suitable low-carbon technologies to meet identify energy service needs for the country. With respect to the rating of energy service needs and priorities in Thailand, it could be observed that stakeholders attached a very high priority to Electricity provision for industry, Energy efficiency in industry and Electricity for agriculture. This is shown in Figure 4-12. Twenty stakeholders rated electricity for industry as (very) highly important, 17 stakeholders rated energy efficiency in industry as (very) highly important and 16 stakeholders rated the importance of electricity for agriculture as high and very high. The needs and priorities rated shortly below that are Municipal solid waste management and Heat for industry. Electricity for rural communities and Electricity for urban communities were rated at medium priority.
In conclusion, Thai stakeholders, when assessing energy service needs and priorities, focussed mainly on the industrial sectors rather than on household sectors in Thailand. According to stakeholders, the large degree of industrialisation has led to a large energy demand in industrial sectors, which can partly be met by
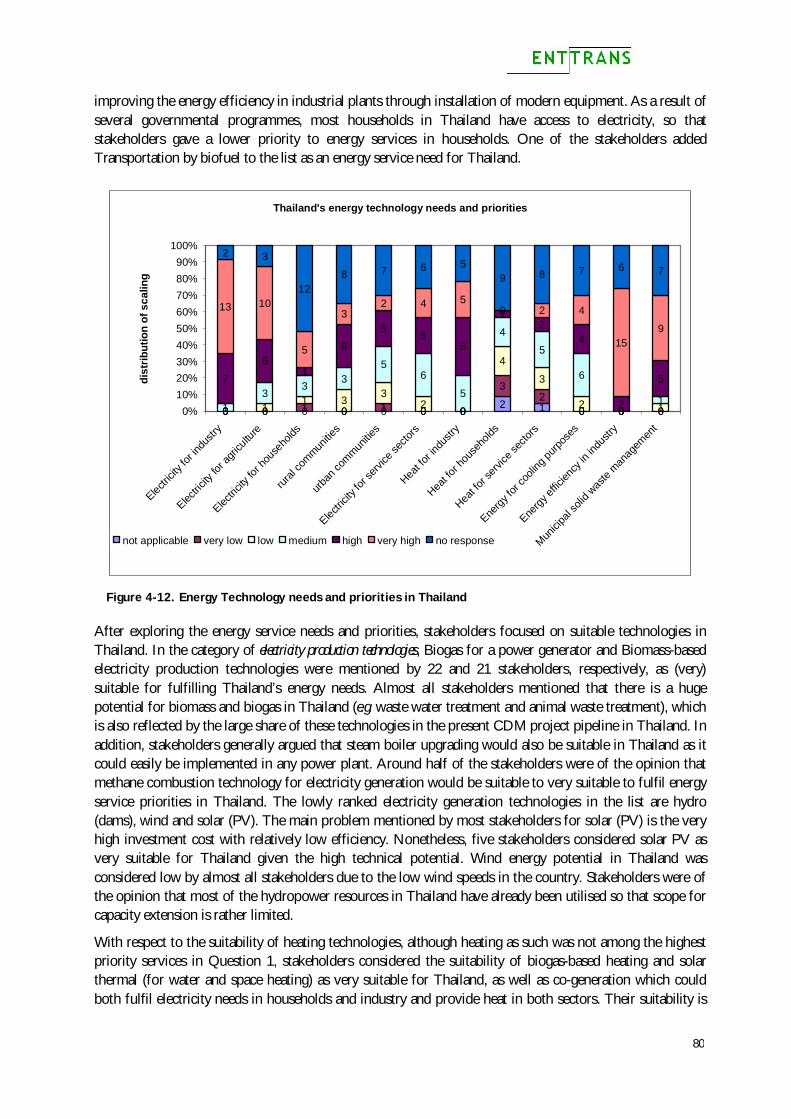
80
improving the energy efficiency in industrial plants through installation of modern equipment. As a result of several governmental programmes, most households in Thailand have access to electricity, so that stakeholders gave a lower priority to energy services in households. One of the stakeholders added Transportation by biofuel to the list as an energy service need for Thailand.
Thailand's energy technology needs and priorities
0 0 0 0 0 0 0 2 1 0 0 00 0 1 0 1 0 0
32
0 0 00 11 3 3
2 0
4
3
2 0 113
3 35
6
5
4
5
6
01
7
61
6
5 58
12
4
2
5
13 10
5
32 4 5
0 2 4
159
2 3
128 7 6 5
9 8 7 6 7
0%10%20%30%40%50%60%70%80%90%
100%
Electricit
y for
indus
try
Electric
ity fo
r agri
cultu
re
Electric
ity fo
r hou
seho
ldsrur
al co
mmunitie
s
urban
commun
ities
Electricit
y for
servi
ce se
ctors
Heat fo
r indu
stry
Heat fo
r hou
seho
lds
Heat fo
r serv
ice se
ctors
Energy
for c
oolin
g purp
oses
Energy
effic
iency
in in
dustr
y
Munici
pal s
olid w
aste
manag
emen
t
dist
ribut
ion
of s
calin
g
not applicable very low low medium high very high no response
Figure 4-12. Energy Technology needs and priorities in Thailand After exploring the energy service needs and priorities, stakeholders focused on suitable technologies in Thailand. In the category of electricity production technologies, Biogas for a power generator and Biomass-based electricity production technologies were mentioned by 22 and 21 stakeholders, respectively, as (very) suitable for fulfilling Thailand’s energy needs. Almost all stakeholders mentioned that there is a huge potential for biomass and biogas in Thailand (e.g. waste water treatment and animal waste treatment), which is also reflected by the large share of these technologies in the present CDM project pipeline in Thailand. In addition, stakeholders generally argued that steam boiler upgrading would also be suitable in Thailand as it could easily be implemented in any power plant. Around half of the stakeholders were of the opinion that methane combustion technology for electricity generation would be suitable to very suitable to fulfil energy service priorities in Thailand. The lowly ranked electricity generation technologies in the list are hydro (dams), wind and solar (PV). The main problem mentioned by most stakeholders for solar (PV) is the very high investment cost with relatively low efficiency. Nonetheless, five stakeholders considered solar PV as very suitable for Thailand given the high technical potential. Wind energy potential in Thailand was considered low by almost all stakeholders due to the low wind speeds in the country. Stakeholders were of the opinion that most of the hydropower resources in Thailand have already been utilised so that scope for capacity extension is rather limited.
With respect to the suitability of heating technologies, although heating as such was not among the highest priority services in Question 1, stakeholders considered the suitability of biogas-based heating and solar thermal (for water and space heating) as very suitable for Thailand, as well as co-generation which could both fulfil electricity needs in households and industry and provide heat in both sectors. Their suitability is
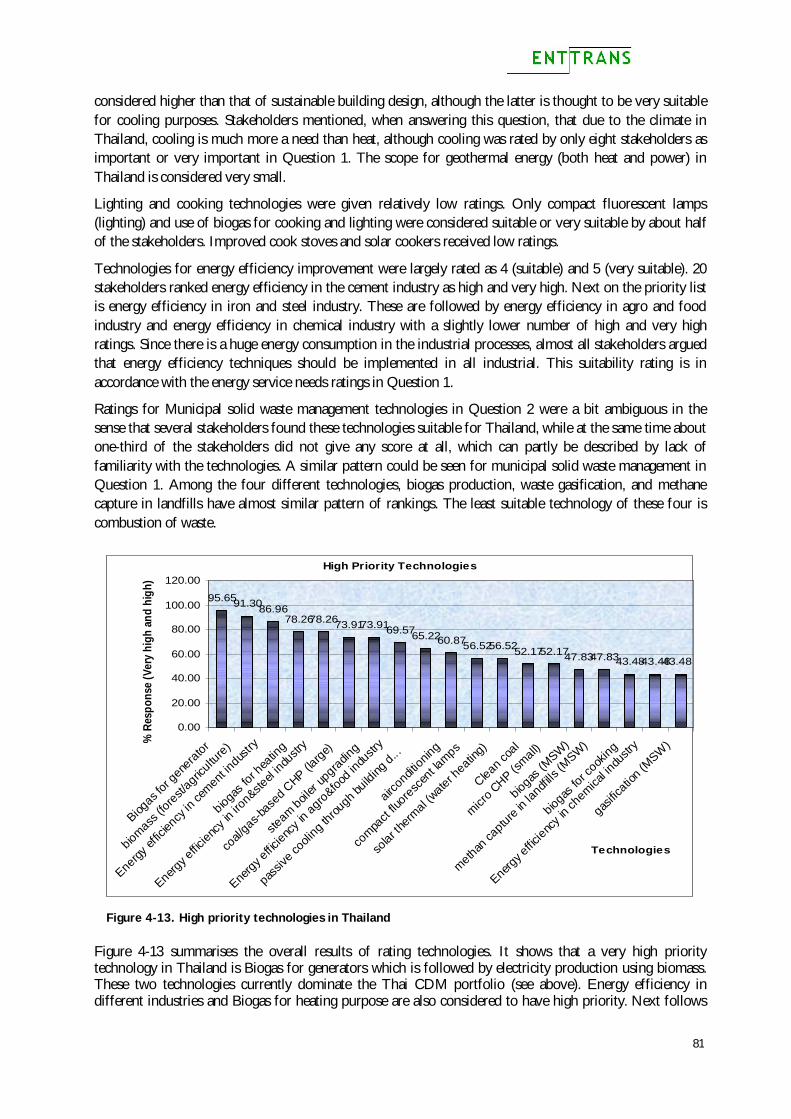
81
considered higher than that of sustainable building design, although the latter is thought to be very suitable for cooling purposes. Stakeholders mentioned, when answering this question, that due to the climate in Thailand, cooling is much more a need than heat, although cooling was rated by only eight stakeholders as important or very important in Question 1. The scope for geothermal energy (both heat and power) in Thailand is considered very small.
Lighting and cooking technologies were given relatively low ratings. Only compact fluorescent lamps (lighting) and use of biogas for cooking and lighting were considered suitable or very suitable by about half of the stakeholders. Improved cook stoves and solar cookers received low ratings.
Technologies for energy efficiency improvement were largely rated as 4 (suitable) and 5 (very suitable). 20 stakeholders ranked energy efficiency in the cement industry as high and very high. Next on the priority list is energy efficiency in iron and steel industry. These are followed by energy efficiency in agro and food industry and energy efficiency in chemical industry with a slightly lower number of high and very high ratings. Since there is a huge energy consumption in the industrial processes, almost all stakeholders argued that energy efficiency techniques should be implemented in all industrial. This suitability rating is in accordance with the energy service needs ratings in Question 1.
Ratings for Municipal solid waste management technologies in Question 2 were a bit ambiguous in the sense that several stakeholders found these technologies suitable for Thailand, while at the same time about one-third of the stakeholders did not give any score at all, which can partly be described by lack of familiarity with the technologies. A similar pattern could be seen for municipal solid waste management in Question 1. Among the four different technologies, biogas production, waste gasification, and methane capture in landfills have almost similar pattern of rankings. The least suitable technology of these four is combustion of waste.
High Priority Technologies
95.6591.3086.9678.2678.2673.9173.9169.5765.2260.8756.5256.5252.1752.1747.8347.8343.4843.4843.48
0.00
20.00
40.00
60.00
80.00
100.00
120.00
Biogas f
or gene
rator
biomass (fo
rest/agric
ulture)
Energy ef
ficien
cy in
cement
industry
biogas f
or hea
ting
Energy e
fficienc
y in i
ron&steel
industr
y
coal/
gas-base
d CHP (la
rge)
steam boil
er up
grading
Energy e
fficienc
y in agro&foo
d indu
stry
passiv
e cooli
ng throu
gh build
ing d...
aircondit
ioning
compa
ct flu
orescen
t lamps
solar th
ermal (w
ater heatin
g)
Clean coa
l
micro C
HP (small)
biogas (M
SW)
methan ca
pture in la
ndfills
(MSW)
biogas fo
r cook
ing
Energy e
fficienc
y in ch
emical in
dustr
y
gasific
ation (M
SW)
Technologies
% R
espo
nse
(Ver
y hi
gh a
nd h
igh)
Figure 4-13. High priority technologies in Thailand
Figure 4-13 summarises the overall results of rating technologies. It shows that a very high priority technology in Thailand is Biogas for generators which is followed by electricity production using biomass. These two technologies currently dominate the Thai CDM portfolio (see above). Energy efficiency in different industries and Biogas for heating purpose are also considered to have high priority. Next follows
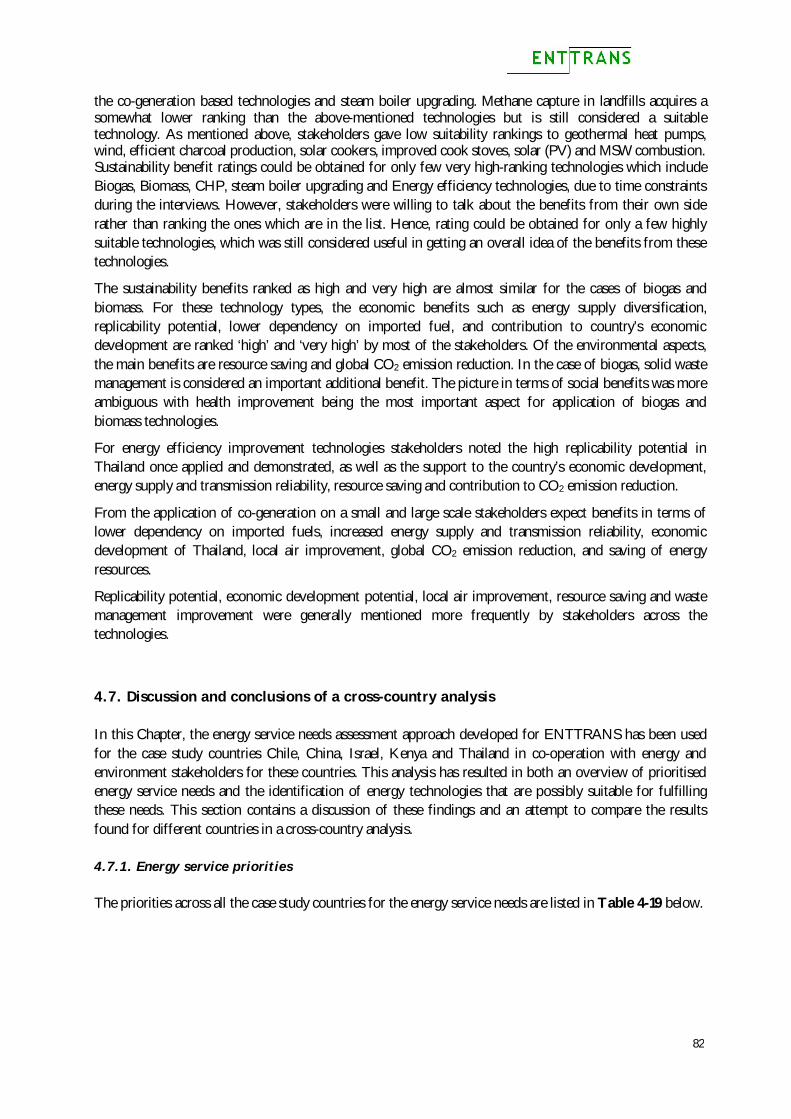
82
the co-generation based technologies and steam boiler upgrading. Methane capture in landfills acquires a somewhat lower ranking than the above-mentioned technologies but is still considered a suitable technology. As mentioned above, stakeholders gave low suitability rankings to geothermal heat pumps, wind, efficient charcoal production, solar cookers, improved cook stoves, solar (PV) and MSW combustion. Sustainability benefit ratings could be obtained for only few very high-ranking technologies which include Biogas, Biomass, CHP, steam boiler upgrading and Energy efficiency technologies, due to time constraints during the interviews. However, stakeholders were willing to talk about the benefits from their own side rather than ranking the ones which are in the list. Hence, rating could be obtained for only a few highly suitable technologies, which was still considered useful in getting an overall idea of the benefits from these technologies.
The sustainability benefits ranked as high and very high are almost similar for the cases of biogas and biomass. For these technology types, the economic benefits such as energy supply diversification, replicability potential, lower dependency on imported fuel, and contribution to country’s economic development are ranked ‘high’ and ‘very high’ by most of the stakeholders. Of the environmental aspects, the main benefits are resource saving and global CO2 emission reduction. In the case of biogas, solid waste management is considered an important additional benefit. The picture in terms of social benefits was more ambiguous with health improvement being the most important aspect for application of biogas and biomass technologies.
For energy efficiency improvement technologies stakeholders noted the high replicability potential in Thailand once applied and demonstrated, as well as the support to the country’s economic development, energy supply and transmission reliability, resource saving and contribution to CO2 emission reduction.
From the application of co-generation on a small and large scale stakeholders expect benefits in terms of lower dependency on imported fuels, increased energy supply and transmission reliability, economic development of Thailand, local air improvement, global CO2 emission reduction, and saving of energy resources.
Replicability potential, economic development potential, local air improvement, resource saving and waste management improvement were generally mentioned more frequently by stakeholders across the technologies.
4.7. Discussion and conclusions of a cross-country analysis
In this Chapter, the energy service needs assessment approach developed for ENTTRANS has been used for the case study countries Chile, China, Israel, Kenya and Thailand in co-operation with energy and environment stakeholders for these countries. This analysis has resulted in both an overview of prioritised energy service needs and the identification of energy technologies that are possibly suitable for fulfilling these needs. This section contains a discussion of these findings and an attempt to compare the results found for different countries in a cross-country analysis.
4.7.1. Energy service priorities
The priorities across all the case study countries for the energy service needs are listed in Table 4-19 below.
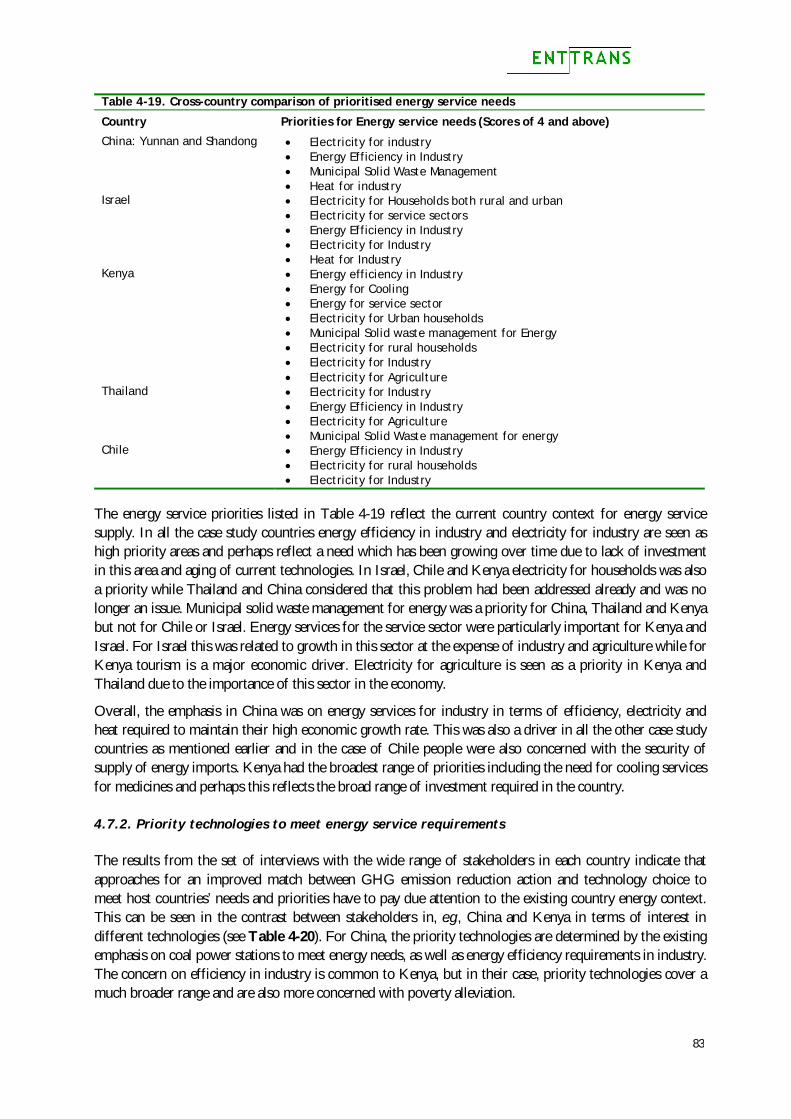
83
Table 4-19. Cross-country comparison of prioritised energy service needs
Country Priorities for Energy service needs (Scores of 4 and above)
China: Yunnan and Shandong Electricity for industry Energy Efficiency in Industry Municipal Solid Waste Management Heat for industry
Israel Electricity for Households both rural and urban Electricity for service sectors Energy Efficiency in Industry Electricity for Industry Heat for Industry
Kenya Energy efficiency in Industry Energy for Cooling Energy for service sector Electricity for Urban households Municipal Solid waste management for Energy Electricity for rural households Electricity for Industry Electricity for Agriculture
Thailand Electricity for Industry Energy Efficiency in Industry Electricity for Agriculture Municipal Solid Waste management for energy
Chile Energy Efficiency in Industry Electricity for rural households Electricity for Industry
The energy service priorities listed in Table 4-19 reflect the current country context for energy service supply. In all the case study countries energy efficiency in industry and electricity for industry are seen as high priority areas and perhaps reflect a need which has been growing over time due to lack of investment in this area and aging of current technologies. In Israel, Chile and Kenya electricity for households was also a priority while Thailand and China considered that this problem had been addressed already and was no longer an issue. Municipal solid waste management for energy was a priority for China, Thailand and Kenya but not for Chile or Israel. Energy services for the service sector were particularly important for Kenya and Israel. For Israel this was related to growth in this sector at the expense of industry and agriculture while for Kenya tourism is a major economic driver. Electricity for agriculture is seen as a priority in Kenya and Thailand due to the importance of this sector in the economy.
Overall, the emphasis in China was on energy services for industry in terms of efficiency, electricity and heat required to maintain their high economic growth rate. This was also a driver in all the other case study countries as mentioned earlier and in the case of Chile people were also concerned with the security of supply of energy imports. Kenya had the broadest range of priorities including the need for cooling services for medicines and perhaps this reflects the broad range of investment required in the country.
4.7.2. Priority technologies to meet energy service requirements
The results from the set of interviews with the wide range of stakeholders in each country indicate that approaches for an improved match between GHG emission reduction action and technology choice to meet host countries’ needs and priorities have to pay due attention to the existing country energy context. This can be seen in the contrast between stakeholders in, e.g., China and Kenya in terms of interest in different technologies (see Table 4-20). For China, the priority technologies are determined by the existing emphasis on coal power stations to meet energy needs, as well as energy efficiency requirements in industry. The concern on efficiency in industry is common to Kenya, but in their case, priority technologies cover a much broader range and are also more concerned with poverty alleviation.
84
Table 4-20. Priorities for Energy technologies (Scores of 4 and above) Chile Israel Energy Saving lamps Sustainable design of buildings Passive cooling technologies Biomass for electricity Municipal solid waste Landfill methane capture Wind power Coal Mine Methane combustion for electricity Mini/micro hydro Energy conservation in the cement, agro, chemical
and iron and steel industries Geothermal Solar Thermal
Solar PV Solar Thermal Sustainable Building design Energy saving lamps Air conditioning Coal to gas for power Wind power Municipal solid waste methane combustion Solar lanterns
Kenya Thailand Mini/micro Hydro Efficient cement production Solar thermal for heating Efficient agricultural industry Energy saving lamps Solar Thermal for cooling Solar PV Efficient iron and Steel Industry Mini/micro systems Improved cook stoves Efficient chemical industry Efficient charcoal production LPG for cooking Wind power Municipal solid waste gasification for energy Municipal solid waste biogas for energy Biomass CHP
Biogas for electricity Biomass for electricity Energy efficiency in cement industry Biogas for heating Energy efficiency in Iron and steel industry Coal/gas based CHP Steam boiler upgrades Energy efficiency in agro industry Passive cooling by building design Air conditioning CFLs Solar thermal water heating Clean coal Micro CHP Municipal solid waste Biogas Municipal solid waste Methane capture from landfill
China: Yunnan Province China: Shandong Province Energy Saving lamps Solar Coolers Clean coal for electricity Energy efficiency in cement industry Large scale hydro Supercritical boilers for power Energy efficiency in iron and steel industry Coal to gas for electricity Energy efficiency in chemical industry
Clean-coal for large-scale power supply Hydropower through dams Energy saving lamps Cement industry energy conservation Solar coolers Iron & steel industry energy conservation Wind power for large-scale power supply Solar cookers (for households) Combustion of municipal solid waste
Municipal Solid Waste technologies for energy, though not necessarily the highest priority, were nevertheless rated highly in all the case study countries along with Compact fluorescent lights, and Solar thermal. Energy efficiency technologies for industries are also common to all case study countries except for Israel while Wind power is highly rated for all countries except for Thailand because of their low wind resource. In China the emphasis is on large-scale electricity supply technologies while in Thailand, Israel, Kenya and Chile there was more emphasis on a range of smaller scale technologies for space and water heating, for cooking, lighting and distributed generation. China is the only advocate of large-scale hydro dams and clean coal technologies are also rated highly in common with Israel, Thailand and Chile. Biomass technologies were rated highly only in Kenya, Thailand and Chile for obvious reasons. Similarly, cooking technologies were given priority mainly in Kenya and in Shandong. Because of the appreciation within Chile and Israel of the need to limit demand in the domestic sector, energy efficiency technologies related to buildings are rated highly in those countries only. Surprisingly, CHP is only mentioned as a priority technology in Kenya and Thailand. Solar PV is rated in Israel and Kenya while the costs are cited for low priority in other countries. Geothermal energy was given priority only in Chile. In Kenya, geothermal opportunities were considered to have been exploited already.
85
The country descriptions of the assessment for priority technologies illustrate that there was a problem in some bias in the assessment of the priority technologies due to a range of issues and these are discussed further in Section 4.11.
4.8. Exploration of different viewpoints in assessment of technological preferences
The stakeholders interviewed using the questionnaire were diverse ranging from academics and policymakers to industry and NGOs as discussed earlier and it was obvious that in some cases there was a tendency to prioritise technologies in which the respondent had a special interest. It is possible to analyse the results of the questionnaire to look at the different groups of stakeholders within each country but the numbers tend to be low so that the results and conclusions can only be indicative.
4.9. Overall comparison of ESNA with EGTT procedures
In this section, the results from the Energy Service Needs Assessment (ESNA) for technology priorities are contrasted with the TNA procedure applied by the UNFCCC Expert Group on Technology Transfer (EGTT) for China in the following section. The priority results in each case were developed using different approaches, as the EGTT required much more analysis and discussion but with the aim of refining down to a small set of priority technologies whereas this first part of ENTTRANS was based on a questionnaire and interviews with some discussion of the range of alternative technologies available.
The EGTT has carried out TNAs in 94 non-Annex I countries. In contrast to ENTTRANS, their approach is to agree on criteria for the technologies on a participatory basis with internal and external experts. These criteria include environmental, economic, technology transfer and investment criteria including the cost effectiveness of GHG reductions. Bearing these criteria in mind, the experts proposed a range of technologies based on their experience. This initial list of technologies is further refined to a few priority technologies whose barriers to development are identified and an action plan to overcome them formulated. It is unfortunate that of the possible Multi Criteria Analysis approaches which could have been used, the Analytical Hierarchy Process (AHP) was chosen as an evaluation tool. The AHP approach has several inherent faults which can lead to misleading results (DETR, 2000). A Multi Criteria Decision Analysis approach used with a trained facilitator is a better option, which is well tried and grounded in decision theory.
Of the 94 countries where TNA exercises were undertaken there is already available information for Kenya, China and Chile. Compared to the ESNA approach of ENTTRANS there is no consideration of energy service needs and technologies to address those needs. Instead, the technologies were decided on the basis of experts’ experience in both cases, though a more strategic basis regarding the country context would need to be incorporated at a later stage. As part of the analysis, GHG impacts were assessed and cost effectiveness considered.
As an illustration, for China the technologies initially identified are listed in the Table 4-21.
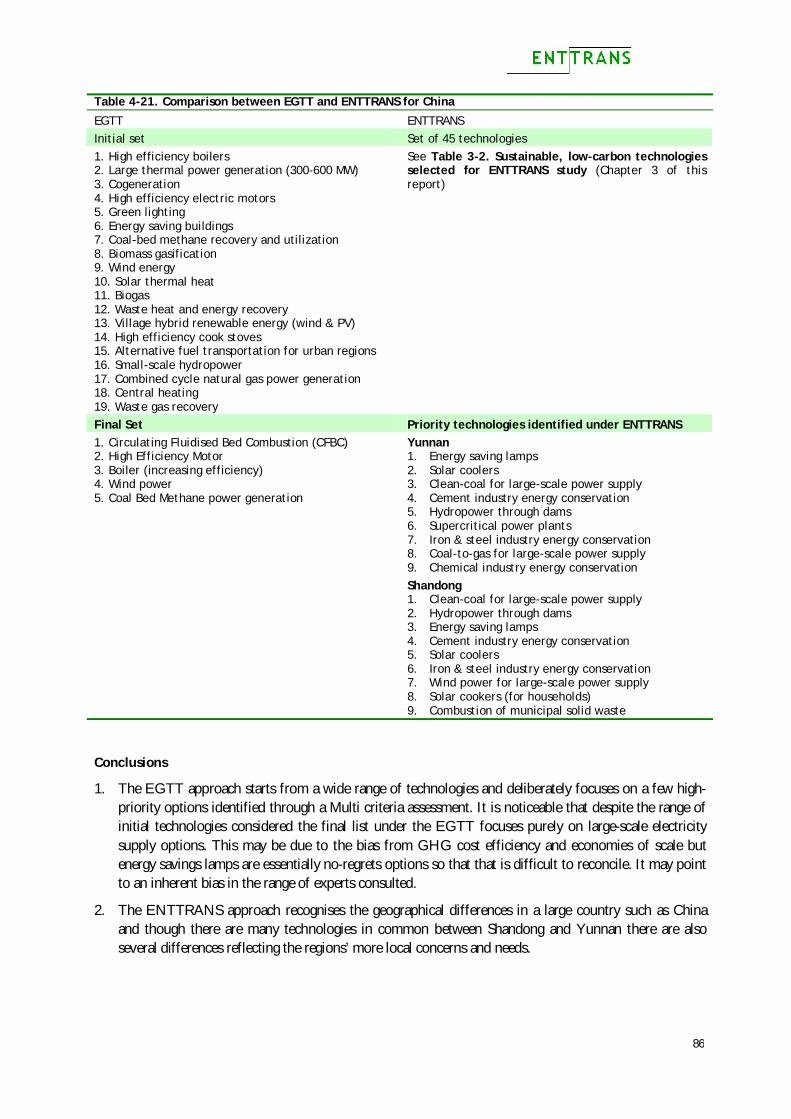
86
Table 4-21. Comparison between EGTT and ENTTRANS for China
EGTT ENTTRANS Initial set Set of 45 technologies 1. High efficiency boilers 2. Large thermal power generation (300-600 MW) 3. Cogeneration 4. High efficiency electric motors 5. Green lighting 6. Energy saving buildings 7. Coal-bed methane recovery and utilization 8. Biomass gasification 9. Wind energy 10. Solar thermal heat 11. Biogas 12. Waste heat and energy recovery 13. Village hybrid renewable energy (wind & PV) 14. High efficiency cook stoves 15. Alternative fuel transportation for urban regions 16. Small-scale hydropower 17. Combined cycle natural gas power generation 18. Central heating 19. Waste gas recovery
See Table 3-2. Sustainable, low-carbon technologies selected for ENTTRANS study (Chapter 3 of this report)
Final Set Priority technologies identified under ENTTRANS 1. Circulating Fluidised Bed Combustion (CFBC) 2. High Efficiency Motor 3. Boiler (increasing efficiency) 4. Wind power 5. Coal Bed Methane power generation
Yunnan 1. Energy saving lamps 2. Solar coolers 3. Clean-coal for large-scale power supply 4. Cement industry energy conservation 5. Hydropower through dams 6. Supercritical power plants 7. Iron & steel industry energy conservation 8. Coal-to-gas for large-scale power supply 9. Chemical industry energy conservation
Shandong 1. Clean-coal for large-scale power supply 2. Hydropower through dams 3. Energy saving lamps 4. Cement industry energy conservation 5. Solar coolers 6. Iron & steel industry energy conservation 7. Wind power for large-scale power supply 8. Solar cookers (for households) 9. Combustion of municipal solid waste
Conclusions
1. The EGTT approach starts from a wide range of technologies and deliberately focuses on a few high-priority options identified through a Multi criteria assessment. It is noticeable that despite the range of initial technologies considered the final list under the EGTT focuses purely on large-scale electricity supply options. This may be due to the bias from GHG cost efficiency and economies of scale but energy savings lamps are essentially no-regrets options so that that is difficult to reconcile. It may point to an inherent bias in the range of experts consulted.
2. The ENTTRANS approach recognises the geographical differences in a large country such as China and though there are many technologies in common between Shandong and Yunnan there are also several differences reflecting the regions’ more local concerns and needs.
87
3. For China, only two technologies, wind power and high efficiency boilers, were common to both the ENTTRANS analysis and the EGTT analysis, though one could argue that CFBC or ICGCC are both advanced clean coal technologies and so the overlap is greater.
4. Nevertheless, we would agree that an overall assessment of the sustainability benefits from the technologies as conducted under the EGTT is useful but that in practice the methodological approach could be improved (i) by relating the assessment to the local site conditions, and (2) by giving weights to the assessment criteria and applying sensitivity analysis to determine robust options. The AHP technique is also not recommended.
5. The technologies must also be placed in the context of an overall strategy to deliver the energy service needs, instead of just focussing on electricity. The EGTT approach to identify priority technologies does not necessarily consider the overall context of energy service delivery.
6. The aims of the first part of ENTTRANS in using the ESNA approach with a questionnaire was to identify energy service needs and priority technologies to meet those needs and in the process explore the perceptions within different countries. The aims and approach of ENTTRANS are therefore different to EGTT and not surprisingly give a different result. This indicates that decisions based on TNAs have to be carefully considered and a wider set of participants allowed to contribute to the EGTT TNA may be helpful as well as consideration of a new approach to avoid anchoring in existing technologies which is proposed in Chapter 5 of this report.
4.10. Problems with assessment of preferred technologies
As mentioned elsewhere in this Chapter, there are a number of limitations to the use of the ESNA approach. These are described below.
1. Awareness
There were large gaps in people’s awareness of a range of potentially useful technologies. There were two main aspects to this:
a) Some respondents had never heard of some technologies or did not know anything about specific technologies such as what it could deliver and whether it was available. This meant that they were not confident in making assessments so that potential technologies did not feature in the final lists. This can be seen in the country reporting of results from question 2 (selection of suitable technologies, see Annex 1) where a bias was identified when there were low scores due to lack of information on which to make an assessment. Discussions with respondents indicated that even if they knew something about the new technologies, they would need to see a project technology type actually up and running in the context of their own country before they could commit to considering it for future implementation. This means that the technology lists for what is needed might be biased by what technologies have already been implemented in the country. Based on the stakeholder responses, people seemed to be locked in to established technologies in the country context and ways of doing things. For instance, stakeholders did not give high ranks to solar space heating and cooling to replace electrically driven air conditioners in hot countries, mainly due to lack of knowledge and experience with the technology.
b) Short term/long term dimension – Some technologies are perceived to be available now while others are considered something for the future and therefore are rated lower because they are perceived as not so relevant in current planning considerations for the provision of energy services. Respondents did not seem to have sufficient information on the state of development and usage round the world of ‘new’ technologies.
88
2. Perception of costs
There also seemed to be an automatic assumption for developing countries that technologies which had not been used in their context before, were more expensive than existing technologies, riskier, and were therefore again not rated highly for that reason.
3. Historic experience
Another factor colouring the assessment of technologies was historic experience. If a new technology had been badly implemented for whatever reason, then this created an automatic bias against it for some respondents. Added to this is the fact that people tend to anchor in what they know and are familiar with, which implies that the adoption of new technologies has to overcome this resistance to change in the decision making process.
4. Power in the market and resistance to innovation
Another aspect is who is taking the decision on technology implementation and who is giving advice. Many existing systems tend to be grid electricity oriented and employ power engineers who are used to this system. As a result, ENTTRANS has found that the power engineers and those concerned in existing large energy supply companies are usually unwilling to consider decentralised energy production and may feel threatened by it. Conversely respondents in the solar industry tend to bias their replies towards solar. As pointed out by Winskel (2006) “Organisations operate in embedded socio-technical networks and tend to re-invest in established competences: disruptive technologies (e.g. renewable energy technologies) rarely make sense to incumbents so their development is left to outsider organsiations”
5. Cultural Aspects
Cultural aspects are also important in the success of technology transfer. For example, in Kenya it was found that a solar cooker pilot programme was not a success because people did not like to cook outside. They did not want others to see what they were cooking and there were problems of dust and dogs, etc. Also people usually eat in the evening, so the timing of the availability of solar cooking technology is not compatible with their lifestyles.
4.11. Conclusions and recommendations
1. The stakeholders consulted in each country were very skilled and had the objective of improving country performance. Their input was comprehensive and considered. The TNAs for each country vary in terms of potential adoption of low carbon technologies depending on the country conditions and resources and in terms of existing awareness of their options along with the other factors considered in Section 4.10 above. Few people are conversant with the state of play and potential of all the possible low-carbon technologies. However, there is no doubt that opportunities are being missed and this is explored further in the market mapping exercises in Chapter 5.
2. This lack of confidence in the practicality and affordability of low-carbon technologies in the country context and in the necessary timescales presents a major barrier for a low-carbon future.
3. From the assessment it has become clear that a TNA as currently applied by institutions are likely to be rooted in existing technologies and competences and existing powers in the market will resist perceived threats from ‘disruptive’ technologies. This is normal. Existing TNA exercises as currently formulated therefore cannot deliver the full range of technologies and the innovation needed to accelerate a move

89
to a low-carbon future as they ignore the influence of the factors above. This is in line with Innovation Systems theory as well as with studies carried out on innovation as described in the review in Chapter 5.
4. If innovation to low carbon technologies is to be accelerated then there has to be an approach which takes account of these problems in assessment while maintaining the level of participation that is required for buy in for any changes in direction made and to ensure that country priorities are met. This is discussed further in chapter 7.
5. In Kenya and in Chile coal has recently been discovered in the country and the large utilities are planning to move to coal technology and not necessarily clean-coal technology as costs will be a major factor in their investment decisions. There is therefore little time left before lock-in to a high-carbon future for some developing countries.
90
5. Technology Transfer Aspects: Mapping markets for technologies
5.1. Introduction to technology transfer
As explained in Chapter 3, the purpose of technology transfer under the UNFCCC Article 4.5 is to “…promote, facilitate, and finance as appropriate the transfer of, or access to, environmentally sound technologies and know how to other Parties particularly Developing Country parties to enable them to implement the provisions of the Convention”.
The key challenge in this respect is that low-carbon sustainable technologies need to be adopted both by developed as well as developing countries, which requires that developing countries avoid past unsustainable practices and being locked into old, less sustainable technologies. Instead, technology transfer should allow them to move quickly to environmentally sound and sustainable practices, institutions and technologies. The transfer or innovation process must be fast enough to reduce global vulnerability to climate change. In this process the CDM could play a key role as it is focussed on low(er) carbon technology transfers to developing countries.
The process of technology transfer is informed by a range of literature on technology transfer, innovation, development, behavioural change and economic development. This Section therefore draws on some of this literature and highlights aspects of special relevance to this study. In particular, the market mapping exercise discussed below extends the studies in this area in examining the networks for different technologies and sizes of technologies in a range of country contexts and in exploring the role of CDM in that process.
5.1.1. What is technology transfer and what is really transferred?
The IPCC report on Methodological and Technological Issues in Technology Transfer contains a broad definition of technology transfer. They define technology transfer in terms of a set of processes “covering the flows of know-how, experience and equipment, for mitigating and adapting to climate change amongst different stakeholders such as governments, private sector entities, financial institutions, NGOs and research/education institutions” (IPCC, 2000). Transfer includes diffusion of technologies and technological co-operation across and within countries and involves the process of “learning to understand, utilise and replicate the technology including the ability to decide which technology to transfer and adapt it to local conditions and integrate it with indigenous technologies”.
The term technology transfer refers to both the transfer of knowledge and of the hardware. Knowledge can be comprised of explicit technical scientific knowledge about the principles of how a technology might work. Such transfers also need to involve knowledge about the practicality of the technology to make it work under a range of circumstances. Then, when a technology is being transferred through an organisation, such as a manufacturer, there is tacit knowledge associated with the procedures associated with the organisation. For the host developing country, there are similar knowledge requirements with additional needs for people who can interface with the host country organisations and people who can understand and have knowledge about the systems into which the technology is being transferred with its supply and support chains.
Of course, knowledge is not enough for a complete transfer of the technology. There also needs to be consideration of the host country social capital for the skills and expertise needed and host country technology base in terms of manufacturing capacity, supply chain capacity, end-of-life/waste disposal,
91
institutional capacity and sustainability of the whole process and the social networks between them. For the technology innovation to deliver benefits to the communities within the host developing country, it is also imperative that local organisations buy themselves in the investment and that communities are involved in the technology implementation process.
IPCC (2000) considers only North-South transfers and breaks down some of the elements of the processes involved.
IPCC (2000) recognises a diversity of stakeholders in the process and identifies the following key actors: Project developers, Technology owners, Technology suppliers, Product buyers, Recipients, Users of the technology, Financiers and donors, Governments, International organisations, NGOs, and Community Groups.
They do not mention research organisations, trade organisations and educational institutions, though these are also important in supporting the transfer process.
IPCC (2000) points out that technology transfer can take place in a number of ways and lists the following: Directly between government agencies, Within vertically integrated firms, and Partnerships across a network of information service providers, business consultants and financial
firms.
In bringing in the idea of key actors and networks, they are extending the technology transfer system and this is explicitly addressed in the market mapping approach which has been used in this study and is described in Section 5.2.
The IPCC (2000) report also recognises that the pathways for transfer will depend on the country context, sector and type of technology and this is also recognised in the current study within the market mapping exercise in Section 5.2. However, they explicitly mention pathways for interaction, such as: Government assistance programmes, Direct purchases, Licensing, Foreign direct investment, Joint ventures, Co-operative research arrangements, Co production agreements, Education and training, and Government direct investment.
Moreover, in addition to the ways in which technology transfer can take place and the pathways for transfers, the IPCC report also identifies stages within the processes involved in technology transfer: Identification of needs,
92
Choice of technology, Assessment of conditions of transfer, Agreement, Implementation, Evaluation, Adjustment to local conditions, and Replication
It is emphasised that the processes are complex and not necessarily sequential. The final stages, from agreement to replication, represent the transfer to the local energy market and this is the focus of the market mapping exercise performed by ENTTRANS; the first stages, identification of needs and choice of technology, are comparable to the ESNA exercise in Chapter 4 of this study.
Barriers to technology transfer have been identified by many workers (Ellis and Kamel, 2007; IPCC, 2000) and these are discussed in detail in Sections 5.2 and 5.3. However, looking at the transfer processes as a system, particular to the type of technology, scale of the technology and country context, means that barriers are more related to blockages in the flows through the system or a lack of supporting and enabling institutions. This will be discussed in the coming sections.
The IPCC quite rightly emphasises that there is no fixed prescription for enabling technology transfer and that activities have to be grounded in the stakeholder and country context, as well as the technology scale and type. However, they focus on three main activities which are considered to make a significant contribution to overcoming barriers: Capacity building, Enabling environment, and Mechanisms for transfer.
First, it is worth looking at technology transfer in more detail from a conceptual view. In the following sections, some of the developments of the theories in this area and the implications of this review for technology transfer and the approach and results from this study are traced.
5.1.2. Technology Transfer and Innovation
The transfer of a sustainable energy technology involves a process of innovation into an existing energy system. In many studies (Lundvall et al., 2002), innovation, whether social or technical, has been studied from the point of view of an industrialised developed country with the innovation taking place within its existing systems. Technology transfer, on the other hand, involves innovation from one country to another country, which may be more or less well developed. The innovation chain involves both the processes of research and development and the commercialisation of the technology, including its social acceptance and adoption.
Innovation theory
The importance of social capital for successful innovation, in terms of the multiple stakeholder collaborative learning and knowledge transfer activities, has been pointed out by the National Systems of Innovation (NSI) approach developed by Lundvall et al. (2002). Other important aspects of such national innovation systems can be found at regional, technological and sectoral levels within a country. As Lundvall et al. (2002) point out, innovation system ideas are rooted in development theories (Hirschmann, 1958) and so it is appropriate to make a connection between technology transfer aspects to developing countries and development theories.
93
When analysing economic change in developing countries, development theories used to emphasise the role of institutions, whereas in developed countries markets were assumed to dominate. In developing the theory further, it became evident that the development of new technology was an interaction between the user sectors and the producer sectors within a country. However, in the context of technology transfers from industrialised to developing countries, such as with the CDM, one possible model is that less developed countries are the user sectors and industrialised countries the producer sectors. Other possibilities, of course, are that developing countries are both producers and users of technologies, such as in unilateral CDM and in South-South transfers. As Brewer (2007) points out, focussing on North-South transfers neglects the fact that some developing countries have climate-friendly technologies which could be transferred from South to North and also from South to South (e.g. technologies produced China and implemented in CDM projects in other countries in Southeast Asia).
Further studies on NSI showed that success in innovation relate to long-term and close interaction with external agents (Rothwell, 1977). It was also realised that trust, loyalty and power relationships of the players in the market are important (Lundvall, 1985). This led to the focus on ‘interactive learning’, which is the basis for the current focus on networks and mechanisms for innovation. It also supports the above-mentioned IPCC emphasis on the influence of differences in country contexts on technology transfer. For example, how firms and organisations from different countries interact depends on the differences between countries in terms of languages and mores, trust and transfer of tacit knowledge. In this respect, institutional aspects such as norms, habits and rules play an important role, as has been emphasised by Johnson (1992), who stated that institutions play a key role in the process of relationship building and building of trust and that the regulatory and legal environment round an existing market, such as property rights, contract laws corporate law arbitration, and labour market institutions will have an effect on this.
Innovation systems have two main dimensions: the structure of the system and the institutional set up. The structure of the system is concerned about what is produced and what are the competences developed by the system, while the institutional aspect is concerned with how the production innovation and learning actually occurs within the system.
Lundvall (1985) specifically recommends the NSI approach for less developed countries as innovations are based on everyday activities in firms and abilities of ordinary people. However, he emphasises that the rate of change based on short-term financial criteria in markets has serious consequences for maintaining the social capital upon which the development of intellectual capital depends. In his view, the short-term financial focus ignores the value of longer-term ecological implications and this has a negative impact on the innovation system.
Innovation according to Schumpeter (1939) would involve firstly the demonstration of a technology and then the diffusion of the technology in space and over time. Thus, a new ‘technology’ is adopted by the market and is disseminated throughout that market. As we have seen, the process of adoption is complex and also involves some behavioural change on the part of the receiver. This means that people must make an effort to actively seek out and adopt the technology and adapt to its requirements. The efficiency of this adoption process will depend on people’s experience, values and perceptions, but also on the economic, social and political environment.
Rogers and Shoemaker (1971) and Ostland (1973-4) developed a sociological/psychological theory of diffusion of innovations which has been widely applied to innovation of new technologies. Rogers (1983) defines diffusion as: “the process by which an innovation is communicated through certain channels over time among the members of a social system.” He derives three concepts from the theory: diffusion, adoption and innovativeness. Adoption refers to the famous S-shaped curve where the innovation, e.g. the technology, is adopted by more and more of the social system until it saturates the system. The rate of diffusion of the technology is the time taken to move from low numbers of adoption to the saturated level
94
as also described by Gruebler (1997). Innovativeness is related to the personal characteristics of the individual who may be willing to change. Five stages of ‘innovativeness’ for individuals are identified and these stages correspond to the S-shaped diffusion curve (Rogers 1983). These stages are as follows: 1. Innovators (first to adopt), 2. Early adopters, 3. Early majority, 4. Late majority, and 5. Laggards (last to adopt).
A review of the application of diffusion theory is provided by Rogers (1983, 1995, 2003). Key factors in the adoption process, which will affect the outcome, are identified. These factors include personality traits, attitudes, and socio-demographic factors, the nature of the social system, and their perception of the attributes of the innovation. These in turn require consideration of the communication system between the social actors and also the constraints of the social system. Social psychology is concerned with the links between the individual and society. Rogers (1983), like Lundvall, emphasises the social processes involved in diffusion and the nature of the social system. He proposes that system norms which reflect cultural patterns of behaviour have an important role in determining responses to innovation. Thus studying local practices and the barriers that these produce as well as incentives for adoption of an innovation can provide a foundation for progress in innovation acceptability and acceleration compared to the normal top down approach.
Rogers and shoemaker (1971) also introduced five types of perceptions which they identified from their study of innovations. These perceptions will have an affect on the decision to adopt the innovation and will thus affect the overall rate of adoption. The perception of the innovation is affected by the following psychological characteristics: Relative advantage: the perception of how much better the innovation is relative to the status quo, Compatibility: the perception of how well the innovation fulfils the person’s needs, values and past
experience, Complexity: How easy it is to understand and use, Trialability: The possibility of being able to try out the innovation on a limited basis before adoption,
and Observability: How clearly can the results of the innovation be seen?
The work of Bauer (1960) and Ostland (1973-4) has added to this list the characteristic of risk: the expected probability of economic personal or social problems resulting from adoption (see also Guagnano et al, 1986). This can be modified to perceived risk: which is the perception of the social, physical and functional risks of the innovation (Shama and Wisenbilt, 1984).
Rogers and Shoemaker(1971) also found that the relative importance of relative advantage, compatibility, trialability and observability were higher compared to perceived risks and complexity for adopters. Demographic factors were also found to be important with age and income being key. Young and highly educated professionals on high incomes tended to be adopters.
Observability and trialability have been the subject of contention as some studies failed to find these aspects important. However, this is technology dependent and further work understanding the role of demonstration programmes was conducted by Shama and Wisenbilt (1984) and Leonard-Barton (1981). This is important in terms of accelerating innovation and the findings within the country studies described in chapter 4 on the expressed need to see technologies in action within the country context.
Developments from Rogers’ original work linked diffusion theory with social network theory (Darley and Beninger, 1981) to account for the social intractions which also affect the decision to adopt and innovate. This links to the work of Lundvall on national systems of innovation. In addition, the six factors identified
95
above (including risk) can be disaggregated into subfactors which can explore the complexity of the decisions being made. Trialability, however, was distinct in this respect.
Shama and Wisenbilt (1984) postulated a refinement of the factors based on a review of the literature and the studies carried out. These are: 1. Economic feasibility, 2. Reliability, maintenance and safety, 3. Legal and regulatory issues, and 4. Regional aspects.
One of his insights was that financial barriers may not be a good indicator as such as what is important is the relative advantage over the status quo which he pointed out will only be manifest over time. Using life cycle costing with energy savings and payback times is problematic as it involves consideration of system efficiency, location, energy prices, income level and uncertainties in future prices for energy services.
Hobday (1997) points out that successful developing countries are good at linking into the national systems of innovation in developed countries. The NSI approach with its focus on norms, habits and rules within a country is particularly useful where there is a need to take account of local and traditional knowledge. In many developing countries, such knowledge is largely not documented and lodged solely in local competences (Ernst and Lundvall, 1997). Lundvall et al. (2002) stress that the approach has been applied mainly to industrialised countries and it will be important to consider the effect of globalisation on the possibilities to build innovation systems in developing countries.
An aspect that has been identified as currently lacking in the NSI approach, is that it does not handle the potential for power struggles and conflicts over income within the innovation interactive learning focus. Such problems could offset the co-operation and communication aspect of innovation development, or as Gu and Lundvall (2006) state: “interactive learning possibilities can be blocked and competences destroyed for political reasons” and “counteractive policies are needed as is stability in the financial and macroeconomic fiscal and monetary policies”. To further improve innovation systems, there is a need for long-term competence building in firms and society. Gu and Lundvall (2006) recommend a cross-policy strategy with elements from social, employment, education, science, energy and environmental industrial, energy and environmental policies. Banks and financial ministries, he suggests, are not the best people to do this.
Gu and Lundvall (2006) propose that production capital and intellectual capital are easily reproduced, but that natural and social capital are not. Therefore, focussing only on production and intellectual capital and neglecting natural and social capital is not sustainable.
The above has shown that innovation systems theory has developed from analysis of existing systems in the industrialised countries to a focus on the role of social capital in the form of multi-stakeholder networks for collaboration, interactive learning and transfer. However, it should not be applied directly to developing countries without taking account of their particular context.
Gu and Lundvall (2006) suggested that the main requirements for innovation within a country are: Formal rules in market regulations and planning, Informal norms rules and values that shape collaboration ways or compete, Strong and diversified systems, Well developed structural and institutional support, e.g. legal, education, regulatory, Competence building systems, Interactive learning systems ‘where agents communicate and cooperate in the creation and utilisation of
new economically useful knowledge’, and Capacity building for learning for all levels of society.
96
Conflict can arise because something is replaced and power and income can be lost from one set of people and transferred to innovators. There can be deliberate moves to block the innovation process for this reason. Policies to minimise these opportunities are needed, in particular in developing countries which may be more vulnerable to this. In addition, in international co-operation aspects, issues of knowledge transfer can emerge, such as in the case of monopolistic electricity utilities blocking market entry for renewable technologies.
With respect to the role of energy technologies in innovation, studies have shown that energy systems are subject to inertia and lock-in effects (Unruh, 2000, 2002) and that introduction of renewable energy technologies involves informal organisational and behavioural norms (Karnoe, 1996). Winskel et al. (2006) show that “Organisations operate in embedded socio-technical networks and tend to re-invest in established competences: disruptive technologies [e.g. renewable energy technologies] rarely make sense to incumbents so their development tends to be left to small outsider organisations.” This is an important observation which is reflected in the results of ENTTRANS where stakeholders interviewed in the case-study countries have given low priority to technologies that they were not familiar with (see Chapter 4). This in turn has implications on how technology transfer processes should proceed.
Therefore, it has been argued that policy interventions are needed to make firms consider alternative energy technologies (Rip and Kemp, 1998). According to Reijnders (2002), there is a need for policy to support a technology push and feed-in market pull for effective system building. Therefore, widespread support for renewables at the preparatory stage is an essential precursor for policy intervention to facilitate industrial growth.
Studies of other energy systems also indicate that developing a new technology requires a long period of learning and network building in the experimental phase with sustained policy support to maintain a range of different designs and to avoid lock-in round unsuccessful designs. According to Bergek and Jacobsson (2002), creating and maintaining this ‘Design Variety’ requires an inclusive style of system building. Social acceptance plays an increasing role in the market development of an innovation. Wustenhagen et al. (2007) postulated that there are three main elements of social acceptance: a broad general public acceptance in principle for renewable energy technologies, effective policies for new investors, and collaborative decision making on spatial planning.
5.1.3. Technology transfer and economic growth
Gruebler (1997) examined the process of technology transfer in terms of the patterns of diffusion of innovation at a macro level. He found that, for a range of technological innovations, they all followed the three stages of invention, diffusion and saturation, as identified earlier by Schumpeter (1939). He also uses the well-known S-shape diffusion curve (Hobshawn and Rude, 1968) for social or technological change to show that the time between the initial invention/demonstration to adoption varies with how radical the change is in terms of the sociological and organisational and institutional system changes involved. In addition, these innovations were accompanied by other critical innovations. For example, the development of road systems goes in parallel with the development of oil pipelines for supplying the fuel for the cars. Gruebler (1997) also showed that diffusion is also a spatial phenomenon with areas that adopt an innovation later, do so faster, but with less penetration.
Gruebler (1997) points out that the cycle of invention, diffusion and saturation followed by a new invention which substitutes for the original ‘technology’ tends to go through a period of crisis in transitional periods when the old system is saturating and the new is still at the early stages of innovation. Saturation leads to a decline in the rate of technical and social change leading to a slowdown in economic growth. This transitional period lasts for some time before a period of accelerating rates of change occurs. These economic growth periods seem to correlate with the emergence of a cluster of interrelated innovations
97
leading to new products, markets, industries and infrastructures supported by social and organisational processes.
5.1.4. Summary of insights from the literature
The review has provided many insights for technology transfer to developing countries. Energy systems in most developing countries, even in least developed countries, tend to have large-scale infrastructure and institutional inertia, similar to those in industrialised countries. Changing investments in energy infrastructure to low-carbon alternatives and more decentralised energy generation and making industry more efficient could be hampered by ingrained habits and training, as well as pressures from industrialised countries to buy their older technologies.
If there is a possibility of leapfrogging, then concerted efforts would need to be made to overcome the lag times built into changing long-term infrastructure systems or of circumventing them. Currently available high-carbon or older technologies tend to be cheaper and more affordable for developing countries and play to the existing experience and know how.
The role of social capital in terms of the multi-stakeholder networks in innovation systems needs to be recognised and explicitly fostered. Lundvall et al. (2002) warn that short-term financial criteria can undermine this resource and that natural and social capital cannot easily be renewed.
Power and lack of trust in markets can block change as can be seen in the behaviour of monopolistic electricity utilities (whether overtly privatised or not) towards distributed energy and new sources and the use of intellection property and other methods for blocking innovation. Gruebler (1997) showed that economic losses from innovations will affect some existing market players who will therefore resist innovation. As Winskel et al. (2006) point out “Organisations operate in embedded socio-technical networks and tend to re-invest in established competences: disruptive technologies e.g. renewable energy technologies rarely make sense to incumbents so their development tends to be left to small outsider organisations.”
The need for the country and technology context has been shown in the NSI approach to be grounded in the institutional settings within the country relating to cultural norms and rules and firm-to-firm interactions.
Rogers’ work on the key factors affecting perceptions for decisions to adopt an innovation showed that these included relative advantage, compatibility, complexity, observability, trialability and risk. Early adopters tended to be young, highly educated professionals. The findings within the country studies described in Chapters 4 on the expressed need to see technologies in action within the country context indicate that in the technology transfer context that this may be an important factor in terms of accelerating innovation.
These key perceptions of new technologies therefore need to be addressed, and, in addition, awareness of the existence of the new options. In the short term, small-scale new technologies may have more opportunity to enter these markets.
Presently, the CDM concentrates on single projects (as shown in Chapter 2), mostly in isolation of the host country’s national and technology context, and does not address technology transfer on any scale. It currently does not foster the supporting systems needed to enhance adoption of a new technology, and it can therefore only address part of the process. The isolated installation of projects is useful for only the very early stage of demonstration of an invention, but the real technology transfer processes will require much more effort.
Chapter 7 will provide insights into how the CDM could be adapted to deliver more technology transfer through improvement of the country system for adoption of low-carbon technologies. In this analysis it is
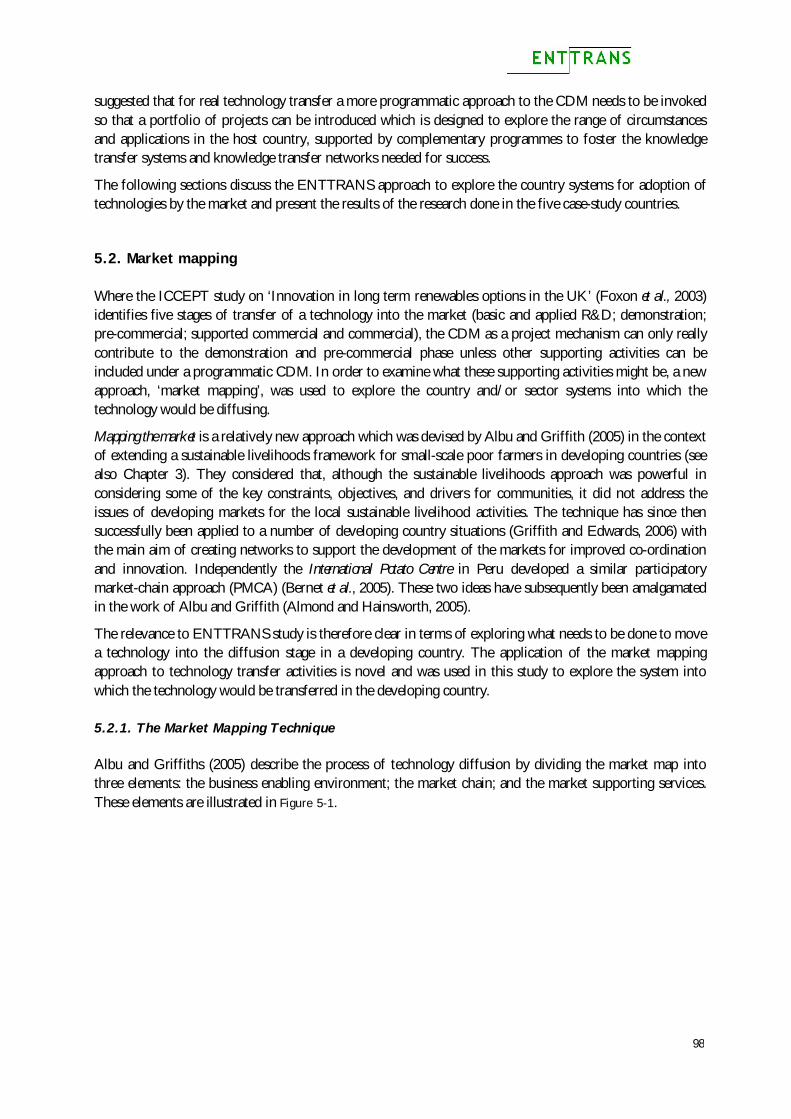
98
suggested that for real technology transfer a more programmatic approach to the CDM needs to be invoked so that a portfolio of projects can be introduced which is designed to explore the range of circumstances and applications in the host country, supported by complementary programmes to foster the knowledge transfer systems and knowledge transfer networks needed for success.
The following sections discuss the ENTTRANS approach to explore the country systems for adoption of technologies by the market and present the results of the research done in the five case-study countries.
5.2. Market mapping
Where the ICCEPT study on ‘Innovation in long term renewables options in the UK’ (Foxon et al., 2003) identifies five stages of transfer of a technology into the market (basic and applied R&D; demonstration; pre-commercial; supported commercial and commercial), the CDM as a project mechanism can only really contribute to the demonstration and pre-commercial phase unless other supporting activities can be included under a programmatic CDM. In order to examine what these supporting activities might be, a new approach, ‘market mapping’, was used to explore the country and/or sector systems into which the technology would be diffusing.
Mapping the market is a relatively new approach which was devised by Albu and Griffith (2005) in the context of extending a sustainable livelihoods framework for small-scale poor farmers in developing countries (see also Chapter 3). They considered that, although the sustainable livelihoods approach was powerful in considering some of the key constraints, objectives, and drivers for communities, it did not address the issues of developing markets for the local sustainable livelihood activities. The technique has since then successfully been applied to a number of developing country situations (Griffith and Edwards, 2006) with the main aim of creating networks to support the development of the markets for improved co-ordination and innovation. Independently the International Potato Centre in Peru developed a similar participatory market-chain approach (PMCA) (Bernet et al., 2005). These two ideas have subsequently been amalgamated in the work of Albu and Griffith (Almond and Hainsworth, 2005).
The relevance to ENTTRANS study is therefore clear in terms of exploring what needs to be done to move a technology into the diffusion stage in a developing country. The application of the market mapping approach to technology transfer activities is novel and was used in this study to explore the system into which the technology would be transferred in the developing country.
5.2.1. The Market Mapping Technique
Albu and Griffiths (2005) describe the process of technology diffusion by dividing the market map into three elements: the business enabling environment; the market chain; and the market supporting services. These elements are illustrated in Figure 5-1.
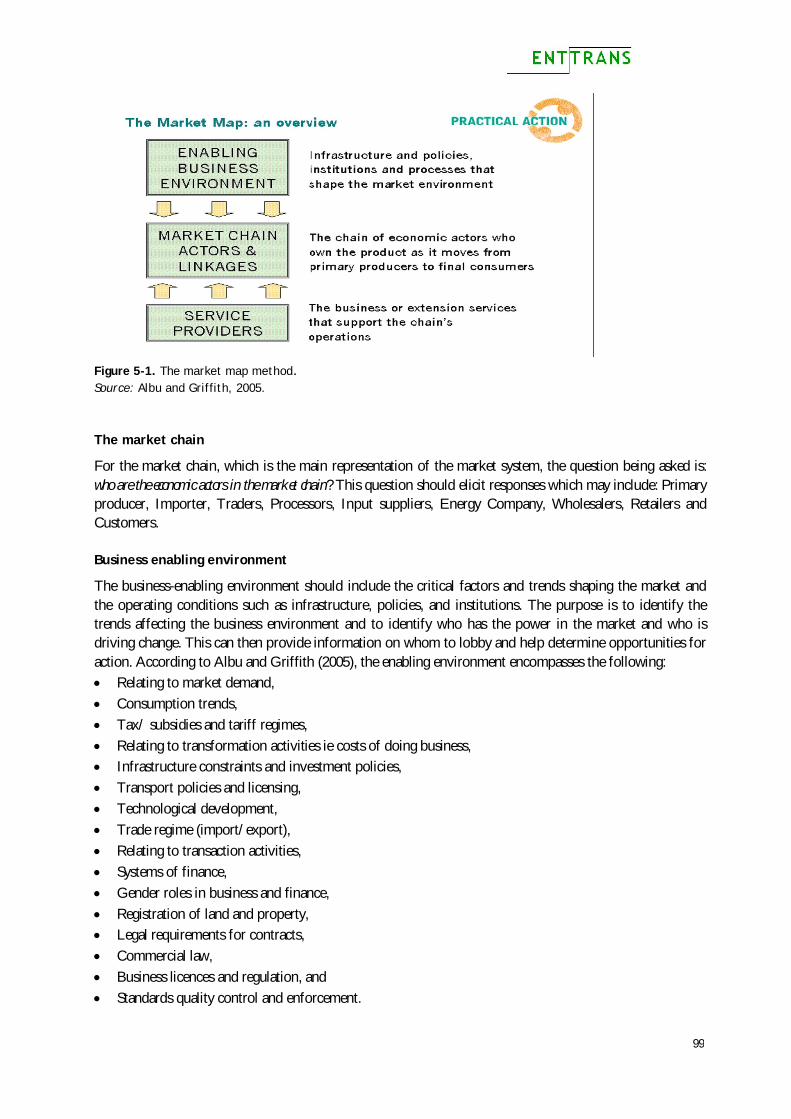
99
Figure 5-1. The market map method. Source: Albu and Griffith, 2005.
The market chain
For the market chain, which is the main representation of the market system, the question being asked is: who are the economic actors in the market chain? This question should elicit responses which may include: Primary producer, Importer, Traders, Processors, Input suppliers, Energy Company, Wholesalers, Retailers and Customers.
Business enabling environment
The business-enabling environment should include the critical factors and trends shaping the market and the operating conditions such as infrastructure, policies, and institutions. The purpose is to identify the trends affecting the business environment and to identify who has the power in the market and who is driving change. This can then provide information on whom to lobby and help determine opportunities for action. According to Albu and Griffith (2005), the enabling environment encompasses the following: Relating to market demand, Consumption trends, Tax/ subsidies and tariff regimes, Relating to transformation activities ie costs of doing business, Infrastructure constraints and investment policies, Transport policies and licensing, Technological development, Trade regime (import/export), Relating to transaction activities, Systems of finance, Gender roles in business and finance, Registration of land and property, Legal requirements for contracts, Commercial law, Business licences and regulation, and Standards quality control and enforcement.
100
Supporting Services
Supporting services are the business and extension service providers supporting the market chain. The linkages to the market chain are shown in Figure 5-2 to complete the market map. The purpose is to identify the needs for services and who the users are. This gives insights on what can be done in terms of supporting services to make the market more efficient. Such services are myriad but can include financial services, quality control, technical expertise and market information services, etc.
Figure 5-2. An example market map Source: Albu and Griffith, 2005.
5.2.2. The market mapping process
The market mapping exercise takes place in a three-stage process involving: a. The creation of a preliminary map using existing knowledge by the research team members. This may
or may not be necessary. If there is a shortage of time, this can be helpful as the basis for discussions. On the other hand, it may act to anchor the participants in a particular model which is not the same as their perceptions of the system. In ENTTRANS, this was used in some cases where time was very short.
b. A participatory process to engage the market players: (i) to identify incentives for engagement in the exercise; (ii) to form market opportunity groups of representatives through whom a large number of small
producers or other market actors can be represented; and (iii) to conduct a PCMA to create a market map while also building trust and negotiating and
networking.
101
In the ENTTRANS exercise, due to time and budget limitations the focus has been mainly on (iii), though there was some element of (i) in the preparation of the invitations to the workshops held in the case-study countries. For small-scale technologies, depending on the numbers of existing players step (ii) might be required.
c. An action phase resulting from the formation of a functioning network of market actors based on the relationships formed and the trust engendered. By necessity, this last phase has to be taken up by the country stakeholders as an ongoing activity beyond the contractual scope of the ENTTRANS study.
Thus, market mapping involves a process of identification of market stakeholders, identification of incentives for engagement by these stakeholders in the technology diffusion process and then a series of meetings with stakeholders to generate a detailed map of the system in which they operate to identify opportunities to increase the efficiency of the operation of the market and opportunities for development and co-operation. The outcome of the overall process is the creation of a network of market actors able to carry this forward into the future and deal with new problems and make changes as required. The main aim is to create a network that is able to explore the system and identify and meet the system’s challenges.
The insights into the system gained in the process are the basis for future development and can give some indication of the directions for supporting activities for technology transfer.
Finally, it must be noted that in carrying out the workshops in the ENTTRANS case-study countries for the PCMA, it became obvious that markets for technology transfer could be very different, as there could be a market for large-scale energy technologies, and one for small-scale energy technologies. Both types of markets are explored further in the results from the Workshops described in the next Section.
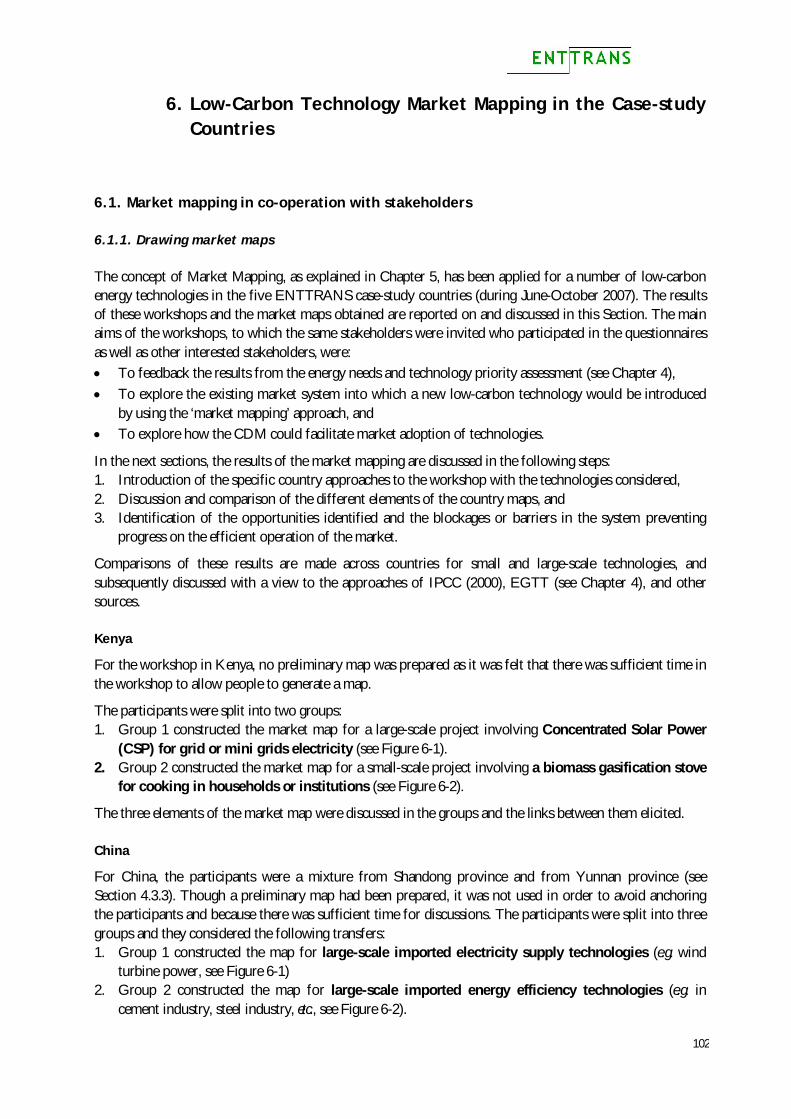
102
6. Low-Carbon Technology Market Mapping in the Case-study Countries
6.1. Market mapping in co-operation with stakeholders
6.1.1. Drawing market maps
The concept of Market Mapping, as explained in Chapter 5, has been applied for a number of low-carbon energy technologies in the five ENTTRANS case-study countries (during June-October 2007). The results of these workshops and the market maps obtained are reported on and discussed in this Section. The main aims of the workshops, to which the same stakeholders were invited who participated in the questionnaires as well as other interested stakeholders, were: To feedback the results from the energy needs and technology priority assessment (see Chapter 4), To explore the existing market system into which a new low-carbon technology would be introduced
by using the ‘market mapping’ approach, and To explore how the CDM could facilitate market adoption of technologies.
In the next sections, the results of the market mapping are discussed in the following steps: 1. Introduction of the specific country approaches to the workshop with the technologies considered, 2. Discussion and comparison of the different elements of the country maps, and 3. Identification of the opportunities identified and the blockages or barriers in the system preventing
progress on the efficient operation of the market.
Comparisons of these results are made across countries for small and large-scale technologies, and subsequently discussed with a view to the approaches of IPCC (2000), EGTT (see Chapter 4), and other sources.
Kenya
For the workshop in Kenya, no preliminary map was prepared as it was felt that there was sufficient time in the workshop to allow people to generate a map.
The participants were split into two groups: 1. Group 1 constructed the market map for a large-scale project involving Concentrated Solar Power
(CSP) for grid or mini grids electricity (see Figure 6-1). 2. Group 2 constructed the market map for a small-scale project involving a biomass gasification stove
for cooking in households or institutions (see Figure 6-2).
The three elements of the market map were discussed in the groups and the links between them elicited.
China
For China, the participants were a mixture from Shandong province and from Yunnan province (see Section 4.3.3). Though a preliminary map had been prepared, it was not used in order to avoid anchoring the participants and because there was sufficient time for discussions. The participants were split into three groups and they considered the following transfers: 1. Group 1 constructed the map for large-scale imported electricity supply technologies (e.g. wind
turbine power, see Figure 6-1) 2. Group 2 constructed the map for large-scale imported energy efficiency technologies (e.g. in
cement industry, steel industry, etc., see Figure 6-2).
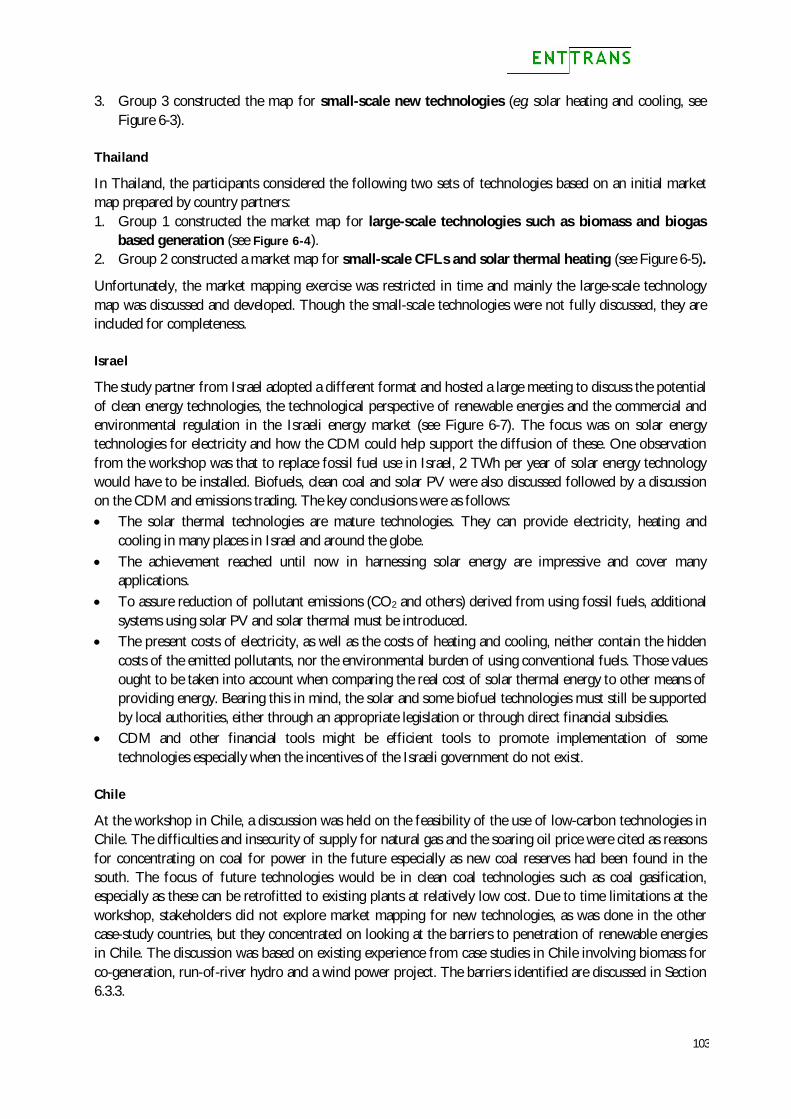
103
3. Group 3 constructed the map for small-scale new technologies (e.g. solar heating and cooling, see Figure 6-3).
Thailand
In Thailand, the participants considered the following two sets of technologies based on an initial market map prepared by country partners: 1. Group 1 constructed the market map for large-scale technologies such as biomass and biogas
based generation (see Figure 6-4). 2. Group 2 constructed a market map for small-scale CFLs and solar thermal heating (see Figure 6-5).
Unfortunately, the market mapping exercise was restricted in time and mainly the large-scale technology map was discussed and developed. Though the small-scale technologies were not fully discussed, they are included for completeness.
Israel
The study partner from Israel adopted a different format and hosted a large meeting to discuss the potential of clean energy technologies, the technological perspective of renewable energies and the commercial and environmental regulation in the Israeli energy market (see Figure 6-7). The focus was on solar energy technologies for electricity and how the CDM could help support the diffusion of these. One observation from the workshop was that to replace fossil fuel use in Israel, 2 TWh per year of solar energy technology would have to be installed. Biofuels, clean coal and solar PV were also discussed followed by a discussion on the CDM and emissions trading. The key conclusions were as follows: The solar thermal technologies are mature technologies. They can provide electricity, heating and
cooling in many places in Israel and around the globe. The achievement reached until now in harnessing solar energy are impressive and cover many
applications. To assure reduction of pollutant emissions (CO2 and others) derived from using fossil fuels, additional
systems using solar PV and solar thermal must be introduced. The present costs of electricity, as well as the costs of heating and cooling, neither contain the hidden
costs of the emitted pollutants, nor the environmental burden of using conventional fuels. Those values ought to be taken into account when comparing the real cost of solar thermal energy to other means of providing energy. Bearing this in mind, the solar and some biofuel technologies must still be supported by local authorities, either through an appropriate legislation or through direct financial subsidies.
CDM and other financial tools might be efficient tools to promote implementation of some technologies especially when the incentives of the Israeli government do not exist.
Chile
At the workshop in Chile, a discussion was held on the feasibility of the use of low-carbon technologies in Chile. The difficulties and insecurity of supply for natural gas and the soaring oil price were cited as reasons for concentrating on coal for power in the future especially as new coal reserves had been found in the south. The focus of future technologies would be in clean coal technologies such as coal gasification, especially as these can be retrofitted to existing plants at relatively low cost. Due to time limitations at the workshop, stakeholders did not explore market mapping for new technologies, as was done in the other case-study countries, but they concentrated on looking at the barriers to penetration of renewable energies in Chile. The discussion was based on existing experience from case studies in Chile involving biomass for co-generation, run-of-river hydro and a wind power project. The barriers identified are discussed in Section 6.3.3.
Other Local Suppliers
Local Producers: Manufacturers of absorbers and collectors
External Producers for heat transfer fluids and turbines
Shippers Transporters
Local and International contractors
Power Producers
IPPs Minigrids Local generators
Power Transmission and Distribution KPLC
Consumers
Importers
No demand reserves on elec
Manufacturing inspection costs
Govt. support for critical info colln
Transparency
Communities
Privatisation competition
Govt Target for RE Govt. red tape eg
Licences, import bureaucracy
Int. Org Incentives eg REEEP
Environmental policies
Rural 15% access
KAM/GEF EEFF industry 2007
Infrastructure in North
Insecurity and unreliability of elec supply
Rural Policy not integrated
Elect tariffs will increase
Licences over 100MW
Growth in demand 7%pa
Consumer levies/ taxes CC opps
Nairobi 50%
Feasibility study funding insurance
Extend Govt Risk Support eg guarantees, security , new entrants
R&D Arbitration Ombudsman consumer rights
Codes and Standards
Professional Engineering Services
ODA
Legal services Eg comm. Lawyers, Co. reg.
Financial Services for investments eg coop, ADB, REEEP
Supplementary Funding eg CDCF
Figure 6-1. Group 1 Kenya - market map for large-scale CSP
105
Tech Owner
Installers
Retailer
Competitors
Other local supplier
Promoter Stockist
Financiers
Supplier raw material
Biomass Supply
Distributor
Importer
Transporters
Producer Service Agents
Capacity building on design
Marketing and Media
Good existing distr.network Infrastructure
Tax incentives & policies
Trade Policies
Quality Control need
Good Production infrastructure
Govt. Depts MOTI/MoEn/MoENV
Energy Policy
Science and Technology Policies
Environment Policies
Standard and COP enforcement
Mitigate high perceived risk
Organisation to drive process (KAM)
Anti-dumping
Enforcement of EMCA
Trade Laws
Industry Associations KRA/KEBS/ KIRDI//KFS
Import regime
Access to Credit
Low purchasing power problem
Research & Training
Sales Reps Insurance
Pre- shipment inspections
Govt. ministries MoA
Banks and financial institutions
Extension Workers
Clear and fwd agency
Figure 6-2. Group 2 Kenya - market map for small-scale biomass gasification stoves CSP
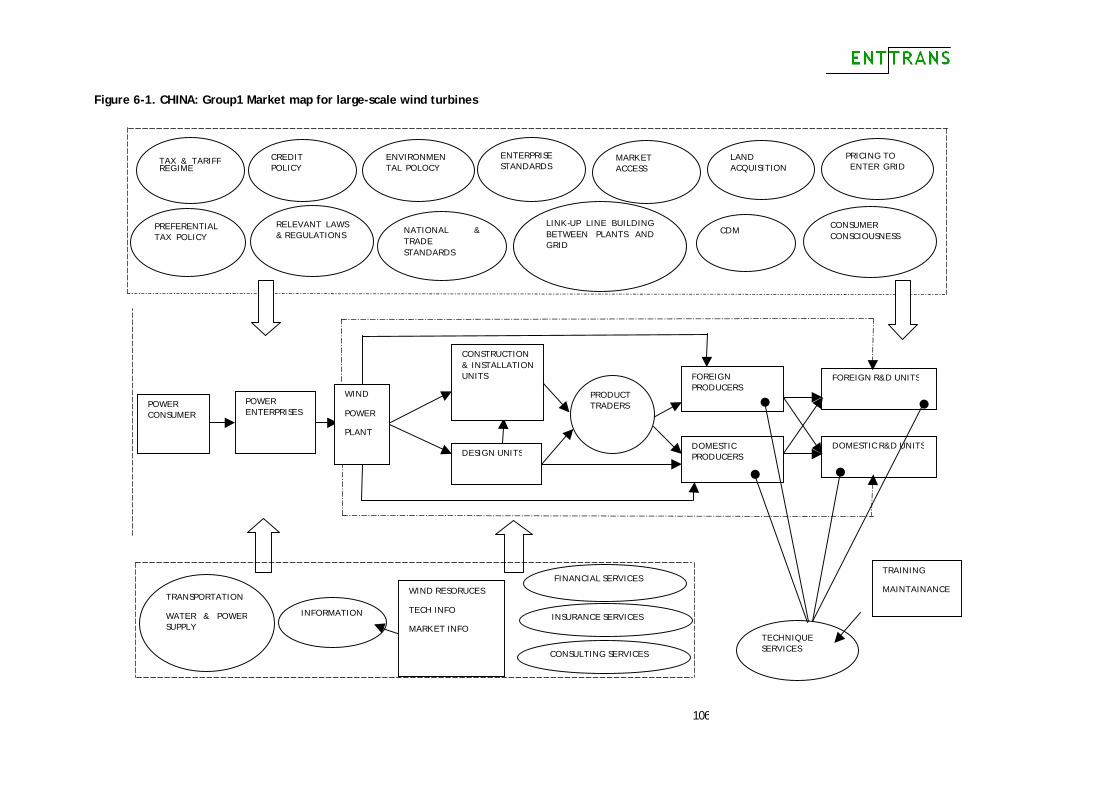
106
Figure 6-1. CHINA: Group1 Market map for large-scale wind turbines
LAND ACQUISITION
CDM LINK-UP LINE BUILDING BETWEEN PLANTS AND GRID
MARKET ACCESS
ENTERPRISE STANDARDS
NATIONAL & TRADE STANDARDS
ENVIRONMENTAL POLOCY
RELEVANT LAWS& REGULATIONS
CREDIT POLICY
TAX & TARIFF REGIME
PREFERENTIAL TAX POLICY
CONSUMER CONSCIOUSNESS
PRICING TO ENTER GRID
TRANSPORTATION
WATER & POWER SUPPLY
FINANCIAL SERVICES
INSURANCE SERVICES INFORMATION
WIND RESORUCES
TECH INFO
MARKET INFO
FOREIGN PRODUCERS
DOMESTIC PRODUCERS
FOREIGN R&D UNITS
DOMESTIC R&D UNITS DESIGN UNITS
CONSTRUCTION & INSTALLATION UNITS
WIND
POWER
PLANT
POWER ENTERPRISES
POWER CONSUMER
PRODUCT TRADERS
TECHNIQUE SERVICES CONSULTING SERVICES
TRAINING
MAINTAINANCE
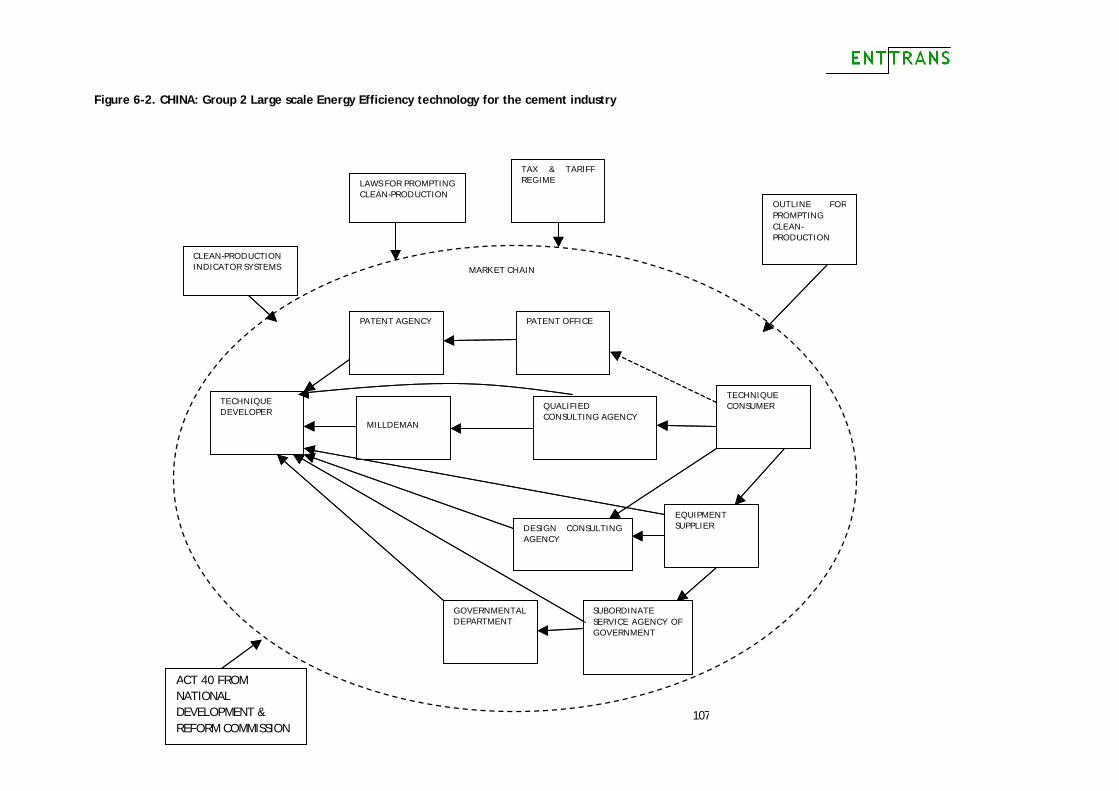
107
Figure 6-2. CHINA: Group 2 Large scale Energy Efficiency technology for the cement industry
EQUIPMENT SUPPLIER DESIGN CONSULTING
AGENCY
QUALIFIED CONSULTING AGENCY
MILLDEMAN
PATENT OFFICE PATENT AGENCY
TECHNIQUE CONSUMER TECHNIQUE
INVENTOR
CLEAN-PRODUCTION INDICATOR SYSTEMS
OUTLINE FOR PROMPTING CLEAN-PRODUCTION
TAX & TARIFF REGIME LAWS FOR PROMPTING
CLEAN-PRODUCTION
SUBORDINATE SERVICE AGENCY OF GOVERNMENT
GOVERNMENTAL DEPARTMENT
MARKET CHAIN
EQUIPMENT SUPPLIER DESIGN CONSULTING
AGENCY
QUALIFIED CONSULTING AGENCY
MILLDEMAN
PATENT OFFICE PATENT AGENCY
TECHNIQUE CONSUMER TECHNIQUE
DEVELOPER
CLEAN-PRODUCTION INDICATOR SYSTEMS
OUTLINE FOR PROMPTING CLEAN-PRODUCTION
TAX & TARIFF REGIME LAWS FOR PROMPTING
CLEAN-PRODUCTION
SUBORDINATE SERVICE AGENCY OF GOVERNMENT
GOVERNMENTAL DEPARTMENT
MARKET CHAIN
ACT 40 FROM NATIONAL DEVELOPMENT & REFORM COMMISSION
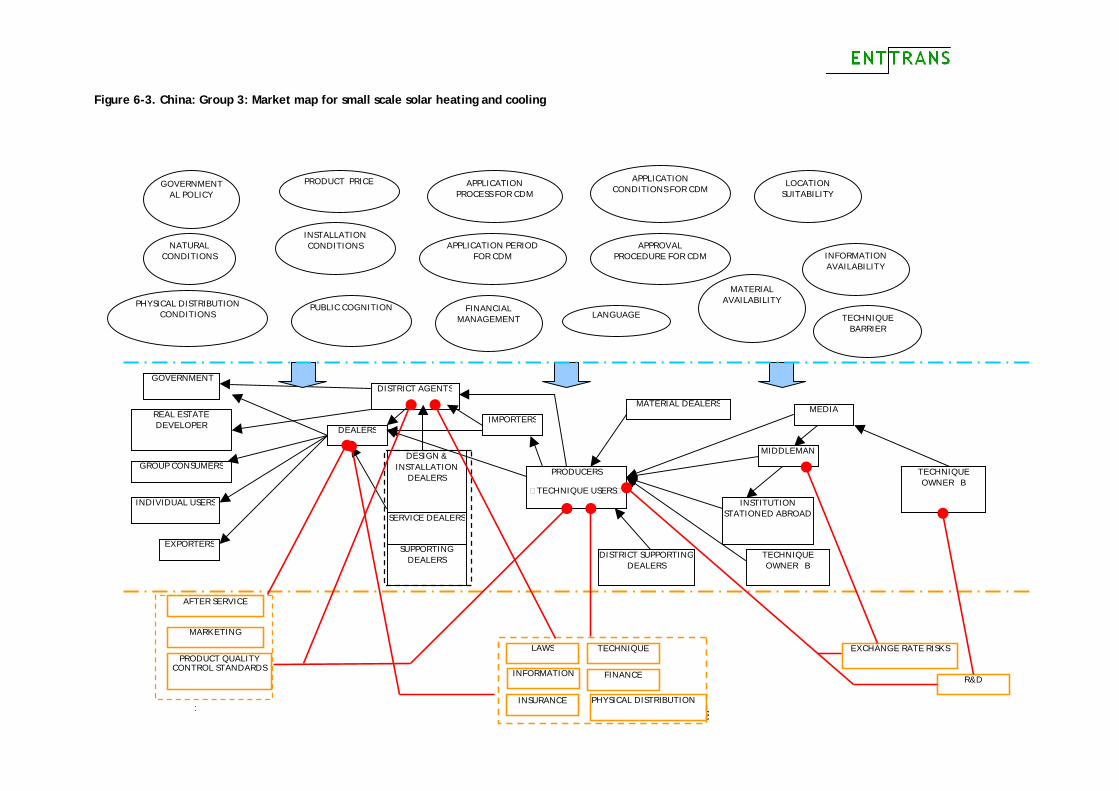
108
Figure 6-3. China: Group 3: Market map for small scale solar heating and cooling
TECHNIQUE BARRIER
GOVERNMENT
REAL ESTATE DEVELOPER
GROUP CONSUMERS
INDIVIDUAL USERS
EXPORTERS
PRODUCERS
�TECHNIQUE USERS�
IMPORTERS
DISTRICT AGENTS
DESIGN & INSTALLATION
DEALERS
DEALERS
SERVICE DEALERS
SUPPORTING DEALERS
TECHNIQUE OWNER B
TECHNIQUE OWNER B
MEDIA
MIDDLEMAN
INSTITUTION STATIONED ABROAD
DISTRICT SUPPORTING DEALERS
MATERIAL DEALERS
INFORMATION AVAILABILITY
MATERIAL AVAILABILITY
LOCATION SUITABILITY
APPLICATION PROCESS FOR CDM
APPLICATION CONDITIONS FOR CDM
APPLICATION PERIOD FOR CDM
APPROVAL PROCEDURE FOR CDM
FINANCIAL MANAGEMENT LANGUAGE
GOVERNMENTAL POLICY
PRODUCT PRICE
NATURAL CONDITIONS
INSTALLATION CONDITIONS
PHYSICAL DISTRIBUTION CONDITIONS
PUBLIC COGNITION
PRODUCT QUALITY CONTROL STANDARDS
LAWS EXCHANGE RATE RISKS
INFORMATION
TECHNIQUE
AFTER SERVICE
PHYSICAL DISTRIBUTION INSURANCE
MARKETING
FINANCE R&D
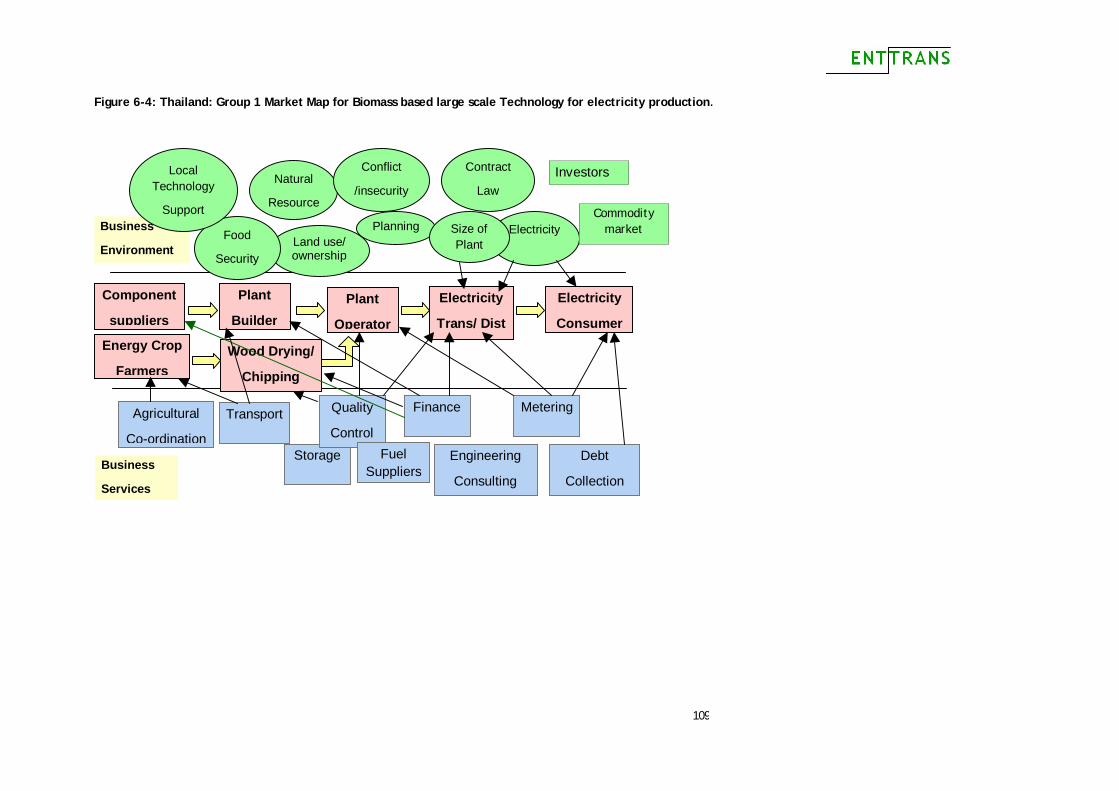
109
Figure 6-4: Thailand: Group 1 Market Map for Biomass based large scale Technology for electricity production.
Business
Environment
Natural
Resource
Land use/ ownership
Conflict
/insecurity
Electricity Planning Food
Security
Contract
Law
Plant
Builder Plant
Operator
Electricity
Trans/ Dist
Electricity
Consumer Energy Crop
Farmers
Component
suppliers
Wood Drying/
Chipping
Business
Services
Metering
Storage
Transport Quality
Control Agricultural
Co-ordination Debt
Collection
Engineering
Consulting
Finance
Investors
Commodity market Size of
Plant
Fuel Suppliers
Local Technology
Support
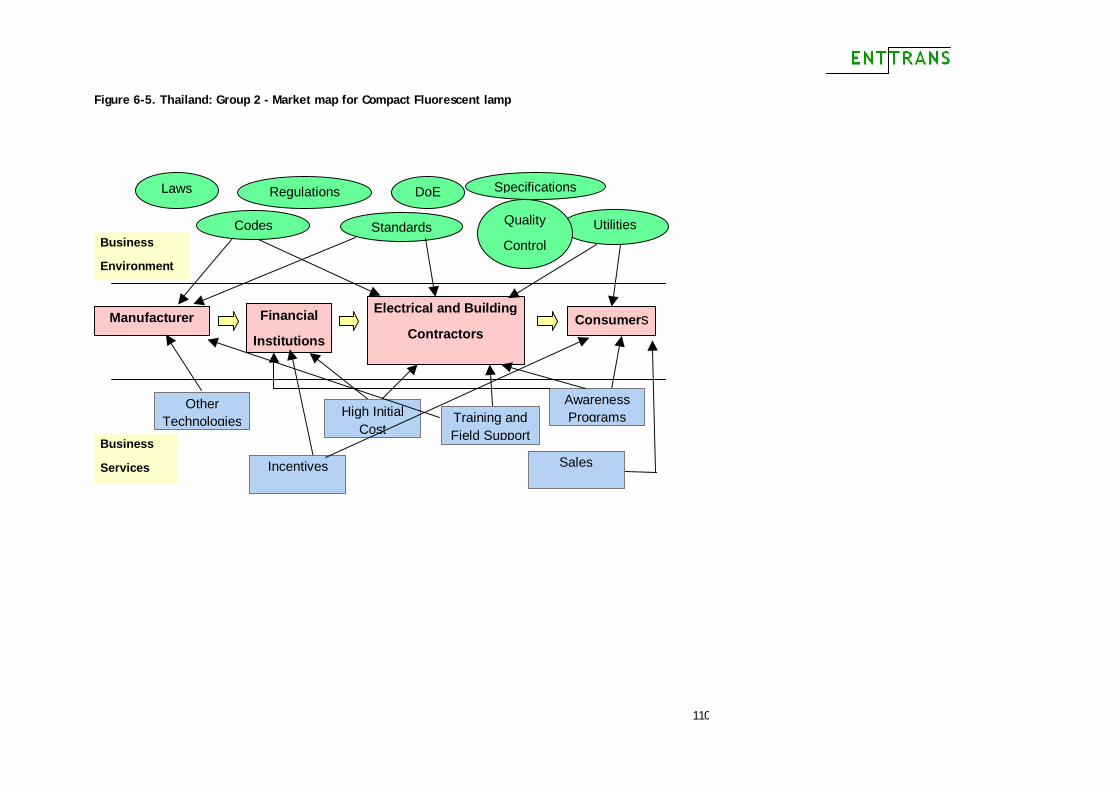
110
Figure 6-5. Thailand: Group 2 - Market map for Compact Fluorescent lamp
Utilities
SpecificationsLaws Regulations
Codes Quality
Control Standards
Consumers Manufacturer Financial
Institutions
Electrical and Building
Contractors
DoE
Business
Services
Other Technologies
Incentives
High Initial Cost
Training and Field Support
Awareness Programs
Sales
Business
Environment
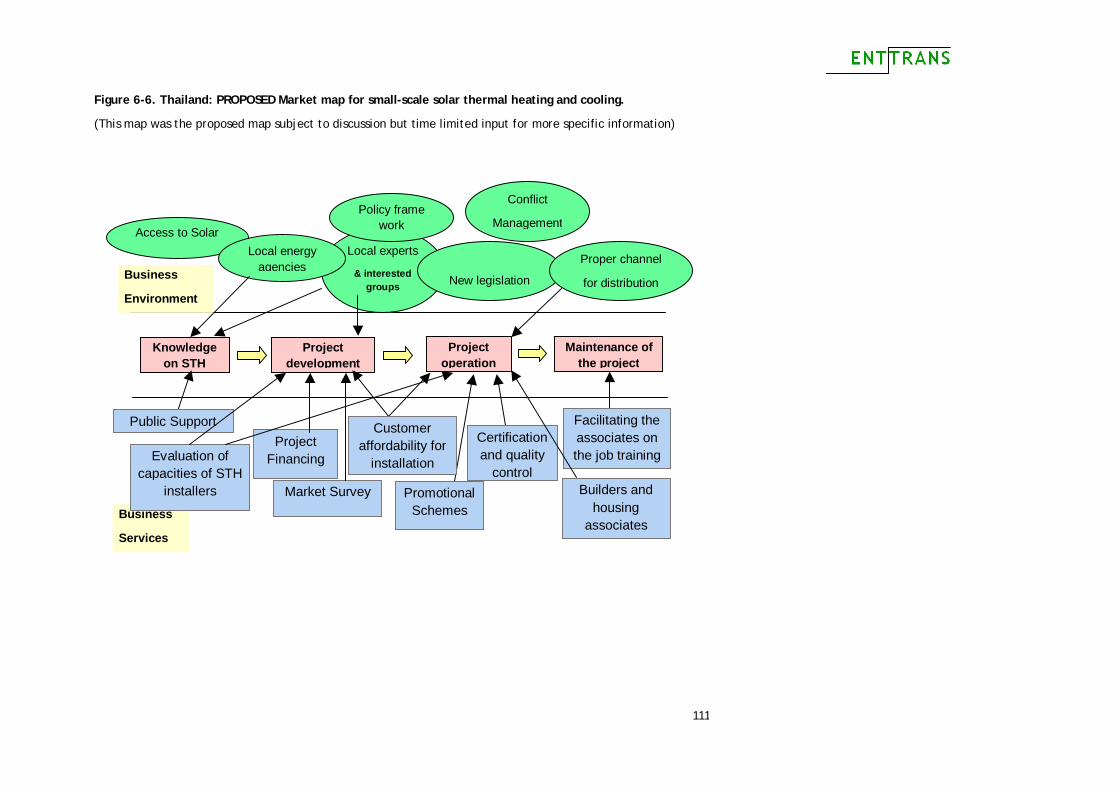
111
Figure 6-6. Thailand: PROPOSED Market map for small-scale solar thermal heating and cooling.
(This map was the proposed map subject to discussion but time limited input for more specific information)
Knowledge on STH
Project development
Project operation
Maintenance of the project
Local experts
& interested groups
Access to Solar
Thermal
New legislation
Local energy agencies Business
Environment
Policy frame work
Conflict
Management
Business
Services
Proper channel
for distribution
Public Support
Evaluation of capacities of STH
installers Market Survey
Project Financing
Customer affordability for
installation
Promotional Schemes
Certification and quality
control Builders and
housing associates
Facilitating the associates on the job training
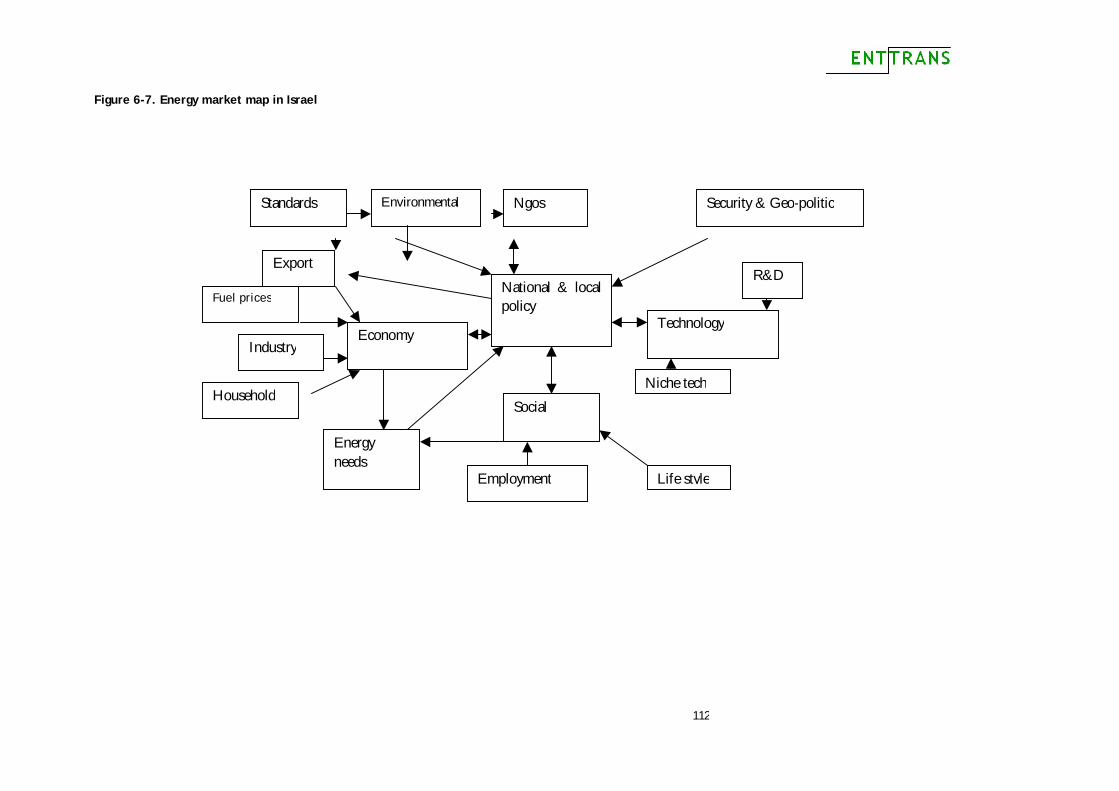
112
Figure 6-7. Energy market map in Israel
R&D
Niche tech
Technology
National & local policy
Economy
Social
Life style Employment
Energy needs
Security & Geo-politic Ngos Environmental
Standards
Export
Industry
Household
Fuel prices
113
6.1.2. Comparison of market maps across case study countries
The Market Mapping exercise was undertaken to explore an area which is not usually considered in terms of technology transfer, but which is crucial for successful transfer: the nature of the market within which the technology must compete. If markets are inefficient or resistant to change or lack trust then overcoming the barriers being identified will not provide a successful transfer on their own. The exercise is designed to allow the market players to interact and examine their market system in a way which normally does not occur. The aim is to generate the impetus for a market network actively looking to maximise the efficiency and equity in the market.
In practice, differentiating between the enabling environment and the supporting services (see Figure 5-1 and Figure 5-2) was not always clear-cut and different countries/groups viewed these differently and so there is overlap between these. The exercise undertaken in the countries could only be a first step in this process of generation of knowledge and stakeholder contact and trust. Nevertheless, it can provide interesting insights into the process needed for technology transfer.
The technologies chosen and agreed with the group were designed to challenge the status quo where possible. The results are given in the market maps above and summarised in the tables below.
It is clear that there are large differences between countries in both implementing the new market mapping technique and also in the country responses to the exercise.
Small versus large-scale market chains across countries
For Kenya and China, the market maps for the small-scale technologies were different in terms of complexity to the large-scale technologies. In Thailand the maps for small-scale were not fully completed and developed due to restricted time.
Comparing the market chain elements of the map, it is clear that in Kenya and China there is a greater range of stakeholders involved in the chain for small-scale technologies. In Kenya, the main differences compared to large-scale were in the need for retailers, sales agents, promoters, installers, service agents and wholesalers. Similarly for China, the small-scale technology focus seems to be on the need for the district dealers, district agents, design and installation dealers, service dealers and real estate developers. This is the network needed to reach the much larger range of customers who have to be actively engaged in buying the new small-scale product. In addition, the importance of quality control and regulation was recognised in including this aspect as an integral component.
For large-scale technology, the chain ends with the utilities and distribution companies who already have their distribution network and who are not changing what they sell. For imported technologies, there are additional areas such as shipping, but in both cases the technology may be imported and so both need this aspect which is recognised under importers. Although small-scale technology designers are part of the market chain, there seems to be a much greater need for local and international engineering consultants for the larger-scale technology.
It therefore seems clear that for adoption of the small-scale technology by the market there is a need either for an interface to an existing network for reaching customers, or the creation of such a network and interface to it. Programmes of small-scale projects intended for transfer have to ensure that this aspect is built into the programme design.
114
Enabling business environment across countries
The enabling business environment includes the critical factors and trends shaping the market and operating conditions such as infrastructure, policies, and institutions, fiscal aspects, financial incentives, infrastructure for distribution and production. In general, the main factors included in the mapping were as follows: • Government department co-ordination and red tape, • Regulation, fiscal and legal, • Trade and research institutions, • Transparency and Trade Laws, especially regarding Independent Power Producers (IPP), • Small scale: local expertise, research, training, financing, risk offsetting, • Large scale: tariffs, privatisation and int. incentives, • Policy environment, and • Public awareness and information.
Commonly noted aspects for implementation chains for large and small-scale technologies for Kenya, China and Thailand were: government departments (red tape), trade and research institutions, standards, price, regulation and legislation, and policies.
For small-scale technologies in Kenya the accent was on research and training and accessing financial resources, quality control and the high risk of small-scale technologies, while the large-scale technology enabling environment for CSP was dominated by privatisation, tariffs, and international incentives. For Kenya, government policy on licences seems to be good. Quality control and standards for Kenya and Thailand again seem to be a concern for small-scale technologies as was availability of local expertise.
In Thailand, a specific concern not seen in Kenya or China was over food security and land-use/ownership, which is related to the nature of the fuel as this was associated with biomass generation in Thailand. Debt collection was also a concern.
Transparency and Trade laws (e.g. intellectual property rights, patent office) were mentioned in Kenya and China as part of the enabling business environment. Public awareness and information availability was also a key concern in China for the enabling environment and mirrored in the inclusion of media in the market chain for small-scale solar thermal.
The enabling business environment depends on the country context and the technology though there are many general aspects that countries and technologies have in common. There are some differences across large and small-scale technologies related to quality control and risk and access to finance for small-scale projects.
Support services across countries
As mentioned above, there is some overlap between the support services and enabling environment. Therefore, if a topic is mentioned in the enabling environment, it is not repeated here under support services: • Financial services, • Legal services, • Professional engineering services, and • Government planning and support, including R&D and Codes and standards.
For large-scale CSP in Kenya the support services were grouped under financial services, legal services and regulations, professional engineering services and government planning and support (e.g. R&D). These general headings apply to Kenya, China and Thailand and also apply to small-scale projects, except for professional engineering services which tend to be more relevant for large-scale technology projects.
115
Thailand had the addition of Debt collection and metering as a concern though finance for investment was not perceived as a problem in Thailand.
Links between support services and market chain across countries
The links between the support services and the market chain can show where some key services are needed or where blockages might occur. For the large-scale CSP in Kenya key roles are seen in financial services, government support including R&D, legal services and codes and standards. These also apply to the small-scale biomass gasification stoves along with quality control and marketing. In China, for large-scale wind turbines similar support services apply but with emphasis on technique services for training and maintenance. Small-scale solar thermal in China also covered the same concerns, but identified exchange rate risks in addition. In Thailand, as mentioned earlier, the same links are given, but with debt collection as an extra service supporting the market. Small-scale solar followed a similar pattern though there are less data on these.
Technology and country specific aspects
The Chinese stakeholders identified natural conditions and physical distribution conditions as important concerns for the enabling environment for small-scale projects though they will also affect large-scale projects. Material availability and location suitability were also highlighted. These general concerns are manifest in the following examples from the maps for Kenya and Thailand.
With respect to biomass-based technologies in Thailand there were concerns about the security of the fuel supply and food security, whereas also legal and contractual conditions needed to be strengthened.
For large-scale CSP technology application in Kenya there were concerns with infrastructure for arid and semi arid land, wayleaves, and water.
Summary
Taken together the insights from the market chains in the five case-study countries shows that the enabling business environment and the support services along with the links can provide an initial picture of the complexity of the system and also of the areas where blockages can occur and which need to be examined and corrected where possible in order to enable the full technology transfer opportunities. It is also clear that the maps have elements in common for the market chain, enabling business environment and support services but also that country conditions are important and the type of technology and its size.
These insights are a first step in elaborating the complexity and key activities for successful transfer. The creation of a market network is needed to explore the system further for the country and technology specific opportunities and blockages.
The following sub-sections describe an initial set of opportunities and blockages identified by the groups.
6.2. Opportunities identified from market mapping
As a next step, the stakeholders were asked to identify opportunities arising from the market mapping analysis. These have been listed in Table 6-1 below for each country and for the different technology scales.
In Kenya, in both large and small-scale technology interventions, the participants were able to identify many opportunities and sustainability benefits emerging from adoption of the technologies. In the workshop a genuine enthusiasm was generated for the technologies which had not been considered before. At the country level, stakeholders identified benefits in terms of economic development, such as improved skills and creation of jobs, and in terms of increased energy security of supply and improved balancing of power
116
supplies. At the local level, identified benefits from the technologies were: poverty alleviation, in particular when introducing CSP in the north east part of Kenya, which is a poor area, and small scale local benefits; improved quality of life, e.g., because of the improved access to modern types of energy; and improvement of health, because of the avoidance of in-house smoke caused by burning traditional biomass for cooking purposes.
With respect to opportunities at the international level, stakeholders mentioned that a technology, once it is adapted to developing country conditions, could be further exported to other developing countries. In addition, the contribution of introducing low-carbon technologies in the country to addressing the issue of global warming was recognised.
Additional funding leverage and hybridisation with other renewable technology opportunities were also valued.
The emphasis in Thailand was on the opportunity to have superior technology with the associated knowledge and skills training benefits and development of services from local suppliers as well as the opportunity to adapt to a new technology. One example of a technical aspect of the market map mentioned at the workshop was the fact that compact fluorescent lamps are preferred over incandescent bulbs, because they are tolerant of voltage swings in the power grid. The stakeholders in Thailand also mentioned that by mapping the market for a new technology, policies and incentive schemes in the country could be refined and directed towards investments in new technologies. It would also provide an opportunity for local suppliers to learn to develop technology programmes instead of relying mainly on foreign investors to complete project development and implementation. Usually, the latter route is preferred in Thailand because it offers a stronger financial position, but with the CDM revenues, the first route could become increasingly feasible. Finally, it was recommended that local consultants are used, where possible, for technology implementation projects (under the CDM) in order to reduce transaction and monitoring costs and make sure that the project is fully in accordance with the local preferences.
China is different to many countries in that the main companies who would buy large-scale technology are government-owned and therefore the main market actors are governed by government policy and regulations rather than by market pressures. This does not apply to some industries for large-scale energy efficiency. Nevertheless, some provinces offer subsidies to encourage manufacturers to change to technologies that are more efficient. For example, in Shandong province a technology fair being held in October 2007 offered 50% subsidies to manufacturers to adopt new technologies. In China, the main driver for large-scale projects would be government policy and regulation rather than market forces. For energy efficiency in industry, the central government or the provinces can offer incentives for change. However, for small-scale projects there would be an opportunity to develop a market.
In Chile, government-led regulatory changes requiring electricity from renewables can provide the driver for change and the opportunity to develop a market. A new law, the Short Law II requires that 5% of demand from small clients be met by renewable sources. Another new law is under consideration which would require all generators larger than 200 MW to dispatch at least 8% of their energy from renewables. Stakeholders expected access to CDM finance to improve the internal rate of return of technology implementation projects.
Israeli stakeholders recognised opportunities in the solar market for power generation and for small-scale technologies as a means to enhance energy supply security to the country. According to stakeholders, Israel has built up experience with a range of technologies and has a good potential for a range of applications. Stakeholders mentioned though that the additional initial financial risk related to introducing and implementing new technologies could only be justified if the external effects from combusting conventional fossil fuels were included in the cost calculations (e.g. energy prices).
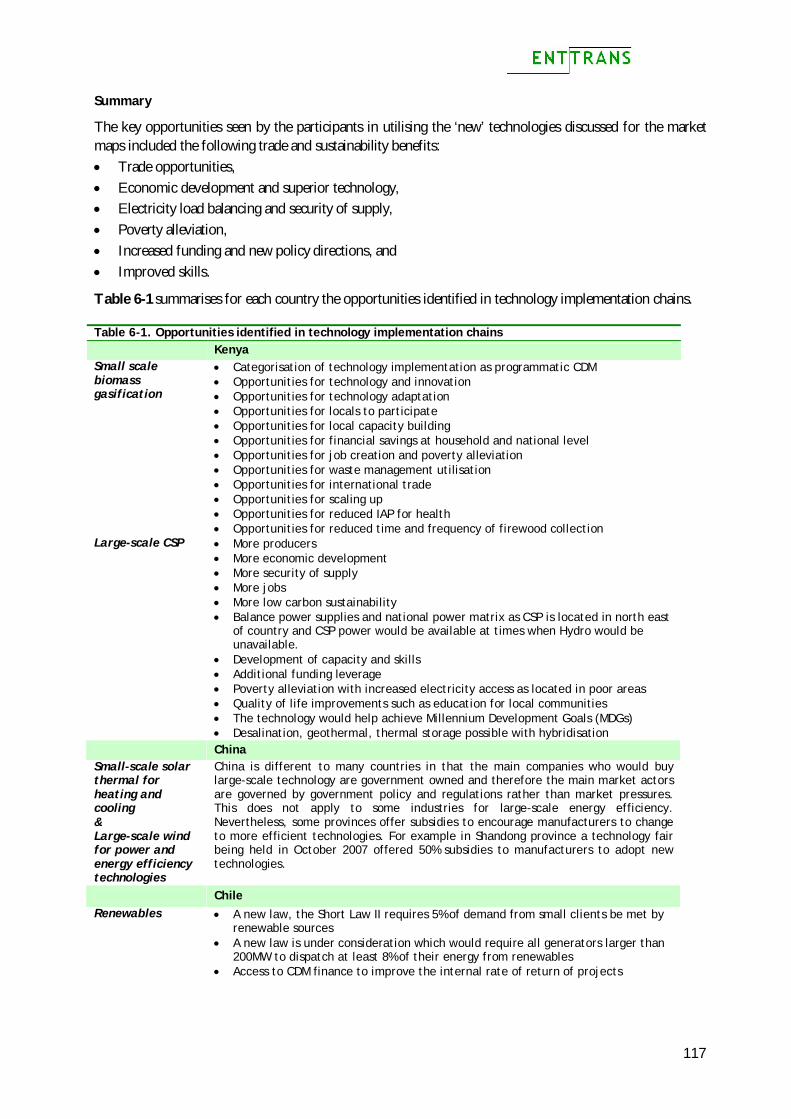
117
Summary
The key opportunities seen by the participants in utilising the ‘new’ technologies discussed for the market maps included the following trade and sustainability benefits: Trade opportunities, Economic development and superior technology, Electricity load balancing and security of supply, Poverty alleviation, Increased funding and new policy directions, and Improved skills.
Table 6-1 summarises for each country the opportunities identified in technology implementation chains. Table 6-1. Opportunities identified in technology implementation chains Kenya Small scale biomass gasification
Categorisation of technology implementation as programmatic CDM Opportunities for technology and innovation Opportunities for technology adaptation Opportunities for locals to participate Opportunities for local capacity building Opportunities for financial savings at household and national level Opportunities for job creation and poverty alleviation Opportunities for waste management utilisation Opportunities for international trade Opportunities for scaling up Opportunities for reduced IAP for health Opportunities for reduced time and frequency of firewood collection
Large-scale CSP More producers More economic development More security of supply More jobs More low carbon sustainability Balance power supplies and national power matrix as CSP is located in north east
of country and CSP power would be available at times when Hydro would be unavailable.
Development of capacity and skills Additional funding leverage Poverty alleviation with increased electricity access as located in poor areas Quality of life improvements such as education for local communities The technology would help achieve Millennium Development Goals (MDGs) Desalination, geothermal, thermal storage possible with hybridisation
China Small-scale solar thermal for heating and cooling & Large-scale wind for power and energy efficiency technologies
China is different to many countries in that the main companies who would buy large-scale technology are government owned and therefore the main market actors are governed by government policy and regulations rather than market pressures. This does not apply to some industries for large-scale energy efficiency. Nevertheless, some provinces offer subsidies to encourage manufacturers to change to more efficient technologies. For example in Shandong province a technology fair being held in October 2007 offered 50% subsidies to manufacturers to adopt new technologies.
Chile Renewables A new law, the Short Law II requires 5% of demand from small clients be met by
renewable sources A new law is under consideration which would require all generators larger than
200MW to dispatch at least 8% of their energy from renewables Access to CDM finance to improve the internal rate of return of projects
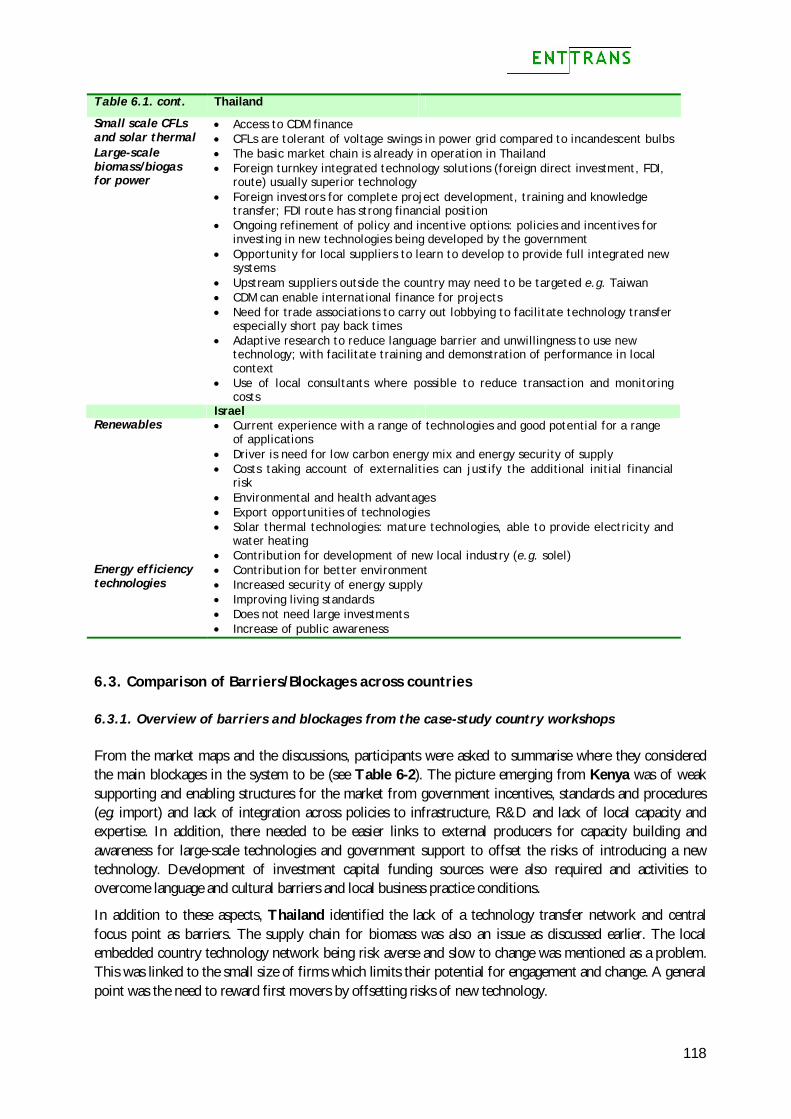
118
Table 6.1. cont. Thailand
Small scale CFLs and solar thermal
Access to CDM finance CFLs are tolerant of voltage swings in power grid compared to incandescent bulbs
Large-scale biomass/biogas for power
The basic market chain is already in operation in Thailand Foreign turnkey integrated technology solutions (foreign direct investment, FDI,
route) usually superior technology Foreign investors for complete project development, training and knowledge
transfer; FDI route has strong financial position Ongoing refinement of policy and incentive options: policies and incentives for
investing in new technologies being developed by the government Opportunity for local suppliers to learn to develop to provide full integrated new
systems Upstream suppliers outside the country may need to be targeted e.g. Taiwan CDM can enable international finance for projects Need for trade associations to carry out lobbying to facilitate technology transfer
especially short pay back times Adaptive research to reduce language barrier and unwillingness to use new
technology; with facilitate training and demonstration of performance in local context
Use of local consultants where possible to reduce transaction and monitoring costs
Israel Renewables Current experience with a range of technologies and good potential for a range
of applications Driver is need for low carbon energy mix and energy security of supply Costs taking account of externalities can justify the additional initial financial
risk Environmental and health advantages Export opportunities of technologies Solar thermal technologies: mature technologies, able to provide electricity and
water heating Contribution for development of new local industry (e.g. solel)
Energy efficiency technologies
Contribution for better environment Increased security of energy supply Improving living standards Does not need large investments Increase of public awareness
6.3. Comparison of Barriers/Blockages across countries
6.3.1. Overview of barriers and blockages from the case-study country workshops
From the market maps and the discussions, participants were asked to summarise where they considered the main blockages in the system to be (see Table 6-2). The picture emerging from Kenya was of weak supporting and enabling structures for the market from government incentives, standards and procedures (e.g. import) and lack of integration across policies to infrastructure, R&D and lack of local capacity and expertise. In addition, there needed to be easier links to external producers for capacity building and awareness for large-scale technologies and government support to offset the risks of introducing a new technology. Development of investment capital funding sources were also required and activities to overcome language and cultural barriers and local business practice conditions.
In addition to these aspects, Thailand identified the lack of a technology transfer network and central focus point as barriers. The supply chain for biomass was also an issue as discussed earlier. The local embedded country technology network being risk averse and slow to change was mentioned as a problem. This was linked to the small size of firms which limits their potential for engagement and change. A general point was the need to reward first movers by offsetting risks of new technology.
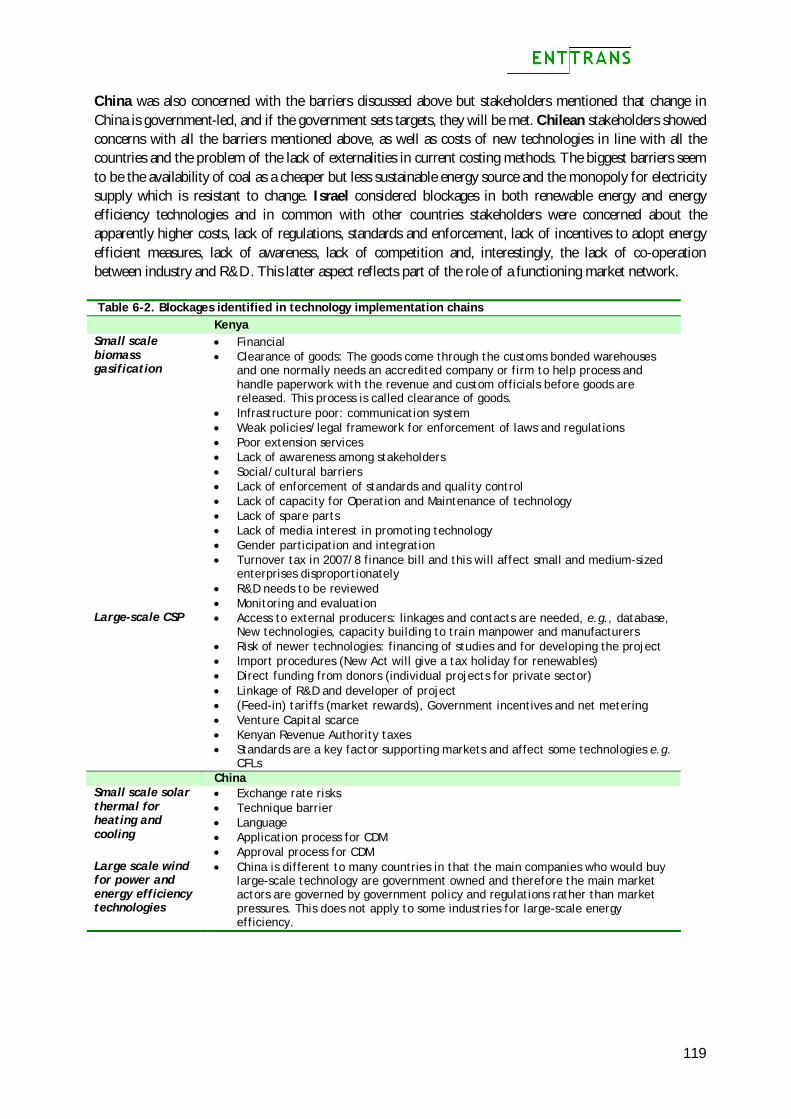
119
China was also concerned with the barriers discussed above but stakeholders mentioned that change in China is government-led, and if the government sets targets, they will be met. Chilean stakeholders showed concerns with all the barriers mentioned above, as well as costs of new technologies in line with all the countries and the problem of the lack of externalities in current costing methods. The biggest barriers seem to be the availability of coal as a cheaper but less sustainable energy source and the monopoly for electricity supply which is resistant to change. Israel considered blockages in both renewable energy and energy efficiency technologies and in common with other countries stakeholders were concerned about the apparently higher costs, lack of regulations, standards and enforcement, lack of incentives to adopt energy efficient measures, lack of awareness, lack of competition and, interestingly, the lack of co-operation between industry and R&D. This latter aspect reflects part of the role of a functioning market network. Table 6-2. Blockages identified in technology implementation chains Kenya Small scale biomass gasification
Financial Clearance of goods: The goods come through the customs bonded warehouses
and one normally needs an accredited company or firm to help process and handle paperwork with the revenue and custom officials before goods are released. This process is called clearance of goods.
Infrastructure poor: communication system Weak policies/legal framework for enforcement of laws and regulations Poor extension services Lack of awareness among stakeholders Social/cultural barriers Lack of enforcement of standards and quality control Lack of capacity for Operation and Maintenance of technology Lack of spare parts Lack of media interest in promoting technology Gender participation and integration Turnover tax in 2007/8 finance bill and this will affect small and medium-sized
enterprises disproportionately R&D needs to be reviewed Monitoring and evaluation
Large-scale CSP Access to external producers: linkages and contacts are needed, e.g., database, New technologies, capacity building to train manpower and manufacturers
Risk of newer technologies: financing of studies and for developing the project Import procedures (New Act will give a tax holiday for renewables) Direct funding from donors (individual projects for private sector) Linkage of R&D and developer of project (Feed-in) tariffs (market rewards), Government incentives and net metering Venture Capital scarce Kenyan Revenue Authority taxes Standards are a key factor supporting markets and affect some technologies e.g.
CFLs China Small scale solar thermal for heating and cooling
Exchange rate risks Technique barrier Language Application process for CDM Approval process for CDM
Large scale wind for power and energy efficiency technologies
China is different to many countries in that the main companies who would buy large-scale technology are government owned and therefore the main market actors are governed by government policy and regulations rather than market pressures. This does not apply to some industries for large-scale energy efficiency.
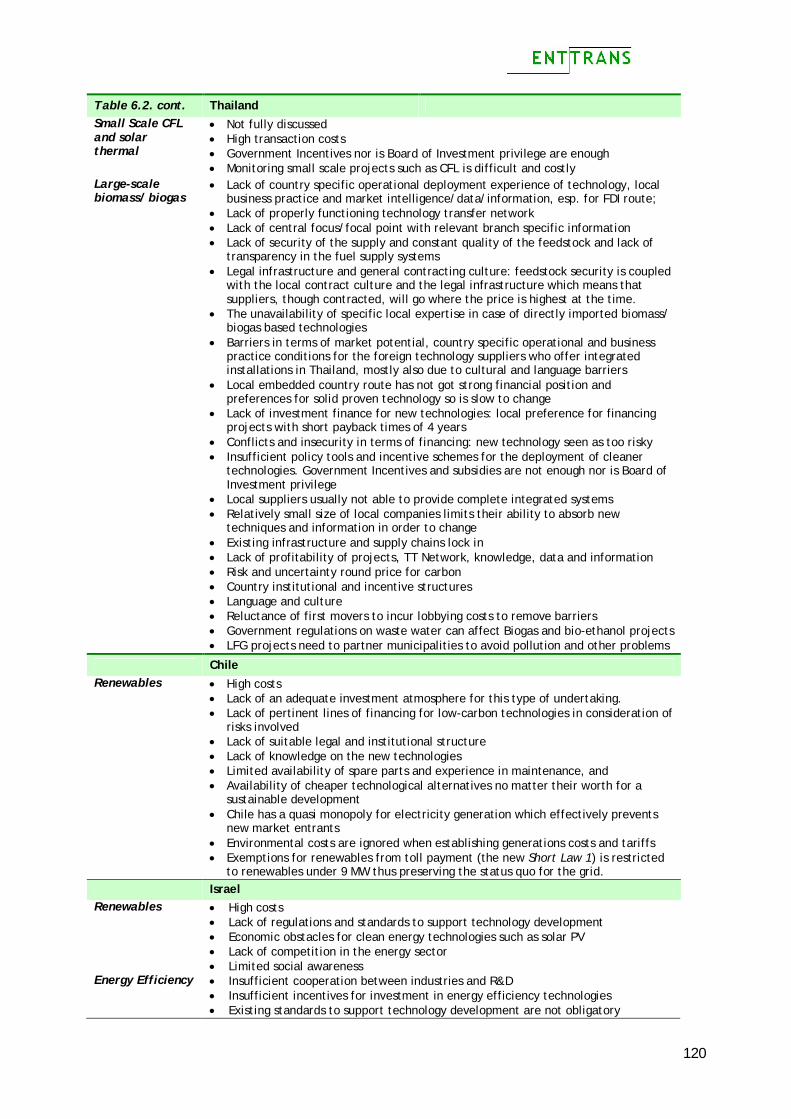
120
Table 6.2. cont. Thailand Small Scale CFL and solar thermal
Not fully discussed High transaction costs Government Incentives nor is Board of Investment privilege are enough Monitoring small scale projects such as CFL is difficult and costly
Large-scale biomass/ biogas
Lack of country specific operational deployment experience of technology, local business practice and market intelligence/data/information, esp. for FDI route;
Lack of properly functioning technology transfer network Lack of central focus/focal point with relevant branch specific information Lack of security of the supply and constant quality of the feedstock and lack of
transparency in the fuel supply systems Legal infrastructure and general contracting culture: feedstock security is coupled
with the local contract culture and the legal infrastructure which means that suppliers, though contracted, will go where the price is highest at the time.
The unavailability of specific local expertise in case of directly imported biomass/ biogas based technologies
Barriers in terms of market potential, country specific operational and business practice conditions for the foreign technology suppliers who offer integrated installations in Thailand, mostly also due to cultural and language barriers
Local embedded country route has not got strong financial position and preferences for solid proven technology so is slow to change
Lack of investment finance for new technologies: local preference for financing projects with short payback times of 4 years
Conflicts and insecurity in terms of financing: new technology seen as too risky Insufficient policy tools and incentive schemes for the deployment of cleaner
technologies. Government Incentives and subsidies are not enough nor is Board of Investment privilege
Local suppliers usually not able to provide complete integrated systems Relatively small size of local companies limits their ability to absorb new
techniques and information in order to change Existing infrastructure and supply chains lock in Lack of profitability of projects, TT Network, knowledge, data and information Risk and uncertainty round price for carbon Country institutional and incentive structures Language and culture Reluctance of first movers to incur lobbying costs to remove barriers Government regulations on waste water can affect Biogas and bio-ethanol projects LFG projects need to partner municipalities to avoid pollution and other problems
Chile Renewables High costs
Lack of an adequate investment atmosphere for this type of undertaking. Lack of pertinent lines of financing for low-carbon technologies in consideration of
risks involved Lack of suitable legal and institutional structure Lack of knowledge on the new technologies Limited availability of spare parts and experience in maintenance, and Availability of cheaper technological alternatives no matter their worth for a
sustainable development Chile has a quasi monopoly for electricity generation which effectively prevents
new market entrants Environmental costs are ignored when establishing generations costs and tariffs Exemptions for renewables from toll payment (the new Short Law 1) is restricted
to renewables under 9 MW thus preserving the status quo for the grid. Israel Renewables High costs
Lack of regulations and standards to support technology development Economic obstacles for clean energy technologies such as solar PV Lack of competition in the energy sector Limited social awareness
Energy Efficiency Insufficient cooperation between industries and R&D Insufficient incentives for investment in energy efficiency technologies Existing standards to support technology development are not obligatory
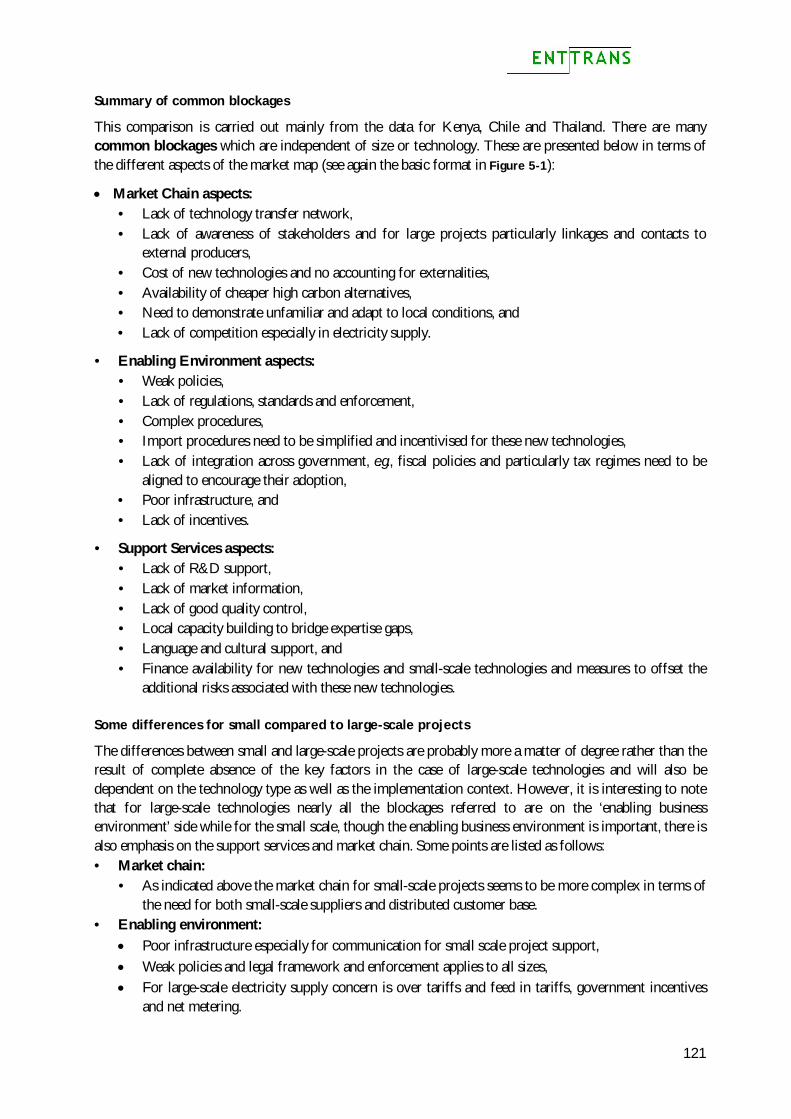
121
Summary of common blockages
This comparison is carried out mainly from the data for Kenya, Chile and Thailand. There are many common blockages which are independent of size or technology. These are presented below in terms of the different aspects of the market map (see again the basic format in Figure 5-1):
Market Chain aspects: • Lack of technology transfer network, • Lack of awareness of stakeholders and for large projects particularly linkages and contacts to
external producers, • Cost of new technologies and no accounting for externalities, • Availability of cheaper high carbon alternatives, • Need to demonstrate unfamiliar and adapt to local conditions, and • Lack of competition especially in electricity supply.
• Enabling Environment aspects: • Weak policies, • Lack of regulations, standards and enforcement, • Complex procedures, • Import procedures need to be simplified and incentivised for these new technologies, • Lack of integration across government, e.g., fiscal policies and particularly tax regimes need to be
aligned to encourage their adoption, • Poor infrastructure, and • Lack of incentives.
• Support Services aspects: • Lack of R&D support, • Lack of market information, • Lack of good quality control, • Local capacity building to bridge expertise gaps, • Language and cultural support, and • Finance availability for new technologies and small-scale technologies and measures to offset the
additional risks associated with these new technologies.
Some differences for small compared to large-scale projects
The differences between small and large-scale projects are probably more a matter of degree rather than the result of complete absence of the key factors in the case of large-scale technologies and will also be dependent on the technology type as well as the implementation context. However, it is interesting to note that for large-scale technologies nearly all the blockages referred to are on the ‘enabling business environment’ side while for the small scale, though the enabling business environment is important, there is also emphasis on the support services and market chain. Some points are listed as follows: • Market chain:
• As indicated above the market chain for small-scale projects seems to be more complex in terms of the need for both small-scale suppliers and distributed customer base.
• Enabling environment: Poor infrastructure especially for communication for small scale project support, Weak policies and legal framework and enforcement applies to all sizes, For large-scale electricity supply concern is over tariffs and feed in tariffs, government incentives
and net metering.
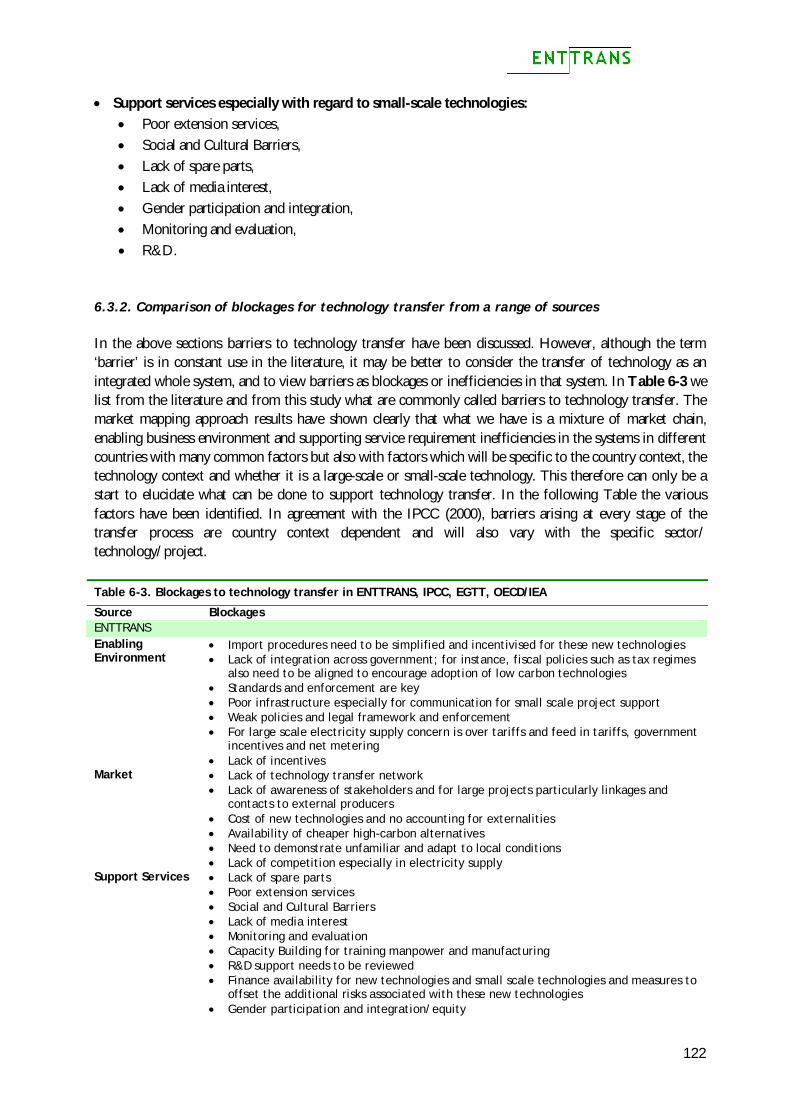
122
Support services especially with regard to small-scale technologies: Poor extension services, Social and Cultural Barriers, Lack of spare parts, Lack of media interest, Gender participation and integration, Monitoring and evaluation, R&D.
6.3.2. Comparison of blockages for technology transfer from a range of sources
In the above sections barriers to technology transfer have been discussed. However, although the term ‘barrier’ is in constant use in the literature, it may be better to consider the transfer of technology as an integrated whole system, and to view barriers as blockages or inefficiencies in that system. In Table 6-3 we list from the literature and from this study what are commonly called barriers to technology transfer. The market mapping approach results have shown clearly that what we have is a mixture of market chain, enabling business environment and supporting service requirement inefficiencies in the systems in different countries with many common factors but also with factors which will be specific to the country context, the technology context and whether it is a large-scale or small-scale technology. This therefore can only be a start to elucidate what can be done to support technology transfer. In the following Table the various factors have been identified. In agreement with the IPCC (2000), barriers arising at every stage of the transfer process are country context dependent and will also vary with the specific sector/ technology/project. Table 6-3. Blockages to technology transfer in ENTTRANS, IPCC, EGTT, OECD/IEA
Source Blockages ENTTRANS Enabling Environment
Import procedures need to be simplified and incentivised for these new technologies Lack of integration across government; for instance, fiscal policies such as tax regimes
also need to be aligned to encourage adoption of low carbon technologies Standards and enforcement are key Poor infrastructure especially for communication for small scale project support Weak policies and legal framework and enforcement For large scale electricity supply concern is over tariffs and feed in tariffs, government
incentives and net metering Lack of incentives
Market Lack of technology transfer network Lack of awareness of stakeholders and for large projects particularly linkages and
contacts to external producers Cost of new technologies and no accounting for externalities Availability of cheaper high-carbon alternatives Need to demonstrate unfamiliar and adapt to local conditions Lack of competition especially in electricity supply
Support Services Lack of spare parts Poor extension services Social and Cultural Barriers Lack of media interest Monitoring and evaluation Capacity Building for training manpower and manufacturing R&D support needs to be reviewed Finance availability for new technologies and small scale technologies and measures to
offset the additional risks associated with these new technologies Gender participation and integration/equity
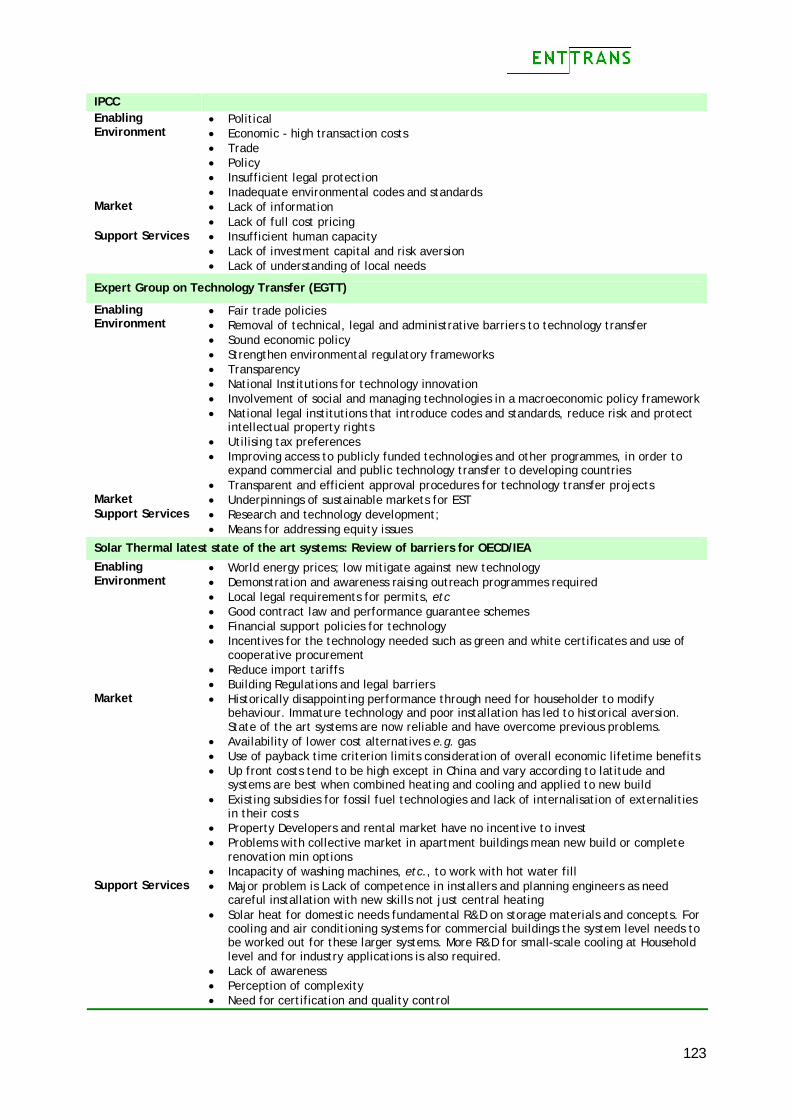
123
IPCC Enabling Environment
Political Economic - high transaction costs Trade Policy Insufficient legal protection Inadequate environmental codes and standards
Market Lack of information Lack of full cost pricing
Support Services Insufficient human capacity Lack of investment capital and risk aversion Lack of understanding of local needs
Expert Group on Technology Transfer (EGTT)
Enabling Environment
Fair trade policies Removal of technical, legal and administrative barriers to technology transfer Sound economic policy Strengthen environmental regulatory frameworks Transparency National Institutions for technology innovation Involvement of social and managing technologies in a macroeconomic policy framework National legal institutions that introduce codes and standards, reduce risk and protect
intellectual property rights Utilising tax preferences Improving access to publicly funded technologies and other programmes, in order to
expand commercial and public technology transfer to developing countries Transparent and efficient approval procedures for technology transfer projects
Market Underpinnings of sustainable markets for EST Support Services Research and technology development;
Means for addressing equity issues
Solar Thermal latest state of the art systems: Review of barriers for OECD/IEA Enabling Environment
World energy prices; low mitigate against new technology Demonstration and awareness raising outreach programmes required Local legal requirements for permits, etc Good contract law and performance guarantee schemes Financial support policies for technology Incentives for the technology needed such as green and white certificates and use of
cooperative procurement Reduce import tariffs Building Regulations and legal barriers
Market Historically disappointing performance through need for householder to modify behaviour. Immature technology and poor installation has led to historical aversion. State of the art systems are now reliable and have overcome previous problems.
Availability of lower cost alternatives e.g. gas Use of payback time criterion limits consideration of overall economic lifetime benefits Up front costs tend to be high except in China and vary according to latitude and
systems are best when combined heating and cooling and applied to new build Existing subsidies for fossil fuel technologies and lack of internalisation of externalities
in their costs Property Developers and rental market have no incentive to invest Problems with collective market in apartment buildings mean new build or complete
renovation min options Incapacity of washing machines, etc., to work with hot water fill
Support Services Major problem is Lack of competence in installers and planning engineers as need careful installation with new skills not just central heating
Solar heat for domestic needs fundamental R&D on storage materials and concepts. For cooling and air conditioning systems for commercial buildings the system level needs to be worked out for these larger systems. More R&D for small-scale cooling at Household level and for industry applications is also required.
Lack of awareness Perception of complexity Need for certification and quality control
124
6.3.3. Conclusions and Recommendations on dealing with barriers/blockages
1. Although there are common barriers affecting the different parts of the market map, there is a need to recognise that the country context, the technology and the specific conditions relating to that combination need to be taken into account when considering activities to improve technology transfer. This is in line with the findings in IPCC (2000).
2. Although market mapping was only used in ENTTRANS, it is clear that the ‘barriers’ can be categorised in terms of enabling environment, market chain and support services. This categorisation allows easier comparison between the studies.
3. The EGTT barriers focus mainly on the enabling environment. They define ‘Enabling environment’ as “government policies that focus on creating and maintaining an overall macroeconomic environment that brings together suppliers and consumers in an inter-firm co-operation manner (UNCTAD, 1998a. TD/B/COM.2/33)” (EGTT, 2008). The focus corresponds with the enabling business environment part of the Market Map used in this study. In practice, some of the items on the list of barriers in EGTT (2008) can be assigned to the market chain and to the support activities for the market as shown in the table. The EGTT also identifies specific areas to enhance the enabling environment for technology transfer and these are included in the list provided.
4. Though the market chain and support service issues are apparently not so well addressed in terms of barriers or enabling activities by the EGTT approach, the sector level activities for technology information dissemination undertaken as part of the technical information theme under the EGTT activities will encourage market networks. For the EGTT the market chain barrier identified was the underpinnings of sustainable markets for sustainable energy technologies, so that the market mapping with the formation of a market network as in ENTTRANS would be in line with this general aim. As observed earlier, the small-scale projects tend to have a bigger market chain and more support service requirements so that this observation may imply an emphasis on mainly large-scale electricity supply energy technologies.
5. The results from ENTTRANS are also in line with the general IPCC barriers, although they give much more detail and structure to them than in IPCC (2000).
6.4. Future steps
In the workshops carried out in Kenya and China the participants were asked at the end of the workshop what they considered should be the next steps. The key outcome from the meeting in Nairobi was that participants decided that it was important that they follow up the workshop and organise themselves into a network to hold meetings to follow up on the issues raised on the operation of the market and technology transfer with the objective of progressing CDM project proposals. KIRDI, the Kenyan Industry Research and Development Institute, which is funded by the government, offered to organise the meetings which they thought should be monthly. The meeting therefore catalysed the formation of a new energy market network.
Participants at the workshop in Kunming (China) agreed that there was a need for additional action in China and that the following initiatives would be beneficial: Strengthen local governmental co-ordination in different regions of the country and establish specific
local governmental organization to co-ordinate CDM projects (already in progress). Promote public participation by introducing effective forms, e.g., CDM game field. Every province should issue the provincial plan in responding to climate change, based on the national
plan that had been already issued (National Development and Reform Commission People’s Republic of China, 2007).
125
7. Technology Transfer Acceleration and the Role of the CDM
This study has consisted of three consecutive phases. During the first phase, for five case-study countries, in collaboration with energy and environment stakeholders, energy service needs have been assessed and low-carbon technologies explored that could serve those needs (Chapters 3 and 4). In the second phase, for a number of low-carbon technologies (both small and large-scale technologies) a Market mapping exercise has been carried out in each country in order to analyse technology implementation systems and explore where in such systems blockages to technology transfer may occur. This analysis has been reported on and discussed in Chapters 5 and 6. Finally, the third phase of this study consists of an analysis of what measures could be taken to accelerate the transfer of technologies to developing countries. Section 7.1 will give an overall discussion of technology transfer acceleration aspects, which will be followed by a discussion in Section 7.2 on the potential role of the CDM in this respect.
7.1. Accelerating technology transfers in developing countries
From the analysis of blockages in the technology implementation chains in Chapters 5 and 6, recommendations can be derived with respect to supporting actions for technology transfer. In line with the conclusions from the ESNA and Market mapping exercises the recommended actions will need to be identified for each country context and implemented as an integral part of the transfer process.
7.1.1. Market Networks
The shaping of a market with its actors and supply chains depends on the technology being transferred and the country context. The formation of networks of market actors through the process of conducting Market Mapping exercises would be needed to first identify the economic actors and then identify, together with these local actors, the possible technology supply chains and their enabling business environment and supporting services. The formation of market networks strengthens the operation of the market and contributes to examination of the existing market chain, e.g. through highlighting blockages and inefficiencies at all levels within the market, including at government and regulatory level. Further action can then be generated to address these problems.
7.1.2. Market information systems and raising awareness
Creation of demand and incentives for change is a major element in enabling the market to develop and so it is important to make information (i.e. about new low-carbon technologies and implementation requirements) available and raise awareness. This would imply a two-pronged approach with awareness raising exercises on a large scale via the media coupled to good market information on reliability and quality of suppliers and systems. Once people say ‘What can I do?’, Industry should be ready with the answers. A source of good market information, e.g. available products and also guarantees that suppliers are accredited and checked from manufacturer to installer, etc. (such as with the CORGI system in the UK), are required. Also clear price signals for energy technology and CO2 emission reductions are needed.
7.1.3. Investment facilitation
The risk to the investor (both national or international investors) associated with introduction of a new technology needs to be minimised. There are several activities to do this such as by introduction of the technology in an institutional or industrial sector context to create a demand and/or through either
126
government/FDI sponsored programmes of demonstration of low carbon technologies, or through bundling/ programmatic basis under the CDM. This would provide a ready-made market which generates confidence and awareness. If the technology is properly implemented and is shown to be reliable and useful, then this can assist in a wider dissemination and development. Further participatory consultations with investors in the countries would characterise risk mitigation strategies more fully as a first step. Small-scale businesses are particularly vulnerable. This would also help overcome the problem of first movers taking all the risks while others take a free ride. Issues such as energy and feed-in tariffs are important. It also supports the development of the supply chains needed in the market.
Limited availability of sources of investor funding are also a major problem in many countries, which could be alleviated by the availability of multiple funding sources and ease of application.
Technology choices also have to avoid the trap of least financial cost solutions and take account of the externalities. In many countries, there are implicit subsidies for existing technologies and so policies to level the playing field for new market entrants are needed. New approaches to funding demonstration and small-scale projects are also essential with reappraisal of the suitability of other investment criteria such as payback time and other criteria as appropriate. The recent UNFCCC contribution on this subject (e.g. compliance fund, share of CER proceeds) needs to be implemented more widely.
7.1.4. Supporting the operation of the market
The following actions would support the operation of markets for low-carbon energy technologies: Transparency control – Good transparency control, especially avoiding corruption, on the
enforcement side is extremely important for proper development of a market and for maintaining good reputation and customer relations. Too often, for instance with compact fluorescent lamps (CFLs), there seems to be poor quality control leading to growing resistance to change to CFLs after bad experiences and wasted resources.
R&D – Adaptive research and development for low-carbon technologies to ensure suitability for local conditions is needed to encourage development of new technologies and to build technical capacity.
Training – Appropriate training for technology installation, operation, maintenance and servicing, and building management skills would be needed to support the technology transfer and delivery of local benefits. Programmes of training support could be provided alongside the main technology projects or CDM projects. This sort of capacity building is an important component in successful transfer.
Support promising technologies and increase their availability – In some cases, really good technologies with huge potential, such as solar thermal for cooling in developing countries, are not being used and the fine detail and availability of these systems are not entirely clear. An off-the-shelf solar thermal space cooling option is not really available, e.g. for householders or hoteliers, etc., but a much more focussed development in the country contexts involving manufacturers and suppliers, as well as skills development for installation and design is vital. This could possibly involve the task forces of the International Energy Agency (IEA). Integration with architectural practice would also be very good. Targeted investment in the short term to make the technologies fully available would yield large GHG benefits. The same applies to concentrating solar power and to hybrid combinations of renewables to provide integrated solutions. This activity combined with risk minimisation would provide good initial support.
Access of industrial sector to technological knowledge – Support for exhibitions of new technologies and possible discounts and incentives to take part in programmes of projects may be a useful way forward here to encourage manufacturers to change and provide captive short-term markets to facilitate investments. At the ENTTRANS workshop in China (July 2007), the partners learned about such exhibitions in China. This could also be done through joint industrialised country/EU/
127
host country initiatives. In addition, more external links would improve access to technological information. These external links need to be actively fostered.
7.1.5. Support for host government.
At the Annual Meeting of the World Business Council for Sustainable Development (2007), the EU Development Days in Lisbon, and the World Energy Conference it was recommended by participants, and in particular by industry representatives that government leadership is needed to establish transparent, long-term and stable policy targets and strategies. This also involves an integration of climate change issues in international development co-operation. Consideration also needs to be given to appropriate policies to offset any blocking tactics from monopolies in the market. For this, it is important to facilitate countries’ ability to formulate a policy framework, legislative and fiscal incentives and other measures to address countries’ technological needs and gaps. The host government departments involved need to be streamlining and aligning policies, incentives and procedures with regard to their role in and impact on the transfer process so that, e.g., import/export barriers are not counterproductive for low-carbon technology transfers. The host government capacity to make the suggested changes and support for technology transfer will require funding and training
For electricity supply projects the interface between decentralised systems and the grid is an area of concern which could also be assisted by a programme of technology transfer activities. Such a programme could address issues such as feed-in tariffs and charges for grid connections and the creation of ‘virtual’ power stations and smart metering. Decentralised energy supply technologies and systems can play an important role in the energy security of supply, also in developing countries, because its role is complementary to centralised energy provision (even based on local renewable energy resources).
7.2. The role of the CDM in accelerating low-carbon technology transfers
At present, as argued in Chapter 2, the CDM concentrates on single projects, mostly in isolation of the host country’s national and technology context, and does not address technology transfer on any scale. It currently does not really foster the supporting systems needed to enhance adoption of a new technology, and it therefore only addresses part of the process related to the early stages of demonstration and pre-commercialisation of technologies in the developing country market.
The isolated installation of projects is useful for only the very early stage of demonstration of an invention, but the real technology transfer processes will require much more effort. This Section provides insights into how the CDM could be adapted to deliver more technology transfer through improvement of the country system for adoption of low-carbon technologies. These insights are to a large extent based on the discussions held at the case-study country workshops (June-October 2007) with the country stakeholders (next to the market mapping exercises described in Chapter 6). During the discussions the positive and negative aspects of the CDM were identified with the country stakeholders and then an action plan of what could be done to improve the CDM was generated.
The following two questions were asked: 1. How effectively does the CDM support Technology Transfer of suitable technologies? 2. How can the CDM be improved to ensure CDM projects are in line with energy services considered
most needed and avoid ad-hoc CDM projects, and improve the efficiency of CDM host country operation to fast track CDM projects?
The approach was to consider how well the CDM is performing on these issues and then what could be done about it and by whom. All countries developed recommended actions based on the discussion of the
128
questions above by exploring the positive and negative aspects of the performance of the CDM on technology transfer, as well as recommended action needed to improve this performance. The country recommendations have been amalgamated and summarised below under three main activity headings: technology transfer enhancement, host country facilitation of the CDM, and CDM procedural change at the international level.
7.2.1. General aspects related to how the CDM could enhance technology transfer
Below are listed a number of general CDM-related aspects, as identified by the workshop participants, which would contribute to an enhanced transfer of low-carbon technologies in developing countries through CDM projects: There is a need for development of local CDM knowledge suppliers and consultancies over time in
order to replace any import needs in the project planning, including the preparation of CDM project design documents (PDDs). Several stakeholders mentioned that presently there is not enough local participation in the preparation of PDDs. Local knowledge suppliers are likely to have a better knowledge of local needs and priorities and may see CDM opportunities around technologies that are suitable for fulfilling these.
Governments need to provide local standards and better enforcement, as well as enabling policies, integrated regulations, and legal and financial supporting structures for technology transfer. Alignment of existing policies and removing policy inconsistencies (some policies stimulating and other policies hampering low-carbon technology transfer) would also be productive.
It is recommended that several CDM projects with the same technology, but carried out in different locations in a host country and at different scales should be grouped (e.g. under a programme), to iron out problems that individual projects may encounter and adapt the projects to host country conditions.
Intellectual property right problems need to be addressed within PDDs and the project contracts (possibly emission reduction purchase agreement, ERPA), especially patents and cost of patents.
Participants mentioned the advantage of having an effective mechanism for technology transfer under the CDM within a country, which could, among others, check the technical and financial feasibility of a CDM project idea before entering the stage of preparing a PDD and the subsequent validation procedures. Such a mechanism could facilitate discussions with industry and research and development institutes within the country at the planning stage.
It is important that within developing countries new technology CDM projects are linked to national strategies on energy planning to promote national focus, co-ordination, and resource allocation.
Enhanced capacity building associated with the technology transfer to meet local requirements should be part of the CDM project.
7.2.2. CDM Host Country Issues
The following issues have come out of the workshops with respect to the host country organisation of technology transfer through CDM projects and possible combinations with existing policy programmes (e.g. ODA):
7. Promotion/marketing of Designated National Authorities (DNAs) as one-stop-shops for CDM activities. This involves streamlining the process for foreign investors, as well as initiatives to build capacity within DNA and within sectors for project participants for all aspects of the CDM, including bundling of CDM projects and programmatic CDM. It is suggested that DNAs are assisted in achieving these tasks and build capacity by Government agencies specialised in development co-operation (e.g. DGIS in the Netherlands, DANIDA in Denmark, GTZ in Gemany, etc.). It is also important that DNAs do not operate in isolation from other policies and decision makers at the government level
129
(ministries of finance, development planning, energy, agriculture, trade, etc.) and that there are integration structures in place.
8. Support is also needed for the formulation of low-carbon CDM strategies by the host country based on national needs and priorities and suitable technologies for which technology implementation chains have been clearly mapped and streamlined along the lines explained in the ENTTRANS process in this study. As explained above it is important that these strategies are based on participatory processes and information collection and analysis with good two-way communications. Such strategies also involve awareness creation especially for industry and project proponents with trade associations to be involved. Technology choices also have to avoid the trap of least financial cost solutions and take account of the externalities. These low-carbon CDM strategies thus formulated should lead to a domestic CDM project pipeline in line with priorities identified as well as to market introductions.
9. CDM in its programmatic form could also support programmes of demonstration projects covering a range of sizes, sectors, locations, implementation models and scales of country conditions to prove and adapt the technologies using a participatory process. One-off projects can be useful but a portfolio or programme approach to projects should be preferred where possible.
10. Although formulating CDM strategies is a country-specific exercise depending on the different country contexts, it is also recommended that countries collaborate through regional co-operation in order to share experience and to establish South-South dialogues. For instance, the ENTTRANS analysis in the five case study countries could thus be expanded towards a regional scope: Chile – Latin America; China – Asia (e.g. India); Kenya – Sub-Sahara Africa; Israel – MEDA countries; Thailand – Southeast Asia (e.g. Lao PDR, Vietnam, Nepal, Cambodia). Countries could use the ENTTRANS methodology for energy service and technology assessments with market mapping and supporting activities promoting low carbon technology transfers through CDM projects.
11. Assistance to project developers for PDD to reduce transaction costs taking account of language barriers could improve uptake of CDM opportunities. Accessible and simple information for people to undertake a project design document would be a first step. Accessibility is an issue in countries where Internet connections are not reliable. Equally important to reduce costs and stimulate local interest will be support for programmes to develop local accredited validation and verification entities to reduce CDM project cycle costs. Guarantees for the purchase of CERs in this commitment period and post Kyoto such as those by the World Bank would also contribute to minimising risks and costs.
12. CDM projects to be linked with development initiatives where appropriate. Although CDM projects should not use Official Development Assistance (ODA) funds for the investment and acquisition of CERs, the expertise in development co-operation projects would be a valuable input for the CDM projects as suggested at COP-MOP-2 held in Nairobi (Kenya, November 2007). Such deliberate links between CER acquisition and development assistance experts would ensure maximisation of local development benefits under the CDM.
7.2.3. CDM at the international level
Streamlining CDM procedures to make the mechanism more accessible for investments in, e.g., small-scale projects or energy efficiency activities across a range of installations in an industrial sector is the main aim of the following recommendations:
6. Explicit guidance on Technology Transfer and avoidance of dumping needs to be incorporated into the modalities of the CDM
7. Review the additionality concept: for some developing countries there are no other projects which would be undertaken in the absence of the project and the country circumstances should be recognised when assessing additionality of emission reductions. It would be therefore better to have a more positive approach to additionality in the sense that a project is additional because it is required a) to
130
adopt a participatory approach to the project design and development and b) to establish capacity building actions such as setting up ongoing training schemes to maximise the transfer and local benefits. This would at the same time stimulate the involvement of local stakeholders in project identification and preparation and would thus enhance participatory process in the preparation of projects.
8. In order to make the CDM fit for technology transfer and for sustainable development it could be used mainly in the programmatic mode. Programmatic CDM can be used to demonstrate new technologies under a range of different
circumstances in the country and this has to be supported by the specific activities detailed under Technology Transfer issues and CDM host country issues (both detailed above) otherwise it will not support technology transfer. These specific supporting actions could themselves become a programmatic CDM project.
Programmatic CDM is very suitable for energy efficiency improvement projects in households (e.g. cooking, lighting) and industry (e.g. one technology applied within an industrial sector at different locations but under similar circumstances), but its applicability needs to be improved by: Streamlined programme approval and registration procedures (presently around 400 days), Allowing more than one methodology for baselines and monitoring for calculating the
emission reductions of activities within the programme (e.g. methodologies for insulation and fuel switch within a built environment retrofit programme), which is presently limited to one methodology only.
Programmatic CDM requires monitoring modalities: case-by-case monitoring of activities’ performance when activities within the programme are large-scale; sample monitoring when activities are small-scale.
9. Enable the development of new methodologies for GHG accounting procedures (including baselines) of CDM projects by experts (as a result of research) to be given to developers and the EB rather than the developers bearing the costs of preparing new methodologies by themselves, as is current practice.
10. Devise alternative schemes to minimise the up front loading of costs of PDD, for example by using CERs to pay the costs either by paying later or by borrowing or by using an increase in the levy to assist in offsetting the costs as well as by support for increased accreditation of local entities.
7.3. Final recommendation at international Level
It is suggested that a new initiative be introduced under the UNFCCC to accelerate innovation. This would focus on the ENTTRANS integrated process from technology transfer network formation and ESNA assessment to technology demonstrations, technology needs assessment and final market innovation and supporting activities for the enabling business environment and market services as described above. The market network structures would be designed to link to energy strategies and markets as well as the CDM and would be facilitated by supporting actions for the enabling business environment and market support services. This would assist in accelerating the transfer process for less well known but potentially useful low carbon technologies. Additional measures to ensure delivery of sustainability benefits and monitoring would have to be built in to such a system.
It would be separate from and in addition to the CDM improvements suggested above, although it could inform a proposed CDM country portfolio.
Such a participatory process to develop low-carbon futures and accelerate the transfer of low-carbon technologies in line with the Bali Roadmap agreement of December 2007 would provide a roadmap for all Parties to move forward and would provide substance to ‘meaningful participation’ of developing and

131
developed countries in mitigation actions under a post-2012 climate policy regime. Possible targets for the amount of low-carbon technologies in the energy service mix over time would provide intermediate goals for eventual decarbonisation of the energy service systems in both developed and developing countries.
132
References
Abare, 2006, Technology: its role in economic development and climate change, 06.6; World Bank, 2006. Clean Energy and Development: towards an investment framework, DC2006-0002; IEA, 2006, Energy Technology Perspectives 2006.
ABN AMRO, 2007. Carbon Markets Overview, 29 October 2007.
Agnolucci, P., 2007. Wind electricity in Denmark: A survey of policies, their effectiveness and factors motivating their introduction, Renewable and Sustainable Energy Reviews, 11: 951-963, 2007.
Albu M. and A. Griffith, 2005, Mapping the Market: A framework for Rural Enterprise development policy and practice, Practical Action report http://practicalaction.org/?id=mapping_the_market
Albu M. and A. Griffiths, 2006, “Mapping the market: participatory market chain development in practice,” Small Enterprise Development, Vol.17 No.2, pp. 12-22.
Almond, F. and S. Hainsworth (editors), 2005. Beyond Agriculture – making markets work for the poor, Proceedings of an international seminar, CPHP, March 2005, London, UK.
American Wind Energy Association, 2001. Wind Energy Applications Guide, January. Available at: http://www.awea.org/pubs/documents/appguideformatWeb.pdf.
Batelle, 2005. Assessing Market Opportunities for CO2 Capture and Storage (CCS) in China, Power Point presentation, 29 September 2005.
Bauer, R.A., 1960. “Consumer behavior as risk-taking”, In: Hancock, R.S., Editor, 1960. Dynamic marketing for a changing world, American Marketing Association, Chicago, pp. 389–98.
Beck, F. and E. Martinot, 2004. Renewable Energy Policies and Barriers, Encyclopedia of Energy, Pages 365-383
Bergek, A. and S. Jacobsson, 2002. The emergence of a growth industry: a comparative analysis of the German, dutch and Swedich wind turbibe industries, in: S. Metcalfe and U. Canter (eds.). Change, Transformation and development: Schupeterian perspectives, pp. 197-228, Heidelberg: Physica/Springer
Bernet, T., A. Devaux, O. Ortiz and G. Thiele, 2005. Participatory market-chain approach, BeraterInnen News 1/2005, Lindau, Switzerland, available through www.sfiar.ch
Bhattacharya, S.C. and P. Abdul Salam, 2006. A Review of Selected Biomass Energy Technologies: Gasification, Combustion, Carbonization and Densification, A publication of Asian Regional Research Programme in Energy, Environment and Climate (ARRPEEC), April 2006.
Bonduki, Y., 2003. Assessing Technology Needs for Climate Change, National Communications Support Unit Handbook, United Nations Development Programme and Global Environment Facility.
Brewer, T. L., 2007. International climate change transfer: New paradigm and new policy agenda, at http://www.usclimatechange.com/ accessed in February 2008.
Bryan, Garnier&Co, 2006. Investment advise on Ecosecurities stocks, available from http://www.bryangarnier.com/ (password and username required.)
Castro, M. and C. Figueres, 2002.“The functions of a National Authority”, in: C. Figueres (ed.), Establishing National Authorities for the CDM – A Guide for Developing Countries, IISD/CSDA, pp.63-74
CDM EB, 2004. Indicative simplified baseline and monitoring methodologies for selected small-scale CDM project activity categories, Version 04: 22 October 2004
133
Chaparro M., L-R., 2006. “DNA structure and CDM project approval process in five Latin American Countries: Argentina, Brazil, Chile, Mexico, and Peru”, In: CDM Investment Newsletter Nr.2/2006. Nairobi and Vienna: Bureau of Environmental Analysis and Climate Business Network. pp.7-10, 2006.
China’s Statistics Press, 2001. 2001 China Statistical Yearbook, available at: http://chinadatacenter.org/chinadata
China’s Statistics Press, 2005. 2005 China Statistical Yearbook, available at: http://chinadatacenter.org/chinadata
COGEN Europe, 1999. European Cogeneration Review.
Comision Nacional de Energia, 2007. Chile’s Energy Security Policy, Santiago de Chile, Chile, available at: http://www.minmineria.cl/img/newsletter.ingles.noviembre.pdf
Commission Staff Working Document, 2004. The share of renewable energy in the EU, Country Profiles, Overview of Renewable Energy Sources in the Enlarged European Union, Brussels, 2004
CTI, 2002, Methods for Climate Change Technology Transfer Needs Assessments and Implementing Activities: developing and transition country approaches and experiences; Climate Technology Initiative, March 2002.
Danish Energy Agency (DEA), 2002. Wind energy in Denmark, Danish Energy Agency, Copenhagen.
Darley, J.M. and J.R. Beninger, 1981. Diffusion of energy-conserving innovations. Journal of Social Issues, 37 (2), pp. 150-71.
DETR, 2000. Multi-criteria appraisal: A Manual. HMSO, London.
EGAT, 2004. Power Development Plan 2003 and Electricity Demand Forecast Report, January 2004, Bangkok, Thailand.
EGTT, 2008. TNA overview, available at: http://ttclear.unfccc.int/ttclear/jsp/index.jsp?mainFrame=../html/TNAOverview.html accessed on 28-01-2008.
Ellis, J., J. Corfee-Morlot, and H. Winkler, 2004. Taking stock of progress under the Clean Development Mechanism, COM/ENV/EPOC/IEA/SLT(2004)4/FINAL. Paris: OECD/IEA, 2004.
Ellis, J., 2006. Issues related to a programme of activities under the CDM, OECD, COM/ENV/EPOC/IEA/SLT (2006)3.
Ellis, J. and S. Kamel, 2007. Overcoming Barriers to Clean Development Mechanism Projects, COM/ENV/EPOC/IEA/SLT(2007)3.
ENTTRANS, 2008. Synthesis report on technology descriptions ‘Sustainable, low carbon technologies for potential use under the CDM’, Deliverable 5&6, FP-6, Paterswolde, the Netherlands.
ERI, CEERD, and JIN, 2007. Study on the Impact of the European Linking Directive 2004/101/EC (so-called CDM Linking Directive) for Thailand, EU-Thailand Economic Co-operation Small Project Facility, TH/SPF/G/12 (112374), Bangkok, Thailand, and Paterswolde, the Netherlands.
Ernst, D. and B-A. Lundvall, 1997. Information Technology in the learning economy: challenges for developing countries, DRUID working paper 97-11, Department of Business studies, Aalborg.
European Commission, 2005. Communication from the Commission, The support of electricity from renewable energy sources, Brussels, Belgium.
European Commission, 2007. Report of the Public Consultation on the European Strategic Energy Technology Plan (SET-Plan).
134
European Renewable Energy Council (EREC), 2007 Renewable Energy Technology Roadmap: up to 2020, Available at: http://www.erec.org/documents/publications.html
European Solar Thermal Industry (ESTIF), 2007. Solar Thermal Markets in Europe, available at: http://www.estif.org/9.0.html
Fankhauser S. and L. Lavric, 2003, The investment climate for climate investment: JI in transition countries, EBRD, Working paper No. 77, London.
Fenhann, J., 2007. CDM Pipeline Overview, UNEP Risø Centre, Denmark, monthly update, available at: http://www.cdmpipeline.org
Figueres, C., 2004. Institutional capacity to integrate economic development and climate change considerations – An assessment of DNAs in Latin America and the Caribbean, Inter-American Development Bank, Sustainable Development Department, Environment Division.
Figueres, C., and H. Olivas, H., 2002. “Evolution of National Authorities for the CDM,” In: Figueres, C. (ed.). Establishing National Authorities for the CDM: A guide for developing countries, Winnipeg and Washington, DC: International Institute for Sustainable Development and the Center for Sustainable Development in the Americas. pp.33-52.
Findsen, J., 2005. CDM Institutional Frameworks in Southern Europe and CIS, San Diego, CA: Science Applications International Corporation.
Foxon, T., R. Gross, and D. Anderson, 2003. Innovation in long-term renewables Options in the UK: Overcoming barriers and systems failures, London, ICCEPT Imperial College centre for Energy Policy and Technology.
GEF, 2005. Assessment of World bank/GEF strategy for the market development of concentrating Solar Thermal Power, GEF/C.25/Inf11, June 2005.
Ghana efficient lighting retrofit project, 2006. Ghana efficient lighting retrofit project, Version 9, 4 August 2006
Government of Chile, 2000. First National Communication Chile, from www.unfccc.int.
Griffith A and J. Edwards, 2006, An action-research on PMCA applications in Bangladesh, Sudan, Peru, Sri Lanka, Zimbabwe, Working Document, Practical Action, July 2006, http://practicalaction.org/?id=marketchain_report, 2006.
Grohnheit E., Denmark: long-term planning with different objectives. In: C. Vrolijk (Ed), Climate change and power, Economic instruments for European electricity, Earthscan Publications Ltd, London 2002, pp. 108–30.
Gruebler, A., 1997. Time for a Change: On the patterns of Diffusion and Innovation, International Institute for Applied Systems Analysis, Research report RR-97-3, January 1997.
GTZ Climate Protection Programme, 2007. CDM Highlights 53, October 2007 (2 November 2007).
Gu, S. and B-A. Lundvall, 2006. “China's innovation system and the move toward harmonious growth and endogenous innovation”, Innovation, Management, Policy & Practice, Vol. 8 No.1/2.
Guagnano, G., G.R. Hawkes, C. Acredolo, and N. White, 1986. Innovation Perception and Adoption of Solar Heating Technology, Journal of Consumer Affairs, Summer, 20 (1), pp. 48-64.
Hayashi, D., 2006. “Opportunities for aggregation under the CDM”, presentation delivered at Workshop on The Impact of the European Directive 2004/101/EC (Linking Directive) for Thailand,” Bangkok, Thailand, 13 December 2006.
Hirschman, A.O., 1958. The Strategy of Economic Development, YUP, Clinton, MA
Hobday, M., 1997, Innovation in East Asia, Edward Elgar, London.
135
Hobshawn, E. and G. Rude, 1968. Captain Swing, Pantheon books
IEA, 2003. Renewables for Power Generation – Status and Prospects, OECD and IEA, 2003.
IEA, 2006. Focus on Asia Pacific, Coal in China; Overview and possible areas of international co-operation, OECD/IEA, Paris, France, October 2006.
IEA, 2006a, Energy Technology Perspective: scenario & strategies to 2050, in support of the G-8 Plan of Action, Paris, France.
IISD, 1997, Report Of The Third Conference Of The Parties To The United Nations Framework Convention On Climate Change: 1 – 11 December 1997, vol.12, no.76, 13 December 1997.
IPCC, 2000 - Bert Metz, Ogunlade Davidson, Jan-Willem Martens, Sascha Van Rooijen and Laura Van Wie Mcgrory (Eds.), Methodological and Technological Issues in Technology Transfer, Cambridge University Press, UK. Pp. 432
Jahn, M., A. Michaelowa, S. Raubenheimer, and H. Liptow, 2004. Measuring the potential of unilateral CDM – A pilot study, HWWA Discussion Paper 263
Jepma, C.J., 2005. Unilateral CDM on the Horizon – Editor’s Note, Joint Implementation Quarterly, Vol. 11 - No. 1, April 2005.
JIN, 2007, “Thailand Approves its First Set of CDM Projects”, Joint Implementation Quarterly, vol.13, nr.1, p.7.
Johnson, B., 1992. Institutional learning in ‘National Innovation Systems: Towards a theory of Innovation and Interactive Learning,’ Lundvall, B-A, Pinter, London
Karagiorgas, M. and T. Botzios, 1999. GSR Experience in Industrial Applications of Solar Thermal Systems in Greece, CRES paper for Solar Hot Water with Guaranteed results.
Karnoe, P., 1996. The social process of competence building. International journal of Technology management, 11(7-6), pp. 770-89.
Laseur, J., 2005. Unilateral CDM – Addressing the participation of developing countries in CDM project development, International Economics & Business Master thesis, University of Groningen, http://jiq.wiwo.nl/unilateralcdm.pdf
Lee, M-K (ed.)., 2004. CDM information and guidebook: second edition, Rosklide: UNEP Risø Centre, Denmark.
Leonard-Barton, D., 1981. “Voluntary simplicity lifestyles and energy conservation”, Journal of Consumer Research, Vol. 8, pp. 243-52.
Library of Congress, 2007. Federal Research Division Country Profile: Kenya, June 2007.
Liu Deshun, 2001. Building Frameworks for CDM Carbon Market To Meet Developing Countries’ Needs, International Workshop on Social-Economy Assessment for CDM and Other Mechanisms, 15-16 March 2001 Xindadu Hotel, Beijing, China, www.iges.or.jp/en/cp/output_all/workshop/ClimateAsia/ china/presentation/CPD-C-4.pdf
Lorenzen, K.H., 2001. Report on fiscal incentives and subsidy schemes influencing the use of renewable energy in Denmark, Altener, Ener-IURE project phase II, 2001.
Lundvall, B-A., 1985. Product Innovation and User-Producer interaction, Aalborg University Press, Aalborg.
Lundvall, B-A, B. Johnson, E.S. Andersen, and B. Dalum, 2002. “National systems of production, innovation and competence building,” Research Policy, 31, pp. 213-31
MacGiffin, G., 2007. MF Global Weekly CDM and Voluntary Markets Commentary, 1-7 December 2007, 07 December 2007, 18:06 PM.
136
Martinot, E., 2006. Renewables: Global Status Report, 2006 Update, REN21, www.ren21.net;
Masinda, M.T., 2005. National Systems Of Innovation: Implications On Science And Technology Policies In Sub -Saharan Africa, CPROST Report # 98-05.
Matysek, A., M. Ford, G. Jakeman, A.Gurney, and B.S. Fisher, 2006. Technology: Its Role in Economic Development and Climate Change, ABARE Research Report 06.6, prepared for Australian government Department of Industry, Tourism and Resources, Canberra, Australia.
Mellado, P., 2007. Programa País Eficiencia Energética y el Mecanismo de Desarrollo Limpio, Jefa de Áreas Industria y Minería Foro Latinoamericano del Carbono on 6 Sept. 2007.
Meyer, N.I., 2004. Renewable energy policy in Denmark, Energy Sustain. Dev. 3 (1), pp. 25-35.
Michaelowa, A., 2008. Project performance under CDM so far, Austrian JI/CDM Workshop, January 24, 2008, Perspectives GmbH.
Muriithi, J., 2006. Developing Small Hydropower Infrastructure in Kenya, 2nd Small Hydropower For Today Conference IN-SHP, Hangzhou, China, 22-25 April 2006.
National Development and Reform Commission People’s Republic of China, 2007. China’s National Climate Change Programme, http://en.ndrc.gov.cn/newsrelease/P020070604561191006823.pdf
Netherlands Ministry of Foreign Affairs, 2007. Clean and sustainable? An evaluation of the contribution of the Clean Development Mechanism to sustainable development in host countries, IOB Evaluations, no. 307, December 2007, the Hague, the Netherlands.
Nilsson, L.J., L. Lopes, P. Fonseca, M. Araújo, and N. Lablanca, 2007. IEE project “EMEEES-Evaluation and Monitoring for the EU Directive on Energy End-Use Efficiency and Energy Services”, WP 2 report: Briefing on existing evaluation practice and experience.
Nondek L. and Arquit Niederberger A., 2005, Statistical Analysis of CDM Capacity-Building Needs Climate Policy, 4, pp. 249-68.
Nondek L., Maly M., Splitek V., Pretel J., 2001, JI in the context of EU accession: The case of the Czech Republic. PCF Plus, Report 7, Washington DC
O’Ryan and Febré Ingenieros Consultores, 2006. Global and Local Environmental and Energy Security Benefits of the Development of the Renewable Energy Sector in Chile, April 2006
OECD, 2006. Barriers to Technology Diffusion: The Case of Solar Thermal Technologies, Paris, France
OPET, 2001. Danish legislation in the field of renewable energy, Taastrup, Denmark
Ostland, L. E., 1973-74. “Interpersonal Communication Following McGovern’s Eageleton Decision,” Public Opinion Quarterly, 37, pp. 601-10.
Philibert , C., 2006. Barriers to Technology Diffusion: The case of Solar Thermal technologies, IEA/OECD report to UNFCCC, October 2006. Available at http:unfccc.int
Rip, A. and R. Kemp, 1998. Towards a theory of sociotechnical change. In: S. Rayner and E.L. Majone (red.). Human choice and climate change. Ohio: Batelle Press, 1998.
Reuters Carbon Community, 2007. Carbon Market News, Prices & Analysis, 4 December 2007.
Reijnders, L., 2002. Imports as a major complication: liberalisation of the green electricity market in the Netherlands, Energy Policy, 30(9), pp.723-6.
Rogers, E.M., 1983. Diffusion of Innovations, 3rd ed., The Free Press, New York, NY.
Rogers, E.M., 1995. Diffusion of innovations (4th edition). The Free Press. New York.
137
Rogers, E.M., 2003. Diffusion of Innovations, 5th ed., The Free Press, New York, NY,
Rogers, E.M. and F.F. Shoemaker, 1971. Communication of Innovations, 2nd ed., The Free Press, New York, NY.
Rothwell, R., 1977. The characteristics of successful innovators and technically progressive firms, R&D Manage, 7 (3), pp. 191-206.
Sanhueza, J.E., 2006. Stakeholder assessment CHILE, presentation at ENTTRANS mid-term assessment meeting, 6 December 2006, Athens, Greece.
Schumpeter, J.A., 1939. Business Cycles, A theoretical, Historical and Statistical analysis of the Capitalist process, Vols I and II, Mcgraw-Hill, New York.
SenterNovem, 2007. Energy Investment Tax Relief (Netherlands), http://www.senternovem.nl/eia/English.asp, 2007
Shama, A., and J. Wisenbilt, 1984. “Values of voluntary simplicity: Lifestyle and Motivation”, Psychological Reports, Vol. 55, pp. 231–40.
Thai Ministry of Energy, 2003. Technical potential and Targets - Energy Strategy for Competitiveness, Bangkok, Thailand, available at: http://www.eppo.go.th/admin/moe-workshop1/index.html
Therdyothin, A., S. C. Bhattacharya, and S. Chirarattananon, 1992. Electricity generation potential of Thai sugar mills, Energy Sources, 14: pp. 367-80.
Visakhapatnam CDM project, 2007. Visakhapatnam (India) OSRAM CFL distribution CDM Project (Version 1), 23 August 2007, available at http://cdm.unfccc.int.
World Bank, 2005. Technical and Economic Assessment: off-grid, mini-grid and grid electrification technologies, prepared for Energy Unit, Energy and Water Department, the World Bank; Discussion Paper, Energy Unit, Energy and Water Department, The World Bank, November 2005
UN, 1992. United Nations Convention on Climate Change, Geneva, Switzerland, available at: http://unfccc.int/resource/docs/
UNEP and IEA, 2007. Analysing Our Energy Future, Some Pointers for Policy-makers.
UNEP Risø Centre, after Fenhann, 2007. CDM pipeline, available at: http://www.cdmpipeline.org
UNFCCC, 1998. The Kyoto Protocol to the United Nations Framework Convention on Climate Change, http://unfccc.int/resource/docs/convkp/kpeng.pdf
UNFCCC, 2002. Report of the Conference of the Parties on its Seventh Session, held at Marrakesh from 29 October to 10 November 2001, FCCC/CP/2001/13, 21 January 2002.
UNFCCC, 2005. Decision 2/CMP.1 - Principles, nature and scope of the mechanisms pursuant to Articles 6, 12 and 17 of the Kyoto Protocol, FCCC/KP/CMP/2005/8/Add.1, Page 4.
UNFCCC, 2006, Synthesis Report on Technology Needs Identified by Parties not included in Annex I to the Convention, FCCC/SBSTA/2006/INF.1.
Unruh, G.C. 2000, Understanding carbon lock-in, Energy Policy 28(12), 817-830
Unruh, G.C, 2002. Escaping carbon lock-in. Energy Policy, 30(4) 317-325.
USGS, 2005. Minerals Yearbook, Santiago de Chile, Chile.
Vassilakos, N.P., N. Karapanagiotis, D. Fertis and K. Tigas, 2003. Methods of Financing Renewable Energy Investments in Greece, Centre for Renewable Energy Sources (CRES).
138
VROM, 2003. Implementation of the Clean Development Mechanism by The Netherlands, 29 May, Ministry of Housing, Spatial Planning and the Environment, The Hague, The Netherlands.
WADE, 2003. Guide to Decentralized Energy Technologies, Edinburgh, UK, www.localpower.org;
Westling, H., 1997. Status of pilot project. Documentation for the expert meeting in Helsinki, September 1997.
Winskel. M., A. Mcleod, R. Wallace, and R. Williams, 2006. “Energy Policy and the institutional context: marine energy innovation systems,” Energy Policy, 33, 5, pp. 365-76.
World Coal Institute, 2004. Clean Coal – Building a Future Through Technology, www.wcicoal.com/uploads/WCICleanCoalReport.pdf.
Wücke, A. and A. Michaelowa, 2007. CDM Highlights 51, August 2007.
Wustenhagen, R., M. Wolsink, and M.J. Buerer, 2007. Social Acceptance of renewable energy innovation: An introduction to the concept, Energy Policy, 35, pp. 2683-91.
Zou Ji, 2002. Methodologies and Tools for Technology Needs Assessments: an Overview, Department of Environmental Economics and Management, Renmin University of China, presentation at SBSTA-16, Bonn, Germany, June 2002, available at: http://ttclear.unfccc.int/ttclear/presentations/SBSTA16/
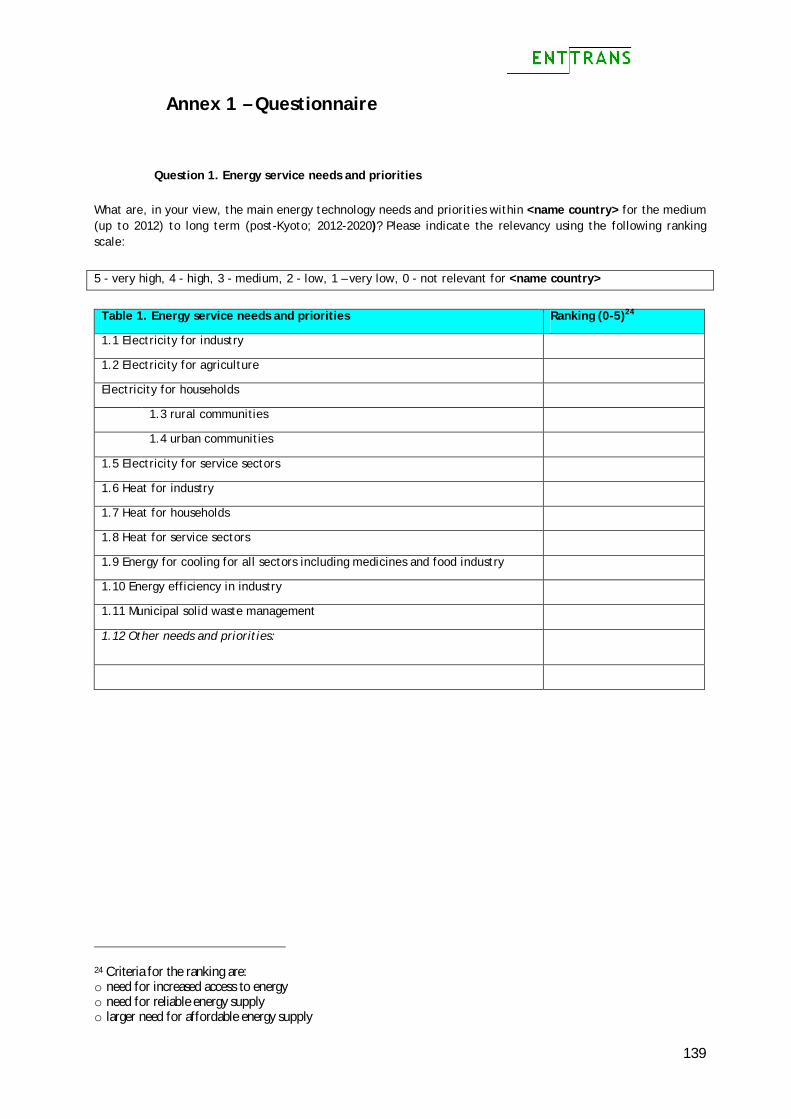
139
Annex 1 – Questionnaire
Question 1. Energy service needs and priorities
What are, in your view, the main energy technology needs and priorities within <name country> for the medium (up to 2012) to long term (post-Kyoto; 2012-2020)? Please indicate the relevancy using the following ranking scale:
5 - very high, 4 - high, 3 - medium, 2 - low, 1 – very low, 0 - not relevant for <name country>
Table 1. Energy service needs and priorities Ranking (0-5)24
1.1 Electricity for industry
1.2 Electricity for agriculture
Electricity for households
1.3 rural communities
1.4 urban communities
1.5 Electricity for service sectors
1.6 Heat for industry
1.7 Heat for households
1.8 Heat for service sectors
1.9 Energy for cooling for all sectors including medicines and food industry
1.10 Energy efficiency in industry
1.11 Municipal solid waste management
1.12 Other needs and priorities:
24 Criteria for the ranking are: o need for increased access to energy o need for reliable energy supply o larger need for affordable energy supply
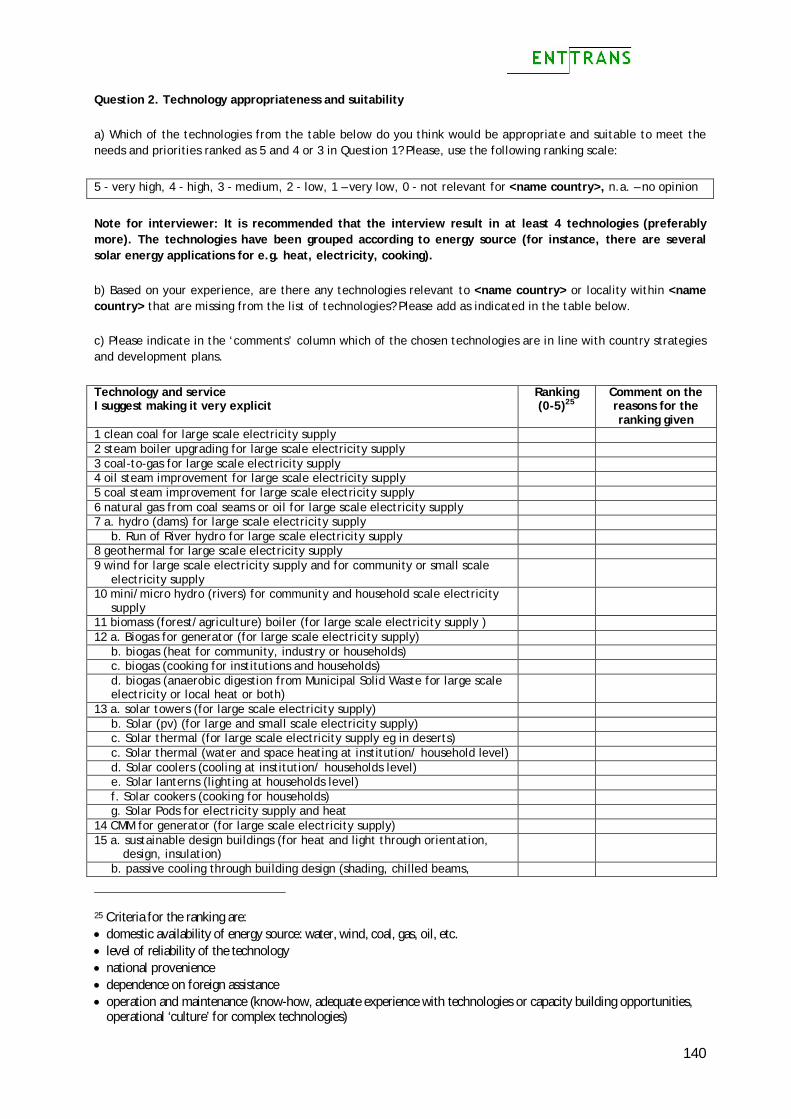
140
Question 2. Technology appropriateness and suitability
a) Which of the technologies from the table below do you think would be appropriate and suitable to meet the needs and priorities ranked as 5 and 4 or 3 in Question 1? Please, use the following ranking scale:
5 - very high, 4 - high, 3 - medium, 2 - low, 1 – very low, 0 - not relevant for <name country>, n.a. – no opinion
Note for interviewer: It is recommended that the interview result in at least 4 technologies (preferably more). The technologies have been grouped according to energy source (for instance, there are several solar energy applications for e.g. heat, electricity, cooking).
b) Based on your experience, are there any technologies relevant to <name country> or locality within <name country> that are missing from the list of technologies? Please add as indicated in the table below.
c) Please indicate in the ‘comments’ column which of the chosen technologies are in line with country strategies and development plans.
Technology and service I suggest making it very explicit
Ranking (0-5)25
Comment on the reasons for the ranking given
1 clean coal for large scale electricity supply 2 steam boiler upgrading for large scale electricity supply 3 coal-to-gas for large scale electricity supply 4 oil steam improvement for large scale electricity supply 5 coal steam improvement for large scale electricity supply 6 natural gas from coal seams or oil for large scale electricity supply 7 a. hydro (dams) for large scale electricity supply
b. Run of River hydro for large scale electricity supply 8 geothermal for large scale electricity supply 9 wind for large scale electricity supply and for community or small scale
electricity supply
10 mini/micro hydro (rivers) for community and household scale electricity supply
11 biomass (forest/agriculture) boiler (for large scale electricity supply ) 12 a. Biogas for generator (for large scale electricity supply)
b. biogas (heat for community, industry or households) c. biogas (cooking for institutions and households) d. biogas (anaerobic digestion from Municipal Solid Waste for large scale electricity or local heat or both)
13 a. solar towers (for large scale electricity supply) b. Solar (pv) (for large and small scale electricity supply) c. Solar thermal (for large scale electricity supply eg in deserts) c. Solar thermal (water and space heating at institution/ household level) d. Solar coolers (cooling at institution/ households level) e. Solar lanterns (lighting at households level) f. Solar cookers (cooking for households) g. Solar Pods for electricity supply and heat
14 CMM for generator (for large scale electricity supply) 15 a. sustainable design buildings (for heat and light through orientation,
design, insulation)
b. passive cooling through building design (shading, chilled beams, natural ventilation)
25 Criteria for the ranking are: domestic availability of energy source: water, wind, coal, gas, oil, etc. level of reliability of the technology national provenience dependence on foreign assistance operation and maintenance (know-how, adequate experience with technologies or capacity building opportunities,
operational ‘culture’ for complex technologies)

141
natural ventilation) 16 a Air Water or ground source heat pumps on-grid (community heat and
cooling or for industry)
b. Air Water or ground source heat pumps off-grid (heat and cooling for households or industry)
17 a. CHP coal/gas-based large-scale electricity and heat supply b. Micro CHP small-scale for electricity and heat for households /
commercial level
c. Biomass CHP at community or household level for electricity and heat 18 energy saving lamps (lighting end use in buildings) 19 efficient charcoal production (for households /commercial cooking) 20 improved cook stoves (for households /commercial cooking) 21 LPG and LNG (for households /commercial cooking) 22 cement industry energy efficiency/saving measures 23 iron & steel industry energy efficiency /saving measures 24 chemical industry energy efficiency /saving measures 25 agro & food industry (e.g. sugar) energy efficiency /saving measures 26 methane capture in landfills (MSW) for large scale electricity or local heat
or both
27 Combustion of Municipal Solid Waste (MSW) for district heat or electricity 28 Gasification of Municipal solid Waste for large scale electricity or heat or
both
29 Wave power for large and small scale electricity supply 30 Tidal power for large scale electricity supply 31 Ethanol Stove (from sugar production) for efficient cooking for
HH/institutions
32. Biogasification stove (wood or husks, etc.) for efficient cooking at institution/ households level (25l water boiled for 1 kg wood)
ADDITIONAL MISSING TECHNOLOGIES
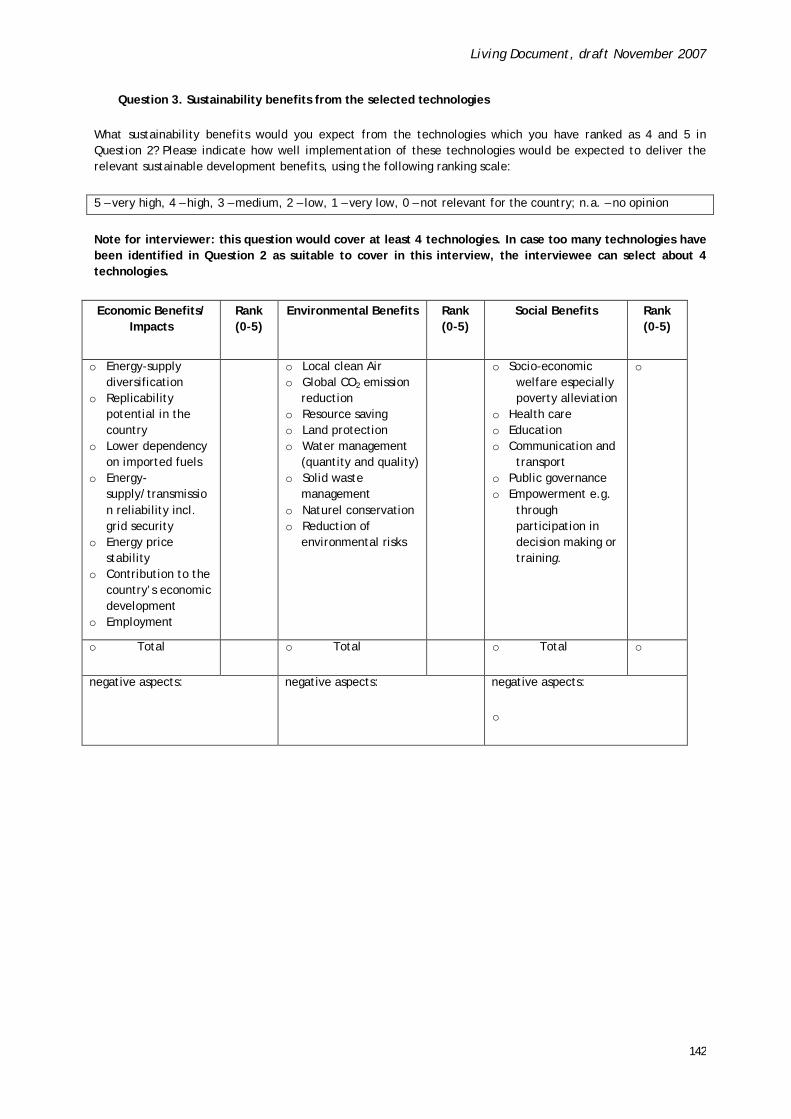
Living Document, draft November 2007
142
Question 3. Sustainability benefits from the selected technologies
What sustainability benefits would you expect from the technologies which you have ranked as 4 and 5 in Question 2? Please indicate how well implementation of these technologies would be expected to deliver the relevant sustainable development benefits, using the following ranking scale:
5 – very high, 4 – high, 3 – medium, 2 – low, 1 – very low, 0 – not relevant for the country; n.a. – no opinion
Note for interviewer: this question would cover at least 4 technologies. In case too many technologies have been identified in Question 2 as suitable to cover in this interview, the interviewee can select about 4 technologies.
Economic Benefits/ Impacts
Rank (0-5)
Environmental Benefits Rank (0-5)
Social Benefits Rank (0-5)
o Energy-supply diversification
o Replicability potential in the country
o Lower dependency on imported fuels
o Energy-supply/transmission reliability incl. grid security
o Energy price stability
o Contribution to the country’s economic development
o Employment
o Local clean Air o Global CO2 emission
reduction o Resource saving o Land protection o Water management
(quantity and quality) o Solid waste
management o Naturel conservation o Reduction of
environmental risks
o Socio-economic welfare especially poverty alleviation
o Health care o Education o Communication and
transport o Public governance o Empowerment e.g.
through participation in decision making or training.
o
o Total o Total o Total o
negative aspects: negative aspects:
negative aspects:
o
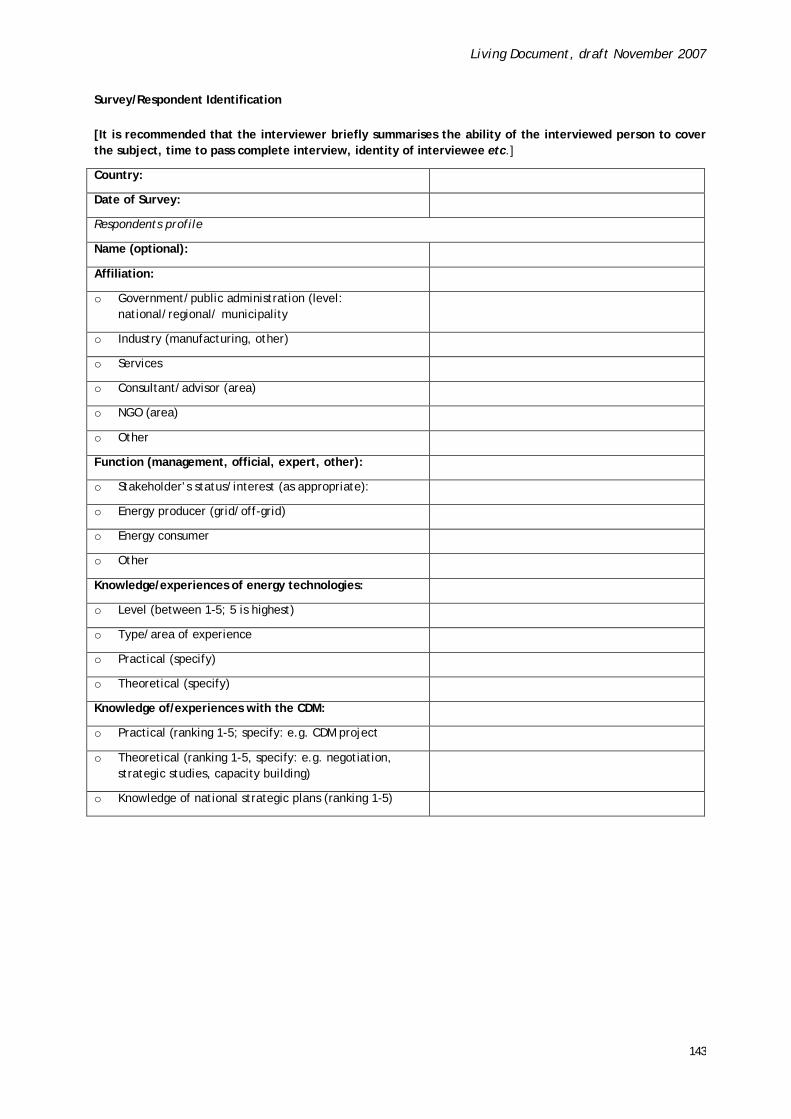
Living Document, draft November 2007
143
Survey/Respondent Identification
[It is recommended that the interviewer briefly summarises the ability of the interviewed person to cover the subject, time to pass complete interview, identity of interviewee etc.]
Country:
Date of Survey:
Respondents profile
Name (optional):
Affiliation:
o Government/public administration (level: national/regional/ municipality
o Industry (manufacturing, other)
o Services
o Consultant/advisor (area)
o NGO (area)
o Other
Function (management, official, expert, other):
o Stakeholder’s status/interest (as appropriate):
o Energy producer (grid/off-grid)
o Energy consumer
o Other
Knowledge/experiences of energy technologies:
o Level (between 1-5; 5 is highest)
o Type/area of experience
o Practical (specify)
o Theoretical (specify)
Knowledge of/experiences with the CDM:
o Practical (ranking 1-5; specify: e.g. CDM project
o Theoretical (ranking 1-5, specify: e.g. negotiation, strategic studies, capacity building)
o Knowledge of national strategic plans (ranking 1-5)