propagule pressure and colony social organization are ... · we characterized patterns of genetic...
TRANSCRIPT
Molecular Ecology (2012) 21, 817–833 doi: 10.1111/j.1365-294X.2011.05393.x
Propagule pressure and colony social organizationare associated with the successful invasion and rapidrange expansion of fire ants in China
CHIN-CHENG YANG,*† MARINA S. ASCUNCE,‡– LI -ZHI LUO,§ J ING-GUO SHAO,§
CHENG-JEN SHIH†** and DEWAYNE SHOEMAKER‡**
*Master Program for Plant Medicine, National Taiwan University, No. 1, Sec. 4, Roosevelt Road, Taipei 10617, Taiwan,
†Department of Entomology, National Taiwan University, No. 1, Sec. 4, Roosevelt Road, Taipei 10617, Taiwan, ‡USDA, ARS,
Center for Medical, Agricultural & Veterinary Entomology, 1600 ⁄ 1700 SW 23rd Drive, Gainesville, FL 32608, USA, §Institute
of Plant Protection, Chinese Academy of Agricultural Sciences, No. 2 West Yuanmingyuan Road, Beijing 100094, China
Corresponde
E-mail: dewa–Current add
University of
FL 32611, US
**These auth
� Published
Abstract
We characterized patterns of genetic variation in populations of the fire ant Solenopsisinvicta in China using mitochondrial DNA sequences and nuclear microsatellite loci to
test predictions as to how propagule pressure and subsequent dispersal following
establishment jointly shape the invasion success of this ant in this recently invaded area.
Fire ants in Wuchuan (Guangdong Province) are genetically differentiated from those
found in other large infested areas of China. The immediate source of ants in Wuchuan
appears to be somewhere near Texas, which ranks first among the southern USA infested
states in the exportation of goods to China. Most colonies from spatially distant, outlying
areas in China are genetically similar to one another and appear to share a common
source (Wuchuan, Guangdong Province), suggesting that long-distance jump dispersal
has been a prevalent means of recent spread of fire ants in China. Furthermore, most
colonies at outlier sites are of the polygyne social form (featuring multiple egg-laying
queens per nest), reinforcing the important role of this social form in the successful
invasion of new areas and subsequent range expansion following invasion. Several
analyses consistently revealed characteristic signatures of genetic bottlenecks for
S. invicta populations in China. The results of this study highlight the invasive
potential of this pest ant, suggest that the magnitude of international trade may serve as a
predictor of propagule pressure and indicate that rates and patterns of subsequent range
expansion are partly determined by the interplay between species traits and the trade and
transportation networks.
Keywords: fire ants, genetic structure, invasive species, jump dispersal, microsatellites,
mitochondrial DNA, pest management, social form, Solenopsis invicta
Received 21 December 2010; revision received 31 October 2011; accepted 2 November 2011
Introduction
Invasive species pose major threats to worldwide biodi-
versity, public health, agriculture and the economy, and,
nce: DeWayne Shoemaker, Fax: (352) 374 5818;
ress: Florida Museum of Natural History,
Florida, Museum Rd & Newell Dr, Gainesville,
A.
ors contributed equally.
2011. This article is a U.S. Government work and is in th
not surprisingly, their negative impacts are likely to con-
tinue to increase with increasing global human activities
(Sakai et al. 2001). Because invasive species often are
characterized by small founder population sizes, they
often remain undetected until the severity of their
impacts is overwhelming (Hulme 2006; Hulme et al.
2008). Successful strategies for alleviating the harmful
effects of invasives partly rely on reconstructing the
invasion history, tracing patterns of ongoing migration
and developing effective integrated management plans
e public domain in the USA.
818 C. -C. YANG ET AL.
that are compatible with the biology of the target inva-
sive species in newly colonized areas (Strayer et al.
2006). However, inference of invasion history and
migration routes of such species can be misleading or
unclear if historical data provide the only supporting
source of information. Further, observational field data
are often insufficient to discern an invading organism’s
reproductive biology or mode of dispersal, which is
highly relevant to the development of effective manage-
ment schemes. Population genetic approaches employ-
ing highly polymorphic genetic markers potentially
offer a powerful means to more fully resolve many of
these issues (i.e. understanding the invasion route,
demographic history, population connectivity or life his-
tory traits; Dlugosch & Parker 2008; Ficetola et al. 2008;
Fonseca et al. 2010). From a more basic perspective,
genetic data obtained from native and invasive popula-
tions also may be of additional utility for increasing our
understanding of the evolutionary mechanisms underly-
ing invasion success (Herborg et al. 2007; Darling et al.
2008).
Several ant species are considered to be among the
most damaging invaders worldwide (five ant species
are listed among the 100 worst alien invasive species
worldwide; ISSG website, http://www.issg.org/
worst100_species.html). Although not universal, the
success of many invasive ants has been correlated with
changes in behaviour, mating system, colony social
organization, genetic structure or pressure from natural
enemies (Suarez & Tsutsui 2008; Suarez et al. 2008; He-
lantera et al. 2009).
One of the most notorious invasive ant species is the
red imported fire ant, Solenopsis invicta. This ant was
inadvertently introduced into the southern USA from
South America in the 1930s and subsequently spread
rapidly throughout the southern states. More recently,
well-established populations of S. invicta have been
reported in other regions of the world, including Austra-
lia, Taiwan and China (McCubbin & Weiner 2002;
Huang et al. 2004; Zhang et al. 2007). As a result of its
significant pest status, an enormous amount of research
has been conducted to increase our understanding of the
basic biology of S. invicta, both in its native and intro-
duced USA ranges (reviewed in Tschinkel 2006).
Included among this work are a number of population
genetic studies of S. invicta relevant to understanding
the biology of the species in the USA and more recently
invaded areas. For instance, two previous population
genetic studies of S. invicta in Australia and Taiwan
revealed that patterns of genetic structure in these
recently invaded areas were similar to the patterns found
in the USA, with minor differences likely reflecting the
recency of introductions into the former areas (Henshaw
et al. 2005; Yang et al. 2008).
� Published 2011. This article is a
More recently, Ascunce et al. (2011) conducted a
detailed genetic study reconstructing the worldwide
invasion history of S. invicta. One major result from
that study was the finding that the immediate source of
fire ant infestations in countries of the Pacific Rim most
likely was the USA. The repeated successful introduc-
tions from the USA may result from particular popula-
tion traits that preadapted fire ants as a colonizer or
may be a consequence of higher propagule pressure
from the USA relative to other regions (Ascunce et al.
2011).
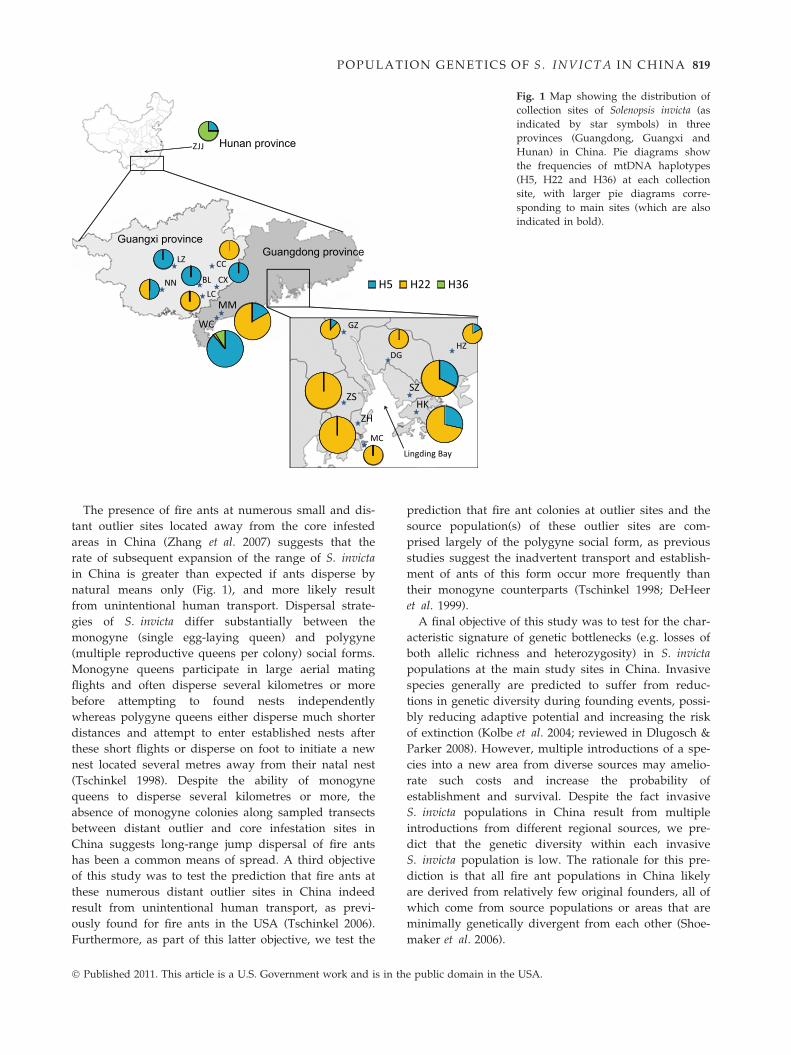
Ascunce et al. (2011) also demonstrated that fire ants
in mainland China generally belong to one of two dis-
tinct genetic clusters (China1 and China2), with one
comprised of populations from Hong Kong, Shenzhen
and Wuchuan and the other of populations from
Macao (Fig. 1). These authors suggested that these two
distinct genetic clusters reflect two separate invasions
of S. invicta into China. However, the fact that Wuchu-
an is geographically distant from the other two popula-
tions in the China1 cluster (approximately 450 km,
Fig. 1) with no record for ants occurring in intervening
areas raises suspicions that fire ants in the Wuchuan
area are the result of a separate third introduction.
Further support for this alternate hypothesis comes
from the fact that Hong Kong and Shenzhen popula-
tions of S. invicta are in close proximity to interna-
tional commerce centres in south-eastern China,
whereas Wuchuan is not but is instead close to another
international hub (i.e. Zhanjiang) that primarily coordi-
nates trade for south-western China. The first objective
of the present study was to employ extensive genetic
data to test our prediction that fire ants in Wuchuan
result from a separate third introduction of fire ants
into China from the USA.
The second objective of this study was to test the pre-
diction that the US source population or region of ants
for the presumable third introduction into China repre-
sents an area in the USA with the highest level of
exports destined for China (estimated from data on the
overall amount of total exports from each state within
the USA to China). Historical records indicate that fire
ants, like many other invasive species, likely are trans-
ported as cargo stowaways (Krushelnycky et al. 2005;
Wetterer & Snelling 2006; Zhang et al. 2007), suggesting
increasing volume and frequency of international trade
will lead to higher propagule pressure and invasion
potential. Thus, we predict that the volume of trade
from fire ant–infested areas potentially may serve as a
general predictor of the potential of different fire ant
populations serving as the source of recent or new out-
breaks of fire ants, such as those found in Wuchuan
(Levine & D’Antonio 2003; Westphal et al. 2008; Sim-
berloff 2009).
U.S. Government work and is in the public domain in the USA.
ZJJ
HK
SZZS
ZH
MC
HZDG
GZ
MM
WC
LC
BL CXNN
CCLZ
Lingding Bay
Guangdong provinceGuangxi province
Hunan province
H5 H22 H36
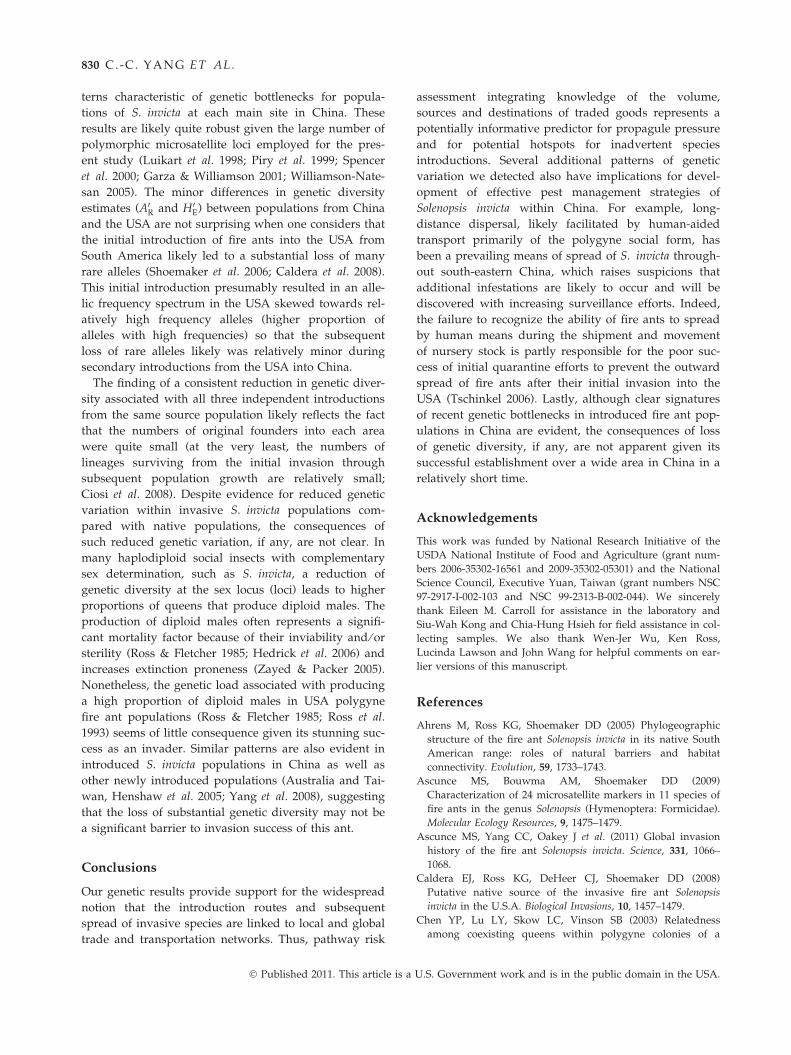
Fig. 1 Map showing the distribution of
collection sites of Solenopsis invicta (as
indicated by star symbols) in three
provinces (Guangdong, Guangxi and
Hunan) in China. Pie diagrams show
the frequencies of mtDNA haplotypes
(H5, H22 and H36) at each collection
site, with larger pie diagrams corre-
sponding to main sites (which are also
indicated in bold).
POPULATION GENETICS OF S . INVICTA I N CHI NA 819
The presence of fire ants at numerous small and dis-
tant outlier sites located away from the core infested
areas in China (Zhang et al. 2007) suggests that the
rate of subsequent expansion of the range of S. invicta
in China is greater than expected if ants disperse by
natural means only (Fig. 1), and more likely result
from unintentional human transport. Dispersal strate-
gies of S. invicta differ substantially between the
monogyne (single egg-laying queen) and polygyne
(multiple reproductive queens per colony) social forms.
Monogyne queens participate in large aerial mating
flights and often disperse several kilometres or more
before attempting to found nests independently
whereas polygyne queens either disperse much shorter
distances and attempt to enter established nests after
these short flights or disperse on foot to initiate a new
nest located several metres away from their natal nest
(Tschinkel 1998). Despite the ability of monogyne
queens to disperse several kilometres or more, the
absence of monogyne colonies along sampled transects
between distant outlier and core infestation sites in
China suggests long-range jump dispersal of fire ants
has been a common means of spread. A third objective
of this study was to test the prediction that fire ants at
these numerous distant outlier sites in China indeed
result from unintentional human transport, as previ-
ously found for fire ants in the USA (Tschinkel 2006).
Furthermore, as part of this latter objective, we test the
� Published 2011. This article is a U.S. Government work and is in th
prediction that fire ant colonies at outlier sites and the
source population(s) of these outlier sites are com-
prised largely of the polygyne social form, as previous
studies suggest the inadvertent transport and establish-
ment of ants of this form occur more frequently than
their monogyne counterparts (Tschinkel 1998; DeHeer
et al. 1999).
A final objective of this study was to test for the char-
acteristic signature of genetic bottlenecks (e.g. losses of
both allelic richness and heterozygosity) in S. invicta
populations at the main study sites in China. Invasive
species generally are predicted to suffer from reduc-
tions in genetic diversity during founding events, possi-
bly reducing adaptive potential and increasing the risk
of extinction (Kolbe et al. 2004; reviewed in Dlugosch &
Parker 2008). However, multiple introductions of a spe-
cies into a new area from diverse sources may amelio-
rate such costs and increase the probability of
establishment and survival. Despite the fact invasive
S. invicta populations in China result from multiple
introductions from different regional sources, we pre-
dict that the genetic diversity within each invasive
S. invicta population is low. The rationale for this pre-
diction is that all fire ant populations in China likely
are derived from relatively few original founders, all of
which come from source populations or areas that are
minimally genetically divergent from each other (Shoe-
maker et al. 2006).
e public domain in the USA.
820 C. -C. YANG ET AL.
We tested the above predictions by conducting a
detailed population genetic study of S. invicta in China
using a large set of samples from numerous sites
throughout China not reported in Ascunce et al. (2011)
and a large number of informative genetic markers
(67 microsatellite loci and mitochondrial sequences)
combined with a diverse suite of genetic analyses. The
results from this study provide a comprehensive over-
view of the population genetic structure of S. invicta in
China as well as baseline information for integrated
pest management of this ant species and for studies of
evolutionary changes associated with very recent fire
ant invasions.
Materials and methods
Historical records of fire ant invasion into Chinaand collection of study samples
Solenopsis invicta was first reported in Hong Kong (HK)
and Wuchuan (WC), Guangdong Province, in Septem-
ber 2004 and then reported in Shenzhen (SZ), Zuhai
(ZH) and Macao (MC), Guangdong Province, in early
2005 (Zeng et al. 2005). Since then, sites near these out-
break populations [Dongguan (DG), Huizhou (HZ), Gu-
angzhou (GZ), Zhongshan (ZS) and Maoming (MM),
Guangdong Province] have been infested successively
by S. invicta. More recently, this pest ant has been dis-
covered in multiple areas much further away from each
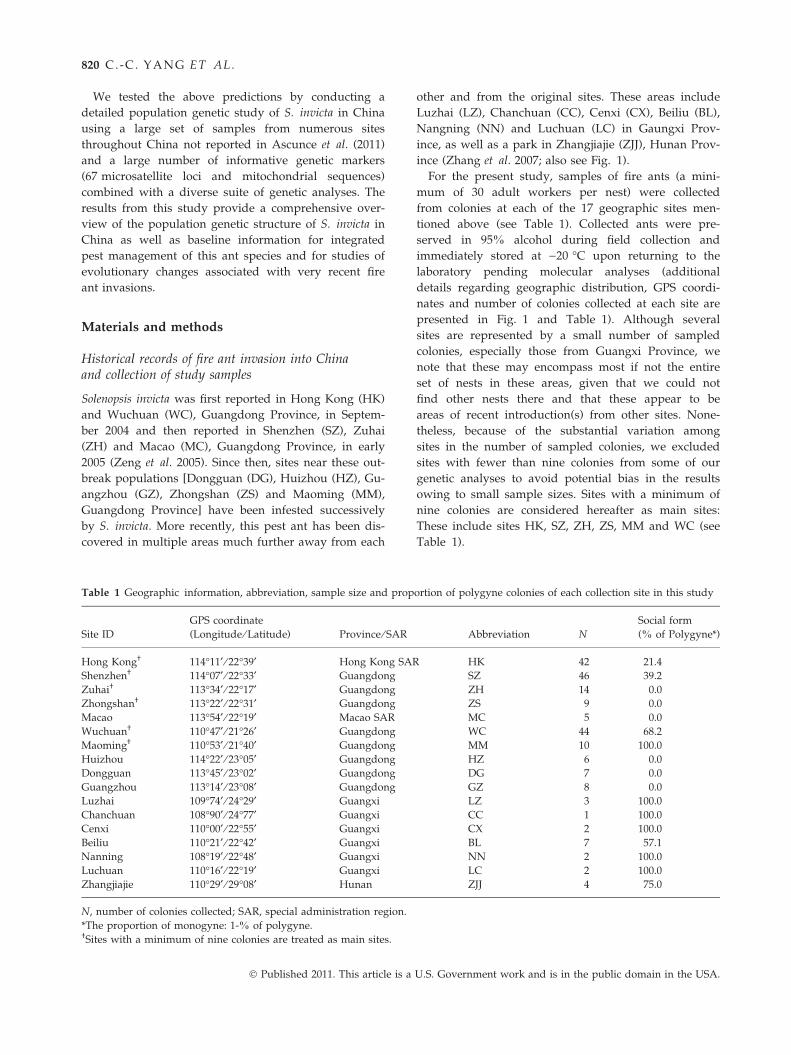
Table 1 Geographic information, abbreviation, sample size and prop
Site ID
GPS coordinate
(Longitude ⁄ Latitude) Province ⁄ SAR
Hong Kong† 114�11¢ ⁄ 22�39¢ Hong Kong SAR
Shenzhen† 114�07¢ ⁄ 22�33¢ Guangdong
Zuhai† 113�34¢ ⁄ 22�17¢ Guangdong
Zhongshan† 113�22¢ ⁄ 22�31¢ Guangdong
Macao 113�54¢ ⁄ 22�19¢ Macao SAR
Wuchuan† 110�47¢ ⁄ 21�26¢ Guangdong
Maoming† 110�53¢ ⁄ 21�40¢ Guangdong
Huizhou 114�22¢ ⁄ 23�05¢ Guangdong
Dongguan 113�45¢ ⁄ 23�02¢ Guangdong
Guangzhou 113�14¢ ⁄ 23�08¢ Guangdong
Luzhai 109�74¢ ⁄ 24�29¢ Guangxi
Chanchuan 108�90¢ ⁄ 24�77¢ Guangxi
Cenxi 110�00¢ ⁄ 22�55¢ Guangxi
Beiliu 110�21¢ ⁄ 22�42¢ Guangxi
Nanning 108�19¢ ⁄ 22�48¢ Guangxi
Luchuan 110�16¢ ⁄ 22�19¢ Guangxi
Zhangjiajie 110�29¢ ⁄ 29�08¢ Hunan
N, number of colonies collected; SAR, special administration region.
*The proportion of monogyne: 1-% of polygyne.†Sites with a minimum of nine colonies are treated as main sites.
� Published 2011. This article is a
other and from the original sites. These areas include
Luzhai (LZ), Chanchuan (CC), Cenxi (CX), Beiliu (BL),
Nangning (NN) and Luchuan (LC) in Gaungxi Prov-
ince, as well as a park in Zhangjiajie (ZJJ), Hunan Prov-
ince (Zhang et al. 2007; also see Fig. 1).
For the present study, samples of fire ants (a mini-
mum of 30 adult workers per nest) were collected
from colonies at each of the 17 geographic sites men-
tioned above (see Table 1). Collected ants were pre-
served in 95% alcohol during field collection and
immediately stored at )20 �C upon returning to the
laboratory pending molecular analyses (additional
details regarding geographic distribution, GPS coordi-
nates and number of colonies collected at each site are
presented in Fig. 1 and Table 1). Although several
sites are represented by a small number of sampled
colonies, especially those from Guangxi Province, we
note that these may encompass most if not the entire
set of nests in these areas, given that we could not
find other nests there and that these appear to be
areas of recent introduction(s) from other sites. None-
theless, because of the substantial variation among
sites in the number of sampled colonies, we excluded
sites with fewer than nine colonies from some of our
genetic analyses to avoid potential bias in the results
owing to small sample sizes. Sites with a minimum of
nine colonies are considered hereafter as main sites:
These include sites HK, SZ, ZH, ZS, MM and WC (see
Table 1).
ortion of polygyne colonies of each collection site in this study
Abbreviation N
Social form
(% of Polygyne*)
HK 42 21.4
SZ 46 39.2
ZH 14 0.0
ZS 9 0.0
MC 5 0.0
WC 44 68.2
MM 10 100.0
HZ 6 0.0
DG 7 0.0
GZ 8 0.0
LZ 3 100.0
CC 1 100.0
CX 2 100.0
BL 7 57.1
NN 2 100.0
LC 2 100.0
ZJJ 4 75.0
U.S. Government work and is in the public domain in the USA.
POPULATION GENETICS OF S . INVICTA I N CHI NA 821
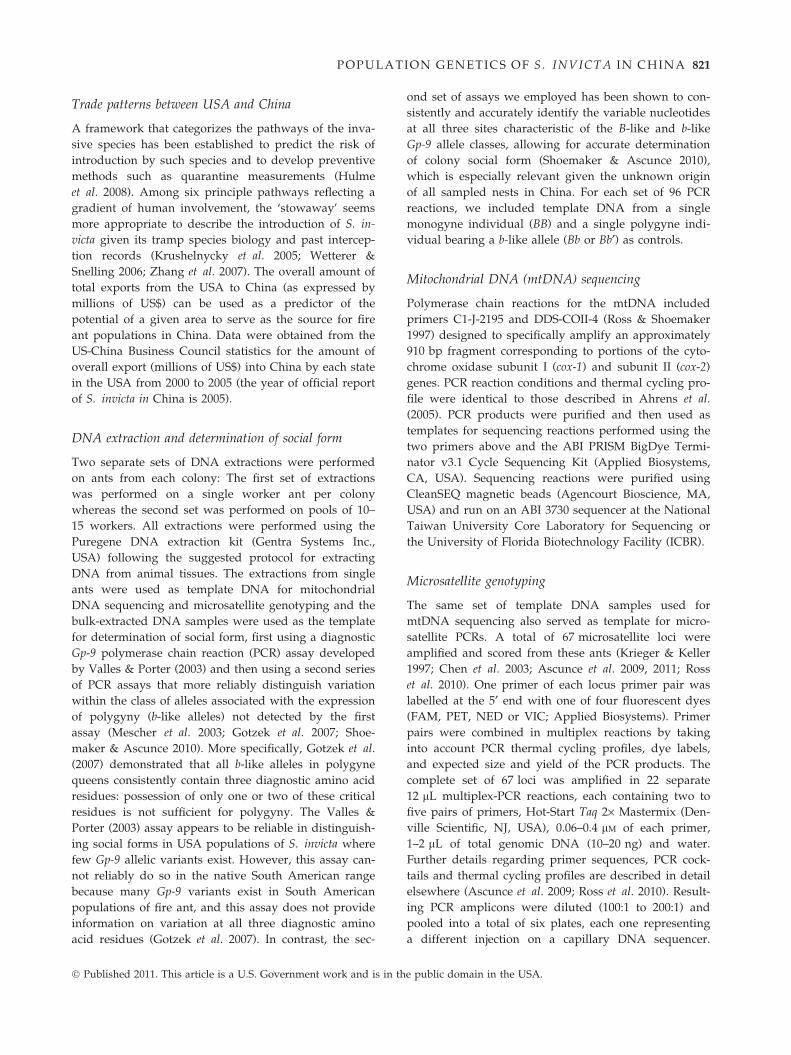
Trade patterns between USA and China
A framework that categorizes the pathways of the inva-
sive species has been established to predict the risk of
introduction by such species and to develop preventive
methods such as quarantine measurements (Hulme
et al. 2008). Among six principle pathways reflecting a
gradient of human involvement, the ‘stowaway’ seems
more appropriate to describe the introduction of S. in-
victa given its tramp species biology and past intercep-
tion records (Krushelnycky et al. 2005; Wetterer &
Snelling 2006; Zhang et al. 2007). The overall amount of
total exports from the USA to China (as expressed by
millions of US$) can be used as a predictor of the
potential of a given area to serve as the source for fire
ant populations in China. Data were obtained from the
US-China Business Council statistics for the amount of
overall export (millions of US$) into China by each state
in the USA from 2000 to 2005 (the year of official report
of S. invicta in China is 2005).
DNA extraction and determination of social form
Two separate sets of DNA extractions were performed
on ants from each colony: The first set of extractions
was performed on a single worker ant per colony
whereas the second set was performed on pools of 10–
15 workers. All extractions were performed using the
Puregene DNA extraction kit (Gentra Systems Inc.,
USA) following the suggested protocol for extracting
DNA from animal tissues. The extractions from single
ants were used as template DNA for mitochondrial
DNA sequencing and microsatellite genotyping and the
bulk-extracted DNA samples were used as the template
for determination of social form, first using a diagnostic
Gp-9 polymerase chain reaction (PCR) assay developed
by Valles & Porter (2003) and then using a second series
of PCR assays that more reliably distinguish variation
within the class of alleles associated with the expression
of polygyny (b-like alleles) not detected by the first
assay (Mescher et al. 2003; Gotzek et al. 2007; Shoe-
maker & Ascunce 2010). More specifically, Gotzek et al.
(2007) demonstrated that all b-like alleles in polygyne
queens consistently contain three diagnostic amino acid
residues: possession of only one or two of these critical
residues is not sufficient for polygyny. The Valles &
Porter (2003) assay appears to be reliable in distinguish-
ing social forms in USA populations of S. invicta where
few Gp-9 allelic variants exist. However, this assay can-
not reliably do so in the native South American range
because many Gp-9 variants exist in South American
populations of fire ant, and this assay does not provide
information on variation at all three diagnostic amino
acid residues (Gotzek et al. 2007). In contrast, the sec-
� Published 2011. This article is a U.S. Government work and is in th
ond set of assays we employed has been shown to con-
sistently and accurately identify the variable nucleotides
at all three sites characteristic of the B-like and b-like
Gp-9 allele classes, allowing for accurate determination
of colony social form (Shoemaker & Ascunce 2010),
which is especially relevant given the unknown origin
of all sampled nests in China. For each set of 96 PCR
reactions, we included template DNA from a single
monogyne individual (BB) and a single polygyne indi-
vidual bearing a b-like allele (Bb or Bb¢) as controls.
Mitochondrial DNA (mtDNA) sequencing
Polymerase chain reactions for the mtDNA included
primers C1-J-2195 and DDS-COII-4 (Ross & Shoemaker
1997) designed to specifically amplify an approximately
910 bp fragment corresponding to portions of the cyto-
chrome oxidase subunit I (cox-1) and subunit II (cox-2)
genes. PCR reaction conditions and thermal cycling pro-
file were identical to those described in Ahrens et al.
(2005). PCR products were purified and then used as
templates for sequencing reactions performed using the
two primers above and the ABI PRISM BigDye Termi-
nator v3.1 Cycle Sequencing Kit (Applied Biosystems,
CA, USA). Sequencing reactions were purified using
CleanSEQ magnetic beads (Agencourt Bioscience, MA,
USA) and run on an ABI 3730 sequencer at the National
Taiwan University Core Laboratory for Sequencing or
the University of Florida Biotechnology Facility (ICBR).
Microsatellite genotyping
The same set of template DNA samples used for
mtDNA sequencing also served as template for micro-
satellite PCRs. A total of 67 microsatellite loci were
amplified and scored from these ants (Krieger & Keller
1997; Chen et al. 2003; Ascunce et al. 2009, 2011; Ross
et al. 2010). One primer of each locus primer pair was
labelled at the 5¢ end with one of four fluorescent dyes
(FAM, PET, NED or VIC; Applied Biosystems). Primer
pairs were combined in multiplex reactions by taking
into account PCR thermal cycling profiles, dye labels,
and expected size and yield of the PCR products. The
complete set of 67 loci was amplified in 22 separate
12 lL multiplex-PCR reactions, each containing two to
five pairs of primers, Hot-Start Taq 2· Mastermix (Den-
ville Scientific, NJ, USA), 0.06–0.4 lM of each primer,
1–2 lL of total genomic DNA (10–20 ng) and water.
Further details regarding primer sequences, PCR cock-
tails and thermal cycling profiles are described in detail
elsewhere (Ascunce et al. 2009; Ross et al. 2010). Result-
ing PCR amplicons were diluted (100:1 to 200:1) and
pooled into a total of six plates, each one representing
a different injection on a capillary DNA sequencer.
e public domain in the USA.
822 C. -C. YANG ET AL.
GeneScan 600 LIZ size standard (0.1 lL) was added to
all pool-plex dilutions, which subsequently were run on
an ABI-3730XL-96 capillary sequencer (Applied Biosys-
tems) at the University of Florida Biotechnology Facility
(ICBR). Microsatellite genotypes were scored using
GENEMARKER software (SoftGenetics, PA, USA).
MtDNA sequence analyses
Sequences were aligned with previously published
sequences in GenBank (accession numbers AY249097,
AY950731 and AY249114; Shoemaker & Ross 1996) for
determining haplotype identity. MtDNA haplotype fre-
quencies at all collection sites were estimated using
ARLEQUIN 3.0 (Excoffier et al. 2005). Pairwise FST values
between sites were based on mtDNA haplotype frequen-
cies and estimated using ARLEQUIN 3.0. Hierarchical FST
values were calculated at two levels (among sites and
between social forms within sites) using the analysis of
molecular variance (AMOVA) approach implemented in
ARLEQUIN. Statistical significance of differentiation at
each level was assessed by means of permutation tests
(20 000 data permutations).
Microsatellite analyses
Preliminary analyses of our data revealed that 15 of the
67 microsatellite loci were monomorphic within S. in-
victa at all 17 collection sites in China. We therefore per-
formed the majority of subsequent genetic analyses on
the genotypic data for the remaining 52 variable micro-
satellite loci.
We tested for the presence of null alleles or scoring
errors owing to allele dropout using the program Micro-
Checker (van Oosterhout et al. 2004). Departures from
Hardy–Weinberg equilibrium (HWE) at each locus in
each main site were assessed using exact probability
tests with 10 000 permutations (option 1) implemented
in GENEPOP on the web (Raymond & Rousset 1995;
http://genepop.curtin.edu.au/). Summary statistics for
each locus, including mean number of alleles (NA), num-
ber of private alleles (NPA), observed (HO) and expected
heterozygosities (HE), and FIS for each site, were calcu-
lated using GENALEX 6.1 (Peakall & Smouse 2006). Sig-
nificance of FIS values was determined by bootstrapping
over loci (10 000 replications) to obtain 95% confidence
intervals. Allelic richness (AR) was estimated by correct-
ing for variation in sample sizes with the rarefaction
method using the program HP-RARE (Kalinowski 2005).
General population genetic analyses
Linkage disequilibrium (LD, expressed as D¢) between
pairs of loci within each main site was estimated using
� Published 2011. This article is a
PowerMarker (Liu & Muse 2005), and the significance
levels of D¢ were obtained using both permutation and
Markov chain Monte Carlo approaches without adjust-
ing for multiple comparisons. For each main site, the
finding of more than 5% of total pairwise locus com-
parisons displaying significant D¢ values (P < 0.05) was
interpreted as more LD than would be expected by
chance in a population lacking such disequilibrium
(Schug et al. 2007).
Pairwise FST values between all main sites were esti-
mated using FSTAT (Goudet 2001), and the significance
of the measured genetic differentiation was assessed
using exact tests as implemented in GENEPOP on the web.
Pairwise genetic distances (Nei’s unbiased D) between
sites were calculated using MSA (Dieringer & Schlotter-
er 2002).
The software STRUCTURE 2.3 (Pritchard et al. 2000) was
used to estimate the number of distinct genetic clusters
represented by all sampled individuals in the present
study, as well as subsets of the entire dataset, and to
probabilistically partition each individual’s genome into
membership fractions (ancestry) in each defined cluster.
We first performed simulations using STRUCTURE on sub-
sets of the data consisting of all individuals from each
site to identify potential cryptic genetic structure within
sampled sites. For these and subsequent STRUCTURE anal-
yses, we used only the multilocus genotypic data for
the 52 variable microsatellite loci. Simulations were per-
formed for values of K (number of inferred clusters)
ranging from one to five using 50 000 Markov chain
Monte Carlo generations and 100 000 generations in the
data collection phase. Ten independent runs were con-
ducted for each K. Next, STRUCTURE simulations were
performed on the entire dataset of individuals from all
17 sites using similar simulation parameters as above,
with K varying from one to 20. Finally, we ran separate
STRUCTURE simulations (K values from one to five) on all
samples within each genetic cluster (if any) identified in
the latter runs to learn whether lower-level genetic
structure occurred within any of the major clusters
(STRUCTURE generally detects genetic structure only at the
highest level; Hubisz et al. 2009). All simulations were
performed using the admixture and correlated allele
frequencies models with no prior information. Selection
of K for STRUCTURE simulations was based on the combi-
nation of results of the DK method developed by Evan-
no et al. (2005), and the estimated posterior
probabilities of the data for each K. DISTRUCT (Rosen-
berg 2004) were used to perform graphic visualization
of the STRUCTURE results.
We used principal component analysis (PCA), which
plots relationships between populations on n principal
coordinates based on allele frequencies across all loci, to
visualize the clustering patterns among main sites, as
U.S. Government work and is in the public domain in the USA.
POPULATION GENETICS OF S . INVICTA I N CHI NA 823
implemented in the program GENALEX (Peakall &
Smouse 2006).
We performed analyses of molecular variance (AM-
OVA), as implemented in ARLEQUIN, within and among
three regional groups, each of which comprised sites
that were geographically close to one another (HK ⁄ SZ,
ZH ⁄ ZS and MM ⁄ WC). Statistical significance of the dif-
ferentiation at each level was established by means of
20 000 data permutations.
Identification of putative source population of fire antsin Wuchuan
The most likely source of ants in WC resulting from a
putative third invasion in China was inferred by esti-
mating the assignment likelihood values (Li fi l, the
likelihood of assigning a given individual i to popula-
tion l), as implemented in GENECLASS 2 (Piry et al. 2004),
with multiple collection sites in various states in the
USA (two from each of California, Louisiana, Georgia
and Mississippi; one from each of Florida and Texas)
serving as reference sites. Microsatellite genotypic data
for ants from these USA sites were obtained from Asc-
unce et al. (2011). All assignment likelihood tests were
performed under the Bayesian criterion (Rannala &
Mountain 1997). Also, estimates of pairwise FST served
as a supplementary method to interpret the potential
source population by estimating the genetic differentia-
tion between the ants in WC and those in each USA ref-
erence site. The reference site displaying both the
highest likelihood and the lowest FST values was
inferred as the most likely source.
Identification of putative sources of colonies fromoutlier areas
The proportion of estimated membership coefficients
(degree of admixture, Q) of each individual genotype to
distinct genetic clusters, as inferred from STRUCTURE, was
used to infer the putative geographic source of sampled
outlier colonies located away from the main sites. Indi-
viduals with Q estimates ‡ 0.70 for a single cluster were
assigned to that cluster (Q estimates based on the
selected K value). Individuals were assigned to two
clusters if Q was ambiguous (e.g. 0.5 for each cluster).
The assignment likelihood values (Piry et al. 2004) were
also used to identify the most likely source site of out-
lier nests, with all nonfocal sites serving as reference
populations. The most likely source was inferred as the
site with the highest likelihood value. Estimates of FST
were not included in this analysis as this method is
prone to biases if sample sizes are too small as is the
case for some outlier sites.
� Published 2011. This article is a U.S. Government work and is in th
Tests for genetic bottlenecks
Three approaches were used to test for the characteris-
tic signatures associated with genetic bottlenecks:
heterozygote excess (implemented in BOTTLENECK;
Piry et al. 1999), the M ratio test (implemented in
M_P_VAL in conjunction with CRITICAL_M; Garza &
Williamson 2001) and, more directly, comparisons of
genetic diversity in terms of allelic richness and
expected heterozygosity. Populations that have experi-
enced a recent population bottleneck are predicted to
have greater heterozygosities (HE) than expected at
mutation-drift equilibrium (HEQ) because alleles, espe-
cially rare alleles, are generally lost faster than hetero-
zygosity in bottlenecked populations (Cornuet &
Luikart 1996; Piry et al. 1999). HEQ was simulated
using BOTTLENECK with 10 000 replications under
the two-phase model (TPM) consisting of 20% multi-
state change and a variance of 12 as suggested by Piry
et al. (1999). The significance of heterozygosity excess
was tested by the Wilcoxon signed-rank test, which, in
theory, has relatively high power when large numbers
of loci are employed, as is the case for the present
study (Luikart et al. 1998). For the second method we
calculated and used the M ratio (number of alleles
divided by the allelic size range) as an indicator of bot-
tlenecks, with the expectation that numerous alleles
within the expected size range are missing because of
their loss during and following the bottleneck (Garza
& Williamson 2001). The observed M ratio for each site
was compared to the lower 5% tail of the critical ratio
(MC) distribution generated by CRITICAL_M, which
requires three parameters to be set: h = 4 Nel (where
Ne = effective population size and l = mutation rate of
5 · 10)4), Dg (mean size of non-one-step mutations)
and ps (the per cent of one-step mutations). We used
the parameter values h = 10, Dg = 3.5 and ps = 90% as
recommended by Garza & Williamson (2001). Sites
with an observed M ratio under the MC threshold were
considered to show evidence of having experienced a
recent bottleneck. Finally, we also compared genetic
diversity, as measured by allelic richness (A0R) and
expected heterozygosity (H0E) at identical sets of micro-
satellite loci, among sites in China, a single site from
the immediate putative source (Mississippi, USA; Asc-
unce et al. 2011), and a single site in the native South
American range which represents the presumed source
for ants found in the USA (Formosa, Argentina; Cal-
dera et al. 2008). Notably, we estimated these two val-
ues (A0R and H0E) using data generated for all
67 microsatellite loci to avoid any potential bias associ-
ated with removing loci invariant in China but not
elsewhere (see Table 2).
e public domain in the USA.
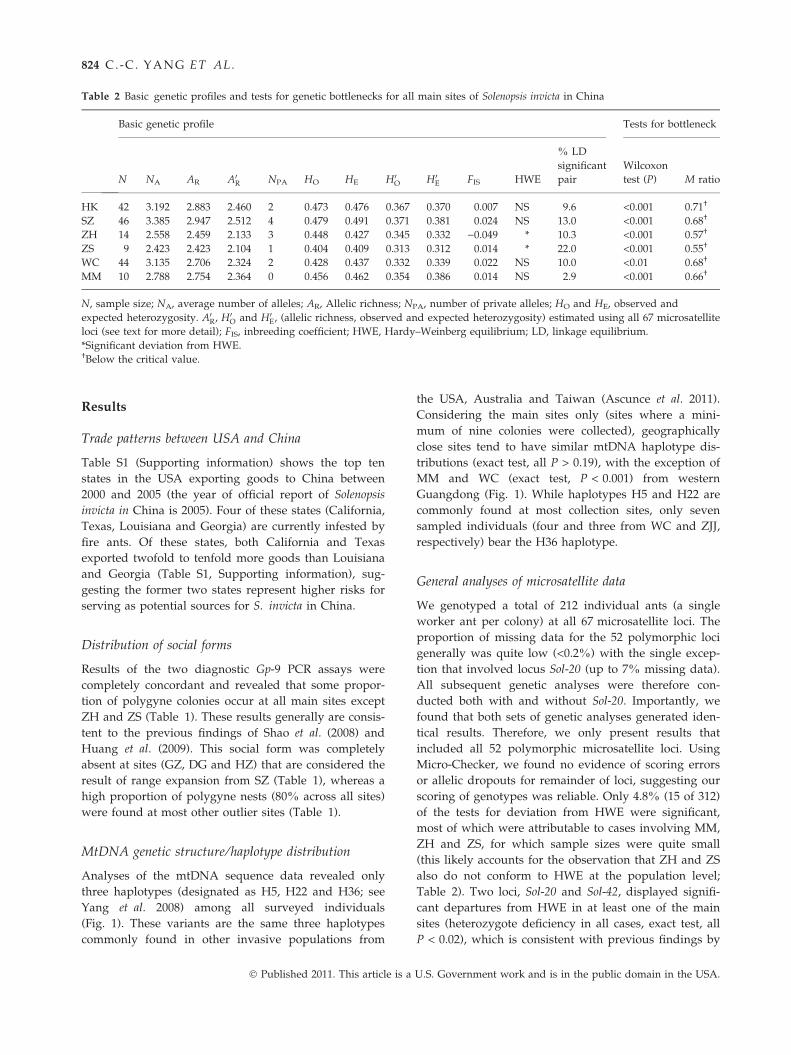
Table 2 Basic genetic profiles and tests for genetic bottlenecks for all main sites of Solenopsis invicta in China
Basic genetic profile Tests for bottleneck
N NA AR A0R NPA HO HE H0O H0E FIS HWE
% LD
significant
pair
Wilcoxon
test (P) M ratio
HK 42 3.192 2.883 2.460 2 0.473 0.476 0.367 0.370 0.007 NS 9.6 <0.001 0.71†
SZ 46 3.385 2.947 2.512 4 0.479 0.491 0.371 0.381 0.024 NS 13.0 <0.001 0.68†
ZH 14 2.558 2.459 2.133 3 0.448 0.427 0.345 0.332 )0.049 * 10.3 <0.001 0.57†
ZS 9 2.423 2.423 2.104 1 0.404 0.409 0.313 0.312 0.014 * 22.0 <0.001 0.55†
WC 44 3.135 2.706 2.324 2 0.428 0.437 0.332 0.339 0.022 NS 10.0 <0.01 0.68†
MM 10 2.788 2.754 2.364 0 0.456 0.462 0.354 0.386 0.014 NS 2.9 <0.001 0.66†
N, sample size; NA, average number of alleles; AR, Allelic richness; NPA, number of private alleles; HO and HE, observed and
expected heterozygosity. A0R, H0O and H0E, (allelic richness, observed and expected heterozygosity) estimated using all 67 microsatellite
loci (see text for more detail); FIS, inbreeding coefficient; HWE, Hardy–Weinberg equilibrium; LD, linkage equilibrium.
*Significant deviation from HWE.†Below the critical value.
824 C. -C. YANG ET AL.
Results
Trade patterns between USA and China
Table S1 (Supporting information) shows the top ten
states in the USA exporting goods to China between
2000 and 2005 (the year of official report of Solenopsis
invicta in China is 2005). Four of these states (California,
Texas, Louisiana and Georgia) are currently infested by
fire ants. Of these states, both California and Texas
exported twofold to tenfold more goods than Louisiana
and Georgia (Table S1, Supporting information), sug-
gesting the former two states represent higher risks for
serving as potential sources for S. invicta in China.
Distribution of social forms
Results of the two diagnostic Gp-9 PCR assays were
completely concordant and revealed that some propor-
tion of polygyne colonies occur at all main sites except
ZH and ZS (Table 1). These results generally are consis-
tent to the previous findings of Shao et al. (2008) and
Huang et al. (2009). This social form was completely
absent at sites (GZ, DG and HZ) that are considered the
result of range expansion from SZ (Table 1), whereas a
high proportion of polygyne nests (80% across all sites)
were found at most other outlier sites (Table 1).
MtDNA genetic structure ⁄ haplotype distribution
Analyses of the mtDNA sequence data revealed only
three haplotypes (designated as H5, H22 and H36; see
Yang et al. 2008) among all surveyed individuals
(Fig. 1). These variants are the same three haplotypes
commonly found in other invasive populations from
� Published 2011. This article is a
the USA, Australia and Taiwan (Ascunce et al. 2011).
Considering the main sites only (sites where a mini-
mum of nine colonies were collected), geographically
close sites tend to have similar mtDNA haplotype dis-
tributions (exact test, all P > 0.19), with the exception of
MM and WC (exact test, P < 0.001) from western
Guangdong (Fig. 1). While haplotypes H5 and H22 are
commonly found at most collection sites, only seven
sampled individuals (four and three from WC and ZJJ,
respectively) bear the H36 haplotype.
General analyses of microsatellite data
We genotyped a total of 212 individual ants (a single
worker ant per colony) at all 67 microsatellite loci. The
proportion of missing data for the 52 polymorphic loci
generally was quite low (<0.2%) with the single excep-
tion that involved locus Sol-20 (up to 7% missing data).
All subsequent genetic analyses were therefore con-
ducted both with and without Sol-20. Importantly, we
found that both sets of genetic analyses generated iden-
tical results. Therefore, we only present results that
included all 52 polymorphic microsatellite loci. Using
Micro-Checker, we found no evidence of scoring errors
or allelic dropouts for remainder of loci, suggesting our
scoring of genotypes was reliable. Only 4.8% (15 of 312)
of the tests for deviation from HWE were significant,
most of which were attributable to cases involving MM,
ZH and ZS, for which sample sizes were quite small
(this likely accounts for the observation that ZH and ZS
also do not conform to HWE at the population level;
Table 2). Two loci, Sol-20 and Sol-42, displayed signifi-
cant departures from HWE in at least one of the main
sites (heterozygote deficiency in all cases, exact test, all
P < 0.02), which is consistent with previous findings by
U.S. Government work and is in the public domain in the USA.
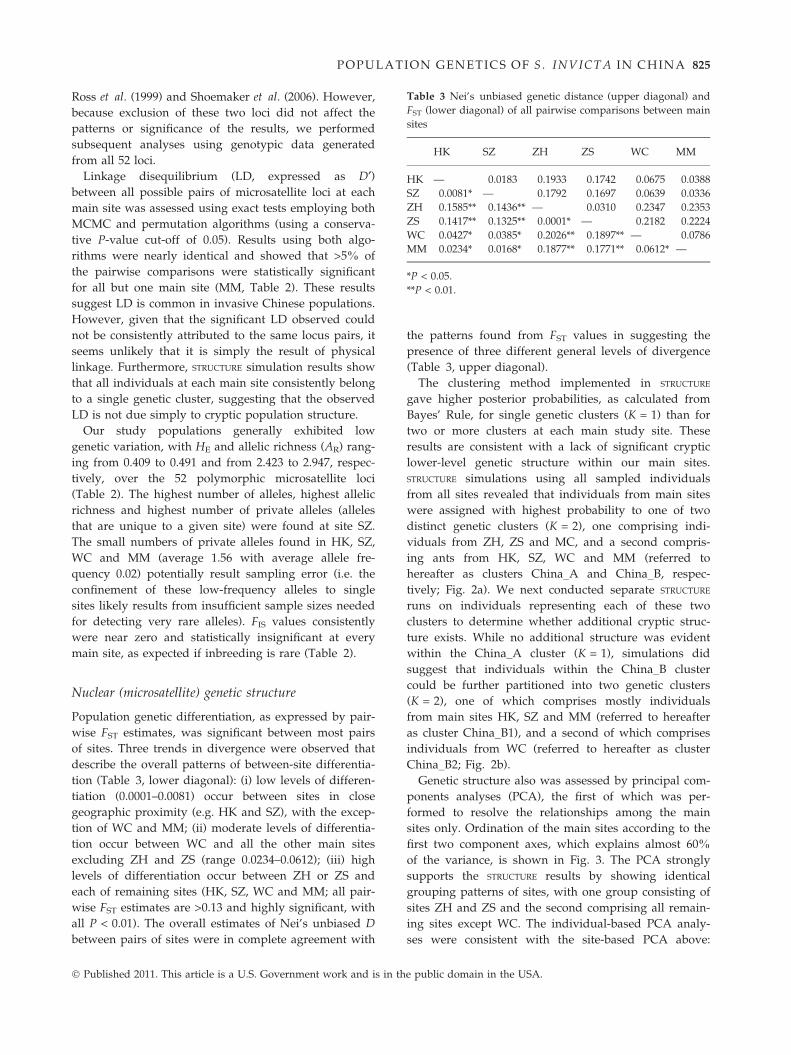
Table 3 Nei’s unbiased genetic distance (upper diagonal) and
FST (lower diagonal) of all pairwise comparisons between main
sites
HK SZ ZH ZS WC MM
HK — 0.0183 0.1933 0.1742 0.0675 0.0388
SZ 0.0081* — 0.1792 0.1697 0.0639 0.0336
ZH 0.1585** 0.1436** — 0.0310 0.2347 0.2353
ZS 0.1417** 0.1325** 0.0001* — 0.2182 0.2224
WC 0.0427* 0.0385* 0.2026** 0.1897** — 0.0786
MM 0.0234* 0.0168* 0.1877** 0.1771** 0.0612* —
*P < 0.05.
**P < 0.01.
POPULATION GENETICS OF S . INVICTA I N CHI NA 825
Ross et al. (1999) and Shoemaker et al. (2006). However,
because exclusion of these two loci did not affect the
patterns or significance of the results, we performed
subsequent analyses using genotypic data generated
from all 52 loci.
Linkage disequilibrium (LD, expressed as D¢)between all possible pairs of microsatellite loci at each
main site was assessed using exact tests employing both
MCMC and permutation algorithms (using a conserva-
tive P-value cut-off of 0.05). Results using both algo-
rithms were nearly identical and showed that >5% of
the pairwise comparisons were statistically significant
for all but one main site (MM, Table 2). These results
suggest LD is common in invasive Chinese populations.
However, given that the significant LD observed could
not be consistently attributed to the same locus pairs, it
seems unlikely that it is simply the result of physical
linkage. Furthermore, STRUCTURE simulation results show
that all individuals at each main site consistently belong
to a single genetic cluster, suggesting that the observed
LD is not due simply to cryptic population structure.
Our study populations generally exhibited low
genetic variation, with HE and allelic richness (AR) rang-
ing from 0.409 to 0.491 and from 2.423 to 2.947, respec-
tively, over the 52 polymorphic microsatellite loci
(Table 2). The highest number of alleles, highest allelic
richness and highest number of private alleles (alleles
that are unique to a given site) were found at site SZ.
The small numbers of private alleles found in HK, SZ,
WC and MM (average 1.56 with average allele fre-
quency 0.02) potentially result sampling error (i.e. the
confinement of these low-frequency alleles to single
sites likely results from insufficient sample sizes needed
for detecting very rare alleles). FIS values consistently
were near zero and statistically insignificant at every
main site, as expected if inbreeding is rare (Table 2).
Nuclear (microsatellite) genetic structure
Population genetic differentiation, as expressed by pair-
wise FST estimates, was significant between most pairs
of sites. Three trends in divergence were observed that
describe the overall patterns of between-site differentia-
tion (Table 3, lower diagonal): (i) low levels of differen-
tiation (0.0001–0.0081) occur between sites in close
geographic proximity (e.g. HK and SZ), with the excep-
tion of WC and MM; (ii) moderate levels of differentia-
tion occur between WC and all the other main sites
excluding ZH and ZS (range 0.0234–0.0612); (iii) high
levels of differentiation occur between ZH or ZS and
each of remaining sites (HK, SZ, WC and MM; all pair-
wise FST estimates are >0.13 and highly significant, with
all P < 0.01). The overall estimates of Nei’s unbiased D
between pairs of sites were in complete agreement with
� Published 2011. This article is a U.S. Government work and is in th
the patterns found from FST values in suggesting the
presence of three different general levels of divergence
(Table 3, upper diagonal).
The clustering method implemented in STRUCTURE
gave higher posterior probabilities, as calculated from
Bayes’ Rule, for single genetic clusters (K = 1) than for
two or more clusters at each main study site. These
results are consistent with a lack of significant cryptic
lower-level genetic structure within our main sites.
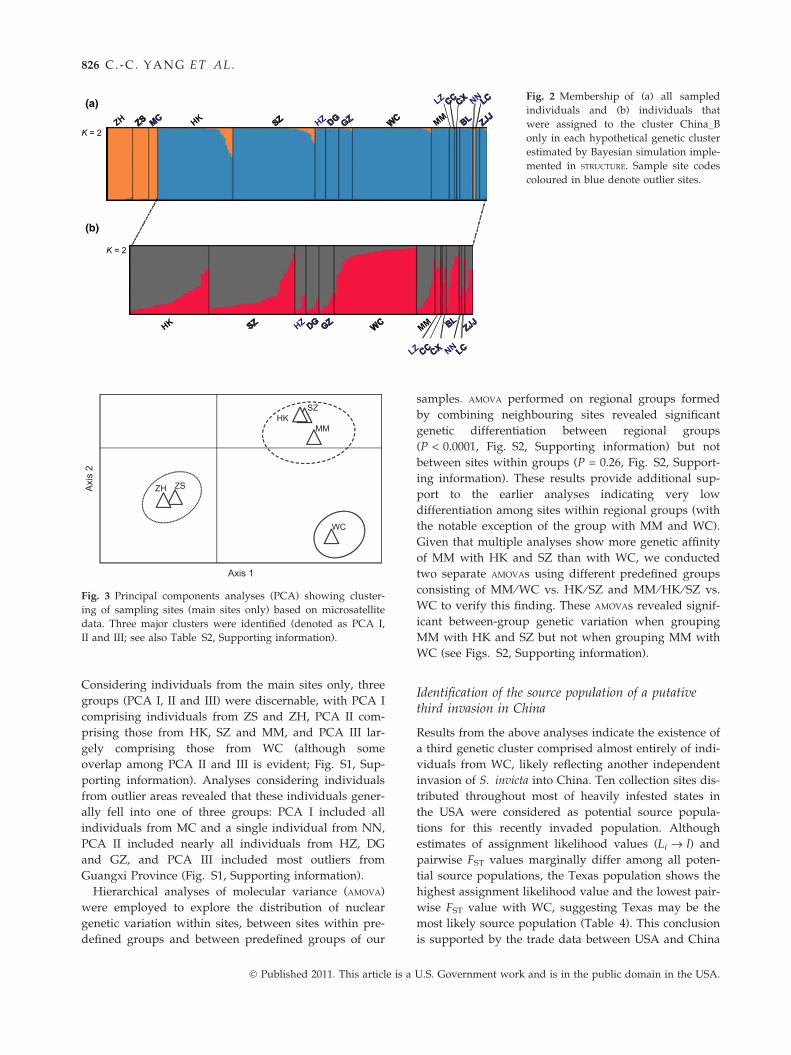
STRUCTURE simulations using all sampled individuals
from all sites revealed that individuals from main sites
were assigned with highest probability to one of two
distinct genetic clusters (K = 2), one comprising indi-
viduals from ZH, ZS and MC, and a second compris-
ing ants from HK, SZ, WC and MM (referred to
hereafter as clusters China_A and China_B, respec-
tively; Fig. 2a). We next conducted separate STRUCTURE
runs on individuals representing each of these two
clusters to determine whether additional cryptic struc-
ture exists. While no additional structure was evident
within the China_A cluster (K = 1), simulations did
suggest that individuals within the China_B cluster
could be further partitioned into two genetic clusters
(K = 2), one of which comprises mostly individuals
from main sites HK, SZ and MM (referred to hereafter
as cluster China_B1), and a second of which comprises
individuals from WC (referred to hereafter as cluster
China_B2; Fig. 2b).
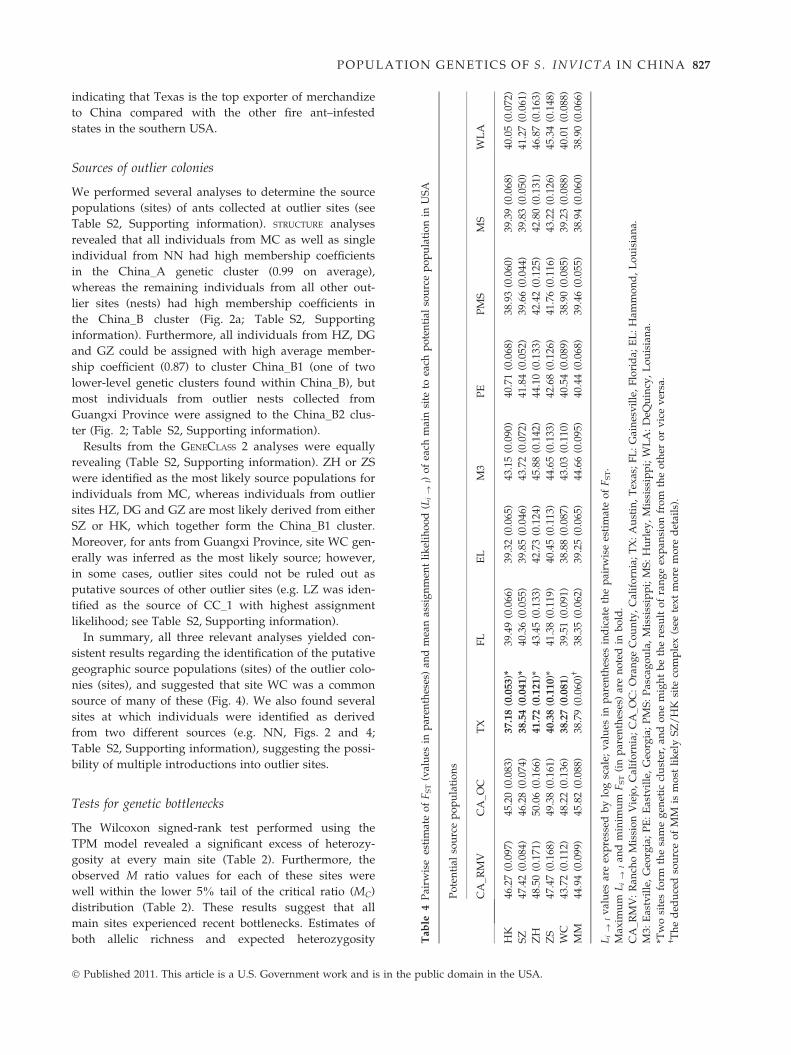
Genetic structure also was assessed by principal com-
ponents analyses (PCA), the first of which was per-
formed to resolve the relationships among the main
sites only. Ordination of the main sites according to the
first two component axes, which explains almost 60%
of the variance, is shown in Fig. 3. The PCA strongly
supports the STRUCTURE results by showing identical
grouping patterns of sites, with one group consisting of
sites ZH and ZS and the second comprising all remain-
ing sites except WC. The individual-based PCA analy-
ses were consistent with the site-based PCA above:
e public domain in the USA.
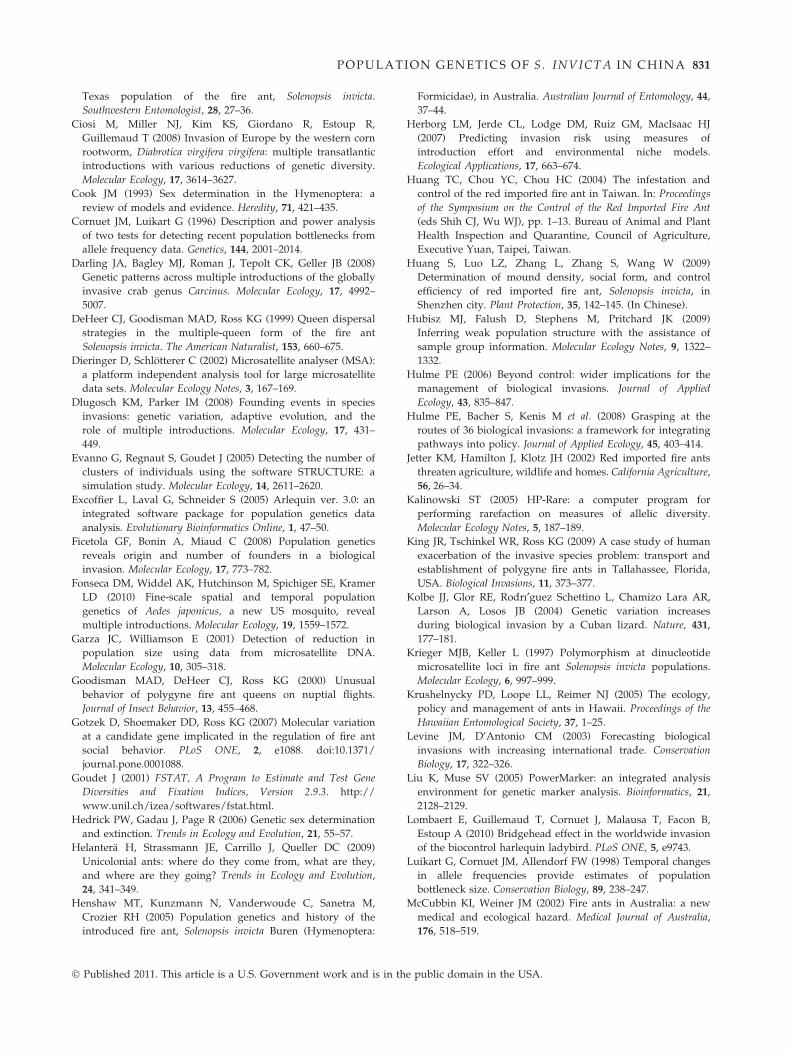
K = 2
K = 2
(a)
(b)
Fig. 2 Membership of (a) all sampled
individuals and (b) individuals that
were assigned to the cluster China_B
only in each hypothetical genetic cluster
estimated by Bayesian simulation imple-
mented in STRUCTURE. Sample site codes
coloured in blue denote outlier sites.
ZSZH
HKSZ
MM
WC
Axis 1
Axi
s 2
Fig. 3 Principal components analyses (PCA) showing cluster-
ing of sampling sites (main sites only) based on microsatellite
data. Three major clusters were identified (denoted as PCA I,
II and III; see also Table S2, Supporting information).
826 C. -C. YANG ET AL.
Considering individuals from the main sites only, three
groups (PCA I, II and III) were discernable, with PCA I
comprising individuals from ZS and ZH, PCA II com-
prising those from HK, SZ and MM, and PCA III lar-
gely comprising those from WC (although some
overlap among PCA II and III is evident; Fig. S1, Sup-
porting information). Analyses considering individuals
from outlier areas revealed that these individuals gener-
ally fell into one of three groups: PCA I included all
individuals from MC and a single individual from NN,
PCA II included nearly all individuals from HZ, DG
and GZ, and PCA III included most outliers from
Guangxi Province (Fig. S1, Supporting information).
Hierarchical analyses of molecular variance (AMOVA)
were employed to explore the distribution of nuclear
genetic variation within sites, between sites within pre-
defined groups and between predefined groups of our
� Published 2011. This article is a
samples. AMOVA performed on regional groups formed
by combining neighbouring sites revealed significant
genetic differentiation between regional groups
(P < 0.0001, Fig. S2, Supporting information) but not
between sites within groups (P = 0.26, Fig. S2, Support-
ing information). These results provide additional sup-
port to the earlier analyses indicating very low
differentiation among sites within regional groups (with
the notable exception of the group with MM and WC).
Given that multiple analyses show more genetic affinity
of MM with HK and SZ than with WC, we conducted
two separate AMOVAs using different predefined groups
consisting of MM ⁄ WC vs. HK ⁄ SZ and MM ⁄ HK ⁄ SZ vs.
WC to verify this finding. These AMOVAs revealed signif-
icant between-group genetic variation when grouping
MM with HK and SZ but not when grouping MM with
WC (see Figs. S2, Supporting information).
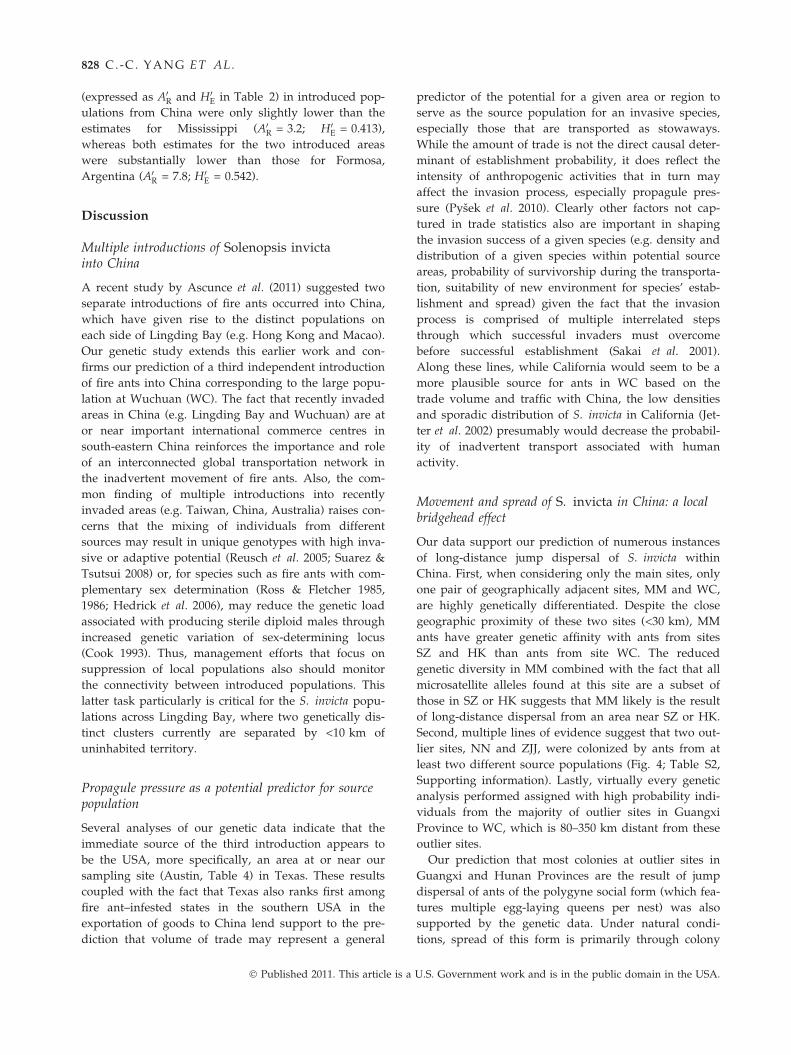
Identification of the source population of a putativethird invasion in China
Results from the above analyses indicate the existence of
a third genetic cluster comprised almost entirely of indi-
viduals from WC, likely reflecting another independent
invasion of S. invicta into China. Ten collection sites dis-
tributed throughout most of heavily infested states in
the USA were considered as potential source popula-
tions for this recently invaded population. Although
estimates of assignment likelihood values (Li fi l) and
pairwise FST values marginally differ among all poten-
tial source populations, the Texas population shows the
highest assignment likelihood value and the lowest pair-
wise FST value with WC, suggesting Texas may be the
most likely source population (Table 4). This conclusion
is supported by the trade data between USA and China
U.S. Government work and is in the public domain in the USA.
LA
.05
(0.0
72)
.27
(0.0
61)
.87
(0.1
63)
.34
(0.1
48)
.01
(0.0
88)
.90
(0.0
66)
POPULATION GENETICS OF S . INVICTA I N CHI NA 827
indicating that Texas is the top exporter of merchandize
to China compared with the other fire ant–infested
states in the southern USA.
alu
esin
par
enth
eses
)an
dm
ean
assi
gn
men
tli
kel
iho
od
(Li
fil)
of
each
mai
nsi
teto
each
po
ten
tial
sou
rce
po
pu
lati
on
inU
SA
ns
TX
FL
EL
M3
PE
PM
SM
SW
83)
37
.18
(0.0
53)*
39.4
9(0
.066
)39
.32
(0.0
65)
43.1
5(0
.090
)40
.71
(0.0
68)
38.9
3(0
.060
)39
.39
(0.0
68)
40
74)
38
.54
(0.0
41)*
40.3
6(0
.055
)39
.85
(0.0
46)
43.7
2(0
.072
)41
.84
(0.0
52)
39.6
6(0
.044
)39
.83
(0.0
50)
41
66)
41
.72
(0.1
21)*
43.4
5(0
.133
)42
.73
(0.1
24)
45.8
8(0
.142
)44
.10
(0.1
33)
42.4
2(0
.125
)42
.80
(0.1
31)
46
61)
40
.38
(0.1
10)*
41.3
8(0
.119
)40
.45
(0.1
13)
44.6
5(0
.133
)42
.68
(0.1
26)
41.7
6(0
.116
)43
.22
(0.1
26)
45
36)
38
.27
(0.0
81)
39.5
1(0
.091
)38
.88
(0.0
87)
43.0
3(0
.110
)40
.54
(0.0
89)
38.9
0(0
.085
)39
.23
(0.0
88)
40
88)
38.7
9(0
.060
)†38
.35
(0.0
62)
39.2
5(0
.065
)44
.66
(0.0
95)
40.4
4(0
.068
)39
.46
(0.0
55)
38.9
4(0
.060
)38
cale
;v
alu
esin
par
enth
eses
ind
icat
eth
ep
airw
ise
esti
mat
eo
fF
ST.
(in
par
enth
eses
)ar
en
ote
din
bo
ld.
alif
orn
ia;
CA
_OC
:O
ran
ge
Co
un
ty,
Cal
ifo
rnia
;T
X:
Au
stin
,T
exas
;F
L:
Gai
nes
vil
le,
Flo
rid
a;E
L:
Ham
mo
nd
,L
ou
isia
na.
,G
eorg
ia;
PM
S:
Pas
cag
ou
la,
Mis
siss
ipp
i;M
S:
Hu
rley
,M
issi
ssip
pi;
WL
A:
DeQ
uin
cy,
Lo
uis
ian
a.
ust
er,
and
on
em
igh
tb
eth
ere
sult
of
ran
ge
exp
ansi
on
fro
mth
eo
ther
or
vic
ev
ersa
.
tli
kel
yS
Z/
HK
site
com
ple
x(s
eete
xt
mo
rem
ore
det
ails
).
Sources of outlier colonies
We performed several analyses to determine the source
populations (sites) of ants collected at outlier sites (see
Table S2, Supporting information). STRUCTURE analyses
revealed that all individuals from MC as well as single
individual from NN had high membership coefficients
in the China_A genetic cluster (0.99 on average),
whereas the remaining individuals from all other out-
lier sites (nests) had high membership coefficients in
the China_B cluster (Fig. 2a; Table S2, Supporting
information). Furthermore, all individuals from HZ, DG
and GZ could be assigned with high average member-
ship coefficient (0.87) to cluster China_B1 (one of two
lower-level genetic clusters found within China_B), but
most individuals from outlier nests collected from
Guangxi Province were assigned to the China_B2 clus-
ter (Fig. 2; Table S2, Supporting information).
Results from the GENECLASS 2 analyses were equally
revealing (Table S2, Supporting information). ZH or ZS
were identified as the most likely source populations for
individuals from MC, whereas individuals from outlier
sites HZ, DG and GZ are most likely derived from either
SZ or HK, which together form the China_B1 cluster.
Moreover, for ants from Guangxi Province, site WC gen-
erally was inferred as the most likely source; however,
in some cases, outlier sites could not be ruled out as
putative sources of other outlier sites (e.g. LZ was iden-
tified as the source of CC_1 with highest assignment
likelihood; see Table S2, Supporting information).
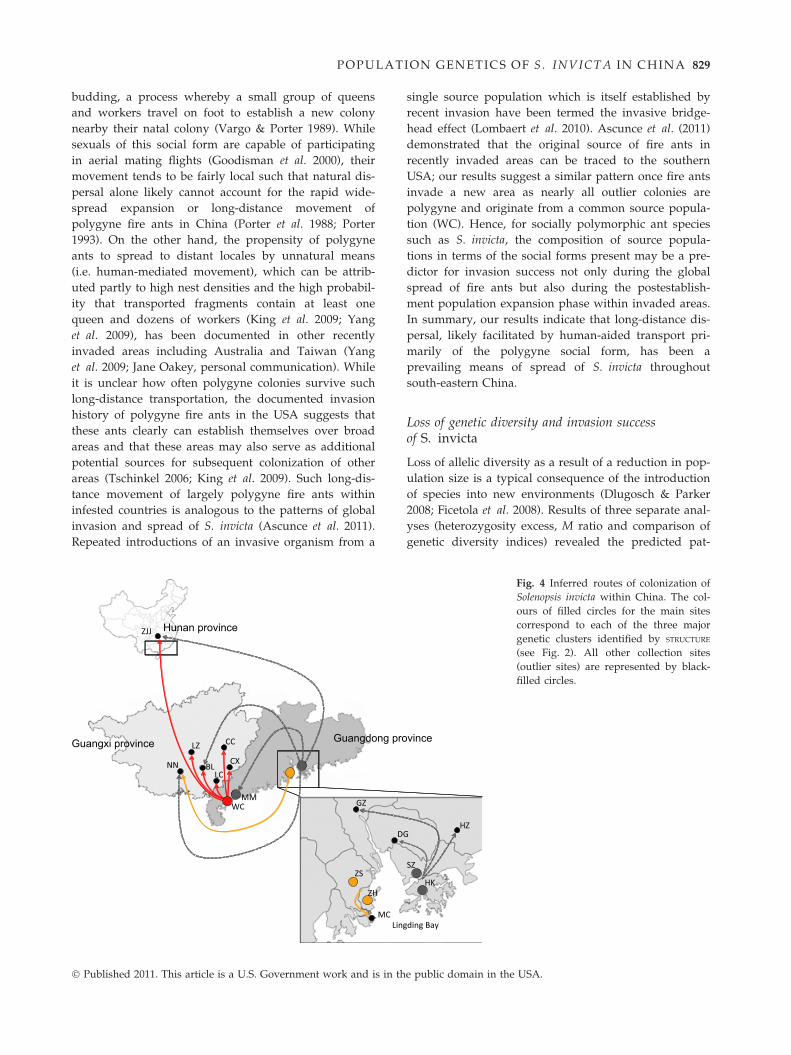
In summary, all three relevant analyses yielded con-
sistent results regarding the identification of the putative
geographic source populations (sites) of the outlier colo-
nies (sites), and suggested that site WC was a common
source of many of these (Fig. 4). We also found several
sites at which individuals were identified as derived
from two different sources (e.g. NN, Figs. 2 and 4;
Table S2, Supporting information), suggesting the possi-
bility of multiple introductions into outlier sites.
Ta
ble
4P
airw
ise
esti
mat
eo
fF
ST
(v
Po
ten
tial
sou
rce
po
pu
lati
o
CA
_RM
VC
A_O
C
HK
46.2
7(0
.097
)45
.20
(0.0
SZ
47.4
2(0
.084
)46
.28
(0.0
ZH
48.5
0(0
.171
)50
.06
(0.1
ZS
47.4
7(0
.168
)49
.38
(0.1
WC
43.7
2(0
.112
)48
.22
(0.1
MM
44.9
4(0
.099
)45
.82
(0.0
Li
fil
val
ues
are
exp
ress
edb
ylo
gs
Max
imu
mL
ifi
lan
dm
inim
um
FS
T
CA
_RM
V:
Ran
cho
Mis
sio
nV
iejo
,C
M3:
Eas
tvil
le,
Geo
rgia
;P
E:
Eas
tvil
le
*Tw
osi
tes
form
the
sam
eg
enet
iccl
†T
he
ded
uce
dso
urc
eo
fM
Mis
mo
s
Tests for genetic bottlenecks
The Wilcoxon signed-rank test performed using the
TPM model revealed a significant excess of heterozy-
gosity at every main site (Table 2). Furthermore, the
observed M ratio values for each of these sites were
well within the lower 5% tail of the critical ratio (MC)
distribution (Table 2). These results suggest that all
main sites experienced recent bottlenecks. Estimates of
both allelic richness and expected heterozygosity
� Published 2011. This article is a U.S. Government work and is in the public domain in the USA.
828 C. -C. YANG ET AL.
(expressed as A0R and H0E in Table 2) in introduced pop-
ulations from China were only slightly lower than the
estimates for Mississippi (A0R = 3.2; H0E = 0.413),
whereas both estimates for the two introduced areas
were substantially lower than those for Formosa,
Argentina (A0R = 7.8; H0E = 0.542).
Discussion
Multiple introductions of Solenopsis invictainto China
A recent study by Ascunce et al. (2011) suggested two
separate introductions of fire ants occurred into China,
which have given rise to the distinct populations on
each side of Lingding Bay (e.g. Hong Kong and Macao).
Our genetic study extends this earlier work and con-
firms our prediction of a third independent introduction
of fire ants into China corresponding to the large popu-
lation at Wuchuan (WC). The fact that recently invaded
areas in China (e.g. Lingding Bay and Wuchuan) are at
or near important international commerce centres in
south-eastern China reinforces the importance and role
of an interconnected global transportation network in
the inadvertent movement of fire ants. Also, the com-
mon finding of multiple introductions into recently
invaded areas (e.g. Taiwan, China, Australia) raises con-
cerns that the mixing of individuals from different
sources may result in unique genotypes with high inva-
sive or adaptive potential (Reusch et al. 2005; Suarez &
Tsutsui 2008) or, for species such as fire ants with com-
plementary sex determination (Ross & Fletcher 1985,
1986; Hedrick et al. 2006), may reduce the genetic load
associated with producing sterile diploid males through
increased genetic variation of sex-determining locus
(Cook 1993). Thus, management efforts that focus on
suppression of local populations also should monitor
the connectivity between introduced populations. This
latter task particularly is critical for the S. invicta popu-
lations across Lingding Bay, where two genetically dis-
tinct clusters currently are separated by <10 km of
uninhabited territory.
Propagule pressure as a potential predictor for sourcepopulation
Several analyses of our genetic data indicate that the
immediate source of the third introduction appears to
be the USA, more specifically, an area at or near our
sampling site (Austin, Table 4) in Texas. These results
coupled with the fact that Texas also ranks first among
fire ant–infested states in the southern USA in the
exportation of goods to China lend support to the pre-
diction that volume of trade may represent a general
� Published 2011. This article is a
predictor of the potential for a given area or region to
serve as the source population for an invasive species,
especially those that are transported as stowaways.
While the amount of trade is not the direct causal deter-
minant of establishment probability, it does reflect the
intensity of anthropogenic activities that in turn may
affect the invasion process, especially propagule pres-
sure (Pysek et al. 2010). Clearly other factors not cap-
tured in trade statistics also are important in shaping
the invasion success of a given species (e.g. density and
distribution of a given species within potential source
areas, probability of survivorship during the transporta-
tion, suitability of new environment for species’ estab-
lishment and spread) given the fact that the invasion
process is comprised of multiple interrelated steps
through which successful invaders must overcome
before successful establishment (Sakai et al. 2001).
Along these lines, while California would seem to be a
more plausible source for ants in WC based on the
trade volume and traffic with China, the low densities
and sporadic distribution of S. invicta in California (Jet-
ter et al. 2002) presumably would decrease the probabil-
ity of inadvertent transport associated with human
activity.
Movement and spread of S. invicta in China: a localbridgehead effect
Our data support our prediction of numerous instances
of long-distance jump dispersal of S. invicta within
China. First, when considering only the main sites, only
one pair of geographically adjacent sites, MM and WC,
are highly genetically differentiated. Despite the close
geographic proximity of these two sites (<30 km), MM
ants have greater genetic affinity with ants from sites
SZ and HK than ants from site WC. The reduced
genetic diversity in MM combined with the fact that all
microsatellite alleles found at this site are a subset of
those in SZ or HK suggests that MM likely is the result
of long-distance dispersal from an area near SZ or HK.
Second, multiple lines of evidence suggest that two out-
lier sites, NN and ZJJ, were colonized by ants from at
least two different source populations (Fig. 4; Table S2,
Supporting information). Lastly, virtually every genetic
analysis performed assigned with high probability indi-
viduals from the majority of outlier sites in Guangxi
Province to WC, which is 80–350 km distant from these
outlier sites.
Our prediction that most colonies at outlier sites in
Guangxi and Hunan Provinces are the result of jump
dispersal of ants of the polygyne social form (which fea-
tures multiple egg-laying queens per nest) was also
supported by the genetic data. Under natural condi-
tions, spread of this form is primarily through colony
U.S. Government work and is in the public domain in the USA.
POPULATION GENETICS OF S . INVICTA I N CHI NA 829
budding, a process whereby a small group of queens
and workers travel on foot to establish a new colony
nearby their natal colony (Vargo & Porter 1989). While
sexuals of this social form are capable of participating
in aerial mating flights (Goodisman et al. 2000), their
movement tends to be fairly local such that natural dis-
persal alone likely cannot account for the rapid wide-
spread expansion or long-distance movement of
polygyne fire ants in China (Porter et al. 1988; Porter
1993). On the other hand, the propensity of polygyne
ants to spread to distant locales by unnatural means
(i.e. human-mediated movement), which can be attrib-
uted partly to high nest densities and the high probabil-
ity that transported fragments contain at least one
queen and dozens of workers (King et al. 2009; Yang
et al. 2009), has been documented in other recently
invaded areas including Australia and Taiwan (Yang
et al. 2009; Jane Oakey, personal communication). While
it is unclear how often polygyne colonies survive such
long-distance transportation, the documented invasion
history of polygyne fire ants in the USA suggests that
these ants clearly can establish themselves over broad
areas and that these areas may also serve as additional
potential sources for subsequent colonization of other
areas (Tschinkel 2006; King et al. 2009). Such long-dis-
tance movement of largely polygyne fire ants within
infested countries is analogous to the patterns of global
invasion and spread of S. invicta (Ascunce et al. 2011).
Repeated introductions of an invasive organism from a
MMWC
LCBL
CXNN
CCLZ
ZJJ
DG
GZ
ZS
ZH
MC
Guangdong proGuangxi province
Hunan province
Ling
� Published 2011. This article is a U.S. Government work and is in th
single source population which is itself established by
recent invasion have been termed the invasive bridge-
head effect (Lombaert et al. 2010). Ascunce et al. (2011)
demonstrated that the original source of fire ants in
recently invaded areas can be traced to the southern
USA; our results suggest a similar pattern once fire ants
invade a new area as nearly all outlier colonies are
polygyne and originate from a common source popula-
tion (WC). Hence, for socially polymorphic ant species
such as S. invicta, the composition of source popula-
tions in terms of the social forms present may be a pre-
dictor for invasion success not only during the global
spread of fire ants but also during the postestablish-
ment population expansion phase within invaded areas.
In summary, our results indicate that long-distance dis-
persal, likely facilitated by human-aided transport pri-
marily of the polygyne social form, has been a
prevailing means of spread of S. invicta throughout
south-eastern China.
Loss of genetic diversity and invasion successof S. invicta
Loss of allelic diversity as a result of a reduction in pop-
ulation size is a typical consequence of the introduction
of species into new environments (Dlugosch & Parker
2008; Ficetola et al. 2008). Results of three separate anal-
yses (heterozygosity excess, M ratio and comparison of
genetic diversity indices) revealed the predicted pat-
HK
SZ
HZ
vince
ding Bay
Fig. 4 Inferred routes of colonization of
Solenopsis invicta within China. The col-
ours of filled circles for the main sites
correspond to each of the three major
genetic clusters identified by STRUCTURE
(see Fig. 2). All other collection sites
(outlier sites) are represented by black-
filled circles.
e public domain in the USA.
830 C. -C. YANG ET AL.
terns characteristic of genetic bottlenecks for popula-
tions of S. invicta at each main site in China. These
results are likely quite robust given the large number of
polymorphic microsatellite loci employed for the pres-
ent study (Luikart et al. 1998; Piry et al. 1999; Spencer
et al. 2000; Garza & Williamson 2001; Williamson-Nate-
san 2005). The minor differences in genetic diversity
estimates (A0R and H0E) between populations from China
and the USA are not surprising when one considers that
the initial introduction of fire ants into the USA from
South America likely led to a substantial loss of many
rare alleles (Shoemaker et al. 2006; Caldera et al. 2008).
This initial introduction presumably resulted in an alle-
lic frequency spectrum in the USA skewed towards rel-
atively high frequency alleles (higher proportion of
alleles with high frequencies) so that the subsequent
loss of rare alleles likely was relatively minor during
secondary introductions from the USA into China.
The finding of a consistent reduction in genetic diver-
sity associated with all three independent introductions
from the same source population likely reflects the fact
that the numbers of original founders into each area
were quite small (at the very least, the numbers of
lineages surviving from the initial invasion through
subsequent population growth are relatively small;
Ciosi et al. 2008). Despite evidence for reduced genetic
variation within invasive S. invicta populations com-
pared with native populations, the consequences of
such reduced genetic variation, if any, are not clear. In
many haplodiploid social insects with complementary
sex determination, such as S. invicta, a reduction of
genetic diversity at the sex locus (loci) leads to higher
proportions of queens that produce diploid males. The
production of diploid males often represents a signifi-
cant mortality factor because of their inviability and ⁄ or
sterility (Ross & Fletcher 1985; Hedrick et al. 2006) and
increases extinction proneness (Zayed & Packer 2005).
Nonetheless, the genetic load associated with producing
a high proportion of diploid males in USA polygyne
fire ant populations (Ross & Fletcher 1985; Ross et al.
1993) seems of little consequence given its stunning suc-
cess as an invader. Similar patterns are also evident in
introduced S. invicta populations in China as well as
other newly introduced populations (Australia and Tai-
wan, Henshaw et al. 2005; Yang et al. 2008), suggesting
that the loss of substantial genetic diversity may not be
a significant barrier to invasion success of this ant.
Conclusions
Our genetic results provide support for the widespread
notion that the introduction routes and subsequent
spread of invasive species are linked to local and global
trade and transportation networks. Thus, pathway risk
� Published 2011. This article is a
assessment integrating knowledge of the volume,
sources and destinations of traded goods represents a
potentially informative predictor for propagule pressure
and for potential hotspots for inadvertent species
introductions. Several additional patterns of genetic
variation we detected also have implications for devel-
opment of effective pest management strategies of
Solenopsis invicta within China. For example, long-
distance dispersal, likely facilitated by human-aided
transport primarily of the polygyne social form, has
been a prevailing means of spread of S. invicta through-
out south-eastern China, which raises suspicions that
additional infestations are likely to occur and will be
discovered with increasing surveillance efforts. Indeed,
the failure to recognize the ability of fire ants to spread
by human means during the shipment and movement
of nursery stock is partly responsible for the poor suc-
cess of initial quarantine efforts to prevent the outward
spread of fire ants after their initial invasion into the
USA (Tschinkel 2006). Lastly, although clear signatures
of recent genetic bottlenecks in introduced fire ant pop-
ulations in China are evident, the consequences of loss
of genetic diversity, if any, are not apparent given its
successful establishment over a wide area in China in a
relatively short time.
Acknowledgements
This work was funded by National Research Initiative of the
USDA National Institute of Food and Agriculture (grant num-
bers 2006-35302-16561 and 2009-35302-05301) and the National
Science Council, Executive Yuan, Taiwan (grant numbers NSC
97-2917-I-002-103 and NSC 99-2313-B-002-044). We sincerely
thank Eileen M. Carroll for assistance in the laboratory and
Siu-Wah Kong and Chia-Hung Hsieh for field assistance in col-
lecting samples. We also thank Wen-Jer Wu, Ken Ross,
Lucinda Lawson and John Wang for helpful comments on ear-
lier versions of this manuscript.
References
Ahrens M, Ross KG, Shoemaker DD (2005) Phylogeographic
structure of the fire ant Solenopsis invicta in its native South
American range: roles of natural barriers and habitat
connectivity. Evolution, 59, 1733–1743.
Ascunce MS, Bouwma AM, Shoemaker DD (2009)
Characterization of 24 microsatellite markers in 11 species of
fire ants in the genus Solenopsis (Hymenoptera: Formicidae).
Molecular Ecology Resources, 9, 1475–1479.
Ascunce MS, Yang CC, Oakey J et al. (2011) Global invasion
history of the fire ant Solenopsis invicta. Science, 331, 1066–
1068.
Caldera EJ, Ross KG, DeHeer CJ, Shoemaker DD (2008)
Putative native source of the invasive fire ant Solenopsis
invicta in the U.S.A. Biological Invasions, 10, 1457–1479.
Chen YP, Lu LY, Skow LC, Vinson SB (2003) Relatedness
among coexisting queens within polygyne colonies of a
U.S. Government work and is in the public domain in the USA.
POPULATION GENETICS OF S . INVICTA I N CHI NA 831
Texas population of the fire ant, Solenopsis invicta.
Southwestern Entomologist, 28, 27–36.
Ciosi M, Miller NJ, Kim KS, Giordano R, Estoup R,
Guillemaud T (2008) Invasion of Europe by the western corn
rootworm, Diabrotica virgifera virgifera: multiple transatlantic
introductions with various reductions of genetic diversity.
Molecular Ecology, 17, 3614–3627.
Cook JM (1993) Sex determination in the Hymenoptera: a
review of models and evidence. Heredity, 71, 421–435.
Cornuet JM, Luikart G (1996) Description and power analysis
of two tests for detecting recent population bottlenecks from
allele frequency data. Genetics, 144, 2001–2014.
Darling JA, Bagley MJ, Roman J, Tepolt CK, Geller JB (2008)
Genetic patterns across multiple introductions of the globally
invasive crab genus Carcinus. Molecular Ecology, 17, 4992–
5007.
DeHeer CJ, Goodisman MAD, Ross KG (1999) Queen dispersal
strategies in the multiple-queen form of the fire ant
Solenopsis invicta. The American Naturalist, 153, 660–675.
Dieringer D, Schlotterer C (2002) Microsatellite analyser (MSA):
a platform independent analysis tool for large microsatellite
data sets. Molecular Ecology Notes, 3, 167–169.
Dlugosch KM, Parker IM (2008) Founding events in species
invasions: genetic variation, adaptive evolution, and the
role of multiple introductions. Molecular Ecology, 17, 431–
449.
Evanno G, Regnaut S, Goudet J (2005) Detecting the number of
clusters of individuals using the software STRUCTURE: a
simulation study. Molecular Ecology, 14, 2611–2620.
Excoffier L, Laval G, Schneider S (2005) Arlequin ver. 3.0: an
integrated software package for population genetics data
analysis. Evolutionary Bioinformatics Online, 1, 47–50.
Ficetola GF, Bonin A, Miaud C (2008) Population genetics
reveals origin and number of founders in a biological
invasion. Molecular Ecology, 17, 773–782.
Fonseca DM, Widdel AK, Hutchinson M, Spichiger SE, Kramer
LD (2010) Fine-scale spatial and temporal population
genetics of Aedes japonicus, a new US mosquito, reveal
multiple introductions. Molecular Ecology, 19, 1559–1572.
Garza JC, Williamson E (2001) Detection of reduction in
population size using data from microsatellite DNA.
Molecular Ecology, 10, 305–318.
Goodisman MAD, DeHeer CJ, Ross KG (2000) Unusual
behavior of polygyne fire ant queens on nuptial flights.
Journal of Insect Behavior, 13, 455–468.
Gotzek D, Shoemaker DD, Ross KG (2007) Molecular variation
at a candidate gene implicated in the regulation of fire ant
social behavior. PLoS ONE, 2, e1088. doi:10.1371/
journal.pone.0001088.
Goudet J (2001) FSTAT, A Program to Estimate and Test Gene
Diversities and Fixation Indices, Version 2.9.3. http://
www.unil.ch/izea/softwares/fstat.html.
Hedrick PW, Gadau J, Page R (2006) Genetic sex determination
and extinction. Trends in Ecology and Evolution, 21, 55–57.
Helantera H, Strassmann JE, Carrillo J, Queller DC (2009)
Unicolonial ants: where do they come from, what are they,
and where are they going? Trends in Ecology and Evolution,
24, 341–349.
Henshaw MT, Kunzmann N, Vanderwoude C, Sanetra M,
Crozier RH (2005) Population genetics and history of the
introduced fire ant, Solenopsis invicta Buren (Hymenoptera:
� Published 2011. This article is a U.S. Government work and is in th
Formicidae), in Australia. Australian Journal of Entomology, 44,
37–44.
Herborg LM, Jerde CL, Lodge DM, Ruiz GM, MacIsaac HJ
(2007) Predicting invasion risk using measures of
introduction effort and environmental niche models.
Ecological Applications, 17, 663–674.
Huang TC, Chou YC, Chou HC (2004) The infestation and
control of the red imported fire ant in Taiwan. In: Proceedings
of the Symposium on the Control of the Red Imported Fire Ant
(eds Shih CJ, Wu WJ), pp. 1–13. Bureau of Animal and Plant
Health Inspection and Quarantine, Council of Agriculture,
Executive Yuan, Taipei, Taiwan.
Huang S, Luo LZ, Zhang L, Zhang S, Wang W (2009)
Determination of mound density, social form, and control
efficiency of red imported fire ant, Solenopsis invicta, in
Shenzhen city. Plant Protection, 35, 142–145. (In Chinese).
Hubisz MJ, Falush D, Stephens M, Pritchard JK (2009)
Inferring weak population structure with the assistance of
sample group information. Molecular Ecology Notes, 9, 1322–
1332.
Hulme PE (2006) Beyond control: wider implications for the
management of biological invasions. Journal of Applied
Ecology, 43, 835–847.
Hulme PE, Bacher S, Kenis M et al. (2008) Grasping at the
routes of 36 biological invasions: a framework for integrating
pathways into policy. Journal of Applied Ecology, 45, 403–414.
Jetter KM, Hamilton J, Klotz JH (2002) Red imported fire ants
threaten agriculture, wildlife and homes. California Agriculture,
56, 26–34.
Kalinowski ST (2005) HP-Rare: a computer program for
performing rarefaction on measures of allelic diversity.
Molecular Ecology Notes, 5, 187–189.
King JR, Tschinkel WR, Ross KG (2009) A case study of human
exacerbation of the invasive species problem: transport and
establishment of polygyne fire ants in Tallahassee, Florida,
USA. Biological Invasions, 11, 373–377.
Kolbe JJ, Glor RE, Rodrı¢guez Schettino L, Chamizo Lara AR,
Larson A, Losos JB (2004) Genetic variation increases
during biological invasion by a Cuban lizard. Nature, 431,
177–181.
Krieger MJB, Keller L (1997) Polymorphism at dinucleotide
microsatellite loci in fire ant Solenopsis invicta populations.
Molecular Ecology, 6, 997–999.
Krushelnycky PD, Loope LL, Reimer NJ (2005) The ecology,
policy and management of ants in Hawaii. Proceedings of the
Hawaiian Entomological Society, 37, 1–25.
Levine JM, D’Antonio CM (2003) Forecasting biological
invasions with increasing international trade. Conservation
Biology, 17, 322–326.
Liu K, Muse SV (2005) PowerMarker: an integrated analysis
environment for genetic marker analysis. Bioinformatics, 21,
2128–2129.
Lombaert E, Guillemaud T, Cornuet J, Malausa T, Facon B,
Estoup A (2010) Bridgehead effect in the worldwide invasion
of the biocontrol harlequin ladybird. PLoS ONE, 5, e9743.
Luikart G, Cornuet JM, Allendorf FW (1998) Temporal changes
in allele frequencies provide estimates of population
bottleneck size. Conservation Biology, 89, 238–247.
McCubbin KI, Weiner JM (2002) Fire ants in Australia: a new
medical and ecological hazard. Medical Journal of Australia,
176, 518–519.
e public domain in the USA.
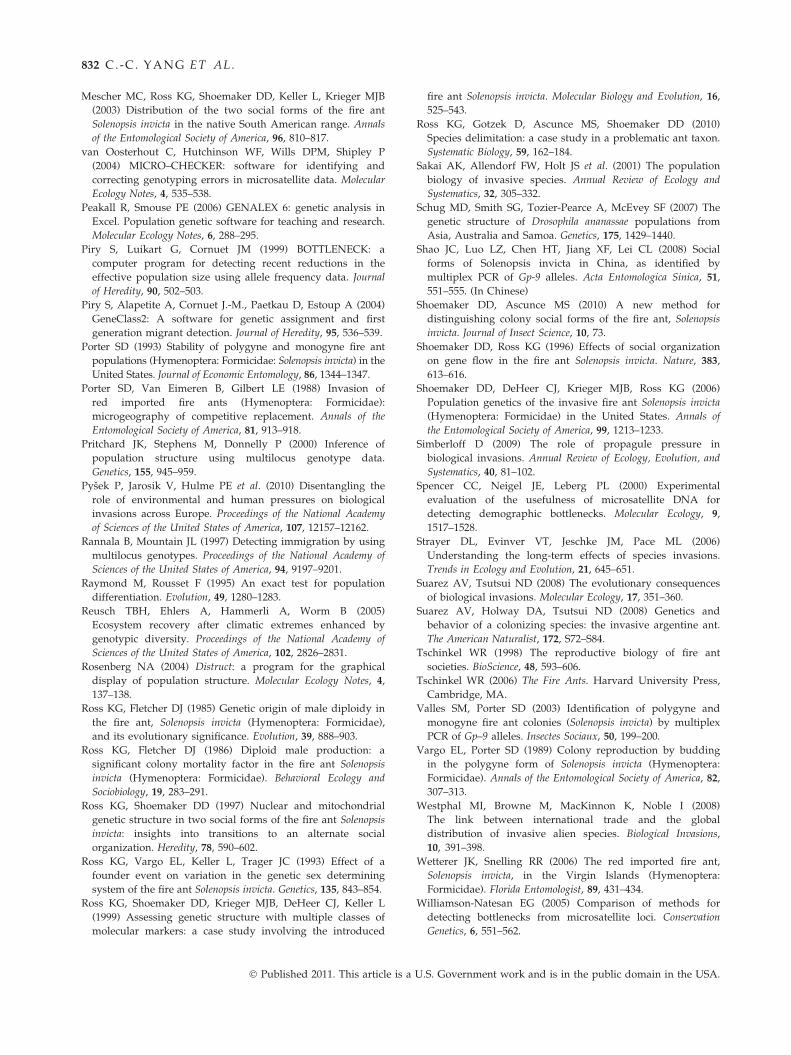
832 C. -C. YANG ET AL.
Mescher MC, Ross KG, Shoemaker DD, Keller L, Krieger MJB
(2003) Distribution of the two social forms of the fire ant
Solenopsis invicta in the native South American range. Annals
of the Entomological Society of America, 96, 810–817.
van Oosterhout C, Hutchinson WF, Wills DPM, Shipley P
(2004) MICRO–CHECKER: software for identifying and
correcting genotyping errors in microsatellite data. Molecular
Ecology Notes, 4, 535–538.
Peakall R, Smouse PE (2006) GENALEX 6: genetic analysis in
Excel. Population genetic software for teaching and research.
Molecular Ecology Notes, 6, 288–295.
Piry S, Luikart G, Cornuet JM (1999) BOTTLENECK: a
computer program for detecting recent reductions in the
effective population size using allele frequency data. Journal
of Heredity, 90, 502–503.
Piry S, Alapetite A, Cornuet J.-M., Paetkau D, Estoup A (2004)
GeneClass2: A software for genetic assignment and first
generation migrant detection. Journal of Heredity, 95, 536–539.
Porter SD (1993) Stability of polygyne and monogyne fire ant
populations (Hymenoptera: Formicidae: Solenopsis invicta) in the
United States. Journal of Economic Entomology, 86, 1344–1347.
Porter SD, Van Eimeren B, Gilbert LE (1988) Invasion of
red imported fire ants (Hymenoptera: Formicidae):
microgeography of competitive replacement. Annals of the
Entomological Society of America, 81, 913–918.
Pritchard JK, Stephens M, Donnelly P (2000) Inference of
population structure using multilocus genotype data.
Genetics, 155, 945–959.
Pysek P, Jarosik V, Hulme PE et al. (2010) Disentangling the
role of environmental and human pressures on biological
invasions across Europe. Proceedings of the National Academy
of Sciences of the United States of America, 107, 12157–12162.
Rannala B, Mountain JL (1997) Detecting immigration by using
multilocus genotypes. Proceedings of the National Academy of
Sciences of the United States of America, 94, 9197–9201.
Raymond M, Rousset F (1995) An exact test for population
differentiation. Evolution, 49, 1280–1283.
Reusch TBH, Ehlers A, Hammerli A, Worm B (2005)
Ecosystem recovery after climatic extremes enhanced by
genotypic diversity. Proceedings of the National Academy of
Sciences of the United States of America, 102, 2826–2831.
Rosenberg NA (2004) Distruct: a program for the graphical
display of population structure. Molecular Ecology Notes, 4,
137–138.
Ross KG, Fletcher DJ (1985) Genetic origin of male diploidy in
the fire ant, Solenopsis invicta (Hymenoptera: Formicidae),
and its evolutionary significance. Evolution, 39, 888–903.
Ross KG, Fletcher DJ (1986) Diploid male production: a
significant colony mortality factor in the fire ant Solenopsis
invicta (Hymenoptera: Formicidae). Behavioral Ecology and
Sociobiology, 19, 283–291.
Ross KG, Shoemaker DD (1997) Nuclear and mitochondrial
genetic structure in two social forms of the fire ant Solenopsis
invicta: insights into transitions to an alternate social
organization. Heredity, 78, 590–602.
Ross KG, Vargo EL, Keller L, Trager JC (1993) Effect of a
founder event on variation in the genetic sex determining
system of the fire ant Solenopsis invicta. Genetics, 135, 843–854.
Ross KG, Shoemaker DD, Krieger MJB, DeHeer CJ, Keller L
(1999) Assessing genetic structure with multiple classes of
molecular markers: a case study involving the introduced
� Published 2011. This article is a
fire ant Solenopsis invicta. Molecular Biology and Evolution, 16,
525–543.
Ross KG, Gotzek D, Ascunce MS, Shoemaker DD (2010)
Species delimitation: a case study in a problematic ant taxon.
Systematic Biology, 59, 162–184.
Sakai AK, Allendorf FW, Holt JS et al. (2001) The population
biology of invasive species. Annual Review of Ecology and
Systematics, 32, 305–332.
Schug MD, Smith SG, Tozier-Pearce A, McEvey SF (2007) The
genetic structure of Drosophila ananassae populations from
Asia, Australia and Samoa. Genetics, 175, 1429–1440.
Shao JC, Luo LZ, Chen HT, Jiang XF, Lei CL (2008) Social
forms of Solenopsis invicta in China, as identified by
multiplex PCR of Gp-9 alleles. Acta Entomologica Sinica, 51,
551–555. (In Chinese)
Shoemaker DD, Ascunce MS (2010) A new method for
distinguishing colony social forms of the fire ant, Solenopsis
invicta. Journal of Insect Science, 10, 73.
Shoemaker DD, Ross KG (1996) Effects of social organization
on gene flow in the fire ant Solenopsis invicta. Nature, 383,
613–616.
Shoemaker DD, DeHeer CJ, Krieger MJB, Ross KG (2006)
Population genetics of the invasive fire ant Solenopsis invicta
(Hymenoptera: Formicidae) in the United States. Annals of
the Entomological Society of America, 99, 1213–1233.
Simberloff D (2009) The role of propagule pressure in
biological invasions. Annual Review of Ecology, Evolution, and
Systematics, 40, 81–102.
Spencer CC, Neigel JE, Leberg PL (2000) Experimental
evaluation of the usefulness of microsatellite DNA for
detecting demographic bottlenecks. Molecular Ecology, 9,
1517–1528.
Strayer DL, Evinver VT, Jeschke JM, Pace ML (2006)
Understanding the long-term effects of species invasions.
Trends in Ecology and Evolution, 21, 645–651.
Suarez AV, Tsutsui ND (2008) The evolutionary consequences
of biological invasions. Molecular Ecology, 17, 351–360.
Suarez AV, Holway DA, Tsutsui ND (2008) Genetics and
behavior of a colonizing species: the invasive argentine ant.
The American Naturalist, 172, S72–S84.
Tschinkel WR (1998) The reproductive biology of fire ant
societies. BioScience, 48, 593–606.
Tschinkel WR (2006) The Fire Ants. Harvard University Press,
Cambridge, MA.
Valles SM, Porter SD (2003) Identification of polygyne and
monogyne fire ant colonies (Solenopsis invicta) by multiplex
PCR of Gp–9 alleles. Insectes Sociaux, 50, 199–200.
Vargo EL, Porter SD (1989) Colony reproduction by budding
in the polygyne form of Solenopsis invicta (Hymenoptera:
Formicidae). Annals of the Entomological Society of America, 82,
307–313.
Westphal MI, Browne M, MacKinnon K, Noble I (2008)
The link between international trade and the global
distribution of invasive alien species. Biological Invasions,
10, 391–398.
Wetterer JK, Snelling RR (2006) The red imported fire ant,
Solenopsis invicta, in the Virgin Islands (Hymenoptera:
Formicidae). Florida Entomologist, 89, 431–434.
Williamson-Natesan EG (2005) Comparison of methods for
detecting bottlenecks from microsatellite loci. Conservation
Genetics, 6, 551–562.
U.S. Government work and is in the public domain in the USA.
POPULATION GENETICS OF S . INVICTA I N CHI NA 833
Yang CC, Shoemaker DD, Wu WJ, Shih CJ (2008) Population
genetic structure of the red imported fire ant, Solenopsis
invicta, in Taiwan. Insectes Sociaux, 55, 54–65.
Yang CC, Shoemaker DD, Wu JC et al. (2009) Successful
establishment of the invasive fire ant Solenopsis invicta in
Taiwan: insights into interactions of alternate social forms.
Diversity and Distributions, 15, 709–719.
Zayed A, Packer L (2005) Complementary sex determination
substantially increases extinction proneness of haplodiploid
populations. Proceedings of the National Academy of Sciences of
the United States of America, 102, 10742–10746.
Zeng L, Lu YY, He XF, Zhang WQ, Liang GW (2005)
Identification of the red imported fire ant Solenopsis invicta to
invade mainland China and infestation in Wuchuan,
Guangdong. Chinese Bulletin of Entomology, 42, 144–148.
Zhang R, Li Y, Liu N, Porter SD (2007) An overview of the red
imported fire ant (Hymenoptera: Formicidae) in mainland
China. Florida Entomologist, 90, 723–731.
C.C.Y. and C.J.S. are mainly interested in the evolutionary biol-
ogy of invasive fire ants, role of social organization in invasion
success and development of effective control strategies of fire
ants. M.S.A. is an evolutionary geneticist interested in popula-
tion genetics, phylogeography, host-parasite interactions and
invasion processes. She is currently working on lice and
human co-evolution. L.Z.L. and J.G.S.’s research focus on
understanding the basic population biology of invasive species
in China.
� Published 2011. This article is a U.S. Government work and is in th
Data accessibility:
MtDNA sequences: GenBank accessions HM241155–HM241157.
Microsatellite data deposited in the Dryad repository:
doi:10.5061/dryad.2j5r8v6v.
Supporting information
Additional supporting information may be found in the online
version of this article.
Table S1 Top US state exporters of goods to China from 2000
to 2005 (expressed as millions of US$).
Table S2 Assignment of colonies collected from outlier sites
using different genetic analyses.
Fig. S1 Principal components analyses (PCA) showing cluster-
ing of individuals based on microsatellite data.
Fig. S2 Results from analysis of molecular variance (AMOVA) for
different pre-defined groups as follows: (a) Main sites that are
in close geographic proximity; (b) Same as (a) but data for
individuals from sites ZH and ZS excluded; (c) Sites assigned
to China_B1 and B2 clusters; *P < 0.05 (see text for various P
values).
Please note: Wiley-Blackwell are not responsible for the content
or functionality of any supporting information supplied by the
authors. Any queries (other than missing material) should be
directed to the corresponding author for the article.
e public domain in the USA.