property market assessment and economic outlook€¦ · 1.2.3. another important element for the...
TRANSCRIPT
Outline Planning Application
June 2020
PROPERTY MARKET ASSESSMENT
AND ECONOMIC OUTLOOK

OxfordshireGarden Village will be a place that
celebrates nature, allowing wildlife, plants and people to co-exist and thrive; a sanctuary of modern living
within a rural West Oxfordshire setting.
Application Documents and DrawingsDocument Name Reference Number
Outline Planning Application Guide N/A
Application Form and Certificates N/A
Location Plan (OGV-DWG-APPR-LP-01)
Planning Application Boundary (OGV-DWG-APPR-PAB-01)
Building Demolition Plan (OGV-DWG-APPR-BDP-01)
A40 Western Access drawing (OGV-DWG-APPR-A40A-01)
Lower Road Northern Site Access drawing (OGV-DWG-APPR-LRNA-01)
Lower Road Site Access drawing (OGV-DWG-APPR-LRA-01)
Cuckoo Lane Residential Access drawing (OGV-DWG-APPR-CLRA-01)
Parameter Plans Booklet (OGV-DOC-APPR-PP-01)
Parameter Plan 1: Land Use (OGV-DWG-APPR-PP1-01)
Parameter Plan 2: Landscape (OGV-DWG-APPR-PP2-01)
Parameter Plan 3: Movement and Access (OGV-DWG-APPR-PP3-01)
Parameter Plan 4: Building Heights (OGV-DWG-APPR-PP4-01)
Development Specification and Framework (OGV-DOC-APPR-DSF-01)
Site-wide Design Code (OGV-DOC-APPR-SWDC-01)
Illustrative Masterplan (OGV-DWG-ILL-IMP-01)
Blue Line Plan (OGV-DWG-INF-BLP-01)
Planning Statement (OGV-DOC-INF-PS-01)
Design and Access Statement (OGV-DOC-INF-DAS-01)
Transport Assessment (OGV-DOC-INF-TA-01)
Affordable Housing Statement (OGV-DOC-INF-AHS-01)
Arboricultural Impact Assessment (OGV-DOC-INF-AIA-01)
Biodiversity Mitigation, Monitoring and Management Framework (OGV-DOC-INF-BMMMF-01)
Draft Heads of Terms for Section 106 Agreement (OGV-DOC-INF-DHOT-01)
Environmental Statement Non-Technical Summary (OGV-DOC-INF-ESNTS-01)
Environmental Statement - Volume 1 - Main Report (OGV-DOC-INF-ES-01)
Environmental Statement - Volume 2 - Appendices (OGV-DOC-INF-ESAPP-01)
Flood Risk Assessment (OGV-DOC-INF-FRA-01)
Framework Travel Plan (OGV-DOC-INF-FTP-01)
Health Impact Assessment (OGV-DOC-INF-HIA-01)
Infrastructure Delivery Plan (OGV-DOC-INF-IDP-01)
Outline Community Employment Plan (OGV-DOC-INF-OCEP-01)
Outline Energy Strategy (OGV-DOC-INF-ENER-01)
Outline Stewardship and Management Plan (OGV-DOC-INF-OSMP-01)
Phase 1 Ground Condition Assessment (OGV-DOC-INF-P1GCA-01)
Phase 2 Ground Condition Assessment (OGV-DOC-INF-P2GCA-01)
Property Market Assessment and Economic Outlook (OGV-DOC-INF-EMP-01)
Retail Assessment (OGV-DOC-INF-RA-01)
Statement of Community Involvement (OGV-DOC-INF-SCI-01)
Surface Water Management Strategy (OGV-DOC-INF-SWMS-01)
Sustainability Strategy (OGV-DOC-INF-SUS-01)
Topographical Survey (OGV-DWG-INF-TOP-01)
Utilities Appraisal Report (OGV-DOC-INF-UTI-01)
Waste Strategy (OGV-DOC-INF-WAS-01)


Grosvenor Developments Ltd June 2020
Oxfordshire Garden Village Property Market Assessment and Economic Outlook
savills.co.uk

Oxfordshire Garden Village Property Market Assessment and Economic Outlook
June 2020 1
Contents Executive Summary 1 1. Introduction 2
1.1. Background .......................................................................................................................................................... 2 1.2. Method .................................................................................................................................................................. 3 1.3. Caveats and Limitations ....................................................................................................................................... 3
2. Site Context 4 2.1. Introduction ........................................................................................................................................................... 4 2.2. Site Context .......................................................................................................................................................... 4 2.3. Planning Context .................................................................................................................................................. 5 2.4. Development Proposal Compared to Policy Framework ...................................................................................... 8
3. Property Market Analysis 9 3.1. Introduction ........................................................................................................................................................... 9 3.2. Use Analysis ......................................................................................................................................................... 9 3.3. Phasing Analysis ................................................................................................................................................ 11 3.4. Scale of Development ......................................................................................................................................... 12 3.5. Case Studies ...................................................................................................................................................... 13
4. Link Between Homes and Jobs 20 4.1. Introduction ......................................................................................................................................................... 20 4.2. Onsite Balance ................................................................................................................................................... 20 4.3. Balance of Homes and Jobs in the Wider Area .................................................................................................. 21 4.4. Conclusions ........................................................................................................................................................ 22
5. Economic Outlook 23 5.1. Introduction ......................................................................................................................................................... 23 5.2. Employment ........................................................................................................................................................ 23 5.3. Business Base .................................................................................................................................................... 25
6. Conclusions 28 6.1. Conclusions ........................................................................................................................................................ 28
Oxfordshire Garden Village Property Market Assessment and Economic Outlook
June 2020 1
Executive Summary Savills was commissioned to undertake a property market assessment and economic outlook analysis to support the planning application by Grosvenor Developments Ltd (‘the Applicant’) for its Oxfordshire Garden Village (OGV) development proposal. The proposal is for 26.9ha of employment land as part of the ca.40ha supported in the Local Plan. However, it is sufficient to create a critical mass of employment activity and could also facilitate future delivery of employment premises on adjacent land within the wider Local Plan allocation. This report considers the suitability of the scheme from a property market and economic outlook perspective.
Local Plan policy supports an allocation of around 40ha of employment land to operate as a campus-style science park. There is no evidence to establish that the 40ha is the required land quantum or ‘critical mass’ to deliver a successful science park. It is acknowledged that, as envisaged by the Local Plan, the science park will be delivered beyond the current Local Plan period which ends in 2031. There is a number of factors from the property market and economic growth evidence base which suggest that the outline planning application (OPA) development proposal for 26.9ha represents the necessary critical mass, comprised of an appropriate range of uses, as a first stage of reaching the longer-term ambition.
The employment land and floorspace in the Applicant’s OGV development proposal has capacity to deliver employment land and premises comparable to West Oxfordshire District Council’s (WODC) full employment land and floorspace requirement in the evidence base document used to support its Local Plan. It would also be comparable in scale to a number of notable business parks although smaller in scale (at this stage) compared to well-established parks such as Granta Park in Cambridge and Green Park Business Park in Reading.
With regard to the development proposal’s delivery of employment and homes, both elements would be highly beneficial. The new homes would address an anticipated decline in WODC’s labour force and meet the needs of the tight housing market in the wider area including in Oxford City. The new employment premises would broaden and diversify the District’s economic base which has a smaller proportion of professionals and a slightly higher concentration of less skilled workers.
The current outlook for WODC’s economy from Oxford Economics shows modest overall economic growth and a high level of out-commuting. WODC’s manufacturing and retail sectors, of which there is a concentration, are expected to continue to contract. The District has relatively low wages and an under provision of professionals working in the economy. The scale of the OGV development proposal for employment land is a significant move in the delivery of employment land and premises that meet the longer term needs of the District and the wider area.
Given that the proposed employment area will be developed beyond the Local Plan period, the application is an appropriate response, of the necessary scale, to policy and the need to integrate jobs and homes at the allocated site. As such we anticipate that the OGV development proposal for employment land and premises is likely to be more appropriate in scale at this stage and within the control of the Applicant as opposed to the approximately 40ha supported in policy.

Oxfordshire Garden Village Property Market Assessment and Economic Outlook
June 2020 2
1. Introduction 1.1. Background
1.1.1. Savills was commissioned by Grosvenor Developments Ltd (the ‘Applicant’) to undertake a property market assessment and economic outlook analysis to support its planning application for its Oxfordshire Garden Village (OGV) development proposal in Oxfordshire. The key issues that are covered in the report are the scale, mix, and phasing of employment land and premises; the economic outlook for the area; and the balance between delivering new homes and jobs.
1.1.2. The Oxfordshire Garden Village is the Applicant’s proposed development to the north of the village of Eynsham in West Oxfordshire District Council (WODC). Eynsham is situated less than six miles to the north-west of Oxford City Centre.
1.1.3. The OGV development proposal is part of a larger Local Plan allocation in the West Oxfordshire Local Plan 2031 which is referred to in the Local Plan as the Oxfordshire Cotswolds Garden Village Strategic Location for Growth. The Local Plan sets out the framework to deliver about 2,200 new homes, around 40 hectares of employment land (to operate as a science park), schools and other elements for the new community.
1.1.4. The Oxfordshire Cotswolds Garden Village Area Action Plan – Preferred Options Paper was published by WODC in July 2019. The document is WODC’s first step towards formulating more detailed guidance for the allocated site.
1.1.5. The Oxfordshire Cotswold Garden Village Employment Study (the ‘Lichfields Employment Study’) was prepared by Lichfields and published in April 2019, prior to the draft AAP. It provides advice on the role that employment could play within the Local Plan allocation. It states that around 40 ha of employment land in the allocation would represent a ‘critical mass’ to deliver a successful employment scheme.
1.1.6. The OGV development proposal includes 26.9ha land for employment uses whilst providing sufficient flexibility to allow for organic growth and without hindering future employment land development on adjacent plots of land falling within the Local Plan allocation. The OGV development proposal’s Parameter Plans do not fetter the future delivery of employment land in the Allocation, although the Applicant is not including this wider employment area within the planning application for OGV as, although allocated, is beyond the Applicant's control. Initial estimates, applying the same assumptions as the Applicant’s indicative employment mix, suggest this additional area adjacent to the Site within the AAP boundary could yield approximately 7.8ha of additional employment land, subject to further testing.
1.1.7. With regard to employment floorspace, the OGV development proposal includes about 57,000 sqm including ancillary uses. An additional 23,000 sqm of employment floorspace could potentially be delivered on the additional 7.8ha of employment land within the allocation that is outside of the OGV proposal. This would achieve a total employment floorspace quantum of 80,000 sqm on about 34.7ha of employment land. The Local Plan does not include a specific target for the amount of employment floorspace that should be delivered.
1.1.8. This report assesses the suitability of the employment proposition at the OGV development proposal and considers the scale, mix, phasing and market factors such as demand, take up, and the balance between homes and jobs generated.
Oxfordshire Garden Village Property Market Assessment and Economic Outlook
June 2020 3
1.2. Method
1.2.1. The report is comprised of several analyses. After presenting the Site the report summarises the relevant planning policy and supporting evidence. It then reviews the OGV development proposal and sets out how it differs from the Local Plan Allocation. It also covers the critical mass of the proposed employment uses and considers the longer-term implications for organic growth of employment premises on adjacent land within the Allocation boundary.
1.2.2. To assess the necessary quantum of land for the creation of a successful employment park, the report presents several case studies of existing parks to consider their own critical mass including plot ratios and phasing for delivery. Using the case studies and our own experience we review:
The scale of employment uses and critical mass of employment uses; Proposed mix of uses; Proposed phasing, considering demand and take up factors; Level of flexibility to support organic growth; and Scale of future growth.
1.2.3. Another important element for the success of the OGV development proposal is the appropriate balance
between homes and jobs. The report presents a high-level assessment of the link between homes and jobs for the overall OGV development proposal and considers the scale of housing development compared to the number of jobs which can be generated at the site.
1.2.4. Finally, the report covers the local economic outlook of the area. It presents the existing mix of business and economic sectors in the local area and considers the current outlook for employment. The section then assesses the impact that the OGV development proposal could have on the area by diversifying the business base and introducing higher-skilled employment to the local area.
1.3. Caveats and Limitations
1.3.1. The Coronavirus crisis will have a major impact on the demand for different employment uses in the short to medium term. Our analysis presented in this report was prepared at the time that the Coronavirus crisis had impacted the UK property market. The analysis and conclusions should be considered as potentially relevant to the situation once the UK economy has recovered from the most significant impacts of Coronavirus. However, it is too early to estimate how the crisis will impact on trends and for example how strong the rebound will be and to what degree there is a change in the composition of demand and activities in the post Coronavirus crisis world. The findings should be kept under review as the situation evolves.

Oxfordshire Garden Village Property Market Assessment and Economic Outlook
June 2020 4
2. Site Context 2.1. Introduction
2.1.1. This section presents the employment component of the OGV development proposal, its wider spatial context and a summary of the relevant planning policy. It then distinguishes between the OGV development proposal and the wider vision for the Local Plan Allocation.
2.1.2. Whilst the Local Plan states that the employment element of the allocated site should be around 40 hectares and operate as a science park, it provides no detail about the basis for its size nor does it set out the quantum and mix of employment floorspace or the appropriate types of ancillary uses.
2.1.3. The Preferred Options AAP (POAAP - July 2019) acknowledges that the proposed science park is a long-term proposition that requires phasing and that its build out will be extend beyond the current Local Plan period (to 2031).
2.1.4. The Lichfields Employment Study that informed the Preferred Options AAP cites a range of characteristics that can influence the performance of science parks. It includes scale/size, linkages with academia, presence of an anchor institution and a USP (unique selling proposition). It does not cite demand for premises in Eynsham as a key driver and recognises the considerable competition from a range of existing and planned science parks throughout Oxfordshire.
2.1.5. The evidence base document also presents a range of science parks in Oxfordshire and Cambridgeshire. The evidence suggests that size/scale could be a factor in performance but that the relationship does not appear to be strong. There are a range of factors that determine performance.
2.2. Site Context
2.2.1. The Local Plan allocates the Oxfordshire Cotswolds Garden Village Strategic Location for Growth which includes the area that is the subject of the OGV development proposal. The allocated site is agricultural land to the north of the village of Eynsham in the south-east corner of the administrative area of WODC. Eynsham is about five miles to the north-east of the Oxford City Centre.
2.2.2. The OGV development proposal comprises a mix of uses (in addition to the employment component) that includes 2,200 dwellings, school sites, a range of community uses and public open space including leisure and sports facilities.
2.2.3. The principal employment land element of the OGV development proposal will be located to the west of Cuckoo Lane, adjacent to the proposed Park and Ride facility. There is also adjacent land to the west of OGV that is within the Local Plan Allocation and which could be used to bring forward additional employment land. The Applicant has considered a wider masterplan that considers future connections to the adjacent land. Table 2.1 shows that the employment element on the Applicant’s controlled land is 26.9 hectares and that the adjacent land could contribute an additional 7.8 hectares, as shown in Figure 2.1. Although the adjacent land is outside the planning application boundary, the Illustrative Masterplan and Parameter Plans demonstrate that the OGV development proposal would not fetter the delivery of additional employment floorspace. Initial estimates, applying the same assumptions as the Applicant’s indicative employment mix, suggest the adjacent land, within the Allocation, could yield approximately 7.8ha and 23,000 sqm of additional employment floorspace, subject to further testing. Pre-application discussions have confirmed that 40ha is equivalent to 80,000 sqm as this represents an appropriate plot ratio for the

Oxfordshire Garden Village Property Market Assessment and Economic Outlook
June 2020 5
type of landscape-led science park typology sought by West Oxfordshire.
Figure 2.1 Potential Wider Employment Area
Source: TOR (2020)
Table 2.1 Potential Employment Land and Floorspace from OGV Development Proposal And Adjacent Land
Land or Use Class Application Boundary Adjacent Land Total AAP Guidance
Land (ha) 26.9 7.8 34.7 40.0
Total Employment Floorspace (sqm) 57,000 23,000 80,000 80,000*
Source: Grosvenor (2020) * As advised in Pre-application discussions
2.3. Planning Context
2.3.1. The planning policy which frames the development proposal is set out in the West Oxfordshire Local Plan 2031 (adopted September 2018). The Local Plan says the Council intends to prepare an Area Action Plan (AAP) with the vision and mix of uses for the site.
2.3.2. The Local Plan vision for the employment element of OGV states (our underlining):

Oxfordshire Garden Village Property Market Assessment and Economic Outlook
June 2020 6
In accordance with Garden City/Village principles, there will be a strong emphasis on the provision of high quality local employment opportunities in order to encourage increased self-containment and reduce the need for out-commuting. Whilst the detail will be worked up through the Area Action Plan, it is anticipated that the Garden Village will incorporate a new science park of around 40 hectares in size in a prominent location close to the A40. This scale will provide long term capacity up to and beyond 2031. Although there are a number of ‘campus-style’ science parks in Oxfordshire, there are currently none in West Oxfordshire. The provision of around 40 hectares of business land within the Garden Village will help to ensure it is a commercially viable prospect and has the necessary scale to operate as a science park. The principle of delivering a new science park in this location is supported by the Oxfordshire LEP and is reflective of the economic strength of Eynsham and its close relationship to Oxford and the Oxfordshire knowledge spine. It is complementary to the Northern Gateway proposals in Oxford.
2.3.3. Whilst the Local Plan says the employment element of Local Plan allocation should be around 40 hectares
it provides no detail about the basis for its size nor does not set out the quantum and mix of employment floorspace or the types of ancillary uses. There is nothing in the evidence base that supported the Local Plan that justifies the 40 ha figure.
2.3.4. WODC has consulted on the Preferred Options AAP (July 2019) referenced in the Local Plan. Section 9 covers the employment land element of the Local Plan allocation. It references the aspiration for a campus style science park of around 40ha. The rationale and guidance for the proposed cluster is:
To act as a ‘move on’ site for businesses in Oxford’s existing science parks (notably Begbroke); To provide high quality employment opportunities; Delivery to be achieved through new, large-scale business space, other commercial opportunities,
enabling home-working and developing employment skills and training opportunities. 2.3.5. The Preferred Options AAP states:
‘There is support from a qualitative, supply-side perspective with existing evidence and strategic policy supporting the delivery of a new science park of the type and scale proposed. It represents a key mechanism and spatial opportunity to implement ambitious plans for Oxfordshire to become one of the top three global innovation ecosystems by 2040 (as set out in the emerging Oxfordshire trailblazer LIS). It also offers synergy with the wider architecture of the Oxfordshire ‘knowledge spine’, with OxLEP specifically identifying the garden village at Eynsham as contributing towards this objective.’1
2.3.6. The Preferred Options AAP also states that the science park is a unique opportunity to contribute to
Oxfordshire’s globally renowned knowledge economy and that WODC ‘has historically lacked the supply of sites which are of a scale suitable to attract science/R&D activity’. It states that the proposed science park is an opportunity to reverse this. It goes on to say that the park has the potential to ‘accommodate unmet demand, particularly amongst science and technology sector occupiers’.
2.3.7. The Preferred Options AAP says that there are a range of different science park typologies and says a hybrid is likely to represent the most realistic approach. Despite the lack of clarity about what type of park is best, it concludes that around 40 hectares is the appropriate scale.
1 Oxfordshire Cotswolds Garden Village Area Action Plan (AAP) – Preferred Options (July 2019), p.89

Oxfordshire Garden Village Property Market Assessment and Economic Outlook
June 2020 7
2.3.8. The Preferred Options AAP acknowledges that the science park is a long-term proposition that requires phasing and that its build out will be beyond the Local Plan period (to 2031). It sets out the role of the AAP to ensure that sufficient land is safeguarded to allow the science park to be appropriately phased and to be fully developed over the longer term.
2.3.9. Finally the Preferred Options AAP cautions that reducing the size of the science park could significantly affect its long term success as high tech spin outs will be drawn to other parks which are a scale and size to attract an anchor institution and also provide opportunities for future expansion. It also says that if the scale and size of the employment site is eroded, the park is unlikely to be able to provide the critical mass to successfully attract and retain potential occupiers.
2.3.10. The Preferred Options AAP contains a Preferred Policy Approach 21 – New Business Space addresses the issue of size and states:
‘The quantum of business land to be made available will be the subject of further masterplanning, taking account of the overall site constraints and opportunities and the timing of delivery which is anticipated to run beyond 2031.
The primary emphasis will be on achieving a sufficient ‘critical mass’ of business space of about 40 hectares of land, so as to not undermine or dilute the science park concept and likely future delivery.’
2.3.11. The Preferred Options AAP references and summarises the Lichfields Employment Study which was commissioned by WODC to assess and justify the role that employment should play at the Local Plan allocation. The OGV Employment Study seeks to assess the available evidence to justify the delivery of a new science park of the type and scale proposed in the Local Plan.
2.3.12. The Lichfields Employment Study assumes that the economic potential of allocated land for the science park will develop over time as the location becomes established. It acknowledges that the location is ‘largely untested’ but that there could be scope to help meet unmet demand from across Oxfordshire.
2.3.13. With regard to a science park proposition, the Lichfields Employment Study says there are no immediate opportunities identified for an anchor tenant or academic sponsor but that the aspiration is that the science park would focus on established, growing companies. The study provides that the delivery model for the science park will need to build in flexibility in terms of size and price point of premises.
2.3.14. The Lichfields Employment Study says that the evidence and strategic policy support delivery of the science park from a qualitative, supply side perspective. The report provides no indication of existing demand except to state that the Council’s previous growth assumptions may have been conservative.
2.3.15. The Lichfields Employment Study covers the local office market in Eynsham and notes relatively high vacancy levels within existing stock. However, the Oxfordshire Local Enterprise Partnership (OxLEP) suggests that there is latent demand amongst national and international investors for a business presence within Oxfordshire and the proposed science park could provide an opportunity to attract further investment.
2.3.16. The Lichfields Employment Study presents a wide range of successful parks of varying sizes and delivery strategies in Oxfordshire and Cambridgeshire. It identifies the scale and size of site as a relevant characteristic for their success alongside:
Linkages with academia; Presence of an anchor institution; and
Oxfordshire Garden Village Property Market Assessment and Economic Outlook
June 2020 8
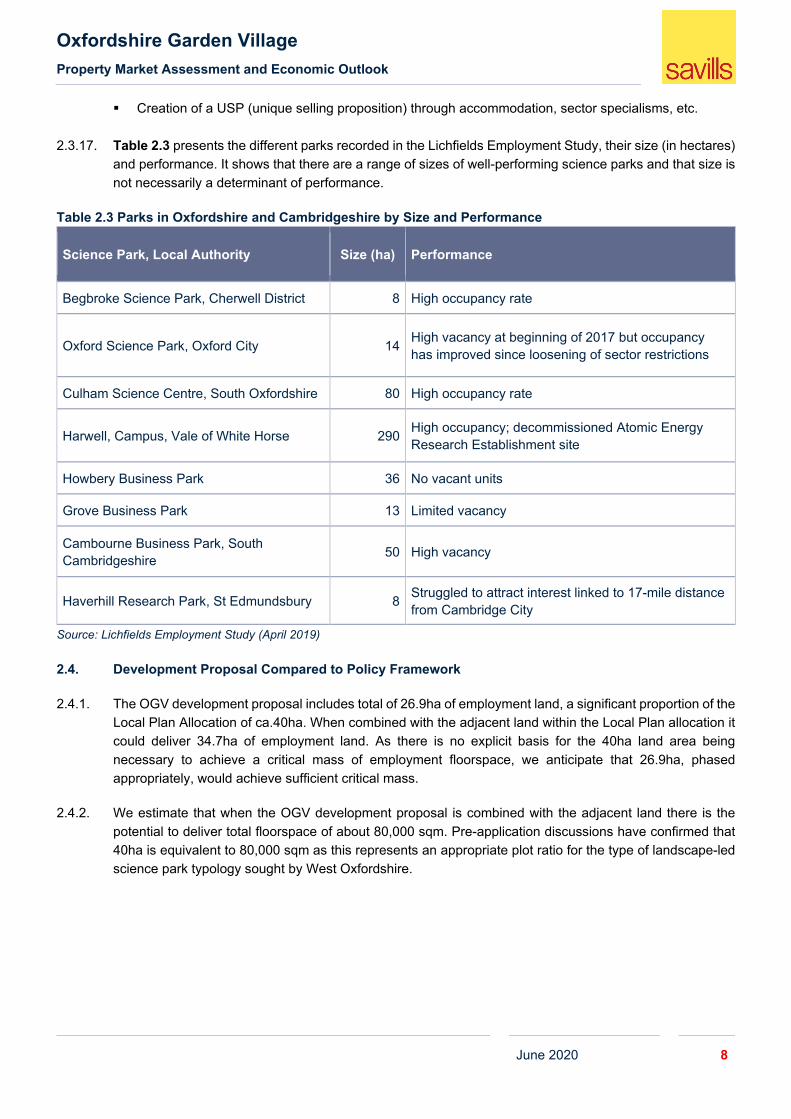
Creation of a USP (unique selling proposition) through accommodation, sector specialisms, etc. 2.3.17. Table 2.3 presents the different parks recorded in the Lichfields Employment Study, their size (in hectares)
and performance. It shows that there are a range of sizes of well-performing science parks and that size is not necessarily a determinant of performance.
Table 2.3 Parks in Oxfordshire and Cambridgeshire by Size and Performance
Science Park, Local Authority Size (ha) Performance
Begbroke Science Park, Cherwell District 8 High occupancy rate
Oxford Science Park, Oxford City 14 High vacancy at beginning of 2017 but occupancy has improved since loosening of sector restrictions
Culham Science Centre, South Oxfordshire 80 High occupancy rate
Harwell, Campus, Vale of White Horse 290 High occupancy; decommissioned Atomic Energy Research Establishment site
Howbery Business Park 36 No vacant units
Grove Business Park 13 Limited vacancy
Cambourne Business Park, South Cambridgeshire 50 High vacancy
Haverhill Research Park, St Edmundsbury 8 Struggled to attract interest linked to 17-mile distance from Cambridge City
Source: Lichfields Employment Study (April 2019)
2.4. Development Proposal Compared to Policy Framework
2.4.1. The OGV development proposal includes total of 26.9ha of employment land, a significant proportion of the Local Plan Allocation of ca.40ha. When combined with the adjacent land within the Local Plan allocation it could deliver 34.7ha of employment land. As there is no explicit basis for the 40ha land area being necessary to achieve a critical mass of employment floorspace, we anticipate that 26.9ha, phased appropriately, would achieve sufficient critical mass.
2.4.2. We estimate that when the OGV development proposal is combined with the adjacent land there is the potential to deliver total floorspace of about 80,000 sqm. Pre-application discussions have confirmed that 40ha is equivalent to 80,000 sqm as this represents an appropriate plot ratio for the type of landscape-led science park typology sought by West Oxfordshire.

Oxfordshire Garden Village Property Market Assessment and Economic Outlook
June 2020 9
3. Property Market Analysis 3.1. Introduction
3.1.1. The section sets out details of the OGV development proposal for employment premises by area and use. It compares the OGV development proposal to WODC’s evidence base to determine if there is alignment. It also assesses the OGV development proposal (and adjacent land) by comparing it with comparable business parks to consider its prospects for success based on scale and build out rate. It draws conclusions about its likely success based on the amount of proposed employment land.
3.1.2. The section shows that the OGV development proposal (and adjacent land) could deliver a quantum of land and floorspace that exceeds the anticipated demand in the council’s evidence base. The OGV development proposal would have capacity to deliver significant additional employment land and is of an appropriate scale that would not jeopardise the delivery of the considerable number of planned business parks in Oxfordshire.
3.2. Use Analysis
3.2.1. This section sets out the development proposal and compares it with the two evidence base documents that relate to the status of WODC’s employment land: the West Oxfordshire Economic Snapshot (2015) (‘the Snapshot’) and the Lichfields Employment Study. The Snapshot is a report that was part of the evidence base for the Local Plan and makes no mention of the Local Plan allocation north of Eynsham that includes the OGV development proposal. The Lichfields Employment Study has already been discussed and was used to inform the draft AAP.
3.2.2. Table 3.1 sets out the land area and floor area by uses. The OPA OGV development proposal comprises 57,000 sqm of employment floorspace (including ancillary uses). The OGV development proposal is comprised of various types of employment accommodation. The focus is primarily on office and R&D-related activities, with supporting industrial and ancillary uses.
Table 3.1 Indicative Employment Land and Floorspace within The Local Plan Allocation
Land or Use Class Application Boundary Adjacent Land within Allocation Total
Land (ha) 26.9 7.8 34.7
Offices (B1a) (sqm) 13,200 * 5,137 18,337
R&D (B1b) (sqm) 15,492 ** 6,278 18,882
Light Industry (B1c) (sqm) 9,167 4,566 13,733
Industry (B2) (sqm) 9,625 4,794 14,419
Warehousing (B8) (sqm) 4,125 2,055 6,180
Ancillary Uses (sqm) 1,676 - 1,676
Hotel (sqm) 3,911 - 3,911
Oxfordshire Garden Village Property Market Assessment and Economic Outlook
June 2020 10
Land or Use Class Application Boundary Adjacent Land within Allocation Total
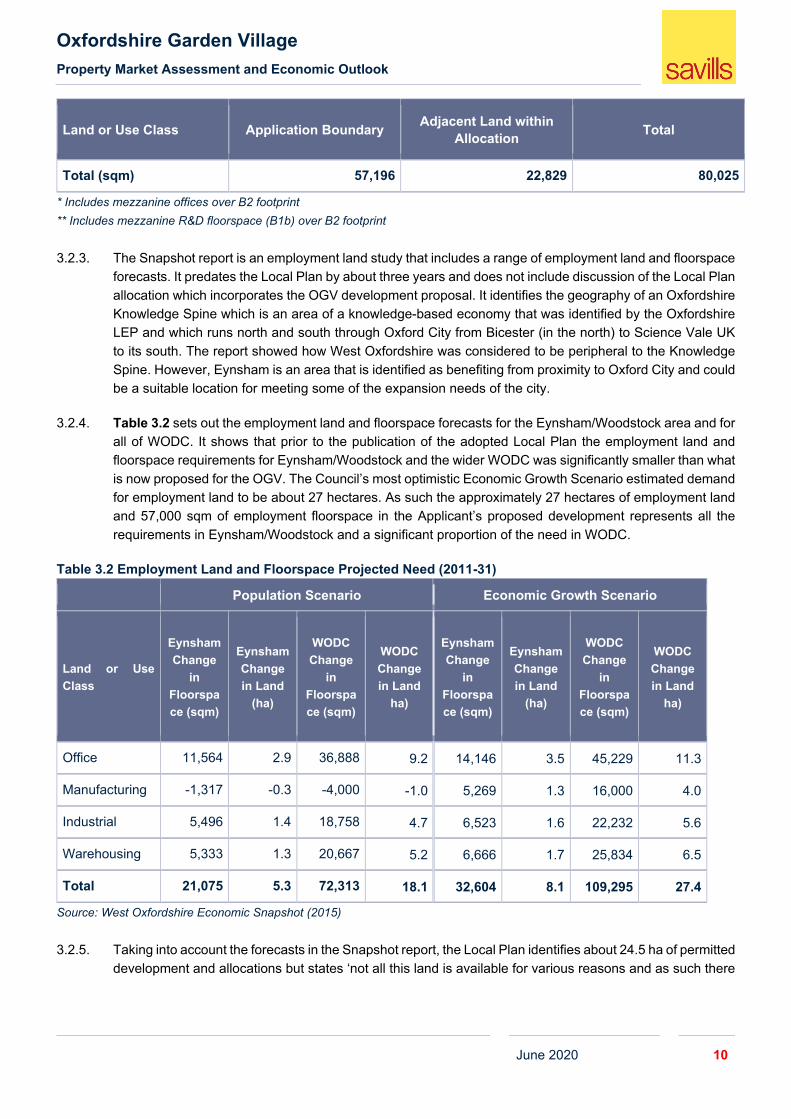
Total (sqm) 57,196 22,829 80,025
* Includes mezzanine offices over B2 footprint ** Includes mezzanine R&D floorspace (B1b) over B2 footprint
3.2.3. The Snapshot report is an employment land study that includes a range of employment land and floorspace
forecasts. It predates the Local Plan by about three years and does not include discussion of the Local Plan allocation which incorporates the OGV development proposal. It identifies the geography of an Oxfordshire Knowledge Spine which is an area of a knowledge-based economy that was identified by the Oxfordshire LEP and which runs north and south through Oxford City from Bicester (in the north) to Science Vale UK to its south. The report showed how West Oxfordshire was considered to be peripheral to the Knowledge Spine. However, Eynsham is an area that is identified as benefiting from proximity to Oxford City and could be a suitable location for meeting some of the expansion needs of the city.
3.2.4. Table 3.2 sets out the employment land and floorspace forecasts for the Eynsham/Woodstock area and for all of WODC. It shows that prior to the publication of the adopted Local Plan the employment land and floorspace requirements for Eynsham/Woodstock and the wider WODC was significantly smaller than what is now proposed for the OGV. The Council’s most optimistic Economic Growth Scenario estimated demand for employment land to be about 27 hectares. As such the approximately 27 hectares of employment land and 57,000 sqm of employment floorspace in the Applicant’s proposed development represents all the requirements in Eynsham/Woodstock and a significant proportion of the need in WODC.
Table 3.2 Employment Land and Floorspace Projected Need (2011-31)
Population Scenario Economic Growth Scenario
Land or Use Class
Eynsham Change
in Floorspace (sqm)
Eynsham Change in Land
(ha)
WODC Change
in Floorspace (sqm)
WODC Change in Land
ha)
Eynsham Change
in Floorspace (sqm)
Eynsham Change in Land
(ha)
WODC Change
in Floorspace (sqm)
WODC Change in Land
ha)
Office 11,564 2.9 36,888 9.2 14,146 3.5 45,229 11.3
Manufacturing -1,317 -0.3 -4,000 -1.0 5,269 1.3 16,000 4.0
Industrial 5,496 1.4 18,758 4.7 6,523 1.6 22,232 5.6
Warehousing 5,333 1.3 20,667 5.2 6,666 1.7 25,834 6.5
Total 21,075 5.3 72,313 18.1 32,604 8.1 109,295 27.4
Source: West Oxfordshire Economic Snapshot (2015)
3.2.5. Taking into account the forecasts in the Snapshot report, the Local Plan identifies about 24.5 ha of permitted
development and allocations but states ‘not all this land is available for various reasons and as such there

Oxfordshire Garden Village Property Market Assessment and Economic Outlook
June 2020 11
is a need to consider additional provision to provide sufficient flexibility’.2 Therefore the Local Plan allocates a total of about 74 hectares of employment (including the approximately 40 hectares allocated for the science park). This is about 270% of the amount of land needed in the optimistic Economic Growth Scenario forecast for WODC.
3.2.6. Figure 3.1 presents a comparison of employment land need from two scenarios in WODC’s Snapshot report and the employment land allocations from the Local Plan. It shows that the OGV development proposal is in line with the employment land need in the economic growth scenario in the Snapshot report. It also shows that all the Local Plan employment land allocations exceed the Council’s own evidence base.
Figure 3.1 Employment Land Proposal, Employment Land Need and Employment Land Local Plan Allocations
Source: West Oxfordshire Snapshot Report (2015); West Oxfordshire Local Plan 2031 (2018)
3.3. Phasing Analysis
3.3.1. This section compares the approximate phasing of employment land and floorspace in the development proposal with the estimate of demand from the Council’s evidence base. It is a pace of build out that would take place over 22 years starting in 2023. It assumes that the development captures about 2,600 sqm per annum which is slightly less than half the total forecast demand in the District but significantly more than the level of demand forecast for the Eynsham area. It is this rate of demand that results in a 22-year timeframe for the proposed employment floorspace to be successfully built out. Table 3.3 presents a comparison on a per annum basis of the demand forecast that supports the Local Plan evidence base and the proposed development. This is also shown graphically in Figure 3.2.
2 West Oxfordshire Local Plan 2031, page 71.
0
10
20
30
40
50
60
70
80
OGV DevelopmentProposal & Adjacent Land
Population Scenario(Snapshot Report)
Economic Growth Scenario(Snapshot Report)
Local Plan Allocation
Empl
oym
ent L
and
(ha)
OGV Development Proposal Adjacent LandPopulation Scenario (Eynsham Demand) Population Scenario (WODC less Eynsham)Economic Growth Scenario (Eynsham Demand) Economic Growth Scenario (WODC less Eynsham)Local Plan Employment Land Allocation For Science Park Local Plan Employment Land (the rest of WODC)

Oxfordshire Garden Village Property Market Assessment and Economic Outlook
June 2020 12
Table 3.3 Development Proposal Phasing Compared to Demand
Per Annum
Total
Local Plan Employment Land Demand (2011-2031) for WODC (ha) 1.37 27.4
Development Proposal Employment Land Delivery (ha) (2023-2045) 1.22 26.9
Local Plan Employment Floorspace Demand (2011-2031) for WODC (sqm) 5,465 109,294
Development Proposal Employment Floorspace Delivery (ha) (2023-2045) 2,590 57,000
Source: West Oxfordshire Economic Snapshot (2015) Figure 3.2 Per Annum Floorspace Delivery of OGV Development Proposal and Local Plan Need
Source: West Oxfordshire Snapshot Report (2015)
3.4. Scale of Development
3.4.1. The development proposal will achieve a sufficient critical mass of premises to ensure the science park is a success. There are no rules of thumb or national guidance which sets out the amount of land or floorspace that is required for a science park to succeed. In the next section we review several case studies which highlight prominent business parks and considers the critical mass.
3.4.2. The development includes 26.9ha of employment land which in itself is sufficient to ensure that a critical mass of premises and activity is achieved. The additional adjacent land within the Local Plan allocation provides additional expansion land. The site coverage ratio of the development is about 21% including both employment floorspace and ancillary uses.
3.4.3. The development proposal includes a quantum of employment floorspace capable of delivering within the Parameter Plans 57,000 sqm including ancillary uses. The approximately 15,500 sqm of proposed office floorspace would increase office inventory in WODC by about 13%. The approximately 20,600 sqm of

Oxfordshire Garden Village Property Market Assessment and Economic Outlook
June 2020 13
industrial floorspace would increase the inventory of industrial premises by about 5%.
3.5. Case Studies
3.5.1. We consider several other prominent science and business parks to compare with the OGV development proposal. These are locations with national profiles that provide further perspective on the size, build-out rates, performance and other relevant metrics of successful parks. One of the parks is from Oxford and the others are from Cambridge, Reading and West London.

Oxfordshire Garden Village Property Market Assessment and Economic Outlook
June 2020 14
Table 3.4 Oxford Science Park, Oxford
Owner Magdalen College Oxford
Main Employment Uses Offices (B1a); R&D (B1b)
Ancillary Uses Bar, Restaurant, Café, Nursery
Employment Land Area 9 ha (plus proposed expansion of 5.5 ha)
Employment Floorspace 52,000 sqm across 16 buildings. Further expansion planned for an additional 21,000 sqft.
Site Coverage 11% (13% with proposed expansion)
Completion of First Building 1991
Build Out The park has completed a building about once every two years. It has delivered about 2,000 sqm per annum but in its first decade delivered about 4,600 sqft per annum.
Critical Mass Critical mass is likely to have been reached in 2003 when most of the existing park would have been developed. At this point the park delivered about 425,000 sqft.
Performance Vacancy was high from 2008 to 2013 but occupancy improved once there was a loosening of sector restrictions. The park is currently fully let.
Figure 3.3 Build-Out and Vacancy Rate of Oxford Science Park
Source: CoStar (2020)
0%
2%
4%
6%
8%
10%
12%
14%
16%
18%
0
20,000
40,000
60,000
80,000
100,000
120,000
140,000
160,000
19921993199419951996199719981999200020012002200320042005200620072008200920102011201220132014201520162017201820192020
Vaca
ncy
Sqft
Square Feet (NIA) (left axis) Vacancy Rate (right axis)
Oxfordshire Garden Village Property Market Assessment and Economic Outlook
June 2020 15
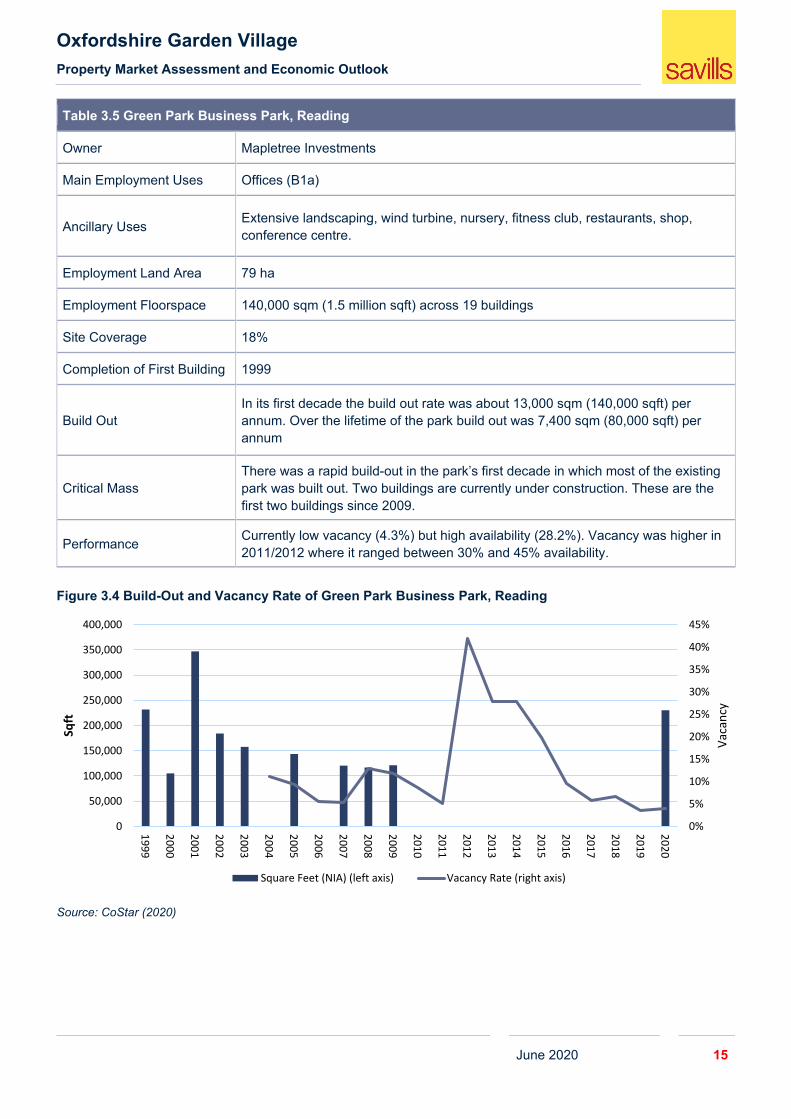
Table 3.5 Green Park Business Park, Reading
Owner Mapletree Investments
Main Employment Uses Offices (B1a)
Ancillary Uses Extensive landscaping, wind turbine, nursery, fitness club, restaurants, shop, conference centre.
Employment Land Area 79 ha
Employment Floorspace 140,000 sqm (1.5 million sqft) across 19 buildings
Site Coverage 18%
Completion of First Building 1999
Build Out In its first decade the build out rate was about 13,000 sqm (140,000 sqft) per annum. Over the lifetime of the park build out was 7,400 sqm (80,000 sqft) per annum
Critical Mass There was a rapid build-out in the park’s first decade in which most of the existing park was built out. Two buildings are currently under construction. These are the first two buildings since 2009.
Performance Currently low vacancy (4.3%) but high availability (28.2%). Vacancy was higher in 2011/2012 where it ranged between 30% and 45% availability.
Figure 3.4 Build-Out and Vacancy Rate of Green Park Business Park, Reading
Source: CoStar (2020)
0%
5%
10%
15%
20%
25%
30%
35%
40%
45%
0
50,000
100,000
150,000
200,000
250,000
300,000
350,000
400,000
1999
2000
2001
2002
2003
2004
2005
2006
2007
2008
2009
2010
2011
2012
2013
2014
2015
2016
2017
2018
2019
2020
Vaca
ncy
Sqft
Square Feet (NIA) (left axis) Vacancy Rate (right axis)

Oxfordshire Garden Village Property Market Assessment and Economic Outlook
June 2020 16
Table 3.6 Chiswick Park, West London
Owner China Investment Corporation bought the park in 2014 from The Blackstone Group.
Main Employment Uses Offices (B1a) for large corporates.
Ancillary Uses 4,200 sqm of retail including a gym, restaurants, shops and various pop-up traders
Employment Land Area 12.7 ha
Employment Floorspace 170,000 sqm across 12 buildings
Site Coverage -
Completion of First Building 2000
Build Out In its first decade the build out rate was about 10,000 sqm per annum. Over the lifetime of the park build to 2015 the rate was about the same. The park is now fully built out.
Critical Mass
The park has a relatively rapid build out with about 1 million sqft completed between 2000 and 2006. This established the park. After 2006 there was steady construction although not at the same pace as the initial. This was due in part to the global financial crisis which began in 2008.
Performance The park has seen relatively steady rental growth and low vacancies except for the period between 2015 and 2018 when vacancy was high due to a new building which took time to lease up.
Figure 3.5 Build-Out and Vacancy Rate of Chiswick Park, West London
Source: CoStar (2020)
0%
5%
10%
15%
20%
25%
0
50,000
100,000
150,000
200,000
250,000
300,000
350,000
400,000
2000
2001
2002
2003
2004
2005
2006
2007
2008
2009
2010
2011
2012
2013
2014
2015
2016
2017
2018
2019
2020
Vaca
ncy
Sqft
Square Feet (NIA) (left axis) Vacancy Rate (right axis)

Oxfordshire Garden Village Property Market Assessment and Economic Outlook
June 2020 17
Table 3.7 Granta Park, Cambridge
Owner Partnership between The Welding Institute and the BioMed Realty Trust
Main Employment Uses Offices (B1a) and R&D (B1b) for biotech and pharmaceutical companies.
Ancillary Uses Restaurants, cafes, Fitness and wellbeing centre, conference centre, nursery
Employment Land Area 57.9 ha
Employment Floorspace 150,000 sqm
Site Coverage 26%
Completion of First Building 2000
Build Out
In its first decade to 2011 delivery was about 7,400 sqm (80,000 sqft) per annum. There was a pause until 2016 when development re-commenced. Average historic rate of delivery over life of the park is 5,600 sqm (60,0000 sqft) per annum.
Critical Mass In the first wave of development to 2011 there was about 87,000 sqm delivered. This was the critical mass required to establish the location.
Performance Performance has been strong with steady rental growth since 2013 and relatively low vacancy except for the period during the global financial crisis.
Figure 3.6 Build-Out and Vacancy Rate of Granta Park, Cambridge
Source: CoStar (2020)
0%
5%
10%
15%
20%
25%
0
50,000
100,000
150,000
200,000
250,0002000
2001
2002
2003
2004
2005
2006
2007
2008
2009
2010
2011
2012
2013
2014
2015
2016
2017
2018
2019
2020
Vaca
ncy
Sqft
Square Feet (NIA) (left axis) Vacancy Rate (right axis)

Oxfordshire Garden Village Property Market Assessment and Economic Outlook
June 2020 18
3.5.2. The following graphs compare the OGV development proposal (and adjacent land) with the other business parks analysed above. It shows that the OGV development proposal (and adjacent land) is broadly comparable with the established parks although at a moderate scale. Its moderate scale and assumed build-out rate of the OGV development proposal ensures that it will not jeopardise the delivery of the range of other parks in Oxfordshire that are being built out or that are in the proposal stage. This includes a number of the parks, some of which are presented in the Lichfields Employment Study. They include the Oxford Science Park, the Culham Science Centre, the Harwell Campus, the Howbery Business Park, the Grove Business Park and Bicester Gateway. Each of these parks has plans to expand.
3.5.3. Figure 3.7 compares the development proposal with the other case studies. It shows that in terms of scale the proposal is comparable to other large business parks with a national profile.
Figure 3.7 Comparison of Business Parks by Size (ha)
Source: Savills (2020) 3.5.4. Figure 3.8 compares the proposal with the other case studies with regard to total floorspace. It shows that
in terms of floorspace the OGV development proposal and adjacent land would be smaller than some of the major parks but larger than the Oxford Science Park.
0
10
20
30
40
50
60
70
80
90
OGV DevelopmentProposal & Adjacent
Land
Oxford Science Park Chiswick Park Granta Park Green Park BusinessPark
Hect
ares
OGV (Applicant's Land) Land Adjacent to OGVOGV

Oxfordshire Garden Village Property Market Assessment and Economic Outlook
June 2020 19
Figure 3.8 Comparison of Business Parks by Floorspace (Sqm)
Source: Savills (2020)
0
20,000
40,000
60,000
80,000
100,000
120,000
140,000
160,000
180,000
OGV DevelopmentProposal & Adjacent
Land
Oxford Science Park Green Park BusinessPark
Granta Park Chiswick Park
Sqm
OGV (Applicant's Land) Land Adjacent to OGVOGV
Oxfordshire Garden Village Property Market Assessment and Economic Outlook
June 2020 20
4. Link Between Homes and Jobs 4.1. Introduction
4.1.1. This section assesses the balance between homes and jobs in the development proposal and in the wider region. The aim of this assessment is to consider if the amount of housing development and employment development is proportional and if it will create a sustainable Garden Village community.
4.1.2. The analysis finds that the ratio of new residents to jobs is about 1.5 (excluding jobs generated on the adjacent land). The assessment finds that OGV would help to address an anticipated decline in the size of WODC’s labour force and broaden WODC’s economic base whilst providing capacity for further flexible growth in the future.
4.2. Onsite Balance
4.2.1. The OGV development proposal includes a proposed 2,200 homes alongside the employment land and floorspace within the Parameter Plan. The average household size in West Oxfordshire is about 2.42 persons based on the ratio of population to households from the 2011 Census. Applied to OGV this would generate a population of about 5,324 residents.
4.2.2. About 60% of the West Oxfordshire population is of working age (between the ages of 16 and 64), and so the working age population that would live at OGV is estimated to be about 3,200 people. By applying the current economic activity rate for West Oxfordshire residents of work age, we estimate that the development proposal would generate about 2,800 economically active residents and about 2,770 employed residents.
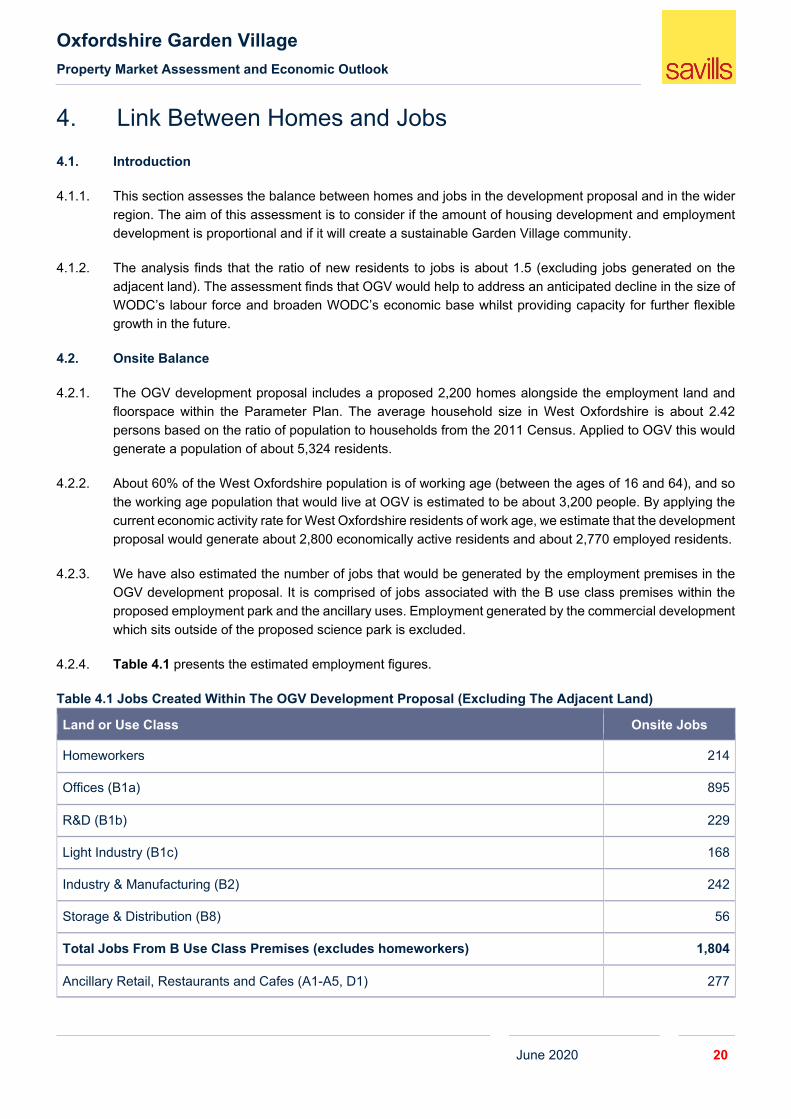
4.2.3. We have also estimated the number of jobs that would be generated by the employment premises in the OGV development proposal. It is comprised of jobs associated with the B use class premises within the proposed employment park and the ancillary uses. Employment generated by the commercial development which sits outside of the proposed science park is excluded.
4.2.4. Table 4.1 presents the estimated employment figures.
Table 4.1 Jobs Created Within The OGV Development Proposal (Excluding The Adjacent Land)
Land or Use Class Onsite Jobs
Homeworkers 214
Offices (B1a) 895
R&D (B1b) 229
Light Industry (B1c) 168
Industry & Manufacturing (B2) 242
Storage & Distribution (B8) 56
Total Jobs From B Use Class Premises (excludes homeworkers) 1,804
Ancillary Retail, Restaurants and Cafes (A1-A5, D1) 277

Oxfordshire Garden Village Property Market Assessment and Economic Outlook
June 2020 21
Land or Use Class Onsite Jobs
Hotel (C1) 33
Total Jobs From Ancillary Uses 310
Total Jobs 2,114
Source: Savills (2020)
4.2.5. Based on this analysis we estimate that the ratio of economically active residents to new jobs in OGV is
about 1.5 people per job (excluding jobs generated on the adjacent land). This means that more residents will be generated than jobs within the employment area. Some of the new residents may also find work within other premises within OGV which sit outside of the employment area that includes schools, neighbourhood and village centre uses and community premises.
4.3. Balance of Homes and Jobs in the Wider Area
4.3.1. WODC is currently a net exporter of jobs. According to the 2011 Census, about 20,000 residents commute to jobs located outside of the District and only 12,000 workers in WODC commute in from outside the area. Most of the imbalance can be ascribed to the high number of WODC residents who work in Oxford City. The new local jobs at OGV could help to address the imbalance by enabling local residents to work locally and those workers commuting from outside of WODC to buy homes locally.
4.3.2. Figure 4.1 presents the historic and forecast ratio of working age residents to jobs in WODC. It shows that since 2000 the ratio has steadily declined from a high of 1.33 people per job in 2002 to about 1.10 people per job today. The expectation is that the ratio will continue to decline at a modest rate. This is due to a decline in the working age population (the numerator) whilst the number of jobs in the WODC (the denominator) is expected to remain stable at its current level. Over the same period it is expected that the rate of out-commuting remains relatively stable (albeit at a lower level than which is from the 2011 Census discussed earlier).
4.3.3. The new jobs and homes in OGV could help address out-commuting as WODC will increasingly need to benefit from more workers living and working in the local area as well as attracting more workers from outside the District. Ultimately OGV will help to create a more balanced economic relationship between WODC and Oxford City in which WODC is able to retain more economic growth.
4.3.4. The introduction of OGV has the capacity to alter the forecast in Figure 4.1 by reducing the net outflow of workers and widening both the number of residents of working age and the number of local jobs.

Oxfordshire Garden Village Property Market Assessment and Economic Outlook
June 2020 22
Figure 4.1 Historic and Forecasted Labour Force, Jobs and Commuting Pattern in WODC
Source: Oxford Economics (2020)
4.4. Conclusions
4.4.1. The scale of homes and jobs in the development proposal is appropriate. The ratio of 1.5 resident workers per job takes into consideration that many incoming residents will still want to access employment opportunities within Oxford City, but rather than live in the city, these residents will bring the economic benefits out to WODC. It is also likely that only some of the job opportunities created at OGV will be taken up by the incoming population, with between 1,500 and 1,700 jobs being filled either by people living in other parts of WODC or from other areas.
4.4.2. It is beyond the scope of this assessment to model the overall impact of this on commuting patterns due to their complex nature. However, at a high level this balance appears to be broadly in line with existing conditions and aligned with those observed at other similar schemes in the region.
4.4.3. OGV brings significant demographic benefits to Eynsham and the wider district that are highlighted in this section. It would:
Increase the number of working age residents in WODC to address an anticipated decline in local workers; and
Provide an attractive place to live for those accessing jobs in the locality; and Broaden the economic base in WODC while providing the opportunity for flexible growth in the future.
-12
-11
-10
-9
-8
-7
-6
-5
-4
-3
-2
0.0
0.2
0.4
0.6
0.8
1.0
1.2
1.4
1.6
1.8
2.0
Net
Com
mut
ing
Flow
s (00
0s)
Ratio
of W
orki
ng A
ge R
esid
ents
to L
ocal
Jobs
Ratio of Work Age Residents to Local Jobs (left axis) Net Commuting (right axis)
forecast

Oxfordshire Garden Village Property Market Assessment and Economic Outlook
June 2020 23
5. Economic Outlook 5.1. Introduction
5.1.1. This section assesses the economic outlook for WODC and the impact that the economic growth and jobs could have on the local economy.
5.1.2. Forecasts from Oxford Economics for WODC anticipate low overall job creation and continued out-commuting from WODC to Oxford City. WODC has a concentration of primary industry activities and retail which are expected to contract. There are also fewer professionals working in WODC and overall gross wages are significantly below the average level in Oxfordshire. It suggests that the scale and type of proposed employment premise at OGV is likely to exceed the requirement of the existing business base.
5.2. Employment
5.2.1. Historic employment growth in WODC has been variable with periods of strong job growth mixed with contractions. The average rate of employment growth between 1992 and 2019 has been about 1.4% per annum. Over the past decade (since the financial crisis of 2008/9) growth has been closer to 1.9% per annum. Figure 5.1 shows historic and forecasted employment growth. The forecast is based on figures from Oxford Economics which assume a relatively high rate of continuing out-commuting. The figures don’t recognise the contribution that less urbanised locations will play in housing delivery and providing for flexible and footloose working.
Figure 5.1 Historic and Forecasted Employment Growth in WODC
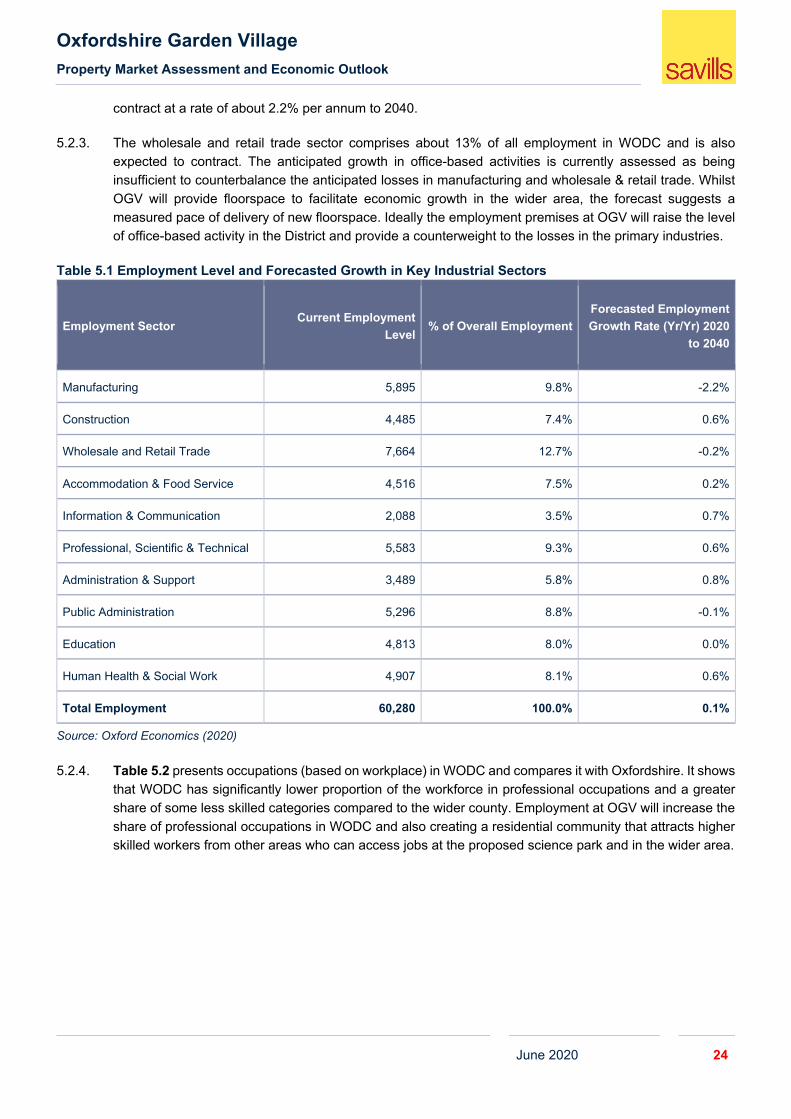
Source: Oxford Economics (2020) 5.2.2. The modest level of forecasted employment growth in WODC Industry is due primarily to a contraction in
the primary industrial sectors. The decline is particularly acute in manufacturing which represents about 10% of employment in WODC. Table 5.1 below shows that manufacturing employment is expected to
-5.0%
-4.0%
-3.0%
-2.0%
-1.0%
0.0%
1.0%
2.0%
3.0%
4.0%
5.0%
6.0%
Yera
-on
-yea
r Em
ploy
met
n Gr
owth
(%)
Employment Growth (yr/yr) Employment Growth Forecast (yr/yr) Historic Average Growth Rate (yr/yr)
Oxfordshire Garden Village Property Market Assessment and Economic Outlook
June 2020 24
contract at a rate of about 2.2% per annum to 2040.
5.2.3. The wholesale and retail trade sector comprises about 13% of all employment in WODC and is also expected to contract. The anticipated growth in office-based activities is currently assessed as being insufficient to counterbalance the anticipated losses in manufacturing and wholesale & retail trade. Whilst OGV will provide floorspace to facilitate economic growth in the wider area, the forecast suggests a measured pace of delivery of new floorspace. Ideally the employment premises at OGV will raise the level of office-based activity in the District and provide a counterweight to the losses in the primary industries.
Table 5.1 Employment Level and Forecasted Growth in Key Industrial Sectors
Employment Sector Current Employment
Level % of Overall Employment
Forecasted Employment Growth Rate (Yr/Yr) 2020
to 2040
Manufacturing 5,895 9.8% -2.2%
Construction 4,485 7.4% 0.6%
Wholesale and Retail Trade 7,664 12.7% -0.2%
Accommodation & Food Service 4,516 7.5% 0.2%
Information & Communication 2,088 3.5% 0.7%
Professional, Scientific & Technical 5,583 9.3% 0.6%
Administration & Support 3,489 5.8% 0.8%
Public Administration 5,296 8.8% -0.1%
Education 4,813 8.0% 0.0%
Human Health & Social Work 4,907 8.1% 0.6%
Total Employment 60,280 100.0% 0.1%
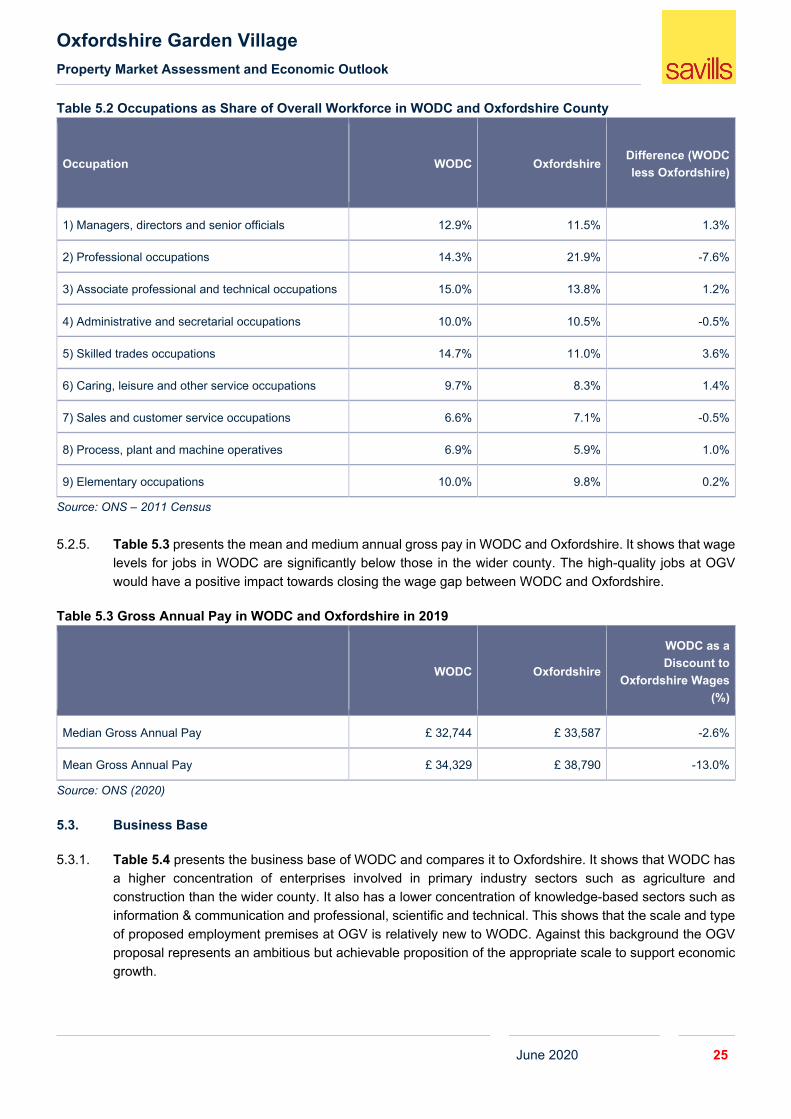
Source: Oxford Economics (2020) 5.2.4. Table 5.2 presents occupations (based on workplace) in WODC and compares it with Oxfordshire. It shows
that WODC has significantly lower proportion of the workforce in professional occupations and a greater share of some less skilled categories compared to the wider county. Employment at OGV will increase the share of professional occupations in WODC and also creating a residential community that attracts higher skilled workers from other areas who can access jobs at the proposed science park and in the wider area.
Oxfordshire Garden Village Property Market Assessment and Economic Outlook
June 2020 25
Table 5.2 Occupations as Share of Overall Workforce in WODC and Oxfordshire County
Occupation WODC Oxfordshire Difference (WODC less Oxfordshire)
1) Managers, directors and senior officials 12.9% 11.5% 1.3%
2) Professional occupations 14.3% 21.9% -7.6%
3) Associate professional and technical occupations 15.0% 13.8% 1.2%
4) Administrative and secretarial occupations 10.0% 10.5% -0.5%
5) Skilled trades occupations 14.7% 11.0% 3.6%
6) Caring, leisure and other service occupations 9.7% 8.3% 1.4%
7) Sales and customer service occupations 6.6% 7.1% -0.5%
8) Process, plant and machine operatives 6.9% 5.9% 1.0%
9) Elementary occupations 10.0% 9.8% 0.2%
Source: ONS – 2011 Census 5.2.5. Table 5.3 presents the mean and medium annual gross pay in WODC and Oxfordshire. It shows that wage
levels for jobs in WODC are significantly below those in the wider county. The high-quality jobs at OGV would have a positive impact towards closing the wage gap between WODC and Oxfordshire.
Table 5.3 Gross Annual Pay in WODC and Oxfordshire in 2019
WODC Oxfordshire
WODC as a Discount to
Oxfordshire Wages (%)
Median Gross Annual Pay £ 32,744 £ 33,587 -2.6%
Mean Gross Annual Pay £ 34,329 £ 38,790 -13.0%
Source: ONS (2020)
5.3. Business Base
5.3.1. Table 5.4 presents the business base of WODC and compares it to Oxfordshire. It shows that WODC has a higher concentration of enterprises involved in primary industry sectors such as agriculture and construction than the wider county. It also has a lower concentration of knowledge-based sectors such as information & communication and professional, scientific and technical. This shows that the scale and type of proposed employment premises at OGV is relatively new to WODC. Against this background the OGV proposal represents an ambitious but achievable proposition of the appropriate scale to support economic growth.

Oxfordshire Garden Village Property Market Assessment and Economic Outlook
June 2020 26
Table 5.4 Share of Total Number of Enterprises by Industry Sector in WODC and Oxfordshire
WODC Oxfordshire
1 : Agriculture, forestry & fishing (A) 7.1% 5.3%
2 : Mining, quarrying & utilities (B,D and E) 0.3% 0.4%
3 : Manufacturing (C) 4.5% 4.4%
4 : Construction (F) 14.1% 12.1%
5 : Motor trades (Part G) 3.1% 2.8%
6 : Wholesale (Part G) 3.7% 3.4%
7 : Retail (Part G) 6.2% 5.6%
8 : Transport & storage (inc postal) (H) 2.4% 2.8%
9 : Accommodation & food services (I) 5.0% 5.0%
10 : Information & communication (J) 8.6% 9.7%
11 : Financial & insurance (K) 1.6% 1.6%
12 : Property (L) 3.7% 3.6%
13 : Professional, scientific & technical (M) 18.8% 21.2%
14 : Business administration & support services (N) 7.6% 8.3%
15 : Public administration & defence (O) 0.8% 0.6%
16 : Education (P) 1.9% 2.3%
17 : Health (Q) 3.4% 3.8%
18 : Arts, entertainment, recreation & other services
7.1% 7.0%
Source: ONS (2020)
5.3.2. Finally, Table 5.5 presents the distribution of enterprises by size in WODC and the wider Oxfordshire area.
It shows that on the margin WODC has a higher concentration of small enterprises (employing 0 to 9 employees). The industry sectors where WODC has a higher concentration of small enterprises is in the primary activities (agriculture, forestry & fishing and construction) and retail activities.

Oxfordshire Garden Village Property Market Assessment and Economic Outlook
June 2020 27
Table 5.5 Distribution of Enterprises in WODC and Oxfordshire
Size Band of Enterprises by # of Employees
WODC (# of Enterprises)
WODC (% of Enterprises by
Size Band)
Oxfordshire (# of Enterprises)
Oxfordshire (% of Enterprises by Size Band)
Micro (0 to 9) 5,140 89.8% 28,075 88.6%
Small (10 to 49) 500 8.7% 2,920 9.2%
Medium-sized (50 to 249) 65 1.1% 530 1.7%
Large (250+) 20 0.3% 145 0.5%
Total 5,725 31,670
Source: ONS (2020)

Oxfordshire Garden Village Property Market Assessment and Economic Outlook
June 2020 28
6. Conclusions 6.1. Conclusions
6.1.1. This report has assessed the prospects for the OGV development proposal for employment land and premises. The proposed development represents an appropriate scale in the context of existing data and information reviewed in this report.
6.1.2. The Council’s evidence base document supporting the policy for a campus-style science park of around 40ha sets out a range of characteristics that could impact on its success. Whilst scale and size are relevant factors, so are links to academia, the presence of an anchor institution and a USP (unique selling proposition). The evidence base document uses a range of business parks as case studies to support the Allocation but it does not establish a convincing link between land area and success.
6.1.3. With regard to delivering both employment and homes, the proposal has a ratio of 1.5 residents of working age to anticipated jobs. The new homes would help to address an anticipated decline in WODC’s labour force and the new employment premises would broaden and diversify the District’s economic base.
6.1.4. Employment land and floorspace within the OGV development proposal has capacity to deliver a quantum of floorspace that is comparable to WODC’s full requirement based on the evidence base document which supports the Local Plan. It is also comparable in scale to some notable business parks although smaller in scale than well-established parks such as Granta Park in Cambridge and Green Park Business Park in Reading.
6.1.5. The scale of the OGV development proposal for employment land is a significant move in the delivery of employment land and premises that meet the longer term needs of the District and the wider area.
6.1.6. Whilst the OGV development proposal will need to compete with an array of other attractive and expanding science and business parks in Oxfordshire, it has the potential to be a significant employment generator. The OGV development proposal also allows for the organic growth of the employment area in the future to meet long term ambitions for beyond the current Local Plan period to 2031.