prospective life cycle assessment of bio-based adipic acid...
TRANSCRIPT

Prospective life cycle assessment of bio-based adipic acid production fromforest residues
Rio Aryapratamaa,b, Matty Janssena,∗
aEnvironmental Systems Analysis, Department of Energy and Environment, Chalmers University of Technology, SE-412 96 Göteborg,Sweden
bInstitute of System Sciences, Innovation and Sustainability Research, University of Graz, A-8010 Graz, Austria
Abstract
Environmental concerns related to the production of bulk chemicals are growing. Researchers and
technology developers are currently looking into alternative production pathways for such chemicals by
utilizing renewable resources, such as lignocellulosic feedstocks. Adipic acid is an example of such a bulk
chemical, and its conventional fossil-based production emits significant amounts of N2O, a major greenhouse
gas. In this study, a prospective life cycle assessment (LCA) of bio-based adipic acid production from
forest residues at an early development stage, situated in Sweden, was conducted. Acid-catalyzed (using
SO2) and alkaline (using NaBH4) pretreatment were employed and scenarios and sensitivity analyses were
conducted. The potential environmental impacts of this technology under development were compared to
those of conventional adipic acid production. The results show that bio-based adipic acid production has a
lower impact on global warming, eutrophication and photochemical ozone creation compared to fossil-based
production. In contrast, it has a higher impact on acidification. An increased efficiency of mitigating N2O
emissions from the fossil-based production may alter this comparison. Producing bio-based adipic acid using
the alkaline pretreatment has a higher environmental impact than producing it using acid-catalyzed pretreatment.
Furthermore, if biomass is used to fulfil process energy demands, instead of fossil fuel, the environmental
impact of the bio-based production decreases. It is therefore important to reduce the amount of NaBH4 used in
the alkaline pretreatment or to lower the environmental impact of its production.
Keywords:
life cycle assessment, prospective, adipic acid, forest residues, acid-catalyzed pretreatment, alkaline
pretreatment
∗Corresponding authorEmail address: [email protected] (Matty Janssen)
Preprint submitted to Journal of Cleaner Production June 7, 2017

1. Introduction
The increase of population, the growing concerns about climate change and issues related to non-renewable
resource depletion encourage society to find alternative ways to divest from the fossil-based economy. The
current fossil-based economy includes a wide range of chemical products, from large-scale bulk to high-value
added fine chemicals. Environmental concerns related to the production of these chemicals are growing
and potential solutions such as by increasing selectivity, reducing by-product formation, and developing
multi-functional catalysts in order to minimize the number of reaction steps, are explored (Hoelderich, 2000).
Another solution may be to substitute fossil-based, non-renewable resources and products with renewable ones,
which leads to completely different production processes (Sandén and Pettersson, 2014).
Adipic acid ((CH2)4(COOH)2) is considered as an important bulk chemical and is a pre-cursor for the
production of nylon-6,6. About 80 % of the world-wide adipic acid production is used for the production
of this polymer (Shimizu et al., 2000), and its production increased almost 9-fold from 2000 to 2010 (Li
et al., 2014). There are several industrial-scale production routes to produce adipic acid, and all of them are
fossil-based. The most common route is via nitric acid oxidation of cyclohexanol and cyclohexanone, so-called
ketone-alcohol (KA) oil (Shimizu et al., 2000). This production route also leads to the formation of nitrous
oxide (N2O), one of the major greenhouse gases (GHG). Its climate impact is 298 times higher than that of
carbon dioxide (CO2) (Myhre et al., 2013). N2O emissions account for about 9% of global annual greenhouse
gas (GHG) emissions, and currently, adipic acid production itself contributes almost 80% of total industrial
N2O emissions (Li et al., 2014).
Despite the availability and implementation of N2O emission abatement technologies, N2O emissions
remain as a major concern in climate change mitigation. The N2O emissions due to adipic acid production
have been a motivation for finding an alternative production process in order to avoid N2O emissions. For
instance, Wang et al. (2013) used a direct synthesis of adipic acid from cyclohexene using H2O2 as an oxidant
(instead of nitric acid) in a continuous process, and conducted a life cycle assessment (LCA) to determine its
environmental impact. Even though the results indicate lower impact on the climate, the authors emphasized
that this route has disadvantages in several other life cycle impact categories, which indicate a potential
environmental burden shifting. In a more recent study, Han (2016) performed experimental studies on adipic
acid production through catalytic conversion of corn stover whose purpose it also was to lower N2O emissions.
However, the study did not quantify the environmental benefits of this production route.
Another way to produce adipic acid is through biological conversion (Draths and Frost, 1994; van Duuren
et al., 2011). Draths and Frost (1994) developed the microbial conversion of D-glucose into cis,cis-muconic
2
acid followed by the reduction to adipic acid. van Duuren et al. (2011) performed process simulation and
limited LCA studies of adipic acid production via the biological conversion of aromatic feedstocks (benzoic
acid, impure aromatics, toluene, and phenol) from lignin to cis,cis-muconic acid. Both studies were conducted
at a very early stage in the development of the process. Producing adipic acid via bioprocess pathways looks
promising because, not only does it not emit N2O, it also increases the use of renewable resources (biomass),
instead of fossil-based raw materials (KA-oil). Forest residues, which mainly consists of branches and tops
from commercial thinning, can be considered as such a promising renewable resource. In Sweden, approx.
8 TW h of bioenergy is already generated from forest residues (Ortiz et al., 2014). Nevertheless, 80 % of these
residues are still left on the forest floor after harvesting, which suggests their availability as a feedstock (Ortiz
et al., 2014). A previous study mentioned that using forest residues as a feedstock for adipic acid production
can be considered as a promising alternative pathway (Svensson et al., 2015).
Considering that adipic acid bio-conversion technology is still at an early development stage, its environ-
mental performance needs to be evaluated with assessment tools such as LCA, using a prospective perspective,
in order to guide its further development. To the best of the authors’ knowledge, there is only one study that
conducted a limited LCA of bio-adipic acid production (van Duuren et al., 2011), which implies that a more
comprehensive prospective LCA study is needed. Therefore, the purpose of the LCA study reported in this
paper is to assess the potential environmental impacts and to identify the environmental hotspots of bio-based
adipic acid production from forest residues in Sweden at an early development stage, and to compare it with
the existing fossil-based production process. The LCA results are intended to guide the decision makers for
further development towards a more environmentally benign adipic acid production technology and process.
2. Materials and methods
2.1. System description
The technical system under study is depicted in Fig. 1.
2.1.1. Forestry activities
In the upstream activities, firstly the forest residues from Norway Spruce harvesting are collected by a
forwarder at the harvesting site and brought to the roadside. The forestry activities were assumed to take place
approx. 50 km from the adipic acid plant, situated in Örnsköldsvik, Sweden. It was assumed that the timber
extraction produced two different products: roundwood, which is the main part of the trees and the forest
residues. Economic allocation is used to attribute environmental impacts from forest residue extraction.
3

2.1.2. Pretreatment
The pretreatment fractionates the forest residues into cellulose, hemicellulose, free sugars, lignin, and other
materials. There are two types of pretreatment used in this study: the acid-catalyzed and alkaline pretreatments.
Sulfur dioxide (SO2) is used for the acid-catalyzed pretreatment process. The pretreatment was conducted by
adding steam at 212 ◦C and at 20 bar. The steam is generated by burning lignin and methane produced as a
byproduct from the fermentation and anaerobic digestion (Fig. 1), respectively.
The alkaline pretreatment is performed by using a 7 %(m/m) solution of sodium borohydride (NaBH4)
based on the mass of the forest residues. The process is then followed by mild steam explosion (STEX) at
110 ◦C. Next, the alkaline pretreatment by using sodium hydroxide (NaOH) is performed.
2.1.3. Neutralization and upstream separation process
For both acid and alkaline pretreatment processes, the neutralization step is needed in order to adjust the
pH to approx. 4.8, which is optimal for the hydrolysis and fermentation process. In case of acid-catalyzed
pretreatment, NaOH was added, while hydrochloric acid (HCl) was used to neutralize the pretreated material
after the alkaline pretreatment. All materials then go into the upstream separation process (see Fig. 1) where
the water with free sugars is discharged into the anaerobic digestion process which produces the biogas to fuel
the steam generation. The rest of the materials are sent into the fermentation reactor.
2.1.4. Hydrolysis and fermentation
The flow into the hydrolysis and fermentation process is the pretreated forest residues which contains
cellulose, hemicellulose, lignin, and other components (bark, ash, free sugars, etc.). The hydrolysis process
produces fermentable sugars, undigested holocellulose, and unfermentable free sugars. The other components,
including lignin, are only slightly affected by the hydrolysis process.
In the case of acid-catalyzed pretreatment, the Cellic Ctec2 enzyme product is used to hydrolyze cellulose
and hemicellulose. In the case of alkaline pretreatment, there is no enzyme used (Jedvert et al., 2012; Jedvert,
2014). The fermentation consists of the conversion of C6 sugars to adipic acid via lysine (Burgard et al., 2013),
and it was assumed that this two-step process can take place in one fermentation reactor to produce adipic acid.
The required nutrient for the fermentation process was assumed to be ammonium sulfate ((NH4)2SO4.
2.1.5. Downstream process
The downstream process unit operations and their energy demands were based on a simulation study
performed by Schweigler (2016). The evaporation of water and the concentration of adipic acid are the most
energy intensive parts of the downstream process. Lignin is produced by the downstream process as by-product.4

The filtration unit produces relatively pure adipic acid while the other flows (water with dissolved chemicals
and materials) are either recycled to increase the recovery of adipic acid, or are flowing to the anaerobic
digestion (see Fig. 1). The steam needed in the downstream process is produced by burning fossil fuel and
lignin. Meanwhile, the undigested part of hollocellulose and process water are sent to a wastewater treatment
plant, which is considered outside of the system boundary.
2.2. LCA description
2.2.1. Set-up of the LCA
It was assumed that the adipic acid produced by the fossil-based and bio-based pathways has the same
quality, and therefore can be compared using the same functional unit (FU). The FU in this study is set as 1 kg
of adipic acid at the factory gate. The main goals of this study are a) to identify the environmental hotspots
of bio-based adipic acid production from forest residues, and b) to compare the potential environmental
performance of bio-based adipic acid with that produced via the conventional fossil-based pathway (Shimizu
et al., 2000). This LCA study follows an attributional approach, from cradle to gate, since the purpose is to
identify environmental hotspots to identify possibilities for improvement to guide the bio-based adipic acid
technology development. The LCA model was built in openLCA 1.4 (Ciroth, 2007), an open source LCA
software, in which the inventory modeling and life cycle impact assessment (LCIA) were performed. The LCIA
was conducted using the CML (Institute of Environmental Sciences at Leiden University) characterization
method (Guinée et al., 2002). The following environmental impact categories were used in the assessment:
• Global Warming Potential (GWP)
The production of bio-based instead of fossil-based adipic acid may lower the greenhouse gas (GHG)
emissions, especially the N2O emissions. The GWP is a highly important impact category to show how
significant the GHG emissions reduction of bio-based adipic acid production will be in comparison to
that of the fossil-based process.
• Acidification Potential (AP)
This impact category is important to show the effect of bio-based adipic acid production on the acidity of
soil and water. This impact category is mainly contributed by the emission of SO2, NOx and NH3 from
the combustion of fossil fuel, biogas and lignin pellets.
• Eutrophication Potential (EP)
The phosphorous and nitrogen emissions from enzyme production, as well as emissions of nutrients
from the fermentation process may lead to the increase of water and soil eutrophication.
• Photochemical Ozone Creation Potential (POCP).
5

The combustion of fossil fuel, biogas, and combustion of lignin pellets will also emit NOx and volatile
organic compounds, which could enhance the creation of photochemical ozone.
Furthermore, analyses on the consumption of both non-renewable (NREU) and renewable energy (REU) were
performed by using the cumulative energy demand (CED) method (Frischknecht et al., 2007). The impacts due
to direct and indirect land use change are omitted in this study, mainly because Swedish forest is well managed
and there is no significant land use change taking place any more.
2.2.2. Data collection, modeling and assumptions
The life cycle inventory (LCI) data were collected from various sources, including experimental studies
performed at Chalmers University of Technology, Sweden, scientific literature and reports, LCI databases (e.g.
ecoinvent version 3.1 and US LCI), and process simulation studies.
The data for the emissions from and primary energy use during forestry harvesting were obtained from
Liptow et al. (2013). Economic allocation was used to attribute the environmental impact of the forestry
activities to the forest residues.
In the acid-catalyzed pretreatment process, sulfur dioxide (SO2), 2.5 %(m/m) based on dry forest residues
weight, was added. The SO2 production was modeled in openLCA by using the ecoinvent process ‘sulfur
dioxide, liquid – RER’ (Althaus et al., 2007). The alkaline pretreatment of lignocellulosic materials is mostly
still in the early development stages or at laboratory experimental scale. To the best of the authors’ knowledge,
there is no LCA study yet on alkaline pretreatment of forest residues. In this study, the alkaline pretreatment
data were acquired from experimental work performed by Jedvert et al. (2012) and Jedvert (2014). It was
assumed that the experimental data can be applied at the industrial scale. The model for the NaBH4 synthesis
route was built in openLCA and was based on the reaction of trimethyl borate and sodium hydride (NaH) in
the Brown-Schlessinger process (Wu et al., 2004). In the lab experiments, the mixture of NaBH4 and forest
residues was left for up to 4 d to 5 d to achieve complete reactions. The production of NaOH was modeled by
using the ecoinvent process ‘sodium hydroxide, without water, in 50 % solution state – RER’ (Althaus et al.,
2007), and the amount of NaOH added is 54.7 g kg−1 of dry matter. The production of HCl, which is used in
the neutralization step, was modeled by using the ecoinvent process ‘hydrochloric acid, without water, in 30 %
solution state – RER’. The required amount of NaOH and HCl were estimated based on the study by Janssen
et al. (2016). In the next stage, the upstream separation process, it was assumed that both outputs have an
economic value of 70e t−1 (allocation point B, see Fig. 1).
The data for enzyme usage for the fermentation were gathered from Karlsson et al. (2014) and were specific
for forest residues in northern Sweden. It was assumed that these experimental data on enzyme dosage can
6

also be applied at an industrial scale. The environmental impact data of enzyme production were taken from
Liptow et al. (2013). It was assumed that the enzyme was produced in Kalundborg, Denmark, and delivered to
the adipic acid plant via freight transport. The Danish fossil fuel mix (50 % oil, 29 % coal and 21 % natural
gas) was used to model the fossil energy use of the enzyme production (Danish Energy Agency, 2011). In the
fermentation process, the amount of (NH4)2SO4 used as a nutrient was taken from van Duuren et al. (2011).
Even though the pathway was different compared to this study, it was assumed that the required amount of
(NH4)2SO4 will not be significantly different. The production of (NH4)2SO4 was modeled in openLCA by
using the ecoinvent process ‘ammonium sulfate, as N – RER’. The energy consumption due to mixing during
the fermentation process was obtained from Palmqvist and Liden (2012).
The fossil-based energy used in the process was assumed to be the Swedish fossil fuel mix from 2011
(11 % coal, 82 % oil and 7 % natural gas), and was used for steam production (Energimyndigheten, 2014). Data
related to the anaerobic digestion process (see Fig. 1) was taken from Janssen et al. (2016). The incineration of
lignin for process energy needs was modeled using ‘Combustion, dry wood residue – AP 42’ process from the
from US LCI database (NREL, 2012). It is assumed that the incineration of biogas generated by the anaerobic
digestion, of the lignin and of the additional fossil fuel have efficiencies of 90 %, 75 % and 90 %, respectively.
The partitioning of environmental burdens was done by means of economic allocation.
2.2.3. Description of scenarios
In the base case scenario (BC) (see Table 1), the lignin byproduct is burned to produce steam to fulfil part
of the energy demand of the pretreatment, which cannot be entirely met by the biogas produced in anaerobic
digestion only in the case of acid-catalyzed pretreatment. The other part of the steam produced by lignin
combustion is used to provide energy to the downstream processing. However, to completely fulfil the energy
demand in this scenario, extra steam needs to be produced. It is assumed that this is done by burning fossil fuel
(Swedish fossil fuel mix).
In Scenario 1 (Sc1) (see Table 1), the steam production is free from fossil fuel use and the shortage of
energy needed to produce all steam is supplied by burning wood chips. After being processed at the sawmill
plant, the wood chips are sent to the incineration at the adipic acid plant site to be burned to produce energy.
Economic allocation was used to partition environmental burden of wood chips at the sawmill plant. The
burning of wood chips was modeled by using the ’Combustion, dry wood residue AP-42’ process obtained
from the US LCI database (NREL, 2012).
In Scenario 2 (Sc2) (see Table 1), the lignin by-product is sold as lignin pellets, and is not used to produce
steam. This means that extra fuel would be needed to produce the steam. It is assumed, as in the base case
7

scenario, that this extra fuel is fossil-based. The environmental impact of adipic acid production is partitioned
over the adipic acid and lignin pellets using economic allocation, shown as ‘allocation point C’ in Fig. 1. The
adipic acid price (see Table 2) is assumed to be the median value of the price range stated in Boswell and
Meehan (2011).
The lignin by-product is also sold as lignin pellets in Scenario 3 (Sc3) (see Table 1). However, the additional
fuel for steam production is completely produced by burning wood chips as is the case in Scenario 1. As there
is no lignin and fossil fuel incineration for steam production, this scenario has the highest amount of external
biomass use.
These scenarios (see Table 1) were run for both the acid and the alkaline pretreatment cases. The fossil-
based adipic acid production was used as the reference scenario, and compared with the scenarios of bio-based
adipic acid production via both acid and alkaline pretreatment pathways. In openLCA, the fossil-based adipic
acid production was modeled by using ecoinvent process ‘adipic acid – RER’ (Althaus et al., 2007).
2.2.4. Sensitivity analyses
Sensitivity analyses were conducted for the price of adipic acid and for the biomass burning efficiency, for
both acid-catalyzed and alkaline pretreatments. For the adipic acid (AA) price sensitivity analysis, the lowest
and highest prices were set at 1100e t−1AA and 2500e t−1
AA, respectively, according to Boswell and Meehan
(2011) (see Table 2). For the biomass combustion efficiency, an increase from 75 % to 90 %was analyzed.
For the case of alkaline pretreatment, sensitivity analyses were conducted regarding the dosage of NaBH4
and the energy sources during NaBH4 production. Jedvert (2014) used 7 %(m/m) of NaBH4 (on a dry wood
basis) as the base case when conducting the pretreatment experiments. In these experiments, the NaBH4
concentration was varied from 0.5 %(m/m) to 7 %(m/m) (Jedvert, 2014) and, although the treatment times were
different, only small differences were found between the chemical compositions of the resulting pretreated
material following the pretreatment and mild steam explosion. Therefore, the concentration of NaBH4 was
varied in order to investigate to what extent potential environmental impacts could be reduced by using less
NaBH4. Furthermore, as NaBH4 production required significant amounts of energy, it is also important to
assess how changing the energy source for the NaBH4 production process would affect the environmental
impacts. In the sensitivity analysis, the environmental impact change of shifting the energy source from the
conventional source (modeled by the ecoinvent process ’heat, in chemical industry – RER’) to completely from
biomass is assessed.
The ecoinvent process model for the fossil-based production of adipic acid assumes that 80 % of the formed
N2O is removed by abatement technologies (Althaus et al., 2007). However, the catalyzers that are used for this
8

removal have been further improved and can reach a removal efficiency of 98 % (Alini et al., 2007). Therefore,
a sensitivity analysis is done to assess how such a change in N2O removal efficiency may affect the comparison
between the different scenarios for bio-based (see Table 1) and the fossil-based adipic acid production.
3. Results and discussion
3.1. Environmental impacts
The results for the considered impact categories are described in this section. Fig. 2 displays the results for
all four scenarios using acid-catalyzed pretreatment, while Fig. 3 displays the results for the scenarios using
alkaline pretreatment. In each of the bar charts, the values of the impact for the fossil-based production of
adipic acid is mentioned.
3.1.1. Global warming
For the base case (BC) scenario, the global warming potential (GWP) results show that adipic acid (AA)
production via the bio-based pathway has significant environmental benefits in comparison with the fossil-
based pathway. The benefit is more pronounced for the acid-catalyzed pretreatment case, where the GWP is
4.0 kgCO2-eq kg−1AA, or approx. 6.4 times lower than the GWP of the fossil-based production (25.6 kgCO2-eq kg−1
AA).
The GWP result for the alkaline pretreatment case is 7.8 kgCO2-eq kg−1AA, or approx. 3.3 times lower than the
GWP of the fossil-based production (Althaus et al., 2007).
In the acid-catalyzed pretreatment case, the main contributors to GWP are the downstream processing,
forest residue pretreatment, and enzyme production (see Fig. 2a). The downstream processing is the most
energy-intensive process, as it employs multiple processes for separating adipic acid from the fermentation
broth, including crystallization and multi-evaporation. Furthermore, in the BC scenario, a significant amount
of fossil fuel is used to produce additional steam for downstream processing, and significantly contributes
to the overall GWP. Sc2 has the highest environmental impact because in this scenario lignin is sold as a
by-product and therefore more fossil fuel is used to generate process energy. The pretreatment process and
enzyme production are the second and third largest contributors to the GWP. The lower GWP for Sc1 is due to
the incineration of biomass in addition to lignin by-product incineration in order to generate the process energy
needed. Meanwhile, Sc3 has the lowest GWP because in this process only biomass is incinerated to generate
process energy, while selling all of the lignin as by-product. Even though Sc3 needs more wood chips, which
means more intensive external forestry harvesting activities, the GWP is still lower than that of Sc1, which
may be due to the partitioning of environmental impacts between adipic acid and lignin by-product.
9
For the alkaline pretreatment case, significant differences in comparison with the acid-catalyzed pretreat-
ment case regarding the main contributing processes to GWP can be observed (see Fig. 3a). NaBH4 production
and use is the main source of GWP for all scenarios, except for Sc2. The energy in the NaBH4 production is
required for the sodium hydride (NaH) synthesis, the subsequent reaction of NaH with trimethylborate and the
extraction of NaBH4 with isopropylamine. In Sc2, the GWP of downstream processing is slightly higher than
the GWP of NaBH4 production, since this scenario only uses fossil fuel to generate steam for process energy.
For the alkaline pretreatment case, it is important to highlight that the downstream processing in the Sc1 and
Sc3 scenarios only has a small contribution to the overall impacts since these scenarios do not use fossil fuel
for generating process steam.
3.1.2. Eutrophication
The bio-based adipic acid pathway has a much lower eutrophication potential (EP) compared to the EP
from the fossil-based pathway (see Figs. 2b and 3b). The impacts are more evident for the acid-catalyzed
pretreatment, where the EP in the BC scenario is 6.7 times lower than the EP of the fossil-based pathway. The
overall EP results for scenarios Sc2 and Sc3 are slightly lower than those of the base case and Sc1 scenarios
which is mainly due to allocation of the environmental impact to adipic acid and lignin. Furthermore, Sc1 has
a lower impact compared to the BC scenario because of increased biomass utilization for providing energy to
the downstream processing. However, increased biomass utilization causes increased emissions from external
forestry activities which affect the EP of Sc1 and makes it level off when compared to the EP of the base case.
This also occurs for the Sc2 and Sc3 scenarios. Overall, the trend in the EP among the four scenarios (see Figs.
2b and 3b) is different compared to those in the other impact categories. This co-variation is further discussed
in section 3.3.
3.1.3. Acidification
In the case of acidification potential (AP) for the acid-catalyzed pretreatment case, the overall potential
impact of the fossil-based production is lower than those of the BC and Sc2 scenarios (see Fig 2c). This
result is different compared to those in other impact categories where typically the bio-based pathway shows
significant reductions in environmental impact compared to fossil-based production. This emphasizes the
risk of environmental burden shifting (the reduction of specific impacts and an inadvertent increase of other
impacts) when developing novel technologies or processes (Laurent and Espinosa, 2015). The trend of the
impact over the different scenarios is nevertheless similar to the other impact categories, especially compared
to GWP and POCP.
10

In all scenarios, SO2 is the highest contributing emission for AP. The main contributing processes for
the BC and Sc2 scenarios in the acid-catalyzed pretreatment case are the downstream processes due to the
significant use of fossil fuel to generate process steam. This is mainly due to emissions of SO2 from crude
oil processing. In the alkaline pretreatment case (see Fig. 3c), the environmental burden shifting is even
more pronounced. The reason is the energy-intensive production of NaBH4 in all scenarios, and downstream
processing for the BC and Sc2 scenarios. For the Sc1 and Sc3 scenarios, the impacts are much lower than
those for the BC and Sc2 scenarios because biomass is used as additional energy provider for steam generation.
Nevertheless, due to the NaBH4 production the AP for both Sc1 and Sc3 scenarios is higher than the AP for the
fossil-based production. This result is an example of a critical issue for decision makers: how will they trade
off the reduction of GWP against the increase of AP when shifting the adipic acid production from a fossil- to
bio-based pathway? The result also gives an indication to decision makers regarding the impact reduction from
NaBH4 production, e.g. by establishing a more energy-efficient or cleaner NaBH4 production process or by
using less NaBH4 in the alkaline pretreatment process.
3.1.4. Photochemical ozone creation
All scenarios, both with the acid-catalyzed and alkaline pretreatments, have a lower photo-chemical ozone
creation potential (POCP) compared to the fossil-based pathway (see Figs. 2d and 3d). However, there are less
environmental benefits for the alkaline pretreatment cases, because the POCP of the BC and Sc2 scenarios are
similar to that of the fossil-based pathway. The POCP in both BC and Sc2 scenarios is mainly caused by the
use of fossil energy in the downstream and NaBH4 production processes.
3.2. Energy use
The non-renewable and renewable energy use (NREU and REU) results for the scenarios using the acid-
catalyzed pretreatment are shown in Fig. 4, while those for the scenarios using the alkaline pretreatment are
shown in Fig. 5.
In general, both acid-catalyzed and alkaline pretreatment cases have a lower NREU compared to the
fossil-based pathway. The acid-catalyzed pretreatment has a significantly lower NREU (by 62 %) than the
fossil-based pathway in the BC scenario. In the BC and Sc2 scenarios, the most energy-intensive process is
the downstream processing, followed by enzyme production and use. Both processes utilize large amounts
of fossil fuels to fulfil their energy demands. Since the Sc1 and Sc3 scenarios use external biomass burning
as an additional energy source, the NREU decreases sharply by more than 60 % when compared to those of
the BC and Sc2 scenarios. The enzyme production and use is the most energy-intensive process in both Sc1
11
and Sc3 scenarios. In the alkaline pretreatment, the NaBH4 production is the most energy-intensive process
for all scenarios. The NREU of the alkaline BC scenario itself is approx. 15 % lower than the NREU of the
fossil-based pathway (in comparison to 62 % for the acid-catalyzed pretreatment case. NaBH4 production
contributes 48 % to 77 % to the overall NREU in the four different scenarios. Shifting from fossil fuel to
biomass as additional energy source reduces the NREU by approx. 37 % in Sc3, compared to the BC scenario.
These results highlight the importance of producing NaBH4 in more efficient and cleaner ways.
The REU is dominated by the forestry harvesting activities. The amount of forest residue needed for the
bio-based adipic acid production is the same for all scenarios, and therefore the REU of forestry harvesting
is similar for all scenarios. The REU for the Sc2 and Sc3 scenarios is slightly lower due to the allocation of
the environmental burdens to adipic acid and lignin pellets. External forestry harvesting plays a major role
in the Sc1 and Sc3 scenarios due to the increased need of external energy by wood chips incineration. The
REU of external forestry harvesting differs approx. 8 % between the acid-catalyzed and alkaline pretreatment
scenarios (Figs. 4b and 5b). In comparison to fossil-based adipic acid production, the REU of the BC scenarios
for the acid-catalyzed and alkaline pretreatments are 6.6 and 6.9 times higher, respectively. Unlike NREU, the
REU for both pretreatment cases is similar. For example, the total REU for the acid-catalyzed and alkaline BC
scenarios are 31.8 MJ and 33.5 MJ, respectively. In the other scenarios, the average REU difference between
the acid-catalyzed and alkaline pretreatments is only around 4 %. This is due to the dominance of REU from
forestry harvesting, and due to the fact that NaBH4 production in the alkaline pretreatment only utilizes a
minimum amount of renewable energy sources. This trend is different compared to NREU. The alkaline
pretreatment energy demand is 2.2 times higher than the demand of the acid-catalyzed pretreatment in the
base case scenario. Unlike in the case of the environmental impact categories and NREU, where the NaBH4
production contributes significantly to the results (from 31 % to 68 % and from 48 % to 77 % of the impact
categories and NREU overall values, respectively), the REU of NaBH4 production contributes only 8.6 % to
the overall REU of the BC and Sc2 scenarios. In the scenarios with increased external biomass use (Sc1 and
Sc3 scenarios) the contribution of NaBH4 production to the REU is only 4.4 % and 3.4 %, respectively. These
values are much lower than the contribution of NaBH4 production in NREU.
3.3. Cross-correlation between impact categories and energy use
The GWP, AP, and POCP show a similar trend over the scenarios (see Figs. 2a, c and d, and 3a, c and
d). The NREU results (see Figs. 4a and 5a) strongly correlate with the results of these environmental impact
categories, especially with GWP. However, this is not the case for EP as it shows a different trend compared to
other impact categories (see Figs. 2b and 3b). For the case of EP, the REU due to biomass use starts to play a
12
dominant role and makes the EP results of the scenarios that use external biomass as additional energy source
(Sc1 and Sc3 scenarios, see Table 1) almost the same as those of their fossil fuel counterparts (BC and Sc2
scenarios). The phosphate emissions from the external forestry harvesting processes and biomass incineration
for process energy make the EP of the Sc1 and Sc3 scenarios level with those of the BC and Sc2 scenarios.
3.4. Sensitivity analyses
3.4.1. Adipic acid price variation
The adipic acid (AA) price in the base case scenario was set at 1800e t−1AA. A price increase from 1800e t−1
AA
to 2500e t−1AA will lead to an increase of environmental impact of adipic acid of 4.9 % and 4.1 % for the acid-
catalyzed and alkaline pretreatment BC scenario. The environmental impact changes will be more significant
if the price goes down from 1800e t−1AA to 1100e t−1
AA. The environmental impact reduction compared to the
base price for the acid-catalyzed and alkaline pretreatment scenarios will be 9.6 % and 8.1 %, respectively.
3.4.2. Biomass incineration efficiency
An efficiency improvement of biomass incineration from 75 % to 90 % exhibited the highest environmental
impact reduction for the BC scenario (see Table 3). In general, the GWP is mainly caused by non-renewable
energy use (NREU). For the GWP, the reductions are approx. 10 % and 4 % for the acid-catalyzed and alkaline
BC scenarios, respectively. These reductions are mainly due to a lower amount of fossil fuel to fulfil the energy
demand in the downstream processing of the BC scenario. The alkaline BC scenario has a lower reduction
compared to the acid-catalyzed BC scenario because NaBH4 production is the major contributor to the overall
GWP which makes the incineration efficiency improvement become less influential on the overall impact (see
Table 3). In the scenarios Sc1 and Sc3 using alkaline pretreatment, the GWP reductions are less than 1 %,
while the reductions are around 3 % for the scenarios Sc1 and Sc3 using acid-catalyzed pretreatment. The
lower GWP reduction for the Sc1 and Sc3 scenarios are because of the higher contributions due to biomass
incineration. On average, the GWP reduction in the acid-catalyzed pretreatment scenarios is approx. 3 times
higher than for the alkaline pretreatment scenarios.
For the impact categories other than GWP, the reduction in the impacts is also greater for the acid-catalyzed
scenarios. The average reductions magnitude for AP, EP and POCP in acid-catalyzed pretreatment case are
2.0, 4.9 and 2.1 times greater than the reductions in the alkaline pretreatment scenarios, respectively (see the
Supplementary material). This is due to the high impact of the production of NaBH4. Increasing the biomass
incineration efficiency from 75 % to 90 % seems optimistic. However, the results of this sensitivity analysis
give decision makers an illustration about the potential environmental benefits and energy use reduction due to
13

the increase of biomass combustion efficiency.
3.4.3. NaBH4 concentration variation
Reducing the NaBH4 concentration to 5 %(m/m), 3 %(m/m) and 0.5 %(m/m) results in a significant reduc-
tion of the potential environmental impacts in all scenarios (see Table 4). A significant reduction of NREU is
the main reason for this reduction. For the BC and Sc2 scenarios, the NREU reductions are between 16 % and
52 %, and 14 % and 44 %, respectively, while for the Sc1 and Sc3 scenarios, the values are almost similar, from
22 % to 71 %. Accordingly, the highest reductions in GWP are observed for the Sc1 and Sc3 scenarios. For
instance, reducing the NaBH4 concentration to 5 %(m/m) and 0.5 %(m/m) for Sc1 results in GWP reductions
of approx. 19 % and 60 %, respectively. For the BC and Sc2 scenarios, the GWP reductions are 13 % and 42 %,
and 11 % and 35 %, respectively. The lower reductions of GWP in the BC and Sc2 scenarios are because of the
higher proportion of fossil fuel use for process energy, which makes the environmental benefit due to NaBH4
concentration reduction less influential.
Further experimental research should be conducted in order to optimize pretreatment at lower NaBH4
concentrations. Although the chemical composition of pretreated forest residue will not change significantly at
the different concentrations of NaBH4 at the lab scale, other variables should also be taken into consideration,
e.g. the reaction time that is needed to pretreat the forest residues with a low concentration of NaBH4.
3.4.4. Cleaner NaBH4 production process
In all alkaline pretreatment scenarios, the production and use of NaBH4 contribute significantly to the total
environmental impacts. The NaBH4 production was modeled via the reaction of NaH and trimethylborate
pathway, where the required energy was modeled by using ecoinvent process ’heat, in chemical industry –
RER’. Changing this energy source to biomass only resulted in a significant reduction of the environmental
impact. This is due to the reduction of NREU by 25 % to 41 %. For GWP, the highest impact reduction was in
the Sc1 and Sc3 scenarios, for which a reduction of approx. 32 % in GWP was observed. The GWP reduction
for the BC and Sc2 scenarios were 22 % and 19 %, respectively (see Table 5). The impact reductions in the
Sc1 and Sc3 scenarios are higher because the relative contribution from NaBH4 production and use to the
overall impacts was higher than in the case of the BC and Sc2 scenarios. It should be noted that replacing the
conventional energy source with biomass only will increase biomass extraction, in this case round wood, in
order to provide the amount of energy needed for NaBH4 production. Furthermore, this sensitivity analysis
was only performed for the base case concentration of NaBH4, which is 7 %(m/m).
The best environmental performance of the alkaline scenarios would be obtained if the energy in the
14

NaBH4 production process is provided completely by biomass incineration and the pretreatment is performed
at 0.5 %(m/m) NaBH4 concentration.
3.4.5. Increased N2O removal efficiency
Increasing the removal efficiency of N2O from 80 % to 98 % results in a reduction of its emission from
6.02 × 10⁻² kgN2O kg−1AA to 6.02 × 10⁻³ kgN2O kg−1
AA in the ecoinvent process model for fossil-based adipic
acid production. Consequently, the GWP and EP of the fossil-based production decreased significantly
from 25.6 kgCO2-eq kg−1AA to 9.4 kgCO2-eq kg−1
AA (a reduction of 63 %), and from 2.90 × 10⁻² kgPO 3 –4 -eq kg−1
AA to
1.44 × 10⁻² kgPO 3 –4 -eq kg−1
AA (a reduction of 50 %), respectively. The AP and POCP were not affected by the
reduction of N2O emissions.
The fossil-based production of adipic acid continues to have a worse performance for both GWP and EP
when compared to the acid-catalyzed scenarios for its bio-based production (see Fig. 2). The difference in
GWP between the fossil-based and bio-based production is at least 48 % (scenario Sc2, see Fig. 2a), and at least
70 % for EP (scenarios BC and Sc1, see Fig. 2b). However, for the alkaline scenarios, the EP of the base case
and Sc1 scenarios are similar to the EP of the fossil-based production (see Fig. 3b). Nevertheless, the GWP of
the bio-based production scenarios remains lower although the difference between the GWP of the base case
and Sc2 scenarios is reduced to 1.6 kgCO2-eq kg−1AA and 1.3 kgCO2-eq kg−1
AA, respectively (see Fig. 3a). It should be
noted however that when the GaBi process data set for fossil-based adipic acid production (Thinkstep, 2017)
is used, the GWP further drops to between 6.3 kgCO2-eq kg−1AA and 7.2 kgCO2-eq kg−1
AA. Fossil-based production
then outperforms the alkaline base case and Sc2 scenarios. Despite a better environmental performance of the
fossil-based production of adipic acid due to reduced N2O emissions, it does not become competitive (from
an environmental point-of-view) with any of the acid-catalyzed bio-based production scenarios. However, in
the case of the alkaline bio-based production scenarios, the EP of the fossil-based production is similar to the
EP of these scenarios, and thus needs to be considered carefully (next to AP, see section 3.1.3) in order to
guarantee a better environmental performance of the bio-based production of adipic acid.
4. Conclusion
In this study, a prospective life cycle assessment (LCA) of adipic acid production from forest residues at
an early development stage was conducted. Two different pretreatment methods, acid-catalyzed and alkaline,
were employed and scenarios and sensitivity analyses were conducted. The potential environmental impacts
of this alternative bio-based pathway were compared to those of fossil-based adipic acid. For most of the
impact categories (GWP, EP and POCP), the bio-adipic acid production from forest residues shows significant15
environmental benefits compared to the fossil-based pathway. This benefit will be higher when more renewable
resources such as biomass are used to fulfil the process energy demands.
Overall, the sensitivity analyses emphasize the potential environmental benefit of using biomass as a source
for process energy, either in the bio-adipic acid or NaBH4 production. Efficiency improvement of biomass
incineration will also reduce the potential environmental impacts. Furthermore, as alkaline pretreatment has
higher potential environmental impacts than the acid pretreatment, it is important to reduce the amount of
NaBH4 used in the pretreatment. Further research will be needed in order to investigate the feasibility of using
a lower amount of NaBH4 at a larger scale.
Supplementary material
Supplementary data are available as an electronic annex.
Acknowledgements
This study was funded by The Swedish Research Council for Environment, Agricultural Sciences and
Spatial Planning (FORMAS; Stockholm, Sweden, BioBUF project, grant number 213-2013-78). The authors
would also like to acknowledge Achille-B. Laurent at Maastricht University’s Department of Biobased Material
for providing data about the fossil-based adipic acid production process.
References
Alini, S., Basile, F., Blasioli, S., Rinaldi, C., Vaccari, A., 2007. Development of new catalysts for N2O-
decomposition from adipic acid plant. Appl Catal B 70, 323–329.
Althaus, H.-J., Chudacoff, M., Hischier, R., Jungbluth, N., Osses, M., Primas, A., 2007. Life cycle inventories
of chemicals. Tech. Rep. ecoinvent report No. 8, EMPA Dübendorf.
Boswell, C., Meehan, J., 2011. European adipic acid prices stumble after long run-up. ICIS Chemical Business
280, 18–19.
Burgard, A. P., Pharkya, P., Osterhout, R. E., 2013. Microorganisms for the production of adipic acid and other
compounds. US patent no. 8592189 B2.
Ciroth, A., 2007. ICT for Environment in Life Cycle Applications openLCA - A new open source software for
Life Cycle Assessment. Int J Life Cycle Assess 12, 209–210.
16
Danish Energy Agency, 2011. Energy strategy 2050 - from coal, oil and gas to green energy. Tech. rep., Danish
Energy Agency.
Draths, K. M., Frost, J. W., 1994. Environmentally compatible synthesis of adipic acid from D-glucose. J Am
Chem Soc 116, 399–400.
Energimyndigheten, 2014. Energy in sweden 2013. Tech. rep., Energimyndigheten.
Frischknecht, R., Jungbluth, N., Althaus, H.-J., Bauer, C., Doka, G., Dones, R., Hischier, R., Hellweg, S.,
Humbert, S., Köllner, T., Loerincik, Y., Margni, M., Nemecek, T., 2007. Implementation of life cycle impact
assessment methods. Tech. Rep. ecoinvent report No. 3, Swiss Centre for Life Cycle Inventories.
Guinée, J., Gorrée, M., Heijungs, R., Huppes, G., Kleijn, R., Koning, A. d., Oers, L. v., Wegener Sleeswijk,
A., Suh, S., Udo de Haes, H., Bruijn, H. d., Duin, R. v., Huijbregts, M., 2002. Handbook on life cycle
assessment. Operational guide to the ISO standards. Kluwer Academic Publishers, Dordrecht.
Han, J., 2016. A bio-based ‘green’ process for catalytic adipic acid production from lignocellulosic biomass
using cellulose and hemicellulose derived γ-valerolactone. Energy Convers Manage 129, 75–80.
Hoelderich, W. F., 2000. Environmentally benign manufacturing of fine and intermediate chemicals. Catal
Today 62, 115–130.
Janssen, M., Xiros, C., Tillman, A.-M., 2016. Life cycle impacts of ethanol production from spruce wood chips
under high gravity conditions. Biotechnol Biofuels 9, 53.
Jedvert, K., 2014. Mild steam explosion of Norway spruce. Ph.D. thesis, Chalmers University of Technology.
URL http://publications.lib.chalmers.se/records/fulltext/197017/197017.pdf
Jedvert, K., Saltberg, A., Lindström, M. E., Theliander, H., 2012. Mild steam explosion and chemical pre-
treatment of Norway spruce. Bioresources 7, 2051–2074.
Karlsson, H., Börjesson, P., Hansson, P.-A., Ahlgren, S., 2014. Ethanol production in biorefineries using
lignocellulosic feedstock - GHG performance, energy balance and implications of life cycle calculation
methodology. J Clean Prod 83, 420–427.
Laurent, A., Espinosa, N., 2015. Environmental impacts of electricity generation at global, regional and
national scales in 1980-2011: what can we learn for future energy planning? Energy Environ Sci 8, 689–701.
17

Li, L., Xu, J., Hu, J., Han, J., 2014. Reducing Nitrous Oxide Emissions to Mitigate Climate Change and Protect
the Ozone Layer. Environ Sci Technol 48, 5290–5297.
Liptow, C., Tillman, A.-M., Janssen, M., Wallberg, O., Taylor, G., 2013. Ethylene based on woody biomass:
what are environmental key issues of a possible future Swedish production on industrial scale. Int J Life
Cycle Assess 18, 1071–1081.
Myhre, G., Shindell, D., Bréon, F.-M., Collins, W., Fuglestvedt, J., Huang, J., Koch, D., Lamarque, J.-F., Lee,
D., Mendoza, B., Nakajima, T., Robock, A., Stephens, G., Takemura, T., Zhang, H., 2013. Anthropogenic
and Natural Radiative Forcing. Cambridge University Press, Cambridge, United Kingdom and New York,
NY, USA, Ch. 8, pp. 659–740.
NREL, 2012. U.S. life cycle inventory database. Accessed April 2016.
URL https://www.lcacommons.gov/nrel/search
Ortiz, C. A., Lundblad, M., Lundström, A., Stendahl, J., 2014. The effect of increased extraction of forest
harvest residues on soil organic carbon accumulation in sweden. Biomass Bioenerg 70, 230–238.
Palmqvist, B., Liden, G., 2012. Torque measurements reveal large process differences between materials during
high solid enzymatic hydrolysis of pretreated lignocellulose. Biotechnol Biofuels 5, 57.
Qin, C., 2009. Lignin as alternative renewable fuel.
URL http://www.altenergymag.com/emagazine/2009/06/lignin-as-alternative-renewable-fuel/1384
Sandén, B., Pettersson, K., 2014. System Perspectives on Biorefineries. Chalmers Energy Initiative.
Schweigler, T., 2016. Process development of integrated biorefinery concepts at different technology readiness
level. Master’s thesis, ETH Zürich.
Shimizu, A., Tanaka, K., Fujimori, M., 2000. Abatement technologies for N2O emissions in the adipic acid
industry. Chemosphere Global Change Sci 2, 425–434.
Svensson, E., Janssen, M., Pettersson, K., Ekman, A., 2015. Economic and environmental analysis of an emerg-
ing biorefinery concept as a guide for early technology development. In: 10th Conference on Sustainable
Development of Energy, Water and Environment Systems. pp. 1–6.
Thinkstep, 2017. Process data set: Adipic acid; via cyclohexane; production mix, at plant. Online, accessed
February 2017.18

URL http://gabi-documentation-2016.gabi-software.com/xml-data/processes/
28274c40-d4ac-4350-94bc-800788c29369.xml
van Duuren, J., Brehmer, B., Mars, A., Eggink, G., dos Santos, V. M., Sanders, J., 2011. A limited LCA
of bio-adipic acid: Manufacturing the nylon-6,6 precursor adipic acid using the benzoic acid degradation
pathway from different feedstocks. Biotechnol Bioeng 108, 1298–1306.
Wang, Q., Gürsel, I. V., Shang, M., Hessel, V., 2013. Life cycle assessment for the direct synthesis of adipic
acid in microreactors and benchmarking to the commercial process. Chem Eng J 234, 300–311.
Wu, Y., Kelly, M. T., Ortega, J. V., 2004. Review of chemical processes for the synthesis of sodium borohydride.
Tech. rep., Millennium Cell Inc.
URL https://www.eecbg.energy.gov/hydrogenandfuelcells/pdfs/review_chemical_processes.pdf
19

Table captions
Table 1Description of the analyzed scenarios
Table 2The price of the products of the process
Table 3The reduction of GWP and NREU for each scenario (acid-catalyzed and alkaline pretreatment) when biomassincineration efficiency is increased from 75 % to 90 %
Table 4The reduction of GWP and NREU due to the reduction of NaBH4 concentration
Table 5The reduction of GWP and NREU when process energy for the NaBH4 production is changed from the ecoinventprocess ’heat, in chemical industry – RER’ to biomass only
1

Figure captions
Fig. 1. Process diagram of bio-based adipic acid production. Note: *applied to BC and Sc1 scenarios where ligninby-product is incinerated to generate process energy; **applied to Sc2 and Sc3 scenarios where lignin by-product issold (see section 2.2.3 for the scenario descriptions).
Fig. 2. Environmental impacts of the production of bio-based adipic acid using acid-catalyzed ptreatment for thedefined scenarios: a. global warming potential (GWP), b. eutrophication potential (EP), c. acidification potential(AP), and d. photochemical ozone creation potential (POCP). The impact of fossil-based adipic acid production ismentioned in each graph.
Fig. 3. Environmental impacts of the production of bio-based adipic acid using alkaline ptreatment for the definedscenarios: a. global warming potential (GWP), b. eutrophication potential (EP), c. acidification potential (AP), and d.photochemical ozone creation potential (POCP). The impact of fossil-based adipic acid production is mentioned ineach graph.
Fig. 4. Energy use in the production of bio-based adipic acid using acid-catalyzed ptreatment for the defined scenarios:a. non-renewable energy use (NREU), and b. renewable energy use (NREU). The energy use of fossil-based adipicacid production is mentioned in each graph.
Fig. 5. Energy use in the production of bio-based adipic acid using alkaline ptreatment for the defined scenarios: a.non-renewable energy use (NREU), and b. renewable energy use (REU). The energy use of fossil-based adipic acidproduction is mentioned in each graph.
1

Tables
Table 1
Scenario name Lignin by-product Additional energy source
BC (base case) incinerated biogas, lignin, fossil fuelSc1 incinerated biogas, lignin, external biomassSc2 sold biogas, fossil fuelSc3 sold biogas, external biomass
1

Table 2
Products Price [e t−1]
Adipic acid 18001
Lignin 3002
1 Boswell and Meehan (2011)2 Assumed to be sold as an al-
ternative renewable fuel (Qin,2009).
2

Table 3
Scenario Acid-catalyzed pretreatment Alkaline pretreatment∆GWP [%] ∆NREU [%] ∆GWP [%] ∆NREU [%]
BC −10.0 −9.9 −4.1 −3.6Sc1 −2.8 −2.8 −0.4 −0.2Sc3 −2.9 −3.7 −0.6 −0.4
3
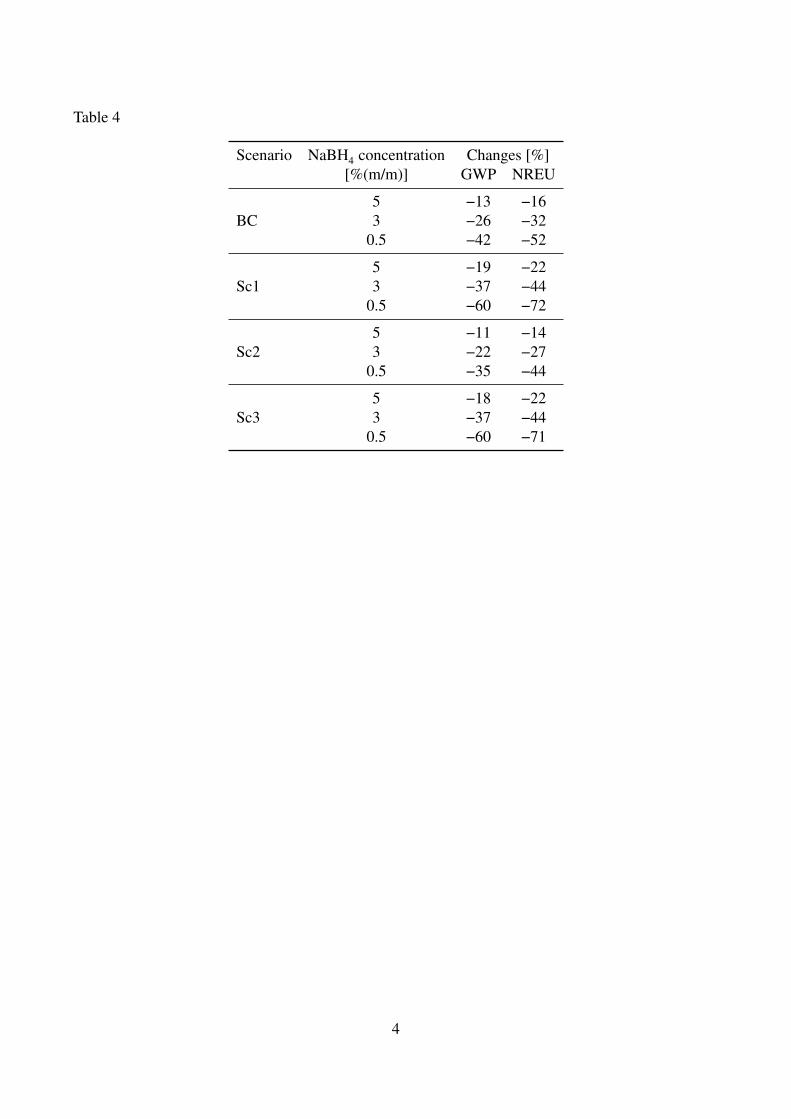
Table 4
Scenario NaBH4 concentration Changes [%][%(m/m)] GWP NREU
5 −13 −16BC 3 −26 −32
0.5 −42 −52
5 −19 −22Sc1 3 −37 −44
0.5 −60 −72
5 −11 −14Sc2 3 −22 −27
0.5 −35 −44
5 −18 −22Sc3 3 −37 −44
0.5 −60 −71
4

Table 5
Scenario Changes [%]GWP NREU
BC −22 −30Sc1 −32 −41Sc2 −19 −25Sc3 −32 −41
5

Figures
Figure 1
Forest residueharvesting Roundwood
Pretreatment
Neutralisationand
separation
Anaerobicdigestion
Incineration
Additional fuel
Hydrolysis andfermentation
Centrifugation
Multi-evaporation
Crystallization
Drying
Lignin,to pelletizing**
Evaporationand drying
Filtration Adipic acid
Evaporation
Allocationpoint A
Allocationpoint B
Allocationpoint C**
Downstream processing
Lignin,for process
energy*
Biogas
Rec
ycle
dflo
w
Forest residue
1
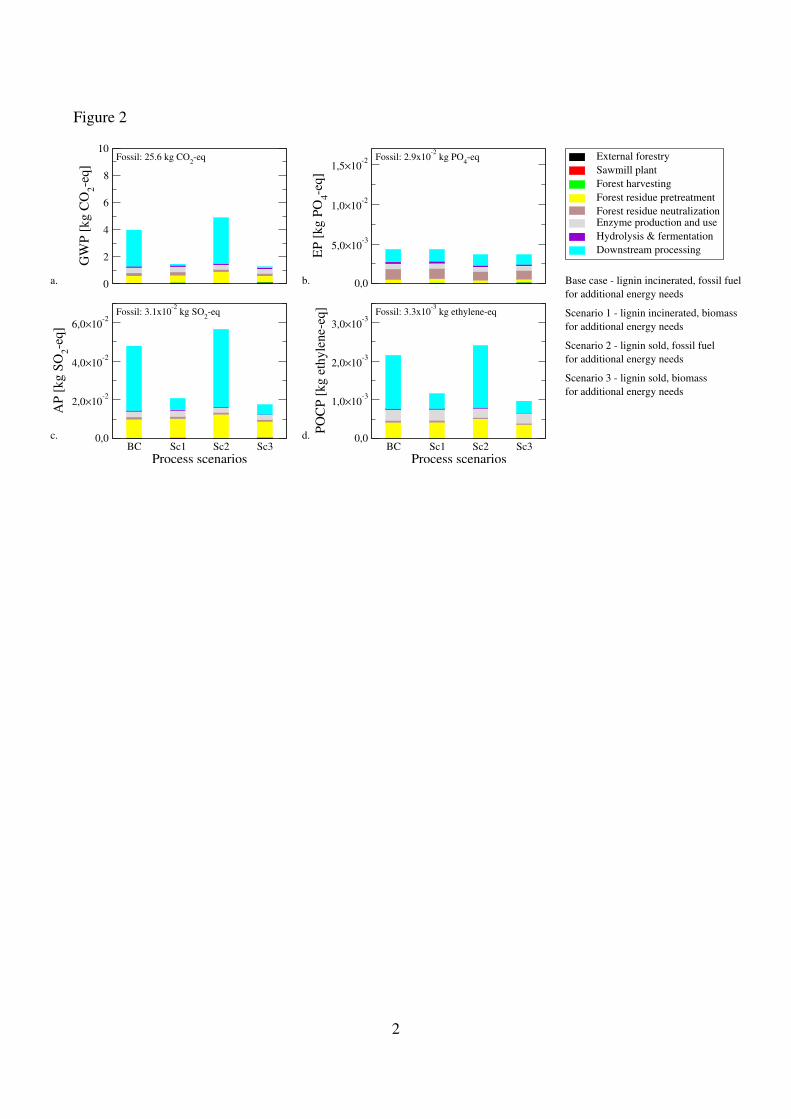
Figure 2
0
2
4
6
8
10
GW
P [
kg
CO
2-e
q]
External forestry
Sawmill plant
Forest harvesting
Forest residue pretreatment
Forest residue neutralizationEnzyme production and use
Hydrolysis & fermentation
Downstream processing
0,0
5,0×10⁻³
1,0×10⁻²
1,5×10⁻²
EP
[k
g P
O4-e
q]
BC Sc1 Sc2 Sc3
Process scenarios
0,0
2,0×10⁻²
4,0×10⁻²
6,0×10⁻²
AP
[k
g S
O2-e
q]
BC Sc1 Sc2 Sc3
Process scenarios
0,0
1,0×10⁻³
2,0×10⁻³
3,0×10⁻³
PO
CP
[k
g e
thy
len
e-eq
]
Base case - lignin incinerated, fossil fuel
for additional energy needs
Scenario 1 - lignin incinerated, biomass
for additional energy needs
Scenario 2 - lignin sold, fossil fuel
for additional energy needs
Scenario 3 - lignin sold, biomass
for additional energy needs
Fossil: 25.6 kg CO2-eq Fossil: 2.9x10
-2 kg PO
4-eq
Fossil: 3.1x10⁻²
kg SO2-eq Fossil: 3.3x10
-3 kg ethylene-eq
a. b.
c. d.
2
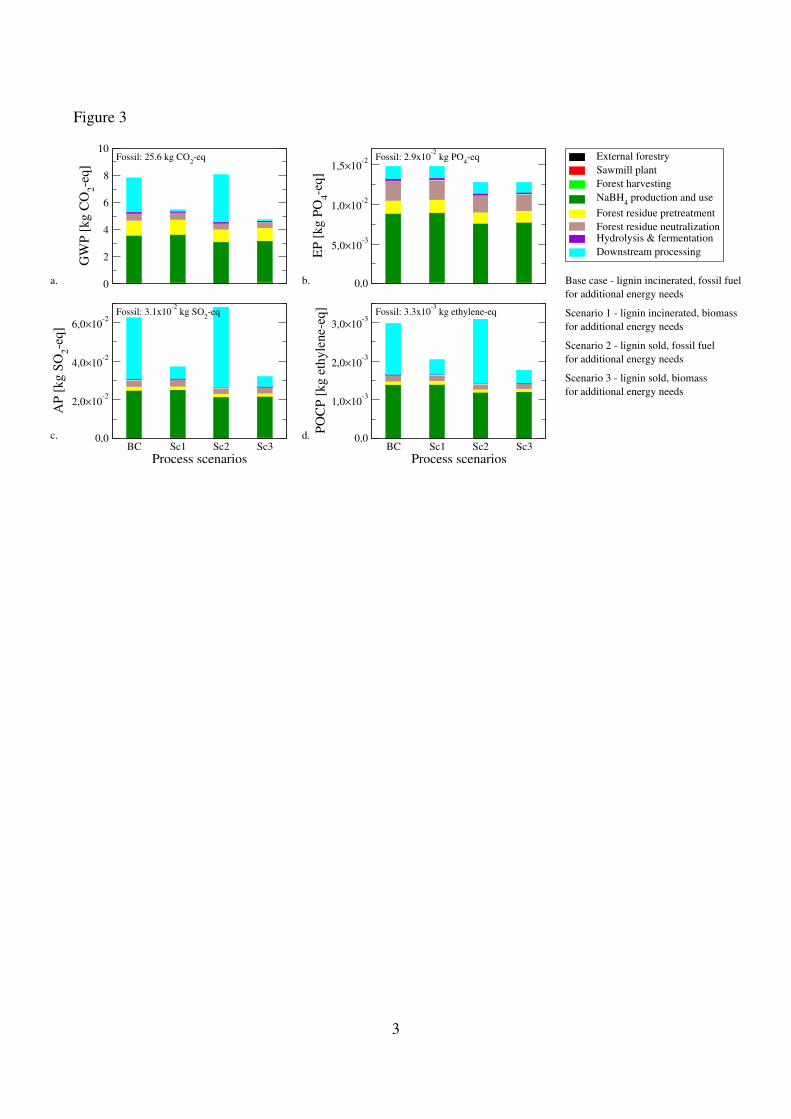
Figure 3
0
2
4
6
8
10
GW
P [
kg
CO
2-e
q]
External forestry
Sawmill plant
Forest harvesting
NaBH4 production and use
Forest residue pretreatment
Forest residue neutralizationHydrolysis & fermentation
Downstream processing
0,0
5,0×10⁻³
1,0×10⁻²
1,5×10⁻²
EP
[k
g P
O4-e
q]
BC Sc1 Sc2 Sc3
Process scenarios
0,0
2,0×10⁻²
4,0×10⁻²
6,0×10⁻²
AP
[k
g S
O2-e
q]
BC Sc1 Sc2 Sc3
Process scenarios
0,0
1,0×10⁻³
2,0×10⁻³
3,0×10⁻³
PO
CP
[k
g e
thy
len
e-eq
]
Base case - lignin incinerated, fossil fuel
for additional energy needs
Scenario 1 - lignin incinerated, biomass
for additional energy needs
Scenario 2 - lignin sold, fossil fuel
for additional energy needs
Scenario 3 - lignin sold, biomass
for additional energy needs
Fossil: 25.6 kg CO2-eq Fossil: 2.9x10
-2 kg PO
4-eq
Fossil: 3.1x10⁻²
kg SO2-eq Fossil: 3.3x10
-3 kg ethylene-eq
a. b.
c. d.
3

Figure 4
BC Sc1 Sc2 Sc3
Process scenarios
0
25
50
75
100
125
NR
EU
[M
J-eq
]
External forestry
Sawmill plant
Forest harvesting
Forest residue pretreatment
Forest residue neutralizationEnzyme production and use
Hydrolysis & fermentation
Downstream processing
BC Sc1 Sc2 Sc3
Process scenarios
0
10
20
30
40
50
60
70
80
RE
U [
MJ-
eq]
Base case - lignin incinerated, fossil fuel
for additional energy needs
Scenario 1 - lignin incinerated, biomass
for additional energy needs
Scenario 2 - lignin sold, fossil fuel
for additional energy needs
Scenario 3 - lignin sold, biomass
for additional energy needs
Fossil: 136 MJ-eq Fossil: 4.8 MJ-eq
a. b.
4

Figure 5
BC Sc1 Sc2 Sc3
Process scenarios
0
25
50
75
100
125
NR
EU
[M
J-eq
]
External forestry
Sawmill plant
Forest harvesting
NaBH4 production and use
Forest residue pretreatment
Forest residue neutralizationHydrolysis & fermentation
Downstream processing
BC Sc1 Sc2 Sc3
Process scenarios
0
10
20
30
40
50
60
70
80
RE
U [
MJ-
eq]
Base case - lignin incinerated, fossil fuel
for additional energy needs
Scenario 1 - lignin incinerated, biomass
for additional energy needs
Scenario 2 - lignin sold, fossil fuel
for additional energy needs
Scenario 3 - lignin sold, biomass
for additional energy needs
Fossil: 136 MJ-eq Fossil: 4.8 MJ-eq
a. b.
5