protein dynamics studied with ultrafast two-dimensional ... · the topic of considerable interest.1...
TRANSCRIPT

1866 ’ ACCOUNTS OF CHEMICAL RESEARCH ’ 1866–1874 ’ 2012 ’ Vol. 45, No. 11 Published on the Web 03/20/2012 www.pubs.acs.org/accounts10.1021/ar200275k & 2012 American Chemical Society
Protein Dynamics Studied with UltrafastTwo-Dimensional Infrared Vibrational Echo
SpectroscopyMEGAN C. THIELGES† AND MICHAEL D. FAYER*
Department of Chemistry Stanford University, Stanford, California 94305,United States
RECEIVED ON OCTOBER 29, 2011
CONS P EC TU S
P roteins, enzymes, and other biological molecules undergo structural dynamics as an intrinsic part of their biological functions.While many biological processes occur on the millisecond, second, and even longer time scales, the fundamental structural
dynamics that eventually give rise to such processes occur on much faster time scales. Many decades ago, chemical kineticistsfocused on the inverse of the reaction rate constant as the important time scale for a chemical reaction. However, through transitionstate theory and a vast amount of experimental evidence, we now know that the key events in a chemical reaction can involvestructural fluctuations that take a system of reactants to its transition state, the crossing of a barrier, and the eventual relaxation toproduct states. Such dynamics occur on very fast time scales.
Today researchers would like to investigate the fast structural fluctuations of biological molecules to gain an understanding ofhow biological processes proceed from simple structural changes in biomolecules to the final, complex biological function. Thestudy of the fast structural dynamics of biological molecules requires experiments that operate on the appropriate time scales, andin this Account, we discuss the application of ultrafast two-dimensional infrared (2D IR) vibrational echo spectroscopy to the studyof protein dynamics. The 2D IR vibrational echo experiment is akin to 2D NMR, but it operates on time scales many orders ofmagnitude faster. In the experiments, a particular vibrational oscillator serves as a vibrational dynamics probe. As the structure ofthe protein evolves in time, the structural changes are manifested as time-dependent changes in the frequency of the vibrationaldynamics probe. The 2D IR vibrational echo experiments can track the vibrational frequency evolution, which we then relate to thetime evolution of the protein structure. In particular, we measured protein substate interconversion for mutants of myoglobinusing 2D IR chemical exchange spectroscopy and observed well-defined substate interconversion on a sub-100 ps time scale. Inanother study, we investigated the influence of binding five different substrates to the enzyme cytochrome P450cam. The varioussubstrates affect the enzyme dynamics differently, and the observed dynamics are correlated with the enzyme's selectivity ofhydroxylation of the substrates and with the substrate binding affinity.
I. IntroductionIn recent years, the study of the dynamics of biological
molecules undergoing structural changes on a wide range
of time scales, from femtoseconds tomilliseconds, has been
the topic of considerable interest.1�4 Biological function
requires protein structural changes on a variety of time
scales.1,2 Accumulating evidence suggests that very fast
structural fluctuations on subnanosecond time scales can

Vol. 45, No. 11 ’ 2012 ’ 1866–1874 ’ ACCOUNTS OF CHEMICAL RESEARCH ’ 1867
Protein Dynamics Thielges and Fayer
be intimately related to protein function manifested on
much longer time scales.5�9 For example, subnanosecond
time scale motions have been implicated in the thermody-
namics and specificity of protein�protein binding9,10 and
allostery.8 The two-dimensional infrared (2D IR) spectro-
scopic experiments discussed herein suggest that motions
on the picosecond time scale contribute to the selectivity of
hydroxylation by cytochrome P450cam.7 Understanding the
structural dynamics of biomolecules can provide valuable
information regarding the relationship between structure
and function.5,11,12
The energy landscapes of proteins are complex and fre-
quently contain a number of local minima of similar energy.
Each local minimum reflects a particular conformational
state where the protein adopts a distinct structure.5 Under
thermal equilibrium conditions, protein structures fluctuate
and continually switch among their conformational states.
In addition to interconversion between distinct energymini-
ma, proteins undergo structural fluctuations within a partic-
ular conformational state.
Two-dimensional infrared (2D IR) vibrational echo spec-
troscopy can measure protein structural fluctuations on fast
times scales.7,13�16 Applications of 2D IR spectroscopy to
biomolecules include studies of protein structure, dynamics,
and folding.7,15�21 Here we discuss two related 2D IR tech-
niques that have been employed for the study of protein
dynamics. The first is chemical exchange spectroscopy,
which provides a direct observable for monitoring the inter-
conversion between twodistinct protein conformations. The
second is themeasurement of spectral diffusion, which is the
time evolution of the frequency of the vibrational probe
within the inhomogeneous distribution of states reflected in
the vibrational absorption line width. The time-dependent
frequency changes are caused by structural fluctuations of
the vibrational probe and its environment. The experimen-
tal measurement of spectral diffusion is used to determine
the frequency�frequency correlation function (FFCF), which
is the connection between the experimental observables
and the underlying dynamics of the system.22
II. Experimental ProceduresHerein are discussed example studies of twohemeproteins:
mutants of myoglobin (Mb) and cytochrome P450cam
(P450cam). CO binds the active sites of both heme proteins
and displays a strong vibrational stretching transition
at ∼1950 cm�1. The CO serves as the vibrational probe of
the surrounding protein dynamics.
The laser system used for these experiments consists of a
Ti:sapphire oscillator and regenerative amplifier pumping
an optical parametric amplifier and difference frequency
stage to produce ∼90 fs pulses at ∼5 μm (1950 cm�1). The
frequency of the IR is tuned to the transition frequency of the
CO stretch for the protein under study. Because the pulses
are short, the bandwidth spans the ground state to first
vibrational excited state (0�1) transition as well as the first
to second excited state transition (1�2).
In 2D IR vibrational echo experiments,22 the IR beam is
split into three excitation pulses and a fourth beam, the local
oscillator (LO) (Figure 1). The three excitation pulses are time
ordered, with pulses 1 and 2 traveling along variable delay
stages. The first pulse creates a coherence consisting of a
superposition of the v=0and v=1vibrational levels. During
the evolution period τ, the phase relationships between the
oscillators decay. The second pulse reaches the sample at
time τ and creates a population state in either v = 0 or v = 1.
A time Tw (the waiting period) elapses before the third pulse
arrives at the sample to create another coherence that
partially restores the phase relationships. Rephasing of the
oscillators causes emission of a vibrational echo signal. For
very short Tw times, the echo will be emitted at a time t ≈ τ
after the third pulse, and for increasingly longer Tw times, it
will appear increasingly nearer the time of the third pulse.
During Tw, the frequencies of the CO molecules change
(chemical exchange14,21,23 or spectral diffusion7,15,16) as
they sample different environments due to the structural
evolution of the proteins.24�26 The echo signal is spatially
and temporally overlapped with the LO for heterodyned
detection, which provides both signal amplification and
phase information. The heterodyned signal is frequency
dispersed by a monochromator and detected with an array
detector. Taking the spectrum of the signal provides the
FIGURE 1. Two-dimensional IR experimental pulse sequence, geome-try, and detection.

1868 ’ ACCOUNTS OF CHEMICAL RESEARCH ’ 1866–1874 ’ 2012 ’ Vol. 45, No. 11
Protein Dynamics Thielges and Fayer
vertical axis (ωm axis) in the 2D spectrum. At each ωm
frequency, scanning τ produces a temporal interferogram.
Numerical Fourier transforms of these interferograms give
the horizontal axis (ωτ axis). Then Tw is changed and another
2D spectrum is recorded. The time evolution of the 2D
spectra provides the information on the system dynamics.
III. Results and DiscussionA. Substate Switching inMyoglobin�COObservedwith
Chemical Exchange Spectroscopy. The ability of proteins
to undergo conformational switching is central to protein
function. For example, conformational changes often ac-
company enzyme�ligand or protein�protein binding.27�29
A folding protein will sample many conformations as it prog-
resses toward the folded structure.30 Proteins can undergo
large conformational changes that occur on longer, milli-
second to second, time scales. However, these large con-
formational changes consist of a vast number of more local
elementary conformational steps involving small scale
structural fluctuations of individual amino acids that can
occur on much faster time scales.
The experimental determination of the time scales of ele-
mentary conformational steps is a long-standing problem
that has now been successfully addressed using ultrafast 2D
IR vibrational echo chemical exchange spectroscopy.14,21,23
Conformational switching has been studied extensively in
the protein myoglobin (Mb) with the ligand CO bound at the
active site (MbCO).14,21,23,31,32 The Fourier transform infra-
red (FT IR) spectrum of the heme-ligated CO stretching
mode of Mb has two major absorption bands, denoted A1
(1945 cm�1) and A3 (1932 cm�1), and a third small band, A0
(1965 cm�1) (Figure 2B).33 Only the A1 and A3 bands will be
discussed here. These bands reflect conformational sub-
states ofMbwhere the distal histidine residue, His64, adopts
different configurations (Figure 2A).33�35
MbCO rapidly interconverts between the A1 andA3 states
under thermal equilibrium conditions. CO binding rate con-
stants following photolysis determined at low temperature
and extrapolated to ambient temperature indicated the
switching between A1 and A3 to be <1 ns.36 Molecular dy-
namics (MD) simulations have placed the A1�A3 switching
time on the order of a few hundred picoseconds.21,23,35
Here, direct measurements of the A1�A3 interconversion
time for two Mb mutants under thermal equilibrium condi-
tions using 2D-IR vibrational echo chemical exchange spec-
troscopy are described. This method has proven useful for
studying fast dynamical processes in liquids.24,26,37,38 The
2D IR vibrational echo chemical exchange experiment is
akin to a 2D NMR chemical exchange experiment except
that it can operate on a picosecond time scale, and it directly
probes the structural degrees of freedom through the time
evolution of the 2D vibrational spectrum.
Figure 3 shows a schematic illustration of spectra for an
ideal 2D IR chemical exchange experiment. There are two
species, A and B, with absorption frequencies, ωA and ωB. At
short time (left panel), prior to any chemical exchange, two
peaks appear on the diagonal that arise from the 0�1
vibrational transitions (red, positive going), and two corre-
sponding peaks appear below, shifted to lower frequency
along the ωm axis by the vibrational anharmonicity, due to
vibrational echo emission at the 1�2 transition frequency
(blue, negative going). At long time (right panel), chemical
exchange has occurred. Some A's have turned into B's, and
because the system is in equilibrium, the samenumber of B's
have turned into A's. The chemical exchange is manifested
FIGURE2. (A) Structure ofMb L29I (pdb id 1MWC) and (B) FT IR spectrumof CO in L29I Mb.
FIGURE 3. Schematic of 2D IR spectra illustrating chemical exchange.
Vol. 45, No. 11 ’ 2012 ’ 1866–1874 ’ ACCOUNTS OF CHEMICAL RESEARCH ’ 1869
Protein Dynamics Thielges and Fayer
by the growth of the off-diagonal peaks. Measurement
of the time-dependent increase in the off-diagonal peaks
enables determination of the time scale of chemical
exchange.24
Because the A3 absorption peak of wild-type MbCO is
relatively weak compared with the A1 peak, which results in
the A1 peak dominating the spectra, we performed the ex-
periments on two Mb mutants, L29I and the double mutant
T67R/S92D. These mutations cause the A1 and A3 bands in
the FT IR spectrum to be approximately the same amplitude
(Figure 2B), which helped us to clearly discern all the diag-
onal and off-diagonal chemical exchange peaks and facili-
tated their analysis.
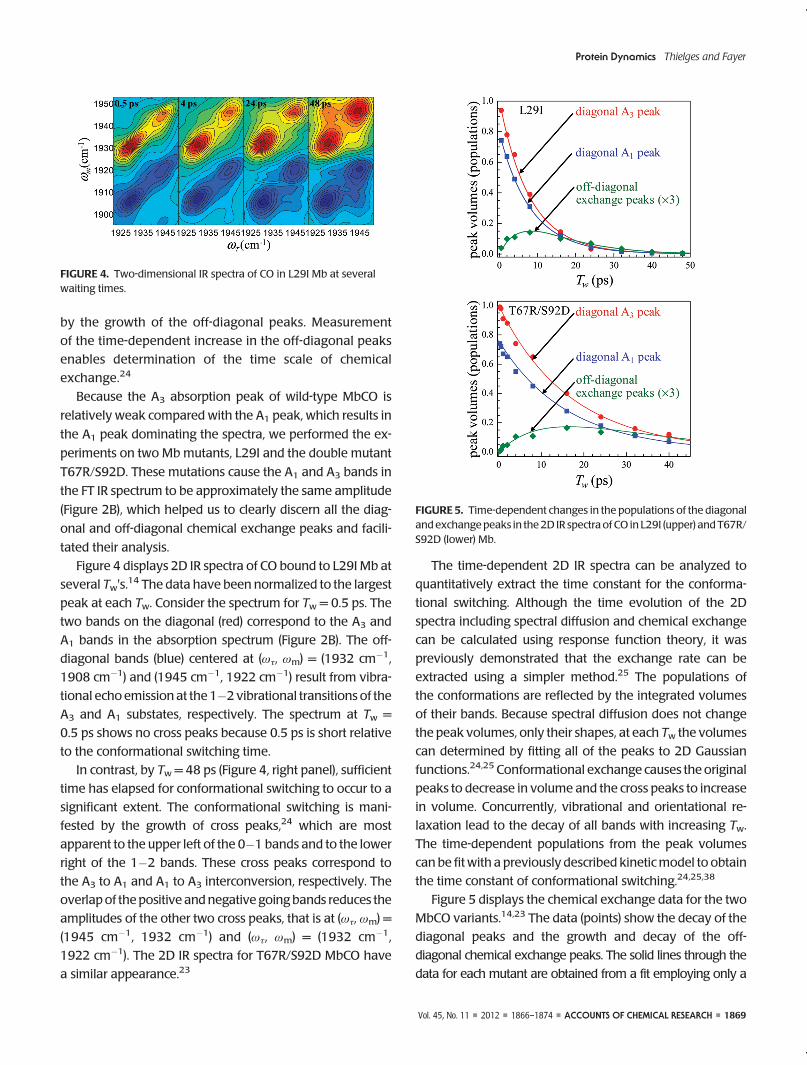
Figure 4 displays 2D IR spectra of CO bound to L29I Mb at
several Tw's.14 The data have been normalized to the largest
peak at each Tw. Consider the spectrum for Tw = 0.5 ps. The
two bands on the diagonal (red) correspond to the A3 and
A1 bands in the absorption spectrum (Figure 2B). The off-
diagonal bands (blue) centered at (ωτ, ωm) = (1932 cm�1,
1908 cm�1) and (1945 cm�1, 1922 cm�1) result from vibra-
tional echo emission at the 1�2vibrational transitions of the
A3 and A1 substates, respectively. The spectrum at Tw =
0.5 ps shows no cross peaks because 0.5 ps is short relative
to the conformational switching time.
In contrast, by Tw = 48 ps (Figure 4, right panel), sufficient
time has elapsed for conformational switching to occur to a
significant extent. The conformational switching is mani-
fested by the growth of cross peaks,24 which are most
apparent to the upper left of the 0�1 bands and to the lower
right of the 1�2 bands. These cross peaks correspond to
the A3 to A1 and A1 to A3 interconversion, respectively. The
overlapof the positive andnegative going bands reduces the
amplitudes of the other two cross peaks, that is at (ωτ, ωm) =
(1945 cm�1, 1932 cm�1) and (ωτ, ωm) = (1932 cm�1,
1922 cm�1). The 2D IR spectra for T67R/S92D MbCO have
a similar appearance.23
The time-dependent 2D IR spectra can be analyzed to
quantitatively extract the time constant for the conforma-
tional switching. Although the time evolution of the 2D
spectra including spectral diffusion and chemical exchange
can be calculated using response function theory, it was
previously demonstrated that the exchange rate can be
extracted using a simpler method.25 The populations of
the conformations are reflected by the integrated volumes
of their bands. Because spectral diffusion does not change
the peak volumes, only their shapes, at each Tw the volumes
can determined by fitting all of the peaks to 2D Gaussian
functions.24,25 Conformational exchange causes the original
peaks to decrease in volume and the cross peaks to increase
in volume. Concurrently, vibrational and orientational re-
laxation lead to the decay of all bands with increasing Tw.
The time-dependent populations from the peak volumes
can be fit with a previously described kineticmodel to obtain
the time constant of conformational switching.24,25,38
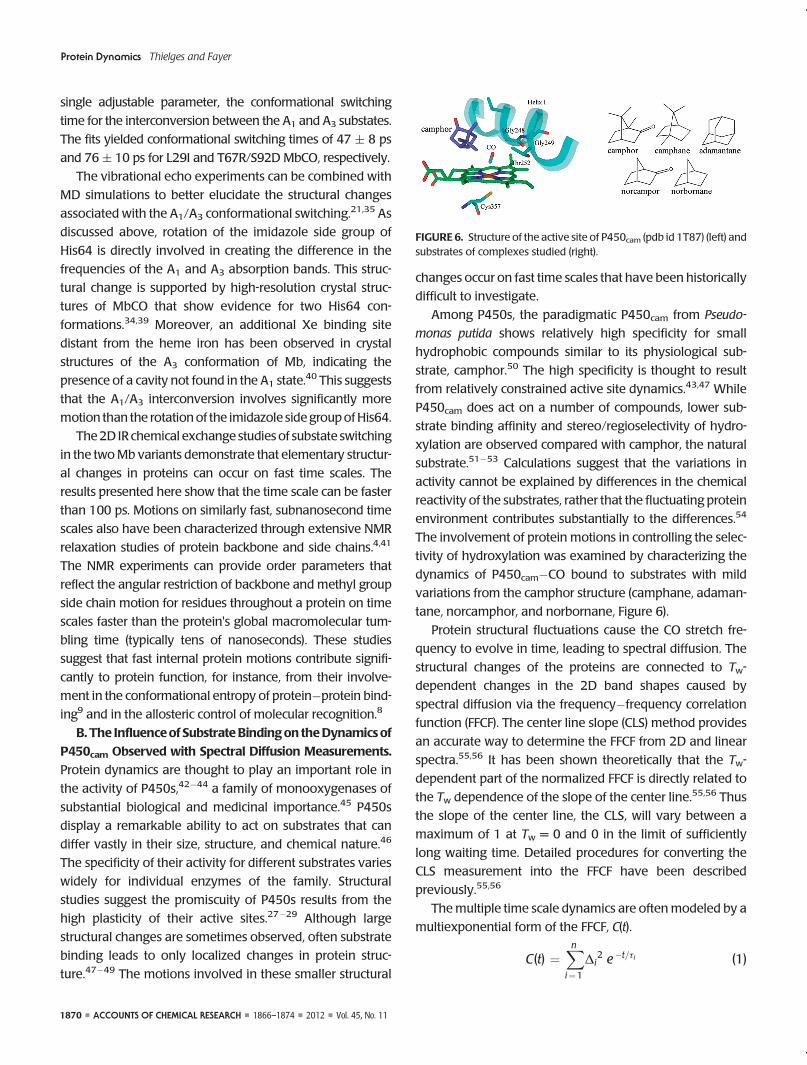
Figure 5 displays the chemical exchange data for the two
MbCO variants.14,23 The data (points) show the decay of the
diagonal peaks and the growth and decay of the off-
diagonal chemical exchange peaks. The solid lines through the
data for each mutant are obtained from a fit employing only a
FIGURE 4. Two-dimensional IR spectra of CO in L29I Mb at severalwaiting times.
FIGURE 5. Time-dependent changes in the populations of the diagonalandexchangepeaks in the2D IR spectraof CO in L29I (upper) andT67R/S92D (lower) Mb.
1870 ’ ACCOUNTS OF CHEMICAL RESEARCH ’ 1866–1874 ’ 2012 ’ Vol. 45, No. 11
Protein Dynamics Thielges and Fayer
single adjustable parameter, the conformational switching
time for the interconversion between the A1 and A3 substates.
The fits yielded conformational switching times of 47 ( 8 ps
and 76 ( 10 ps for L29I and T67R/S92D MbCO, respectively.
The vibrational echo experiments can be combined with
MD simulations to better elucidate the structural changes
associated with the A1/A3 conformational switching.21,35 As
discussed above, rotation of the imidazole side group of
His64 is directly involved in creating the difference in the
frequencies of the A1 and A3 absorption bands. This struc-
tural change is supported by high-resolution crystal struc-
tures of MbCO that show evidence for two His64 con-
formations.34,39 Moreover, an additional Xe binding site
distant from the heme iron has been observed in crystal
structures of the A3 conformation of Mb, indicating the
presence of a cavity not found in the A1 state.40 This suggests
that the A1/A3 interconversion involves significantly more
motion than the rotationof the imidazole sidegroupofHis64.
The2D IR chemical exchange studies of substate switching
in the twoMb variants demonstrate that elementary structur-
al changes in proteins can occur on fast time scales. The
results presented here show that the time scale can be faster
than 100 ps. Motions on similarly fast, subnanosecond time
scales also have been characterized through extensive NMR
relaxation studies of protein backbone and side chains.4,41
The NMR experiments can provide order parameters that
reflect the angular restriction of backbone and methyl group
side chain motion for residues throughout a protein on time
scales faster than the protein's global macromolecular tum-
bling time (typically tens of nanoseconds). These studies
suggest that fast internal protein motions contribute signifi-
cantly to protein function, for instance, from their involve-
ment in the conformational entropy of protein�protein bind-
ing9 and in the allosteric control of molecular recognition.8
B. The Influenceof SubstrateBindingon theDynamicsof
P450cam Observed with Spectral Diffusion Measurements.
Protein dynamics are thought to play an important role in
the activity of P450s,42�44 a family of monooxygenases of
substantial biological and medicinal importance.45 P450s
display a remarkable ability to act on substrates that can
differ vastly in their size, structure, and chemical nature.46
The specificity of their activity for different substrates varies
widely for individual enzymes of the family. Structural
studies suggest the promiscuity of P450s results from the
high plasticity of their active sites.27�29 Although large
structural changes are sometimes observed, often substrate
binding leads to only localized changes in protein struc-
ture.47�49 The motions involved in these smaller structural
changes occur on fast time scales that have been historically
difficult to investigate.
Among P450s, the paradigmatic P450cam from Pseudo-
monas putida shows relatively high specificity for small
hydrophobic compounds similar to its physiological sub-
strate, camphor.50 The high specificity is thought to result
from relatively constrained active site dynamics.43,47 While
P450cam does act on a number of compounds, lower sub-
strate binding affinity and stereo/regioselectivity of hydro-
xylation are observed compared with camphor, the natural
substrate.51�53 Calculations suggest that the variations in
activity cannot be explained by differences in the chemical
reactivity of the substrates, rather that the fluctuating protein
environment contributes substantially to the differences.54
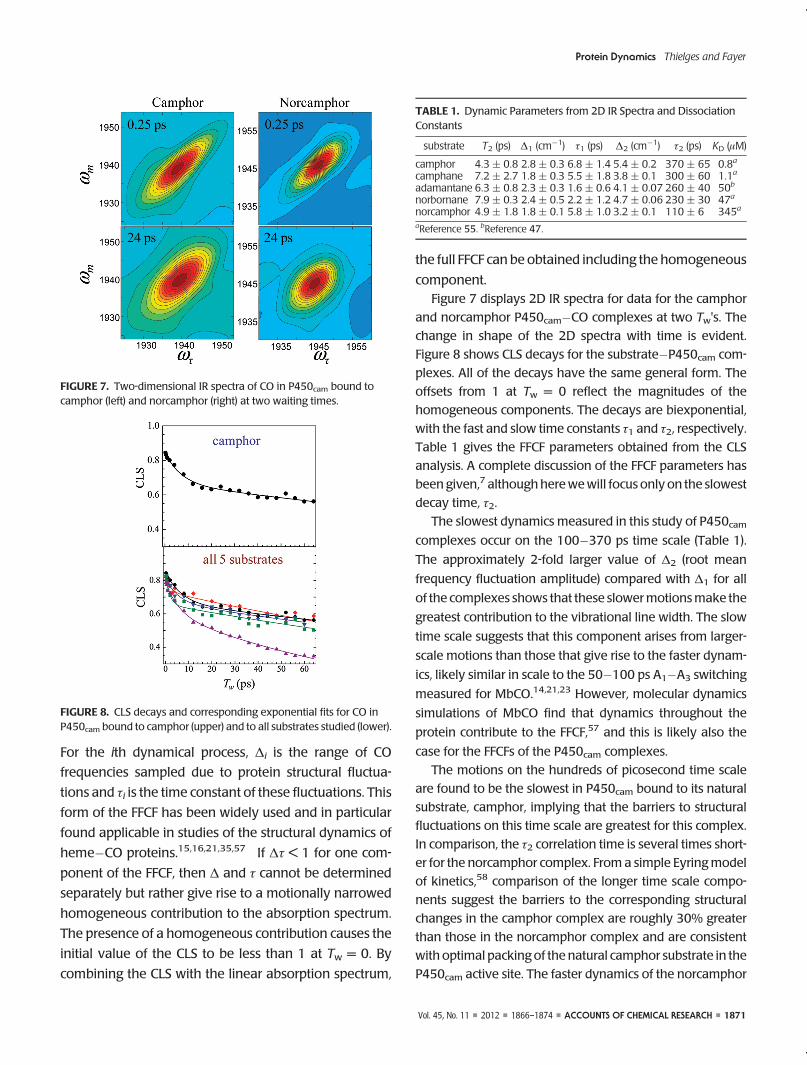
The involvement of protein motions in controlling the selec-
tivity of hydroxylation was examined by characterizing the
dynamics of P450cam�CO bound to substrates with mild
variations from the camphor structure (camphane, adaman-
tane, norcamphor, and norbornane, Figure 6).
Protein structural fluctuations cause the CO stretch fre-
quency to evolve in time, leading to spectral diffusion. The
structural changes of the proteins are connected to Tw-
dependent changes in the 2D band shapes caused by
spectral diffusion via the frequency�frequency correlation
function (FFCF). The center line slope (CLS) method provides
an accurate way to determine the FFCF from 2D and linear
spectra.55,56 It has been shown theoretically that the Tw-
dependent part of the normalized FFCF is directly related to
the Tw dependence of the slope of the center line.55,56 Thus
the slope of the center line, the CLS, will vary between a
maximum of 1 at Tw = 0 and 0 in the limit of sufficiently
long waiting time. Detailed procedures for converting the
CLS measurement into the FFCF have been described
previously.55,56
Themultiple time scale dynamics are oftenmodeled by a
multiexponential form of the FFCF, C(t).
C (t) ¼Xn
i¼1
Δi2 e�t=τi (1)
FIGURE 6. Structure of the active site of P450cam (pdb id 1T87) (left) andsubstrates of complexes studied (right).
Vol. 45, No. 11 ’ 2012 ’ 1866–1874 ’ ACCOUNTS OF CHEMICAL RESEARCH ’ 1871
Protein Dynamics Thielges and Fayer
For the ith dynamical process, Δi is the range of CO
frequencies sampled due to protein structural fluctua-
tions and τi is the time constant of these fluctuations. This
form of the FFCF has been widely used and in particular
found applicable in studies of the structural dynamics of
heme�CO proteins.15,16,21,35,57,,,, If Δτ < 1 for one com-
ponent of the FFCF, then Δ and τ cannot be determined
separately but rather give rise to a motionally narrowed
homogeneous contribution to the absorption spectrum.
The presence of a homogeneous contribution causes the
initial value of the CLS to be less than 1 at Tw = 0. By
combining the CLS with the linear absorption spectrum,
the full FFCF can be obtained including the homogeneous
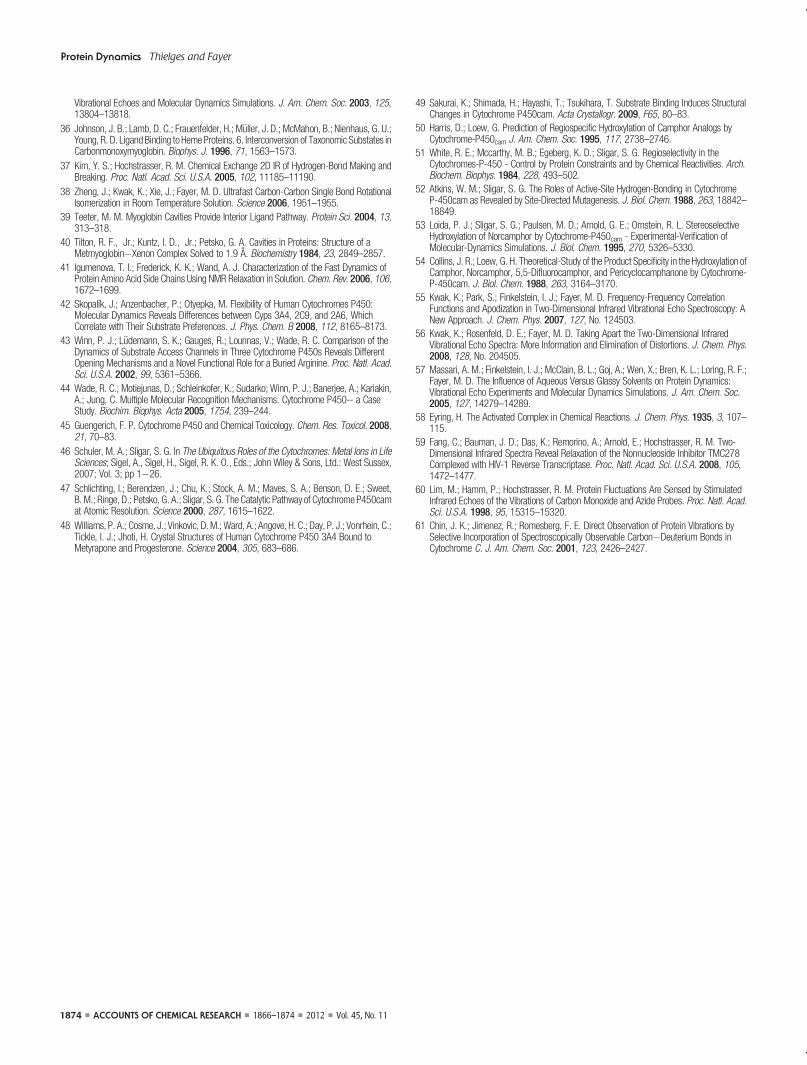
component.Figure 7 displays 2D IR spectra for data for the camphor
and norcamphor P450cam�CO complexes at two Tw's. The
change in shape of the 2D spectra with time is evident.
Figure 8 shows CLS decays for the substrate�P450cam com-
plexes. All of the decays have the same general form. The
offsets from 1 at Tw = 0 reflect the magnitudes of the
homogeneous components. The decays are biexponential,
with the fast and slow time constants τ1 and τ2, respectively.
Table 1 gives the FFCF parameters obtained from the CLS
analysis. A complete discussion of the FFCF parameters has
been given,7 althoughherewewill focus only on the slowest
decay time, τ2.
The slowest dynamics measured in this study of P450camcomplexes occur on the 100�370 ps time scale (Table 1).
The approximately 2-fold larger value of Δ2 (root mean
frequency fluctuation amplitude) compared with Δ1 for all
of the complexes shows that these slowermotionsmake the
greatest contribution to the vibrational line width. The slow
time scale suggests that this component arises from larger-
scale motions than those that give rise to the faster dynam-
ics, likely similar in scale to the 50�100 ps A1�A3 switching
measured for MbCO.14,21,23 However, molecular dynamics
simulations of MbCO find that dynamics throughout the
protein contribute to the FFCF,57 and this is likely also the
case for the FFCFs of the P450cam complexes.
The motions on the hundreds of picosecond time scale
are found to be the slowest in P450cam bound to its natural
substrate, camphor, implying that the barriers to structural
fluctuations on this time scale are greatest for this complex.
In comparison, the τ2 correlation time is several times short-
er for the norcamphor complex. From a simple Eyringmodel
of kinetics,58 comparison of the longer time scale compo-
nents suggest the barriers to the corresponding structural
changes in the camphor complex are roughly 30% greater
than those in the norcamphor complex and are consistent
with optimal packing of the natural camphor substrate in the
P450cam active site. The faster dynamics of the norcamphor
FIGURE 7. Two-dimensional IR spectra of CO in P450cam bound tocamphor (left) and norcamphor (right) at two waiting times.
FIGURE 8. CLS decays and corresponding exponential fits for CO inP450cam bound to camphor (upper) and to all substrates studied (lower).
TABLE 1. Dynamic Parameters from 2D IR Spectra and DissociationConstants
substrate T2 (ps) Δ1 (cm�1) τ1 (ps) Δ2 (cm
�1) τ2 (ps) KD (μM)
camphor 4.3 ( 0.8 2.8 ( 0.3 6.8 ( 1.4 5.4 ( 0.2 370 ( 65 0.8a
camphane 7.2 ( 2.7 1.8 ( 0.3 5.5 ( 1.8 3.8 ( 0.1 300 ( 60 1.1a
adamantane 6.3 ( 0.8 2.3 ( 0.3 1.6 ( 0.6 4.1 ( 0.07 260 ( 40 50b
norbornane 7.9 ( 0.3 2.4 ( 0.5 2.2 ( 1.2 4.7 ( 0.06 230 ( 30 47a
norcamphor 4.9 ( 1.8 1.8 ( 0.1 5.8 ( 1.0 3.2 ( 0.1 110 ( 6 345a
aReference 55. bReference 47.

1872 ’ ACCOUNTS OF CHEMICAL RESEARCH ’ 1866–1874 ’ 2012 ’ Vol. 45, No. 11
Protein Dynamics Thielges and Fayer
complex indicate relatively low kinetic barriers among struc-
tural conformations and hence a smoother energy land-
scape. Conversely, the slower dynamics in the complex with
the natural substrate indicate relatively high barriers to
motion, leading to the picture of a more “rugged” energy
landscape.
The uniquely fast dynamics observed in the norcamphor
complex (Table 1) are particularly notable given the low
selectivity of the hydroxylation of the norcamphor sub-
strate. While 100% and 90% 50-exo hydroxylation product
are obtained from camphor and camphane, respectively,52
the activity of P450cam toward norcamphor results in only
60% of the 50-exo hydroxylation product.53 (Adamantane
and norbornane do not possess an equivalent number of
distinct carbon atoms.) The correlation between the dy-
namics of the complexes and their regioselectivities of
hydroxylation is consistent with the involvement of protein
dynamics in the selectivity of P450cam activity. While the
actual chemical reaction likely involves a low probability
incursion to a high energy state, it seems plausible that the
more rugged landscape would serve to restrict the particular
sequences of structural fluctuations that can lead to the
transition state, and thus enhance the selectivity of camphor
hydroxylation. In contrast, the smoother energy landscape
of the norcamphor complex may lead to a more permissive
trajectory to the transition state and thus allow the reaction
to proceed with “incorrect” carbon centers.
In addition, the 2D IR results suggest that the dynamics of
the complexes may influence the binding affinity, because
the dissociation constants and τ2 are also generally corre-
lated. Those substrates with smaller KD values for binding to
P450cam show longer τ2 times in the FFCFs of the substrate
complexes (Table 1). Thus the binding affinity increases with
slower dynamics. This effect is not likely due to conforma-
tional entropy changes upon binding, because more con-
strained substrate complexes should lead to greater entropic
penalties for binding. It is more likely that the higher barriers
that result in slower dynamics are due to more enthalpically
favorable interactions within the tighter complexes.
Two-dimensional IR vibrational echo spectroscopy mea-
sured dynamics in P450cam complexes on a wide range of
time scales. The complex with the natural substrate, cam-
phor, shows slower motions compared with the unnatural
substrate complexes, indicating higher barriers to protein
structural changes. The enzyme likely has evolved to opti-
mally bind camphor to restrict the structural fluctuations that
may lead to the transition state, such that hydroxylation
occurs only at a specific carbon center. Thus, overall the data
support the involvement of fast structural dynamics in en-
zyme function, and in particular, the specificity of hydroxyla-
tion by P450cam.
Similarly fast motions have been observed in other en-
zymes with spectral diffusion measurements employing
small ligand IR probes.18,59,60 Motions on the tens of pico-
seconds time scale were observed in 2D vibrational studies
of azide bound to carbonic anhydrase60 and a small mole-
cule nitrile inhibitor bound to HIV reverse transcriptase.59 In
a study of azide, a transition state analog, bound to formate
dehydrogenase in several substrate/cofactor complexes,
slower motions observed in the binary ligand complex of
formate dehydrogenase disappeared upon forming the
reactant and product ternary complexes,18 suggesting that
protein motions on fast, subnanosecond time scales might
impact enzyme molecular recognition, in accord with the
P450cam study described here.
IV. Concluding RemarksThe application of two techniques of ultrafast 2D IR vibra-
tional echo spectroscopy to the study of proteins has been
described. One method, chemical exchange spectroscopy,
was used to directly observe the interconversion between
distinct structural substates of two Mb mutants. In both
cases, conformational switching times less than 100 pswere
measured, demonstrating that basic structural changes in
proteins can occur on fast time scales.
In the second application, 2D IR vibrational echo experi-
ments were used to measure spectral diffusion, which is
directly related to protein structural fluctuations. The dy-
namics of P450cam in complex with CO and five different
substrates were discussed. The slowest components of the
fast structural fluctuations show correlations with the selec-
tivity of the activity and the binding constants of the sub-
strates with the enzyme. These results indicate that an
enzyme's fast structural fluctuations are intimately involved
in biological processes that occur on time scales that are
many orders of magnitude slower.
The applications of 2D IR spectroscopy to the measure-
ment of protein dynamics presented here used a heme-
bound CO ligand as a vibrational probe. To generalize the
methods of 2D IR spectroscopy to study dynamics of
proteins beyond those that bind small molecule ligands
and to measure the dynamics at sites throughout protein
structures, our group has begun to combine the spectros-
copic methods with the site-specific incorporation of
amino acids that bear vibrational probe groups.13,15 Azido,
cyano, and carbon-deuterium labeled amino acids can be

Vol. 45, No. 11 ’ 2012 ’ 1866–1874 ’ ACCOUNTS OF CHEMICAL RESEARCH ’ 1873
Protein Dynamics Thielges and Fayer
introduced at specific sites in proteins to exploit their infrared
frequencies around 2000 cm�1 in a relatively transparent
region of a protein IR spectrum,13,15,61 permitting the dis-
cernment and analysis of absorption bands due single
residues in proteins. Cyanophenylalanine has been em-
ployed in 2D IR studies of peptide dynamics and folding.15
Recently, our group reported the first study of the dynamics
of a labeled amino acid, azidophenylalanine, in a full length
protein, myoglobin.13 The combination of site-specific protein
labeling and 2D IR spectroscopy promises to be a powerful
meansofunderstanding theroleofdynamics inprotein function.
We thank the National Institutes of Health (Grant 2-R01-GM061137-09) for support of this research. M.C.T. also thanksthe National Institutes of Health for a postdoctoral fellowship(Grant F32-GM090549).
BIOGRAPHICAL INFORMATION
Megan C. Thielges received her B.S. (2003) from Arizona StateUniversity and Ph.D. (2009) from the Scripps Research Institute.She is currently a NIH postdoctoral fellow in the Fayer group atStanford University and will join the chemistry faculty at IndianaUniversity in the fall of 2012.
Michael D. Fayer received his B.S. (1969) and Ph.D. (1974) fromthe University of California at Berkeley. He joined the faculty atStanford University in 1974, where he is the David MulvaneEhrsam and Edward Curtis Franklin Professor of Chemistry. He isa member of the National Academy of Science, and he hasreceived the E. Bright Wilson Award for Spectroscopy, the Ellis R.Lippincott Award, the Earl K. Plyler Prize for Molecular Spectros-copy, and the Arthur L. Schawlow Prize in Laser Science.
FOOTNOTES
The authors declare no competing financial interest.†Department of Chemistry, Indiana University, Bloomington, Indiana 47405, United States.
REFERENCES1 Henzler-Wildman, K. A.; Lei, M.; Thai, V.; Kerns, S. J.; Karplus, M.; Kern, D. A. Hierarchy of
Timescales in Protein Dynamics Is Linked to Enzyme Catalysis. Nature 2007, 450, 913–916.
2 Hammes-Schiffer, S.; Benkovic, S. J. Relating Protein Motion to Catalysis. Annu. Rev.Biochem. 2006, 75, 519–541.
3 Erzberger, J. P.; Berger, J. M. Evolutionary Relationships and Structural Mechanisms ofAAAþ Proteins. Annu. Rev. Biophys. Biomol. Struct. 2006, 35, 93–114.
4 Boehr, D. D.; Dyson, H. J.; Wright, P. E. An NMR Perspective on Enzyme Dynamics. Chem.Rev. 2006, 106, 3055–3079.
5 Frauenfelder, H.; Sligar, S. G.; Wolynes, P. G. The Energy Landscapes and Motions ofProteins. Science 1991, 254, 1598–1603.
6 Parak, F.; Frauenfelder, H. Protein Dynamics. Physica A 1993, 201, 332–345.7 Thielges, M. C.; Chung, J. K.; Fayer, M. D. Protein Dynamics in Cytochrome P450
Molecular Recognition and Substrate Specificity Using 2D IR Vibrational Echo Spectroscopy.J. Am. Chem. Soc. 2011, 133, 3995–4004.
8 Petit, C.M.; Zhang, J.; Sapienza, P. J.; Fuentes, E. J.; Lee, A. L. Hidden Dynamic Allostery ina PDZ Domain. Proc. Natl. Acad. Sci. U.S.A. 2009, 106, 18249–18254.
9 Frederick, K. K.; Marlow, M. S.; Valentine, K. G.; Wand, A. J. Conformational Entropy inMolecular Recognition by Proteins. Nature 2007, 448, 325–329.
10 Jimenez, R.; Salazar, G.; Yin, J.; Joo, T.; Romesberg, F. E. Protein Dynamics and theImmunological Evolution of Molecular Recognition. Proc. Natl. Acad. Sci. U.S.A. 2004, 101,3803–3808.
11 Hong, M. K.; Braunstein, D.; Cowen, B. R.; Frauenfelder, H.; Iben, I. E. T.; Mourant, J. R.;Ormos, P.; Scholl, R.; Schulte, A.; Steinbach, P. J.; Xie, A. H.; Young, R. D. ConformationalSubstates and Motions in Myoglobin - External Influences on Structure and Dynamics.Biophys. J. 1990, 58, 429–436.
12 Frauenfelder, H.; McMahon, B. H.; Austin, R. H.; Chu, K.; Groves, J. T. The Role of Structure,Energy Landscape, Dynamics, and Allostery in the Enzymatic Function of Myoglobin. Proc.Natl. Acad. Sci. U.S.A. 2001, 98, 2370–2374.
13 Thielges, M. C.; Axup, J. Y.; Wong, D.; Lee, H. S.; Chung, J. K.; Schultz, P. G.; Fayer, M. D.Two-Dimensional IR Spectroscopy of Protein Dynamics Using Two Vibrational Labels: ASite-Specific Genetically Encoded Unnatural Amino Acid and an Active Site Ligand. J. Phys.Chem. B 2011, 115, 11294–11304.
14 Ishikawa, H.; Kwak, K.; Chung, J. K.; Kim, S.; Fayer, M. D. Direct Observation of Fast ProteinConformational Switching. Proc. Natl. Acad. Sci. U.S.A. 2008, 105, 8619–8624.
15 Chung, J. K.; Thielges, M. C.; Fayer, M. D. Dynamics of the Folded and Unfolded VillinHeadpiece (HP35) Measured with Ultrafast 2D IR Vibrational Echo Spectroscopy. Proc. Natl.Acad. Sci. U.S.A. 2011, 108, 3578–3583.
16 Chung, J. K.; Thielges, M. C.; Bowman, S. E. J.; Bren, K. L.; Fayer, M. D. TemperatureDependent Equilibrium Native to Unfolded Protein Dynamics and Properties Observed withIR Absorption and 2D IR Vibrational Echo Experiments. J. Am. Chem. Soc. 2011, 133,6681–6691.
17 Ganim, Z.; Chung, H. S.; Smith, A. W.; Deflores, L. P.; Jones, K. C.; Tokmakoff, A. Amide ITwo-Dimensional Infrared Spectroscopy of Proteins. Acc. Chem. Res. 2008, 41, 432–441.
18 Bandaria, J. N.; Dutta, S.; Nydegger, M. W.; Rock, W.; Kohen, A.; Cheatum, C. M.Characterizing the Dynamics of Functionally Relevant Complexes of Formate Dehydro-genase. Proc. Natl. Acad. Sci. U.S.A. 2010, 107, 17974–17979.
19 Middleton, C. T.; Woys, A. M.; Mukherjee, S. S.; Zanni, M. T. Residue-Specific StructuralKinetics of Proteins through the Union of Isotope Labeling, Mid-IR Pulse Shaping, andCoherent 2D IR Spectroscopy. Methods 2010, 52, 12–22.
20 Kim, Y. S.; Hochstrasser, R. M. Applications of 2D IR Spectroscopy to Peptides, Proteins,and Hydrogen-Bond Dynamics. J. Phys. Chem. B 2009, 113, 8231–8251.
21 Bagchi, S.; Nebgen, B. T.; Loring, R. F.; Fayer, M. D. Dynamics of a Myoglobin MutantEnzyme: 2D IR Vibrational Echo Experiments and Simulations. J. Am. Chem. Soc. 2010,132, 18367–18376.
22 Park, S.; Kwak, K.; Fayer, M. D. Ultrafast 2D-IR Vibrational Echo Spectroscopy: A Probe ofMolecular Dynamics. Laser Phys. Lett. 2007, 4, 704–718.
23 Bagchi, S.; Thorpe, D. G.; Thorpe, I. F.; Voth, G. A.; Fayer, M. D. Conformational Switchingbetween Protein Substates Studied with 2D IR Vibrational Echo Spectroscopy andMolecularDynamics Simulations. J. Phys. Chem. B 2010, 114, 17187–17193.
24 Zheng, J.; Kwak, K.; Asbury, J. B.; Chen, X.; Piletic, I.; Fayer, M. D. Ultrafast Dynamics ofSolute-Solvent Complexation Observed at Thermal Equilibrium in Real Time. Science 2005,309, 1338–1343.
25 Kwak, K.; Zheng, J.; Cang, H.; Fayer, M. D. Ultrafast 2D IR Vibrational Echo ChemicalExchange Experiments and Theory. J. Phys. Chem. B. 2006, 110, 19998–20013.
26 Moilanen, D. E.; Wong, D.; Rosenfeld, D. E.; Fenn, E. E.; Fayer, M. D. Ion-Water HydrogenBond Switching Observed with 2D IR Vibrational Echo Chemical Exchange Spectroscopy.Proc. Nat. Acad. Sci. U.S.A. 2009, 106, 375–380.
27 Scott, E. E.; He, Y. A.; Wester, M. R.;White,M. A.; Chin, C. C.; Halpert, J. R.; Johnson, E. F.;Stout, C. D. An Open Conformation ofMammalian Cytochrome P450 2B4 at 1.6- AngstromResolution. Proc. Natl. Acad. Sci. U.S.A. 2003, 100, 13196–13201.
28 Poulos, T. L.; Johnson, E. F. In Cytochrome P450: Structure, Mechanism, andBiochemistry; de Montellano, O., Ed.; Plenum Press: New York, 2005; Vol. 3; pp 87�114.
29 Ekroos, M.; Sj€ogren, T. Structural Basis for Ligand Promiscuity in Cytochrome P450 3A4.Proc. Natl. Acad. Sci. U.S.A. 2006, 103, 13682–13687.
30 Oliveberg, M.; Wolynes, P. G. The Experimental Survey of Protein-Folding Energy Land-scapes. Q. Rev. Biophys. 2005, 38, 245–288.
31 Ansari, A.; Beredzen, J.; Braunstein, D.; Cowen, B. R.; Frauenfelder, H.; Hong, M. K.; Iben,I. E. T.; Johnson, J. B.; Ormos, P.; Sauke, T.; Schroll, R.; Schulte, A.; Steinback, P. J.;Vittitow, J.; Young, R. D. Rebinding andRelaxation in theMyoglobin Pocket. Biophys. Chem.1987, 26, 337–355.
32 Muller, J. D.; McMahon, B. H.; Chen, E. Y. T.; Sligar, S. G.; Nienhaus, G. U. Connectionbetween the Taxonomic Substates of Protonation of Histidines 64 and 97 in CarbonmonoxyMyoglobin. Biophys. J. 1999, 77, 1036–1051.
33 Li, T. S.; Quillin, M. L.; Phillips, G. N., Jr.; Olson, J. S. Structural Determinants of theStretching Frequency of CO Bound to Myoglobin. Biochemistry 1994, 33, 1433–1446.
34 Vojtechovsky, J.; Chu, K.; Berendzen, J.; Sweet, R. M.; Schlichting, I. Crystal Structures ofMyoglobin-Ligand Complexes at near Atomic Resolution. Biophys. J. 1999, 77, 2153–2174.
35 Merchant, K. A.; Noid,W. G.; Akiyama, R.; Finkelstein, I. J.; Goun, A.;McClain, B. L.; Loring,R. F.; Fayer, M. D. Myoglobin-CO Substate Structures and Dynamics: Multidimensional
1874 ’ ACCOUNTS OF CHEMICAL RESEARCH ’ 1866–1874 ’ 2012 ’ Vol. 45, No. 11
Protein Dynamics Thielges and Fayer
Vibrational Echoes and Molecular Dynamics Simulations. J. Am. Chem. Soc. 2003, 125,13804–13818.
36 Johnson, J. B.; Lamb, D. C.; Frauenfelder, H.; M€uller, J. D.; McMahon, B.; Nienhaus, G. U.;Young, R. D. Ligand Binding to Heme Proteins. 6. Interconversion of Taxonomic Substates inCarbonmonoxymyoglobin. Biophys. J. 1996, 71, 1563–1573.
37 Kim, Y. S.; Hochstrasser, R. M. Chemical Exchange 2D IR of Hydrogen-Bond Making andBreaking. Proc. Natl. Acad. Sci. U.S.A. 2005, 102, 11185–11190.
38 Zheng, J.; Kwak, K.; Xie, J.; Fayer, M. D. Ultrafast Carbon-Carbon Single Bond RotationalIsomerization in Room Temperature Solution. Science 2006, 1951–1955.
39 Teeter, M. M. Myoglobin Cavities Provide Interior Ligand Pathway. Protein Sci. 2004, 13,313–318.
40 Tilton, R. F., Jr.; Kuntz, I. D., Jr.; Petsko, G. A. Cavities in Proteins: Structure of aMetmyoglobin�Xenon Complex Solved to 1.9 Å. Biochemistry 1984, 23, 2849–2857.
41 Igumenova, T. I.; Frederick, K. K.; Wand, A. J. Characterization of the Fast Dynamics ofProtein Amino Acid Side Chains Using NMR Relaxation in Solution. Chem. Rev. 2006, 106,1672–1699.
42 Skopalík, J.; Anzenbacher, P.; Otyepka, M. Flexibility of Human Cytochromes P450:Molecular Dynamics Reveals Differences between Cyps 3A4, 2C9, and 2A6, WhichCorrelate with Their Substrate Preferences. J. Phys. Chem. B 2008, 112, 8165–8173.
43 Winn, P. J.; L€udemann, S. K.; Gauges, R.; Lounnas, V.; Wade, R. C. Comparison of theDynamics of Substrate Access Channels in Three Cytochrome P450s Reveals DifferentOpening Mechanisms and a Novel Functional Role for a Buried Arginine. Proc. Natl. Acad.Sci. U.S.A. 2002, 99, 5361–5366.
44 Wade, R. C.; Motiejunas, D.; Schleinkofer, K.; Sudarko; Winn, P. J.; Banerjee, A.; Kariakin,A.; Jung, C. Multiple Molecular Recognition Mechanisms. Cytochrome P450-- a CaseStudy. Biochim. Biophys. Acta 2005, 1754, 239–244.
45 Guengerich, F. P. Cytochrome P450 and Chemical Toxicology. Chem. Res. Toxicol. 2008,21, 70–83.
46 Schuler, M. A.; Sligar, S. G. In The Ubiquitous Roles of the Cytochromes: Metal Ions in LifeSciences; Sigel, A., Sigel, H., Sigel, R. K. O., Eds.; John Wiley & Sons, Ltd.: West Sussex,2007; Vol. 3; pp 1�26.
47 Schlichting, I.; Berendzen, J.; Chu, K.; Stock, A. M.; Maves, S. A.; Benson, D. E.; Sweet,B. M.; Ringe, D.; Petsko, G. A.; Sligar, S. G. The Catalytic Pathway of Cytochrome P450camat Atomic Resolution. Science 2000, 287, 1615–1622.
48 Williams, P. A.; Cosme, J.; Vinkovic, D.M.;Ward, A.; Angove, H. C.; Day, P. J.; Vonrhein, C.;Tickle, I. J.; Jhoti, H. Crystal Structures of Human Cytochrome P450 3A4 Bound toMetyrapone and Progesterone. Science 2004, 305, 683–686.
49 Sakurai, K.; Shimada, H.; Hayashi, T.; Tsukihara, T. Substrate Binding Induces StructuralChanges in Cytochrome P450cam. Acta Crystallogr. 2009, F65, 80–83.
50 Harris, D.; Loew, G. Prediction of Regiospecific Hydroxylation of Camphor Analogs byCytochrome-P450cam J. Am. Chem. Soc. 1995, 117, 2738–2746.
51 White, R. E.; Mccarthy, M. B.; Egeberg, K. D.; Sligar, S. G. Regioselectivity in theCytochromes-P-450 - Control by Protein Constraints and by Chemical Reactivities. Arch.Biochem. Biophys. 1984, 228, 493–502.
52 Atkins, W. M.; Sligar, S. G. The Roles of Active-Site Hydrogen-Bonding in CytochromeP-450cam as Revealed by Site-Directed Mutagenesis. J. Biol. Chem. 1988, 263, 18842–18849.
53 Loida, P. J.; Sligar, S. G.; Paulsen, M. D.; Arnold, G. E.; Ornstein, R. L. StereoselectiveHydroxylation of Norcamphor by Cytochrome-P450cam - Experimental-Verification ofMolecular-Dynamics Simulations. J. Biol. Chem. 1995, 270, 5326–5330.
54 Collins, J. R.; Loew, G. H. Theoretical-Study of the Product Specificity in the Hydroxylation ofCamphor, Norcamphor, 5,5-Difluorocamphor, and Pericyclocamphanone by Cytochrome-P-450cam. J. Biol. Chem. 1988, 263, 3164–3170.
55 Kwak, K.; Park, S.; Finkelstein, I. J.; Fayer, M. D. Frequency-Frequency CorrelationFunctions and Apodization in Two-Dimensional Infrared Vibrational Echo Spectroscopy: ANew Approach. J. Chem. Phys. 2007, 127, No. 124503.
56 Kwak, K.; Rosenfeld, D. E.; Fayer, M. D. Taking Apart the Two-Dimensional InfraredVibrational Echo Spectra: More Information and Elimination of Distortions. J. Chem. Phys.2008, 128, No. 204505.
57 Massari, A. M.; Finkelstein, I. J.; McClain, B. L.; Goj, A.; Wen, X.; Bren, K. L.; Loring, R. F.;Fayer, M. D. The Influence of Aqueous Versus Glassy Solvents on Protein Dynamics:Vibrational Echo Experiments and Molecular Dynamics Simulations. J. Am. Chem. Soc.2005, 127, 14279–14289.
58 Eyring, H. The Activated Complex in Chemical Reactions. J. Chem. Phys. 1935, 3, 107–115.
59 Fang, C.; Bauman, J. D.; Das, K.; Remorino, A.; Arnold, E.; Hochstrasser, R. M. Two-Dimensional Infrared Spectra Reveal Relaxation of the Nonnucleoside Inhibitor TMC278Complexed with HIV-1 Reverse Transcriptase. Proc. Natl. Acad. Sci. U.S.A. 2008, 105,1472–1477.
60 Lim, M.; Hamm, P.; Hochstrasser, R. M. Protein Fluctuations Are Sensed by StimulatedInfrared Echoes of the Vibrations of Carbon Monoxide and Azide Probes. Proc. Natl. Acad.Sci. U.S.A. 1998, 95, 15315–15320.
61 Chin, J. K.; Jimenez, R.; Romesberg, F. E. Direct Observation of Protein Vibrations bySelective Incorporation of Spectroscopically Observable Carbon�Deuterium Bonds inCytochrome C. J. Am. Chem. Soc. 2001, 123, 2426–2427.