proteome discoverer 1.3 software: enhanced tools for...
TRANSCRIPT

Proteome Discoverer 1.3 Software: Enhanced Tools For Protein IdentificationDavid HornProteomics Software Strategic Marketing ManagerSeptember 22, 2011

2
Hybrid Orbitrap Mass Spectrometers
CID
• Full flexibility of fragmentation techniques (CID, HCD, ETD)• Up to 240,000 resolving power for MS, low-ppm mass tolerance• Highest sensitivity (i.e. ion trap with SRIG: 5-10X vs. LTQ) • Top down (Intact protein analysis), Bottom up (Protein ID), PTMs (especially those requiring MSn such as glycomics/glycoproteomics ), Comprehensive Quan (SILAC, label free, targeted peptide quan with HRAM)
Orbitrap
ETD HCD
Ion trap

3
Multiple Fragmentation Methods Provide Complementary Information
Fragmentation methods
ETD CID
HCD
Complimentary sequence coverage
Benefits of multiple fragmentation methods
• High mass accuracy• High energy fragmentation• High intensity at low m/z• Diagnostic ions (immonium & reporter ions)
•Complete fragment ion coverage•Preservation of PTMs
• Robust• Most versatile

4
Multiple modes of fragmentation= x 1.5 more unique peptides
Sample: 200 ng HeLa lysate; tryptic digest; 90 min gradient.

5
HCD
Example: HCD-triggered ETD for Identification of Glycopeptides
Oxonium Ions=Product IonsHex m/z 163.06
HexNAc m/z 204.087
HexNAc fragment ions m/z 138.055m/z 186.076
Hex-HexNAc m/z 366.138
10 ppm mass accuracy
ETDETD

6
b₈⁺945.56b₇⁺
832.58
b₆⁺717.53
y₉⁺1019.60
y₁₄⁺1591.84
b₁₂²⁺-H₂O, y₁₂²⁺672.15
b₁₂⁺-H₂O, y₁₂⁺1342.74
b₁₁⁺1262.79
y₁₀⁺1134.66
y₁₄²⁺796.20
y₁₁⁺1205.67
y₁₅²⁺869.74
y₅⁺589.34
400 600 800 1000 1200 1400 1600 1800m/z
0
5
10
15
20
25
30
In
te
nsity [co
un
ts] (1
0^3
)
Extracted from: C:\Users\Iman\Desktop\Thermo Data\BSA_Disulfide\Iman_BSA_ETD_CIDms3_Top2.raw.raw #1140 RT: 19.26 ITMS, CID, z=+2, Mono m/z=925.95477 Da, MH+=1850.90227 Da, Match Tol.=1.2 Da
b₉⁺1066.55
b₇⁺852.52
b₂⁺277.34
y₉⁺1007.62
y₃⁺321.32
y₆⁺-H₂O631.55
y₅⁺-H₂O, y₅⁺-NH₃518.37
b₄²⁺249.22
[M+2H]²⁺-NH₃-H₂O677.02
y₁₀⁺1110.52
200 400 600 800 1000 1200 1400m/z
0
5
10
15
In
te
nsity [co
un
ts] (1
0^3
)
Extracted from: C:\Users\Iman\Desktop\Thermo Data\BSA_Disulfide\Iman_BSA_ETD_CIDms3_Top2.raw.raw #1141 RT: 19.28 ITMS, CID, z=+2, Mono m/z=693.81525 Da, MH+=1386.62322 Da, Match Tol.=1.2 Da
LFTFHADICTLPDTEKYICDNQDTISSK
Iman_BSA_ETD_CIDms3_Top2.raw #1139 RT: 19.25 AV: 1 NL: 1.91E5T: FTMS + p NSI d Full ms2 [email protected] [100.00-2000.00]
200 400 600 800 1000 1200 1400 1600 1800 2000m/z
0
10
20
30
40
50
60
70
80
90
100
Relat
ive A
bund
ance
926.4551
693.81521387.6244
1074.8434
519.2931634.3201
260.1372 361.1844 762.3765876.4196
1611.76531181.55031288.5836234.1451 476.2147 1489.7109
992.4557
1851.8879147.1144 1993.2537
ETD triggered Top 2 MS3 CID of disulfide-linked peptides
ETD MS2
CID MS3 CID MS3

7
Analysis of Complex Proteomics Datasets Containing Mixed MS/MS modes
• Flexibility, throughput, and sensitivity of Orbitrap and ion trap systems produce large, highly complex datasets that most database search software packages are unable to utilize effectively
• Some examples:• Data-dependent decision tree (ETD on larger peptides, CID or HCD on
smaller) to increase the number of ID’s in a run• HCD-triggered ETD for labile PTM detection (e.g. glycans)• MS3 of phosphopeptides• ETD MS/MS-triggered CID MS3 for disulfide mapping• Many different quantification experiments, including SILAC, TMT, dimethyl
labeling, spectral counting, precursor ion label-free quantification
Solution: Proteome Discoverer 1.3

8
Proteome Discoverer 1.3
• Workflow-based system for proteomics “deep sequencing”
• Key Features• Workflow editor enables highly flexible searches• Easily searches complex experiments produced by hybrid Orbitrap systems
(e.g. data dependent decision tree, HCD-triggered ETD for glycan analysis, ETD->CID MS3 disulfide mapping, etc.)
• SEQUEST and Mascot• Labeled quantification (SILAC, TMT)• Automated calculation of false discovery rate (Percolator) – New• Biological annotation node and automated upload to ProteinCenter – New• Phosphorylation site localization – New

9
Proteome Discoverer Workflow Editor
Nodes Workflow
Node Parameters

10
HCD-triggered ETD of O-GlcNAc Proteins
• Proteome Discoverer: 5 different database searches (3 SEQUEST, 2 Mascot), ETD-specific peak processing, Percolator post-processing
Input Data Files: 1) HCD,2) HCD + ETD, 3) ETD only
ETD HCD
10 ppm precursor, 20 mmu fragment
Removal of reduced species
and neutral losses
2+ precursors 3+ and higher
Percolator Rescoring (New in 1.3)10 ppm precursor, 1.2 Da fragment

11
Workflow for ETD-triggered CID MS3
CID MS3 ETD MS2
Removal of charge reduced species
Search with c, y, z ions
Assign confidence
Assign confidence
search with b, y ions
MSn-1 precursor mass

12
HCD-triggered ETD of O-GlcNAc Proteins
• Proteome Discoverer Results:

13
Expression Profiling with Proteome Discoverer
Reporter Ion Quantification (iTRAQ, TMT)
Precursor Ion Quantification (SILAC, 18O, Dimethyl)
Expression ratios and variabilities for proteins and peptides:

14
Precursor Quan: Quan Result Display
15
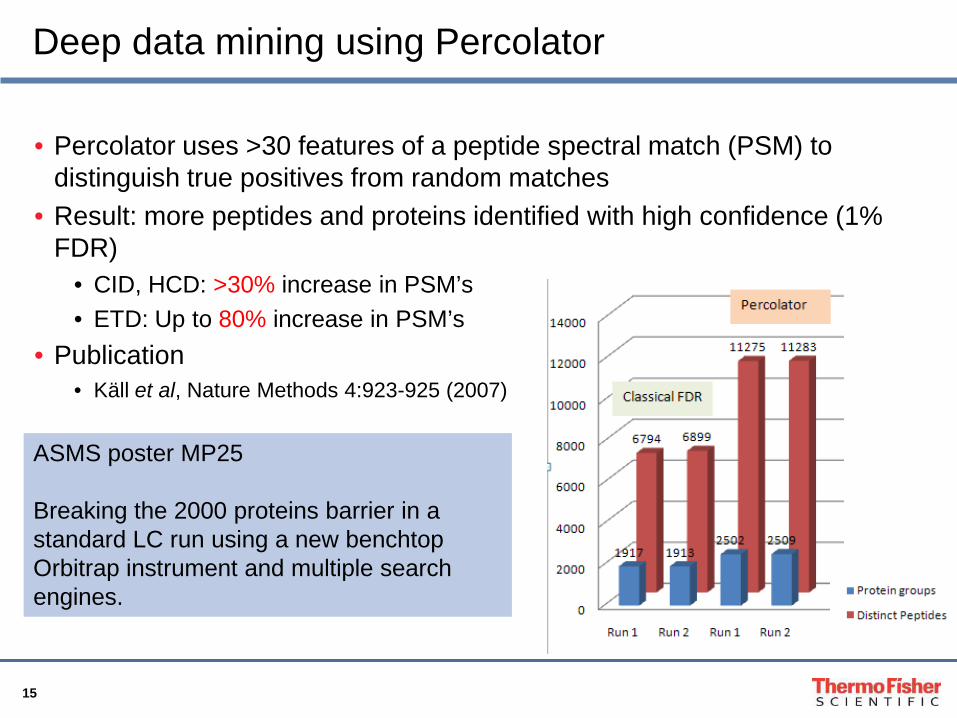
Deep data mining using Percolator
• Percolator uses >30 features of a peptide spectral match (PSM) to distinguish true positives from random matches
• Result: more peptides and proteins identified with high confidence (1% FDR)
• CID, HCD: >30% increase in PSM’s• ETD: Up to 80% increase in PSM’s
• Publication• Käll et al, Nature Methods 4:923-925 (2007)
ASMS poster MP25
Breaking the 2000 proteins barrier in a standard LC run using a new benchtopOrbitrap instrument and multiple search engines.

16
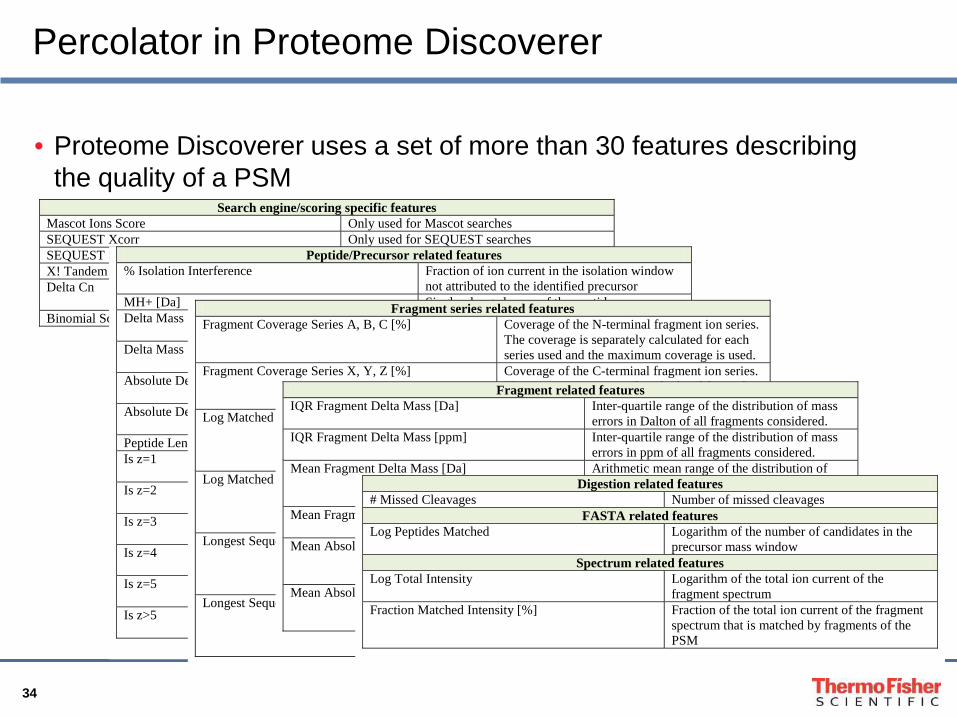
Percolator in Proteome Discoverer
q-values and PEPs for peptide groups
q-values and PEPs for PSMs

17
phosphoRS node in Proteome Discoverer
• Developed in conjunction with Karl Mechtler’s group at University of Vienna for determination of phosphorylation site confidence

18
phosphoRS in Proteome Discoverer
pRS scores for peptide groups
pRS scores for PSMs

19
Visualization of Found and Known PTMs
• The Protein ID Details view now presents a comprehensive overview of all modifications found in the MS/MS data of each protein
double click a protein of interest
Found and documented PTM are annotated on the protein sequence
Site probabilities are color coded
Toggle between PTMs only and all mods

20
Visualization of Identified PTMs
• Find detailed information about the found PTMs in the Modification List

21
• 3 year support subscription includes annotation node:• Automatically queries hosted ProteinCenter server in Denmark for GO,
protein family (Pfam), PTM, and ProteinCard annotations• All can be filtered• Displayed in the PD Viewer
• Previous results can be annotated or re-annotated
Providing biological context using the Annotation node
ASMS Poster ThP22 401“Integration of a central protein repository into a standard data processing application for mining proteomics data”
Molecular Function Cellular Component Biological Process

22
ProteinCard for Identified Proteins
• ProteinCard can be displayed for every identified protein whose accession is tracked in ProteinCenter
double click a protein of
interest

23
Filtering identified proteins using GO and PfamAnnotations
enable the Row Filters from the right-click context menu
select GO slim terms as filter from the Row Filter dropdown

24
Annotated PTM’s from UniProt
Known phosphorylation sites from UniProt annotated in protein
sequence

25
Conclusions
• Proteome Discoverer 1.3 has the most comprehensive set of tools for analysis of proteomics data from Thermo mass spectrometers
• The new nodes developed in collaboration with 3rd parties demonstrate the flexibility of the Proteome Discoverer node-based workflow engine and hint at the expansion in the number of tools available for our customers
• Integration with ProteinCenter annotation adds biological inference to SEQUEST and Mascot search results
Supplementary Slides

27
Intact protein analysis example: Yeast Enolase (48 kDa)
993.0 993.5 994.0 994.5 995.0m/z
0
20
40
60
80
100
0
20
40
60
80
100
Rel
ativ
e A
bund
ance
993.9770R=110221
994.1036R=108475
993.8706R=107582
994.1885R=109018993.6367
R=108853993.0619R=109083 994.4433
R=105946993.4244R=99350 994.7200
R=109283994.9536R=98949
994.0309R=44604
993.9030R=42104
994.1802R=42804
994.4540R=52804
993.5618R=47304
993.7112R=35704
994.6257R=37604
993.1357R=42304 994.8610
R=32404
Orbitrap Elite
LTQ Orbitrap Velos
Yeast Enolase, 48+ is baseline resolved on Orbitrap Elite
At 48+ charge state, the mass difference between isotopic peaks is
only 0.021 Th!
Improving protein analysis in Orbitrap mass spectrometry Eugen Damoc; Eduard Denisov; Oliver Lange; Thomas Moehring; Alexander Makarov. ASMS 2011, MP560Resolution 240000@400

28
Percolator
• The Percolator algorithm (http://per-colator.com) uses a set of features related to the quality of the peptide-spectrum matches (PSMs) with a semi-supervised method to train a machine learning algorithm called a support vector machine (SVM) to discriminate between correct and incorrect matches
• Does not require any expert-driven or subjective decisions, thereby eliminating any artificial biases
• The learnt classifier is specifically adapted and unique for each data set, thus, adapting to variations in data quality, protocols and instrumentation
• Percolator improves the sensitivity of existing database search algorithms at a constant false discovery rate
• Furthermore, Percolator assigns a statistically meaningful q-value to each PSM, as well as the probability of the individual PSM being incorrect
L. Käll, et al. Semi-supervised learning for peptide identification from shotgun proteomics datasets. Nat Methods, 2007, 4, 923-925

29
Percolator

30
q-values and Posterior Error Probabilities
q-value• the minimal FDR at which the identification is deemed correct• Although associated with a single PSM, the q-value depends upon the data set
in which the PSM occurs• A q-value of 0.01 for peptide EAMRQPK matching spectrum s means that, if we
try all possible FDR thresholds, then 1% is the minimal FDR at which this PSM will appear in the output list
Posterior Error Probability (PEP)• quite simply, the probability that the observed PSM is incorrect. • The PEP can be thought of as a local version of the FDR ( “local FDR”).
Whereas the FDR measures the error rate associated with a collection of PSMs, the PEP measures the probability of error for a single PSM.
• if the PEP of PSM (EAMRPK,s) is 5%, there is a 95% chance that peptide EAMRPK was in the spectrometer when the spectrum s was generated

31
q-values and Posterior Error Probabilities
L. Käll, et al., Posterior error probabilities and false discovery rates: two sides of the same coin., J Proteome Res, 2008, 7, 40-44

32
q-value or PEP: Which one is better?
PEPs and q-values are complementary, and are useful in different situations:• If you are interested in determining which proteins are expressed in a certain cell type
under a certain set of conditions, or if your follow-up analysis will involve looking at groups of PSMs, for example, considering all proteins in a known pathway, evaluating enrichment with respect to GO categories, or performing experimental validation on a group of proteins, then the q-value is an appropriate measure.
• If the goal of your experiment instead is to determine the presence of a specific peptide or protein, then the PEP is more relevant. For example, imagine that you are interested in determining whether a certain protein is expressed in a certain cell type under a certain set of conditions. In this scenario you should examine the PEPs of your detected PSMs. Likewise, imagine that you have identified a large set of PSMs using a q-value threshold, and among them, you identify a single PSM that is intriguing. Before deciding to dedicate significant resources to investigating a single result, you should examine the PEP associated with that PSM. This is because, although the q-value associated with that PSM may be 0.01, the PEP is always greater than or equal to 0.01. In practice, the PEP values for PSMs near the q = 0.01 threshold are likely to be much larger than 1%.
L. Käll, et al., Posterior error probabilities and false discovery rates: two sides of the same coin., J Proteome Res, 2008, 7, 40-44

33
Percolator in Proteome Discoverer
• Available as a new node under “Peptide Validation”
Note: Percolator needs a sufficient number of PSMs from the target and the decoy search. If less than 200 target or decoy PSMs were identified, the percolation is rejected. The same is true if less than 20% decoy PSMs are available compared to the number of target matches.
34
Percolator in Proteome Discoverer
• Proteome Discoverer uses a set of more than 30 features describing the quality of a PSM
Search engine/scoring specific features Mascot Ions Score Only used for Mascot searches SEQUEST Xcorr Only used for SEQUEST searches SEQUEST Sp Score Only used for SEQUEST searches X! Tandem Hyperscore Only used for X!Tandem searches Delta Cn Normalized score distance to the 2nd best
scoring PSM of the spectrum Binomial Score Binomial score as described in [8]
Peptide/Precursor related features % Isolation Interference Fraction of ion current in the isolation window
not attributed to the identified precursor MH+ [Da] Singly-charged mass of the peptide Delta Mass [Da] Deviation of the measured mass from the
theoretical mass of the peptide in Dalton Delta Mass [ppm] Deviation of the measured mass from the
theoretical mass of the peptide in ppm Absolute Delta Mass [Da] Absolute deviation of the measured mass from
the theoretical mass of the peptide in Dalton Absolute Delta Mass [ppm] Absolute deviation of the measured mass from
the theoretical mass of the peptide in ppm Peptide Length Length of the peptide in residues Is z=1 Binary flag indicating whether the charge state
of the PSM is 1 Is z=2 Binary flag indicating whether the charge state
of the PSM is 2 Is z=3 Binary flag indicating whether the charge state
of the PSM is 3 Is z=4 Binary flag indicating whether the charge state
of the PSM is 4 Is z=5 Binary flag indicating whether the charge state
of the PSM is 5 Is z>5 Binary flag indicating whether the charge state
of the PSM above 5
Fragment series related features Fragment Coverage Series A, B, C [%] Coverage of the N-terminal fragment ion series.
The coverage is separately calculated for each series used and the maximum coverage is used.
Fragment Coverage Series X, Y, Z [%] Coverage of the C-terminal fragment ion series. The coverage is separately calculated for each series used and the maximum coverage is used.
Log Matched Fragment Series Intensities A, B, C Logarithm of the intensity sum of all matched N-terminal fragment ion series peaks. The intensity sum is separately calculated for each series used and the maximum coverage is used.
Log Matched Fragment Series Intensities X, Y, Z Logarithm of the intensity sum of all matched C-terminal fragment ion series peaks. The intensity sum is separately calculated for each series used and the maximum coverage is used.
Longest Sequence Series A, B, C Longest consecutive matched sequence among the N-terminal fragment ion series peaks. The sequence length is separately calculated for each series used and the maximum coverage is used.
Longest Sequence Series X, Y, Z Longest consecutive matched sequence among the C-terminal fragment ion series peaks. The sequence length is separately calculated for each series used and the maximum coverage is used.
Fragment related features IQR Fragment Delta Mass [Da] Inter-quartile range of the distribution of mass
errors in Dalton of all fragments considered. IQR Fragment Delta Mass [ppm] Inter-quartile range of the distribution of mass
errors in ppm of all fragments considered. Mean Fragment Delta Mass [Da] Arithmetic mean range of the distribution of
mass errors in Dalton of all fragments considered.
Mean Fragment Delta Mass [ppm] Arithmetic mean range of the distribution of mass errors in ppm of all fragments considered.
Mean Absolute Fragment Delta Mass [Da] Arithmetic mean range of the distribution of absolute mass errors in Dalton of all fragments considered.
Mean Absolute Fragment Delta Mass [ppm] Arithmetic mean range of the distribution of absolute mass errors in ppm of all fragments considered.
Digestion related features # Missed Cleavages Number of missed cleavages
FASTA related features Log Peptides Matched Logarithm of the number of candidates in the
precursor mass window Spectrum related features
Log Total Intensity Logarithm of the total ion current of the fragment spectrum
Fraction Matched Intensity [%] Fraction of the total ion current of the fragment spectrum that is matched by fragments of the PSM

35
Percolator in Proteome Discoverer
Define the q-value (or PEP) thresholds to devide PSMs in high, medium, and low confident hits on the Peptide Confidence tab
Define whether the confidence estimation is based on Percolator scores (default when Percolator was used) or classical FDR on score thresholds
Click “Apply Filters” after changes

36
• Developed in collaboration with Karl Mechtler’s lab at University of Vienna for phosphorylation site confidence determination
• phosphoRS Score: is it phosphorylated?• site probability Score: confidence in site localization
Confident PTM analysis Using PhosphoRS
Confident site confirmed by UniProt

37
phosphoRS
• automated calculation of individual site probabilities for each putative phospho-site
• works for all common fragmentation techniques (CID, ETD, and HCD) and all available database search engines
• validated and optimized by analysis of LC-MS/MS data of more than 150 synthetic phospho-peptides with precisely known phospho-sites
T. Taus et al., phosphoRS, a novel phospho-site localization tool, 59th ASMS 2011, WOA pm 3:30

38
phosphoRS
n: number of theoretical fragment ionskS : number of matched fragment peaksp: probability to match a fragment by chance
Probability PS,i to match kS or more peaks purely by chance:
pRS-Scores:
39
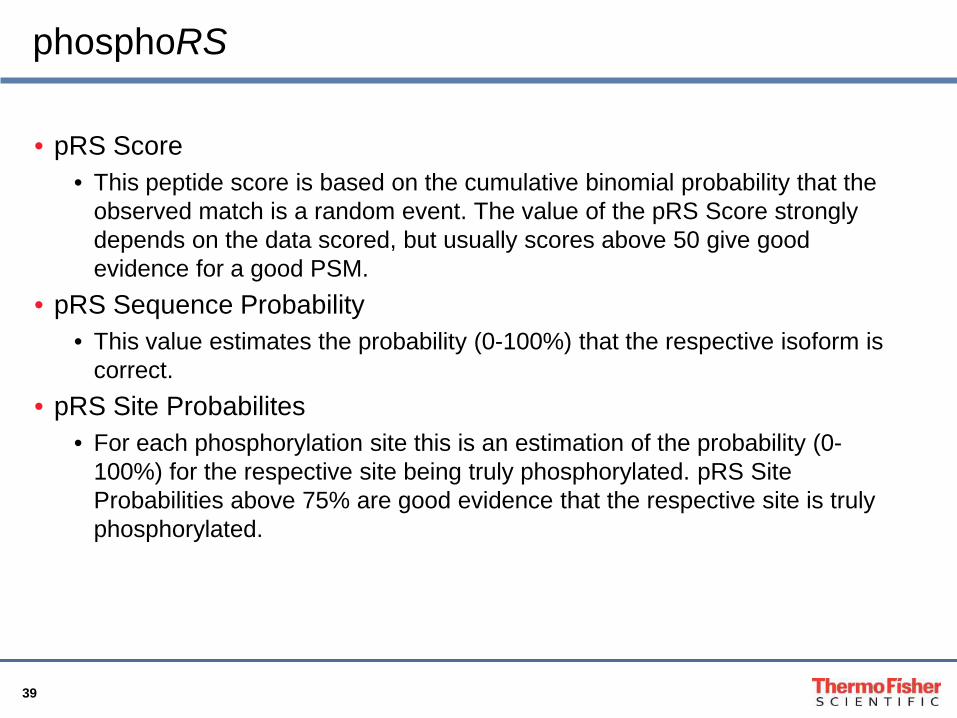
phosphoRS
• pRS Score• This peptide score is based on the cumulative binomial probability that the
observed match is a random event. The value of the pRS Score strongly depends on the data scored, but usually scores above 50 give good evidence for a good PSM.
• pRS Sequence Probability• This value estimates the probability (0-100%) that the respective isoform is
correct.• pRS Site Probabilites
• For each phosphorylation site this is an estimation of the probability (0-100%) for the respective site being truly phosphorylated. pRS Site Probabilities above 75% are good evidence that the respective site is truly phosphorylated.

40
ProteinCenter™
• Protein-centric data warehouse specifically designed for interpretation of proteomics data
• Enables the comparison of data sets searched against different databases and different versions of databases
• > 16 million protein sequences from the major public protein databases distilled from 130 million accession codes from past and present versions
• The consolidated database is updated bi-weekly
ProteinCenter™
consolidate

41
Annotate Identified Proteins Using the ProteinCenter™ Repository
• Provides concise, precise and focused annotation for a given protein• Use the Annotation node to directly retrieve protein annotations from
the web service provided by ProteinCenter• Currently the following annotations are retrieved:
• Gene Ontology (GO, http://www.geneontology.org) and GO slim annotations
• provides a widely used controlled vocabulary to describe the function, localization and process a protein is assigned to
• approx. 35000 terms is organized in dependency hierarchies. • Subsets taken on a high level of this hierarchy (termed GO slims) are
widely used to give an overview of the biological impact of a molecule• Protein family (Pfam, Welcome Trust Sanger Institure) annotations• Modifications documented in the Uniprot database

42
Use the Annotation Node in a Workflow
• The Annotation node automatically connects with every search node

43
(Re) Annotate Existing .msf Files
• Use the Re-Annotation node to annotate existing result files that do not yet contain annotations or update existing annotations
• Can be automated with the Discoverer Daemon
1. use the provided Re-Annotation workflow template
3. select the .msf files to annotate
4. Start processing
2. provide a folder name on the server

44
Automatic Transfer of Results from Proteome Discoverer to ProteinCenter™
• You need a user account on a ProteinCenter™ server• Configure your account settings under Tools > Options > ProteinCenter
• Export all or selected proteins with Tools > Export to ProteinCenter