proteomics in nutritional research - pdfs.semanticscholar.org · som hæm-transport og katabolisme,...
TRANSCRIPT
Proteomics in Nutritional ResearchA 2-DE based study of diet induced changesin the human plasma proteome
Maria RentschPhD Thesis2011
Proteomics in Nutritional ResearchA 2-DE based study of diet induced changes
in the human plasma proteome
PhD Thesis
by
Maria L. Rentsch
Division of Industrial Food ResearchNational Food Institute
Technical University of DenmarkJune 2011

CONTENTS I
Contents
Contents I
List of figures III
Preface IV
Acknowledgements V
Enclosed Papers VI
Summary VII
Resume IX
Abbreviations XI
1 Introduction 1
2 Part I: Beneficial health effects of fish intake 32.1 Fish and health . . . . . . . . . . . . . . . . . . . . . . . . . . . 32.2 Polyunsaturated fatty acids metabolism and dietary sources . . . . 32.3 Dietary ratio of n-6/n-3 PUFA . . . . . . . . . . . . . . . . . . . 42.4 N-3 LCPUFA and cardiovascular disease . . . . . . . . . . . . . . 62.5 Fish protein . . . . . . . . . . . . . . . . . . . . . . . . . . . . . 82.6 Fish farming and sustainability . . . . . . . . . . . . . . . . . . . 8
3 Part II: Proteomics 103.1 Biomarkers and blood proteomics . . . . . . . . . . . . . . . . . 103.2 History of proteomics . . . . . . . . . . . . . . . . . . . . . . . . 113.3 Sample preparation of human plasma for 2-DE . . . . . . . . . . 123.4 First dimensional electrophoresis . . . . . . . . . . . . . . . . . . 153.5 Second dimensional electrophoresis . . . . . . . . . . . . . . . . 163.6 Visualisation of proteins . . . . . . . . . . . . . . . . . . . . . . 173.7 Image analysis . . . . . . . . . . . . . . . . . . . . . . . . . . . 183.8 Data analysis . . . . . . . . . . . . . . . . . . . . . . . . . . . . 193.9 Mass spectrometry based identification of proteins of interest . . . 203.10 Experimental design and biological variability . . . . . . . . . . . 24
4 Aim of the study 26
5 Overview of experimental design 265.1 Single meal study . . . . . . . . . . . . . . . . . . . . . . . . . . 265.2 Human intervention trial . . . . . . . . . . . . . . . . . . . . . . 28

II CONTENTS
6 Main results and discussion 296.1 Preparation of human plasma samples . . . . . . . . . . . . . . . 296.2 Depletion of high abundant proteins . . . . . . . . . . . . . . . . 306.3 Visualisation of spots . . . . . . . . . . . . . . . . . . . . . . . . 316.4 Technical variation and the significance of the IgY-12 fractionation
on the proteomic data . . . . . . . . . . . . . . . . . . . . . . . . 326.5 Acute postprandial effects of trout and poultry . . . . . . . . . . . 356.6 Long-term effects of trout fed a marine or a vegetable based feed . 386.7 Inter-individual variation . . . . . . . . . . . . . . . . . . . . . . 39
7 Conclusions 42
8 Future perspectives 44
9 2-DE based plasma proteomics:Lessons learned 45
References 47
Appendix 61

LIST OF FIGURES III
List of figures
1 Biochemical pathways for the metabolism of n-3 and n-6PUFA . . . . . . . . . . . . . . . . . . . . . . . . . . . . . . . . 5
2 Flow diagram of the sample preparation procedure of plasmafor 2-DE analysis . . . . . . . . . . . . . . . . . . . . . . . . . 14
3 2-DE based plasma protein profiling of human plasma be-fore and after IgY-12 treatment . . . . . . . . . . . . . . . . 15
4 Visualisation of proteins . . . . . . . . . . . . . . . . . . . . . 185 PCA Scores plot of 2-DE separated human plasma proteins
derived from the single meal study . . . . . . . . . . . . . . 216 Mass spectrometry based identification of proteins . . . . . 237 Experimental design and methods conducted in the single
meal study . . . . . . . . . . . . . . . . . . . . . . . . . . . . . 278 Time line of single meal study . . . . . . . . . . . . . . . . . 279 Experimental design and methods conducted in the human
intervention study . . . . . . . . . . . . . . . . . . . . . . . . 2810 Representative 2-DE gel from the replicate study . . . . . 3311 The postprandial response of trout and poultry compared
to baseline variations of the non-significant spot 818 insubject 1-5 . . . . . . . . . . . . . . . . . . . . . . . . . . . . . 37
12 The postprandial response of ficolin-3 isoforms . . . . . . . 3813 Overview of conclusions . . . . . . . . . . . . . . . . . . . . . 43

IV
Preface
This PhD study was initiated in January 2007 and is based on human blood plasmafrom a single meal study and an intervention study conducted at the Departmentof Human Nutrition, Faculty of Life Sciences, University of Copenhagen (KU).The experimental work was carried out at the National Food Institute, TechnicalUniversity of Denmark (DTU) and at the Department of Biochemistry and Biology,Southern University of Denmark (SDU).
During my three years as PhD student, my main workplace has been DTU inLyngby, where I learned a lot about sample preparation, how to run two dimen-sional electrophoresis, data processing and statistical analyses. I also spent half ayear at Department of Human Nutrition, KU, where I was the main co-ordinatorof the human single meal study. At this place, I gained valuable knowledge abouthow to conduct human nutritional studies including recruitment of subjects, plan-ning and performing the study. Moreover, with assistance from Rene Lametsch,Department of Food Science, Faculty of Life Sciences, University of Copenhagen,I also got insights into mass spectrometry based identification of proteins.
This thesis consists of two parts; part I describes the health beneficial effects of fishintake in relation to the association between n-3 LCPUFA and decreased risk of car-diovascular disease. Part II describes the applied proteomic methodology includ-ing sample preparation, two-dimensional electrophoresis, data analysis and massspectrometry. The present PhD project was supported by grants from the DanishAgency for Science, Technology and Innovation, and the Danish Food IndustryAgency.

V
Acknowledgements
During my time as a PhD student I have been privileged to be surrounded by highlycompetent and scientifically skilled people. First, I would like to give thanks to mytwo supervisors who helped me develop scientifically and supported me duringthese three years of research. Flemming Jessen, for his great expertise within 2-DEproteomics, and Lotte Lauritzen for sharing her knowledge and enthusiasm aboutnutritional research and health benefits of n-3 polyunsaturated fatty acids. Warmthanks also to my project manager, Henrik H. Nielsen, for always having an opendoor and to Rene Lametsch for his excellent supervision on mass spectrometry.
I am also grateful to a number of people who helped with the practical work.Thanks to BioMar A/S for raising the trout for the human trials and to JeanetteU. Møller for slaughtering and packaging the trout from the fish farm. Thanks tothe kitchen staff for preparing the meals and also to Elin Skytte who sampled bloodfrom the subjects and measured the plasma triglyceride content. A special thanksto Hanne Jacobsen, who taught me how to run 2-DE, to notice every little detailduring the experimental work with 2-DE gels and for always being positive andhelpful. Thanks to Andrea Lorentzen for her great devotion and expertise withinmass spectrometry.
Also special thanks to my colleagues at the Division of Seafood Research, DTUfor good laughs and constructive discussions. Last but absolutely not least, I amgrateful to my family and friends who are the greatest support I can imagine.

VI
Enclosed Papers
This thesis is based on the following three papers:
• Paper I: Rentsch ML, Lametsch R, Lauritzen L, Bugel SH, Jessen F. A pilotstudy of the postprandial changes in human plasma proteome profiles afterintake of mixed meals (Prepared for submission to British Journal of Nutri-tion)
• Paper II: Rentsch ML, Lametsch R, Lauritzen L, Bugel SH, Jessen F. Con-sumption of farmed trout affects the human plasma proteome profiles inhealthy men (Manuscript)
• Paper III: Rentsch, ML, Jessen, F. Proteomic analysis of inter-individualvariability of protein patterns in plasma from healthy subjects (Manuscript)

VII
Summary
Substantial evidence indicates an association between diet and incidence of chronicdiseases. Thus, the development of biomarkers of predicting outcome for foodbased studies is essential given insights into the metabolic and cellular responseinduced by nutrients. Moreover, these biomarkers will provide knowledge on theearly diet induced changes of proteins that precede health benefits or the onset ofdisease. However, the link between diet and disease is complex and difficult tounravel.
The main methodology used in the present PhD study was proteome analysis (two-dimensional gel electrophoresis), which is the study of the protein composition inan organism at a given time. Proteome analysis of human blood plasma offers astrong approach to increase the knowledge of the early dynamic changes in pro-teins induced by dietary components. Furthermore, plasma proteins are a circula-ting representation of body tissue thus reflecting the overall metabolic state of anindividual.
Based on a single meal study and an intervention study in healthy subjects, the aimwas to investigate acute and long-term effects of meal intake on the plasma pro-teome profiling. We further aimed to examine the influence on consumers healthof replacing a marine based feed with one of vegetable origin for farmed trout. Wealso assesed the largest variance component in the 2-DE data set from the singlemeal study including different experimental parameters.
The results showed that single meal intake of trout compared to poultry elicitedpostprandial responses in proteins linked to the biological processes lipid transport,coagulation and complement cascade, acute phase response as well as cofactorand vitamin metabolism. No differences were seen in the postprandial triacyl-glycerol response after intake of trout compared to poultry. A daily meal of farmedtrout fed either on pure marine diet or pure vegetable diet, or a reference mealof chicken for eight weeks induced changes in abundance of proteins implicatedin the various biological processes haeme transport and catabolism, regulation ofvasoconstriction, blood haemostasis, complement cascade, antioxidative defence,cellular component movement, glycolysis and vitamin transport. However, onlya single protein identified as complement c1r differed significantly in the marinefed trout compared to the vegetable fed trout. The individual variation representedthe largest variance component exceeding experimental parameters as fasting orpostprandial sampling, meal type (poultry, marine fed trout and vegetable fed trout)and time (weeks).
This thesis demonstrated that 2-DE based proteomics is a powerful tool to detectmeal induced changes in plasma proteins. The individual variation is a significantfactor for comparative proteomic studies and needs to be taken into account in theexperimental design of human studies and interpretation of data. Furthermore, we

VIII
have demonstrated that cross-over studies using an individual as its own control andmeasure analyte variations over time is an important experimental design for study-ing human plasma proteins due to large biological variation between individuals.

IX
Resume
Proteomteknologi i ernæringsforskning − et 2-DE baseret studie af kostindu-cerede ændringer i plasmaproteiner hos mennesker
Der er belæg for, at der er en sammenhæng mellem kost og forekomst af kro-niske sygdomme. Udvikling af biomarkører til at forudsige effekter i forbindelsemed ernæringsstudier er derfor af væsentlig betydning, idet der herved opnas enforstaelse for de metaboliske og cellulære respons, som induceres af næringsstof-fer. Desuden vil disse biomarkører give en indsigt i de tidlige kostinducerede pro-teinændringer, som gar forud for sundhedsgavnlige effekter eller sygdomsfrem-brud. Sammenhængen mellem kost og sygdom er dog kompliceret og vanskelig atforklare.
Den anvendte metode i dette PhD studie er primært proteomanalyse (todimensionelgelelektroforese), som er studiet af ændringer og mønstre i proteinekspression ien organisme pa et givent tidspunkt. Proteomanalyse baseret pa blodplasma framennesker er en velegnet metode til at øge kendskabet til de tidlige dynamiskekostinducerede ændringer, da cirkulerende plasmaproteiner repræsenterer vævet iet individ og dermed afspejler den generelle metaboliske tilstand.
Formalet med dette studie var at undersøge akutte og langtidseffekter pa proteom-profilen i plasma efter indtagelse af maltider pa baggrund af et enkelt maltidsstudiesamt et interventionsstudie med raske forsøgspersoner. Desuden undersøgte vibetydningen af at erstatte marint baseret ørredfoder med vegetabilsk i forhold tilforbrugernes sundhed. Derudover vurderede vi hvilke eksperimentelle parametresom bidrog til den største variation i et 2-DE datasæt fra enkelt-maltidsstudiet.
Resultaterne viste, at indtagelse af et enkelt maltid af ørred i forhold til fjerkræudløste forskellige postprandielle respons i proteiner, som er involverede i følgendebiologiske processer som lipid transport, koagulation- og komplement-kaskade,akut fase respons samt cofaktor og vitamin metabolisme. Der blev ikke detek-teret forskel i det postprandielle triglycerid respons efter indtagelse af ørred sam-menlignet med fjerkræ. Et dagligt maltid bestaende af enten marint fodret ørred,vegetabilsk fodret ørred eller fjerkræ (reference) gennem otte uger inducerede æn-dringer i forekomsten af proteiner involveret i forskellige biologiske processer sasom hæm-transport og katabolisme, regulering af vasokonstriktion, blod homeosta-sis, komplement kaskade, antioxidativt forsvar, bevægelse af cellulære komponen-ter, glykolyse og vitamin transport. Der var dog kun et enkelt protein, komple-ment c1r, som ændrede sig signifikant efter indtagelse af den marint fodrede ørredsammenlignet med den vegetabilske. Individ-forskelle bidrog til den største varia-tion og overgik eksperimentelle parametre som faste eller postprandielle prøver,maltidstype (fjerkræ, marint fodret ørred og vegetabilsk fodret ørred) og tid (uger).
Denne tese viste, at 2-DE baseret proteom-teknologi er et vigtig redskab til at de-tektere maltids-inducerede ændringer i plasma proteiner. Individ-forskelle er af

X
stor betydning for proteomstudier og bør derfor tages i betragtning i forbindelsemed eksperimentelt design af humane studier og fortolkning af data. Vi har end-videre vist, at anvendelse af overkrydsningsstudier, hvor hver forsøgsperson er sinegen kontrol, er et vigtigt eksperimentelt design i studiet af plasma proteomet pga.store biologiske forskelle mellem individer.

XI
List of abbreviations
2-DE Two-dimensional electrophoresis
ALA Alpha linolenic acid
ANOVA Analysis of variance
CA Carrier ampholyte
CHD Coronary heart disease
CVD Cardiovascular heart disease
DIGE Difference gel electrophoresis
DTT Dithiotreitol
FDR False discovery rate
IPG Immobilised pH gradient
LA Linoleic acid
MALDI-TOF Matrix Assisted Laser Desorption/Ionization Time-of-Flight
MS Mass spectrometry
n-3 LCPUFA n-3 long-chain polyunsaturated fatty acids
PCA Principal component analysis
pI Isoelectric point
PLSR Principal least squares regression
PUFA Polyunsaturated fatty acids
RCT Randomised controlled trials
SDS-PAGE Sodium dodecyl sulfate-polyacrylamide gel electrophoresis
TAG Triacylglycerol
VLDL Very low density lipoprotein

1 Introduction 1
1 Introduction
During the last decades, a considerable effort has been made in discovering, quanti-fying and validating biomarkers. However, new and better biomarkers are urgentlyneeded to improve health and disease diagnosis in the general population. Thedevelopment of early, sensitive and accurate biomarkers for predicting outcomeof food based studies is becoming more and more important given substantial evi-dence indicating an association between diet and incidence of chronic diseases [Huand Willett 2002; Van et al., 2008]. Yet, the link between diet and chronic diseaseis complex and difficult to unravel [de Roos B. 2009].
The main methodology used in the present PhD study is proteome analysis basedon two-dimensional gel electrophoresis. This technique is powerful for the highresolution separation of proteins in a complex mixture, thus providing a snapshotof the protein composition in an organism at a given time. From the complex pro-tein pattern it is possible to extract information of proteins, the key actors in vir-tually all biological processes in the human body, changing in response to variousbiological stimuli and responses such as diet or disease [de Roos B. and McAr-dle 2008]. In this way, it is possible to increase the understanding of the dynamicchanges in proteins induced by dietary components, which may serve as candidatebiomarkers of health and thereby reveal early indications of disease risk [de RoosB. and McArdle 2008; de Roos 2008]. However, the use of proteome studies innutritional science is still in its youth, but new investigations using this approachwill improve our molecular understanding of dietary induced health effects in hu-mans and provide knowledge on the complex mechanisms of action [Kussmannand Affolter 2009].
Human blood plasma represents an attractive and promising source for biomarkerdiscovery since it is easily accessible and is a circulating representation of all bodytissue reflecting the overall metabolic state of an individual [Anderson and An-derson 2002; Jacobs et al., 2005; Nedelkov et al., 2005]. Despite its clinical im-portance and huge amounts of investigations, major challenges exist for plasmaproteomic based biomarker discovery due to the huge dynamic range of plasmaproteins comprising more than 10 orders of magnitude [Anderson and Anderson2002; Jacobs et al., 2005]. Furthermore, the human biological variability is a ma-jor obstacle in clinical studies because it may mask the discovery of candidatebiomarkers and influence the proteins in a way that might enhance or degrade itsperformance as biomarkers.
In Denmark, farmed fish contributes increasingly to the overall fish consumptionand the rainbow trout (Oncorhynchus mykiss), is a significant specie due to a highannual production. Regular fish consumption and fish oil supplementation are as-sociated with human health benefits, particular with regard to decreased risk ofcardiovascular disease (CVD) [Kris-Etherton et al., 2002]. These beneficial ef-fects have been ascribed to the high content of the n-3 long chain polyunsaturated

2
fatty acids (n-3 LCPUFAs), eicosapentaenoic acid (EPA) and docosahexaenoicacid (DHA) in fish [Breslow 2006; Bucher et al., 2002; Kris-Etherton et al., 2002;Wang et al., 2006a]. A further understanding of the underlying mechanisms of thebeneficial effects of fish intake will thus play a significant role for human healthdue to the detection of early metabolic changes that precede the onset of CVD.

2 Part I: Beneficial health effects of fish intake 3
2 Part I: Beneficial health effects of fish intake
2.1 Fish and health
Fish is considered one of the main components of a healthy diet. In Denmark,official dietary guidelines concerning fish are expressed in one of the Eight DietaryAdvices from the Ministry of Food, Agriculture and Fisheries. The Danish publicis recommended to consume 200-300 grams of fish pr. week based on an evaluationof the positive nutritional aspects relative to the potential toxic aspects. However, amajor cause of concern is the fact that fish is consumed in relatively small amountsin western diets [Simopoulos 2006] including Denmark, in which fish consumptionis lower than recommended [Pedersen et al., 2010].
The interest and understanding of the health effects of fish and fish oil originatefrom studies in populations consuming diets rich in n-3 polyunsaturated fatty acids(n-3 LCPUFA). In the 1970s, Danish researchers reported beneficial lipid profilesand a greatly lower incidence of CVD in coastal Greenlandic Eskimos consuminga high fat diet rich in n-3 LCPUFA from fish and marine mammals as part of theirnative lifestyle, compared to an equivalent Danish population [Bang and Dyerberg1972; Kromann and Green 1980]. Similar effects of fish consumption were seen inthe Japanese population. The high fish intake in Japan, compared to Japanese menliving in Hawaii and California, was associated with a very low rate of myocardialinfarction and death from coronary heart disease (CHD). The incidence in Japanwas half that observed in Hawaii, and the highest rate was reported in Japanesepeople living in California [Robertson et al., 1977]. These initial studies raisedconsiderable interest and led to the subsequent research interest on the role of n-3LCPUFA in preventing and treating diseases, particular CVD, which is the leadingcourse of morbidity and mortality worldwide [Torrejon et al., 2007].
2.2 Polyunsaturated fatty acids metabolism and dietary sources
The n-3 and n-6 fatty acids are two families of polyunsaturated fatty acids (PUFA).Alpha linolenic acid (ALA) and linoleic acid (LA), the precursors of n-3 and n-6fatty acids respectively, cannot be de novo synthesised or inter-converted in thehuman body and is termed nutritionally essential fatty acids. A sufficient intakefrom food or other sources is essential for humans. In the body, ALA and LAare converted and elongated to longer chained unsaturated fatty acid derivates (seeFigure 1) and the intermediates can either be incorporated into phospholipids orbecome substrates for further elongation and desaturation processes [Russo 2009].ALA is mainly derived from plants e.g. linseed and canola oil and major dietarysources of LA are maize, sunflowerseed, safflowerseed and rapeseed oil, which areused in many processed food products such as bread, cakes, biscuits and crisps[Russo 2009; Schmitz and Ecker 2008].

4
ALA can be converted in the liver to n-3 LCPUFA including the bioactive eico-sapentaenoic acid (EPA) and docosahexaenoic acid (DHA) [Russo 2009]. Accor-ding to a recent review [Burdge and Calder 2005], chronically increased ALA con-sumption raised the EPA concentration but an insufficient conversion to DHA inplasma and cell pools was seen. Overall, ALA appears to be a limited source ofn-3 LCPUFA [Burdge and Calder 2005]. Fish, especially oily fish such as mack-erel, sardine, herring, salmon and trout, is a rich source of EPA and DHA. Oneshould note, that the content of these fatty acids also can vary considerable withinspecies dependent on season, fishing area as well as age and gender [Calder 2004;Racine and Deckelbaum 2007]. EPA and DHA are incorporated into phospho-lipids in most cell membranes in varying proportions and are released by phos-pholipases. They are essential for many body functions in man such as growthand reproduction [Lauritzen et al., 2001; Wathes et al., 2007]. Moreover, theyplay a significant role in health status and can act via multiple pathways affectingcell membrane function, eicosanoid metabolism and gene expression [Arab 2003;Racine and Deckelbaum 2007]. EPA can be metabolised to eicosanoids of theprostaglandin-3, thromboxane-3 and leukotrine-5 series [Schmitz and Ecker 2008].The longer chained n-6 fatty acid arachidonic acid (AA) is derived from eggs, lardand meat [Arab 2003; Russo 2009] and is the main precursor in eicosanoid synthe-sis resulting in prostaglandin-2, thromboxane-2 and leukotrine-4 series. The dif-ference between n-3 and n-6 PUFA derived eicosanoids is that mediators derivedfrom EPA and DHA exert most anti-inflammatory effects whereas those derivedfrom AA show mostly pro-inflammatory effects [Arab 2003; Schmitz and Ecker2008].
The mechanisms whereby n-3 PUFA directly affects gene expression in differenttissue are complex and involve multiple processes, and the mechanisms remainunclear [Deckelbaum et al., 2006; Sampath and Ntambi 2004]. N-3 PUFA hasbeen shown to modulate gene expression by regulating different transcription fac-tors such as sterol-regulatory element binding protein (SREBP) and peroxisomeproliferator-activated receptor (PPAR). Both transcription factors are responsiblefor regulating genes involved in lipid homeostasis; SREBP is a key regulator offatty acid, triacylglycerol and cholesterol synthesis and PPAR plays a role in lipidoxidation and thermogenesis [Price et al., 2000; Sampath and Ntambi 2004].
2.3 Dietary ratio of n-6/n-3 PUFA
Since hepatic conversion of n-3 and n-6 PUFA to longer chained fatty acids sharesthe same series of elongating and desaturating enzymes, a competition exists be-tween those two families for biochemical metabolism of fatty acids with an excessof one leading to a decrease in the conversion of the other [Schmitz and Ecker2008]. Particular, the delta-6 desaturase is the rate-limiting enzyme and ALA andLA compete for this enzyme in the synthesis of longer chained PUFA [Emken et

2.3 Dietary ratio of n-6/n-3 PUFA 5
Figure 1: Biochemical pathways for the metabolism of n-3 and n-6 PUFA.Modified from [Schmitz and Ecker 2008]. LA: linoleic acid, AA: arachidonic acid,ALA: a-linolenic acid, EPA: eicosapentaenoic acid, DHA: docosahexaenoic acid.
al., 1994]. Thus, the dietary n-3/n-6 PUFA ratio may have implications for func-tional outcomes e.g. via changes in cell membrane properties, intracellular sig-nalling, binding of n-3 LCPUFA to transcription factors or changes in bioactivecompounds [Calder 2007]. These outcomes are of importance for human health,particularly in the pathogenesis of chronic diseases such as CVD [Russo 2009].
Major changes in our diet have taken place during the evolution from hunter-gatherers to modern agriculture and a westernised life style, particularly in thetype and amount of essential fatty acids. During the last 150 years, a dramaticincrease is seen in human consumption of vegetable seed oils rich in n-6 fattyacids with a parallel decrease in n-3 fatty acids. Thus, in the present western diet,the ratio of n-6/n-3 PUFA can be as high as 20:1 compared to the diet of our an-cestors probably being 1:1 or 2:1 [Simopoulos 2000; Simopoulos 2002]. A highintake of n-6 compared to n-3 fatty acids will favour mediators of primarily pro-inflammatory, pro-thrombotic and pro-aggregatory roles compared to those derivedfrom n-3 fatty acid metabolisms favouring the pathogenesis of chronic diseases (re-viewed in [Simopoulos 2002]). Epidemiological studies have shown correlationsbetween the n-6/n-3 PUFA ratio in human diets and CVD. Thus, a lower ratio isneeded for prevention and management of CVD diseases, and the optimal ratio is

6
varying with the disease of consideration [Simopoulos 2006]. However, it shouldbe noted, that beneficial effects of n-6 intake have been reported such as the welldescribed potential of LA to lower both total and LDL cholesterol in the blood andto increase HDL-cholesterol [Kris-Etherton and Yu 1997].
2.4 N-3 LCPUFA and cardiovascular disease
Evidence from a meta-analysis based on randomised controlled trials and cohortstudies has shown that intake of fish or fish oil is associated with decreased riskof cardiovascular disease and mortality both in CVD patients as well as people ofCVD risk [Bucher et al., 2002; Wang et al., 2006a]. In contrast, a meta-analysis byHooper et al., 2006 showed no effect of n-3 PUFA on cardiovascular events. Thereason for this inconsistency concerning the n-3 PUFA beneficial effects is likelyto be attributable to confounding factors such as health status of participants, espe-cially since the Hooper analysis also included studies with healthy people, whereasthe Wang analysis were only based on studies with CVD patients. Furthermore,the included studies differ in duration of follow-up time and most importantly typeof n-3 PUFA as the Hooper meta-analysis also focused on studies that suppliedalpha-linolenic acid, as well as source (dietary or supplemental) and dose admi-nistered. These effects have been ascribed to the high content of n-3 LCPUFA infish [Bucher et al., 2002; Kris-Etherton et al., 2002; Wang et al., 2006a]. Nume-rous effects of n-3 LCPUFA in relation to health have been reported and some ofthe proposed mechanisms for the protective role of these fatty acids against car-diovascular disease include lowered blood pressure [Geleijnse et al., 2002], alteredlipid profile; especially lowering of triacylglycerol [Harris 1996], reduced trom-botic tendency [Robinson and Stone 2006], anti-inflammatory effects [Zampelaset al., 2005], anti-arrhythmic effects including reduction in heart rate [Mozaffarianet al., 2005] and improved vascular function [Chin and Dart 1995]. The plasmatriacylglycerol (TAG) lowering effects of n-3 LCPUFA are well established anda reduction up to 30% is reported with effects seen in both normolipidemic andhypertriglyceridemic patients, but with greater efficacy at higher triglyceride base-line levels [Harris 1996]. Fish oil seems to have a small, dose-dependent effecton blood pressure in hyper-cholesteromics and stable hypertensive people, thoughno effects are seen on healthy subjects [Morris et al., 1993]. A meta-analysis hasshown that fish oil reduces heart rate particular in trials with a long treatment dura-tion and with higher baseline heart rate [Mozaffarian et al., 2005]. Thus, beneficialeffects are mainly seen in older subjects with already high values of blood pressureand heart rate.
Cohort studies have reported beneficial effects of n-3 LCPUFA, whereas othersstudies have failed to detect these effects. The Nurses Health study including85,000 women based on validated questionnaires reported a strong inverse associ-ation of fish/n-3 LCPUFA intake and the incidence of all cause mortality through-

2.4 N-3 LCPUFA and cardiovascular disease 7
out a 16-year follow-up period. Furthermore, the fatty acid-induced protection ap-peared to be stronger for CHD death than for non-fatal myocardial infarction [Hu etal., 2002]. In contrast, the US Physicians Health Study demonstrated no effects ontotal myocardial infarction, non-sudden cardiac death or total cardiovascular mor-tality in healthy men [Morris et al., 1995]. Likewise, the Health Professionals sixyear follow up Study found no overall association between fish or n-3 LCPUFAintake and the risk of coronary disease in men initially free of CVD, but a non-significant trend toward lower risk of fatal CHD with increasing fish consumptionwas seen [Ascherio et al., 1995].
The Gizzi-Prevenzione trial, a large secondary prevention trial, has investigatedthe effect of dietary supplementation with n-3 LCPUFA in 11,000 patients witha recent myocardial infarction. It was found that daily supplementation of onegram of n-3 LCPUFA for two years reduced the occurrence of main cardiovas-cular end points such as cardiovascular death, nonfatal myocardial infarction andstroke by 20%, coronary or cardiac death and sudden death by 30%, and finally allfatal events by 20% [Valagussa et al., 1999]. In the Japanese five year EPA sup-plementation study (JELIS) conducted in more than 18,000 hypercholesterolemicpatients, documentation of a 19% reduction in major coronary events in the se-condary prevention subgroup was seen [Yokoyama et al., 2007]. Results from the30-year follow up of the Chicago Western Electric Study supported the evidencethat fish consumption favourably affects CHD mortality. Men, free of CVD, whoconsumed at least 35 g of fish daily, had a 40% lower risk of fatal CHD, especiallynon-sudden death from myocardial infarction [Daviglus et al., 1997].
In a recent meta-analysis, it was described that the effect of fish and fish oil intakein terms of cardiac death is non-linear. Consumption of one to two servings offish pr.week, especially fish with a high content of n-3 LCPUFA, reduces the riskof coronary death by 36% and total mortality by 17%. Moreover, little additionalprotective effects were seen with increased fish intake above this level [Mozaffarianand Rimm 2006].
Taken together, the above mentioned studies primarily support the growing bodyof evidence that strongly suggests that consumption of n-3 LCPUFA has beneficialeffects on cardiovascular health. Thus, the American Heart Association, whichaims to improve diet and lifestyle to prevent CVD, recommends the general popu-lation to eat fish, preferable a fatty fish meal at least twice a week and for thosepeople with known coronary heart disease to consume one g of EPA/DHA pr. daypreferably from fish or dietary supplement [Lichtenstein et al., 2006]. In additionto providing EPA and DHA, however, it should be noted that fish consumptionmay also lead to a decrease in consumption of other foods high in saturated fat andtrans-fatty acids.

8
2.5 Fish protein
Although the main focus of beneficial effects of fish intake according to preven-tion and treatment of CVD has been related to the high content of n-3 LCPUFA,fish is also an excellent source of other nutrients including high-quality proteins,vitamin A, D and B, minerals and trace elements, especially iodine and selenium.During a fish meal a significant amount of protein is consumed. Interestingly, thepossibility that fish protein, particularly amino acids, may contribute to the benefi-cial health effects has emerged recently. Yet, only few studies have examined thepositive health effects of fish protein intake on health markers in humans as wellas in animal models of CVD. Ait-Yahia and colleagues have shown that a dietaryintervention of purified fish protein lowered blood pressure and decreased very lowdensity lipoprotein (VLDL)-TAG in hypertensive rats [Ait et al., 2005]. Additio-nally, Boukortt et al. have shown a similar beneficial effect on blood pressure afteran intervention consisting of fish protein compared to casein in hypertensive rats[Boukortt et al., 2004]. Furthermore, in normotensive rabbits, dietary fish pro-tein induced a decrease in VLDL-TAG and a concomitant increase in high densitylipoprotein-cholesterol and lipoprotein lipase activity [Bergeron et al., 1991; Ber-geron et al., 1992]. These results are of importance, since high blood pressure andunhealthy lipid composition are contributors to development of CVD. Other studi-es in rats have demonstrated that intake of protein from defatted cod fillets resultedin improved glucose tolerance and insulin sensitivity [Lavigne et al., 2000; Trem-blay et al., 2005]. A single cross-over study carried out in insulin-resistant men andwomen has compared the effect of a four-week intervention with proteins from codcompared with other animal proteins concerning their effects on insulin sensitivity[Ouellet et al., 2007]. The consumed diets differed only in terms of protein source.The intake of cod protein improved insulin sensitivity and had a strong tendency tobetter the beta cell function. Moreover, data from this study showed that intake ofcod protein decreased plasma C-reactive protein levels [Ouellet et al., 2008]. Thesefindings may contribute to prevention of type II diabetes by reducing the metaboliccomplications related to insulin sensitivity.
2.6 Fish farming and sustainability
In recent years, people in developed countries have been encouraged to increasetheir intake of EPA and DHA from fatty fish to improve health and prevent deve-lopment of major chronic diseases, especially CVD (see section n-3 LCPUFA andcardiovascular disease). Given this overall interest in n-3 fatty acid consumption,the decreased supplies will not be able to meet the increasing demand due to therapid worldwide decline of fish stocks. Even though the global catches of fish havebeen on decline since the 1980s, the number of collapsed stocks has been increa-sing exponentially since the 1950s consequently leading to the extinctions of ma-rine populations in the worlds oceans [Jenkins et al., 2009]. Thus, the aquaculture

2.6 Fish farming and sustainability 9
sector aims at relieving the pressure on wild stocks of fish and thus compensatesfor the shortfall of fish harvest by commercially raising farmed fish for human con-sumption. Thereby, it has become the fastest growing food production sector ofthe world and by 2010, more than 85% of global fish oil production is estimated tobe consumed in aquaculture feeds [Barlow 2000]. However, the issue is whetherthe aquaculture industry really enhances or diminishes the available fish supply.In aquaculture industry, carnivore fish species are grown on diets containing sig-nificant amounts of fish meal and fish oil. These predators require approximately2.5-5 times as much fish biomass as is produced and the carnivorous fish farming isthus still perceived as a net fish consumer rather than a producer, which has raisedconcern about the long-term sustainability of these industries [Naylor et al., 2000].In that connection, great improvement has been made, since feed conversion ratiovalues (ratio of the weight of feed added to the weight of fish produced) aroundone is reported for several fish species [Mente et al., 2006].
Consequently, since wild fish is a finite value, substantial effort has been spent onevaluating different feeding regimes as alternatives to fish meal and fish oils e.g.ingredients of plant origin. The effect of a change in feeding regime from ma-rine to vegetable based origin such as soy bean, lupin, peas and sunflower havebeen proposed. Nevertheless, complete replacement of fish oil and protein in feedfor carnivore farmed fish faces several barriers. A change in feeding regime mayinfluence flesh and eating quality of the fish as well as nutritional properties e.g.the content of n-3 LCPUFA. Thereby, the following consumption of these fishmay affect end-consumers health. Furthermore, plant ingredients contain differentanti-nutritional factors like protease inhibitors, phytates, lectins, anti-vitamins andtannins, which present in varying degrees may have adverse effects in fish in rela-tion to diet utilisation and digestibility and thus growth performance [Francis et al.,2001]. Studies have shown that rainbow trout fed a diet composed of plant basedprotein and oil was significantly affected according to sensory attributes of the fil-lets such as smell, taste, texture, and colour compared to a marine based diet [deFrancesco et al., 2004; Skonberg et al., 1993]. In proteomic based studies of liverproteins from rainbow trout, dietary replacement of fish meal with plant proteinshas shown to affect a number of metabolic pathways demonstrating the complexnature of gene expression responses to dietary manipulations [Martin et al., 2003;Vilhelmsson et al., 2004].

10
3 Part II: Proteomics
3.1 Biomarkers and blood proteomics
A biomarker is a measurable indicator of a specific biological state, pathologicalprocess and progress or pharmacological response to a therapeutic intervention [Ri-fai et al., 2006; van Ommen et al., 2009]. The biomarker discovery process aimsat identifying proteins being up and down-regulated in association with a specificbiological process or disease state compared to healthy individuals [Kussmann andAffolter 2009]. During the last decades, a considerable effort has been made indiscovering, quantifying, verifying and validating biomarkers. However, new andbetter biomarkers are urgently needed to improve health and disease diagnosis. Thedevelopment of useful, sensitive and accurate biomarkers for predicting outcomein food based studies is becoming more and more important given substantial evi-dence indicating an association between diet and incidence of chronic diseases [Huand Willett 2002; Van et al., 2008]. Ideally, a biomarker of health should be ableto reflect the subtle but relevant molecular changes of food interventions in healthstatus that precede the onset of disease [van Ommen et al., 2009]. These earlybiomarkers will give insights into the metabolic and cellular responses induced bya nutrient and how it affects homeostasis in specific tissue within the whole orga-nism. Moreover, they will provide knowledge on the early diet induced changes ofproteins that precede health benefits or the onset of disease.
Human blood plasma represents an attractive and promising source for biomarkerdiscovery due to several reasons. Blood is easily accessible in humans [Wang etal., 2006b] and the plasma harbours tens of thousands of proteins that are synthe-sised, secreted or lost from a variety of cells and tissue [Anderson and Anderson2002; Jacobs et al., 2005]. Thus, the plasma proteome is a circulating representa-tion of all body tissue reflecting the overall metabolic state of an individual [An-derson and Anderson 2002; Jacobs et al., 2005; Nedelkov et al., 2005]. Despiteits clinical importance and huge amounts of investigations, major challenges existfor plasma proteomic based biomarker discovery. Firstly, the complexity and thesheer dynamic range of plasma protein concentrations, secondly, the relatively lowabundance of many proteins which are of biological and disease-specific interestand thirdly, the inter-individual biological variation both in terms of physiologi-cal and pathological variation between humans [Rifai et al., 2006]. Even thoughthe number of proteins detected in human plasma or serum is increasing rapidly,a paradoxically decline is observed in the number of new protein biomarkers ap-proved for use in clinical diagnostics [Anderson 2005a]. During the last decade,the rate of introduction of new protein analytes approved by the US Food and Drugadministration has fallen to one biomarker pr. year [Rifai et al., 2006]. In fact,only a handful of proteins are currently established in clinical use [Anderson andAnderson 2002].

3.2 History of proteomics 11
3.2 History of proteomics
The term “proteomics” was first introduced in 1995 and defined as the large scalecharacterisation of the entire protein complement of a cell line, tissue or an orga-nism [Anderson and Anderson 1996; Wasinger et al., 1995; Wilkins et al., 1996].Initially, the term was used to describe the study of the expressed proteins of agenome using two-dimensional gel electrophoresis (2-DE) and mass spectrometry(MS) for separating and identifying proteins. The scope of proteomics has broad-ened considerably during the last decade and at present includes protein expressionprofiling, protein function, protein modifications, protein localisation and compart-mentalisation and protein-protein interactions [Graves and Haystead 2002]. Thisrapid expansion of proteomics with increasing application to answer biologicalquestions is clearly reflected in the number of published papers and a literaturesearch conducted in Medline using the query “proteomics” gives 23849 hits. Thesevast amounts of experimental data being gathered reveal that the proteome is morecomplex than the genome. The total number of genes in the human genome is24,000-30,000. If a given cell express 10,000 genes, the number of proteome com-ponents in that cell may exceed 100,000 since one gene gives rise to a variety ofproteins through mechanisms extending from alternative splicing, proteolytic pro-cessing to a wide range of posttranslational modifications [Kim et al., 2004].
Two-dimensional gel electrophoresis (2-DE) is still one of the most widely usedapproaches in proteomics for identification of changes in proteins of tissue and biofluids [de Roos B. 2009]. The method is powerful for the high resolution sepa-ration of proteins in a complex mixture, thus providing a snapshot of the proteincomposition in an organism at a given time under a given condition. The classical2-DE approach used in proteomics today based on the concept of combining iso-electric focusing (IEF) and SDS-PAGE was initially introduced in the pre-omicsera in the mid-seventies by O’Farrell [O’Farrell 1975] and Klose [Klose 1975],who began the mapping of proteins from E. Coli and mouse, respectively. Theymade unforeseen contributions to the research field of proteomics and the appli-cation of 2-DE to study cellular and tissue proteins from a global point of view[Klose 2009; O’Farrell 2008]. In the first dimension, the IEF step, proteins areseparated according to electric charge (pI), whereas in the second dimension in-cluding the SDS-PAGE, separation of proteins is based on their molecular weights.The robustness of the methods has dramatically increased in nowadays mainly dueto the introduction of immobilised pH gradients improving the resolution and re-producibility of protein separation in the first dimension [Bjellqvist et al., 1982]and a drastically increased sensitivity of detected proteins by the introduction ofsilver staining [Merril et al., 1981]. Moreover, the major breakthrough was thedevelopment of micro-sequencing technologies in the beginning of the nineties in-volving the identification of proteins of interest at first by Edman based sequencingfollowing the development and advances of MS and MS/MS based identificationof proteins [Aebersold and Mann 2003]. This greatly improved the quality of data

12
obtained from 2-DE. More recently, the introduction of fluorescent staining hasfurther provided higher sensitivity and larger dynamic range compared to silverstaining [Steinberg et al., 2000]. Especially, the development of Difference GelElectrophoresis (DIGE), first described by Unlu et al., has greatly improved thequantification of proteins in 2-D gels and allows for detection of subtle changesin protein abundance [Unlu et al., 1997]. The inter-gel variation is substantiallyeliminated by running three samples, marked with different fluorophores, on thesame gel.
3.3 Sample preparation of human plasma for 2-DE
Sample preparation is of utmost importance and very critical to acquisition of highquality data from proteome analysis based on 2-DE. Preparation should be as sim-ple as possible to increase reproducibility of the experiment. The main purposeof sample preparation is to solubilise the proteins making them suitable for 2-DEanalysis, while minimising the loss of proteins during the procedure. The solubili-sation process includes denaturation of the protein to break non-covalent bindingswithin and among the proteins, while maintaining the native charge and molecularweight of soluble proteins. Ideally, the perfect solubilisation mixture should freezeall the proteins in their exact state both in terms of amino acid composition andposttranslational modifications [Rabilloud 1999].
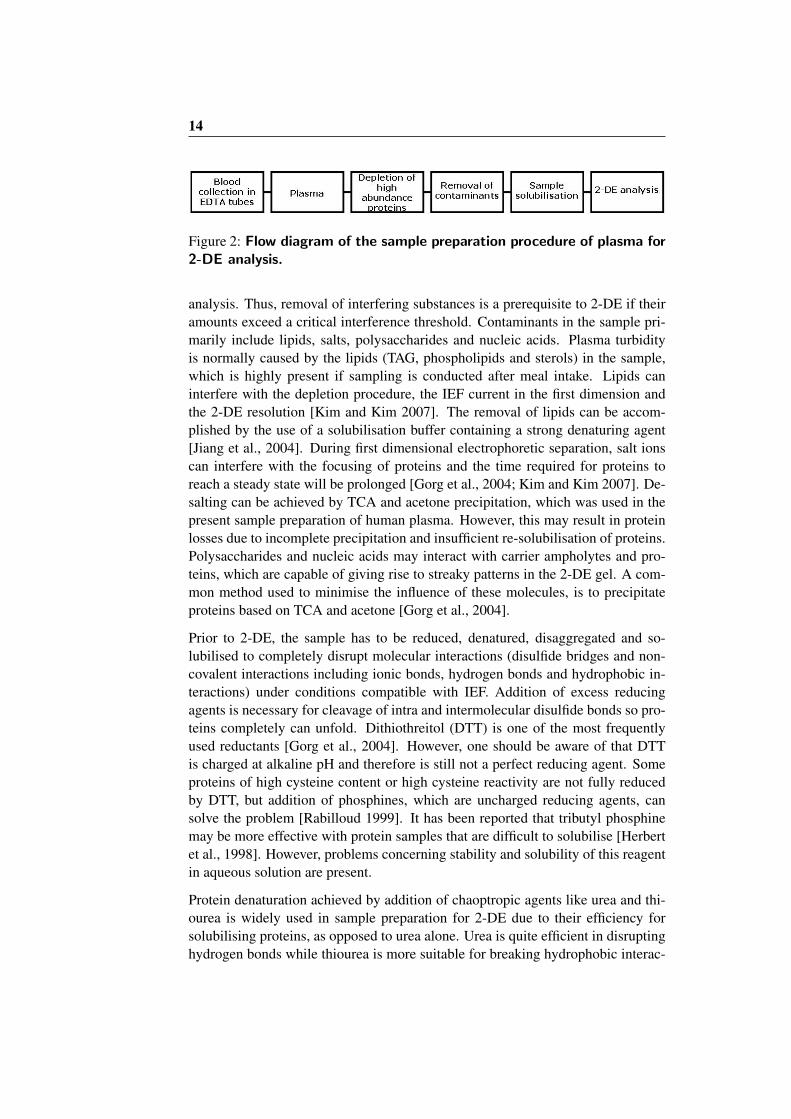
A large number of standard protocols are available, but these protocols have tobe adapted and optimised for the type of sample e.g. body fluids, tissue extractsand microbial cells to be analysed. The following section will focus on the sam-ple preparation procedures of human plasma, since it is used in the present PhDstudy and is a highly complicated specimen to analyse by 2-DE. Figure 2 illu-strates the flow diagram of sample preparation of plasma. Blood is collected intubes containing anticoagulants to prevent blood clotting. Different anticoagulantshave different molecular mechanisms, which are reflected in the proteome profile.In a study by Hsieh et al., the addition of anticoagulants including heparin, EDTAand sodium citrate was shown to have an impact on the following plasma proteomeprofiling on the basis of whole MALDI-TOF spectra [Hsieh et al., 2006]. More-over, the time-lag before separation of plasma from whole blood is very critical forthe analytic stability and the following proteome profiling due to cellular elements;platelets in particular, can secrete a variety of cellular components. Therefore, inthe present PhD study plasma was prepared directly after blood collection to mini-mise pre-analytical effects.
Addition of protease inhibitor cocktails have extensively been used in order to pre-vent degradation of proteins that otherwise will result in artefactual spots on the2-D gel and loss of high molecular weighted proteins. However, protease inhibitorsare not always recommended since they may modify protein structures and inducechanges in the charge of the molecules [Kim and Kim 2007] and may interfere with

3.3 Sample preparation of human plasma for 2-DE 13
the MS based identification of proteins of interest. TCA/acetone mediated pre-cipitation of proteins is useful to minimise protein degradation by proteases [Gorget al., 2004]. In addition, it has been shown that urea, thiourea and CHAPS incombination are very effective inhibitors of proteolytic activity [Castellanos-Serraand Paz-Lago 2002].
The major problem concerning the visualisation of plasma proteins is the broadand dynamic range of proteins comprising more than 10 orders of magnitude [An-derson and Anderson 2002; Jacobs et al., 2005], which really poses a challengefor proteomics. The steep dynamic range begins with the core plasma protein, al-bumin, which comprises approximately 50% of plasma protein content (45mg/ml)and ends with circulating cytokines present at 1-10pg/ml [Anderson and Anderson2002; Jacobs et al., 2005]. Therefore, sub-fractionation of plasma is a requisite tosimplify the protein composition of the plasma sample and to reach the lesser abun-dant proteins. Strategies that often have been used to overcome this problem areto fractionate the proteome into smaller sub-sets. Multiple approaches have beenused to simplify the plasma proteome including affinity, size and antibody baseddepletion of high abundance proteins [Kim and Kim 2007]. Removal by immuno-affinity capture is the most commonly used approach because of advantages of thehighly selective depletion process and the low cross-reactivity to non-target pro-teins [Crosley et al., 2009; de Roos 2008; Jenkins et al., 2008]. In the present PhDstudy, plasma was fractionated by an IgY-12 antibody based spin column (Beck-man Coulter, CA) in accordance with the manufacturers instructions to remove thetop 12 high abundance proteins. These proteins make up less than 0.1% of the totalnumber of proteins present in plasma, yet they comprise up to 95% of the totalprotein concentration in plasma [Huang et al., 2005]. Desrosiers and co-workers[Desrosiers et al., 2007] have compared the efficiency of IgY-12 column with twoother columns removing two and six of the high abundance proteins, respectively.They showed that the IgY-12 column was most efficient in enriching less abun-dant proteins. This sub-fractionation of plasma will allow better resolution andhigher sensitivity required to detect the lower abundant plasma proteins comparedto crude plasma and thus increases the possibility to “dig” deeper into the humanplasma proteome. However, the principal disadvantage of antibody based deple-tion includes its relatively high cost and low sample capacity. Moreover, a potentialartefact to be aware of includes non-specific binding to the column caused by theability of high abundant proteins, like albumin, to act as carrier protein for pep-tides and protein fragments [Desrosiers et al., 2007; Elrick et al., 2006]. The 2-DEbased plasma protein profiling of human plasma before and after IgY-12 treatmentdepleted of the top 12 high abundance proteins is shown in Figure 3. It is clearlyseen that the high abundance proteins contribute to a lot of smear in gel 3A. Re-moval of these proteins enables detection of the lower abundant proteins seen ingel 3B, and the result is a gel of distinct and separated spots.
2-DE based analysis of human plasma is rather difficult due to the many com-ponents in the sample that bind with proteins and possibly interfere during the
14
Figure 2: Flow diagram of the sample preparation procedure of plasma for2-DE analysis.
analysis. Thus, removal of interfering substances is a prerequisite to 2-DE if theiramounts exceed a critical interference threshold. Contaminants in the sample pri-marily include lipids, salts, polysaccharides and nucleic acids. Plasma turbidityis normally caused by the lipids (TAG, phospholipids and sterols) in the sample,which is highly present if sampling is conducted after meal intake. Lipids caninterfere with the depletion procedure, the IEF current in the first dimension andthe 2-DE resolution [Kim and Kim 2007]. The removal of lipids can be accom-plished by the use of a solubilisation buffer containing a strong denaturing agent[Jiang et al., 2004]. During first dimensional electrophoretic separation, salt ionscan interfere with the focusing of proteins and the time required for proteins toreach a steady state will be prolonged [Gorg et al., 2004; Kim and Kim 2007]. De-salting can be achieved by TCA and acetone precipitation, which was used in thepresent sample preparation of human plasma. However, this may result in proteinlosses due to incomplete precipitation and insufficient re-solubilisation of proteins.Polysaccharides and nucleic acids may interact with carrier ampholytes and pro-teins, which are capable of giving rise to streaky patterns in the 2-DE gel. A com-mon method used to minimise the influence of these molecules, is to precipitateproteins based on TCA and acetone [Gorg et al., 2004].
Prior to 2-DE, the sample has to be reduced, denatured, disaggregated and so-lubilised to completely disrupt molecular interactions (disulfide bridges and non-covalent interactions including ionic bonds, hydrogen bonds and hydrophobic in-teractions) under conditions compatible with IEF. Addition of excess reducingagents is necessary for cleavage of intra and intermolecular disulfide bonds so pro-teins completely can unfold. Dithiothreitol (DTT) is one of the most frequentlyused reductants [Gorg et al., 2004]. However, one should be aware of that DTTis charged at alkaline pH and therefore is still not a perfect reducing agent. Someproteins of high cysteine content or high cysteine reactivity are not fully reducedby DTT, but addition of phosphines, which are uncharged reducing agents, cansolve the problem [Rabilloud 1999]. It has been reported that tributyl phosphinemay be more effective with protein samples that are difficult to solubilise [Herbertet al., 1998]. However, problems concerning stability and solubility of this reagentin aqueous solution are present.
Protein denaturation achieved by addition of chaoptropic agents like urea and thi-ourea is widely used in sample preparation for 2-DE due to their efficiency forsolubilising proteins, as opposed to urea alone. Urea is quite efficient in disruptinghydrogen bonds while thiourea is more suitable for breaking hydrophobic interac-

3.4 First dimensional electrophoresis 15
tions. Additional detergents such as CHAPS are commonly included in the solu-bilisation mixture due to its efficiency for solubilising hydrophobic proteins [Gorget al., 2004].
Figure 3: 2-DE based plasma protein profiling of human plasma beforeand after IgY-12 treatment. In the first dimension, proteins are separatedaccording to electric charge in an immobilised pH gradient of pH 4-7, whereas inthe second dimension, proteins are separated according to their molecular weightsin a 12% SDS-PAGE gel. A: Un-fractionated human plasma, B: Human plasmaprotein fraction after IgY treatment depleted of the 12 most abundant proteins.
3.4 First dimensional electrophoresis
The first dimension of 2-DE consists of isoelectric focusing, where proteins areseparated on basis of their charge. The isoelectric point (pI) of a protein is thepH value of the proteins surroundings at which the protein has a zero net charge.Carrier-ampholyte (CA) generated pH gradient was originally used in the first2-DE protocols introduced by O’Farrell and Klose in 1975 [Klose 1975; O’Farrell1975], but the method suffers from several limitations including resolution, re-producibility, separation of very acidic and/or very alkaline proteins and sampleloading capacity [Weiss and Gorg 2009]. In order to overcome the limitations ofCA, immobilised pH gradients (IPG) was developed by Bjellqvist [Bjellqvist et al.,1982] and further improved by Gorg and colleagues [Gorg et al., 1988]. To achievehigh resolution 2-DE patterns, the classical IEF protocol was modified taking intoaccount that IPGs behave differently compared to CA generated pH gradients. Thisnew separation technique greatly improved the resolution and it was the beginningof a long journey of stepwise improvements of the 2-DE technology. Consequently,IPG is nowadays the current method of choice in IEF of 2-DE in proteome analysis[Gorg et al., 2009]. The IPG gradient is immobilised due to covalent anchoringof the pH gradient to the acrylamide matrix during casting, which generates an

16
extremely stable pH gradient. This leads to true steady state IEF with high re-producibility due to constant zone position and pattern constancy and eliminationof batch differences as observed with CA [Gorg et al., 1988; Righetti and Bossi1997]. IPG can be cast in different ranges between pH 2.5-pH 12 in both narrowor wide ranges [Gorg et al., 2004] and the choice of range is dependent on samplecomplexity and scientific purpose. Temperature during IEF has a significant effecton the 2-DE pattern, since the position of protein spots on the gel vary along thepH gradient, when different temperatures are applied. Thus, to achieve high repro-ducibility of 2-DE gels, it is very important that IEF is conducted under a definedtemperature, where 20◦C has been shown to provide optimal conditions [Gorg etal., 1991].
3.5 Second dimensional electrophoresis
Following the separation of proteins by first dimensional IEF, the second dimen-sion is carried out by SDS-PAGE in an electric field, where proteins are separatedaccording to their molecular weights. SDS is an anionic detergent and disruptshydrogen bonds, blocks hydrophobic interactions and partly unfolds the protein.It gives the proteins the same net negative charge per unit mass overwhelming thenative charge of sample proteins. Thus, during electrophoresis the denatured SDSpolypeptides are separated in the gel solely based on their molecular mass.
SDS-PAGE in second dimension can be performed on horizontal or vertical sy-stems. The horizontal system is suited for pre-cast commercial gels but has li-mited capacity of only a single gel, whereas the vertical system used in the presentPhD study is the system of choice for multiple runs in parallel, particularly forlarge-scale analysis which requires simultaneous batch electrophoresis to increasethrough-put and maximise reproducibility [Anderson and Anderson 1978]. Themost commonly used buffers for 2-DE is the discontinuous buffer system by La-emmli [Laemmli 1970]. Altering the amount of acrylamide will affect pore sizeand thus the sieving properties of the polyacrylamide gel. Nevertheless obtaininghigh-quality separation of the entire molecular weight range of the sample proteinsremains an art, as differences can arise from a number of factors during the process.The result of 2-DE analysis is a protein map of spots that are assigned their xand y coordinates. Proteins are recognised according to their specific coordinatesand each spot represents one to few proteins depending on the complexity of thesample. High resolution 2-DE can potentially resolve up to 10,000 protein spotssimultaneously [Zimny-Arndt et al., 2009] and from the complex protein profilepattern it is possible to extract information about changes in protein expressionlevels, isoforms or posttranslational modifications.

3.6 Visualisation of proteins 17
3.6 Visualisation of proteins
After conducting 2-DE, the separated proteins in the gel have to be visualised,as the main purpose of differential proteomics is to study the changes in expres-sion level/amount of proteins. It is important that the visualisation approach meetsthe acquirements of high sensitivity (low detection limit), high linear dynamicrange (quantitative accuracy) and compatibility of post-electrophoretic identifica-tion methodologies such as mass spectrometry. However, currently no stainingmethod for proteome analysis fulfils all these criteria [Gorg et al., 2004]. The visua-lisation of proteins can be obtained by application of various staining techniquesincluding organic dye, silver stain, reverse stain, fluorescent stain, radio-labellingand chemiluminescent stain [Patton 2002]. Conventional Coomassie Brilliant Blueis one of the most widely used dyes for 2-DE protein staining due to low cost,ease of use and good compatibility with downstream protein identification me-thods such as mass spectrometry. The principal limitation of this dye is insufficientdetection sensitivity, hence it is not able to stain low abundance proteins. It isbased on end-point staining with a detection limitation of 10-100 ng protein perspot. Additionally, the dye provides a linear dynamic range of 10-30 fold of pro-tein concentration [Weiss et al., 2009; Wu et al., 2005].
Silver staining is a frequently used approach for visualisation of 2-DE separatedproteins. It is sensitive and permits detection of the low nanogram level (0.5-1ng of protein) but with a restricted linear dynamic range of only 10 fold concen-trations. In contrast to Coomassie, silver stain is a quite complex procedure withcarefully controlled multi time-steps and staining development must be stopped atsome arbitrary time point in order to avoid saturation effect [Wu et al., 2005]. Con-sequently, gel-to-gel reproducibility can be problematic. The most sensitive silverstains are MS incompatible since aldehydes in the fixatives irreversible cross-linkpolypeptide chains. However, alternative silver staining protocols have been de-veloped that are compatible with MS based protein identification [Shevchenko etal., 1996; Wu et al., 2005]. Generally, the modified technique is poorer in terms ofdetection sensitivity and background staining is less uniform [Patton 2002].
Fluorescence staining of proteins is gaining popularity due to high sensitivity,broad dynamic range and ease of use. On the other hand, the cost of the method isquite high due to expensive chemicals and instruments needed for the detection offluorophores. The most common used fluorescence stain is non-covalently boundfluorescence dye, such as Sypro Ruby, a ruthenium based metal chelate stain thatbinds to basic amino acids in proteins and was originally developed for detection ofproteins in SDS-PAGE gels and proteins blotted to membranes [Wu et al., 2005].The detection sensitivity (1 ng of protein) is as high as silver staining and the lineardynamic range is at least three orders of magnitude exceeding Coomassie BrilliantBlue and silver stain in terms of performance. Furthermore, it allows one-step end-point staining and it can thus be performed over night without overdeveloping and

18
concomitantly with low background staining [Ahnert et al., 2004; Patton 2002].Finally, most procedures are compatible with protein identification methods suchas mass spectrometry [Gorg et al., 2004].
In the present PhD study, three different types of staining to visualise humanplasma proteins were compared; Coomassie Briliant Blue, Sypro Ruby and sil-ver staining shown in Figure 4, respectively. By manual inspection, it is clearlydemonstrated that the approach based on silver staining is by far the most sensi-tive staining technique to visualise the proteins. However, one should be awareof the drawbacks of this staining method mentioned above. The low sensitivity ofCoomassie Brilliant Blue is also clearly confirmed even despite the fact that thesample is four times as concentrated. Therefore, the staining of plasma proteins inthe enclosed papers is carried out by use of silver staining.
Figure 4: Visualisation of proteins. Plasma proteins are visualised on 2-DE gelsby use of (A) Coomassie, (B) Sypro Ruby and (C) silver staining.
3.7 Image analysis
After protein staining, it is of vital importance that protein spots are aligned ac-curately to ensure high quality data from proteome experiments. One of the keylimitations for 2-DE based studies is the lack of a rapid, robust and reproduciblemethod for gel image analysis in terms of detecting, matching and quantifyingspots. To facilitate rapid and accurate image analysis with relatively high through-put, a number of commercial software packages are available for image analysisof 2-DE gels e.g. Delta 2D, Melanie, PDQuest, Image Master 2D Elite and Pro-genesis [Raman et al., 2002]. These are based on different detection and match-ing principles and have a broad range of options, capability and price. However,all software packages use the same traditional workflow involved in differentialimage comparisons analysis; (i) spot detection, (ii) gel-to-gel matching and (iii)spot quantification [Raman et al., 2002]. Yet, manual editing during the spot detec-tion is nearly impossible to avoid due to sample complexity with several thousandsof spots on a gel and mismatches must be carefully checked and edited e.g. dele-tion of false protein spots and correction of spot shape. Even a very experienced

3.8 Data analysis 19
person will not be able to produce gels with similar spot patterns. Dissimilarityof spot positions in the 2-DE gel may be caused by variations in pH of runningbuffer, incomplete polymerisation, current leakage, air bubbles in gels and influ-ence of high abundant proteins on the pH gradient in IPG gels caused by their ownlocally concentrated buffer capacity [Berth et al., 2007]. Slight variations in pro-tein load pr. gel and staining efficiency can have a considerable impact on the rawspot volumes. Hence, spot volume normalisation, a necessary step in 2-DE dataacquisition to minimize the analytical variation caused by gel-to-gel variations, isvery important for quantification of spot volumes.
Thus, it is important to stress, that even with the best performing program it is notpossible to extract good results from bad gels. Thus, 2-DE gels of good quality area prerequisite for high-quality image analysis and it is important to avoid experi-mentally caused artefacts (background, noise and streaking), which will influencethe spot detection and quantification process.
3.8 Data analysis
In 2-DE based proteomics, large amounts of high dimensionality data are produceddue to the detection of hundreds or even thousands of protein spots. Generally, datais divided in two groups, treatment versus control group, and spots are commonlytested individually by use of univariate statistics such as the Students t-test to re-veal spots changing in abundance between the two groups [Biron et al., 2006]. Thevariation in spot volumes is heterogeneous; some spots differ highly in volume,while others show only small differences. Consequently, data deviating from nor-mal distribution is not uncommon. Often, data analysis is based on Students t-testbut the normal distribution of data is frequently assumed and not tested [Wilkinset al., 2006]. Overall, inappropriate use of Students t-test or analysis of variance(ANOVA) may result in a number of false positives spots, which is the case in seve-ral proteomic studies, and this needs to be taken into consideration in the evaluationof the data. Multiple testing correction methods exist (Bonferroni correction andFalse Discovery Rate (FDR)) to adjust the values of protein spots based on Studentst-test or ANOVA to keep the overall rate of error as low as possible. An extensionof FDR is the q-value, which is the expected proportion of false positives incurredamong a set of significant findings changing in expression [Storey and Tibshirani2003]. For each given p-value, a q-value can be reported and an overall estimatefor the proportion of protein species changing in abundance.
Using univariate statistics alone, it is impossible to reveal all the complex interac-tions in protein expression profiling, and essential data information as well as datastructure is lost in the analysis. In multivariate statistical analysis e.g. principalcomponent analysis (PCA) and Partial Least Squares Regression (PLSR), all spotsare analysed simultaneously and this method offers a strong approach for the eva-luation of 2-DE maps to get an overview of the main variation and structure in data

20
[Jensen et al., 2008; Karp and Lilley 2007]. PCA is a multivariate pattern recog-nition method breaking down the data matrix into systematic variation and noise.PCA results in the decomposition of raw data into scores, describing the relation-ship between samples, and into loadings showing the relationship between vari-ables [Marengo et al., 2007]. The variation is described by principal components(PC1, PC2, PC3 etc,), where the first PC explains the maximum possible variancein the data set and each successive component account for the remaining residualvariance. The PCs are then calculated hierarchically, so experimental noise andrandom variation are contained in the last PCs [Marengo et al., 2007; Marengo etal., 2008]. Of course, this is only true, if experimental noise and random variationsrepresent a minor contribution compared to the systematic variation in data. Anexample of PCA analysis of data from 2-DE based proteomics is demonstrated inFigure 5. The proteome data is obtained from the single meal study in which hu-man plasma samples were collected before meal intake and during the postprandialphase. From the 2-DE based data, it is demonstrated that samples are grouped, toa more or less extent, according to each subject and the inter-individual variationthus represents a major variance component in the data.
Another very useful multivariate statistical approach is PLSR. By use of this re-gression method it is possible to identify the relation of variation between two setsof data (x and y data matrix), e.g. spots compared to other characteristics of thesamples. The result of the PLSR analysis is a prediction model, where the varia-tion in the total spot dataset (x-variables) is used to explain the variation in othermeasurements or related information of the same samples (y-variables).
3.9 Mass spectrometry based identification of proteins of interest
The classical 2-DE based approach coupled with spot identification by mass spec-trometry has become the most widely used approach in proteomics to effectivelyidentifying the protein spots of tissue, cells and bio fluids [Fuchs et al., 2005; Roep-storff 1997]. Various proteome maps with identified proteins originating fromdifferent phyla, tissue and bio fluids are available on the internet at the Swiss-2D-PAGE site (www.expasy.org/swiss-2dpage/viewer) with a constantly increa-sing number of identified protein spots. A huge development of MS based tech-nologies both in relation to instruments and computational protein analysis tech-niques has enhanced the sensitivity and through-put of identification of 2-DE se-parated proteins [Gygi and Aebersold 2000; Poutanen et al., 2001]. Furthermore,the sequencing of several genomes, including the human genome, has been a greatadvantage in MS based identification of proteins [Roepstorff 1997].
Mass spectrometry enables structural information such as exact peptide massesand amino acid sequences, which makes it possible to identify proteins of interest[Graves and Haystead 2002]. Different methods have been developed for identifi-cation of proteins from 2-DE gels. Basically, fingerprints of proteins are created by

3.9 Mass spectrometry based identification of proteins of interest 21
Figure 5: PCA Scores plot of 2-DE separated human plasma proteinsderived from the single meal study. The PCA scores plot displays the firstthree principal components in which PC1 (23%), PC2 (8%) and PC3 (6%) accountfor 37% of the total variation in the data set.
in-gel digestion of proteins by a specific protease e.g. trypsin following a record-ing of a mass spectrometric peptide map with information of experimental pep-tide mass-to-charge value. Comparing the experimentally obtained mass against atheoretical obtained mass data from an already identified protein in a database leadsto protein identification. The work presented in this thesis is based on MS/MS re-sults obtained from Maldi/Tof-Tof mass analyser, which is a classical approach andcommonly used for identification of proteins from 2-DE. Maldi-MS is a sensitivemethod and normally used to analyse relative simple peptide mixtures, like in thiscase a protein excised from a 2-DE gel, contrary to liquid-chromatography elec-tro spray ionisation MS systems, which are ideal for analysis of complex samples[Abersold and Mann 2003]. Additionally, Maldi-MS is more tolerant to contami-nants like salts and small amounts of detergents, which may appear in the excisedprotein spots from the 2-DE gel [Domon and Aebersold 2006]. Having determinedthe mass-charge value and intensity of all the peptides in the MS spectrum, themass spectrometer proceeds to obtain sequence information about these peptidesby further fragmentising single selected peptide ions. The MS/MS spectrum is

22
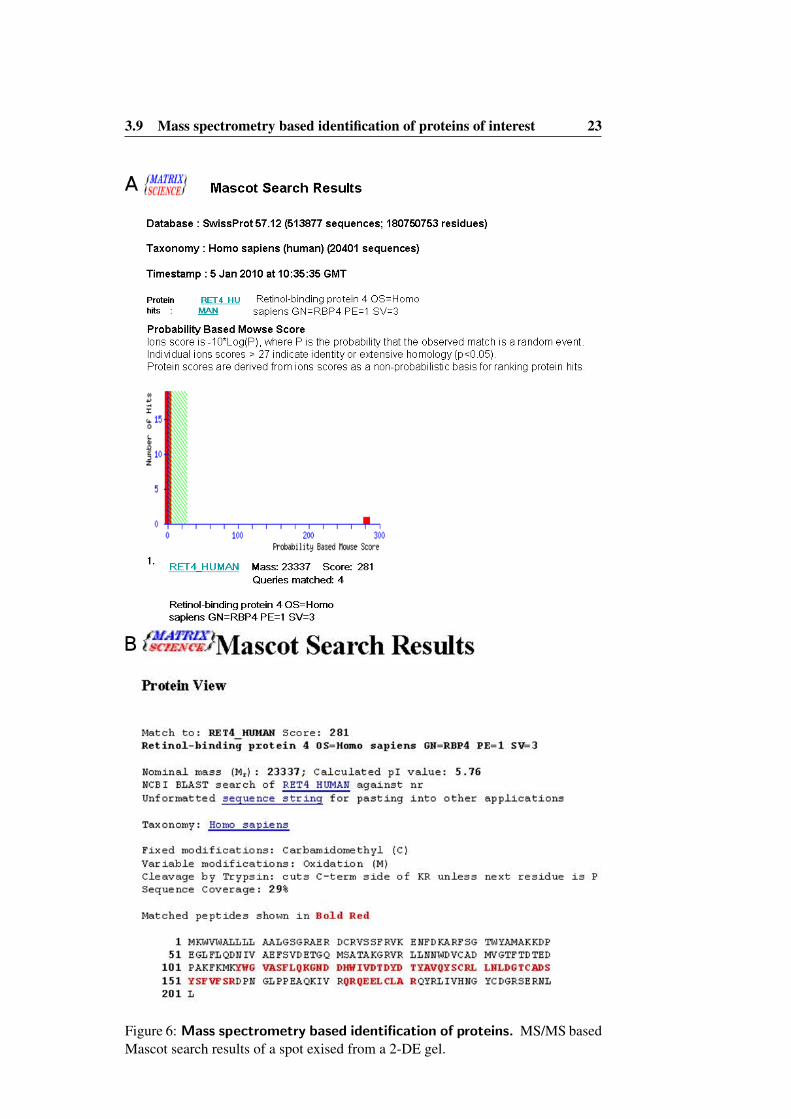
the result of an ensemble of one particular precursor ion fragmented at differentamide bonds and short amino acid sequence tags are generated for the individualpeptides. These partial sequences are compared to the original peptide masses ofall known proteins within the database, which greatly improves specificity [Steenand Mann 2004]. Various peptide mass search programs are available on the Inter-net e.g. Mascot, MS-fit and PeptideSearch [Kim et al., 2004] and the complexityof the algorithms used to search sequence databases is program dependent. Whenconducting large-scale studies with following identification of proteins by databasesearching, one should use an organism with sequenced genome; so that all possiblepeptides are known and time consuming de novo sequencing is thus not mandatory.The Mascot MS/MS-search (www.matrixscience.com) is used for database search-ing, where different MS variables e.g. instrument, taxonomy, database, enzymeand modifications etc. are typed in prior to the search. Figure 6 shows a Mascotreport from a database search using a Maldi-Tof/Tof spectrum of a trypsin-digestedspot from a 2-D gel containing human plasma proteins. In this case, peptides gain-ing a Mascot score greater than 27 are found significant (p<0.05). However, itshould be noticed that the significance limit is database dependant due to numberof entries. A single protein was significantly identified as retinol-binding protein4 with a score of 281, which is highly trustworthy. The retinol-binding protein hithas a sequence coverage of 29%, which is defined as the ratio of the portion ofthe protein sequence covered by the matched peptides to the whole length proteinsequence.
The accuracy of the mono-isotopic mass is limited by the instrument used. Today,by use of modern instruments, mass accuracy lower than 50 ppm is routine [Barnesand Kim 2004]. In paper I, protein identifications are based on 2-5 peptides with amean mass accuracy of 7 ppm. Ideally, one would expect to observe a signal for allpeptides and whole sequence coverage of the protein. However, this is hardly everthe case. Some proteins had an experimental molecular mass, estimated from thespot position on the 2-DE gel, differing from the theoretical molecular mass. Thisindicates that the analysed proteins were a fragment of their respective full lengthproteins. Furthermore, this was clearly documented in the mascot report by look-ing at the original amino acid sequence, where the matched peptides were foundfor instance at the C-terminal end of the sequence with resulting low sequence co-verage, since the calculation is based on the full length protein. From time to timea spot contains a mixture of proteins. When a single protein in the spot is identi-fied, additional proteins can be identified by doing a “second pass” search meaningthat after a correct identification of the first protein, the unmatched peptides can beused in a new search. This feature is offered by the search engine Mascot.
3.9 Mass spectrometry based identification of proteins of interest 23
Figure 6: Mass spectrometry based identification of proteins. MS/MS basedMascot search results of a spot exised from a 2-DE gel.
24
3.10 Experimental design and biological variability
Randomised controlled trials (RCT) are considered as gold standard in human stu-dies, when evaluating the efficacy and safety of a treatment intervention [Silver-man 2009]. In these trials, subjects are randomised into different parallel treatmentgroups and each group receives a specific treatment. They are simpler in experi-mental design and more feasible compared to cross-over studies [Lathyris et al.,2007]. In a cross-over study, each individual receives two or more treatments, butin a random order. These studies represent relatively complex study design and itcan be difficult to apply for many research questions [Lathyris et al., 2007]. Theparticular strength of a cross-over study is that the different treatments are evalu-ated on the same subject, allowing comparison at the individual level rather thanon the group level as seen in RCT. Since each subject receives both interventionsand thus acts as its own control, the number of subjects required to produce simi-lar precision is reduced considerably compared to parallel group trials [Elbourneet al., 2002]. Furthermore, this study design can eliminate biological variation,since variation in repeated responses within a subject is usually smaller than thatseen between subjects. Also, the number of replicate 2-DE gels is reduced. Incontrast, it should be noted that a cross-over design mediates a risk of a carry-overeffect, occurring when the treatment given in the fist period has an effect that iscarried over in the subsequent treatment period [Elbourne et al., 2002]. However,a wash-out period between the different treatments may reduce the effect of carry-over. Another noteworthy aspect is the treatment period interactions, which mayintroduce bias into the outcome of the study.
In nutritional studies, the metabolic changes caused by a dietary intervention areoften small and subtle when working with subjects who are generally healthy and inmetabolic homeostasis. In addition, the effect of a dietary treatment is often smallerthan the biological variation in metabolic responses between individuals [Rezzi etal., 2007]. Factors like sex, age, genetic background, environment, health sta-tus and lifestyle may contribute to this variability [Anderson and Anderson 2002;Nedelkov 2008; Winkler et al., 2008]. Consequently, this poses a challenge for nu-tritional experimental design when evaluating dietary effects in humans and careshould be taken to minimise this source of heterogeneity in a given study. Oneway to cope with this variation is to conduct carefully controlled studies with de-fined diets where each subject participate both in the control and the test groupi.e. cross-over study design. Furthermore, the criteria for selecting participantsare also of importance in terms of reducing inter-individual variation. Pre-studyscreening of participants including measurements of biological parameters such asbody mass index, blood pressure and clinical measurements as blood lipid statusand glycaemia is essential for participant selection. Moreover, additional know-ledge about the participants including age, habitual dietary and lifestyle habits maycontribute to the selection process. According to proteomic based biomarker dis-covery, the biological variation may affect a given protein in a way that might

3.10 Experimental design and biological variability 25
enhance or degrade its performance as a biomarker. To date, the extent of theinter-individual variability of protein expression remains unclear. One of the mainchallenges in proteomic based nutritional research is to separate the changes in pro-tein expression profiling induced by a well-determined food intervention from theso-called confounding factors such as biological variability. Only few studies havedemonstrated the presence of inter-individual variability in different proteomes e.g.plasma, platelets, monocytes, peripheral blood mononuclear cells, saliva, urine,cerebrospinal fluid and liver [Hu et al., 2005; Nedelkov et al., 2005; Nedelkov2008; Quintana et al., 2009; Winkler et al., 2008; Zerefos et al., 2006; Zhang et al.,2006].

26
4 Aim of the study
The overall objective of this PhD study was to investigate the impact of meal intakeon human plasma proteins assessed by proteomics. Both acute effects and long-term effects were evaluated based on a single meal study and a human interventiontrial, respectively.
The specific aims of the study were:
• To examine the postprandial changes in the plasma proteome and lipid pro-file of elderly healthy men after single meal intake of trout (marine basedfeed) and poultry. Furthermore, it was warranted to investigate whether atwo-dimensional gel based approach was a valuable tool with respect to de-tection of the postprandial induced changes in human plasma proteins (PaperI).
• To investigate the long-term effects of a change in feeding regime of farmedtrout from marine origin to vegetable based diet on consumers health. The ef-fects were assessed by measurements of plasma proteome profiles in healthyadult males (Paper II).
• To study the extent of biological variation between subjects with respect toprotein abundance assessed by measurements of the plasma proteome pro-files in healthy elderly men (Paper III).
5 Overview of experimental design
The experimental part of the present PhD thesis is based on a single meal studyand an intervention trial conducted in healthy elderly men. The results from thesestudies are presented in the three enclosed papers (see appendix). The followingsection will briefly describe the experimental design of the two human studies togive an overview of the experiments, which have been addressed in the papers.
5.1 Single meal study
The single meal study was a randomised single-blinded dietary cross-over studyincluding five healthy men in the age of 54-70 years. In random order, the sub-jects received three test meals with poultry (control), marine fed trout (high of n-3PUFA) or vegetable fed trout (high of n-6 PUFA) separated by one-week of inter-val. Blood was sampled before the meal intake (baseline), four times during thepostprandial phase (1.5, 3, 4.5 and 6 h after meal ingestion) and after 24 h (fas-ting blood sample) for proteome analysis and MS-based identification of proteinsof interest as well as TAG analysis (see Figure 7 and 8). Details concerning the

5.1 Single meal study 27
participants, the meal content and the methods are described thoroughly in paper Iand paper III.
Figure 7: Experimental design and methods conducted in the single mealstudy.
Figure 8: Time line of single meal study. Blood was sampled before the mealintake, four times during the postprandial phase following a 24 h fasting sample.A standard lunch and dinner were served in order to control the macronutrient andenergy intake during the test day.

28
5.2 Human intervention trial
The human eight week intervention trial was a three-grouped parallel randomisedstudy including 68 healthy men in the age of 40-70 years. Subjects were randomlyassigned to one of the three groups eating either one daily meal of trout fed by apure marine based diet, one daily meal of trout fed by a pure vegetable based dietor a daily meal of poultry (control meal). Blood was collected at baseline (week 0)and at the end of the intervention (week 8) for plasma proteome analysis and MS-based identification of proteins of interest (see Figure 9). 30 of the 68 subjects(10 from each intervention group) were randomly selected and their samples wereused for proteomic analysis. Details concerning the participants, the meal contentand the methods are described in paper II.
Figure 9: Experimental design and methods conducted in the human in-tervention study.

6 Main results and discussion 29
6 Main results and discussion
During the experimental work with human plasma from the single meal study andthe intervention study, various choices were made in the laboratory regarding sam-ple processing and 2-DE with the aim of obtaining most stable and reliable plasmaprofiles. Several steps in the proteomic procedure appear critical for and mightcontribute to variation. Pre-analytical variables such as sample collection, storageand handling may have profound effects on the composition of the plasma sampleand these could confound the proteomic data analysis. Therefore, it is importantto quantify the sources of variation inherent in the proteomic method and improvethem to the extent possible in order to reduce artefacts that could bias the resultsand further obscure the detection of the dietary induced changes in the humanplasma protein profiles.
6.1 Preparation of human plasma samples
Sample preparation of plasma often includes addition of protease inhibitors (PI) inorder to preserve the protein population from proteolytic cleavage that otherwisemay result in artificial protein spots and loss of high molecular weight proteinson the 2-DE gel. However, the use of PI is challenging since differences in 2-DEpatterns both with and without PI are documented. Schuchard and colleagues haveshown that several human plasma protein trains on 2-DE gels were shifted toward ahigher isoelectric point following addition of a PI cocktail [Schuchard et al., 2005].In contrast, Hulmes et al. have demonstrated that inclusion of PI in plasma samplesimproved sample qualities and gave reproducible results based on classical 2-DEimage analysis, 2D-PAGE quality scoring and enzyme immunoassay [Hulmes etal., 2004]. Furthermore, samples without PI cocktail varied significantly from con-trol samples. In the present study, the benefits versus drawbacks of inclusion ofPI described in the literature were balanced and it was decided not to use PI in thepreparation for the human plasma samples. In that connection, different initiativeswere taken during sample preparation to reduce proteolysis. Following the Hu-man Plasma Proteome Project recommendations [Omenn et al., 2005], blood wascollected in vacutainers containing EDTA anticoagulant, whose chelating actionmay be advantageous. Moreover, plasma was prepared directly after venipunctureand the applied TCA protein precipitation as well as urea, thiourea and chaps inthe reswelling solution are useful for minimising proteolytic activity [Castellanos-Serra and Paz-Lago 2002; Gorg et al., 2004]. Still, it must be kept in mind thatproteolysis will presumably occur, since it is rather difficult to completely inac-tivate all proteases. Consequently, a number of spots on the 2-D gel may reflectprotein fragments as a result of proteolysis. However, according to the tables ofMS/MS based protein identification (paper I and II) this seems not to be the case.On the basis of the mass spectrum and the experimental MW and PI compared to

30
the theoretical values, it was indicated that only few (four out of 37) of the differentsignificant spots changing in abundance were fragments of the reported proteins.
Another variable such as temperature during blood centrifugation may affect theplasma profiles since several handling procedures have been shown to influencethe proteome profiling [Hsieh et al., 2006; Hulmes et al., 2004]. The blood sam-ples from the volunteers were centrifuged at room temperature, although proteinstability is better at lower temperatures, but his temperature was chosen to avoidcold activation of platelets [Banks et al., 2005]. This is of high importance sinceplatelets play a central role in thrombosis, haemostasis and inflammation, whichare essential processes implicated in CVD [Gawaz et al., 2005] and of great impor-tance when evaluating health beneficial effects of fish consumption. In the light ofthe foregoing reflections, there is without doubt a need for standardising methods ofcollection, processing, and storage of plasma samples to minimise the effect of pre-analytical variables on plasma proteome profiling and be able to detect biomarkersin an unbiased fashion.
6.2 Depletion of high abundant proteins
Multiple strategies have been used to simplify the plasma proteome due to the vastdisparity in protein abundance of human plasma [Kim and Kim 2007] in which re-moval of high abundance proteins by immunoaffinity capture is increasingly beingrecognised as the most effective sample preparation strategy for plasma proteomics[de Roos 2008]. In that connection, a study by Whiteaker and colleagues, whoexamined eight different pre-fractionation approaches of human serum, demon-strated that immunoaffinity subtraction of the high abundant proteins was mosteffective and reproducible [Whiteaker et al., 2007]. On the other hand, this methodis not free of troubles. In the present study, plasma was fractionated by use of thecommercial available IgY-12 proteome partitioning column from Beckman Coulterwhich captures the 12 most abundant plasma proteins. The principal rationale forusing this immunodepletion strategy was to lower the detection limit on the 2-DEgels and make the lower abundant proteins accessible to global proteome profiling,since the majority of potential disease/health biomarkers may be present at ex-tremely low concentrations in plasma. Although use of the IgY-12 column greatlyimproved the resolution of the gels, the lower abundant proteins were still out ofreach and the identified proteins were mainly common plasma proteins involved inblood key functions.
It is important to note that some of the identified proteins were IgY-target proteinswhich should have been retained by the column, although it was expected that theremaining amount of these proteins was proportional to their original amounts.On the basis of this result and the fact that the column is used for all samples,variations in column absorption efficiency may occur. Although the column coulddeplete 100 samples according to the manufacturers product descriptions, it has

6.3 Visualisation of spots 31
been shown that after 25 samples the protein content of the flow-though fractionincreased suggesting decreased efficiency for retaining the high abundant targetproteins [de Roos et al., 2008]. Therefore, consistent depletion conditions may notbe guaranteed. To shed light on this matter, a linear regression analysis of nineselected (four non-significant and five significant IgY-target spots from paper I wasconducted. The proteomic data of these nine spots was listed in order according tothe date that the sample was fractionated by the IgY-column. The regression slopewas found significant in seven (two non-significant and five significant IgY-spots(636, 859, 936, 937 and 940) out of nine examined spots. Conclusively, these spotsare doubtful since a time dependent variation in column absorption efficiency isindicated and the results of these spots should thus be interpreted with caution.
The potential loss of inadvertent capture of non-targeted proteins due to the abilityof high abundant proteins, like albumin, to act as carrier proteins [Desrosiers et al.,2007; Elrick et al., 2006] is also of concern, since some minor proteins may pos-sibly remain bound to the column and will be lacking in the flow-through fractionloaded on the 2-D gel. This may remove potential biomarker candidates duringthe depletion process. Huang et al. have addressed this concern by examining theflow-through fraction and bound/eluted fraction after IgY-depletion. They foundthat proteins identified in the bound/eluted fraction consisted mainly of the targe-ted abundant proteins except for four non-targeted proteins [Huang et al., 2005].Equivalent to that study, Tu and colleagues demonstrated that the bound fractionassociated with immunodepletion contained a number of non-targeted proteins [Tuet al., 2010]. Taken together, in quantitative plasma proteomic studies based onimmunoaffinity capturing, it is important to keep in mind the risk of not only thepotential non-selective loss of protein candidates but also incomplete absorptionability of the column as suggested by the present results.
6.3 Visualisation of spots
Silver staining is a frequently used approach for visualisation of protein spots onthe 2-D gel due to its positive features such as excellent sensitivity below one ng ofprotein and relative low cost for reagents [Weiss et al., 2009]. In this study, proteinswere stained by use of silver staining as described in [Wulff et al., 2008] and theexcellent sensitivity was demonstrated in comparison with Sypro Ruby fluorescentstain and Coomassie Brilliant Blue where silver staining clearly visualised mostspots on the 2-D gel. Thus, this staining technique increased the possibility tovisualise as many proteins of potential use as specific biomarkers. However, one ofthe drawbacks by the stain is the limited linear dynamic range which is important,since spot saturation effects impede normalisation and accurate quantifications ofspots. Moreover, gel-to-gel variations are not negligible due to several solutionchanges and other carefully timed steps. In addition, fluorescence staining is anattractive approach since it offers reliable quantification over a wide linear dynamic

32
range combined with a high sensitivity of spot detection [Wu et al., 2005]. Yet, thedyes are very expensive and a costly fluorescent scanner is required, which was notavailable at the time the staining procedure took place.
6.4 Technical variation and the significance of the IgY-12 fractiona-tion on the proteomic data
The number of replicates is often restricted in 2-DE studies due to labour andcost. Biological replicates (different measurements within the same experimen-tal group) and technical replicates (repeated measurements of the same biologicalsample) can be used in proteomic studies. Reliable sample preparation and lots ofexperience with 2-DE based proteomics ought to minimise the technical variation.In this study biological replication was carried out which is better than technicalreplication, if a limited number of gels can be made [Horgan 2007]. Furthermore,if technical replicates were used, it will be occurring at the expense of biologicalreplication which is not recommendable [Horgan 2007].
It is important to shed light on the technical variation since high 2-DE reproducibi-lity is an essential prerequisite for obtaining high quality data and further identifypotential protein biomarkers. For that reason, six technical replicate gels of IgY-12fractionated plasma from a single subject were run according to the applied 2-DEprocedure to investigate the scope of the technical variation in data, i.e. the contri-bution of the IgY-12 column (data not shown). The mean coefficient of variation(CV) of all spots (921 spots, 6 gels) in the replicate dataset was 25% in which 45%of all the spots had CV values less than 20%. Moreover, it was clearly seen thatspots with a high variation (> three fold changes) were primarily low spot volumesor located in the blurred area of the gel (Fig. 10A). Furthermore, six gels of pooledIgY-12 preparations of human plasma samples from the same subject as mentionedbefore was run to illustrate to what extent the IgY-column contributes to variation.Analysis of pooled IgY-12 plasma samples (dataset of 921 spots, data not shown)resulted in a mean CV of 18% in which 69% of the spots had CV values less than20%. In that connection, results from a former experimental variation study of asingle human plasma sample prepared eight times by top-6 high abundance proteindepletion following 2D DIGE reported that 50% of all spots had less than 10% CV[Corzett et al., 2006]. By comparison, we could report that 11% of the total numberof spots in our replicate study had less than 10% CV. However, it should be noted,that the DIGE technique reduces the inter-gel variations and thus overcomes thelimitation of traditional 2-DE since three samples are loaded on a single gel.
To get insights into the technical variation of spots distinctly separated on the 2-Dgel, 25 randomly picked spots of both large and small volumes were selected (Fig.10B). The mean CV of the 25 spots was 11% (range CV 5-17%) in the replicategels. In addition, nine selected (four non-significant and five significant) IgY-targetspots identified in paper I had a mean CV of 12% and 7% in the replicate study

6.4 Technical variation and the significance of the IgY-12 fractionation onthe proteomic data 33
Figure 10: Representative 2-DE gel from the replicate study. A: The spatialdistribution of spot volumes larger than three fold changes. B: The spatial distribu-tion of 25 randomly selected spots.
and the pooled study, respectively. Based on the results presented above, it wasindicated that the IgY-12 column contributes to variation in the proteomic data,however, only to a lesser extent and did therefore not contribute the main variationin the data.
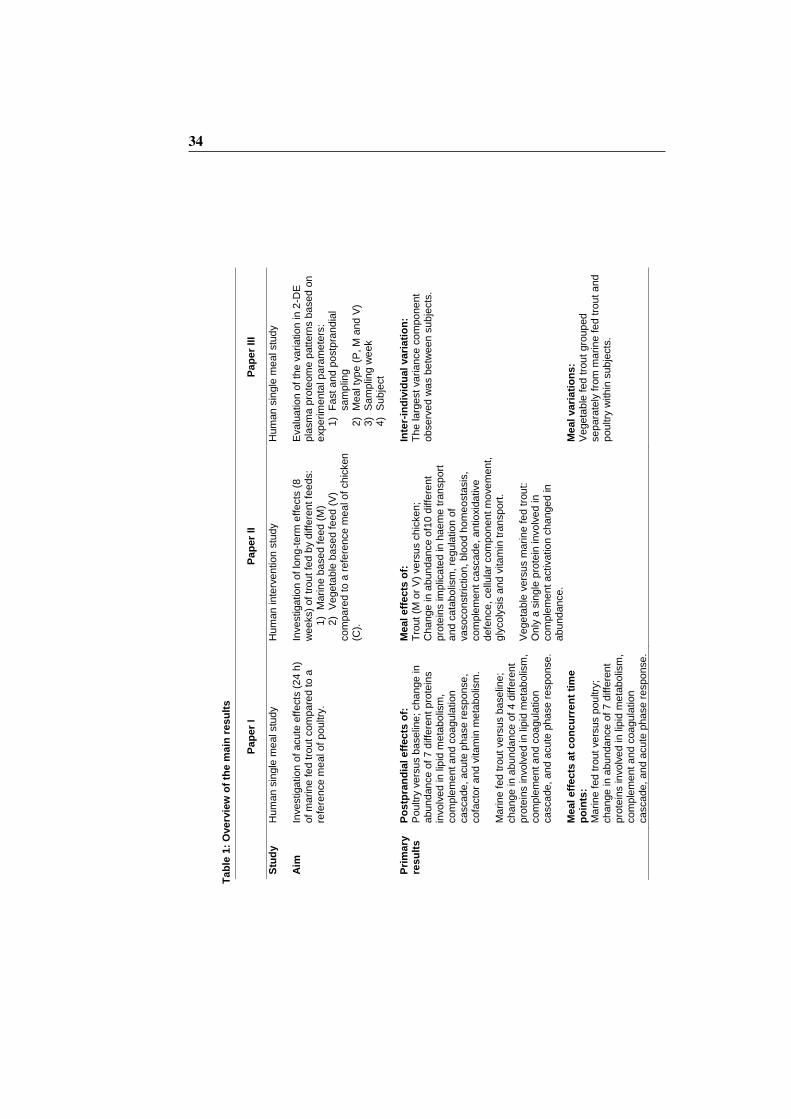
34
Tab
le 1
: O
ve
rvie
w o
f th
e m
ain
res
ult
s
P
ap
er
I P
ap
er
II
Pa
per
III
Stu
dy
Hum
an
sin
gle
me
al stu
dy
Hum
an
in
terv
en
tio
n s
tud
y
Hum
an
sin
gle
me
al stu
dy
Aim
In
ve
stiga
tio
n o
f a
cu
te e
ffe
cts
(24
h)
of
ma
rin
e fe
d t
rou
t com
pa
red
to
a
refe
ren
ce
mea
l of
po
ultry
.
Inve
stiga
tio
n o
f lo
ng
-term
eff
ects
(8
we
eks)
of
tro
ut fe
d b
y d
iffe
rent fe
ed
s:
1)
Ma
rin
e b
ase
d fe
ed
(M
) 2
) V
ege
tab
le b
ase
d f
eed
(V
)
co
mpa
red t
o a
refe
rence
mea
l of
ch
icken
(C
).
Eva
lua
tio
n o
f th
e v
aria
tion
in
2-D
E
pla
sm
a p
rote
om
e p
att
ern
s b
ased
on
e
xp
erim
en
tal p
ara
me
ters
: 1
) F
ast
and
po
stp
ran
dia
l sa
mp
ling
2)
Me
al ty
pe
(P
, M
an
d V
) 3
) S
am
plin
g w
ee
k
4)
Su
bje
ct
Pri
ma
ry
res
ult
s
Po
stp
ran
dia
l e
ffe
cts
of:
P
ou
ltry
ve
rsus b
ase
line
; cha
nge
in
a
bun
dan
ce
of
7 d
iffe
ren
t p
rote
ins
invo
lve
d in
lip
id m
eta
bo
lism
, co
mp
lem
en
t a
nd
coa
gu
latio
n
ca
sca
de
, a
cu
te p
ha
se
resp
on
se
, cofa
cto
r and
vita
min
me
tabo
lism
. M
arin
e f
ed
tro
ut
ve
rsus b
ase
line
; ch
an
ge
in
abu
nda
nce
of
4 d
iffe
ren
t p
rote
ins in
vo
lve
d in
lip
id m
eta
bo
lism
, co
mp
lem
en
t a
nd
coa
gu
lation
ca
sca
de
, an
d a
cu
te p
ha
se
respo
nse
.
Me
al
eff
ec
ts o
f:
Tro
ut
(M o
r V
) ve
rsus c
hic
ken
;
Cha
nge
in
ab
un
da
nce o
f10 d
iffe
ren
t p
rote
ins im
plic
ate
d in
ha
em
e t
ran
sp
ort
a
nd
ca
tab
olis
m, re
gu
latio
n o
f va
so
co
nstr
ictio
n, b
lood h
om
eo
sta
sis
, co
mp
lem
en
t ca
scad
e,
an
tio
xid
ative
d
efe
nce
, ce
llula
r com
po
nen
t m
ove
men
t,
gly
co
lysis
an
d v
ita
min
tra
nsp
ort
. V
ege
tab
le v
ers
us m
arin
e fe
d t
rou
t:
On
ly a
sin
gle
pro
tein
invo
lve
d in
co
mp
lem
en
t a
ctiva
tio
n c
ha
nge
d in
a
bun
dan
ce
.
Inte
r-in
div
idu
al
va
ria
tio
n:
The
la
rge
st
va
ria
nce
co
mpo
ne
nt
ob
se
rve
d w
as b
etw
ee
n s
ub
jects
.
M
ea
l e
ffe
cts
at
co
nc
urr
en
t ti
me
p
oin
ts:
M
arin
e f
ed
tro
ut
ve
rsus p
ou
ltry
; ch
an
ge
in
abu
nda
nce
of
7 d
iffe
ren
t p
rote
ins in
vo
lve
d in
lip
id m
eta
bo
lism
, co
mp
lem
en
t a
nd
coa
gu
lation
ca
sca
de
, an
d a
cu
te p
ha
se
respo
nse
.
M
ea
l va
ria
tio
ns:
Ve
ge
tab
le f
ed
tro
ut
gro
up
ed
se
pa
rate
ly f
rom
ma
rin
e f
ed
tro
ut a
nd
p
ou
ltry
with
in s
ub
jects
.

6.5 Acute postprandial effects of trout and poultry 35
6.5 Acute postprandial effects of trout and poultry
To give an overview of the main findings from the present PhD project, aim andmain results from the two human studies are summarised in Table 1. Firstly, weaimed at examining the acute postprandial changes in the plasma proteome andlipid profile of elderly healthy men after single meal intake of trout and poultry.Furthermore, it was warranted to investigate whether the 2-DE based approachwas an applicable tool to detect the postprandial changes in plasma proteins. Sincemost individuals spend a large portion of their daytime in the postprandial state, itis essential to investigate how dietary components affect the biochemical and phy-siological processes within the human body. In healthy subjects, n-3 LCPUFAshave been reported to reduce the magnitude of the postprandial TAG response [Avi-ram et al., 1986; Zampelas et al., 1994], but this was not demonstrated in the singlemeal study (Fig.1, paper 1). The change in plasma TAG concentration followingintake of trout and poultry resulted in a bell-shaped postprandial response, whichis in congruence with previous findings [Callow et al., 2002; Heath et al., 2003;Overgaard et al., 2008]. All subjects demonstrated well-controlled lipid homeosta-sis which is an important reflection of their metabolic efficiency, but no significantdifference was observed between the two TAG responses. The amount of fat in thetest meal and the inter-individual variability in the response, probably caused bydifferences in metabolism may be a contributing factor for the lack of TAG lower-ing effect of trout compared to poultry. In contrast, single meal studies in healthysubjects have demonstrated a reduced postprandial lipaemia following fish oil in-take in comparison with a fat load primarily containing saturated fat [Aviram et al.,1986; Zampelas et al., 1994]. However, the given fat loads were far greater thanthose consumed in the present trout meal. Furthermore, it should be noted, thatonly five subjects were included in the study but the applied cross-over design, inwhich the different treatments are evaluated on the same subject, reduces the num-ber of subjects required to produce similar precision compared to parallel design[Elbourne et al., 2002].
After single meal intake of trout and poultry, we were able to detect postpran-dial changes during 24 h in human plasma proteins (Table 1, paper I). By useof fractionated plasma depleted of the top 12 abundant proteins, the resolutionof the 2-DE gel images was greatly improved which increased the possibility toquantify the lower abundant proteins. Image analysis of silver stained 2-DE gelsresulted in the detection of 1157 spots separated according to charge and mole-cular weight. Of these, a total of 17 spots were found to change significantly inabundance in the postprandial state relative to baseline (pre-prandial state) aftereither the trout or poultry meal. None of the spots changed in response to bothmeals, which indicates that the two type of meals elicited different responses inplasma. By comparison of trout and poultry at concurrent time points, 14 spotswere significantly changed. Based on mass spectrometry, the significant spots re-flected proteins categorised to be involved in different biological processes as lipid

36
transport, coagulation and complement cascade, acute phase response as well ascofactor and vitamin metabolism. However, it should be noted, that some of thesignificant changed spots were IgY-target spots, which should have been retainedby the column. Therefore, these proteins must be interpreted with caution. Themeal induced fold changes after trout and poultry intake relative to baseline (ta-ble 1, paper 1) were small. Thus, one might speculate if the variation caused bythe IgY-column fractionation may have added substantially to these results. Thisseems not to be the case since the meal induced fold changes of the significantspots were higher than the CVs of the same spots in the replicate data set with theexception of spot 750 (ficolin 3, a non-IgY- target protein) and 937 (haptoglobin,an IgY-target protein). These spots had a higher CV% in the replicate data set andthe meal response of those two spots may be doubtful. Furthermore, significantbaseline variations in spot volumes of 859 and 923 was seen and the meal responseof trout compared to poultry of these spots shown in table 2 should be interpretedwith caution since the baseline variation may confould the shown meal effects.The postprandial response of trout and poultry compared to baseline variations ofthe non-significant spot 818 is shown in Fig.11. It is demonstrated that the post-prandial response exceeded baseline variations in four out of five subjects in spiteof the postprandial change in spot volume was not signicant. Taken together, themeal induced changes of the plasma proteins detected in the present study are trueand it is furthermore important to keep in mind that dietary compounds often havea subtle, but relevant effects on biomarkers of health [de Roos and McArdle 2008].
Ficolin-3, a non-IgY-target protein, was found significant at time 6 h as well as24 h after poultry intake compared to baseline (table 1 in paper I). This protein ischosen as an example to illustrate the error structure of a significant non-IgY-targetprotein due to the isoforms present, even though the CV of spot 750 was higherin the replicate data compared to the postprandial induced changes. However, thehigh CV was probably due to a very low spot volume in a single replicate gel. Thepostprandial time course of the ficolin-3 isoforms, spot 750 and 745, is shown inFig. 12, in which a parallel and gradual decline in volume intensity of both spots isseen. Despite the high risk of false positives in multiple testing [Biron et al., 2006],the time course of these spots clearly indicates that the postprandial change was notappeared by chance. This is supported by the fact that both isoforms decreased overtime, even though the earlier time points were not significantly changed, and theaffected pathway was also relevant according to meal intake.
A 2-DE based approach is powerful for the high resolution separation of proteinsin a complex mixture as plasma [Zimny-Arndt et al., 2009]. However, the majorlimitation of the 2-DE gel based approach is the rather time consuming steps in-cluding sample preparation, 2-DE, staining, image analysis, statistical analysis ofdata and protein identification. The visualisation of proteins can be obtained by ap-plication of various staining techniques as organic dye, silver stain, reverse stain,fluorescent stain, radio-labelling and chemiluminescent stain [Patton 2002]. Allthe 2-DE results from the enclosed papers are based on a sensitive silver staining
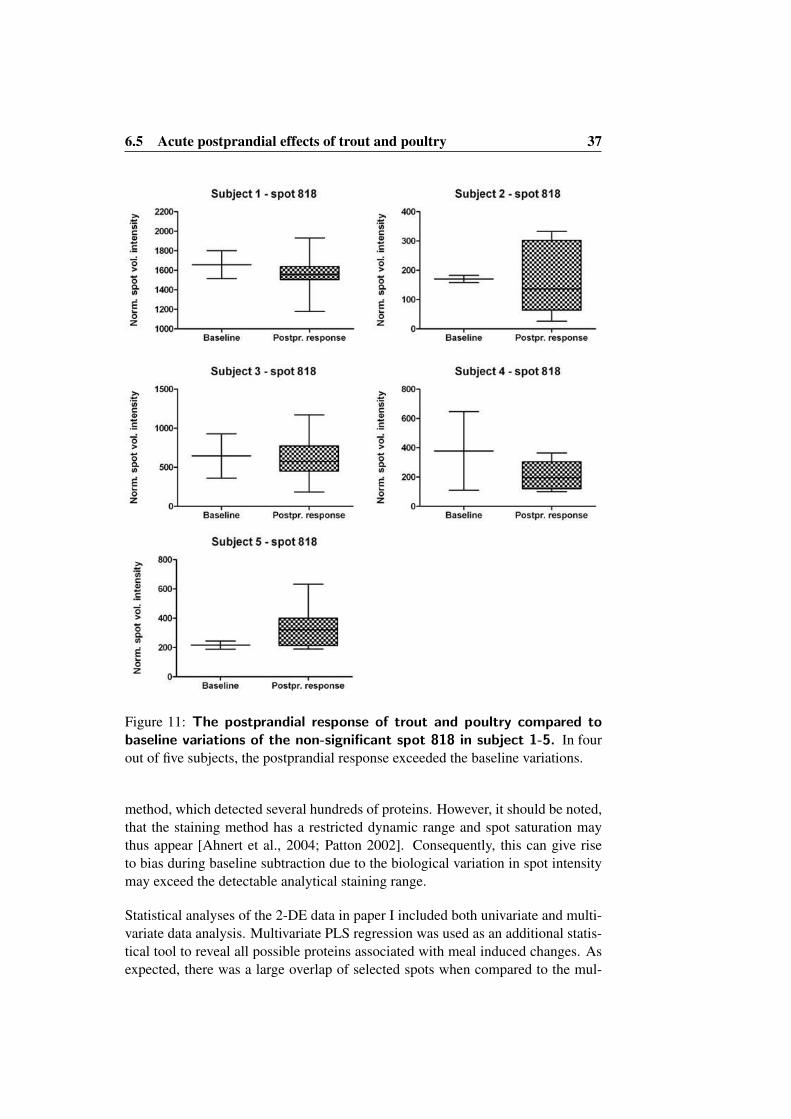
6.5 Acute postprandial effects of trout and poultry 37
Figure 11: The postprandial response of trout and poultry compared tobaseline variations of the non-significant spot 818 in subject 1-5. In fourout of five subjects, the postprandial response exceeded the baseline variations.
method, which detected several hundreds of proteins. However, it should be noted,that the staining method has a restricted dynamic range and spot saturation maythus appear [Ahnert et al., 2004; Patton 2002]. Consequently, this can give riseto bias during baseline subtraction due to the biological variation in spot intensitymay exceed the detectable analytical staining range.
Statistical analyses of the 2-DE data in paper I included both univariate and multi-variate data analysis. Multivariate PLS regression was used as an additional statis-tical tool to reveal all possible proteins associated with meal induced changes. Asexpected, there was a large overlap of selected spots when compared to the mul-

38
Figure 12: The postprandial response of ficolin-3 isoforms. The postprandialtime course of spot 745 and 750 identified as ficolin-3 shows a parallel and gradualdecline in spot volume intensity. The insert shows the distribution of the two spotson the gel.
tivariate method, but some spots were only significantly selected by use of PLS.Thus, in order to find all relevant spots in the data analysis it is suggested to useunivariate statistics combined with multivariate methods [Jensen et al., 2008]. Con-clusively, despite methodological limitations of the IgY-12 column and the 2-DE,this proteomic approach has provided insigths into the effects of meal intake onplasma proteins. A further understanding of the metabolic mechanisms of proteintargets of nutrients is important contributions to knowledge of food based outcomesin terms of health and disease.
6.6 Long-term effects of trout fed a marine or a vegetable based feed
Reduced availability of wild fish is a major challenge for the aquaculture sector.Therefore, different feeding regimes of plant origins are evaluated as alternativesto fish bone meal and fish oil. However, the impact of a change in feed composi-tion on human health is largely unknown. Thus, we secondly aimed at investigatingwhether a change in feed composition of farmed trout affected health of consumersassessed by plasma proteome analysis. A parallel eight week dietary interventionstudy was conducted in adult males as described in paper II, in which subjectsconsumed a daily meal of farmed trout raised either on pure marine diet or purevegetable diet, or a reference meal of chicken. Plasma proteins, depleted of the 12high abundant proteins, revealed a total of 681 distinct separated high-quality spots

6.7 Inter-individual variation 39
visualised by silver staining. Based on delta spot volumes (baseline subtractedspots), a total of 23 spots changed significantly in abundance when comparing thethree intervention groups of marine fed trout, vegetable fed trout and chicken. Ofthese, 18 spots were identified by mass spectrometry and the proteins were linkedto the various biological processes haeme transport and catabolism, regulation ofvasoconstriction, blood haemostasis, complement cascade, antioxidative defence,cellular component movement, glycolysis and vitamin transport (Table 2, paperII). Nine spots were significantly changed in abundance after intake of marine fedtrout compared to chicken and ten spot after intake of vegetable fed trout com-pared to chicken. Two of the affected spots were changed after both types of troutmeals. Only a single spot identified as complement c1r was increased in the groupconsuming the vegetable fed trout compared to the marine fed trout. This pro-tein is involved in the complement system which is a major component of hostdefence. The system initiates a cascade of highly regulated activation steps cul-minating in the membrane attack complex resulting in cytolysis [Porter and Reid1978]. However, inappropriate activation of the complement system can also con-tribute to inflammation seen in various pathological conditions [Morgan and Harris2003]. This finding is of significance since inflammation plays a central role in thedevelopment of atherosclerosis. Indeed, if future replacement of fish oil with ve-getable oils becomes inevitably, it is important to know more about the nutritionalconsequences of such replacement for the consumer. From a nutritional point ofview, vegetable oils rich in ALA would be of choice in feed for farmed trout, sincesalmonids are capable of converting ALA to its more biological active forms of n-3PUFA, EPA and DHA [Sargent and Tacon 1999].
6.7 Inter-individual variation
The biological variation of the human population is a major obstacle in clini-cal studies and biomarker discovery. Factors like sex, age, genetic background,health status and lifestyle may contribute to this variability [Anderson and Ander-son 2002; Nedelkov 2008; Winkler et al., 2008]. Proteomic studies need to addressthe biological variation in protein expression between individuals in the generalpopulation before application of biomarkers in clinical research. This variationbetween individuals may influence the protein in a way that might enhance or de-grade its performance as a biomarker. To date, the knowledge of the quantitativedifferences in plasma protein expression across the general population is limitedand only few studies have investigated the inter-individual variability of differentproteomes. Hence, the need for a better understanding within this research fieldis urgently needed. Thus, we thirdly aimed at investigating the extent of the bio-logical variation between subjects with respect to protein abundance assessed bymeasurements of the plasma proteome profiles in healthy elderly men. By use ofthe 2-DE data set (a total of 483 distinct separated high-quality spots) from the sin-gle meal study following applications of multivariate methods, PCA and PLSR, we

40
revealed the individual differences between subjects (paper III). Multivariate dataanalysis is a valuable tool since it offers a strong approach for evaluation of 2-DEbased protein profiles to get an overview of the main variation and structure in data[Jensen et al., 2008; Karp and Lilley 2007]. PCA analysis was performed to get anoverview of how the experimental parameters including fasting versus postprandialsampling, meal type, sampling week and subject contributed to the main variationin the data set (Fig.1, paper III). Results from the PCA scores plot revealed that thevariation between subjects represented the largest variance component exceedingthe other measured experimental parameters. By use of PLS regression of the totalproteome data set (Table 1, paper III), a large number of spots were demonstratedto be differentially expressed between subjects. Furthermore, analysing the datawith a longitudinal approach revealed an effect of the meals. PCAs on the sub-jects one by one showed that postprandial samples taken after intake of the troutfed a vegetable based feed grouped separately from samples taken after intake ofthe other two meals (Fig.2, paper III). In four of five subjects there was a grou-ping according to meal, however, of different extent (distance between groups) inthe subjects. Due to the detection of the significant IgY-target spots shown in pa-per I, it is essential to examine whether the IgY-12 column may have added thepresent results concerning the groping of samples due to individual variation. Thedistribution of the known IgY-target spots was examined and they were found tobe randomly distributed in the loading plot from the PCA analysis of the experi-mental parameters (Fig.1 paper III) and also in the PCA loading plot of the spotsthat were differentially expressed between subjects (Fig.4, paper III). Furthermore,excluding the IgY-target spots from the data matrix resulted in the similar and cleargrouping of the individuals in the PCA scores plot. Conclusively, these resultsindicate that the IgY-12 fractionation has not contributed to the present results con-cerning inter-individual variability.
The inter-individual variability can of course not be avoided but has to be taken intoconsideration in the experimental study design, analytical proteomic strategy andinterpretation of the obtained results. Many authors have acknowledged the inter-individual variability in humans, however, the extent of variation remains unclearand is an important factor to try and quantify. From the results achieved in paper III,we have demonstrated that cross-over studies using an individual as its own controland measure analyte variations over time is an important experimental design forstudying human plasma proteins due to large biological variation between indivi-duals. In this regard, these findings contribute to the further understanding of thehuman proteome variability improving the biomarker discovery process being ableto discover new biomarkers that reflect early functional changes of importance.
Biomarkers measured in homeostatic perturbations such as challenge test may bemore valuable compared to the same biomarkers based on homeostatic condi-tions (fasting state) [van Ommen et al., 2009]. We obtained perturbations witha metabolic challenge in the human body in the form of a meal following post-prandial measurements (the single meal study). This is a highly relevant challenge

6.7 Inter-individual variation 41
since much of the 24 h day is spent in the non-fasting state. The value of challengetest is demonstrated in a recent cohort investigation, the Womens Health Study,examining the fasting compared to non-fasting TAG levels in relation to CVD risk[Bansal et al., 2007]. Postprandial plasma TAG was shown to be associated withincreased cardiovascular events while the fasting TAG showed little relationship.Thus, postprandial measures may be more robust indicators of disease risk andthe great variability of postprandial levels between individuals provides importantinformation about an individuals metabolism. However, these challenge tests war-rant further investigations as indicators of the metabolic state to detect the accuratedisease risk.

42
7 Conclusions
Based on the 2-DE proteomic investigation of dietary induced changes in the hu-man plasma profiles from the single meal study and the intervention study, weconclude that:
• Consumption of single meals of poultry or trout elicited acute postprandialchanges in abundance of several plasma proteins implicated in the differentbiological processes lipid transport, complement and coagulation cascade,acute phase response as well as cofactor and vitamin metabolism. Intakeof trout and poultry elicited no differences in the postprandial bell-shapedTAG response. A 2-DE based approach, however in refined ways, may be avaluable tool with respect to detection of the postprandial induced changesin human plasma proteins.
• An eight week dietary intervention with chicken and trout fed either a ma-rine based feed or a vegetable based feed revealed a change in abundanceof plasma proteins involved in the biological processes haeme transport andcatabolism, regulation of vasoconstriction, blood haemostasis, complementcascade, antioxidative defence, cellular component movement, glycolysisand vitamin transport. Furthermore, the change in feed composition of trouthad a lower impact on the plasma protein profiling in contrast to the diffe-rences in response after intake of trout compared to chicken.
• The inter-individual variability represented the largest observed variance com-ponent exceeding fasting or postprandial sampling, meal type (poultry, ma-rine and vegetable fed trout) and sampling week). Thus, the inter-individualvariability is a significant factor for comparative proteomic studies and needsto be taken into account in the experimental design of human studies and in-terpretation of data. Furthermore, cross-over design in which each individualacts as its own control and longitudinal sampling on the basis of a physio-logical challenge (e.g. meal intake) seems more informative than parallelstudy design.
These conclusions are summerised in Figure 13.

7 Conclusions 43
Figure 13: Overview of conclusions. B = baseline, P = poultry, M = marinefed trout and V = vegetable fed trout.
44
8 Future perspectives
This thesis has contributed to the clarification of several research questions andconcurrently generated new issues and perspectives, which require further investi-gation.
In relation to diet induced changes in human plasma proteins, we need to increaseour understanding of the underlying molecular mechanisms that are in play to im-prove health and prevent the onset of disease. We have shown a measurable effecton a number of proteins implicated in various pathways of importance for chronicdisease such as CVD. A further understanding within this research field will have alarge impact on public health. Specifically, development of proteomic tools basedon the identification of new plasma proteomic biomarkers that identify metabolicchanges in specific tissue and organ is needed to clarify the complex mechanismsof action. These novel biomarkers, compared to already known risk markers, willallow early detection of the onset of disease or, ideally, the pre-disease state.
In the present study, we have examined the impact of mixed meals on humanplasma proteins. The effects of single nutrient components, protein, lipid and car-bohydrate and their interactions on metabolism will be interesting to investigate. Infuture nutritional studies, we should focus on the experimental design to increasethe sensitivity of detecting and identifying biological changes related to dietaryinduced health effects. We have demonstrated that cross-over studies using an in-dividual as its own control and measure analyte variations over time are a verysensitive experimental design.
Based on the results from the dietary intervention study with differently fed trout,new studies should be performed to further evaluate the influence of the change infeeding regimes for farmed trout in relation to the nutritional properties of the fishespecially with focus on n-3 LCPUFA content. This is an important issue to clarifydue to the well-documented beneficial effects of these fatty acids.

9 2-DE based plasma proteomics:Lessons learned 45
9 2-DE based plasma proteomics:Lessons learned
Based on 2-DE proteomics, we were able to detect and identify a number of po-tential candidate proteins in human plasma that were affected after intake of troutcompared to poultry both according to acute and long-term effects. The candi-date proteins are related to pathways involved in transportation of food compo-nents, lipid modulating processes, immune function and anti-oxidative defence.The present approach, though optimised with respect to methodology and designoffers a potential for revealing nutritional biomarkers, also supported by the factthat proteins found significant in the present study are involved in likely pathwaysrelated to dietary consumption.
During the work with plasma proteomics, several barriers were encountered in-cluding the extreme dynamic range of plasma proteins spanning at least ten ordersof magnitude and the resulting requirement for fractionation to reveal even a mo-dest number of proteins. Depletion of the high abundant proteins, which comprisethe vast majority of total protein mass, greatly improved the resolution of the gels,but the lower abundant proteins were still out of reach. However, in quantitativeplasma proteomic studies based on immunoaffinity capturing, it is important tokeep in mind the risk of not only the potential non-selective loss of protein can-didates but also incomplete absorption ability of the column as suggested by thepresent results. Furthermore, the present 2-DE approach has limitations. 2-DE islaborious due to multiple analytical steps which may increase the risk of bias. Gelto gel variations often occurs and the applied silver staining has a limited dynamicrange. Moreover, multiple testing increases the risk of false positives. On the con-trary, 2-DE enable the simultaneous analysis of hundreds of proteins, access toposttranslational modifications and a relative quantification on the 2-DE images.Pre-analytical factors such as sample collection, storage and handling as well asanalytical factors can have profound effects on the outcome of a discovery study.In addition, the biological variation of the subjects may also contribute to bias. Oneway to cope with this inter-individual variation is to conduct carefully controlledstudies e.g. cross-over studies, in which each subjects participate both in the con-trol and test group, due to the variation within a subject is usually smaller than thatseen between subjects.
Clearly, proteomics studies do not lead to biomarkers that directly can be appliedin clinical diagnostics; the journey from discovery to practical implementation inclinical diagnostics is still long and uncertain. 2-DE based proteomics should beconsidered as a screening tool that offers a well-established approach to find newbiomarkers of plasma - the circulating representation of all body tissue and thus themost comprehensive human proteome. These candidate proteins must be furtherverified and validated in large-scale studies required to determine the key para-meters for diagnostics test such as biological variability, sensitivity and specificity
46
according to target state, and the contribution in various multi biomarker panels[Anderson 2005b]. Despite the high potential of plasma proteomics for biomarkerdiscovery and vast amount of intensified research and investment, a paradoxicallydecline is observed in the number of new biomarkers approved for clinical diagnos-tics [Anderson and Anderson 2002]. The reason for the shortage of new biomar-kers is probably related to the high false discovery rate of biomarkers in proteomicstechnologies arisen from biological and technical variability in combination witha lack of robust methods for biomarker verification in clinical large sample sets[Anderson 2005; Rifai et al., 2006; Carr and Anderson 2008]. Currently, there isno ideal, extensive biomarker discovery platform for plasma proteomics. A stan-dard biomarker pipeline is urgently needed that relieves the bottleneck betweenbiomarker discovery and clinical validation.
The emerging technology of mass spectrometry targeted protein quantification hasincreasingly becoming important for biomarker development in clinical research[Pan et al., 2009; Anderson 2005]. The absolute quantification relies on the useof stable isotopes labelled reference peptides/proteins which acts as internal stan-dards, enabling protein quantification by comparing the signals from the exoge-nously labelled and the corresponding unlabelled peptide. In a recent study, massspectrometry-based multiple reaction monitoring of proteins revealed the absolutequantification of 45 endogenous proteins in human plasma based on trypsin di-gests without prior affinity depletion or enrichment [Kuzyk et al., 2009]. Futureproteomics technologies should to be able to detect biomarker candidates in thepresence of high abundance proteins to avoid depletion of candidate proteins dueto non-specific binding to high abundant proteins. Development of standard, robustsample preparation strategies and more sophisticated technologies like the targetedMS methods in combination with novel data processing methods are expected toprovide a smoother path from science to practice than exists today.

REFERENCES 47
References
[Aebersold and Mann, 2003] Aebersold, R. and Mann, M. (2003). Massspectrometry-based proteomics. Nature, 422(6928):198–207.
[Ahnert et al., 2004] Ahnert, N., Patton, W., and Schulenberg, B. (2004). Opti-mized conditions for diluting and reusing a fluorescent protein gel stain. Elec-trophoresis, 25(15):2506–2510.
[Ait et al., 2005] Ait, Y. D., Madani, S., Prost, J., Bouchenak, M., and Belleville,J. (2005). Fish protein improves blood pressure but alters hdl2 and hdl3 compo-sition and tissue lipoprotein lipase activities in spontaneously hypertensive rats.Eur.J.Nutr., 44(1):10–17.
[Anderson, 2005a] Anderson, L. (2005a). Candidate-based proteomics in thesearch for biomarkers of cardiovascular disease. J.Physiol, 563(Pt 1):23–60.
[Anderson, 2005b] Anderson, N. (2005b). The roles of multiple proteomic plat-forms in a pipeline for new diagnostics. Mol.Cell Proteomics, 4(10):1441–1444.
[Anderson and Anderson, 1978] Anderson, N. and Anderson, N. (1978). Ana-lytical techniques for cell fractions. xxii. two-dimensional analysis of serumand tissue proteins: multiple gradient-slab gel electrophoresis. Anal.Biochem.,85(2):341–354.
[Anderson and Anderson, 1996] Anderson, N. and Anderson, N. (1996). Twentyyears of two-dimensional electrophoresis: past, present and future. Elec-trophoresis, 17(3):443–453.
[Anderson and Anderson, 2002] Anderson, N. and Anderson, N. (2002). The hu-man plasma proteome: history, character, and diagnostic prospects. Mol.CellProteomics, 1(11):845–867.
[Arab, 2003] Arab, L. (2003). Biomarkers of fat and fatty acid intake. J.Nutr., 133Suppl 3:925S–932S.
[Ascherio et al., 1995] Ascherio, A., Rimm, E., Stampfer, M., Giovannucci, E.,and Willett, W. (1995). Dietary intake of marine n-3 fatty acids, fish intake, andthe risk of coronary disease among men. N.Engl.J.Med., 332(15):977–982.
[Aviram et al., 1986] Aviram, M., Brox, J., and Nordoy, A. (1986). Acute effectsof dietary cod liver oil and cream on plasma lipoproteins. Ann.Nutr.Metab,30(2):143–148.
[Bang and Dyerberg, 1972] Bang, H. and Dyerberg, J. (1972). Plasma lipids andlipoproteins in greenlandic west coast eskimos. Acta Med.Scand., 192(1-2):85–94.

48 REFERENCES
[Banks et al., 2005] Banks, R., Stanley, A., Cairns, D., Barrett, J., Clarke, P.,Thompson, D., and Selby, P. (2005). Influences of blood sample processingon low-molecular-weight proteome identified by surface-enhanced laser des-orption/ionization mass spectrometry. Clin.Chem., 51(9):1637–1649.
[Bansal et al., 2007] Bansal, S., Buring, J., Rifai, N., Mora, S., Sacks, F., and Rid-ker, P. (2007). Fasting compared with nonfasting triglycerides and risk of car-diovascular events in women. JAMA, 298(3):309–316.
[Barlow, 2000] Barlow, S. (2000). Fish meal and fish oil: Sustainable feed ingre-dients for aquafeeds. Global Aquaculture Advocate, 4:85–88.
[Barnes and Kim, 2004] Barnes, S. and Kim, H. (2004). Nutriproteomics: iden-tifying the molecular targets of nutritive and non-nutritive components of thediet. J.Biochem.Mol.Biol., 37(1):59–74.
[Bergeron et al., 1992] Bergeron, N., Deshaies, Y., and Jacques, H. (1992). Di-etary fish protein modulates high density lipoprotein cholesterol and lipoproteinlipase activity in rabbits. J.Nutr., 122(8):1731–1737.
[Bergeron et al., 1991] Bergeron, N., Deshaies, Y., Lavigne, C., and Jacques, H.(1991). Interaction between dietary proteins and lipids in the regulation of serumand liver lipids in the rabbit. effect of fish protein. Lipids, 26(9):759–764.
[Berth et al., 2007] Berth, M., Moser, F., Kolbe, M., and Bernhardt, J. (2007). Thestate of the art in the analysis of two-dimensional gel electrophoresis images.Appl.Microbiol.Biotechnol., 76(6):1223–1243.
[Biron et al., 2006] Biron, D., Brun, C., Lefevre, T., Lebarbenchon, C., Lox-dale, H., Chevenet, F., Brizard, J., and Thomas, F. (2006). The pitfalls ofproteomics experiments without the correct use of bioinformatics tools. Pro-teomics., 6(20):5577–5596.
[Bjellqvist et al., 1982] Bjellqvist, B., Ek, K., Righetti, P., Gianazza, E., Gorg,A., Westermeier, R., and Postel, W. (1982). Isoelectric focusing in im-mobilized ph gradients: principle, methodology and some applications.J.Biochem.Biophys.Methods, 6(4):317–339.
[Boukortt et al., 2004] Boukortt, F., Girard, A., Prost, J., it Yahia, D., Bouchenak,M., and Belleville, J. (2004). Fish protein improves the total antioxidantstatus of streptozotocin-induced diabetes in spontaneously hypertensive rat.Med.Sci.Monit., 10(11):BR397–BR404.
[Breslow, 2006] Breslow, J. (2006). n-3 fatty acids and cardiovascular disease.Am.J.Clin.Nutr., 83(6 Suppl):1477S–1482S.
[Bucher et al., 2002] Bucher, H., Hengstler, P., Schindler, C., and Meier, G.(2002). N-3 polyunsaturated fatty acids in coronary heart disease: a meta-analysis of randomized controlled trials. Am.J.Med., 112(4):298–304.

REFERENCES 49
[Burdge and Calder, 2005] Burdge, G. and Calder, P. (2005). Conversion of alpha-linolenic acid to longer-chain polyunsaturated fatty acids in human adults. Re-prod.Nutr.Dev., 45(5):581–597.
[Calder, 2004] Calder, P. (2004). n-3 fatty acids and cardiovascular disease: evi-dence explained and mechanisms explored. Clin.Sci.(Lond), 107(1):1–11.
[Calder, 2007] Calder, P. (2007). Immunomodulation by omega-3 fatty acids.Prostaglandins Leukot.Essent.Fatty Acids, 77(5-6):327–335.
[Callow et al., 2002] Callow, J., Summers, L., Bradshaw, H., and Frayn, K.(2002). Changes in ldl particle composition after the consumption of mealscontaining different amounts and types of fat. Am.J.Clin.Nutr., 76(2):345–350.
[Carr and Anderson, 2008] Carr, S. and Anderson, L. (2008). Protein quantita-tion through targeted mass spectrometry: the way out of biomarker purgatory?Clin.Chem., 54(11):1749–1752.
[Castellanos-Serra and Paz-Lago, 2002] Castellanos-Serra, L. and Paz-Lago, D.(2002). Inhibition of unwanted proteolysis during sample preparation: evalu-ation of its efficiency in challenge experiments. Electrophoresis, 23(11):1745–1753.
[Chin and Dart, 1995] Chin, J. and Dart, A. (1995). How do fish oils affect vascu-lar function? Clin.Exp.Pharmacol.Physiol, 22(2):71–81.
[Corzett et al., 2006] Corzett, T., Fodor, I., Choi, M., Walsworth, V., Chromy, B.,Turteltaub, K., and Cutchen-Maloney, S. (2006). Statistical analysis of the ex-perimental variation in the proteomic characterization of human plasma by two-dimensional difference gel electrophoresis. J.Proteome.Res., 5(10):2611–2619.
[Crosley et al., 2009] Crosley, L., Duthie, S., Polley, A., Bouwman, F., Heim, C.,Mulholland, F., Horgan, G., Johnson, I., Mariman, E., Elliott, R., Daniel, H., andde, R. B. (2009). Variation in protein levels obtained from human blood cellsand biofluids for platelet, peripheral blood mononuclear cell, plasma, urine andsaliva proteomics. Genes Nutr., 4(2):95–102.
[Daviglus et al., 1997] Daviglus, M., Stamler, J., Orencia, A., Dyer, A., Liu, K.,Greenland, P., Walsh, M., Morris, D., and Shekelle, R. (1997). Fish con-sumption and the 30-year risk of fatal myocardial infarction. N.Engl.J.Med.,336(15):1046–1053.
[de Francesco et al., 2004] de Francesco, M., Parisi, G., Medale, F., Lupi, P.,Kaushik, S., and Poli, B. (2004). Effect of long-term feeding with a plant pro-tein mixture based diet on growth and body/fillet quality traits of large rainbowtrout (oncorhynchus mykiss). Aquaculture, 236(1-4):413–429.

50 REFERENCES
[de Roos, 2008] de Roos, B. (2008). Proteomic analysis of human plasma andblood cells in nutritional studies: development of biomarkers to aid disease pre-vention. Expert.Rev.Proteomics., 5(6):819–826.
[de Roos et al., 2008] de Roos, B., Duthie, S., Polley, A., Mulholland, F., Bouw-man, F., Heim, C., Rucklidge, G., Johnson, I., Mariman, E., Daniel, H., andElliott, R. (2008). Proteomic methodological recommendations for studiesinvolving human plasma, platelets, and peripheral blood mononuclear cells.J.Proteome.Res., 7(6):2280–2290.
[de Roos B., 2009] de Roos B. (2009). Nutrition proteomics and biomarker dis-covery. Expert.Rev.Proteomics, 6(4):349–351.
[de Roos B. and McArdle, 2008] de Roos B. and McArdle, H. (2008). Proteomicsas a tool for the modelling of biological processes and biomarker developmentin nutrition research. Br.J.Nutr., 99 Suppl 3:S66–S71.
[Deckelbaum et al., 2006] Deckelbaum, R., Worgall, T., and Seo, T. (2006). n-3fatty acids and gene expression. Am.J.Clin.Nutr., 83(6 Suppl):1520S–1525S.
[Desrosiers et al., 2007] Desrosiers, R., Beaulieu, E., Buchanan, M., and Be-liveau, R. (2007). Proteomic analysis of human plasma proteins by two-dimensional gel electrophoresis and by antibody arrays following depletion ofhigh-abundance proteins. Cell Biochem.Biophys., 49(3):182–195.
[Domon and Aebersold, 2006] Domon, B. and Aebersold, R. (2006). Mass spec-trometry and protein analysis. Science, 312(5771):212–217.
[Elbourne et al., 2002] Elbourne, D., Altman, D., Higgins, J., Curtin, F., Wor-thington, H., and Vail, A. (2002). Meta-analyses involving cross-over trials:methodological issues. Int.J.Epidemiol., 31(1):140–149.
[Elrick et al., 2006] Elrick, M., Walgren, J., Mitchell, M., and Thompson, D.(2006). Proteomics: recent applications and new technologies. BasicClin.Pharmacol.Toxicol., 98(5):432–441.
[Emken et al., 1994] Emken, E., Adlof, R., and Gulley, R. (1994). Dietary linoleicacid influences desaturation and acylation of deuterium-labeled linoleic andlinolenic acids in young adult males. Biochim.Biophys.Acta, 1213(3):277–288.
[Francis et al., 2001] Francis, G., Makkar, H., and Becker, K. (2001). Antinutri-tional factors present in plant-derived alternate fish feed ingredients and theireffects in fish. Aquaculture, 199(3-4):197–227.
[Fuchs et al., 2005] Fuchs, D., Winkelmann, I., Johnson, I., Mariman, E., Wen-zel, U., and Daniel, H. (2005). Proteomics in nutrition research: principles,technologies and applications. Br.J.Nutr., 94(3):302–314.
[Gawaz et al., 2005] Gawaz, M., Langer, H., and May, A. (2005). Platelets ininflammation and atherogenesis. J.Clin.Invest, 115(12):3378–3384.

REFERENCES 51
[Geleijnse et al., 2002] Geleijnse, J., Giltay, E., Grobbee, D., Donders, A., andKok, F. (2002). Blood pressure response to fish oil supplementation: metare-gression analysis of randomized trials. J.Hypertens., 20(8):1493–1499.
[Gorg et al., 2009] Gorg, A., Drews, O., Luck, C., Weiland, F., and Weiss, W.(2009). 2-de with ipgs. Electrophoresis, 30 Suppl 1:S122–S132.
[Gorg et al., 1991] Gorg, A., Postel, W., Friedrich, C., Kuick, R., Strahler, J., andHanash, S. (1991). Temperature-dependent spot positional variability in two-dimensional polypeptide patterns. Electrophoresis, 12(9):653–658.
[Gorg et al., 1988] Gorg, A., Postel, W., and Gunther, S. (1988). The currentstate of two-dimensional electrophoresis with immobilized ph gradients. Elec-trophoresis, 9(9):531–546.
[Gorg et al., 2004] Gorg, A., Weiss, W., and Dunn, M. (2004). Currenttwo-dimensional electrophoresis technology for proteomics. Proteomics,4(12):3665–3685.
[Graves and Haystead, 2002] Graves, P. and Haystead, T. (2002). Molecular biol-ogist’s guide to proteomics. Microbiol.Mol.Biol.Rev., 66(1):39–63.
[Gygi and Aebersold, 2000] Gygi, S. and Aebersold, R. (2000). Mass spectrome-try and proteomics. Curr.Opin.Chem.Biol., 4(5):489–494.
[Harris, 1996] Harris, W. (1996). n-3 fatty acids and lipoproteins: comparison ofresults from human and animal studies. Lipids, 31(3):243–252.
[Heath et al., 2003] Heath, R., Karpe, F., Milne, R., Burdge, G., Wootton, S., andFrayn, K. (2003). Selective partitioning of dietary fatty acids into the vldl tgpool in the early postprandial period. J.Lipid Res., 44(11):2065–2072.
[Herbert et al., 1998] Herbert, B., Molloy, M., Gooley, A., Walsh, B., Bryson,W., and Williams, K. (1998). Improved protein solubility in two-dimensionalelectrophoresis using tributyl phosphine as reducing agent. Electrophoresis,19(5):845–851.
[Hooper et al., 2006] Hooper, L., Thompson, R., Harrison, R., Summerbell, C.,Ness, A., Moore, H., Worthington, H., Durrington, P., Higgins, J., Capps, N.,Riemersma, R., Ebrahim, S., and Davey, S. G. (2006). Risks and benefits ofomega 3 fats for mortality, cardiovascular disease, and cancer: systematic re-view. BMJ, 332(7544):752–760.
[Horgan, 2007] Horgan, G. (2007). Sample size and replication in 2d gel elec-trophoresis studies. J.Proteome.Res., 6(7):2884–2887.
[Hsieh et al., 2006] Hsieh, S., Chen, R., Pan, Y., and Lee, H. (2006). Systemati-cal evaluation of the effects of sample collection procedures on low-molecular-weight serum/plasma proteome profiling. Proteomics, 6(10):3189–3198.

52 REFERENCES
[Hu et al., 2002] Hu, F., Bronner, L., Willett, W., Stampfer, M., Rexrode, K., Al-bert, C., Hunter, D., and Manson, J. (2002). Fish and omega-3 fatty acid intakeand risk of coronary heart disease in women. JAMA, 287(14):1815–1821.
[Hu and Willett, 2002] Hu, F. and Willett, W. (2002). Optimal diets for preventionof coronary heart disease. JAMA, 288(20):2569–2578.
[Hu et al., 2005] Hu, Y., Malone, J., Fagan, A., Townsend, R., and Holtzman, D.(2005). Comparative proteomic analysis of intra- and interindividual variationin human cerebrospinal fluid. Mol.Cell Proteomics, 4(12):2000–2009.
[Huang et al., 2005] Huang, L., Harvie, G., Feitelson, J., Gramatikoff, K., Herold,D., Allen, D., Amunngama, R., Hagler, R., Pisano, M., Zhang, W., and Fang,X. (2005). Immunoaffinity separation of plasma proteins by igy microbeads:meeting the needs of proteomic sample preparation and analysis. Proteomics,5(13):3314–3328.
[Hulmes et al., 2004] Hulmes, D., Bethea, D., Ho, K., Huang, S., Ricci, D.,Opiteck, G., and Hefta, S. (2004). An investigation of plasma collection, sta-bilization, and storage procedures for proteomic analysis of clinical samples.Clinical Proteomics Journal, 1:17–30.
[Jacobs et al., 2005] Jacobs, J., Adkins, J., Qian, W., Liu, T., Shen, Y., Camp, D.,and Smith, R. (2005). Utilizing human blood plasma for proteomic biomarkerdiscovery. J.Proteome.Res., 4(4):1073–1085.
[Jenkins et al., 2009] Jenkins, D., Sievenpiper, J., Pauly, D., Sumaila, U., Kendall,C., and Mowat, F. (2009). Are dietary recommendations for the use of fish oilssustainable? CMAJ., 180(6):633–637.
[Jenkins et al., 2008] Jenkins, R., Kitteringham, N., Greenough, C., and Park, B.(2008). Albumin and immunoglobulin depletion of human plasma. MethodsMol.Biol., 425:15–25.
[Jensen et al., 2008] Jensen, K., Jessen, F., and Jorgensen, B. (2008). Multivariatedata analysis of two-dimensional gel electrophoresis protein patterns from fewsamples. J.Proteome.Res., 7(3):1288–1296.
[Jiang et al., 2004] Jiang, L., He, L., and Fountoulakis, M. (2004). Comparison ofprotein precipitation methods for sample preparation prior to proteomic analy-sis. J.Chromatogr.A, 1023(2):317–320.
[Karp and Lilley, 2007] Karp, N. and Lilley, K. (2007). Design and analysis issuesin quantitative proteomics studies. Proteomics, 7 Suppl 1:42–50.
[Kim et al., 2004] Kim, H., Page, G., and Barnes, S. (2004). Proteomics and massspectrometry in nutrition research. Nutrition, 20(1):155–165.

REFERENCES 53
[Kim and Kim, 2007] Kim, M. and Kim, C. (2007). Human blood plasmapreparation for two-dimensional gel electrophoresis. J.Chromatogr.B Ana-lyt.Technol.Biomed.Life Sci., 849(1-2):203–210.
[Klose, 1975] Klose, J. (1975). Protein mapping by combined isoelectric focusingand electrophoresis of mouse tissues. a novel approach to testing for inducedpoint mutations in mammals. Humangenetik., 26(3):231–243.
[Klose, 2009] Klose, J. (2009). From 2-d electrophoresis to proteomics. Elec-trophoresis, 30 Suppl 1:S142–S149.
[Kris-Etherton et al., 2002] Kris-Etherton, P., Harris, W., and Appel, L. (2002).Fish consumption, fish oil, omega-3 fatty acids, and cardiovascular disease. Cir-culation, 106(21):2747–2757.
[Kris-Etherton and Yu, 1997] Kris-Etherton, P. and Yu, S. (1997). Individual fattyacid effects on plasma lipids and lipoproteins: human studies. Am.J.Clin.Nutr.,65(5 Suppl):1628S–1644S.
[Kromann and Green, 1980] Kromann, N. and Green, A. (1980). Epidemiologicalstudies in the upernavik district, greenland. incidence of some chronic diseases1950-1974. Acta Med.Scand., 208(5):401–406.
[Kussmann and Affolter, 2009] Kussmann, M. and Affolter, M. (2009). Pro-teomics at the center of nutrigenomics: comprehensive molecular understandingof dietary health effects. Nutrition, 25(11-12):1085–1093.
[Kuzyk et al., 2009] Kuzyk, M., Smith, D., Yang, J., Cross, T., Jackson, A.,Hardie, D., Anderson, N., and Borchers, C. (2009). Multiple reactionmonitoring-based, multiplexed, absolute quantitation of 45 proteins in humanplasma. Mol.Cell Proteomics, 8(8):1860–1877.
[Laemmli, 1970] Laemmli, U. (1970). Cleavage of structural proteins during theassembly of the head of bacteriophage t4. Nature, 227(5259):680–685.
[Lathyris et al., 2007] Lathyris, D., Trikalinos, T., and Ioannidis, J. (2007). Evi-dence from crossover trials: empirical evaluation and comparison against paral-lel arm trials. Int.J.Epidemiol., 36(2):422–430.
[Lauritzen et al., 2001] Lauritzen, L., Hansen, H., Jorgensen, M., and Michaelsen,K. (2001). The essentiality of long chain n-3 fatty acids in relation to develop-ment and function of the brain and retina. Prog.Lipid Res., 40(1-2):1–94.
[Lavigne et al., 2000] Lavigne, C., Marette, A., and Jacques, H. (2000). Cod andsoy proteins compared with casein improve glucose tolerance and insulin sensi-tivity in rats. Am.J.Physiol Endocrinol.Metab, 278(3):E491–E500.
[Lichtenstein et al., 2006] Lichtenstein, A., Appel, L., Brands, M., Carnethon, M.,Daniels, S., Franch, H., Franklin, B., Kris-Etherton, P., Harris, W., Howard, B.,Karanja, N., Lefevre, M., Rudel, L., Sacks, F., Van, H. L., Winston, M., and
54 REFERENCES
Wylie-Rosett, J. (2006). Diet and lifestyle recommendations revision 2006: ascientific statement from the american heart association nutrition committee.Circulation, 114(1):82–96.
[Marengo et al., 2007] Marengo, E., Robotti, E., and Bobba, M. (2007). Multivari-ate statistical tools for the evaluation of proteomic maps: recent achievementsand applications. Current Proteomics, 4:53–66.
[Marengo et al., 2008] Marengo, E., Robotti, E., and Bobba, M. (2008). 2d-pagemaps analysis. Methods Mol.Biol., 428:291–325.
[Martin et al., 2003] Martin, S., Vilhelmsson, O., Medale, F., Watt, P., Kaushik,S., and Houlihan, D. (2003). Proteomic sensitivity to dietary manipulations inrainbow trout. Biochim.Biophys.Acta, 1651(1-2):17–29.
[Mente et al., 2006] Mente, E., Pierce, G., Santos, M., and Neofitou, C. (2006).Effect of feed and feeding in the culture of salmonids on the marine aquaticenvironment: a synthesis for european aquaculture. Aquaculture International,14(5):499–522.
[Merril et al., 1981a] Merril, C., Dunau, M., and Goldman, D. (1981a). A rapidsensitive silver stain for polypeptides in polyacrylamide gels. Anal.Biochem.,110(1):201–207.
[Merril et al., 1981b] Merril, C., Goldman, D., Sedman, S., and Ebert, M. (1981b).Ultrasensitive stain for proteins in polyacrylamide gels shows regional variationin cerebrospinal fluid proteins. Science, 211(4489):1437–1438.
[Morgan and Harris, 2003] Morgan, B. and Harris, C. (2003). Complement thera-peutics; history and current progress. Mol.Immunol., 40(2-4):159–170.
[Morris et al., 1995] Morris, M., Manson, J., Rosner, B., Buring, J., Willett, W.,and Hennekens, C. (1995). Fish consumption and cardiovascular disease in thephysicians’ health study: a prospective study. Am.J.Epidemiol., 142(2):166–175.
[Morris et al., 1993] Morris, M., Sacks, F., and Rosner, B. (1993). Does fishoil lower blood pressure? a meta-analysis of controlled trials. Circulation,88(2):523–533.
[Mozaffarian et al., 2005] Mozaffarian, D., Geelen, A., Brouwer, I., Geleijnse, J.,Zock, P., and Katan, M. (2005). Effect of fish oil on heart rate in humans: ameta-analysis of randomized controlled trials. Circulation, 112(13):1945–1952.
[Mozaffarian and Rimm, 2006] Mozaffarian, D. and Rimm, E. (2006). Fish in-take, contaminants, and human health: evaluating the risks and the benefits.JAMA, 296(15):1885–1899.
[Naylor et al., 2000] Naylor, R., Goldburg, R., Primavera, J., Kautsky, N., Bev-eridge, M., Clay, J., Folke, C., Lubchenco, J., Mooney, H., and Troell, M.

REFERENCES 55
(2000). Effect of aquaculture on world fish supplies. Nature, 405(6790):1017–1024.
[Nedelkov, 2008] Nedelkov, D. (2008). Population proteomics: investigation ofprotein diversity in human populations. Proteomics, 8(4):779–786.
[Nedelkov et al., 2005] Nedelkov, D., Kiernan, U., Niederkofler, E., Tubbs, K.,and Nelson, R. (2005). Investigating diversity in human plasma proteins.Proc.Natl.Acad.Sci.U.S.A, 102(31):10852–10857.
[O’Farrell, 1975] O’Farrell, P. (1975). High resolution two-dimensional elec-trophoresis of proteins. J.Biol.Chem., 250(10):4007–4021.
[O’Farrell, 2008] O’Farrell, P. (2008). The pre-omics era: the early days of two-dimensional gels. Proteomics, 8(23-24):4842–4852.
[Omenn et al., 2005] Omenn, G., States, D., Adamski, M., Blackwell, T., Menon,R., Hermjakob, H., Apweiler, R., Haab, B., Simpson, R., Eddes, J., Kapp, E.,Moritz, R., Chan, D., Rai, A., Admon, A., Aebersold, R., Eng, J., Hancock, W.,Hefta, S., Meyer, H., Paik, Y., Yoo, J., Ping, P., Pounds, J., Adkins, J., Qian, X.,Wang, R., Wasinger, V., Wu, C., Zhao, X., Zeng, R., Archakov, A., Tsugita, A.,Beer, I., Pandey, A., Pisano, M., Andrews, P., Tammen, H., Speicher, D., andHanash, S. (2005). Overview of the hupo plasma proteome project: results fromthe pilot phase with 35 collaborating laboratories and multiple analytical groups,generating a core dataset of 3020 proteins and a publicly-available database.Proteomics, 5(13):3226–3245.
[Ouellet et al., 2007] Ouellet, V., Marois, J., Weisnagel, S., and Jacques, H.(2007). Dietary cod protein improves insulin sensitivity in insulin-resistant menand women: a randomized controlled trial. Diabetes Care, 30(11):2816–2821.
[Ouellet et al., 2008] Ouellet, V., Weisnagel, S., Marois, J., Bergeron, J., Julien,P., Gougeon, R., Tchernof, A., Holub, B., and Jacques, H. (2008). Dietary codprotein reduces plasma c-reactive protein in insulin-resistant men and women.J.Nutr., 138(12):2386–2391.
[Overgaard et al., 2008] Overgaard, J., Porsgaard, T., Guo, Z., Lauritzen, L., andMu, H. (2008). Postprandial lipid responses of butter blend containing fish oilin a single-meal study in humans. Mol.Nutr.Food Res., 52(10):1140–1146.
[Pan et al., 2009] Pan, S., Aebersold, R., Chen, R., Rush, J., Goodlett, D., McIn-tosh, M., Zhang, J., and Brentnall, T. (2009). Mass spectrometry based targetedprotein quantification: methods and applications. J.Proteome Res., 8(2):787–797.
[Patton, 2002] Patton, W. (2002). Detection technologies in proteome analysis.J.Chromatogr.B Analyt.Technol.Biomed.Life Sci., 771(1-2):3–31.

56 REFERENCES
[Pedersen et al., 2010] Pedersen, A., Fagt, S., Groth, M., Christensen, T., Biltoft-Jensen, A., Matthiessen, J., Andersen, N., Krup, K., Hartkopp, H., Ygil, K.,Hinsch, H.-J., Saxholt, E., and Trolle, E. (2010). Danskernes kostvaner 2003-2008. DTU Fdevareinstituttet, pages –.
[Porter and Reid, 1978] Porter, R. and Reid, K. (1978). The biochemistry of com-plement. Nature, 275(5682):699–704.
[Poutanen et al., 2001] Poutanen, M., Salusjarvi, L., Ruohonen, L., Penttila, M.,and Kalkkinen, N. (2001). Use of matrix-assisted laser desorption/ionizationtime-of-flight mass mapping and nanospray liquid chromatography/electrosprayionization tandem mass spectrometry sequence tag analysis for high sensitivityidentification of yeast proteins separated by two-dimensional gel electrophore-sis. Rapid Commun.Mass Spectrom., 15(18):1685–1692.
[Price et al., 2000] Price, P., Nelson, C., and Clarke, S. (2000). Omega-3 polyun-saturated fatty acid regulation of gene expression. Curr.Opin.Lipidol., 11(1):3–7.
[Quintana et al., 2009] Quintana, M., Palicki, O., Lucchi, G., Ducoroy, P., Cham-bon, C., Salles, C., and Morzel, M. (2009). Inter-individual variability of proteinpatterns in saliva of healthy adults. J.Proteomics, 72(5):822–830.
[Rabilloud, 1999] Rabilloud, T. (1999). Solubilization of proteins in 2-d elec-trophoresis. an outline. Methods Mol.Biol., 112:9–19.
[Racine and Deckelbaum, 2007] Racine, R. and Deckelbaum, R. (2007). Sourcesof the very-long-chain unsaturated omega-3 fatty acids: eicosapentaenoic acidand docosahexaenoic acid. Curr.Opin.Clin.Nutr.Metab Care, 10(2):123–128.
[Raman et al., 2002] Raman, B., Cheung, A., and Marten, M. (2002). Quantita-tive comparison and evaluation of two commercially available, two-dimensionalelectrophoresis image analysis software packages, z3 and melanie. Elec-trophoresis, 23(14):2194–2202.
[Rezzi et al., 2007] Rezzi, S., Ramadan, Z., Fay, L., and Kochhar, S. (2007).Nutritional metabonomics: applications and perspectives. J.Proteome.Res.,6(2):513–525.
[Rifai et al., 2006] Rifai, N., Gillette, M., and Carr, S. (2006). Protein biomarkerdiscovery and validation: the long and uncertain path to clinical utility.Nat.Biotechnol., 24(8):971–983.
[Righetti and Bossi, 1997] Righetti, P. and Bossi, A. (1997). Isoelectric focus-ing in immobilized ph gradients: an update. J.Chromatogr.B Biomed.Sci.Appl.,699(1-2):77–89.
[Robertson et al., 1977] Robertson, T., Kato, H., Rhoads, G., Kagan, A., Mar-mot, M., Syme, S., Gordon, T., Worth, R., Belsky, J., Dock, D., Miyanishi,
REFERENCES 57
M., and Kawamoto, S. (1977). Epidemiologic studies of coronary heart diseaseand stroke in japanese men living in japan, hawaii and california. incidence ofmyocardial infarction and death from coronary heart disease. Am.J.Cardiol.,39(2):239–243.
[Robinson and Stone, 2006] Robinson, J. and Stone, N. (2006). Antiatheroscle-rotic and antithrombotic effects of omega-3 fatty acids. Am.J.Cardiol.,98(4A):39i–49i.
[Roepstorff, 1997] Roepstorff, P. (1997). Mass spectrometry in protein studiesfrom genome to function. Curr.Opin.Biotechnol., 8(1):6–13.
[Russo, 2009] Russo, G. (2009). Dietary n-6 and n-3 polyunsaturated fattyacids: from biochemistry to clinical implications in cardiovascular prevention.Biochem.Pharmacol., 77(6):937–946.
[Sampath and Ntambi, 2004] Sampath, H. and Ntambi, J. (2004). Polyunsaturatedfatty acid regulation of gene expression. Nutr.Rev., 62(9):333–339.
[Sargent and Tacon, 1999] Sargent, J. and Tacon, A. (1999). Development offarmed fish: a nutritionally necessary alternative to meat. Proc.Nutr.Soc.,58(2):377–383.
[Schmitz and Ecker, 2008] Schmitz, G. and Ecker, J. (2008). The opposing effectsof n-3 and n-6 fatty acids. Prog.Lipid Res., 47(2):147–155.
[Schuchard et al., 2005] Schuchard, M., Mehigh, R., Cockrill, S., Lipscomb, G.,Stephan, J., Wildsmith, J., Valdes-Camin, R., Kappel, W., Rai, A., and Scott,G. (2005). Artifactual isoform profile modification following treatment of hu-man plasma or serum with protease inhibitor, monitored by 2-dimensional elec-trophoresis and mass spectrometry. Biotechniques, 39(2):239–247.
[Shevchenko et al., 1996] Shevchenko, A., Wilm, M., Vorm, O., and Mann, M.(1996). Mass spectrometric sequencing of proteins silver-stained polyacry-lamide gels. Anal.Chem., 68(5):850–858.
[Silverman, 2009] Silverman, S. (2009). From randomized controlled trials to ob-servational studies. Am.J.Med., 122(2):114–120.
[Simopoulos, 2000] Simopoulos, A. (2000). Human requirement for n-3 polyun-saturated fatty acids. Poult.Sci., 79(7):961–970.
[Simopoulos, 2002] Simopoulos, A. (2002). The importance of the ratio ofomega-6/omega-3 essential fatty acids. Biomed.Pharmacother., 56(8):365–379.
[Simopoulos, 2006] Simopoulos, A. (2006). Evolutionary aspects of diet, theomega-6/omega-3 ratio and genetic variation: nutritional implications forchronic diseases. Biomed.Pharmacother., 60(9):502–507.
58 REFERENCES
[Skonberg et al., 1993] Skonberg, D., Rasco, B., and Dong, F. (1993). Effectsof feeding high monounsaturated sunflower oil diets on sensory attributes ofsalmonid fillets. Journal of Aquatic Food Product Technology, 2(1):117–133.
[Steen and Mann, 2004] Steen, H. and Mann, M. (2004). The abc’s (and xyz’s) ofpeptide sequencing. Nat.Rev.Mol.Cell Biol., 5(9):699–711.
[Steinberg et al., 2000] Steinberg, T., Lauber, W., Berggren, K., Kemper, C., Yue,S., and Patton, W. (2000). Fluorescence detection of proteins in sodium dodecylsulfate-polyacrylamide gels using environmentally benign, nonfixative, salinesolution. Electrophoresis, 21(3):497–508.
[Storey and Tibshirani, 2003] Storey, J. and Tibshirani, R. (2003). Statistical sig-nificance for genomewide studies. Proc.Natl.Acad.Sci.U.S.A, 100(16):9440–9445.
[Torrejon et al., 2007] Torrejon, C., Jung, U., and Deckelbaum, R. (2007). n-3 fatty acids and cardiovascular disease: actions and molecular mechanisms.Prostaglandins Leukot.Essent.Fatty Acids, 77(5-6):319–326.
[Tremblay et al., 2005] Tremblay, F., Jacques, H., and Marette, A. (2005).Modulation of insulin action by dietary proteins and amino acids:role of the mammalian target of rapamycin nutrient sensing pathway.Curr.Opin.Clin.Nutr.Metab Care, 8(4):457–462.
[Tu et al., 2010] Tu, C., Rudnick, P., Martinez, M., Cheek, K., Stein, S., Slebos,R., and Liebler, D. (2010). Depletion of abundant plasma proteins and limita-tions of plasma proteomics. J.Proteome.Res., 9(10):4982–4991.
[Unlu et al., 1997] Unlu, M., Morgan, M., and Minden, J. (1997). Difference gelelectrophoresis: a single gel method for detecting changes in protein extracts.Electrophoresis, 18(11):2071–2077.
[Valagussa et al., 1999] Valagussa, F., Franzosi, M., Geraci, E., Mininni, N., Ni-colosi, G., Santini, M., Tavazzi, L., Vecchio, C., Marchioli, R., Bomba, E., Chi-effo, C., Maggioni, A., Schweiger, C., Tognoni, G., Barzi, F., Flamminio, A.,Marfisi, R., Olivieri, M., Pera, C., Polidoro, A., Santoro, E., Zama, R., Pagliaro,L., Correale, E., Del Favero, A., Loi, U., Marubini, E., Campolo, L., Casari, A.,Di Minno, G., Donati, M., Galli, M., Gattone, M., Garattini, S., Mancini, M.,Marino, P., Santoro, G., Scardulla, C., Specchia, G., Cericola, A., Di Gregorio,D., Di Mascio, R., Levantesi, G., Mantini, L., Mastrogiuseppe, G., Tucci, C.,Mocarelli, P., Baldinelli, R., Ceriotti, F., Colonna, A., Cortese, C., Fortunato,G., Franzini, C., Gonano, F., and Graziani, M. (1999). Dietary supplementationwith n-3 polyunsaturated fatty acids and vitamin e after myocardial infarction:results of the gissi-prevenzione trial. Lancet, 354(9177):447–455.
[Van et al., 2008] Van, H. L., McCoin, M., Kris-Etherton, P., Burke, F., Carson,J., Champagne, C., Karmally, W., and Sikand, G. (2008). The evidence for

REFERENCES 59
dietary prevention and treatment of cardiovascular disease. J.Am.Diet.Assoc.,108(2):287–331.
[van Ommen et al., 2009] van Ommen, B., Keijer, J., Heil, S., and Kaput, J.(2009). Challenging homeostasis to define biomarkers for nutrition relatedhealth. Mol.Nutr.Food Res., 53(7):795–804.
[Vilhelmsson et al., 2004] Vilhelmsson, O., Martin, S., Medale, F., Kaushik, S.,and Houlihan, D. (2004). Dietary plant-protein substitution affects hepaticmetabolism in rainbow trout (oncorhynchus mykiss). Br.J.Nutr., 92(1):71–80.
[Wang et al., 2006a] Wang, C., Harris, W., Chung, M., Lichtenstein, A., Balk, E.,Kupelnick, B., Jordan, H., and Lau, J. (2006a). n-3 fatty acids from fish orfish-oil supplements, but not alpha-linolenic acid, benefit cardiovascular diseaseoutcomes in primary- and secondary-prevention studies: a systematic review.Am.J.Clin.Nutr., 84(1):5–17.
[Wang et al., 2006b] Wang, J., Li, D., Dangott, L., and Wu, G. (2006b). Pro-teomics and its role in nutrition research. J.Nutr., 136(7):1759–1762.
[Wasinger et al., 1995] Wasinger, V., Cordwell, S., Cerpa-Poljak, A., Yan, J., Goo-ley, A., Wilkins, M., Duncan, M., Harris, R., Williams, K., and Humphery-Smith, I. (1995). Progress with gene-product mapping of the mollicutes: My-coplasma genitalium. Electrophoresis, 16(7):1090–1094.
[Wathes et al., 2007] Wathes, D., Abayasekara, D., and Aitken, R. (2007). Polyun-saturated fatty acids in male and female reproduction. Biol.Reprod., 77(2):190–201.
[Weiss and Gorg, 2009] Weiss, W. and Gorg, A. (2009). High-resolution two-dimensional electrophoresis. Methods Mol.Biol., 564:13–32.
[Weiss et al., 2009] Weiss, W., Weiland, F., and Gorg, A. (2009). Protein detec-tion and quantitation technologies for gel-based proteome analysis. MethodsMol.Biol., 564:59–82.
[Whiteaker et al., 2007] Whiteaker, J., Zhang, H., Eng, J., Fang, R., Piening, B.,Feng, L., Lorentzen, T., Schoenherr, R., Keane, J., Holzman, T., Fitzgibbon,M., Lin, C., Zhang, H., Cooke, K., Liu, T., Camp, D., Anderson, L., Watts, J.,Smith, R., McIntosh, M., and Paulovich, A. (2007). Head-to-head comparisonof serum fractionation techniques. J.Proteome.Res., 6(2):828–836.
[Wilkins et al., 2006] Wilkins, M., Appel, R., Van Eyk, J., Chung, M., Gorg, A.,Hecker, M., Huber, L., Langen, H., Link, A., Paik, Y., Patterson, S., Pennington,S., Rabilloud, T., Simpson, R., Weiss, W., and Dunn, M. (2006). Guidelines forthe next 10 years of proteomics. Proteomics, 6(1):4–8.
[Wilkins et al., 1996] Wilkins, M., Sanchez, J., Gooley, A., Appel, R., Humphery-Smith, I., Hochstrasser, D., and Williams, K. (1996). Progress with proteome

60 REFERENCES
projects: why all proteins expressed by a genome should be identified and howto do it. Biotechnol.Genet.Eng Rev., 13:19–50.
[Winkler et al., 2008] Winkler, W., Zellner, M., Diestinger, M., Babeluk, R.,Marchetti, M., Goll, A., Zehetmayer, S., Bauer, P., Rappold, E., Miller, I., Roth,E., Allmaier, G., and Oehler, R. (2008). Biological variation of the plateletproteome in the elderly population and its implication for biomarker research.Mol.Cell Proteomics., 7(1):193–203.
[Wu et al., 2005] Wu, J., Lenchik, N., Pabst, M., Solomon, S., Shull, J., and Ger-ling, I. (2005). Functional characterization of two-dimensional gel-separatedproteins using sequential staining. Electrophoresis, 26(1):225–237.
[Wulff et al., 2008] Wulff, T., Jessen, F., Roepstorff, P., and Hoffmann, E. (2008).Long term anoxia in rainbow trout investigated by 2-de and ms/ms. Proteomics.,8(5):1009–1018.
[Yokoyama et al., 2007] Yokoyama, M., Origasa, H., Matsuzaki, M., Matsuzawa,Y., Saito, Y., Ishikawa, Y., Oikawa, S., Sasaki, J., Hishida, H., Itakura, H.,Kita, T., Kitabatake, A., Nakaya, N., Sakata, T., Shimada, K., and Shirato,K. (2007). Effects of eicosapentaenoic acid on major coronary events in hy-percholesterolaemic patients (jelis): a randomised open-label, blinded endpointanalysis. Lancet, 369(9567):1090–1098.
[Zampelas et al., 2005] Zampelas, A., Panagiotakos, D., Pitsavos, C., Das, U.,Chrysohoou, C., Skoumas, Y., and Stefanadis, C. (2005). Fish consump-tion among healthy adults is associated with decreased levels of inflammatorymarkers related to cardiovascular disease: the attica study. J.Am.Coll.Cardiol.,46(1):120–124.
[Zampelas et al., 1994] Zampelas, A., Peel, A., Gould, B., Wright, J., andWilliams, C. (1994). Polyunsaturated fatty acids of the n-6 and n-3 se-ries: effects on postprandial lipid and apolipoprotein levels in healthy men.Eur.J.Clin.Nutr., 48(12):842–848.
[Zerefos et al., 2006] Zerefos, P., Vougas, K., Dimitraki, P., Kossida, S.,Petrolekas, A., Stravodimos, K., Giannopoulos, A., Fountoulakis, M., and Vla-hou, A. (2006). Characterization of the human urine proteome by preparativeelectrophoresis in combination with 2-de. Proteomics, 6(15):4346–4355.
[Zhang et al., 2006] Zhang, X., Guo, Y., Song, Y., Sun, W., Yu, C., Zhao, X.,Wang, H., Jiang, H., Li, Y., Qian, X., Jiang, Y., and He, F. (2006). Proteomicanalysis of individual variation in normal livers of human beings using differ-ence gel electrophoresis. Proteomics, 6(19):5260–5268.
[Zimny-Arndt et al., 2009] Zimny-Arndt, U., Schmid, M., Ackermann, R., andJungblut, P. (2009). Classical proteomics: two-dimensional electrophore-sis/maldi mass spectrometry. Methods Mol.Biol., 492:65–91.

REFERENCES 61
Appendix