prototype repository – hydromechanical measurements during ... · the prototype repository is an...
TRANSCRIPT

Svensk Kärnbränslehantering ABSwedish Nuclear Fueland Waste Management Co
Box 250, SE-101 24 Stockholm Phone +46 8 459 84 00
R-12-12
Prototype repositoryHydromechanical measurements during operation phase 2003-05- 01 to 2010-02-01
Ingvar Rhén, Torbjörn Forsmark Sweco Environment
June 2014
Tänd ett lager: P, R eller TR.
Prototype repositoryHydromechanical measurements during operation phase 2003-05- 01 to 2010-02-01
Ingvar Rhén, Torbjörn Forsmark Sweco Environment
ISSN 1402-3091SKB R-12-12ID 1354554
June 2015
This report concerns a study which was conducted for Svensk Kärnbränslehantering AB (SKB). The conclusions and viewpoints presented in the report are those of the authors. SKB may draw modified conclusions, based on additional literature sources and/or expert opinions.
A pdf version of this document can be downloaded from www.skb.se.
© 2015 Svensk Kärnbränslehantering AB

SKB R-12-12 3
Förord
Prototype repository project är ett internationellt, EU-stött projekt (fram till april 2004), med syfte att i full skala undersöka den integrerade funktionen hos ingenjörers barriärer och närfältsberg i ett simulerat slutförvar i kristallint berg med hänsyn till värmeutveckling, bergmekanik, vattengenom-strömning, vattenkemi, gasbildning och mikrobiologi under naturliga och realistiska förhållanden på ca 450 m djup.
Försöksplatsen är en 65 m lång TBM-borrad ort från vilken sex vertikala deponeringshål med 1,75 m diameter och 8 m djup borrats i enlighet med KBS-3 konceptet. Testplatsen är delad i två delar; en inre 40 m lång sektion (sektion I) med 4 deponeringshål och en yttre del (sektion II) med två deponerings hål. Stela och täta pluggar separerar sektionerna och sektion II från resten av Äspölaboratoriet (ÄHRL).
Ett stort antal borrhål har borrats för att karakterisera berget. Dessa borrhål användes för långtids-moniteringen av prototypförvaret. En av frågeställningarna som studerades var hur sprickorna i berget påverkades hydromekaniskt av den ökade temperaturen i bergmassan. Denna rapport beskriver dessa mätningar.

SKB R-12-12 5
Summary
The Prototype repository is an international, EC-supported activity (up to April 2004), with the objective to investigate, on a full-scale, the integrated performance of engineered barriers and near-field rock of simulated deep repository. This is done in crystalline rock with respect to heat evolution, rock mechanics, water flow, water chemistry, gas evolution and microbial processes under natural and realistic conditions at approximately 450 m depth below the ground surface.
The test site is a 65 m long TBM-bored drift with diameter of 5 m from which six 1.75 m diameter deposition holes are extended downwards to 8.37 m depth in accordance with the KBS-3 concept. The test site is divided in two parts, an inner 40 m long section (section I) with 4 deposition holes and an outer section (section II) with 2 deposition holes. Stiff and tight plugs separate section I and section II from the rest of the Äspö Hard Rock Laboratory (ÄHRL).
A large number of boreholes have been drilled in order to characterize the rock mass. These bore-holes are used for the long-term monitoring of the Prototype repository. One of the issues that are investigated is the hydromechanical behaviour of fractures in crystalline rock as a result of increased temperature due to the electrical heaters.
The objective of the hydromechanical tests is to measure if the temperature increase affects the rock mass stress in such way that fracture width or/and fracture transmissivity, changes.
The hydromechanical tests started in May 2003 with 11 boreholes with a section equipped with deformation measurement equipment.
Comments and conclusions made from the deformation measurements within the prototype project are divided into the following:
• Hydromechanical sensor performance.
• Temperature measurements.
• Long-term deformation measurements.
• Short-term measurements (hydraulic test campaigns).
• Hydraulic head changes.
• Flow into the deposition holes.
• Main conclusions.
Hydromechanical sensor performanceIn the summer months of 2003 most of the measurement sensors were still working. During that period when there are valid measurement data, there is increasing temperature in the rock and the rock expands while the measured fractures are generally being compressed. The best hydromechani-cal sensor performances are the ones in KA3554G01:2. Both sensors have mostly been functional since 2003 with the exception of the total breakdown in 2005, which occurred in all holes, see Chapter 5. Otherwise the equipment, one or both sensors, see Table S-1, the remaining 10 boreholes have stopped functioning.
Out of 22 temperature sensors within the hydromechanical equipment only 13 are still working 2006-10-01.
By 2010-01-01 only 4 out of the 22 temperature sensors were working and of the HM sensors only the rock and fracture sensor in KA3542G02:2 was in operation.
• The measurements indicate sudden “jumps” which could be caused by either expansion or compression of a fracture. This is the general pattern for both the sections with intact rock only and for the sections one or several fractures. The reason can either be that the anchor itself has slipped which is the plausible explanation for sections with intact rock only, or that a movement in a fracture suddenly occurs, which may be the explanation for fracture sections.

6 SKB R-12-12
• When the backfilling of section II in the Prototype repository was in progress of vibrations were generated in the process of packing the backfill during the period 2003-04-29–2003-06-27. It is an open question whether the energy from this vibration could have been large enough to cause the observed fast “deformations” that could possibly be micro slips of the anchors or micro-movements in fractures. The first explanation, slips of the anchor, is the most probable reason as there are sudden movements later in the project, see below.
• Due to the fact that many sections with intact rock show sudden displacements, it appears that the anchor construction is not optimal to the current conditions. There are very small displacements involved and perhaps the anchors would have performed better with a larger area (and softer) in contact with the rock surface compared to the steel pin and steel edge collar on the anchor that were in contact with the borehole wall in this experiment. cf. Figure 4-1 and Figures 2-6 and 2-7 in Rhén et al. (2003). The original design with expandable copper bladders on the anchors, as delivered from Geokon Inc., was tested in laboratory and was found to not work properly for measuring small deformations. The anchors was therefore modified and tested in the laboratory, but as indicated above, the new design did not perform satisfactory and should probably be developed further if new tests are to be made.
Table S-1. Status of the long-term measurements 2010-01-01. An OK means that it has been possible to evaluate the measurement data. To evaluate the fracture properties it is necessary to have good data from both the intact rock and the rock and fracture sensor. The measurements started 2003-05-06.
Borehole Intact rock sensor
rock and fracture sensor
Fracture def. calc.
Comments
KG0010B01 – – The temperature is affected of the air temperature in the tunnel. The borehole is a reference hole for undisturbed conditions (i.e. undisturbed by the heaters). The rock and fracture deformation is not evaluated. Measurements failed 2006-09-30.
KA3539G:2 – – The rock and fracture measurements failed in February 2005 and the intact rock sensor in mid-2008.
KA3542G01:3 – – The rock and fracture measurements failed in February 2005.KA3542G02:4 – OK The rock measurements failed in February 2005 and only one
sensor operates October 2006.KA3544G01:2 – – The rock and fracture measurements failed in November 2003.KA3546G01:2 – – The rock and fracture measurements failed in November 2003.KA3548A01:3 – – The rock and fracture measurements failed in November 2003.KA3550G01:2 – – Expansion of intact rock observed. The “rock and fracture”-
sensor failed at July 2003. The “intact rock”-sensor failed in January 2004.
KA3552G01:2 – – The temperature data is replaced with data from KA3550G01:2. Both sensors failed in September 2003.
KA3554G01:2 – – The rock and fracture measurements failed in October 2006.KA3554G02:4 – – The rock and fracture measurements failed in February 2005.
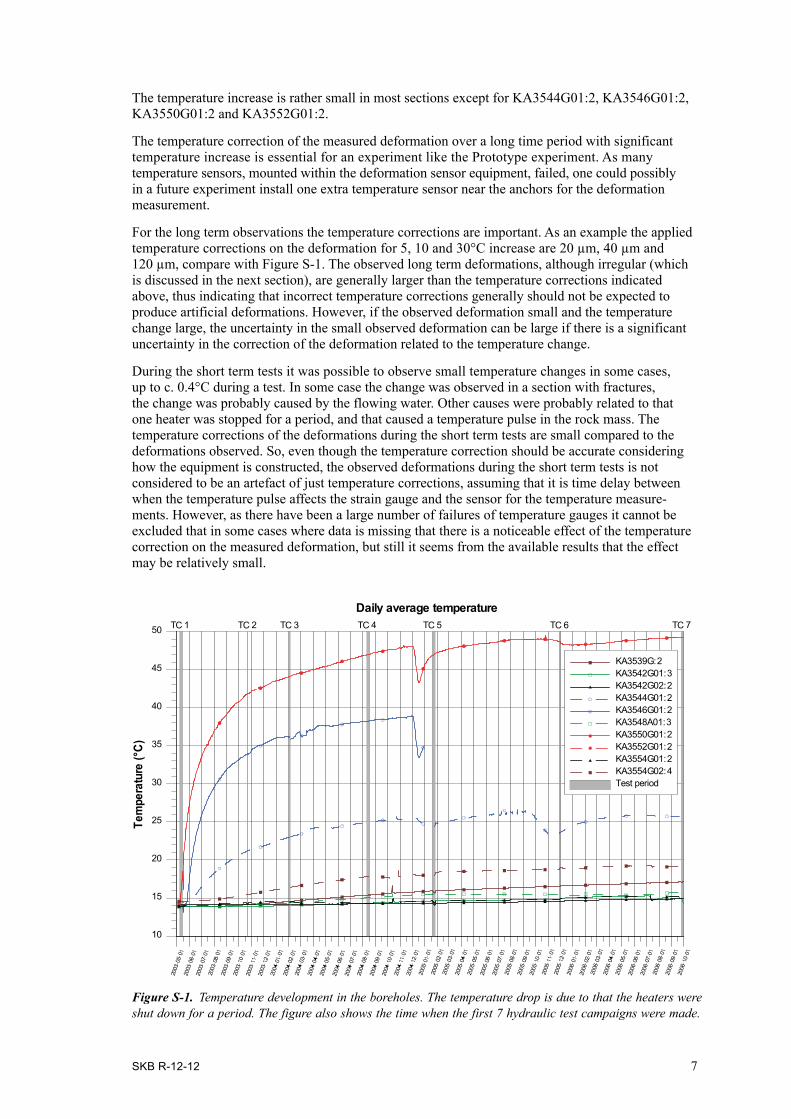
Temperature measurementsThe temperature increases to more than 40°C in the test sections closest to a canister hole, while the increase is more modest in holes more distant to the heating source. The tested sections can be divided into classes with “thermal” distances, where the distance is the closest distance to a heating canister, see Figure S-1:
• approx. 1 m : KA3550G01:2 and KA3552G01:2,
• approx. 1.5 m : KA3544G01:2 and KA3546G01:2,
• approx. 10 m : KA3539G:2 and KA3554G02:4,
• approx. 15 m : KA3542G01:3 and KA3548A01:3,
• approx. 20 m : KA3542G02:2 and KA3554G01:2.
SKB R-12-12 7
The temperature increase is rather small in most sections except for KA3544G01:2, KA3546G01:2, KA3550G01:2 and KA3552G01:2.
The temperature correction of the measured deformation over a long time period with significant temperature increase is essential for an experiment like the Prototype experiment. As many temperature sensors, mounted within the deformation sensor equipment, failed, one could possibly in a future experiment install one extra temperature sensor near the anchors for the deformation measurement.
For the long term observations the temperature corrections are important. As an example the applied temperature corrections on the deformation for 5, 10 and 30°C increase are 20 µm, 40 µm and 120 µm, compare with Figure S-1. The observed long term deformations, although irregular (which is discussed in the next section), are generally larger than the temperature corrections indicated above, thus indicating that incorrect temperature corrections generally should not be expected to produce artificial deformations. However, if the observed deformation small and the temperature change large, the uncertainty in the small observed deformation can be large if there is a significant uncertainty in the correction of the deformation related to the temperature change.
During the short term tests it was possible to observe small temperature changes in some cases, up to c. 0.4°C during a test. In some case the change was observed in a section with fractures, the change was probably caused by the flowing water. Other causes were probably related to that one heater was stopped for a period, and that caused a temperature pulse in the rock mass. The temperature corrections of the deformations during the short term tests are small compared to the deformations observed. So, even though the temperature correction should be accurate considering how the equipment is constructed, the observed deformations during the short term tests is not considered to be an artefact of just temperature corrections, assuming that it is time delay between when the temperature pulse affects the strain gauge and the sensor for the temperature measure-ments. However, as there have been a large number of failures of temperature gauges it cannot be excluded that in some cases where data is missing that there is a noticeable effect of the temperature correction on the measured deformation, but still it seems from the available results that the effect may be relatively small.
Figure S-1. Temperature development in the boreholes. The temperature drop is due to that the heaters were shut down for a period. The figure also shows the time when the first 7 hydraulic test campaigns were made.
10
15
20
25
30
35
40
45
50
Tem
pera
ture
(°C)
KA3539G:2KA3542G01:3KA3542G02:2KA3544G01:2KA3546G01:2KA3548A01:3KA3550G01:2KA3552G01:2KA3554G01:2KA3554G02:4Test period
TC 1 TC
2 TC 3 TC
4 TC 5 TC
6 TC
7
Daily average temperature
8 SKB R-12-12
The temperature sensor, thermistor, with measurement range –80 to +150°C has an accuracy ±0.5°C. The measured temperatures, as shown in Figure S-1, should be accurate.
Evaluated transmissivitiesThe evaluated transmissivities (T) are based on two evaluation methods:
1 The method suggested by Moye (1967) assumes a steady state radial flow near the tested section and spherical flow at some distance.
2 For the transient evaluation the measured flow rate for the flowing phase is used (multirate approach) and the pressure from the pressure build-up period is used for the evaluation. Evaluating the transient data, the pressure change, Δp, is plotted versus the equivalent time, dte, in minutes. The solution used in the analysis is the Dougherty-Babu model for a pumping test in a confined aquifer (Dougherty and Babu 1984).
For method 1 only borehole geometry, test section length, flow rate and pressure difference are and no subjective judgment of the data is needed to calculate the T. Geometrical factors do not change between the tests and the pressure measurements can be considered very accurate. The flow rate, however, can change if the test duration changes, as some test section may not reach fully steady state. To avoid major problem with this the chosen test duration was generally rather long; 60–180 minutes. These individual test-section flow times were used for the repeated tests, with the purpose that the measured last flow rate would be close to steady state flow rate and if not fully developed steady state the same flow times should provide comparable conditions for evaluation of changes of T.
The benefits with method 2 are that near-borehole effects (skin factor) can be filtered out and the evaluated T can be considered to better represent the transmissivity of the fracture. The negative side is that the method demands more from the monitoring of the tests (high frequency of sampling of flow rate and pressure) and that there is some subjectivity in the evaluation process of fitting models to the measured data. In our case the monitoring has been made with a high frequency sampling rate, so data quality is good in that sense. Some tests show complicated flow regime developments and in such cases one can easily get differences in estimated T due to different judgments of what is a reasonable fit for parameter estimation. To minimise the problems of subjectivity in the evaluation, the flow regimes were carefully studied and all previous made tests for a specific test section were checked before the evaluation of a new test; in order to perform the evaluation in a similar manner. With this methodology it was believed that the relative changes of T could be described accurately.
In general one can say that evaluated transmissivities for a test section is dependent of test time, evaluations methods as well as effects from boundary conditions (some may be transient or constant head). As described above, the attempt has been to avoid major problems in order to get relative changes that should be accurate, the relative changes which were considered important for the project. The changes observed for T can generally be considered small and within an estimated uncertainty for an absolute value of T. There are a few greater changes of T and one can be certain that there exist a change of the absolute T. On the other hand, the frequent observation of small changes of T is also an important result as it tells us that no major changes occurred when the rock was heated. These small changes can probably be within expected uncertainties for an absolute estimate of T and observed small trends of the relative changes are uncertain. In a few cases where there are several observations showing a trend one can probably be more certain that there is a trend although small relative changes. However, this assumes that the major changes are due to compres-sion or extension of fractures related to a slow change of stresses. If there is a fracture slip one can have a sudden increase or a decrease of the fracture transmissivity. There are a few observations that possibly can be related to slips but it has not been possible to confirm this cause to the change.
Long-term deformation measurementsThe accuracy based on individual calibration that were performed of the sensors were; Measurement range 0.76–2.1 mm, Resolution (logger) 0.10–0.28 µm, Accuracy 0.76–2.1 µm a, which can be considered as a sufficient accuracy for the test.
SKB R-12-12 9
In borehole KA3552G01:2, which is c. 1.2 m from the centre line of the heater (c. 0.6 m outside the deposition hole wall) with temperature increase from c. 14 to 49°C, there is a clear deformation and transmissivity decrease from c. 5∙10–9 m2/s to c. 6∙10–10 m2/s in the section with a fracture with orientation 193/44. KA3550G01:2 which is in a similar position as KA3552G01:2 but due to packer failure no data are available.
KA3544G01:2 and KA3546G01:2 are fairly close to the heaters, which are c. 1.2 m from the centre line of the heater (c. 0.6 m outside the deposition hole) but located near the bottom of the heater. The temperature increase is c. from c. 14 to 25°C (KA3544G01:2) and 38°C (KA3546G01:2) and the monitored sections have 3–4 fractures with different orientations. In KA3544G01:2 the transmissiv-ity decreases from c. c. 1∙10–8 m2/s to c. 7∙10–9 m2/s (only two measurements) but in KA3544G01:2 there seem to be no decrease in transmissivity.
There are a few observations that indicate a sudden transmissivity increase, e.g. KA3542G02:2, which possibly can indicate a fracture slip; a few months after the heater were started. After this sudden increase, the transmissivity decreases. In other borehole sections the transmissivity changes are small and not possible to judge if they are due to the decreasing water pressure or increasing load due to temperature increase.
The long-term deformation measurements are very difficult to evaluate due to a number of rapid changes that have not been possible to couple to a known cause, or the deformations seem unrealistic in some cases.
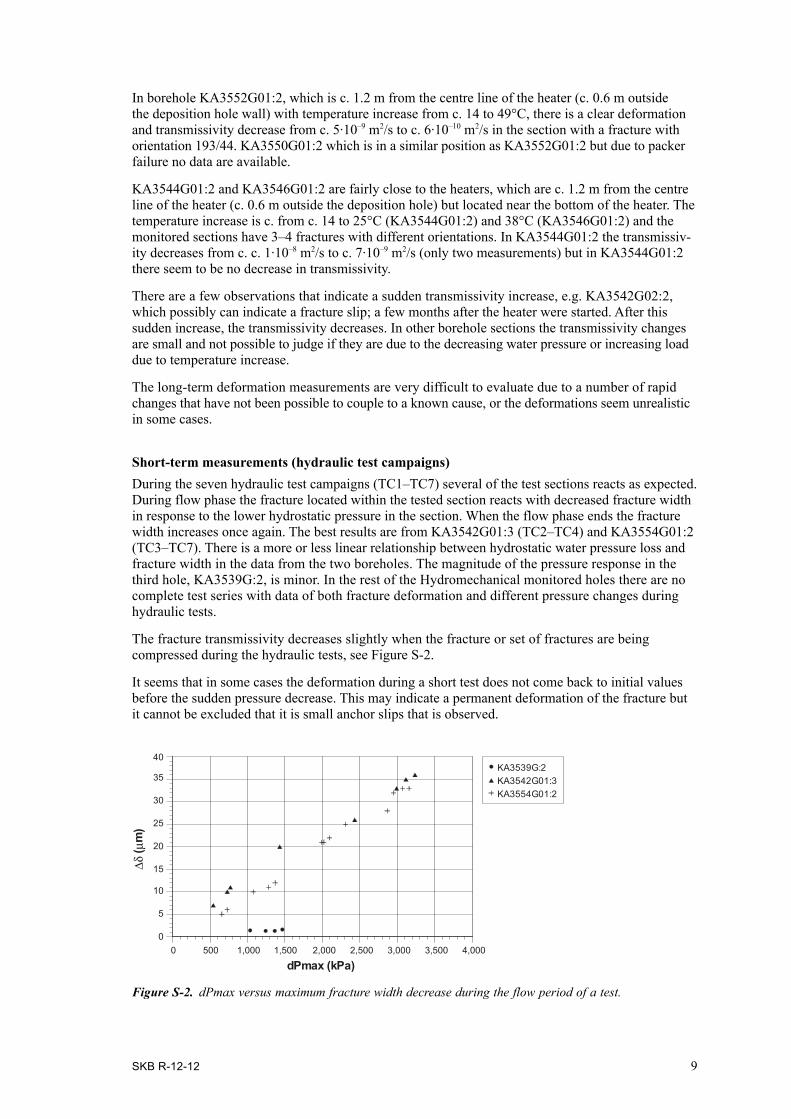
Short-term measurements (hydraulic test campaigns)During the seven hydraulic test campaigns (TC1–TC7) several of the test sections reacts as expected. During flow phase the fracture located within the tested section reacts with decreased fracture width in response to the lower hydrostatic pressure in the section. When the flow phase ends the fracture width increases once again. The best results are from KA3542G01:3 (TC2–TC4) and KA3554G01:2 (TC3–TC7). There is a more or less linear relationship between hydrostatic water pressure loss and fracture width in the data from the two boreholes. The magnitude of the pressure response in the third hole, KA3539G:2, is minor. In the rest of the Hydromechanical monitored holes there are no complete test series with data of both fracture deformation and different pressure changes during hydraulic tests.
The fracture transmissivity decreases slightly when the fracture or set of fractures are being compressed during the hydraulic tests, see Figure S-2.
It seems that in some cases the deformation during a short test does not come back to initial values before the sudden pressure decrease. This may indicate a permanent deformation of the fracture but it cannot be excluded that it is small anchor slips that is observed.
Figure S-2. dPmax versus maximum fracture width decrease during the flow period of a test.
0 500 1,000 1,500 2,000 2,500 3,000 3,500 4,000
dPmax (kPa)
0
5
10
15
20
25
30
35
40
∆δ ( µ
m)
KA3539G:2KA3542G01:3KA3554G01:2

10 SKB R-12-12
One of the questions considered is:
• If fracture transmissivities have changed, can it be correlated to measured deformations of fractures?
The transmissivity change is minor but clear in all four tests presented in Figures S-3 and S-4. In these figures the transmissivity is plotted against maximum change in fracture width, Δδ, and hydro-static water pressure loss, dPmax. The Figures show that there is a correlation as expected between the fracture width and transmissivity but the deformations are small and the transmissivity changes are small. At the depth that the experiments were performed one can expect that all fractures are under a high stress from the outset and a stress increase due to temperature load or decrease in water pressure should just cause small deformations of the fractures, as also can be seen in the figures.
Hydraulic head changesThere seem to be a slowly decreasing trend over the years in the water pressure by time in boreholes near the Prototype repository. At least partly, this cannot be explained as effects from the Prototype repository itself or nearby tunnels, as one can observe a decreasing trend en several of the boreholes in the Äspö HRL. During the same period the total inflow of water to the tunnels has also decreased. The mechanism for this behaviour cannot be explained at present with concepts earlier presented (as; stress changes due to the excavation, chemical precipitation and/or gas release near the tunnel due to pressure decrease of the inflowing water) but possibly can successive fault gauge movements and/or small and slow creep deformation of the rock cause very small changes of the permeability of the fracture system within long distances from the tunnels creating a slightly lower mean permeability.
Figure S-3. Maximum change in fracture widths (Δδ) during flowing of section versus corresponding T (data from test campaigns 4, 5, 6 and 7).
Figure S-4. dPmax during flowing of section versus corresponding T (data from test campaigns 4, 5, 6 and 7).
0 10 20 30 40 50
∆δ (µm)
–8
–7
–6
Log1
0T
(m2/s
)
KA3542G01:3 TC4KA3554G01:2 TC4KA3554G01:2 TC5KA3554G01:2 TC6KA3554G01:2 TC7
KA3542G01:3 TC4KA3554G01:2 TC4KA3554G01:2 TC5KA3554G01:2 TC6KA3554G01:2 TC7
0 500 1,000 1,500 2,000 2,500 3,000 3,500
dPmax (kPa)
–8
–7
–6
Log1
0T
(m2/s
)

SKB R-12-12 11
Flow into the deposition holesThe inflow to the deposition holes DA3551G01 and DA3545G01 were measured 1999-12 to 2000-06 three times (Rhén and Forsmark 2001). In the winter 2012–2013, after the backfill and the buffer had been removed in tunnel section II, the flow measurements were repeated for two of the depositions holes. The measured flow rates for the two occasions are shown in Table S-2. As can be seen the inflow rates has decreased.
Table S-2. Result of inflow measurements to deposition boreholes DA3551G01 and DA3545G01.
Borehole Q 2000-03-28–2000-03-31 (L/min) Q 2012-12-20–2013-02-07 (L/min)
DA3551G01 0.00155 0DA3545G01 0.00270 0.00045
Main conclusions• The observed deformations and transmissivity changes during the measurement period are small.
This was expected as the initial rock stress before the heating is rather high at the depth for the Prototype repository. The transmissivity decrease is c. 0.1 of the initial transmissivity value for one observation just outside a deposition hole but all other observations near or distant from the deposition holes show less changes.
• Hydraulic tests with different water pressure decreases show that the evaluated transmissivity is dependent of the applied water pressure decrease. However, the transmissivity changes are small relative the pressure change. This is expected as the tests are performed at such large depth with relatively high initial rock stresses.
• Although the measurements in some respect have been successful (according to the point above) one can conclude that the deformation measurements are difficult. The deformations are small and one has to be very sure that the anchor does not slip on the rock wall. The sensors (strain gauge and temperature) in the deformation measurement equipment should also withstand the environment (temperature, water pressure, vibration (e.g. from packing the backfill in the tun-nels)) in the borehole better than the equipment used. It is presently not known the reason for the deformation measurement-equipment failure.
• The methodology for performing hydraulic tests has worked well but in any future similar investigations one should perform several tests with different pressure drawdowns (e.g 200 kPa (or at least somewhat lower than used in the present study) as start value and then increase the differential pressure in a number of steps suitable for the project) during each test campaign in each test section already from the outset. Data will be useful for evaluating fracture compress-ibility and one can use the test with the lowest differential pressure when comparing long term behaviour, which would be preferable. To show permeability changes qualitative one can probably also use a third test (besides evaluation of T using stationary and transient methods) by plotting the specific drawdown versus time for all tests made in a specific test section.
• The characterisation of the Prototype tunnel before the tunnel was backfilled and the experiment started, was extensive and it was possible to do several types of geological and hydrogeological investigations that provided a good basis for planning the experiment. However, one method was excluded; the flow logging with Posiva flow log aiming to detect individual flowing fractures and estimate their transmissivity. Investigations in other projects later made by SKB using this tool has proven valuable as a compliment to geological characterisation and orientation of fractures and hydraulic tests with small and large test-section lengths.
• The installed hydraulic packers in tunnel section II have functioned well but unfortunately there have been a few packer failures that have spoiled the possibilities to perform hydraulic tests in those boreholes.
• The water pressure around the deposition tunnels did not increase as expected. First of all, sec-tion I was drained most of test period due to electrical problems with one canister heater when the water pressure increased, which also affect the pressure around section II. There also exists a

12 SKB R-12-12
general pressure decrease near the Prototype repository, but also in Äspö HRL in general. It does not have a main influence of the evaluation of the short-term deformations (other than it limits to use high differential pressures), but it can affect the long-term deformation measurements in that respect that the effective stress in the fractures changes. If the deformation due to the thermal load is limited, the observed small deformations may just be due to long term pressure changes.
• The nearby experiment in tunnel TASS has significantly disturbed the Prototype experiment. The drilling and the grouting for the Fine Sealing project (year 2007) as well as excavation of the TASS tunnel, disturbed the pressures and probably has grout affected at least one of the observation boreholes drilled from the Prototype tunnel. The drilling, the grouting and tunnel excavation have however not had an impact of most result related to hydraulic tests and deforma-tion measurements, as the main part of the result are from the period before 2007. The boundary conditions for the Prototype project significantly changed after 2007 due to the TASS tunnel. Pressure levels and pressure trends have changed in several cases comparing data before drill start and after excavation.

SKB R-12-12 13
Contents
1 Background 151.1 Äspö Hard Rock Laboratory 151.2 Prototype repository 15
1.2.1 General objectives 171.2.2 Background 171.2.3 Objectives of hydromechanical tests 181.2.4 Contents of this report 18
2 Scope of measurements 19
3 Equipment 213.1 Measurement equipment 21
3.1.1 Logger 233.1.2 Sensors 25
4 Measurement and data analysis procedures 274.1 Deformation measurements principles 274.2 Data handling of hydromechanical measurements 274.3 Analyses and interpretation of hydromechanical measurements 27
4.3.1 Temperature data 274.3.2 Deformation data 284.3.3 Results / Fracture deformation 294.3.4 Hydraulic test campaigns 304.3.5 Pressure head in borehole sections 31
5 Geology of hydromechanical sections 335.1 Geology of Äspö Prototype repository area 33
6 Overview of hydromechanical performance, canister heating and hydraulic tests 35
6.1 Hydromechanical sensor performance 356.2 Canister heating performance 366.3 Overview of temperature increase in prototype section II 386.4 Backfilling of section II and construction of plug 396.5 Operation period of section II 39
7 Temperature and deformation measurements 417.1 Deposition hole size 417.2 Test section data 42
7.2.1 KG0010B01 427.2.2 KA3539G 427.2.3 KA3542G01 427.2.4 KA3542G02 447.2.5 KA3544G01 447.2.6 KA3546G01 447.2.7 KA3548A01 467.2.8 KA3550G01 467.2.9 KA3552G01 467.2.10 KA3554G01 487.2.11 KA3554G02 48
7.3 Long term study 497.3.1 KG0010B01 497.3.2 KA3539G:2 (15.85–17.60 m) 497.3.3 KA3542G01:3 (18.60–20.30 m) 527.3.4 KA3542G02:2 (25.6–27.2 m) 587.3.5 KA3544G01:2 (8.90–12.65 m) 597.3.6 KA3546G01:2 (6.75–8.30 m) 65
14 SKB R-12-12
7.3.7 KA3548A01:3 (8.80–10.75 m) 657.3.8 KA3550G01:2 (5.20–7.30 m) 717.3.9 KA3552G01:2 (4.35–6.05 m) 717.3.10 KA3554G01:2 (22.60–24.15 m) 747.3.11 KA3554G02:4 (10.50–12.20 m) 797.3.12 Comments to expected behaviour 84
7.4 Short term study during hydraulic test campaigns 847.4.1 KG0010B01 857.4.2 KA3539G:2 857.4.3 KA3542G01 887.4.4 KA3542G02 937.4.5 KA3544G01 937.4.6 KA3546G01 937.4.7 KA3548A01 947.4.8 KA3550G01 947.4.9 KA3552G01 967.4.10 KA3554G01 967.4.11 KA3554G02 103
7.5 Summary of measurements and comments to expected behaviour 105
8 Transmissivity changes until 2010-02-01 109
9 Comments and conclusions 1159.1 Hydromechanical sensor performance 1159.2 Temperature measurements 1169.3 Evaluated transmissivities 1179.4 Long-term deformation measurements 1189.5 Short-term deformation measurements 1199.6 Hydraulic head changes 1199.7 Flow into the deposition holes 1199.8 Main conclusions 121
9.8.1 General 1219.8.2 Comparison with predictions 122
References 125
Appendix 1 Temperature in borehole sections with HM measurements 127
Appendix 2 Pressure head in borehole sections 139
Appendix 3 Hydraulic tests, operation phase Prototype repository 145
Appendix 4 Overview of monitoring boreholes 151
Appendix 5 Geology of borehole test sections 153

SKB R-12-12 15
1 Background
1.1 Äspö Hard Rock LaboratoryIn order to prepare for the siting and licensing of a spent fuel repository SKB has constructed an underground research laboratory.
In the autumn of 1990, SKB began the construction of Äspö Hard Rock Laboratory (Äspö HRL), see Figure 1-1 and 1-2, near Oskarshamn in the south eastern part of Sweden. A 3.6 km long tunnel was excavated in crystalline rock down to a depth of approximately 460 m.
The laboratory was completed in 1995 and research concerning the disposal of nuclear waste in crystalline rock has since then been carried out.
Figure 1-3 shows the Prototype tunnel and other tunnels in the deepest part of the Äspö laboratory.
1.2 Prototype repositoryThe Äspö Hard Rock Laboratory is an essential part of the research, development, and demonstra-tion work performed by SKB in preparation for construction and operation of the deep repository for spent fuel. Within the scope of the SKB program for RD&D 1995, SKB has decided to carry out a project with the designation “Prototype repository test“. The aim of the project is to test important components in the SKB deep repository system in full scale and in a realistic environment.
The Prototype repository Test is focused on testing and demonstrating the function of the SKB deep repository system. Activities aimed at contributing to development and testing of the practical, engi-neering measures required to rationally perform the steps of a deposition sequence are also included. However, efforts in this direction are limited, since these matters are addressed in the Demonstration of Repository Technology project and to some extent in the Backfill and Plug Test.
Figure 1-1. Location of Äspö Hard Rock Laboratory.
0 500 1000
HAV01
HAV02
HAV03HAV04
HAV05
HAV06
HAV07
HAV08
KAV01
KAV02
KAV03
KLX01
KLX02
HLX01
HLX02
HLX03
HLX04
HLX05
HLX06 HLX07
HLX08
HLX09
KAS01
KAS02
KAS03
KAS04
KAS05
KAS06
KAS07
KAS08
KAS09
KAS10KAS11
KAS12
KAS13
KAS14
KAS16
HAS01
HAS02
HAS03
HAS04
HAS05
HAS06
HAS07
HAS08
HAS09
HAS10
HAS11HAS12
HAS13 HAS14
HAS15
HAS16
HAS17
HAS18
HAS19
HAS20
HAS21
HMJ01
KBH01 KBH02
HBH01HBH02
HBH03HBH04
HBH05
2/570
LAXEMAR
ÄVRÖ
ÄSPÖ
MJÄLEN
HÅLÖ
/13080143/DATA/ÄSPÖ_HRL.SRF 10/29/99
(m)

16 SKB R-12-12
Figure 1-2. Tunnel system at Äspö HRL. The prototype repository is located after section 3/500 m at the end of the tunnel system.
Prototype tunnel
Figure 1-3. The prototype repository and nearby tunnels.

SKB R-12-12 17
Investigations started 1997 and September 2001 the backfilling of the inner tunnel section (tunnel section I) started and late June 2003 the backfilling of tunnel section II was finalized. The casting of the outer plug was finalized 2003-09-11. Nearby experiments have been carried out in the TASS tunnel, see Figure 1-3. Drilling and grouting for the Fine Sealing project (at location of the TASS tunnel) was carried out between 2007-03-12 and 2007-11-19 and the excavation of the TASS tunnel was made 2007-12-11 to 2008-12-18. These activities have affected the Prototype measurements and will be commented in the report.
1.2.1 General objectivesThe Prototype repository should simulate as many aspects as possible of a real repository, for example regarding geometry, materials, and rock environ ment. The Prototype repository is a demon-stration of the integrated function of the repository components. Results are compared with models and assumptions to their validity.
The major objectives for the Prototype repository are:
• To test and demonstrate the integrated function of the repository components under realistic conditions in full scale and to compare results with models and assumptions.
• To develop, test and demonstrate appropriate engineering standards and quality assurance methods.
• To simulate appropriate parts of the repository design and construction process.
The objective for the operation phase program is:
• To monitor processes and properties in the canister, buffer material, backfill and near-field rock mass.
1.2.2 BackgroundDuring storage of nuclear waste in the rock mass the temperature will increase due to the heat loss from the canisters with spent fuel. This will increase the rock stresses and the fractures will generally close, but may locally open due to the stress situation (Hökmark et al. 2006. Fälth and Hökmark 2006, Alm et al. 2005, Rhén and Alm 2004).
As stated in Section 15.5.13 of SR-Site (SKB 2011), fractures with high flow rates intersecting deposition holes affect many identified safety related issues including piping. colloid release, inflow of corrodants potentially leading to canister failure and outflow of radionuclides. High flow rates in deposition holes are also generally associated with low F-values in the geosphere for both recharge and discharge flow paths. It is therefore of great interest to investigate the thermal effect on fracture transmissivity. Before the experiment started, scoping calculations were made of the expected behaviour of the fractures, see Rhén and Alm (2004). The conclusions, which will be discussed in Chapter 9 were:
• The hydraulic response will in general be decreased transmissivity. The decrease will be larger the closer the fractures are to the canisters.
• The transmissivity will be reduced to something between 10 and 80 percent of the in situ values.
• The fracture closure will be in the range of 5–70 micrometre.
• The hydraulic and mechanical responses on the fracture depend on the orientation of the fracture relative the stress field.
• Major part (~80%) of the increase in stress and temperature is reached within two years.
In order to investigate the hydromechanical response of the fractures as a result of the increased thermal load, two different approaches are considered.
The first approach is to measure the change of the fracture width as function of temperature and time. The displacement is both measured for the intact rock as for a section with one or more fractures. Displacement and temperature measurements are registered continuously every hour.

18 SKB R-12-12
The second approach implies that the mechanical response is evaluated indirect by using the results from hydraulic tests. Hydro tests are performed in the same sections as the mechanical measure-ments are made. Hydraulic tests are made a number of times during the operation period for the ten measurement sections. Most tests are made during the first years of operation when the largest displacements are expected to be measured.
This report copes mainly with the first approach. The detailed results of the second approach are reported in Forsmark et al. (2004), Forsmark and Rhén (2004a, b, c, 2005a, b, c) and Forsmark (2006, 2007a, b, 2008, 2010). However, some main results from these hydraulic tests are also presented in this report. The hydrogeological instrumentation of the Prototype repository is shown in Rhén et al. (2001, 2003).
1.2.3 Objectives of hydromechanical testsThe objective of the hydromechanical tests is to measure if the temperature increase will affect the rock mass stress in such way that fracture width or/and fracture transmissivity, changes.
The following questions are considered:
• Is there any deformation observed on the intact rock that can be correlated to temperature?
• Is there any deformation of open fractures that can be correlated to temperature?
• Are there any changes of fracture transmissivities that can be correlated to temperature?
• If fracture transmissivities have changed, can it be correlated to measured deformations of fractures?
1.2.4 Contents of this report• The background to the project is briefly described in Chapter 1.
• The scope of the performed measurements is briefly described in Chapter 2.
• The equipment used is briefly described in Chapter 3.
• The collection and preparation of data is described in Chapter 4.
• The geology of the prototype repository and the hydromechanical equipped borehole sections is described in brief in Chapter 5.
• In Chapter 6 an overview of the functionality of the measurement equipment and the canister heating performance is given.
• The results of the temperature and deformation measurements are detailed in Chapter 7.
• The transmissivity changes up to 2010-02-01 are summarized in Chapter 8.
• Conclusions are given in Chapter 9.

SKB R-12-12 19
2 Scope of measurements
Temperature and mechanical measurements are done in 11 boreholes. The tested intervals are listed in Table 2-1 and shown in Figure 3-1. KG0010B01 in the table is a reference hole located some distance from the prototype repository in the nearby G-tunnel.
Table 2-1. Single hole tests sections. “X” indicates that section is equipped with HM sensors. (No tests were performed in KG0010B01, it was just a control hole in rock, for temperature and deformations, not affected by the heating from the canisters.)
Borehole Section (m) HM section
KG0010B01 2.80–4.35 XKA3539G:2 15.85–17.6 XKA3542G01:3 18.60–20.30 XKA3542G02:2 25.60–27.20 XKA3544G01:2 8.90–10.65 XKA3546G01:2 6.75–8.30 XKA3548A01:3 8.80–10.75 XKA3550G01:2 5.20–7.30 XKA3552G01:2 4.35–6.05 XKA3554G01:2 22.60–24.15 XKA3554G02:4 10.50–12.20 X
For the long-term study the following is done:• Continuous measurement of deformation and temperature every hour in prototype section II
(see Figure 3-1).• The measurements started 2003-05-06. In this report results from May 2003 until October 2006
are reported as temperature plots and deformation plots.
During the operation phase a number of hydraulic test campaigns are conducted. Until October 2006 seven test campaigns were carried out. • Campaign 1, May 8–11, 2003.• Campaign 2, October 21–23, 2003.• Campaign 3, February 2–4, 2004.• Campaign 4, August 11–18, 2004.• Campaign 5, January 19–25, 2005.• Campaign 6, November 28–December 2, 2005.• Campaign 7, September 25–29, 2006.
The objective with the hydraulic test campaigns is to estimate the transmissivity of each Hydro Mechanical (HM) test section. During these campaigns it is possible to measure and evaluate the deformation response on single fractures and intact rock of a sudden drop of the hydrostatic pressure. The results from these campaigns are reported in Forsmark et al. (2004), Forsmark and Rhén (2004a, b, c), Forsmark and Rhén (2005a, b, c) and Forsmark (2006, 2007a). In this report results from the test periods are reported as deformation plots.
A further three test campaigns (Forsmark 2007b, 2009, 2010) were carried out after September 2006. Since the mechanical sensors didn’t work properly during the period after campaign 7, the results are only mentioned briefly in the plots of Chapter 8.• Campaign 8, October 15–19, 2007.• Campaign 9, October 20–24, 2008.• Campaign 10, November 10–19, 2009.
SKB R-12-12 21
3 Equipment
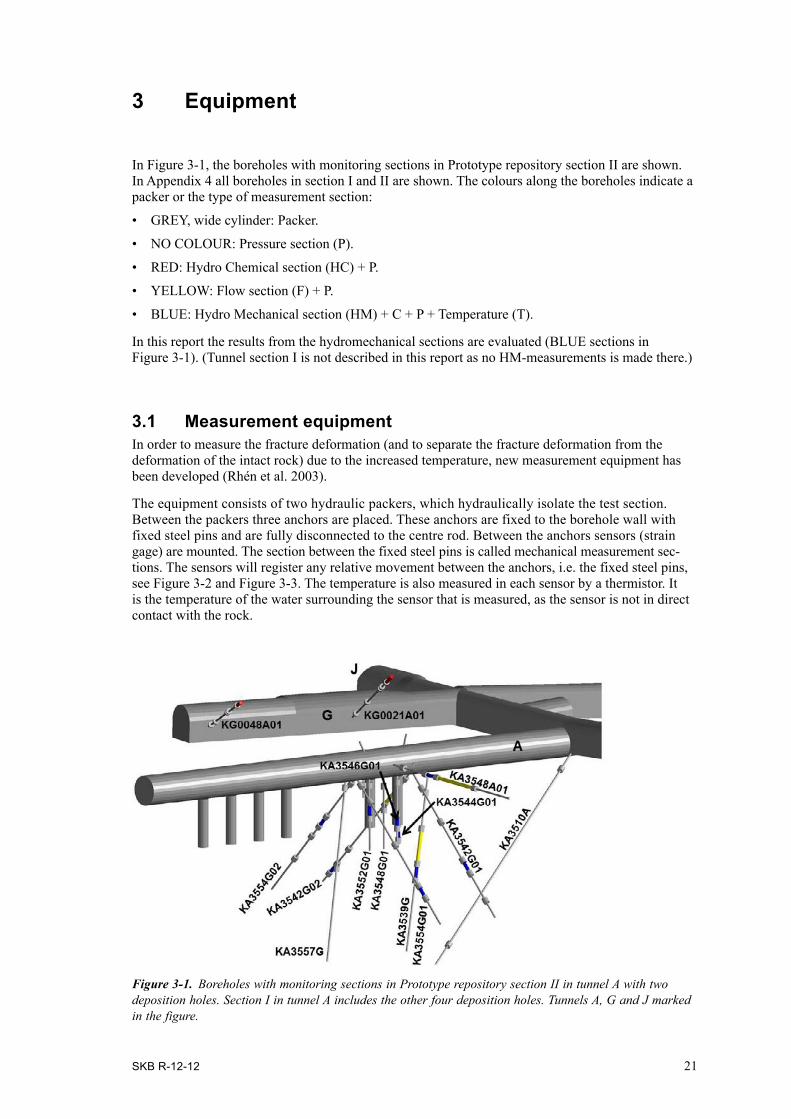
In Figure 3-1, the boreholes with monitoring sections in Prototype repository section II are shown. In Appendix 4 all boreholes in section I and II are shown. The colours along the boreholes indicate a packer or the type of measurement section:
• GREY, wide cylinder: Packer.
• NO COLOUR: Pressure section (P).
• RED: Hydro Chemical section (HC) + P.
• YELLOW: Flow section (F) + P.
• BLUE: Hydro Mechanical section (HM) + C + P + Temperature (T).
In this report the results from the hydromechanical sections are evaluated (BLUE sections in Figure 3-1). (Tunnel section I is not described in this report as no HM-measurements is made there.)
3.1 Measurement equipment In order to measure the fracture deformation (and to separate the fracture deformation from the deformation of the intact rock) due to the increased temperature, new measurement equipment has been developed (Rhén et al. 2003).
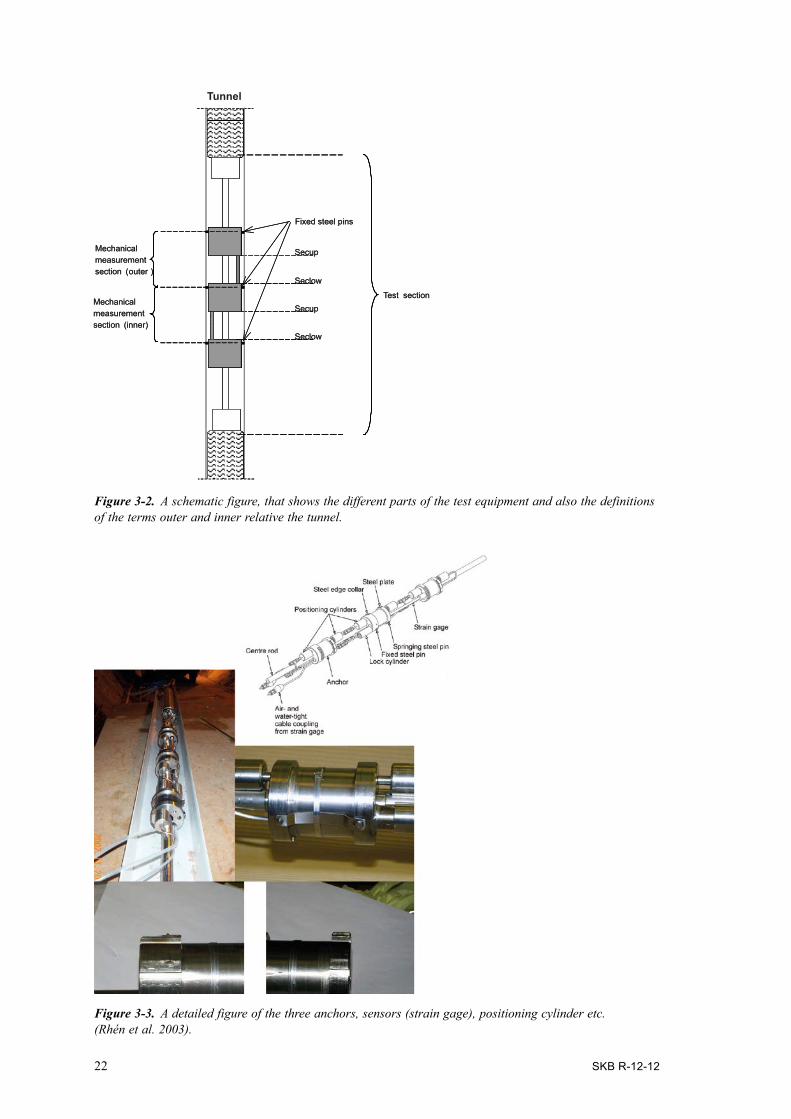
The equipment consists of two hydraulic packers, which hydraulically isolate the test section. Between the packers three anchors are placed. These anchors are fixed to the borehole wall with fixed steel pins and are fully disconnected to the centre rod. Between the anchors sensors (strain gage) are mounted. The section between the fixed steel pins is called mechanical measurement sec-tions. The sensors will register any relative movement between the anchors, i.e. the fixed steel pins, see Figure 3-2 and Figure 3-3. The temperature is also measured in each sensor by a thermistor. It is the temperature of the water surrounding the sensor that is measured, as the sensor is not in direct contact with the rock.
Figure 3-1. Boreholes with monitoring sections in Prototype repository section II in tunnel A with two deposition holes. Section I in tunnel A includes the other four deposition holes. Tunnels A, G and J marked in the figure.
22 SKB R-12-12
Figure 3-2. A schematic figure, that shows the different parts of the test equipment and also the definitions of the terms outer and inner relative the tunnel.
Figure 3-3. A detailed figure of the three anchors, sensors (strain gage), positioning cylinder etc. (Rhén et al. 2003).
Secup
Seclow
Secup
Seclow
Mechanicalmeasurementsection (outer )
Fixed steel pins
Mechanicalmeasurementsection (inner)
Test section
Secup
Seclow
Secup
Seclow
Tunnel
Mechanicalmeasurementsection (outer )
Fixed steel pins
Mechanicalmeasurementsection (inner)
Test section
SKB R-12-12 23
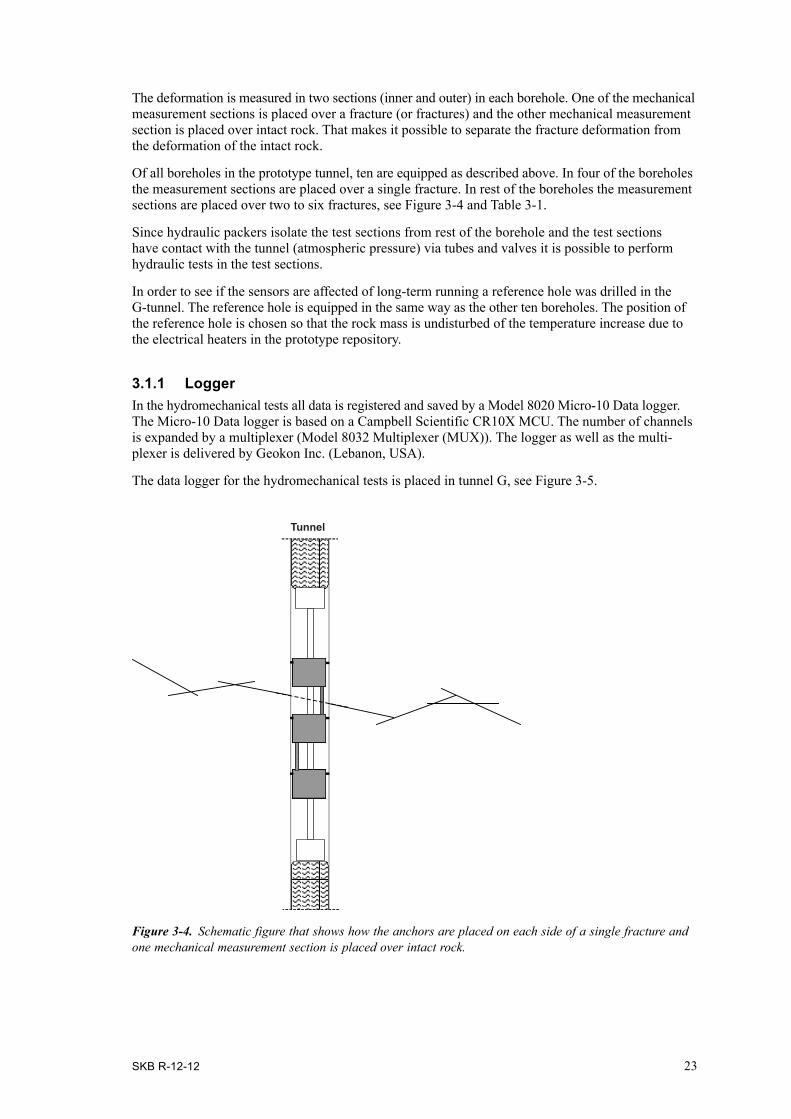
The deformation is measured in two sections (inner and outer) in each borehole. One of the mechanical measurement sections is placed over a fracture (or fractures) and the other mechanical measurement section is placed over intact rock. That makes it possible to separate the fracture deformation from the deformation of the intact rock.
Of all boreholes in the prototype tunnel, ten are equipped as described above. In four of the bore holes the measurement sections are placed over a single fracture. In rest of the boreholes the measurement sections are placed over two to six fractures, see Figure 3-4 and Table 3-1.
Since hydraulic packers isolate the test sections from rest of the borehole and the test sections have contact with the tunnel (atmospheric pressure) via tubes and valves it is possible to perform hydraulic tests in the test sections.
In order to see if the sensors are affected of long-term running a reference hole was drilled in the G-tunnel. The reference hole is equipped in the same way as the other ten boreholes. The position of the reference hole is chosen so that the rock mass is undisturbed of the temperature increase due to the electrical heaters in the prototype repository.
3.1.1 LoggerIn the hydromechanical tests all data is registered and saved by a Model 8020 Micro-10 Data logger. The Micro-10 Data logger is based on a Campbell Scientific CR10X MCU. The number of channels is expanded by a multiplexer (Model 8032 Multiplexer (MUX)). The logger as well as the multi-plexer is delivered by Geokon Inc. (Lebanon, USA).
The data logger for the hydromechanical tests is placed in tunnel G, see Figure 3-5.
Figure 3-4. Schematic figure that shows how the anchors are placed on each side of a single fracture and one mechanical measurement section is placed over intact rock.
Tunnel

24 SKB R-12-12
Table 3-1. Data of the hydromechanical measurement sections (sensor ID, length, number of fractures etc).
Label Cable mark Sensor ID Position Secup (m) Seclow (m) Length of mech. measure-ment section (Lfr/Lir)1 (mm)
Number of fractures
KA3539G-2-1 HRA 1121 3511 Inner 16.77 16.97 311 2KA3539G-2-2 HRA 1122 3510 Outer 16.47 16.67 323.5 0KA3542G01-3-1 HRA 1231 3513 Inner 19.47 19.67 311 0KA3542G01-3-2 HRA 1232 3512 Outer 19.17 19.37 323.5 1KA3542G02-2-1 HRA 1321 3515 Inner 26.50 26.70 311 1KA3542G02-2-2 HRA 1322 3514 Outer 26.20 26.40 323.5 0KA3544G01-2-1 HRA 1621 3509 Inner 9.82 10.02 311 2KA3544G01-2-2 HRA 1622 3508 Outer 9.52 9.72 323.5 0KA3546G01-2-1 HRA 1721 3517 Inner 7.67 7.87 311 1KA3546G01-2-2 HRA 1722 3516 Outer 7.37 7.57 323.5 0KA3548A01-3-1 HRA 1831 3526 Inner 9.70 10.15 561 2KA3548A01-3-2 HRA 1832 3518 Outer 9.40 9.60 323.5 0KA3550G01-2-1 HRA 2121 3527 Inner 6.10 6.70 711 6KA3550G01-2-2 HRA 2122 3519 Outer 5.80 6.00 323.5 0KA3552G01-2-1 HRA 2521 3521 Inner 5.25 5.45 311 0KA3552G01-2-2 HRA 2522 3520 Outer 4.95 5.15 323.5 2KA3554G01-2-1 HRA 2821 3525 Inner 23.54 23.80 371 2KA3554G01-2-2 HRA 2822 3522 Outer 23.24 23.44 323.5 0KA3554G02-4-1 HRA 2941 3524 Inner 11.40 11.60 311 0KA3554G02-4-2 HRA 2942 3523 Outer 11.10 11.30 323.5 1KG0010B01-1-1 – 3238 Inner 3.66 3.86 265KG0010B01-1-2 – 3507 Outer 3.36 3.56 323.5
1 see Figures 3-2 and 4-2.
Figure 3-5. Data loggers for the hydromechanical equipment, located in Tunnel G.
SKB R-12-12 25
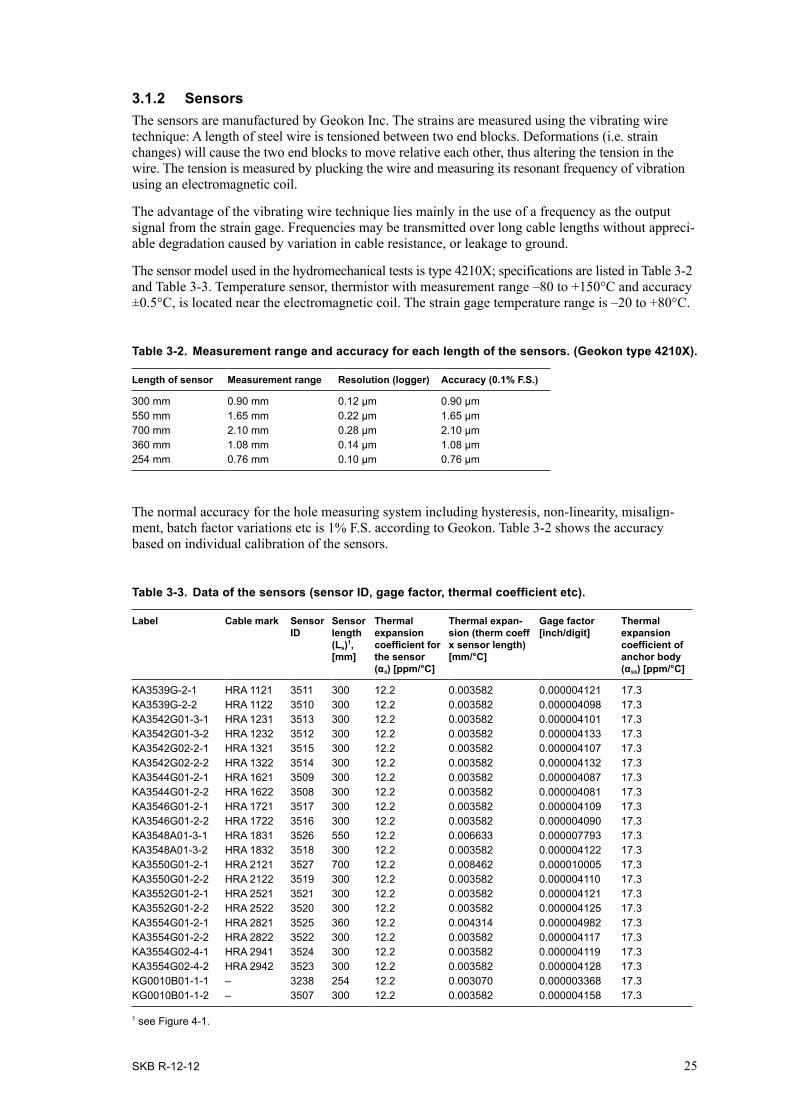
3.1.2 SensorsThe sensors are manufactured by Geokon Inc. The strains are measured using the vibrating wire technique: A length of steel wire is tensioned between two end blocks. Deformations (i.e. strain changes) will cause the two end blocks to move relative each other, thus altering the tension in the wire. The tension is measured by plucking the wire and measuring its resonant frequency of vibration using an electromagnetic coil.
The advantage of the vibrating wire technique lies mainly in the use of a frequency as the output signal from the strain gage. Frequencies may be transmitted over long cable lengths without appreci-able degradation caused by variation in cable resistance, or leakage to ground.
The sensor model used in the hydromechanical tests is type 4210X; specifications are listed in Table 3-2 and Table 3-3. Temperature sensor, thermistor with measurement range –80 to +150°C and accuracy ±0.5°C, is located near the electromagnetic coil. The strain gage temperature range is –20 to +80°C.
Table 3-2. Measurement range and accuracy for each length of the sensors. (Geokon type 4210X).
Length of sensor Measurement range Resolution (logger) Accuracy (0.1% F.S.)
300 mm 0.90 mm 0.12 µm 0.90 µm550 mm 1.65 mm 0.22 µm 1.65 µm700 mm 2.10 mm 0.28 µm 2.10 µm360 mm 1.08 mm 0.14 µm 1.08 µm254 mm 0.76 mm 0.10 µm 0.76 µm
The normal accuracy for the hole measuring system including hysteresis, non-linearity, misalign-ment, batch factor variations etc is 1% F.S. according to Geokon. Table 3-2 shows the accuracy based on individual calibration of the sensors.
Table 3-3. Data of the sensors (sensor ID, gage factor, thermal coefficient etc).
Label Cable mark Sensor ID
Sensor length (Ls)1, [mm]
Thermal expansion coefficient for the sensor (αs) [ppm/°C]
Thermal expan-sion (therm coeff x sensor length) [mm/°C]
Gage factor [inch/digit]
Thermal expansion coefficient of anchor body (αss) [ppm/°C]
KA3539G-2-1 HRA 1121 3511 300 12.2 0.003582 0.000004121 17.3KA3539G-2-2 HRA 1122 3510 300 12.2 0.003582 0.000004098 17.3KA3542G01-3-1 HRA 1231 3513 300 12.2 0.003582 0.000004101 17.3KA3542G01-3-2 HRA 1232 3512 300 12.2 0.003582 0.000004133 17.3KA3542G02-2-1 HRA 1321 3515 300 12.2 0.003582 0.000004107 17.3KA3542G02-2-2 HRA 1322 3514 300 12.2 0.003582 0.000004132 17.3KA3544G01-2-1 HRA 1621 3509 300 12.2 0.003582 0.000004087 17.3KA3544G01-2-2 HRA 1622 3508 300 12.2 0.003582 0.000004081 17.3KA3546G01-2-1 HRA 1721 3517 300 12.2 0.003582 0.000004109 17.3KA3546G01-2-2 HRA 1722 3516 300 12.2 0.003582 0.000004090 17.3KA3548A01-3-1 HRA 1831 3526 550 12.2 0.006633 0.000007793 17.3KA3548A01-3-2 HRA 1832 3518 300 12.2 0.003582 0.000004122 17.3KA3550G01-2-1 HRA 2121 3527 700 12.2 0.008462 0.000010005 17.3KA3550G01-2-2 HRA 2122 3519 300 12.2 0.003582 0.000004110 17.3KA3552G01-2-1 HRA 2521 3521 300 12.2 0.003582 0.000004121 17.3KA3552G01-2-2 HRA 2522 3520 300 12.2 0.003582 0.000004125 17.3KA3554G01-2-1 HRA 2821 3525 360 12.2 0.004314 0.000004982 17.3KA3554G01-2-2 HRA 2822 3522 300 12.2 0.003582 0.000004117 17.3KA3554G02-4-1 HRA 2941 3524 300 12.2 0.003582 0.000004119 17.3KA3554G02-4-2 HRA 2942 3523 300 12.2 0.003582 0.000004128 17.3KG0010B01-1-1 – 3238 254 12.2 0.003070 0.000003368 17.3KG0010B01-1-2 – 3507 300 12.2 0.003582 0.000004158 17.3
1 see Figure 4-1.

SKB R-12-12 27
4 Measurement and data analysis procedures
4.1 Deformation measurements principles Measuring the deformation of fractures and intact rock during the operation phase is a continuous activity that is ongoing independent of other activities in the prototype area.
Beside the installation of the equipment the activities is limited to:
• Downloading data from the logger on a regular basis.
• Control of data in order to see if the sensors are working.
• Visual control of the logger equipment at certain intervals.
The main purpose of the measurements is to register both temperature change and deformation in the rock mass. The logger registers both temperature and strain (from each sensor) every hour.
If hydraulic tests are done, the measurement sampling rate is increased to twice every minute and downloading of data from logger has to be done at least after the test campaign is finished or earlier if the capacity of the storage of data is not enough.
4.2 Data handling of hydromechanical measurementsThe data is down loaded and transferred (via telephone modem) to a server by Berg Bygg Konsult AB and then delivered to SWECO Environment AB. The raw data is evaluated and analysed and presented in this report.
All the referred activity plans for this report has been checked and all are reported and stored in SKB’s database SICADA under project number F63.1.
4.3 Analyses and interpretation of hydromechanical measurements
The analyses and interpretation has to be done in four steps, namely:
1. Control and compare the temperature data from the inner and outer sensors and finally chose the data set that is used.
2. Calculate and evaluate the sensor deformation by using the gage factor and temperature data.– The sensor deformation is adjusted due to the temperature by using the thermal coefficient of
the sensor (αsensor) and thermal coefficient of the anchor body (αstainless steal).
3. Calculate the rock and fracture deformation.– In order to separate the fracture deformation from the deformation of the rock mass it is
necessary to evaluate the strain of the intact rock.
4. Interpretation of the results.
4.3.1 Temperature dataIn each test section there are two sensors and each of them contains thermistors that measure the temperature. Theoretically these two thermistors deliver the same data since they are close to each other and the ground water flow easily between the sensors. However, it has turned out that the zero-level is not the same between the thermistors. Some of the thermistors have failed as well or just delivers incorrect data.

28 SKB R-12-12
The temperature data is controlled in three steps:
1. The raw data from inner and outer thermistor is plotted versus time.
2. Visual control,a. extreme values, such as temperature below zero, and over 100°C are removed,b. (occasionally) values that stand out from the rest are removed,c. data from failed thermistors are removed.
3. Chose temperature, a. if the raw data from both thermistors are good the average of them is chosen (In Appendix 1
temperature is shown for inner and outer sections),b. if just one of them is good that one is chosen,c. if none of the thermistors works, data from another section (with the same distance to the
heater) is chosen.
4.3.2 Deformation data The signal from the sensor is registered or presented as digits. Each sensor is calibrated and one digit represents a certain movement, i.e. gage factor. Since the sensor also is affected of the change in temperature the result must be compensated for the change in length due to the temperature increase or decrease.
Furthermore, there is a distance, Lanchor body, between the fixed steel pin (i.e. the contact point between the anchor and the borehole wall) and the attach point of the sensor. The readout from the sensor must be corrected due to the thermal expansion of this part of the anchor body, see Figure 4-1.
The correction due to the thermal expansion of sensor and the anchor bodies is done as follows, see Figure 4-1 and Table 3-3:
(4-1))(
)()(TL
TLfactorgagedigitsofnumberxbodyanchorsteelstainless
sensorsensorcorrected
∆××+∆××+×∆=∆
αα
where:
αsensor = αs = thermal coefficient for sensor = 12.2·10–6/°C
Lsensor = Ls= length of the sensor
ΔT = change in temperature from reference temperature at time t0 =T(time t)–T(time t0)
αstainless steel = ass= thermal coefficient for anchor body = 17.3·10–6/°C
Lanchor body = La = length of the part between the fixed steel pin and the attach point of the sensor La= c. 11 mm
Δ(number of digits) = digits(time t)–digits(reference position at time t0)
Figure 4-1. The figure shows how the sensor is mounted to the anchor body as well as the fixed contact point (fixed steel pin) between the anchor and the borehole wall.
Fixed steel pin Fixed steel pin
Lanchor body
Outer sensor
Inner sens
Lsensor

SKB R-12-12 29
Assuming the change in temperature is 1°C the correction for a 300 mm long sensor is 3.7E-6 m and the correction for the anchor body 2E-7 m. The correction for the anchor body is c. 10 to 20 smaller than the temperature correction related to the sensor for equipment used, and could in principle for this experiment be neglected. In Section 7.4 a few examples of the temperature change during short-term tests of the water in the test sections are shown. The examples indicate that the changes may be 0.1 to 0.2°C. This means that the applied correction to the short term deformation measurements may be up to c. 1E-6 m and the observed corrected deformations are up to c. 4E-5 m. The tempera-ture corrections applied on the data for short term tests are thus generally significantly smaller than the deformation measurements made, see Section 7.4 for more details and comments.
The deformation data is controlled as well. The deformation data is controlled in two steps:
1. The raw data from inner and outer sensor is plotted versus time.
2. Visual control,a. extreme values, such as deformation larger than the measurement range are removed,b. exceptional values that stand out from the rest are removed,c. a failed sensor is removed. Eventually the data before breakdown can be used.
4.3.3 Results / Fracture deformationFracture deformationResults from the measurement sections include deformation of intact rock as well as fractures and therefore need to be evaluated in order to separate the fracture deformation, Δδfracture :
Δδ fracture = Δx fractured rock –Δx intact rock
However, since the length of the mechanical measurement sections varies with the change in fracture deformation, must be estimated by following calculation, see Figure 4-2 and Table 3-3.
×
∆−∆=∆ fr
ir
corrircorr
frfracture LLxxδ (4-2)
where:
Δxfrcorr = Δxcorrected
fractured rock = corrected change in length of sensor placed in fractured rock
Δxircorr = Δxcorrected
intact rock = corrected change in length of sensor placed in intact rock
Lfr = Lfractured rock = length of the mechanical measurement section (in fractured rock)
Lir = Lintact rock = length of the mechanical measurement section (in intact rock)
Figure 4-2. Denominations used when calculating the fracture deformation.
Fracture
x frx ir
L fr L ir

30 SKB R-12-12
4.3.4 Hydraulic test campaigns Test procedureA selected borehole section is tested with a single hole pressure build-up test. A pressure build-up test roughly include following steps:
• Initialising of the HMS system 30 minutes before flow start with logging interval of 5 minutes.
• A couple of minutes before flow start and until 5 minutes after flow start the highest logging interval of 3 seconds are used for measuring the pressure changes. Thereafter the logging interval is 30 seconds which is used until 30 minutes after flow start and a logging interval of 5 minutes is then used once again.
• The flow is measured with a flow metre. The flow is also measured manually 2–3 times the first 5 minutes after flow start, 2–3 times the following 60 minutes and 3 times shortly before flow stop.
• From shortly before flow stop until 5 minutes after flow stop the highest logging interval of 3 sec-onds are used for measuring the pressure changes. Thereafter the logging frequency is 30 seconds which is used until 30 minutes after flow start and a logging frequency of 5 minutes is then used.
• The valve shutting is done as swiftly as possible.
The test procedure and the results are described in detail in Forsmark and Rhén (2004a, b, c, 2005a, b, c) and Forsmark (2006, 2007a, b, 2008, 2010) and in Appendix 3 there is an overview of the test campaigns.
Analyses and interpretation of the hydraulic testTwo methods are used; a stationary method (TMoye) and a transient method applied on the recovery phase.
The Moye formula can be used for interpretation of steady state tests in order to get an estimate of the transmissivity (Moye 1967):
TMoye = Q·(1 + ln(L/(2·rw))) / (2·π ·Δh) whereQ = average water flow before shutting the valve after the flowing phase [m3/s]Δh = (p0 –pp) / (rw·g) [m]L = test section length [m]rw = borehole radius [m]p0 = absolute pressure in test section before start of flow period [Pa]pp = absolute pressure in test section before stop of flow period [Pa]rw = water density [kg/m3]g = acceleration of gravity [m/s2]
The method suggested by Moye (1967) assumes a steady state radial flow near the tested section and spherical flow at some distance.
For the transient evaluation the measured flow rate for the flowing phase is used (multirate approach) and the pressure from the pressure build-up period is used for the evaluation. Evaluating the transient data, the pressure change, Δp, is plotted versus the equivalent time, dte, in minutes. The equivalent time, dte, (Spane and Wurstner 1993) is defined as:
dte = (tp·dt) / (tp + dt) wheretp = the flowing time of the bore hole before shutting the valve dt = the time after shutting the valveThe pressure change Δp is calculated as:Δp = p(dt) –p(tp)p(dt) = measured pressure at time dt after shutting the valvep(tp) = measured pressure just before shutting the valve
SKB R-12-12 31
The tests are evaluated using the software AQTESOLV ver. 4.50. AQTESOLV is the all-in-one soft-ware package for the design and analysis of aquifer tests including pumping tests, step-drawdown tests, variable-rate tests, recovery tests, single-well tests, slug tests and constant-head tests. The software is developed by HydroSOLVE, Inc., USA. General approach for transient analysis is presented in Horne (1995).
The solution used in the analysis is the Dougherty-Babu model for a pumping test in a confined aquifer (Dougherty and Babu 1984). The model assumes radial flow in a porous medium. AQTESOLV uses the principle of superposition in time to simulate variable-rate tests including recovery with the solution. The result consist of:
Transmissivity, T (m2/s)
Skinfactor, Sw (-)
Both methods outlines above, the steady state and the transient methods, assume radial flow. However, Moye (1967) ads a spherical part and using a transient method one can evaluate the flow dimension to check if there is radial flow. Radial flow may not always be present but the evaluation of the flow dimension indicate that radial flow is approximately present in many cases with hydraulic transient tests in crystalline rock, which also has been seen in other SKB projects, see e.g. Rhén et al. (2008). It is there for judged that the evaluation methods used are appropriate for evaluating trans-missivity changes during the experiment, even though it is a fractured medium and not a porous medium. Details of the observed flow regimes can be found in the reports for the individual tests, see References in the end of this report.
The effective stress in the fracture system will increase when the flowing period starts and will go back to its initial conditions during the pressure build-up period. TMoye is based on the minimum flow rate and the maximum drawdown during the flow period and represents then a situation with lowest effective stress in the fracture/s. T from the transient evaluation will mainly depend on a match of pressures in the fracture(s that have effective stress close to the effective stress at the initial condi-tions. The transient evaluation can also take into account a skin factor, assumed to be a hydraulic resistance near the borehole wall. In general one would then expect that the transient evaluated T based on the pressure build-up period should be more relevant for evaluation of the actual trans-missivity of a fracture.
To gain more information, the test campaigns were modified from test campaign 4. Applied Δp were c. 100 kPa, 200 kPa and maximum drawdown (open valves in the G-tunnel). In some test campaigns only c. 100 kPa and maximum drawdown could be applied. In test campaigns 1–3 only maximum drawdown was applied.
In Section 7-3 where the long-time evolution of the deformation and transmissivity are shown, it is the T-values from maximum drawdown that is plotted.
It is of uttermost importance when evaluation the hydraulic tests within the scope of this report that all tests are evaluated using the same approach between the test campaigns. This is important to be able to evaluate the relative difference of the transmissivity from one test campaign to another.
Fracture deformationThe fracture and rock deformation is evaluated as described in Section 4.3.2 and 4.3.3.
4.3.5 Pressure head in borehole sectionsIn Appendix 2 the long-term development of the pressure head in boreholes with HM – measure-ments are shown.
SKB R-12-12 33
5 Geology of hydromechanical sections
In this chapter the geology is described in brief for each of the hydromechanical sections. The exact positioning of the hydromechanical equipment is detailed in Table 3-1. All tested sections are detailed in Appendix 5. An example is shown below.
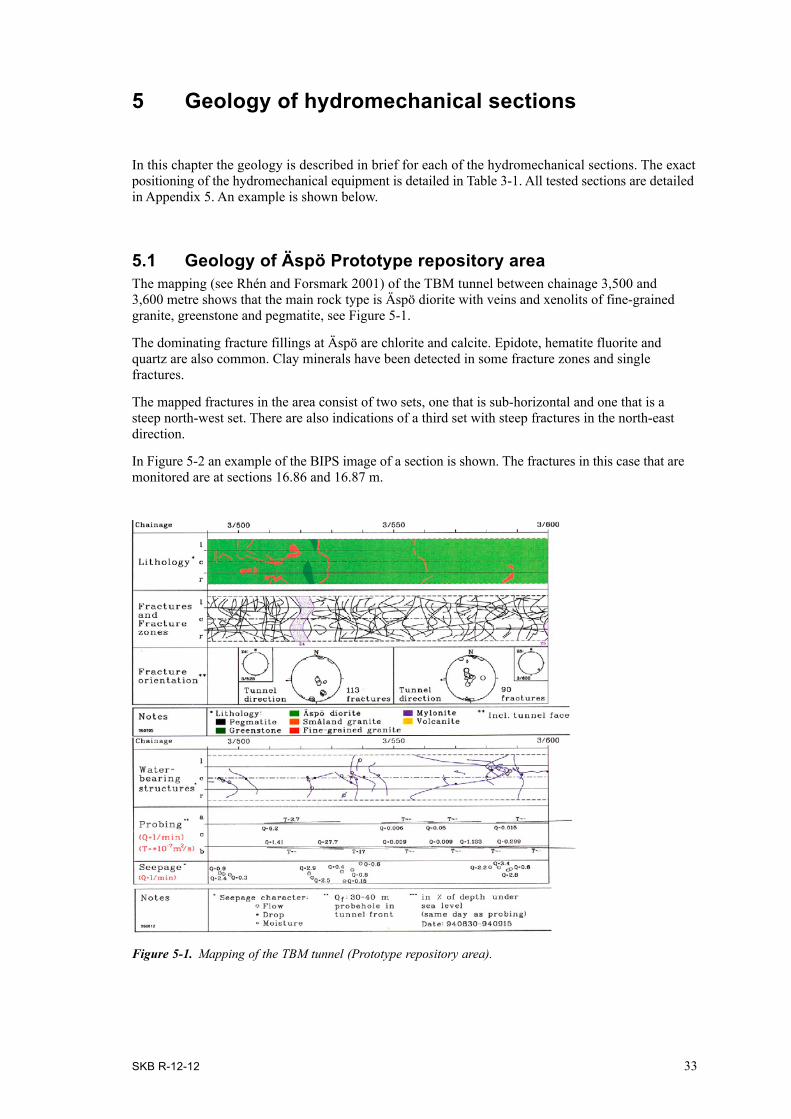
5.1 Geology of Äspö Prototype repository areaThe mapping (see Rhén and Forsmark 2001) of the TBM tunnel between chainage 3,500 and 3,600 metre shows that the main rock type is Äspö diorite with veins and xenolits of fine-grained granite, greenstone and pegmatite, see Figure 5-1.
The dominating fracture fillings at Äspö are chlorite and calcite. Epidote, hematite fluorite and quartz are also common. Clay minerals have been detected in some fracture zones and single fractures.
The mapped fractures in the area consist of two sets, one that is sub-horizontal and one that is a steep north-west set. There are also indications of a third set with steep fractures in the north-east direction.
In Figure 5-2 an example of the BIPS image of a section is shown. The fractures in this case that are monitored are at sections 16.86 and 16.87 m.
Figure 5-1. Mapping of the TBM tunnel (Prototype repository area).

34 SKB R-12-12
Table 5-1. Fractures in KA3539G, 15.85–17.60 m. (Aperture: Estimated from BIPS and should not be interpreted as hydraulic aperture but rather as an indication of difference of openness between observed (interpreted) open fracture.)
Borehole Section (m) Strike (°) Dip (°) Aperture (mm) Mineral Comments
KA3539G 16.86 195 59 2 Calcite MonitoredKA3539G 16.87 53 27 2 Calcite Monitored
Figure 5-2. BIPS image of KA3539G (16.5–17.4 m).
The rocktype of the section is granodiorite. There are xenoliths of mafic igneous rock between 16.15–16.20 m and 17.16–17.20 m.

SKB R-12-12 35
6 Overview of hydromechanical performance, canister heating and hydraulic tests
6.1 Hydromechanical sensor performanceSeveral of the sensors failed due to different technical reasons during the period up to 2006-10-01. Below are shown in two diagrams the operational periods of each sensor.
The reason for the long non-operational period starting in February 2005 is due to the probable cause that increased water pressure, occurring when the drainage of Prototype section 1 was closed down 2004-11-01. This caused water entering the signal cables and finally the data logger equipment. The drainage-system was re-opened 2004-12-06 due to electrical problems with the canister heaters. Several sensors have unfortunately failed to operate after the replacement of logger and connecting equipment. They were permanently lost. The temperature measurements were however on-going for most sections.
Figure 6-1. Operational periods of hydromechanical sensors (Sensor ID, see Table 3-1).
Figure 6-2. Operational periods of temperature sensors in HM-equipment (Sensor ID, see Table 3-1).
2003
-05-
0120
03-0
6-01
2003
-07-
0120
03-0
8-01
2003
-09-
0120
03-1
0-01
2003
-11-
0120
03-1
2-01
2004
-01-
0120
04-0
2-01
2004
-03-
0120
04-0
4-01
2004
-05-
0120
04-0
6-01
2004
-07-
0120
04-0
8-01
2004
-09-
0120
04-1
0-01
2004
-11-
0120
04-1
2-01
2005
-01-
0120
05-0
2-01
2005
-03-
0120
05-0
4-01
2005
-05-
0120
05-0
6-01
2005
-07-
0120
05-0
8-01
2005
-09-
0120
05-1
0-01
2005
-11-
0120
05-1
2-01
2006
-01-
0120
06-0
2-01
2006
-03-
0120
06-0
4-01
2006
-05-
0120
06-0
6-01
2006
-07-
0120
06-0
8-01
2006
-09-
0120
06-1
0-01
3511351035133512351535143509350835173516352635183527351935213520352535223524352332383507
KA3539GKA3539GKA3542G01KA3542G01KA3542G02KA3542G02KA3544G01KA3544G01KA3546G01KA3546G01KA3548A01KA3548A01KA3550G01KA3550G01KA3552G01KA3552G01KA3554G01KA3554G01KA3554G02KA3554G02KG0010B01KG0010B01
Operation periods of HM sensors
Sens
or ID
2003
-05-
0120
03-0
6-01
2003
-07-
0120
03-0
8-01
2003
-09-
0120
03-1
0-01
2003
-11-
0120
03-1
2-01
2004
-01-
0120
04-0
2-01
2004
-03-
0120
04-0
4-01
2004
-05-
0120
04-0
6-01
2004
-07-
0120
04-0
8-01
2004
-09-
0120
04-1
0-01
2004
-11-
0120
04-1
2-01
2005
-01-
0120
05-0
2-01
2005
-03-
0120
05-0
4-01
2005
-05-
0120
05-0
6-01
2005
-07-
0120
05-0
8-01
2005
-09-
0120
05-1
0-01
2005
-11-
0120
05-1
2-01
2006
-01-
0120
06-0
2-01
2006
-03-
0120
06-0
4-01
2006
-05-
0120
06-0
6-01
2006
-07-
0120
06-0
8-01
2006
-09-
0120
06-1
0-01
3511351035133512351535143509350835173516352635183527351935213520352535223524352332383507
KA3539GKA3539GKA3542G01KA3542G01KA3542G02KA3542G02KA3544G01KA3544G01KA3546G01KA3546G01KA3548A01KA3548A01KA3550G01KA3550G01KA3552G01KA3552G01KA3554G01KA3554G01KA3554G02KA3554G02KG0010B01KG0010B01
Sens
or ID
Operation periods of Temperature sensors
36 SKB R-12-12
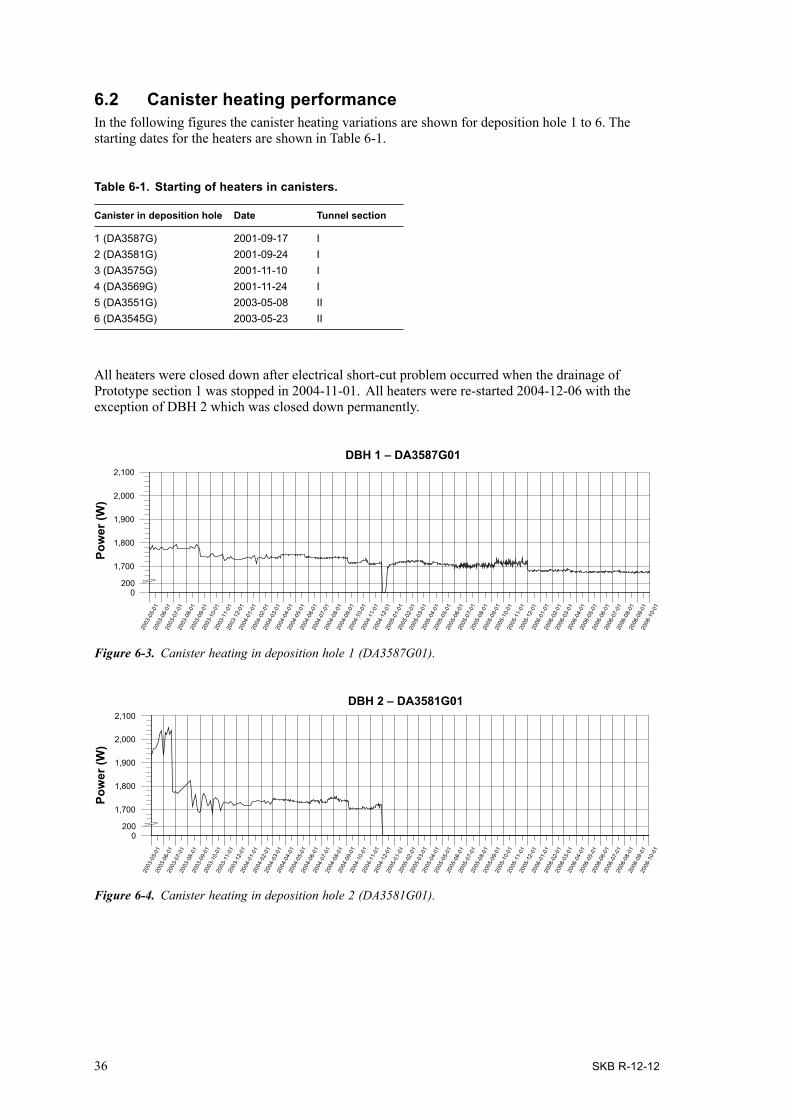
6.2 Canister heating performanceIn the following figures the canister heating variations are shown for deposition hole 1 to 6. The starting dates for the heaters are shown in Table 6-1.
Table 6-1. Starting of heaters in canisters.
Canister in deposition hole Date Tunnel section
1 (DA3587G) 2001-09-17 I2 (DA3581G) 2001-09-24 I3 (DA3575G) 2001-11-10 I4 (DA3569G) 2001-11-24 I5 (DA3551G) 2003-05-08 II6 (DA3545G) 2003-05-23 II
All heaters were closed down after electrical short-cut problem occurred when the drainage of Prototype section 1 was stopped in 2004-11-01. All heaters were re-started 2004-12-06 with the exception of DBH 2 which was closed down permanently.
Figure 6-3. Canister heating in deposition hole 1 (DA3587G01).
Figure 6-4. Canister heating in deposition hole 2 (DA3581G01).
Pow
er (W
)
DBH 2 – DA3581G01
2003
-05-
0120
03-0
6-01
2003
-07-
0120
03-0
8-01
2003
-09-
0120
03-1
0-01
2003
-11-
0120
03-1
2-01
2004
-01-
0120
04-0
2-01
2004
-03-
0120
04-0
4-01
2004
-05-
0120
04-0
6-01
2004
-07-
0120
04-0
8-01
2004
-09-
0120
04-1
0-01
2004
-11-
0120
04-1
2-01
2005
-01-
0120
05-0
2-01
2005
-03-
0120
05-0
4-01
2005
-05-
0120
05-0
6-01
2005
-07-
0120
05-0
8-01
2005
-09-
0120
05-1
0-01
2005
-11-
0120
05-1
2-01
2006
-01-
0120
06-0
2-01
2006
-03-
0120
06-0
4-01
2006
-05-
0120
06-0
6-01
2006
-07-
0120
06-0
8-01
2006
-09-
0120
06-1
0-01
0200
1,700
1,800
1,900
2,000
2,100
2003
-05-
0120
03-0
6-01
2003
-07-
0120
03-0
8-01
2003
-09-
0120
03-1
0-01
2003
-11-
0120
03-1
2-01
2004
-01-
0120
04-0
2-01
2004
-03-
0120
04-0
4-01
2004
-05-
0120
04-0
6-01
2004
-07-
0120
04-0
8-01
2004
-09-
0120
04-1
0-01
2004
-11-
0120
04-1
2-01
2005
-01-
0120
05-0
2-01
2005
-03-
0120
05-0
4-01
2005
-05-
0120
05-0
6-01
2005
-07-
0120
05-0
8-01
2005
-09-
0120
05-1
0-01
2005
-11-
0120
05-1
2-01
2006
-01-
0120
06-0
2-01
2006
-03-
0120
06-0
4-01
2006
-05-
0120
06-0
6-01
2006
-07-
0120
06-0
8-01
2006
-09-
0120
06-1
0-01
0200
1,700
1,800
1,900
2,000
2,100
Pow
er (W
)
DBH 1 – DA3587G01

SKB R-12-12 37
Figure 6-5. Canister heating in deposition hole 3 (DA3575G01).
Figure 6-6. Canister heating in deposition hole 4 (DA3569G01).
Figure 6-7. Canister heating in deposition hole 5 (DA3551G01).
Figure 6-8. Canister heating in deposition hole 6 (DA3545G01).
Pow
er (W
)
DBH 3 – DA3575G01
2003
-05-
0120
03-0
6-01
2003
-07-
0120
03-0
8-01
2003
-09-
0120
03-1
0-01
2003
-11-
0120
03-1
2-01
2004
-01-
0120
04-0
2-01
2004
-03-
0120
04-0
4-01
2004
-05-
0120
04-0
6-01
2004
-07-
0120
04-0
8-01
2004
-09-
0120
04-1
0-01
2004
-11-
0120
04-1
2-01
2005
-01-
0120
05-0
2-01
2005
-03-
0120
05-0
4-01
2005
-05-
0120
05-0
6-01
2005
-07-
0120
05-0
8-01
2005
-09-
0120
05-1
0-01
2005
-11-
0120
05-1
2-01
2006
-01-
0120
06-0
2-01
2006
-03-
0120
06-0
4-01
2006
-05-
0120
06-0
6-01
2006
-07-
0120
06-0
8-01
2006
-09-
0120
06-1
0-01
0200
1,700
1,800
1,900
2,000
2,100
Pow
er (W
)
DBH 4 – DA3569G01
2003
-05-
0120
03-0
6-01
2003
-07-
0120
03-0
8-01
2003
-09-
0120
03-1
0-01
2003
-11-
0120
03-1
2-01
2004
-01-
0120
04-0
2-01
2004
-03-
0120
04-0
4-01
2004
-05-
0120
04-0
6-01
2004
-07-
0120
04-0
8-01
2004
-09-
0120
04-1
0-01
2004
-11-
0120
04-1
2-01
2005
-01-
0120
05-0
2-01
2005
-03-
0120
05-0
4-01
2005
-05-
0120
05-0
6-01
2005
-07-
0120
05-0
8-01
2005
-09-
0120
05-1
0-01
2005
-11-
0120
05-1
2-01
2006
-01-
0120
06-0
2-01
2006
-03-
0120
06-0
4-01
2006
-05-
0120
06-0
6-01
2006
-07-
0120
06-0
8-01
2006
-09-
0120
06-1
0-01
0200
1,700
1,800
1,900
2,000
2,100
Pow
er (W
)
DBH 5 – DA3551G01
2003
-05-
0120
03-0
6-01
2003
-07-
0120
03-0
8-01
2003
-09-
0120
03-1
0-01
2003
-11-
0120
03-1
2-01
2004
-01-
0120
04-0
2-01
2004
-03-
0120
04-0
4-01
2004
-05-
0120
04-0
6-01
2004
-07-
0120
04-0
8-01
2004
-09-
0120
04-1
0-01
2004
-11-
0120
04-1
2-01
2005
-01-
0120
05-0
2-01
2005
-03-
0120
05-0
4-01
2005
-05-
0120
05-0
6-01
2005
-07-
0120
05-0
8-01
2005
-09-
0120
05-1
0-01
2005
-11-
0120
05-1
2-01
2006
-01-
0120
06-0
2-01
2006
-03-
0120
06-0
4-01
2006
-05-
0120
06-0
6-01
2006
-07-
0120
06-0
8-01
2006
-09-
0120
06-1
0-01
0200
1,700
1,800
1,900
2,000
2,100
Pow
er (W
)
DBH 6 – DA3545G01
2003
-05-
0120
03-0
6-01
2003
-07-
0120
03-0
8-01
2003
-09-
0120
03-1
0-01
2003
-11-
0120
03-1
2-01
2004
-01-
0120
04-0
2-01
2004
-03-
0120
04-0
4-01
2004
-05-
0120
04-0
6-01
2004
-07-
0120
04-0
8-01
2004
-09-
0120
04-1
0-01
2004
-11-
0120
04-1
2-01
2005
-01-
0120
05-0
2-01
2005
-03-
0120
05-0
4-01
2005
-05-
0120
05-0
6-01
2005
-07-
0120
05-0
8-01
2005
-09-
0120
05-1
0-01
2005
-11-
0120
05-1
2-01
2006
-01-
0120
06-0
2-01
2006
-03-
0120
06-0
4-01
2006
-05-
0120
06-0
6-01
2006
-07-
0120
06-0
8-01
2006
-09-
0120
06-1
0-01
0200
1,700
1,800
1,900
2,000
2,100

38 SKB R-12-12
6.3 Overview of temperature increase in prototype section IIThe tested sections can be divided into classes with “thermal” distances, where the distance is the closest distance to a heating canister:
• approx. 1 m : KA3550G01:2 and KA3552G01:2,
• approx. 1.5 m : KA3544G01:2 and KA3546G01:2,
• approx. 10 m : KA3539G:2 and KA3554G02:4,
• approx. 15 m : KA3542G01:3 and KA3548A01:3,
• approx. 20 m : KA3542G02:2 and KA3554G01:2.
In Table 6-2 the reference temperature for each test section equipped with hydromechanical equip-ment is shown.
Table 6-2. Reference temperature in test sections.
Borehole section Date Temperature (°C)
KG0010B01 2003-05-16 12.62KA3539G:2 2003-05-06 13.88KA3542G01:3 2003-05-06 13.87KA3542G02:2 2003-05-06 14.10KA3544G01:2 2003-05-06 14.06KA3546G01:2 2003-05-06 14.01KA3548A01:3 2003-05-06 13.90KA3550G01:2 2003-05-06 14.32KA3552G01:2 2003-05-06 14.32KA3554G01:2 2003-05-06 13.95KA3554G02:4 2003-05-06 14.56
In the figure below the hydraulic test periods are shown as vertical lines.
Figure 6-9. Temperature development in the boreholes. Overview of hydraulic test periods until test campaign 7.
10
15
20
25
30
35
40
45
50
Tem
pera
ture
(°C)
KA3539G:2KA3542G01:3KA3542G02:2KA3544G01:2KA3546G01:2KA3548A01:3KA3550G01:2KA3552G01:2KA3554G01:2KA3554G02:4Test period
TC 1 TC
2 TC 3 TC
4 TC 5 TC
6 TC
7
Daily average temperature

SKB R-12-12 39
6.4 Backfilling of section II and construction of plugThe backfilling of section II started 2003-04-29 and work continued until 2003-06-27. The casting of the outer plug was finalized 2003-09-11.
6.5 Operation period of section II Measurements were made up to late 2010. Demolition work of the outer plug of section II started during December 2010 and was finalized during February 2011. The work was done by drilling several boreholes into the concrete plug continued by mechanical impact with a hydraulic hammer and a hydraulic breaker.
The backfill material was then carefully excavated with a lot of material samples taken every 2 metre to determine amongst other parameters water content and density. The heating canister in deposition hole 6 was retrieved 2011-07-14 and the same was done with the canister in deposition hole 5 2011-12-07. All demolition work in the tunnel section II was finalized by 2011-12-15.
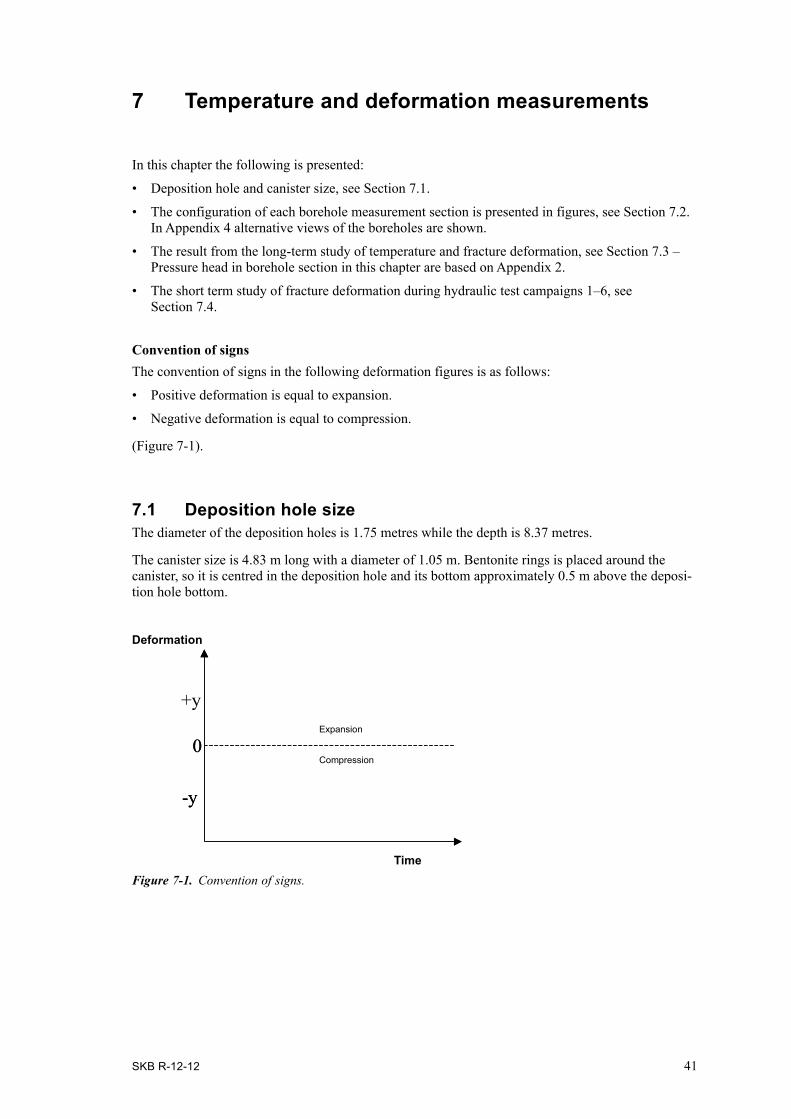
SKB R-12-12 41
7 Temperature and deformation measurements
In this chapter the following is presented:
• Deposition hole and canister size, see Section 7.1.
• The configuration of each borehole measurement section is presented in figures, see Section 7.2. In Appendix 4 alternative views of the boreholes are shown.
• The result from the long-term study of temperature and fracture deformation, see Section 7.3 – Pressure head in borehole section in this chapter are based on Appendix 2.
• The short term study of fracture deformation during hydraulic test campaigns 1–6, see Section 7.4.
Convention of signsThe convention of signs in the following deformation figures is as follows:
• Positive deformation is equal to expansion.
• Negative deformation is equal to compression.
(Figure 7-1).
7.1 Deposition hole sizeThe diameter of the deposition holes is 1.75 metres while the depth is 8.37 metres.
The canister size is 4.83 m long with a diameter of 1.05 m. Bentonite rings is placed around the canister, so it is centred in the deposition hole and its bottom approximately 0.5 m above the deposi-tion hole bottom.
Figure 7-1. Convention of signs.
0
-y
Expansion
Deformation
Time
0
-y
+y
Compression

42 SKB R-12-12
7.2 Test section data7.2.1 KG0010B01This borehole is 6.10 m long. The hydromechanical test section is between 2.80 m and 4.35 m. This hole is used as a reference hole not influenced by the increased temperature around the prototype repository itself.
Test section data• Length of the hydromechanical measurement section (located below level of canister holes):
– Inner: 0.265 m.– Outer: 0.3235 m.
• Spherical distance to centre of nearest heater: 47 m.
• Number of fractures:– Inner: – .– Outer: – .
(Figure 7-2).
7.2.2 KA3539GThis borehole is 30.01 m long. The hydromechanical test section is between 15.85 m and 17.60 m.
Test section data• Length of the hydromechanical measurement section (located below level of canister hole bottom):
– Inner: 0.311 m.– Outer: 0.3235 m.
• Distances:– Spherical distance to centre of nearest heater: 13.1 m.– Spherical distance to centre of the bottom of nearest heater: 9.2 m.– (Radial distance to centre line of nearest heater: 4.0 m).
• Number of fractures:– Inner: 2.– Outer: – .
(Figure 7-3).
7.2.3 KA3542G01This borehole is 30.01 m long. The hydromechanical test section is between 18.60 m and 20.30 m.
Test section data• Length of the hydromechanical measurement section (located below level of canister hole bottom):
– Inner: 0.311 m.– Outer: 0.3235 m.
• Distances:– Spherical distance to centre of nearest heater: 17.4 m.– Spherical distance to centre of the bottom of nearest heater: 15.5 m.– (Radial distance to centre line of nearest heater: 14.6 m).
• Number of fractures:– Inner: – .– Outer: 1.
(Figure 7-4).
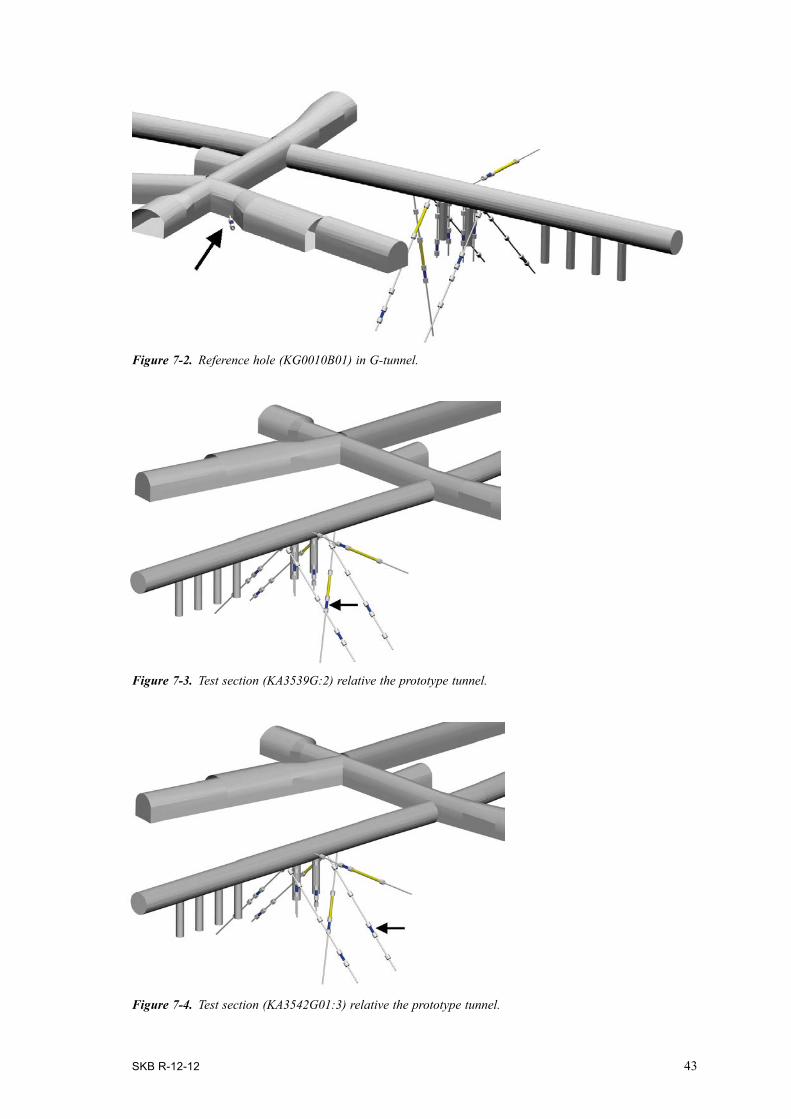
SKB R-12-12 43
Figure 7-2. Reference hole (KG0010B01) in G-tunnel.
Figure 7-3. Test section (KA3539G:2) relative the prototype tunnel.
Figure 7-4. Test section (KA3542G01:3) relative the prototype tunnel.

44 SKB R-12-12
7.2.4 KA3542G02This borehole is 30.01 m long. The hydromechanical test section is between 25.60 m and 27.20 m.
Test section data• Length of the hydromechanical measurement section (located below level of canister hole bottom):
– Inner: 0.311 m.– Outer: 0.3235 m.
• Distances:– Spherical distance to centre of nearest heater: 24.2 m.– Spherical distance to centre of the bottom of nearest heater: 22.0 m.– (Radial distance to centre line of nearest heater: 19.6 m).
• Number of fractures:– Inner: 1.– Outer: – .
(Figure 7-5).
7.2.5 KA3544G01This borehole is 12.00 m long. The hydromechanical test section is between 8.90 m and 10.65 m.
Test section data• Length of the hydromechanical measurement section (located below level of canister hole bottom):
– Inner: 0.311 m.– Outer: 0.3235 m.
• Distances:– (Spherical distance to centre of nearest heater: 5.6 m).– Spherical distance to centre of the bottom of nearest heater: 1.8 m.– Radial distance to centre line of nearest heater: 1.2 m.
• Number of fractures:– Inner: 1.– Outer: – .
(Figure 7-6).
7.2.6 KA3546G01This borehole is 12.00 m long. The hydromechanical test section is between 6.75 m and 8.30 m.
Test section data• Length of the hydromechanical measurement section (located above level of canister hole bottom):
– Inner: 0.311 m.– Outer: 0.3235 m.
• Distances:– (Spherical distance to centre of nearest heater: 3.4 m).– Spherical distance to bottom of nearest heater: 1.6 m.– Radial distance to centre line of nearest heater: 1.2 m.
• Number of fractures:– Inner: 1.– Outer: – .
(Figure 7-7).

SKB R-12-12 45
Figure 7-5. Test section (KA3542G02:2) relative the prototype tunnel.
Figure 7-6. Test section (KA3544G01:2) relative the prototype tunnel.
Figure 7-7. Test section (KA3546G01:2) relative the prototype tunnel.

46 SKB R-12-12
7.2.7 KA3548A01This borehole is 30.00 m long. The hydromechanical test section is between 8.80 m and 10.75 m.
Test section data• Length of the hydromechanical measurement section (located above level of canister hole
bottom):– Inner: 0.561 m.– Outer: 0.3235 m.
• Distances:– Spherical distance to centre of nearest heater: 14.0 m.– Spherical distance to centre of the bottom of nearest heater: 12.8 m.– Radial distance to centre line of nearest heater: 12.6 m.
• Number of fractures:– Inner: 2.– Outer: – .
(Figure 7-8).
7.2.8 KA3550G01This borehole is 12.03 m long. The hydromechanical test section is between 5.20 m and 7.30 m.
Test section data• Length of the hydromechanical measurement section (located above level of canister hole):
– Inner: 0.711 m.– Outer: 0.3235 m.
• Distances:– (Spherical distance to centre of nearest heater: 2.2 m).– (Spherical distance to centre of the bottom of nearest heater: 2.5 m).– Radial distance to centre line of nearest heater: 1.1 m.
• Number of fractures:– Inner: 6.– Outer: – .
(Figure 7-9).
7.2.9 KA3552G01This borehole is 12.00 m long. The hydromechanical test section is between 4.35 m and 6.05 m.
Test section data• Length of the hydromechanical measurement section (located above level of canister hole):
– Inner: 0.311 m.– Outer: 0.3235 m.
• Distances:– Spherical distance to centre of nearest heater: 1.5 m.– (Spherical distance to centre of the bottom of nearest heater: 3.5 m).– Radial distance to centre line of nearest heater: 1.2 m.
• Number of fractures:– Inner: – .– Outer: 2.
(Figure 7-10).

SKB R-12-12 47
Figure 7-9. Test section (KA3550G01:2) relative the prototype tunnel.
Figure 7-8. Test section (KA3548A01:3) relative the prototype tunnel.
Figure 7-10. Test section (KA3552G01:2) relative the prototype tunnel.

48 SKB R-12-12
7.2.10 KA3554G01This borehole is 30.01 m long. The hydromechanical test section is between 22.60 m and 24.15 m.
Test section data• Length of the hydromechanical measurement section (located below level of canister hole):
– Inner: 0.371 m.– Outer: 0.3235 m.
• Distances:– Spherical distance to centre of nearest heater: 21.2 m.– Spherical distance to centre of the bottom of nearest heater: 19.1 m.– (Radial distance to centre line of nearest heater: 17.3 m).
• Number of fractures:– Inner: 2.– Outer: – .
(Figure 7-11).
7.2.11 KA3554G02This borehole is 30.01 m long. The hydromechanical test section is between 10.50 m and 12.20 m.
Test section data• Length of the hydromechanical measurement section (located above level of canister hole):
– Inner: 0.311 m.– Outer: 0.3235 m.
• Distances:– Spherical distance to centre of nearest heater: 9.8 m.– Spherical distance to centre of the bottom of nearest heater: 9.1 m.– (Radial distance to centre line of nearest heater: 9.0 m).
• Number of fractures:
– Inner: – .– Outer: 1.
(Figure 7-12).
Figure 7-11. Test section (KA3554G01:2) relative the prototype tunnel.
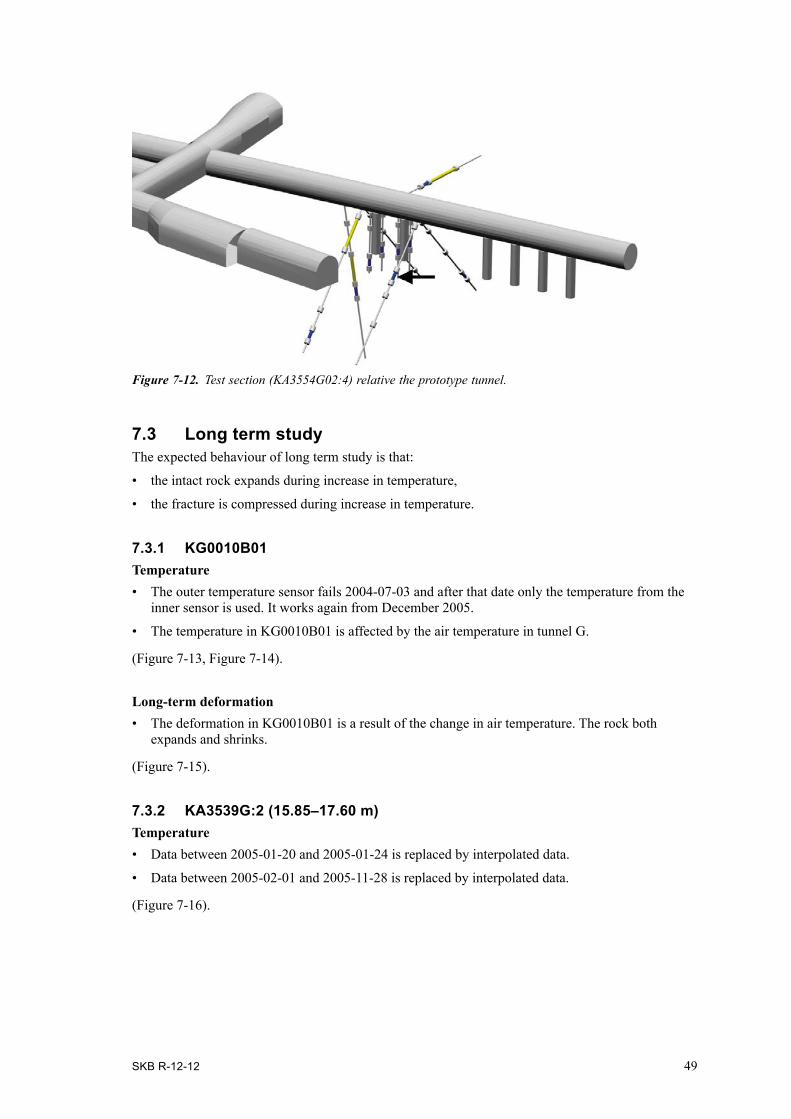
SKB R-12-12 49
Figure 7-12. Test section (KA3554G02:4) relative the prototype tunnel.
7.3 Long term studyThe expected behaviour of long term study is that:
• the intact rock expands during increase in temperature,
• the fracture is compressed during increase in temperature.
7.3.1 KG0010B01Temperature• The outer temperature sensor fails 2004-07-03 and after that date only the temperature from the
inner sensor is used. It works again from December 2005.
• The temperature in KG0010B01 is affected by the air temperature in tunnel G.
(Figure 7-13, Figure 7-14).
Long-term deformation• The deformation in KG0010B01 is a result of the change in air temperature. The rock both
expands and shrinks.
(Figure 7-15).
7.3.2 KA3539G:2 (15.85–17.60 m)Temperature• Data between 2005-01-20 and 2005-01-24 is replaced by interpolated data.
• Data between 2005-02-01 and 2005-11-28 is replaced by interpolated data.
(Figure 7-16).
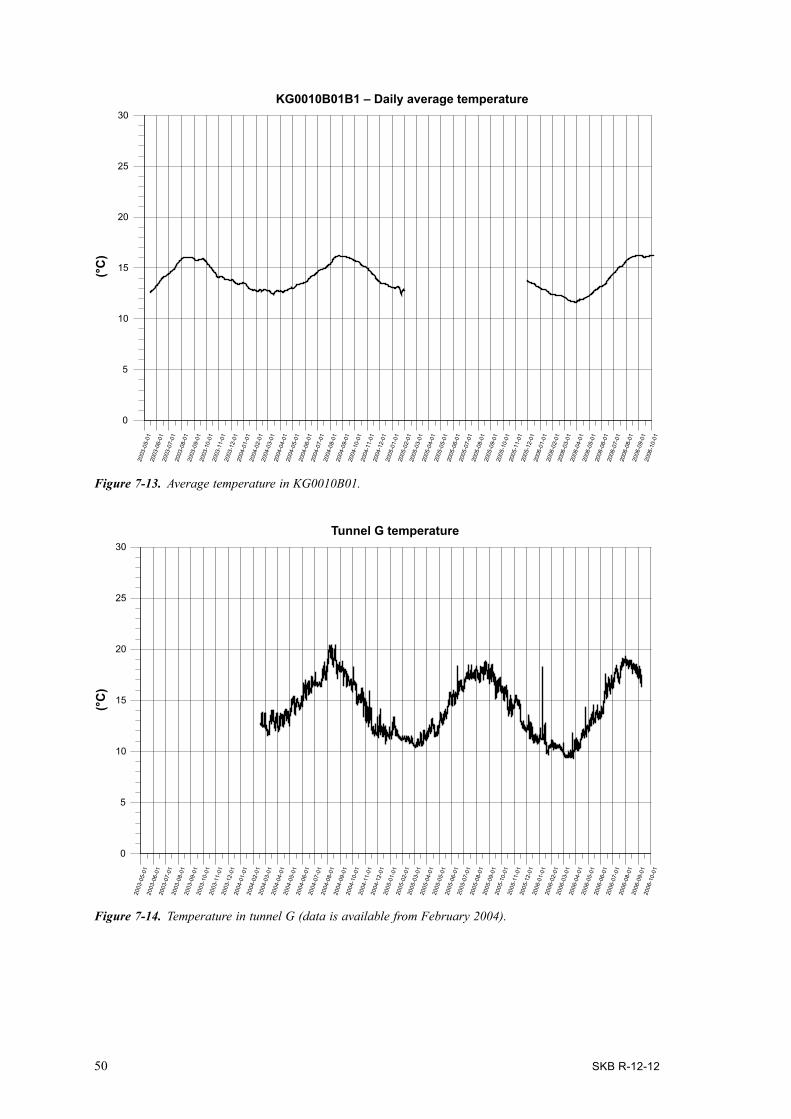
50 SKB R-12-12
Figure 7-13. Average temperature in KG0010B01.
Figure 7-14. Temperature in tunnel G (data is available from February 2004).
2003
-05-
0120
03-0
6-01
2003
-07-
0120
03-0
8-01
2003
-09-
0120
03-1
0-01
2003
-11-
0120
03-1
2-01
2004
-01-
0120
04-0
2-01
2004
-03-
0120
04-0
4-01
2004
-05-
0120
04-0
6-01
2004
-07-
0120
04-0
8-01
2004
-09-
0120
04-1
0-01
2004
-11-
0120
04-1
2-01
2005
-01-
0120
05-0
2-01
2005
-03-
0120
05-0
4-01
2005
-05-
0120
05-0
6-01
2005
-07-
0120
05-0
8-01
2005
-09-
0120
05-1
0-01
2005
-11-
0120
05-1
2-01
2006
-01-
0120
06-0
2-01
2006
-03-
0120
06-0
4-01
2006
-05-
0120
06-0
6-01
2006
-07-
0120
06-0
8-01
2006
-09-
0120
06-1
0-01
0
5
10
15
20
25
30Tunnel G temperature
(°C
)
2003
-05-
0120
03-0
6-01
2003
-07-
0120
03-0
8-01
2003
-09-
0120
03-1
0-01
2003
-11-
0120
03-1
2-01
2004
-01-
0120
04-0
2-01
2004
-03-
0120
04-0
4-01
2004
-05-
0120
04-0
6-01
2004
-07-
0120
04-0
8-01
2004
-09-
0120
04-1
0-01
2004
-11-
0120
04-1
2-01
2005
-01-
0120
05-0
2-01
2005
-03-
0120
05-0
4-01
2005
-05-
0120
05-0
6-01
2005
-07-
0120
05-0
8-01
2005
-09-
0120
05-1
0-01
2005
-11-
0120
05-1
2-01
2006
-01-
0120
06-0
2-01
2006
-03-
0120
06-0
4-01
2006
-05-
0120
06-0
6-01
2006
-07-
0120
06-0
8-01
2006
-09-
0120
06-1
0-01
0
5
10
15
20
25
30KG0010B01B1 – Daily average temperature
(°C
)

SKB R-12-12 51
Figure 7-15. Long-term deformation of the rock mass in KG0010B01.
Figure 7-16. KA3539G:2. Average temperature.
2003
-05-
0120
03-0
6-01
2003
-07-
0120
03-0
8-01
2003
-09-
0120
03-1
0-01
2003
-11-
0120
03-1
2-01
2004
-01-
0120
04-0
2-01
2004
-03-
0120
04-0
4-01
2004
-05-
0120
04-0
6-01
2004
-07-
0120
04-0
8-01
2004
-09-
0120
04-1
0-01
2004
-11-
0120
04-1
2-01
2005
-01-
0120
05-0
2-01
2005
-03-
0120
05-0
4-01
2005
-05-
0120
05-0
6-01
2005
-07-
0120
05-0
8-01
2005
-09-
0120
05-1
0-01
2005
-11-
0120
05-1
2-01
2006
-01-
0120
06-0
2-01
2006
-03-
0120
06-0
4-01
2006
-05-
0120
06-0
6-01
2006
-07-
0120
06-0
8-01
2006
-09-
0120
06-1
0-01
–0.04
–0.02
0
0.02
0.04KG0010B1 – Daily average inner section deformation
(mm
)
2003
-05-
0120
03-0
6-01
2003
-07-
0120
03-0
8-01
2003
-09-
0120
03-1
0-01
2003
-11-
0120
03-1
2-01
2004
-01-
0120
04-0
2-01
2004
-03-
0120
04-0
4-01
2004
-05-
0120
04-0
6-01
2004
-07-
0120
04-0
8-01
2004
-09-
0120
04-1
0-01
2004
-11-
0120
04-1
2-01
2005
-01-
0120
05-0
2-01
2005
-03-
0120
05-0
4-01
2005
-05-
0120
05-0
6-01
2005
-07-
0120
05-0
8-01
2005
-09-
0120
05-1
0-01
2005
-11-
0120
05-1
2-01
2006
-01-
0120
06-0
2-01
2006
-03-
0120
06-0
4-01
2006
-05-
0120
06-0
6-01
2006
-07-
0120
06-0
8-01
2006
-09-
0120
06-1
0-01
0
5
10
15
20KA3539G:2 – Daily average temperature
(°C
)
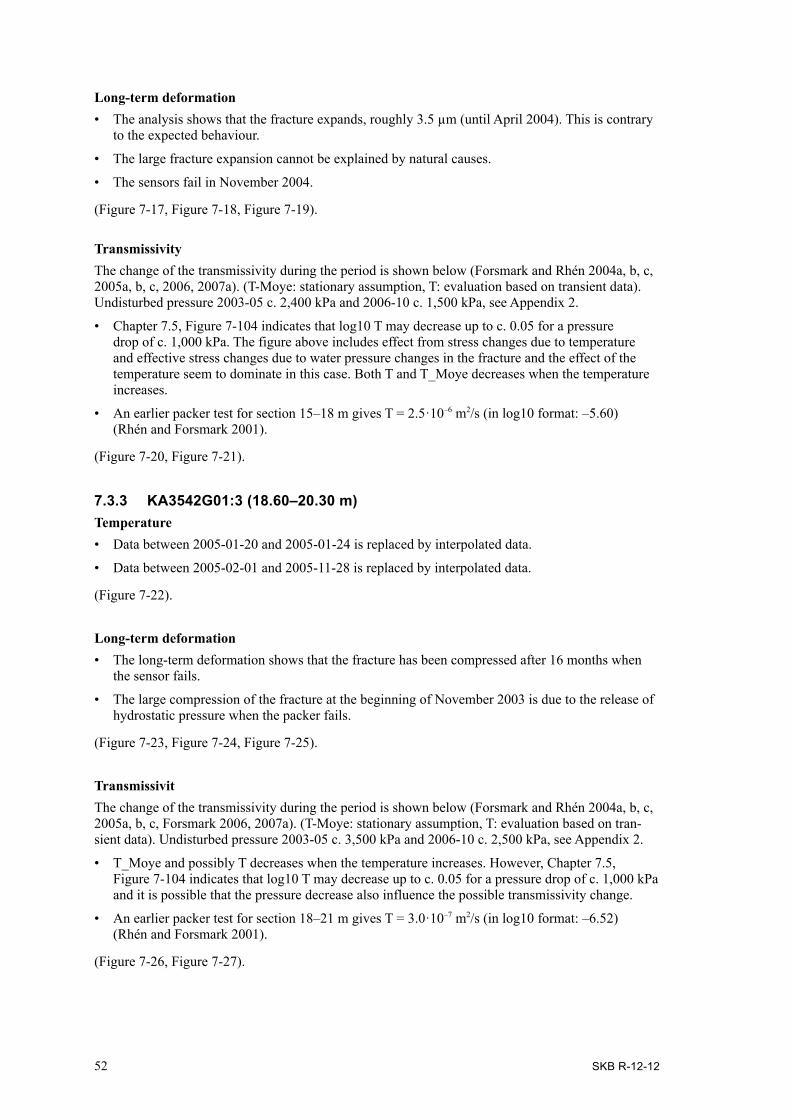
52 SKB R-12-12
Long-term deformation• The analysis shows that the fracture expands, roughly 3.5 µm (until April 2004). This is contrary
to the expected behaviour.
• The large fracture expansion cannot be explained by natural causes.
• The sensors fail in November 2004.
(Figure 7-17, Figure 7-18, Figure 7-19).
TransmissivityThe change of the transmissivity during the period is shown below (Forsmark and Rhén 2004a, b, c, 2005a, b, c, 2006, 2007a). (T-Moye: stationary assumption, T: evaluation based on transient data). Undisturbed pressure 2003-05 c. 2,400 kPa and 2006-10 c. 1,500 kPa, see Appendix 2.
• Chapter 7.5, Figure 7-104 indicates that log10 T may decrease up to c. 0.05 for a pressure drop of c. 1,000 kPa. The figure above includes effect from stress changes due to temperature and effective stress changes due to water pressure changes in the fracture and the effect of the temperature seem to dominate in this case. Both T and T_Moye decreases when the temperature increases.
• An earlier packer test for section 15–18 m gives T = 2.5·10–6 m2/s (in log10 format: –5.60) (Rhén and Forsmark 2001).
(Figure 7-20, Figure 7-21).
7.3.3 KA3542G01:3 (18.60–20.30 m)Temperature• Data between 2005-01-20 and 2005-01-24 is replaced by interpolated data.
• Data between 2005-02-01 and 2005-11-28 is replaced by interpolated data.
(Figure 7-22).
Long-term deformation• The long-term deformation shows that the fracture has been compressed after 16 months when
the sensor fails.
• The large compression of the fracture at the beginning of November 2003 is due to the release of hydrostatic pressure when the packer fails.
(Figure 7-23, Figure 7-24, Figure 7-25).
TransmissivitThe change of the transmissivity during the period is shown below (Forsmark and Rhén 2004a, b, c, 2005a, b, c, Forsmark 2006, 2007a). (T-Moye: stationary assumption, T: evaluation based on tran-sient data). Undisturbed pressure 2003-05 c. 3,500 kPa and 2006-10 c. 2,500 kPa, see Appendix 2.
• T_Moye and possibly T decreases when the temperature increases. However, Chapter 7.5, Figure 7-104 indicates that log10 T may decrease up to c. 0.05 for a pressure drop of c. 1,000 kPa and it is possible that the pressure decrease also influence the possible transmissivity change.
• An earlier packer test for section 18–21 m gives T = 3.0·10–7 m2/s (in log10 format: –6.52) (Rhén and Forsmark 2001).
(Figure 7-26, Figure 7-27).
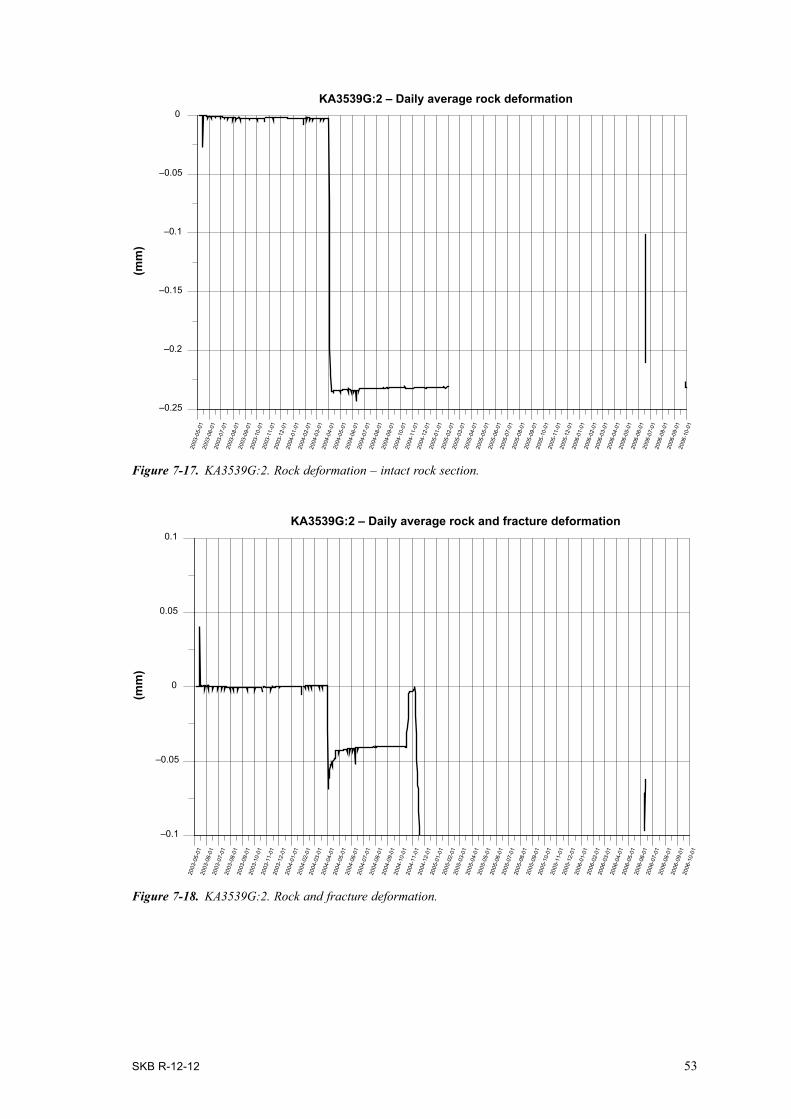
SKB R-12-12 53
–0.1
–0.05
0
0.05
0.1KA3539G:2 – Daily average rock and fracture deformation
(mm
)
2003
-05-
0120
03-0
6-01
2003
-07-
0120
03-0
8-01
2003
-09-
0120
03-1
0-01
2003
-11-
0120
03-1
2-01
2004
-01-
0120
04-0
2-01
2004
-03-
0120
04-0
4-01
2004
-05-
0120
04-0
6-01
2004
-07-
0120
04-0
8-01
2004
-09-
0120
04-1
0-01
2004
-11-
0120
04-1
2-01
2005
-01-
0120
05-0
2-01
2005
-03-
0120
05-0
4-01
2005
-05-
0120
05-0
6-01
2005
-07-
0120
05-0
8-01
2005
-09-
0120
05-1
0-01
2005
-11-
0120
05-1
2-01
2006
-01-
0120
06-0
2-01
2006
-03-
0120
06-0
4-01
2006
-05-
0120
06-0
6-01
2006
-07-
0120
06-0
8-01
2006
-09-
0120
06-1
0-01
Figure 7-17. KA3539G:2. Rock deformation – intact rock section.
Figure 7-18. KA3539G:2. Rock and fracture deformation.
–0.25
–0.2
–0.15
–0.1
–0.05
0KA3539G:2 – Daily average rock deformation
(mm
)
2003
-05-
0120
03-0
6-01
2003
-07-
0120
03-0
8-01
2003
-09-
0120
03-1
0-01
2003
-11-
0120
03-1
2-01
2004
-01-
0120
04-0
2-01
2004
-03-
0120
04-0
4-01
2004
-05-
0120
04-0
6-01
2004
-07-
0120
04-0
8-01
2004
-09-
0120
04-1
0-01
2004
-11-
0120
04-1
2-01
2005
-01-
0120
05-0
2-01
2005
-03-
0120
05-0
4-01
2005
-05-
0120
05-0
6-01
2005
-07-
0120
05-0
8-01
2005
-09-
0120
05-1
0-01
2005
-11-
0120
05-1
2-01
2006
-01-
0120
06-0
2-01
2006
-03-
0120
06-0
4-01
2006
-05-
0120
06-0
6-01
2006
-07-
0120
06-0
8-01
2006
-09-
0120
06-1
0-01
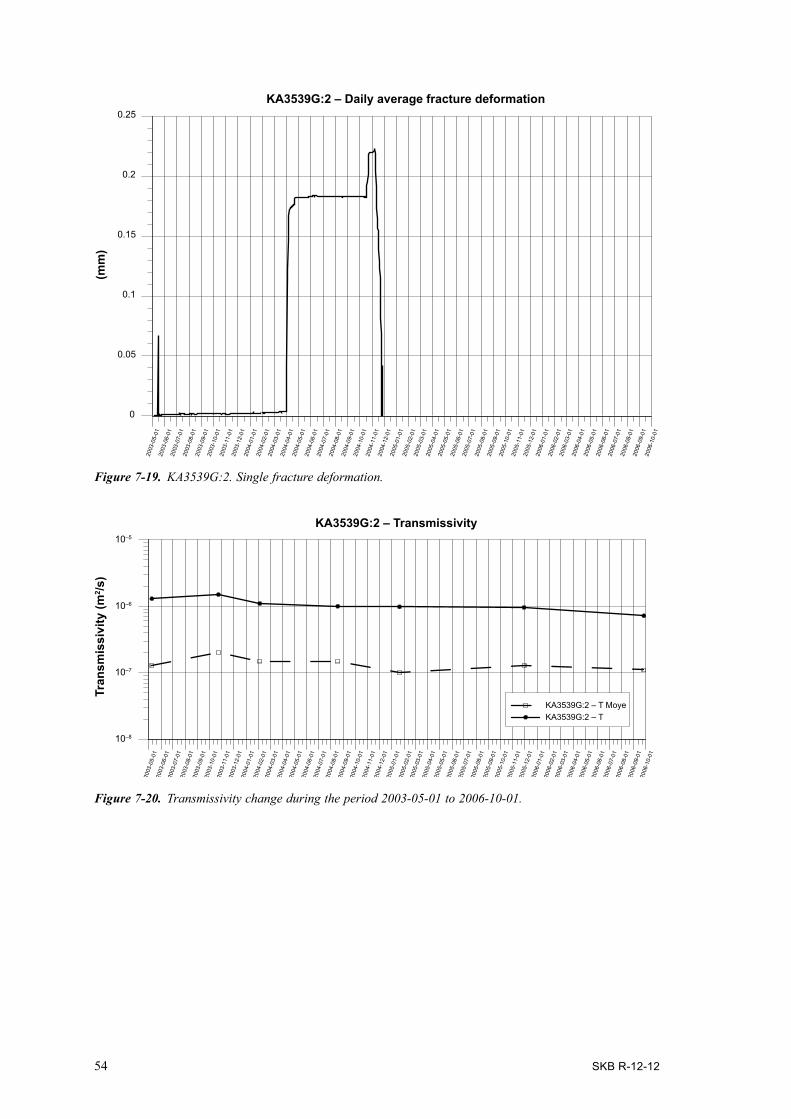
54 SKB R-12-12
Figure 7-20. Transmissivity change during the period 2003-05-01 to 2006-10-01.
10–8
10–7
10–6
10–5
Tran
smis
sivi
ty (m
2 /s)
KA3539G:2 – Transmissivity
KA3539G:2 – T MoyeKA3539G:2 – T
2003
-05-
0120
03-0
6-01
2003
-07-
0120
03-0
8-01
2003
-09-
0120
03-1
0-01
2003
-11-
0120
03-1
2-01
2004
-01-
0120
04-0
2-01
2004
-03-
0120
04-0
4-01
2004
-05-
0120
04-0
6-01
2004
-07-
0120
04-0
8-01
2004
-09-
0120
04-1
0-01
2004
-11-
0120
04-1
2-01
2005
-01-
0120
05-0
2-01
2005
-03-
0120
05-0
4-01
2005
-05-
0120
05-0
6-01
2005
-07-
0120
05-0
8-01
2005
-09-
0120
05-1
0-01
2005
-11-
0120
05-1
2-01
2006
-01-
0120
06-0
2-01
2006
-03-
0120
06-0
4-01
2006
-05-
0120
06-0
6-01
2006
-07-
0120
06-0
8-01
2006
-09-
0120
06-1
0-01
0
0.05
0.1
0.15
0.2
0.25KA3539G:2 – Daily average fracture deformation
(mm
)
2003
-05-
0120
03-0
6-01
2003
-07-
0120
03-0
8-01
2003
-09-
0120
03-1
0-01
2003
-11-
0120
03-1
2-01
2004
-01-
0120
04-0
2-01
2004
-03-
0120
04-0
4-01
2004
-05-
0120
04-0
6-01
2004
-07-
0120
04-0
8-01
2004
-09-
0120
04-1
0-01
2004
-11-
0120
04-1
2-01
2005
-01-
0120
05-0
2-01
2005
-03-
0120
05-0
4-01
2005
-05-
0120
05-0
6-01
2005
-07-
0120
05-0
8-01
2005
-09-
0120
05-1
0-01
2005
-11-
0120
05-1
2-01
2006
-01-
0120
06-0
2-01
2006
-03-
0120
06-0
4-01
2006
-05-
0120
06-0
6-01
2006
-07-
0120
06-0
8-01
2006
-09-
0120
06-1
0-01
Figure 7-19. KA3539G:2. Single fracture deformation.

SKB R-12-12 55
Figure 7-21. Transmissivity versus temperature in KA3539G:2 (15.85–17.60 m).
Figure 7-22. KA3542G01:3. Average temperature.
12 13 14 15 16 17 18–8
–7
–6
–5KA3539G:2 – Transmissivity
Temperature [°C]
Log1
0 –
Tran
smis
sivi
ty (m
2 /s)
Fit Results – T LinearEquation Y = –0.07667475023 * X –4.798767644
Fit Results – T MoyeLinearEquation Y = –0.05210363476 * X –6.067680311
Packer test (15–18 m)Linear Fit – T vs TempKA3539G:2 – TAQTSLinear Fit – T Moye vs TempKA3539G:2 – T Moye
0
5
10
15
20
KA3542G01:3 – Daily average temperature
[°C
]
2003
-05-
0120
03-0
6-01
2003
-07-
0120
03-0
8-01
2003
-09-
0120
03-1
0-01
2003
-11-
0120
03-1
2-01
2004
-01-
0120
04-0
2-01
2004
-03-
0120
04-0
4-01
2004
-05-
0120
04-0
6-01
2004
-07-
0120
04-0
8-01
2004
-09-
0120
04-1
0-01
2004
-11-
0120
04-1
2-01
2005
-01-
0120
05-0
2-01
2005
-03-
0120
05-0
4-01
2005
-05-
0120
05-0
6-01
2005
-07-
0120
05-0
8-01
2005
-09-
0120
05-1
0-01
2005
-11-
0120
05-1
2-01
2006
-01-
0120
06-0
2-01
2006
-03-
0120
06-0
4-01
2006
-05-
0120
06-0
6-01
2006
-07-
0120
06-0
8-01
2006
-09-
0120
06-1
0-01

56 SKB R-12-12
–0.02
–0.01
0
0.01
0.02KA3542G01:3 – Daily average rock and fracture deformation
(mm
)
2003
-05-
0120
03-0
6-01
2003
-07-
0120
03-0
8-01
2003
-09-
0120
03-1
0-01
2003
-11-
0120
03-1
2-01
2004
-01-
0120
04-0
2-01
2004
-03-
0120
04-0
4-01
2004
-05-
0120
04-0
6-01
2004
-07-
0120
04-0
8-01
2004
-09-
0120
04-1
0-01
2004
-11-
0120
04-1
2-01
2005
-01-
0120
05-0
2-01
2005
-03-
0120
05-0
4-01
2005
-05-
0120
05-0
6-01
2005
-07-
0120
05-0
8-01
2005
-09-
0120
05-1
0-01
2005
-11-
0120
05-1
2-01
2006
-01-
0120
06-0
2-01
2006
-03-
0120
06-0
4-01
2006
-05-
0120
06-0
6-01
2006
-07-
0120
06-0
8-01
2006
-09-
0120
06-1
0-01
Figure 7-24. KA3542G01:3. Rock and fracture deformation.
Figure 7-23. KA3542G01:3. Rock deformation – intact rock section.
–0.01
–0.008
–0.006
–0.004
–0.002
0KA3542G01:3 – Daily average rock deformation
(mm
)
2003
-05-
0120
03-0
6-01
2003
-07-
0120
03-0
8-01
2003
-09-
0120
03-1
0-01
2003
-11-
0120
03-1
2-01
2004
-01-
0120
04-0
2-01
2004
-03-
0120
04-0
4-01
2004
-05-
0120
04-0
6-01
2004
-07-
0120
04-0
8-01
2004
-09-
0120
04-1
0-01
2004
-11-
0120
04-1
2-01
2005
-01-
0120
05-0
2-01
2005
-03-
0120
05-0
4-01
2005
-05-
0120
05-0
6-01
2005
-07-
0120
05-0
8-01
2005
-09-
0120
05-1
0-01
2005
-11-
0120
05-1
2-01
2006
-01-
0120
06-0
2-01
2006
-03-
0120
06-0
4-01
2006
-05-
0120
06-0
6-01
2006
-07-
0120
06-0
8-01
2006
-09-
0120
06-1
0-01

SKB R-12-12 57
–0.02
–0.016
–0.012
–0.008
–0.004
0KA3542G01:3 – Daily average fracture deformation
(mm
)
2003
-05-
0120
03-0
6-01
2003
-07-
0120
03-0
8-01
2003
-09-
0120
03-1
0-01
2003
-11-
0120
03-1
2-01
2004
-01-
0120
04-0
2-01
2004
-03-
0120
04-0
4-01
2004
-05-
0120
04-0
6-01
2004
-07-
0120
04-0
8-01
2004
-09-
0120
04-1
0-01
2004
-11-
0120
04-1
2-01
2005
-01-
0120
05-0
2-01
2005
-03-
0120
05-0
4-01
2005
-05-
0120
05-0
6-01
2005
-07-
0120
05-0
8-01
2005
-09-
0120
05-1
0-01
2005
-11-
0120
05-1
2-01
2006
-01-
0120
06-0
2-01
2006
-03-
0120
06-0
4-01
2006
-05-
0120
06-0
6-01
2006
-07-
0120
06-0
8-01
2006
-09-
0120
06-1
0-01
Figure 7-25. KA3542G01:3. Single fracture deformation.
Figure 7-26. Transmissivity change during the period 2003-05-01 to 2006-10-01.
10–8
10–7
10–6
10–5
Tran
smis
sivi
ty (m
2 /s)
KA3542G01:3 – Transmissivity
KA3542G01:3 –TKA3542G01:3 – T Moye
2003
-05-
0120
03-0
6-01
2003
-07-
0120
03-0
8-01
2003
-09-
0120
03-1
0-01
2003
-11-
0120
03-1
2-01
2004
-01-
0120
04-0
2-01
2004
-03-
0120
04-0
4-01
2004
-05-
0120
04-0
6-01
2004
-07-
0120
04-0
8-01
2004
-09-
0120
04-1
0-01
2004
-11-
0120
04-1
2-01
2005
-01-
0120
05-0
2-01
2005
-03-
0120
05-0
4-01
2005
-05-
0120
05-0
6-01
2005
-07-
0120
05-0
8-01
2005
-09-
0120
05-1
0-01
2005
-11-
0120
05-1
2-01
2006
-01-
0120
06-0
2-01
2006
-03-
0120
06-0
4-01
2006
-05-
0120
06-0
6-01
2006
-07-
0120
06-0
8-01
2006
-09-
0120
06-1
0-01
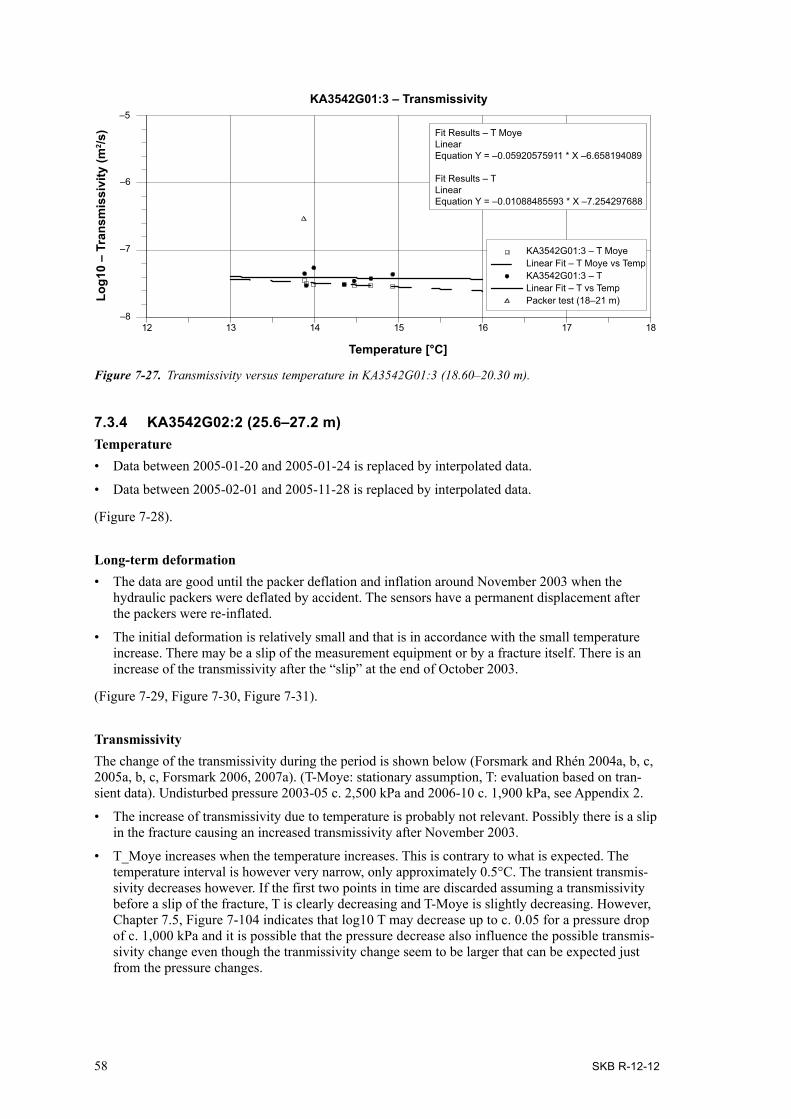
58 SKB R-12-12
7.3.4 KA3542G02:2 (25.6–27.2 m)Temperature• Data between 2005-01-20 and 2005-01-24 is replaced by interpolated data.
• Data between 2005-02-01 and 2005-11-28 is replaced by interpolated data.
(Figure 7-28).
Long-term deformation• The data are good until the packer deflation and inflation around November 2003 when the
hydraulic packers were deflated by accident. The sensors have a permanent displacement after the packers were re-inflated.
• The initial deformation is relatively small and that is in accordance with the small temperature increase. There may be a slip of the measurement equipment or by a fracture itself. There is an increase of the transmissivity after the “slip” at the end of October 2003.
(Figure 7-29, Figure 7-30, Figure 7-31).
TransmissivityThe change of the transmissivity during the period is shown below (Forsmark and Rhén 2004a, b, c, 2005a, b, c, Forsmark 2006, 2007a). (T-Moye: stationary assumption, T: evaluation based on tran-sient data). Undisturbed pressure 2003-05 c. 2,500 kPa and 2006-10 c. 1,900 kPa, see Appendix 2.
• The increase of transmissivity due to temperature is probably not relevant. Possibly there is a slip in the fracture causing an increased transmissivity after November 2003.
• T_Moye increases when the temperature increases. This is contrary to what is expected. The temperature interval is however very narrow, only approximately 0.5°C. The transient transmis-sivity decreases however. If the first two points in time are discarded assuming a transmissivity before a slip of the fracture, T is clearly decreasing and T-Moye is slightly decreasing. However, Chapter 7.5, Figure 7-104 indicates that log10 T may decrease up to c. 0.05 for a pressure drop of c. 1,000 kPa and it is possible that the pressure decrease also influence the possible transmis-sivity change even though the tranmissivity change seem to be larger that can be expected just from the pressure changes.
Figure 7-27. Transmissivity versus temperature in KA3542G01:3 (18.60–20.30 m).
12 13 14 15 16 17 18–8
–7
–6
–5KA3542G01:3 – Transmissivity
Fit Results – T MoyeLinearEquation Y = –0.05920575911 * X –6.658194089
Fit Results – TLinearEquation Y = –0.01088485593 * X –7.254297688
Temperature [°C]
Log1
0 –
Tran
smis
sivi
ty (m
2 /s)
Packer test (18–21 m)Linear Fit – T vs TempKA3542G01:3 – TLinear Fit – T Moye vs TempKA3542G01:3 – T Moye

SKB R-12-12 59
Figure 7-28. KA3542G02:2. Average temperature.
0
5
10
15
20
KA3542G02:2 – Daily average temperature
[°C
]
2003
-05-
0120
03-0
6-01
2003
-07-
0120
03-0
8-01
2003
-09-
0120
03-1
0-01
2003
-11-
0120
03-1
2-01
2004
-01-
0120
04-0
2-01
2004
-03-
0120
04-0
4-01
2004
-05-
0120
04-0
6-01
2004
-07-
0120
04-0
8-01
2004
-09-
0120
04-1
0-01
2004
-11-
0120
04-1
2-01
2005
-01-
0120
05-0
2-01
2005
-03-
0120
05-0
4-01
2005
-05-
0120
05-0
6-01
2005
-07-
0120
05-0
8-01
2005
-09-
0120
05-1
0-01
2005
-11-
0120
05-1
2-01
2006
-01-
0120
06-0
2-01
2006
-03-
0120
06-0
4-01
2006
-05-
0120
06-0
6-01
2006
-07-
0120
06-0
8-01
2006
-09-
0120
06-1
0-01
• The “sudden” change in transmissivity between second and third test campaigns may be due to a fracture slip, see Figure 7-31.
• An earlier packer test for section 24–27 m gives T = 9.4·10–9 m2/s (in log10 format: –8.03) (Rhén and Forsmark 2001).
(Figure 7-32, Figure 7-33).
7.3.5 KA3544G01:2 (8.90–12.65 m)Temperature• Data between 2005-01-20 and 2005-01-24 is replaced by interpolated data.
• Data between 2005-02-01 and 2005-11-28 is replaced by data calculated as the temperature data in TR6014 (Ghoudarzi and Johannesson 2006) (which is a temperature sensor in a hole drilled from inside the deposition hole DA3545G01 located 1.9 m from the HM section in KA3544G01) minus 3.7 degrees which was the temperature difference 2005-02-01.
(Figure 7-34).
Long-term deformation• The data is not good enough to evaluate due to deflated hydraulic packers in the beginning of
November 2003, which have not been possible to re-inflate since then.
• Until November 2003 the rock is expanding. The magnitude however is rather large.
• The sensor failed in mid-August 2003.
(Figure 7-35, Figure 7-36).
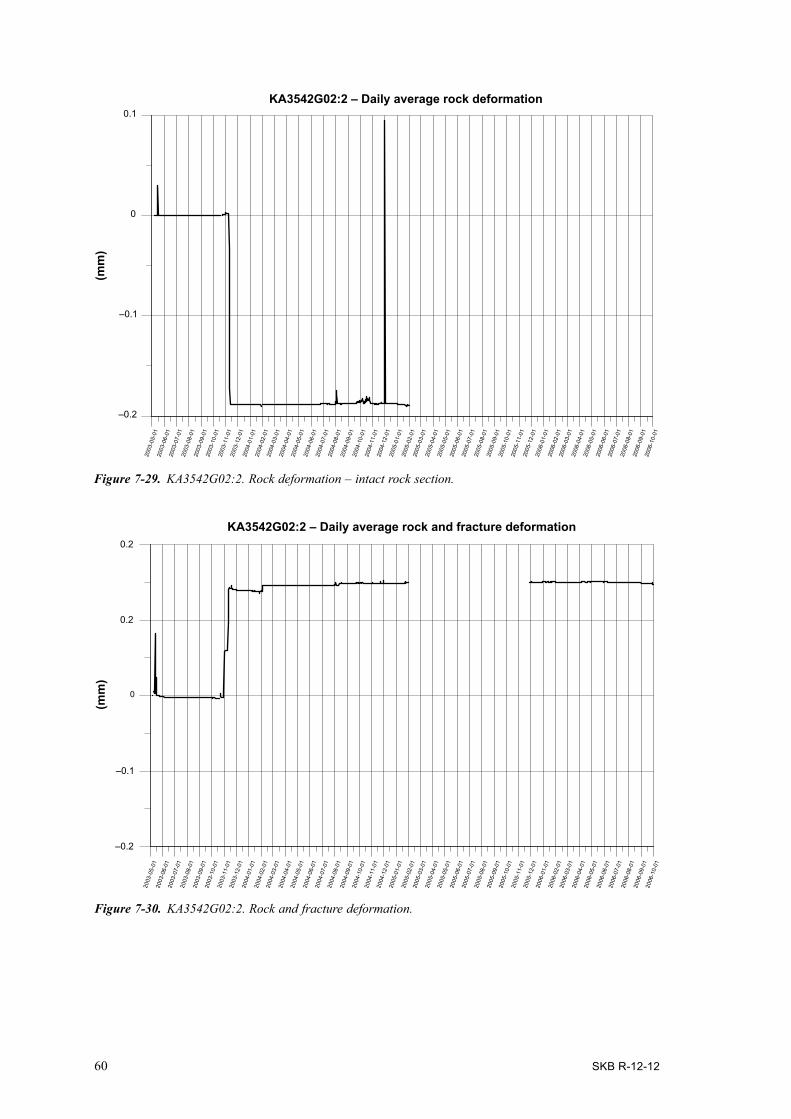
60 SKB R-12-12
–0.2
–0.1
0
0.2
0.2
KA3542G02:2 – Daily average rock and fracture deformation
(mm
)
2003
-05-
0120
03-0
6-01
2003
-07-
0120
03-0
8-01
2003
-09-
0120
03-1
0-01
2003
-11-
0120
03-1
2-01
2004
-01-
0120
04-0
2-01
2004
-03-
0120
04-0
4-01
2004
-05-
0120
04-0
6-01
2004
-07-
0120
04-0
8-01
2004
-09-
0120
04-1
0-01
2004
-11-
0120
04-1
2-01
2005
-01-
0120
05-0
2-01
2005
-03-
0120
05-0
4-01
2005
-05-
0120
05-0
6-01
2005
-07-
0120
05-0
8-01
2005
-09-
0120
05-1
0-01
2005
-11-
0120
05-1
2-01
2006
-01-
0120
06-0
2-01
2006
-03-
0120
06-0
4-01
2006
-05-
0120
06-0
6-01
2006
-07-
0120
06-0
8-01
2006
-09-
0120
06-1
0-01
Figure 7-30. KA3542G02:2. Rock and fracture deformation.
Figure 7-29. KA3542G02:2. Rock deformation – intact rock section.
–0.2
–0.1
0
0.1KA3542G02:2 – Daily average rock deformation
(mm
)
2003
-05-
0120
03-0
6-01
2003
-07-
0120
03-0
8-01
2003
-09-
0120
03-1
0-01
2003
-11-
0120
03-1
2-01
2004
-01-
0120
04-0
2-01
2004
-03-
0120
04-0
4-01
2004
-05-
0120
04-0
6-01
2004
-07-
0120
04-0
8-01
2004
-09-
0120
04-1
0-01
2004
-11-
0120
04-1
2-01
2005
-01-
0120
05-0
2-01
2005
-03-
0120
05-0
4-01
2005
-05-
0120
05-0
6-01
2005
-07-
0120
05-0
8-01
2005
-09-
0120
05-1
0-01
2005
-11-
0120
05-1
2-01
2006
-01-
0120
06-0
2-01
2006
-03-
0120
06-0
4-01
2006
-05-
0120
06-0
6-01
2006
-07-
0120
06-0
8-01
2006
-09-
0120
06-1
0-01

SKB R-12-12 61
–0.1
0
0.1
0.2
0.3
0.4KA3542G02:2 – Daily average fracture deformation
(mm
)
2003
-05-
0120
03-0
6-01
2003
-07-
0120
03-0
8-01
2003
-09-
0120
03-1
0-01
2003
-11-
0120
03-1
2-01
2004
-01-
0120
04-0
2-01
2004
-03-
0120
04-0
4-01
2004
-05-
0120
04-0
6-01
2004
-07-
0120
04-0
8-01
2004
-09-
0120
04-1
0-01
2004
-11-
0120
04-1
2-01
2005
-01-
0120
05-0
2-01
2005
-03-
0120
05-0
4-01
2005
-05-
0120
05-0
6-01
2005
-07-
0120
05-0
8-01
2005
-09-
0120
05-1
0-01
2005
-11-
0120
05-1
2-01
2006
-01-
0120
06-0
2-01
2006
-03-
0120
06-0
4-01
2006
-05-
0120
06-0
6-01
2006
-07-
0120
06-0
8-01
2006
-09-
0120
06-1
0-01
10–10
10–9
10–8
10–7
Tran
smis
sivi
ty (m
2 /s)
KA3542G02:2 – Transmissivity
KA3542G02:2 – TKA3542G02:2 – T Moye
2003
-05-
0120
03-0
6-01
2003
-07-
0120
03-0
8-01
2003
-09-
0120
03-1
0-01
2003
-11-
0120
03-1
2-01
2004
-01-
0120
04-0
2-01
2004
-03-
0120
04-0
4-01
2004
-05-
0120
04-0
6-01
2004
-07-
0120
04-0
8-01
2004
-09-
0120
04-1
0-01
2004
-11-
0120
04-1
2-01
2005
-01-
0120
05-0
2-01
2005
-03-
0120
05-0
4-01
2005
-05-
0120
05-0
6-01
2005
-07-
0120
05-0
8-01
2005
-09-
0120
05-1
0-01
2005
-11-
0120
05-1
2-01
2006
-01-
0120
06-0
2-01
2006
-03-
0120
06-0
4-01
2006
-05-
0120
06-0
6-01
2006
-07-
0120
06-0
8-01
2006
-09-
0120
06-1
0-01
Figure 7-31. KA3542G02:2. Single fracture deformation.
Figure 7-32. Transmissivity change during the period 2003-05-01 to 2006-10-01.
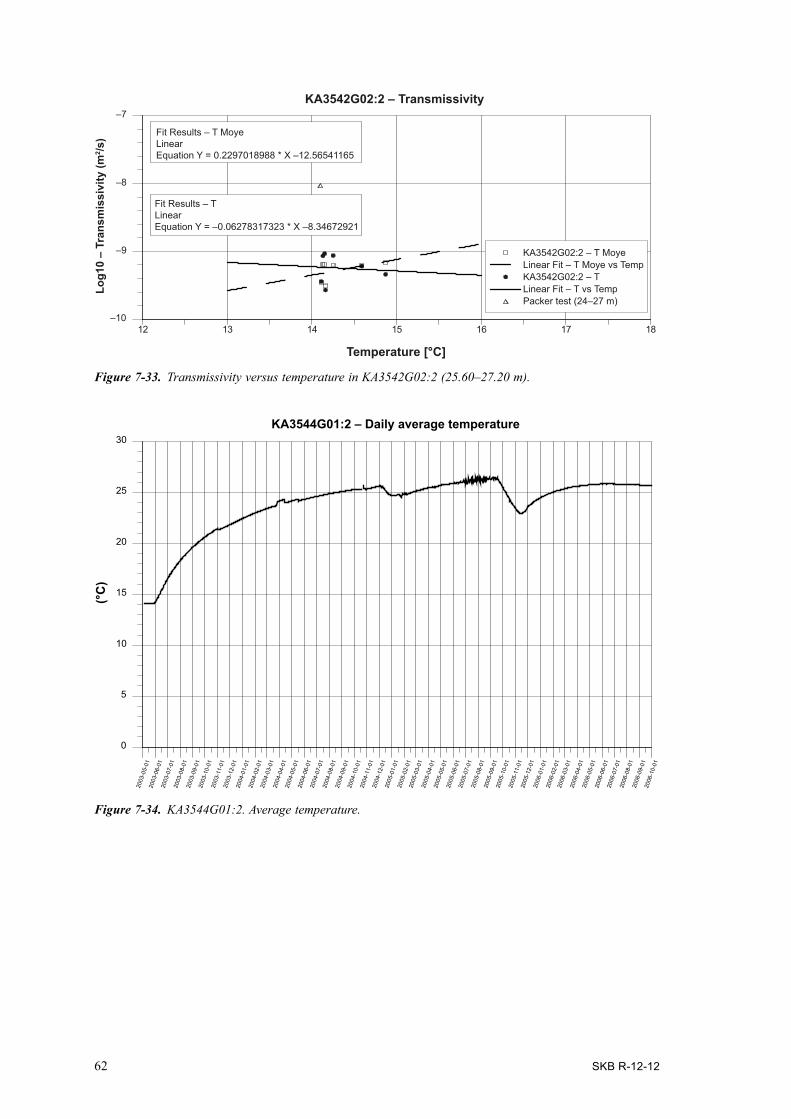
62 SKB R-12-12
0
5
10
15
20
25
30KA3544G01:2 – Daily average temperature
(°C
)
2003
-05-
0120
03-0
6-01
2003
-07-
0120
03-0
8-01
2003
-09-
0120
03-1
0-01
2003
-11-
0120
03-1
2-01
2004
-01-
0120
04-0
2-01
2004
-03-
0120
04-0
4-01
2004
-05-
0120
04-0
6-01
2004
-07-
0120
04-0
8-01
2004
-09-
0120
04-1
0-01
2004
-11-
0120
04-1
2-01
2005
-01-
0120
05-0
2-01
2005
-03-
0120
05-0
4-01
2005
-05-
0120
05-0
6-01
2005
-07-
0120
05-0
8-01
2005
-09-
0120
05-1
0-01
2005
-11-
0120
05-1
2-01
2006
-01-
0120
06-0
2-01
2006
-03-
0120
06-0
4-01
2006
-05-
0120
06-0
6-01
2006
-07-
0120
06-0
8-01
2006
-09-
0120
06-1
0-01
Figure 7-34. KA3544G01:2. Average temperature.
12 13 14 15 16 17 18–10
–9
–8
–7Lo
g10
– Tr
ansm
issi
vity
(m2 /s
)
Temperature [°C]
Fit Results – T MoyeLinearEquation Y = 0.2297018988 * X –12.56541165
Fit Results – TLinearEquation Y = –0.06278317323 * X –8.34672921
KA3542G02:2 – Transmissivity
Packer test (24–27 m)Linear Fit – T vs TempKA3542G02:2 – TLinear Fit – T Moye vs TempKA3542G02:2 – T Moye
Figure 7-33. Transmissivity versus temperature in KA3542G02:2 (25.60–27.20 m).

SKB R-12-12 63
Figure 7-35. KA3544G01:2. Rock deformation – intact rock section.
Figure 7-36. KA3544G01:2. Rock and fracture deformation.
–1
0
1
2
3KA3544G01:2 – Daily average rock deformation
(mm
)
2003
-05-
0120
03-0
6-01
2003
-07-
0120
03-0
8-01
2003
-09-
0120
03-1
0-01
2003
-11-
0120
03-1
2-01
2004
-01-
0120
04-0
2-01
2004
-03-
0120
04-0
4-01
2004
-05-
0120
04-0
6-01
2004
-07-
0120
04-0
8-01
2004
-09-
0120
04-1
0-01
2004
-11-
0120
04-1
2-01
2005
-01-
0120
05-0
2-01
2005
-03-
0120
05-0
4-01
2005
-05-
0120
05-0
6-01
2005
-07-
0120
05-0
8-01
2005
-09-
0120
05-1
0-01
2005
-11-
0120
05-1
2-01
2006
-01-
0120
06-0
2-01
2006
-03-
0120
06-0
4-01
2006
-05-
0120
06-0
6-01
2006
-07-
0120
06-0
8-01
2006
-09-
0120
06-1
0-01
–0.1
0
0.1
0.2
0.3KA3544G01:2 – Daily average rock and fracture deformation
(mm
)
2003
-05-
0120
03-0
6-01
2003
-07-
0120
03-0
8-01
2003
-09-
0120
03-1
0-01
2003
-11-
0120
03-1
2-01
2004
-01-
0120
04-0
2-01
2004
-03-
0120
04-0
4-01
2004
-05-
0120
04-0
6-01
2004
-07-
0120
04-0
8-01
2004
-09-
0120
04-1
0-01
2004
-11-
0120
04-1
2-01
2005
-01-
0120
05-0
2-01
2005
-03-
0120
05-0
4-01
2005
-05-
0120
05-0
6-01
2005
-07-
0120
05-0
8-01
2005
-09-
0120
05-1
0-01
2005
-11-
0120
05-1
2-01
2006
-01-
0120
06-0
2-01
2006
-03-
0120
06-0
4-01
2006
-05-
0120
06-0
6-01
2006
-07-
0120
06-0
8-01
2006
-09-
0120
06-1
0-01
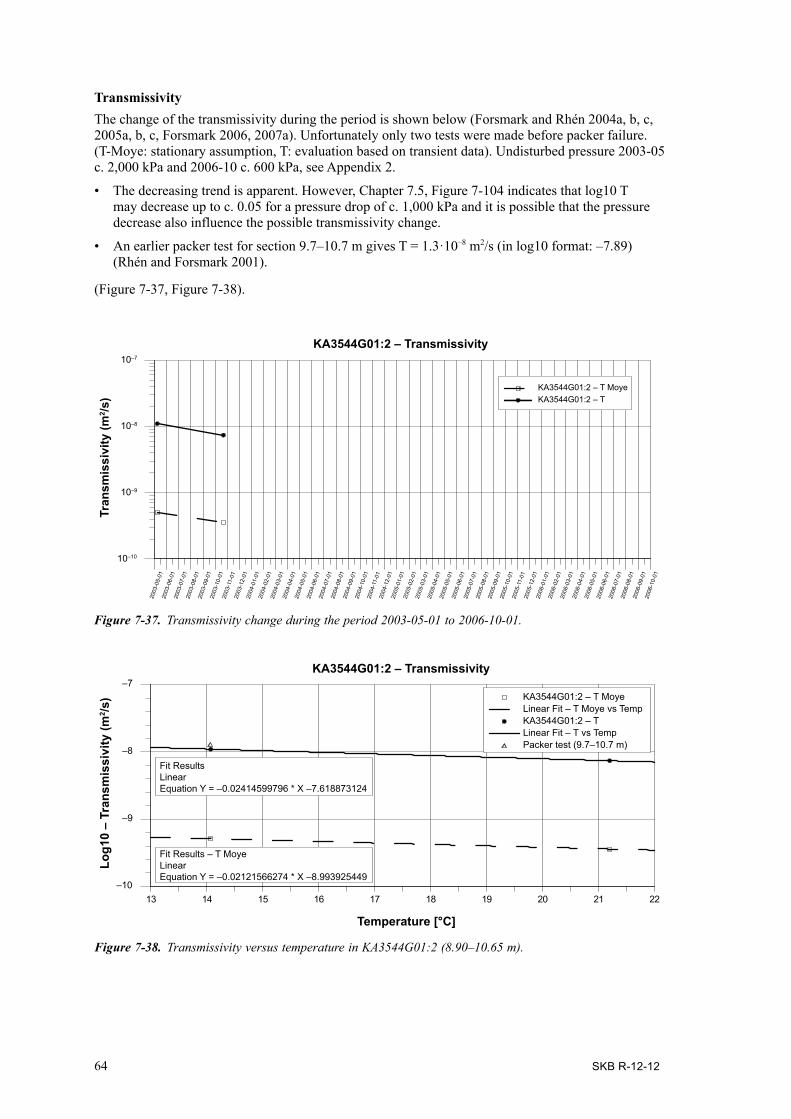
64 SKB R-12-12
Figure 7-37. Transmissivity change during the period 2003-05-01 to 2006-10-01.
Figure 7-38. Transmissivity versus temperature in KA3544G01:2 (8.90–10.65 m).
10–10
10–9
10–8
10–7
KA3544G01:2 – Transmissivity
Tran
smis
sivi
ty (m
2 /s) KA3544G01:2 – T
KA3544G01:2 – T Moye
2003
-05-
0120
03-0
6-01
2003
-07-
0120
03-0
8-01
2003
-09-
0120
03-1
0-01
2003
-11-
0120
03-1
2-01
2004
-01-
0120
04-0
2-01
2004
-03-
0120
04-0
4-01
2004
-05-
0120
04-0
6-01
2004
-07-
0120
04-0
8-01
2004
-09-
0120
04-1
0-01
2004
-11-
0120
04-1
2-01
2005
-01-
0120
05-0
2-01
2005
-03-
0120
05-0
4-01
2005
-05-
0120
05-0
6-01
2005
-07-
0120
05-0
8-01
2005
-09-
0120
05-1
0-01
2005
-11-
0120
05-1
2-01
2006
-01-
0120
06-0
2-01
2006
-03-
0120
06-0
4-01
2006
-05-
0120
06-0
6-01
2006
-07-
0120
06-0
8-01
2006
-09-
0120
06-1
0-01
13 14 15 16 17 18 19 20 21 22–10
–9
–8
–7
KA3544G01:2 – Transmissivity
Log1
0 –
Tran
smis
sivi
ty (m
2 /s)
Fit Results – T MoyeLinearEquation Y = –0.02121566274 * X –8.993925449
Fit ResultsLinearEquation Y = –0.02414599796 * X –7.618873124
Temperature [°C]
Packer test (9.7–10.7 m)Linear Fit – T vs TempKA3544G01:2 – TLinear Fit – T Moye vs TempKA3544G01:2 – T Moye
TransmissivityThe change of the transmissivity during the period is shown below (Forsmark and Rhén 2004a, b, c, 2005a, b, c, Forsmark 2006, 2007a). Unfortunately only two tests were made before packer failure. (T-Moye: stationary assumption, T: evaluation based on transient data). Undisturbed pressure 2003-05 c. 2,000 kPa and 2006-10 c. 600 kPa, see Appendix 2.
• The decreasing trend is apparent. However, Chapter 7.5, Figure 7-104 indicates that log10 T may decrease up to c. 0.05 for a pressure drop of c. 1,000 kPa and it is possible that the pressure decrease also influence the possible transmissivity change.
• An earlier packer test for section 9.7–10.7 m gives T = 1.3·10–8 m2/s (in log10 format: –7.89) (Rhén and Forsmark 2001).
(Figure 7-37, Figure 7-38).

SKB R-12-12 65
7.3.6 KA3546G01:2 (6.75–8.30 m)Temperature• The zero value from May (2003) and the 20°C decrease between 2003-05-23 and 2003-06-17
have been removed. Thereafter the average value of the two thermistors is used.
• Data after 2004-05-22 is considered as non-realistic when compared to another temperature data is the close vicinity of the deposition hole.
• Data between 2004-05-22 and 2004-12-29 is replaced by data calculated as the temperature data in TR6012 (Ghoudarzi and Johannesson 2006) (which is a temperature sensor in a hole drilled from inside the deposition hole DA3545G01 located 1.8 m from the HM section in KA3546G01) plus 1.6 degrees which was the temperature difference 2004-05-22.
(Figure 7-39).
Long-term deformation• The rock expands until the sensor fails in mid-december 2003.
• The reason for the large fracture expansion during the autumn 2003 is unknown.
(Figure 7-40, Figure 7-41, Figure 7-42).
TransmissivityThe change of the transmissivity during the period is shown below (Forsmark and Rhén 2004a, b, c, 2005a, b, c, Forsmark 2006, 2007a). (T-Moye: stationary assumption, T: evaluation based on transient data). Undisturbed pressure 2003-05 c. 0 kPa and 2006-10 c. 700 kPa, see Appendix 2.
• T_Moye and T decrease when the temperature increases for the three last tests in the figure above. Chapter 7.5, Figure 7-104 indicates that log10 T may decrease up to c. 0.05 for a pressure drop of c. 1,000 kPa and as the water pressure increase one can assume that the T decrease is due to the temperature increase.
• Possibly van the increased transmissivity at an early stage indicate a fracture slip?
• An earlier packer test for section 6.7–7.7 m gives T = 3.9·10–11 m2/s (in log10 format: –10.41) (Forsmark and Rhén 2001).
• An earlier packer test for section 7.7–8.7 m gives T = 1.7·10–9 m2/s (in log10 format: –8.77) (Rhén and Forsmark 2001).
(Figure 7-43, Figure 7-44).
7.3.7 KA3548A01:3 (8.80–10.75 m)Temperature• The outer thermistor is out of order so data from the inner thermistor is presented.
• Data between 2005-01-20 and 2005-01-24 is replaced by interpolated data.
• Data between 2005-02-01 and 2005-11-28 is replaced by interpolated data.
(Figure 7-45).
Long-term deformationThe intact rock sensor has failed as well. Therefor no fracture deformation can be presented.
(Figure 7-46).

66 SKB R-12-12
Figure 7-39. KA3546G01:2. Average temperature.
Figure 7-40. KA3546G01:2. Rock deformation – intact rock section.
0
5
10
15
20
25
30
35
40KA3546G01:2 – Daily average temperature
[°C
]
2003
-05-
0120
03-0
6-01
2003
-07-
0120
03-0
8-01
2003
-09-
0120
03-1
0-01
2003
-11-
0120
03-1
2-01
2004
-01-
0120
04-0
2-01
2004
-03-
0120
04-0
4-01
2004
-05-
0120
04-0
6-01
2004
-07-
0120
04-0
8-01
2004
-09-
0120
04-1
0-01
2004
-11-
0120
04-1
2-01
2005
-01-
0120
05-0
2-01
2005
-03-
0120
05-0
4-01
2005
-05-
0120
05-0
6-01
2005
-07-
0120
05-0
8-01
2005
-09-
0120
05-1
0-01
2005
-11-
0120
05-1
2-01
2006
-01-
0120
06-0
2-01
2006
-03-
0120
06-0
4-01
2006
-05-
0120
06-0
6-01
2006
-07-
0120
06-0
8-01
2006
-09-
0120
06-1
0-01
–0.1
–0.05
0
0.05
0.1KA3546G01:2 – Daily average rock deformation
(mm
)
2003
-05-
0120
03-0
6-01
2003
-07-
0120
03-0
8-01
2003
-09-
0120
03-1
0-01
2003
-11-
0120
03-1
2-01
2004
-01-
0120
04-0
2-01
2004
-03-
0120
04-0
4-01
2004
-05-
0120
04-0
6-01
2004
-07-
0120
04-0
8-01
2004
-09-
0120
04-1
0-01
2004
-11-
0120
04-1
2-01
2005
-01-
0120
05-0
2-01
2005
-03-
0120
05-0
4-01
2005
-05-
0120
05-0
6-01
2005
-07-
0120
05-0
8-01
2005
-09-
0120
05-1
0-01
2005
-11-
0120
05-1
2-01
2006
-01-
0120
06-0
2-01
2006
-03-
0120
06-0
4-01
2006
-05-
0120
06-0
6-01
2006
-07-
0120
06-0
8-01
2006
-09-
0120
06-1
0-01

SKB R-12-12 67
Figure 7-41. KA3546G01:2. Rock and fracture deformation.
Figure 7-42. KA3546G01:2. Single fracture deformation.
–0.1
0
0.1
0.2
0.3KA3546G01:2 – Daily average rock and fracture deformation
(mm
)
2003
-05-
0120
03-0
6-01
2003
-07-
0120
03-0
8-01
2003
-09-
0120
03-1
0-01
2003
-11-
0120
03-1
2-01
2004
-01-
0120
04-0
2-01
2004
-03-
0120
04-0
4-01
2004
-05-
0120
04-0
6-01
2004
-07-
0120
04-0
8-01
2004
-09-
0120
04-1
0-01
2004
-11-
0120
04-1
2-01
2005
-01-
0120
05-0
2-01
2005
-03-
0120
05-0
4-01
2005
-05-
0120
05-0
6-01
2005
-07-
0120
05-0
8-01
2005
-09-
0120
05-1
0-01
2005
-11-
0120
05-1
2-01
2006
-01-
0120
06-0
2-01
2006
-03-
0120
06-0
4-01
2006
-05-
0120
06-0
6-01
2006
-07-
0120
06-0
8-01
2006
-09-
0120
06-1
0-01
–0.05
0
0.05
0.1
0.15
0.2
0.25KA3546G01:2 – Daily average fracture deformation
(mm
)
2003
-05-
0120
03-0
6-01
2003
-07-
0120
03-0
8-01
2003
-09-
0120
03-1
0-01
2003
-11-
0120
03-1
2-01
2004
-01-
0120
04-0
2-01
2004
-03-
0120
04-0
4-01
2004
-05-
0120
04-0
6-01
2004
-07-
0120
04-0
8-01
2004
-09-
0120
04-1
0-01
2004
-11-
0120
04-1
2-01
2005
-01-
0120
05-0
2-01
2005
-03-
0120
05-0
4-01
2005
-05-
0120
05-0
6-01
2005
-07-
0120
05-0
8-01
2005
-09-
0120
05-1
0-01
2005
-11-
0120
05-1
2-01
2006
-01-
0120
06-0
2-01
2006
-03-
0120
06-0
4-01
2006
-05-
0120
06-0
6-01
2006
-07-
0120
06-0
8-01
2006
-09-
0120
06-1
0-01

68 SKB R-12-12
Figure 7-43. Transmissivity change during the period 2003-05-01 to 2006-10-01.
Figure 7-44. Transmissivity versus temperature in KA3546G01:2 (6.75–8.30 m). No temperature measure-ments are available after 2005-01-01.
10–11
10–10
10–9
10–8
KA3546G01:2 – Transmissivity
KA3546G01:2 – TKA3546G01:2 – T MoyeTr
ansm
issi
vity
(m2 /s
)
2003
-05-
0120
03-0
6-01
2003
-07-
0120
03-0
8-01
2003
-09-
0120
03-1
0-01
2003
-11-
0120
03-1
2-01
2004
-01-
0120
04-0
2-01
2004
-03-
0120
04-0
4-01
2004
-05-
0120
04-0
6-01
2004
-07-
0120
04-0
8-01
2004
-09-
0120
04-1
0-01
2004
-11-
0120
04-1
2-01
2005
-01-
0120
05-0
2-01
2005
-03-
0120
05-0
4-01
2005
-05-
0120
05-0
6-01
2005
-07-
0120
05-0
8-01
2005
-09-
0120
05-1
0-01
2005
-11-
0120
05-1
2-01
2006
-01-
0120
06-0
2-01
2006
-03-
0120
06-0
4-01
2006
-05-
0120
06-0
6-01
2006
-07-
0120
06-0
8-01
2006
-09-
0120
06-1
0-01
10 15 20 25 30 35 40–11
–10
–9
–8
Log1
0 –
Tran
smis
sivi
ty (m
2 /s)
Temperature [°C]
KA3546G01:2 – Transmissivity
Fit Results – T MoyeLinearEquation Y = –0.007990685153 * X –9.125245448
Fit Results – T AQTSLinearEquation Y = –0.02426443274 * X –8.036447425Packer test (7.7–8.7 m)
Packer test (6.7–7.7 m) Linear Fit – TvsTempKA3546G01:2 – TLinear Fit – T Moye vs TempKA3546G01:2 – T Moye

SKB R-12-12 69
Figure 7-45. KA3548A01:3. Average temperature.
Figure 7-46. KA3548A01:3. Rock and fracture deformation.
0
5
10
15
20KA3548A01:3 – Daily inner thermistor temperature
(°C
)
2003
-05-
0120
03-0
6-01
2003
-07-
0120
03-0
8-01
2003
-09-
0120
03-1
0-01
2003
-11-
0120
03-1
2-01
2004
-01-
0120
04-0
2-01
2004
-03-
0120
04-0
4-01
2004
-05-
0120
04-0
6-01
2004
-07-
0120
04-0
8-01
2004
-09-
0120
04-1
0-01
2004
-11-
0120
04-1
2-01
2005
-01-
0120
05-0
2-01
2005
-03-
0120
05-0
4-01
2005
-05-
0120
05-0
6-01
2005
-07-
0120
05-0
8-01
2005
-09-
0120
05-1
0-01
2005
-11-
0120
05-1
2-01
2006
-01-
0120
06-0
2-01
2006
-03-
0120
06-0
4-01
2006
-05-
0120
06-0
6-01
2006
-07-
0120
06-0
8-01
2006
-09-
0120
06-1
0-01
–25
–20
–15
–10
–5
0
5KA3548A01:3 – Daily average rock and fracture deformation
(mm
)
2003
-05-
0120
03-0
6-01
2003
-07-
0120
03-0
8-01
2003
-09-
0120
03-1
0-01
2003
-11-
0120
03-1
2-01
2004
-01-
0120
04-0
2-01
2004
-03-
0120
04-0
4-01
2004
-05-
0120
04-0
6-01
2004
-07-
0120
04-0
8-01
2004
-09-
0120
04-1
0-01
2004
-11-
0120
04-1
2-01
2005
-01-
0120
05-0
2-01
2005
-03-
0120
05-0
4-01
2005
-05-
0120
05-0
6-01
2005
-07-
0120
05-0
8-01
2005
-09-
0120
05-1
0-01
2005
-11-
0120
05-1
2-01
2006
-01-
0120
06-0
2-01
2006
-03-
0120
06-0
4-01
2006
-05-
0120
06-0
6-01
2006
-07-
0120
06-0
8-01
2006
-09-
0120
06-1
0-01

70 SKB R-12-12
Figure 7-47. Transmissivity change during the period 2003-05-01 to 2006-10-01.
Figure 7-48. Transmissivity versus temperature in KA3548A01:3 (8.80–10.75 m).
10–9
10–8
10–7
10–6
Tran
smis
sivi
ty (m
2 /s)
KA3548A01:3 – Transmissivity
KA3548A01:3 – TKA3548A01:3 – T Moye
2003
-05-
0120
03-0
6-01
2003
-07-
0120
03-0
8-01
2003
-09-
0120
03-1
0-01
2003
-11-
0120
03-1
2-01
2004
-01-
0120
04-0
2-01
2004
-03-
0120
04-0
4-01
2004
-05-
0120
04-0
6-01
2004
-07-
0120
04-0
8-01
2004
-09-
0120
04-1
0-01
2004
-11-
0120
04-1
2-01
2005
-01-
0120
05-0
2-01
2005
-03-
0120
05-0
4-01
2005
-05-
0120
05-0
6-01
2005
-07-
0120
05-0
8-01
2005
-09-
0120
05-1
0-01
2005
-11-
0120
05-1
2-01
2006
-01-
0120
06-0
2-01
2006
-03-
0120
06-0
4-01
2006
-05-
0120
06-0
6-01
2006
-07-
0120
06-0
8-01
2006
-09-
0120
06-1
0-01
12 13 14 15 16 17 18–9
–8
–7
–6
Temperature [°C]
KA3548A01:3 – Transmissivity
Log1
0 –
Tran
smis
sivi
ty (m
2 /s)
Fit Results – TLinearEquation Y = –0.06259060283 * X –6.046612293
Fit Results – T MoyeLinearEquation Y = –0.03169065127 * X –6.707295263 Packer test (9–10 m)
Linear Fit – T vs TempKA3548A01:3 – TLinear Fit – T Moye vs TempKA3548A01:3 – T Moye
TransmissivityThe change of the transmissivity during the period is shown below (Forsmark and Rhén 2004a, b, c, 2005a, b, c, Forsmark 2006, 2007a). (T-Moye: stationary assumption, T: evaluation based on tran-sient data). Undisturbed pressure 2003-07 c. 3,500 kPa and 2006-10 c. 2,500 kPa, see Appendix 2.
• Both T and T_Moye decreases when the temperature increases. Chapter 7.5, Figure 7-104 indicates that log10 T may decrease up to c. 0.05 for a pressure drop of c. 1,000 kPa. The figure above includes effect from stress changes due to temperature and effective stress changes due to water pressure changes in the fracture and the effect of the temperature seem to dominate in this case.
• An earlier packer test for section 9–10 m gives T = 1.1·10–7 m2/s (in log10 format: –6.96) (Rhén and Forsmark 2001).
(Figure 7-47, Figure 7-48).

SKB R-12-12 71
Figure 7-49. KA3550G01:2. Average temperature.
0
5
10
15
20
25
30
35
40
45
50KA3550G01:2 – Daily average temperature
(°C
)
2003
-05-
0120
03-0
6-01
2003
-07-
0120
03-0
8-01
2003
-09-
0120
03-1
0-01
2003
-11-
0120
03-1
2-01
2004
-01-
0120
04-0
2-01
2004
-03-
0120
04-0
4-01
2004
-05-
0120
04-0
6-01
2004
-07-
0120
04-0
8-01
2004
-09-
0120
04-1
0-01
2004
-11-
0120
04-1
2-01
2005
-01-
0120
05-0
2-01
2005
-03-
0120
05-0
4-01
2005
-05-
0120
05-0
6-01
2005
-07-
0120
05-0
8-01
2005
-09-
0120
05-1
0-01
2005
-11-
0120
05-1
2-01
2006
-01-
0120
06-0
2-01
2006
-03-
0120
06-0
4-01
2006
-05-
0120
06-0
6-01
2006
-07-
0120
06-0
8-01
2006
-09-
0120
06-1
0-01
7.3.8 KA3550G01:2 (5.20–7.30 m)Temperature• The temperature differs from the temperature in holes in the same area.
• Data between 2003-10-31 and 2006-10-01 is replaced by data calculated as the temperature data in TR5034 (Ghoudarzi and Johannesson 2006) (which is a temperature sensor in a hole drilled from inside the deposition hole DA3551G01 located 2.4 m from the HM section in KA3550G01) plus 9.5 degrees which was the temperature difference 2003-10-31.
(Figure 7-49).
Long-term deformation• The intact rock expands as a result of the temperature increase until the sensor fails in October 2003.
• The fracture is being compressed until sensor failure.
(Figure 7-50, Figure 7-51, Figure 7-52).
TransmissivityNo hydraulic tests have been done in this borehole (Forsmark and Rhén 2004a, b, c, 2005a, b, c, Forsmark 2006, 2007a) due to packer failure. Undisturbed pressure 2003-07 c. 0 kPa and 2006-10 c. 700 kPa, see Appendix 2.
7.3.9 KA3552G01:2 (4.35–6.05 m)Temperature• None of the temperature sensors is in function.
• The data is replaced with data from KA3550G01:2.
(Figure 7-53).
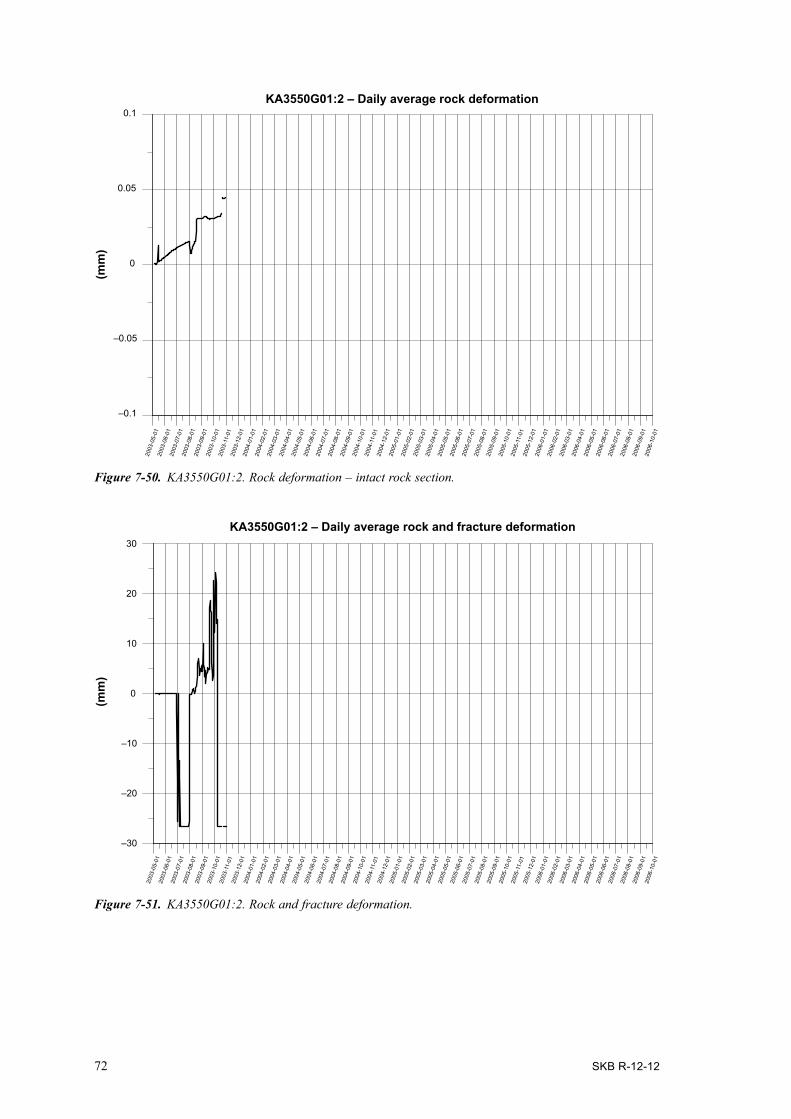
72 SKB R-12-12
Figure 7-51. KA3550G01:2. Rock and fracture deformation.
–30
–20
–10
0
10
20
30
KA3550G01:2 – Daily average rock and fracture deformation
(mm
)
2003
-05-
0120
03-0
6-01
2003
-07-
0120
03-0
8-01
2003
-09-
0120
03-1
0-01
2003
-11-
0120
03-1
2-01
2004
-01-
0120
04-0
2-01
2004
-03-
0120
04-0
4-01
2004
-05-
0120
04-0
6-01
2004
-07-
0120
04-0
8-01
2004
-09-
0120
04-1
0-01
2004
-11-
0120
04-1
2-01
2005
-01-
0120
05-0
2-01
2005
-03-
0120
05-0
4-01
2005
-05-
0120
05-0
6-01
2005
-07-
0120
05-0
8-01
2005
-09-
0120
05-1
0-01
2005
-11-
0120
05-1
2-01
2006
-01-
0120
06-0
2-01
2006
-03-
0120
06-0
4-01
2006
-05-
0120
06-0
6-01
2006
-07-
0120
06-0
8-01
2006
-09-
0120
06-1
0-01
Figure 7-50. KA3550G01:2. Rock deformation – intact rock section.
–0.1
–0.05
0
0.05
0.1KA3550G01:2 – Daily average rock deformation
(mm
)
2003
-05-
0120
03-0
6-01
2003
-07-
0120
03-0
8-01
2003
-09-
0120
03-1
0-01
2003
-11-
0120
03-1
2-01
2004
-01-
0120
04-0
2-01
2004
-03-
0120
04-0
4-01
2004
-05-
0120
04-0
6-01
2004
-07-
0120
04-0
8-01
2004
-09-
0120
04-1
0-01
2004
-11-
0120
04-1
2-01
2005
-01-
0120
05-0
2-01
2005
-03-
0120
05-0
4-01
2005
-05-
0120
05-0
6-01
2005
-07-
0120
05-0
8-01
2005
-09-
0120
05-1
0-01
2005
-11-
0120
05-1
2-01
2006
-01-
0120
06-0
2-01
2006
-03-
0120
06-0
4-01
2006
-05-
0120
06-0
6-01
2006
-07-
0120
06-0
8-01
2006
-09-
0120
06-1
0-01
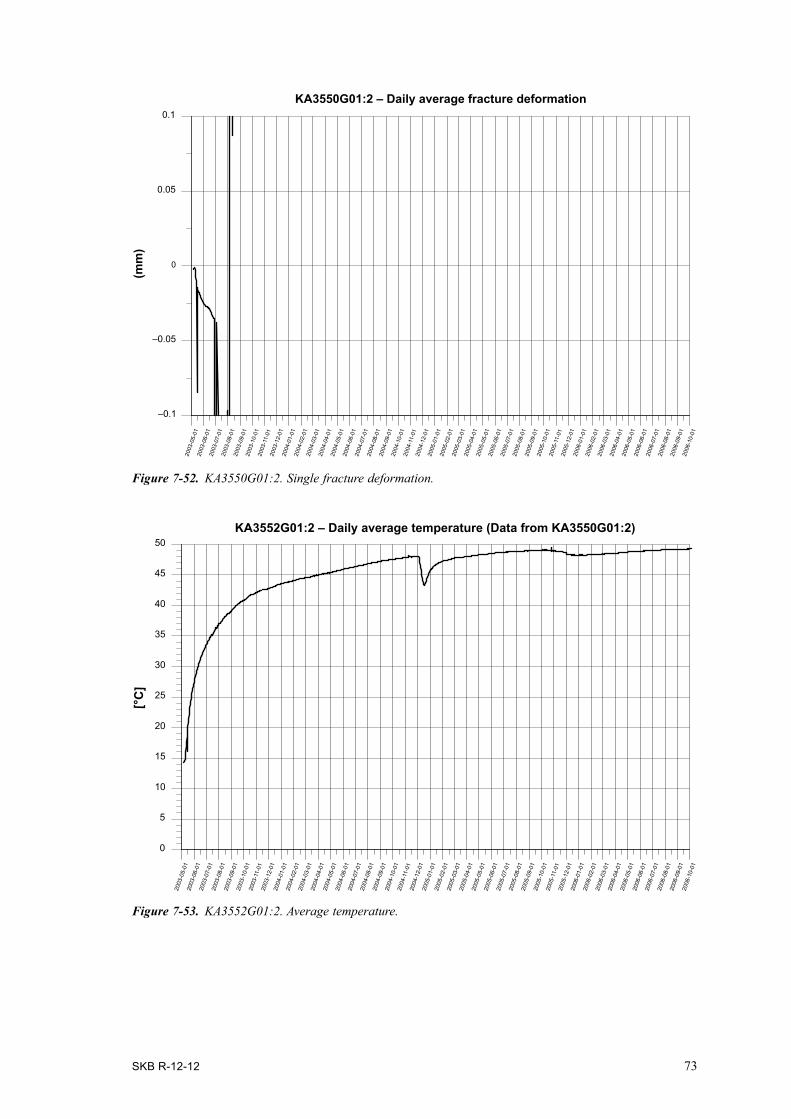
SKB R-12-12 73
Figure 7-52. KA3550G01:2. Single fracture deformation.
–0.1
–0.05
0
0.05
0.1KA3550G01:2 – Daily average fracture deformation
(mm
)
2003
-05-
0120
03-0
6-01
2003
-07-
0120
03-0
8-01
2003
-09-
0120
03-1
0-01
2003
-11-
0120
03-1
2-01
2004
-01-
0120
04-0
2-01
2004
-03-
0120
04-0
4-01
2004
-05-
0120
04-0
6-01
2004
-07-
0120
04-0
8-01
2004
-09-
0120
04-1
0-01
2004
-11-
0120
04-1
2-01
2005
-01-
0120
05-0
2-01
2005
-03-
0120
05-0
4-01
2005
-05-
0120
05-0
6-01
2005
-07-
0120
05-0
8-01
2005
-09-
0120
05-1
0-01
2005
-11-
0120
05-1
2-01
2006
-01-
0120
06-0
2-01
2006
-03-
0120
06-0
4-01
2006
-05-
0120
06-0
6-01
2006
-07-
0120
06-0
8-01
2006
-09-
0120
06-1
0-01
Figure 7-53. KA3552G01:2. Average temperature.
0
5
10
15
20
25
30
35
40
45
50KA3552G01:2 – Daily average temperature (Data from KA3550G01:2)
[°C
]
2003
-05-
0120
03-0
6-01
2003
-07-
0120
03-0
8-01
2003
-09-
0120
03-1
0-01
2003
-11-
0120
03-1
2-01
2004
-01-
0120
04-0
2-01
2004
-03-
0120
04-0
4-01
2004
-05-
0120
04-0
6-01
2004
-07-
0120
04-0
8-01
2004
-09-
0120
04-1
0-01
2004
-11-
0120
04-1
2-01
2005
-01-
0120
05-0
2-01
2005
-03-
0120
05-0
4-01
2005
-05-
0120
05-0
6-01
2005
-07-
0120
05-0
8-01
2005
-09-
0120
05-1
0-01
2005
-11-
0120
05-1
2-01
2006
-01-
0120
06-0
2-01
2006
-03-
0120
06-0
4-01
2006
-05-
0120
06-0
6-01
2006
-07-
0120
06-0
8-01
2006
-09-
0120
06-1
0-01

74 SKB R-12-12
Long-term deformation• The rock expansion ends up with a sensor failure in August 2003.
(Figure 7-54, Figure 7-55, Figure 7-56).
TransmissivityThe change of the transmissivity during the period is shown below (Forsmark and Rhén 2004a, b, c, 2005a, b, c, Forsmark 2006, 2007a). (T-Moye: stationary assumption, T: evaluation based on transient data). Undisturbed pressure 2003-05 c. 0 kPa and 2006-10 c. 800 kPa, see Appendix 2.
• The test section is very close to the canister and, together with KA3550G01:2, should be most affected by stress changes due to temperature increase in the rock mass.
• T_Moye and T decreases when the temperature increases. Chapter 7.5, Figure 7-104 indicates that log10 T may decrease up to c. 0.05 for a pressure drop of c. 1,000 kPa. In KA3552G01:2 the water pressure increases. The figure above includes effect from stress changes due to temperature and effective stress changes due to water pressure changes in the fracture and the effect of the temperature is clear in this case. The fracture orientation is 193/44, see Table 5-8.
• The “sudden” change in transmissivity between first and second test campaigns may be due to a fracture slip, see Figure 7-56 or only dependent on compression of the fracture due to the increased stress?
• An earlier packer test for section 4.7–5.7 m gives T (specific capacity) = 4.8·10–9 m2/s (in log10 format: –8.32) (Rhén and Forsmark 2001). Using measured parameters from that test gives a value of TMoye = 7.0·10–10 m2/s. This is in the same order of magnitude as the majority of the test results shown above.
• The pressure head in KA3552G01:3, is very high in the beginning of the test period, see Appendix 2. The reason may be that the section has a very low hydraulic conductivity, as can be seen in Rhén and Forsmark (2001), and during inflation of the packers the pressure increases to high levels followed by a slow leakage period lowering the pressure.
(Figure 7-57, Figure 7-58).
7.3.10 KA3554G01:2 (22.60–24.15 m)Temperature• Data between 2004-08-01 and 2006-10-01 is replaced by data from KA3542G01:3.
(Figure 7-59).
Long-term deformation• The rock shows a slight compression since the measurement start.
• The expansion of both sensors at the beginning of the test period can be a result of that the anchors have settled down. After that there has been a small but clear compression of the system.
• At the end of February 2004 something happens that affect both sensors. No explanation for the sudden deformation change can be found.
(Figure 7-60).
Long-term deformation(Figure 7-61, Figure 7-62).

SKB R-12-12 75
–0.4
–0.3
–0.2
–0.1
0
0.1
0.2
0.3
0.4KA3552G01:2 – Daily average rock deformation
(mm
)
2003
-05-
0120
03-0
6-01
2003
-07-
0120
03-0
8-01
2003
-09-
0120
03-1
0-01
2003
-11-
0120
03-1
2-01
2004
-01-
0120
04-0
2-01
2004
-03-
0120
04-0
4-01
2004
-05-
0120
04-0
6-01
2004
-07-
0120
04-0
8-01
2004
-09-
0120
04-1
0-01
2004
-11-
0120
04-1
2-01
2005
-01-
0120
05-0
2-01
2005
-03-
0120
05-0
4-01
2005
-05-
0120
05-0
6-01
2005
-07-
0120
05-0
8-01
2005
-09-
0120
05-1
0-01
2005
-11-
0120
05-1
2-01
2006
-01-
0120
06-0
2-01
2006
-03-
0120
06-0
4-01
2006
-05-
0120
06-0
6-01
2006
-07-
0120
06-0
8-01
2006
-09-
0120
06-1
0-01
Figure 7-54. KA3552G01:2. Rock deformation.
Figure 7-55. KA3552G01:2. Rock and fracture deformation.
–0.6
–0.4
–0.2
0
0.2KA3552G01:2 – Daily average rock and fracture deformation
(mm
)
2003
-05-
0120
03-0
6-01
2003
-07-
0120
03-0
8-01
2003
-09-
0120
03-1
0-01
2003
-11-
0120
03-1
2-01
2004
-01-
0120
04-0
2-01
2004
-03-
0120
04-0
4-01
2004
-05-
0120
04-0
6-01
2004
-07-
0120
04-0
8-01
2004
-09-
0120
04-1
0-01
2004
-11-
0120
04-1
2-01
2005
-01-
0120
05-0
2-01
2005
-03-
0120
05-0
4-01
2005
-05-
0120
05-0
6-01
2005
-07-
0120
05-0
8-01
2005
-09-
0120
05-1
0-01
2005
-11-
0120
05-1
2-01
2006
-01-
0120
06-0
2-01
2006
-03-
0120
06-0
4-01
2006
-05-
0120
06-0
6-01
2006
-07-
0120
06-0
8-01
2006
-09-
0120
06-1
0-01

76 SKB R-12-12
Figure 7-57. Transmissivity change during the period 2003-05-01 to 2006-02-01.
10–10
10–9
10–8
10–7
Tran
smis
sivi
ty (m
2 /s)
KA3552G01:2 – Transmissivity
KA3552G01:2 – TKA3552G01:2 – T Moye
2003
-05-
0120
03-0
6-01
2003
-07-
0120
03-0
8-01
2003
-09-
0120
03-1
0-01
2003
-11-
0120
03-1
2-01
2004
-01-
0120
04-0
2-01
2004
-03-
0120
04-0
4-01
2004
-05-
0120
04-0
6-01
2004
-07-
0120
04-0
8-01
2004
-09-
0120
04-1
0-01
2004
-11-
0120
04-1
2-01
2005
-01-
0120
05-0
2-01
2005
-03-
0120
05-0
4-01
2005
-05-
0120
05-0
6-01
2005
-07-
0120
05-0
8-01
2005
-09-
0120
05-1
0-01
2005
-11-
0120
05-1
2-01
2006
-01-
0120
06-0
2-01
2006
-03-
0120
06-0
4-01
2006
-05-
0120
06-0
6-01
2006
-07-
0120
06-0
8-01
2006
-09-
0120
06-1
0-01
Figure 7-56. KA3552G01:2. Single fracture deformation.
–0.4
–0.3
–0.2
–0.1
0
0.1
0.2
0.3
0.4
KA3552G01:2 – Daily average fracture deformation(m
m)
2003
-05-
0120
03-0
6-01
2003
-07-
0120
03-0
8-01
2003
-09-
0120
03-1
0-01
2003
-11-
0120
03-1
2-01
2004
-01-
0120
04-0
2-01
2004
-03-
0120
04-0
4-01
2004
-05-
0120
04-0
6-01
2004
-07-
0120
04-0
8-01
2004
-09-
0120
04-1
0-01
2004
-11-
0120
04-1
2-01
2005
-01-
0120
05-0
2-01
2005
-03-
0120
05-0
4-01
2005
-05-
0120
05-0
6-01
2005
-07-
0120
05-0
8-01
2005
-09-
0120
05-1
0-01
2005
-11-
0120
05-1
2-01
2006
-01-
0120
06-0
2-01
2006
-03-
0120
06-0
4-01
2006
-05-
0120
06-0
6-01
2006
-07-
0120
06-0
8-01
2006
-09-
0120
06-1
0-01
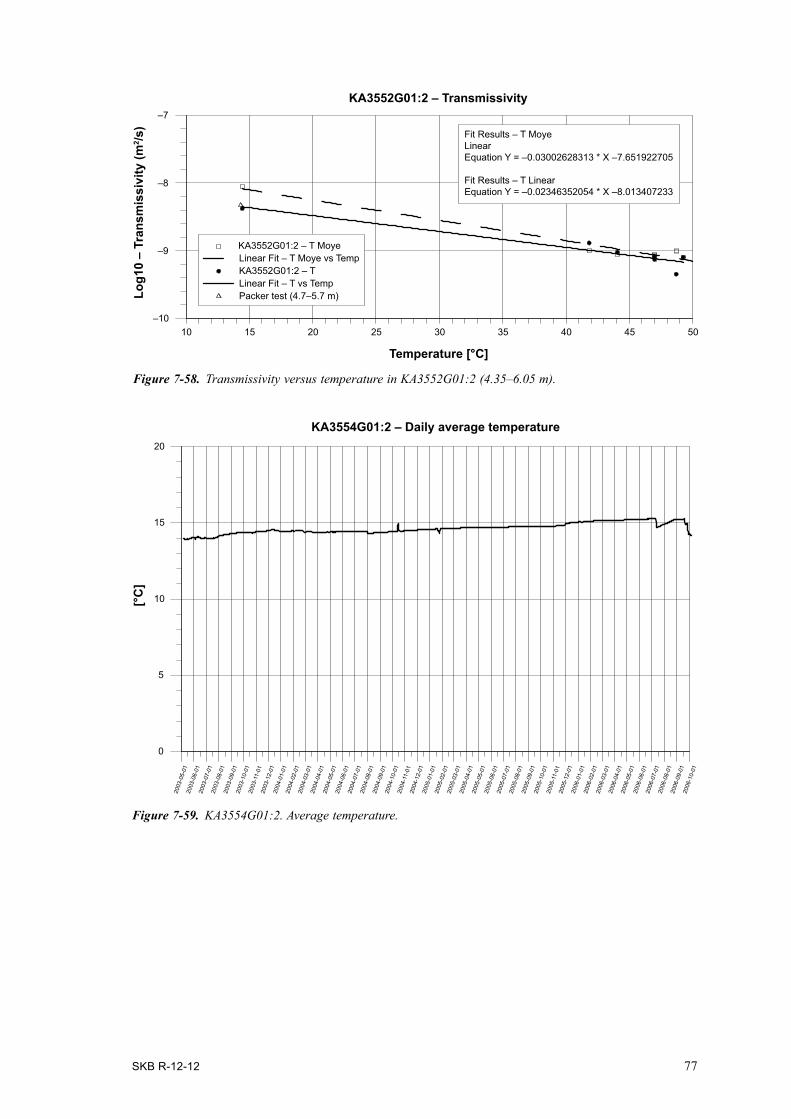
SKB R-12-12 77
Figure 7-58. Transmissivity versus temperature in KA3552G01:2 (4.35–6.05 m).
10 15 20 25 30 35 40 45 50 –10
–9
–8
–7
Log1
0 –
Tran
smis
sivi
ty (m
2 /s)
Temperature [°C]
KA3552G01:2 – Transmissivity
Fit Results – T MoyeLinearEquation Y = –0.03002628313 * X –7.651922705
Fit Results – T LinearEquation Y = –0.02346352054 * X –8.013407233
Packer test (4.7–5.7 m)Linear Fit – T vs TempKA3552G01:2 – TLinear Fit – T Moye vs TempKA3552G01:2 – T Moye
Figure 7-59. KA3554G01:2. Average temperature.
0
5
10
15
20
[°C
]
KA3554G01:2 – Daily average temperature
2003
-05-
0120
03-0
6-01
2003
-07-
0120
03-0
8-01
2003
-09-
0120
03-1
0-01
2003
-11-
0120
03-1
2-01
2004
-01-
0120
04-0
2-01
2004
-03-
0120
04-0
4-01
2004
-05-
0120
04-0
6-01
2004
-07-
0120
04-0
8-01
2004
-09-
0120
04-1
0-01
2004
-11-
0120
04-1
2-01
2005
-01-
0120
05-0
2-01
2005
-03-
0120
05-0
4-01
2005
-05-
0120
05-0
6-01
2005
-07-
0120
05-0
8-01
2005
-09-
0120
05-1
0-01
2005
-11-
0120
05-1
2-01
2006
-01-
0120
06-0
2-01
2006
-03-
0120
06-0
4-01
2006
-05-
0120
06-0
6-01
2006
-07-
0120
06-0
8-01
2006
-09-
0120
06-1
0-01
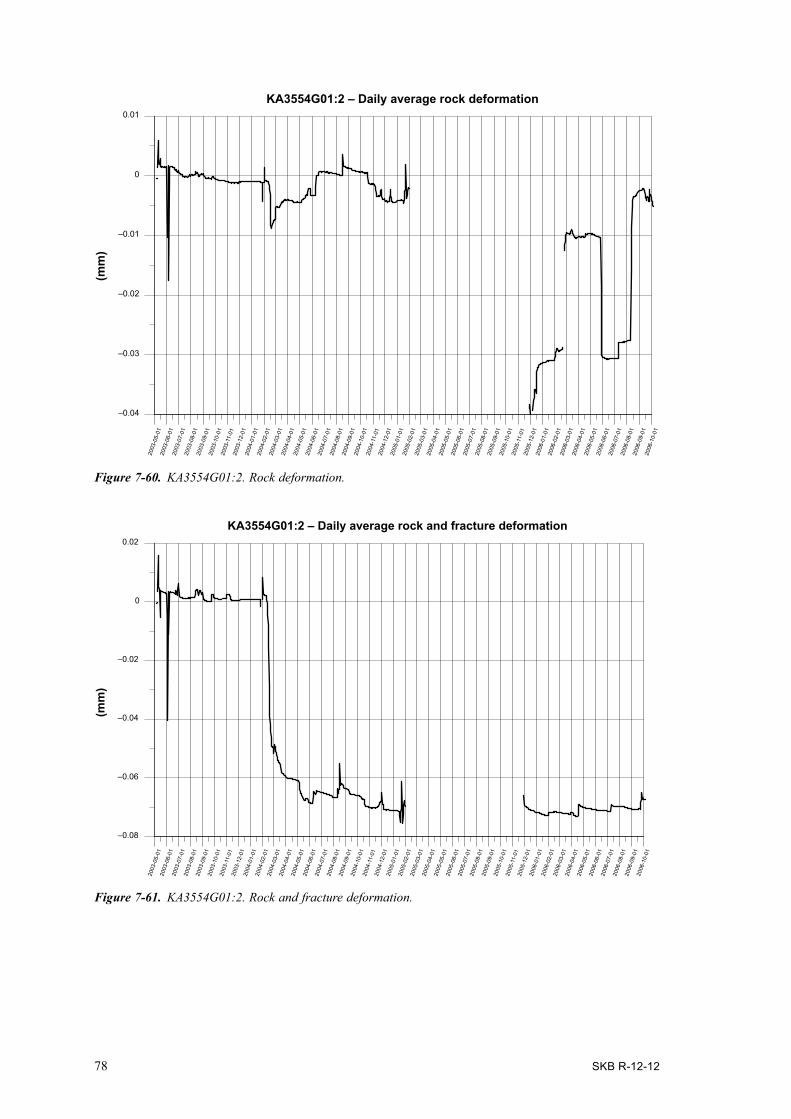
78 SKB R-12-12
Figure 7-61. KA3554G01:2. Rock and fracture deformation.
–0.08
–0.06
–0.04
–0.02
0
0.02
KA3554G01:2 – Daily average rock and fracture deformation
(mm
)
2003
-05-
0120
03-0
6-01
2003
-07-
0120
03-0
8-01
2003
-09-
0120
03-1
0-01
2003
-11-
0120
03-1
2-01
2004
-01-
0120
04-0
2-01
2004
-03-
0120
04-0
4-01
2004
-05-
0120
04-0
6-01
2004
-07-
0120
04-0
8-01
2004
-09-
0120
04-1
0-01
2004
-11-
0120
04-1
2-01
2005
-01-
0120
05-0
2-01
2005
-03-
0120
05-0
4-01
2005
-05-
0120
05-0
6-01
2005
-07-
0120
05-0
8-01
2005
-09-
0120
05-1
0-01
2005
-11-
0120
05-1
2-01
2006
-01-
0120
06-0
2-01
2006
-03-
0120
06-0
4-01
2006
-05-
0120
06-0
6-01
2006
-07-
0120
06-0
8-01
2006
-09-
0120
06-1
0-01
Figure 7-60. KA3554G01:2. Rock deformation.
–0.04
–0.03
–0.02
–0.01
0
0.01
KA3554G01:2 – Daily average rock deformation(m
m)
2003
-05-
0120
03-0
6-01
2003
-07-
0120
03-0
8-01
2003
-09-
0120
03-1
0-01
2003
-11-
0120
03-1
2-01
2004
-01-
0120
04-0
2-01
2004
-03-
0120
04-0
4-01
2004
-05-
0120
04-0
6-01
2004
-07-
0120
04-0
8-01
2004
-09-
0120
04-1
0-01
2004
-11-
0120
04-1
2-01
2005
-01-
0120
05-0
2-01
2005
-03-
0120
05-0
4-01
2005
-05-
0120
05-0
6-01
2005
-07-
0120
05-0
8-01
2005
-09-
0120
05-1
0-01
2005
-11-
0120
05-1
2-01
2006
-01-
0120
06-0
2-01
2006
-03-
0120
06-0
4-01
2006
-05-
0120
06-0
6-01
2006
-07-
0120
06-0
8-01
2006
-09-
0120
06-1
0-01
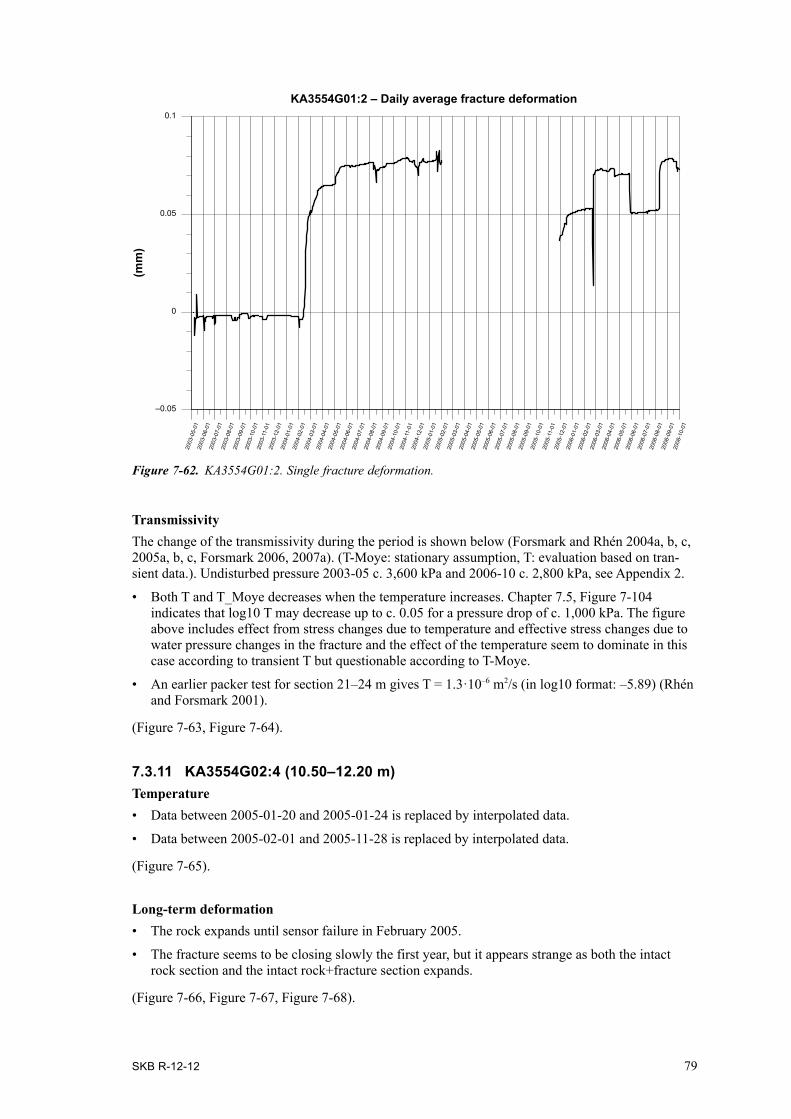
SKB R-12-12 79
Figure 7-62. KA3554G01:2. Single fracture deformation.
–0.05
0
0.05
0.1
KA3554G01:2 – Daily average fracture deformation
(mm
)
2003
-05-
0120
03-0
6-01
2003
-07-
0120
03-0
8-01
2003
-09-
0120
03-1
0-01
2003
-11-
0120
03-1
2-01
2004
-01-
0120
04-0
2-01
2004
-03-
0120
04-0
4-01
2004
-05-
0120
04-0
6-01
2004
-07-
0120
04-0
8-01
2004
-09-
0120
04-1
0-01
2004
-11-
0120
04-1
2-01
2005
-01-
0120
05-0
2-01
2005
-03-
0120
05-0
4-01
2005
-05-
0120
05-0
6-01
2005
-07-
0120
05-0
8-01
2005
-09-
0120
05-1
0-01
2005
-11-
0120
05-1
2-01
2006
-01-
0120
06-0
2-01
2006
-03-
0120
06-0
4-01
2006
-05-
0120
06-0
6-01
2006
-07-
0120
06-0
8-01
2006
-09-
0120
06-1
0-01
TransmissivityThe change of the transmissivity during the period is shown below (Forsmark and Rhén 2004a, b, c, 2005a, b, c, Forsmark 2006, 2007a). (T-Moye: stationary assumption, T: evaluation based on tran-sient data.). Undisturbed pressure 2003-05 c. 3,600 kPa and 2006-10 c. 2,800 kPa, see Appendix 2.
• Both T and T_Moye decreases when the temperature increases. Chapter 7.5, Figure 7-104 indicates that log10 T may decrease up to c. 0.05 for a pressure drop of c. 1,000 kPa. The figure above includes effect from stress changes due to temperature and effective stress changes due to water pressure changes in the fracture and the effect of the temperature seem to dominate in this case according to transient T but questionable according to T-Moye.
• An earlier packer test for section 21–24 m gives T = 1.3·10–6 m2/s (in log10 format: –5.89) (Rhén and Forsmark 2001).
(Figure 7-63, Figure 7-64).
7.3.11 KA3554G02:4 (10.50–12.20 m)Temperature• Data between 2005-01-20 and 2005-01-24 is replaced by interpolated data.
• Data between 2005-02-01 and 2005-11-28 is replaced by interpolated data.
(Figure 7-65).
Long-term deformation• The rock expands until sensor failure in February 2005.
• The fracture seems to be closing slowly the first year, but it appears strange as both the intact rock section and the intact rock+fracture section expands.
(Figure 7-66, Figure 7-67, Figure 7-68).

80 SKB R-12-12
Figure 7-64. Transmissivity versus temperature in KA3554G01:2 (22.60–24.15 m).
12 13 14 15 16 17 18–8
–7
–6
–5KA3554G01:2 – Transmissivity
Fit Results – T MoyeLinearEquation Y = –0.0252622392 * X –6.929751725
Fit Results – TLinearEquation Y = –0.1840433688 * X –3.612667103
Temperature [°C]
Log1
0 –
Tran
smis
sivi
ty (m
2 /s)
Packer test (21–24 m)Linear Fit – T vs TempKA3554G01:2 – TLinear Fit – T Moye vs TempKA3554G01:2 – T Moye
Figure 7-63. Transmissivity change during the period 2003-05-01 to 2006-10-01.
10–8
10–7
10–6
10–5
Tran
smis
sivi
ty (m
2 /s)
KA3554G01:2 – Transmissivity
KA3554G01:2 – TKA3554G01:2 – T Moye
2003
-05-
0120
03-0
6-01
2003
-07-
0120
03-0
8-01
2003
-09-
0120
03-1
0-01
2003
-11-
0120
03-1
2-01
2004
-01-
0120
04-0
2-01
2004
-03-
0120
04-0
4-01
2004
-05-
0120
04-0
6-01
2004
-07-
0120
04-0
8-01
2004
-09-
0120
04-1
0-01
2004
-11-
0120
04-1
2-01
2005
-01-
0120
05-0
2-01
2005
-03-
0120
05-0
4-01
2005
-05-
0120
05-0
6-01
2005
-07-
0120
05-0
8-01
2005
-09-
0120
05-1
0-01
2005
-11-
0120
05-1
2-01
2006
-01-
0120
06-0
2-01
2006
-03-
0120
06-0
4-01
2006
-05-
0120
06-0
6-01
2006
-07-
0120
06-0
8-01
2006
-09-
0120
06-1
0-01

SKB R-12-12 81
Figure 7-65. KA3554G02:4. Average temperature.
0
5
10
15
20KA3554G02:4 – Daily average temperature
(°C
)
2003
-05-
0120
03-0
6-01
2003
-07-
0120
03-0
8-01
2003
-09-
0120
03-1
0-01
2003
-11-
0120
03-1
2-01
2004
-01-
0120
04-0
2-01
2004
-03-
0120
04-0
4-01
2004
-05-
0120
04-0
6-01
2004
-07-
0120
04-0
8-01
2004
-09-
0120
04-1
0-01
2004
-11-
0120
04-1
2-01
2005
-01-
0120
05-0
2-01
2005
-03-
0120
05-0
4-01
2005
-05-
0120
05-0
6-01
2005
-07-
0120
05-0
8-01
2005
-09-
0120
05-1
0-01
2005
-11-
0120
05-1
2-01
2006
-01-
0120
06-0
2-01
2006
-03-
0120
06-0
4-01
2006
-05-
0120
06-0
6-01
2006
-07-
0120
06-0
8-01
2006
-09-
0120
06-1
0-01
Figure 7-66. KA3554G02:4. Rock deformation – intact rock section.
–0.04
–0.03
–0.02
–0.01
0
0.01
0.02
0.03
0.04KA3554G02:4 – Daily average rock deformation
(mm
)
2003
-05-
0120
03-0
6-01
2003
-07-
0120
03-0
8-01
2003
-09-
0120
03-1
0-01
2003
-11-
0120
03-1
2-01
2004
-01-
0120
04-0
2-01
2004
-03-
0120
04-0
4-01
2004
-05-
0120
04-0
6-01
2004
-07-
0120
04-0
8-01
2004
-09-
0120
04-1
0-01
2004
-11-
0120
04-1
2-01
2005
-01-
0120
05-0
2-01
2005
-03-
0120
05-0
4-01
2005
-05-
0120
05-0
6-01
2005
-07-
0120
05-0
8-01
2005
-09-
0120
05-1
0-01
2005
-11-
0120
05-1
2-01
2006
-01-
0120
06-0
2-01
2006
-03-
0120
06-0
4-01
2006
-05-
0120
06-0
6-01
2006
-07-
0120
06-0
8-01
2006
-09-
0120
06-1
0-01
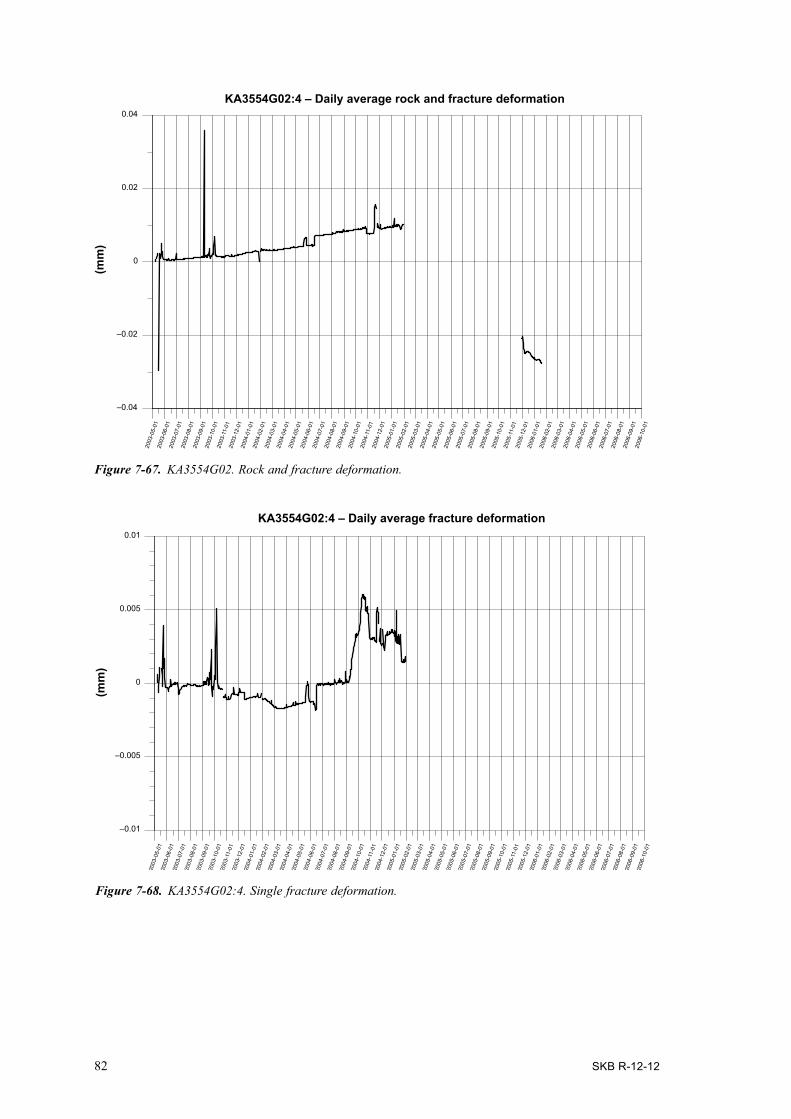
82 SKB R-12-12
Figure 7-68. KA3554G02:4. Single fracture deformation.
–0.01
–0.005
0
0.005
0.01
KA3554G02:4 – Daily average fracture deformation
(mm
)
2003
-05-
0120
03-0
6-01
2003
-07-
0120
03-0
8-01
2003
-09-
0120
03-1
0-01
2003
-11-
0120
03-1
2-01
2004
-01-
0120
04-0
2-01
2004
-03-
0120
04-0
4-01
2004
-05-
0120
04-0
6-01
2004
-07-
0120
04-0
8-01
2004
-09-
0120
04-1
0-01
2004
-11-
0120
04-1
2-01
2005
-01-
0120
05-0
2-01
2005
-03-
0120
05-0
4-01
2005
-05-
0120
05-0
6-01
2005
-07-
0120
05-0
8-01
2005
-09-
0120
05-1
0-01
2005
-11-
0120
05-1
2-01
2006
-01-
0120
06-0
2-01
2006
-03-
0120
06-0
4-01
2006
-05-
0120
06-0
6-01
2006
-07-
0120
06-0
8-01
2006
-09-
0120
06-1
0-01
Figure 7-67. KA3554G02. Rock and fracture deformation.
–0.04
–0.02
0
0.02
0.04
KA3554G02:4 – Daily average rock and fracture deformation(m
m)
2003
-05-
0120
03-0
6-01
2003
-07-
0120
03-0
8-01
2003
-09-
0120
03-1
0-01
2003
-11-
0120
03-1
2-01
2004
-01-
0120
04-0
2-01
2004
-03-
0120
04-0
4-01
2004
-05-
0120
04-0
6-01
2004
-07-
0120
04-0
8-01
2004
-09-
0120
04-1
0-01
2004
-11-
0120
04-1
2-01
2005
-01-
0120
05-0
2-01
2005
-03-
0120
05-0
4-01
2005
-05-
0120
05-0
6-01
2005
-07-
0120
05-0
8-01
2005
-09-
0120
05-1
0-01
2005
-11-
0120
05-1
2-01
2006
-01-
0120
06-0
2-01
2006
-03-
0120
06-0
4-01
2006
-05-
0120
06-0
6-01
2006
-07-
0120
06-0
8-01
2006
-09-
0120
06-1
0-01

SKB R-12-12 83
Figure 7-69. Transmissivity change during the period 2003-05-01 to 2006-10-01.
10–10
10–9
10–8
10–7
Tran
smis
sivi
ty (m
2 /s)
KA3554G02:4 – Transmissivity
KA3554G02:4 – TKA3554G02:4 – T Moye
2003
-05-
0120
03-0
6-01
2003
-07-
0120
03-0
8-01
2003
-09-
0120
03-1
0-01
2003
-11-
0120
03-1
2-01
2004
-01-
0120
04-0
2-01
2004
-03-
0120
04-0
4-01
2004
-05-
0120
04-0
6-01
2004
-07-
0120
04-0
8-01
2004
-09-
0120
04-1
0-01
2004
-11-
0120
04-1
2-01
2005
-01-
0120
05-0
2-01
2005
-03-
0120
05-0
4-01
2005
-05-
0120
05-0
6-01
2005
-07-
0120
05-0
8-01
2005
-09-
0120
05-1
0-01
2005
-11-
0120
05-1
2-01
2006
-01-
0120
06-0
2-01
2006
-03-
0120
06-0
4-01
2006
-05-
0120
06-0
6-01
2006
-07-
0120
06-0
8-01
2006
-09-
0120
06-1
0-01
TransmissivityThe change of the transmissivity during the period is shown below (Forsmark and Rhén 2004a, b, c, 2005a, b, c, Forsmark 2006, 2007a). (T-Moye: stationary assumption, T: evaluation based on tran-sient data). Undisturbed pressure 2003-05 c. 2,400 kPa and 2006-10 c. 1,400 kPa, see Appendix 2.
• T_Moye increases slightly when the temperature decreases which is not what is expected. T decreases as expected. Chapter 7.5, Figure 7-104 indicates that log10 T may decrease up to c. 0.05 for a pressure drop of c. 1,000 kPa. The figure above includes effect from stress changes due to temperature and effective stress changes due to water pressure changes in the fracture and the effect of the temperature seem to dominate in this case according to transient T but question-able according to T-Moye.
• An earlier packer test for section 11–12 m gives T = 2.9·10–7 m2/s (in log10 format: –6.54) (Rhén and Forsmark 2001).
(Figure 7-69, Figure 7-70).
Figure 7-70. Transmissivity versus temperature in KA3554G02:4 (10.50–12.20 m).
14 15 16 17 18 19 20–10
–9
–8
–7
–6
Fit Results – TLinearEquation Y = –0.006449174633 * X –7.642431506
Fit Results – T MoyeLinearEquation Y = 0.02304421746 * X –9.46510924
Temperature [°C]
Log1
0 –
Tran
smis
sivi
ty (m
2 /s)
KA3554G02:4 – Transmissivity
Packer test (11–12 m)Linear Fit – T vs TempKA3554G02:4 – TLinear Fit – T Moye vs TempKA3554G02:4 – T Moye
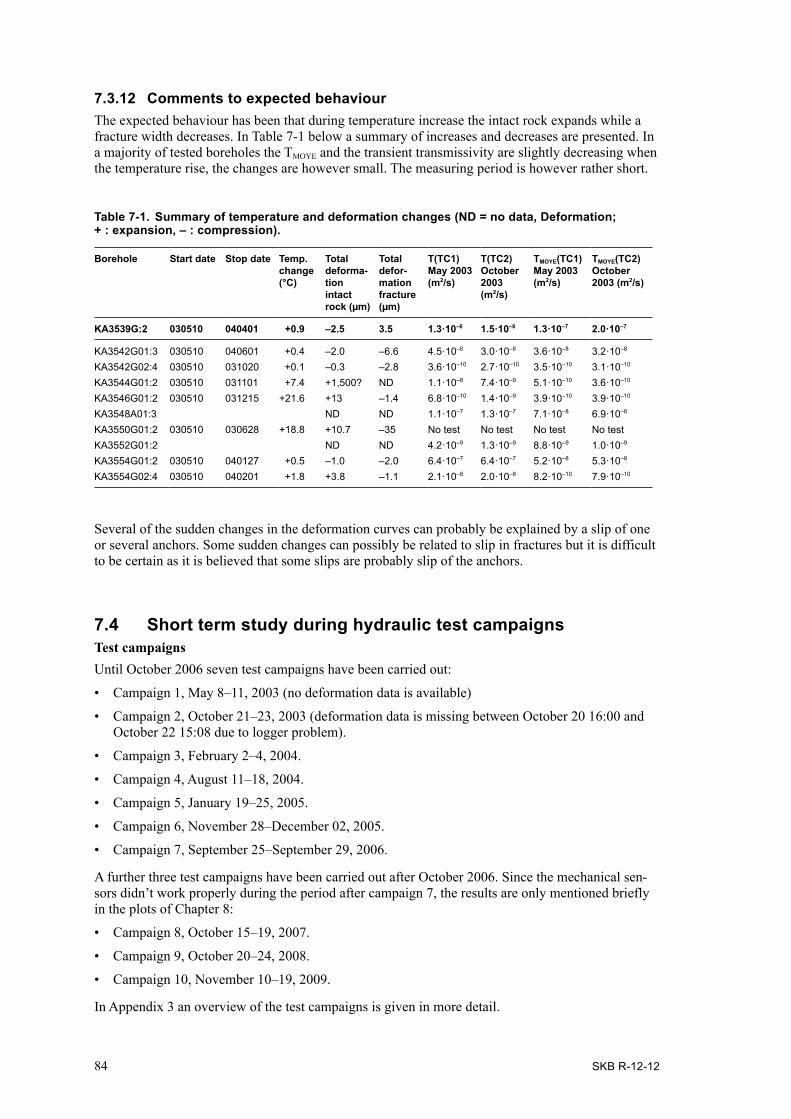
84 SKB R-12-12
7.3.12 Comments to expected behaviourThe expected behaviour has been that during temperature increase the intact rock expands while a fracture width decreases. In Table 7-1 below a summary of increases and decreases are presented. In a majority of tested boreholes the TMOYE and the transient transmissivity are slightly decreasing when the temperature rise, the changes are however small. The measuring period is however rather short.
Table 7-1. Summary of temperature and deformation changes (ND = no data, Deformation; + : expansion, – : compression).
Borehole Start date Stop date Temp. change (°C)
Total deforma-tion intact rock (µm)
Total defor-mation fracture (µm)
T(TC1) May 2003 (m2/s)
T(TC2) October 2003 (m2/s)
TMOYE(TC1) May 2003 (m2/s)
TMOYE(TC2) October 2003 (m2/s)
KA3539G:2 030510 040401 +0.9 –2.5 3.5 1.3·10–6 1.5·10–6 1.3·10–7 2.0·10–7
KA3542G01:3 030510 040601 +0.4 –2.0 –6.6 4.5·10–8 3.0·10–8 3.6·10–8 3.2·10–8
KA3542G02:4 030510 031020 +0.1 –0.3 –2.8 3.6·10–10 2.7·10–10 3.5·10–10 3.1·10–10
KA3544G01:2 030510 031101 +7.4 +1,500? ND 1.1·10–8 7.4·10–9 5.1·10–10 3.6·10–10
KA3546G01:2 030510 031215 +21.6 +13 –1.4 6.8·10–10 1.4·10–9 3.9·10–10 3.9·10–10
KA3548A01:3 ND ND 1.1·10–7 1.3·10–7 7.1·10–8 6.9·10–8
KA3550G01:2 030510 030628 +18.8 +10.7 –35 No test No test No test No testKA3552G01:2 ND ND 4.2·10–9 1.3·10–9 8.8·10–9 1.0·10–9
KA3554G01:2 030510 040127 +0.5 –1.0 –2.0 6.4·10–7 6.4·10–7 5.2·10–8 5.3·10–8
KA3554G02:4 030510 040201 +1.8 +3.8 –1.1 2.1·10–8 2.0·10–8 8.2·10–10 7.9·10–10
Several of the sudden changes in the deformation curves can probably be explained by a slip of one or several anchors. Some sudden changes can possibly be related to slip in fractures but it is difficult to be certain as it is believed that some slips are probably slip of the anchors.
7.4 Short term study during hydraulic test campaignsTest campaignsUntil October 2006 seven test campaigns have been carried out:
• Campaign 1, May 8–11, 2003 (no deformation data is available)
• Campaign 2, October 21–23, 2003 (deformation data is missing between October 20 16:00 and October 22 15:08 due to logger problem).
• Campaign 3, February 2–4, 2004.
• Campaign 4, August 11–18, 2004.
• Campaign 5, January 19–25, 2005.
• Campaign 6, November 28–December 02, 2005.
• Campaign 7, September 25–September 29, 2006.
A further three test campaigns have been carried out after October 2006. Since the mechanical sen-sors didn’t work properly during the period after campaign 7, the results are only mentioned briefly in the plots of Chapter 8:
• Campaign 8, October 15–19, 2007.
• Campaign 9, October 20–24, 2008.
• Campaign 10, November 10–19, 2009.
In Appendix 3 an overview of the test campaigns is given in more detail.

SKB R-12-12 85
Expected behaviourPressure build-up test:
• The fracture is compressed when the water pressure inside the fracture is released (the flow period).
• The intact rock expands when the surrounded pressure is released (the flow period).
• The fracture width will increase when the flow period stops and the water pressure increases during pressure build-up.
• The intact rock is compressed when the flow period stops and the water pressure increases during pressure build-up.
7.4.1 KG0010B01The borehole is not used in the test campaigns.
7.4.2 KA3539G:2Deformation during test campaigns Campaign 1 No data available.
Campaign 2 (October 21–23, 2003) Flow start: October 23 10:15 (winter time correspond to 11:15 in figures).Flow stop: October 23 10:45 (correspond to 11:45 in figures).
• The mechanical response of the pressure build-up test is very clear.
• The behaviour of the fracture is according to the expected behaviour.
• The measurement indicates that the test cause a permanent deformation of the fracture or move-ment of the whole measurement equipment or the outer anchor for Rock+Fracture section.
• The mechanical response is roughly 1.3 µm compression of fracture at a pressure drop of 1,364 kPa.
(Figure 7-71, Figure 7-72).
Figure 7-71. Rock and fracture and intact rock deformation in KA3539G:2 during test campaign 2.
–0.0025
–0.002
–0.0015
–0.001
–0.0005
0KA3539G:2 (camp. 2)
Def
orm
atio
n [m
m]
Oct. 22–Oct. 24 (2003)
Intact rockRock and fracture
14:00 16:00 18:00 20:00 22:00 0:00 2:00 4:00 6:00 8:00 10:00 12:00 14:00 16:00 18:00 20:00 22:00 0:00
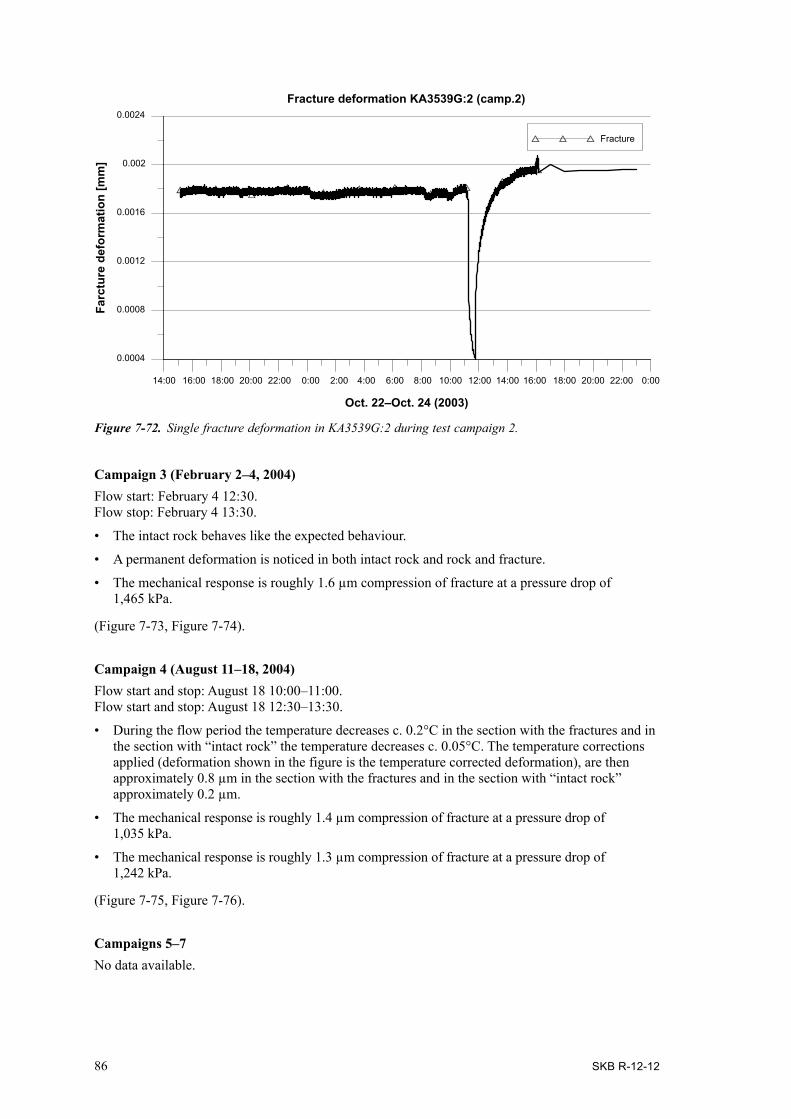
86 SKB R-12-12
Figure 7-72. Single fracture deformation in KA3539G:2 during test campaign 2.
14:00 16:00 18:00 20:00 22:00 0:00 2:00 4:00 6:00 8:00 10:00 12:00 14:00 16:00 18:00 20:00 22:00 0:00
0.0004
0.0008
0.0012
0.0016
0.002
0.0024Fracture deformation KA3539G:2 (camp.2)
Farc
ture
def
orm
atio
n [m
m]
Oct. 22–Oct. 24 (2003)
Fracture
Campaign 3 (February 2–4, 2004) Flow start: February 4 12:30. Flow stop: February 4 13:30.
• The intact rock behaves like the expected behaviour.
• A permanent deformation is noticed in both intact rock and rock and fracture.
• The mechanical response is roughly 1.6 µm compression of fracture at a pressure drop of 1,465 kPa.
(Figure 7-73, Figure 7-74).
Campaign 4 (August 11–18, 2004) Flow start and stop: August 18 10:00–11:00. Flow start and stop: August 18 12:30–13:30.
• During the flow period the temperature decreases c. 0.2°C in the section with the fractures and in the section with “intact rock” the temperature decreases c. 0.05°C. The temperature corrections applied (deformation shown in the figure is the temperature corrected deformation), are then approximately 0.8 µm in the section with the fractures and in the section with “intact rock” approximately 0.2 µm.
• The mechanical response is roughly 1.4 µm compression of fracture at a pressure drop of 1,035 kPa.
• The mechanical response is roughly 1.3 µm compression of fracture at a pressure drop of 1,242 kPa.
(Figure 7-75, Figure 7-76).
Campaigns 5–7No data available.

SKB R-12-12 87
Figure 7-73. Rock and fracture and intact rock deformation in KA3539G:2 during test campaign 3.
Figure 7-74. Single fracture deformation in KA3539G:2 during test campaign 3.
0:00 4:00 8:00 12:00 16:00 20:00 0:00 4:00 8:00 12:00 16:00 20:00 0:00
–0.003
–0.002
–0.001
0
0.001
Def
orm
atio
n [m
m]
KA3539G:2 (camp 3)
February 4–February 6
Intact rockRock and fracture
0:00 4:00 8:00 12:00 16:00 20:00 0:00 4:00 8:00 12:00 16:00 20:00 0:00
0.0008
0.0012
0.0016
0.002
0.0024
0.0028Fracture deformation KA3539G:2 (camp. 3)
Farc
ture
def
orm
atio
n [m
m]
Feb. 4–Feb. 6 (2004)
Fracture
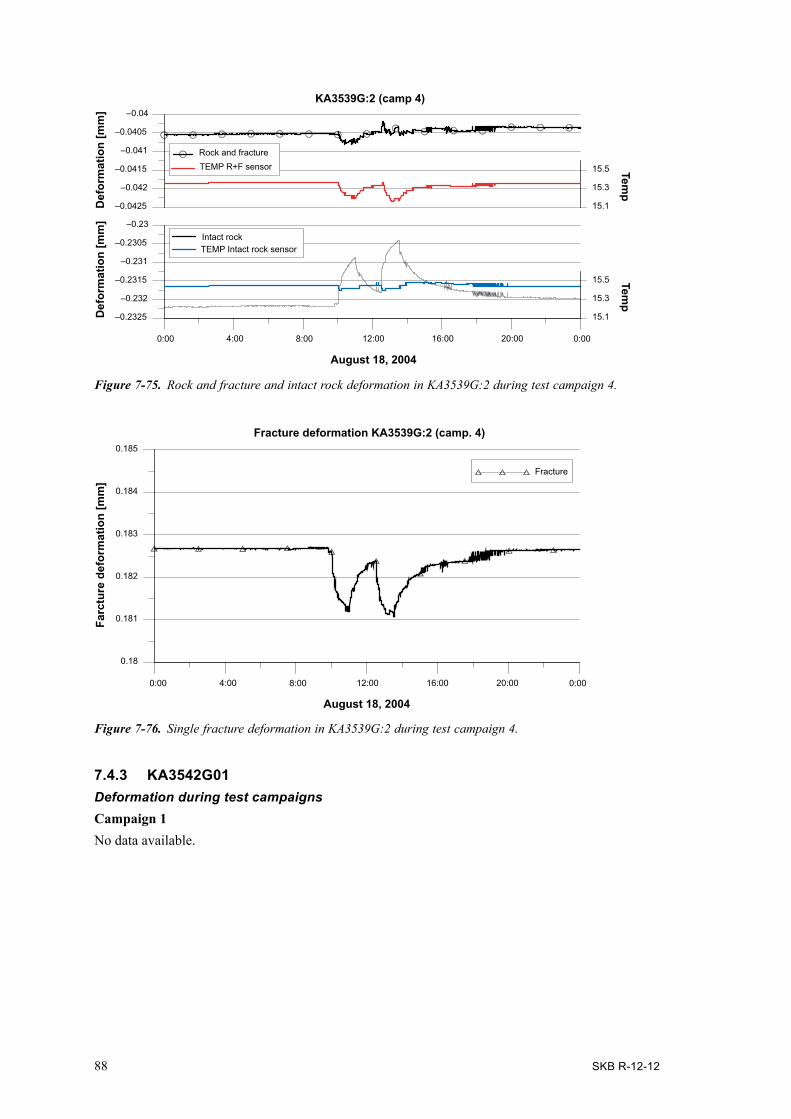
88 SKB R-12-12
Figure 7-75. Rock and fracture and intact rock deformation in KA3539G:2 during test campaign 4.
Figure 7-76. Single fracture deformation in KA3539G:2 during test campaign 4.
0:00 4:00 8:00 12:00 16:00 20:00 0:00
–0.2325
–0.232
–0.2315
–0.231
–0.2305
–0.23
15.1
15.3
15.5
–0.0425
–0.042
–0.0415
–0.041
–0.0405
–0.04
15.1
15.3
15.5
KA3539G:2 (camp 4)D
efor
mat
ion
[mm
]D
efor
mat
ion
[mm
]
August 18, 2004
Temp
Temp
TEMP R+F sensorRock and fracture
TEMP Intact rock sensorIntact rock
0.18
0.181
0.182
0.183
0.184
0.185
Fracture deformation KA3539G:2 (camp. 4)
Farc
ture
def
orm
atio
n [m
m]
August 18, 2004
Fracture
0:00 4:00 8:00 12:00 16:00 20:00 0:00
7.4.3 KA3542G01Deformation during test campaigns Campaign 1No data available.

SKB R-12-12 89
Figure 7-77. Rock and fracture and intact rock deformation in KA3542G01:3 during test campaign 2.
Figure 7-78. Single fracture deformation in KA3542G01:3 during test campaign 2.
14:00 16:00 18:00 20:00 22:00 0:00 2:00 4:00 6:00 8:00 10:00 12:00 14:00 16:00 18:00 20:00 22:00 0:00
–0.04
–0.03
–0.02
–0.01
0
0.01KA3542G01:3 (camp. 2)
Oct. 22–Oct. 24 (2003)
Def
orm
atio
n [m
m]
Rock and fractureIntact rock
14:00 16:00 18:00 20:00 22:00 0:00 2:00 4:00 6:00 8:00 10:00 12:00 14:00 16:00 18:00 20:00 22:00 0:00
–0.04
–0.03
–0.02
–0.01
0Fracture deformation KA3542G01:3 (camp. 2)
Frac
ture
def
orm
atio
n [m
m]
Oct. 22–Oct. 24 (2003)
Fracture
Campaign 2 (October 21–23, 2003) Flow start: October 22 16:45 (winter time correspond to 17:45 in figures).Flow stop: October 22 17:15 (correspond to 18:15 in figures).
• Both intact rock and rock and fracture behave as expected.
• The second dip and peak (19:15–19:45) is the response of the test performed in KA3548A01.
• The fracture deformation during the pressure build-up test is approximately 36 µm compression of fracture at a pressure drop of 3,238 kPa.
• The second pulse generates a pressure drop in KA3542G01:3 of 542 kPa and a fracture deforma-tion approximately 7 µm compression of fracture in magnitude.
(Figure 7-77, Figure 7-78).

90 SKB R-12-12
Figure 7-79. Rock and fracture and intact rock deformation in KA3542G01:3 during test campaign 3.
Figure 7-80. Single fracture deformation in KA3542G01:3 during test campaign 3.
0:00 3:00 6:00 9:00 12:00 15:00 18:00 21:00 0:00 3:00 6:00 9:00 12:00 15:00 18:00 21:00 0:00
–0.04
–0.03
–0.02
–0.01
0
0.01KA3542G01:3 (camp 3)
Def
orm
atio
n [m
m]
February 3–February 5
Rock and fractureIntact rock
Response from test in KA3548A01:3
0:00 3:00 6:00 9:00 12:00 15:00 18:00 21:00 0:00 3:00 6:00 9:00 12:00 15:00 18:00 21:00 0:00
–0.05
–0.04
–0.03
–0.02
–0.01
0
Fracture deformation KA3542G01:3 (camp. 3)
Fracture
Frac
ture
def
orm
atio
n
Feb. 2–Feb. 4 (2004)
Campaign 3 (February 2–4, 2004) Flow start: February 3 13:00. Flow stop: February 3 14:00.
• Both intact rock and rock and fracture behave as expected.
• The second dip and peak (16:00–17:00) is the response of the test performed in KA3548A01:3.
• The fracture deformation during the pressure build-up test is approximately 35 µm compression of fracture at a pressure drop of 3,117 kPa.
• The second pulse generates a pressure drop in KA3542G01:3 of 729 kPa and a fracture deforma-tion approximately 10 µm compression of fracture in magnitude.
(Figure 7-79, Figure 7-80).
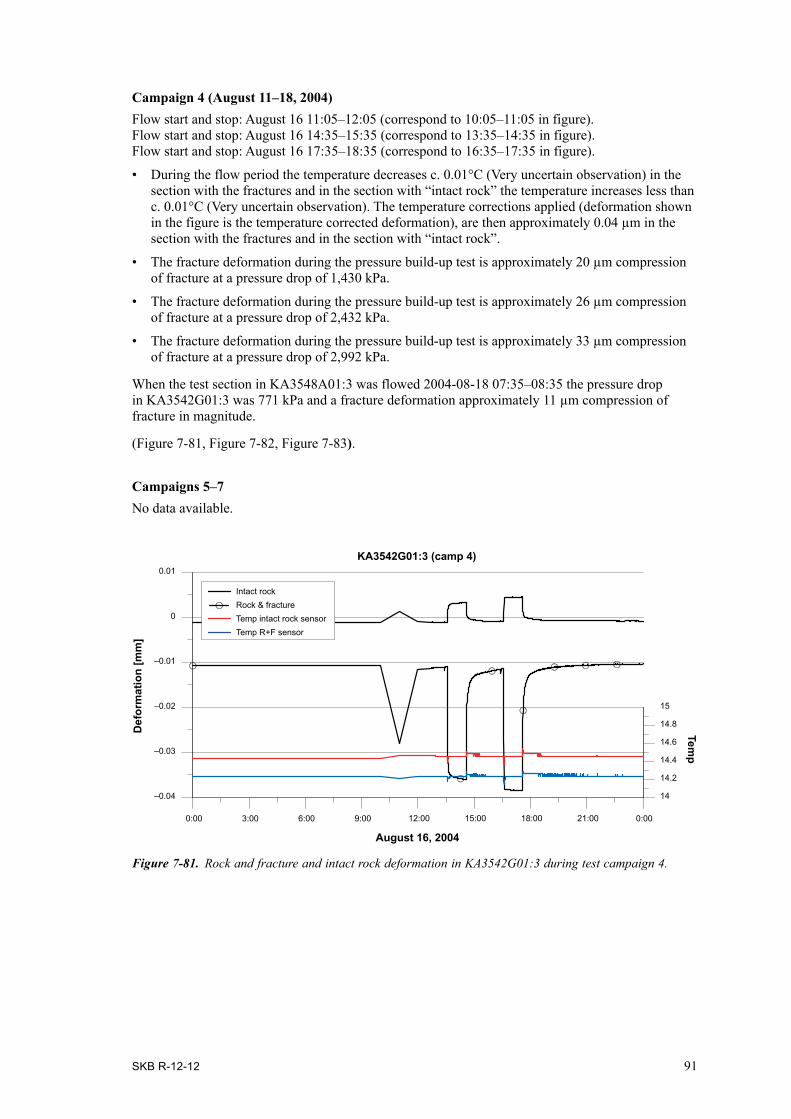
SKB R-12-12 91
Figure 7-81. Rock and fracture and intact rock deformation in KA3542G01:3 during test campaign 4.
0:00 3:00 6:00 9:00 12:00 15:00 18:00 21:00 0:00
–0.04
–0.03
–0.02
–0.01
0
0.01
14
14.2
14.4
14.6
14.8
15
KA3542G01:3 (camp 4)
Def
orm
atio
n [m
m]
August 16, 2004
Temp
Temp R+F sensorTemp intact rock sensorRock & fractureIntact rock
Campaign 4 (August 11–18, 2004) Flow start and stop: August 16 11:05–12:05 (correspond to 10:05–11:05 in figure).Flow start and stop: August 16 14:35–15:35 (correspond to 13:35–14:35 in figure).Flow start and stop: August 16 17:35–18:35 (correspond to 16:35–17:35 in figure).
• During the flow period the temperature decreases c. 0.01°C (Very uncertain observation) in the section with the fractures and in the section with “intact rock” the temperature increases less than c. 0.01°C (Very uncertain observation). The temperature corrections applied (deformation shown in the figure is the temperature corrected deformation), are then approximately 0.04 µm in the section with the fractures and in the section with “intact rock”.
• The fracture deformation during the pressure build-up test is approximately 20 µm compression of fracture at a pressure drop of 1,430 kPa.
• The fracture deformation during the pressure build-up test is approximately 26 µm compression of fracture at a pressure drop of 2,432 kPa.
• The fracture deformation during the pressure build-up test is approximately 33 µm compression of fracture at a pressure drop of 2,992 kPa.
When the test section in KA3548A01:3 was flowed 2004-08-18 07:35–08:35 the pressure drop in KA3542G01:3 was 771 kPa and a fracture deformation approximately 11 µm compression of fracture in magnitude.
(Figure 7-81, Figure 7-82, Figure 7-83).
Campaigns 5–7No data available.
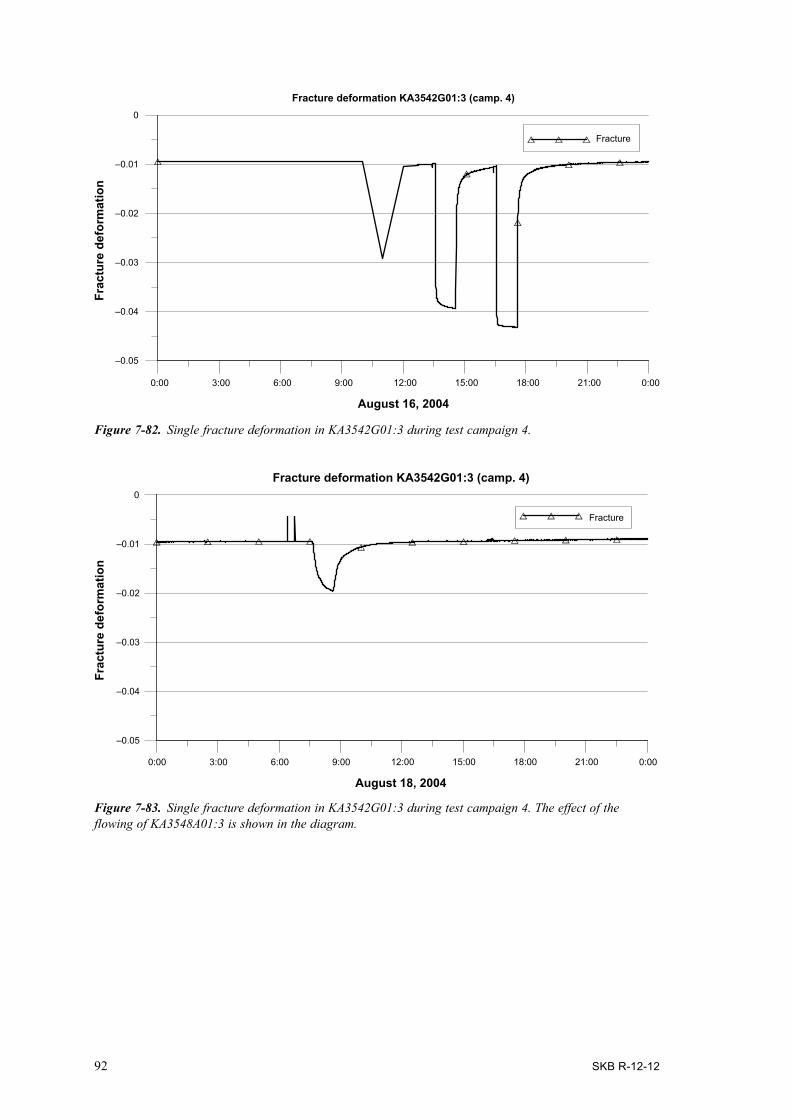
92 SKB R-12-12
Figure 7-82. Single fracture deformation in KA3542G01:3 during test campaign 4.
Figure 7-83. Single fracture deformation in KA3542G01:3 during test campaign 4. The effect of the flowing of KA3548A01:3 is shown in the diagram.
0:00 3:00 6:00 9:00 12:00 15:00 18:00 21:00 0:00
August 16, 2004
–0.05
–0.04
–0.03
–0.02
–0.01
0
Fracture deformation KA3542G01:3 (camp. 4)
Fracture
Frac
ture
def
orm
atio
n
0:00 3:00 6:00 9:00 12:00 15:00 18:00 21:00 0:00
August 18, 2004
–0.05
–0.04
–0.03
–0.02
–0.01
0
Fracture deformation KA3542G01:3 (camp. 4)
Frac
ture
def
orm
atio
n
Fracture
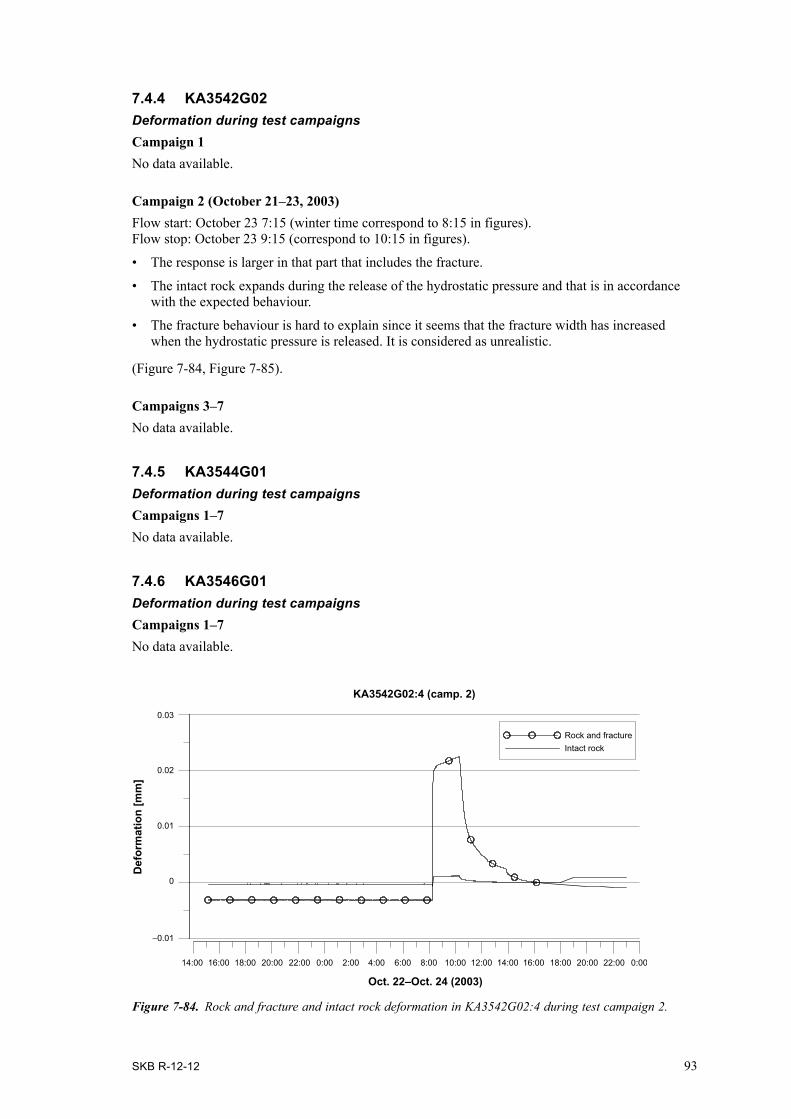
SKB R-12-12 93
Figure 7-84. Rock and fracture and intact rock deformation in KA3542G02:4 during test campaign 2.
7.4.4 KA3542G02Deformation during test campaigns Campaign 1No data available.
Campaign 2 (October 21–23, 2003) Flow start: October 23 7:15 (winter time correspond to 8:15 in figures).Flow stop: October 23 9:15 (correspond to 10:15 in figures).
• The response is larger in that part that includes the fracture.
• The intact rock expands during the release of the hydrostatic pressure and that is in accordance with the expected behaviour.
• The fracture behaviour is hard to explain since it seems that the fracture width has increased when the hydrostatic pressure is released. It is considered as unrealistic.
(Figure 7-84, Figure 7-85).
Campaigns 3–7No data available.
7.4.5 KA3544G01Deformation during test campaignsCampaigns 1–7No data available.
7.4.6 KA3546G01Deformation during test campaignsCampaigns 1–7No data available.
0
Oct. 22–Oct. 24 (2003)
KA3542G02:4 (camp. 2)
Def
orm
atio
n [m
m]
0.03
0.02
0.01
–0.01
14:00 16:00 18:00 20:00 22:00 0:00 2:00 4:00 6:00 8:00 10:00 12:00 14:00 16:00 18:00 20:00 22:00 0:00
Rock and fracture Intact rock

94 SKB R-12-12
7.4.7 KA3548A01Deformation during test campaigns Campaign 1No data available. Campaign 2 (October 21–23, 2003) Flow start: October 22 18:15 (winter time correspond to 19:15 in figures).Flow stop: October 22 18:45 (correspond to 19:45 in figures).
• The behaviour of the rock and fracture deformation curve during the pressure build-up tests is unstable and is hard to evaluate.
(Figure 7-86, Figure 7-87).
Campaign 3 (February 2–4, 2004)Flow start: February 3 16:00. Flow stop: February 3 17:00.
• The behaviour of the rock and fracture deformation curve during the pressure build-up tests is unstable and is hard to evaluate.
Campaign 4–7No data available.
7.4.8 KA3550G01Deformation during test campaignsCampaigns 1–7No data available.
0
Oct. 22–Oct. 24 (2003)
14:00 16:00 18:00 20:00 22:00 0:00 2:00 4:00 6:00 8:00 10:00 12:00 14:00 16:00 18:00 20:00 22:00 0:00
Fracture deformation KA3542G02:4 (camp. 2)Fr
actu
re d
efor
mat
ion
[mm
]
0.025
0.02
0.015
0.01
0.005
-0.005
Fracture
Figure 7-85. Single fracture deformation in KA3542G02:4 during test campaign 2.
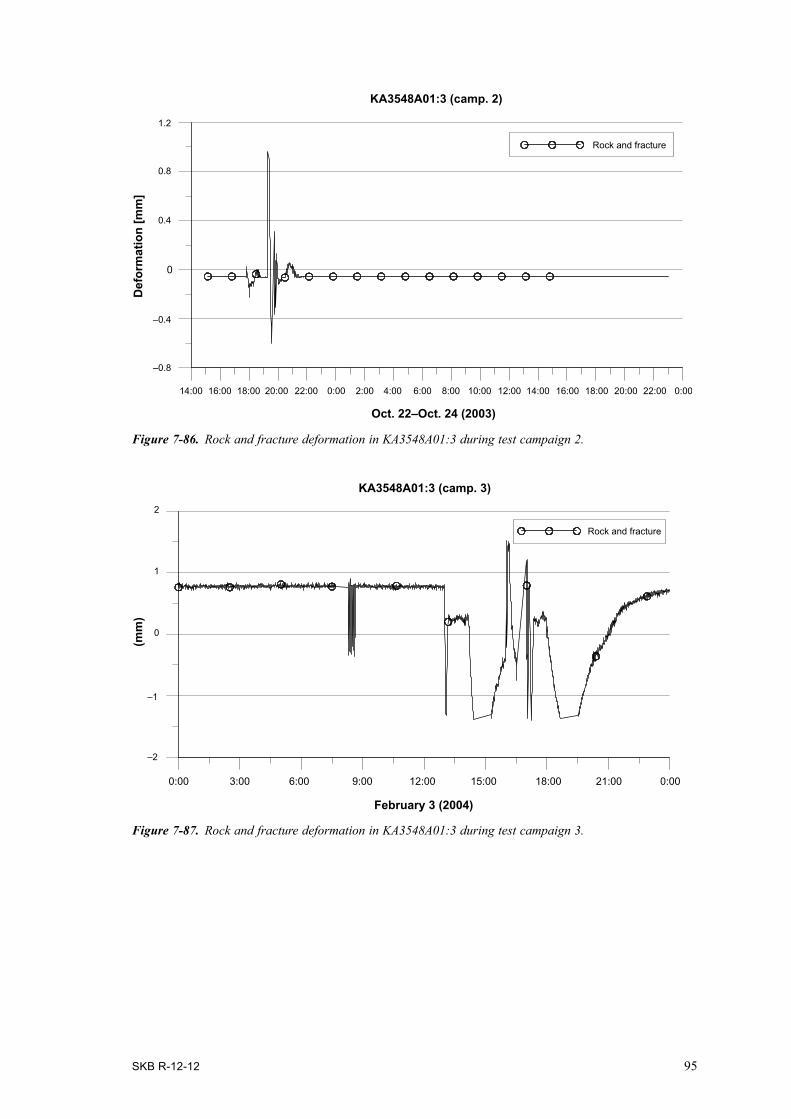
SKB R-12-12 95
Figure 7-86. Rock and fracture deformation in KA3548A01:3 during test campaign 2.
Figure 7-87. Rock and fracture deformation in KA3548A01:3 during test campaign 3.
Oct. 22–Oct. 24 (2003)
0
14:00 16:00 18:00 20:00 22:00 0:00 2:00 4:00 6:00 8:00 10:00 12:00 14:00 16:00 18:00 20:00 22:00 0:00
Def
orm
atio
n [m
m]
1.2
0.8
0.4
–0.4
–0.8
Rock and fracture
KA3548A01:3 (camp. 2)
0
1
2
KA3548A01:3 (camp. 3)
Rock and fracture
(mm
)
–1
–2
February 3 (2004)
0:00 3:00 6:00 9:00 12:00 15:00 18:00 21:00 0:00

96 SKB R-12-12
7.4.9 KA3552G01Deformation during test campaignsCampaigns 1–7No data available.
7.4.10 KA3554G01Deformation during test campaignsCampaigns 1–2No data available.
Campaign 3 (February 2–4, 2004) Flow start: February 2 17:30.Flow stop: February 2 19:30.
• During the pressure build-up test the fracture behave as expected with compression after the hydrostatic pressure is released.
• The fracture deformation during the pressure build-up test is approximately 33 µm compression of fracture at a pressure drop of 3,159 kPa.
• A permanent deformation of 2 µm compression of fracture remains after the pressure build-up test.
(Figure 7-88, Figure 7-89).
Campaign 4 (August 11–18, 2004) Flow start and stop: August 17 08:50–10:50 (correspond to 07:50–09:50 in figure).Flow start and stop: August 17 13:10–15:10 (correspond to 12:10–14:10 in figure).Flow start and stop: August 17 16:10–18:10 (correspond to 15:10–17:10 in figure).
• During the flow period the temperature is more or less constant in the section with the fractures and in the section with “intact rock” the temperature decreases more or less linearly c. 0.25°C during the test period. (The decrease related to the stop of the heaters, 2004-11-01 to 2004-12-06?) The temperature corrections applied (deformation shown in the figure is the temperature corrected deformation), for a single test are then approximately 0 µm in the section with the fractures and in the section with “intact rock” approximately 0.4 µm during a single test.
• For some reason the fracture width does not decrease after the flow stops at 18:10. It remains “open” for approximately an hour until its “closes”. Since the hydrostatic pressure in the section recovers following a normal pattern it is probably due to some kind of equipment problem. It is not re-observed during TC 5 or TC 6.
• The fracture deformation during the pressure build-up test is approximately 11 µm compression of fracture at a pressure drop of 1,282 kPa.
• The fracture deformation during the pressure build-up test is approximately 22 µm compression of fracture at a pressure drop of 2,095 kPa.
• The fracture deformation during the pressure build-up test is approximately 33 µm compression of fracture at a pressure drop of 3,072 kPa.
(Figure 7-90, Figure 7-91).
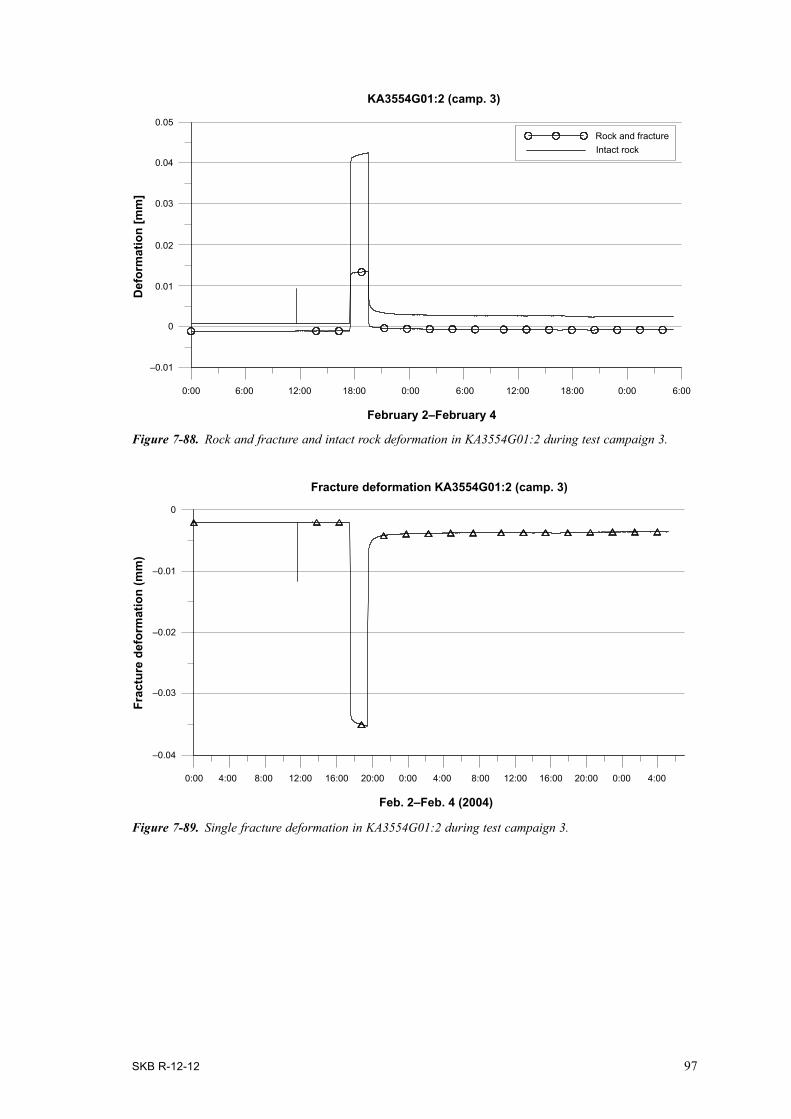
SKB R-12-12 97
Figure 7-88. Rock and fracture and intact rock deformation in KA3554G01:2 during test campaign 3.
Figure 7-89. Single fracture deformation in KA3554G01:2 during test campaign 3.
0
Intact rockRock and fracture
KA3554G01:2 (camp. 3)
0.05
0.04
0.03
0.02
0.01
–0.01
Def
orm
atio
n [m
m]
0:00 6:00 12:00 18:00 0:00 6:00 12:00 18:00 6:000:00
February 2–February 4
0
Feb. 2–Feb. 4 (2004)
Frac
ture
def
orm
atio
n (m
m)
–0.01
–0.02
–0.03
–0.04
0:00 4:00 8:00 12:00 16:00 20:00 0:00 4:00 8:00 12:00 16:00 20:00 0:00 4:00
Fracture deformation KA3554G01:2 (camp. 3)

98 SKB R-12-12
Figure 7-90. Rock and fracture and intact rock deformation in KA3554G01:2 during test campaign 4.
0
14
14.25
14.5
14.75
15
15.25
15.5
August 17, 2004
KA3554G01:2 (camp. 4)D
efor
mat
ion
[mm
]
0:00 6:00 12:00 18:00 0:00
Temp
0.04
0.02
–0.02
–0.04
–0.06
–0.08
Rock and fractureIntact rockTemp R+F sensorTemp intact rock sensor
Figure 7-91. Single fracture deformation in KA3554G01:2 during test campaign 4.
0:00 4:00 8:00 12:00 16:00 20:00 0:00
0.03
0.04
August 17, 2004
Fracture deformation KA3554G01:2 (camp. 4)
Frac
ture
def
orm
atio
n (m
m)
0.08
0.07
0.06
0.05
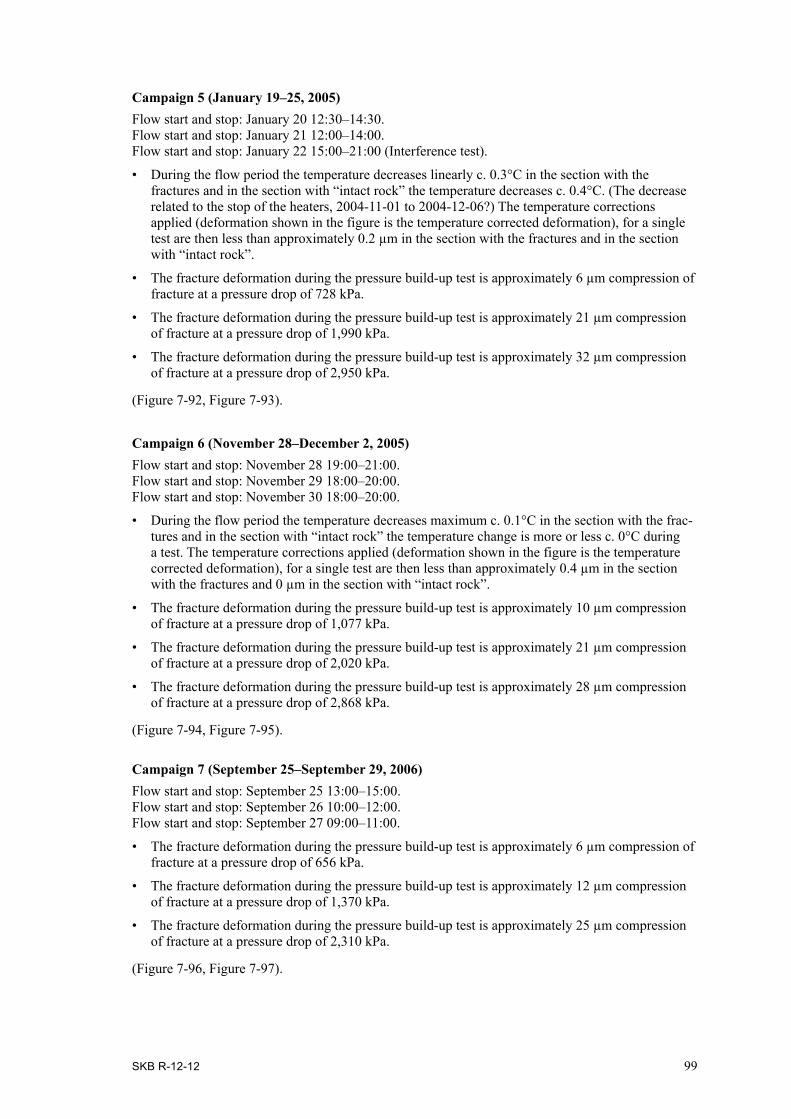
SKB R-12-12 99
Campaign 5 (January 19–25, 2005) Flow start and stop: January 20 12:30–14:30.Flow start and stop: January 21 12:00–14:00.Flow start and stop: January 22 15:00–21:00 (Interference test).
• During the flow period the temperature decreases linearly c. 0.3°C in the section with the fractures and in the section with “intact rock” the temperature decreases c. 0.4°C. (The decrease related to the stop of the heaters, 2004-11-01 to 2004-12-06?) The temperature corrections applied (deformation shown in the figure is the temperature corrected deformation), for a single test are then less than approximately 0.2 µm in the section with the fractures and in the section with “intact rock”.
• The fracture deformation during the pressure build-up test is approximately 6 µm compression of fracture at a pressure drop of 728 kPa.
• The fracture deformation during the pressure build-up test is approximately 21 µm compression of fracture at a pressure drop of 1,990 kPa.
• The fracture deformation during the pressure build-up test is approximately 32 µm compression of fracture at a pressure drop of 2,950 kPa.
(Figure 7-92, Figure 7-93).
Campaign 6 (November 28–December 2, 2005) Flow start and stop: November 28 19:00–21:00.Flow start and stop: November 29 18:00–20:00.Flow start and stop: November 30 18:00–20:00.
• During the flow period the temperature decreases maximum c. 0.1°C in the section with the frac-tures and in the section with “intact rock” the temperature change is more or less c. 0°C during a test. The temperature corrections applied (deformation shown in the figure is the temperature corrected deformation), for a single test are then less than approximately 0.4 µm in the section with the fractures and 0 µm in the section with “intact rock”.
• The fracture deformation during the pressure build-up test is approximately 10 µm compression of fracture at a pressure drop of 1,077 kPa.
• The fracture deformation during the pressure build-up test is approximately 21 µm compression of fracture at a pressure drop of 2,020 kPa.
• The fracture deformation during the pressure build-up test is approximately 28 µm compression of fracture at a pressure drop of 2,868 kPa.
(Figure 7-94, Figure 7-95).
Campaign 7 (September 25–September 29, 2006) Flow start and stop: September 25 13:00–15:00.Flow start and stop: September 26 10:00–12:00.Flow start and stop: September 27 09:00–11:00.
• The fracture deformation during the pressure build-up test is approximately 6 µm compression of fracture at a pressure drop of 656 kPa.
• The fracture deformation during the pressure build-up test is approximately 12 µm compression of fracture at a pressure drop of 1,370 kPa.
• The fracture deformation during the pressure build-up test is approximately 25 µm compression of fracture at a pressure drop of 2,310 kPa.
(Figure 7-96, Figure 7-97).
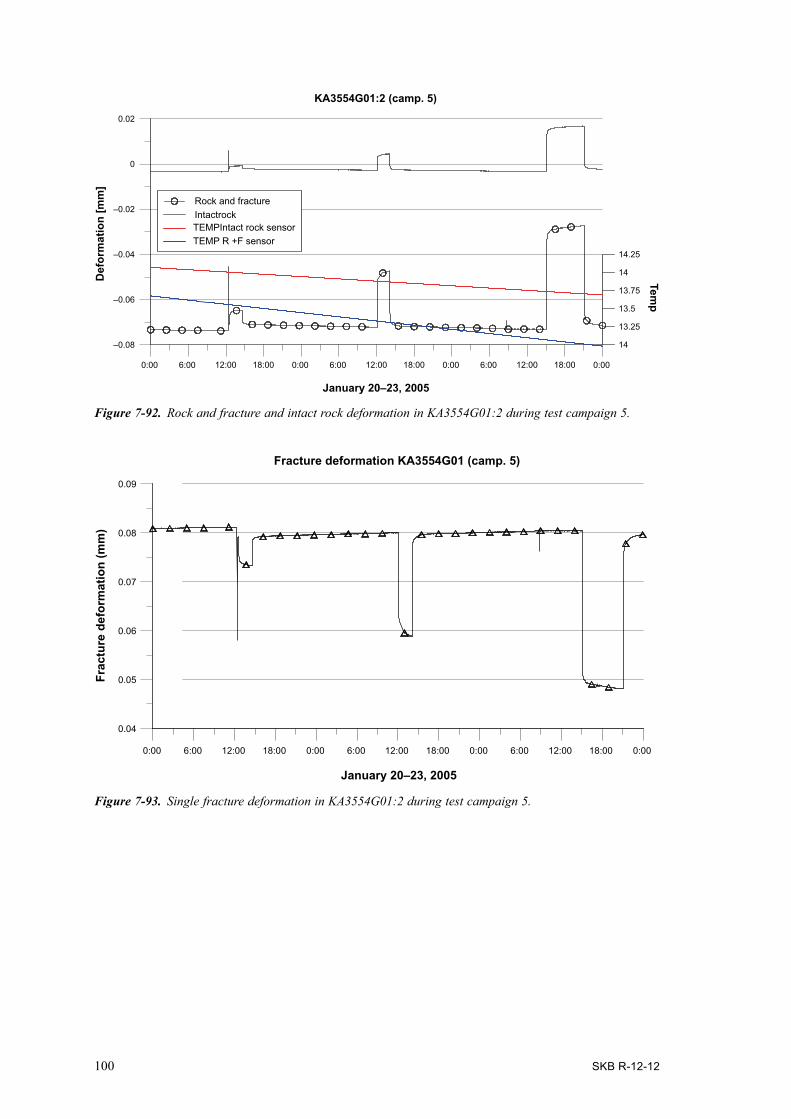
100 SKB R-12-12
Figure 7-92. Rock and fracture and intact rock deformation in KA3554G01:2 during test campaign 5.
Figure 7-93. Single fracture deformation in KA3554G01:2 during test campaign 5.
0:00 6:00 12:00 18:00 0:00 6:00 12:00 18:00 0:00 6:00 12:00 18:00 0:00
–0.08
–0.06
–0.04
–0.02
0
0.02
14
13.25
13.5
13.75
14
14.25
January 20–23, 2005
KA3554G01:2 (camp. 5)
Temp
Rock and fracture Intactrock TEMPIntact rock sensorTEMP R +F sensor
Def
orm
atio
n [m
m]
0:00 6:00 12:00 18:00 0:00 6:00 12:00 18:00 0:00 6:00 12:00 18:00 0:00
0.04
0.05
0.06
0.07
0.08
0.09
Frac
ture
def
orm
atio
n (m
m)
Fracture deformation KA3554G01 (camp. 5)
January 20–23, 2005
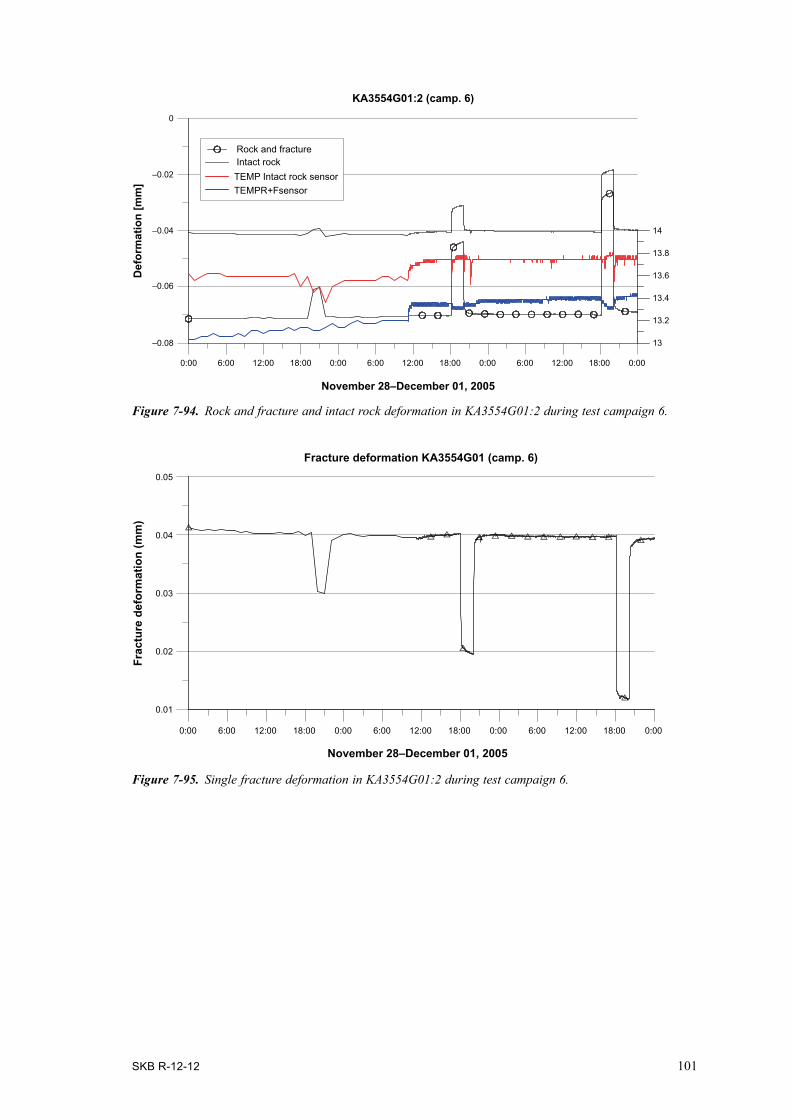
SKB R-12-12 101
Figure 7-94. Rock and fracture and intact rock deformation in KA3554G01:2 during test campaign 6.
Figure 7-95. Single fracture deformation in KA3554G01:2 during test campaign 6.
–0.02
0
13
13.2
13.4
13.6
13.8
14
0:00 6:00 12:00 18:00 0:00 6:00 12:00 18:00 0:00 6:00 12:00 18:00 0:00
November 28–December 01, 2005
KA3554G01:2 (camp. 6)
–0.04
–0.06
–0.08
Def
orm
atio
n [m
m]
Rock and fractureIntact rockTEMP Intact rock sensor TEMPR+Fsensor
0.01
0.02
0.03
0.04
0.05
Fracture deformation KA3554G01 (camp. 6)
Frac
ture
def
orm
atio
n (m
m)
November 28–December 01, 2005
0:00 6:00 12:00 18:00 0:00 6:00 12:00 18:00 0:00 6:00 12:00 18:00 0:00

102 SKB R-12-12
Figure 7-97. Single fracture deformation in KA3554G01:2 during test campaign 7.
0:00 6:00 12:00 18:00 0:00 6:00 12:00 18:00 0:00 6:00 12:00 18:00 0:00
0.04
0.05
0.06
0.07
0.08
September 25–September 28, 2006
Frac
ture
def
orm
atio
n (m
m)
Fracture deformation KA3554G01 (camp. 7)
Figure 7-96. Rock and fracture and intact rock deformation in KA3554G01:2 during test campaign 7.
0:00 6:00 12:00 18:00 0:00 6:00 12:00 18:00 0:00 6:00 12:00 18:00 0:00
–0.08
–0.06
–0.04
–0.02
0
0.02
September 25–September 28, 2006
Def
orm
atio
n [m
m]
KA3554G01 (camp. 7)
Rock and fractureIntact rock

SKB R-12-12 103
Figure 7-98. Rock and fracture and intact rock deformation in KA3554G02:4 during test campaign 3.
0:00 4:00 8:00 12:00 16:00 20:00 0:00 4:00 8:00 12:00 16:00 20:00 0:00 4:00
0.002
0.004
0.006
0.008
0.01
February 2–February 4
Def
orm
atio
n [m
m]
KA3554G02:4 (camp. 3)
Intact rockRock and fracture
7.4.11 KA3554G02Deformation during test campaignsCampaigns 1–2No data available.
Campaign 3 (February 2–4, 2004) Flow start: February 2 14:30.Flow stop: February 2 16:30.
• A momentary expansion of the fracture followed by a period of both decreasing and increasing width. It is difficult to explain the behaviour.
(Figure 7-98, Figure 7-99).
Campaign 4 (August 11–18, 2004) Flow start and stop: August 12 14:10–16:10 Flow start and stop: August 12 17:10–19:10
• The fracture behaviour is hard to explain since it seems that the fracture width has increased when the hydrostatic pressure is released. It is considered as unrealistic.
(Figure 7-100, Figure 7-101).
Campaign 5–7No data available.

104 SKB R-12-12
Figure 7-99. Single fracture deformation in KA3554G02:4 during test campaign 3.
–0.001
0
0.001
0.002
Feb. 2–Feb. 4 (2004)
Frac
ture
def
orm
atio
n (m
m)
Fracture
Fracture deformation KA3554G02:4 (camp. 3)
0:00 4:00 8:00 12:00 16:00 20:00 0:00 4:00 8:00 12:00 16:00 20:00 0:00 4:00
–0.002
Figure 7-100. Rock and fracture and intact rock deformation in KA3554G02:4 during test campaign 4.
0:00 4:00 8:00 12:00 16:00 20:00 0:00
0.006
0.008
0.01
0.012
0.014
0.016
KA3554G02:4 (camp. 4)
Rock and Fracture Intact Rock
Def
orm
atio
n [m
m]
August 12, 2004

SKB R-12-12 105
Figure 7-101. Single fracture deformation in KA3554G02:4 during test campaign 4.
–0.002
–0.001
0
0.001
0.002
0:00 4:00 8:00 12:00 16:00 20:00 0:00
August 12, 2004
Frac
ture
def
orm
atio
n (m
m)
Fracture
Fracture deformation KA3554G02:4 (camp. 4)
7.5 Summary of measurements and comments to expected behaviour
A summary of the hydromechanical measurements (July 2009) is done in the table below. Dates for the hydraulic measurement campaigns were presented in Chapter 2.
Out of 22 temperature sensors within the hydromechanical equipment only 13 are still working 2006-10-01.
By 2010-01-01 only 4 out of the 22 temperature sensors were working and of the HM sensors only the rock and fracture sensor in KA3542G02:4 was in operation.
Table 7-2. Status of the long-term measurements 2009-07-01. An OK means that it has been possible to evaluate the measurement data. To evaluate the fracture properties it is necessary to have good data from both the intact rock and the rock and fracture sensor.
Borehole Intact rock sensor
Rock and fracture sensor
Fracture def. calc.
Comments
KG0010B01 – – The temperature is affected of the air temperature in the tunnel. The borehole is a reference hole for undisturbed conditions (i.e. undisturbed by the heaters). The rock and fracture deformation is not evaluated. Measurements failed 2006-09-30.
KA3539G:2 – – The rock and fracture measurements failed in February 2005 and the intact rock sensor in mid-2008.
KA3542G01:3 – – The rock and fracture measurements failed in February 2005.
KA3542G02:4 – OK The rock measurements failed in February 2005 and only one sensor operates October 2006.
KA3544G01:2 – – The rock and fracture measurements failed in November 2003.
KA3546G01:2 – – The rock and fracture measurements failed in November 2003.
KA3548A01:3 – – The rock and fracture measurements failed in November 2003.
KA3550G01:2 – – Expansion of intact rock observed. The “rock and fracture”-sensor failed at July 2003. The “intact rock”-sensor failed in January 2004.
KA3552G01:2 – – The temperature data is replaced with data from KA3550G01:2. Both sensors failed in September 2003.
KA3554G01:2 – – The rock and fracture measurements failed in October 2006.
KA3554G02:4 – – The rock and fracture measurements failed in February 2005.

106 S
KB
R-12-12
Table 7-3. Summary of the maximum fracture deformation during pressure build-up test (Test campaigns 2–4).
Borehole Camp. 2 ΔP [kPa]
Δδ [mm] Camp. 3 ΔP [kPa]
Δδ [μm] Camp. 4a ΔP [kPa]
Δδ [μm] Camp. 4b ΔP [kPa]
Δδ [μm] Camp. 4c ΔP [kPa]
Δδ [μm] Comments
KA3539G:2 1,364 –1.3 1,465 –1.6 1,035 –1.4 1,242 –1.3 – –
KA3542G01:3 3,238 –36 3,117 –35 1,430 –20? 2,432 –26 2,992 –33 This section is influenced by the flowing of KA3548A01:3.Flowing of
KA3548A01:3542 –7 729 –10 771 –11 – – – –
KA3542G02:2 1,849 +25? – – – – – – – – The fracture width increases which is unrealistic!?
KA3544G01:2 – – – – – – – – – – Logger problem during camp. 2. The inner sensor failed in mid August (camp. 3).
KA3546G01:2 – – – – – – – – – – Logger problem during camp. 2. The outer sensor failed in February 2004.
KA3548A01:3 – – – – – – – – – – Bad data quality.
KA3550G01:2 – – – – – – – – – – Failure of packer system.
KA3552G01:2 – – – – – – – – – – Failure of sensors in Sept 2003.
KA3554G01:2 – – 3,159 –33 1,282 –11 2,095 –22 3,072 –33 Good test series.
KA3554G02:4 – – 2,032 +0.4 1,017 +0.5 1,908 +0.8 – – The fracture width increases which is unrealistic!?
Table 7-4. Summary of the maximum fracture deformation during pressure build-up test (Test campaigns 5–6).Borehole Camp. 5a
ΔP [kPa]Δδ [μm] Camp. 5b
ΔP [kPa]Δδ [μm] Camp. 5c
ΔP [kPa]Δδ [μm] Camp. 6a
ΔP [kPa]Δδ [μm] Camp. 6b
ΔP [kPa]Δδ [μm] Camp. 6c
ΔP [kPa]Δδ [μm] Comments
KA3539G:2 – – ––––––––
1,990–
– – – – – – – – –KA3542G01:3 – – – – – – – – – – –KA3542G02:2 – – – – – – – – – – –KA3544G01:2 – – – – – – – – – – –KA3546G01:2 – – – – – – – – – – –KA3548A01:3 – – – – – – – – – – –KA3550G01:2 – – – – – – – – – – –KA3552G01:2 – – – – – – – – – – –KA3554G01:2 728 –6 –21 2,950 –32 1,077 –10 2,020 –21 2,868 –28 Good tests.KA3554G02:4 – – – – – – – – – – –
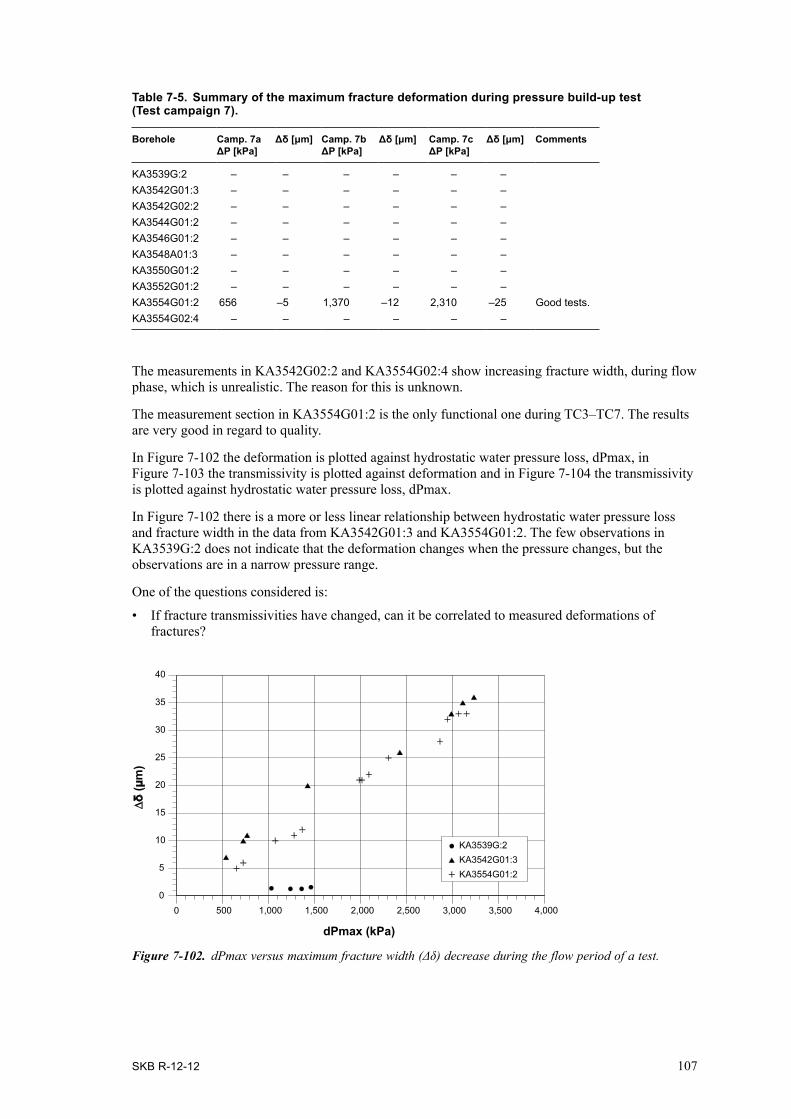
SKB R-12-12 107
Table 7-5. Summary of the maximum fracture deformation during pressure build-up test (Test campaign 7).
Borehole Camp. 7a ΔP [kPa]
Δδ [μm] Camp. 7b ΔP [kPa]
Δδ [μm] Camp. 7c ΔP [kPa]
Δδ [μm] Comments
KA3539G:2 – – – – – –KA3542G01:3 – – – – – –KA3542G02:2 – – – – – –KA3544G01:2 – – – – – –KA3546G01:2 – – – – – –KA3548A01:3 – – – – – –KA3550G01:2 – – – – – –KA3552G01:2 – – – – – –KA3554G01:2 656 –5 1,370 –12 2,310 –25 Good tests.KA3554G02:4 – – – – – –
The measurements in KA3542G02:2 and KA3554G02:4 show increasing fracture width, during flow phase, which is unrealistic. The reason for this is unknown.
The measurement section in KA3554G01:2 is the only functional one during TC3–TC7. The results are very good in regard to quality.
In Figure 7-102 the deformation is plotted against hydrostatic water pressure loss, dPmax, in Figure 7-103 the transmissivity is plotted against deformation and in Figure 7-104 the transmissivity is plotted against hydrostatic water pressure loss, dPmax.
In Figure 7-102 there is a more or less linear relationship between hydrostatic water pressure loss and fracture width in the data from KA3542G01:3 and KA3554G01:2. The few observations in KA3539G:2 does not indicate that the deformation changes when the pressure changes, but the observations are in a narrow pressure range.
One of the questions considered is:
• If fracture transmissivities have changed, can it be correlated to measured deformations of fractures?
Figure 7-102. dPmax versus maximum fracture width (Δδ) decrease during the flow period of a test.
0 500 1,000 1,500 2,000 2,500 3,000 3,500 4,0000
5
10
15
20
25
30
35
40
∆δ (µ
m)
dPmax (kPa)
KA3539G:2KA3542G01:3KA3554G01:2

108 SKB R-12-12
The Figure 7-103 show that there is a correlation as expected between the fracture width change and transmissivity but the deformations are small and the transmissivity changes are small. At the depth that the experiments were performed one can expect that all fractures are under a high stress from the outset and a stress increase due to temperature load or decrease in water pressure should just cause small deformations of the fractures. Figure 7-104 shows also that the transmissivity change is small for the applied water pressure changes.
0 500 1,000 1,500 2,000 2,500 3,000 3,500–8
–7
–6
Log1
0 T
(m2 /s
)
dPmax (kPa)
KA3542G01:3 TC4KA3554G01:2TC4KA3554G01:2 TC5 KA3554G01:2TC6 KA3554G01:2TC7
Figure 7-103. Maximum change in fracture width (Δδ) during flowing of section versus corresponding T (data from test campaigns 4, 5, 6 and 7).
Figure 7-104. dPmax during flowing of section versus corresponding T (data from test campaigns 4, 5, 6 and 7).
0 10 20 30 40 50–8
–7
–6
Log1
0 T
(m2 /s
)
∆δ (µm)
KA3542G01:3 TC4 KA3554G01:2TC4 KA3554G01:2TC5KA3554G01:2TC6KA3554G01:2TC7
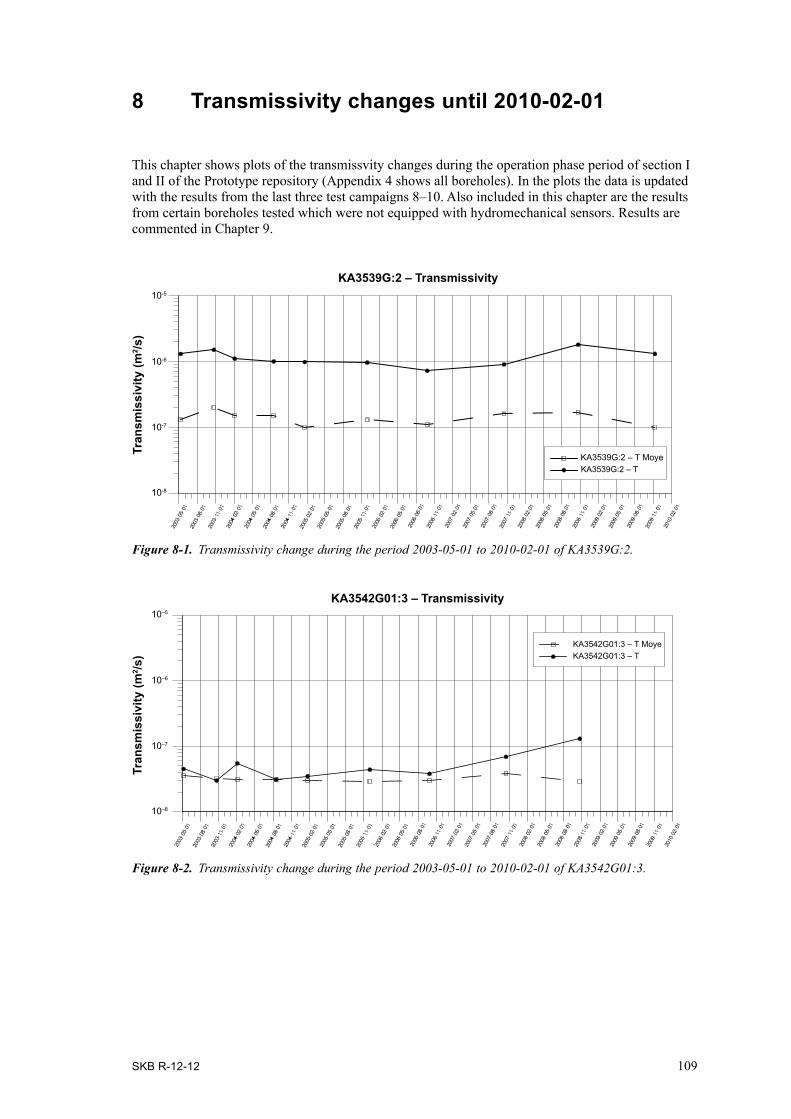
SKB R-12-12 109
8 Transmissivity changes until 2010-02-01
This chapter shows plots of the transmissvity changes during the operation phase period of section I and II of the Prototype repository (Appendix 4 shows all boreholes). In the plots the data is updated with the results from the last three test campaigns 8–10. Also included in this chapter are the results from certain boreholes tested which were not equipped with hydromechanical sensors. Results are commented in Chapter 9.
Tran
smis
sivi
ty (m
2 /s)
KA3539G:2 – Transmissivity10-5
10-6
10-7
10-8
KA3539G:2 – T MoyeKA3539G:2 – T
KA3542G01:3 – Transmissivity
Tran
smis
sivi
ty (m
2 /s)
10–5
10–6
10–7
10–8
KA3542G01:3 – T MoyeKA3542G01:3 – T
Figure 8-1. Transmissivity change during the period 2003-05-01 to 2010-02-01 of KA3539G:2.
Figure 8-2. Transmissivity change during the period 2003-05-01 to 2010-02-01 of KA3542G01:3.

110 SKB R-12-12
KA3546G01:2 – Transmissivity
Tran
smis
sivi
ty (m
2 /s)
10–8
10–9
10–10
10–11
KA3546G01:2 – T MoyeKA3546G01:2 – T
KA3548A01:3 – Transmissivity
Tran
smis
sivi
ty (m
2 /s)
10–6
10–7
10–8
10–9
KA3548A01:3 – T MoyeKA3548A01:3 – T
Figure 8-3. Transmissivity change during the period 2003-05-01 to 2010-02-01 of KA3542G02:2.
Figure 8-4. Transmissivity change during the period 2003-05-01 to 2010-02-01 of KA3546G01:2.
Figure 8-5. Transmissivity change during the period 2003-05-01 to 2010-02-01 of KA3548A01:3.
Tran
smis
sivi
ty (m
2 /s)
10–7
10–8
10–7
10–8
KA3542G02:2 – Transmissivity
KA3542G02:2 – T MoyeKA3542G02:2 – T

SKB R-12-12 111
Figure 8-8. Transmissivity change during the period 2003-05-01 to 2010-02-01 of KA3554G02:4.
Figure 8-6. Transmissivity change during the period 2003-05-01 to 2010-02-01 of KA3552G01:2.
Figure 8-7. Transmissivity change during the period 2003-05-01 to 2010-02-01 of KA3554G01:3.
KA3552G01:2 – Transmissivity
Tran
smis
sivi
ty (m
2 /s)
10–7
10–8
10–9
10–10
KA3552G01:2 – T MoyeKA3552G01:2 – T
KA3554G01:2 – Transmissivity
Tran
smis
sivi
ty (m
2 /s)
10–5
10–6
10–7
10–8
KA3554G01:2 – T MoyeKA3554G01:2 – T
KA3554G02:4 – Transmissivity
Tran
smis
sivi
ty (m
2 /s)
10–7
10–8
10–9
10–10
KA3554G02:4 – T MoyeKA3554G02:4 – T

112 SKB R-12-12
Figure 8-9. Transmissivity change during the period 2003-05-01 to 2010-02-01 of KA3563G:4.
Figure 8-10. Transmissivity change during the period 2003-05-01 to 2010-02-01 of KA3566G01:2.
Figure 8-11. Transmissivity change during the period 2003-05-01 to 2010-02-01 of KA3572G01:2.
KA3566G01:2 – Transmissivity
Tran
smis
sivi
ty (m
2 /s)
10–8
10–9
10–10
10–11
KA3566G01:2 – T MoyeKA3566G01 – T
KA3572G01:2 – Transmissivity
Tran
smis
sivi
ty (m
2 /s)
10–7
10–8
10–9
10–10
KA3572G01:2 – T MoyeKA3572G01:2 – T
KA3563G:4 – TransmissivityTr
ansm
issi
vity
(m2 /s
)10–6
10–7
10–8
10–9
KA3563G:4 – T MoyeKA3563G:4 – T

SKB R-12-12 113
Figure 8-12. Transmissivity change during the period 2003-05-01 to 2010-02-01 of KA3542G02:5.
Figure 8-13. Transmissivity change during the period 2003-05-01 to 2010-02-01 of KA3592G02:1.
Figure 8-14. Transmissivity change during the period 2003-05-01 to 2010-02-01 of KG0021A01:3.
KA3542G02:5 – Transmissivity
Tran
smis
sivi
ty (m
2 /s)
10–7
10–8
10–9
10–10
KA3542G02:5 – T Moye KA3542G02:5 – T
KA3590G02:1 – Transmissivity
Tran
smis
sivi
ty (m
2 /s)
10–6
10–7
10–8
10–9
KA3590G02:1 – T MoyeKA3590G02:1 – T
KG0021A01:3 – Transmissivity
Tran
smis
sivi
ty (m
2 /s)
10–6
10–7
10–8
10–9
KG0021A01:3 – T MoyeKG0021A01:3 – T
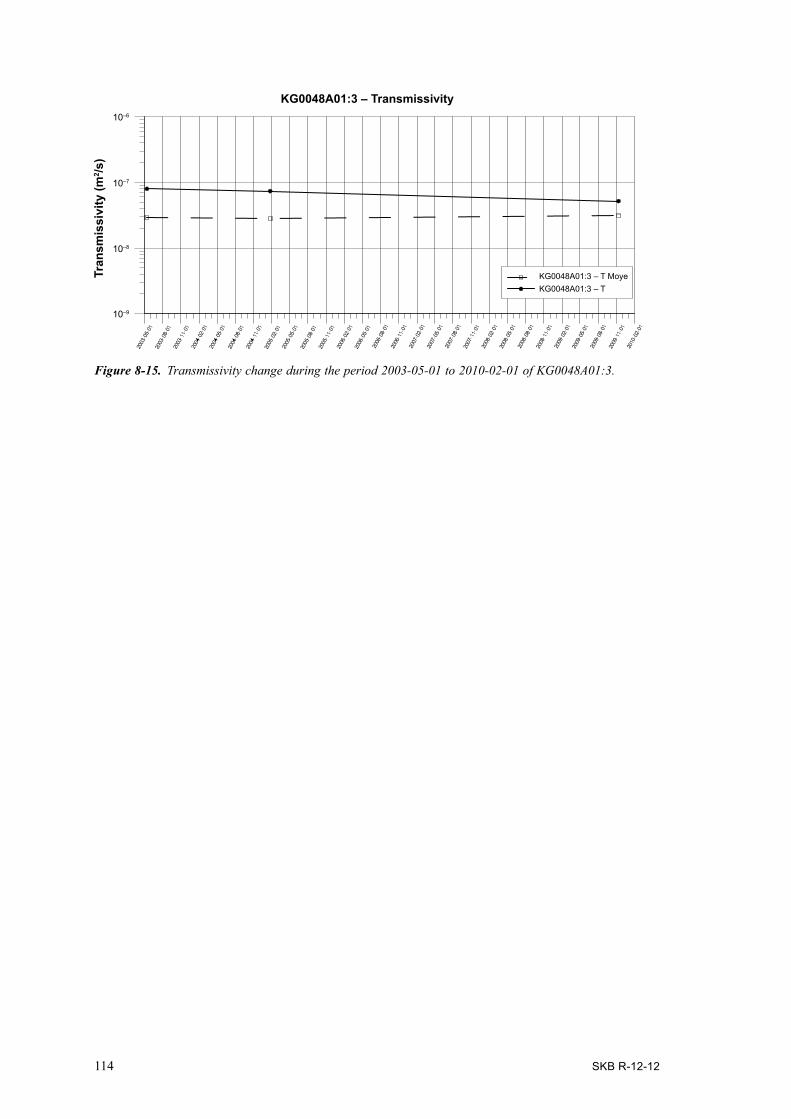
114 SKB R-12-12
Figure 8-15. Transmissivity change during the period 2003-05-01 to 2010-02-01 of KG0048A01:3.
KG0048A01:3 – TransmissivityTr
ansm
issi
vity
(m2 /s
)10–6
10–7
10–8
10–9
KG0048A01:3 – T MoyeKG0048A01:3 – T

SKB R-12-12 115
9 Comments and conclusions
Comments and conclusions made from the deformation measurements within the prototype project are divided into the following parts:
• Hydromechanical sensor performance.
• Temperature measurements.
• Long-term deformation measurements.
• Short-term measurements (hydraulic test campaigns).
• Hydraulic head changes.
• Flow into the deposition holes.
• Main conclusions.
9.1 Hydromechanical sensor performanceThe best hydromechanical sensor performances are the ones in KA3554G01:2. Both sensors were functional during the major part of the period 2003–2006 with the exception of the total breakdown in 2005 which occurred in all holes, see Chapter 5. The equipment in the reference hole KG0010B01 were also in operation 2006. Otherwise the equipment, one or both sensors, see Figures 6-1 and 6-2, in the remaining 9 boreholes had stopped functioning at the beginning of October 2006.
Out of 22 temperature sensors within the hydromechanical equipment only 13 were still working 2006-10-01.
By 2010-01-01 only 4 out of the 22 temperature sensors were working and of the HM sensors only the rock and fracture sensor in KA3542G02:4 was in operation.
• The measurements indicate sudden “jumps” which could be caused by either expansion or compression of a fracture. This is the general pattern for both the sections with intact rock only and for the sections one or several fractures. The reason can either be that the anchor itself has slipped which is the plausible explanation for sections with intact rock only, or that a movement in a fracture suddenly occurs, which may be the explanation for fracture sections.
• When the backfilling of section II in the Prototype repository was in progress of vibrations were generated in the process of packing the backfill during the period 2003-04-29–2003-06-27. It is an open question whether the energy from this vibration could have been large enough to cause the observed fast “deformations” that could possibly be micro slips of the anchors or micro-movements in fractures. The first explanation, slips of the anchor, is the most probable reason as there are sudden movements later in the project, see below.
• Due to the fact that many sections with intact rock show sudden displacements, it appears that the anchor construction is not optimal to the current conditions. There are very small displacements involved and perhaps the anchors would have performed better with a larger area (and softer) in contact with the rock surface compared to the steel pin and steel edge collar on the anchor that were in contact with the borehole wall in this experiment. cf. Figure 4-1 and Figures 2-6 and 2-7 in Rhén et al. (2003). The original design with expandable copper bladders on the anchors, as delivered from Geokon Inc., was tested in laboratory and was found to not work properly for measuring small deformations. The anchors was therefore modified and tested in the laboratory, but as indicated above, the new design did not perform satisfactory and should probably be developed further if new tests are to be made.
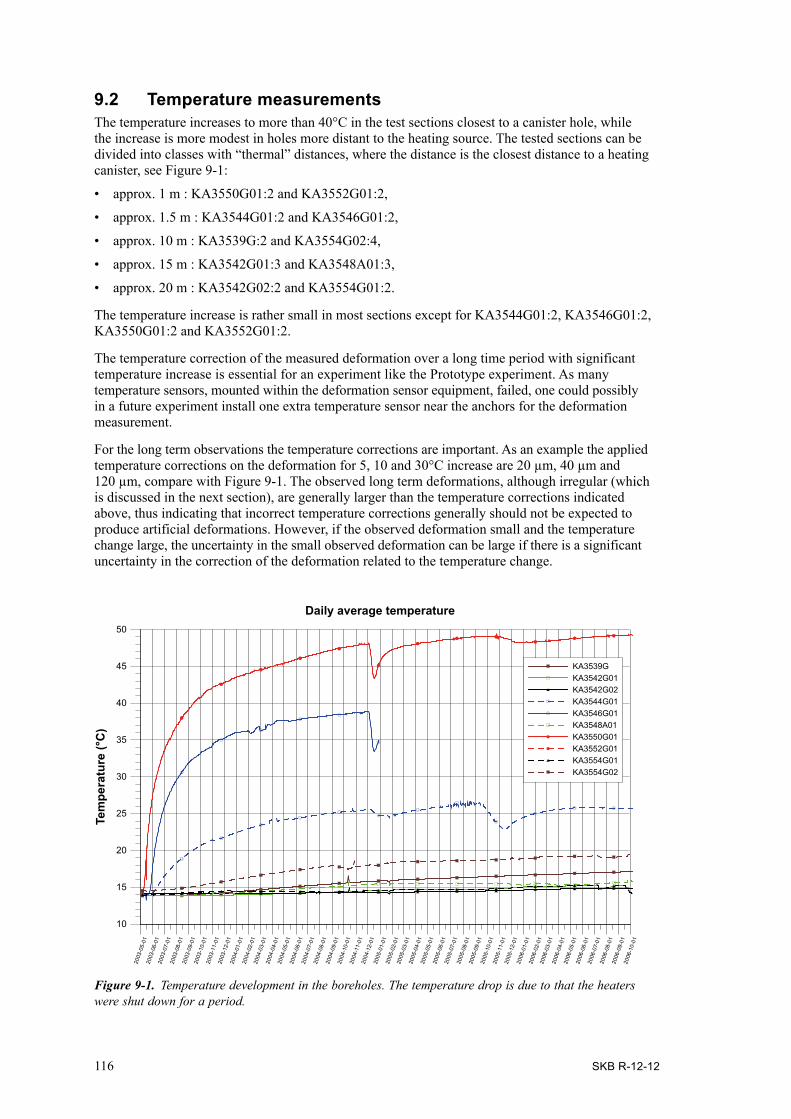
116 SKB R-12-12
9.2 Temperature measurementsThe temperature increases to more than 40°C in the test sections closest to a canister hole, while the increase is more modest in holes more distant to the heating source. The tested sections can be divided into classes with “thermal” distances, where the distance is the closest distance to a heating canister, see Figure 9-1:
• approx. 1 m : KA3550G01:2 and KA3552G01:2,
• approx. 1.5 m : KA3544G01:2 and KA3546G01:2,
• approx. 10 m : KA3539G:2 and KA3554G02:4,
• approx. 15 m : KA3542G01:3 and KA3548A01:3,
• approx. 20 m : KA3542G02:2 and KA3554G01:2.
The temperature increase is rather small in most sections except for KA3544G01:2, KA3546G01:2, KA3550G01:2 and KA3552G01:2.
The temperature correction of the measured deformation over a long time period with significant temperature increase is essential for an experiment like the Prototype experiment. As many temperature sensors, mounted within the deformation sensor equipment, failed, one could possibly in a future experiment install one extra temperature sensor near the anchors for the deformation measurement.
For the long term observations the temperature corrections are important. As an example the applied temperature corrections on the deformation for 5, 10 and 30°C increase are 20 µm, 40 µm and 120 µm, compare with Figure 9-1. The observed long term deformations, although irregular (which is discussed in the next section), are generally larger than the temperature corrections indicated above, thus indicating that incorrect temperature corrections generally should not be expected to produce artificial deformations. However, if the observed deformation small and the temperature change large, the uncertainty in the small observed deformation can be large if there is a significant uncertainty in the correction of the deformation related to the temperature change.
Figure 9-1. Temperature development in the boreholes. The temperature drop is due to that the heaters were shut down for a period.
2003
-05-
0120
03-0
6-01
2003
-07-
0120
03-0
8-01
2003
-09-
0120
03-1
0-01
2003
-11-
0120
03-1
2-01
2004
-01-
0120
04-0
2-01
2004
-03-
0120
04-0
4-01
2004
-05-
0120
04-0
6-01
2004
-07-
0120
04-0
8-01
2004
-09-
0120
04-1
0-01
2004
-11-
0120
04-1
2-01
2005
-01-
0120
05-0
2-01
2005
-03-
0120
05-0
4-01
2005
-05-
0120
05-0
6-01
2005
-07-
0120
05-0
8-01
2005
-09-
0120
05-1
0-01
2005
-11-
0120
05-1
2-01
2006
-01-
0120
06-0
2-01
2006
-03-
0120
06-0
4-01
2006
-05-
0120
06-0
6-01
2006
-07-
0120
06-0
8-01
2006
-09-
0120
06-1
0-01
10
15
20
25
30
35
40
45
50
KA3539GKA3542G01KA3542G02KA3544G01KA3546G01KA3548A01KA3550G01KA3552G01KA3554G01KA3554G02
Daily average temperature
Tem
pera
ture
(°C
)
SKB R-12-12 117
During the short term tests it was possible to observe small temperature changes in some cases, up to c. 0.4°C during a test. In some case the change was observed in a section with fractures, the change was probably caused by the flowing water. Other causes were probably related to that one heater was stopped for a period, and that caused a temperature pulse in the rock mass. The temperature corrections of the deformations during the short term tests are small compared to the deformations observed. So, even though the temperature correction should be accurate considering how the equip-ment is constructed, the observed deformations during the short term tests is not considered to be an artefact of just temperature corrections, assuming that it is time delay between when the temperature pulse affects the strain gauge and the sensor for the temperature measurements. However, as there have been a large number of failures of temperature gauges it cannot be excluded that in some cases where data is missing that there is a noticeable effect of the temperature correction on the measured deformation, but still it seems from the available results that the effect may be relatively small.
According to Chapter 3 the temperature sensor, thermistor, with measurement range –80 to +150°C has an accuracy ±0.5°C. The measured temperatures, as shown in Figure 9-1, should be accurate.
9.3 Evaluated transmissivitiesThe evaluated transmissivities (T) are based on two evaluation methods;
1 The method suggested by Moye (1967) assumes a steady state radial flow near the tested section and spherical flow at some distance.
2 For the transient evaluation the measured flow rate for the flowing phase is used (multirate approach) and the pressure from the pressure build-up period is used for the evaluation. Evaluating the transient data, the pressure change, Δp, is plotted versus the equivalent time, dte, in minutes. The solution used in the analysis is the Dougherty-Babu model for a pumping test in a confined aquifer (Dougherty and Babu 1984).
The methods are described in Section 4.3.4. For method 1 only borehole geometry, test section length, flow rate and pressure difference are and no subjective judgment of the data is needed to calculate the T. Geometrical factors do not change between the tests and the pressure measurements can be considered very accurate. The flow rate, however, can change if the test duration changes, as some test section may not reach fully steady state. To avoid major problem with this the chosen test duration was generally rather long; 120 minutes. In some cases were steady state was reached rather quickly, 60 minutes flow time was used and in some slow reacting sections 180 minutes flow time was used (some of the tests during test campaign 1 slightly different flow times). These individual test-section flow times were used for the repeated tests, with the purpose that the measured last flow rate would be close to steady state flow rate and if not fully developed steady state the same flow times should provide comparable conditions for evaluation of changes of T.
The benefits with method 2 are that near-borehole effects (skin factor) can be filtered out and the evaluated T can be considered to better represent the transmissivity of the fracture. The negative side is that the method demands more from the monitoring of the tests (high frequency of sampling of flow rate and pressure) and that there is some subjectivity in the evaluation process of fitting models to the measured data. In our case the monitoring has been made with a high frequency sampling rate, so data quality is good in that sense. Some tests show complicated flow regime developments and in such cases one can easily get differences in estimated T due to different judg-ments of what is a reasonable fit for parameter estimation. To minimise the problems of subjectivity in the evaluation, the flow regimes were carefully studied and all previous made tests for a specific test section were checked before the evaluation of a new test; in order to perform the evaluation in a similar manner. With this methodology it was believed that the relative changes of T could be described accurately.
In general one can say that evaluated transmissivities for a test section is dependent of test time, evaluations methods as well as effects from boundary conditions (some may be transient or constant head). As described above, the attempt has been to avoid major problems in order to get relative changes that should be accurate, the relative changes which were considered important for the
118 SKB R-12-12
project. The changes observed for T can generally be considered small and within an estimated uncertainty for an absolute value of T. There are a few greater changes of T and one can be certain that there exist a change of the absolute T. On the other hand, the frequent observation of small changes of T is also an important result as it tells us that no major changes occurred when the rock was heated. These small changes can probably be within expected uncertainties for an absolute estimate of T and observed small trends of the relative changes are uncertain. In a few cases where there are several observations showing a trend one can probably be more certain that there is a trend although small relative changes. However, this assumes that the major changes are due to compres-sion or extension of fractures related to a slow change of stresses. If there is a fracture slip one can have a sudden increase or a decrease of the fracture transmissivity. There are a few observations that possibly can be related to slips but it has not been possible to confirm this cause to the change.
9.4 Long-term deformation measurementsIn the summer months of 2003 most of the measurement sensors were still working. During that period when there are valid measurement data, there is increasing temperature in the rock and the rock expands while the measured fractures are generally being compressed.
The normal accuracy for the hole measuring system including hysteresis, non-linearity, misalign-ment, batch factor variations etc is 1% F.S. according to Geokon. The accuracy based on individual calibration that were performed of the sensors were; Measurement range 0.76–2.1 mm, Resolution (logger) 0.10–0.28 µm, Accuracy 0.76–2.1 µm according to Chapter 3, which can be considered as a sufficient accuracy for the test.
In a majority of tested boreholes the transmissivity slightly decreases when the temperature rises. But there are also boreholes where the opposite result is received. However changes are generally very small. In several sections, but not all, the water pressure decreases c. 500 to 1,000 kPa during 2003 to 2006 but this change cannot explain the observed long-term deformations using transmis-sivity and pressure-change data from the short-term deformation measurements in some borehole sections. In a few sections the water pressure increased but the transmissivity decreased and one can conclude that the temperature increase has caused transmissivity decrease. In some cases possibly both the temperature increase and the water pressure decrease has caused the transmisssivity decrease.
In borehole KA3552G01:2, which is c. 1.2 m from the centre line of the heater (c. 0.6 m outside the deposition hole wall) with temperature increase from c. 14 to 49°C, there is a clear deformation and transmissivity decrease from c. 5∙10–9 m2/s to c. 6∙10–10 m2/s in the section with a fracture with orientation 193/44. KA3550G01:2 which is in a similar position as KA3552G01:2 but due to packer failure no data are available.
KA3544G01:2 and KA3546G01:2 are fairly close to the heaters, which are c. 1.2 m from the centre line of the heater (c. 0.6 m outside the deposition hole) but located near the bottom of the heater. The temperature increase is c. from c. 14 to 25°C (KA3544G01:2) and 38°C (KA3546G01:2) and the monitored sections have 3–4 fractures with different orientations. In KA3544G01:2the transmissivity decreases from c. c. 1∙10–8 m2/s to c. 7∙10–9 m2/s (only two measurements) but in KA3544G01:2 there seem to be no decrease in transmissivity.
There are a few observations that indicate a sudden transmissivity increase, e.g. KA3542G02:2, which possibly can indicate a fracture slip; a few months after the heater were started. After this sudden increase, the transmissivity decreases. In other borehole sections the transmissivity changes are small and not possible to judge if they are due to the decreasing water pressure or increasing load due to temperature increase.
The long-term deformation measurements are very difficult to evaluate due to a number of rapid changes that have not been possible to couple to a known cause, or the deformations seem unrealistic in some cases.

SKB R-12-12 119
9.5 Short-term deformation measurementsDuring the seven hydraulic test campaigns (TC1–TC7) several of the test sections reacts as expected. During flow phase the fracture located within the tested section reacts with decreased fracture width in response to the lower hydrostatic pressure in the section. When the flow phase ends the fracture width increases once again. The best results are from KA3542G01:3 (TC2–TC4) and KA3554G01:2 (TC3–TC7). There is a more or less linear relationship between hydrostatic water pressure loss and fracture width in the data from the two boreholes.
The fracture transmissivity decreases slightly when the fracture or set of fractures are being compressed during the hydraulic tests.
It seems that in some cases the deformation during a short test does not come back to initial values before the sudden pressure decrease. This may indicate a permanent deformation of the fracture but it cannot be excluded that it is small anchor slips that is observed.
9.6 Hydraulic head changesAppendix 2 shows the pressure measurements around the Prototype repository. There seem to be a slowly decreasing trend in the water pressure by time. At least partly, this cannot be explained as effects from the Prototype repository itself or nearby tunnels, as one can observe a decreasing trend en several of the boreholes in the Äspö HRL, exemplified in Figure 9-2. Borehole KA3105A is situated east of the TBM assembly hall and KA2162B is drill through the tunnel spiral, Figure 1-2 and Figure 1-3. During the same period the total inflow of water to the tunnels has decreased, see Figure 9-3. Explanations for the decreasing inflow rate to the tunnels, which has been observed at several underground facilities, has been near-tunnel effects causing a permeability decrease close to the tunnel as; Stress changes due to the excavation, chemical precipitation and/or gas release near the tunnel due to pressure decrease of the inflowing water. Fault gauge moving with the flowing water can also cause changes in the permeability, which has been observed within the Prototype experi-ment, then linked to changes observed when blasting rock nearby. As the pressure far away from the tunnels does not increase, as one would anticipate of the above reasons, there must be, at least also, other mechanisms involved causing the decreasing inflow rate to the tunnels. This mechanism cannot be explained at present but possibly can successive fault gauge movements and/or small and slow creep deformation of the rock cause very small changes of the permeability of the fracture system within long distances from the tunnels creating a slightly lower mean permeability.
9.7 Flow into the deposition holesThe inflow to the deposition holes DA3551G01 and DA3545G01 were measured 1999-12 to 2000-06 three times (Rhén and Forsmark 2001). In the winter 2012–2013, after the backfill and the buffer had been removed in tunnel section II, the flow measurements were repeated for two of the depositions holes. The measured flow rates for the two occasions are shown in Table 9-1. As can be seen the inflow rates has decreased.
Table 9-1. Result of inflow measurements to deposition boreholes DA3551G01 and DA3545G01.
Borehole Q 2000-03-28–2000-03-31 (L/min)
Q 2012-12-20–2013-02-07 (L/min)
DA3551G01 0.00155 0DA3545G01 0.00270 0.00045

120 SKB R-12-12
0
1,000
2,000
3,000
4,000
Section 1Section 2Section 3Section 4
KA2162BG
roun
dwat
er p
ress
ure
head
(kPa
)
0
1,000
2,000
3,000
4,000
Section 1Section 2Section 3Section 4
KA3105A
Gro
undw
ater
pre
ssur
e he
ad (k
Pa)
Figure 9-2. Groundwater pressure in KA2162B and KA3105A.

SKB R-12-12 121
1995 1996 1997 1998 1999 2000 2001 2002 2003 2004 2005 2006 2007 2008 2009 2010 2011 2012 2013
0
1,000
2,000
3,000
1995 1996 1997 1998 1999 2000 2001 2002 2003 2004 2005 2006 2007 2008 2009 2010 2011 2012 2013
0
10
20
30
Total volumes of piped outgoing water (m3/24h)
Total volumes of piped ingoing water (m3/24h)
Yearly average day flow
Yearly average day flow
Flow
rate
(m3 /2
4h)
Flow
rate
(m3 /2
4h)
Figure 9-3. Measurement of total inflow from the rock (outgoing water) to the Äspö HRL and total ingoing water for e.g drilling purpose. (Measurement of ingoing water was ended June 1999 after a failure in the flow meter.).
9.8 Main conclusions9.8.1 GeneralThe following questions are considered in Section 1.2.3:
• Is there any deformation observed on the intact rock that can be correlated to temperature?
• Is there any deformation of open fractures that can be correlated to temperature?
Yes, deformation can be observed in both the intact rock and in sections with fractures, but the results are difficult to interpret as the anchors seem to slip on the rock surface in some cases and the amount of data is less than expected due to that sensors have stopped working during the project.
• Are there any changes of fracture transmissivities that can be correlated to temperature?
Yes, but the changes are generally small.
• If fracture transmissivities have changed, can it be correlated to measured deformations of fractures?
Yes, and the changes are small. However the amount of data is also small.
Below the main results are described in more detail:
• The observed deformations and transmissivity changes during the measurement period are small. This was expected as the initial rock stress before the heating is rather high at the depth for the Prototype repository. The transmissivity decrease is c. 0.1 of the initial transmissivity value for one observation just outside a deposition hole but all other observations near or distant from the deposition holes show fewer changes, but the changes show decreases as well as increases. The mall changes should be considered uncertain.

122 SKB R-12-12
• Hydraulic tests with different water pressure decreases show that the evaluated transmissivity is dependent of the applied water pressure decrease. However, the transmissivity changes are small relative the pressure change. This is expected as the tests are performed at such large depth with relatively high initial rock stresses.
• Although the measurements in some respect have been successful (according to the point above) one can conclude that the deformation measurements are difficult. The deformations are small and one has to be very sure that the anchor does not slip on the rock wall. The sensors (strain gauge and temperature) in the deformation measurement equipment should also withstand the environment (temperature, water pressure, vibration (e.g. from packing the backfill in the tun-nels)) in the borehole better than the equipment used. It is presently not known the reason for the deformation measurement-equipment failure.
• The methodology for performing hydraulic tests has worked well but in any future similar investi gations one should perform several tests with different pressure drawdowns (e.g 200 kPa (or at least somewhat lower than used in the present study) as start value and then increase the differential pressure in a number of steps suitable for the project) during each test campaign in each test section already from the outset. Data will be useful for evaluating fracture compressibility and one can use the test with the lowest differential pressure when comparing long term behaviour, which would be preferable. To show permeability changes qualitative one can probably also use a third test (besides evaluation of T using stationary and transient methods) by plotting the specific drawdown versus time for all tests made in a specific test section.
• The characterisation of the Prototype tunnel before the tunnel was backfilled and the experiment started, was extensive and it was possible to do several types of geological and hydrogeological investigations that provided a good basis for planning the experiment. However, one method was excluded; the flow logging with Posiva flow log aiming to detect individual flowing fractures and estimate their transmissivity. Investigations in other projects later made by SKB using this tool has proven valuable as a compliment to geological characterisation and orientation of fractures and hydraulic tests with small and large test-section lengths.
• The installed hydraulic packers in tunnel section II have functioned well but unfortunately there have been a few packer failures that have spoiled the possibilities to perform hydraulic tests in those boreholes.
• The water pressure around the deposition tunnels did not increase as expected. First of all, sec-tion I was drained most of test period due to electrical problems with one canister heater when the water pressure increased, which also affect the pressure around section II. There also exists a general pressure decrease near the Prototype repository, but also in Äspö HRL in general. It does not have a main influence of the evaluation of the short-term deformations (other than it limits to use high differential pressures), but it can affect the long-term deformation measurements in that respect that the effective stress in the fractures changes. If the deformation due to the thermal load is limited, the observed small deformations may just be due to long term pressure changes.
• The nearby experiment in tunnel TASS has significantly disturbed the Prototype experiment. The drilling and the grouting for the Fine Sealing project (year 2007) as well as excavation of the TASS tunnel, disturbed the pressures and probably has grout affected at least one of the observation boreholes drilled from the Prototype tunnel. The drilling, the grouting and tunnel excavation have however not had an impact of most result related to hydraulic tests and deforma-tion measurements, as the main part of the result are from the period before 2007. The boundary conditions for the Prototype project significantly changed after 2007 due to the TASS tunnel. Pressure levels and pressure trends have changed in several cases comparing data before drill start and after excavation.
9.8.2 Comparison with predictionsBefore the experiment started, scoping calculations were made of the expected behaviour of the fractures, see Rhén and Alm (2004). The conclusions were:
• Prediction: The hydraulic response will in general be decreased transmissivity. The decrease will be larger the closer the fractures are to the canisters.

SKB R-12-12 123
• Outcome: Correct prediction but the number of observations is small.
• Prediction: The transmissivity will be reduced to something between 10 and 80 percent of the in situ values.
• Outcome: Prediction fairly correct. One observation close to the deposition holes shows a decrease to 10% of initial value. Most other sections show only small changes or hardly any changes. However, the maximum distance from the deposition holes assumed in the predic-tions were 10 m and several of the observation are c. 15–25 m from the deposition holes, see Section 7.2, indicating that it is reasonable that the observations indicate less changes for many of the measured section.
• Prediction: The fracture closure will be in the range of 5–70 micrometre.
• Outcome: The deformation during short term tests with a decrease of the effective pressure of maximum c. 3,200 kPa generates a deformation of maximum 35 micrometre, see Figure 7-102. The measured long-term deformation is very uncertain due to that the anchors have probably in many cases slipped. In a few cases were there seem to be a more or less continuous deformations change, without sudden and permanent changes in deformation that is in the prediction range, see Section 7.3. It cannot be said that the measurements have confirmed the predictions, due to the fact that the measurement data for long-term monitoring of deformations are of low quality.
• Prediction: The hydraulic and mechanical responses on the fracture depend on the orientation of the fracture relative the stress field.
• Outcome: It cannot be said that the measurements have confirmed the predictions, due to the fact that the measurement data for long-term monitoring of deformations are of low quality, and it has not been consider possible to evaluate actual stress situation around each monitored section in order to validate the predictions. For future experiments one would like to have more measure-ment sections rather near deposition holes (probably <10 m) where probable stress effects more likely can be observed. Preferably that each borehole section having one or several fractures with approximately one orientation and that most of the borehole section have fracture(s) with different orientations compared to other borehole sections. One should also use the Posiva flow log, or similar equipment, to identify the flowing fractures and then using the geological mapping for orientation of the flowing fracture.
• Prediction: Major part (~80%) of the increase in stress and temperature is reached within two years.
• Outcome: After two years (2005-05) the temperature close to the deposition holes was c. 95% of the temperature 2006-10, see Section 6.3. After two years the temperature c. 10 m from the deposition holes was c. 70% of the temperature 2006, see Section 6.3. Deformation data are lacking for a longer period so no relevant comparison to prediction can be made.
SKB R-12-12 125
References
SKB’s (Svensk Kärnbränslehantering AB) publications can be found at www.skb.se/publications.
Alm P, Forsmark T, Rhén I, 2005. Äspö Hard Rock Laboratory. Prototype repository. Installations for measurements of flow into tunnels, water pressure in the rock and hydromechanical responses in boreholes during operation phase. SKB IPR-05-04, Svensk Kärnbränslehantering AB.
Dougherty D E, Babu D K, 1984. Flow to a partially penetrating well in a double-porosity reservoir. Water Resources Research 20, 1116–1122.
Forsmark T, 2006. Äspö Hard Rock Laboratory. Prototype repository. Hydraulic tests and displace-ment measurements during operation phase. Test campaign 6. Single hole tests. SKB IPR-06-01, Svensk Kärnbränslehantering AB.
Forsmark T, 2007a. Äspö Hard Rock Laboratory. Prototype repository. Hydraulic tests and displace-ment measurements during operation phase. Test campaign 7. Single hole tests. SKB IPR-07-02, Svensk Kärnbränslehantering AB.
Forsmark T, 2007b. Äspö Hard Rock Laboratory. Prototype repository. Hydraulic tests and displace-ment measurements during operation phase. Test campaign 8. Single hole tests. SKB IPR-07-17, Svensk Kärnbränslehantering AB.
Forsmark T, 2008. Äspö Hard Rock Laboratory. Prototype repository. Hydraulic tests and displacement measurements during operation phase. Test campaign 9. SKB IPR-08-22, Svensk Kärnbränslehantering AB.
Forsmark T, 2010. Äspö Hard Rock Laboratory. Prototype repository. Hydraulic tests during opera-tion phase. Test campaign 10. Interference tests. SKB IPR-10-03, Svensk Kärnbränslehantering AB.
Forsmark T, Rhén I, 2004a. Äspö Hard Rock Laboratory. Prototype repository. Hydraulic tests and displacement measurements during operation phase, test campaign 1, single hole tests. SKB IPR-04-17, Svensk Kärnbränslehantering AB.
Forsmark T, Rhén I, 2004b. Äspö Hard Rock Laboratory. Prototype repository. Hydraulic tests and displacement measurements during operation phase, test campaign 2, single hole tests. SKB IPR-04-18, Svensk Kärnbränslehantering AB.
Forsmark T, Rhén I, 2004c. Äspö Hard Rock Laboratory. Prototype repository. Hydraulic tests and displacement measurements during operation phase, test campaign 3, single hole tests. SKB IPR-04-19, Svensk Kärnbränslehantering AB.
Forsmark T, Rhén I, 2005a. Äspö Hard Rock Laboratory. Prototype repository. Hydraulic tests and displacement measurements during operation phase, test campaign 4, single hole tests. SKB IPR-05-02, Svensk Kärnbränslehantering AB.
Forsmark T, Rhén I, 2005b. Äspö Hard Rock Laboratory. Prototype repository. Hydraulic tests and displacement measurements during operation phase. Test campaign 5. Single hole tests. SKB IPR-05-17, Svensk Kärnbränslehantering AB.
Forsmark T, Rhén I, 2005c. Äspö Hard Rock Laboratory. Prototype repository. Hydraulic tests and displacement measurements during operation phase. Test campaign 5. Interference tests. SKB IPR-05-18, Svensk Kärnbränslehantering AB.
Forsmark T, Forsman I, Rhén I, 2004. Äspö Hard Rock Laboratory. Prototype repository. Hydraulic tests and displacement measurements during operation phase, test campaign 1, interference tests. SKB IPR-04-16, Svensk Kärnbränslehantering AB.
Fälth B, Hökmark H, 2006. Mechanical and thermo-mechanical discrete fracture near-field analyses based on preliminary data from the Forsmark, Simpevarp and Laxemar sites. SKB R-06-89, Svensk Kärnbränslehantering AB.
Goudarzi R, Johannesson L-E, 2006. Äspö Hard Rock Laboratory. Prototype repository. Sensor data report (Period 010917–060601). Report No:15. SKB IPR-06-26, Svensk Kärnbränslehantering AB.
126 SKB R-12-12
Horne R N, 1995. Modern well test analysis: a computer-aided approach. 2nd ed. Palo Alto, CA: Petroway Inc.
Hökmark H, Fälth B, Wallroth T, 2006. T-H-M couplings in rock. Overview of results of impor-tance to the SR-Can safety assessment. SKB R-06-88, Svensk Kärnbränslehantering AB.
Moye D G, 1967. Diamond drilling for foundation exploration. Civil Engineering Transactions, Institute of Engineers (Australia), 95–100.
Rhén I, Alm P, 2004. Äspö Hard Rock Laboratory. Prototype repository. Hydromechanical behaviour of fractures due to excavation and thermal load. SKB IPR-04-22, Svensk Kärnbränslehantering AB.
Rhén I, Forsmark T, 2001. Äspö Hard Rock Laboratory. Prototype repository. Hydrogeology. Summary report of investigations before the operation phase. SKB IPR-01-65, Svensk Kärnbränslehantering AB.
Rhén I, Forsmark T, Torin L, Puigdomenech I, 2001. Äspö Hard Rock Laboratory. Prototype repository. Hydrogeological, hydrochemical and temperature measurements in boreholes during the operation phase of the Prototype repository. Tunnel section I. SKB IPR-01-32, Svensk Kärnbränslehantering AB.
Rhén I, Forsmark T, Magnusson J, Alm P, 2003. Äspö Hard Rock Laboratory. Prototype reposi-tory. Hydrogeolocical, hydrochemical, hydromechanical and temperature measurements in boreholes during the operation phase of the Prototype repository Tunnel section II. SKB IPR-03-22, Svensk Kärnbränslehantering AB.
Rhén I, Forsmark T, Hartley L, Jackson C P, Roberts D, Swan D, Gylling B, 2008. Hydrogeological conceptualisation and parameterisation. Site descriptive modelling, SDM-Site Laxemar. SKB R-08-78, Svensk Kärnbränslehantering AB.
SKB, 2011. Long-term safety for the final repository for spent nuclear fuel at Forsmark. Main report of the SR-Site project. SKB TR-11-01, Svensk Kärnbränslehantering AB.
Spane F A, Wurstner S K, 1993. DERIV: A computer program for calculating pressure derivatives for use in hydraulic tests. Groundwater 31, 814–822.

SKB R-12-12 127
Appendix 1
Temperature in borehole sections with HM measurementsIn the appendices the following plots are presented with all data available until 2009-07-01. Most of the sensors unfortunately malfunction by that date.
• Daily average temperature plot for inner deformation measurement section.
• Daily average temperature plot for outer deformation measurement section.
KG0010B01Temperature
2003
-05-
0120
03-0
6-01
2003
-07-
0120
03-0
8-01
2003
-09-
0120
03-1
0-01
2003
-11-
0120
03-1
2-01
2004
-01-
0120
04-0
2-01
2004
-03-
0120
04-0
4-01
2004
-05-
0120
04-0
6-01
2004
-07-
0120
04-0
8-01
2004
-09-
0120
04-1
0-01
2004
-11-
0120
04-1
2-01
2005
-01-
0120
05-0
2-01
2005
-03-
0120
05-0
4-01
2005
-05-
0120
05-0
6-01
2005
-07-
0120
05-0
8-01
2005
-09-
0120
05-1
0-01
2005
-11-
0120
05-1
2-01
2006
-01-
0120
06-0
2-01
2006
-03-
0120
06-0
4-01
2006
-05-
0120
06-0
6-01
2006
-07-
0120
06-0
8-01
2006
-09-
0120
06-1
0-01
2006
-11-
0120
06-1
2-01
2007
-01-
0120
07-0
2-01
2007
-03-
0120
07-0
4-01
2007
-05-
0120
07-0
6-01
2007
-07-
0120
07-0
8-01
2007
-09-
0120
07-1
0-01
2007
-11-
0120
07-1
2-01
2008
-01-
0120
08-0
2-01
2008
-03-
0120
08-0
4-01
2008
-05-
0120
08-0
6-01
2008
-07-
0120
08-0
8-01
2008
-09-
0120
08-1
0-01
2008
-11-
0120
08-1
2-01
2009
-01-
0120
09-0
2-01
2009
-03-
0120
09-0
4-01
2009
-05-
0120
09-0
6-01
2009
-07-
0120
09-0
8-01
0
5
10
15
20
25
30
KG0010B01B1 – Daily average inner temperature
(°C
)

128 SKB R-12-12
KG0010B01Long-term deformation
2003
-05-
0120
03-0
6-01
2003
-07-
0120
03-0
8-01
2003
-09-
0120
03-1
0-01
2003
-11-
0120
03-1
2-01
2004
-01-
0120
04-0
2-01
2004
-03-
0120
04-0
4-01
2004
-05-
0120
04-0
6-01
2004
-07-
0120
04-0
8-01
2004
-09-
0120
04-1
0-01
2004
-11-
0120
04-1
2-01
2005
-01-
0120
05-0
2-01
2005
-03-
0120
05-0
4-01
2005
-05-
0120
05-0
6-01
2005
-07-
0120
05-0
8-01
2005
-09-
0120
05-1
0-01
2005
-11-
0120
05-1
2-01
2006
-01-
0120
06-0
2-01
2006
-03-
0120
06-0
4-01
2006
-05-
0120
06-0
6-01
2006
-07-
0120
06-0
8-01
2006
-09-
0120
06-1
0-01
2006
-11-
0120
06-1
2-01
2007
-01-
0120
07-0
2-01
2007
-03-
0120
07-0
4-01
2007
-05-
0120
07-0
6-01
2007
-07-
0120
07-0
8-01
2007
-09-
0120
07-1
0-01
2007
-11-
0120
07-1
2-01
2008
-01-
0120
08-0
2-01
2008
-03-
0120
08-0
4-01
2008
-05-
0120
08-0
6-01
2008
-07-
0120
08-0
8-01
2008
-09-
0120
08-1
0-01
2008
-11-
0120
08-1
2-01
2009
-01-
0120
09-0
2-01
2009
-03-
0120
09-0
4-01
2009
-05-
0120
09-0
6-01
2009
-07-
0120
09-0
8-01
0
5
10
15
20
25
30
KG0010B01B1 – Daily average outer temperature(°
C)
2003
-05-
0120
03-0
6-01
2003
-07-
0120
03-0
8-01
2003
-09-
0120
03-1
0-01
2003
-11-
0120
03-1
2-01
2004
-01-
0120
04-0
2-01
2004
-03-
0120
04-0
4-01
2004
-05-
0120
04-0
6-01
2004
-07-
0120
04-0
8-01
2004
-09-
0120
04-1
0-01
2004
-11-
0120
04-1
2-01
2005
-01-
0120
05-0
2-01
2005
-03-
0120
05-0
4-01
2005
-05-
0120
05-0
6-01
2005
-07-
0120
05-0
8-01
2005
-09-
0120
05-1
0-01
2005
-11-
0120
05-1
2-01
2006
-01-
0120
06-0
2-01
2006
-03-
0120
06-0
4-01
2006
-05-
0120
06-0
6-01
2006
-07-
0120
06-0
8-01
2006
-09-
0120
06-1
0-01
–0.2
–0.1
0
0.1
0.2
KG0010B1 – Daily average outer section deformation
(mm
)

SKB R-12-12 129
KA3539GTemperature
2003
-05-
0120
03-0
6-01
2003
-07-
0120
03-0
8-01
2003
-09-
0120
03-1
0-01
2003
-11-
0120
03-1
2-01
2004
-01-
0120
04-0
2-01
2004
-03-
0120
04-0
4-01
2004
-05-
0120
04-0
6-01
2004
-07-
0120
04-0
8-01
2004
-09-
0120
04-1
0-01
2004
-11-
0120
04-1
2-01
2005
-01-
0120
05-0
2-01
2005
-03-
0120
05-0
4-01
2005
-05-
0120
05-0
6-01
2005
-07-
0120
05-0
8-01
2005
-09-
0120
05-1
0-01
2005
-11-
0120
05-1
2-01
2006
-01-
0120
06-0
2-01
2006
-03-
0120
06-0
4-01
2006
-05-
0120
06-0
6-01
2006
-07-
0120
06-0
8-01
2006
-09-
0120
06-1
0-01
2006
-11-
0120
06-1
2-01
2007
-01-
0120
07-0
2-01
2007
-03-
0120
07-0
4-01
2007
-05-
0120
07-0
6-01
2007
-07-
0120
07-0
8-01
2007
-09-
0120
07-1
0-01
2007
-11-
0120
07-1
2-01
2008
-01-
0120
08-0
2-01
2008
-03-
0120
08-0
4-01
2008
-05-
0120
08-0
6-01
2008
-07-
0120
08-0
8-01
2008
-09-
0120
08-1
0-01
2008
-11-
0120
08-1
2-01
2009
-01-
0120
09-0
2-01
2009
-03-
0120
09-0
4-01
2009
-05-
0120
09-0
6-01
2009
-07-
0120
09-0
8-01
0
5
10
15
20
25
30
KA3539G – Daily average temperature inner section(°
C)
2003
-05-
0120
03-0
6-01
2003
-07-
0120
03-0
8-01
2003
-09-
0120
03-1
0-01
2003
-11-
0120
03-1
2-01
2004
-01-
0120
04-0
2-01
2004
-03-
0120
04-0
4-01
2004
-05-
0120
04-0
6-01
2004
-07-
0120
04-0
8-01
2004
-09-
0120
04-1
0-01
2004
-11-
0120
04-1
2-01
2005
-01-
0120
05-0
2-01
2005
-03-
0120
05-0
4-01
2005
-05-
0120
05-0
6-01
2005
-07-
0120
05-0
8-01
2005
-09-
0120
05-1
0-01
2005
-11-
0120
05-1
2-01
2006
-01-
0120
06-0
2-01
2006
-03-
0120
06-0
4-01
2006
-05-
0120
06-0
6-01
2006
-07-
0120
06-0
8-01
2006
-09-
0120
06-1
0-01
2006
-11-
0120
06-1
2-01
2007
-01-
0120
07-0
2-01
2007
-03-
0120
07-0
4-01
2007
-05-
0120
07-0
6-01
2007
-07-
0120
07-0
8-01
2007
-09-
0120
07-1
0-01
2007
-11-
0120
07-1
2-01
2008
-01-
0120
08-0
2-01
2008
-03-
0120
08-0
4-01
2008
-05-
0120
08-0
6-01
2008
-07-
0120
08-0
8-01
2008
-09-
0120
08-1
0-01
2008
-11-
0120
08-1
2-01
2009
-01-
0120
09-0
2-01
2009
-03-
0120
09-0
4-01
2009
-05-
0120
09-0
6-01
2009
-07-
0120
09-0
8-01
0
5
10
15
20
25
30
KA3539G – Daily average temperature outer section
(°C
)
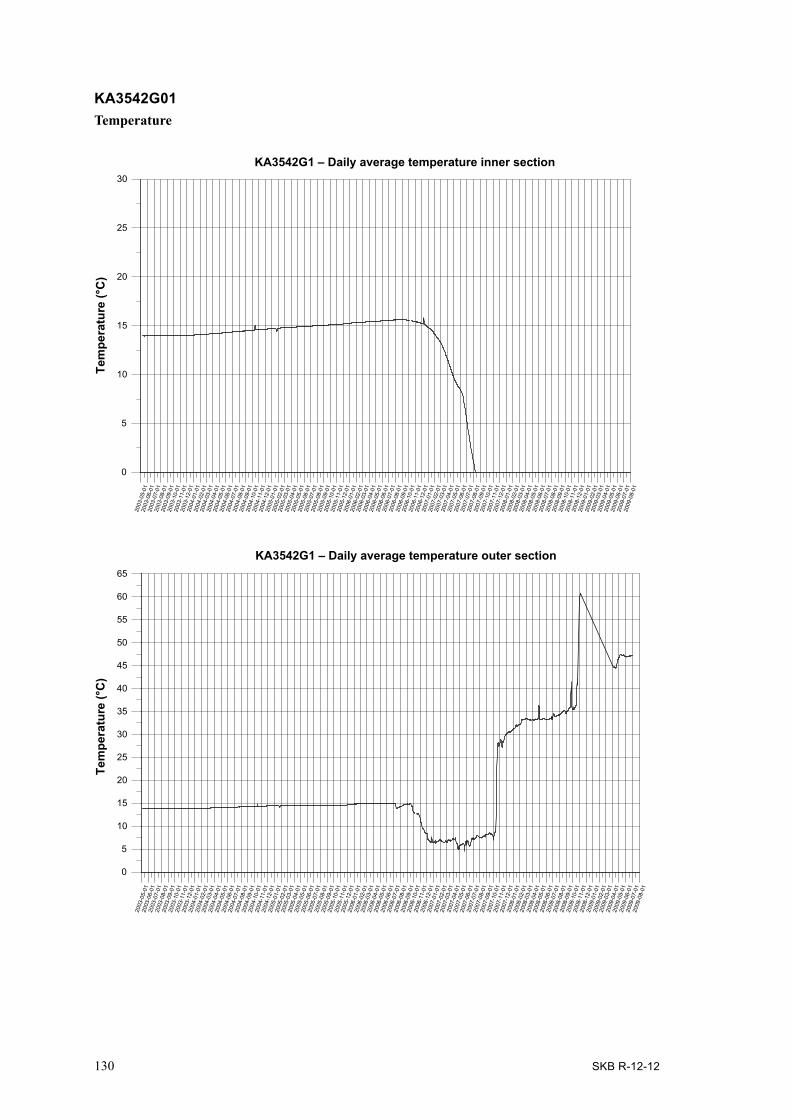
130 SKB R-12-12
KA3542G01Temperature
Tem
pera
ture
20
03-0
5-01
2003
-06-
0120
03-0
7-01
2003
-08-
0120
03-0
9-01
2003
-10-
0120
03-1
1-01
2003
-12-
0120
04-0
1-01
2004
-02-
0120
04-0
3-01
2004
-04-
0120
04-0
5-01
2004
-06-
0120
04-0
7-01
2004
-08-
0120
04-0
9-01
2004
-10-
0120
04-1
1-01
2004
-12-
0120
05-0
1-01
2005
-02-
0120
05-0
3-01
2005
-04-
0120
05-0
5-01
2005
-06-
0120
05-0
7-01
2005
-08-
0120
05-0
9-01
2005
-10-
0120
05-1
1-01
2005
-12-
0120
06-0
1-01
2006
-02-
0120
06-0
3-01
2006
-04-
0120
06-0
5-01
2006
-06-
0120
06-0
7-01
2006
-08-
0120
06-0
9-01
2006
-10-
0120
06-1
1-01
2006
-12-
0120
07-0
1-01
2007
-02-
0120
07-0
3-01
2007
-04-
0120
07-0
5-01
2007
-06-
0120
07-0
7-01
2007
-08-
0120
07-0
9-01
2007
-10-
0120
07-1
1-01
2007
-12-
0120
08-0
1-01
2008
-02-
0120
08-0
3-01
2008
-04-
0120
08-0
5-01
2008
-06-
0120
08-0
7-01
2008
-08-
0120
08-0
9-01
2008
-10-
0120
08-1
1-01
2008
-12-
0120
09-0
1-01
2009
-02-
0120
09-0
3-01
2009
-04-
0120
09-0
5-01
2009
-06-
0120
09-0
7-01
2009
-08-
01
0
5
10
15
20
25
30
KA3542G1 – Daily average temperature inner section
(°C
)
2003
-05-
0120
03-0
6-01
2003
-07-
0120
03-0
8-01
2003
-09-
0120
03-1
0-01
2003
-11-
0120
03-1
2-01
2004
-01-
0120
04-0
2-01
2004
-03-
0120
04-0
4-01
2004
-05-
0120
04-0
6-01
2004
-07-
0120
04-0
8-01
2004
-09-
0120
04-1
0-01
2004
-11-
0120
04-1
2-01
2005
-01-
0120
05-0
2-01
2005
-03-
0120
05-0
4-01
2005
-05-
0120
05-0
6-01
2005
-07-
0120
05-0
8-01
2005
-09-
0120
05-1
0-01
2005
-11-
0120
05-1
2-01
2006
-01-
0120
06-0
2-01
2006
-03-
0120
06-0
4-01
2006
-05-
0120
06-0
6-01
2006
-07-
0120
06-0
8-01
2006
-09-
0120
06-1
0-01
2006
-11-
0120
06-1
2-01
2007
-01-
0120
07-0
2-01
2007
-03-
0120
07-0
4-01
2007
-05-
0120
07-0
6-01
2007
-07-
0120
07-0
8-01
2007
-09-
0120
07-1
0-01
2007
-11-
0120
07-1
2-01
2008
-01-
0120
08-0
2-01
2008
-03-
0120
08-0
4-01
2008
-05-
0120
08-0
6-01
2008
-07-
0120
08-0
8-01
2008
-09-
0120
08-1
0-01
2008
-11-
0120
08-1
2-01
2009
-01-
0120
09-0
2-01
2009
-03-
0120
09-0
4-01
2009
-05-
0120
09-0
6-01
2009
-07-
0120
09-0
8-01
0
5
10
15
20
25
30
35
40
45
50
55
60
65
KA3542G1 – Daily average temperature outer section
Tem
pera
ture
(°C
)

SKB R-12-12 131
KA3542G02Temperature
Tem
pera
ture
(°C
)
2003
-05-
0120
03-0
6-01
2003
-07-
0120
03-0
8-01
2003
-09-
0120
03-1
0-01
2003
-11-
0120
03-1
2-01
2004
-01-
0120
04-0
2-01
2004
-03-
0120
04-0
4-01
2004
-05-
0120
04-0
6-01
2004
-07-
0120
04-0
8-01
2004
-09-
0120
04-1
0-01
2004
-11-
0120
04-1
2-01
2005
-01-
0120
05-0
2-01
2005
-03-
0120
05-0
4-01
2005
-05-
0120
05-0
6-01
2005
-07-
0120
05-0
8-01
2005
-09-
0120
05-1
0-01
2005
-11-
0120
05-1
2-01
2006
-01-
0120
06-0
2-01
2006
-03-
0120
06-0
4-01
2006
-05-
0120
06-0
6-01
2006
-07-
0120
06-0
8-01
2006
-09-
0120
06-1
0-01
2006
-11-
0120
06-1
2-01
2007
-01-
0120
07-0
2-01
2007
-03-
0120
07-0
4-01
2007
-05-
0120
07-0
6-01
2007
-07-
0120
07-0
8-01
2007
-09-
0120
07-1
0-01
2007
-11-
0120
07-1
2-01
2008
-01-
0120
08-0
2-01
2008
-03-
0120
08-0
4-01
2008
-05-
0120
08-0
6-01
2008
-07-
0120
08-0
8-01
2008
-09-
0120
08-1
0-01
2008
-11-
0120
08-1
2-01
2009
-01-
0120
09-0
2-01
2009
-03-
0120
09-0
4-01
2009
-05-
0120
09-0
6-01
2009
-07-
0120
09-0
8-01
0
5
10
15
20
25
30KA3542G2 – Daily average temperature inner section
Tem
pera
ture
(°C
)
2003
-05-
0120
03-0
6-01
2003
-07-
0120
03-0
8-01
2003
-09-
0120
03-1
0-01
2003
-11-
0120
03-1
2-01
2004
-01-
0120
04-0
2-01
2004
-03-
0120
04-0
4-01
2004
-05-
0120
04-0
6-01
2004
-07-
0120
04-0
8-01
2004
-09-
0120
04-1
0-01
2004
-11-
0120
04-1
2-01
2005
-01-
0120
05-0
2-01
2005
-03-
0120
05-0
4-01
2005
-05-
0120
05-0
6-01
2005
-07-
0120
05-0
8-01
2005
-09-
0120
05-1
0-01
2005
-11-
0120
05-1
2-01
2006
-01-
0120
06-0
2-01
2006
-03-
0120
06-0
4-01
2006
-05-
0120
06-0
6-01
2006
-07-
0120
06-0
8-01
2006
-09-
0120
06-1
0-01
2006
-11-
0120
06-1
2-01
2007
-01-
0120
07-0
2-01
2007
-03-
0120
07-0
4-01
2007
-05-
0120
07-0
6-01
2007
-07-
0120
07-0
8-01
2007
-09-
0120
07-1
0-01
2007
-11-
0120
07-1
2-01
2008
-01-
0120
08-0
2-01
2008
-03-
0120
08-0
4-01
2008
-05-
0120
08-0
6-01
2008
-07-
0120
08-0
8-01
2008
-09-
0120
08-1
0-01
2008
-11-
0120
08-1
2-01
2009
-01-
0120
09-0
2-01
2009
-03-
0120
09-0
4-01
2009
-05-
0120
09-0
6-01
2009
-07-
0120
09-0
8-01
0
5
10
15
20
25
30
KA3542G2 – Daily average temperature outer section
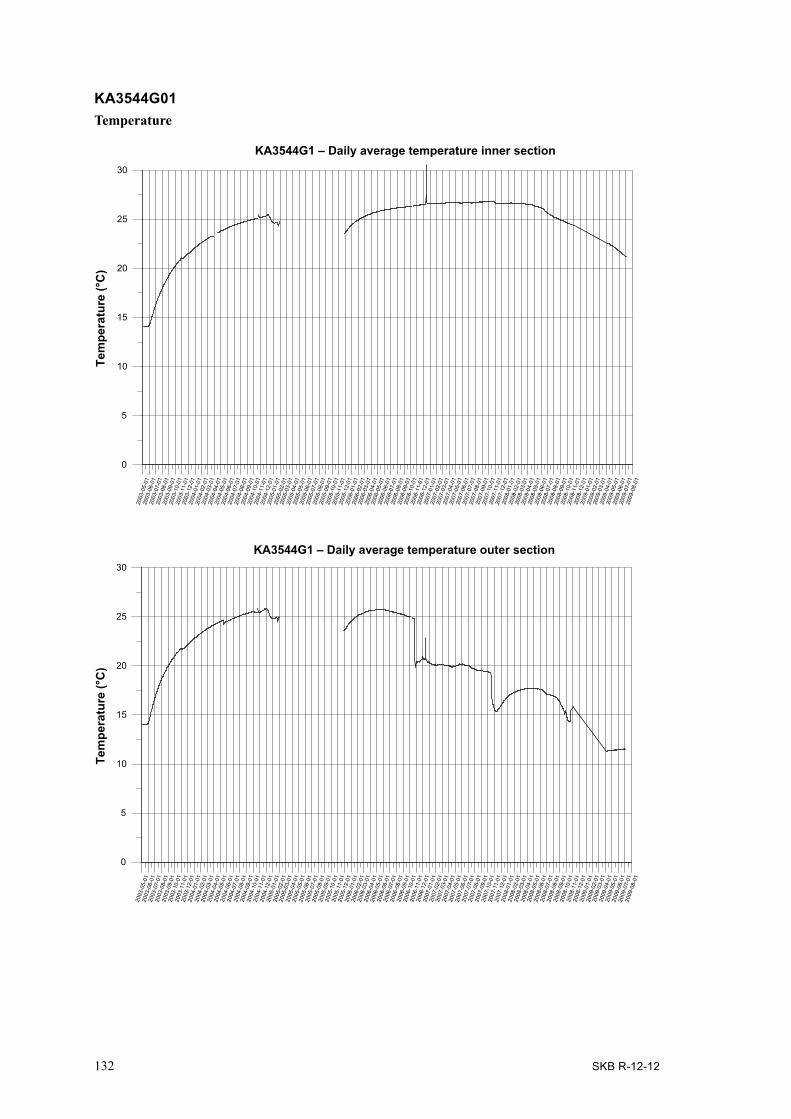
132 SKB R-12-12
KA3544G01Temperature
Tem
pera
ture
(°C
)
2003
-05-
0120
03-0
6-01
2003
-07-
0120
03-0
8-01
2003
-09-
0120
03-1
0-01
2003
-11-
0120
03-1
2-01
2004
-01-
0120
04-0
2-01
2004
-03-
0120
04-0
4-01
2004
-05-
0120
04-0
6-01
2004
-07-
0120
04-0
8-01
2004
-09-
0120
04-1
0-01
2004
-11-
0120
04-1
2-01
2005
-01-
0120
05-0
2-01
2005
-03-
0120
05-0
4-01
2005
-05-
0120
05-0
6-01
2005
-07-
0120
05-0
8-01
2005
-09-
0120
05-1
0-01
2005
-11-
0120
05-1
2-01
2006
-01-
0120
06-0
2-01
2006
-03-
0120
06-0
4-01
2006
-05-
0120
06-0
6-01
2006
-07-
0120
06-0
8-01
2006
-09-
0120
06-1
0-01
2006
-11-
0120
06-1
2-01
2007
-01-
0120
07-0
2-01
2007
-03-
0120
07-0
4-01
2007
-05-
0120
07-0
6-01
2007
-07-
0120
07-0
8-01
2007
-09-
0120
07-1
0-01
2007
-11-
0120
07-1
2-01
2008
-01-
0120
08-0
2-01
2008
-03-
0120
08-0
4-01
2008
-05-
0120
08-0
6-01
2008
-07-
0120
08-0
8-01
2008
-09-
0120
08-1
0-01
2008
-11-
0120
08-1
2-01
2009
-01-
0120
09-0
2-01
2009
-03-
0120
09-0
4-01
2009
-05-
0120
09-0
6-01
2009
-07-
0120
09-0
8-01
0
5
10
15
20
25
30
KA3544G1 – Daily average temperature inner section
Tem
pera
ture
(°C
)
2003
-05-
0120
03-0
6-01
2003
-07-
0120
03-0
8-01
2003
-09-
0120
03-1
0-01
2003
-11-
0120
03-1
2-01
2004
-01-
0120
04-0
2-01
2004
-03-
0120
04-0
4-01
2004
-05-
0120
04-0
6-01
2004
-07-
0120
04-0
8-01
2004
-09-
0120
04-1
0-01
2004
-11-
0120
04-1
2-01
2005
-01-
0120
05-0
2-01
2005
-03-
0120
05-0
4-01
2005
-05-
0120
05-0
6-01
2005
-07-
0120
05-0
8-01
2005
-09-
0120
05-1
0-01
2005
-11-
0120
05-1
2-01
2006
-01-
0120
06-0
2-01
2006
-03-
0120
06-0
4-01
2006
-05-
0120
06-0
6-01
2006
-07-
0120
06-0
8-01
2006
-09-
0120
06-1
0-01
2006
-11-
0120
06-1
2-01
2007
-01-
0120
07-0
2-01
2007
-03-
0120
07-0
4-01
2007
-05-
0120
07-0
6-01
2007
-07-
0120
07-0
8-01
2007
-09-
0120
07-1
0-01
2007
-11-
0120
07-1
2-01
2008
-01-
0120
08-0
2-01
2008
-03-
0120
08-0
4-01
2008
-05-
0120
08-0
6-01
2008
-07-
0120
08-0
8-01
2008
-09-
0120
08-1
0-01
2008
-11-
0120
08-1
2-01
2009
-01-
0120
09-0
2-01
2009
-03-
0120
09-0
4-01
2009
-05-
0120
09-0
6-01
2009
-07-
0120
09-0
8-01
0
5
10
15
20
25
30
KA3544G1 – Daily average temperature outer section

SKB R-12-12 133
KA3546G01Temperature
Tem
pera
ture
(°C
)
2003
-05-
0120
03-0
6-01
2003
-07-
0120
03-0
8-01
2003
-09-
0120
03-1
0-01
2003
-11-
0120
03-1
2-01
2004
-01-
0120
04-0
2-01
2004
-03-
0120
04-0
4-01
2004
-05-
0120
04-0
6-01
2004
-07-
0120
04-0
8-01
2004
-09-
0120
04-1
0-01
2004
-11-
0120
04-1
2-01
2005
-01-
0120
05-0
2-01
2005
-03-
0120
05-0
4-01
2005
-05-
0120
05-0
6-01
2005
-07-
0120
05-0
8-01
2005
-09-
0120
05-1
0-01
2005
-11-
0120
05-1
2-01
2006
-01-
0120
06-0
2-01
2006
-03-
0120
06-0
4-01
2006
-05-
0120
06-0
6-01
2006
-07-
0120
06-0
8-01
2006
-09-
0120
06-1
0-01
2006
-11-
0120
06-1
2-01
2007
-01-
0120
07-0
2-01
2007
-03-
0120
07-0
4-01
2007
-05-
0120
07-0
6-01
2007
-07-
0120
07-0
8-01
2007
-09-
0120
07-1
0-01
2007
-11-
0120
07-1
2-01
2008
-01-
0120
08-0
2-01
2008
-03-
0120
08-0
4-01
2008
-05-
0120
08-0
6-01
2008
-07-
0120
08-0
8-01
2008
-09-
0120
08-1
0-01
2008
-11-
0120
08-1
2-01
2009
-01-
0120
09-0
2-01
2009
-03-
0120
09-0
4-01
2009
-05-
0120
09-0
6-01
2009
-07-
0120
09-0
8-01
0
5
10
15
20
25
30
35
40
KA3546G1 – Daily average temperature inner sectionTe
mpe
ratu
re(°
C)
2003
-05-
0120
03-0
6-01
2003
-07-
0120
03-0
8-01
2003
-09-
0120
03-1
0-01
2003
-11-
0120
03-1
2-01
2004
-01-
0120
04-0
2-01
2004
-03-
0120
04-0
4-01
2004
-05-
0120
04-0
6-01
2004
-07-
0120
04-0
8-01
2004
-09-
0120
04-1
0-01
2004
-11-
0120
04-1
2-01
2005
-01-
0120
05-0
2-01
2005
-03-
0120
05-0
4-01
2005
-05-
0120
05-0
6-01
2005
-07-
0120
05-0
8-01
2005
-09-
0120
05-1
0-01
2005
-11-
0120
05-1
2-01
2006
-01-
0120
06-0
2-01
2006
-03-
0120
06-0
4-01
2006
-05-
0120
06-0
6-01
2006
-07-
0120
06-0
8-01
2006
-09-
0120
06-1
0-01
2006
-11-
0120
06-1
2-01
2007
-01-
0120
07-0
2-01
2007
-03-
0120
07-0
4-01
2007
-05-
0120
07-0
6-01
2007
-07-
0120
07-0
8-01
2007
-09-
0120
07-1
0-01
2007
-11-
0120
07-1
2-01
2008
-01-
0120
08-0
2-01
2008
-03-
0120
08-0
4-01
2008
-05-
0120
08-0
6-01
2008
-07-
0120
08-0
8-01
2008
-09-
0120
08-1
0-01
2008
-11-
0120
08-1
2-01
2009
-01-
0120
09-0
2-01
2009
-03-
0120
09-0
4-01
2009
-05-
0120
09-0
6-01
2009
-07-
0120
09-0
8-01
0
5
10
15
20
25
30
35
40
KA3546G1 – Daily average temperature outer section

134 SKB R-12-12
KA3548A01Temperature
KA3550G01Temperature
Tem
pera
ture
(°C
)
2003
-05-
0120
03-0
6-01
2003
-07-
0120
03-0
8-01
2003
-09-
0120
03-1
0-01
2003
-11-
0120
03-1
2-01
2004
-01-
0120
04-0
2-01
2004
-03-
0120
04-0
4-01
2004
-05-
0120
04-0
6-01
2004
-07-
0120
04-0
8-01
2004
-09-
0120
04-1
0-01
2004
-11-
0120
04-1
2-01
2005
-01-
0120
05-0
2-01
2005
-03-
0120
05-0
4-01
2005
-05-
0120
05-0
6-01
2005
-07-
0120
05-0
8-01
2005
-09-
0120
05-1
0-01
2005
-11-
0120
05-1
2-01
2006
-01-
0120
06-0
2-01
2006
-03-
0120
06-0
4-01
2006
-05-
0120
06-0
6-01
2006
-07-
0120
06-0
8-01
2006
-09-
0120
06-1
0-01
2006
-11-
0120
06-1
2-01
2007
-01-
0120
07-0
2-01
2007
-03-
0120
07-0
4-01
2007
-05-
0120
07-0
6-01
2007
-07-
0120
07-0
8-01
2007
-09-
0120
07-1
0-01
2007
-11-
0120
07-1
2-01
2008
-01-
0120
08-0
2-01
2008
-03-
0120
08-0
4-01
2008
-05-
0120
08-0
6-01
2008
-07-
0120
08-0
8-01
2008
-09-
0120
08-1
0-01
2008
-11-
0120
08-1
2-01
2009
-01-
0120
09-0
2-01
2009
-03-
0120
09-0
4-01
2009
-05-
0120
09-0
6-01
2009
-07-
0120
09-0
8-01
0
5
10
15
20
KA3548A1 – Daily average temperature inner section
Tem
pera
ture
(°C
)
2003
-05-
0120
03-0
6-01
2003
-07-
0120
03-0
8-01
2003
-09-
0120
03-1
0-01
2003
-11-
0120
03-1
2-01
2004
-01-
0120
04-0
2-01
2004
-03-
0120
04-0
4-01
2004
-05-
0120
04-0
6-01
2004
-07-
0120
04-0
8-01
2004
-09-
0120
04-1
0-01
2004
-11-
0120
04-1
2-01
2005
-01-
0120
05-0
2-01
2005
-03-
0120
05-0
4-01
2005
-05-
0120
05-0
6-01
2005
-07-
0120
05-0
8-01
2005
-09-
0120
05-1
0-01
2005
-11-
0120
05-1
2-01
2006
-01-
0120
06-0
2-01
2006
-03-
0120
06-0
4-01
2006
-05-
0120
06-0
6-01
2006
-07-
0120
06-0
8-01
2006
-09-
0120
06-1
0-01
0
5
10
15
20
25
30
35
40
45
50
KA3550G1 – Daily average temperature inner section
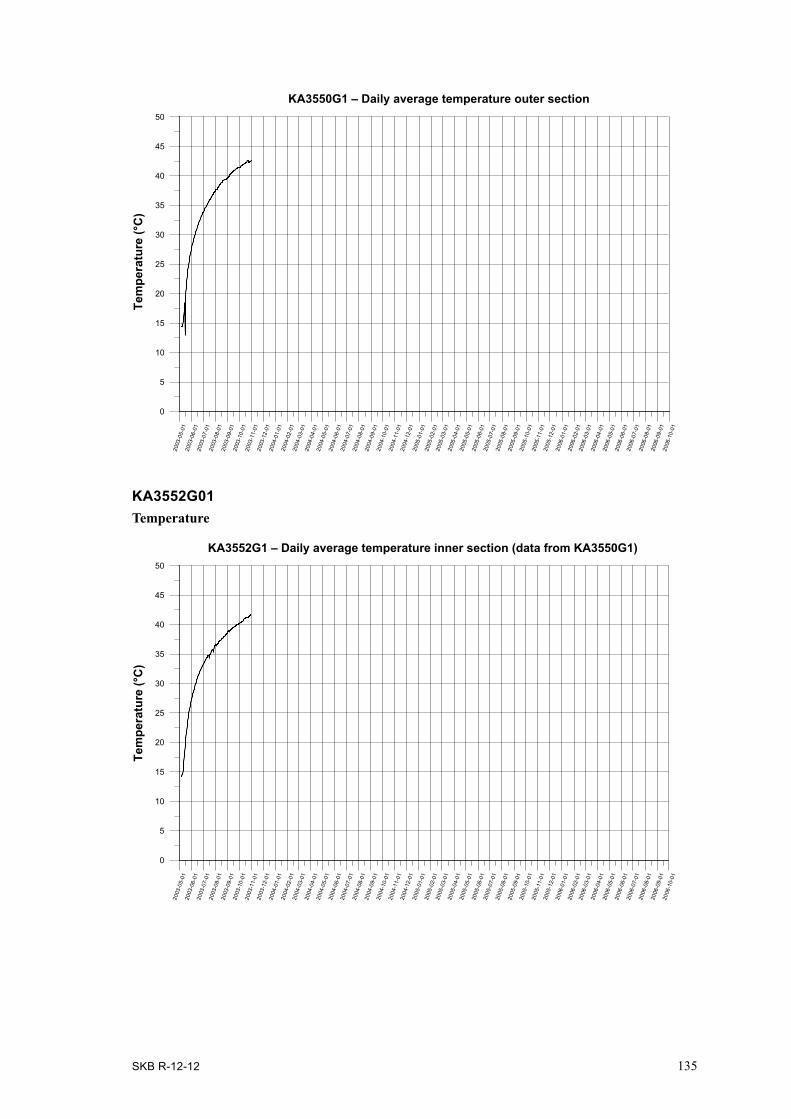
SKB R-12-12 135
2003
-05-
0120
03-0
6-01
2003
-07-
0120
03-0
8-01
2003
-09-
0120
03-1
0-01
2003
-11-
0120
03-1
2-01
2004
-01-
0120
04-0
2-01
2004
-03-
0120
04-0
4-01
2004
-05-
0120
04-0
6-01
2004
-07-
0120
04-0
8-01
2004
-09-
0120
04-1
0-01
2004
-11-
0120
04-1
2-01
2005
-01-
0120
05-0
2-01
2005
-03-
0120
05-0
4-01
2005
-05-
0120
05-0
6-01
2005
-07-
0120
05-0
8-01
2005
-09-
0120
05-1
0-01
2005
-11-
0120
05-1
2-01
2006
-01-
0120
06-0
2-01
2006
-03-
0120
06-0
4-01
2006
-05-
0120
06-0
6-01
2006
-07-
0120
06-0
8-01
2006
-09-
0120
06-1
0-01
0
5
10
15
20
25
30
35
40
45
50
Tem
pera
ture
(°C
)
KA3550G1 – Daily average temperature outer section
Tem
pera
ture
(°C
)
2003
-05-
0120
03-0
6-01
2003
-07-
0120
03-0
8-01
2003
-09-
0120
03-1
0-01
2003
-11-
0120
03-1
2-01
2004
-01-
0120
04-0
2-01
2004
-03-
0120
04-0
4-01
2004
-05-
0120
04-0
6-01
2004
-07-
0120
04-0
8-01
2004
-09-
0120
04-1
0-01
2004
-11-
0120
04-1
2-01
2005
-01-
0120
05-0
2-01
2005
-03-
0120
05-0
4-01
2005
-05-
0120
05-0
6-01
2005
-07-
0120
05-0
8-01
2005
-09-
0120
05-1
0-01
2005
-11-
0120
05-1
2-01
2006
-01-
0120
06-0
2-01
2006
-03-
0120
06-0
4-01
2006
-05-
0120
06-0
6-01
2006
-07-
0120
06-0
8-01
2006
-09-
0120
06-1
0-01
0
5
10
15
20
25
30
35
40
45
50
KA3552G1 – Daily average temperature inner section (data from KA3550G1)
KA3552G01Temperature

136 SKB R-12-12
Tem
pera
ture
(°C
)
2003
-05-
0120
03-0
6-01
2003
-07-
0120
03-0
8-01
2003
-09-
0120
03-1
0-01
2003
-11-
0120
03-1
2-01
2004
-01-
0120
04-0
2-01
2004
-03-
0120
04-0
4-01
2004
-05-
0120
04-0
6-01
2004
-07-
0120
04-0
8-01
2004
-09-
0120
04-1
0-01
2004
-11-
0120
04-1
2-01
2005
-01-
0120
05-0
2-01
2005
-03-
0120
05-0
4-01
2005
-05-
0120
05-0
6-01
2005
-07-
0120
05-0
8-01
2005
-09-
0120
05-1
0-01
2005
-11-
0120
05-1
2-01
2006
-01-
0120
06-0
2-01
2006
-03-
0120
06-0
4-01
2006
-05-
0120
06-0
6-01
2006
-07-
0120
06-0
8-01
2006
-09-
0120
06-1
0-01
0
5
10
15
20
25
30
35
40
45
50
KA3552G1 – Daily average temperature outer section (data from KA3550G1)Te
mpe
ratu
re(°
C)
2003
-05-
0120
03-0
6-01
2003
-07-
0120
03-0
8-01
2003
-09-
0120
03-1
0-01
2003
-11-
0120
03-1
2-01
2004
-01-
0120
04-0
2-01
2004
-03-
0120
04-0
4-01
2004
-05-
0120
04-0
6-01
2004
-07-
0120
04-0
8-01
2004
-09-
0120
04-1
0-01
2004
-11-
0120
04-1
2-01
2005
-01-
0120
05-0
2-01
2005
-03-
0120
05-0
4-01
2005
-05-
0120
05-0
6-01
2005
-07-
0120
05-0
8-01
2005
-09-
0120
05-1
0-01
2005
-11-
0120
05-1
2-01
2006
-01-
0120
06-0
2-01
2006
-03-
0120
06-0
4-01
2006
-05-
0120
06-0
6-01
2006
-07-
0120
06-0
8-01
2006
-09-
0120
06-1
0-01
2006
-11-
0120
06-1
2-01
2007
-01-
0120
07-0
2-01
2007
-03-
0120
07-0
4-01
2007
-05-
0120
07-0
6-01
2007
-07-
0120
07-0
8-01
2007
-09-
0120
07-1
0-01
2007
-11-
0120
07-1
2-01
2008
-01-
0120
08-0
2-01
2008
-03-
0120
08-0
4-01
2008
-05-
0120
08-0
6-01
2008
-07-
0120
08-0
8-01
2008
-09-
0120
08-1
0-01
2008
-11-
0120
08-1
2-01
2009
-01-
0120
09-0
2-01
2009
-03-
0120
09-0
4-01
2009
-05-
0120
09-0
6-01
2009
-07-
0120
09-0
8-01
0
5
10
15
20
KA3554G1 – Daily average temperature inner section
• The data is replaced with data from KA3550G01.
KA3554G01Temperature

SKB R-12-12 137
Tem
pera
ture
(°C
)
2003
-05-
0120
03-0
6-01
2003
-07-
0120
03-0
8-01
2003
-09-
0120
03-1
0-01
2003
-11-
0120
03-1
2-01
2004
-01-
0120
04-0
2-01
2004
-03-
0120
04-0
4-01
2004
-05-
0120
04-0
6-01
2004
-07-
0120
04-0
8-01
2004
-09-
0120
04-1
0-01
2004
-11-
0120
04-1
2-01
2005
-01-
0120
05-0
2-01
2005
-03-
0120
05-0
4-01
2005
-05-
0120
05-0
6-01
2005
-07-
0120
05-0
8-01
2005
-09-
0120
05-1
0-01
2005
-11-
0120
05-1
2-01
2006
-01-
0120
06-0
2-01
2006
-03-
0120
06-0
4-01
2006
-05-
0120
06-0
6-01
2006
-07-
0120
06-0
8-01
2006
-09-
0120
06-1
0-01
2006
-11-
0120
06-1
2-01
2007
-01-
0120
07-0
2-01
2007
-03-
0120
07-0
4-01
2007
-05-
0120
07-0
6-01
2007
-07-
0120
07-0
8-01
2007
-09-
0120
07-1
0-01
2007
-11-
0120
07-1
2-01
2008
-01-
0120
08-0
2-01
2008
-03-
0120
08-0
4-01
2008
-05-
0120
08-0
6-01
2008
-07-
0120
08-0
8-01
2008
-09-
0120
08-1
0-01
2008
-11-
0120
08-1
2-01
2009
-01-
0120
09-0
2-01
2009
-03-
0120
09-0
4-01
2009
-05-
0120
09-0
6-01
2009
-07-
0120
09-0
8-01
0
5
10
15
20
KA3554G1 – Daily average temperature outer section
Tem
pera
ture
(°C
)
2003
-05-
0120
03-0
6-01
2003
-07-
0120
03-0
8-01
2003
-09-
0120
03-1
0-01
2003
-11-
0120
03-1
2-01
2004
-01-
0120
04-0
2-01
2004
-03-
0120
04-0
4-01
2004
-05-
0120
04-0
6-01
2004
-07-
0120
04-0
8-01
2004
-09-
0120
04-1
0-01
2004
-11-
0120
04-1
2-01
2005
-01-
0120
05-0
2-01
2005
-03-
0120
05-0
4-01
2005
-05-
0120
05-0
6-01
2005
-07-
0120
05-0
8-01
2005
-09-
0120
05-1
0-01
2005
-11-
0120
05-1
2-01
2006
-01-
0120
06-0
2-01
2006
-03-
0120
06-0
4-01
2006
-05-
0120
06-0
6-01
2006
-07-
0120
06-0
8-01
2006
-09-
0120
06-1
0-01
2006
-11-
0120
06-1
2-01
2007
-01-
0120
07-0
2-01
2007
-03-
0120
07-0
4-01
2007
-05-
0120
07-0
6-01
2007
-07-
0120
07-0
8-01
2007
-09-
0120
07-1
0-01
2007
-11-
0120
07-1
2-01
2008
-01-
0120
08-0
2-01
2008
-03-
0120
08-0
4-01
2008
-05-
0120
08-0
6-01
2008
-07-
0120
08-0
8-01
2008
-09-
0120
08-1
0-01
2008
-11-
0120
08-1
2-01
2009
-01-
0120
09-0
2-01
2009
-03-
0120
09-0
4-01
2009
-05-
0120
09-0
6-01
2009
-07-
0120
09-0
8-01
0
5
10
15
20
25
KA3554G2 – Daily average temperature inner section
Data after 2004-08-01 is replaced by data from KA3542G01.

138 SKB R-12-12
KA3554G02Temperature
Tem
pera
ture
(°C
)
2003
-05-
0120
03-0
6-01
2003
-07-
0120
03-0
8-01
2003
-09-
0120
03-1
0-01
2003
-11-
0120
03-1
2-01
2004
-01-
0120
04-0
2-01
2004
-03-
0120
04-0
4-01
2004
-05-
0120
04-0
6-01
2004
-07-
0120
04-0
8-01
2004
-09-
0120
04-1
0-01
2004
-11-
0120
04-1
2-01
2005
-01-
0120
05-0
2-01
2005
-03-
0120
05-0
4-01
2005
-05-
0120
05-0
6-01
2005
-07-
0120
05-0
8-01
2005
-09-
0120
05-1
0-01
2005
-11-
0120
05-1
2-01
2006
-01-
0120
06-0
2-01
2006
-03-
0120
06-0
4-01
2006
-05-
0120
06-0
6-01
2006
-07-
0120
06-0
8-01
2006
-09-
0120
06-1
0-01
2006
-11-
0120
06-1
2-01
2007
-01-
0120
07-0
2-01
2007
-03-
0120
07-0
4-01
2007
-05-
0120
07-0
6-01
2007
-07-
0120
07-0
8-01
2007
-09-
0120
07-1
0-01
2007
-11-
0120
07-1
2-01
2008
-01-
0120
08-0
2-01
2008
-03-
0120
08-0
4-01
2008
-05-
0120
08-0
6-01
2008
-07-
0120
08-0
8-01
2008
-09-
0120
08-1
0-01
2008
-11-
0120
08-1
2-01
2009
-01-
0120
09-0
2-01
2009
-03-
0120
09-0
4-01
2009
-05-
0120
09-0
6-01
2009
-07-
0120
09-0
8-01
0
5
10
15
20
25
KA3554G2 – Daily average temperature outer section
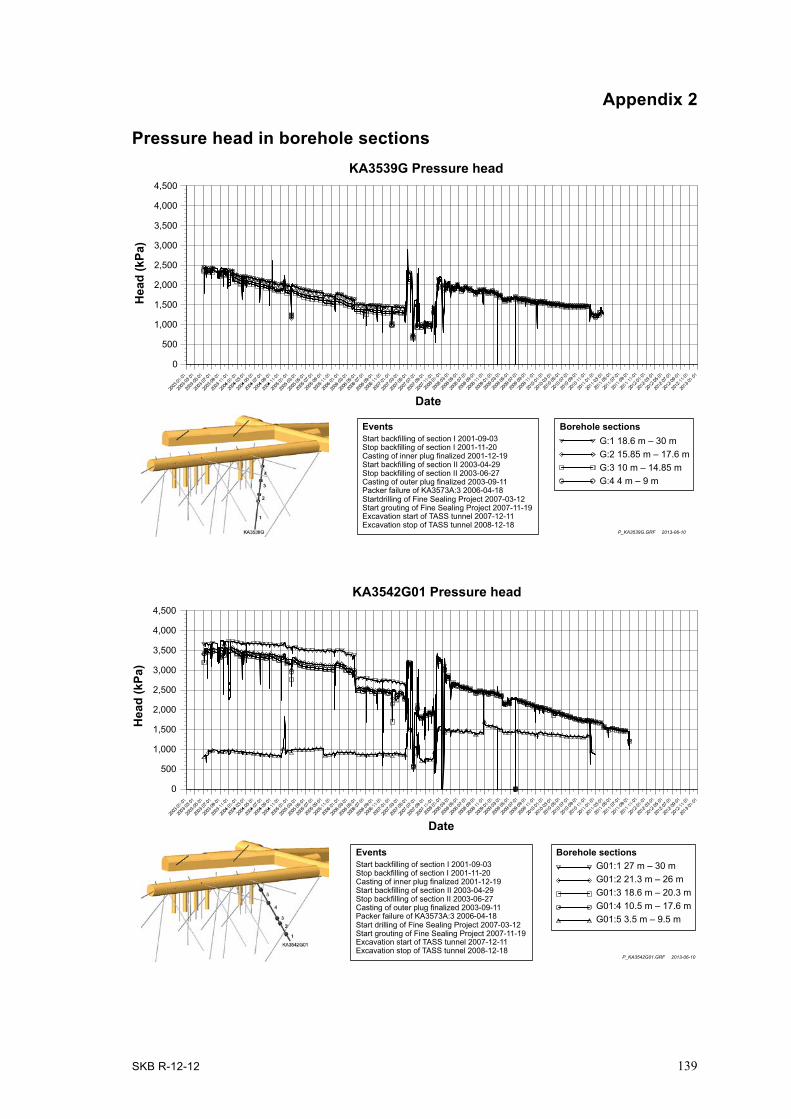
SKB R-12-12 139
Appendix 2
Pressure head in borehole sectionsH
ead
(kPa
)
Borehole sectionsG:1 18.6 m – 30 mG:2 15.85 m – 17.6 m
G:3 10 m – 14.85 mG:4 4 m – 9 m
P_KA3539G.GRF
2013-06-10
EventsStart backfilling of section I 2001-09-03Stop backfilling of section I 2001-11-20Casting of inner plug finalized 2001-12-19 Start backfilling of section II 2003-04-29Stop backfilling of section II 2003-06-27 Casting of outer plug finalized 2003-09-11 Packer failure of KA3573A:3 2006-04-18 Startdrilling of Fine Sealing Project 2007-03-12Start grouting of Fine Sealing Project 2007-11-19 Excavation start of TASS tunnel 2007-12-11 Excavation stop of TASS tunnel 2008-12-18
Date
0
500
1,000
1,500
2,000
2,500
3,000
3,500
4,000
4,500
Borehole sectionsG01:1 27 m – 30 mG01:2 21.3 m – 26 m
G01:3 18.6 m – 20.3 mG01:4 10.5 m – 17.6 mG01:5 3.5 m – 9.5 m
P_KA3542G01.GRF
2013-06-10
EventsStart backfilling of section I 2001-09-03Stop backfilling of section I 2001-11-20 Casting of inner plug finalized 2001-12-19 Start backfilling of section II 2003-04-29 Stop backfilling of section II 2003-06-27Casting of outer plug finalized 2003-09-11Packer failure of KA3573A:3 2006-04-18Start drilling of Fine Sealing Project 2007-03-12Start grouting of Fine Sealing Project 2007-11-19Excavation start of TASS tunnel 2007-12-11Excavation stop of TASS tunnel 2008-12-18
KA3539G Pressure head
KA3542G01 Pressure head
Date
Hea
d (k
Pa)
0
500
1,000
1,500
2,000
2,500
3,000
3,500
4,000
4,500

140 SKB R-12-12
G02:1 28.2 m – 30.01 m
G02:2 25.6 m – 27.2 mG02:3 21.5 m – 24.6 m
G02:4 9 m – 20.5 mG02:5 2 m – 8 m
P_KA3542G02.GRF
2013-06-10
G01:1 11.65 m – 12 mG01:2 8.9 m – 10.65 mG01:3 3.5 m – 7.9 m
P_KA3544G01.GRF
2013-06-10
Hea
d (k
Pa)
Hea
d (k
Pa)
KA3542G02 Pressure head
KA3544G01 Pressure head
Date
Date
0
500
1,000
1,500
2,000
2,500
3,000
3,500
4,000
4,500
0
500
1,000
1,500
2,000
2,500
3,000
3,500
4,000
4,500
EventsStart backfilling of section I 2001-09-03Stop backfilling of section I 2001-11-20 Casting of inner plug finalized 2001-12-19 Start backfilling of section II 2003-04-29 Stop backfilling of section II 2003-06-27Casting of outer plug finalized 2003-09-11Packer failure of KA3573A:3 2006-04-18Start drilling of Fine Sealing Project 2007-03-12Start grouting of Fine Sealing Project 2007-11-19Excavation start of TASS tunnel 2007-12-11Excavation stop of TASS tunnel 2008-12-18
Borehole sections

SKB R-12-12 141
G01:1 9.3 m – 12 mG01:2 6.75 m – 8.3 mG01:3 1.5 m – 5.75 m
KA3546G01 Pressure head
P_KA3546G01.GRF
2013-06-10
A01:1 21.5 m – 30 mA01:2 11.75 m – 20.5 mA01:3 8.8 m – 10.75 mA01:4 3 m – 7.8 m
KA3548A01 Pressure head
P_KA3548A01.GRF
2013-06-10
EventsStart backfilling of section I 2001-09-03Stop backfilling of section I 2001-11-20 Casting of inner plug finalized 2001-12-19 Start backfilling of section II 2003-04-29 Stop backfilling of section II 2003-06-27Casting of outer plug finalized 2003-09-11Packer failure of KA3573A:3 2006-04-18Start drilling of Fine Sealing Project 2007-03-12Start grouting of Fine Sealing Project 2007-11-19Excavation start of TASS tunnel 2007-12-11Excavation stop of TASS tunnel 2008-12-18
EventsStart backfilling of section I 2001-09-03Stop backfilling of section I 2001-11-20 Casting of inner plug finalized 2001-12-19 Start backfilling of section II 2003-04-29 Stop backfilling of section II 2003-06-27Casting of outer plug finalized 2003-09-11Packer failure of KA3573A:3 2006-04-18Start drilling of Fine Sealing Project 2007-03-12Start grouting of Fine Sealing Project 2007-11-19Excavation start of TASS tunnel 2007-12-11Excavation stop of TASS tunnel 2008-12-18
Borehole sections
Borehole sections
Date
Date
Hea
d (k
Pa)
Hea
d (k
Pa)
0
500
1,000
1,500
2,000
2,500
3,000
3,500
4,000
4,500
0
500
1,000
1,500
2,000
2,500
3,000
3,500
4,000
4,500

142 SKB R-12-12
G01:1 8.3 m – 12.03 mG01:2 5.2 m – 7.3 mG01:3 1.8 m – 4.2 m
KA3550G01 Pressure head
P_KA3550G01.GRF
2013-06-10
G01:1 7.05 m – 12 m G01:2 4.35 m – 6.05 m G01:3 1.5 m – 3.35 m
KA3552G01 Pressure head
P_KA3552G01.GRF
2013-08-15
Hea
d (k
Pa)
Hea
d (k
Pa)
0
500
1,000
1,500
2,000
2,500
3,000
3,500
4,000
4,500
0
500
1,000
1,500
2,000
2,500
3,000
3,500
4,000
4,500
Date
Date
EventsStart backfilling of section I 2001-09-03Stop backfilling of section I 2001-11-20 Casting of inner plug finalized 2001-12-19 Start backfilling of section II 2003-04-29 Stop backfilling of section II 2003-06-27Casting of outer plug finalized 2003-09-11Packer failure of KA3573A:3 2006-04-18Start drilling of Fine Sealing Project 2007-03-12Start grouting of Fine Sealing Project 2007-11-19Excavation start of TASS tunnel 2007-12-11Excavation stop of TASS tunnel 2008-12-18
Borehole sections
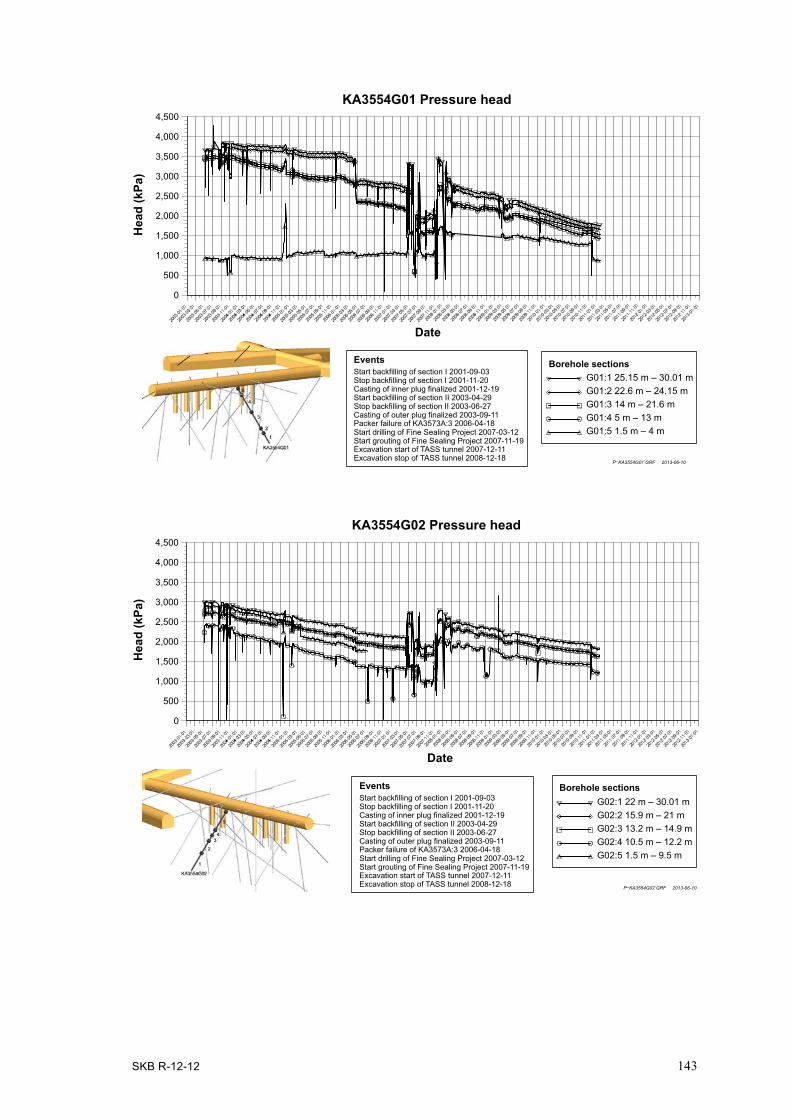
SKB R-12-12 143
G01:1 25.15 m – 30.01 m G01:2 22.6 m – 24.15 mG01:3 14 m – 21.6 mG01:4 5 m – 13 mG01:5 1.5 m – 4 m
KA3554G01 Pressure head
P_KA3554G01.GRF
2013-06-10
G02:1 22 m – 30.01 mG02:2 15.9 m – 21 mG02:3 13.2 m – 14.9 mG02:4 10.5 m – 12.2 mG02:5 1.5 m – 9.5 m
KA3554G02 Pressure head
P_KA3554G02.GRF
2013-06-10
Hea
d (k
Pa)
Hea
d (k
Pa)
Date
Date
Borehole sections
Borehole sections
EventsStart backfilling of section I 2001-09-03Stop backfilling of section I 2001-11-20 Casting of inner plug finalized 2001-12-19 Start backfilling of section II 2003-04-29 Stop backfilling of section II 2003-06-27Casting of outer plug finalized 2003-09-11Packer failure of KA3573A:3 2006-04-18Start drilling of Fine Sealing Project 2007-03-12Start grouting of Fine Sealing Project 2007-11-19Excavation start of TASS tunnel 2007-12-11Excavation stop of TASS tunnel 2008-12-18
EventsStart backfilling of section I 2001-09-03Stop backfilling of section I 2001-11-20 Casting of inner plug finalized 2001-12-19 Start backfilling of section II 2003-04-29 Stop backfilling of section II 2003-06-27Casting of outer plug finalized 2003-09-11Packer failure of KA3573A:3 2006-04-18Start drilling of Fine Sealing Project 2007-03-12Start grouting of Fine Sealing Project 2007-11-19Excavation start of TASS tunnel 2007-12-11Excavation stop of TASS tunnel 2008-12-18
0
500
1,000
1,500
2,000
2,500
3,000
3,500
4,000
4,500
0
500
1,000
1,500
2,000
2,500
3,000
3,500
4,000
4,500

SKB R-12-12 145
Appendix 3
Hydraulic tests, operation phase Prototype repository
Table A3-1. Single hole tests during the campaign in May 2003.
Borehole Section (m) HM section
Single hole test no.
Date of test Start of test
Flow start Flow stop Test stop
KA3550G01:2(1) 5.20–7.30 X – – – – – –KA3552G01:2 4.35–6.05 X 1:1 2003-05-08 10:00:00 10:52:00 11:39:00 13:58:00KA3554G01:2 22.60–24.15 X 1:2 2003-05-08 13:15:00 13:46:00 14:16:00 16:00:00KA3554G02:4 10.50–12.20 X 1:3 2003-05-08 14:45:00 15:16:00 15:46:00 18:00:00KA3548A01:3 8.80–10.75 X 1:4 2003-05-08 16:15:00 16:46:00 17:16:00 20:00:00KA3542G01:3 18.60–20.30 X 1:5 2003-05-08 17:53:00 18:23:00 18:53:00 21:00:00KA3544G01:2 8.90–10.65 X 1:6 2003-05-08 19:23:00 19:53:00 20:43:00 23:00:00KA3542G02:2 25.60–27.20 X 1:7 2003-05-09 05:55:00 06:25:00 07:25:00 10:00:00KA3563G:4 1.50–3.00 – 1:8 2003-05-09 05:55:00 06:26:00 07:26:00 10:00:00KA3546G01:2 6.75–8.30 X 1:9 2003-05-10 06:00:00 06:30:00 07:30:05 10:00:00KA3566G01:2 20.0–21.5 – 1:10 2003-05-10 06:00:00 06:34:00 07:34:00 10:00:00KA3572G01:2 2.70–5.30 – 1:11 2003-05-11 08:00:00 08:30:00 09:30:00 12:00:00KA3574G01:3 1.80–4.10 – 1:12 2003-05-11 08:00:00 08:32:00 09:32:00 12:00:00KA3539G:2 15.85–17.6 X 1:13 2003-05-09 08:00:00 08:40:00 14:50:00 06:30:00
(1) indicates packer system failure, “X” indicates that section is equipped with HM sensors.
Table A3-2. Interference tests during the campaign in May 2003.
Borehole Section (m) HM section
Test no.
Date of test Start of test
Flow start Flow stop Test stop (Next day)
KA3539G:2 15.85–17.60 X 1:21 2003-05-09 06:40:00 08:40:00 14:50:00 06:30:00KA3542G02:5 2.00–8.00 – 1:22 2003-05-10 06:55:00 08:55:00 14:55:00 08:30:00KA3554G01:2 22.60–24.15 X 1:23 2003-05-11 08:35:00 10:35:00 16:35:00 09:41:00KA3590G02:1 25.50–30.01 – 1:24 2003-05-12 07:41:00 09:41:00 15:41:00 09:40:00KG0021A01:3 35.00–36.00 – 1:25 2003-05-13 07:40:00 09:40:00 15:40:00 09:40:00KG0048A01:3 32.80–33.80 – 1:26 2003-05-14 07:40:00 09:40:00 15:40:00 09:40:00KA3573A:4 10.50–12.50 – 1:27 2003-05-15 07:40:00 09:40:00 15:40:00 09:40:00
Table A3-3. Single hole tests during the campaign in October 2003.
Borehole Section (m) HM section
Single hole test no.
Date of test Start of test
Flow start Flow stop Test stop
KA3550G01:2(1) 5.20–7.30 X – – – – – –KA3552G01:2 4.35–6.05 X 2:1 2003-10-21 10:30:00 12:30:00 14:30:00 15:30:00KA3554G01:2 22.60–24.15 X 2:2 2003-10-21 13:30:00 15:30:00 16:00:00 17:00:00KA3554G02:4 10.50–12.20 X 2:3 2003-10-22 05:45:00 07:45:00 09:45:00 10:45:00KA3548A01:3 8.80–10.75 X 2:4 2003-10-22 16:15:00 18:15:00 18:45:00 19:45:00KA3542G01:3 18.60–20.30 X 2:5 2003-10-22 14:45:00 16:45:00 17:15:00 18:15:00KA3544G01:2 8.90–10.65 X 2:6 2003-10-22 08:45:00 10:45:00 12:45:00 13:45:00KA3542G02:2 25.60–27.20 X 2:7 2003-10-23 05:15:00 07:15:00 09:15:00 10:15:00KA3546G01:2 6.75–8.30 X 2:9 2003-10-22 11:45:00 13:45:00 15:45:00 16:45:00KA3539G:2 15.85–17.6 X 2:13 2003-10-23 08:15:00 10:15:00 10:45:00 12:45:00
(1) indicates packer system failure, “X” indicates that section is equipped with HM sensors.
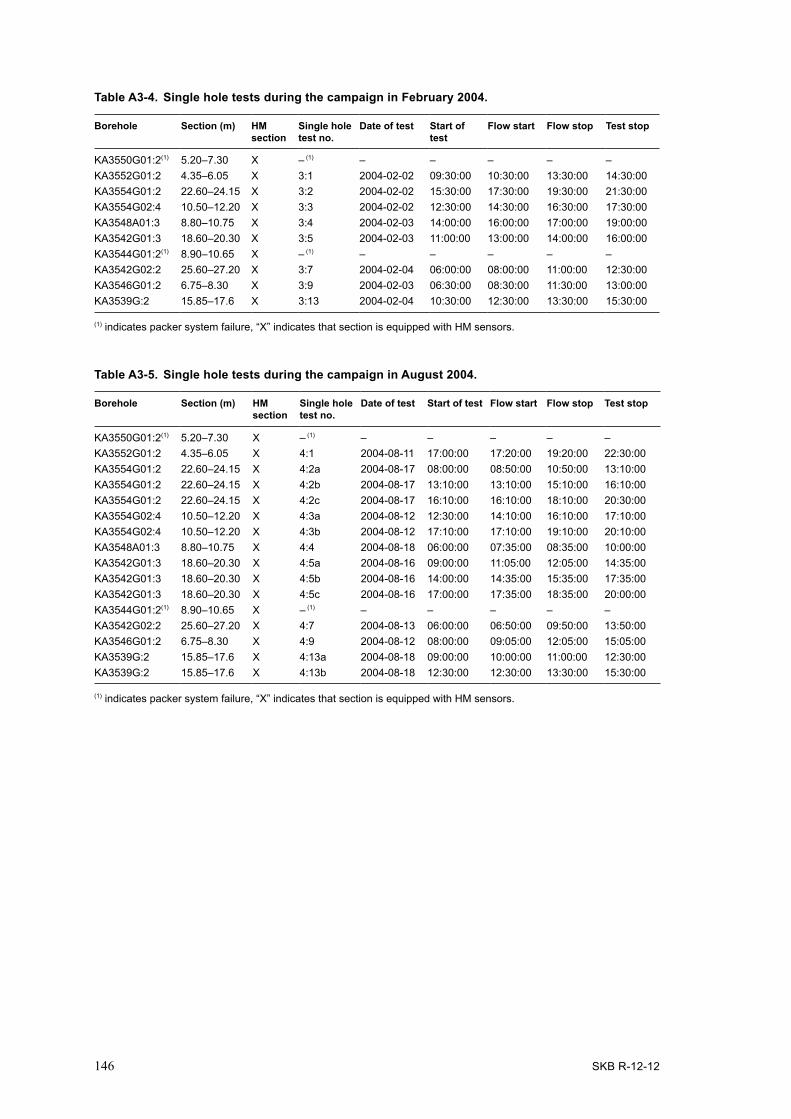
146 SKB R-12-12
Table A3-4. Single hole tests during the campaign in February 2004.
Borehole Section (m) HM section
Single hole test no.
Date of test Start of test
Flow start Flow stop Test stop
KA3550G01:2(1) 5.20–7.30 X – (1) – – – – –KA3552G01:2 4.35–6.05 X 3:1 2004-02-02 09:30:00 10:30:00 13:30:00 14:30:00KA3554G01:2 22.60–24.15 X 3:2 2004-02-02 15:30:00 17:30:00 19:30:00 21:30:00KA3554G02:4 10.50–12.20 X 3:3 2004-02-02 12:30:00 14:30:00 16:30:00 17:30:00KA3548A01:3 8.80–10.75 X 3:4 2004-02-03 14:00:00 16:00:00 17:00:00 19:00:00KA3542G01:3 18.60–20.30 X 3:5 2004-02-03 11:00:00 13:00:00 14:00:00 16:00:00KA3544G01:2(1) 8.90–10.65 X – (1) – – – – –KA3542G02:2 25.60–27.20 X 3:7 2004-02-04 06:00:00 08:00:00 11:00:00 12:30:00KA3546G01:2 6.75–8.30 X 3:9 2004-02-03 06:30:00 08:30:00 11:30:00 13:00:00KA3539G:2 15.85–17.6 X 3:13 2004-02-04 10:30:00 12:30:00 13:30:00 15:30:00
(1) indicates packer system failure, “X” indicates that section is equipped with HM sensors.
Table A3-5. Single hole tests during the campaign in August 2004.
Borehole Section (m) HM section
Single hole test no.
Date of test Start of test Flow start Flow stop Test stop
KA3550G01:2(1) 5.20–7.30 X – (1) – – – – –KA3552G01:2 4.35–6.05 X 4:1 2004-08-11 17:00:00 17:20:00 19:20:00 22:30:00KA3554G01:2 22.60–24.15 X 4:2a 2004-08-17 08:00:00 08:50:00 10:50:00 13:10:00KA3554G01:2 22.60–24.15 X 4:2b 2004-08-17 13:10:00 13:10:00 15:10:00 16:10:00KA3554G01:2 22.60–24.15 X 4:2c 2004-08-17 16:10:00 16:10:00 18:10:00 20:30:00KA3554G02:4 10.50–12.20 X 4:3a 2004-08-12 12:30:00 14:10:00 16:10:00 17:10:00KA3554G02:4 10.50–12.20 X 4:3b 2004-08-12 17:10:00 17:10:00 19:10:00 20:10:00KA3548A01:3 8.80–10.75 X 4:4 2004-08-18 06:00:00 07:35:00 08:35:00 10:00:00KA3542G01:3 18.60–20.30 X 4:5a 2004-08-16 09:00:00 11:05:00 12:05:00 14:35:00KA3542G01:3 18.60–20.30 X 4:5b 2004-08-16 14:00:00 14:35:00 15:35:00 17:35:00KA3542G01:3 18.60–20.30 X 4:5c 2004-08-16 17:00:00 17:35:00 18:35:00 20:00:00KA3544G01:2(1) 8.90–10.65 X – (1) – – – – –KA3542G02:2 25.60–27.20 X 4:7 2004-08-13 06:00:00 06:50:00 09:50:00 13:50:00KA3546G01:2 6.75–8.30 X 4:9 2004-08-12 08:00:00 09:05:00 12:05:00 15:05:00KA3539G:2 15.85–17.6 X 4:13a 2004-08-18 09:00:00 10:00:00 11:00:00 12:30:00KA3539G:2 15.85–17.6 X 4:13b 2004-08-18 12:30:00 12:30:00 13:30:00 15:30:00
(1) indicates packer system failure, “X” indicates that section is equipped with HM sensors.

SKB R-12-12 147
Table A3-6. Single hole tests during the campaign in January 2005.
Borehole Section (m) HM section
Single hole test no.
Date of test Start of test Flow start Flow stop Test stop
KA3550G01:2(1) 5.20–7.30 X – (1) – – – – –KA3552G01:2 4.35–6.05 X 5:1 2005-01-23 11:00:00 13:05:00 15:00:00 17:00:00KA3554G01:2 22.60–24.15 X 5:2a 2005-01-20 10:30:00 12:30:00 14:30:00 16:30:00KA3554G01:2 22.60–24.15 X 5:2b 2005-01-21 10:00:00 12:00:00 14:00:00 16:00:00KA3554G01:2 22.60–24.15 X 5:2c 2005-01-22 13:00:00 15:00:00 21:00:00 15:00:00*KA3554G02:4 10.50–12.20 X 5:3a 2005-01-24 08:00:00 09:00:00 11:00:00 13:00:00KA3554G02:4 10.50–12.20 X 5:3b 2005-01-25 15:00:00 16:00:00 18:00:00 20:00:00KA3548A01:3 8.80–10.75 X 5:4a 2005-01-20 06:00:00 07:15:00 08:15:00 10:15:00KA3548A01:3 8.80–10.75 X 5:4b 2005-01-23 10:00:00 11:00:00 12:00:00 14:00:00KA3548A01:3 8.80–10.75 X 5:4c 2005-01-24 06:00:00 07:00:00 08:00:00 10:00:00KA3542G01:3 18.60–20.30 X 5:5a 2005-01-20 08:00:00 09:15:00 10:15:00 12:15:00KA3542G01:3 18.60–20.30 X 5:5b 2005-01-21 08:00:00 09:00:00 10:00:00 12:00:00KA3542G01:3 18.60–20.30 X 5:5c 2005-01-22 06:00:00 07:00:00 08:00:00 10:00:00KA3544G01:2(1) 8.90–10.65 X – (1) – – – – –KA3542G02:2 25.60–27.20 X 5:7a 2005-01-22 08:00:00 10:00:00 13:00:00 15:00:00KA3542G02:2 25.60–27.20 X 5:7b 2005-01-23 06:00:00 07:00:00 10:00:00 12:00:00KA3563G:4 1.50–3.00 – 5:8 2005-01-24 11:00:00 12:00:00 13:00:00 15:00:00KA3546G01:2 6.75–8.30 X 5:9 2005-01-25 10:00:00 11:00:00 14:00:00 16:00:00KA3566G01:2 20.00–21.50 – 5:10 2005-01-25 06:00:00 07:00:00 07:58:00 10:00:00KA3572G01:2 2.70–5.30 – 5:11 2005-01-21 06:00:00 07:00:00 08:00:00 10:00:00KA3574G01:3 1.80–4.10 – 5:12 2005-01-25 08:00:00 09:00:00 10:00:00 12:00:00KA3539G:2 15.85–17.60 X 5:13a 2005-01-19 12:00:00 13:30:00 14:30:00 16:30:00KA3539G:2 15.85–17.60 X 5:13b 2005-01-20 14:30:00 15:30:00 21:30:00 15:30:00*
(1) indicates packer system failure, “X” indicates that section is equipped with HM sensors.
Table A3-7. Interference tests during the campaign in January 2005.
Borehole Section (m) HM section
Test no.
Date of test Start of test
Flow start Flow stop Test stop (Next day)
KA3539G:2 15.85–17.60 X 5:21 2005-01-20 13:30:00 15:30:00 21:30:00 15:30:00KA3542G02:5 2.00–8.00 – 5:22 2005-01-24 13:00:00 15:00:00 21:00:00 15:00:00KA3554G01:2 22.60–24.15 X 5:23 2005-01-22 13:00:00 15:00:00 21:00:00 15:00:00KA3590G02:1 25.50–30.01 – 5:24 2005-01-21 13:00:00 15:00:00 21:00:00 15:00:00KG0021A01:3 35.00–36.00 – 5:25 2005-01-19 14:00:00 16:00:00 22:00:00 16:00:00KG0048A01:3 32.80–33.80 – 5:26 2005-01-23 14:00:00 16:00:00 22:00:00 16:00:00KA3573A:4 10.50–12.50 – 5:27 2005-01-25 17:00:00 19:00:00 15:00:00* 19:00:00**
* = 2005-01-26, ** = 2005-01-28.

148 SKB R-12-12
Table A3-8. Single hole tests during the campaign in November–December 2005.
Borehole Section (m) HM section
Single hole test no.
Date of test Start of test
Flow start Flow stop Test stop
KA3550G01:2(1) 5.20–7.30 X – (1) – – – – –KA3552G01:2 4.35–6.05 X 6:1 2005-11-30 12:00:00 13:00:00 15:00:00 16:00:00KA3554G01:2 22.60–24.15 X 6:2a 2005-11-28 18:00:00 19:00:00 21:00:00 22:00:00KA3554G01:2 22.60–24.15 X 6:2b 2005-11-29 17:00:00 18:00:00 20:00:00 21:00:00KA3554G01:2 22.60–24.15 X 6:2c 2005-11-30 17:00:00 18:00:00 20:00:00 21:00:00KA3554G02:4 10.50–12.20 X 6:3a 2005-11-29 07:00:00 08:00:00 10:00:00 11:00:00KA3554G02:4 10.50–12.20 X 6:3b 2005-12-01 12:00:00 13:00:00 15:00:00 16:00:00KA3548A01:3 8.80–10.75 X 6:4a 2005-11-29 15:00:00 16:00:00 17:00:00 18:00:00KA3548A01:3 8.80–10.75 X 6:4b 2005-11-30 15:00:00 16:00:00 17:00:00 18:00:00KA3548A01:3 8.80–10.75 X 6:4c 2005-12-01 15:10:00 16:10:00 17:10:00 18:10:00KA3542G01:3 18.60–20.30 X 6:5c 2005-11-28 13:40:00 14:00:00 15:00:00 17:00:00KA3542G01:3 18.60–20.30 X 6:5a 2005-11-29 10:00:00 11:00:00 12:00:00 14:00:00KA3542G01:3 18.60–20.30 X 6:5b 2005-12-01 17:15:00 18:15:00 19:15:00 21:15:00KA3544G01:2(1) 8.90–10.65 X – (1) – – – – –KA3542G02:2 25.60–27.20 X 6:7a 2005-12-01 07:00:00 08:00:00 11:00:00 13:00:00KA3542G02:2 25.60–27.20 X 6:7b 2005-12-02 06:30:00 07:30:00 10:30:00 12:30:00KA3563G:4 1.50–3.00 – – (2) – – – – –KA3546G01:2 6.75–8.30 X 6:9 2005-11-30 07:00:00 08:00:00 11:00:00 13:00:00KA3566G01:2 20.00–21.50 – – (2) – – – – –KA3572G01:2 2.70–5.30 – – (2) – – – – –KA3574G01:3 1.80–4.10 – – (2) – – – – –KA3539G:2 15.85–17.60 X 6:13a 2005-11-28 16:00:00 17:00:00 18:00:00 19:00:00KA3539G:2 15.85–17.60 X 6:13b 2005-11-29 13:00:00 14:00:00 16:00:00 16:00:00
(1) indicates packer system failure, “X” indicates that section is equipped with HM sensors. (2) indicates no test is done in this campaign.
Table A3-9. Single hole tests during the campaign in September 2006.
Borehole Section (m) HM section
Single hole test no.
Date of test Start of test
Flow start Flow stop Test stop
KA3550G01:2(1) 5.20–7.30 X – (1) – – – – –KA3552G01:2 4.35–6.05 X 7:1 2006-09-28 08:00:00 09:00:00 11:00:00 12:00:00KA3554G01:2 22.60–24.15 X 7:2a 2006-09-25 12:00:00 13:00:00 15:00:00 17:00:00KA3554G01:2 22.60–24.15 X 7:2b 2006-09-26 09:00:00 10:00:00 12:00:00 13:00:00KA3554G01:2 22.60–24.15 X 7:2c 2006-09-27 08:00:00 09:00:00 11:00:00 12:00:00KA3554G02:4 10.50–12.20 X 7:3a 2006-09-26 06:00:00 07:00:00 09:00:00 10:00:00KA3554G02:4 10.50–12.20 X 7:3b 2006-09-28 11:00:00 12:00:00 14:00:00 15:00:00KA3548A01:3 8.80–10.75 X 7:4a 2006-09-26 14:00:00 15:00:00 16:00:00 17:00:00KA3548A01:3 8.80–10.75 X 7:4b 2006-09-27 06:00:00 07:00:00 08:00:00 09:00:00KA3548A01:3 8.80–10.75 X 7:4c 2006-09-28 06:00:00 07:00:00 08:00:00 09:00:00KA3542G01:3 18.60–20.30 X 7:5a 2006-09-25 17:00:00 18:00:00 19:00:00 21:00:00KA3542G01:3 18.60–20.30 X 7:5b 2006-09-26 16:00:00 17:00:00 18:00:00 20:00:00KA3542G01:3 18.60–20.30 X 7:5c 2006-09-27 16:00:00 17:00:00 18:00:00 20:00:00KA3544G01:2(1) 8.90–10.65 X – (1) – – – – –KA3542G02:2 25.60–27.20 X 7:7a 2006-09-28 14:00:00 15:00:00 18:00:00 20:00:00KA3542G02:2 25.60–27.20 X 7:7b 2006-09-29 04:30:00 05:30:00 08:30:00 10:30:00KA3563G:4 1.50–3.00 – – (2) – – – – –KA3546G01:2 6.75–8.30 X 7:9 2006-09-27 11:00:00 12:00:00 15:00:00 17:00:00KA3566G01:2 20.00–21.50 – – (2) – – – – –KA3572G01:2 2.70–5.30 – – (2) – – – – –KA3574G01:3 1.80–4.10 – – (2) – – – – –KA3539G:2 15.85–17.60 X 7:13a 2006-09-25 15:00:00 16:00:00 17:00:00 18:00:00KA3539G:2 15.85–17.60 X 7:13b 2006-09-26 12:00:00 13:00:00 14:00:00 15:00:00
(1) indicates packer system failure, “X” indicates that section is equipped with HM sensors. (2) indicates no test is done in this campaign.

SKB R-12-12 149
Table A3-10. Single hole tests during the campaign in October 2007.
Borehole Section (m) HM section
Single hole test no.
Date of test Start of test
Flow start Flow stop Test stop
KA3550G01:2(1) 5.20–7.30 X – (1) – – – – –KA3552G01:2 4.35–6.05 X 8:1 2007-10-18 07:30:00 08:30:30 10:30:00 11:30:00KA3554G01:2 22.60–24.15 X 8:2a 2007-10-15 14:40:00 15:41:00 17:40:00 18:40:00KA3554G01:2 22.60–24.15 X 8:2b 2007-10-16 09:00:00 10:00:00 12:00:00 13:00:00KA3554G01:2 22.60–24.15 X 8:2c 2007-10-17 07:30:00 08:30:00 10:30:00 11:30:00KA3554G02:4 10.50–12.20 X 8:3a 2007-10-16 06:00:00 07:00:00 09:00:00 10:00:00KA3554G02:4 10.50–12.20 X 8:3b 2007-10-17 10:30:00 11:30:00 13:30:00 14:30:00KA3548A01:3 8.80–10.75 X 8:4a 2007-10-16 14:20:00 15:20:00 16:20:00 17:20:00KA3548A01:3 8.80–10.75 X 8:4b 2007-10-17 05:30:00 06:30:00 07:30:00 08:30:00KA3548A01:3 8.80–10.75 X 8:4c 2007-10-18 05:30:00 06:30:00 07:30:00 08:30:00KA3542G01:3 18.60–20.30 X 8:5a 2007-10-15 19:40:00 20:40:00 21:40:00 23:40:00KA3542G01:3 18.60–20.30 X 8:5b 2007-10-16 19:20:00 20:20:00 21:20:00 23:20:00KA3542G01:3 18.60–20.30 X 8:5c 2007-10-17 15:35:00 16:35:00 17:35:00 19:35:00KA3544G01:2(1) 8.90–10.65 X – (1) – – – – –KA3542G02:2 25.60–27.20 X 8:7a 2007-10-18 13:30:00 14:30:00 17:30:00 19:00:00KA3542G02:2 25.60–27.20 X 8:7b 2007-10-19 04:50:00 05:50:00 08:50:00 10:20:00KA3563G:4 1.50–3.00 – – (2) – – – – –KA3546G01:2 6.75–8.30 X 8:9 2007-10-17 10:35:00 11:35:00 14:35:05 16:05:00KA3566G01:2 20.00–21.50 – – (2) – – – – –KA3572G01:2 2.70–5.30 – – (2) – – – – –KA3574G01:3 1.80–4.10 – – (2) – – – – –KA3539G:2 15.85–17.60 X 8:13a 2007-10-15 17:40:00 18:40:00 19:40:00 20:40:00KA3539G:2 15.85–17.60 X 8:13b 2007-10-16 12:00:00 13:00:00 14:00:00 15:00:00
(1) indicates packer system failure, “X” indicates that section is equipped with HM sensors. (2) indicates no test is done in this campaign.
Table A3-11. Single hole tests during the campaign in October 2008. (HMS time).
Borehole Section (m) HM section
Single hole test no.
Date of test Start of test
Flow start Flow stop Test stop
KA3550G01:2(1) 5.20–7.30 X – (1) – – – – –KA3552G01:2 4.35–6.05 X 9:1 2008-10-23 09:00:00 10:00:00 – (3) –KA3554G01:2 22.60–24.15 X 9:2a 2008-10-20 13:25:00 14:25:00 16:25:00 17:25:00KA3554G01:2 22.60–24.15 X 9:2b 2008-10-21 10:00:00 11:00:00 13:00:00 14:00:00KA3554G01:2 22.60–24.15 X 9:2c 2008-10-22 08:40:00 09:40:00 11:40:00 12:40:00KA3554G02:4 10.50–12.20 X 9:3a 2008-10-21 07:00:00 08:00:00 10:00:00 11:00:00KA3554G02:4 10.50–12.20 X 9:3b 2008-10-23 12:00:00 13:00:00 15:00:00 16:00:00KA3548A01:3 8.80–10.75 X 9:4a 2008-10-21 15:00:00 16:00:00 17:00:00 18:00:00KA3548A01:3 8.80–10.75 X 9:4b 2008-10-22 06:40:00 07:40:00 08:40:00 09:40:00KA3548A01:3 8.80–10.75 X 9:4c 2008-10-23 06:40:00 07:40:00 08:40:00 09:40:00KA3542G01:3 18.60–20.30 X 9:5a 2008-10-20 18:30:00 19:30:00 20:30:00 22:30:00KA3542G01:3 18.60–20.30 X 9:5b 2008-10-21 17:00:00 18:00:00 19:00:00 21:00:00KA3542G01:3 18.60–20.30 X 9:5c 2008-10-22 16:40:00 17:40:00 18:40:00 20:40:00KA3544G01:2(1) 8.90–10.65 X – (1) – – – – –KA3542G02:2 25.60–27.20 X 9:7a 2008-10-23 15:20:00 16:20:00 19:20:00 21:20:00KA3542G02:2 25.60–27.20 X 9:7b 2008-10-24 05:30:00 06:30:00 09:30:00 11:30:00KA3563G:4 1.50–3.00 – – (2) – – – – –KA3546G01:2 6.75–8.30 X 9:9 2008-10-22 11:40:00 12:40:00 15:40:00 17:40:00KA3566G01:2 20.00–21.50 – – (2) – – – – –KA3572G01:2 2.70–5.30 – – (2) – – – – –KA3574G01:3 1.80–4.10 – – (2) – – – – –KA3539G:2 15.85–17.60 X 9:13a 2008-10-20 16:30:00 17:30:00 18:30:00 19:30:00KA3539G:2 15.85–17.60 X 9:13b 2008-10-21 13:00:00 14:00:00 15:00:00 16:00:00
(1) indicates packer system failure, “X” indicates that section is equipped with HM sensors. (2) indicates no test is done in this campaign. (3) A probable packer failure.

Table A3-12. Interference tests during the campaign in November 2009.
Borehole Section (m) HM section
Test no. Date of test Start of test
Flow start Flow stop Test stop (Next day)
KA3539G:2 15.85–17.60 X 10:21 2009-11-10 07:30:00 08:00:00 14:00:00 08:00:00KA3542G02:5 2.00–8.00 – 10:22 2009-11-12 07:30:00 08:00:00 14:00:00 08:00:00KA3554G01:2 22.60–24.15 X 10:23 2009-11-17 07:30:00 08:00:00 14:00:00 08:00:00KA3590G02:1 25.50–30.01 – 10:24 2009-11-19 07:30:00 08:10:00 14:10:00 08:10:00KG0021A01:3 35.00–36.00 – 10:25 2009-11-18 07:30:00 08:00:00 14:00:00 08:00:00KG0048A01:3 32.80–33.80 – 10:26 2009-11-11 07:30:00 08:00:00 14:00:00 08:00:00
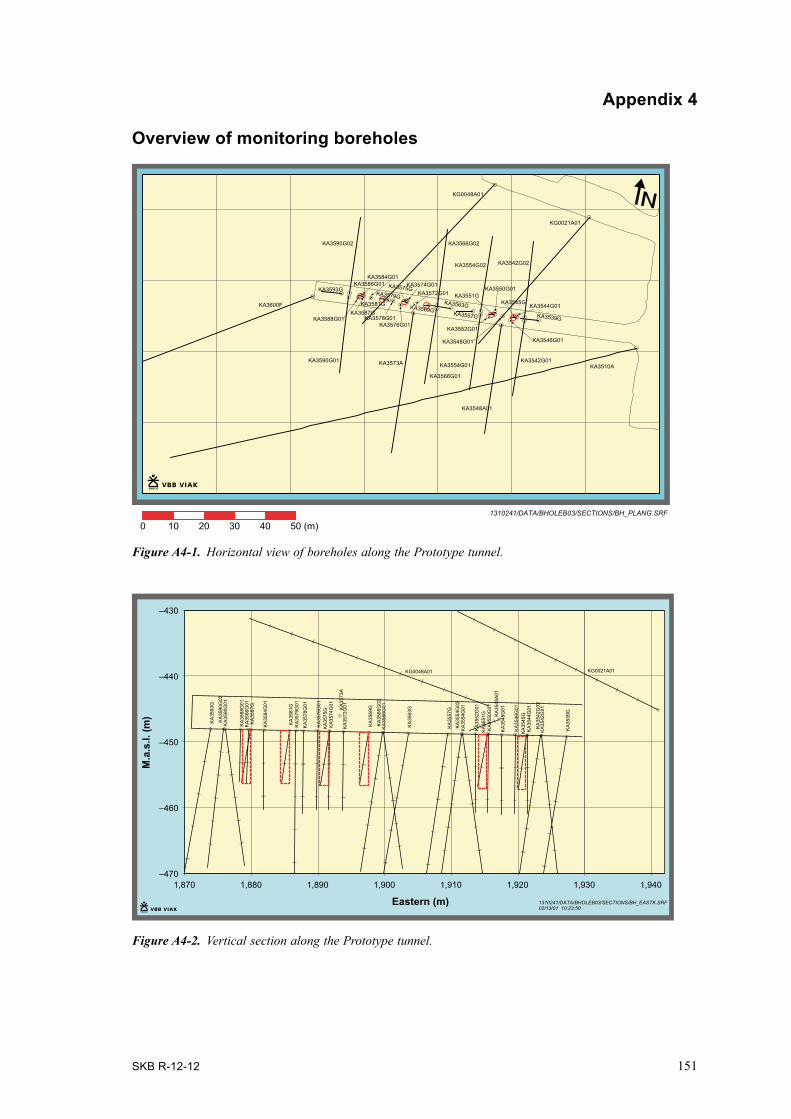
SKB R-12-12 151
Appendix 4
Overview of monitoring boreholes
KA3510A
KA3600F
KA3588G01
KA3593GKA3586G01
0 10 20 30 40 50 (m)
KA3587G
KA3584G01
KA3581G
KA3578G01
KA3575GKA3572G01
KA3573A
KA3569GKA3563G
KA3557G
KA3552G01
KA3550G01KA3551G
KA3548G01 KA3546G01
KA3539G
KA3544G01
KA3590G01
KA3590G02
KA3574G01
KA3576G01
KA3566G01
KA3566G02
KA3554G01
KA3554G02
KA3545G
KA3542G01
KA3542G02
KA3579G
KA3548A01
KG0021A01
KG0048A01
1310241/DATA/BHOLEB03/SECTIONS/BH_PLANG.SRF
KA3
539G
KA35
42G
01
KA35
44G
01
KA35
46G
01
KA35
48G
01
KA3
550G
01
KA3
552G
01
KA35
54G
01
KA35
57G
KA35
63G
KA
3566
G01
KA35
69G
KA35
72G
01KA35
73A
KA35
74G
01
KA35
76G
01
KA
3578
G01
KA
3581
G
KA35
84G
01
KA35
87G
KA
3588
G01
KA35
90G
01
KA
3593
G
1,870 1,880 1,890 1,900 1,910 1,920 1,930 1,940
Eastern (m)
–470
–460
–450
–440
–430
M.a
.s.l.
(m)
KA35
86G
01
KA3
551G
KA35
45G
1310241/DATA/BHOLEB03/SECTIONS/BH_EASTK.SRF02/13/01 10:23:50
KA
3542
G02
KA35
54G
02
KA3
566G
02
KA35
75G
KA
3590
G02
KA
3579
G01
KG0048A01 KG0021A01
KA35
48A0
1
Figure A4-1. Horizontal view of boreholes along the Prototype tunnel.
Figure A4-2. Vertical section along the Prototype tunnel.
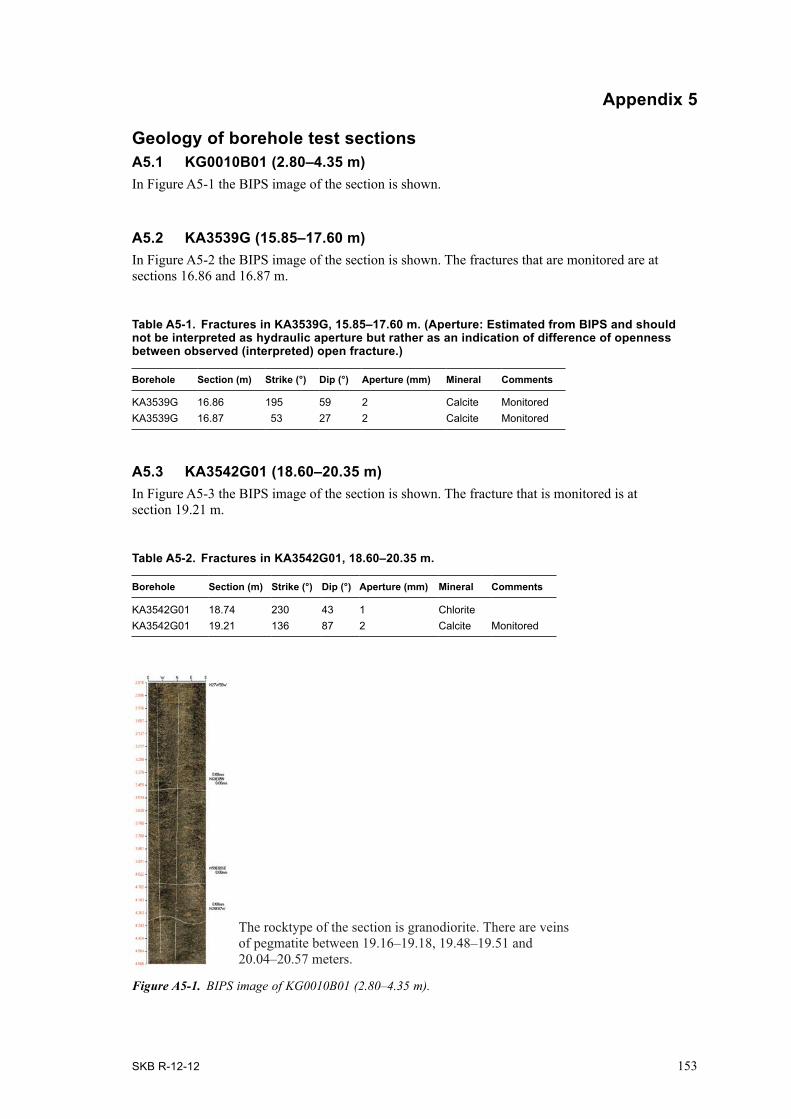
SKB R-12-12 153
Appendix 5
Geology of borehole test sectionsA5.1 KG0010B01 (2.80–4.35 m)In Figure A5-1 the BIPS image of the section is shown.
A5.2 KA3539G (15.85–17.60 m)In Figure A5-2 the BIPS image of the section is shown. The fractures that are monitored are at sections 16.86 and 16.87 m.
Table A5-1. Fractures in KA3539G, 15.85–17.60 m. (Aperture: Estimated from BIPS and should not be interpreted as hydraulic aperture but rather as an indication of difference of openness between observed (interpreted) open fracture.)
Borehole Section (m) Strike (°) Dip (°) Aperture (mm) Mineral Comments
KA3539G 16.86 195 59 2 Calcite MonitoredKA3539G 16.87 53 27 2 Calcite Monitored
A5.3 KA3542G01 (18.60–20.35 m)In Figure A5-3 the BIPS image of the section is shown. The fracture that is monitored is at section 19.21 m.
Table A5-2. Fractures in KA3542G01, 18.60–20.35 m.
Borehole Section (m) Strike (°) Dip (°) Aperture (mm) Mineral Comments
KA3542G01 18.74 230 43 1 ChloriteKA3542G01 19.21 136 87 2 Calcite Monitored
Figure A5-1. BIPS image of KG0010B01 (2.80–4.35 m).
The rocktype of the section is granodiorite. There are veins of pegmatite between 19.16–19.18, 19.48–19.51 and 20.04–20.57 meters.

154 SKB R-12-12
A5.4 KA3542G02 (25.60–27.20 m)In Figure A5-4 the BIPS image of the section is shown. The fracture that is monitored is at section 26.60 m.
Table A5-3. Fractures in KA3542G02, 25.60–27.20 m.
Borehole Section (m) Strike (°) Dip (°) Aperture (mm) Mineral Comments
KA3542G02 26.56 137 87 1 PyriteKA3542G02 26.60 136 82 1 Pyrite MonitoredKA3542G02 26.63 138 90 1 PyriteKA3542G02 27.06 47 35 1 Chlorite
Figure A5-3. BIPS image of KA3542G01 (18.60–20.35 m).
Figure A5-2. BIPS image of KA3539G (16.5–17.4 m).
The rocktype of the section is granodiorite. There are xenoliths of mafic igneous rock between 16.15–16.20 m and 17.16–17.20 m.
The rocktype of the section is granodiorite. There are veins of pegmatite between 19.16–19.18, 19.48–19.51 and 20.04–20.57 meters.

SKB R-12-12 155
A5.5 KA3544G01 (8.90–12.65 m)In Figure A5-5 the BIPS image of the section is shown. The fracture that is monitored is at section 9.89 m.
Table A5-4. Fractures in KA3544G01, 8.90–12.65 m.
Borehole Section (m) Strike (°) Dip (°) Aperture (mm) Mineral Comments
KA3544G01 8.98 201 58 4 PyriteKA3544G01 9.89 115 25 1 Pyrite MonitoredKA3544G01 10.69 174 14 2 PyriteKA3544G01 11.30 59 45 1 Chlorite
Figure A5-4. BIPS image of KA3542G02 (25.60–27.20 m).
Figure A5-5. BIPS image of KA3544G01 (8.90–12.65 m).
The rocktype of the section is granodiorite. There is a vein of pegmatite between 26.31–26.33 m and a vein of aplite at 26.36 m. There are xenoliths of mafic igneous rock within the section.
The rocktype of the section is granodiorite. There are veins of pegmatite between 9.32–9.36, 9.99–10.02 and 10.08–10.11 meters. There are xenoliths of mafic igneous rock within the section.

156 SKB R-12-12
A5.6 KA3546G01 (6.75–8.30 m)In Figure A5-6 the BIPS image of the section is shown. The fracture that is monitored is at section 7.76 m.
Table A5-5. Fractures in KA3546G01, 6.75–8.30 m.
Borehole Section (m) Strike (°) Dip (°) Aperture (mm) Mineral Comments
KA3546G01 7.47 172 77 1 ChloriteKA3546G01 7.68 291 29 2 CalciteKA3546G01 7.76 278 24 3 Calcite Monitored
A5.7 KA3548A01 (8.80–10.75 m)In Figure A5-7 the BIPS image of the section is shown. The fractures that are monitored is at section 9.80 and 9.87 m.
Table A5-6. Fractures in KA3548A01, 8.80–10.75 m.
Hole Section Strike Dip Aperture (mm) Mineral Comments
KA3548A01 9.80 303 76 2 Calcite MonitoredKA3548A01 9.87 108 82 1 Calcite MonitoredKA3548A01 9.92 29 63 1 ChloriteKA3548A01 9.93 234 81 1 ChloriteKA3548A01 10.03 37 67 2 ChloriteKA3548A01 10.69 267 50 1 Chlorite
A5.8 KA3550G01 (5.20–7.30 m)In Figure A5-8 the BIPS image of the section is shown. Nine fractures are monitored within the section.
Figure A5-6. BIPS image of KA3546G01 (6.75–8.30 m).
The rocktype of the section is granodiorite. There are xenoliths of mafic igneous rock within the section.

SKB R-12-12 157
Table A5-7. Fractures in KA3550G01, 5.20–7.30 m.Borehole Section (m) Strike (°) Dip (°) Aperture (mm) Mineral Comments
KA3550G01 6.19 321 34 2 Chlorite MonitoredKA3550G01 6.22 295 25 1 Chlorite MonitoredKA3550G01 6.27 174 27 1 Calcite MonitoredKA3550G01 6.30 79 7 3 Chlorite MonitoredKA3550G01 6.32 347 9 9 Chlorite MonitoredKA3550G01 6.34 313 16 6 Chlorite MonitoredKA3550G01 6.35 314 26 2 Chlorite MonitoredKA3550G01 6.47 312 40 1 Chlorite MonitoredKA3550G01 6.62 287 11 1 Chlorite MonitoredKA3550G01 6.67 11 14 1 Chlorite MonitoredKA3550G01 6.92 328 28 2 Chlorite
Figure A5-7. BIPS image of KA3548A01 (8.80–10.75 m).
Figure A5-8. BIPS image of KA3550G01 (5.20–7.30 m).
The rocktype of the section is granodiorite. There is a xenolith (10.22–10.27 m) of mafic igneous rock within the section.
The rocktype of the section is granodiorite. There is a vein of aplite between 5.31–5.38 m and another vein of pegmatite between 5.89–5.95 m within the section.
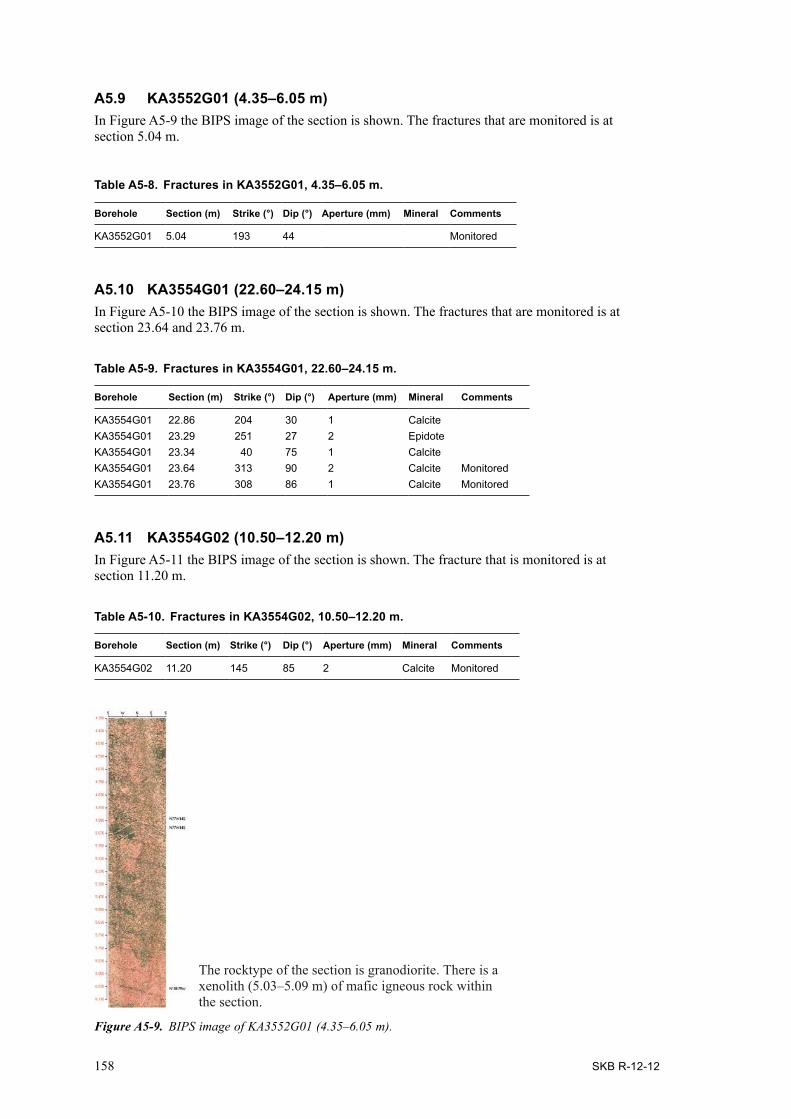
158 SKB R-12-12
A5.9 KA3552G01 (4.35–6.05 m)In Figure A5-9 the BIPS image of the section is shown. The fractures that are monitored is at section 5.04 m.
Table A5-8. Fractures in KA3552G01, 4.35–6.05 m.
Borehole Section (m) Strike (°) Dip (°) Aperture (mm) Mineral Comments
KA3552G01 5.04 193 44 Monitored
A5.10 KA3554G01 (22.60–24.15 m)In Figure A5-10 the BIPS image of the section is shown. The fractures that are monitored is at section 23.64 and 23.76 m.
Table A5-9. Fractures in KA3554G01, 22.60–24.15 m.
Borehole Section (m) Strike (°) Dip (°) Aperture (mm) Mineral Comments
KA3554G01 22.86 204 30 1 CalciteKA3554G01 23.29 251 27 2 EpidoteKA3554G01 23.34 40 75 1 CalciteKA3554G01 23.64 313 90 2 Calcite MonitoredKA3554G01 23.76 308 86 1 Calcite Monitored
A5.11 KA3554G02 (10.50–12.20 m)In Figure A5-11 the BIPS image of the section is shown. The fracture that is monitored is at section 11.20 m.
Table A5-10. Fractures in KA3554G02, 10.50–12.20 m.
Borehole Section (m) Strike (°) Dip (°) Aperture (mm) Mineral Comments
KA3554G02 11.20 145 85 2 Calcite Monitored
Figure A5-9. BIPS image of KA3552G01 (4.35–6.05 m).
The rocktype of the section is granodiorite. There is a xenolith (5.03–5.09 m) of mafic igneous rock within the section.
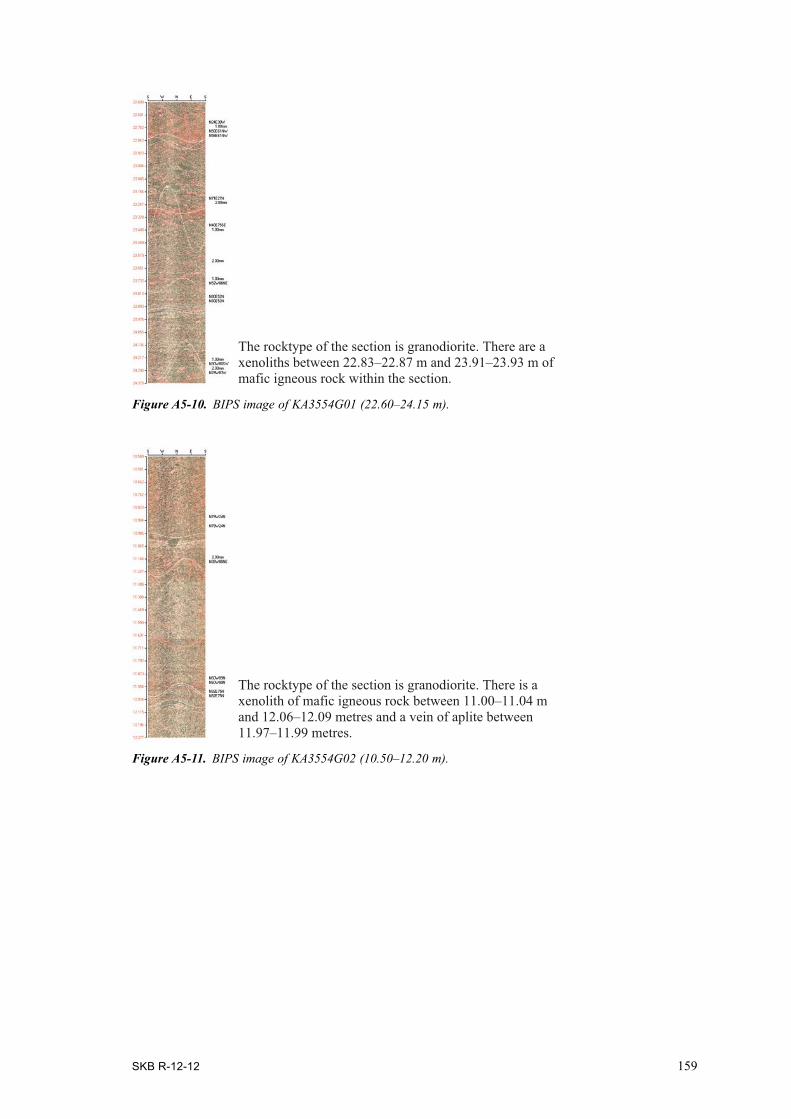
SKB R-12-12 159
Figure A5-10. BIPS image of KA3554G01 (22.60–24.15 m).
Figure A5-11. BIPS image of KA3554G02 (10.50–12.20 m).
The rocktype of the section is granodiorite. There are a xenoliths between 22.83–22.87 m and 23.91–23.93 m of mafic igneous rock within the section.
The rocktype of the section is granodiorite. There is a xenolith of mafic igneous rock between 11.00–11.04 m and 12.06–12.09 metres and a vein of aplite between 11.97–11.99 metres.