prudential plc annual report 2010
TRANSCRIPT

PRUDENTIAL PLC
ANNUAL REPORT 2010
Long-term thinking
HK Stock Code: 2378

The directors’ report of Prudential plc for the year ended 31 December 2010 is set out on pages 1 to 121, pages 353 to 374 and on pages 438 to 442 and includes the sections of the Annual Report referred to in these pages.
Prudential delivered a very strong performance in 2010, with results significantly ahead of 2009. Our disciplined approach to capital allocation, proactive risk management and focus on profitability are generating both growth and cash for our shareholders.
On the statutory International Financial Reporting Standards (IFRS) basis, our operating profit before tax from continuing operations increased by 24 per cent to £1,941 million. On the European Embedded Value basis, Group operating profit before tax increased by 20 per cent to £3,696 million.
In view of the progress that the Group has made in recent years to improve IFRS operating profitability and free surplus generation, the Board has decided to rebase the full year dividend upwards by 4 pence per share, equivalent to an increase of 20 per cent. In line with this, the directors recommend a final dividend of 17.24 pence per share, which brings the total dividend for the year to 23.85 pence per share.
We believe our proven strategy, our discipline in putting value ahead of volume and our focus on execution will continue to allow us to grow profitably and to generate significant returns for our shareholders.
VIEW OUR REPORT ONLINE
www.prudential.co.uk

OV
ER
VIE
W1
BU
SIN
ES
S R
EV
IEW
GO
VE
RN
AN
CE
DIR
EC
TO
RS
’ R
EM
UN
ER
AT
ION
RE
PO
RT
AD
DIT
ION
AL
IN
FO
RM
AT
ION
FIN
AN
CIA
L
ST
AT
EM
EN
TS
OVERVIEW > CONTENTS
OVERVIEW
BUSINESS REVIEW
GOVERNANCE
DIRECTORS’ REMUNERATION REPORT
ADDITIONAL INFORMATION
FINANCIAL STATEMENTS AND
EUROPEAN EMBEDDED VALUE (EEV)
BASIS SUPPLEMENTARY INFORMATION
2 Highlights4 Business overview6 Chairman’s statement8 Group Chief Executive’s report
18 Financial highlights20 Chief Financial Officer’s review26 Business unit review
• Insurance operations: Asia, US, UK• Asset management: M&G, Asia, US
54 Financial review80 Risk and capital management87 Other corporate information91 Corporate responsibility review
100 Board of directors104 Governance report121 Additional disclosures122 Index to principal Directors’ Report disclosures
124 Directors’ remuneration report
438 Risk factors443 Shareholder information445 How to contact us
150 Summary of statutory and supplementary International Financial Reporting Standards (IFRS) basis and EEV basis results
152 Index to Group financial statements153 Consolidated income statement154 Consolidated statement of comprehensive income155 Consolidated statement of changes in equity157 Consolidated statement of financial position159 Consolidated statement of cash flows160 Notes on the Group financial statements354 Additional unaudited information375 Balance sheet of the parent company376 Notes on the parent company financial statements387 Statement of directors’ responsibilities in respect
of the Annual Report and the financial statements388 Independent auditor’s report to the members
of Prudential plc389 EEV basis supplementary information395 Notes on the EEV basis supplementary information434 Statement of directors’ responsibilities in respect
of the EEV basis supplementary information435 Independent auditor’s report to Prudential plc
on the EEV basis supplementary information
2
Prudential plc Annual Report 2010
OVERVIEW > HIGHLIGHTS
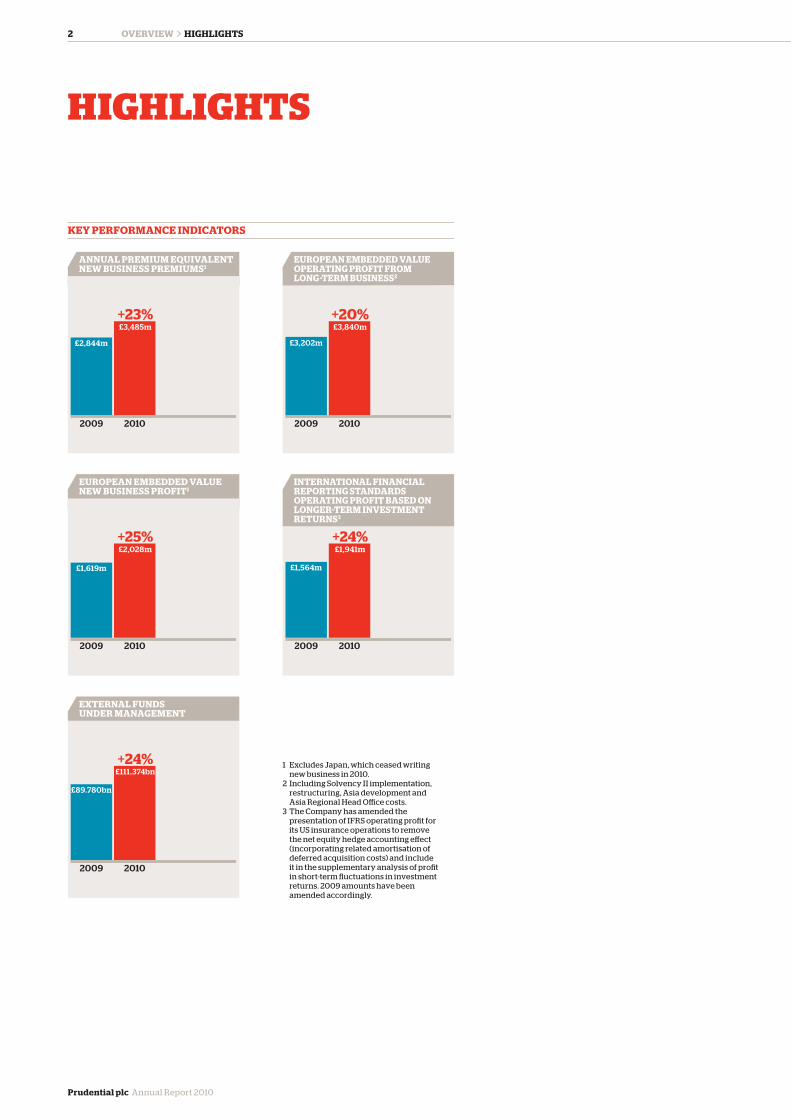
1 Excludes Japan, which ceased writing new business in 2010.
2 Including Solvency II implementation, restructuring, Asia development and Asia Regional Head Office costs.
3 The Company has amended the presentation of IFRS operating profit for its US insurance operations to remove the net equity hedge accounting effect (incorporating related amortisation of deferred acquisition costs) and include it in the supplementary analysis of profit in short-term fluctuations in investment returns. 2009 amounts have been amended accordingly.
HIGHLIGHTS
KEY PERFORMANCE INDICATORS
ANNUAL PREMIUM EQUIVALENT NEW BUSINESS PREMIUMS1
2009
£2,844m
£3,485m
2010
+23%
EUROPEAN EMBEDDED VALUE NEW BUSINESS PROFIT1
2009
£1,619m
£2,028m+25%
2010
INTERNATIONAL FINANCIAL REPORTING STANDARDS OPERATING PROFIT BASED ON LONGER-TERM INVESTMENT RETURNS3
2009
£1,564m
£1,941m+24%
2010
EUROPEAN EMBEDDED VALUE OPERATING PROFIT FROM LONG-TERM BUSINESS2
2009
£3,202m
£3,840m+20%
2010
EXTERNAL FUNDS UNDER MANAGEMENT
2009
£89.780bn
£111.374bn+24%
2010

3O
VE
RV
IEW
BUSINESS UNIT PERFORMANCE HIGHLIGHTS
PRUDENTIAL CORPORATION ASIA
• Regional leader with more market leading positions in the life insurance and asset management sectors than anyone else
• Well diversified platform as no one country, distribution channel or product drives performance
• APE sales up 24 per cent to £1,501 million
• New business profit up 24 per cent to £902 million
• IFRS operating profit up 29 per cent to £536 million
JACKSON
• Record total APE retail sales of £1,164 million – highest level in Jackson’s history
• Top three provider of variable annuities in US
• Rated as a ‘World Class’ service provider for five successive years by Service Quality Measurement Group
• ‘Highest Customer Satisfaction by Industry’ award from Service Quality Measurement Group
PRUDENTIAL UK
• Strength and investment performance of With-Profits Fund allowed Prudential to deliver strong annualised returns for policyholders
• Retained ‘Five Star’ rating for excellent service in the Investment category at the Financial Adviser Service Awards
• IFRS total operating profits up nine per cent to £719 million
• Retail new business margin increased from 31 per cent to 35 per cent
M&G
• M&G’s retail business was awarded the prestigious 2010 Global Group of the Year award at the 15th annual Investment Week Fund Manager of the Year Awards. This is the second time in three years that M&G has received this award
• M&G’s institutional business was also recognised for its investment performance, winning the 2010 UK Asset Management Firm of the Year award at Financial News’ Awards for Excellence in Institutional Asset Management
• Record full year profits of £246 million, 8 per cent higher than previous record achieved in 2008
• External net fund inflows of £9.1 billion

4
Prudential plc Annual Report 2010
Prudential plc is an international financial services group with significant operations in Asia, the US and the UK. We serve over 25 million customers and have £340 billion of assets under management. The Group is structured around four main business units: Prudential Corporation Asia, Jackson National Life Insurance Company, Prudential UK and M&G.
PRUDENTIALAT A GLANCE
OVERVIEW > AT A GLANCE
OVERVIEW
KEY STATISTICS
% OF GROUP OPERATING PROFITS
PRUDENTIAL CORPORATION ASIA
Prudential is a leading life insurer in Asia operating in 12 markets. We are in the top three for market share of new business in Hong Kong, India, Indonesia, Malaysia, Singapore, the Philippines and Vietnam.
In Asia we provide a comprehensive range of savings, protection and investment products tailored to meet customers’ needs in each market.
Prudential’s Asian asset management business manages investments across a broad range of asset classes for internal, retail and institutional clients. We are one of the region’s leaders of Asian sourced assets under management. We are also the largest onshore mutual fund manager in Asia.
JACKSON
Jackson is one of the largest life insurance companies in the US, providing retirement savings and income solutions to more than 2.8 million customers.
Jackson is also one of the top three providers of variable annuities in the US.
Founded 50 years ago, Jackson has a long and successful record of providing advisers with the products, tools and support to design effective retirement solutions for their clients.
ASIAwww.prudentialcorporation-asia.com
UNITED STATESwww.jackson.com
15m+customers
2.8m+customers16,400
employees
320,000+
agents3,700
employeesincluding affiliates
EEV*
38%
IFRS†
25%
EEV*
38%
IFRS†
35%

5O
VE
RV
IEW
www.prudential.co.uk
PRUDENTIAL UK
Prudential UK is a leading life and pensions provider to approximately 7 million customers in the United Kingdom.
Our expertise in areas such as longevity, risk management and multi-asset investment, together with our financial strength and highly respected brand, means that the business is strongly positioned to continue pursuing a value-driven strategy built around our core strengths in with-profits and annuities.
M&G
M&G is Prudential’s UK and European fund management business with total assets under management of £198 billion (at 31 December 2010).
M&G has been investing money for individual and institutional clients for 80 years. Today it is one of Europe’s largest active investment managers as well as being a powerhouse in fixed income.
UNITED KINGDOMwww.pru.co.uk
UNITED KINGDOM & EUROPEwww.mandg.co.uk
7mcustomers
335,000customers
through M&G Investments2,700
employees1,400
employees
1 Excludes Japan, which ceased writing new business in 2010.
* % of Group EEV long-term operating profits.† % of Group IFRS operating profits, based
on longer-term investment returns before restructuring costs and other income and expenditure.
EEV*
24%
IFRS†
29%
IFRS†
11%
LIFE ASSURANCE
% of Group APE new business premiums1
% of Group new business profit1
43% Asia33% US24% UK
44% Asia38% US18% UK
ASSET MANAGEMENT
% of Group external funds under management
80% M&G20% Asia

6
Prudential plc Annual Report 2010
I am delighted to welcome you to Prudential’s 2010 Annual Report. We have followed our excellent year in 2009 with another very strong performance.
In 2010, our proven strategy of focusing on the most attractive markets and products, together with the discipline with which the Group manages risk and capital, has again delivered outstanding results. The Board has therefore recommended a final dividend of 17.24 pence per share, which brings the total dividend for the reporting period to 23.85 pence per share, 4 pence (20 per cent) higher than the 2009 total dividend. The scrip dividend scheme is not being offered in respect of this dividend. In its place shareholders will be offered a Dividend Reinvestment Plan (DRIP).
As a company, our purpose has remained the same since our foundation in 1848. We meet our customers’ changing needs for savings, income and protection wherever we do business. Prudential is uniquely positioned in the industry, delivering both rapid, profitable growth in emerging markets and generating strong cash flows.
Following Board approval, in December we announced new growth and profitability objectives for our Asia business and new cash remittance objectives for the Group. These are challenging but achievable given the Group’s strategy and the potential of our businesses in our chosen markets. These objectives are clear evidence of the Group’s commitment to provide both growth and cash to shareholders. The Board’s recommendation for the final dividend is consistent with that commitment.
One of the key events in the first half of the year was our proposed transaction with AIA. This led to significant focus on Prudential. The decision to pursue this transaction was in line with our strategy, which is to concentrate our resources on the highest growth and highest return markets, many of which are in Asia. The Board spent considerable time reviewing, challenging, questioning and validating the deal, including months of due diligence. I would like to thank the non-executive directors for their extensive contribution to the process. As I said at the 2010 AGM, the whole Board strongly believed this was an opportunity worth pursuing as part of our wider strategy. We greatly regret that we were not successful in completing the deal, however while it would have accelerated our growth, the 2010 results show our ability to deliver a first-class performance without it.
There have been a number of changes to the Board during the year. In October, we announced the appointment of Howard Davies and Paul Manduca as non-executive directors. Paul has replaced James Ross as the Board’s Senior Independent Director. James will retire from the Board at Prudential’s AGM on 19 May 2011. Howard has become Chairman of the Group Risk Committee. Both have extensive experience in the financial sector.
We also announced the appointment of Mike Wells as President and Chief Executive Officer of Jackson National Life Insurance Company and as an executive director on the Board of Prudential with effect from 1 January 2011. Mike, who has been with Jackson for 15 years and was Vice Chairman and Chief Operating Officer, succeeds Clark Manning, who decided to step down after 15 years with Jackson.
In December, John Foley was appointed Group Chief Risk Officer and he became an executive director on the Board of Prudential with effect from 1 January 2011. John was previously Chief Executive, Prudential Capital and Group Treasurer. The decision to make the position of Group Chief Risk Officer a Board role underlines the importance of risk management to the Group.
OVERVIEW > CHAIRMAN’S STATEMENT
CHAIRMAN’SSTATEMENT
HARVEY MCGRATHCHAIRMAN
“ Prudential is uniquely positioned in the industry, delivering both rapid, profitable growth in emerging markets and generating strong cash flows.”
FULL YEAR DIVIDEND
2009
19.85p
23.85p
2010
+20%

OV
ER
VIE
W7
I am very pleased to welcome Mike, John, Howard and Paul to the Board of Prudential and I look forward to working with them. I would like to thank Clark and James for their invaluable service and significant contribution over their time on the Board.
I would also like to pay tribute to Mick Newmarch, who died in April 2010. Mick was instrumental in shaping the Group during his time as Chief Executive from 1990 to 1995. Mick refocused and re-energised our business in Asia, laying down the groundwork for our outstanding success in the region today.
Our performance should not only be judged by our financial return. Prudential is committed to being an active and supportive member of the community. We encourage our businesses to establish projects and partnerships around education (particularly financial education) and social welfare. Our approach to community investment is to support charitable organisations and appropriate NGOs, not only through funding, but also with the experience and expertise of our employees. In 2010, around one in four employees volunteered in their community, many of them through our Group-wide flagship volunteering programme, the Chairman’s Challenge. Over the last five years, since the Chairman’s Challenge was launched, more than 100 annual projects have been supported by our employees in partnership with charities including Help Age International, Plan International and Junior Achievement.
Looking at the performance of the Group around the world, our strategy, the quality of our people and the strength of our brands, I remain confident we will continue to deliver profitable growth and sustainable value for our shareholders. We have emerged from the economic turbulence of the past few years as one of the strongest insurers in the world and I would like to express my thanks to all our employees for their continued contribution to the Group’s success.

8
Prudential plc Annual Report 2010
OVERVIEW > GROUP CHIEF EXECUTIVE’S REPORT
I am pleased to report a very strong performance in 2010, with results significantly ahead of 2009. We achieved this by remaining focused on rigorous capital allocation and effective management of our balance sheet.
These principles have served us well during the financial crisis allowing us to emerge from the 2008-2009 period with a stronger balance sheet, higher profits, higher cash flows and an increased dividend. Our 2010 results confirm that our strategy, underpinned by our operating principles, should increasingly allow us to differentiate ourselves through our ability to combine growth and cash generation, as we announced at our Investor Day on 1 December 2010.
Our strategyAt the centre of our strategy is the acceleration of our profitable growth in Asia, which offers many of the highest growth and return opportunities. The emerging markets of South-East Asia – such as Indonesia, Malaysia, Vietnam, the Philippines and Thailand, together with Hong Kong and Singapore – are particularly attractive. They remain the priority destination for our new capital investment. With our compelling platform of distribution, brand and product development capabilities in the high growth markets of Asia, we believe we are particularly well positioned to take advantage of the considerable opportunity that the region offers.
In the US, we continue to build on the strength of our operations to make them a more significant component of the Group in terms of IFRS earnings as well as cash generation. In the UK, we remain focused on generating cash and capital and providing resilience to the Group’s balance sheet.
In asset management, our strong track record, both at M&G and in our asset management business in Asia, is enabling us to grow our funds under management. These businesses make an increasingly important contribution to our profits and cash generation.
Each part of the Group plays a key role in our strategy. Our flexibility and diversification were instrumental in allowing us to navigate successfully the economic and market cycle in 2008 and 2009.
In executing this strategy, we are guided by three clearly defined Group-wide operating principles. The first of these is that from 2008, we decided to take a more balanced approach to performance management across the three key measures of Embedded Value (EEV), IFRS and cash, with an increased emphasis on IFRS and cash. When this operating principle was introduced, it was a clear break with how our industry, and our company, had operated previously. As a consequence of this new focus, we have been able in 2010, for the third year in a row, to report results that are in fast progression across all three key measures – EEV, IFRS and cash.
Second, we have focused on allocating capital with total discipline to the highest return and shortest payback opportunities across the Group. This means that we restrict new business to areas of the market where these stringent criteria are met. As a result, we have not hesitated to take and implement a number of challenging decisions.
GROUP CHIEF EXECUTIVE’S REPORT
“ At the centre of our strategy is the acceleration of our profitable growth in Asia, which offers many of the highest growth and return opportunities.”
“ We have focused on allocating capital with total discipline to the highest return and shortest payback opportunities across the Group.”
TIDJANE THIAMGROUP CHIEF EXECUTIVE

OV
ER
VIE
W9

10
Prudential plc Annual Report 2010
GROUP CHIEF EXECUTIVE’S REPORT
OVERVIEW > GROUP CHIEF EXECUTIVE’S REPORT > CONTINUED
Even in our preferred region of Asia, we acted decisively when necessary for the Group, as illustrated by our decision to sell our back book of business in Taiwan, to curtail writing new life business in Japan, or exchange short-term sales volume in Korea for long-term shareholder value. In the UK, we have closed down the equity release business and significantly increased our minimum return criteria for bulk purchase annuities. In the US, we have managed our sales of annuities, fixed and variable, with a clear focus on returns and payback periods, not hesitating to lose market share when necessary and putting value ahead of volume.
Finally, our third operating principle – of equal importance – is to take a proactive approach to managing risk across the cycle. We have transformed the capital position of the Group during the last three years, closing 2010 with more than £4 billion of Insurance Groups Directive (IGD) capital surplus against £1.5 billion at the end of 2008. We have significantly more capital today than before the financial crisis, and we have put in place a set of processes to hedge and manage the key risks to which we are exposed.
Our strategy and the disciplined implementation of our operating principles have produced excellent results.
Group performanceIn 2010, APE sales1 were up 23 per cent in life insurance to £3,485 million (2009: £2,844 million) and new business profit1 has increased by 25 per cent to £2,028 million (2009: £1,619 million) as our new business margins increased to 58 per cent (2009: 57 per cent).
Net inflows in our asset management businesses were £8.9 billion, following an exceptional year in 2009 (2009: £15.4 billion). These continued strong inflows underpin the robust performance of our asset management operations during the year and are a direct driver of the growth in our profits.
On the statutory IFRS basis, our operating profit before tax from continuing operations increased by 24 per cent in 2010 to £1,941 million (2009: £1,564 million). IFRS profit for the year after tax increased by 112 per cent to £1,431 million (2009: £676 million). IFRS shareholder funds increased 28 per cent in 2010 to £8.0 billion (2009: £6.3 billion).
On the EEV basis, Group operating profit before tax increased by 20 per cent in 2010 to £3,696 million (2009: £3,090 million). New business profit1 for the year was £2,028 million, an increase of 25 per cent (2009: £1,619 million), and we continued to deliver very strong margins of 58 per cent (2009: 57 per cent). Our total investment in new business1 in 2010 was £643 million (2009: £660 million), a reduction of 3 per cent. As a result of our focus on rigorous capital allocation, we are delivering higher returns on capital invested for our shareholders, while managing to use less capital in absolute terms.
Since 2008, we have been using free surplus as the primary indicator of our ability to generate cash and capital. In 2010, free surplus increased 32 per cent to £3.3 billion, up from £2.5 billion at the end of 2009 and £0.9 billion at the end of 2008.
As these results show, we achieved strong growth on our three key metrics of EEV, IFRS and cash simultaneously. From 2009 to 2010, both our IFRS and EEV operating profits have grown by 20 per cent or more, while consuming less capital in absolute terms.
Our ability to generate significant growth while providing increasing cash returns to our shareholders – ‘growth and cash’ – is the result of our differentiated strategy. This strategy and the quality of our teams, both in our business units and our head office, allows us to provide value to our customers and shareholders. Each of our businesses is a clear leader in its market.
Note
1 Excluding Japan, which ceased writing new business in 2010.
IFRS OPERATING PROFIT BEFORE TAX
2009
£1,564m
£1,941m
2010
+24%
TOTAL EEV OPERATING PROFIT BEFORE TAX
2009
£3,090m
£3,696m
2010
+20%
“ We have significantly more capital today than before the financial crisis.”

11O
VE
RV
IEW
A year ago, we announced an agreement with AIG to acquire its Asia operations, AIA. The proposed acquisition was a unique opportunity to accelerate our strategy of focusing on the fast growing markets in Asia. We could not agree a purchase price that was acceptable to the AIG Board. The costs associated with the transaction were announced at our half year results and are detailed in the full year results statement.
Our operating performance by business unitOur aim across all our businesses is to develop and market a suite of products that deliver good value solutions that meet our customers’ needs, in a way that is profitable and capital efficient for the Group.
Prudential Corporation AsiaIn 2010, in line with our strategy, our core investment was in the fast growing and highly profitable markets of South-East Asia and Hong Kong and Singapore. Due to the long-term structural changes taking place in these economies, we continue to believe they offer the most attractive opportunity in the global life insurance market today.
Distribution remains critical to our business in Asia, and our unique combination of proprietary agency distribution and bank partnerships continues to deliver excellent results. Agency will remain the dominant and most profitable channel in Asia for many years to come. It is clear that Prudential’s agency distribution platform compares favourably to our peer group, whether in terms of scale, training or productivity. In addition, we will continue developing our presence in the bancassurance channel. The performance of our new partnership with UOB reinforces our view that the bancassurance channel will be increasingly important as Asian middle classes become wealthier and increasingly use banks and their services. This, together with our strategy of growing health and protection business, has been central to increasing our profitability and margins.
Our financial performance in Asia will continue to be based on three principal drivers. First, as a result of our strong new business growth, and its contribution to the increase in our in-force policies book, net inflows will be a major contributor to our IFRS earnings. Second, there will continue to be a contribution from investment returns, which will increase as the business grows. Third, as the scale of the business increases, our profitability will continue to benefit from the efficiency of our Asian platform, with revenues growing faster than our cost base. These three drivers support our confidence in our ability to double our 2009 IFRS profits by 2013.
JacksonIn the US, we have maintained our focus on value over sales volume growth, ensuring sales are delivered at highly profitable margin levels. We have maintained our pricing discipline and have been consistent in our approach of not chasing market share for its own sake. In 2010 we continued to benefit from the market changes following the financial turmoil in 2008 and 2009. As part of a trend, mostly driven by distributors who guide their customers towards the companies that held firm through the crisis and never closed to business, Jackson has significantly improved its position in the key variable annuity market. This flight to quality has allowed the Jackson team to increase sales volumes and market share. Our consistent pricing approach, product flexibility and Jackson’s strong credit rating, which has remained unchanged for eight years, have served us well.
We have continued to grow the number of advisers appointed to sell our products, increasing licensed agents and registered representatives in 2010 to more than 130,000.
FREE SURPLUS
2009
£2.5bn
£3.3bn
2010
+32%
“ In the US, we have maintained our focus on value over sales volume growth, ensuring sales are delivered at highly profitable margin levels.”

12
Prudential plc Annual Report 2010
OVERVIEW > GROUP CHIEF EXECUTIVE’S REPORT > CONTINUED
GROUP CHIEFEXECUTIVE’S REPORT
Prudential UK Our business in the UK is highly disciplined and generates differentiated returns relative to the market. We continued to be a market leader in both individual annuities and with-profits business. We maintained our focus on balancing the writing of new business with the generation of cash and capital, successfully delivering attractive returns on capital employed. This strategy led the UK to deliver net cash of £420 million to the Group in 2010.
Our emphasis on value and generating strong returns saw the UK business continue to prioritise the retail market, while selectively participating in the wholesale market. Wholesale market opportunities have only been pursued when they meet our strict financial criteria and deliver an appropriate return on the capital invested both in terms of quantum but also, and equally important, of payback period. In 2010 we also continued to make good progress against our cost reduction plans, meeting our 2010 savings target of £195 million per annum six months early.
Asset management M&G had a very good 2010, a performance which is all the more impressive as it comes after an exceptional year in 2009. M&G continues to focus on offering customers superior investment performance over the longer term, building on its proven track record of success in the retail investment market through ongoing expansion in Europe. M&G’s retail business achieved net inflows of £7.4 billion. M&G’s IFRS operating profit was £284 million, up 19 per cent compared to 2009.
In Asia, our asset management business also had a very successful year, with operating profits of £72 million, 31 per cent ahead of 2009. It is a key feature of our strategy that asset management profits are very capital efficient and are ‘cash rich’ profits. For the first time, funds under management passed the £50 billion mark, up from £42.4 billion in 2009, a trend that should also lead to continued profit growth.
These achievements underline the potential we see for asset management across Asia. We continue to believe that this is one of the most exciting opportunities for the Group today. In 2010, we appointed a new Chief Executive, and we are determined to continue to invest to capture a significant share of the growth and profits available in asset management in Asia. The priorities for our asset management business in Asia are: to build and develop institutional relationships, securing pan-Asia discretionary mandates; to increase our focus on Japan and China, as the region’s largest and fastest growing markets respectively; and, finally, to grow our offshore funds business.
Capital and risk managementA strong capital position is key to our development. It gives confidence to our customers in what is a long-term business, and it allows us to write large amounts of new business. Strict management and allocation of capital remain a core focus for our Group. Using the regulatory measure of the IGD, our Group capital surplus at 31 December 2010 was estimated at £4.3 billion (31 December 2009: £3.4 billion). The Group’s required capital is covered 3.0 times. This ratio means we continue to be one of the world’s best-capitalised insurers.
We have strengthened our risk management practices by forming a Group Risk Committee headed by Howard Davies reporting directly to the Board. We also appointed a new Chief Risk Officer (CRO), John Foley, and have elevated the CRO position to board level.
“ In the UK, we maintained our focus on balancing the writing of new business with the generation of cash and capital.”

13O
VE
RV
IEW
DividendIn view of the progress that the Group has made in recent years to improve IFRS operating profitability and free surplus generation, the Board has decided to rebase the full year dividend upwards by 4 pence per share, equivalent to an increase of 20 per cent. In line with this, the directors recommend a final dividend of 17.24 pence per share, which brings the total dividend for the year to 23.85 pence per share (2009: 19.85 pence per share).
The scrip dividend scheme is not being offered in respect of this dividend. In its place shareholders will be offered a Dividend Reinvestment Plan (DRIP).
The Board will maintain its focus on delivering a growing dividend from this new higher base, which will continue to be determined after taking into account the Group’s financial flexibility and our assessment of opportunities to generate attractive returns by investing in specific areas of the business. The Board believes that in the medium term a dividend cover of around two times is appropriate.
Our financial objectives1 In December 2010, we announced new objectives for the Group that reflect our determination to accelerate growth in Asia and our belief that we can continue to deliver both growth and cash sustainably to our shareholders.
Our core objectives are:
(i) In Asia, to double the 2009 value of IFRS life and asset management pre-tax operating profit in 2013 (2009: £465 million) and to double the 2009 value of new business profits in 2013 (2009: £713 million).
(ii) For each business unit to remit net cash to the Group: Asia to deliver £300 million of net cash remittance to the Group in 2013 (2009: £40 million); Jackson to deliver £200 million of net cash remittance to the Group in 2013 (2009: £39 million); UK to deliver £350 million of net cash remittance to the Group in 2013 (2009: £2842 million).
(iii) All business units in aggregate to deliver cumulative net cash remittances of at least £3.8 billion over the period 2010 to end-2013. These net remittances are to be underpinned by a targeted level of cumulative underlying free surplus generation of £6.5 billion over the same period.
These objectives are clear evidence of our determination to provide – through our strategy and disciplined execution – both growth and cash to our shareholders at a sustained pace.
Notes
1 The following discussion and the discussion under ‘Outlook’ below, contain forward-looking statements that involve inherent risks and uncertainties. Prudential’s actual future financial condition or performance or other indicated results may differ materially from those indicated in any such forward-looking statement due to a number of important factors (including those discussed under the heading ‘Risk factors’ in this report). See the discussion under the heading ‘Forward-looking statements’ at the end of this report. The objectives assume current exchange rates and a normalised economic environment consistent with the economic assumptions made by Prudential in calculating the EEV basis supplementary information for the half year ended 30 June 2010. They have been prepared using current solvency rules and do not pre-judge the outcome of Solvency II, which remains uncertain.
2 Representing the underlying remittances excluding the £150 million impact of pro-active financing techniques used to bring forward cash emergence of the in-force book during the financial crisis.
“ M&G continues to focus on offering customers superior investment performance over the longer term, building on its proven track record.”

14
Prudential plc Annual Report 2010
OutlookBy continuing to implement our strategy with discipline, allocating capital to the most attractive markets and products, and managing risk and capital prudently, but proactively, we have generated differentiated performance from our peers.
The outlook for economic growth in Asia, particularly in our preferred markets in South-East Asia, remains positive. The prospects for sustainably growing our leading platform in the region continue to be strong. Our confidence is reflected in the ambitious, yet achievable, objectives we have set for our business in Asia in December 2010.
Regarding Western economies, we continue to be more cautious about the outlook, with some clear differences between the US and Europe. The US economy is recovering, and the combination of the transition of 78 million ‘baby boomers’ into retirement, and our skill base and products, creates a unique and exciting opportunity for us. The economic outlook in Europe is more challenging. However, having focused our UK business, and relying largely on our existing seven million customers, we believe that we will continue to achieve our objectives in terms of margins and capital and cash generation.
GROUP CHIEFEXECUTIVE’S REPORT
OVERVIEW > GROUP CHIEF EXECUTIVE’S REPORT > CONTINUED
Strategy and operating principles
DISCIPLINED
CAPITA
L AL
LO
CA
TIO
N
PROACTIVE RISK MANAGEMENT
USE
OF
BA
LAN
CED METRICS
OPERATING PRINCIPLES
ACCELERATINGASIA
STRENGTHENING UNITED STATES
FOCUSINGUNITED
KINGDOM
STRATEGIC FRAMEWORK
OPTIMISINGASSET
MANAGEMENT

15O
VE
RV
IEW
Our disciplined process of capital allocation will, I believe, enable us to continue to deliver improved cash returns to shareholders. Our diversification, combined with our flexibility to choose where to allocate our capital, have proved to be significant sources of competitive advantage. We successfully navigated the extreme economic and market cycle of the past two years and are confident we will continue to outperform in the markets where we compete in the future.
I believe that the quality of our strategic options, our discipline in putting value ahead of volume and our focus on execution will continue to allow us to grow profitably and to generate significant returns for our shareholders.
2011 PRIORITIES 2013 FINANCIAL OBJECTIVES
GROUP • Continue to implement strategy with discipline, allocating capital to the most attractive markets and products
• Manage risk and capital prudently, but proactively• Focus on delivering a progressive dividend,
determined after taking into account the Group’s financial flexibility and opportunities to invest in areas of business offering attractive returns
• All business units in aggregate to deliver cumulative net cash remittances of at least £3.8 billion over the period 2010 to end-2013
• Net remittances underpinned by targeted level of cumulative underlying free surplus generation of £6.5 billion over the period 2010 to end-2013
ASIA • Continue expanding multi-channel distribution platform and improving its productivity
• Focus on regular premium products with comprehensive suite of protection riders
• Drive value through operational efficiency
• Double 2009 value of IFRS life and asset management pre-tax operating profit
• Double 2009 value of new business profits• Deliver £300 million of net cash remittance
to the Group
UNITED STATES
• Continue to drive positive net retail flows• Innovate around our key variable annuity
product• Further enhance operational efficiency
• Deliver £200 million of net cash remittance to the Group
UNITED KINGDOM
• Balance writing profitable new business at attractive returns on capital with sustainable cash generation and capital preservation
• Continue to pursue a value-driven strategy built around our core strengths in with-profits and annuities
• Deliver further improvements to operational performance and customer service while maintaining a strict focus on costs
• Continue building complementary distribution channels
• Deliver £350 million of net cash remittance to the Group
M&G • Maintain superior long-term investment performance for both internal and external funds• Continue growth in third-party retail and institutional businesses

16
Prudential plc Annual Report 2010

17B
US
INE
SS
RE
VIE
W
18 Financial highlights20 Chief Financial Officer’s review26 Business unit review
• Insurance operations: Asia, US, UK• Asset management: M&G, Asia, US
54 Financial review80 Risk and capital management87 Other corporate information91 Corporate responsibility review
BUSINESS REVIEW

18
Prudential plc Annual Report 2010
FINANCIAL HIGHLIGHTS
BUSINESS REVIEW > FINANCIAL HIGHLIGHTS
Life APE new business sales New business profit Free surplus investment
in new business
Asia1 US UK
2009
912
723
1,209
1,164
1,501
8203,485
2,844
2010
+23%
2009
664230
725
761
902
3652,028
1,619
2010
+25%
2009
(326)
(103)
(231)
(65)(300)
(278)
(643)(660)
2010
+3%
LIFE NEW BUSINESS: DELIVERING GROWTH IN VALUE AND VOLUME – BALANCING CAPITAL CONSUMPTION AND VALUE OPTIMISATION £m
IFRS operating profit External funds under
management
Total asset management
Net inflows
M&G net inflows
M&G Other asset management business Total asset management
2009
238284
378
297
2010
+27%
2009
70,306
89,326
111,374
89,780
2010
+24%
2009
8,890
15,417
2010
–42%
2009
9,105
13,478
2010
–32%
ASSET MANAGEMENT NET INFLOWS AND PROFITABILITY £m
Asia1 US UK Group
2010 2009 2010 2009 2010 2009 2010 2009
New business profit margin 60% 60% 65% 73% 45% 32% 58% 57%
Payback period2 3 years 3 years 1 year 2 years 4 years 5 years 2 years 3 yearsInternal rate of return >20% >20% >20% >20% >20% >15% >20% >20%
SHAREHOLDER-BACKED POLICYHOLDER LIABILITIES £m
At 1 Jan2009
12,975
45,361
33,85392,189 2,055 5,189
(73)701 100,061
Net liability flows3 Net liability flows3
At 31 Dec2010
At 1 Jan2010
12,427 43,944122,183
60,523
17,71613,050
48,311
38,7001,298
7,368 1,029
Asia US UK Other movements

19B
US
INE
SS
RE
VIE
W
2009
£1,564m
£1,941m
2010
+24%
2009
£3,090m
£3,696m
2010
+20%
IFRS EEV
2009
88.8p106.9p
47.5p62.0p
2010
+20%
+31%
Excluding goodwill Including goodwill
2009
603p
551p
715p
658p
2010
+19%
+19%
IFRS OPERATING PROFIT 4
EEV OPERATING PROFIT
BALANCE SHEET, CASH AND CAPITAL
BASIC EARNINGS PER SHARE – BASED ON OPERATING PROFIT AFTER TAX AND NON-CONTROLLING INTERESTS 5
EEV SHAREHOLDERS’ FUNDS PER SHARE
Notes
1 Asia new business amounts exclude Japan, which ceased writing new business in 2010.
2 Payback: Expected period over which future undiscounted free surplus generation from shareholder-backed business recoups initial new business investment.
3 Net liability flows defined as movements in shareholder-backed policyholder liabilities arising from premiums, surrenders, maturities and deaths.
4 The Company has amended the presentation of IFRS operating profit for its US insurance operations to remove the net equity hedge accounting effect (incorporating related amortisation of deferred acquisition costs) and include
it in the supplementary analysis of profit in short-term fluctuations in investment returns. 2009 amounts have been amended accordingly.
5 2010 excludes an exceptional tax credit of £158 million which primarily relates to the impact of a settlement agreed with the UK tax authorities.
6 Underlying free surplus comprises underlying free surplus generated from in-force business less investment in new business.
7 For 2010, IGD amounts are estimated.8 Operating profit after tax and non-controlling interests (but excluding
in 2010 exceptional tax credit of £158 million) as percentage of opening shareholders’ funds.
Underlying free surplus
generated 6
IGD Capital before final
dividend 7
Dividend per share relating to the
reporting year
2009
£1,414m
£1,714m
2010
+21%
2009
£3.4bn
£4.3bn
2010
+26%
2009
19.85p
23.85p
2010
+20%
EEV shareholders’ funds IFRS shareholders’ funds
Return on shareholders’ funds8
2009
£15.3bn
£18.2bn
2010 2009
£6.3bn
£8.0bn
2010
15% 18% 23% 25%
GROUP SHAREHOLDERS’ FUNDS (INCLUDING GOODWILL ATTRIBUTABLE TO SHAREHOLDERS)

20
Prudential plc Annual Report 2010
2010 was a good year for Prudential as we delivered strong performance in our key growth metrics. EEV new business profit (‘new business profit’) was up 25 per cent to £2,028 million (2009: £1,619 million) and IFRS operating profit based on longer-term investment returns (‘IFRS operating profit’) increased 24 per cent to £1,941 million (2009: £1,564 million).
On our capital metric of net underlying free surplus generation we improved 21 per cent to £1,714 million (2009: £1,414 million). Prudential’s ability to deliver on all of these metrics is testament to the quality of our businesses and marks us out among our peers. Our ongoing focus on driving value over volume coupled with our advantaged product and geographic business footprint and the financial discipline that is ingrained within all of our businesses has resulted in the Group delivering excellent performance in the year and gives us confidence as we look into 2011 and beyond.
GrowthIn life insurance, APE sales1 in 2010 were up 23 per cent to £3,485 million (2009: £2,844 million) and new business profit has increased by 25 per cent to £2,028 million (2009: £1,619 million) as our new business margins1 increased to 58 per cent (2009: 57 per cent).
Asia produced APE sales1 of £1,501 million (2009: £1,209 million) and new business profit1 of £902 million (2009: £725 million) in 2010, both figures up 24 per cent on the prior year. AER sales performance across Asia was strong, particularly in Indonesia (up 49 per cent), Malaysia (up 40 per cent), Hong Kong (up 19 per cent) and Singapore (up 37 per cent) where we have a powerful market presence. Our agency and bancassurance channels both continue to flourish, each growing at a rate in excess of 25 per cent, and our health and protection rider strategy remains highly successful, with health and protection products representing 27 per cent of new business premiums in 2010.
Jackson delivered APE sales of £1,164 million (2009: £912 million) and £761 million of new business profit (2009: £664 million), up 28 per cent and 15 per cent respectively on the prior year. The decline in our new business margin in the US from 73 per cent in 2009 to 65 per cent in 2010 was expected. Nevertheless, Jackson successfully defended most of the exceptional margin gains achieved in 2009 in taking advantage of the extreme dislocation prevalent in the corporate bond market. Jackson has capitalised on the weakened competitive environment in the US life insurance market and has emerged as one of the top three players in the variable annuity market in terms of sales and number two in terms of net flows. However, our expansion in variable annuities has been opportunistic and this market share may not be sustained as competition re-emerges over the medium term.
In the UK, we delivered total retail and bulk annuity APE sales of £820 million (2009: £723 million) and new business profit of £365 million (2009: £230 million), up 13 per cent and 59 per cent respectively. At a retail level, new business profit of £257 million was up 15 per cent from £223 million in 2009 at an expanded margin of 35 per cent versus 31 per cent in the prior year. This reflects improved margins on with-profits bond sales where we have seen volumes 11 per cent higher on improved demand and the strong annuity margins experienced in 2009 continuing into 2010.
CHIEF FINANCIAL OFFICER’S OVERVIEW
BUSINESS REVIEW > CHIEF FINANCIAL OFFICER’S OVERVIEW
NIC NICANDROUCHIEF FINANCIAL OFFICER
Note
1 Excluding Japan which ceased writing new business in 2010.
APE SALES
2009
£2,844m
£3,485m
2010
+23%
£2,028mNew business profit
58%New business margin

21B
US
INE
SS
RE
VIE
W
In asset management, we have delivered £8.9 billion of net inflows over 2010 compared with £15.4 billion in 2009, a year which benefited from exceptionally high flows into M&G’s fixed income funds due to the credit spread environment at the time. M&G is the driver of our inflows in asset management, producing £9.1 billion (2009: £13.5 billion) of net inflows in the period (£7.4 billion retail, £1.7 billion institutional). M&G’s track record in attracting positive net inflows is highly impressive, ranking number 1 in the UK retail market for the last nine consecutive quarters, making it one of the leading asset managers in Europe. At the end of 2010 it had external funds under management of £89.3 billion, an increase of £19.0 billion from the position at the beginning of the year; adding these funds to internal amounts, M&G’s total funds under management were £198.3 billion. Asia asset management continues to make great strides forward attracting £1.8 billion of retail and institutional inflows in 2010 (2009: £556 million). These were offset by £2.1 billion of outflows (2009: £1.4 billion inflows) in low margin money market funds where sales and redemptions tend to be highly volatile.
It is encouraging to note that we continue to grow our balance sheet with shareholder-backed policyholder liabilities up by 22 per cent to £122 billion, benefiting from both net inflows and investment market movements. We continue to see positive net inflows into our life businesses, with a net £9.7 billion being received in 2010, an increase from the net £7.2 billion received in 2009. In asset management our Group net inflows as a percentage of opening external funds under management stands at 9.9 per cent for 2010. Both measures emphasise the significant organic growth we are delivering across the Group. In addition, the returns we expect to generate on the capital we invest in writing life new business have also reached a new high. For every £1 we invested in new business strain in 2010 we expect to generate £2.2 of post-tax new business profit and our initial capital investment is expected to be paid back within two years.
ProfitabilityIn terms of profitability, we have successfully built on the momentum seen last year and delivered another strong performance thanks to a continued focus on our core disciplines of value creation and capital conservation. We have delivered record profitability in 2010 with Group IFRS operating profit up 24 per cent to £1,941 million (2009: £1,564 million) and Group EEV operating profit based on longer-term investment returns (‘EEV operating profit’) up 20 per cent to £3,696 million (2009: £3,090 million) equivalent to an annual return on embedded value of 18 per cent (2009: 15 per cent).
Central to this achievement is the active management of our portfolio of products and businesses, which in 2010 saw us cease writing new business in our Japanese life operations, exit from the equity release market in the UK, reduce our appetite for sales of fixed annuities in the US and target, instead, the highly profitable markets in South-East Asia (including Hong Kong) and variable annuities in the US. We have also remained opportunistic in the UK bulk annuity market and entered into one large transaction which comfortably exceeded our high return and short payback requirements.
In Asia, long-term business IFRS operating profit was up 29 per cent to £536 million in 2010 (2009: £416 million), a strong performance in and of itself, even before factoring in the £63 million one-off credit to the 2009 result from a change in reserving basis in Malaysia. The result benefited notably from strong performance in Indonesia, Malaysia, Singapore and Vietnam. In addition, management actions to close Japan to new business and refocus our operations in Korea and Taiwan have also helped to eliminate some of the negatives that were holding back our profitability. The ongoing build-out of distribution across South-East Asia, the success of our health and protection rider strategy, and the underlying strength of the economies in which we operate should drive continuing strong growth in Asia IFRS operating profit going forward. Asia’s long-term EEV operating profit, a measure of the economic value creation in the year, grew by 31 per cent in 2010 to £1,450 million (2009: £1,105 million) further underlining the creation of sustainable value by these operations.
“ In terms of profitability, we have successfully built on the momentum seen last year and delivered another strong performance thanks to a continued focus on our core disciplines of value creation and capital conservation.”

22
Prudential plc Annual Report 2010
CHIEF FINANCIAL OFFICER’S OVERVIEW
BUSINESS REVIEW > CHIEF FINANCIAL OFFICER’S OVERVIEW > CONTINUED
In the US, long-term business IFRS operating profit was up 35 per cent from £618 million in 2009 to £833 million in 2010. Jackson’s impressive growth in the variable annuity market is a key driver behind its improved profitability. The ‘fees on assets’ that Jackson earns on separate account assets are the highest across the Group’s unit-linked businesses, and these revenues have increased significantly as these assets have grown by over 51 per cent during 2010 to £31 billion at the end of the year. The majority of this asset growth has come from £5.8 billion of net inflows in the period (2009: £3.6 billion). Jackson’s general account has also contributed to the growth in IFRS profits during the period. The size of the general account was up slightly during 2010, and closed the year with policyholder liabilities of £29 billion but the average spread margin that we earn on these liabilities increased from 179 bps in 2009 to 243 bps in 2010. This included a £108 million benefit from various transactions undertaken during 2010 to more closely match the overall asset and liability duration, as well as management actions to lower crediting rates on fixed annuities. These actions also had the effect of improving the 2010 EEV operating profits by 18 per cent to £1,458 million (2009: £1,233 million).
In the UK long-term business IFRS operating profit was up by 11 per cent from £606 million in 2009 to £673 million in 2010. Our UK business continues to optimise the balance between growth and cash generation. The improvement in IFRS operating profit reflects the benefit of cost saving initiatives, higher with-profits income and increased annuity profits arising principally from a bulk annuity contract which contributed £63 million to the total. At eight per cent, growth in EEV operating earnings to £936 million (2009: £870 million) was in line with our strategy.
In asset management IFRS operating profit was up 27 per cent to £378 million compared to £297 million in 2009. M&G had a strong year benefiting from rising markets and the strong inflows described above, resulting in IFRS operating profit up 19 per cent to £284 million in 2010 (2009: £238 million). Asia asset management produced IFRS operating profit of £72 million up 31 per cent on the prior year (2009: £55 million), also benefiting from rising markets and an element of improving mix as £1.8 billion of high margin retail and institutional net inflows offset £2.1 billion of low margin money market net outflows.
Capital generationOur strategy of efficiently deploying our capital to those products and geographies with the most attractive profitability characteristics has, over the past three years, transformed the capital position of our business. Across the Group, we are now producing very significant amounts of free capital, which we measure as free surplus generated. Our first priority for the use of this capital is reinvestment in new business as we can achieve attractive internal rates of return (IRRs) and rapid paybacks on this investment. However, such is the scale and efficiency of our businesses, we are now producing significant amounts of free surplus over and above that which we can reinvest in new business. This excess free surplus generation is being used to continue to strengthen our balance sheet and to increase cash returns to our shareholders.
In 2010, we generated £2,359 million of underlying free surplus from our in-force business, up 13 per cent from £2,089 million in 2009, and we reinvested £645 million of this into writing new business. Asia is the priority destination when it comes to reinvesting our capital and Prudential Corporation Asia (PCA)’s growth is not constrained by the supply of capital from the Group. In the US, we invest in an opportunistic manner reflecting the market and competitive environment at the time. In the UK, we take a selective approach and focus only on lines of business where we believe we have both the scale and expertise to compete successfully. In asset management, our businesses require minimal capital to fund growth. Thus, the split of the investment in new business in 2010 was £280 million into Asia, £300 million into the US and £65 million into the UK. The IRRs on this invested capital were more than 20 per cent in Asia, the US and the UK; with payback periods of three years, one year and four years respectively.
“ Our strategy of efficiently deploying our capital to those products and geographies with the most attractive profitability characteristics has, over the past three years, transformed the capital position of our business.”

23B
US
INE
SS
RE
VIE
W
Of the remaining free surplus generated after reinvestment in new business, £935 million was remitted from the business units to Group. This cash was used to meet central costs (including those associated with Solvency II implementation) of £180 million, service net interest payments of £231 million and meet dividend payments (net of scrip) of £449 million. In 2010, we also incurred significant exceptional cash outflows relating to the AIA transaction costs of £377 million (pre-tax) and we utilised our central resources to fund the acquisition of UOB Life of £276 million. Our central cash resources amounted to £1,232 million at the end of the year, comfortably above the £1 billion holding company cash buffer we seek to retain.
The remaining free surplus generated in the period was retained within our businesses and this will bolster local capital ratios. The total free surplus balance deployed across our life and asset management operations increased from £2,531 million at the beginning of the period to £3,338 million at the end of the period.
New financial objectives – ‘Growth and Cash’ The following discussion contains forward-looking statements that involve inherent risks and uncertainties. Prudential’s actual future financial condition or performance or other indicated results may differ materially from those indicated in any such forward-looking statement due to a number of important factors (including those discussed under the heading ‘Risk factors’ in this report). See the discussion under the heading ‘Forward-looking statement’ at the end of this report.
At our 2010 investor conference entitled ‘Growth and Cash’ we announced new financial objectives demonstrating our confidence in continued rapid growth in Asia, and increasing levels of cash remittances from all of our businesses. These objectives were defined as follows:
(i) Asia growth and profitability objectives1:• To double the 2009 value of IFRS life and asset management pre-tax operating
profit in 2013 (2009: £465 million); and• To double the 2009 value of new business profits in 2013 (2009: £713 million).
(ii) Business unit cash remittance objectives1:• Asia to deliver £300 million of net cash remittance to the Group in 2013
(2009: £40 million);• Jackson to deliver £200 million of net cash remittance to the Group in 2013
(2009: £39 million); and • UK to deliver £350 million of net cash remittance to the Group in 2013
(2009: £284 million2).
(iii) Cumulative net cash remittances1:• All business units in aggregate to deliver cumulative net cash remittances of at
least £3.8 billion over the period 2010 to end-2013. These net remittances are to be underpinned by a targeted level of cumulative underlying free surplus generation of £6.5 billion over the same period.
Notes
1 The objectives assume current exchange rates and a normalised economic environment consistent with the economic assumptions made by Prudential in calculating the EEV basis supplementary information for the half-year ended 30 June 2010. They have been prepared using current solvency rules and do not pre-judge the outcome of Solvency II, which remains uncertain.
2 Representing the underlying remittances excluding the £150 million impact of proactive financing techniques used to bring forward cash emergence of the in-force book during the financial crisis.

24
Prudential plc Annual Report 2010
CHIEF FINANCIAL OFFICER’S OVERVIEW
BUSINESS REVIEW > CHIEF FINANCIAL OFFICER’S OVERVIEW > CONTINUED
The table below shows our progress towards these objectives from our results in 2010. We believe we have made a strong start towards achieving these objectives.
Actual Objective
2009£m
2010£m
2013£m
ASIA GROWTH OBJECTIVES Value of new business (including Japan) 713 901 1,426IFRS operating profit* 465 604 930BUSINESS UNIT NET REMITTANCE OBJECTIVESAsia 40 233 300Jackson 39 80 200UK† 434 420 350M&G‡ 175 202
Total 688 935
CUMULATIVE NET CASH REMITTANCES FROM 2010 ONWARDS 3,800
CUMULATIVE UNDERLYING GROUP FREE SURPLUS GENERATION NET OF INVESTMENT IN NEW BUSINESS 6,500
* Total Asia operating profit from long-term business and asset management after development costs.
† In 2009, the net remittances from the UK include the £150 million in 2009 arising from the pro-active financing techniques used to bring forward cash emergence of the in-force book during the financial crisis. The 2010 net remittances include an amount of £120 million representing the releases of surplus and net financing payments.
‡ Including Prudential Capital.
In 2010 net remittances from business operations increased to £935 million, equivalent to 55 per cent of underlying free surplus generated (after investment in new business) of £1,714 million. The increased level of net remittances further illustrates both the strong and improving capital generative nature of our business, with a greater proportion of this capital being returned to the corporate centre in the form of dividends. The delivery of the 2010 to 2013 financial objectives will see this trend continue.
Capital position, financing and liquidityThe Group has continued to maintain a strong capital position. At the end of 2010 our IGD surplus stood at £4.3 billion (2009: £3.4 billion), with coverage a very strong 3.0 times the requirement. All of our subsidiaries maintain strong capital positions at the local regulatory level. In particular, Jackson’s RBC ratio has continued to strengthen throughout the period under review and at the end of 2010 this ratio stood at 483 per cent.

25B
US
INE
SS
RE
VIE
W
Solvency II, which is expected to be implemented from 1 January 2013, represents a complete overhaul of the capital adequacy regime for European insurers. We welcome the risk-based focus of the Solvency II regime but, along with our European peers, we do have concerns about the degree of prudence built in within the proposed calibrations for the standard formula. We are engaging directly with our peers, politicians and regulators to ensure a fair and reasonable outcome before the regime becomes law.
Our financing and liquidity position has remained strong throughout the period. The next call on external financing is in December 2011 on the ¤500 million Tier 2 subordinated notes. In early 2011 we successfully issued US$550 million Tier 1 subordinated debt in anticipation of calling the ¤500 million Tier 2 notes.
We continue to engage with rating agencies in order to provide insurance financial strength ratings for the Group. Prudential is currently rated A+ by S&P, A2 (negative outlook) by Moody’s and A by Fitch.
Embedded valueEEV shareholders’ funds increased by 19 per cent during 2010 to £18.2 billion (2009: £15.3 billion). On a per share basis EEV at the end of 2010 stood at 715 pence, up 19 per cent from the end of 2009 (2009: 603 pence).
2010 dividend In view of the progress that the Group has made in recent years to improve IFRS operating profitability and free surplus generation, the Board has decided to rebase the full year dividend upwards by 4 pence per share, equivalent to an increase of 20 per cent. In line with this, the directors recommend a final dividend of 17.24 pence per share, which brings the total dividend for the year to 23.85 pence per share (2009: 19.85 pence per share). The scrip dividend scheme is not being offered in respect of this dividend. In its place shareholders will be offered a Dividend Reinvestment Plan (DRIP).
The Board will maintain its focus on delivering a growing dividend from this new higher base, which will continue to be determined after taking into account the Group’s financial flexibility and our assessment of opportunities to generate attractive returns by investing in specific areas of the business. The Board believes that in the medium term a dividend cover of around two times is appropriate.
Summary2010 was a good year for the Group in uncertain conditions as global economies emerged from the financial crisis. These results demonstrate that we are maximising the growth opportunities of our high quality franchises in Asia, the US, and the UK. We remain disciplined in our approach of optimising value and are very focused on improving the quality of our earnings. We have accelerated the generation of free surplus and we are signalling our confidence in the future potential of our business by proposing an increase in the payout to shareholders.
“ These results demonstrate that we are maximising the growth opportunities of our high quality franchises in Asia, the US, and the UK.”

26
Prudential plc Annual Report 2010
ACCELERATINGASIA
BUSINESS REVIEW > INSURANCE OPERATIONS > ASIA

BU
SIN
ES
S R
EV
IEW
27

28
Prudential plc Annual Report 2010
BUSINESS REVIEW > INSURANCE OPERATIONS > ASIA > CONTINUED
BARRY STOWECHIEF EXECUTIVE PRUDENTIAL CORPORATION ASIA
The Asian economies continue to lead the world in terms of current and prospective growth and it is clear that Asia’s historic reliance on exports is increasingly balanced with rapidly growing domestic consumption. Across the region, we are seeing major demographic and socioeconomic changes – with the emergence of a sizeable and growing middle class.
The Asian Development Bank estimates that there are now over 1.9 billion middle class Asians, a threefold increase since 1990 and this means that, within a generation, hundreds of millions of households in the region have ascended from poverty to living standards and lifestyle aspirations that are consistent with those seen in Western Europe and the US. These are urbanised households that are smaller, that are better educated, that want good quality housing, consumer goods, access to good medical services, transport, holidays, entertainment, education, to provide a quality of life for their children that is better than the one they had and not least to have a long life with a comfortable retirement.
Household savings rates in Asia have historically been multiples of those in the UK and US and in markets where little exists in the way of state backed social security benefits or welfare support, the need to save in case of an unplanned life changing event such as a medical incident involving hospitalisation is real and strong. As households have become wealthier the quantum of these emergency funds has increased materially, resulting in significant amounts of undeployed or under-deployed capital waiting to be brought into the formal economy as they migrate to insurance companies’ and banks’ balance sheets. Life insurance companies are ideally placed to provide some financial protection and security to household balance sheets.
Although there will inevitably be some short-term fluctuations in demand for life insurance and asset management products as other factors come into play, the fundamental social and political drivers for growth in these sectors will continue to support long-term growth.
Market overview Overall, Asia’s life insurance industry saw a sharp recovery in new business volumes during 2010 as markets moved beyond the 2008/2009 crisis.
The competitive landscape for the life sector varies by market but has largely remained consistent with that seen in prior years. Most markets feature a mix of local and multinational players whose definitions of business success may differ.
Competition is primarily around securing distribution. With insurance penetration rates being generally low, growth is less constrained by the size of the market than by companies’ ability to further expand it by adding distribution and making their products available to parts of the population who have never used them. A large proportion of sales in markets with low penetration are to consumers who have never bought a policy before, thus expanding the market itself.
ASIA

29B
US
INE
SS
RE
VIE
W
Tied agency continues to dominate although distribution through banks is becoming increasingly significant, with examples like HSBC Life and Bank of China Life in Hong Kong. Across the region there is little direct competition on products; there are no patents or copyrights in life insurance, or on product pricing, where regulators typically define the parameters for the industry.
The region’s life insurance regulators tend to adopt a conservative stance and remain focused on driving development of the sector in a way that balances the need to ensure consumers have, first and foremost, access to appropriate products that are sold in a fair and transparent manner with the need to reward shareholders for taking on the risks of investing in the development of a relatively young and capital intensive industry. The industry also employs millions of people in the region, an important consideration when high unemployment rates can be a catalyst for political friction. India saw the most impactful regulatory change during 2010, which in summary, was designed to shift the emphasis of the industry away from products which are mostly investment orientated and encourage more traditional savings and protection.
A positive development in a number of markets has been the development of the financial press. Many leading publications carry regular sections on personal financial planning and there is healthy debate on the uses of particular types of product. Prudential is a champion of improving standards of financial literacy.
Strategy overviewThe overarching objective for Prudential in Asia is to continue building scale profitably, leveraging our advantaged platform. The strategic priorities articulated in 2006 remain entirely relevant and continue to be driven in a highly focused and disciplined way. While market outperformance in terms of new business growth is an indicator of scale, we do not pursue volume for its own sake as we put profitability, returns on capital and capital efficiency ahead of topline growth.
One of the key components of our strategy is driving agency distribution scale and productivity. Our agency structures are differentiated by market depending upon their size and maturity with the management emphasis balanced between recruitment (newer markets like Indonesia and Vietnam) and productivity growth (more established markets like Hong Kong and Singapore). However this is a simplification as those two priorities are always present and not mutually exclusive; local management will always focus on both.
Prudential’s agency management competencies drive effective selection discipline and training designed to ‘fast start’ new agents and improve the skills and productivity of the more experienced ones. Our combination of training programmes, comprehensive product suites, specialised support allowing agents to address the evolving needs of existing customers and technology solutions to facilitate the fact finding and proposal submission processes combine to add value to agents, shareholders and customers.
* Operating profit from long-term operations including Japan but excluding asset management operations, development costs and Asia regional head office expenses.
£536mTotal IFRS operating profit*
FINANCIAL PERFORMANCE CER
2010£m
2009£m
Change%
2009£m
Change%
APE sales (excluding Japan) 1,501 1,209 24 1,300 15NBP (excluding Japan) 902 725 24 783 15NBP margin (excluding Japan) (% APE) 60% 60% 60%Total IFRS operating profit* 536 416 29 451 19Total EEV operating profit* 1,450 1,105 31 1,190 22
2011 PRIORITIES
• Continue expanding multi-channel distribution platform and improving its productivity
• Focus on regular premium products with comprehensive suite of protection riders
• Drive value through operational efficiency
APE SALES
2009
£1,209m
£1,501m
2010
+24%
£902mNew business profit

30
Prudential plc Annual Report 2010
During 2010 total average agent numbers excluding India at 154,000 were up 7.5 per cent over 2009. In India, where significant regulatory changes were introduced during the year, agent numbers were down 27 per cent to 168,000 at the end of December 2010. This is in line with our strategy to rationalise expense levels and focus on productivity improvements, which puts us in a strong position to respond to the recent regulatory changes. Excluding India, our agency productivity in terms of average APE per agent increased by 10 per cent.
Prudential is a pioneer and regional leader in partnership distribution in Asia. Key success drivers are our expertise in developing, training and motivating in branch insurance specialists and our investment in enduring and mutually beneficial relationships with our partners, including Standard Chartered Bank across the region, E.Sun in Taiwan and most recently United Overseas Bank in Singapore, Thailand and Indonesia.
Prudential’s product mix continues its emphasis on regular premium policies and protection riders. The high proportion of health and protection, standalone and riders, at 27 per cent of new business premiums in 2010, supports the new business profit margins and reflects the higher proportion of risk based products in our book than some competitors who focus on single premium investment orientated policies.
Prudential currently insures over 11 million life customers in Asia and has 15 million in-force policies. Highlighting the value Prudential policies have for our customers, we paid out £2.6 billion in claims and maturities during 2010. This customer base is a tremendously valuable asset as over 40 per cent of new business APE came from existing customers in 2010 (excluding India). This reflects our enduring relationship with our customers and how our solutions are meeting their needs over time. The customer retention rate continues to improve and at 91 per cent it is one per cent up on 2009.
Financial performanceNew business for the fourth quarter was a new record at £435 million, up eight per cent on the same period last year, which was already a record quarter and the full year 2010 was £1,501 million up 24 per cent on 2009 and an impressive 44 per cent ahead of 2007, the last full year to be unaffected by the 2008/2009 financial crisis. Agency remains the largest distribution channel accounting for 66 per cent of new business volumes and with the proportion from bancassurance increasing from 25 per cent to 26 per cent. The proportion of linked and protection business remained broadly in line with prior year at 41 per cent and 27 per cent respectively. With the economic recovery, the size of average cases, excluding India, increased nine per cent. Importantly, our continued emphasis on regular premium business is reflected in its 93 per cent contribution to total APE, which is also in line with prior year.
New business market share statistics for full year 2010 are not yet available but based on our estimates and market intelligence we expect to have retained or improved our market rankings in most markets across the region.
Consistent with our ‘value over volume’ priority we have maintained our product and pricing disciplines. New business profits of £9021 million are up 24 per cent over 2009. Average new business profit margins have remained the same as prior year at 60 per cent, with the positive impacts of country mix changes having largely been offset by operating assumption changes.
In-force operating profits from long-term business of £549 million are up 40 per cent on prior year. This increase reflects the growing size of the in-force book and a significantly reduced level of net negative operating experience variance at £1 million compared to negative £85 million in 2009, which, in part, reflects lower adverse persistency variances of negative £48 million compared with the 2009 level of negative £76 million. The net negative variance level of £1 million is small relative to the size of the EEV shareholders’ funds (before goodwill) of £7.4 billion.
BUSINESS REVIEW > INSURANCE OPERATIONS > ASIA > CONTINUED
ASIA
Note
1 Excluding Japan which ceased writing new business in 2010.
“ Prudential currently insures over 11 million life customers in Asia and has 15 million in-force policies. Highlighting the value Prudential policies have for our customers, we paid out £2.6 billion in claims and maturities during 2010.”
2013 FINANCIAL OBJECTIVES
• Double 2009 value of IFRS life and asset management pre-tax operating profit
• Double 2009 value of new business profits
• Deliver £300 million of net cash remittance to the Group

31B
US
INE
SS
RE
VIE
W
Full year 2010 operating profits from long-term business reported under the IFRS basis were £536 million, up 29 per cent over 2009 reflecting increased crystallisation of profits from the in-force book and lower new business strain of four per cent of APE compared to six per cent last year1. All operations aside from Japan, China and Taiwan made an IFRS profit in 2010.
Underlying free surplus net of investment in new business has improved to £326 million in 2010 compared to £119 million in 2009 driven principally by growth in in-force profits reflecting the increasing size and inherent profitability of the in-force book.
The life business significantly increased remittance of cash to the Group in 2010, at £267 million up from £80 million in 2009. This includes an exceptional £130 million from Malaysia representing the remittance of distributable earnings accumulated over recent years. Whilst this one-off type of remittance will not be repeated, it further demonstrates our ability to upstream cash from the region.
Looking at individual countries:
CHINA
AER CER
2010£m
2009£m
Change%
2009£m
Change%
APE sales 58 45 29 46 26
In China, Prudential’s 50 per cent share of new business volumes for 2010 was £58 million up 29 per cent on prior year. Agency remains the largest distribution channel although bank distribution grew at a slightly faster pace, up 35 per cent. Leading bank partners are SCB, CITIC and ICBC. In a market where bank sales are overwhelmingly dominated by single premium investment products it is important to note that 25 per cent of our bank channel APE is now regular premium unit-linked business.
CITIC-Prudential remains one of the leading foreign joint ventures and we continue to pursue our strategy of quality sales and sustainable value creation rather than trying to achieve short-term sales volume growth.
HONG KONG
AER CER
2010£m
2009£m
Change%
2009£m
Change%
APE sales 287 241 19 244 18
Hong Kong delivered an excellent result in 2010 with new business APE of £287 million up 19 per cent on prior year. Our continuing success in this market is underpinned by the quality of both our distribution and product development. In 2010 some 42 per cent of our new business sales were from new products launched in the year.
Our average agency headcount increased by 15 per cent, principally through organic recruitment initiatives, closing the year with an agency count in excess of 5,000. Our long-term bancassurance relationship with Standard Chartered Bank saw a strong rebound following the 2008/2009 crisis. In-branch insurance specialists continue to focus on recurring premium savings and protection products and the profitability of the product mix continues to improve. Bancassurance now accounts for 37 per cent of our total sales, growing by 24 per cent in 2010.
Note
1 Excluding Japan which ceased writing new business in 2010.

32
Prudential plc Annual Report 2010
INDIA
AER CER
2010£m
2009£m
Change%
2009£m
Change%
APE sales 188 168 12 179 5
The India market has been through a significant period of change during 2010, particularly with the regulatory driven refocus on savings and protection products, which came into effect on 1 September. Sales have fallen by 56 per cent in the last quarter of the year and we expect that the unit-linked market will remain disrupted in the short-term. Nevertheless during 2010 ICICI-Prudential grew new business APE by 12 per cent to £723 million (Prudential’s 26 per cent share is £188 million). Agency remains the largest distribution channel and following reductions in the size of the agency force, initiatives to improve agency productivity are delivering good results.
INDONESIA
AER CER
2010£m
2009£m
Change%
2009£m
Change%
APE sales 283 190 49 219 29
Prudential’s business in Indonesia where we sell both conventional and takaful products, continues to be a clear market leader. New business volumes for 2010 of £283 million were driven by a very effective agency management approach that prioritises not only disciplined recruitment but also professional training and activation programmes. Average agency numbers have increased by 5 per cent during 2010 (to 81,000) and APE per active agent is higher by 21 per cent. Our agency generates over 90 per cent of total new business and this is predominantly regular premium unit-linked with protection riders.
During 2010 we have added new bancassurance agreements with UOB, SCB and Permata.
KOREA
AER CER
2010£m
2009£m
Change%
2009£m
Change%
APE sales 96 122 (21) 135 (29)
In Korea we remain focused on writing profitable business and remain resolute in our unwillingness to compete in the low margin, capital-intensive guaranteed products sector. New business volumes of £96 million for 2010 are 21 per cent lower than last year. We remain confident in our approach and the value this is generating for shareholders. The fourth quarter 2010 APE sales at £27 million were four per cent higher than the fourth quarter 2009. Persistency in Korea continues to improve.
MALAYSIA
AER CER
2010£m
2009£m
Change%
2009£m
Change%
APE sales 204 146 40 163 25
Our traditional and takaful businesses in Malaysia had a record 2010 with new business APE of £204 million. In local currency terms we are the first insurer in the history of the industry to pass RM1 billion in new business APE in a year. This growth has been driven primarily by the agency channel where the strategy to expand into the Bumi and takaful sectors has proven to be successful with our average agent numbers increasing by nine per cent (to 13,000 of which 46 per cent are Bumi).
BUSINESS REVIEW > INSURANCE OPERATIONS > ASIA > CONTINUED
ASIA

33B
US
INE
SS
RE
VIE
W
Productivity initiatives targeting the enhancement of existing policies have also been very effective, for example a recent offer to upgrade a health plan resulted in a 30 per cent take up rate. Average APE per agent is 16 per cent higher reflecting both renewed confidence in the market and the impact of these cross selling initiatives.
SINGAPORE
AER CER
2010£m
2009£m
Change%
2009£m
Change%
APE sales 175 128 37 138 27
Singapore also had a very strong 2010 with new business of £175 million up 37 per cent on prior year with improvements in agency productivity (APE per agent up 15 per cent) and the very successful launch of bancassurance with UOB that generated 11 per cent of new business.
TAIWAN
AER CER
2010£m
2009£m
Change%
2009£m
Change%
APE sales 120 107 12 114 5
Following our exit of the agency channel in 2009, Taiwan is now successfully focused on bank distribution principally with partners E.Sun and SCB. New business volumes of £120 million for the year are up 12 per cent on prior year and Taiwan remains a material contributor to Asia’s results.
OTHERS – PHILIPPINES, THAILAND AND VIETNAM
AER CER
2010£m
2009£m
Change%
2009£m
Change%
APE sales 90 62 45 62 45
Vietnam delivered a very strong result in 2010, up 17 per cent on the prior year, driven by improvements in agency manpower and productivity. Although still relatively small both Philippines and Thailand delivered excellent results with APE up 109 per cent and 63 per cent respectively. Our new distribution agreement with UOB in Thailand has made a strong start, contributing 41 per cent of total APE and helping to nearly double our market share.
JAPAN
As previously announced, PCA Life Japan ceased writing new business with effect from 15 February 2010. Sales for Japan in 2010 amounted to £7 million (2009: £52 million). In order to reflect the results of our ongoing Asian operations, APE sales and NBP metrics included in this report exclude the contribution from Japan.

34
Prudential plc Annual Report 2010
STRENGTHENINGUNITED STATES
BUSINESS REVIEW > INSURANCE OPERATIONS > UNITED STATES

BU
SIN
ES
S R
EV
IEW
35

36
Prudential plc Annual Report 2010
The United States is the world’s largest retirement savings market. Each year, more of the 78 million baby boomers1 reach retirement age, triggering a shift from savings accumulation to retirement income generation for more than US$10 trillion of accumulated wealth over the next decade.2
During 2010, the US financial services industry continued to face many challenges. The recovery witnessed in the first quarter reversed in the second quarter but was more visible again in the third and fourth quarters. At half year, the S&P 500 index was down 7.6 per cent, 10-year Treasury rates had dropped below three per cent, swap rates had declined to near historic lows, AA corporate spreads had increased slightly and volatility had risen to levels more consistent with the first half of 2009. By year-end, the S&P 500 index was up 12.8 per cent for the year. Rates on 10-year Treasuries, which continued to decline through the third quarter before increasing in the fourth quarter, finished the year at 3.3 per cent, down from 3.9 per cent at the end of 2009. Swap rates also declined through the third quarter before rebounding slightly in the fourth quarter, although they still were near historic lows at year-end. Corporate AA spreads and volatility both declined through the second half of the year to fall below year-end 2009 levels.
We believe these unstable market conditions continue to provide a competitive advantage to companies with strong financial strength ratings and a relatively consistent product set. Companies that were hardest hit by the market disruption over the last few years are in general still struggling to regain market share as customers and distributors continue to seek product providers that offer consistency, stability and financial strength. Jackson continues to benefit significantly from this flight to quality as its financial strength ratings from the four primary rating agencies have remained unchanged for more than eight years. Through its financial stability and innovative products that provide clear value to the consumer, Jackson has enhanced its reputation as a high-quality and reliable business partner, with sales increasing as more advisers have recognised the benefits of working with Jackson.
Jackson’s strategy continues to focus on balancing volume and capital consumption for both variable and fixed annuities. Jackson continued to sell no institutional products during 2010, as available capital was directed to support higher-margin variable annuity sales.
BUSINESS REVIEW > INSURANCE OPERATIONS > UNITED STATES > CONTINUED
2011 PRIORITIES
• Continue to drive positive net retail flows
• Innovate around our key variable annuity product
• Further enhance operational efficiency
UNITED STATES
Notes
1 Source: US Census Bureau.2 Source: McKinsey.
“ Jackson’s strategy continues to focus on balancing volume and capital consumption for both variable and fixed annuities.”
MIKE WELLSPRESIDENT AND CHIEF EXECUTIVE OFFICERJACKSON NATIONAL LIFE INSURANCE COMPANY

37B
US
INE
SS
RE
VIE
W
Business overviewInitiatives in 2010Continue to innovate around our key variable annuity productJackson continues to be innovative in its product offerings, implementing various changes in 2010 to increase sales, to comply with revised regulations or to enhance risk management flexibility and/or increase profitability.
In 2010, Jackson added two new optional lifetime guaranteed minimum withdrawal benefits (GMWBs) to its variable annuity products. LifeGuard Freedom 6 Net GMWB, introduced in May, gives investors the opportunity to help offset their tax liability by increasing their available withdrawal amounts to generate more income. LifeGuard Freedom Flex, introduced in October, is the industry’s first customisable guaranteed minimum withdrawal benefit. Freedom Flex extends the menu-driven construction that Jackson offers in its variable annuity products, which gives investors the ability to build a personalised benefit based on their individual retirement planning objectives, while paying only for those options elected. Additionally, Jackson added six portfolios from American Funds and added BlackRock, managing two portfolios, to its variable annuity fund line-up during the year.
Continue to focus on improving efficiency of operationsJackson continues to invest in its back office staffing and systems to provide world class customer service in an efficient and cost effective manner. In 2010, for the fifth consecutive year, Jackson was rated as a ‘World Class’ service provider by Service Quality Measurement Group1. Jackson was able to provide this level of service in 2010 while processing record retail sales and maintaining its ratio of statutory general expenses to average assets (one measure of efficiency) at the 2009 level of 44 basis points.
Expand retail operationWith consistent, high-quality wholesaling support and customer service, combined with stability in product offering, pricing and financial strength ratings and the ability to bring new products to market swiftly, Jackson continues to be an attractive business partner for its long-term distributors, as well as attract new distributors. During 2010, Jackson increased the number of licensed agents and registered representatives to more than 130,000.
Financial performanceIFRS pre-tax operating profit for the long-term business was £833 million in 2010, up 35 per cent over the £618 million in 2009. This increase was primarily due to higher separate account fee income due to substantial positive net flows and the improved equity markets and higher spread income.
2013 FINANCIAL OBJECTIVE
• Deliver £200 million of net cash remittance to the Group
£833mTotal IFRS operating profit*†
FINANCIAL PERFORMANCE AER CER
2010£m
2009£m
Change%
2009£m
Change%
APE sales 1,164 912 28 924 26NBP 761 664 15 673 13NBP margin (% APE) 65% 73% 73%Total IFRS operating profit*† 833 618 35 626 33Total EEV operating profit* 1,458 1,233 18 1,249 17
* Based on longer-term investment returns and excluding broker-dealer, fund management and Curian. † The Company has amended the presentation of IFRS operating profit for its US operations to remove the net equity hedge accounting effect (incorporating related amortisation of deferred acquisition costs) and include it in short-term fluctuations. 2009 amounts have been amended accordingly.
Note
1 Source: Service Quality Measurement Group.
“ In 2010, for the fifth consecutive year, Jackson was rated as a ‘World Class’ service provider by Service Quality Measurement Group1. ”
APE SALES
2009
£912m
£1,164m
2010
+28%
£761mNew business profit

38
Prudential plc Annual Report 2010
UNITED STATES
At 31 December 2010, Jackson had £31 billion in separate account assets, more than doubling the balance in the last 18 months. Separate account assets in 2010 averaged £9 billion higher than during 2009, reflecting the impact of sales and the higher average market levels. This growth resulted in variable annuity separate account fee income of £506 million in 2010, up 56 per cent over the £324 million in 2009.
Total spread income, including the expected return on shareholders’ assets, of £817 million increased 31 per cent over the £622 million in 2009, primarily due to decreased crediting rates on fixed annuities and higher income on the growing general account assets. Jackson undertook various interest rate swap transactions during 2010 to more closely match the overall asset and liability duration, benefiting spread income in 2010 by £108 million.
Acquisition costs have increased in absolute terms compared to 2009 due to the significant increase in sales. However, acquisition costs as a percentage of APE has fallen from 76 per cent in 2009 to 73 per cent in 2010 as more advisors are electing to take asset based commissions which are paid over the life of the policy based on fund value. This asset based commission is not a deferrable acquisition cost and is expensed in the current period as an administration expense.
DAC amortisation of £334 million in 2010 compared to £223 million in 2009. 2010 includes £11 million additional amortisation as equity market returns fell below assumed rates (2009: £39 million benefit from improved equity markets). Excluding this effect, the underlying amortisation increased £61 million due to higher gross profits.
Administration expenses totalling £344 million in 2010 compared to £259 million in 2009, with the increase due primarily to higher asset based commissions which are excluded from acquisition costs.
With the improvement in the bond markets in 2010, and active management of the investment portfolio to reduce certain investment risks, Jackson realised net gains of £11 million in 2010 compared to net realised losses of £506 million in 2009. Jackson incurred losses, net of recoveries and reversals, on credit related sales of bonds of £89 million (2009: less than £1 million). Write downs were £124 million (£630 million in 2009), including £71 million on RMBS and £39 million on ABS. More than offsetting these losses were interest related gains of £224 million (2009: £125 million), primarily due to sales of lower rated CMBS and corporate debt.
Gross unrealised losses improved from £966 million at 31 December 2009 to £370 million at 31 December 2010. The net unrealised gain position has also improved significantly, from £4 million at 31 December 2009 to £1,210 million at 31 December 2010 due primarily to a decline in the US Treasury rates.
Jackson delivered record retail APE sales of £1,164 million in 2010, representing a 28 per cent increase over 2009. With no institutional sales in 2010, total APE sales were also £1,164 million, the highest total in the company’s history. This achievement further demonstrates the resilience of Jackson’s business model, as well as stability of our high-quality product offerings, exceptional wholesaling support and consistency demonstrated throughout the economic downturn.
While the equity markets rebounded in 2010, reaching two-year highs in December, and in light of continued volatility in US equity markets and historically low interest rates, customers continue to seek to mitigate equity risk while receiving an acceptable return through the purchase of variable annuities with guaranteed living benefits. Jackson is a beneficiary of this trend while being well placed to benefit from the huge wave of baby boomers starting to retire, as they increasingly use variable annuities to structure their retirement income.
In 2010, record variable annuity APE sales of £948 million were up 48 per cent from 2009. Jackson ranked third in new variable annuity sales in the US in 2010 with a market share of 11 per cent, up from fourth and a market share of eight per cent in 20091. With significant sales increases and continued low surrender rates, Jackson held steady with its ranking of second in variable annuity net flows in 20104.
BUSINESS REVIEW > INSURANCE OPERATIONS > UNITED STATES > CONTINUED
“ Jackson ranked third in new variable annuity sales in the US in 2010 with a market share of 11 per cent, up from fourth and a market share of eight per cent in 20091.”

39B
US
INE
SS
RE
VIE
W
Fixed annuity APE sales of £84 million were down 20 per cent from the prior year, as consumer demand for the products fell due to the continued low interest rate environment. Jackson’s new business opportunities were balanced with the goals of capital and cash conservation. Jackson ranked eighth in sales of traditional deferred fixed annuities through the third quarter of 2010, with a market share of three per cent compared to 13th with a two per cent market share for the full year 20092.
Fixed index annuity (FIA) APE sales of £109 million in 2010 were down 24 per cent from 2009 as Jackson focused its marketing efforts on the higher margin variable annuity products. Jackson ranked sixth in sales of fixed index annuities through the first three quarters of 2010, with a market share of five per cent, down from fourth and a market share of eight per cent for the full year 20093.
Retail annuity net flows increased 38 per cent, benefiting from record sales and continued low levels of surrender activity.
Jackson achieved extraordinary EEV new business margins in 2009, partially as a result of our ability to take advantage of the extreme dislocation prevalent in the corporate bond market. While the recovery in the corporate bond market has led to somewhat lower EEV new business margins due to lower spreads in 2010, we continue to write new business at internal rates of return in excess of 20 per cent.
The exceptionally high EEV spread levels in 2009 included an allowance that crediting rates and spreads would normalise in the future.
EEV basis new business profits of £761 million were up 15 per cent on 2009, reflecting a 28 per cent increase in APE sales offset somewhat by lower new business margins. Total new business margin was 65 per cent, compared to 73 per cent achieved in 2009.
The variable annuity new business margin of 72 per cent in 2010 decreased somewhat from 81 per cent in 2009, as lower assumed separate account returns and lower assumed spreads on the guaranteed funds were partially offset by an increase in-the take-up rate on guaranteed benefits – particularly guaranteed minimum withdrawal benefits.
The fixed index annuity new business margin decreased from 51 per cent in 2009 to 41 per cent in 2010 due to decreased spread assumptions and lower interest rates, offset somewhat by longer maturity contracts sold in 2010. These same interest rate and spread factors also caused the fixed annuity new business margin to normalise from 57 per cent to 34 per cent. For both products, the spread assumptions decreased due primarily to abnormally high investment yields during 2009.
Total EEV basis operating profit for the long-term business in 2010 was £1,458 million, compared to £1,233 million in 2009. In-force EEV profits of £697 million for 2010 were 22 per cent higher than 2009 profit of £569 million. During 2010, EEV basis operating profit benefited as a result of the interest rate swap transactions noted earlier. Including this benefit, experience variances and other items were £201 million higher in 2010 due primarily to favourable spread and persistency variances that were partially offset by lower expense and mortality variances.
In 2010, Jackson invested £300 million of free surplus to write £1,164 million of new business (2009: £326 million and £912 million, respectively). The reduction in capital consumption year-on-year was caused predominantly by the differing business mix in 2010, when Jackson wrote a higher proportion of variable annuity business, which consume lower levels of initial capital, while maintaining a disciplined approach to fixed and fixed index annuity pricing.
Notes
1 Source: Morningstar2 Source: LIMRA3 Source: AnnuitySpecs4 Source: SimFund

40
Prudential plc Annual Report 2010
BUSINESS REVIEW > INSURANCE OPERATIONS > UNITED KINGDOM
FOCUSINGUNITED KINGDOM

BU
SIN
ES
S R
EV
IEW
41

42
Prudential plc Annual Report 2010
Prudential UK competes selectively in the UK’s retirement savings and income market. The focus of the business is to balance writing profitable new business at attractive returns on capital with sustainable cash generation, which is key for the Group and capital preservation. It is this discipline that has enabled Prudential UK to deliver another strong performance in 2010.
The UK has a mature life and pensions market which is characterised by an ageing population – in particular, through two waves of baby-boomers born after World War II and in the 1960s – with wealth distribution significantly skewed and very much concentrated in the 45-74 age group. In this context, the retirement and near-retirement segments are highly attractive.
UK consumers are insufficiently prepared as they will have to face increasingly long periods of retirement. This will result in longer working lives and a more flexible approach towards retirement. It will also mean that the baby-boomers will need to target their wealth on the provision of dependable retirement income. Prudential UK’s expertise in areas such as longevity risk management and multi-asset investment, together with its financial strength and strong brand, mean that the business is strongly positioned in the retirement planning space with a particular focus on with-profits and annuities.
Business overviewSelective participation in the retirement income and savings market Prudential UK has a strong individual annuity business, built on a robust pipeline of internal vestings from maturing individual and corporate pension policies. The internal vestings pipeline is supplemented by sales through intermediaries and strategic partnerships with third parties where Prudential is the recommended annuity provider for customers vesting their pensions at retirement.
Total individual annuity sales of APE £205 million were six per cent lower than in 2009, mainly due to lower sales of conventional annuities where Prudential UK proactively managed the flow of new business to control capital consumption. This was partially offset by strong sales of with-profits annuities which represented 22 per cent of total annuity sales, compared with 15 per cent last year, due to the continuing success of the innovative Income Choice Annuity (ICA). The ICA is a with-profits product, launched in March 2009, which offers consumers security with a potential for income growth.
Internal vestings annuity sales of APE £124 million were nine per cent down on 2009, principally due to the number of customers retiring being lower than in 2009. Although fewer Prudential customers invested in conventional annuities, there continues to be a positive increase in the number of customers choosing an ICA, with sales of APE £16 million resulting in a 38 per cent increase in with-profits annuity sales.
BUSINESS REVIEW > INSURANCE OPERATIONS > UNITED KINGDOM > CONTINUED
ROB DEVEYCHIEF EXECUTIVEPRUDENTIAL UK AND EUROPE
2011 PRIORITIES
• Balance writing profitable new business at attractive returns on capital with sustainable cash generation and capital preservation
• Continue to pursue a value-driven strategy built around our core strengths in with-profits and annuities
• Deliver further improvements to operational performance and customer service while maintaining a strict focus on costs
• Continue building complementary distribution channels
UNITED KINGDOM
“ Prudential UK’s expertise in areas such as longevity risk management and multi-asset investment, together with its financial strength and strong brand, mean that the business is strongly positioned in the retirement planning space.”

43B
US
INE
SS
RE
VIE
W
Onshore bond sales of APE £166 million were up 15 per cent, including with-profits bond sales of APE £146 million which increased 11 per cent with an exceptionally strong fourth quarter. PruFund made up 78 per cent of our total with-profits bond sales. Demand for Prudential UK’s with-profits products remains resilient and the business has continued to innovate to maintain and enhance its position in the market. This includes broadening access to PruFund across its retail savings product range and PruFund now has over £3 billion invested.
Unit-linked bond sales of APE £20 million were 61 per cent up on 2009, helped by the launch of PruDynamic portfolio funds in January 2010 and the continued success of the PruSelect fund range.
Individual pension sales of APE £69 million (including income drawdown) were three per cent up on 2009. Sales of the Flexible Retirement Plan, Prudential UK’s RDR-compliant individual pension and income drawdown product, grew by four per cent to APE £22 million. PruFund Cautious, launched in the fourth quarter of 2009, and the new PruDynamic portfolio funds, launched in January 2010, together made up 34 per cent of individual pension sales.
Corporate pension sales of APE £221 million were five per cent above 2009 levels. Prudential UK administers corporate pensions for over 600,000 scheme members sponsored by some of the UK’s largest employers and has also built a very strong position in the provision of with-profits Additional Voluntary Contribution (AVC) arrangements. Prudential UK provides AVCs to 66 of the 99 Local Government Authorities in England & Wales. During 2010, Prudential UK continued to focus on strengthening existing relationships through further improvements to online servicing capabilities as well as targeted marketing activity.
In August 2010, Prudential UK’s joint venture partner Discovery SA announced the completion of the acquisition of Standard Life Healthcare and its combination with the PruHealth business. As part of the transaction, Prudential UK reduced its shareholding in the combined PruHealth and PruProtect businesses from 50 per cent to 25 per cent of the enlarged Group and sales are included on a proportionate basis from 1 August 2010. PruProtect sales had previously been included at 100 per cent and PruHealth sales at 50 per cent. The effect of this reporting change is that Prudential UK’s share of PruProtect sales is reported at APE £16 million, an increase of 18 per cent. Prudential UK’s share of PruHealth sales of APE £12 million was nine per cent higher than in 2009, and at the end of 2010, the combined health business covered approximately 680,000 lives.
FINANCIAL PERFORMANCE AER CER
2010£m
2009£m
Change%
2009£m
Change%
APE sales 820 723 13 723 13NBP 365 230 59 230 59NBP margin (% APE) 45% 32% 32%Total IFRS operating profit 719 657 9 657 9Total EEV basis operating profit 982 921 7 921 7
£719mTotal IFRS operating profit
2013 FINANCIAL OBJECTIVE
• Deliver £350 million of net cash remittance to the Group
TOTAL IFRS OPERATING PROFIT
2009
£657m£719m
2010
+9%
£365mNew business profit

44
Prudential plc Annual Report 2010
Capitalising on our competitive advantages The strength and investment performance of Prudential UK’s With-Profits Fund is widely recognised in the industry and was demonstrated by the 12.7 per cent pre-tax investment return achieved for policyholder asset shares in the Fund in 2010. The Fund has delivered investment returns of 82.1 per cent over ten years, which compares favourably with other with-profits funds and the FTSE All-Share Index (total return) of 43.3 per cent over the same period. This strong performance has shown that with-profits, when invested in an actively managed, and financially strong fund like Prudential’s, continues to be a very attractive medium to long-term investment, offering strong annualised returns compared with other investment options. Prudential’s with-profits customers benefit from the security offered by Prudential’s large inherited estate, with the free assets of the with-profits fund valued at approximately £6.8 billion at the year end, valued on a realistic basis.
In the Wholesale market, Prudential UK’s aim is to continue to participate very selectively in bulk and back-book buyouts using its financial strength, superior investment track record and annuitant mortality risk assessment and servicing capabilities. In line with this approach, in the fourth quarter of 2010, Prudential UK signed a bulk annuity buy-in insurance agreement of £88 million APE.
Building capabilitiesIn September 2010, Prudential UK announced a five-year exclusive agreement with Santander to distribute its market-leading investment bonds in the UK. Prudential UK’s Flexible Investment Plan, including PruFund, will be available to Santander’s UK customers in 1,300 high street branches throughout the country.
This new agreement, which is expected to go live in the second half of 2011, forms part of Prudential UK’s continuing strategy to develop diversified and complementary distribution across its Direct, Intermediary and Partnership channels.
Prudential UK’s focus on delivering improved levels of customer service was recognised again at the 2010 Financial Adviser Service Awards, where it retained its 5-Star rating for excellent service in the Investment category.
Financial performanceRetail APE sales of £725 million were up one per cent on 2009, with the new business margin increasing from 31 per cent to 35 per cent. This performance was entirely consistent with Prudential UK’s strategy of not pursuing top-line sales growth but instead deploying capital to opportunities that play to the core strengths of the business and generate the best returns.
Total APE sales increased by 13 per cent to £820 million and included the bulk annuity buy-in insurance agreement. This transaction generated EEV new business profit of £104 million and IFRS operating profits of £63 million. Prudential UK will continue to maintain a very strict focus on value and only participate in capital-efficient transactions that meet its strict return on capital requirements. Including this transaction, Prudential UK’s new business margin increased from 32 per cent to 45 per cent.
BUSINESS REVIEW > INSURANCE OPERATIONS > UNITED KINGDOM > CONTINUED
UNITED KINGDOM
“ Demand for Prudential UK’s with-profits products remains resilient and the business has continued to innovate to maintain and enhance its position in the market.”

45B
US
INE
SS
RE
VIE
W
Higher sales and margins resulted in total EEV new business profits increasing by 59 per cent to £365 million. This improvement included the impact of the bulk annuity transaction, but also reflected improved retail margins, in particular on with-profits bonds. Retail EEV new business profits at £257 million were 15 per cent up on 2009 (£223 million).
IFRS total operating profits before restructuring costs were up nine per cent at £719 million, reflecting increased sales. Commission received on Prudential-branded General Insurance products contributed £46 million to IFRS operating profits in 2010, £5 million lower than 2009 as the book of business originally transferred to Churchill in 2004 is decreasing as expected.
EEV total operating profit of £982 million was up seven per cent mainly due to an increase in new business profits. In-force EEV operating profit included £37 million from renewal expense assumptions and £41 million from the change in the long-term tax rate assumption from 28 per cent to 27 per cent. These positive impacts were offset by a £40 million negative net impact from the strengthening of mortality improvement assumptions, partially offset by the release of excess margins previously held.
Prudential UK continues to manage actively the retention of the in-force book. During 2010, the experience at an aggregate level has been in line with long-term assumptions.
Prudential UK writes with-profits annuity, with-profits bond and with-profits corporate and individual pensions business in its Life Fund, with other products backed by shareholder capital. The weighted average post-tax IRR on the shareholder capital allocated to new business in the UK was in excess of 20 per cent. The average free surplus undiscounted payback period for shareholder backed business written in 2010 was four years.
As announced at the half-year, the business met its cost savings target of £195 million per annum, six months early. Prudential UK has commenced a number of cost saving initiatives to reduce costs by a further £75 million per annum on a consistent basis by the end of 2013. The business has already made good progress towards this objective in 2010.
During 2010 Prudential UK remitted cash of £420 million to the Group, comprising £202 million from the annual with-profits transfer to shareholders and £218 million from the shareholder backed business, which included £120 million from one-off releases of surplus and net financing repayments. The business expects to generate £350 million per annum sustainable cash remittances by 2013, supported by the strength of the with-profits business and surpluses arising from the large book of shareholder backed annuities, maintained into the future by the pipeline of maturing individual and corporate pensions.

46
Prudential plc Annual Report 2010
BUSINESS REVIEW > ASSET MANAGEMENT
OPTIMISINGASSET MANAGEMENT

BU
SIN
ES
S R
EV
IEW
47

48
Prudential plc Annual Report 2010
MICHAEL McLINTOCKCHIEF EXECUTIVEM&G
BUSINESS REVIEW > ASSET MANAGEMENT > M&G
M&G is the UK and European fund manager of the Prudential Group with responsibility for £198 billion of investments as at 31 December 2010 on behalf of both internal and external clients. M&G is an investment-led business whose aim is to generate superior long-term returns for its third-party investors and the internal funds of the Prudential Group.
This aim is achieved by creating an environment that is attractive to investment talent. The core focus on investment performance, combined with a well-diversified business mix and established distribution capabilities, has helped M&G achieve strong net sales performance, growth in funds under management and increased profitability.
In the retail market, M&G’s aim is to operate a single fund range and to diversify the distribution base by accessing a wide variety of channels and geographies. In recent years, key themes have included growing the proportion of business sourced from intermediated channels and the increased sales of UK-based funds in European and other international markets.
In the institutional marketplace, M&G’s approach centres on leveraging capabilities developed primarily for the Prudential internal funds to create higher margin external business opportunities. This has allowed M&G to offer third-party clients an innovative range of specialist fixed income strategies, including leveraged finance and infrastructure investment.
Sales performance2009 was an exceptional year for M&G in terms of net sales. The Retail business experienced unprecedented net purchases of its top-performing bond funds by investors seeking to exploit a near unique opportunity in fixed income markets. On the institutional side, M&G benefited in particular from winning a very substantial single institutional mandate. It was not expected that the business would be able to repeat these levels of net sales in 2010. In the event, the Retail business achieved full year net inflows of £7.4 billion, a decrease of only one per cent compared to the record level of £7.5 billion in 2009. On the institutional side, M&G still achieved very healthy net sales of £1.7 billion.
Gross fund inflows for the full year rose six per cent to £26.4 billion. This set a new record for the M&G business, surpassing the £24.9 billion achieved in 2009. Maintaining this strong sales performance over 2010, and in some highly volatile markets, demonstrates M&G’s strength in depth across all the main asset classes and distribution channels.
M&G’s Retail business in the UK has been number one for gross and net retail sales over nine consecutive quarters based on data to the end of December 20101. As already highlighted, it was sales of M&G’s top-performing fixed income funds that accounted for the lion’s share of net inflows in 2009 with 68 per cent of the net retail flows. During 2010, fixed income products continued to sell extremely well, accounting for 43 per cent of flows, but, with market sentiment turning more bullish, investor appetite for our equity and property funds increased. Net inflows into equity funds have increased in share from 26 per cent in 2009 to 48 per cent of total net retail sales in 2010. Over the same period, property funds’ share of total net sales trebled to nine per cent.
ASSET MANAGEMENTM&G
2011 PRIORITIES
• Maintain long-term investment performance for both internal and external funds
• Continue growth in third-party retail and institutional businesses
“ The Retail business achieved full year net inflows of £7.4 billion, a decrease of only one per cent compared to the record level of £7.5 billion in 2009.”

49B
US
INE
SS
RE
VIE
W
The improved diversification of sales by asset class was matched by an increased diversification of sales performance by region. In 2009, 19 per cent of net retail flows were from M&G’s distribution business outside of the UK, primarily based in Europe. This figure had increased to 39 per cent by the end of 2010.
The retail investment market in Europe is substantially larger than the UK market. In further response to this opportunity, M&G’s European Retail business registered its core OEIC fund range for distribution in the Netherlands and Sweden in the fourth quarter of 2010. Registration in both markets has already boosted sales results with M&G being able to leverage off existing client relationships established in other European markets. M&G already has a proven track record of success in distributing into Europe with its registration in France in 2007, for example, having already generated funds under management of £1.3 billion and achieved status as a top ten cross border player in the French market2. Total funds under management sourced outside of the UK amounted to £13.4 billion at the end of 2010, equivalent to 31 per cent of total retail external funds managed by M&G.
The consistency and excellence of its performance resulted in M&G being awarded the prestigious 2010 Global Group of the Year award at the 15th annual Investment Week Fund Manager of the Year Awards. This is the second time in three years that M&G has received this award.
In the institutional market, M&G also attracted healthy net new business on the back of outstanding investment performance with inflows of £1.7 billion. This compares with net inflows of almost £6.0 billion in 2009, although this latter figure was dominated by a single £4 billion fixed income mandate. Like M&G’s retail distribution, the institutional business also benefits from an increasingly diverse investor base with distribution activities covering Scandinavia and the Netherlands.
M&G’s institutional business was also recognised for its investment performance winning the 2010 UK Asset Management Firm of the Year award at Financial News’ Awards for Excellence in Institutional Asset Management.
M&G’s total funds under management at 31 December 2010 were at a record level of £198.3 billion, up 14 per cent on the 2009 year end. External funds under management at the end of 2010 of £89.3 billion were 27 per cent higher than the start of the year and now represent 45 per cent of M&G’s total funds under management.
£284mTotal IFRS operating profit
FUNDS UNDER MANAGEMENT
2009
£198bn£174bn
2010
+14%
£198bnFunds under management
M&G
AER CER
2010£m
2009£m
Change%
2009£m
Change%
Net investment flows 9,105 13,478 (32) 13,478 (32)Revenue 612 457 34 457 34Other income 3 13 (77) 13 (77)Staff costs (263) (205) (28) (205) (28)Other costs (123) (100) (23) (100) (23)
Underlying profit before performance-related fees 229 165 39 165 39Performance-related fees 17 12 42 12 42
Operating profit from asset management operations 246 177 39 177 39Operating profit from Prudential Capital 38 61 (38) 61 (38)
Total IFRS operating profit 284 238 19 238 19Funds under management 198bn 174bn 14 174bn 14
Notes
1 Source: Fundscape Pridham Report.2 Source: Lipper FMI Saleswatch.
GLOBAL GROUP OF THE YEAR
The consistency and excellence of its performance resulted in M&G being awarded the prestigious 2010 Global Group of the Year award at the 15th annual Investment Week Fund Manager of the Year Awards. This is the second time in three years that M&G has received this award.

50
Prudential plc Annual Report 2010
BUSINESS REVIEW > ASSET MANAGEMENT > M&G > CONTINUED
Financial performanceM&G’s IFRS operating profit rose to £246 million, an increase of 39 per cent compared with the 2009 result of £177 million.
The full year 2010 result was a record profit level for M&G, being eight per cent higher than the previous record achieved in 2008. If performance-related fees and carried interest on private equity investments are excluded, M&G’s operating profit would actually display underlying growth of 24 per cent over 2008. Equity market levels have boosted business results, with the FT All Share averaging three per cent higher over 2010 compared to 2008. It is also the exceptionally strong net inflows over 2009 and 2010, particularly from the Retail business that have contributed to the increased profit levels.
M&G remains focused on cost control with the cost/income ratio1 at 63 per cent over the full year, an improvement on the 2009 result of 65 per cent. A key aspect to cost management is to create a more flexible operational cost base, where appropriate, to enable the business to react to significant changes in its business profile. During 2010, M&G outsourced fund accounting, taxation and pricing operations for its UK regulated retail funds to an external supplier. The transition of these services has secured for M&G access to a scalable global platform to support both the current and future needs of its funds. Outsourcing this element of its operational platform to a dedicated provider of these services also ensures that M&G can focus on the continued delivery of strong investment performance and winning new business.
M&G continues to provide capital efficient profits and cash generation for the Prudential Group, as well as strong investment returns on the internally managed funds. Cash remittances of £150 million in 2010 provided strong support for the Group’s corporate objectives.
PRUDENTIAL CAPITAL
Prudential Capital (PruCap) manages Prudential Group’s balance sheet for profit by leveraging Prudential Group’s market position. This business has three strategic objectives: to provide professional treasury services to the Prudential Group; to operate a first-class wholesale and capital markets interface; and to realise profitable proprietary opportunities within a tightly controlled risk framework. PruCap generates revenue by providing bridging finance, managing investments and operating a securities lending and cash management business for the Prudential Group and its clients.
The business has consolidated its position in a period of difficult and volatile markets, focusing on liquidity across the Prudential Group, management of existing asset portfolio and conservative levels of new investment. Development of new product and infrastructure has continued, helping to maintain the dynamism and flexibility necessary to identify and realise opportunities for profit within acceptable risk parameters. PruCap is committed to continuing to work closely with other business units across the Prudential Group to exploit opportunities and increase value creation for Prudential as a whole. In particular, PruCap offers to the Prudential Group a holistic view on hedging strategy, liquidity and capital management.
PruCap has a diversified earnings base derived from its portfolio of secured loans, debt investments and the provision of wholesale markets services. As a result of lower net operating revenue and prevailing market conditions, IFRS operating profits decreased by 38 per cent to £38 million, however PruCap still delivered a cash remittance to the Group holding company of £52 million.
ASSET MANAGEMENTM&G
Note
1 Excluding performance related fees and carried interest on private equity investments.
UK ASSET MANAGEMENT FIRM OF THE YEAR
M&G’s institutional business was also recognised for its investment performance winning the 2010 UK Asset Management Firm of the Year award at Financial News’ Awards for Excellence in Institutional Asset Management.

51B
US
INE
SS
RE
VIE
W
ASIA ASSET MANAGEMENT
AER CER
2010£m
2009£m
Change%
2009£m
Change%
Retail and institutional business net inflows 1,838 556 231 569 223Money Market Funds net (outflows)/ inflows (MMF) (2,053) 1,443 (242) 1,550 (232)Funds under management 51.9bn 42.4bn 22 47.2bn 10Total IFRS operating profit 72 55 31 58 24
Prudential’s asset management business in Asia manages investments for UKIO and the Asian life companies and has also successfully leveraged these investment capabilities to build a strategically significant and market leading third party funds management business.
Business overviewUnder the leadership of a new Chief Executive, the team has driven strong improvements in the business.
Investment performance is a key driver of success and for 2010, 68 per cent of our funds outperformed their peer medians or benchmarks1. Accolades received during the year included the PCA Indonesia Equity Open Fund being recognised as ‘Fund of the Year 2010’ in Japan by Morningstar amongst 557 open-ended funds in the domestic market, as well as the PCA China Dragon A-share Equity Fund being named ‘Best fund in overseas equity category’ in Korea’s 2010 MoneyToday – Morningstar Fund Awards. In India and China, funds offered by our joint venture businesses were ranked top-decile by their respective local rating agencies.
The business has been actively implementing its strategy of targeting higher-margin equity and bond asset classes. Third party net inflows of £1.8 billion were driven predominantly by Japan, which saw strong interest for its white-labelled Asia Oceanic High Dividend Equity and its open-ended Indonesian Equity Open funds. In addition, positive bond fund flows resulted from Taiwan and China’s successful new product launches and strong demand for our offshore product range. Money market funds saw net outflows totalling £2.1 billion in 2010, mainly attributed to redemptions in India as a result of tighter liquidity conditions.
Financial performancePrudential’s Asian asset management business’ total FUM crossed the £50 billion mark for the first time and closed the year at £52 billion which includes a core £25 billion from Prudential Corporation Asia’s life funds, £5 billion of assets from the Group and £22 billion from third-party customers. Compared to 2009, the overall FUM increased by 22 per cent, driven by net inflows of £1.8 billion and a total of £7.7 billion of positive market and currency related movements.
IFRS operating profit from fund management of £72 million is 31 per cent higher than in the prior year. The Funds business remitted a net £33 million of surplus capital to the Group during 2010.
ASSET MANAGEMENTASIA
Note
1 Based on a blend of 1-year and 3-year performance.
FUNDS UNDER MANAGEMENT
2009
£42.4bn
£51.9bn
2010
+22%
£72mTotal IFRS operating profit
BUSINESS REVIEW > ASSET MANAGEMENT > ASIA

52
Prudential plc Annual Report 2010
PPM AMERICA
AER CER
2010£m
2009£m
Change%
2009£m
Change%
Total IFRS operating profit 10 6 67 5 100
Business overviewPPM America (PPMA) manages assets for Prudential’s US, UK and Asian affiliates. PPMA also provides other affiliated and unaffiliated institutional clients with investment services including collateralised debt obligations (CDOs), private equity funds, institutional accounts, and mutual funds. PPMA’s strategy is focused on managing existing assets effectively, maximising the benefits derived from synergies with our international asset management affiliates, and leveraging investment management capabilities across the Prudential Group. PPMA also pursues third-party mandates on an opportunistic basis.
Financial performanceIFRS operating profit in 2010 was £10 million, compared to £6 million in 2009.
At 31 December 2010, funds under management of £54 billion were as follows:
AER
2010 2009
US£bn
UK£bn
Asia£bn
Total£bn
US£bn
UK£bn
Asia£bn
Total£bn
Insurance 31 15 – 46 29 12 – 41Unitised 1 1 5 7 – 1 4 5CDOs 1 – – 1 1 – – 1Total funds under management 33 16 5 54 30 13 4 47
CURIAN
AER CER
2010£m
2009£m
Change%
2009£m
Change%
Gross investment flows 1,361 796 71 806 69Revenue 39 25 56 26 50Costs (38) (31) 23 (32) 19Total IFRS operating profit/(loss) 1 (6) 117 (6) 117Total funds under management 3,457 2,260 53 2,331 48
Business overviewCurian Capital, Jackson’s registered investment advisor, provides innovative fee-based managed accounts and investment products to advisers through a sophisticated technology platform. Curian expands Jackson’s access to advisers while also complementing Jackson’s core annuity product lines with Curian’s retail asset management products.
BUSINESS REVIEW > ASSET MANAGEMENT > UNITED STATES
ASSET MANAGEMENTUNITED STATES

53B
US
INE
SS
RE
VIE
W
Financial performanceAt 31 December 2010, Curian had total assets under management of £3.5 billion, compared to £2.3 billion at the end of 2009. Curian generated deposits of £1,361 million in 2010, up 71 per cent over 2009. The increase in both deposits and assets under management was mainly due to an expansion of Curian’s investment platform with the addition of two new investment strategies, plus an expansion of the firm’s wholesaling team, in addition to a rebound from the difficult conditions in the equity markets in early 2009.
Curian’s assets under management surpassed the break-even point during the year, resulting in the firm reporting its first full-year IFRS basis operating profit in 2010, with a net profit of £1 million versus a loss of £6 million during 2009.
US BROKER DEALER
NATIONAL PLANNING HOLDINGS, INC. AER CER
2010£m
2009£m
Change%
2009£m
Change%
Revenue 449 390 15 395 14Costs (438) (386) 13 (391) 12Total IFRS operating profit 11 4 175 4 175
Business overviewNational Planning Holdings, Inc. (NPH) is Jackson’s affiliated independent broker-dealer network. The business is comprised of four broker-dealer firms, including INVEST Financial Corporation, Investment Centers of America, National Planning Corporation, and SII Investments.
NPH continues to grow the business and revenue per representative. By utilising high-quality, state-of-the-art technology, we provide NPH’s advisers with the tools they need to operate their practices more efficiently. At the same time, through its relationship with NPH, Jackson continues to benefit from an important retail distribution outlet, as well as receive valuable insights into the needs of financial advisers and their clients.
Financial performanceNPH generated revenues of £449 million in 2010, up from £390 million in 2009, on gross product sales of £9.3 billion. The network continues to achieve profitable results, with 2010 IFRS operating profit of £11 million, a 175 per cent increase from £4 million in 2009. At 31 December 2010, the NPH network had 3,461 registered advisers, down slightly from 3,478 at year-end 2009.

54
Prudential plc Annual Report 2010
BUSINESS REVIEW > FINANCIAL REVIEW
FINANCIAL REVIEW
BUSINESS REVIEW > FINANCIAL REVIEW
RESULTS SUMMARY
International Financial Reporting Standards (IFRS) basis results* Statutory IFRS basis results
2010 2009
Profit after tax attributable to equity holders of the Company £1,431m £676mBasic earnings per share 56.7p 27.0pShareholders’ equity, excluding non-controlling interests £8.0bn £6.3bn
Supplementary IFRS basis information 2010 £m 2009 £m
note i
Asian operations 604 465 US operations 855 622 UK operations: UK insurance operations 719 657 M&G 284 238 Other income and expenditure (450) (395) Restructuring and Solvency II implementation costs (71) (23)
OPERATING PROFIT BASED ON LONGER-TERM INVESTMENT RETURNS* note i 1,941 1,564
Short-term fluctuations in investment returns on shareholder-backed business (123) (123) Shareholders’ share of actuarial and other gains and losses on defined benefit pension schemes (10) (74) Costs of terminated AIA transaction (377) – Gain on dilution of holding in PruHealth 30 – Loss on sale and results of Taiwan agency business – (621)
Profit from continuing operations before tax attributable to shareholders 1,461 746
Operating earnings per share*note ii 62.0p 47.5p
European Embedded Value (EEV) basis results*
2010 £m 2009 £m
Asian operations 1,518 1,154 US operations 1,480 1,237 UK operations: UK insurance operations 982 921 M&G 284 238 Other income and expenditure (494) (433) Restructuring and Solvency II implementation costs (74) (27)
OPERATING PROFIT BASED ON LONGER-TERM INVESTMENT RETURNS* 3,696 3,090 Short-term fluctuations in investment returns (30) 351 Mark to market value movements on core borrowings (164) (795) Shareholders’ share of actuarial and other gains and losses on defined benefit pension schemes (11) (84) Effect of changes in economic assumptions (10) (910) Costs of terminated AIA transaction (377) – Gain on dilution of holding in PruHealth 3 – Profit on sale and results of Taiwan agency business – 91
PROFIT FROM CONTINUING OPERATIONS BEFORE TAX (INCLUDING ACTUAL INVESTMENT RETURNS) 3,107 1,743
Operating earnings per share*note ii 106.9p 88.8p
Shareholders’ equity, excluding non-controlling interests 18.2bn 15.3bn

55B
US
INE
SS
RE
VIE
W
2010 2009
DIVIDENDS PER SHARE DECLARED AND PAID IN REPORTING PERIOD 20.17p 19.20pDIVIDENDS PER SHARE RELATING TO REPORTING PERIOD 23.85p 19.85pFUNDS UNDER MANAGEMENT £340bn £290bnINSURANCE GROUPS DIRECTIVE CAPITAL SURPLUS (AS ADJUSTED)* £4.3bn £3.4bn
Notesi The Company has amended the presentation of IFRS operating profit for its US insurance operations to remove the net equity hedge
accounting effect (incorporating related amortisation of deferred acquisition costs) and include it in the supplementary analysis of profit in short-term fluctuations in investment returns. The 2009 amounts have been amended accordingly. As explained below and in Note C to the IFRS financial statements.
ii Operating earnings per share reflects operating profit based on longer-term investment returns after related tax and non-controlling interests but excludes in 2010 an exceptional tax credit of £158 million which primarily relates to the impact of a settlement agreed with the UK tax authorities.
* Basis of preparationResults basesWith the exception of the adoption of IFRS 3 (Revised) on business combinations and associated amendments to other standards and the altered basis of presentation for Jackson’s IFRS operating profit referred to below, the basis of preparation of the statutory IFRS basis results and supplementary IFRS basis information is consistent with that applied for the 2009 results and financial statements. The EEV basis results have been prepared in accordance with the European Embedded Value Principles issued by the CFO Forum of European Insurance Companies in May 2004. Life insurance products are, by their nature, long-term and the profit on this business is generated over a significant number of years. Accounting under IFRS alone does not, in Prudential’s opinion, fully reflect the value of future profit streams. Prudential considers that embedded value reporting provides investors with a measure of the future profit streams of the Group’s in-force long-term businesses and is a valuable supplement to statutory accounts. With the exception of the presentation of the new business results of the Japan life operation which ceased writing new business in February 2010, there has been no change to the basis of presentation of the EEV results from the 2009 results and financial statements.
Exchange translation – Actual Exchange Rate (AER) and Constant Exchange Rate (CER)The comparative results have been prepared using previously reported exchange rates (AER basis) except where otherwise stated.
Operating profit based on longer-term investment returnsConsistent with previous reporting practice, the Group provides supplementary analysis of IFRS profit before tax attributable to shareholders and analyses its EEV basis results, so as to distinguish operating profit based on longer-term investment returns from other elements of total profit. On both the IFRS and
EEV bases, operating earnings per share are calculated using operating profits based on longer-term investment returns, after related tax and non-controlling interests. These profits exclude short-term fluctuations in investment returns and the shareholders’ share of actuarial and other gains and losses on defined benefit pension schemes. The operating profit based on longer-term investment returns for 2010 also excludes the costs associated with the terminated AIA transaction and the gain arising upon the dilution of the Group’s holding in PruHealth. Consistent with the prior year presentation, the effect of disposal and the results of the Taiwan agency business are shown separate from operating profit based on longer-term investment returns for 2009. In 2010 the Company amended its presentation of IFRS operating profit for its US insurance operations to exclude the net equity hedge accounting effect of negative £367 million (2009: negative £159 million) relating principally to its variable annuity business and reclassified it as a short-term fluctuation. Prior year comparatives have been amended accordingly. This is a presentational change and it has no impact on the IFRS profit before tax or the IFRS shareholders’ funds. The change also has no impact on our EEV financial statements. Under the EEV basis, where additional profit and loss effects arise, operating profit based on longer-term investment returns also excludes the mark to market value movements on core borrowings and the effect of changes in economic assumptions. After adjusting for related tax and non-controlling interests, the amounts excluded from operating profit based on longer-term investment returns are included in the calculation of basic earnings per share.
Insurance Groups Directive capital surplus (as adjusted) The surpluses shown for 2010, which is estimated, and 2009 are before allowing for the final dividends for 2010 and 2009 respectively.

56
Prudential plc Annual Report 2010
BUSINESS REVIEW > FINANCIAL REVIEW > CONTINUED
FINANCIAL REVIEW
IFRS basis operating profit based on longer-term investment returns
AER CER
2010 £m 2009 £m Change % 2009 £m Change %
Insurance business Long-term business: Asia 536 416 29 451 19 USnote i 833 618 35 626 33 UK 673 606 11 606 11 Development expenses (4) (6) 33 (6) 33
LONG-TERM BUSINESS OPERATING PROFIT 2,038 1,634 25 1,677 22
UK general insurance commission 46 51 (10) 51 (10)Asset management business: M&G 284 238 19 238 19 Asia asset management 72 55 31 58 24 Curian 1 (6) 117 (6) 117 US broker-dealer and asset management 21 10 110 10 110
2,462 1,982 24 2,028 21
Other income and expenditure (450) (395) 14 (396) 14 Solvency II implementation costs (45) – 100 – 100 Restructuring costs (26) (23) 13 (23) 13
TOTAL IFRS BASIS OPERATING PROFIT BASED ON LONGER-TERM INVESTMENT RETURNSnote i 1,941 1,564 24 1,609 21
Notei The Company has amended the presentation of IFRS operating profit for its US insurance operations to remove the net equity hedge
accounting effect (incorporating related amortisation of deferred acquisition costs) and include it in the supplementary analysis of profit in short-term fluctuations in investment returns. 2009 amounts have been amended accordingly.
Group IFRS operating profit before tax based on longer-term investment returns after Solvency II implementation and restructuring costs was £1,941 million, an increase of 24 per cent on 2009.
In Asia, IFRS operating profit for long-term business increased by 29 per cent from £416 million in 2009 to £536 million in 2010, with the £416 million in 2009 being inclusive of a £63 million one-off credit relating to changes to the Malaysia reserving basis. Profits from in-force business grew by 20 per cent from £494 million in 2009 to £593 million in 2010, reflecting the continued build-up of the business in the region and the positive impact of currency fluctuations. New business strain of £56 million1 (2009: £72 million) was 3.7 per cent of APE new business sales, a significant improvement compared to last year (2009: 6.0 per cent1) demonstrating management’s continued focus on capital efficient growth.
There was a continued strong performance across the Asian region. Hong Kong, Singapore, Malaysia and Indonesia accounted for 81 per cent or £434 million of operating profits (2009: £390 million, including the impact of the one-off credit recorded in Malaysia). Strong underlying improvements were reported in Indonesia with operating profits higher by 54 per cent to £157 million, reflecting both the success of our product offering and the growing maturity of this business. Malaysia operating profits, excluding the one-off credit in 2009, were also higher by 49 per cent to £97 million, reflecting the growing size of our book of business and the strong earnings profile of our health and protection business. The contribution to IFRS profits from the other Asian businesses is also improving. The closure of Japan to new business has substantially reduced the IFRS losses of this business and Taiwan saw an improvement in the year as it refocused on bancassurance business. Korea benefited from improved in-force profits in the period and
Note
1 Excluding Japan which ceased writing new business in 2010. IFRS new business strain including Japan was £57 million (2009: £78 million).
IFRS RESULTS

57B
US
INE
SS
RE
VIE
W
Vietnam was up 43 per cent to £43 million. Changes to reserving bases in India and China contributed a £19 million one-off profit, with both countries showing improvement in their underlying results excluding this change.
The US long-term business operating profit increased by 35 per cent from £618 million in 2009 to £833 million in 2010, reflecting strong growth in spread and fee income, up £195 million and £182 million respectively, as Jackson’s policyholder liability balances grew. Jackson undertook various transactions in 2010 to more closely match the overall asset and liability duration. This contributed £108 million to operating profit in the period. These positive contributions to profits have been partially offset by increased costs and DAC amortisation primarily reflecting Jackson’s growth.
Jackson’s operating profit net of related DAC amortisation excludes the net equity hedge accounting effect of negative £367 million (2009: negative effect of £159 million) following a change in the presentation of operating profit based on longer-term investment returns. Jackson’s hedging approach has always focused on optimising the economic outcome ahead of accounting results, which means we accept an element of variability in accounting outcomes in order to ensure we achieve the right economic result. We believe this presentational change, which reclassifies net equity hedge accounting effects as short-term fluctuations in investment returns, will ensure that Jackson’s operating results better reflect its unchanged and continued focus on optimising economic value.
Accounting volatility previously arose within the reported IFRS operating profit due to the difference between the movement in the fair value of free standing derivatives within Jackson’s equity hedging programme for annuity business and the movement in the accounting value of Jackson’s liabilities for variable and fixed index annuity guarantees. Typically, under IFRS, reserves are not fair valued, which for the US variable annuities business produces a distorting accounting effect on the IFRS operating profit that is not representative of the true economics of Jackson’s hedging programme. Jackson’s economically based hedges are marked-to-market. As a result, when the marked-to-market value of the hedges changes, there are offsetting changes in the economic value of the hedged liabilities which are not reflected in our accounts. This is particularly relevant for the Guaranteed Minimum Death Benefit (GMDB) and the
Guaranteed Minimum Withdrawal Benefit (GMWB) with ‘for-life’ features. This mismatch creates additional short-term volatility in our profit which does not reflect changes in the underlying economic position.
Over the long-term the impact of this accounting distortion should cumulatively net out to a broadly neutral effect, but in the short-term the impact to the IFRS total profit can be highly volatile. The recent growth in Jackson’s variable annuity business has resulted in this short-term effect having a greater impact on our IFRS operating profit than in prior years. In the 2010 half year financial statements this accounting mismatch produced a positive contribution to the IFRS operating profit of £123 million for the first six months as compared to a negative contribution of £367 million for the full year.
In our UK business, total IFRS operating profit grew by nine per cent to £719 million in 2010, reflecting higher retail profits and the bulk annuity transaction agreed in the last quarter of 2010. Profit from UK general insurance commission decreased by £5 million to £46 million in 2010 in line with the decline in the in-force policy numbers as the business matures.
M&G’s operating profit for 2010 was £284 million, an increase of 19 per cent from £238 million in 2009, primarily reflecting the continuation of exceptionally strong net inflows, including increased sales of higher margin equity products and higher equity market levels. In 2010 M&G had net inflows of £9.1 billion, the second highest annual level of flows after 2009.
The Asian asset management operations reported operating profits of £72 million, up by 31 per cent from £55 million in 2009, driven by increased operating revenues as a result of higher funds under management (FUM). Strong net inflows for retail and institutional business of £1.8 billion together with positive market and currency movements have contributed to a 22 per cent increase in FUM (including internal funds) to £52 billion at the end of 2010.
The £55 million increase in the charge for other income and expenditure to £450 million primarily reflects an increase in interest payable on core structural borrowings.
We incurred £45 million of Solvency II implementation costs in 2010.

58
Prudential plc Annual Report 2010
BUSINESS REVIEW > FINANCIAL REVIEW > CONTINUED
FINANCIAL REVIEW
Spread income has increased by £260 million to £1,013 million, an increase of 35 per cent. This is higher than the six per cent increase in average liabilities, leading to an increase in margin, from 148 bps in 2009 to 188 bps in 2010. The increase in spread income arises primarily in the US, where investment spread has increased by £168 million. This reflects transactions in the period to more closely match the overall asset and liability duration in 2010, with an overall impact of £108 million, as well as decreased crediting rates on fixed annuities.
Fee income has increased by £230 million to £688 million. This principally reflects improved equity market performance and net cash inflows into unit-linked liabilities of £6.7 billion during 2010, equivalent to an increase on opening liabilities of 13 per cent. The increase in fee margin from 106 bps to 120 bps reflects a richer mix of the higher fee variable annuity business.
Insurance margin has increased £144 million to £592 million in 2010. This increase is driven by growth in the in-force book in Asia which has a relatively high proportion of risk-based products.
Margin on revenues principally comprises amounts deducted from premiums to cover acquisition costs and administration expenses and has increased by 19 per cent from £1,041 million in 2009 to £1,241 million in 2010. This is driven by the growth of the business in Asia.
Acquisition costs have increased in absolute terms by £187 million to £1,674 million in 2010, but as percentage of APE new business sales they have fallen from 51 per cent in 2009 to 48 per cent in 2010. This is primarily due to Asia’s continuing improvements to new business strain, and in the US a move away from up front commission to on-going asset based commission, which is treated as an administration expense.
Administration expenses have increased by £110 million to £924 million in 2010 reflecting the growth of the business in the year. Overall the margin in 2010 is 83 bps, lower than the prior year margin of 86 bps.The improvement in this margin reflects operational leverage benefits in Asia and UK cost savings which have more than offset the effect of the move towards asset based commission in the US as described above.
DAC adjustments represents the level of costs deferred in the year offset by amortisation in the period. The year-on-year movement reflects changes in business mix and, in part, the acceleration of DAC amortisation in US.
IFRS basis results – Analysis of long-term insurance business pre-tax IFRS operating profit based on longer-term investment returns by driver
AER CER
2010 2009 i 2009 i
Operating profit
£m
Averageliability
£mMargin ii
bps
Operatingprofit
£m
Averageliability
£mMargin ii
bps
Operatingprofit
£m
Averageliability
£mMargin ii
bps
Spread income 1,013 53,858 188 753 51,000 148 762 49,735 153 Fee income 688 57,496 120 458 43,373 106 469 43,153 109 With-profits 342 89,693 38 310 84,063 37 311 83,964 37 Insurance margin 592 448 466 Margin on revenues 1,241 1,041 1,112 Expenses Acquisition costs iii (1,674) 3,492 (48)% (1,487) 2,896 (51)% (1,547) 2,947 (52)% Administration expenses (924) 111,354 (83) (814) 94,373 (86) (844) 92,888 (91) DAC adjustments 518 614 628 Expected return on
shareholder assets 242 248 250 Non-recurrent release of
reserve for Malaysia Life – 63 70
Operating profit 2,038 1,634 1,677
Notesi The Company has amended the presentation of IFRS operating profit for its US insurance operations to remove the net equity hedge
accounting effect (incorporating related amortisation of deferred acquisition costs) and include it in short-term fluctuations. 2009 amounts have been amended accordingly.
ii Margin represents the operating return earned in the period as a proportion of the relevant class of policyholder liabilities excluding unallocated surplus. Opening and closing policyholder liabilities have been used to derive an average balance for the period.
iii Acquisition cost ratio represents shareholder acquisition costs as a percentage of total APE, including Japan APE new business sales of £7 million (2009: £52 million).

59B
US
INE
SS
RE
VIE
W
M&G increased its asset management fee margin during the year from 31 bps in 2009 to 34 bps in 2010. This reflects increased sales of higher margin equity funds in the year.
Asia maintained its margin at 40 bps from 2009 to 2010. This is driven by an improvement in the retail margin following positive inflows into higher margin equity and bond funds, offset by a decline in institutional margin caused by net outflows of money market funds.
PruCap’s operating profit fell during 2010, reflecting market conditions and higher funding costs.
The increase in US asset management operating income principally arises in PPMA, reflecting increased performance fees and higher management fees.
IFRS basis results – Analysis of asset management pre-tax IFRS operating profit based on longer-term investment returns
2010 £m
M&G Asia PruCap US Total
Operating income* 632 191 88 229 1,140Operating profit based on longer-term investment returns 246 72 38 22 378
Average funds under management (FUM)† £186.5bn £47.2bn Margin based on operating income† 34 bps 40 bps Cost/income ratio‡ 63% 64%
2009 £m
M&G Asia PruCap US Total
Operating income* 482 160 89 183 914 Operating profit based on longer-term investment returns 177 55 61 4 297
Average funds under management (FUM)† £157.5bn £39.6bn Margin based on operating income† 31 bps 40 bps Cost/income ratio‡ 65% 67%
* Operating income is net of commissions and includes performance related fees.† Margin represents operating income as a proportion of the related funds under management (FUM). Opening and closing FUM have been used to
derive the average. ‡ Cost/income ratio is calculated as cost as a percentage of income excluding performance-related fees.

60
Prudential plc Annual Report 2010
BUSINESS REVIEW > FINANCIAL REVIEW > CONTINUED
FINANCIAL REVIEW
IFRS basis profit after tax The total profit before tax from continuing operations attributable to shareholders was £1,461 million in 2010, compared with £746 million in 2009. The improvement reflects the increase in operating profit based on longer-term investment returns and the impact of one-off items. The profit in 2010 was reduced by the terminated AIA transaction costs of £377 million, whereas 2009 was adversely impacted by the £621 million loss recorded as part of the disposal of the Taiwan Agency business and IGD hedge costs of £235 million.
In calculating the IFRS operating profit, we use longer-term investment return assumptions rather than actual investment returns arising in the year. The difference between actual investment returns recorded in the income statement and longer-term returns is shown in the analysis of profits as short-term fluctuations in investment returns.
IFRS short-term fluctuations in investment returnsShort-term fluctuations in investment returns for our insurance operations of negative £148 million comprise positive £114 million for Asia, negative £378 million for US operations and positive £116 million in the UK.
The positive short-term fluctuations of £114 million for our Asian operations primarily reflect unrealised gains on the shareholder debt portfolio, as well as a £30 million unrealised gain on the Group’s 8.66 per cent stake in China Life Insurance Company of Taiwan.
The negative short-term fluctuations of £378 million for our US operations principally arise on derivative and embedded derivative value movements. They include the negative net equity hedge accounting effect (net of related DAC amortisation) of £367 million (2009: negative £159 million). The strong rise in the S&P Index in the last quarter of 2010 resulted in fair value reductions in the free-standing derivatives backing the guarantees embedded in Jackson’s variable and fixed index annuity products. As a substantial proportion of these guarantees are not fair valued for accounting purposes, there is no accounting offset to these losses. Other US short-term fluctuations were negative £11 million.
IFRS basis profit after tax
AER
2010 £m 2009 £m
OPERATING PROFIT BASED ON LONGER-TERM INVESTMENT RETURNS 1,941 1,564 Short-term fluctuations in investment returns:note i Insurance operations (148) 7 IGD hedge costs – (235) Other operations 25 105 (123) (123)Shareholders’ share of actuarial and other gains and losses on defined benefit pension schemes (10) (74)Costs of terminated AIA transaction (377) – Gain on dilution of holding in PruHealth 30 – Loss on sale and results of Taiwan agency business – (621)
PROFIT BEFORE TAX FROM CONTINUING OPERATIONS ATTRIBUTABLE TO SHAREHOLDERS 1,461 746
Tax charge attributable to shareholders’ profit note ii (25) (55)Discontinued operations (net of tax) – (14)Non-controlling interests (5) (1)
PROFIT FOR THE YEAR ATTRIBUTABLE TO EQUITY HOLDERS OF THE COMPANY 1,431 676
Notesi The Company has amended the presentation of IFRS operating profit for its US insurance operations to remove the net equity hedge
accounting effect (incorporating related amortisation of deferred acquisition costs) and include it in short-term fluctuations. 2009 amounts have been amended accordingly.
ii Tax charge attributable to shareholders’ profit includes a credit of £158 million which primarily relates to the impact of a settlement agreed with the UK tax authorities.

61B
US
INE
SS
RE
VIE
W
The positive short-term fluctuations of £116 million for our UK operations reflect principally value movements on fixed income assets backing the capital of the shareholder-backed annuity business, brought about by the falls in yields during 2010.
Short-term fluctuations for other operations were positive £25 million and mainly represent unrealised appreciation on Prudential Capital’s debt securities portfolio offset by unrealised value movements on centrally held derivatives. The 2009 result included £235 million costs incurred in respect of the hedge temporarily put in place during the first quarter to protect the IGD capital position in exceptional market conditions.
Shareholders’ share of actuarial and other gains and losses on defined benefit pension schemesThe shareholders’ share of actuarial and other gains and losses on defined benefit pension schemes of negative £10 million reflects the impact of assumption changes, being primarily a lower discount rate applied to the liabilities of the Scottish Amicable and M&G schemes, partially offset by actual asset returns being higher than the long-term rate assumed.
Costs of terminated AIA transactionDuring the period the Group incurred pre-tax costs in relation to the AIA transaction of £377 million. This comprises the termination break fee of £153 million, the costs associated with foreign exchange hedging of £100 million, underwriting fees of £58 million and adviser and other fees totalling £66 million. After expected tax relief, the post-tax cost is £284 million.
Gain on dilution of holding in PruHealth On 1 August 2010, Discovery Holdings of South Africa, the Group’s joint venture partner in its investment in PruHealth, completed the acquisition of the entire share capital of Standard Life Healthcare, a wholly-owned subsidiary of the Standard Life Group, for £138 million. Discovery funded the purchase of the Standard Life Healthcare transaction, and contributed Standard Life Healthcare to PruHealth as a capital investment on completion. As a result of the transaction, Discovery have increased their shareholding in PruHealth from the previous level of 50 per cent to 75 per cent, and Prudential’s shareholding reduced from 50 per cent of the previous joint venture structure to 25 per cent of the new structure of the much enlarged business.
As a result of this dilution in holding and the consequential loss of control, PruHealth has been reclassified from a joint venture to an associate and the entity is no longer proportionally consolidated from the date of the transaction. In accordance with IAS 31 ‘Interests in joint ventures’ a gain of £30 million arises upon the dilution, representing the difference between the fair value of the enlarged 25 per cent investment still held and the IFRS book value of the original 50 per cent investment holding.
Effective tax ratesThe effective rate of tax on operating profits, based on longer-term investment returns, was 11 per cent (2009: 24 per cent). Adjusting the reported tax rate to exclude the exceptional tax credit of £158 million which primarily relates to the impact of a settlement agreed with the UK tax authorities, the underlying tax rate on 2010 operating profits was 19 per cent. This is lower than 2009 primarily due to 2010 benefiting from revisions to prior period tax returns in the UK and an increase in the proportion of income in Asia which attracts lower tax. The effective rate of tax at the total IFRS profit level for continuing operations was two per cent (2009: seven per cent). Adjusting the rate in 2010 to exclude the exceptional tax credit of £158 million gives an underlying tax rate at the total IFRS profit level for 2010 of 13 per cent. In both 2009 and 2010, we have benefited from utilising carried forward tax losses for which no deferred tax asset had been previously recognised.

62
Prudential plc Annual Report 2010
BUSINESS REVIEW > FINANCIAL REVIEW > CONTINUED
FINANCIAL REVIEW
EEV basis operating profit based on longer-term investment returns
AER CER
2010 £m 2009 £m Change % 2009 £m Change %
Insurance business: Asia 1,450 1,105 31 1,190 22 US 1,458 1,233 18 1,249 17 UK 936 870 8 870 8 Development expenses (4) (6) 33 (6) 33
LONG-TERM BUSINESS PROFIT 3,840 3,202 20 3,303 16
UK general insurance commission 46 51 (10) 51 (10) Asset management business: M&G 284 238 19 238 19 Asia asset management 72 55 31 58 24 Curian 1 (6) 117 (6) 117 US broker-dealer and asset management 21 10 110 10 110
4,264 3,550 20 3,654 17
Other income and expenditure (494) (433) 14 (434) 14 Solvency II implementation costs (46) – 100 – 100 Restructuring costs (28) (27) 4 (27) 4
TOTAL EEV BASIS OPERATING PROFIT 3,696 3,090 20 3,193 16
In 2010, Prudential Group’s total EEV basis operating profit based on longer-term investment returns was £3,696 million, an increase of 20 per cent from the same period in 2009.
Long-term business profits generated by the Group increased by 20 per cent to £3,840 million. These profits comprise:
• New business profits1 of £2,028 million (2009: £1,619 million); • In-force profits of £1,817 million (2009: £1,601 million); and• Negative £5 million of other items including development
expenses (2009: negative £18 million).
New business profits1 at £2,028 million, were 25 per cent higher than last year, reflecting both a 23 per cent increase in sales volumes as compared to 2009. This represents a one percentage point increase in the average Group new business APE profit margin from 57 per cent in 2009 to 58 per cent in 2010.
Strong new business APE profit margins were recorded across the Group. The margin for the Asian business was maintained at 60 per cent and the UK new business margin increased by 13 percentage points to 45 per cent, benefiting both from the bulk annuity buy-in agreement written in December and higher underlying margins on retail business. The US maintained much of the high margins achieved in 2009, with margins falling by eight percentage points to 65 per cent, due primarily to anticipated reductions in spread margins on fixed and fixed index annuities and the impact of lower assumed equity return assumptions on variable annuities.
The contribution to operating profit from in-force business increased by £216 million to £1,817 million. This includes a £71 million increase in the unwind discount and other expected returns from £1,421 million in 2009 to £1,492 million in 2010,
principally reflecting the growing maturity of the Asian in-force book. In-force profit in 2010 also includes the effect of operating assumption changes, experience variances and other items which had an aggregate positive impact of £325 million (2009: positive impact of £180 million). Of this amount, £328 million arises in the US, primarily reflecting positive mortality, persistency, expense and spread experience variances. The most significant of these relates to spread experience, contributing £158 million in 2010, arising principally from transactions undertaken in the year to more closely match the overall asset and liability duration, the effect of which is expected to persist in 2011, but at a reduced level.
Overall the impact of operating assumption changes, experience variances and other items on Asia was negative £24 million, with adverse expense and persistency changes being offset by positive mortality and morbidity amounts.
In the UK operating assumption changes, experience variances and other items had an overall impact of positive £21 million, which is not significant in the context of the size of this business.
Operating profit from the asset management business and other non-long term businesses increased to £424 million, up 22 per cent from £348 million in 2009.
Other income and expenditure totalled a net expense of £494 million compared with £433 million in 2009. The £61 million increase principally reflects the higher interest payable on core structural borrowings.
EEV RESULTS
Note
1 Excludes Japan which ceased writing new business in 2010.

63B
US
INE
SS
RE
VIE
W
EEV basis profit after tax and non-controlling interestsShort-term fluctuations in investment returnsEEV operating profit is based on longer-term investment return assumptions rather than actual investment returns achieved. Short-term fluctuations represent the difference between the actual investment return and those assumed in arriving at the reported operating profit.
Short-term fluctuations in investment returns for insurance operations of negative £55 million comprise a positive £287 million for Asia, negative £678 million for our US operations and positive £336 million in the UK.
For our Asian business, short-term fluctuations of positive £287 million (2009: positive £437 million) primarily reflected the improvement in equity markets in 2010 and unrealised gains on the bond portfolio.
For our US business, short-term fluctuations in investment returns were negative £678 million (2009: negative £401 million), principally reflecting a reduction in expected yields on assets as a result of derisking activities within the portfolio and higher hedging costs, partially offset by separate account return in 2010 of 14.5 per cent being higher than the long-term expected level of 6.8 per cent.
For our UK business, the short-term fluctuations in investment returns were positive £336 million (2009: positive £445 million), principally due to the 2010 return on the investments of the with-profits life fund (covering policyholder liabilities and unallocated surplus) of positive 12.0 per cent being higher than the long-term assumed return of 6.7 per cent and to the unrealised gains arising on corporate bonds held as part of the annuity portfolio.
Mark to market movement on core borrowingsThe mark to market movement on core borrowings was a negative £164 million, as credit spreads continued to narrow to more normal levels.
EEV basis profit after tax and non-controlling interests
AER
2010 £m 2009 £m
EEV basis operating profit based on longer-term investment returns 3,696 3,090 Short-term fluctuations in investment returns: – Insurance operations (55) 481 – IGD hedge costs – (235) – Other operations 25 105 (30) 351 Mark to market value movements on core borrowings (164) (795) Shareholders’ share of actuarial and other gains and losses on defined benefit pension schemes (11) (84) Effect of changes in economic assumptions (10) (910) Costs of terminated AIA transaction (377) –Gain on dilution of holding in PruHealth 3 –Profit on sale and results of Taiwan agency business – 91
PROFIT BEFORE TAX FROM CONTINUING OPERATIONS 3,107 1,743 Tax charge attributable to shareholders’ profitnote i (530) (481) Discontinued operations (net of tax) – (14) Non-controlling interests (4) (3)
PROFIT AFTER NON-CONTROLLING INTERESTS 2,573 1,245
Notei Tax charge attributable to shareholders’ profit includes a credit of £158 million which primarily relates to the impact of a settlement agreed
with the UK tax authorities.

64
Prudential plc Annual Report 2010
FINANCIAL REVIEW
BUSINESS REVIEW > FINANCIAL REVIEW > CONTINUED
EEV basis profit after tax and non-controlling interests > continuedShareholders’ share of actuarial and other gains and losses on defined benefit pension schemesThe shareholders’ share of actuarial and other gains and losses on defined benefit pension schemes on the EEV basis comprises the IFRS charge attributable to shareholders, and the shareholders’ share of movements in the scheme assets and liabilities attributable to the PAC with-profits fund. On the EEV basis there was a charge of negative £11 million (2009: negative £84 million) which mainly reflects the impact of assumption changes, being primarily a lower discount rate to the liabilities of the Scottish Amicable and M&G schemes partially offset by actual asset returns being higher than the long-term rate assumed.
Effect of changes in economic assumptionsThe effect of changes in economic assumptions of negative £10 million comprises negative £71 million for Asia, negative £1 million for the US and positive £62 million for the UK.
In our Asian business, economic assumption changes were negative £71 million mainly reflecting the impact of falls in interest rates and the derisking of the portfolios in Hong Kong and Singapore.
In our US business, economic assumption changes were negative £1 million, with the fall in the separate account return being offset by the beneficial effect arising from the decrease in the risk discount rate following a reduction of 0.6 per cent in the US 10-year Treasury rate during the period.
In our UK business, economic assumption changes were positive £62 million, where the impact of the lower risk discount rate more than offset the effect of lower expected long-term rates of return following a reduction in UK Gilt rates of 0.4 per cent during 2010.
Costs of terminated AIA transaction As previously discussed, the Group incurred pre-tax costs of £377 million in 2010 (£284 million post-tax) related to the terminated AIA transaction.
Gain on dilution of holding in PruHealthAs previously discussed, the Company’s holding of PruHealth has been reduced from 50 per cent to 25 per cent, following the injection into PruHealth of Standard Life Healthcare by the Group’s joint venture partner, Discovery Holdings of South Africa.
On an EEV basis, a gain of £3 million arises upon the dilution, representing the difference between the fair value of the enlarged investment still held and the embedded value of the original 50 per cent investment holding. From 1 August 2010 the Group incorporates 25 per cent of PruHealth’s new business sales, profits and EEV in-force results into its consolidated EEV financial results.
Effective tax rates The fall in the total tax rate, excluding the impact of the exceptional tax credit, from 28 per cent in 2009 to 22 per cent in 2010 arises from the effect of the mark to market value movements on core borrowings. As noted above, these movements gave rise to a charge in the EEV income statement of £164 million in 2010 and £795 million in 2009. As the liabilities are generally held to maturity or for the long-term, no deferred tax asset or liability is established on the market value adjustments and therefore, in 2010 and 2009 no deferred tax credits were established. The underlying tax rate on profits excluding the mark to market value adjustment on core borrowings and the exceptional tax credit was 21 per cent in 2010 as against 19 per cent in 2009.

65B
US
INE
SS
RE
VIE
W
Earnings per share (EPS)
2010Excluding
exceptional tax credit i
pence
2010 Including
exceptional tax credit
pence
2009
pence
Basic EPS based on operating profit after tax and non-controlling interests:
IFRSnote ii 62.0 68.3 47.5 EEV 106.9 113.2 88.8
2010 pence
2009 pence
Basic EPS based on total profit after non-controlling interests:
IFRS 56.7 27.0 EEV 101.9 49.8
Notesi The exceptional tax credit in 2010 relates to a £158 million credit
which primarily relates to the impact of a settlement agreed with the UK tax authorities.
ii The Company has amended the presentation of IFRS operating profit for its US insurance operations to remove the net equity hedge accounting effect (incorporating related amortisation of deferred acquisition costs) and include it in short-term fluctuations. 2009 amounts have been amended accordingly.
Dividend per share Interim dividends are recorded in the period in which they are paid. Final dividends are recorded in the period in which they are approved by shareholders. The second interim dividend of 13.56 pence per ordinary share for the year ended 31 December 2009 was paid to eligible shareholders on 27 May 2010 and the 2010 interim dividend of 6.61 pence per ordinary share was paid to eligible shareholders on 23 September 2010.
Following the Board’s decision to rebase the dividend upwards and subject to shareholders’ approval, the 2010 final dividend of 17.24 pence per ordinary share will be paid on 26 May 2011 in sterling to shareholders on the principal and Irish branch registers at 6.00pm BST on Friday, 1 April 2011 (the ‘Record Date’), and in Hong Kong dollars to shareholders on the Hong Kong branch register at 4.30pm Hong Kong time on the Record Date (‘HK Shareholders’). Holders of US American Depositary Receipts (‘US Shareholders’) will be paid their dividends in US dollars on or about five days after the payment date of the dividend to shareholders on the principal register. The final dividend will be paid on or about 2 June 2011 in Singapore dollars to shareholders with shares standing to the credit of their securities accounts with The Central Depository (Pte.) Limited (‘CDP’) at 5.00pm Singapore time on the Record Date (‘SG Shareholders’). The dividend payable to the HK Shareholders will be translated using the exchange rate quoted by the WM Company at 4.00pm UK time on 8 March 2011. The exchange rate at which the dividend payable to the SG Shareholders will be translated into SG$ will be determined by CDP. The dividend will distribute an estimated £439 million of shareholders’ funds.
The scrip dividend is not being offered in respect of this dividend. In its place shareholders will be offered a Dividend Reinvestment Plan (DRIP).
The final dividend of 17.24 pence per share brings the total dividend for the reporting period to 23.85 pence per share, four pence per share (20 per cent) higher than the 2009 total dividend.
The Board will maintain its focus on delivering a growing dividend from this new higher base, which will continue to be determined after taking into account the Group’s financial flexibility and our assessment of opportunities to generate attractive returns by investing in specific areas of the business. The Board believes that in the medium term a dividend cover of around two times is appropriate.
EARNINGS AND DIVIDEND PER SHARE

66
Prudential plc Annual Report 2010
BUSINESS REVIEW > FINANCIAL REVIEW > CONTINUED
FINANCIAL REVIEW
MOVEMENT ON SHAREHOLDERS’ FUNDS
IFRS EEV
2010
£m
2009note e
AER£m
2010
£m
2009
AER£m
Operating profit based on longer-term investment returns 1,941 1,564 3,696 3,090 Items excluded from operating profit (480) (818) (589) (1,347)
TOTAL PROFIT BEFORE TAX 1,461 746 3,107 1,743 Exceptional tax credit 158 – 158 –Tax, discontinued operations and non-controlling interests (188) (70) (692) (498)
PROFIT FOR THE PERIOD 1,431 676 2,573 1,245 Exchange movements, net of related tax 251 (195) 693 (750) Unrealised gains and losses on Jackson securities classified as
available for salenote a 478 1,043 – –Dividends (511) (481) (511) (481) New share capital subscribed 75 141 75 141 Other 36 29 104 162
NET INCREASE IN SHAREHOLDERS’ FUNDS 1,760 1,213 2,934 317 Shareholders’ funds at beginning of year 6,271 5,058 15,273 14,956
SHAREHOLDERS’ FUNDS AT END OF YEAR 8,031 6,271 18,207 15,273
Comprising Long-term business Free surplus note b 2,748 2,065 Required capital 3,415 2,994
Net worth note c 6,163 5,059 Value of in-force 12,051 10,283
Total 18,214 15,342 Other business note d (7) (69)
TOTAL note f 18,207 15,273
Notesa Net of related changes to deferred acquisition costs and tax.b The increase in free surplus of £683 million from 2010 arises primarily from £1,284 million being generated by the long-term business, off-set
by cash paid to the holding company and other items.c The increase in net worth in the period principally reflects the free surplus generated in the period, offset by cash paid to the holding
company, changes to required capital and other items.d Shareholders’ funds for other than long-term business of negative £7 million (2009: negative £69 million) comprises £1,787 million for asset
management operations (2009: £1,659 million), including goodwill of £1,230 million (2009: £1,230 million), holding company net borrowings of £2,212 million (2009: £1,780 million) and net other shareholders’ funds of £418 million (2009: £52 million).
e The Company has amended the presentation of IFRS operating profit for its US insurance operations to remove the net equity hedge accounting credit effect (incorporating related amortisation of deferred acquisition costs) and include it in short-term fluctuations. 2009 amounts have been amended accordingly.
f EEV shareholders’ funds excluding goodwill attributable to shareholders is £16,741 million (2009: £13,963 million).
IFRSStatutory IFRS basis shareholders’ funds at 31 December 2010 were £8.0 billion. This compares to the £6.3 billion at 31 December 2009, an increase of £1.7 billion, and equivalent to 28 per cent.
The movement reflects the profit for the year after tax and non-controlling interests of £1.4 billion, exchange translation gains of £0.3 billion, the improvement in the level of net unrealised gains on Jackson’s debt securities of £0.5 billion
from the position at 31 December 2009 and other items of £0.1 billion, offset by dividend payments of £0.5 billion.
EEVOn an EEV basis, which recognises the shareholders’ interest in long-term business, shareholder funds at 31 December 2010 were £18.2 billion, an increase of £2.9 billion from the 2009 level, equivalent to 19 per cent. This increased level of shareholders’ funds primarily reflects the profit after tax of £2.6 billion, the

67B
US
INE
SS
RE
VIE
W
OverviewThe Group manages its internal cash flow by focusing on the free surplus generated by the life and asset management businesses as defined below and the percentage of net underlying free surplus that is remitted to the holding company as cash (‘the remittance ratio’). The tables below set out the Group’s free surplus generation for 2010, the holding company cash flow statement and a table showing the remittance ratio for each of the business operations.
Free surplus generationSources and uses of free surplus generation from the Group’s insurance and asset management operationsGroup free surplus at the end of the period comprises free surplus for the insurance businesses, representing the excess of the net worth over the required capital included in the EEV results, and IFRS net assets for the asset management businesses excluding goodwill. The free surplus generated during the
The total movement in free surplus net of tax in the year can be analysed as follows:
AER
2010 £m 2009 £m
Free surplus generation Expected in-force cash flows (including expected return on net assets) 2,139 1,914 Changes in operating assumptions and variances 220 175
UNDERLYING FREE SURPLUS GENERATED IN THE PERIOD FROM IN-FORCE BUSINESS 2,359 2,089 Market related items (94) (198)Investment in new business: Excluding Japan (643) (660) Japan (2) (15)
Total investment in new business (645) (675)
FREE SURPLUS GENERATED IN THE PERIOD FROM RETAINED BUSINESSES 1,620 1,216 Effect of disposal and trading results of Taiwan agency business – 987 Net cash remitted by the business units (935) (688)Other movements and timing differencesnote 1 122 157
TOTAL MOVEMENT DURING THE PERIOD 807 1,672 FREE SURPLUS AT 1 JANUARY 2,531 859
FREE SURPLUS AT 31 DECEMBER 3,338 2,531
Comprised of: Free surplus relating to long-term insurance business 2,748 2,065 Free surplus of other insurance business 33 37 IFRS net assets of asset management businesses excluding goodwill 557 429
Total free surplus 3,338 2,531
Note1 Included within other movements and timing differences is £18 million arising on the acquisition of UOB.
FREE SURPLUS AND HOLDING COMPANY CASH FLOW
positive effects of exchange movements of £0.7 billion offset by the dividend payments of £0.5 billion.
The shareholders’ funds at 31 December relating to long-term business of £18.2 billion comprise £7.4 billion (up 29 per cent from 2009) for our Asian long-term business operations, £4.8 billion (up 16 per cent from 2009) for our US long-term business operations and £6.0 billion (up 10 per cent from 2009) for our UK long-term business operations.
At 31 December 2010, the embedded value for our Asian long-term business operations was £7.4 billion, with £6.0 billion (up 31 per cent from 2009) being in the South East Asia countries of Indonesia, Malaysia, Philippines, Singapore, Thailand, Vietnam together with Hong Kong. For Prudential’s other Asian markets, the embedded value was £1.4 billion (up 21 per cent from 2009) in aggregate.

68
Prudential plc Annual Report 2010
BUSINESS REVIEW > FINANCIAL REVIEW > CONTINUED
FINANCIAL REVIEW
Value created through investment in new business by life operations
2010 £m
Asian operations
US operations
UK insurance
operations
Grouptotal
excluding Japan
Grouptotal
including Japan
Excluding Japan Japan Total
Free surplus invested in new business (278) (2) (280) (300) (65) (643) (645)
Increase in required capital 84 – 84 270 107 461 461
Net worth invested in new business (194) (2) (196) (30) 42 (182) (184)
Value of in-force created by new business 866 1 867 525 224 1,615 1,616
Post-tax new business profit for the year 672 (1) 671 495 266 1,433 1,432
Tax 230 – 230 266 99 595 595
Pre-tax new business profit for the year 902 (1) 901 761 365 2,028 2,027
New business sales (APE) 1,501 1,508 1,164 820 New business margins (% APE) 60% 60% 65% 45% Internal rate of return* >20% >20% >20% >20%
* The internal rate of return is equivalent to the discount rate at which the present value of the post-tax cash flows expected to be earned over the lifetime of the business written in shareholder-backed life funds is equal to the total invested capital to support the writing of the business. The capital included in the calculation of the IRR is equal to the amount required to pay acquisition costs and set up statutory reserves less premiums received, plus required capital. The impact of the time value of options and guarantees is included in the calculation.
period comprises the movement in this balance excluding foreign exchange, capital movements, and other reserve movements. Specifically, it includes amounts maturing from the in-force operations during the period less the investment in new business, the effect of market movements and other one-off items.
For asset management operations we have defined free surplus generation to be total post-tax IFRS profit for the period. Group free surplus generated also includes the general insurance commission earned during the period and excludes shareholders’ other income and expenditure, and centrally arising restructuring and Solvency II implementation costs.
During 2010 we generated total free surplus from the retained businesses of £1,620 million (2009: £1,216 million). Underlying free surplus generated from the in-force book increased 13 per cent from £2,089 million in 2009 to £2,359 million in 2010, principally reflecting the underlying growth of the portfolio and positive changes in operating assumptions and variances of positive £220 million for our life businesses (2009: positive £175 million). These positive changes include positive £3 million in Asia (2009: negative £98 million), £26 million arising in the UK
(2009: positive £158 million), £191 million in the US, principally reflecting favourable spread experience (2009: positive £115 million).
Underlying free surplus generated has been used by our life businesses to invest in new business. Investment in new business1 has fallen by three per cent to £643 million in 2010. This compares to a 23 per cent increase in sales1 and a 25 per cent increase in new business profits1. The strong improvement in capital efficiency is primarily the result of continuing the active management of the product and geographical mix of the new business sold, in line with the Group’s disciplined approach to capital conservation and cash optimisation.
Market-related movements have improved from negative £198 million in 2009 to negative £94 million in 2010, of which negative £192 million relates to the US, principally reflecting investment returns on variable annuity business and related hedging activity. In addition, negative £74 million relates to the UK and is offset by positive £146 million relating to Asia principally related to favourable equity markets during 2010 and positive £26 million relating to our asset management businesses.
Note
1 Excludes Japan which ceased writing new business in 2010.

69B
US
INE
SS
RE
VIE
W
Value created through investment in new business by life operations > continued
AER
2009 £m
Asian operations
US operations
UK insurance
operations
Grouptotal
excluding Japan
Grouptotal
including Japan
Excluding Japan Japan Total
Free surplus invested in new business (231) (15) (246) (326) (103) (660) (675)
Increase in required capital 69 – 69 300 82 451 451
Net worth invested in new business (162) (15) (177) (26) (21) (209) (224)
Value of in-force created by new business 707 3 710 458 187 1,352 1,355
Post-tax new business profit for the year 545 (12) 533 432 166 1,143 1,131
Tax 180 – 180 232 64 476 476
Pre-tax new business profit for the year 725 (12) 713 664 230 1,619 1,607
New business sales (APE) 1,209 1,261 912 723 New business margins (% APE) 60% 57% 73% 32% Internal rate of return* >20% >20% >20% >15%
CER
2009 £m
Asian operations
US operations
UK insurance
operations
Grouptotal
excluding Japan
Grouptotal
including Japan
Excluding Japan Japan Total
Free surplus invested in new business (245) (16) (261) (330) (103) (678) (694)
Increase in required capital 75 – 75 304 82 461 461
Net worth invested in new business (170) (16) (186) (26) (21) (217) (233)
Value of in-force created by new business 759 3 762 464 187 1,410 1,413
Post-tax new business profit for the year 589 (13) 576 438 166 1,193 1,180
Tax 194 – 194 235 64 493 493
Pre-tax new business profit for the year 783 (13) 770 673 230 1,686 1,673
New business sales (APE) 1,300 1,356 924 723 New business margins (% APE) 60% 57% 73% 32% Internal rate of return* >20% >20% >20% >15%
* The internal rate of return is equivalent to the discount rate at which the present value of the post-tax cash flows expected to be earned over the lifetime of the business written in shareholder-backed life funds is equal to the total invested capital to support the writing of the business. The capital included in the calculation of the IRR is equal to the amount required to pay acquisition costs and set up statutory reserves less premiums received, plus required capital. The impact of the time value of options and guarantees is included in the calculation.

70
Prudential plc Annual Report 2010
BUSINESS REVIEW > FINANCIAL REVIEW > CONTINUED
FINANCIAL REVIEW
Overall, the Group wrote £3,485 million of sales on an APE basis1 in 2010 (2009: £2,844 million) generating a post-tax new business contribution to embedded value of £1,433 million (2009: £1,143 million). To support these sales, we invested £643 million of capital (2009: £660 million). By focusing on sales of products and in geographies which are less capital intensive, the Group has increased the amount of post-tax new business profit contribution1 to embedded value per £1 million of free surplus invested by 29 per cent to £2.2 million (2009: £1.7 million). We estimate the Group’s internal rate of return for the 12 months ended 31 December 2010 to be greater than 20 per cent. The amount of capital invested covers both new business strain, including commissions, of £182 million (2009: £209 million) and the required capital of £461 million (2009: £451 million). Management will continue to focus on capital preservation and investment in those areas which add most value to the Group.
In Asia, investment in new business1 was £278 million, which was up 20 per cent compared to 2009 (£231 million). This compares to a 24 per cent increase in new business sales (APE). For each £1 million of free surplus invested we generated £2.4 million of post-tax new business contribution to embedded value broadly consistent with 2009, excluding Japan (2009: £2.4 million)1. The average free surplus undiscounted payback period for business written in the 12 months to 31 December 2010 was three years (2009: three years).
In the US, investment in new business was £300 million, eight per cent lower than 2009 (£326 million) and considerably lower than the 28 per cent increase in APE new business sales. For each £1 million of free surplus invested we generated £1.7 million of post-tax new business contribution to embedded value (2009: £1.3 million). This higher return reflects a change in business mix with a higher proportion of variable annuity business and a reduced proportion of more capital intensive fixed annuities. The average free surplus undiscounted payback period for business written in the 12 months to 31 December 2010 was one year (2009: two years).
In the UK, investment in new business decreased by 37 per cent from £103 million in 2009 to £65 million in 2010. This decrease compares with a 13 per cent increase in APE new business sales in the period. For each £1 million of free surplus invested we generated £4.1 million of post-tax new business contribution to embedded value (2009: £1.6 million). This increase reflects the UK’s disciplined approach to pricing which has led to higher retail margins across the product range in 2010. It is also improved by the large bulk annuity transaction undertaken in 2010, the size of which may not be repeated in future years. The average free surplus undiscounted payback period for shareholder-backed business written in the 12 months to 31 December 2010 was four years (2009: five years).
Note
1 Excludes Japan which ceased writing new business in 2010.
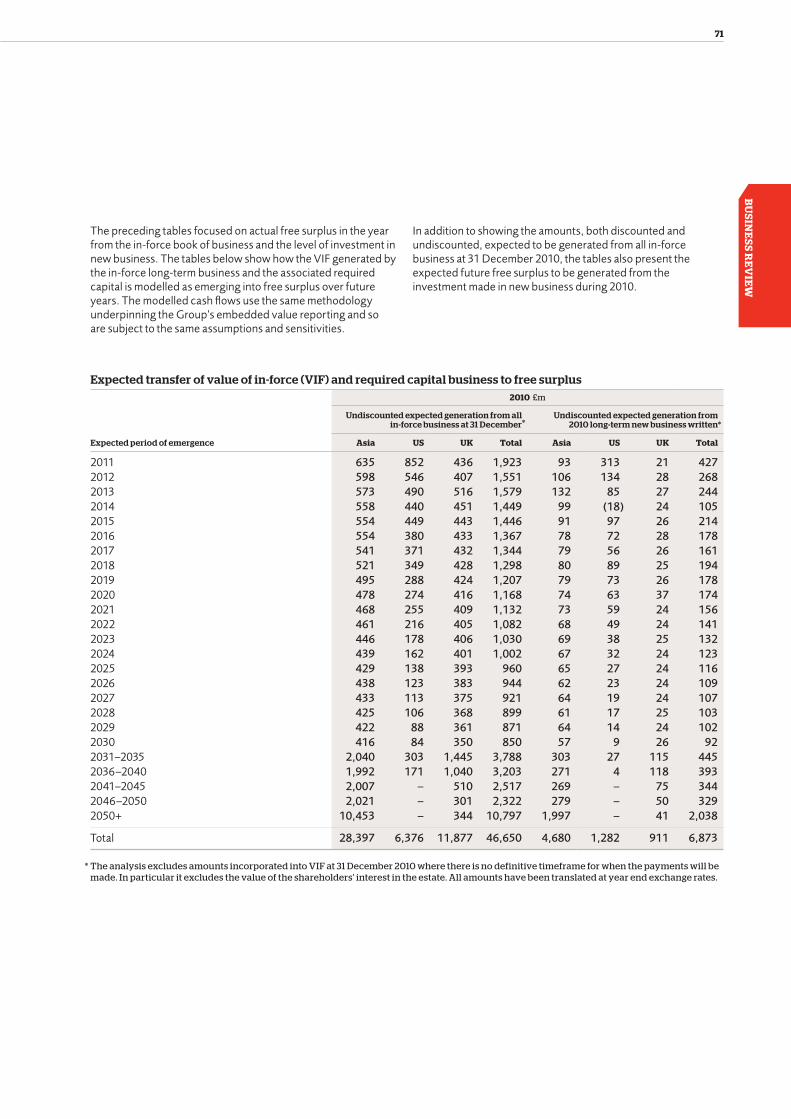
71B
US
INE
SS
RE
VIE
W
Expected transfer of value of in-force (VIF) and required capital business to free surplus 2010 £m
Undiscounted expected generation from allin-force business at 31 December*
Undiscounted expected generation from 2010 long-term new business written*
Expected period of emergence Asia US UK Total Asia US UK Total
2011 635 852 436 1,923 93 313 21 4272012 598 546 407 1,551 106 134 28 2682013 573 490 516 1,579 132 85 27 2442014 558 440 451 1,449 99 (18) 24 1052015 554 449 443 1,446 91 97 26 2142016 554 380 433 1,367 78 72 28 1782017 541 371 432 1,344 79 56 26 1612018 521 349 428 1,298 80 89 25 1942019 495 288 424 1,207 79 73 26 1782020 478 274 416 1,168 74 63 37 1742021 468 255 409 1,132 73 59 24 1562022 461 216 405 1,082 68 49 24 1412023 446 178 406 1,030 69 38 25 1322024 439 162 401 1,002 67 32 24 1232025 429 138 393 960 65 27 24 1162026 438 123 383 944 62 23 24 1092027 433 113 375 921 64 19 24 1072028 425 106 368 899 61 17 25 1032029 422 88 361 871 64 14 24 1022030 416 84 350 850 57 9 26 922031–2035 2,040 303 1,445 3,788 303 27 115 4452036–2040 1,992 171 1,040 3,203 271 4 118 3932041–2045 2,007 – 510 2,517 269 – 75 3442046–2050 2,021 – 301 2,322 279 – 50 3292050+ 10,453 – 344 10,797 1,997 – 41 2,038
Total 28,397 6,376 11,877 46,650 4,680 1,282 911 6,873
* The analysis excludes amounts incorporated into VIF at 31 December 2010 where there is no definitive timeframe for when the payments will be made. In particular it excludes the value of the shareholders’ interest in the estate. All amounts have been translated at year end exchange rates.
The preceding tables focused on actual free surplus in the year from the in-force book of business and the level of investment in new business. The tables below show how the VIF generated by the in-force long-term business and the associated required capital is modelled as emerging into free surplus over future years. The modelled cash flows use the same methodology underpinning the Group’s embedded value reporting and so are subject to the same assumptions and sensitivities.
In addition to showing the amounts, both discounted and undiscounted, expected to be generated from all in-force business at 31 December 2010, the tables also present the expected future free surplus to be generated from the investment made in new business during 2010.

72
Prudential plc Annual Report 2010
BUSINESS REVIEW > FINANCIAL REVIEW > CONTINUED
FINANCIAL REVIEW
The above amounts can be reconciled to the new 2010 business amounts as follows:
2010 New business
Asia*
£mUS £m
UK £m
Total £m
Undiscounted expected free surplus generation 4,680 1,282 911 6,873 Less: discount effect (3,713) (434) (582) (4,729)
Discounted expected free surplus generation 967 848 329 2,144 Less: Free surplus investment in new business (280) (300) (65) (645) Other items† (16) (53) 2 (67)
Post-tax EEV new business profit 671 495 266 1,432 Tax 230 266 99 595
PRE-TAX EEV NEW BUSINESS PROFIT 901 761 365 2,027
* Includes Japan.† Other items represents the impact of the time value of options and guarantees on new business, foreign exchange effects and other non-
modelled items. Foreign exchange effects arise as EEV new business profit amounts are translated at average exchange rates and expected free surplus generation uses year end closing rates.
The equivalent discounted amounts of the totals shown in the table on the preceding are outlined below:
2010 £m
Discounted expected generation from all in-force business at 31 December
Discounted expected generation from 2010 long-term new business written
Expected period of emergence Asia US UK Total Asia US UK Total
2011 575 800 403 1,778 88 292 18 3982012 510 481 348 1,339 91 116 24 2312013 444 408 405 1,257 101 68 22 1912014 405 344 333 1,082 70 (13) 18 752015 370 325 303 998 59 68 19 1462016 343 258 274 875 47 48 19 1142017 310 237 255 802 44 35 16 952018 280 207 234 721 41 50 15 1062019 249 161 215 625 38 39 14 912020 225 144 195 564 33 31 19 832021 207 125 177 509 30 27 12 692022 190 99 163 452 27 21 11 592023 170 78 151 399 25 15 11 512024 157 66 138 361 22 11 9 422025 142 53 126 321 19 9 9 372026 139 45 113 297 19 7 8 342027 128 40 102 270 18 6 8 322028 117 35 93 245 16 5 7 282029 108 28 84 220 15 4 7 262030 99 25 76 200 12 2 7 212031–2035 400 79 240 719 53 5 25 832036–2040 275 40 109 424 35 2 18 552041–2045 195 – 29 224 24 – 8 322046–2050 139 – 11 150 18 – 4 222050+ 152 – 6 158 22 – 1 23
TOTAL 6,329 4,078 4,583 14,990 967 848 329 2,144

73B
US
INE
SS
RE
VIE
W
In recent years, our strategic focus on capital conservation and value optimisation has enabled us to transform the free surplus generation profile of the Group. The undiscounted in-force free surplus generation ability of the Group is now significant, with all businesses contributing material amounts.
Our disciplined approach to writing low strain, high return, short payback new business, produces an expected free surplus generation profile with sizeable free surplus releases in the early years, thereby ensuring that the initial investment is paid back quickly and incremental profits are earned thereafter.
The combination of the long-term business in-force releases depicted in the previous tables, coupled with asset management profits, returns on excess assets together with the impact of future new business, reinforces our confidence that we remain on track to deliver a cumulative net free surplus after new business investment of £6.5 billion in the 2010 to 2013 period.
The above amounts can be reconciled to the Group’s financial statements as follows:
Total £m
Discounted expected generation from all in-force business at 31 December 2010 14,990 Add: Free surplus of life operations held at 31 December 2010 2,748 Less: Time value of options and guarantees (369) Other non-modelled items* 845
Total EEV of life operations 18,214
* These relate to items where there is no definitive timeframe for when the payments will be made and are, consequently, excluded from the amounts incorporated into the tables above showing the expected generation of free surplus from in-force business at 31 December 2010. In particular it excludes the value of the shareholders’ interest in the estate.

74
Prudential plc Annual Report 2010
BUSINESS REVIEW > FINANCIAL REVIEW > CONTINUED
FINANCIAL REVIEW
Holding company cash flow
2010 £m 2009 £m
NET CASH REMITTED BY BUSINESS UNITS: UK Life fund paid to Group 202 284 Shareholder-backed business: Other UK paid to Group 275 189 Group invested in UK (57) (39) Total shareholder-backed business 218 150
UK NET 420 434 US paid to Group 80 39 Group invested in US – –
US NET 80 39 Asia paid to Group Long-term business 330 181 Other operations 33 46
363 227 Group invested in Asia Long-term business (63) (101) Other operations (67) (86)
(130) (187)
ASIA NET 233 40 M&G PAID TO GROUP 150 93 PRUCAP PAID TO GROUP 52 82
NET REMITTANCES TO GROUP FROM BUSINESS UNITS 935 688 Net interest paid (231) (214)Tax received 185 71 Corporate activities (146) (163)Solvency II costs (34) –
TOTAL CENTRAL OUTFLOWS (226) (306)
OPERATING HOLDING COMPANY* CASH FLOW BEFORE DIVIDEND 709 382 Dividend paid net of scrip (449) (344)
OPERATING HOLDING COMPANY* CASH FLOW AFTER DIVIDEND 260 38 Exceptional Items: Cash flow arising from sale of Taiwan agency business – (125) Acquisition of UOB Life and related distribution agreements (276) – Costs of terminated AIA transaction (377) – IGD hedge costs – (235) Bank loan reorganisation 120 –Other cash movements: Issue of hybrid debt, net of costs – 822 Repayment of maturing debt – (249) Receipts arising from foreign exchange movements on US$ hedging instruments – 60
Total holding company cash flow (273) 311 Cash and short-term investments at beginning of period 1,486 1,165 Foreign exchange movements 19 10
CASH AND SHORT-TERM INVESTMENTS AT END OF PERIOD 1,232 1,486
* Including central finance subsidiaries.

75B
US
INE
SS
RE
VIE
W
Cash remittances as a percentage of free surplusAs previously highlighted, the Group focuses on the generation of free surplus by each of the Group’s business units and then balances cash remittances from these units between financing new business growth, managing market shocks and covering the Group’s central outgoings, including the shareholder dividend. The table above highlights this balance by comparing the 2010 net underlying free surplus generated with the net amounts that have been remitted by each of our underlying business operations.
Remittance ratio analysisThe holding company received £935 million of net cash remittances from the business units in 2010, an increase of £247 million from 2009. Overall net remittances as a percentage of net underlying free surplus increased from 49 per cent in 2009 to 55 per cent in 2010. In line with the Group’s strategy the highest remittance ratios are from the UK businesses. The UK insurance operations remitted £420 million in 2010 (2009: £434 million), equivalent to 85 per cent of net underlying free surplus. Contributions from UK with-profits were lower, reflecting the bonus reductions effected at the start of 2009, resulting in a lower share for shareholders in that year and lower remittances in 2010. Net remittances from our shareholder-backed businesses were £218 million, an increase of £68 million from 2009. M&G and PruCap collectively remitted £202 million in 2010 (2009: £175 million) equivalent to 98 per cent of net underlying free surplus.
Asia remitted net cash of £233 million in 2010, an increase of £193 million from the net £40 million remitted in 2009. This includes a one-off remittance of £130 million from Malaysia, representing the accumulation of historic distributable reserves. Total injections in 2010 were £130 million; £57 million lower than the £187 million paid in 2009. This primarily reflects the injection made into Taiwan in 2009 to facilitate the required restructuring after the sale of the agency business in that year.
Cash received from Jackson was £80 million in 2010, £41 million higher than the £39 million remitted in 2009. This is equivalent to a modest proportion of net underlying free surplus generated, reflecting our decision to retain free surplus in the business, in order to provide the capital to capture the attractive new business returns created by the market dislocation and to rebuild the capital buffers of this business following the 2008/2009 financial crisis. From 2011, it is planned that Jackson will increase the level of remittances to the Group.
Central outflows improved by £80 million to £226 million in 2010 (2009: £306 million). Lower corporate costs and higher tax receipts in 2010 more than offset increased net interest payments, following the additional debt raised in 2009, and Solvency II project spend.
Following a settlement reached with the UK tax authorities in relation to matters arising principally in 2001 to 2008, £266 million in exceptional tax outflows are expected to be made over the period from 2011 to 2013. We anticipate that half will be paid in 2011 and the remainder split evenly over 2012 and 2013.
After central costs, there was a net cash inflow before dividend of £709 million in 2010 compared to £382 million for 2009. The dividend paid net of scrip, was £449 million in 2010 compared to £344 million in 2009. The take-up of scrip dividends in 2010 was £62 million compared to £137 million for 2009.
In 2010, central cash resources funded the acquisition of UOB Life and related distribution agreements. In addition, £377 million relating to costs associated with the terminated AIA transaction were also funded from our central resources. Offsetting these outflows were net funds received of £120 million following bank loan reorganisation.
As a result of the transactions above, together with a £19 million foreign exchange revaluation gain, the overall holding company cash and short-term investment balances at 31 December 2010 decreased by £254 million to £1.2 billion from the £1.5 billion at 31 December 2009.
Remittance ratio analysis
2010 2009
Net remittance
to Group£m
Net underlying
free surplus note i
£m
Remittance ratio
%
Net Remittance
to Group£m
Net underlying
free surplusnote i
£m
Remittance ratio
%
Asia 233 383 61 40 161 25US 80 627 13 39 516 8UK 420 497 85 434 562 77M&G (including PruCap) 202 207 98 175 175 100
Total 935 1,714 55 688 1,414 49
Notei Underlying free surplus generated in the period from in-force business less investment in new business.
Holding company cash flow We continue to manage cash flows across the Group with a view to achieving a balance between ensuring sufficient net remittances from the businesses to cover the progressive dividend (after corporate costs) and maximising value for shareholders through the retention and the reinvestment of the free surplus generated at business unit level in the particularly profitable opportunities available to the Group given its established position in key life insurance markets. On this basis, the holding company cash flow statement at an operating level
should ordinarily balance close to zero before exceptional cash flows, but from time to time additional remittances from business operations will be made to provide the Group with greater financial flexibility at the corporate centre.
Operating holding company cash flow for 2010 before the shareholder dividend was £709 million, £327 million higher than 2009. After deducting the shareholder dividend paid net of scrip, the operating holding company cash flow was positive £260 million (2009: £38 million).

76
Prudential plc Annual Report 2010
BUSINESS REVIEW > FINANCIAL REVIEW > CONTINUED
FINANCIAL REVIEW
Balance Sheet Summary
AER
2010 £m 2009 £m
Goodwill attributable to shareholders 1,466 1,310Investments 239,297 208,722Holding company cash and short-term investments 1,232 1,486Other 18,811 16,236
Total assets 260,806 227,754
Less: Liabilities Policyholder liabilities 214,727 186,398 Unallocated surplus of with-profits funds 10,253 10,019
224,980 196,417 Less: Shareholders’ accrued interest in the long-term business (10,176) (9,002)
214,804 187,415 Core structural borrowings of shareholders’ financed operations (IFRS book value basis) 3,676 3,394 Other liabilities including non-controlling interest 24,119 21,672
Total liabilities and non-controlling interest 242,599 212,481
EEV BASIS NET ASSETS 18,207 15,273
Share capital and premium 1,983 1,970 IFRS basis shareholders’ reserves 6,048 4,301
IFRS basis shareholders’ equity 8,031 6,271 Additional EEV basis retained profit 10,176 9,002
EEV BASIS SHAREHOLDERS’ EQUITY (EXCLUDING NON-CONTROLLING INTEREST) 18,207 15,273
The following sections focus on key areas of interest in the balance sheet.
Investments
2010 £m 2009 £m
Participating funds
Unit-linked and variable
annuitiesShareholder-
backed Total
GroupTotal
Group
Debt securities 53,261 9,054 54,037 116,352 101,751 Equity 31,371 54,274 990 86,635 69,354 Property investments 8,993 745 1,509 11,247 10,905 Commercial mortgage loans 256 – 4,693 4,949 4,634 Other loans 1,888 – 2,424 4,312 4,120 Deposits 7,272 749 1,931 9,952 12,820 Other investments note i 3,887 131 1,832 5,850 5,138
Total 106,928 64,953 67,416 239,297 208,722
Notei Includes £71 million of investments, including PruHealth from 1 August 2010, accounted for using the equity method (2009: £6 million).

77B
US
INE
SS
RE
VIE
W
Total investments held by the Group at 31 December 2010 were £239 billion, of which £107 billion were held by participating funds, £65 billion by unit-linked funds and £67 billion by shareholder-backed operations. Shareholders are not directly exposed to value movements on assets backing participating or unit-linked operations, with sensitivity mainly related to shareholder-backed operations.
Of the £ 67 billion investments related to shareholder-backed operations, £6 billion was held by Asia long-term business, £32 billion by Jackson and £26 billion by the UK long-term business respectively. In addition £3 billion is held by our asset management and other operations.
The investments held by the shareholder-backed operations are predominantly debt securities, totalling £54 billion, £4 billion, £26 billion and £22 billion for Asia, the US and the UK long-term businesses respectively, of which 84 per cent, 95 per cent and 98 per cent are rated, either externally or internally, as investment grade.
In addition, £2 billion of debt securities was held by asset management and other operations, substantially all of which was managed by Prudential Capital.
Policyholder liabilities and unallocated surplus of with-profits funds
AER
2010 £m 2009 £m
Shareholder-backed business Asia US UK Total Total
At 1 January 13,050 48,311 38,700 100,061 92,189 Premiums 3,270 11,735 4,579 19,584 15,757 Surrenders (1,800) (3,598) (1,326) (6,724) (5,672) Maturities/Deaths (172) (769) (2,224) (3,165) (2,914)
NET FLOWS 1,298 7,368 1,029 9,695 7,171 Investment related items and other movements 1,523 3,464 4,289 9,276 10,820 Assumption changes 19 – (46) (27) (113) Acquisition of UOB Life Assurance Limited 464 – – 464 –Dilution of holding in PruHealth – – (27) (27) – Disposal of Taiwan agency business – – – – (3,508) Foreign exchange translation difference 1,362 1,380 (1) 2,741 (6,498)
At 31 December 17,716 60,523 43,944 122,183 100,061
WITH-PROFITS FUNDS – Policyholder liabilities 92,544 86,337 – Unallocated surplus 10,253 10,019
TOTAL AT 31 DECEMBER 102,797 96,356
TOTAL POLICYHOLDER LIABILITIES INCLUDING UNALLOCATED SURPLUS AT 31 DECEMBER 224,980 196,417
Policyholder liabilities and unallocated surplus of with-profits funds Policyholder liabilities related to shareholder-backed business grew by £22.1 billion from £100.1 billion at 31 December 2009 to £122.2 billion at 31 December 2010.
The increase reflects positive net flows (premiums less surrenders and maturities/deaths) of £9.7 billion in 2010 (2009: £7.2 billion), driven by strong inflows in the US (£7.4 billion) and Asia (£1.3 billion) and the £0.9 billion bulk annuity transaction in the UK. Positive investment-related
and other items of £9.3 billion (2009: £10.8 billion) also contributed to the growth following improvements in the bond and equity markets during the year.
Other movements include foreign exchange movements of positive £2.7 billion (2009: negative £6.5 billion) and an increase following the acquisition of UOB Life of £464 million.
During 2010, the unallocated surplus, which represents the excess of assets over policyholder liabilities for the Group’s with-profit funds on a statutory basis, increased two per cent in 2010 to £10.3 billion.

78
Prudential plc Annual Report 2010
BUSINESS REVIEW > FINANCIAL REVIEW > CONTINUED
Fair valuation of guarantees attaching to Jackson’s variable annuity businessThe IFRS accounting for guarantees on US variable annuity contracts has a mixed measurement approach. GMWB ‘not for life’ contract features are fair valued under IAS 39 and FAS 157 with a capping feature to prevent early anticipation of expected fees for guarantees. However, the GMDB and GMWB ‘for life’ blocks of business are accounted for under grandfathered US GAAP which does not, and is not intended to, fair value the liabilities.
If we had fair valued the GMDB and GMWB ‘for life’ guarantees as if they were embedded derivatives but restricted or capped the recognition of future fees in line with IFRS, the liabilities at 31 December 2010 would have been higher by some
£650 million and £50 million, respectively. After offsetting related adjustments to DAC amortisation and deferred tax, the net effect would have been a reduction in shareholders’ equity of approximately £150 million.
If the liabilities were remeasured to fair value them using IAS 39 and FAS 157 principles, but with the removal of the fee capping feature, so as to include the full value of future expected fees for guarantees, the change in liability from the IFRS accounting value would be favourable by some £100 million. After offsetting related adjustments to DAC amortisation on the respective GMDB and GMWB components of the change, and for deferred tax, the net effect would be an increase in shareholders’ equity, which is also estimated to be approximately £100 million.
FINANCIAL REVIEW
Shareholders’ net borrowings and ratings Shareholders’ net borrowings at 31 December 2010:
AER
2010 £m 2009 £m
IFRS basis
Mark to market
value EEV basis IFRS basis
Mark to market
value EEV basis
Perpetual subordinated Capital securities (Innovative Tier 1) 1,463 28 1,491 1,422 (71) 1,351 Subordinated notes (Lower Tier 2) 1,255 117 1,372 1,269 103 1,372
2,718 145 2,863 2,691 32 2,723 Senior debt 2023 300 33 333 300 8 308 2029 249 (1) 248 249 (14) 235
Holding company total 3,267 177 3,444 3,240 26 3,266 Prudential Capital 250 – 250 – – – Jackson surplus notes (Lower Tier 2) 159 13 172 154 4 158
Total 3,676 190 3,866 3,394 30 3,424 Less: Holding company cash and short-term
investments (1,232) – (1,232) (1,486) – (1,486)
Net core structural borrowings of shareholder-financed operations 2,444 190 2,634 1,908 30 1,938
Shareholders’ net borrowings and ratings The Group’s core structural borrowings at 31 December 2010 totalled £3.7 billion on an IFRS basis, compared with £3.4 billion at 31 December 2009. The movement of £0.3 billion mainly reflects the addition of a £250 million bank funding facility in the period following activities to reorganise certain bank loans in the period.
After adjusting for holding company cash and short-term investments of £1.2 billion, net core structural borrowings at 31 December 2010 were £2.4 billion compared with £1.9 billion at 31 December 2009. The movement of £0.5 billion includes positive operating cash flows of £0.3 billion, the movement in borrowings of £0.3 billion mentioned above and the use of
£0.7 billion of central resources to fund the acquisition of UOB Life and related distribution agreements and the terminated AIA transaction costs.
In January 2011, the Company issued US$550 million 7.75 per cent Tier 1 subordinated debt, primarily to retail investors. The proceeds, net of costs, were US$539 million and are intended to finance the repayment of the ¤500 million Tier 2 subordinated notes in December 2011.
The Group operates a central treasury function, which has overall responsibility for managing our capital funding programme as well as our central cash and liquidity positions.

79B
US
INE
SS
RE
VIE
W
In addition to our core structural borrowings set out above, we also have in place an unlimited global commercial paper programme. As at 31 December 2010, we had issued commercial paper under this programme totalling £127 million, US$2,350 million, EUR 743 million and CHF 50 million. The central treasury function also manages our £5,000 million medium-term note (MTN) programme, covering both core and non-core borrowings. During January 2010, we raised non-core borrowings of £250 million from this programme. In April and October 2010 we refinanced an existing internal £200 million issue under the same programme. In total, at 31 December 2010 the outstanding subordinated debt under the programme was £835 million, US$750 million and EUR 520 million, while the senior debt outstanding was £450 million. In addition, our holding company has access to £2.1 billion of syndicated and bilateral committed revolving credit facilities, provided by 17 major international banks, expiring between 2011 and 2015. Apart from small drawdowns to test the process, these facilities have never been drawn, and there were no amounts outstanding at 31 December 2010. The commercial paper programme, the MTN programme and the committed revolving credit facilities are all available for general corporate purposes and to support the liquidity needs of our holding company and are intended to maintain a strong and flexible funding capacity.
We manage the Group’s core debt within a target level consistent with our current debt ratings. At 31 December 2010, the gearing ratio (debt, net of cash and short-term investments, as a proportion of EEV shareholders’ funds plus debt) was 11.8 per cent, compared with 11.1 per cent at 31 December 2009. Prudential plc has strong debt ratings from Standard & Poor’s, Moody’s and Fitch. Prudential’s long-term senior debt is rated A+, A2 (negative outlook) and A from Standard & Poor’s, Moody’s and Fitch, while short-term ratings are A-1, P-1 and F1 respectively.
The financial strength of PAC is rated AA by Standard & Poor’s, Aa2 (negative outlook) by Moody’s and AA by Fitch.
Jackson National Life’s financial strength is rated AA by Standard & Poor’s, A1 (negative outlook) by Moody’s and AA by Fitch.
Financial position on defined benefit pension schemes The Group currently operates three defined benefit schemes in the UK, of which by far the largest is the Prudential Staff Pension Scheme (PSPS) and two smaller schemes, Scottish Amicable (SAPS) and M&G.
Defined benefit schemes in the UK are generally required to be subject to a full actuarial valuation every three years, in order to assess the appropriate level of funding for schemes in relation to their commitments. The valuations of PSPS as at 5 April 2008 and SAPS as at 31 March 2008 were finalised in the second quarter of 2009. The valuation of the M&G pension scheme as at 31 December 2008 was finalised in January 2010. The valuation of PSPS demonstrated the scheme to be 106 per cent funded by reference to the Scheme Solvency Target that forms the basis of the scheme’s funding objective. No formal deficit plan was required. However, in recognition of the fall in value of the Scheme’s investments between 5 April 2008 and the completion of the actuarial valuation, additional funding akin to deficit funding was agreed by the Trustees. This is subject to
reassessment when the next valuation is completed. The total contributions being currently made by the Group into the scheme, representing the annual accrual cost and deficit funding, are £50 million per annum. Deficit funding for PSPS is apportioned in the ratio of 70/30 between the PAC with-profits fund and shareholder-backed operations.
The actuarial valuation of SAPS as at 31 March 2008 demonstrated the scheme to be 91 per cent funded, representing a deficit of £38 million. Based on this valuation and subsequent agreements with the Trustees, £13.1 million per annum of deficit funding is currently being paid into the scheme. The next triennial valuations for the PSPS and SAPS schemes are scheduled to take place as at 5 April 2011 and 31 March 2011 respectively.
The actuarial valuation of the M&G pension scheme as at 31 December 2008 demonstrated the scheme to be 76 per cent funded, representing a deficit of £51 million. Based on this valuation, deficit funding amounts designed to eliminate the actuarial deficit over a five year period have been agreed with £14.1 million being paid in each of 2010 and 2011 and £9.3 million per annum for the subsequent three years.
The valuation basis under IAS 19 for the Group financial statements differs markedly from the full triennial actuarial valuation basis. In particular, reflecting the trust deed provisions over distributions, the net underlying surplus of £421 million for PSPS is not recognised. As at 31 December 2010, on the Group IFRS statement of financial position, the shareholders’ share of the liabilities for these UK schemes amounted to a £83 million liability net of related tax relief. The total share attributable to the PAC with-profits fund amounted to a liability of £99 million net of related tax relief.
Changes to Group holdings during the periodDuring 2010 we completed the acquisition of UOB Life for total cash consideration, of SGD 495 million (£220 million), giving rise to goodwill of £141 million. This acquisition accompanied a long-term strategic partnership with UOB facilitating distribution of Prudential’s life insurance products through UOB’s bank branches in Singapore, Indonesia and Thailand.
We also announced the acquisition of Standard Life Healthcare by our PruHealth joint venture partner Discovery and its combination with the existing PruHealth business. This led to a reduction in our shareholding in the enlarged combined businesses from 50 per cent to 25 per cent effective from 1 August, the date of the acquisition. The effects on our EEV and IFRS accounting are as previously set out in this review.
Financial instrumentsThe Group is exposed to financial risk through its financial assets, financial liabilities, and policyholder liabilities. The key financial risk factors that affect the Group include market risk, credit risk and liquidity risk. Information on the Group’s exposure to financial risk factors, and our financial risk management objectives and policies, is provided both in our Risk and Capital Management section of the Business Review and the financial statements. Further information on the sensitivity of the Group’s financial instruments to market risk and its use of derivatives is also provided in the financial statements.

80
Prudential plc Annual Report 2010
As a provider of financial services, including insurance, the management of risk lies at the heart of our business. As a result, effective risk management capabilities represent a key source of competitive advantage for our Group.
The Group’s risk appetite framework sets out our appetite for risk exposures as well as our approach to risk management and return optimisation. Under this approach, we monitor our risk profile continuously against agreed limits. Our main strategies for managing and mitigating risk include asset liability management, using derivatives to hedge relevant market risks, and implementing reinsurance and corporate insurance programmes.
Risk oversightGroup risk appetite We define and monitor aggregate risk limits for our earnings volatility and our capital requirements based on financial and non-financial stresses:
(a) Earnings volatility: the objectives of the limits are to ensure that, (a) the volatility of our earnings is consistent with our stakeholders’ expectations, (b) the Group has adequate earnings (and cash flows) to service debt, expected dividends and to withstand unexpected shocks, and (c) earnings (and cash flows) are managed properly across geographies and are consistent with our funding strategies. The two measures we apply to monitor the volatility of our earnings are European Embedded Value (EEV) operating profit and International Financial Reporting Standards (IFRS) operating profit, although EEV and IFRS total profits are also considered.
(b) Capital requirements: the limits aim to ensure that, (a) the Group meets its capital requirements at all times including EU Insurance Groups Directive (IGD) capital requirements, (b) the Group achieves its desired target rating to meet its business objectives, and (c) supervisory intervention is avoided. In addition, we also monitor capital requirements on a local statutory basis.
Our risk appetite framework forms an integral part of our annual business planning cycle. Our Group Risk function monitors the Group’s risk profile against the agreed limits. Using submissions from business units, Group Risk calculates the Group’s aggregated position (allowing for diversification effects between business units) relative to the limits implied by the risk appetite statements.
We use a two-tier approach to apply the limits at business unit level. Firstly, we calculate business unit risk limits. These ensure that, provided each business unit keeps within its limits, the Group risk position will remain within the Group limits. Secondly, the impact on the risk position is considered as part of Group Risk’s scrutiny of large transactions or departures from plan proposed by individual business units.
In the event that the business unit plans imply risk limits will be exceeded, this will necessitate a dialogue between the executive and the relevant business unit or units. Exceeding Group limits may be avoided if, for example, limits in other business units are not fully utilised, or if the diversification effect at Group level of a particular risk with other business units means the Group limit is not breached.
Market risk is managed such that as conditions evolve the risk profile is maintained within risk appetite. In addition to business unit operational limits on credit risk, we set counterparty risk limits at Group level. The limits on our total Group-wide exposures to a single counterparty are specified within different credit rating ‘categories’. The Group Risk and the Group Credit Risk Committee monitor our actual exposures against these limits on at least a monthly basis, escalating matters to Group Executive Risk Committee (GERC) as appropriate.
Risk exposuresThe Group Risk Framework deploys a common risk language, allowing meaningful comparisons to be made between different business units. Risks are broadly categorised as shown opposite.
The key financial and non-financial risks and uncertainties faced by the Group, and our approaches to managing them, are described below.
1 Financial risksa Market riski Equity risk In the UK business, most of our equity exposure is incurred in the with-profits fund, which includes a large inherited estate estimated at £6.8 billion as at 31 December 2010 (2009: £6.4 billion), which can absorb market fluctuations and protect the fund’s solvency. The inherited estate itself is partially protected against falls in equity markets through an active hedging policy.
In Asia, a high proportion of our in-force book is made up of unit-linked products with limited shareholder exposure to equities. We have minimal direct shareholder exposure to Asian equity markets outside our unit-linked holdings.
In the US, where we are a leading provider of variable annuities, there are well-understood risks associated with the guarantees embedded in our products. We provide guaranteed minimum death benefits (GMDB) on all policies in this class, guaranteed minimum withdrawal benefits (GMWB) on 64 per cent of the book, and guaranteed minimum income benefits (GMIB) on only six per cent. To protect the shareholders against the volatility introduced by these embedded options, we use both a comprehensive hedging programme and reinsurance. Due to the inability to economically reinsure or hedge the GMIB, Jackson ceased offering this benefit in 2009.
RISK AND CAPITAL MANAGEMENT
BUSINESS REVIEW > RISK AND CAPITAL MANAGEMENT

81B
US
INE
SS
RE
VIE
W
In our variable annuity sales activities, we focus on meeting the needs of conservative and risk averse customers who are seeking reliable income in retirement, and who display little tendency to arbitrage their guarantees. These customers generally select conservative investment options. We are able to meet the needs of these customers because our unique and market-leading operational platform allows us to tailor more than 3,400 product combinations.
It is our philosophy not to compete on price. Our individual guarantees tend to be more expensive than the market average because we seek to sell at a price capable of funding the cost we incur to hedge or reinsure our risks.
We use a macro approach to hedging that covers the entire risk in the US business. Within this macro approach we make use of the natural offsets that exist between the variable annuity guarantees and the fixed index annuity book, and then use a combination of OTC options and futures to hedge the residual risk, allowing for significant market shocks and limiting the amount of capital we are putting at risk. Internal positions are generally netted before any external hedge positions are considered. The hedging programme also covers the fees on variable annuity guarantees.
Jackson hedges the economics of its products rather than the accounting result. This focus means that we sometimes accept a degree of variability in our accounting results in order to ensure we achieve the appropriate economic result. Accordingly, while its hedges are effective on an economic basis, due to different accounting treatment for the hedges and some of the underlying
hedged items on an IFRS basis, the reported income effect is more variable. As previously highlighted, this resulted in a negative net equity hedge accounting effect of £367 million in the period (net of related DAC amortisation) as compared to an equivalent negative effect of £159 million in 2009. During 2010, we reclassified these effects from operating profit based on longer-term investment returns to short-term fluctuations to ensure the Group’s operating results better reflect Jackson’s continued focus on optimising economic value.
ii Interest rate riskInterest rate risk arises primarily from Prudential’s investments in long-term debt and fixed income securities. Interest rate risk also exists in policies that carry investment guarantees on early surrender or at maturity, where claim values can become higher than the value of backing assets as a result of rises or falls in interest rates.
In the US, there is interest rate risk across the portfolio. The majority of Jackson’s fixed annuity and life liabilities allow for an annual reset of the crediting rate, which provides for a greater level of discretion in determining the amount of interest rate risk to assume. The primary concerns with these liabilities relate to potential surrenders when rates increase and, in a low interest environment, the minimum guarantees required by state law. With its large fixed annuity and fixed index annuity books, Jackson has natural offsets for its variable annuity interest-rate related risks. Jackson manages interest rate exposure through a combination of interest rate swaps and interest rate options.
CATEGORY RISK TYPE DEFINITION
FINANCIAL RISKS Market risk • The risk that arises from adverse changes in the value of, or income from, assets and changes in interest rates or exchange rates.
Credit risk • The risk of loss if another party fails to meet its obligations, or fails to do so in a timely fashion.
Insurance risk • The inherent uncertainty as to the occurrence, amount and timing of insurance liabilities. This includes adverse mortality, morbidity and persistency experience.
Liquidity risk • The risk that a business, though solvent on a balance sheet basis, either does not have the financial resources to meet its obligations as they fall due or can secure them only at excessive cost.
NON-FINANCIAL
RISKS
Operational risk • The risk of direct or indirect loss resulting from inadequate or failed internal processes, people or systems, or from external events. This includes legal and regulatory compliance risk.
Business environment risk • Exposure to forces in the external environment that could significantly change the fundamentals that drive the business’s overall objectives and strategy.
Strategic risk • Ineffective, inefficient or inadequate senior management processes for the development and implementation of business strategy in relation to the business environment and the Group’s capabilities.

82
Prudential plc Annual Report 2010
RISK AND CAPITAL MANAGEMENT
BUSINESS REVIEW > RISK AND CAPITAL MANAGEMENT > CONTINUED
In the UK, the investment policy for the shareholder-backed annuity business is to match the cash flows from investments with the annuity payments. As a result, assets and liabilities are closely matched by duration. The impact on profit of any residual cash flow mismatching can be adversely affected by changes in interest rates; therefore the mismatching position is regularly monitored.
The exposure to interest rate risk arising from Asia is at modest levels.
iii Foreign exchange risk Prudential principally operates in the UK, the US, and in 13 countries in Asia. The geographical diversity of our businesses means that we are inevitably subject to the risk of exchange rate fluctuations. Prudential’s international operations in the US and Asia, which represent a significant proportion of our operating profit and shareholders’ funds, generally write policies and invest in assets denominated in local currency. Although this practice limits the effect of exchange rate fluctuations on local operating results, it can lead to significant fluctuations in our consolidated financial statements when results are expressed in pounds sterling.
We do not generally seek to hedge foreign currency revenues, as these are substantially retained locally to support the growth of the Group’s business and meet local regulatory and market requirements. However, in cases where a surplus arising in an overseas operation supports Group capital or shareholders’ interest, this exposure is hedged if it is economically optimal to do so. Currency borrowings, swaps and other derivatives are used to manage exposures.
b Credit riskIn addition to business unit operational limits on credit risk, we monitor closely our counterparty exposures at Group level, highlighting those that are large or of concern. Where appropriate, we will reduce our exposure, purchase credit protection or make use of collateral arrangements to control our levels of credit risk.
Debt portfolioOur debt portfolio on an IFRS basis was £116.4 billion at 31 December 2010. £54.0 billion of these assets backed shareholder business, of which 95 per cent were investment grade, compared to 93 per cent at 31 December 2009. Sovereign debt represented 16 per cent of the debt portfolio backing shareholder business, or £8.8 billion, at 31 December 2010. Exposures to sovereign debt have increased since December 2009 due mainly to an enlarged position in US Treasuries. 73 per cent of this was rated AAA and 93 per cent investment grade. Eurozone sovereign exposures backing shareholder business were £3.6 billion at 31 December 2010,
of which 99 per cent were AAA rated. Of the remaining one per cent, the highest exposure was in respect of Italy (£52 million) and Spain (less than £1 million) whilst there was no sovereign exposure to Greece, Portugal or Ireland. The total banking exposure to Portugal, Ireland, Italy, Greece and Spain (PIIGS) was £363 million at 31 December 2010.
AsiaAsia’s debt portfolio totalled £14.1 billion at 31 December 2010. Of this, approximately 69 per cent was in unit-linked and with-profits funds with minimal shareholders’ risk. The remaining 31 per cent is shareholder exposure and is invested predominantly (84 per cent) in investment grade bonds. For Asia, the portfolio has performed very well, and did not experience any default losses in 2010.
UKThe UK’s debt portfolio on an IFRS basis is £74.3 billion as at 31 December 2010, including £46.5 billion within the UK with-profits fund. Shareholders’ risk exposure to the with-profits fund is limited as the solvency is protected by the large inherited estate. Outside the with-profits fund there is £6.0 billion in unit-linked funds where the shareholders’ risk is limited, with the remaining £21.8 billion backing the shareholders’ annuity business and other non-linked business (of which 80 per cent is rated AAA to A, 18 per cent BBB and two per cent non-investment grade).
On a statutory (Pillar 1) basis at 31 December 2010, we held prudent credit reserves within the UK shareholder annuity funds of £1.8 billion to allow for future credit risk. For Prudential Retirement Income Limited (PRIL) this allowance is set at 68 bps decrease in the valuation discount rate at 31 December 2010 (2009: 71 bps). This now represents 43 per cent of the portfolio spread over swaps compared to 41 per cent as at 31 December 2009. No defaults were reported on the debt portfolio held by the UK shareholder backed annuity business in 2010.
During 2010, we continued to materially reduce our holdings in subordinated financial debt backing our annuity business, improving the overall credit quality of our bond portfolios. This has resulted in gross losses of £104 million on shareholder-backed business and £62 million on policyholder-backed business in the period. On a Pillar I basis these losses have been fully offset by a reduction in long-term default reserves of £98 million shareholder/£39 million policyholder that arose as a result of the improvement in the quality of our remaining bond portfolios and a further release of short-term default reserves of £6 million shareholder and £23 million policyholder, which were allocated to the assets sold. On an IFRS basis, the gross costs less the reduction in long-term and short-term default reserves resulted in a small overall pre-tax loss to operating profit of £4 million to shareholders and £15 million to policyholders.

83B
US
INE
SS
RE
VIE
W
USThe most significant area of exposure to credit risk for the shareholders is Jackson in the US. At 31 December 2010 Jackson’s fixed income portfolio totalling £26.4 billion, comprised £20.2 billion corporate and government debt, £2.8 billion of Residential Mortgage-Backed Securities (RMBS), £2.4 billion of Commercial Mortgage-Backed Securities (CMBS) and £1 billion of other instruments.
The US corporate and government debt portfolio of £20.2 billion is comprised of £17.8 billion of corporate debt and £2.4 billion of government debt. Of the £17.8 billion of corporate debt 95 per cent is investment grade. Concentration risk within the corporate debt portfolio is low, with the top ten holdings accounting for approximately eight per cent of the portfolio. Our largest sector exposures in the investment grade corporate debt portfolio are Utilities and Energy at 16 per cent and 15 per cent respectively. We actively manage the portfolio and will sell exposures as events dictate.
Within the RMBS portfolio of £2.8 billion, the agency guaranteed portion is 55 per cent. Another 22 per cent of the portfolio is non-agency prime and Alt-A investments with pre-2006/2007 vintages, where experience has been much more positive than later vintages. Our exposure to the 2006/2007 vintages totals £424 million of which £413 million is invested in the senior part of the capital structure, thereby significantly reducing the risk of defaults and the magnitude of loss if a shortfall does occur. The actual exposure to non-senior 2006/2007 Prime and Alt-A RMBS is only £11 million. The total RMBS portfolio has an average fair value price of 88 cents on the dollar.
The CMBS portfolio of £2.4 billion is performing strongly, with 36 per cent of the portfolio rated AAA and one per cent rated below investment grade. The entire portfolio has an average credit enhancement level of 30 per cent. This level provides significant protection, since it means the bond has to incur a 30 per cent loss, net of recoveries, before we are at risk.
In Jackson, total amounts charged to profits relating to debt securities were £213 million (2009: £631 million). This is net of recoveries/reversals recognised in the year of £10 million (2009: £5 million).
In 2010, Jackson’s total defaults were £nil (2009: less than £1 million). In addition, as part of our active management of the book, we incurred losses net of recoveries and reversals of £89 million (2009: less than £1 million) on credit-related sales of impaired bonds.
IFRS write-downs excluding defaults for the year were £124 million compared to £630 million in 2009. Of this amount £71 million (2009: £509 million) was in respect of RMBS securities.
The impairment process reflects a rigorous review of every bond and security in our portfolio. Our accounting policy requires us to book full mark to market losses on impaired securities through our income statement. However, we would expect only a proportion of these losses eventually to turn into defaults, and some of the impaired securities to recover in price over time.
Unrealised gains and losses on debt securities in the USJackson’s net unrealised gains from debt securities has steadily improved from negative £2,897 million at 31 December 2008 to positive £4 million at 31 December 2009 to positive £1,210 million at 31 December 2010. The gross unrealised loss position moved from £966 million at 31 December 2009 to £370 million at 31 December 2010. Gross unrealised losses on securities priced at less than 80 per cent of face value totalled £224 million at 31 December 2010 compared to £594 million at 31 December 2009.
Asset managementThe debt portfolio of the Group’s asset management operations of £1.6 billion as at 31 December 2010 is principally related to Prudential Capital operations. Of this amount £1.5 billion were rated AAA to A- by S&P or Aaa by Moody’s.
Loans Of the total Group loans of £9.3 billion at 31 December 2010, £7.1 billion are held by shareholder-backed operations comprised of £4.7 billion commercial mortgage loans and £2.4 billion of other loans.
Of the £7.1 billion held by shareholder-backed operations, the Asian insurance operations held £0.5 billion of other loans, the majority of which are commercial loans held by the Malaysian operation that are rated investment grade by two local rating agencies. The US insurance operations held £4.2 billion of loans, comprising £3.6 billion of commercial mortgage loans, all of which are collateralised by properties, and £0.5 billion of policy loans. The US commercial mortgage loan portfolio does not include any single-family residential mortgage loans and therefore is not exposed to the risk of defaults associated with residential sub-prime mortgage loans. The UK insurance operations held £1.0 billion of loans, the majority of which are mortgage loans collateralised by properties.

84
Prudential plc Annual Report 2010
RISK AND CAPITAL MANAGEMENT
BUSINESS REVIEW > RISK AND CAPITAL MANAGEMENT > CONTINUED
The balance of the total shareholder loans amounts to £1.4 billion and relates to bridging loan finance managed by Prudential Capital.
c Insurance risk The processes of determining the price of our products and reporting the results of our long-term business operations require us to make a number of assumptions. In common with other industry players, the profitability of our businesses depends on a mix of factors including mortality and morbidity trends, persistency, investment performance, unit cost of administration and new business acquisition expenses.
We continue to conduct rigorous research into longevity risk using data from our substantial annuity portfolio. The assumptions that Prudential makes about future expected levels of mortality are particularly relevant in its UK annuity business. The attractiveness of reinsurance is regularly evaluated. It is used as a risk management tool where it is appropriate and attractive to do so.
Prudential’s persistency assumptions reflect recent experience for each relevant line of business, and any expectations of future persistency. Persistency risk is mitigated by appropriate training and sales processes and managed proactively post sale. Where appropriate, allowance is also made for the relationship – either assumed or historically observed – between persistency and investment returns, and for the resulting additional risk.
d Liquidity risk The holding company has significant internal sources of liquidity which are sufficient to meet all of our expected requirements for the foreseeable future without having to make use of external funding. In aggregate the Group has £2.1 billion of undrawn committed facilities, expiring between 2011 and 2015. In addition, the Group has access to liquidity via the debt capital markets. Recent issues include a £250 million senior three-year MTN in 2010 and the US$550 million perpetual subordinated Tier 1 securities issued in January 2011. Prudential also has in place an unlimited commercial paper programme and has maintained a consistent presence as an issuer in this market for the last 10 years. Liquidity uses and sources have been assessed at a business unit level under base case and stressed assumptions. The liquidity resources available and the subsequent Liquidity Coverage Ratio (LCR) have been assessed to be sufficient under both sets of assumptions.
2 Non-financial riskPrudential is exposed to operational, business environment and strategic risk in the course of running its businesses.
With regard to operational risk, the Group is dependent on processing a large number of complex transactions across numerous and diverse products, and is subject to a number of different legal and regulatory, including tax, regimes. Prudential also has a significant number of third-party relationships that are important to the distribution and processing of our products, both as market counterparties and as business partners. This results in reliance upon the operational performance of these outsourcing partners.
Prudential’s systems and processes incorporate controls that are designed to manage and mitigate the operational risks associated with its activities. The Prudential Group Governance Manual was developed to make a key contribution to the sound system of internal control that the Group is expected to maintain under the Combined Code of Corporate Governance in the UK and the Hong Kong Code on Corporate Governance Practices. Business units confirm that they have implemented the necessary controls to evidence compliance with the Manual.
The Group also has an operational risk management framework in place that facilitates both the qualitative and quantitative analysis of operational risk exposures. The output of this framework, in particular management information on key operational risk components such as risk and control assessments, internal incidents and external incidents, is reported by the business operations and presented to the Group Operational Risk Committee. This information also supports business decision-making and lessons-learned activities; the ongoing improvement of the control environment; the informing of overall levels of capital held; and determination of the adequacy of Prudential’s corporate insurance programme.
With regard to business environment risk, the Group has a wide-ranging programme of active and constructive engagement with governments, policymakers and regulators in our key markets and with relevant international institutions. Such engagement is undertaken both directly and indirectly via trade associations. The Group has procedures in place to monitor and track political and regulatory developments. Where appropriate, we provide submissions and technical input to officials and others, either via submissions to formal consultations or through interactions with officials.

85B
US
INE
SS
RE
VIE
W
With regard to strategic risk, both business operations and the corporate centre are required to adopt a forward-looking approach to risk management by performing risk assessments as part of the annual strategic planning process. This supports the identification of potential threats and the initiatives needed to address them, as well as competitive opportunities. The impact on the underlying businesses and/or Group-wide risk profile is also considered to ensure that strategic initiatives are within the Group's risk appetite.
3 Risk factors and contingenciesOur disclosures covering risk factors can be found at the end of this document. Note H14 of the IFRS basis consolidated financial statements gives an update on the position for contingencies of the Group since those published in the 2009 Annual Report.
Capital management Regulatory capital (IGD)Prudential is subject to the capital adequacy requirements of the European Union (EU) Insurance Groups Directive (IGD) as implemented by the Financial Services Authority (FSA) in the UK. The IGD capital adequacy requirements involve aggregating surplus capital held in our regulated subsidiaries, from which Group borrowings, except those subordinated debt issues that qualify as capital, are deducted. No credit for the benefit of diversification is permitted under this approach.
Our capital position remains strong. We have continued to place emphasis on maintaining the Group’s financial strength through optimising the balance between writing profitable new business, conserving capital and generating cash. We estimate that our IGD capital surplus was £4.3 billion at 31 December 2010 (before taking into account the 2010 final dividend), covering our capital requirements 3.0 times. This compares to a capital surplus of £3.4 billion at the end of 2009 (before taking into account the 2009 final dividend).
The movements during 2010 mainly comprise:
• Net capital generation mainly through operating earnings (in-force releases less investment in new business) of £1.7 billion;
• Release of tax provisions of £0.2 billion;• Foreign exchange movements of positive £0.1 billion;
Offset by:
• Final 2009 dividend, net of scrip, of £0.3 billion and interim 2010 dividend, net of scrip, of £0.1 billion;
• Inadmissible assets arising on the purchase of UOB’s life insurance subsidiary in Singapore of £0.2 billion;
• Impact of costs incurred in relation to the terminated AIA acquisition, net of tax, of £0.3 billion; and
• External financing costs and other central costs, net of tax, of £0.2 billion.
We continue to have further options available to us to manage available and required capital. These could take the form of increasing available capital (for example, through financial reinsurance) or reducing required capital (for example, through the mix and level of new business) and the use of other risk mitigation measures such as hedging and reinsurance.
In addition to our strong capital position, on a statutory (Pillar 1) basis, the total credit reserve for the UK shareholder annuity funds also protects our capital position in excess of the IGD surplus. This credit reserve as at 31 December 2010 was £1.8 billion. This represents 43 per cent of the portfolio spread over swaps, compared to 41 per cent as at 31 December 2009.
Stress Testing As at 31 December 2010, stress testing of our IGD capital position to various events has the following results:
• An instantaneous 20 per cent fall in equity markets from 31 December 2010 levels would reduce the IGD surplus by £200 million;
• A 40 per cent fall in equity markets (comprising an instantaneous 20 per cent fall followed by a further 20 per cent fall over a four-week period) would reduce the IGD surplus by £650 million;
• A 150 bps reduction (subject to a floor of zero) in interest rates would reduce the IGD surplus by £500 million; and
• Credit defaults of ten times the expected level would reduce IGD surplus by £550 million.
We believe that the results of these stress tests, together with the Group’s strong underlying earnings capacity, our established hedging programmes and our additional areas of financial flexibility, demonstrate that we are in a position to withstand significant deterioration in market conditions.
We also use an economic capital assessment to monitor our capital requirements across the Group, allowing for realistic diversification benefits and continue to maintain a strong position. This assessment provides valuable insights into our risk profile.
Solvency II The European Union (EU) is developing a new solvency framework for insurance companies, referred to as ‘Solvency II’. The Solvency II Directive, which sets out the new framework, was formally approved by the Economic and Financial Affairs Council in November 2009 and is expected to be implemented from 1 January 2013. The new approach is based on the concept of three pillars – minimum capital requirements, supervisory review of firms’ assessments of risk, and enhanced disclosure requirements.

86
Prudential plc Annual Report 2010
RISK AND CAPITAL MANAGEMENT
Specifically, Pillar 1 covers the quantitative requirements around own funds, valuation rules for assets and liabilities and capital requirements. Pillar 2 provides the qualitative requirements for risk management, governance and controls, including the requirement for insurers to submit an Own Risk and Solvency Assessment (ORSA) which will be used by the regulator as part of the supervisory review process. Pillar 3 deals with the enhanced requirements for supervisory reporting and public disclosure.
A key aspect of Solvency II is that the assessment of risks and capital requirements will be aligned more closely with economic capital methodologies. Companies may be allowed to make use of internal economic capital models if approved by the local regulator.
The European Commission is in the process of consulting on the detailed rules that complement the high-level principles in the Directive, referred to as ‘implementing measures', which are not expected to be finalised before late 2011.
In particular, the Committee of European Insurance and Occupational Pensions Supervisors (CEIOPS) published a number of consultation papers in 2009 and 2010 covering advice to the European Commission on the implementing measures but there remains significant uncertainty regarding the outcome from this process. Prudential is actively participating in shaping the outcome through our involvement in industry bodies and trade associations, including the Chief Risk Officer and Chief Financial Officer Forums, together with the Association of British Insurers (ABI) and the Comité Européen des Assurances (CEA). In addition, further guidance and technical standards are currently being developed by the European Insurance and Occupational Pensions Authority (EIOPA). These are expected to be subject to a formal consultation in mid-2011 and finalised by early 2012.
Many of the issues being actively debated have received considerable focus both within the industry and from national bodies. However, the application of Solvency II to international groups is still unclear and there remains a risk of inconsistent application, which may place Prudential at a competitive disadvantage to other European and non-European financial services groups. There is also a risk that the effect of the measures finally adopted could be adverse for the Group, including potentially a significant increase in capital required to support its business.
Having assessed the high-level requirements of Solvency II, an implementation programme was initiated with dedicated teams to manage the required work across the Group. The activity of the local Solvency II teams is being coordinated centrally to achieve consistency in the understanding and application of the requirements.
Over the coming months we will be progressing our implementation plans further and remaining in regular contact with the FSA as we continue to engage in the ‘pre-application’ stage of the approval process for the internal model.
Capital allocation Prudential’s approach to capital allocation takes into account a range of factors, especially risk adjusted returns on capital, the impact of alternative capital measurement bases (accounting, regulatory, economic and ratings agency assessments), tax efficiency, and wider strategic objectives.
We optimise capital allocation across the Group by using a consistent set of capital performance metrics across all business units to ensure meaningful comparison. Capital utilisation, return on capital and new business value creation are measured at a product level. The use of these capital performance metrics is embedded into our decision-making processes for product design and product pricing.
Our capital performance metrics are based on economic capital, which provides a view of our capital requirements across the Group, allowing for realistic diversification benefits. Economic capital also provides valuable insights into our risk profile and is used both for risk measurement and capital management.
Risk mitigation and hedging We manage our actual risk profile against our tolerance of risk. To do this, we maintain risk registers that include details of the risks we have identified and of the controls and mitigating actions we employ in managing them. Any mitigation strategies involving large transactions − such as a material derivative transaction − are subject to review at Group level before implementation.
We use a range of risk management and mitigation strategies. The most important of these include: adjusting asset portfolios to reduce investment risks (such as duration mismatches or overweight counterparty exposures); using derivatives to hedge market risks; implementing reinsurance programmes to limit insurance risk; implementing corporate insurance programmes to limit the impact of operational risks; and revising business plans where appropriate.
BUSINESS REVIEW > RISK AND CAPITAL MANAGEMENT > CONTINUED

87B
US
INE
SS
RE
VIE
W
OTHER CORPORATE INFORMATION
BUSINESS REVIEW > OTHER CORPORATE INFORMATION
Products and drivers of insurance operations’ profits Overview of the Group’s principal activities Prudential plc is the holding company of the Prudential Group. The principal activity of our subsidiary operations is the provision of financial services to individuals and businesses in Asia, the US and UK. We offer a wide range of retail financial products and services and asset management services throughout these territories. The retail financial products and services principally include life insurance, pensions and annuities as well as collective investment schemes.
Asia The life insurance products offered by Prudential Corporation Asia include with-profits (participating) and non-participating term, whole life and endowment and unit-linked policies. To supplement our life products we also offer health, disablement, critical illness and accident cover.
The primary focus in Asia is regular premium products that provide both savings and protection benefits.
In 2010, the new business profit mix in our Asian insurance business was derived 59 per cent (2009: 56 per cent) from health and protection products, 32 per cent (2009: 31 per cent) from unit-linked products and nine per cent (2009: 13 per cent) from non-linked products.
Unit-linked products combine savings with protection, with the cash value of the policy depending on the value of the underlying unitised funds. Participating products provide savings with protection where the basic sum assured can be enhanced by a profit share (or bonus) from the underlying fund as determined at the discretion of the insurer. Non-participating products offer savings with protection where the benefits are guaranteed or determined by a set of defined market-related parameters. Accident and health products provide mortality or morbidity benefits and include health, disablement, critical illness and accident cover. These products are commonly offered as supplements to main life policies, but can also be sold separately.
Policyholder and insurer share the profits from participating policies (typically in a 90:10 ratio) in the same way as with-profits business in the UK. With unit-linked products, shareholders receive the profits arising from managing the policy, its investments and the insurance risk. Policyholders within the underlying unitised fund receive investment gains. The profits from accident and health and non-participating products come from any surplus remaining after paying policy benefits.
Unit-linked products tend to have higher profits on the EEV basis of reporting than traditional non-linked products, as expenses and charges are better matched and solvency capital requirements are lower. At the end of 2010, we were offering unit-linked products in 10 of the 11 countries in Asia in which we operate, with the only exception being Thailand.
In Malaysia and Indonesia, Prudential also offers life insurance policies that are constructed to comply with Islamic principles otherwise known as Takaful. The main principles are policyholders co-operate amongst themselves for the common good, uncertainty is eliminated in respect of subscription and compensation and there is no investment in prohibited areas such as gambling or alcohol.
In addition to the life products described above, we offer mutual fund investment products in India, Taiwan, Japan, Singapore, Malaysia, Hong Kong, Korea, Vietnam and China, thus enabling customers to participate in debt, equity and money market investments. We are also licensed in the United Arab Emirates. Prudential Corporation Asia earns a fee based on assets under management.
United StatesJackson’s product offerings include variable, fixed and fixed index annuities, as well as life insurance and institutional products.
AnnuitiesAnnuity products are long-term individual retirement products, which offer tax-deferred accumulation on the funds invested until proceeds are withdrawn from the policy.
Fixed annuities are used for asset accumulation in retirement planning and for providing income in retirement and offer flexible payout options. The contract holder pays us a premium, which is credited to the contract holder’s account. Periodically, interest is credited to the contract holder’s account and administrative charges are deducted. The interest rate may be reset on each contract anniversary, subject to a guaranteed minimum, in line with state regulations. When the annuity matures, the contract holder is paid either the amount in the contract holder account or staggered payments in the form of an immediate annuity – similar to a UK annuity in payment.

88
Prudential plc Annual Report 2010
OTHER CORPORATE INFORMATION
BUSINESS REVIEW > OTHER CORPORATE INFORMATION > CONTINUED
Fixed annuity policies are subject to early surrender charges for the first six to nine years of the contract. In addition, the contract may be subject to a market value adjustment at the time of surrender. During the surrender charge period, the contract holder may cancel the contract for the surrender value. Our profits on fixed annuities come primarily from the spread between the return earned on investments and the interest credited to the contract holder’s account, less expenses. Fixed annuities continue to be a profitable book of business, benefiting from favourable spread income in recent years.
Fixed index annuities are similar to fixed annuities, in that the contract holder pays a premium that is credited to the contract holder’s account, and also in that interest is periodically credited to the contract holder’s account. An annual minimum interest rate is guaranteed, although actual interest credited may be higher and is linked to an equity index over the product’s index option period. Profit comes primarily from the spread between the return earned on investments and the amounts credited to the contract holder’s account, less expenses, which include the costs of hedging the equity component of the interest credited to the contract. As previously described, hedge results are reflected in short-term fluctuations. Fixed index annuities are subject to early surrender charges for the first five to twelve years of the contract. During the surrender charge period, the contract holder may cancel the contract for the surrender value. Fixed index annuities continue to be a profitable product, benefiting from favourable spread and the effective management of equity risk. The fixed index book provides natural offsetting equity exposure to the guarantees issued in connection with our variable annuity products, which allows for efficient hedging of the net equity exposure.
Variable annuities are tax-advantaged, deferred annuities where the rate of return depends upon the performance of the underlying investment portfolio, similar in principle to UK unit-linked products. They are also used for asset accumulation in retirement planning and to provide income in retirement.
The contract holder can allocate the premiums between a variety of variable sub-accounts, with a choice of fund managers and/or guaranteed fixed-rate options. As with a unit-linked fund, the contract holder’s premiums allocated to the variable accounts are held separately from Jackson’s general account assets. The value of the portion of the separate account allocated to variable sub-accounts fluctuates with the underlying investments. Variable annuity policies are subject to early surrender charges for the first four to seven years of the contract. During the surrender charge period, the contract holder may cancel the contract for the surrender value. Jackson offers one variable annuity that has no surrender charges and also offers a choice of guaranteed benefit options within their variable annuity product portfolio, which customers can elect and pay for. These options
include the guaranteed minimum death benefit (GMDB), which guarantees that, upon death of the annuitant, the contract holder or beneficiary receives a minimum value regardless of past market performance. These guaranteed death benefits might be expressed as the return of original premium, the highest past anniversary value of the contract, or as the original premium accumulated at a fixed rate of interest. In addition, there are three other types of guarantees: guaranteed minimum withdrawal benefits (GMWB), guaranteed minimum accumulation benefits (GMAB) and guaranteed minimum income benefits (GMIB). Due to the lack of availability to economically reinsure or hedge new issues of GMIB, Jackson discontinued offering it in 2009.
GMWBs provide a guaranteed return of the principal invested by allowing for periodic withdrawals that are limited to a maximum percentage of the initial premium. One version of the GMWBs provides for a minimum annual withdrawal amount that is guaranteed for the contract holder’s life without annuitisation. Variations of the GMWBs are offered whereby the guaranteed base can be increased, either through step-ups to a more recent market value of the account, or through bonuses offered if withdrawals are delayed for a particular number of years. Additional charges are assessed for these features. GMABs generally provide a guarantee for a return of a certain amount of principal after a specified period. GMIBs provide for a minimum level of benefits upon annuitisation regardless of the value of the investments underlying the contract at the time of annuitisation. The GMIB is reinsured.
As the investment return on the separate account assets is attributed directly to the contract holders, Jackson’s profit arises from the fees charged on the contracts, less the expenses incurred, which include the costs of hedging the guarantees. As previously described, hedge results are reflected in short-term fluctuations. In addition to being a profitable book of business in its own right, the variable annuity book also provides an opportunity to utilise the offsetting equity risk among various lines of business to cost effectively manage our equity exposure. It is believed that the internal management of equity risk, coupled with the use of external derivative instruments where necessary, continues to provide a cost-effective method of managing equity exposure. Profits in the variable annuity book of business will continue to be subject to the impact of market movements on both sales and allocations to the variable accounts and the effects of the economic hedging programme. While risk is hedged on an economic basis, the nature and duration of the hedging instruments, which are recorded at fair value through the income statement, will fluctuate and produce some accounting volatility. Management continues to believe that, on a long-term economic basis, the equity exposure remains well managed.

89B
US
INE
SS
RE
VIE
W
Life insuranceJackson also sells several types of life insurance including term life, universal life and variable universal life. Term life provides protection for a defined period of time and a benefit that is payable to a designated beneficiary upon the insured’s death. Universal life provides permanent individual life insurance for the life of the insured and includes a savings element. Variable universal life is a life insurance policy that combines death benefit protection and the important tax advantages of life insurance with the long-term growth potential of professionally managed investments. The Jackson life insurance book has also delivered consistent profitability, driven primarily by favourable mortality experience.
Institutional productsJackson’s institutional products division markets institutional products such as traditional Guaranteed Investment Contracts (GICs), Funding Agreements and Medium Term Note (MTN) funding agreements. The institutional product offerings also include Jackson’s funding agreements issued to the Federal Home Loan Bank. Institutional products are distributed directly to investors, through investment banks, or through funding agreement brokers. Jackson sold no institutional products during 2010 or 2009, as available capital was directed to support higher-margin variable annuity sales.
United KingdomIn common with other UK long-term insurance companies, Prudential UK’s products are structured as either with-profits (or participating) products, or non-participating products including annuities in payment and unit-linked products. Depending on the structure, the level of shareholders’ interest in the value of policies and the related profit or loss varies.
With-profits policies are supported by a with-profits sub-fund and can be single premium (for example, Onshore Bonds or Flexible Investment Bonds) or regular premium (for example, certain pension products).
The primary with-profits sub-fund is part of The Prudential Assurance Company Limited (PAC)’s long-term fund. The return to shareholders on virtually all with-profits products is in the form of a statutory transfer to PAC shareholders’ funds. This is analogous to a dividend from PAC’s long-term fund, and is dependent upon the bonuses credited or declared on policies in that year. In this context, there are two types of bonuses – ‘regular’ and ‘final’. Regular bonuses are declared regularly,
usually once a year, and are determined as a prudent proportion of the long-term expected future investment return on the underlying assets. Once credited, regular bonuses are guaranteed in accordance with the terms of the particular product. In contrast, ‘final’ bonuses are only guaranteed until the next bonus declaration, and are primarily determined on the actual smoothed investment return achieved over the life of the policy. Prudential’s with-profits policyholders currently receive 90 per cent of the distribution from the main with-profits sub-fund as bonus additions to their policies, while shareholders receive 10 per cent as a statutory transfer.
The Defined Charge Participating Sub-Fund (DCPSF) forms part of the PAC long-term fund. It is comprised of the accumulated investment content of premiums paid in respect of the defined charge participating with-profits business issued in France, the defined charge participating with-profits business reassured into PAC from Prudential International Assurance plc and Canada Life (Europe) Assurance Ltd and includes the portfolio of with-profit annuity policies acquired from Equitable Life in 2007. All profits in this fund accrue to policyholders in the DCPSF.
The profits from almost all of the new non-participating business accrue solely to shareholders. Such business is written in the non-profit sub-fund within PAC’s long-term fund, or in various shareholder-owned direct or indirect subsidiaries. The most significant of these is Prudential Retirement Income Limited (PRIL), which also writes all new immediate annuities arising from vesting deferred annuity policies in the with-profits sub-fund of PAC.
There is a substantial volume of in-force non-participating business in PAC’s with-profits sub-fund and that fund’s wholly-owned subsidiary Prudential Annuities Limited (PAL), which is closed to new business. Profits from this business accrue to the with-profits sub-fund.
Description of EEV basis reporting Prudential’s results are prepared on two accounting bases – the supplementary EEV basis, and the IFRS basis for the financial statements. Over the life of any given product, the total profit recognised will be the same under either the IFRS or the EEV basis. However, the two methods recognise the emergence of that profit in different ways, with profits emerging earlier under the EEV basis than under IFRS. This section explains how EEV differs from IFRS and why it is used.

90
Prudential plc Annual Report 2010
OTHER CORPORATE INFORMATION
BUSINESS REVIEW > OTHER CORPORATE INFORMATION > CONTINUED
In broad terms, IFRS profits for long-term business reflect the aggregate of statutory transfers from UK-style with-profits funds and profit on a traditional accounting basis for other long-term business. By their nature, the products sold by the life insurance industry are long-term, as insurance companies commit to service these products for many years into the future. The profit on these insurance sales is generated over this long-term period. In our view, the result under IFRS does not properly reflect the inherent value of these future profits, as it focuses instead on the amounts accruing to shareholders in the current year.
In May 2004 the CFO Forum, representing the Chief Financial Officers of 19 European insurers, published the European Embedded Value Principles (expanded by the Additional Guidance of EEV Disclosures published in October 2005), that provide consistent definitions, a framework for setting actuarial assumptions, and a more explicit approach to the underlying methodology and disclosures. So for example:
• The allowance for risk is explicit for EEV through: (i) an allowance for the cost of capital (at the higher of economic capital and the local statutory minimum) (ii) stochastic or other appropriate modelling of financial options and guarantees to ensure that an allowance for their cost is irrespective of their value at the balance sheet date, and (iii) an explicit allowance in the risk discount rate for financial and non-financial risks;
• EEV specifically allows for the look-through into profits arising in shareholder service companies, most notably the profit arising in investment management companies from managing the insurance companies funds for covered business; and
• There are extensive disclosures required for EEV on all aspects of the calculations, including the methodology adopted and the analysis of return.
It is thought that the EEV basis not only provides a good indication of the value being added by management in a given accounting period, but also helps demonstrate whether shareholder capital is being deployed to best effect. Indeed insurance companies in many countries use comparable bases of accounting for management purposes.
The EEV basis is a value-based method of reporting in that it reflects the change in value of the business over the accounting period. This value is called the shareholders’ funds on the EEV basis which, at a given point in time, is the value of future profits expected to arise from the current book of long-term insurance business plus the net worth of the Company. In determining
these expected profits, full allowance is made for the risks attached to their emergence and the associated cost of capital, and takes into account recent experience in assessing likely future persistency, mortality and expenses.
The change in value is typically analysed into the following components:
• the value added from new business sold during the year;• the change in value from existing business already in place
at the start of the year; • short-term fluctuations in investment returns;• change in economic assumptions;• change in the time value of cost of options and guarantees
and economic assumption changes;• other items (for example, profit from other Group operations,
tax, foreign exchange, exceptional items); and• dividends.
The value added from new business – defined as the present value of the future profits arising from new business written in the year – is a key metric used in the management of our business. The change in value of business in-force at the start of the year demonstrates how the existing book is being managed. Together, these metrics provide management and shareholders with valuable information about the underlying development of the Group’s business and the success or otherwise of management actions.
EEV basis results are prepared by first of all setting ‘best estimate’ assumptions, by product, for all relevant factors including expenses, surrender levels and mortality. Economic assumptions as to future investment returns and inflation are generally based on a combination of market data and long-term assumptions. These assumptions are used to project future cash flows. The present value of the future cash flows is then calculated using a discount rate which reflects both the time value of money and the risks associated with the cash flows. The risk discount rate is determined by adding a risk margin to the appropriate risk-free rate of return. The actual outcome may differ from that projected, in which case the effect will be reflected in the experience variances for that year.
The assumptions used for the EEV basis of accounting are set out in the notes that accompany the supplementary EEV basis information. An indication of the sensitivity of the results to changes in key assumptions is also provided within that information.

91B
US
INE
SS
RE
VIE
W
CORPORATE RESPONSIBILITY REVIEW
BUSINESS REVIEW > CORPORATE RESPONSIBILITY REVIEW
Corporate Responsibility (CR) continues to be guided by Harvey McGrath, Chairman, Prudential plc. Led by the Chairman, the Board regularly discusses the Group’s CR performance and reviews strategy annually.
The following review provides an overview of our activities and progress. Prudential publishes an annual CR report, available online at www.prudential.co.uk
“Through 163 years of experience looking after our customers’ interests, and supporting wider society, we have established a heritage of responsibility.”
Our approach The very nature of our products is long term and we do not underestimate the trust our customers place in us to ensure we effectively plan and provide for them in the future. Through 163 years of experience looking after our customers’ interests, and supporting wider society, we have established a heritage of responsibility that is integrated into the way we run our business. This culture of individual responsibility also extends to the high standards of behaviour we expect from our agents and intermediaries.
“We direct our resources towards the issues that we believe are most relevant to our business and where we can make the most impact.”
We are in no doubt that acting responsibly with our customers’ investments, supporting the welfare of the communities in which they live and playing our part in protecting the environment are fundamental to managing a sustainable company. We firmly believe that these activities are best managed by our businesses on the ground, those who are closest to the customer and local stakeholders.
However, we also recognise the importance of ensuring good governance and achieving consistent standards across the Company, which is why the Group is accountable for developing the overarching framework, principles and policies for each of our CR priorities, and for reporting progress to the Board and external stakeholders.
We direct our resources towards the issues that we believe are most relevant to our business and where we can make the most impact through our actions and expertise. As such, we have established four global areas of focus:
1 Fair and transparent products meeting customer needs2 Best people for the best performing business3 Protecting the environment4 Supporting local communities
Fair and transparent products meeting customer needsWe are deeply aware of the importance our customers attach to the financial decisions they face in meeting their changing requirements for savings, income and protection.
Across the Group we serve more than 25 million customers. The demographics of our geographies mean the profiles of our customers and the products we offer vary across our operations. But, in all our markets, we are committed to listening to our customers and understanding their individual needs so that they are able to make well-informed decisions.
In 2011 we will be publishing our Customer Charter on the Prudential plc website, which highlights our key commitments to our customers across the Group.
In Asia, we serve more than 15 million customers, with a mix of life insurance, pensions, mutual funds, consumer finance, asset management, health and protection products and services.
Healthcare is particularly important in a number of our markets in Asia, and we continue to broaden our health and protection product offering. Our evolving suite of health-related products includes innovative solutions such as PRUmy child, the first of its kind to offer coverage during pregnancy and infancy. PRUmy child also combines protection with savings, enabling parents to provide for their children’s education.
Last year, Prudential was the first insurance company in Asia to launch an iPhone app. Our iPhone Retirement Calculator allows customers to model different financial scenarios and lifestyle variables to calculate the savings they would need to fund their retirement. The app is available in Hong Kong, Malaysia, the Philippines and Singapore, with local language versions also launched in Indonesia, Korea, Taiwan, Thailand and Vietnam. We continue to innovate in this field and have a BlackBerry Retirement Calculator in development.
OUR FOUR CORPORATE RESPONSIBITY THEMES
1 Fair and transparent products meeting customer needs
2 Best people for the best performing business
3 Protecting the environment
4 Supporting local communities

92
Prudential plc Annual Report 2010
The United States is the world’s largest retirement savings market. Each year more of the 78 million ‘baby boomers’1 will move into retirement. Jackson, our US business, has more than 2.8 million policies and contracts in force. The economic downturn and demographic changes have led many people to be unprepared as they approach retirement. Jackson’s educational programme, ‘Retirementology’, is designed to help people understand how better to prepare for their financial future.
Recognised for its financial strength, in 2010, Jackson increased the number of advisers selling its variable annuity products to more than 130,000. This made these products more widely available as customers continued to seek greater security in times of economic uncertainty. We also introduced further innovations that deliver long-term value to customers. This includes the launch of the LifeGuard Freedom Flex, the Company’s first guaranteed minimum withdrawal benefit, giving investors the ability to build a personalised benefit that meets their retirement planning objectives.
Like the US, many people in the UK are insufficiently prepared for increasingly long periods of retirement. Prudential UK is one of the largest annuity providers in the country, paying an income to more than one million customers every year. In addition, our with-profits offering is among the strongest in the industry, consistently outperforming the market for our long-term investors and providing them with attractive returns compared with many other investment options. The with-profits offering also protects investors from the full impact of volatile market conditions while giving them the comfort of knowing that their savings are invested in a financially strong and well managed fund.
To help customers make informed financial decisions, Prudential UK has developed a series of online guides offering clear product information. This includes an interactive questionnaire which helps customers find an annuity product to meet their needs by calculating what level of income could be generated.
“As one of the largest active investors in the UK stock market, M&G takes seriously its responsibilities as a shareholder.”
M&G, Prudential’s UK and European fund management business, has served retail and institutional investors for 80 years. It has a history of innovation, designing new funds and investment plans that meet a clear client need.
With inflation once again a concern for investors, M&G has developed a number of innovative investment strategies for clients. For institutional investors, M&G offers the Secured Property Income Fund, which matches commercial property rents against pension funds' long-term liabilities. In the retail market, the recently-launched M&G inflation-linked Corporate Bond Fund enables savers to protect their investments in corporate bonds from rising prices.
As one of the largest active investors in the UK stock market, M&G takes seriously its responsibilities as a shareholder. Its strategy is to invest in companies, not chase share prices. M&G takes a long-term approach to investment opportunities and, provided the investment case remains intact, maintains its conviction in the companies it holds.
As a Group with a long-term view, it is clearly important to participate in global debates and policy considerations that affect our customers. Across our business we share our knowledge and expertise to help inform policy debates.
In October 2010, in partnership with the Washington DC-based think tank, the Center for Strategic and International Studies (CSIS), we published the Global Aging Preparedness Index. This study discussed the policy implications of aging populations in 20 countries and potential reform strategies. During 2011, we will continue to participate in the debate. A copy of the report is available at http://gapindex.csis.org
Customer service and performancePrudential’s reputation for good customer service has continued to be recognised through a number of awards and industry rankings.
In 2010...• Prudential Corporation Asia achieved:
’Best in Achieving Total Customer Satisfaction’ (Life Insurance) at the 2010 Indonesia Customer Satisfaction Awards, sponsored by SWA Magazine
’Best Fund in Overseas Equity’ in the 2010 Money Today-Morningstar Fund Awards, sponsored by KOFIA (Korea Financial Investment Association)
’Best Performing Fund of its Category’ awarded to PRUAsia Pacific Shariah Equity Fund at the Edge-Lipper Malaysia Fund Awards
• In the US, Jackson achieved: ‘World Class’ status and ‘Highest Customer Satisfaction’ from the Service Quality Measurements Group (SQM). This marked the fifth consecutive year that Jackson has achieved world class status
CORPORATE RESPONSIBILITY REVIEW
BUSINESS REVIEW > CORPORATE RESPONSIBILITY REVIEW > CONTINUED
Note
1 US Census Bureau – those born since 1945.

93B
US
INE
SS
RE
VIE
W
• Prudential UK achieved: Five-star rating for excellent service at the Financial Adviser Service Awards for the second year running
‘Best Annuity Provider’ at the 2010 Professional Adviser Awards
• M&G was awarded: ‘Global Group of the Year’ at the 2010 Investment Week Fund Manager of the Year Awards
‘Outstanding Investment House Award’ at the OBSR Honours for Excellence Awards
In the UK, Prudential is a member of the Association of British Insurers’ (ABI) Customer Impact Scheme, which seeks to drive continuous improvement through monitoring customers’ experiences. We are one of 35 companies that participate in the annual Customer Impact Survey. In 2010, our UK business saw an increase in the number of customers rating it ‘very good’ or ‘excellent’ for the time taken to arrange an annuity (64 per cent). In part this is due to our participation in the ‘Options’ initiative. This industry-wide scheme, of which we are a founding member, is designed to speed up the exchange of information and funds between pension and annuity providers.
Despite improvements in consumer confidence and market gains in 2009, some scores in the ABI Customer Impact Scheme fell sharply across the industry in the 2009/10 study, especially for return on investment and industry reputation. Our scores came within the industry average. While this demonstrates that we have achieved a solid performance in very challenging market conditions, we are taking action. This includes providing more information about how our with-profits fund is performing and what impact this may have on a policy. We are also improving our service to our annuity customers. We have revised our annuity quotes to make them clearer, and we are providing interactive online tools which explain the effects of different annuity choices.
Across the Group, we always try to resolve problems for our customers as quickly and smoothly as possible, and we are committed to handling any customer complaints in a fair and timely manner.
In the UK, the Financial Ombudsman Service (FOS) publishes complaint data on case adjudications for more than 150 financial services companies. Prudential performed well and was placed in the top 10 per cent of all companies in the FOS data.
Best people for the best performing businessAcross the Group, we have around 25,000 employees.
We work in an extremely competitive marketplace that demands we attract the most talented people. It is important that we continue to create an environment that appeals to the right individuals – those who are committed and able to deliver top performance for our customers and shareholders.
Developing credible successors Strong leadership is critical to the continued success of our business. Every year we conduct a review across the Group to identify, develop and reward people with leadership potential. During 2010, we held four events in each of our Management Development and Leadership Development programmes. These events support the Group’s succession and development strategy and, in 2010, more than 75 individuals were assessed for their long-term leadership potential.
It is important that we not only develop talent from within the business, but also use our brand strength and heritage to attract new talent. Our flagship development programme, Momentum, operating since 2007, aims to recruit high potential individuals early in their careers and to provide them with a fast-track development plan. Through business placements and training modules, participants gain the management skills and experience required to succeed in an international business. Momentum places a strong emphasis on diversity and is open to people both within and outside Prudential. In 2010, the Momentum website received more than 58,000 visits from 142 countries. More than 2,800 people from 83 countries applied for the programme. The 30 successful applicants increased the total number of participants in the programme to 60, who are in roles across the Group.
“ In 2010, the website for our flagship development programme, Momentum, received more than 58,000 visits from 142 countries.”

Prudential plc Annual Report 2010
94
Building and rewarding performanceWe believe that employees should be rewarded for the contribution they make to our business as a whole. Our reward system is therefore based on both individual performance and behaviours. Our remuneration policies are regularly reviewed to ensure that our reward structure keeps pace with the markets in which we operate, and that they remain relevant to the growth of our business.
It is important for our employees to have an opportunity to benefit from the Group’s success through share ownership. In the UK, we operate two all-employee share plans: a Share Investment Plan (SIP) and a Save As You Earn (SAYE) scheme. In 2010, more than 14 per cent of eligible employees participated in the SAYE scheme and almost six per cent in the SIP. Through these plans, more than two-thirds of employees in the UK now own, or have an interest in, Prudential shares. In Asia, we operate two SAYE schemes, similar to those in the UK, which are open to both employees and agents. Almost a quarter of eligible employees and more than 37 per cent of eligible agents participated in these schemes in 2010.
Developing an organisation that worksWe recognise that an important part of sustaining performance comes from effectively engaging and communicating with our employees. We conduct regular surveys in our businesses to: monitor levels of engagement with Prudential as an employer; identify the effectiveness of our organisations’ structures and practices, and highlight areas for improvement.
Across the Group there are dedicated intranet sites to keep employees up to date, and ‘Town Hall’ events that offer employees the opportunity to ask questions of senior management teams. There are also a number of employee consultation forums in place such as the M&G Staff Consultative Committee and the UK Employee Forum within Prudential UK. Our UK business also has a long-standing relationship with the union Unite.
At Group Head Office, a dedicated team provides regular communication to employees across the Group, through the Group intranet. This includes communication from senior management on Group strategy, direction and performance. We also regularly hold a conference for the Group Leadership Team, approximately 75 senior managers from across the Company who are either leading a significant part of the Group strategy or responsible for implementing a major part of it.
Diversity
“We fully recognise the value that a diverse workforce brings to our organisation and believe Prudential should reflect the diversity of the markets in which we operate.”
We are committed to integrating diversity into our business practices. Our policies are guided by the principles of the UN’s Universal Declaration of Human Rights and the International Labour Organisation’s core labour standards. These are also incorporated into our Group Code of Business Conduct which sets individual standards of employee behaviour. The code is made available to all employees on the Group intranet site.
We fully recognise the value that a diverse workforce brings to our organisation and believe Prudential should reflect the diversity of the markets in which we operate. It is Group policy to give full and fair consideration and encouragement to the employment of applicants with suitable aptitudes and abilities. It is our policy to recruit and develop talented people, regardless of their disability status, and to continue employing people who become disabled.
We also train our people to be aware of, and sensitive to, the needs of employees and customers with a disability.
Protecting the environmentOur environmental strategy is focused on increasing the efficiency of our business operations by reducing the direct impact of the properties we occupy, and the properties we manage through PRUPIM, our real estate investment manager.
Reducing our direct impact: occupied propertiesFor all UK buildings, and Jackson’s main premises in North America (in Lansing, Michigan and Denver, Colorado) we assess the direct impact that our occupied properties have on the environment. This includes monitoring energy consumption, carbon dioxide emissions, water consumption, waste and recycling.
One of the challenges we face in reporting our environmental impacts on a global basis is the collection of robust data for our operations in Asia. Across the region we are often an occupier of multi-tenanted properties and environmental data collection is not the norm. Nonetheless, we are developing processes, and identifying technologies, by which we can accurately begin to measure our impact.
CORPORATE RESPONSIBILITY REVIEW
BUSINESS REVIEW > CORPORATE RESPONSIBILITY REVIEW > CONTINUED

95B
US
INE
SS
RE
VIE
W
The UK Government is committed to reducing national carbon emissions by 80 per cent from 1990 levels by 2050. A central part of its strategy is the introduction of a mandatory climate change and energy savings scheme, the Carbon Reduction Commitment Energy Efficiency Scheme. In 2010, we registered as a participant in this scheme. We will be reporting our footprint data in July 2011.
Under the European Union Energy Performance of Buildings Directive, Energy Performance Certificates (EPCs) are required for any building that is constructed, sold or rented. EPCs rate the energy usage and efficiency of a building, enabling property investors and prospective occupiers to consider energy efficiency ratings and levels of carbon emissions. EPCs for our occupied and commercial properties have been introduced in the UK. In 2010, we retained our ISO 14001 environmental management certification for all our UK occupied properties.
A number of our customer-focused initiatives also deliver wider benefits in support of our CR agenda. For example, in the US, Jackson’s green delivery programme offers customers the option to receive some of their correspondence electronically. This has helped Jackson to reduce its paper consumption and generate cost savings for the business. Jackson has also provided funding to the US non-profit organisation Green Forests to plant 100,000 trees.
Reducing our impact from our property investment portfolioPRUPIM manages more than £16 billion (at 31 December 2010) worth of property assets, making it one of the largest real estate investment managers in the UK and Europe.
PRUPIM’s vision as a leading real estate fund manager is to deliver superior investment performance through further integrating sustainability into its business culture, activities and decision making. It seeks to address its own impact, and influence the property sector, through innovation and thought-leadership.
PRUPIM was recertified during 2010 to ISO 14001 for the management of its real estate investment portfolio. PRUPIM also maintained ISO 14001 certification at 26 managed office investment properties and PAS99, the world’s first integrated management system which includes ISO 14001, at 10 managed shopping centres.
In 2010, the business developed a Sustainability Education Programme for its employees. This included more than 22 hours of workshops, seminars and discussion groups, enabling colleagues to improve their understanding of sustainability issues.
Part of PRUPIM’s strategy is to incorporate sustainability considerations into its investment appraisal and decision-making process. This includes a sustainability questionnaire as part of the appraisal system which determines the value of the assets.
PRUPIM is a signatory of the UN’s Principles for Responsible Investment and continues to lead the property industry’s developments in sustainability through its active involvement in the British Property Federation, British Council of Shopping Centres, UK Green Building Council, Green Property Alliance, UN Environment Programme Finance Initiative, Institutional Investors Group on Climate Change and Better Buildings Partnership.
PRUPIM’s approach and progress can be found in its annual Sustainability Report. For more details please visit www.PRUPIM.com
Supporting local communitiesPrudential has a long history of supporting the community, from our earliest days of Victorian philanthropy. All our businesses implement community investment programmes and we encourage our operations to establish partnerships focused on education (particularly financial education) and social welfare.
Our approach to community investment is to support charitable organisations and appropriate NGOs, not only through funding, but also through the experience and expertise of our employees.
Employee volunteeringIn 2010, almost 25 per cent of employees volunteered in their community on a wide range of projects. These varied from fundraising for local charities such as Cancer Research and the Muscular Dystrophy Campaign in the UK, to employees giving up their time to distribute food to the homeless in the US and delivering financial education seminars in Asia.

96
Prudential plc Annual Report 2010
Chairman’s Challenge
“Over the last five years, since the Chairman’s Challenge was launched, 108 annual projects have been supported.”
Many of our employees volunteer through our Group-wide flagship programme, the Chairman’s Challenge.
Over the last five years, since the Chairman’s Challenge was launched, 108 annual projects have been supported by our employees in partnership with charities including Help Age International, Plan International and Junior Achievement.
All of the projects included in the Chairman’s Challenge receive a financial donation from the Group for each employee who signs up as a volunteer, and the five short-listed projects receive additional funding. Each year, employees across the Group are invited to vote for the shortlisted project they believe has made the greatest impact.
The winning project In 2010, the winning project was the Goal for Youth programme in Hong Kong, where more than 1,800 secondary school students benefited from attending financial management workshops run by more than 188 Prudential volunteers, in partnership with Junior Achievement.
Shortlisted projects included:• Prestasi Junior Indonesia working with more than
120 Prudential volunteers, who gave up four weekends to run a variety of educational projects for children at a safe house in Jakarta
• Junior Achievement in the US, where 163 Jackson employees dedicated 463 hours to teaching young people financial skills in 105 classrooms, benefiting 2,500 students
• Plan International Thailand, working with 316 Prudential employees who helped to build financial skills in seven schools reaching 1,500 students
• Prudential UK employees dedicated 660 hours to Age UK’s Call in Time programme, helping 370 isolated older people re-engage with the community.
Financial educationAs a provider of financial services we believe that encouraging and supporting financial literacy helps to underpin overall economic development and success.
In addition to the financial education projects included in the Chairman’s Challenge, we support a number of other initiatives that aim to improve financial knowledge.
In 2010, our financial capability strategy in Asia continued to gain strength. This year more than 4,400 women in China, Indonesia and Vietnam, participated in our financial training seminars – ‘Investing in Your Future’. These events, first launched in China in 2004, directly support women who, while often responsible for planning the family’s financial needs, have traditionally had limited financial training. In the past six years, more than 27,500 women have attended our financial training seminars in Asia.
Since 2007, Prudential has partnered with the Chinese Ministry of Education, the Chinese Academy of Social Sciences (CASS) and the Chinese Insurance Regulatory Commission (CIRC), to develop and introduce an insurance education curriculum in schools. The programme has reached more than 6,000 students from 26 schools in seven provinces.
In the UK, we partner with a range of organisations such as Citizens Advice, the Personal Finance Education Group (pfeg), and the Specialist Schools and Academies Trust. As a result of these partnerships, thousands of adults and children are learning essential financial literacy skills. Our partnership with Citizens Advice is also helping people to make decisions that will have a profound effect on their financial welfare.
CORPORATE RESPONSIBILITY REVIEW
BUSINESS REVIEW > CORPORATE RESPONSIBILITY REVIEW > CONTINUED

97B
US
INE
SS
RE
VIE
W
Disaster relief The Group maintains a fund which can be activated to support relief efforts following disasters in the countries where we operate.
Our commitment to disaster relief often goes beyond financial aid, providing on-the-ground support to address the most critical needs. Following the earthquake that struck Western Sumatra in Indonesia, near the city of Padang, at the end of 2009, we contributed approximately £1 million, and many of our employees worked as volunteers. Funding was used to support initial emergency relief efforts and subsequent reconstruction work. We have continued to monitor progress and, during 2010, Prudential leaders in Asia attended a ceremony in Padang, celebrating the completion of 220 new houses, a children's library and a play centre. These buildings were constructed by Padang Kapas villagers and our charity partner, Posko Jenggala.
In 2010, Save the Children became a new charity partner through the Group’s support for its Children’s Emergency Fund.
Donations In 2010, the Group spent £7.5 million supporting community activities. Direct donations to charitable organisations amounted to £5.7 million, of which approximately £3.5 million came from EU operations.
This is broken down as follows: education £862,000; social and welfare £1,804,000; environment and regeneration £19,000; cultural £61,000 and staff volunteering £727,000. The aggregate figure for direct charitable donations from Prudential's non-EU subsidiaries (Jackson National Life Insurance Company and Prudential Corporation Asia) amounted to £2.2 million.
It is the Group's policy not to make donations to political parties nor to incur political expenditure, within the meaning of those expressions as defined in the Political Parties, Elections and Referendums Act 2000. The Group did not make any such donations or incur any such expenditure in 2010.
Accountability and governanceThe BoardThe Board discusses the Group’s CR performance at least once a year and also reviews and approves the Group CR Report and strategy on an annual basis.
Responsibility CommitteeBelow the Board, the Responsibility Committee comprises senior representatives from relevant Group functions and each of our core businesses. This committee is responsible for monitoring the Group’s CR activities and for raising issues that need to be addressed.
Code of Business ConductConsideration of environmental, social and community matters is integrated in our Code of Business Conduct. Our code is reviewed by the Board on an annual basis. Refer to page 120 for more information.
Payment policyIt is our Group policy to agree terms of payment when orders for goods and services are placed, and to pay in accordance with those terms.
In the UK, we have signed up to the Prompt Payment Code, launched in December 2008 by the UK Department for Business, Enterprise and Regulatory Reform. In 2010, our trade creditor days, based on the ratio of amounts that were owed to trade creditors at the year-end to the aggregate of the amounts invoiced by trade creditors during the year, were 23 days. The Prompt Payment Code and its signatories can be found at www.promptpaymentcode.org.uk
Supply chain management Prudential recognises that its own social, environmental and economic impacts go beyond the products and services it supplies to include the performance of its suppliers and contractors.
It is our policy to work in partnership with suppliers whose values and standards are aligned with our Group Code of Business Conduct.
Procurement practices in Prudential UK have been successfully accredited with the Chartered Institute of Purchasing and Supply (CIPS) certification, an industry benchmark of recognised good practice.
“ In 2010, Save the Children became a new charity partner through the Group's support for its Children's Emergency Fund.”
£7.5mIn 2010, the Group spent £7.5 million supporting community activities

98
Prudential plc Annual Report 2010
CORPORATE RESPONSIBILITY REVIEW
BUSINESS REVIEW > CORPORATE RESPONSIBILITY REVIEW > CONTINUED
GOVERNANCE STRUCTURE RESPONSIBILITIES
PRUDENTIAL PLC BOARD • Approves strategy
• Approves CR Report
• Monitors progress
• Identifies and develops CR policies
• Collates data for internal and external reporting
• Publishes annual CR Report
• Oversees CR risks and issues management
• Collates and shares CR practices across the Group
• Develops and drives initiatives related to functional responsibilities
• Tracks, reviews and assesses ongoing initiatives
• Provides data/information for internal and external reporting
GROUP RESPONSIBILITYCOMMITTEE
GROUP CR TEAM
BRAND COUNCIL
HR DIRECTORS
COMMUNITY FORUM
ENVIRONMENT, HEALTH & SAFETYCOUNCIL & PRUPIM OPSCO

99G
OV
ER
NA
NC
E
GOVERNANCE
100 Board of directors104 Governance report:
• Corporate governance• Risk governance• Corporate responsibility governance
121 Additional disclosures122 Index to principal Directors' Report disclosures

100
Prudential plc Annual Report 2010
CHAIRMAN EXECUTIVE DIRECTORS
HARVEY MCGRATH CHAIRMAN
TIDJANE THIAMGROUP CHIEF EXECUTIVE
NIC NICANDROU ACACHIEF FINANCIAL OFFICER
ROB DEVEYEXECUTIVE DIRECTOR
JOHN FOLEYEXECUTIVE DIRECTOR
MICHAEL MCLINTOCKEXECUTIVE DIRECTOR
BARRY STOWEEXECUTIVE DIRECTOR
MIKE WELLSEXECUTIVE DIRECTOR
NON-EXECUTIVE DIRECTORS
KEKI DADISETH FCANON-EXECUTIVE DIRECTOR
SIR HOWARD DAVIESNON-EXECUTIVE DIRECTOR
MICHAEL GARRETTNON-EXECUTIVE DIRECTOR
ANN GODBEHERE FCGANON-EXECUTIVE DIRECTOR
BRIDGET MACASKILLNON-EXECUTIVE DIRECTOR
PAUL MANDUCASENIOR INDEPENDENT NON-EXECUTIVE DIRECTOR
KATHLEEN O’DONOVAN ACANON-EXECUTIVE DIRECTOR
JAMES ROSS OBENON-EXECUTIVE DIRECTOR
LORD TURNBULL KCB CVONON-EXECUTIVE DIRECTOR
BOARD OF DIRECTORS
GOVERNANCE > BOARD OF DIRECTORS

101G
OV
ER
NA
NC
E
CHAIRMAN
HARVEY MCGRATH CHAIRMAN AND CHAIRMAN OF THE NOMINATION COMMITTEE
Harvey McGrath was appointed as an independent non-executive director of Prudential in September 2008 and became the Chairman and Chairman of the Nomination Committee in January 2009. Harvey has a long and distinguished career in the international financial services industry, having started his career at Chase Manhattan Bank in London and New York. From 1980 to 2007 he worked for the Man Group, first as Treasurer, then Finance Director, then President of Man Inc. in New York before being appointed as Chief Executive of Man Group plc in London in 1990 and then Chairman in 2000. He left Man Group in 2007.
Harvey is also Chairman of the London Development Agency which works for the Mayor of London coordinating economic development and regeneration across London and is Vice Chairman of the London Skills and Employment Board which is tasked with developing a strategy for adult skills in London. He is the former Chairman of both London First and the East London Business Alliance.
Harvey is a trustee of a number of charities including New Philanthropy Capital, a research based charity which gives advice and guidance to donors and charities; the Royal Anniversary Trust which operates the Queen’s Anniversary Prizes for Higher and Further Education; Children and Families Across Borders (CFAB), which protects the rights and welfare of children and vulnerable adults across borders; icould, an online careers resource; and the Prince’s Teaching Institute, which promotes subject based professional development for teachers. Age 59.
EXECUTIVE DIRECTORS
TIDJANE THIAMGROUP CHIEF EXECUTIVE
Tidjane Thiam has been an executive director of Prudential since March 2008. He was the Chief Financial Officer until September 2009 and became Group Chief Executive in October 2009. Tidjane was previously Chief Executive Officer, Europe at Aviva where he worked from 2002 to 2008 and held successively the positions of Group Strategy and Development Director and Managing
Director, Aviva International. Tidjane spent the first part of his professional career with McKinsey & Company in Paris, London and New York, serving insurance companies and banks. He then spent a number of years in Africa where he was Chief Executive and later Chairman of the National Bureau for Technical Studies and Development in Côte d'Ivoire and a cabinet member as Secretary of Planning and Development. Tidjane returned to France to become a partner with McKinsey & Company as one of the leaders of their Financial Institutions practice before joining Aviva in 2002.
Tidjane was a non-executive director of Arkema in France until November 2009. He is a member of the Board of the Association of British Insurers (ABI), a member of the International Business Council (IBC) of the World Economic Forum (WEF) and a member of the Council of the Overseas Development Institute (ODI) in London. In January 2011, he was appointed to chair the G20 High Level Panel for Infrastructure Investment until the November 2011 G20 Summit. Tidjane sits on the Africa Progress Panel chaired by Kofi Annan and is a sponsor of Opportunity International. Age 48.
NIC NICANDROU ACACHIEF FINANCIAL OFFICER
Nicolaos Nicandrou (Nic) has been an executive director of Prudential and Chief Financial Officer since October 2009. Before joining Prudential, he worked at Aviva, where he held a number of senior finance roles, including Norwich Union Life Finance Director and Board Member, Aviva Group Financial Control Director, Aviva Group Financial Management and Reporting Director and CGNU Group Financial Reporting Director. Nic started his career at PriceWaterhouseCoopers where he worked in both London and Paris. Age 45.
ROB DEVEY EXECUTIVE DIRECTOR
Robert Devey (Rob) has been an executive director of Prudential and Chief Executive, Prudential UK and Europe since November 2009. Rob joined Prudential from Lloyds Banking Group where he worked since 2002 in a number of senior leadership roles across insurance and retail banking including Managing Director, Direct Channels UK Retail Banking, Managing Director of HBOS
Financial Services and Managing Director of HBOS General Insurance. Prior to joining HBOS, Rob was a consultant with the Boston Consulting Group (BCG) in the UK, US and Europe working in financial services. Age 42.
JOHN FOLEYEXECUTIVE DIRECTOR
John Foley was appointed an executive director of Prudential and Group Chief Risk Officer in January 2011. He joined Prudential as Deputy Group Treasurer in 2000 before being appointed Managing Director, Prudential Capital (formerly Prudential Finance (UK)) and Group Treasurer in 2001. He was appointed Chief Executive of Prudential Capital and to the Group Executive Committee in 2007. Prior to joining Prudential, John spent three years with National Australia Bank as General Manager, Global Capital Markets. John began his career at Hill Samuel & Co Limited where, over a 20 year period, he worked in every division of the bank, culminating in senior roles in risk, capital markets and treasury of the combined TSB and Hill Samuel Bank. Age 54.
MICHAEL MCLINTOCKEXECUTIVE DIRECTOR
Michael McLintock has been an executive director of Prudential since September 2000. He is also Chief Executive of M&G, a position he held at the time of M&G's acquisition by Prudential in 1999. Michael joined M&G in 1992. He previously also served on the board of Close Brothers Group plc as a non-executive director from 2000 to 2008. Since October 2008, he has been a Trustee of the Grosvenor Estate. Age 50.
BARRY STOWEEXECUTIVE DIRECTOR
Barry Stowe has been an executive director of Prudential since November 2006 and Chief Executive, Prudential Corporation Asia since October 2006. He has also been a director of the Life Insurance Marketing Research Association (LIMRA) and the Life Office Management Association (LOMA) since October 2008, and a member of the Board of Visitors of Lipscomb University since May 2009. Previously, Barry was President, Accident & Health Worldwide for AIG Life Companies. He joined AIG in 1995 and prior to that was President

102
Prudential plc Annual Report 2010
and CEO of Nisus, a subsidiary of Pan-American Life, from 1992 to 1995. Before joining Nisus, Barry spent 12 years at Willis Corroon in the US. Age 53.
MIKE WELLSEXECUTIVE DIRECTOR
Michael Wells (Mike) has been an executive director of Prudential since January 2011 when he succeeded Clark Manning as President and CEO of Jackson National Life Insurance Company (Jackson). Mike has served in a variety of senior and strategic positions at Jackson over the last 15 years, including President of Jackson National Life Distributors. Mike has been Vice Chairman and Chief Operating Officer of Jackson for the last nine years. During this period he has led the development of Jackson’s highly profitable variable annuity business and been responsible for IT, strategy, operations, communications, distributions, Curian and the retail broker dealers. Age 50.
NON-EXECUTIVE DIRECTORS
KEKI DADISETH FCA INDEPENDENT NON-EXECUTIVE DIRECTOR AND MEMBER OF THE REMUNERATION COMMITTEE
Keki Dadiseth has been an independent non-executive director of Prudential since April 2005. Keki is a member of the Remuneration Committee and was a member of the Audit Committee from 2005 to 2007. During 2006 he was appointed as a non-executive director of ICICI Prudential Life Assurance Company Limited and ICICI Prudential Trust Limited. Keki is also a director of Britannia Industries Limited, Piramal Healthcare Limited, Siemens Limited, The Indian Hotels Company Limited and Godrej Properties Limited, all of which are quoted on the Bombay Stock Exchange. In addition, he acts as advisor to Goldman Sachs, Fleishman-Hillard Inc and Oliver Wyman Limited, and as a trustee for a number of Indian charities. Keki is the non-executive Chairman of Omnicom India Marketing Advisory Services Private Limited, an unquoted Indian company and is also a board member of various other unquoted Indian companies. He serves as Chairman of Sony India Pvt Ltd and is a Senior Advisor to Sony Group in India.
Before he retired from Unilever in 2005, Keki was Director, Home and Personal Care, responsible for the HPC business
of Unilever worldwide, a Board member of Unilever PLC and Unilever N.V., and a member of Unilever's Executive Committee. He joined Hindustan Lever Ltd in India in 1973 and in 1987 he joined the Board of Hindustan Lever and became Chairman in 1996. Age 65.
SIR HOWARD DAVIESINDEPENDENT NON-EXECUTIVE DIRECTOR, CHAIRMAN OF THE RISK COMMITTEE AND MEMBER OF THE AUDIT COMMITTEE
Sir Howard has been an independent non-executive director of Prudential and Chairman of the Risk Committee since October 2010. He joined the Audit Committee in November 2010. Sir Howard remains the Director of the London School of Economics and Political Science (LSE) and, although he has resigned, will continue in the post until such time as a suitable successor is found. Prior to joining the LSE in September 2003, he was Chairman of the Financial Services Authority, the UK’s financial regulator. He is also a director of Morgan Stanley Inc. Age 60.
MICHAEL GARRETTINDEPENDENT NON-EXECUTIVE DIRECTOR AND MEMBER OF THE REMUNERATION COMMITTEE
Michael Garrett has been an independent non-executive director of Prudential and a member of the Remuneration Committee since September 2004. He worked for Nestlé from 1961 becoming Head of Japan from 1990 to 1993 and then Zone Director and Member of the Executive Board, responsible for Asia and Oceania. In 1996 his responsibilities were expanded to include Africa and the Middle East. Michael retired as Executive Vice President of Nestlé in 2005. He served the Government of Australia as Chairman of the Food Industry Council and as a Member of the Industry Council of Australia, and was also a member of the Advisory Committee for an APEC (Asia-Pacific Economic Cooperation) Food System, a Member of The Turkish Prime Minister's Advisory Group and the WTO (World Trade Organization) Business Advisory Council in Switzerland.
Michael remains a director of Nestlé in India and was appointed Chairman of the Evian Group in 2001, a think tank and forum for dialogue promoting free trade. He also serves as a non-executive director on the Boards of the Bobst Group in
Switzerland, Hasbro Inc. in the USA, and Gottex Fund Management Holdings Limited in Guernsey. In addition, he is a member of the Development Committee of the International Business Leaders Forum (IBLF), as well as a Member of the Swaziland International Business Advisory Panel under the auspices of the Global Leadership Foundation (GLF) London. Age 68.
ANN GODBEHERE FCGAINDEPENDENT NON-EXECUTIVE DIRECTOR, CHAIRMAN OF THE AUDIT COMMITTEE AND MEMBER OF THE RISK COMMITTEE
Ann Godbehere has been an independent non-executive director of Prudential since August 2007. She has been a member of the Audit Committee since October 2007 becoming its Chairman in October 2009 and joined the Risk Committee in November 2010. Ann began her career in 1976 with Sun Life of Canada, joining Mercantile & General Reinsurance Group in 1981, where she held a number of management roles rising to Senior Vice President and Controller for life and health and property/casualty businesses in North America in 1995. In 1996 Swiss Re acquired Mercantile & General Reinsurance Group and Ann became Chief Financial Officer of Swiss Re Life & Health, North America. In 1997 she was made Chief Executive Officer of Swiss Re Life & Health, Canada. She moved to London as Chief Financial Officer of Swiss Re Life & Health Division in 1998 and joined the Property & Casualty Business Group, based out of Zurich, as Chief Financial Officer on its establishment in 2001. From 2003 until February 2007, Ann was Chief Financial Officer of the Swiss Re Group.
Ann is also a non-executive director of Rio Tinto plc, Rio Tinto Limited, UBS AG, Ariel Holdings Limited, Atrium Underwriting Group Limited and Atrium Underwriters Limited. From its nationalisation in 2008 until January 2009, Ann was Interim Chief Financial Officer and Executive Director of Northern Rock. Age 55.
BRIDGET MACASKILLINDEPENDENT NON-EXECUTIVE DIRECTOR, CHAIRMAN OF THE REMUNERATION COMMITTEE AND MEMBER OF THE NOMINATION COMMITTEE
Bridget Macaskill has been an independent non-executive director of Prudential since September 2003. Bridget
GOVERNANCE > BOARD OF DIRECTORS > CONTINUED
BOARD OF DIRECTORS

103G
OV
ER
NA
NC
E
rejoined the Board of Prudential having resigned in 2001 as a result of a potential conflict of interest. She has been a member of the Remuneration Committee since 2003 and became its Chairman in May 2006. Bridget has also been a member of the Nomination Committee since March 2004.
Bridget joined First Eagle Investment Management, LLC (formerly Arnhold and S. Bleichroeder Advisers, LLC), a US based investment management firm, as President and Chief Operating Officer in February 2009 and became Chief Executive Officer in February 2010. She is a trustee of the TIAA-CREF funds and was previously also a non-executive director of the Federal National Mortgage Association – Fannie Mae from 2005 to 2008, Scottish & Newcastle PLC from 2004 to 2008 and J Sainsbury Plc from 2002 to 2006. Prior to that she spent 18 years at OppenheimerFunds Inc, a major New York based investment management company, the final 10 years of which she was Chief Executive Officer. Age 62.
PAUL MANDUCASENIOR INDEPENDENT DIRECTOR AND MEMBER OF THE AUDIT, REMUNERATION AND NOMINATION COMMITTEES
Paul Manduca has been an independent non-executive director of Prudential since October 2010 and succeeded James Ross as the Board’s Senior Independent Director in January 2011. He joined the Audit and Remuneration Committees in November 2010 and became a member of the Nomination Committee in January 2011.
Paul was appointed as a non-executive director of Wm Morrison Supermarkets Plc (Morrisons) in September 2005. He is currently the Senior Independent Director, a member of the Nomination Committee and Chairman of the Remuneration Committee of Morrisons. He has previously chaired the Audit Committee and is stepping down from the Board of Morrisons in March 2011. He is also Chairman of Aon Limited, a non-executive director and Chairman of the Audit Committee of KazmunaiGas Exploration & Production Plc, Chairman of Henderson Diversified Income Limited and a director of JPM European Smaller Companies Investment Trust Plc. Paul was a director of Development Securities plc until March 2010, Chairman of
Bridgewell Group plc until 2007 and a director of Henderson Smaller Companies Investment Trust plc until 2006. Paul was European CEO of Deutsche Asset Management from 2002 to 2005, global CEO of Rothschild Asset Management from 1999 to 2002 and founding CEO of Threadneedle Asset Management Limited from 1994 to 1999 when he was also a director of Eagle Star and Allied Dunbar. Paul is a member of the Securities Institute. Age 59.
KATHLEEN O’DONOVAN ACAINDEPENDENT NON-EXECUTIVE DIRECTOR AND MEMBER OF THE AUDIT AND NOMINATION COMMITTEES
Kathleen O’Donovan has been an independent non-executive director of Prudential since May 2003. She has been a member of the Audit Committee since 2003 and was its Chairman from May 2006 until September 2009. Kathleen joined the Nomination Committee in November 2010. Kathleen is also a director and Chairman of the Audit Committee of Trinity Mirror plc, the Senior Independent Director and Chairman of the Audit Committee of ARM Holdings plc and Chairman of the Invensys Pension Scheme.
Previously, Kathleen was a non-executive director and Chairman of the Audit Committees of Great Portland Estates PLC, EMI Group plc and the Court of the Bank of England, and a non-executive director of O2 plc. From 1991 to 2002, Kathleen was Chief Financial Officer of BTR and Invensys and prior to that she was a partner at Ernst & Young. Age 53.
JAMES ROSS OBEINDEPENDENT NON-EXECUTIVE DIRECTOR AND MEMBER OF THE RISK AND NOMINATION COMMITTEES
James Ross has been an independent non-executive director of Prudential since May 2004 and the Senior Independent Director from May 2006 to December 2010. He was succeeded by Paul Manduca as Senior Independent Director in January 2011 and will retire from the Board at the conclusion of the AGM on 19 May 2011. He became a member of the Risk Committee in November 2010 and was a member of the Remuneration Committee from 2004 to 2006 and from 2008 to November 2010. He was also a member of the Audit Committee from 2005 to 2007.
James is Chairman of the Board of Trustees of the Liverpool School of Tropical Medicine. He was previously a non-executive director of Schneider Electric in France, Chairman of the Leadership Foundation for Higher Education, and a non-executive director of McGraw-Hill and Datacard Inc in the United States. Prior to that he was Chairman of National Grid plc and Littlewoods plc. He was also Chief Executive of Cable and Wireless plc and Chairman and Chief Executive of BP America Inc. and a Managing Director of the British Petroleum Company plc. Age 72.
LORD TURNBULL KCB CVOINDEPENDENT NON-EXECUTIVE DIRECTOR AND MEMBER OF THE RISK AND REMUNERATION COMMITTEES
Lord Turnbull has been an independent non-executive director of Prudential since May 2006. He joined the Risk Committee and the Remuneration Committee in November 2010. From January 2007 to November 2010 he was a member of the Audit Committee. He entered the House of Lords as a Life Peer in 2005. In 2002 he became Secretary of the Cabinet and Head of the Home Civil Service until he retired in 2005. Prior to that he held a number of positions in the Civil Service, including Permanent Secretary at HM Treasury; Permanent Secretary at the Department of the Environment (later Environment, Transport and the Regions); Private Secretary (Economics) to the Prime Minister; and Principal Private Secretary to Margaret Thatcher and then John Major. He joined HM Treasury in 1970.
Lord Turnbull is Chairman of BH Global Limited and a non-executive director of Frontier Economics Limited and The British Land Company PLC, and was formerly a non-executive director of the Arup Group from 2006 to 2007. He also worked part-time as a Senior Adviser to the London partners of Booz and Co (UK) until February 2011. Age 66.

104
Prudential plc Annual Report 2010
Compliance with Corporate Governance CodesAs a UK company with primary listings on the London Stock Exchange and on the Stock Exchange of Hong Kong, Prudential is subject to the governance rules set out in the Combined Code 2008 (for reporting periods commencing prior to 29 June 2010) and the Code on Corporate Governance Practices in Appendix 14 to the Rules Governing the Listing of Securities on the Stock Exchange of Hong Kong Limited (together the Corporate Governance Codes).
The Combined Code is issued by the Financial Reporting Council and can be viewed on their website: www.frc.org.uk/corporate/
The Code on Corporate Governance Practices is issued by the Stock Exchange of Hong Kong and can be viewed on their website: www.hkex.com.hk/eng/rulesreg/listrules/
The directors believe that good corporate governance is central to achieving the Group’s objectives and maximising shareholder value, and are committed to high standards of governance.
The Board supports the Corporate Governance Codes and confirms that it has complied with the provisions set out in the Combined Code 2008 throughout the financial year ended 31 December 2010.
The Board further confirms that it has complied with the Code on Corporate Governance Practices in Appendix 14 to the Rules Governing the Listing of Securities on the Stock Exchange of Hong Kong Limited from the date of listing on the exchange, except that it has deviated in respect of the Terms of Reference of the Remuneration Committee. The remit of the Remuneration Committee is limited to considering the remuneration of the Chairman and executive directors and does not extend to making recommendations to the Board in respect of the remuneration of the non-executive directors. The reason for the deviation is that it would be inconsistent with the principles of the Combined Code 2008 (and the provisions of the new UK Corporate Governance Code) for the Remuneration Committee to be involved in setting the fees of non-executive directors.
The principles of the Corporate Governance Codes have been applied as set out below and in the Directors’ Remuneration Report.
Board of directorsRole of the Board The Board is collectively responsible for the success of the Group and provides leadership within a framework of effective controls which enables suitable risk management. The executive directors are responsible for running the business operations and the non-executive directors for bringing independent judgement and scrutiny to decisions taken by the Board.
The directors are responsible for setting strategic objectives and for ensuring the Group is adequately placed and resourced to achieve those objectives and for ensuring obligations to its shareholders, and wider stakeholders, are met in a manner consistent with their statutory duties.
In performing its duties, the Board has direct access to the services of the Company Secretary who advises on corporate governance matters, Board procedures and compliance with applicable rules and regulations.
Directors have the right to seek independent professional advice at the Company’s expense and copies of such advice are circulated to other directors where applicable and appropriate.
In the ordinary course of business, Board and Committee papers are provided to the directors approximately one week in advance of each meeting.
The Board has approved a governance framework which maps out the internal approvals processes and those matters which may be delegated. These principally relate to the operational management of the Group’s businesses and include pre-determined authority limits delegated by the Board to the Group Chief Executive for further delegation by him in respect of matters which are necessary for the effective day-to-day running and management of the businesses. The chief executive of each business unit has authority for the management of that business unit and has established a management board comprising its most senior executives.
The Board may exercise all powers conferred on it by the Articles of Association and the Companies Act 2006. This includes the powers of the Company to borrow money and to mortgage or charge any of its assets (subject to the limitations set out in the Companies Act 2006 and the Company’s Articles of Association) and to give a guarantee, security or indemnity in respect of a debt or other obligation of the Company.
In order to ensure that it exercises control over the Group’s affairs, the Board’s terms of reference are regularly reviewed and set out those matters specifically reserved to it for decision. These include approval of the annual and interim results, strategy and corporate objectives, operating plans, significant transactions and matters affecting the Company's share capital. Under its internal governance framework all business units are required to seek approval from the Board for matters above pre-determined authority limits.
Composition At 31 December 2010 the Board comprised the Chairman, six executive directors and nine independent non-executive directors. From 1 January 2011 the number of executive directors increased to seven with the appointment of John Foley, Group Chief Risk Officer, becoming effective. The biographies of all current directors are set out on pages 100 to 103.
On 15 October 2010, Howard Davies and Paul Manduca were appointed as independent non-executive directors. From 1 January 2011, Paul Manduca succeeded James Ross as the Board’s Senior Independent Director. James will retire from the Board at the conclusion of Prudential’s Annual General Meeting to be held on 19 May 2011. On 1 January 2011, Mike Wells replaced Clark Manning as an executive director and as President and Chief Executive Officer of Jackson National Life Insurance Company. In addition, John Foley was appointed an executive director and Group Chief Risk Officer with effect from 1 January 2011.
CORPORATE GOVERNANCE
GOVERNANCE > CORPORATE GOVERNANCE

105G
OV
ER
NA
NC
E
The Board, or the members in a general meeting, may appoint directors up to a maximum total number of 20 as set out in the Company’s Articles of Association. The removal and resignation of the Company’s directors is governed by the relevant provisions of the Companies Act 2006, the Corporate Governance Codes and the Company’s Articles of Association.
Non-executive directors are usually appointed for an initial three-year term commencing with their election by shareholders at the first Annual General Meeting following their appointment by the Board. Each appointment is reviewed towards the end of the three-year term against performance and the requirements of the Group's businesses. The terms and conditions of all directors’ appointments are available for inspection at the Company’s registered office during normal business hours and at the Annual General Meeting.
Non-executive directors are typically expected to serve for two terms of three years from their initial election by shareholders, although the Board may invite them to serve for an additional period. Directors serving a third term are subject to rigorous annual review.
Directors appointed to the Board since the 2010 Annual General Meeting will stand for election for the first time and in accordance with the provisions of the UK Corporate Governance Code all other directors, with the exception of James Ross who has announced his intention to retire, will offer themselves for re-election at the Annual General Meeting to be held on 19 May 2011.
The Board is actively engaged in succession planning for both executive and non-executive roles to ensure that Board composition is periodically renewed and that the Board retains its effectiveness at all times. This is delivered through an established review process that is applied across all businesses and covers both director and senior management succession and development and also through the work of the Nomination Committee as described more fully on page 112. The Board considers annually the outcome of the review and actions arising from the review are implemented as part of the management development agenda. We believe that our non-executive directors bring a wide range of business, financial and international experience to the Board and its committees. Our executive directors, who head up the main businesses of the Group, each bring an in-depth understanding to the Board of their particular business, its markets and its challenges, ensuring coverage of the breadth and depth of the Group’s principal activities.
Chairman and Chief ExecutiveThe roles of Chairman and Group Chief Executive are separate and clearly defined. The scope of these roles is approved and kept under regular review by the Board so that no individual has unfettered decision-making powers.
The Chairman is responsible for the leadership and governance of the Board and the Group Chief Executive for the management of the Group and the implementation of Board strategy and policy on the Board’s behalf. In discharging his responsibilities, the Group Chief Executive is advised and assisted by the Group Executive Committee which comprises all the business unit heads and a Group Head Office team of functional specialists.
IndependenceThe independence of the non-executive directors is determined with reference to the Corporate Governance Codes. Prudential is required to affirm annually the independence of the non-executive directors under the rules of the Hong Kong Stock Exchange and also the independence of its Audit Committee members under the Sarbanes-Oxley legislation. The Board has appropriate processes in place to manage any potential conflicts of interest.
Throughout the year the non-executive directors were considered by the Board to be independent in character and judgement and met the provisions for independence as set out in the Corporate Governance Codes. The Company has received confirmation of independence from each of the non-executive directors as required by the Hong Kong Listing Rules. As the test of independence is not appropriate in relation to the Chairman under the Combined Code 2008, and to ensure a consistent approach in how the Chairman is described in all corporate communications, the Chairman has not been asked to provide confirmation of his independence for the purposes of the Hong Kong Listing Rules and will not be asked to do so in future. Accordingly, the Chairman will no longer be listed as an independent non-executive director in Hong Kong corporate communications.
Paul Manduca is the Senior Independent Director and concerns may be conveyed to him by shareholders if they are unable to resolve them through the existing mechanisms for investor communications or where such channels are inappropriate.
Keki Dadiseth and Barry Stowe serve as non-executive directors of ICICI Prudential Life Insurance Company Limited, an Indian company which is owned 26% by Prudential. In addition, Keki serves at Prudential’s request as a non-executive director of ICICI Prudential Trust Limited, an Indian company which is owned 49% by Prudential. The Board does not consider that these appointments in any way affect Keki’s status as an independent director of Prudential.

106
Prudential plc Annual Report 2010
Prudential is one of the UK’s largest institutional investors and the Board does not believe that this situation compromises the independence of those non-executive directors who are on the boards of companies in which the Group has a shareholding. The Board also believes that such shareholdings should not preclude the Company from having the most appropriate and highest calibre non-executive directors.
Induction and DevelopmentThe Company Secretary supports the Chairman in providing tailored induction programmes for new directors and on-going development for all directors. On appointment all directors embark upon a wide-ranging induction programme covering, amongst other things, the principal bases of accounting for the Group’s results, the role of the Board and its key committees and the ambit of the internal audit and risk management functions. In addition, they receive detailed briefings on the Group’s principal businesses, its product range, the markets in which it operates and the overall competitive environment. Other areas addressed include the directors’ obligations under the different listing regimes, legal issues affecting directors of financial services companies, the Group’s governance arrangements, its investor relations programme as well as its remuneration policies.
Throughout their period in office directors are regularly updated on the Group’s businesses and the regulatory and industry-specific environments in which it operates as well as on their legal and other duties and obligations as directors where appropriate. These updates can be in the form of written reports to the Board or presentations by senior executives or external sources where appropriate. In order to enhance their knowledge and effectiveness throughout their term in office, non-executive directors serving on key committees are updated regularly on matters specific to the relevant committee and receive presentations from senior executives on topics of interest to them.
A programme of on-going professional development was undertaken by all directors during 2010 which included a number of sector-specific and business issues as well as legal, accounting and regulatory changes and developments. A number of business unit chief executive officers, together with relevant senior executives, gave presentations to the Board during the course of the year on the challenges and opportunities currently faced by their business unit. In addition, senior managers within certain head office functions presented to the Board on the key issues currently facing their function and directors received regular briefings on Solvency II. In addition, members of the Audit Committee have the option to attend meetings of the business unit audit committees to aid their understanding of topical matters of interest to them and how they are handled by the Group.
Performance evaluation Prudential continued its programme of annual evaluation of the performance of the Board and its Committees in respect of 2010, in line with the requirements of the Combined Code 2008. The aim is to continue to improve the effectiveness of the Board and its Committees and enhance the Group’s performance.
Following an internal performance review for 2009, Prudential once again made the decision to use an external adviser to facilitate the evaluation for 2010. The review was carried out by Egon Zehnder International in consultation with the Chairman, the Senior Independent Director and the Group Chief Executive. A key element of the evaluation process was the use of individual meetings with each of the directors. This proved an effective and informative mechanism for capturing feedback.
The report on the findings of the review was discussed by the Board at its meeting in February 2011 and an action plan will be implemented during the year.
In addition, the performance of the non-executive directors and the Group Chief Executive is evaluated by the Chairman in individual meetings. The Chairman also leads the non-executive directors in a performance assessment of the executive directors and the Senior Independent Director leads the non-executive directors in a performance evaluation of the Chairman.
Executive directors are subject to regular review and the Group Chief Executive individually appraises the performance of each of the executive directors as part of the annual Group-wide performance evaluation of all staff.
The Group also uses Egon Zehnder International as executive search consultants, but does not believe there is a conflict of interest, particularly as the Group has relationships with other search firms.
MeetingsDuring 2010 the Board held ten scheduled meetings and met on a further fifteen occasions to discuss extraordinary business. One separate strategy event was held during the year. A detailed forward agenda has been in operation for a number of years. This is kept updated to reflect not only scheduled regular items of business but also any topical matters arising during the year.
Each year at least one Board meeting is held at a Group business operation in order to facilitate a fuller understanding of that business. In November 2010 a Board meeting was held in Jakarta, Indonesia where the directors met with senior members of the Asia management team and attended a series of presentations on the business.
CORPORATE GOVERNANCE
GOVERNANCE > CORPORATE GOVERNANCE > CONTINUED

107G
OV
ER
NA
NC
E
The table above details the number of Board and Committee meetings attended by each director throughout the year. Where directors were not able to attend a meeting, their views were canvassed by the Chairman prior to the meeting. A further ten ad hoc Board Committee meetings took place during the year which had been convened to finalise arrangements for matters discussed by the Board, such as approvals of periodic financial reports and corporate transactions.
The Chairman met with the non-executive directors without the executive directors being present seven times during the year.
Conflicts of interestDirectors have a statutory duty to avoid conflicts of interest with the Company. The Company’s Articles of Association allow the directors to authorise conflicts of interest and the Board has adopted a policy and effective procedures on managing and, where appropriate, approving conflicts or potential conflicts of interest. Under these procedures directors are required to declare all directorships or other appointments to companies which are not part of the Group as well as other situations which could result in conflicts or could give rise to a potential conflict. The Nomination Committee, or the Board where appropriate, evaluates and approves each such situation individually where applicable.
Meeting attendance for 2010
Scheduled Board
Meetings
Unscheduled Board
Meetings
AuditCommittee
Meetings
Remuneration Committee
Meetings
Nomination Committee
Meetings
Number of meetings in year 10 15 171 7 6
CHAIRMANHarvey McGrath 10 (10) 15 (15) – – 6 (6)
EXECUTIVE DIRECTORSTidjane Thiam 10 (10) 15 (15) – – –Nic Nicandrou 10 (10) 15 (15) – – –Rob Devey 10 (10) 14 (15) – – –Clark Manning2 10 (10) 14 (15) – – –Michael McLintock 10 (10) 15 (15) – – –Barry Stowe 9 (10) 13 (15) – – –
NON-EXECUTIVE DIRECTORSKeki Dadiseth 7 (10) 13 (15) – 6 (7) –Howard Davies3, 8 1 (2) – 1 (1) – –Michael Garrett 10 (10) 12 (15) – 6 (7) –Ann Godbehere 10 (10) 13 (15) 17 (17) – –Bridget Macaskill 10 (10) 14 (15) – 7 (7) 6 (6)Paul Manduca4, 8 2 (2) – 0 (1) 0 (1) –Kathleen O’Donovan5 10 (10) 15 (15) 16 (17) – 1 (1) James Ross6 10 (10) 14 (15) – 6 (6) 6 (6)Lord Turnbull7 10 (10) 14 (15) 13 (16) 1 (1) –
Figures in brackets indicate the maximum number of meetings which the individual could have attended in the period in which they were a Board or Committee member.
Notes1 The Audit Committee held eight scheduled meetings during the year and nine unscheduled meetings to discuss extraordinary business.2 Ceased to be a director with effect from 1 January 2011.3 Appointed as a director and Chairman of Risk Committee on 15 October 2010 and member of the Audit Committee on 9 November 2010.4 Appointed as a director on 15 October 2010, as a member of the Audit and Remuneration Committee on 9 November 2010 and as a member
of the Nomination Committee on 1 January 2011.5 Appointed as a member of the Nomination Committee on 9 November 2010.6 Ceased to be a member of the Remuneration Committee on 9 November 2010.7 Ceased to be a member of the Audit Committee and joined the Remuneration Committee on 9 November 2010.8 Were unable to attend certain of the scheduled meetings due to pre-existing commitments at the time of appointment to the Board.

108
Prudential plc Annual Report 2010
Directors’ interests Individual directors’ interests are set out on page 135 of the Directors’ Remuneration Report.
External appointmentsThe Board was satisfied that during 2010 the Chairman’s other commitments did not hinder the day-to-day performance of his duties for the Group and that he had the commitment and capability to make himself available under unforeseen circumstances. The major commitments of the Chairman, including changes during the year where applicable, are detailed in his biography on page 101.
Directors may hold directorships or other significant interests with companies outside of the Group which may have business relationships with the Group.
Executive directors may accept external directorships and retain any fees earned from those directorships subject to prior discussion with the Group Chief Executive and always provided this does not lead to any conflicts of interest. In line with the Combined Code 2008, executive directors would be expected to hold no more than one non-executive directorship of a FTSE 100 company. Some of our executive directors hold directorships or trustee positions of unquoted companies or institutions. Details of any fees retained are included in the Directors’ Remuneration Report on page 135 and major commitments of our executive directors are detailed in their biographies on pages 100 to 103.
Non-executive directors may serve on a number of other boards provided that they are able to demonstrate satisfactory time commitment to their role at Prudential and that they discuss any new appointment with the Chairman prior to accepting. This ensures that they do not compromise their independence and
that any potential conflicts of interest and any possible issues arising out of the time commitments required by the new role can be identified and addressed appropriately. The major commitments of our non-executive directors are detailed in their biographies set out on pages 100 to 103.
Directors’ indemnities and protections The Company has arranged appropriate insurance cover in respect of legal action against directors and senior managers of companies within the Prudential Group. In addition, the Articles of Association of the Company permit the directors and officers of the Company to be indemnified in respect of liabilities incurred as a result of their office. Prudential also provides protections for directors and senior managers of companies within the Group against personal financial exposure they may incur in their capacity as such. These include qualifying third-party indemnity provisions (as defined where relevant by the Companies Act 2006) for the benefit of directors of Prudential plc and other such persons including, where applicable, in their capacity as directors of other companies within the Group. These indemnities were in force during 2010 and remain in force.
CommitteesThe Board has established Audit, Remuneration and Nomination Committees as principal standing committees of the Board with written terms of reference which are kept under regular review. In November 2010 the Board established a further committee, the Risk Committee, to assist the Board in carrying out its duties in respect of monitoring and overseeing Group-wide risk. These committees are key elements of the Group’s corporate governance framework and reports on each committee are included below.
CORPORATE GOVERNANCE
GOVERNANCE > CORPORATE GOVERNANCE > CONTINUED
PRUDENTIAL PLC
• Chairman
• Nine non-executive directors
• Six executive directors at 31 December 2010 (seven from 1 January 2011)
AUDIT COMMITTEE
• Four non-executive directors
REMUNERATION COMMITTEE
• Five non-executive directors
NOMINATION COMMITTEE
• Four non-executive directors and the Chairman
RISK COMMITTEE
• Four non-executive directors

109G
OV
ER
NA
NC
E
Audit Committee ReportThis report sets out the responsibilities of the Group Audit Committee (the Committee) and the activities carried out by the Committee during the year.
Role of the CommitteeThe Committee’s principal responsibilities for 2010 consisted of oversight over financial reporting, internal controls and risk management, and monitoring auditor independence. Its duties include gaining assurance on the control over financial processes and the integrity of the Group’s financial reports, monitoring the performance, objectivity and independence of the external auditor, and reviewing the work of the internal auditor. With the establishment of the Risk Committee, the oversight of risk management has transferred to that Committee with effect from 2011.
In performing its duties, the Audit Committee has access to employees and their financial or other relevant expertise across the Group and to the services of the Group-wide Internal Audit Director and the Company Secretary. The Committee may also seek external professional advice at the Group’s expense.
The Committee’s terms of reference, which are set by the Board and kept under regular review, are available on our website at www.prudential.co.uk/prudential-plc/aboutpru/corporategovernance/ Alternatively, copies may be obtained upon request from the Company Secretary at the Company’s registered office.
MembershipThe Committee is comprised exclusively of independent non-executive directors of the Company as set out below:
Ann Godbehere (Chairman)Kathleen O’Donovan Lord Turnbull (to 9 November 2010)Paul Manduca (from 9 November 2010)Howard Davies (from 9 November 2010)
Membership is selected to provide a broad set of financial, commercial and other relevant experience to meet the Committee’s objectives.
The Board has determined that both Ann Godbehere and Kathleen O’Donovan have recent and relevant financial experience for the purposes of the Combined Code 2008 and the Hong Kong Listing Rules. In June 2010 the Board designated Ann Godbehere as its Audit Committee financial expert for Sarbanes-Oxley Act purposes. This will be reviewed during 2011 in conjunction with the publication of Form 20-F.
Full biographical details of the members of the Committee, including their relevant experience, are set out on pages 100 to 103.
MeetingsThe Committee held eight scheduled meetings during the year and met on a further nine occasions to discuss extraordinary business. Individual attendance for the meetings is given in the table on page 107. By invitation, the Chairman of the Board, the Group Chief Executive, the Chief Financial Officer, the Group General Counsel and Company Secretary, the Group-wide Internal Audit Director, the Group Chief Risk Officer and other senior staff from the Group finance, internal audit, risk, compliance and security functions as well as the lead partner of the external auditor, attended meetings. Other partners and staff of the external auditor also attended some of the meetings to contribute to the discussions relating to their area of expertise.
A detailed forward agenda has been in operation for a number of years and is reviewed and updated continually to ensure that all matters for which the Committee is responsible are addressed at the appropriate time of year. The Committee’s principal business during the year consisted of the following:
• review of half-year and full-year results, the annual report and accounts and other significant announcements, where appropriate;
• examination of critical accounting policies and key judgmental areas;
• review of changes in and implementation of Group Accounting Policies in compliance with International Financial Reporting Standards and practices;
• review of the Group’s tax matters;• approval of the external auditor’s management representation
letter, review of the external auditor’s full-year memorandum and external audit opinion;
• review of US filings and related external audit opinions;• monitoring of auditor independence and the external auditor’s
plans and audit strategy, the effectiveness of the external audit process, the external auditor’s qualifications, expertise and resources, and making recommendations for the re-appointment of the external auditor;
• monitoring of the framework and effectiveness of the Group’s systems of internal control, including the Turnbull compliance statement and Sarbanes-Oxley procedures;
• monitoring the effectiveness of both the Group’s risk framework and the management of key financial and operational risks;
• review of the internal audit plan and resources, and monitoring of the audit framework and internal audit effectiveness;
• monitoring the effectiveness of compliance processes and controls, and performance against the Group Compliance Plan;
• review of anti-money laundering procedures and allegations received via the employee confidential reporting lines; and
• review of its own effectiveness and terms of reference.

110
Prudential plc Annual Report 2010
In addition, the Committee received in-depth presentations on a range of topics. Throughout the year, the Committee received the minutes of the Disclosure Committee and the Group Operational Risk Committee and noted their activities. From November, the Committee further noted the minutes and activities of the Assumptions Approvals Committee. Further information on the Disclosure Committee and on risk governance appears on pages 119 and 115 to 116 respectively.
The Chairman reported to the Board on matters of particular significance after each Committee meeting and the minutes of Committee meetings were circulated to all Board members.
The Committee recognises the need to meet without the presence of executive management. Such sessions were held with the external and internal auditors in February and October 2010. At all other times management and auditors have open access to the Chairman.
Financial reporting As part of its review of financial statements prior to recommending their publication to the Board, the Committee focused on: critical accounting policies and practices and any changes, decisions requiring a major element of judgement, unusual transactions, clarity of disclosures, significant audit adjustments, the going concern assumption, compliance with accounting standards, and compliance with obligations under applicable laws, regulations and governance codes.
In addition, the Committee is regularly briefed by management on developments in International Financial Reporting Standards.
Confidential reporting One of the standing agenda items of the Committee is to review a report on the use of the confidential reporting procedures, which are available to employees to enable them to communicate confidentially, and anonymously if they so wish, on matters of concern and actions taken in response to these communications. No material control implications were raised through these procedures during the year.
Business unit audit committeesEach business unit has its own audit committee whose members and chairmen comprise primarily senior management and are independent of the respective business unit. The minutes of these committees are reported regularly to the Committee and their meetings are attended by senior management of the respective business unit, including the business units' heads of finance, risk, compliance and Group-wide internal audit. Business unit audit committees have adopted standard terms of reference across the Group with minor variations to address overseas requirements or particular requirements of the business. The terms of reference of those committees were reviewed during the year and all include escalation of significant matters to the Committee, recommendations for approval of the business unit internal audit plans and overseeing the adequacy of internal audit resources. Also included are presentations from
the external auditor. During the year the business unit audit committees reviewed their respective internal audit plans, resources and the results of internal audit work, and both external and internal auditors were able to discuss any relevant matters with the Chairman and members of the Committee as required.
Internal control and risk management The Committee reviewed the Group’s statement on internal control systems prior to its endorsement by the Board. It also reviewed the policies and processes for identifying, assessing and managing business risks.
Pursuant to the requirements of Section 404 of the Sarbanes-Oxley Act, the Group undertakes an annual assessment of the effectiveness of internal control over financial reporting. Further details are provided below.
Internal auditThe Committee regards its relationship with the internal audit function as pivotal to the effectiveness of its own activities. Group-wide Internal Audit plays an important role in supporting the Committee to fulfil its responsibilities under the Corporate Governance Codes and the Sarbanes-Oxley Act and provides independent assurance on the Company’s processes of identification and control of risk. The Committee agreed the work programme of the internal audit function to be undertaken during 2010. Each of the Group’s business units has an internal audit team, the heads of which report to the Group-wide Internal Audit Director. Internal audit resources, plans and work are overseen by the Committee and by the business unit audit committees. Total internal audit headcount across the Group stands at 108. The Group-wide Internal Audit Director reports functionally to the Committee and for management purposes to the Chief Financial Officer.
Formal reports are submitted to Committee meetings, with interim updates where appropriate, and views are also sought at the private meetings between the Committee and the internal auditors as well as during regular private meetings between the Chairman of the Committee and the Group-wide Internal Audit Director.
The Committee assesses the effectiveness of the internal audit function by means of regular reviews, some of which are carried out by external advisers, and through ongoing dialogue with the Group-wide Internal Audit Director. External reviews of Group-wide internal audit arrangements and standards were last conducted in 2006 and 2007 to ensure that the activities and resources of internal audit are most effectively organised to support the oversight responsibilities of the Committee. These reviews, performed by Deloitte, confirmed that the internal audit function complies with the Institute of Internal Auditors' international standards for the professional practice of internal auditing and concluded that the function was operating effectively. An internal assessment of the internal audit function was performed by the Group-wide Internal Audit Director in
CORPORATE GOVERNANCE
GOVERNANCE > CORPORATE GOVERNANCE > CONTINUED

111G
OV
ER
NA
NC
E
subsequent years based on internal audit’s ongoing self-assessment processes and using a maturity model derived from the review criteria used by Deloitte. The assessment confirmed that the internal audit function conforms to the Institute of Internal Auditors' international standards and continues to operate effectively in all areas of professional practice. The results of the last assessment were reported in detail to the Committee in February 2011. An external review of internal audit arrangements and standards in UKIO was conducted in 2010 to ensure that the activities and resources of internal audit were effectively organised to support the oversight responsibilities of the Business Unit Audit Committee in the UK. This review, performed by PwC, confirmed that the internal audit function for UKIO complies with the Institute of Internal Auditors' international standards for the professional practice of internal auditing and was operating effectively. The next external review of Group-wide internal audit arrangements and standards is scheduled for 2011.
External auditThe Committee has a key oversight role in relation to the external auditor, KPMG Audit Plc, whose primary relationship is with the Committee. The Group’s Auditor Independence Policy ensures that the independence and objectivity of the external auditor is not impaired. The policy sets out four key principles which underpin the provision of non-audit services by the external auditor, namely that the auditor should not:
• audit its own firm’s work; • make management decisions for the Group;• have a mutuality of financial interest with the Group; or • be put in the role of advocate for the Group.
All services provided by the auditor under this policy are provided in accordance with a pre-approved budget and are reviewed by the Committee and approved where necessary. The Committee regularly reviews and updates the policy to ensure alignment with the latest standards and best practice in establishing, maintaining and monitoring auditor independence and objectivity.
Fees payable to the auditor For the year ended 31 December 2010 the Committee approved fees of £10.4 million to its auditor, KPMG Audit Plc, for audit services and other services supplied pursuant to relevant legislation. In addition, the Committee approved fees of £7.3 million to KPMG for services not related to audit work which accounted for 42 per cent of total fees paid to the external auditor in the year. Excluding services relating to the AIA transaction, this amounted to £1.8 million for services not related to audit work which in turn amounted to only 10 per cent of fees paid to the external auditor. In accordance with the Group’s Auditor Independence Policy, all services were approved prior to work commencing and each of the non-audit services was confirmed to be permissible for the external auditor to undertake
as defined by the Sarbanes-Oxley Act. The Committee reviewed the non-audit services being provided to the Group by KPMG at regular intervals during 2010. A summary of audit fees is provided in Note I6 of the Group Financial Statements.
Auditor performance and independenceAs part of its work during 2010, the Committee assessed the performance of the external auditor, its independence and objectivity, and the effectiveness of the audit process. In addition to questioning the external auditor, which is a regular feature of meetings, the review of the effectiveness of the external audit process was conducted through a questionnaire-based exercise administered by Group-wide Internal Audit. The Committee reviewed the external audit strategy and received reports from the auditor on its own policies and procedures regarding independence and quality control, including an annual confirmation of its independence in line with industry standards.
Re-appointment of auditor The Group operates a policy under which at least once every five years a formal review is undertaken by the Committee to assess whether the external audit should be re-tendered. The external audit was last put out to competitive tender in 1999 when the present auditor was appointed. Since 2005 the Committee has annually considered the need to re-tender the external audit service. It again considered this in February 2011 and concluded that there was nothing in the performance of the auditor requiring a change. In 2007 a new lead audit partner was appointed by KPMG Audit Plc, in line with the Auditing Practices Board Ethical Statements and the Sarbanes-Oxley Act.
Following its review of the external auditor’s effectiveness and independence, the Committee has recommended to the Board that KPMG Audit Plc be re-appointed as auditor of the Company and a resolution for the re-appointment of KPMG Audit Plc as auditor of the Company will be put to a shareholder vote at the Annual General Meeting on 19 May 2011.
Review of Committee effectivenessAs part of the performance evaluation of the Board, the Committee undertook an externally facilitated performance assessment of the qualitative aspects of its performance during the year. The results of this assessment were reported to the Board in February 2011. In addition, an internal evaluation was carried out addressing compliance with various regulations and codes of conduct applicable to the Committee, and the results of that assessment were reported to the Committee in February 2011. The Committee is satisfied, based on the findings of both the internal and external review, that it had been operating as an effective audit committee throughout the year. Further reviews of the effectiveness of the Committee will be undertaken regularly and will, from time to time, be conducted by external consultants.

112
Prudential plc Annual Report 2010
Remuneration Committee Report Role of the CommitteeThe Remuneration Committee (the Committee) determines the remuneration packages of the Chairman and executive directors. It also agrees the principles and monitors the level and structure of remuneration for a defined population of management as determined by the Board. In framing its remuneration policy, the Committee has given full consideration to the provisions of Schedule A to the Combined Code 2008. The Directors’ Remuneration Report prepared by the Board is set out in full on pages 123 to 148. In preparing the report, the Board has followed the provisions of the Combined Code 2008, the Code of Corporate Governance Practices in Appendix 14 of the Rules Governing the Listing of Securities on the Stock Exchange of Hong Kong, the Listing Rules of the Financial Services Authority and the Companies Act 2006.
Except in relation to the remuneration of the Group Chief Executive, when only the Chairman is consulted, the Committee consults the Chairman and the Group Chief Executive about the Committee's proposals relating to the remuneration of all executive directors. The Committee has access to professional advice inside and outside the Company.
The Committee’s terms of reference, which are set by the Board and kept under regular review, are available on our website at www.prudential.co.uk/prudential-plc/aboutpru/corporategovernance/ Alternatively, copies may be obtained upon request from the Company Secretary at the Company’s registered office.
The terms of reference comply with all significant aspects of relevant investor guidelines and require the Committee to ensure that the Company adopts a remuneration policy which rewards executive directors for their contribution to sustainably and responsibly enhancing shareholder value.
MembershipThe Committee is comprised exclusively of independent non-executive directors of the Company as set out below.
Bridget Macaskill (Chairman)Keki Dadiseth Michael GarrettJames Ross (to 9 November 2010)Lord Turnbull (from 9 November 2010)Paul Manduca (from 9 November 2010)
Full biographical details of the members of the Committee, including their relevant experience are set out on pages 100 to 103.
MeetingsThe Committee normally has scheduled meetings at least four times a year and a number of additional meetings, as required, to review remuneration policy and the application of that policy. While the Chairman and Group Chief Executive are not members, they attend meetings unless they have a conflict of interest. During 2010 a total of seven Committee meetings were held. Details of Committee members’ attendance is set out on page 107. Full details of the activities of the Remuneration Committee are set out in the Directors’ Remuneration Report on page 123 to 148.
Nomination Committee Report Role of the CommitteeThe Nomination Committee (the Committee), in consultation with the Board, evaluates the balance of skills, knowledge and experience on the Board and identifies the roles and capabilities required at any given time taking into account the Group’s business and with due regard for the benefits of diversity on the Board, including gender. Candidates are considered on merit against those criteria and the Committee makes recommendations to the Board regarding suitable candidates for appointments. In appropriate cases search consultants are used to identify candidates. The Committee also reviews conflicts of interest or potential conflicts of interest raised by directors between Board meetings or for prospective new Board members. In cases where there might be an actual or potential conflict of interest the Committee has powers to authorise any such actual or potential conflict situation on behalf of the Board, imposing any terms and conditions it deems appropriate, or to make recommendations to the Board as to whether the conflict or potential conflict should be authorised and on what terms.
During 2010 the Committee met six times and recommended to the Board that Howard Davies and Paul Manduca, who were both appointed with the assistance of external search consultants, be appointed as non-executive directors. The Committee further recommended the appointment of Mike Wells and John Foley as executive directors with effect from January 2011. Full biographical details of the directors are set out on pages 100 to 103.
The Committee’s terms of reference, which are set by the Board and kept under regular review, are available on our website at: www.prudential.co.uk/prudential-plc/aboutpru/corporate governance/ Alternatively, copies may be obtained upon request from the Company Secretary at the Company’s registered office.
CORPORATE GOVERNANCE
GOVERNANCE > CORPORATE GOVERNANCE > CONTINUED

113G
OV
ER
NA
NC
E
MembershipThe Committee is comprised of independent non-executive directors and the Chairman, as set out below:
Harvey McGrath (Chairman)Bridget Macaskill James Ross Kathleen O’Donovan (from 9 November 2010)Paul Manduca (from 1 January 2011)
MeetingsThe Committee meets as required to consider candidates for appointment to the Board and to make recommendations to the Board in respect of those candidates. The Group Chief Executive is closely involved in the work of the Committee and is invited to attend and contribute to meetings.
Details of Committee members’ attendance at meetings are set out on page 107.
The process of evaluating the skills and composition of the Board is ongoing and is kept under regular review in order to ensure appropriate plans for succession to the Board are in place.
Risk Committee ReportRole of the CommitteeThe Risk Committee was established in November 2010 and has responsibility for providing leadership, direction and oversight with regard to the Group’s overall risk appetite and tolerance and risk management framework, including risk policies and processes and controls, and to providing oversight in respect of the Group Chief Risk Officer’s responsibilities.
The Committee has terms of reference which are set by the Board and will be kept under regular review. The terms are available on our website at www.prudential.co.uk/prudential-plc/aboutpru/corporategovernance/ Alternatively, copies may be obtained from the Company Secretary at the Registered Office.
MembershipThe Committee is comprised of independent non-executive directors as set out below:
Howard Davies (Chairman)Ann GodbehereJames Ross Lord Turnbull
MeetingsThe Committee expects to hold at least four scheduled meetings a year. The Committee will report on its activities in the Annual Report 2011 after it has completed its first year of business.
Internal control and risk management The Board has overall responsibility for the system of internal control and risk management and for reviewing its effectiveness. The framework setting out the Group’s approach to internal control, risk management and corporate responsibility comprises the following:
• Group governance framework: Documents the Group’s internal control policies and processes in an online manual, including the Group’s risk framework, code of business conduct and detailed policies on key operational and financial risks. Business units are also required to follow any additional processes necessary to comply with local statutory and regulatory requirements.
• Group risk framework: Provides an overview of the Group-wide philosophy and approach to risk management and sets out the key risk management processes which support the Group’s compliance with internal, statutory and regulatory requirements.
• Corporate responsibility framework: Provides an overview of the Group-wide philosophy and approach to corporate responsibility; supports the Group’s commercial focus and the increasing challenges faced including changes in stakeholder expectations. A key element is the Group Code of Business Conduct which sets out the ethical standards the Board requires of itself, employees, agents and others working on behalf of the Group, in their dealings with employees, customers, shareholders, suppliers, and competitors, in the wider community and in respect of the environment.
The Business Review provides further detail on Prudential’s risk appetite and exposures on pages 80 to 86 and corporate responsibility activities on pages 91 to 98.

114
Prudential plc Annual Report 2010
Further details on the procedures for the management of risk and the systems of internal control operated by the Group are given in the section on Risk Governance on pages 115 to 116. The governance framework principally relates to the operational management of the Group’s businesses and includes pre-determined authority limits delegated by the Board in respect of matters which are necessary for the effective day-to-day running and management of the business. The Group Chief Executive has been delegated management authority by the Board and in turn grants authority to the executive, including the chief executive officers of each business unit who report to him for the management of that business unit. In addition, each of those chief executives has established a management board comprising the business unit’s most senior executives.
The system is regularly reviewed and complies with the Corporate Governance Codes. In complying with the Combined Code 2008, the Group follows the 2005 Turnbull Guidance relating to the sections of the Code dealing with risk management and internal control. The Board reviewed the effectiveness of the system of internal control in February 2011, covering all material controls, including financial, operational and compliance controls, risk management systems and the adequacy of the resources, qualifications and experience of staff of the issuer’s accounting and financial reporting function. The Board confirms that there is an ongoing process for identifying, evaluating and managing the significant risks faced by the Group, which has been in place throughout the period and up to the date of this report.
The chief executive and chief financial officer of each business unit annually certifies compliance with the Group’s governance, internal control and risk management requirements. The risk management function reviewed any matters identified by business units in their certification, and also assessed the risk and control issues that arose and were reported during the year. This included: routine and exception-based risk reporting; matters identified and reported by other Group Head Office oversight functions and the findings from the work of the internal audit function, who execute risk-based audit plans throughout the Group. The results were reported to, and reviewed by, the Group Audit Committee.
In line with the Turnbull guidance, the certification provided above does not apply to certain material joint ventures where the Group does not exercise full management control. In these cases, the Group satisfies itself that suitable governance and risk management arrangements are in place to protect the Group’s interests. However, the relevant Group company which is party to the joint venture must, in respect of any services it provides in support of the joint venture, comply with the requirements of the Group’s internal governance framework.
The internal control and risk management systems described above and also under the sections on Risk Governance on page 115 and the Group Audit Committee on page 109, cover the Company’s financial reporting process and the Group’s process for the preparation of consolidated financial statements.
CORPORATE GOVERNANCE
GOVERNANCE > CORPORATE GOVERNANCE > CONTINUED

115G
OV
ER
NA
NC
EGOVERNANCE > RISK GOVERNANCE
OrganisationPrudential’s risk governance framework requires that all of the Group’s businesses and functions establish processes for identifying, evaluating and managing the key risks faced by the Group. The framework is based on the concept of ‘three lines of defence’ (LoD): risk management, risk oversight and independent assurance.
The diagram above outlines the Group-level framework.
Risk management (1st LoD): As described in the corporate governance report, primary responsibility for strategy, performance management and risk control lies with the Board, which has established the Risk Committee to assist in providing leadership, direction and oversight, and with the Group Chief Executive and the chief executives of each business unit.
Balance Sheet and Capital Management Committee: Meets monthly to monitor the Group’s liquidity and oversee the activities of Prudential Capital.
Risk oversight (2nd LoD): Risk exposures are monitored and reviewed by Group-level risk committees chaired by the Group Chief Risk Officer or the Chief Financial Officer.
Group Executive Risk Committee: Meets monthly to oversee the Group’s risk exposures (market, credit, liquidity, insurance and operational risks) and to monitor capital.
Group Operational Risk Committee: Reports to the Group Executive Risk Committee and meets quarterly to oversee the Group’s non-financial (operational, business environment and strategic) risk exposures.
RISK GOVERNANCE
BOARD
BOARD
EXECUTIVES
MANAGEMENT
NOMINATIONCOMMITTEE
REMUNERATIONCOMMITTEE
GROUP RISKCOMMITTEE
GROUP AUDITCOMMITTEE
GROUP CEO
BSCMCCFO
GEC
GERC
GROUP CRO
GCRC
GROUPSECURITY
GROUPRISK
GROUP-WIDEINTERNAL AUDIT
GORC STOC
1st Line of Defence 2nd Line of Defence 3rd Line of Defence
Group-level framework
Board-level Committees
Executive personnel
Exec/Management Committee
GEC: Group Executive CommitteeBSCMC: Balance Sheet & Capital Management CommitteeGERC: Group Executive Risk CommitteeGCRC: Group Credit Risk CommitteeGORC: Group Operational Risk CommitteeSTOC: Solvency II Technical Oversight Committee (permanent
successor to Technical Assurance Committee)
GHO Functions
Direct Reporting Line
Regular Communication and Escalation
KEY
GROUPCOMPLIANCE

116
Prudential plc Annual Report 2010
Group Credit Risk Committee: Reports to the Group Executive Risk Committee and meets monthly to review the Group’s investment and counterparty credit risk positions.
Solvency II Technical Oversight Committee: Will be created when the Solvency II programme is complete, to provide ongoing technical oversight and advice to the executive and the Board in carrying out their duties with regard to the Group’s Internal Model.
The committees’ oversight is supported by the Group Chief Risk Officer with functional oversight provided by:
Group Security: Develop and deliver appropriate security measures to protect the Group’s staff, physical assets and intellectual property.
Group Compliance: Verify compliance with regulatory standards and inform the Group’s management and the Board on key regulatory issues affecting the Group.
Group Risk: Establish and embed a capital management and risk oversight framework and culture consistent with Prudential’s risk appetite that protects and enhances the Group’s embedded and franchise value.
Independent assurance: As described in the Corporate Governance Report, the Group Audit Committee, supported by Group-wide Internal Audit, provides independent assurance and oversight of the effectiveness of the Group’s system of internal control and risk management.
Principles and objectivesRisk is defined as the uncertainty that Prudential faces in successfully implementing its strategies and objectives. This includes all internal or external events, acts or omissions that have the potential to threaten the success and survival of Prudential.
The control procedures and systems established within the Group are designed to manage rather than eliminate the risk of failure to meet business objectives. They can only provide reasonable and not absolute assurance against material misstatement or loss and focus on aligning the levels of risk-taking with the achievement of business objectives.
Material risks will only be retained where this is consistent with Prudential’s risk appetite framework and its philosophy towards risk-taking, that is:
• the retention of the risk contributes to value creation,• the Group is able to withstand the impact of an adverse
outcome,• the Group has the necessary capabilities, expertise,
processes and controls to manage the risk.
The Group has five objectives for risk and capital management:
Framework: Design, implement and maintain a capital management and risk oversight framework consistent with the Group’s risk appetite and Risk-Adjusted Profitability (RAP) model.
Monitoring: Establish a ‘no surprises’ risk management culture by identifying the risk landscape, assessing and monitoring risk exposures and understanding change drivers.
Control: Implement risk mitigation strategies and remedial actions where exposures are deemed inappropriate and manage the response to extreme events.
Communication: Communicate the Group risk, capital and profitability position to internal and external stakeholders and rating agencies.
Culture: Foster a risk management culture, providing quality assurance and facilitating the sharing of best practice risk measurement and management across the Group and industry.
ReportingThe Group's economic capital position and overall position against risk limits is reviewed regularly by the Group Executive Risk Committee. Key economic capital metrics, as well as RAP information, are included in business plans, which are reviewed by the Group Executive Committee and approved by the Board.
The Group Audit Committee and Group Risk Committee are provided with regular reports on the activities of Group Risk. These reports include information on the activities of the Group Operational Risk Committee and Group Credit Risk Committee.
Group Head Office oversight functions have clear escalation criteria and processes for the timely reporting of risks and incidents by business units. As appropriate, these risks and incidents are escalated to the various Group-level risk committees and the Board.
Internal business unit routine reporting requirements vary according to the nature of the business. Each business unit is responsible for ensuring that its risk reporting framework meets both the needs of the business unit (for example, reporting to the business unit risk and audit committees) and the minimum standards set by the Group (for example, to meet Group-level reporting requirements).
Business units review their risks as part of the annual preparation of their business plans, and review opportunities and risks against business objectives regularly with Group Head Office. Group Risk reviews and reports to Group Head Office on the impact of large transactions or divergences from business plan.
GOVERNANCE > RISK GOVERNANCE > CONTINUED
RISK GOVERNANCE

117G
OV
ER
NA
NC
EGOVERNANCE > RELATIONS WITH SHAREHOLDERS
RELATIONS WITH SHAREHOLDERS
Communication with shareholders As a major institutional investor, the Company is very aware of the importance of maintaining good relations with its shareholders. Discussions are held regularly with major shareholders and a programme of meetings took place during 2010. In addition, Prudential also held an investor day in December 2010 and plans to make this an annual event. A perception survey into the views of the Company’s major investors is undertaken regularly by an independent firm and the results of this survey are presented to the Board. Board members also regularly receive copies of the latest analysts’ and brokers’ reports on the Company and the sector to further develop their knowledge and understanding of external views about the Company. The Chairman and the non-executive directors provided feedback to the Board on topics raised with them by major shareholders. Should major shareholders wish to meet newly appointed directors, or any of the directors generally, they are welcome to do so.
The Group maintains a corporate website www.prudential.co.uk containing a wide range of relevant information for private and institutional investors, including the Group’s financial calendar. The shareholder information section on pages 443 to 444 contains further details which may be of interest to shareholders.
Annual General MeetingThe Annual General Meeting will be held in the Churchill Auditorium at The Queen Elizabeth II Conference Centre, Broad Sanctuary, Westminster, London SW1P 3EE on 19 May 2011 at 11.00am. The Company believes the Annual General Meeting is an important forum for both institutional and private shareholders and encourages all its shareholders to vote. Shareholders are given the opportunity during annual general meetings to put questions to the Board on matters relating to the Group’s operations and performance.
At the 2010 Annual General Meeting, the Company continued its practice of calling a poll on all resolutions. The voting results and all proxies lodged prior to the meeting were displayed at the meeting and published on the Company's website. This practice provides shareholders present with sufficient information regarding the level of support and opposition to each resolution and ensures that all votes cast, either at the meeting or through proxies, are included in the result.
Company constitutionThe Company is governed by the Companies Act 2006, other applicable legislation and regulation as well as by provisions of its Articles of Association. The Articles of Association are available on our website at www.prudential.co.uk/ prudential-plc/aboutpru/memorandum
Any change to the Articles must be approved by special resolution of the shareholders in accordance with the provisions of the Companies Act 2006.
Share capital On 31 December 2010, the Company’s issued share capital, which is set out in Note H11 on page 321, consisted of 2,545,594,506 (2009: 2,532,227,471) ordinary shares of 5 pence each, all fully paid up and listed on the London Stock Exchange and the Stock Exchange of Hong Kong. The number of accounts on the share register at 31 December 2010 was 66,048 (2009: 71,700). The Company maintains secondary listings on the New York Stock Exchange in the form of American Depositary Shares which are referenced to its ordinary shares, under a depositary agreement with J.P. Morgan, and on the Singapore Stock Exchange.
In compliance with the Rules Governing the Listing of Securities on the Stock Exchange of Hong Kong, the Company has maintained a public float of at least 25 per cent of the issued share capital from the date of listing on 25 May 2010 to the date of this report.
A number of dividend waivers are in place and these relate to shares issued, but not allocated, under the Group’s employee share plan. These shares are held by the Trustees and will, in due course, be used to satisfy requirements under the Group’s employee share plans.

118
Prudential plc Annual Report 2010
GOVERNANCE > RELATIONS WITH SHAREHOLDERS > CONTINUED
Rights and obligations The rights and obligations attaching to the Company’s shares are set out in full in the Company’s Articles of Association. There are currently no voting restrictions on the ordinary shares, all of which are fully paid, and each share carries one vote on a poll. If votes are cast on a show of hands, each shareholder present in person or by proxy, or in the case of a corporation, each of its duly authorised corporate representatives, has one vote, unless the proxy is appointed by more than one member in which case the proxy has one vote for and one vote against if the proxy has been instructed by one or more members to vote for the resolution and by one or more members to vote against the resolution.
Where, under an employee share plan operated by the Company, participants are the beneficial owners of the shares but not the registered owners, the voting rights are normally exercisable by the registered owner in accordance with the relevant plan rules. Trustees may vote at their discretion, but do not vote on any unawarded shares held as surplus assets.
As at 8 March 2011, Trustees held 0.19 per cent of the issued share capital of the Company under the various plans in operation.
Rights to dividends under the various schemes are set out in Note I4 on page 345.
Restrictions on transferIn accordance with English company law, shares may be transferred by an instrument of transfer or through an electronic system (currently CREST) and transfer is not restricted except that the directors may, in certain circumstances, refuse to register transfers of shares, but only if such refusal does not prevent dealings in the shares from taking place on an open and proper basis. If the directors make use of that power, they must send the transferee notice of the refusal within two months.
Certain restrictions may be imposed from time to time by applicable laws and regulations (for example, insider trading laws) and pursuant to the Listing Rules of both the Financial Services Authority and the Stock Exchange of Hong Kong, as well as Prudential’s own share dealing rules, whereby directors and certain employees of the Company require the approval of the Company to deal in the Company’s ordinary shares.
Some of the Company’s employee share plans include restrictions on transfer of shares while the shares are subject to the plan. As described in the Directors’ Remuneration Report, non-executive directors use a proportion of their fees to purchase shares in the Company which may not normally be transferred during a director’s period of office. In addition, all directors are required to obtain a number of qualification shares within one year of appointment, which they would also be expected to retain during their tenure of office. Executive directors are also required to build up their shareholding in the Company.
Significant shareholdingsAs at 8 March 2011, the Company had received notification, in accordance with Rule 5.1.2 R of the Disclosure and Transparency Rules of the Financial Services Authority, from Capital Research and Management Company, Blackrock Inc., Norges Bank and Legal and General Group plc that they held 11.65 per cent, 5.01 per cent, 4.01 per cent and 3.99 per cent respectively of the Company’s issued ordinary share capital at the time of notification.
Authority to issue sharesThe directors require authority from shareholders in relation to the issue of shares by the Company. Whenever shares are issued the Company has to offer the shares to existing shareholders pro rata to their holdings unless it has been given authority by shareholders to issue shares without offering them first to existing shareholders. The Company seeks authority from its shareholders on an annual basis to issue shares up to a maximum amount and to issue up to five per cent of its issued share capital without observing pre-emption rights, in line with relevant regulations and best practice. Dis-application of statutory pre-emption procedures is also sought for rights issues. The Company’s existing authorities to issue shares and to do so without observing pre-emption rights are due to expire at the end of this year’s Annual General Meeting. An ordinary resolution and a special resolution to approve the renewal of these authorities respectively, will be put to shareholders at the Annual General Meeting on 19 May 2011.
Details of shares issued during 2009 and 2010 are given in note H11 on page 321.
In accordance with the terms of a waiver granted by the Hong Kong Stock Exchange, the Company confirms that it complies with the applicable law and regulation in the UK in relation to the holding of shares in treasury and with the conditions of the waiver in connection with the purchase of own shares and any treasury shares it may hold.
RELATIONS WITH SHAREHOLDERS

119G
OV
ER
NA
NC
E
Authority to purchase own sharesThe directors also require authority from shareholders in relation to the purchase of own shares by the Company. The Company seeks authority by special resolution on an annual basis for the buyback of its own shares in accordance with the relevant provisions of the Companies Act 2006 and other related guidance. The Company has not made use of that authority since it was last granted at its Annual General Meeting in 2010. This existing authority is due to expire at the end of this year’s Annual General Meeting. A special resolution to approve the renewal of this authority will be put to shareholders at the Annual General Meeting on 19 May 2011. Model Code for Securities Transactions by DirectorsPrudential has adopted share dealing rules which incorporate the UK Model Code on share dealing and the Hong Kong Model Code for Securities Transactions by Directors. Prudential operates various employee share plans and has obtained a number of waivers from the Stock Exchange of Hong Kong in order to facilitate the normal operation of those plans.
Following specific enquiry, the directors have confirmed their compliance with these rules.
US corporate governance and regulations As a result of the listing of its securities on the New York Stock Exchange, the Company is required to comply with the relevant provisions of the Sarbanes-Oxley Act 2002 (the ‘Act’) as they apply to foreign private issuers and has adopted procedures to ensure this is the case.
In particular, in relation to the provisions of Section 302 of that Act, which covers disclosure controls and procedures, a Disclosure Committee has been established reporting to the Group Chief Executive, chaired by the Chief Financial Officer and comprising members of senior management. The objectives of this Committee are to:
• assist the Group Chief Executive and the Chief Financial Officer in designing, implementing and periodically evaluating the Company’s disclosure controls and procedures;
• monitor compliance with the Company’s disclosure controls and procedures;
• review and provide advice to the Group Chief Executive and Chief Financial Officer with regard to the scope and content of all public disclosures made by the Company which are of material significance to the market or investors; and
• review and consider, and where applicable follow up on, matters raised by other components of the disclosure process. These may include, to the extent they are relevant to the disclosure process, any matters to be raised with the Group Audit Committee, the internal auditors or the external auditor of the Company’s internal controls.
In discharging these objectives, the Committee helps to support the certifications by the Group Chief Executive and the Chief Financial Officer of the effectiveness of disclosure procedures and controls required by Section 302 of the Act.
The provisions of Section 404 of the Act require the Company's management to report on the effectiveness of internal controls over financial reporting in its annual report on Form 20-F, which is filed with the US Securities and Exchange Commission. To comply with this requirement to report on the effectiveness of internal control, the Group has documented and tested its internal controls over financial reporting in the format required by the Act. The annual assessment and related report from the external auditor will be included in the Group's annual report on Form 20-F, which will be published in the coming months.
In addition, the Disclosure Committee evaluates whether or not a particular matter requires disclosure to the market, taking into account relevant regulations.

120
Prudential plc Annual Report 2010
GOVERNANCE > CORPORATE RESPONSIBILITY GOVERNANCE
The Board is committed to achieving the highest standards of corporate responsibility in directing and controlling the business. In terms of the governance of our corporate responsibility strategy, Harvey McGrath, the Chairman, has Board level responsibility for social, environmental and ethical risk management. The Board discusses Prudential’s performance in these areas at least once a year and also reviews and approves Prudential’s corporate responsibility report and strategy on an annual basis.
Below Board level, the Responsibility Committee is a specialist Group-wide committee. This committee is responsible for reviewing Prudential’s business conduct and social and environmental policy and ensures consistency of approach across the Group’s international businesses. Consideration of environmental, social and community matters is embedded in our Code of Business Conduct and supported by our corporate responsibility philosophy and programme, which takes into account local cultures and requirements across our businesses.
The Corporate Responsibility team, which is located in our Group Head Office, develops Prudential’s corporate responsibility strategy and works closely with individual business units to provide advice. The team also assists with the development and adaptation of Group-wide initiatives so that they not only fit with our overall Group principles but are also adapted to meet local needs.
CORPORATE RESPONSIBILITY GOVERNANCE

121G
OV
ER
NA
NC
EGOVERNANCE > ADDITIONAL DISCLOSURES
The following additional disclosures are made in compliance with the Companies Act 2006, the Disclosure and Transparency Rules and the Corporate Governance Codes.
Financial reporting The directors have a duty to report to shareholders on the performance and financial position of the Group and are responsible for preparing the financial statements on pages 153 to 352 and pages 375 to 386 and the supplementary information on pages 389 to 433. It is the responsibility of the auditor to form independent opinions, based on its audit of the financial statements and its audit of the EEV basis supplementary information; and to report its opinions to the Company’s shareholders and to the Company. Its opinions are given on pages 388 and 435.
Company law requires the directors to prepare financial statements for each financial year which give a true and fair view of the state of affairs of the Company and of the Group. The criteria applied in the preparation of the financial statements are set out in the statement of directors' responsibilities on page 387.
The directors are further required to confirm that the directors’ report includes a fair review of the development and performance of the business, with a description of the principal risks and uncertainties. Such confirmation is included in the statement of directors' responsibilities on page 387.
The Chief Financial Officer's Review includes, on pages 80 to 86, a description of the Group's risk and capital management, which includes a description of the Group's liquidity position. These risks are also discussed in Note C to the financial statements on page 203. The Group has considerable internal and external financial resources and the directors believe that the Group is well placed to manage its business risks successfully.
The directors who held office at the date of approval of this directors’ report confirm that, so far as they are each aware, there is no relevant audit information of which the Company’s auditor is unaware; and each director has taken all the steps that he or she ought to have taken as a director to make himself or herself aware of any relevant audit information and to establish that the Company’s auditor is aware of that information. This confirmation is given and should be interpreted in accordance with the provisions of Section 418 of the Companies Act 2006.
Going concern After making enquiries the directors have a reasonable expectation that the Company and the Group have adequate resources to continue their operations for the foreseeable future. In support of this expectation, the Company’s business activities, together with the factors likely to affect its future development, successful performance and position in the current economic climate are set out in the Business Review on pages 17 to 98. The risks facing the Group’s capital and liquidity positions and their
sensitivities are referred to in the Chief Financial Officer’s Review. Specifically, the Group’s borrowings are detailed in Note H13 on pages 324 to 326, the market risk and liquidity analysis associated with the Group’s assets and liabilities can be found in Note G2 on pages 300 to 304, policyholder liability maturity profile by business units in Notes D2, D3, D4 on pages 232, 253 and 261 respectively, cash flow details in the consolidated statement of cash flows and provisions and contingencies in Note H14. The directors therefore have continued to adopt the going concern basis of accounting in preparing the financial statements.
Post-balance sheet events Important events affecting the Company after the end of the financial year are detailed in Note I12 on page 352.
Change of controlUnder the agreements governing Prudential Corporation Holdings Limited’s life insurance and fund management joint ventures with China International Trust & Investment Corporation (CITIC), if there is a change of control of the Company, CITIC may terminate the agreements and either (i) purchase the Company’s entire interest in the joint venture or require the Company to sell its interest to a third party designated by CITIC, or (ii) require the Company to purchase all of CITIC’s interest in the joint venture. The price of such purchase or sale is to be the fair value of the shares to be transferred, as determined by the auditor of the joint venture.
Essential contracts or arrangementsThere are a number of significant relationships with third parties, which have value to the business. No single relationship, however, is considered to be essential to the Group as a whole.
Compensation for loss of office None of the terms of employment of the Company's directors includes provisions for payment of compensation for loss of office or employment that occurs because of a takeover bid. Terms applying on a termination of their office are set out in the Directors' Remuneration Report. In the US, senior executives participate on a discretionary basis in a plan which entitles them to compensation, in the event that their employment is terminated or adversely affected as a result of a takeover.
CustomersThe five largest customers of the Group constituted in aggregate less than 30 per cent of its total sales for each of 2010 and 2009.
For the year ended 31 December 2010, none of the directors of the Company, their associates or any shareholders of the Company (which have, to the knowledge of the directors of the Company, owned more than 5 per cent of the Company’s issued share capital) had any interest in the Group's major customers.
ADDITIONAL DISCLOSURES

122
Prudential plc Annual Report 2010
GOVERNANCE > INDEX TO PRINCIPAL DIRECTORS’ REPORT DISCLOSURES
Information required to be disclosed in the directors’ report may be found in the following sections:
Information Section in Annual Report Page number(s)
Business review Overview and business review 1-98
Essential contracts or arrangements Additional disclosures 121
Disclosure of information to auditor Corporate governance 121
Directors in office during the year Board of directors 100-103; 104
Principal activities Business review 4-5; 87-89
Dividend recommended for the year Group Chief Executive’s report/Business review
13; 25
Details of qualifying third-party indemnity provisions Corporate governance 108
Political and charitable donations and expenditure Corporate responsibility review 97
Financial instruments – risk management objectives and policies
Business review 79
Post-balance sheet events Note I12 of the Notes on the Group Financial Statements and Additional disclosures
352
Future developments of the business of the Company Group Chief Executive's report 14
Employment policies and employee involvement Corporate responsibility review 93-94
Creditors – policy on payment and practice Corporate responsibility review 97
Structure of share capital, including restrictions on the transfer of securities, voting rights and significant shareholders
Corporate governance 117-119
Rules governing appointments of directors Corporate governance 105
Rules governing changes to the articles of association Corporate governance 117
Powers of directors Corporate governance 104
Significant agreements impacted by a change of control Additional disclosures 121
Agreements for compensation for loss of office or employment on takeover
Additional disclosures 121
In addition, the risk factors set out on pages 438 to 442 and the additional unaudited financial information set out on pages 353 to 374 are incorporated by reference into this directors' report.
Signed on behalf of the Board of directors
MARGARET COLTMANCOMPANY SECRETARY
8 March 2011
INDEX TO PRINCIPAL DIRECTORS’ REPORT DISCLOSURES

123D
IRE
CT
OR
S’
RE
MU
NE
RA
TIO
N R
EP
OR
T
DIRECTORS’ REMUNERATION REPORT124 Directors’ remuneration report

124
Prudential plc Annual Report 2010
DIRECTORS’ REMUNERATION REPORT
DIRECTORS’ REMUNERATION REPORT
DIRECTORS’ REMUNERATION REPORT
The Directors’ Remuneration Report has been prepared by the Remuneration Committee (the ‘Committee’) and has been approved by the Board. Shareholders will be given the opportunity to approve the report at the Annual General Meeting on 19 May 2011.
This report has been drawn up in accordance with the Combined Code on Corporate Governance, Schedule 8 of the Large and Medium Sized Companies and Groups (Accounts and Reports) Regulations 2008, the UK Listing Authority Listing Rules and the Code on Corporate Governance Practices in Appendix 14 of the Rules Governing the Listing of Securities on the Stock Exchange of Hong Kong. KPMG Audit Plc has audited the sections contained on pages 138 to 148.
During the year, the Company has complied with the provisions of Section 1 and Schedule A of the Combined Code on Corporate Governance then in force regarding directors’ remuneration.
Dear ShareholderI am pleased to present the Remuneration Committee’s report on directors’ remuneration for the year to 31 December 2010.
Firstly, I would like to welcome Lord Turnbull and Paul Manduca to the Committee. I would also like to thank James Ross, who has stepped down from the Committee after six years, for his contribution.
In May 2010, we listed our shares in Hong Kong and Singapore. As a result, you will find that some additional information is provided in this year’s Directors’ Remuneration Report and that the format used to present some data has been revised to comply with these new listing requirements.
The primary objective of our remuneration policy remains unchanged: to attract high calibre executives, to encourage them to contribute to the success of Prudential by achieving our business plans, generating returns for shareholders, and to reward them based on the Company’s success and their individual contributions. The policy supports the Company’s strategy and goals, and aims to comply with good practice in the markets where the Group operates.
2010 was another successful year for the Group. As you will see from our results, we have delivered outstanding business performance, achieving strong sales and profits. This demonstrates the success of the Group’s strategy of focusing on value over volume and capitalising on growth opportunities in our chosen markets around the world. The Group’s prudent but proactive risk based approach has ensured that our capital position remains robust and resilient. We have significantly out-performed our international peer group over the last three years, which resulted in full vesting under the Group Performance Share Plan.
In considering the 2010 Annual Bonus payments for executive directors, the Committee sought to balance the appropriate level of reward for the achievement of results which exceeded all performance targets with the costs associated with the proposed AIA transaction. After careful consideration, the Committee used its discretion to take the cost of the AIA transaction (which is excluded from the Group’s reported IFRS and EEV operating profit) fully into account in determining the results to be used for bonus purposes. Bonuses for all executive directors were therefore based on the results after all AIA transaction costs. For 2010, it was agreed with the Group Chief Executive that the portion of his bonus (50%) which would normally be payable immediately in cash would be converted into shares and deferred for three years.
In the Group Chief Executive's Report, Tidjane Thiam set out three Group-wide operating principles which have underpinned the sound management of the Group. These principles are reflected in the reward policies operated by the Group and in the way that the Remuneration Committee makes its decisions, as set out below:
Balanced approach to performance managementThe Group believes that sustainable growth requires new business profitability, IFRS profitability and cash generation to develop in parallel; no one of these measures should be achieved at the expense of the others. The basket of annual bonus plan measures rewards the simultaneous delivery of these key indicators. Bonuses are also determined by the achievement of personal measures which assess executives’ individual non-financial contributions to the development of the Group and to the execution of our strategy.
125D
IRE
CT
OR
S’
RE
MU
NE
RA
TIO
N R
EP
OR
T
Disciplined capital allocationThe Group has a rigorous focus on allocating capital to the geographies and products with the best returns and shortest payback opportunities. Our objective is to create the highest possible sustainable returns for shareholders, as reflected in our share price and dividends. To align the interests of our executives with those of our shareholders and to reward them for delivering these returns, the Group Performance Share Plan is based on total shareholder return and only rewards participants if the Group’s share price growth and dividends are superior to those provided by other international insurance organisations over a three-year period.
Proactive risk managementEffectively managing risk across our operations is essential if the growth which we create is to provide shareholders with lasting value. The Remuneration Committee is therefore mindful of the need for pay to reward the delivery of strong business results without encouraging inappropriate risk taking. Given the longevity of the products which we offer, an important aspect of our remuneration policy has always been a focus on sustainable long-term performance. We continue to achieve this in a number of ways including an emphasis on cash generation and preservation of capital in our annual bonus plan performance measures, the deferral of a proportion of the annual bonus into Company shares for three years and substantial shareholding guidelines for executives.
The Committee has and will continue to review the implications of emerging guidelines and regulations on our remuneration governance structures, policies and practices, and will implement any changes where appropriate.
I trust that you will endorse the policies outlined in our report.
BRIDGET MACASKILLCHAIRMAN, REMUNERATION COMMITTEE
8 March 2011

126
Prudential plc Annual Report 2010
DIRECTORS’ REMUNERATION REPORT
DIRECTORS’ REMUNERATION REPORT > CONTINUED
The Remuneration CommitteeThe Committee is responsible for:
• Determining the remuneration policy for the Chairman and the executive directors of the Company;
• Monitoring the remuneration of a defined leadership population and for individuals earning over £1 million per annum.
The Committee’s terms of reference are available on the Company’s website and a copy may be obtained from the Company Secretary. These terms of reference are reviewed annually.
Each Business Unit also has its own remuneration committee, with similar terms of reference, to ensure effective remuneration governance in all our businesses.
The members of the Committee during 2010 are listed below. All are independent non-executive directors:
Bridget Macaskill (Chairman)Keki Dadiseth FCA Michael GarrettJames Ross (until 9 November 2010)Lord Turnbull KCB CVO (from 9 November 2010)Paul Manduca (from 9 November 2010)
In 2010, the Committee met seven times. Some key activities during the year included:
• Reviewing the requirements of the latest governance guidelines and consultations, including the FSA’s revised Remuneration Code;
• Considering how remuneration arrangements should support the implementation of the Solvency II framework, due to be implemented in 2012;
• Considering the package to be offered to Mike Wells upon his appointment as President and CEO of Jackson and the payments to be made to Clark Manning as he transitioned out of this role;
• Agreeing the package to be offered to John Foley as he joined the Board as Group Chief Risk Officer;
• Establishing the performance measures and targets for the annual and long-term incentive plans, and considering the appropriate level of payments to be made; and
• Overseeing the remuneration of the Group Leadership Team (comprising around 100 senior individuals including the Group Executive Committee) and of employees with remuneration over £1 million per annum.
The Chairman and the Group Chief Executive attend meetings by invitation. The Committee also had the benefit of advice from the Chief Financial Officer, Group Chief Risk Officer, Group Human Resources Director and Director of Group Reward and Employee Relations. Individuals are never present when their own remuneration is discussed.
In making its decisions, the Committee called on advice from Deloitte LLP and PricewaterhouseCoopers LLP. Market data was sourced from Deloitte LLP, Towers Watson and McLagan Partners. Linklaters and Slaughter & May provided legal counsel, including advice on employment law and the operation of the Company’s share plans. Some of these firms also provided other services to the Company: Deloitte LLP, PricewaterhouseCoopers LLP and Slaughter & May in relation to taxation and other financial matters, Towers Watson in relation to actuarial advice and Slaughter & May in relation to commercial, corporate and general legal advice.

127D
IRE
CT
OR
S’
RE
MU
NE
RA
TIO
N R
EP
OR
T
Remuneration principlesIn determining remuneration policy, the Committee applies the following principles:
• A substantial portion of total remuneration is delivered through performance-related reward with the highest levels of reward only being paid for the highest levels of achievement;
• A significant element of performance-related reward is provided in the form of shares;
• The total remuneration package for each executive director is set with reference to the relevant employment market;
• The performance of business unit executive directors is measured at both a business unit and Group level;
• Performance measures include absolute financial measures and relative measures, as appropriate, to provide alignment between achieving results for shareholders and the rewards for executives;
• Reward structures are designed to deliver fair and equitable remuneration for all employees; and
• Reward arrangements are designed to minimise regulatory and operational risk.
These principles shape remuneration policies and practices which are aligned with our business model. They are designed to ensure that a strong governance approach is adopted and applied across all business units. The Committee continues to review these principles regularly.

128
Prudential plc Annual Report 2010
DIRECTORS’ REMUNERATION REPORT
DIRECTORS’ REMUNERATION REPORT > CONTINUED
Summary of main components of remuneration and related requirementsThe table below summarises the Company’s policies as they were applied during 2010. The Committee intends to adopt the same approach in 2011:
ELEMENT PURPOSE APPROACH
Total compensation Adopts appropriate compensation structures and reward payouts to attract high calibre executive directors.
Benchmarked against the relevant market for the role, taking into account the individual’s contribution and experience. Market position is compared with companies of similar size and complexity to Prudential in the relevant market for the role.
Consideration is also given to remuneration arrangements and levels offered to other Prudential employees.
Base salary Along with benefits, provides the guaranteed element of remuneration necessary to recruit and retain the best people to lead our business.
Based on scope of role and market position, as well as the individual’s contribution and experience, taking into account total remuneration, market movement of salaries in comparator organisations and salary increases for employees generally.
The Committee reviews salaries annually. Any changes in base salaries are effective from 1 January.
Annual bonus Rewards the achievement of business results and individual objectives in a given year.
Executive directors have annual bonus plans based on the achievement of Group and business unit financial performance measures and individual contribution. 2010 Group and business unit targets focused on profitability, cash flow and capital preservation.
Bonuses are not pensionable.
Deferred bonus Reinforces the need for annual results to be grounded in business performance which is sustained over the longer term.
Executive directors are required to defer between 30 per cent and 50 per cent of annual bonus (for Michael McLintock, 50 per cent of bonus over £500,000 is deferred) into Prudential shares for three years.
Long-term incentive Rewards executive directors for delivering sustainable long-term returns for shareholders.
All executive directors participate in the Group Performance Share Plan under which awards vest based on relative TSR performance against a peer group of international insurers.
Business unit Chief Executives also participate in business unit plans which focus on financial measures which contribute to the long-term success of the business unit and, therefore, the Group.

129D
IRE
CT
OR
S’
RE
MU
NE
RA
TIO
N R
EP
OR
T
ELEMENT PURPOSE APPROACH
All-employee share plans Offer all employees an opportunity to participate in the success of the Company.
The structure of plans is determined by market practice and local legislation. Executive directors are eligible to participate in all-employee plans on the same basis as other employees in their location.
Benefits Provide health and security benefits as part of the fixed element of remuneration. Set at an appropriate level compared with peers.
Executive directors receive benefits, for example participation in medical insurance schemes, the use of a car and driver, and security arrangements. No benefits are pensionable.
Executive directors are also entitled to participate in M&G investment products on the same terms as other employees.
Pension and long-term savings Provide opportunities for executive directors to save for an income in retirement in a cost efficient manner.
It is the Company’s policy to provide efficient pension and other long-term savings vehicles to allow executive directors to save for their retirement. The Company’s policy for all external appointments since June 2003 has been to provide a pension contribution as a fixed percentage of salary.
The level of Company contribution is related to competitive practice in the executive directors’ employment markets.
Shareholding guidelines Encourage executives to build an interest in the Company’s shares and support alignment with shareholder interests.
The Group Chief Executive and Chief Executive of M&G are required to hold shares equal to 200 per cent of base salary. A policy of 100 per cent of base salary applies for other executive director roles. Executive directors have five years in which to build their shareholding.

130
Prudential plc Annual Report 2010
DIRECTORS’ REMUNERATION REPORT
DIRECTORS’ REMUNERATION REPORT > CONTINUED
On a policy basis, the package for 2011 will offer the following proportions of fixed and variable and short- and long-term reward for our executive directors:
Performance
Group Chief Risk Officer
GoodSuperior
100 %200 6040 80
Chief Executive PCA
GoodSuperior
Chief Executive, Prudential UK & Europe
GoodSuperior
Chief Executive, M&G
GoodSuperior
President and Chief Executive Officer, JNL
GoodSuperior
Chief Financial Officer
GoodSuperior
Group Chief Executive
GoodSuperior
Base salaryCash bonus2010 deferred bonusLong-term incentive plan
In this chart, ‘Good’ performance results in the payment of plan annual bonuses and threshold vesting of long-term incentive awards while ‘Superior’ performance generates maximum payment of annual bonuses and maximum vesting of long-term incentive awards.
Components of remunerationBase salaryThe limited increases to executive directors’ base salaries effective on 1 January 2010 were detailed in the 2009 Remuneration Report. No executive director has been awarded a salary increase effective on 1 January 2011.
Mike Wells’s salary on his appointment as Chief Executive of Jackson is $1,000,000. John Foley’s salary on his appointment as Group Chief Risk Officer is £550,000. Mike Wells’s and John Foley’s salaries will next be reviewed with effect from 1 January 2012.
Annual bonusThe 2010 annual bonus plans for the majority of executive directors included Group and business unit performance measures based on:
• IFRS operating profit• EEV operating profit• Holding company cash flow; and• Insurance Group Directive (IGD) Capital Surplus.
These performance measures have been selected because they recognise the importance of generating profit while maintaining cash flow and capital coverage. Please see the Financial Statements and the Risk and Capital Management section of the Business Review for full definitions of these measures. Michael McLintock’s annual bonus plan incorporated Business Unit measures including growth in third party funds, M&G investment performance and M&G IFRS operating profit (excluding PruCap). The performance measures for Jackson are IFRS pre-tax operating income (with the target and result adjusted to reflect the revised presentation of operating profit) and EEV new business profit.
A portion of the annual bonus for each executive director is based on the achievement of personal objectives. These include the executive’s contribution to Group strategy as a member of the Board and specific goals related to their functional and/or business unit role (for instance, project measures relating to the implementation of the Solvency II requirement). In addition, all employees are required to comply with the regulatory, governance and risk management practices and policies as these relate to their role and business area. Specifically, all business units must act within the Group’s risk appetite.
Executive directors’ bonus opportunities, the weighting of performance measures for 2010 and the proportion of annual bonuses deferred are set out opposite.
The table opposite sets out the proportion of each executive director’s annual bonus which must be deferred. This portion is deferred for three years in the form of the Company’s shares and is used to reinforce executive directors’ focus on the sustained success of the Company.
Despite continued turbulence in the financial markets, Prudential’s leadership team has remained focused on delivery. The Group achieved exceptional results against all of the financial annual incentive plan measures leading to attainment of bonus payments at close to the maximum level, even after offsetting all of the costs associated with the proposed AIA transaction. This was reflected in the value delivered to shareholders by the rising share price and the dividends paid. On the basis of this performance, the Committee approved the 2010 bonus payments set out on page 138.

131D
IRE
CT
OR
S’
RE
MU
NE
RA
TIO
N R
EP
OR
T
During the first quarter of 2010, the vesting of deferred share awards for UK employees (including UK-based executive directors) was accelerated in light of the impending changes to UK taxation. Some of the shares were sold to meet the resulting tax liabilities while the remaining shares were immediately converted into restricted share awards. These will vest on the same terms and timescale as the original deferred share awards. The Committee believed that it was appropriate for executive directors to pay tax on these awards at the rate in force when the annual bonuses were originally calculated and when the deferral was made. Please see the Other Share Awards table on page 144 for details.
Long-term incentivesAll executive directors participate in the Group Performance Share Plan (GPSP). Awards vest on the basis of the Group’s relative Total Shareholder Return (TSR) performance against a peer group of international insurers. Those executive directors with responsibility for a business unit also participate in plans linked to the long-term success of the relevant unit. The Committee will continue to keep the performance measures used in the long-term incentive plans under review to ensure their continued relevance.
Details of the awards made under these plans in 2010 can be found on pages 142 and 143.
Group Performance Share Plan (GPSP)All executive directors participate in the GPSP. This plan delivers shares to participants subject to Prudential’s Total Shareholder Return (TSR) performance over a three year period.
Prudential’s TSR performance over the performance period is compared with the TSR performance of an index composed of 10 international insurers (see box below). This performance measure was selected because it focuses on the value delivered to shareholders. TSR is measured on a local currency basis since this has the benefits of simplicity and directness of comparison.
The peer group used for the 2008 and 2009 GPSP awards was comprised of the organisations listed below plus Friends Provident (Friends Provident was removed from the comparator group for outstanding and future awards in November 2009 when it delisted). The organisations listed will also comprise the peer group used for 2011 GPSP awards.
The vesting schedule for GPSP awards is set out below:
% of award vesting
120%110%100%
0
25
75
50
100
Performance achieved by Prudential (percentage of index)
Peer Companies within the Index used for 2010 GPSP awards Aegon, Allianz, Aviva, Axa, Generali, ING, Legal & General, Manulife, Old Mutual and Standard Life
Executive directors’ bonus opportunities, the weighting of performance measures for 2010 and the proportion of annual bonuses deferred
Maximum bonus
opportunity (% of salary)
Weighting of measures
Deferral requirement
Financial measuresPersonal
objectivesGroup Business unit
Rob Devey 160% 40% of total bonus 20% 60% 20%Clark Manning c 320% (note 1) 30% of total bonus 25% 65% 10%Michael McLintock (note 2) 50% of bonus above £500,000 10% 75% 15%Nic Nicandrou 160% 40% of total bonus 80% – 20%Barry Stowe 160% 40% of total bonus 20% 60% 20%Tidjane Thiam 180% 50% of total bonus3 80% – 20%
Notes1 Clark Manning’s annual bonus figures and the weighting of measures shown include a notional figure for his 10 per cent share of the
Jackson senior management bonus pool based on the performance of Jackson. 2 Michael McLintock’s annual bonus and long-term incentive opportunities are based on M&G’s performance both in absolute terms and
relative to its peers. His bonus and long-term incentive opportunities are determined by an assessment of market competitive rewards for median and superior performance. In line with practice in the asset management sector, there is no specified maximum incentive award. Michael’s total remuneration is subject to an overriding cap which requires that his total remuneration must not be greater than 3 per cent of M&G’s annual IFRS profit.
3 For 2010, it was agreed with the Group Chief Executive that the portion of his bonus (50%) which would normally be payable in cash would be converted into shares and deferred for three years.

132
Prudential plc Annual Report 2010
DIRECTORS’ REMUNERATION REPORT
DIRECTORS’ REMUNERATION REPORT > CONTINUED
For any GPSP award to vest, the Committee must be satisfied that the quality of the Company’s underlying financial performance justifies the level of reward delivered at the end of the performance period. To ensure close alignment with our shareholders’ long-term interests, participants receive the value of reinvested dividends over the performance period for those shares that ultimately vest. If performance measures are not achieved in full, the unvested portion of any award lapses and is not available for retesting.
On 31 December 2010, the performance period for the 2008 GPSP award (which began on 1 January 2008) came to an end. Prudential’s TSR performance over this period was equal to 133.7 per cent of the peer index. The Committee, having satisfied itself about the quality of the Company’s underlying financial performance, confirmed vesting of 100 per cent of the 2008 GPSP award (in 2009, 100 per cent of the 2007 GPSP award vested).
The line chart below compares Prudential’s Total Shareholder Return (TSR) during the five years from 1 January 2005 to 31 December 2010 with that of the peer group against which TSR is measured for the purposes of the Group Performance Share Plan. Our performance is also shown relative to the FTSE 100 since Prudential is a major company within this Index.
2007 200820062005 2009 2010
Prudential TSR v FTSE 100 and peer group total returns index %
PrudentialFTSE 100
0
20
60
40
80
100
120
140
160
Peer index
TSR represents the growth in the value of a share plus the value of dividends paid, assuming that the dividends are reinvested in the Company’s shares on the ex-divided date.
Business Unit Performance Plans (BUPP)For executives with regional responsibilities, the Business Unit Performance Plans (BUPPs) deliver shares subject to performance over a three-year period.
For the Asia and Jackson BUPPs, the performance measure applied to all outstanding awards is the increase in the relevant region’s Shareholder Capital Value (SCV) over the performance period. SCV represents shareholders’ capital and reserves on a European Embedded Value (EEV) basis for each business unit, and was selected as a performance measure since it reflects the value contributed to the Group and its shareholders by each business unit.
The levels of SCV growth required for vesting of outstanding BUPP awards are set out in the table below. The SCV growth rates required in Prudential’s business regions vary to reflect the relative maturity of each market and business environment.
Compound annual growth in SCV over three years
Percentage of BUPP award which vests Jackson Asia
0% < 8% < 15%30% 8% 15%75% 10% 22.5%100% 12% 30%
Vesting occurs between these performance levels on a straight line basis.
In the past, BUPP awards for executives in the UK business unit were also assessed on the basis of SCV growth. During 2009, the Committee decided that future BUPP awards for the UK Business Unit would be based on the same relative TSR measure applied to GPSP awards. As a result, 2010 awards made under the UK BUPP reflect those TSR conditions applied to 2010 GPSP awards.
On his appointment in November 2009, Rob Devey was granted a 2009 BUPP award with a performance measure of growth in Shareholder Capital Value (SCV) of Prudential UK. Shortly after his appointment the strategy for the UK business was redefined and the Committee concluded that the TSR performance target used for the GPSP in 2009 provided a better alignment with the cash-generative priorities of the UK Business Unit than SCV, and therefore the target was amended accordingly.

133D
IRE
CT
OR
S’
RE
MU
NE
RA
TIO
N R
EP
OR
T
For any BUPP award to vest, the Committee must be satisfied that the quality of underlying financial performance of the relevant business unit justifies the level of reward delivered at the end of the performance period. To ensure close alignment with our shareholders’ long-term interests, participants receive the value of reinvested dividends over the performance period for those shares that ultimately vest. If the performance conditions are not achieved in full, the unvested portion of any award lapses and is not available for retesting.
On 31 December 2010, the performance periods for the 2008 BUPP awards (which began on 1 January 2008) came to an end. Over the period, the SCV of the Asia and Jackson business units grew by 15 per cent per annum and 3.9 per cent per annum respectively (on a compound basis). The Committee, having satisfied itself about the quality of the Asia business unit’s underlying financial performance, confirmed vesting of 30 per cent of the 2008 Asia BUPP award. No part of the Jackson 2008 BUPP award vested (in 2009, 63.6 per cent of 2007 Asia BUPP award vested while no part of the 2007 UK and Jackson BUPP awards vested). Please see page 143 for details.
The rules of the GPSP and BUPP set a limit on the value of shares which may be awarded to an executive in a financial year. The combined value of shares awarded under the two plans may not exceed 350 per cent of salary (550 per cent of salary for executives based in the US). The awards made in a particular year are often below this limit. On a change in control of Prudential, vesting of awards made under these arrangements would be prorated for performance and to reflect the elapsed portion of the performance period.
M&G Executive Long-Term Incentive PlanUnder the M&G Executive Long-Term Incentive Plan, an annual award of phantom shares is made with a notional starting share price of £1. The phantom share price at vesting is determined by the increase or decrease in M&G’s profitability over the three-year performance period with a profit and investment performance adjustment also applied. The adjustments are described below.
Profit growthThe value of phantom shares vesting will be adjusted by a profit measure as follows:
• No adjustment will be made if profits in the third year of the performance period are at least equal to the average annual profit generated over the performance period;
• A loss or zero profit will result in the value of the award being reduced to zero, irrespective of fund performance;
• Between these points, the value of phantom shares will be reduced on a straight line basis from no reduction to the complete elimination of the value of the award.
Investment performanceThe value of phantom shares vesting will be adjusted by an investment performance measure as follows:
• Where the investment performance of M&G’s funds is in the top two quartiles during the three-year performance period, the value of phantom shares vesting will be enhanced. The value of phantom shares may be doubled if performance is in the top quartile;
• Investment performance in the third quartile will not change the value of phantom shares vesting;
• Investment performance in the bottom quartile will result in awards being forfeited, irrespective of any profit growth.
The value of the vested phantom shares will be paid in cash after the end of the three-year performance period.
The number of phantom shares awarded depends on the performance of M&G and Michael McLintock’s individual contribution in the financial year prior to the year in which the award is made. Therefore, the number of phantom shares to be awarded in 2011 relates to M&G’s performance in 2010 and is calculated on the basis of its expected value. The expected value of the award is determined by a third party (PricewaterhouseCoopers LLP). Based on 2010 performance, an award of 1,318,148 phantom shares with an anticipated value of £1,779,500 will be made in 2011. The ultimate value of the award will be determined with reference to the profit and investment performance of M&G over the three years from 1 January 2011 to 31 December 2013. Based on 2009 performance, an award of 987,179 phantom shares with an anticipated value of £1,925,000 was made in 2010.

134
Prudential plc Annual Report 2010
DIRECTORS’ REMUNERATION REPORT
DIRECTORS’ REMUNERATION REPORT > CONTINUED
On 31 December 2010, the performance period for the 2008 awards under the M&G Executive Long-Term Incentive Plan (which began on 1 January 2008) came to an end. M&G’s profit grew by 52 per cent over the period and M&G’s investment performance was in the second quartile. The Committee, having satisfied itself about the quality of M&G’s underlying financial performance, confirmed vesting of the 2008 award with a value of £2.62 per share (in 2009, the 2007 award vested with a value of £1.68 per share).
All-employee share plansIt is important that all employees are offered the opportunity to own shares in Prudential, connecting them both to the success of the Company and to the interests of other shareholders. Executive directors are invited to participate in these plans on the same basis as other staff.
Save As You Earn (SAYE) schemesUK-based executive directors are eligible to participate in the Prudential HM Revenue and Customs (HMRC) approved UK SAYE scheme and Barry Stowe is invited to participate in the equivalent International SAYE scheme. These schemes allow employees to save towards the exercise of options over Prudential plc shares with the option price set at the beginning of the savings period at a discount of up to 20 per cent of the market price.
Participants elect to enter into savings contracts of up to £250 per month for a period of three or five years. At the end of this term, participants may exercise their options within six months and purchase shares. If an option is not exercised within six months, participants are entitled to a refund of their cash savings plus interest if applicable under the rules. Shares are issued to satisfy those options which are exercised. No options may be granted under the schemes if the grant would cause the number of shares which have been issued, or which remain issuable pursuant to options granted in the preceding 10 years under the scheme and any other option schemes operated by the Company, or which have been issued under any other share incentive scheme of the Company, to exceed 10 per cent of the Company’s ordinary share capital at the proposed date of grant.
Share Incentive Plan (SIP)UK-based executive directors are also eligible to participate in the Company’s HMRC approved Share Incentive Plan (SIP). This allows all UK based employees to purchase Prudential plc shares up to a value of £125 per month from their gross salary (partnership shares). For every four partnership shares bought, an additional matching share is awarded which is purchased by Prudential on the open market. Dividend shares accumulate while the employee participates in the plan. Partnership shares may be withdrawn from the scheme at any time. If the employee withdraws from the plan within five years, the matching shares are forfeited.
No directors or other employees are provided with loans to enable them to buy shares.
Pensions and long-term savingsFor executive directors in the UK and Asia hired externally after 30 June 2003, it is the Company’s policy to provide a supplement in lieu of pension of 25 per cent of base salary. This includes, where relevant, any Company contributions to the staff defined contribution pension, which UK executive directors may choose to join. This plan has no salary cap. This approach applies to Rob Devey, Nic Nicandrou, Barry Stowe and Tidjane Thiam, and these executives are provided with life assurance cover of up to four times salary. All these executive directors, except Barry Stowe, have opted to become members of the staff defined contribution pension plan.
Clark Manning is eligible to participate in Jackson’s Defined Contribution Retirement Plan, a qualified 401(k) retirement plan, on the same basis as all other US based employees. The Company provides matching contributions of 6 per cent of base salary (Clark Manning's salary for pension purposes is limited to $245,000). He is also eligible to participate in the profit sharing element of the plan which provides eligible participants with an annual profit sharing contribution, depending on the financial results of Jackson for the plan year, to a maximum of an additional 6 per cent of pensionable salary. An annual profit sharing contribution equivalent to 5 per cent of pensionable salary was made in 2010 (6 per cent of pensionable salary in 2009). Clark Manning is provided with life assurance cover of two times salary.

135D
IRE
CT
OR
S’
RE
MU
NE
RA
TIO
N R
EP
OR
T
Michael McLintock participates in a contributory defined benefit scheme that provides a target pension of two thirds of final pensionable earnings on retirement at age 60 for an employee with 30 years or more potential service, for which his contribution is four per cent of basic salary. Michael McLintock participates on the same basis as other employees who joined M&G at the same date. Benefits under the plan are subject to a notional scheme earnings cap (set at £123,600 for both the 2009/10 and 2010/11 tax years) which replicates the HMRC earnings cap in force before A-Day (6 April 2006). Michael McLintock is entitled to supplements based on his salary above the notional earnings cap and he is provided with life assurance cover of four times salary.
In 2010, the Long Term Savings Plan (LTSP) and the Alternative Retirement Benefit Scheme (ARBS) were established to provide long-term savings vehicles for executive directors and other employees. The LTSP was established under ordinary UK tax legislation for Employee Benefit Trusts and the ARBS was established under specific UK tax legislation relating to Employer Financed Retirement Benefit Schemes. If the trustees accept annual discretionary contributions to either of these plans, no cash supplement for pension purposes will be paid to UK based executive directors. No further payments will be made into these plans.
Service Contracts
Chairman’s letter of appointment and benefitsHarvey McGrath was appointed as a non-executive director on 1 September 2008 and became Chairman on 1 January 2009. He is paid an annual fee of £500,000 which is fixed for three years. A contractual notice period of 12 months by either party applies. Harvey McGrath is provided with life assurance cover of four times his annual fees and the use of a car and driver. No pension allowance is paid and he is not a member of any Group pension scheme. Harvey McGrath is also entitled to medical insurance coverage but he has not taken up this benefit.
Executive directors’ service contracts and letters of appointmentThe normal notice of termination that the Company is required to give executive directors is 12 months. Accordingly, in normal circumstances, a director whose contract is terminated would be entitled to one year’s salary and benefits in respect of their notice period. Additionally, outstanding awards under annual and long-term incentive plans may vest depending on the circumstances and according to the rules of the plans. When considering the termination of any service contract, the Remuneration Committee will have regard to the specific circumstances of each case, including the director’s obligation to mitigate his loss. Payments are phased over the notice period.
Policy on external appointmentsSubject to the Group Chief Executive’s or Chairman’s approval, executive directors are able to accept external appointments as non-executive directors of other organisations. Any fees paid may be retained by the executive director. During 2010, Michael McLintock earned £42,500 as a trustee of another organisation. Other directors served as non-executive directors on the boards of educational and cultural organisations without receiving a fee for such services.

136
Prudential plc Annual Report 2010
DIRECTORS’ REMUNERATION REPORT
DIRECTORS’ REMUNERATION REPORT > CONTINUED
Non-executive directors’ letters of appointmentNon-executive directors do not have service contracts but are appointed pursuant to letters of appointment with notice periods of six months without liability for compensation.
Non-executive directors are usually appointed for an initial three year term commencing with their election by shareholders at the first Annual General Meeting following their appointment. They are typically expected to serve for two terms of three years from their initial election by shareholders although the Board may invite them to serve for an additional period. Their appointment is subject to continued performance and re-election by shareholders.
Non-executive directors’ feesNon-executive directors are not eligible to participate in annual bonus plans, long-term incentive plans or pension arrangements. Their fees are determined by the Board and reflect their individual responsibilities, including chairmanship and membership of any committees. The Board reviews fees annually and the last fees changes were effective on 1 July 2008.
The structure of the annual fees paid is detailed below:
From 1 July 2008
(£)1
Basic fee 66,500Audit Committee Chairman – additional fee 50,000Audit Committee member – additional fee 20,000Remuneration Committee Chairman
– additional fee 22,500Remuneration Committee member
– additional fee 10,000Risk Committee Chairman – additional fee2 50,000Risk Committee member – additional fee2 20,000Senior Independent Director – additional fee 30,000
Notes1 Or date on which the Committee was established, if later.2 The Risk Committee was established on 9 November 2010.
Please see the table on page 138 for details of the fees received by individual non-executive directors during 2010.
Currently the non-executive directors use the net value of £25,000 of their total annual fees to purchase shares in the Company. Shares are purchased each quarter and are held at least until retirement from the Board.
Executive director Date of contract
Notice period to the
Company
Notice period from the
Company
Rob Devey 1 July 2009 12 months 12 monthsJohn Foley 8 December 2010 12 months 12 monthsClark Manning(note 1) 7 May 2002 12 months 12 monthsMichael McLintock 21 November 2001 6 months 12 monthsNic Nicandrou 26 April 2009 12 months 12 monthsBarry Stowe 18 October 2006 12 months 12 monthsTidjane Thiam 2 September 2007 12 months 12 monthsMike Wells(note 1) 15 October 2010 12 months 12 months
Note1 The contracts for Clark Manning and Mike Wells are renewable one year fixed term contracts. The contract is renewable automatically upon
the same terms and conditions unless the Company or the director gives at least 90 days’ notice prior to the end of the relevant term.
Non-executive director Appointment by the Board
Initial election by
shareholders at AGM Notice period
Expiration of current term
of appointment1
Keki Dadiseth 1 April 2005 AGM 2005 6 months AGM 2011Howard Davies 15 October 2010 AGM 2011 6 months AGM 2014Michael Garrett 1 September 2004 AGM 2005 6 months AGM 2011Ann Godbehere 2 August 2007 AGM 2008 6 months AGM 2011Bridget Macaskill 1 September 2003 AGM 2004 6 months AGM 2013Paul Manduca 15 October 2010 AGM 2011 6 months AGM 2014Kathleen O’Donovan 8 May 2003 AGM 2004 6 months AGM 2013James Ross2 6 May 2004 AGM 2005 6 months AGM 2011Lord Turnbull 18 May 2006 AGM 2006 6 months AGM 2012
Notes1 Subject to re-election2 James Ross will retire from the Board at the AGM on 19 May 2011.

137D
IRE
CT
OR
S’
RE
MU
NE
RA
TIO
N R
EP
OR
T
Shareholding guidelinesAs a condition of serving, all executive and non-executive directors are required to have beneficial ownership of a minimum of 2,500 ordinary shares in the Company. This interest in shares must be acquired within 12 months of appointment to the Board if the director does not have such an interest upon appointment.
Executive directors should have a substantial shareholding to maximise the community of interest between them and other shareholders. This may be built up over a period of five years. Shares earned and deferred under the annual incentive plan are included in calculating the executive director’s shareholding. Until the guideline is met, at least half of the shares released from the long-term incentive plans (after tax) should be retained by the executive director.
Directors’ shareholdingsThe interests of directors in ordinary shares of the Company are set out opposite. This includes shares acquired under the Share Incentive Plan (detailed in the table on page 147), deferred annual incentive awards and interests in shares awarded on appointment (detailed in the ‘Other Share Awards’ table on page 144). All interests are beneficial.
1 January 2010
31 December 2010
8 March 2011
Keki Dadiseth 27,489 30,655 30,655Howard Davies(note 1) – 575 575Rob Devey 50,575 78,261 78,261John Foley(note 2) – – 535,386Michael Garrett 32,425 36,972 36,972Ann Godbehere 11,518 14,628 14,628Bridget Macaskill 23,970 44,006 44,006Paul Manduca(note 1) – 1,260 1,260Clark Manning(note 3) 277,273 473,069 –Harvey McGrath 296,785 299,540 299,540Michael McLintock 663,818 604,390 604,390Nic Nicandrou(note 4) 114,653 133,555 133,621Kathleen O’Donovan 20,621 23,484 23,484James Ross 18,643 21,190 21,190Barry Stowe(note 5) 125,519 264,437 264,437Tidjane Thiam 291,901 273,025 273,025Lord Turnbull 12,562 15,589 15,589Mike Wells(note 6) – – 293,842
Notes1 Howard Davies and Paul Manduca were appointed on
15 October 2010.2 John Foley became an executive director on 1 January 2011.3 Part of Clark Manning’s interest in shares is made up of 30,935
ADRs (representing 61,870 ordinary shares). Clark ceased to be an executive director on 31 December 2011.
4 Nic Nicandrou’s interest in shares on 8 March 2011 includes his monthly purchases made under the SIP plan in January, February and March 2011.
5 Part of Barry Stowe’s interest in shares is made up of 48,847 ADRs (representing 97,694 ordinary shares. 8,513.73 of these ADRs are held within an investment account which secures premium financing for a life assurance policy).
6 Part of Mike Wells’s interest in shares is made up of 146,921 ADRs (representing 293,842 ordinary shares). Mike became an executive director on 1 January 2011.
Shareholding guidelines
Shareholding guideline after five years as % of base salary
Shareholding at 8 March 2011
as % of base salary(note 1)
Date by which shareholding
guideline must be/ has been met
Rob Devey 100% 95% 1 July 2014John Foley 100% 650% 31 December 2015Clark Manning(note 3) 100% – 7 May 2007Michael McLintock 200% 1,154% 21 November 2006Nic Nicandrou 100% 162% 26 April 2014Barry Stowe(note 2) 100% 265% 18 October 2011Tidjane Thiam 200% 203% 20 September 2012Mike Wells(note 2) 100% 303% 15 October 2015
Notes1 Based on the share price as at 31 December 2010 (£6.68). Calculated using base salaries on 31 December 2010 or on the date of appointment,
if later. 2 Shareholdings for Barry Stowe and Mike Wells include American Depositary Receipts (ADRs). One ADR is equivalent to two
Prudential plc shares.3 Clark Manning ceased to be an executive director on 31 December 2010.

138
Prudential plc Annual Report 2010
DIRECTORS’ REMUNERATION REPORT
DIRECTORS’ REMUNERATION REPORT > CONTINUED
DIRECTORS’ REMUNERATION FOR 2010 (AUDITED INFORMATION)
£000Salary/
fees
2010 Cash
bonus
2010Deferred
bonus
Total2010
bonus Benefits*
Cashsupple-
mentsfor
pensionpurposes†
Totalemolu-
ments2010
Totalemoluments
2009including
cashsupple-
mentsfor
pensionpurposes
Value of anticipated
releasesfrom LTIPs
in respect of per-
formanceperiods
ending 31 December
2010‡
CHAIRMANHarvey McGrath 500 – – – 43 – 543 542 –EXECUTIVE DIRECTORSRob Devey(note 1) 550 496 331 827 43 154 1,574 808 –Clark Manning(note 2) 679 1,462 626 2,088 21 – 2,788 2,753 1,218Michael McLintock 350 1,052 552 1,604 53 87 2,094 2,129 3,312Nic Nicandrou(note 3) 550 512 341 853 43 161 1,607 654 –Barry Stowe(note 4) 666 625 417 1,042 285 167 2,160 1,688 937Tidjane Thiam 900 – 1,570 1,570 64 225 2,759 1,955 2,099
TOTAL EXECUTIVE DIRECTORS 3,695 4,147 3,837 7,984 509 794 12,982 9,987 7,566
NON-EXECUTIVE DIRECTORSKeki Dadiseth(note 5) 87 87 86Howard Davies 27 27 –Michael Garrett 77 77 77Ann Godbehere 119 119 94Bridget Macaskill 89 89 89Paul Manduca 18 18 –Kathleen O’Donovan 87 87 109James Ross 108 108 107Lord Turnbull 88 88 87
TOTAL NON-EXECUTIVE DIRECTORS 700 700 649
OVERALL TOTAL 4,895 4,147 3,837 7,984 552 794 14,225 11,178 7,566
* Benefits include (where provided) the use of a car and driver, medical insurance, security arrangements and expatriate benefits. † Pension supplements that are paid in cash and contributions to the LTSP and/or the ARBS are included in the table. The policy on pensions is
described in the section on ‘Pensions and long-term savings’ on page 134. ‡ Value of anticipated long-term incentive plan releases is the total of cash paid plus, for shares released, the value of the released shares based on
the share price at 31 December 2010. All executive directors participate in long-term incentive plans and the details of share releases from awards with a performance period ending 31 December 2010 are provided in the footnote to the tables on share awards on pages 142 to 146. Executive directors’ participation in all-employee plans are detailed on page 147.
Notes1 Rob Devey elected not to receive his cash supplement for pension purposes in full during 2010. The Company made a request to the Trustees
of the Alternative Retirement Benefit Scheme to accept a contribution equivalent to this supplement. The value of this contribution is included in the table above.
2 Clark Manning's bonus figure excludes a contribution of $12,250 from a profit sharing plan which has been made into a 401(k) retirement plan. This is included in the table on pension contributions on page 147.
3 Nic Nicandrou elected not to receive his cash supplement for pension purposes in full during 2010. The Company made a request to the Trustees of the Long Term Savings Plan to accept a contribution equivalent to this supplement. The value of this contribution is included in the table above.
4 Barry Stowe's benefits relate primarily to his expatriate status, including costs of £153,384 for housing, £47,639 for children’s education and £42,509 for home leave.
5 Keki Dadiseth was paid allowances totalling £10,083 in respect of his accommodation expenses in London whilst on the Company's business as is the usual practice for directors who are not resident in the UK.

139D
IRE
CT
OR
S’
RE
MU
NE
RA
TIO
N R
EP
OR
T
Summary of remuneration provided for 2010This chart summarises the remuneration received by executive directors in 2010. This includes actual base salary paid during the year, total annual bonus awards for 2010 performance (including deferrals into shares) and the long-term incentives plan releases in respect of awards made in 2008. Since Rob Devey and Nic Nicandrou joined the Group in 2009, they did not have long-term incentive awards for 2008.
Remuneration received by executive directors in 2010
Tidjane Thiam
Barry Stowe
Nic Nicandrou
Michael McLintock
Clark Manning
Rob Devey
Base salary2010 cash bonus2010 deferred bonusValue of 2008 long-term incentive plan release
4,0002,0000 3,0001,000 5,000 £0006,000

140
Prudential plc Annual Report 2010
DIRECTORS’ REMUNERATION REPORT
DIRECTORS’ REMUNERATION REPORT > CONTINUED
DIRECTORS’ REMUNERATION FOR 2009
£000Salary/
fees
2009 Cash
bonus
2009Deferred
bonus
Total2009
bonus Benefits*
Cashsupple-
mentsfor
pensionpurposes†
Totalemolu-
ments2009
Totalemoluments
2008including
cashsupple-
mentsfor
pensionpurposes
Value of anticipated
releasesfrom LTIPs
in respect of per-
formanceperiods
ending 31 December
2009‡
CHAIRMANHarvey McGrath 500 – – – 42 – 542 – –EXECUTIVE DIRECTORSRob Devey
(from 16 November 2009) (note 1) 69 360 240 600 138 1 808 – –Clark Manning(note 2) 696 1,724 304 2,028 29 – 2,753 1,768 1,223Michael McLintock 320 1,125 625 1,750 53 6 2,129 2,154 2,572Nic Nicandrou
(from 28 October 2009)(note 3) 98 330 220 550 5 1 654 – –Barry Stowe(note 4) 646 432 185 618 262 162 1,688 1,207 1,098Tidjane Thiam(note 5) 763 528 528 1,056 49 87 1,955 1,244 –
TOTAL EXECUTIVE DIRECTORS 2,592 4,499 2,103 6,602 536 257 9,987 6,373 4,893
NON-EXECUTIVE DIRECTORSKeki Dadiseth(note 6) 86 86 73Michael Garrett 77 77 73Ann Godbehere 94 94 81Bridget Macaskill 89 89 86Harvey McGrath
(until 31 December 2008) 167Kathleen O’Donovan 109 109 108James Ross 107 107 101Lord Turnbull 87 87 81
TOTAL NON-EXECUTIVE DIRECTORS 649 649 770
OVERALL TOTAL 3,741 4,499 2,103 6,602 578 257 11,178 7,143 4,893
* Benefits include (where provided) the use of a car and driver, medical insurance, security arrangements and expatriate benefits. † Pension supplements that are paid in cash are included in the table. The policy on pensions is described in the section on ‘Pensions and long-term
savings’ on page 134. ‡ Value of anticipated long-term incentive plan releases is the total of cash paid plus, for shares released, the value of the released shares based on
the share price at 31 December 2009. All executive directors participate in long-term incentive plans and the details of share releases from awards with a performance period ending 31 December 2009 are provided in the tables on share awards on pages 142 to 146. Executive directors’ participation in all-employee plans are detailed on page 147.
Notes1 As part of Rob Devey's appointment terms, it was agreed that any bonus award would be assessed as if he had been in employment for the
whole of 2009. Rob Devey elected not to receive his cash supplement for pension purposes in full during 2009. In March 2010, the Company made a request to the Trustees of the Alternative Retirement Benefit Scheme to accept a contribution equivalent to this supplement. This amount is included in the remuneration table for 2010.
2 Clark Manning's bonus figure excludes a contribution of $14,700 from a profit sharing plan which has been made into a 401(k) retirement plan. 3 As part of Nic Nicandrou's appointment terms, it was agreed that any bonus award would be assessed as if he had been in employment for
the whole of 2009. Nic Nicandrou elected not to receive his cash supplement for pension purposes in full during 2009. In March 2010, the Company made a request to the Trustees of the Long Term Savings Plan to accept a contribution equivalent to this supplement. This amount is included in the remuneration table for 2010.
4 Barry Stowe's benefits relate primarily to his expatriate status, including costs of £148,051 for housing, £41,528 for children’s education and £32,607 for home leave.
5 Tidjane Thiam's 2009 annual bonus outcome was determined taking into account the period of time he was remunerated as Chief Financial Officer and Group Chief Executive.
6 Keki Dadiseth was paid allowances totalling £5,398 in respect of his accommodation expenses in London whilst on the Company's business as is the usual practice for directors who are not resident in the UK.

141D
IRE
CT
OR
S’
RE
MU
NE
RA
TIO
N R
EP
OR
T
Payments in 2010 to past and newly appointed executive directors Mark TuckerThe 2008 Directors’ Remuneration Report provided details of the remuneration arrangements which applied to Mark Tucker following his resignation as Group Chief Executive. These arrangements were implemented as intended by the Committee. In January 2010, a final payment in respect of salary and benefits (£307,938) was made to Mark Tucker relating to restrictions on his employment. Outstanding deferred share awards were released during the year in accordance with the scheme rules.
On 31 December 2010, the performance period for Mark Tucker’s 2008 Group Performance Share Plan award came to an end. His GPSP award was prorated for service (21/36ths) and its vesting remained dependent on TSR performance achieved over the three-year performance period. Since this condition was met in full, Mark Tucker’s prorated 2008 GPSP award will vest and will be released at the same time as those of other participants in the plan. This award was the last that Mark Tucker had outstanding under a Prudential long-term incentive plan.
Nick PrettejohnThe 2009 Directors’ Remuneration Report provided details of the remuneration arrangements that would apply to Nick Prettejohn after he resigned from the position of Chief Executive UK & Europe. These arrangements were implemented as intended by the Committee. As a result, Nick Prettejohn received:
• A final payment in respect of salary and benefits (£303,375) in January 2010, relating to restrictions on his employment up to 1 April 2010;
• Prorated 2009 annual bonus (9/12ths) based on his length of service during the year and paid in cash in March 2010 (£505,271);
• Outstanding deferred share awards were released in accordance with the scheme rules; and
• The long-term incentive plan awards for 2007, 2008 and 2009 have vested or will vest at the end of each relevant three year performance period prorated based on service, i.e. 33/36ths, 21/36ths and 9/36ths respectively. Vesting remains dependent on performance achieved over the relevant performance periods and any shares releases will occur at the same time as for all other participants in the GPSP and BUPP.
Clark ManningClark Manning stepped down from his role as President and Chief Executive of Jackson and as an executive director on 31 December 2010. Clark Manning remains Chairman of Jackson until 30 April 2011 and will act in an advisory role until 31 December 2011. Clark Manning will receive the following payments:
• Salary and benefits will continue to be paid to Clark Manning until 31 December 2011;
• A prorated 2011 annual bonus opportunity (4/12ths) based on his length of service during 2011 with any payment to be made in cash in March 2012;
• The deferred portion of the bonus awarded to Clark Manning in respect of performance in 2007 will be released to him in March 2011. The deferred portions of the bonuses awarded to Clark Manning in respect of performance in 2009 and 2010 will be released in March 2012;
• Outstanding awards made under the GPSP and BUPP will vest (subject to the achievement of performance conditions) on the same schedule as awards made to other executive directors. These awards will be prorated to reflect the portion of the performance periods which had elapsed on 31 December 2011. No further awards will be made to Clark under any long term incentive plan during 2011 or in any subsequent year.
No other amounts were paid during the financial year or were receivable by directors (or past directors) in connection with leaving the organisation. No amounts were paid to Mike Wells, John Foley or to any other executive directors in connection with their appointment.

142
Prudential plc Annual Report 2010
DIRECTORS’ REMUNERATION REPORT
DIRECTORS’ REMUNERATION REPORT > CONTINUED
Directors’ outstanding long-term incentive awardsShare-based long-term incentive awardsThe table below sets out the outstanding share awards under the Group Performance Share Plan and Business Unit Performance Plans.
Plan name
Year of initial award
Conditionalshare
awardsoutstand-
ing at1 January
2010(Number
of shares)
Con-ditionalawardsin 2010
(Numberof shares)
Market price at date of
original award
(pence)
Scrip dividend
equivalents on vested
shares (Number of shares
released)
Rights exercised
in 2010
Rights lapsed
in 2010
Conditionalshare
awards outstanding
at 31 December
2010 (Number
of shares)
Date of end of
per-formance
period
ROB DEVEY GPSP 2009 120,898 639 120,898 31 Dec 11 BUPP 2009 120,897 639 120,897 31 Dec 11 GPSP 2010 104,089 568.5 104,0892 31 Dec 12 BUPP 2010 104,089 568.5 104,0892 31 Dec 12
241,795 208,178 449,973
CLARK MANNING GPSP 2007 191,140 745 20,269 191,140 0 31 Dec 09 BUPP 2007 95,570 745 95,570 0 31 Dec 09 GPSP 2008 182,262 674.5 182,2623 31 Dec 10 BUPP 2008 91,131 674.5 91,1314 31 Dec 10 GPSP 2009 468,476 455.5 468,4761 31 Dec 11 BUPP 2009 468,476 455.5 468,4761 31 Dec 11 GPSP 2010 302,442 568.5 302,4421,2 31 Dec 12 BUPP 2010 302,442 568.5 302,4421,2 31 Dec 12
1,497,055 604,884 20,269 191,140 95,570 1,815,229
MICHAEL MCLINTOCK GPSP 2007 52,040 745 5,517 52,040 0 31 Dec 09 GPSP 2008 48,330 674.5 48,3303 31 Dec 10 GPSP 2009 92,022 455.5 92,022 31 Dec 11 GPSP 2010 66,238 568.5 66,2382 31 Dec 12
192,392 66,238 5,517 52,040 206,590
NIC NICANDROU GPSP 2009 316,328 639 316,328 31 Dec 11 GPSP 2010 208,179 568.5 208,1792 31 Dec 12
316,328 208,179 524,507
BARRY STOWE GPSP 2007 105,706 745 11,207 105,706 0 31 Dec 09 BUPP 2007 52,853 745 3,562 33,614 19,239 0 31 Dec 09 GPSP 2008 107,988 674.5 107,9883 31 Dec 10 BUPP 2008 53,994 674.5 53,9944 31 Dec 10 GPSP 2009 196,596 455.5 196,5961 31 Dec 11 BUPP 2009 196,596 455.5 196,5961 31 Dec 11 GPSP 2010 129,076 568.5 129,0761,2 31 Dec 12 BUPP 2010 129,076 568.5 129,0761,2 31 Dec 12
713,733 258,152 14,769 139,320 19,239 813,326
TIDJANE THIAM GPSP 2008 314,147 674.5 314,1473 31 Dec 10 GPSP 2009 299,074 455.5 299,074 31 Dec 11 GPSP 2010 510,986 568.5 510,9862 31 Dec 12
613,221 510,986 1,124,207

143D
IRE
CT
OR
S’
RE
MU
NE
RA
TIO
N R
EP
OR
T
Cash rights granted under the Business Unit Performance Plan
Plan name
Year of initial award
Face value of conditional
awards outstanding at 1 January
2010 £000
Conditionally awarded
in 2010 £000
Payments made
in 2010 £000
Cash right lapsed
in 2010 £000
Face value of conditional
awards outstanding
at 31 December 2010
£000
Date of end of performance
period
CLARK MANNING BUPP 2007 624 624 0 31 Dec 09BUPP 2008 652(note 4) 652 31 Dec 10
Total 1,276 624 652
BARRY STOWE BUPP 2007 325 206.7 118.3 0 31 Dec 09BUPP 2008 358(note 4) 358 31 Dec 10
Total 683 206.7 118.3 358
Notes1 The awards in 2009 and 2010 for Clark Manning and Barry Stowe were made in ADRs (1 ADR = 2 Prudential plc shares). The figures in the
table are represented in terms of Prudential shares.2 2010 awards made under the GPSP and the BUPP have a performance period from 1 January 2010 to 31 December 2012. In determining the
2010 conditional share awards the shares were valued at the average share price for the 30 days immediately following the announcement of Prudential’s 2009 results, and the price used to determine the number of shares was 528.39 pence. The awards for Clark Manning and Barry Stowe were made in ADRs (one ADR = 2 Prudential plc shares or $15.97). The figures in the table are represented in terms of Prudential shares.
3 At 31 December 2010 Prudential’s TSR performance was 133.7 per cent of the TSR performance of the index. Hence it is anticipated that awards granted under this scheme in 2008 will vest in full. This will result in 182,262 shares vesting for Clark Manning; 48,330 shares for Michael McLintock; 107,988 shares for Barry Stowe and 314,147 shares for Tidjane Thiam plus, in each case, scrip dividend equivalents on these vested shares.
4 At 31 December 2010, Shareholder Capital Value performance under the 2008 BUPPs was as follows:
% compound annual growth
in SCV
Anticipated number of
shares released from 2008
BUPP share award
(note 5)
Anticipated value of
2008 BUPP cash award
release £000
Jackson 3.9% Nil Nil
Asia 15.0% 16,198 107
5 Scrip dividend equivalents will be released on these vested shares.
Business-specific cash-based long-term incentive plansDetails of all outstanding awards under cash-based long-term incentive plans up to and including 2010 are set out in the table below. The performance period for all awards is three years.
MICHAEL MCLINTOCK
Year of initial award
Face value of conditional
awards outstanding at 1 January
2010 £000
Conditionally awarded
in 2010 £000
Payments made
in 2010 £000
Face value of conditional
awards outstanding
at 31 December 2010
£000
Date of end of performance
period
Phantom M&G shares 2007 1,333 2,239 31 Dec 09M&G Executive LTIP 2008 1,141 1,141 31 Dec 10M&G Executive LTIP 2009 1,830 1,830 31 Dec 11M&G Executive LTIP 2010 1,925 1,925 31 Dec 12
TOTAL CASH PAYMENTS MADE IN 2010 2,239
NoteMichael McLintock’s 2007 long-term incentive awards were under the M&G Chief Executive Long-Term Incentive Plan. The phantom share price at the beginning of the performance period was £1. The change in the phantom share price equals the change in M&G profit, modified up or down by the investment performance of M&G over the performance period. For the 2007 award of 1,333,000 units, the option price at the end of the performance period was £1.68. This resulted in a payment of £2,239,440 to Michael McLintock. For the 2008 award of 1,141,176 units, the option price at the end of the performance period was £2.62. This will result in a payment of £2,989,881 to Michael McLintock.

144
Prudential plc Annual Report 2010
DIRECTORS’ REMUNERATION REPORT
DIRECTORS’ REMUNERATION REPORT > CONTINUED
Year of initial
grant
Conditionalshare
awardsoutstanding at 1 January
2010(Number
of shares)
Con-ditionally
awardedin 2010
(Numberof shares)
Scrip dividends
accumu-lated
(Number of shares)
Shares released
in 2010 (Number
of shares)
Conditionalshare
awards outstanding
at 31 December
2010 (Number of shares)
Date of end of
restricted period
Shares released
in 2010(Number
of shares)Date ofrelease
Market price at
original date of award
(pence)
Market price at date of
vesting or release
(pence)
ROB DEVEYAwards under
appointment terms 2009 50,575 50,575 31 Mar 12 639
Restricted share award based on deferred 2009 annual incentive award(note 2) 2010 45,375 953 18,642 27,686 31 Dec 12 18,642 12 Mar 10 552.5 552.5
CLARK MANNINGDeferred
2006 annual incentive award 2007 10,064 10,064 0 31 Dec 09 10,064 9 Mar 10 723 519.5
Deferred 2007 annual incentive award 2008 17,825 635 18,460 31 Dec 10 635
Deferred 2009 annual incentive award 2010 59,792 2,078 61,870 31 Dec 12 552.5
Other share awardsThe table below sets out the share deferred annual incentive awards and interests in shares awarded on appointment. The values of the deferred share awards are included in the deferred bonus figures in the table on page 138. The number of shares is calculated using the average share price over the three business days commencing on the day of the announcement of the Group’s annual financial results for the relevant year. For the awards from the 2009 annual bonuses, made in 2010, the average share price was 528.92 pence. Please see the table on page 147 for details of shares acquired under the Share Incentive Plan.

145D
IRE
CT
OR
S’
RE
MU
NE
RA
TIO
N R
EP
OR
T
Year of initial
grant
Conditionalshare
awardsoutstanding at 1 January
2010(Number
of shares)
Con-ditionally
awardedin 2010
(Numberof shares)
Scrip dividends
accumu-lated
(Number of shares)
Shares released
in 2010 (Number
of shares)
Conditionalshare
awards outstanding
at 31 December
2010 (Number
of shares)
Date of end of
restricted period
Shares released
in 2010(Number
of shares)Date ofrelease
Market price at
original date of award
(pence)
Market price at date of
vesting or release
(pence)
MICHAEL MCLINTOCKDeferred
2006 annual incentive award 2007 90,090 90,090 0 31 Dec 09 90,090 9 Mar 10 723 519.5
Deferred 2007 annual incentive award(note 1) 2008 112,071 112,071 0 31 Dec 10 112,071 9 Mar 10 635 519.5
Deferred 2008 annual incentive award(note 1) 2009 217,410 217,410 0 31 Dec 11 217,410 9 Mar 10 349.5 519.5
Restricted share award based on deferred 2007 annual incentive award(note 1) 2010 66,029 2,356 68,385 31 Dec 10 519.5
Restricted share award based on deferred 2008 annual incentive award(note 1) 2010 128,093 4,571 132,664 31 Dec 11 519.5
Restricted share award based on deferred 2009 annual incentive award(note 2) 2010 118,165 2,484 48,545 72,104 31 Dec 12 48,545 12 Mar 10 552.5 552.5
NIC NICANDROUAwards under
appointment terms 2009 10,616 10,616 0 31 Mar 10 10,616 9 Mar 10 639 519.5
5,889 5,889 0 31 Mar 10 5,889 9 Mar 10 639 519.513,898 13,898 31 Mar 11 63916,059 16,059 31 Mar 11 63968,191 68,191 31 Mar 12 639
Restricted share award based on deferred 2009 annual incentive award(note 2) 2010 41,594 874 17,088 25,380 31 Dec 12 17,088 12 Mar 10 552.5 552.5

146
Prudential plc Annual Report 2010
DIRECTORS’ REMUNERATION REPORT
DIRECTORS’ REMUNERATION REPORT > CONTINUED
Other share awards continued
Year of initial
grant
Conditionalshare
awardsoutstanding at 1 January
2010(Number
of shares)
Con-ditionally
awardedin 2010
(Numberof shares)
Scrip dividends
accumu-lated
(Number of shares)
Shares released
in 2010 (Number
of shares)
Conditionalshare
awards outstanding
at 31 December
2010 (Number of shares)
Date of end of
restricted period
Shares released
in 2010(Number
of shares)Date ofrelease
Market price at
original date of award
(pence)
Market price at date of
vesting or release
(pence)
BARRY STOWEAwards under
appointment terms 2006 7,088
2,1107,0882,110
00
1 Jan 10 1 May 10
7,088 2,110
9 Mar 10 8 Jun 10
702 702
519.5 525.5
Deferred 2007 annual incentive award 2008 43,777 1,562 45,339 31 Dec 10 635
Deferred 2008 annual incentive award 2009 21,064 751 21,815 31 Dec 11 349.5
Deferred 2009 annual incentive award 2010 36,386 1,264 37,650 31 Dec 12 552.5
TIDJANE THIAMAwards under
appointment terms 2008 48,362
41,135 49,131
48,362 41,135
00
49,131
31 Mar 10 31 Mar 1031 Mar 11
48,362 41,135
9 Mar 10 9 Mar 10
662 662 662
519.5 519.5
Deferred 2008 annual incentive award(note 1) 2009 110,403 110,403 0 31 Dec 11 110,403 9 Mar 10 349.5 519.5
Restricted share award based on deferred 2008 annual incentive award(note 1) 2010 65,046 2,321 67,367 31 Dec 11 552.5
Restricted share award based on deferred 2009 annual incentive award(note 2) 2010 99,851 2,099 41,022 60,928 31 Dec 12 41,022 12 Mar 10 552.5 552.5
Notes1 These awards replaced the 2007, 2008 and 2009 deferred share awards which vested during the year.2 These 2010 awards are a net deferred share award.3 The Deferred Share Awards in 2010 for Clark Manning and Barry Stowe were made in ADRs (1 ADR = 2 Prudential plc shares).
The figures in the table are represented in terms of Prudential shares.

147D
IRE
CT
OR
S’
RE
MU
NE
RA
TIO
N R
EP
OR
T
Shares acquired under the Share Incentive Plan
Year of initial
grant
Share Incentive
Plan awards held in
Trust at 1 January
2010(Number
of shares)
Partnership shares
accumu-lated in
2010(Number
of shares)
Matching shares
accumu-lated in
2010(Number
of shares)
Dividend shares
accumu-lated in
2010(Number
of shares)
Share Incentive
Plan awards held in
Trust at 31 December
2010(Number
of shares)
NIC NICANDROUShares held in Trust 2010 0 240 60 3 303
Note1 Nic Nicandrou participated in the Share Incentive Plan (SIP) for the first time in 2010. The table above provides information about shares
purchased under the SIP together with Matching Shares (awarded on a 1:4 basis) and dividend shares. The total number of shares will only be released if Nic Nicandrou remains in employment for five years.
DilutionReleases from Prudential’s GPSP and BUPP are satisfied using new issue shares rather than by purchasing shares in the open market. Shares relating to options granted under all-employee share plans are also satisfied by new issue shares. The combined dilution from all outstanding shares and options at 31 December 2010 was 0.2 per cent of the total share capital at the time. Deferred shares will continue to be satisfied by the purchase of shares in the open market.
Directors’ pensions and life assuranceThe Company’s pension policy is set out on page 134. Details of directors’ pension entitlements under HMRC approved defined benefit schemes and supplements in the form of contributions to pension arrangements paid by the Company are set out in the following table.
Age at 31 December
2010
Years of pensionable
service at 31 December
2010
Accrued benefit at
31 December 2010£000
Additional pension earned during year ended 31 December 2010 Amount
of (B – A) less
contri-butions
made by directors
during 2010£000
Contri-butions to
pension and life
assurance arrange-
ments4
£000
Ignoring inflation on
pension earned to
31 December 20091
£000
Allowing for inflation on pension
earned to 31 December
20092
£000
Transfer value of accrued benefit at 31 December3
2010A
£000
2009B
£000
Rob Devey 42 0Clark Manning 52 20Michael McLintock 49 18 50 3 1 856 755 87 20Nic Nicandrou 45 0Barry Stowe 53 5Tidjane Thiam 48 0
Notes1 As required by the Companies Act remuneration regulations. 2 As required by Stock Exchange Listing rules.3 The transfer value equivalent has been calculated in accordance with the M&G Group Pension Scheme’s transfer basis.4 Supplements in the form of cash are included in the table on page 138.
Outstanding share optionsThe following table sets out the share options held by Tidjane Thiam in the UK Savings Related Share Option Scheme (SAYE) as at the end of 2010. No other directors hold shares in any other option scheme.
Date of initial grant
Exercise periodNumber of options
Exercise price (p)
Market price at 31 December
2010 (p)Beginning
of period Granted Exercised Cancelled Forfeited LapsedEnd of periodStart End
TIDJANE THIAM 25 Apr 08 1 Jun 11 30 Nov 11 1,705 – – – – – 1,705 551 668
Notes1 No gains were made by directors in 2010 on the exercise of share options (2009: £0). 2 No price was paid for the award of any option. 3 The highest and lowest share prices during 2010 were 681 pence and 487.5 pence respectively.

148
Prudential plc Annual Report 2010
DIRECTORS’ REMUNERATION REPORT
DIRECTORS’ REMUNERATION REPORT > CONTINUED
No enhancements to retirement benefits were paid to or receivable by directors or former directors other than the discretionary pension increases awarded to all pensioners which have been made during the year.
Total contributions to directors’ pension arrangements in 2010, including cash supplements for pension purposes, were £624,921 (2009: £876,466) of which £44,608 (2009: £298,586) related to money purchase schemes.
Five highest paid individuals (unaudited information)Of the five individuals with the highest emoluments in 2010, one was a director whose emoluments are disclosed in this report (2009: two; 2008: two). The aggregate of the emoluments of the other four individuals for 2010 (2009: three; 2008: three) were as follows:
2008 2009 2010
Base salaries, allowances and benefits in kind 1 1 1
Pension contributions* – – –Bonuses paid or
receivable 10 12 18Share based payments
and other cash payments 2 4 6
TOTAL 13 17 25
* Pension contributions payable in the period were less than £150,000 in each period.
Their emoluments were within the following bands:
2008 2009 2010
£2,600,001 – £2,700,000 1£4,700,001 – £4,800,000 1£5,000,001 – £5,100,000 1£5,200,001 – £5,300,000 1£5,300,001 – £5,400,000 1£5,400,001 – £5,500,000 1£6,000,001 – £6,100,000 1 1£6,600,001 – £6,700,000 1£8,300,001 – £8,400,000 1
Signed on behalf of the Board of directors
BRIDGET MACASKILLCHAIRMAN, REMUNERATION COMMITTEE
8 March 2011
HARVEY MCGRATHCHAIRMAN
8 March 2011

149F
INA
NC
IAL
S
TA
TE
ME
NT
S
FINANCIAL STATEMENTS AND EUROPEAN EMBEDDED VALUE (EEV) BASIS SUPPLEMENTARY INFORMATION150 Summary of statutory and supplementary IFRS
and EEV basis results152 Index to Group financial statements153 Consolidated income statement154 Consolidated statement of comprehensive income155 Consolidated statement of changes in equity157 Consolidated statement of financial position159 Consolidated statement of cash flows160 Notes on the Group financial statements354 Additional unaudited financial information375 Balance sheet of the parent company376 Notes on the parent company financial statements387 Statement of directors’ responsibilities in respect of
the Annual Report and the financial statements388 Independent auditor’s report to the members of
Prudential plc389 EEV basis supplementary information395 Notes on the EEV basis supplementary information434 Statement of directors’ responsibilities in respect of
the EEV basis supplementary information435 Independent auditor’s report to Prudential plc
on the EEV basis supplementary information

150
Prudential plc Annual Report 2010
The following tables and referenced disclosure notes show the results reported in the statutory financial statements on pages 153 to 352 and 375 to 386 and supplementary EEV basis results on pages 389 to 433. This page does not form part of the statutory financial statements.
International Financial Reporting Standards (IFRS) basis resultsStatutory IFRS basis results
Primary statement or note reference Page 2010 2009
Profit after tax attributable to equity holders of the Company IFRS income statement 153 £1,431m £676mBasic earnings per share IFRS income statement 153 56.7p 27.0pDividends per share declared and paid in reporting period IFRS note B3 188 20.17p 19.20pShareholders’ equity, excluding non-controlling interest IFRS statement of financial position 158 £8,031m £6,271m
Supplementary IFRS basis information
Primary statement or note reference Page 2010 2009 i
Operating profit based on longer-term investment returns 182 £1,941m £1,564mShort-term fluctuations in investment returns 182 £(123)m £(123)mShareholders’ share of actuarial and other gains and losses on defined benefit pension schemes IFRS note B1 182 £(10)m £(74)mCosts of terminated AIA transaction 182 £(377)m –Gain on dilution of holding in PruHealth 182 £30m –Loss on sale and results for Taiwan agency business 182 – £(621)m
Profit from continuing operations before tax attributable to shareholders (including actual investment returns) IFRS note B1 182 £1,461m £746mOperating earnings per share after related tax and non-
controlling interests (excluding exceptional tax credit) IFRS note B2 186 62.0p 47.5pOperating earnings per share after related tax and non-
controlling interests (including exceptional tax credit) IFRS note B2 186 68.3p 47.5p
Dividends per share in respect of the reporting period (including interim dividend of 6.61p (2009: 6.29p) and final dividend of 17.24p (2009: second interim dividend
of 13.56p) declared after the end of the reporting period) IFRS note B3 188 23.85p 19.85p
Supplementary European Embedded Value (EEV) basis results
Primary statement or note reference Page 2010 2009
Operating profit based on longer-term investment returns 389 £3,696m £3,090mShort-term fluctuations in investment returns 391 £(30)m £351mMark to market value movements on core borrowings 391 £(164)m £(795)mShareholders’ share of actuarial and other gains and losses on defined benefit pension schemes 391 £(11)m £(84)mEffect of changes in economic assumptions EEV income 391 £(10)m £(910)mCosts of terminated AIA transaction statement 391 £(377)m –Gain on dilution of holding in PruHealth 391 £3m –Profit on sale and results for Taiwan agency business 391 – £91mProfit from continuing operations before tax (including actual investment returns) 391 £3,107m £1,743m
Operating earnings per share after related tax and non-controlling interests (excluding exceptional tax credit) EEV note 12 417 106.9p 88.8p
Operating earnings per share after related tax and non-controlling interests (including exceptional tax credit) EEV note 12 417 113.2p 88.8pBasic earnings per share EEV earnings per share 392 101.9p 49.8pShareholders’ equity, excluding non-controlling interests EEV statement of financial position 394 £18,207m £15,273m
Notei The Company has amended the presentation of IFRS operating profit for its US operations to remove the net equity hedge accounting effect (incorporating
related amortisation of deferred acquisition costs) and include it in the supplementary analysis of profit in short-term fluctuations in investment returns. The 2009 amounts have been amended accordingly.
SUMMARY OF STATUTORY AND SUPPLEMENTARY IFRS AND EEV BASIS RESULTS YEAR ENDED 31 DECEMBER 2010
FINANCIAL STATEMENTS > PRIMARY STATEMENTS

FIN
AN
CIA
L
ST
AT
EM
EN
TS
151F
INA
NC
IAL
S
TA
TE
ME
NT
S
NotesBasis of preparation
Results basesWith the exception of the adoption of IFRS 3 (Revised) on business combinations and associated amendments to other standards and the altered basis of presentation of Jackson’s IFRS operating profit based on longer-term investment returns referred to below, the basis of preparation of the statutory IFRS basis results and supplementary IFRS basis information is consistent with that applied for the 2009 results and financial statements. The EEV basis results have been prepared in accordance with the European Embedded Value Principles issued by the CFO Forum of European Insurance Companies in May 2004. Life insurance products are, by their nature, long-term and the profit on this business is generated over a significant number of years. Accounting under IFRS alone does not, in Prudential’s opinion, fully reflect the value of future profit streams. Prudential considers that embedded value reporting provides investors with a measure of the future profit streams of the Group’s in-force long-term businesses and is a valuable supplement to statutory accounts. With the exception of the presentation of the new business results of the Japan life operation which ceased writing new business in February 2010 there has been no other change to the basis of presentation of the EEV results from the 2009 results and financial statements.
Operating profit based on longer-term investment returnsConsistent with previous reporting practice, the Group provides supplementary analysis of IFRS profit before tax attributable to shareholders and analyses its EEV basis results, so as to distinguish operating profit based on longer-term investment returns from other elements of total profit. On both the IFRS and EEV bases, operating earnings per share are calculated using operating profits based on longer-term investment returns, after related tax and non-controlling interests. These profits exclude short-term fluctuations in investment returns and the shareholders’ share of actuarial and other gains and losses on defined benefit pension schemes. The operating profit based on longer-term investment returns for 2010 also excludes the costs associated with the terminated AIA transaction and the gain arising upon the dilution of the Group’s holding in PruHealth. Consistent with prior presentation, the effect of disposal and the results of the Taiwan agency business are shown separately from operating profit based on longer-term investment returns for 2009. In 2010 the Company amended its presentation of IFRS operating profit for its US insurance operations to exclude the net equity hedge accounting effect of negative £367 million (2009: negative £159 million) relating principally to its variable annuity business and reclassified it in the supplementary analysis of profit as a short-term fluctuation in investment returns. Prior year comparatives have been amended accordingly. This is a presentational change and it has no impact on the IFRS profit before tax or the IFRS shareholders’ funds. The change also has no impact on the Group’s EEV financial statements. Under the EEV basis, where additional profit and loss effects arise, operating profit based on longer-term investment returns also excludes the mark to market value movements on core borrowings and the effect of changes in economic assumptions. After adjusting for related tax and non-controlling interests, the amounts excluded from operating profit based on longer-term investment returns are included in the calculation of basic earnings per share.
PR
IMA
RY
ST
AT
EM
EN
TS

152
Prudential plc Annual Report 2010
FINANCIAL STATEMENTS > PRIMARY STATEMENTS
INDEX TO GROUP FINANCIAL STATEMENTS
Primary statements
153 Consolidated income statement154 Consolidated statement of comprehensive income155 Consolidated statement of changes in equity157 Consolidated statement of financial position159 Consolidated statement of cash flows
Notes on the Group financial statements
Section A: Background and accounting policies160 A1: Nature of operations 160 A2: Basis of preparation 160 A3: Critical accounting policies, estimates and judgements 166 A4: Significant accounting policies179 A5: New accounting pronouncements
Section B: Summary of results182 B1: Segment disclosure – income statement186 B2: Earnings per share 188 B3: Dividends 189 B4: Exchange translation 189 B5: New business 192 B6: Group statement of financial position
Section C: Group risk management 203 C: Group risk management
Section D: Life assurance businesses208 D1: Group overview 215 D2: UK insurance operations 234 D3: US insurance operations 254 D4: Asian insurance operations 262 D5: Capital position statement for life
assurance businesses
Section E: Asset management (including US broker dealer) and other operations271 E1: Income statement for asset management operations 273 E2: Statement of financial position for asset management
operations 274 E3: Regulatory and other surplus 275 E4: Sensitivity of profit and equity to market
and other financial risk275 E5: Other operations
Section F: Income statement notes276 F1: Segmental information 278 F2: Revenue 280 F3: Acquisition costs and other expenditure 281 F4: Finance costs: Interest on core structural borrowings
of shareholder-financed operations 281 F5: Tax 288 F6: Allocation of investment return between policyholders
and shareholders290 F7: Benefits and claims and movements in unallocated
surplus of with-profits funds, net of reinsurance
Section G: Financial assets and liabilities291 G1: Financial instruments – designation and fair values 300 G2: Market risk 304 G3: Derivatives and hedging 306 G4: Derecognition and collateral 307 G5: Impairment of financial assets
Section H: Other information on statement of financial position items308 H1: Intangible assets attributable to shareholders 312 H2: Intangible assets attributable to with-profits funds313 H3: Reinsurers’ share of insurance contract liabilities 314 H4: Tax assets and liabilities 315 H5: Accrued investment income and other debtors 316 H6: Property, plant and equipment 317 H7: Investment properties 318 H8: Investments in associates and joint ventures 320 H9: Properties held for sale 321 H10: Cash and cash equivalents 321 H11: Shareholders’ equity: Share capital, share premium
and reserves 323 H12: Insurance contract liabilities and unallocated surplus
of with-profits funds 324 H13: Borrowings 326 H14: Provisions and contingencies 330 H15: Other liabilities
Section I: Other notes331 I1: Acquisition of United Overseas Bank Life
Assurance Limited332 I2: Dilution of the Group’s holding in PruHealth in 2010
and sale of Taiwan agency business in 2009332 I3: Staff and pension plans345 I4: Share-based payments349 I5: Key management remuneration 349 I6: Fees payable to auditor 350 I7: Related party transactions 350 I8: Subsidiary undertakings 352 I9: Commitments 352 I10: Discontinued operations352 I11: Cash flows352 I12: Post balance sheet events
Additional unaudited financial information354 Additional unaudited financial information
Parent company financial statements
375 Balance sheet of the parent company376 Notes on the parent company financial statements
Statement of directors’ responsibilities and independent auditor’s report
387 Statement of directors’ responsibilities in respect of the Annual Report and the financial statements388 Independent auditor’s report to the members of Prudential plc
European Embedded Value (EEV) basis supplementary information
389 Operating profit based on longer-term investment returns391 Summarised consolidated income statement – EEV basis392 Earnings per share – EEV basis392 Dividends per share392 Movement in shareholders’ equity (excluding non-controlling interests) – EEV basis394 Net asset value per share394 Summary statement of financial position – EEV basis395 Notes on the EEV basis supplementary information434 Statement of directors’ responsibilities in respect of the European Embedded Value (EEV) basis supplementary information435 Independent auditor’s report to Prudential plc
on the European Embedded Value (EEV) basis supplementary information

153F
INA
NC
IAL
S
TA
TE
ME
NT
SP
RIM
AR
Y
STA
TE
ME
NT
S
Year ended 31 December 2010 Note 2010 £m 2009 £m
Gross premiums earned 24,568 20,299Outward reinsurance premiums (357) (323)
Earned premiums, net of reinsurance F2 24,211 19,976
Investment return F2 21,769 26,889Other income F2 1,666 1,234
Total revenue, net of reinsurance F1,F2 47,646 48,099
Benefits and claims (40,608) (39,901)Outward reinsurers’ share of benefits and claims 335 265Movement in unallocated surplus of with-profits funds H12 (245) (1,559)
Benefits and claims and movements in unallocated surplus of with-profits funds, net of reinsurance (40,518) (41,195)
Acquisition costs and other expenditure F3 (4,799) (4,572)Finance costs: interest on core structural borrowings of shareholder-financed operations F4 (257) (209)Loss on sale of Taiwan agency business I2 – (559)
Total charges, net of reinsurance F1 (45,574) (46,535)
Profit before tax (being tax attributable to shareholders’ and policyholders’ returns)* 2,072 1,564Tax charge attributable to policyholders’ returns (611) (818)
Profit before tax attributable to shareholders B1 1,461 746Tax charge F5 (636) (873)Less: tax attributable to policyholders’ returns 611 818Tax charge attributable to shareholders’ returns‡ F5 (25) (55)
Profit from continuing operations after tax 1,436 691Discontinued operations (net of tax)† I10 – (14)
PROFIT FOR THE YEAR 1,436 677
Attributable to: Equity holders of the Company 1,431 676 Non-controlling interests 5 1
PROFIT FOR THE YEAR 1,436 677
EARNINGS PER SHARE (IN PENCE)Basic: Based on profit from continuing operations attributable to the equity holders of the Company B2 56.7p 27.6p Based on loss from discontinued operations attributable to the equity holders of the Company B2 – (0.6)p
56.7p 27.0p
Diluted: Based on profit from continuing operations attributable to the equity holders of the Company B2 56.6p 27.6p Based on loss from discontinued operations attributable to the equity holders of the Company B2 – (0.6)p
56.6p 27.0p
* This measure is the formal profit before tax measure under IFRS but is not the result attributable to shareholders and is stated after £377 million of pre-tax costs of the terminated AIA transaction. See note B1.
†The 2009 charge of £14 million which was net of £nil tax, reflected completion adjustments for a previously disposed business.‡ The 2010 tax charge attributable to shareholders’ return includes an exceptional tax credit of £158 million which primarily relates to the impact
of a settlement agreed with the UK tax authorities.
CONSOLIDATED INCOME STATEMENT

154
Prudential plc Annual Report 2010
FINANCIAL STATEMENTS > PRIMARY STATEMENTS
Year ended 31 December 2010 Note 2010 £m 2009 £m
PROFIT FOR THE YEAR 1,436 677
Other comprehensive income: Exchange movements on foreign operations and net investment hedges: Exchange movements arising during the year B4 217 (206) Related tax 34 11
251 (195)
Available-for-sale securities:Unrealised valuation movements on securities of US insurance operations classified as
available-for-sale: D3(a) Unrealised holding gains arising during the year 1,170 2,249 Add back net losses included in the income statement on disposal and impairment 51 420
Total 1,221 2,669Related change in amortisation of deferred income and acquisition costs H1 (496) (1,069)Related tax (247) (557)
478 1,043
OTHER COMPREHENSIVE INCOME FOR THE YEAR, NET OF RELATED TAX 729 848
TOTAL COMPREHENSIVE INCOME FOR THE YEAR 2,165 1,525
Attributable to: Equity holders of the Company 2,160 1,524 Non-controlling interests 5 1
TOTAL COMPREHENSIVE INCOME FOR THE YEAR 2,165 1,525
CONSOLIDATED STATEMENT OF COMPREHENSIVE INCOME

155F
INA
NC
IAL
S
TA
TE
ME
NT
SP
RIM
AR
Y
STA
TE
ME
NT
S
CONSOLIDATED STATEMENT OF CHANGES IN EQUITY
2010 £m
Year ended 31 December 2010 NoteShare
capitalShare
premiumRetained earnings
Trans- lation
reserve
Available-for-sale
securities reserve
Share-holders’
equity
Non-controlling
interestsTotal
equity
RESERVESProfit for the year – – 1,431 – – 1,431 5 1,436 Other comprehensive income: Exchange movements on foreign operations and net investment hedges, net of related tax – – – 251 – 251 – 251 Unrealised valuation movements,
net of related change in amortisation of deferred income and acquisition
costs and related tax – – – – 478 478 – 478
Total other comprehensive income – – – 251 478 729 – 729
Total comprehensive income for the year – – 1,431 251 478 2,160 5 2,165 Dividends B3 – – (511) – – (511) – (511)Reserve movements in respect of share- based payments – – 37 – – 37 – 37 Change in non-controlling interests arising principally from purchase and sale of property partnerships of the PAC with- profits fund and other consolidated investment funds – – – – – – 7 7
SHARE CAPITAL AND SHARE PREMIUMNew share capital subscribed (including
shares issued in lieu of cash dividends) H11 – 75 – – – 75 – 75 Reserve movements in respect of shares issued in lieu of cash dividends H11 – (62) 62 – – – – –
TREASURY SHARESMovement in own shares held in respect of
share-based payment plans – – (4) – – (4) – (4)Movement in Prudential plc shares purchased
by unit trusts consolidated under IFRS – – 3 – – 3 – 3
Net increase in equity – 13 1,018 251 478 1,760 12 1,772 At beginning of year 127 1,843 3,964 203 134 6,271 32 6,303
AT END OF YEAR H11 127 1,856 4,982 454 612 8,031 44 8,075

156
Prudential plc Annual Report 2010
FINANCIAL STATEMENTS > PRIMARY STATEMENTS
CONSOLIDATED STATEMENT OF CHANGES IN EQUITYCONTINUED
2009 £m
Note
Share capital
Share premium
Retained earnings
Trans- lation
reserve
Available-for-sale
securities reserve
Share-holders’
equity
Non-controlling
interestsTotal
equity
RESERVESProfit for the year – – 676 – – 676 1 677Other comprehensive income: Exchange movements on foreign operations and net investment hedges, net of related tax – – – (195) – (195) – (195) Unrealised valuation movements,
net of related change in amortisation of deferred income and acquisition
costs and related tax – – – – 1,043 1,043 – 1,043
Total other comprehensive income – – – (195) 1,043 848 – 848
Total comprehensive income for the year – – 676 (195) 1,043 1,524 1 1,525Dividends B3 – – (481) – – (481) – (481)Reserve movements in respect of share- based payments – – 29 – – 29 – 29Change in non-controlling interests arising principally from purchase and sale of property partnerships of the PAC with- profits fund and other consolidated investment funds – – – – – – (24) (24)
SHARE CAPITAL AND SHARE PREMIUMNew share capital subscribed (including
shares issued in lieu of cash dividends) H11 2 139 – – – 141 – 141Reserve movements in respect of shares issued in lieu of cash dividends H11 – (136) 136 – – – – –
TREASURY SHARESMovement in own shares held in respect of
share-based payment plans – – 3 – – 3 – 3Movement in Prudential plc shares purchased
by unit trusts consolidated under IFRS – – (3) – – (3) – (3)
Net increase (decrease) in equity 2 3 360 (195) 1,043 1,213 (23) 1,190At beginning of year 125 1,840 3,604 398 (909) 5,058 55 5,113
AT END OF YEAR H11 127 1,843 3,964 203 134 6,271 32 6,303

157F
INA
NC
IAL
S
TA
TE
ME
NT
SP
RIM
AR
Y
STA
TE
ME
NT
S
31 December 2010 Note 2010 £m 2009 £m
Intangible assets attributable to shareholders: Goodwill H1(a) 1,466 1,310 Deferred acquisition costs and other intangible assets H1(b) 4,609 4,049
Total 6,075 5,359
Intangible assets attributable to with-profits funds: In respect of acquired subsidiaries for venture fund and other investment purposes H2(a) 166 124 Deferred acquisition costs and other intangible assets H2(b) 110 106
Total 276 230
Total 6,351 5,589
Other non-investment and non-cash assets: Property, plant and equipment H6 612 367 Reinsurers’ share of insurance contract liabilities H3 1,344 1,187 Deferred tax assets H4 2,188 2,708 Current tax recoverable H4 555 636 Accrued investment income G1,H5 2,668 2,473 Other debtors G1,H5 903 762
Total 8,270 8,133
Investments of long-term business and other operations: Investment properties H7 11,247 10,905 Investments accounted for using the equity method H8 71 6 Financial investments*: G1 Loans 9,261 8,754 Equity securities and portfolio holdings in unit trusts 86,635 69,354 Debt securities 116,352 101,751 Other investments 5,779 5,132 Deposits 9,952 12,820
Total 239,297 208,722
Properties held for sale H9 257 3Cash and cash equivalents G1,H10 6,631 5,307
TOTAL ASSETS B6 260,806 227,754
* Included within financial investments are £8,708 million (2009: £10,501 million) of lent securities. See note G4.
CONSOLIDATED STATEMENT OF FINANCIAL POSITION ASSETS

158
Prudential plc Annual Report 2010
31 December 2010 Note 2010 £m 2009 £m
EQUITYShareholders’ equity H11 8,031 6,271Non-controlling interests 44 32
Total equity 8,075 6,303
LIABILITIESPolicyholder liabilities and unallocated surplus of with-profits funds: Insurance contract liabilities H12 171,291 145,713 Investment contract liabilities with discretionary participation features G1 25,732 24,880 Investment contract liabilities without discretionary participation features G1 17,704 15,805 Unallocated surplus of with-profits funds H12 10,253 10,019
Total 224,980 196,417
Core structural borrowings of shareholder-financed operations: Subordinated debt H13 2,718 2,691 Other H13 958 703
Total G1,H13 3,676 3,394
Other borrowings: Operational borrowings attributable to shareholder-financed operations G1,H13 3,004 2,751 Borrowings attributable to with-profits funds G1,H13 1,522 1,284Other non-insurance liabilities: Obligations under funding, securities lending and sale and repurchase agreements G1 4,199 3,482 Net asset value attributable to unit holders of consolidated unit trusts and similar funds G1 3,372 3,809 Deferred tax liabilities H4 4,224 3,872 Current tax liabilities H4 831 1,215 Accruals and deferred income 707 594 Other creditors G1 2,321 1,612 Provisions H14 729 643 Derivative liabilities G1,G3 2,037 1,501 Other liabilities G1,H15 1,129 877
Total 19,549 17,605
Total liabilities B6 252,731 221,451
TOTAL EQUITY AND LIABILITIES 260,806 227,754
The consolidated financial statements on pages 153 to 352 were approved by the Board of directors on 8 March 2011 and signed on its behalf.
HARVEY MCGRATH TIDJANE THIAM NIC NICANDROUCHAIRMAN GROUP CHIEF EXECUTIVE CHIEF FINANCIAL OFFICER
CONSOLIDATED STATEMENT OF FINANCIAL POSITION EQUITY AND LIABILITIES
FINANCIAL STATEMENTS > PRIMARY STATEMENTS

159F
INA
NC
IAL
S
TA
TE
ME
NT
S
Year ended 31 December 2010 Note 2010 £m 2009 £m
CASH FLOWS FROM OPERATING ACTIVITIESProfit before tax (being tax attributable to shareholders’ and policyholders’ returns)note (i) 2,072 1,564Loss before tax from discontinued operations I10 – (14)
Total profit before tax 2,072 1,550Changes in operating assets and liabilities: Investments (24,594) (26,388) Other non-investment and non-cash assets (1,161) (384) Policyholder liabilities (including unallocated surplus) 24,287 24,932 Other liabilities (including operational borrowings) 1,332 (299)Interest income and expense and dividend income included in result before tax (7,514) (7,267)Other non-cash items (including £559 million in 2009 for the loss on disposal of Taiwan agency business) 139 650Operating cash items: Interest receipts 6,277 5,734 Dividend receipts 1,412 1,780 Tax paid (302) (200)
Net cash flows from operating activities 1,948 108
CASH FLOWS FROM INVESTING ACTIVITIESPurchases of property, plant and equipment H6 (93) (91)Proceeds from disposal of property, plant and equipment 4 54Completion adjustment for previously disposed business I10 – (20)Disposal of Taiwan agency business I2(b) – (497)Acquisition of subsidiaries, net of cash balancenote (ii) I1 (145) –
Net cash flows from investing activities (234) (554)
CASH FLOWS FROM FINANCING ACTIVITIESStructural borrowings of the Group: I11 Shareholder-financed operations: Issue of subordinated debt, net of costs – 822 Redemption of senior debt – (249) Bank loan 250 – Interest paid (251) (207) With-profits operations: Interest paid (9) (9)Equity capital:note (iii) Issues of ordinary share capital H11 13 3 Dividends paid B3 (449) (344)
Net cash flows from financing activities (446) 16
Net increase (decrease) in cash and cash equivalents 1,268 (430)Cash and cash equivalents at beginning of year 5,307 5,955Effect of exchange rate changes on cash and cash equivalents 56 (218)
CASH AND CASH EQUIVALENTS AT END OF YEAR H10 6,631 5,307
Notes (i) This measure is the formal profit before tax measure under IFRS but it is not the result attributable to shareholders. (ii) The acquisition of United Overseas Bank Life Assurance Limited (UOB) resulted in an outflow of cash for investing activities of £133 million.
The remaining outflow of £12 million relates to the PAC with-profits fund purchase of Meterserve. (iii) Cash movements in respect of equity capital exclude scrip dividends.
CONSOLIDATED STATEMENT OF CASH FLOWS
PR
IMA
RY
ST
AT
EM
EN
TS
160
Prudential plc Annual Report 2010
FINANCIAL STATEMENTS > NOTES ON THE GROUP FINANCIAL STATEMENTS
A: BACKGROUND AND ACCOUNTING POLICIES
A1: NATURE OF OPERATIONS
Prudential plc (the Company) together with its subsidiaries (collectively, the Group or Prudential) is an international financial services group with its principal operations in the UK, the US and Asia. The Group operates in the UK through its subsidiaries, primarily The Prudential Assurance Company Limited (PAC), Prudential Annuities Limited (PAL), Prudential Retirement Income Limited (PRIL) and M&G Investment Management Limited. In the US, the Group’s principal subsidiary is Jackson National Life Insurance Company (Jackson). The Group also has operations in Hong Kong, Malaysia, Singapore, Indonesia and other Asian countries. Prudential offers a wide range of retail financial products and services and asset management services throughout these territories. The retail financial products and services principally include life insurance, pensions and annuities as well as collective investment schemes. Long-term business products written in the UK and Asia are principally with-profits deposit administration, other conventional and unitised with-profits policies and non-participating pension annuities in the course of payment. Long-term business also includes linked business written in the UK and Asia. In Asia these policies are usually sold with insurance riders, such as health cover. The principal products written by Jackson are interest-sensitive deferred annuities and whole-life policies, variable annuities, guaranteed investment contracts, fixed index deferred annuities and term life insurance. Prudential plc is a public limited company incorporated and registered in England and Wales. The registered office is:
Laurence Pountney Hill London EC4R 0HH Registered number: 1397169
A2: BASIS OF PREPARATION
The consolidated financial statements consolidate the Group and the Group’s interest in associates and jointly-controlled entities. The parent company financial statements present information about the Company as a separate entity and not about the Group. The consolidated financial statements have been prepared and approved by the directors in accordance with International Financial Reporting Standards (IFRS) as issued by the International Accounting Standards Board (IASB) and as endorsed by the European Union (EU) as required by EU law (IAS regulation EC 1606/2032). The Company has elected to prepare its parent company financial statements in accordance with UK Generally Accepted Accounting Practice (GAAP). These are presented on pages 375 to 386. A reconciliation to IFRS has also been provided for shareholders’ equity and profit for the year of the parent company. The Group has applied all IFRS standards and interpretations adopted by the EU that are effective for financial years commencing on or before 1 January 2010. Further details on the new accounting pronouncements and accounting policy changes are provided in note A5. The Group has applied the same accounting policies in preparing the 2010 results as for 2009 except for the adoption of IFRS 3 (Revised) on business combinations and associated amendments to other standards. However, as discussed in note A4 (d)(ii), the measurement of the segment measure of IFRS operating profit based on longer-term investment returns for US insurance operations has altered. Comparative segment results have been adjusted accordingly.
A3: CRITICAL ACCOUNTING POLICIES, ESTIMATES AND JUDGEMENTS
a Critical accounting policiesPrudential’s discussion and analysis of its financial condition and results of operations are based upon Prudential’s consolidated financial statements, which have been prepared in accordance with IFRS as issued by the IASB and as endorsed by the EU. EU-endorsed IFRS may differ from IFRS as issued by the IASB if, at any point in time, new or amended IFRSs have not been endorsed by the EU. As at 31 December 2010, there were no unendorsed standards effective for the two years ended 31 December 2010 affecting the consolidated financial information of Prudential and there were no differences between IFRSs endorsed by the EU and IFRSs issued by the IASB in terms of their application to Prudential. Accordingly, Prudential’s financial information for the two years ended 31 December 2010 is prepared in accordance with IFRS as issued by the IASB. It is Prudential’s policy to adopt mandatory requirements of new or altered EU-adopted IFRS standards where required, with earlier adoption applied where permitted and appropriate in the circumstances. The preparation of these financial statements requires Prudential to make estimates and judgements that affect the reported amounts of assets, liabilities, and revenues and expenses, and related disclosure of contingent assets and liabilities. On an ongoing basis, Prudential evaluates its estimates, including those related to long-term business provisioning, the fair value of assets and the declaration of bonus rates. Prudential bases its estimates on historical experience and on various other assumptions that are believed to be reasonable under the circumstances, the results of which form the basis for making judgements about the carrying value of assets and liabilities that are not readily apparent from other sources. Actual results may differ from these estimates under different assumptions or conditions.

161F
INA
NC
IAL
S
TA
TE
ME
NT
SA
: BA
CK
GR
OU
ND
AN
D
AC
CO
UN
TIN
G P
OL
ICIE
S
Critical accounting policies are defined as those that are reflective of significant judgements and uncertainties, and potentially give rise to different results under different assumptions and conditions. Prudential believes that its critical accounting policies are limited to those described below. The critical accounting policies in respect of the items discussed below are critical for the Group’s results insofar as they relate to the Group’s shareholder-financed business. In particular this applies for Jackson which is the largest shareholder-backed business in the Group. The policies are not critical in respect of the Group’s with-profits business. This distinction reflects the basis of recognition of profit and accounting treatment of unallocated surplus of with-profits funds as a liability. Additional explanation is provided later in this note and cross-referenced notes as to why the distinction between with-profits business and shareholder-backed business is relevant. The items discussed below and in cross-referenced notes explain the effect of changes in estimates and the effect of reasonably likely changes in the key assumptions underlying these estimates as of the latest statement of financial position date so as to provide analysis that recognises the different accounting effects on profit and loss or equity. In order to provide relevant analysis that is appropriate to the circumstances applicable to the Group’s businesses, the explanations refer to types of business, fund structure, the relationship between asset and policyholder liability measurement, and the differences in the method of accounting permitted under IFRS 4 for accounting for insurance contract assets, policyholder liabilities and unallocated surplus of the Group’s with-profits funds.
Insurance contract accountingWith the exception of certain contracts described in note D1, the contracts issued by the Group’s life assurance business are classified as insurance contracts and investment contracts with discretionary participating features. As permitted by IFRS 4, assets and liabilities of these contracts are accounted for under previously applied GAAP. Accordingly, except as described below, the modified statutory basis (MSB) of reporting as set out in the revised Statement of Recommended Practice (SORP) issued by the Association of British Insurers (ABI) has been applied. In 2005 the Group chose to improve its IFRS accounting for UK regulated with-profits funds by the voluntary application of the UK accounting standard FRS 27, ‘Life Assurance’. Under this standard, the main accounting changes that were required for UK with-profits funds were:
• derecognition of deferred acquisition costs and related deferred tax; and• replacement of MSB liabilities with adjusted realistic basis liabilities.
The results included in the financial statements for 2010 and 2009 reflect this basis.Unallocated surplus represents the excess of assets over policyholder liabilities for the Group’s with-profits funds that have yet to be
appropriated between policyholders and shareholders. The Group has opted to account for unallocated surplus wholly as a liability with no allocation to equity. This treatment reflects the fact that shareholders’ participation in the cost of bonuses arises only on distribution. Shareholder profits on with-profits business reflect one-ninth of the cost of declared bonus. For Jackson, applying the MSB as applicable to overseas operations which permits the application of local GAAP in some circumstances, the assets and liabilities of insurance contracts are accounted for under insurance accounting prescribed by US GAAP. For the assets and liabilities of insurance contracts of Asian operations, the local GAAP is applied with adjustments, where necessary, to comply with UK GAAP. For the operations in Taiwan, Vietnam and Japan, countries where local GAAP is not appropriate in the context of the previously applied MSB, accounting for insurance contracts is based on US GAAP. For participating business the liabilities include provisions for the policyholders’ interest in realised investment gains and other surpluses that, where appropriate, and in particular for Vietnam, have yet to be declared as bonuses. The usage of these bases of accounting has varying effects on the way in which product options and guarantees are measured. For UK regulated with-profits funds, options and guarantees are valued on a market consistent basis. The basis is described in note D2(g)(ii). For other operations a market consistent basis is not applied under the accounting basis described in note A4. Details of the guarantees, basis of setting assumptions, and sensitivity to altered assumptions are described in notes D3 and D4.
Valuation and accounting presentation of fair value movements of derivatives and debt securities of JacksonUnder IAS 39, derivatives are required to be carried at fair value. Unless net investment hedge accounting is applied, value movements on derivatives are recognised in the income statement. As previously discussed the Group has chosen to change its presentation of operating profit for its US insurance operations as explained further in note A4(d)(ii). Derivative value movements in respect of equity risk within variable annuity business and other equity related hedging activities are now included outside operating profit as part of short-term fluctuations in investment returns. Accordingly, the value movements on all derivatives held by Jackson are separately identified within the short-term fluctuations in investment returns identified as part of the Group’s segment results described below and in note B1.

162
Prudential plc Annual Report 2010
FINANCIAL STATEMENTS > NOTES ON THE GROUP FINANCIAL STATEMENTS
A: BACKGROUND AND ACCOUNTING POLICIESCONTINUED
A3: CRITICAL ACCOUNTING POLICIES, ESTIMATES AND JUDGEMENTS > CONTINUED
For derivative instruments of Jackson, the Group has considered whether it is appropriate to undertake the necessary operational changes to qualify for hedge accounting so as to achieve matching of value movements in hedging instruments and hedged items in the performance statements. In reaching the decision a number of factors were particularly relevant. These were:
• IAS 39 hedging criteria have been designed primarily in the context of hedging and hedging instruments that are assessable as financial instruments that are either stand-alone or separable from host contracts, rather than, for example, duration characteristics of insurance contracts;
• the high hurdle levels under IAS 39 of ensuring hedge effectiveness at the level of individual hedge transactions;• the difficulties in applying the macro hedge provisions under IAS 39 (which are more suited to banking arrangements) to Jackson’s
derivative book;• the complexity of asset and liability matching of US life insurers such as those with Jackson’s product range; and finally• whether it is possible or desirable, without an unacceptable level of costs and constraint on commercial activity, to achieve the
accounting hedge effectiveness required under IAS 39.
Taking account of these considerations the Group has decided that, except for certain minor categories of derivatives, it is not appropriate to seek to achieve hedge accounting under IAS 39. As a result of this decision the total income statement results are more volatile as the movements in the value of Jackson’s derivatives are reflected within it. Under IAS 39, unless carried at amortised cost (subject to impairment provisions where appropriate) under the held-to-maturity category, debt securities are also carried at fair value. The Group has chosen not to classify any financial assets as held-to-maturity. Debt securities of Jackson are designated as available-for-sale with value movements, unless impaired, being recorded as movements within other comprehensive income. Impairments are recorded in the income statement.
Presentation of results before taxThe total tax charge for the Group reflects tax that in addition to relating to shareholders’ profits is also attributable to policyholders and unallocated surplus of with-profits funds and unit-linked policies. This is explained in more detail in note F5. However, pre-tax profits are determined after transfers to or from unallocated surplus of with-profits funds. These transfers are in turn determined after taking account of tax borne by with-profits funds. Consequently reported profit before the total tax charge is not representative of pre-tax profits attributable to shareholders. In order to provide a measure of pre-tax profits attributable to shareholders the Group has chosen to adopt an income statement presentation of the tax charge and pre-tax results that distinguishes between policyholder and shareholder components.
Segmental analysis of results and earnings attributable to shareholdersThe Group uses operating profit based on longer-term investment returns as the segmental measure of its results. The basis of calculation is disclosed in note A4(d). For shareholder-backed business, with the exception of debt securities held by Jackson and assets classified as loans and receivables, all financial investments and investment property are designated as assets at fair value through profit and loss. Short-term fluctuations in investment returns on such assets held by with-profits funds, do not affect directly reported shareholder results. This is because (i) the unallocated surplus of with-profits funds is accounted for as liabilities and (ii) excess or deficits of income and expenditure of the funds over the required surplus for distribution are transferred to or from unallocated surplus. However, for shareholder-backed businesses the short-term fluctuations affect the result for the year and the Group provides additional analysis of results to provide information on results before and after short-term fluctuations in investment returns.
b Critical accounting estimates and judgementsInvestmentsDetermining the fair value of financial investments when the markets are not activeThe Group holds certain financial investments for which the markets are not active. These can include financial investments which are not quoted on active markets and financial investments for which markets are no longer active as a result of market conditions e.g. market illiquidity. When the markets are not active, there is generally no or limited observable market data to account for financial investments at fair value. The determination of whether an active market exists for a financial investment requires management’s judgement. If the market for a financial investment of the Group is not active, the fair value is determined by using valuation techniques. The Group establishes fair value for these financial investments by using quotations from independent third-parties, such as brokers or pricing services or by using internally developed pricing models. Priority is given to publicly available prices from independent sources when available, but overall the source of pricing and/or the valuation technique is chosen with the objective of arriving at a fair value measurement which reflects the price at which an orderly transaction would take place between market participants on the measurement date. The valuation techniques include the use of recent arm’s length transactions, reference to other instruments that are substantially the same, discounted cash flow analysis, option adjusted spread models and, if applicable, enterprise valuation and may include a number of assumptions relating to variables such as credit risk and interest rates. Changes in assumptions relating to these variables could positively or negatively impact the reported fair value of these financial investments.

163F
INA
NC
IAL
S
TA
TE
ME
NT
SA
: BA
CK
GR
OU
ND
AN
D
AC
CO
UN
TIN
G P
OL
ICIE
S
The financial investments measured at fair value are classified into the following three level hierarchy on the basis of the lowest level of inputs that is significant to the fair value measurement of the financial investment concerned: Level 1: Quoted prices (unadjusted) in active markets for identical assets and liabilities Level 2: Inputs other than quoted prices included within level 1 that are observable either directly or indirectly (i.e. derived from prices). Level 3: Significant inputs for the asset or liability that are not based on observable market data (unobservable inputs). At 31 December 2010, £4,573 million (2009: £5,557 million) of the financial investments (net of derivative liabilities) valued at fair value were classified as level 3. Of these £866 million (2009: £1,684 million) are held to back shareholder non-linked business and so changes to these valuations will directly impact shareholders’ equity. Further details of the classification of financial instruments are given in note G1.
Determining impairments relating to financial assetsAvailable-for-sale securitiesFinancial investments carried on an available-for-sale basis are represented by Jackson’s debt securities portfolio. The consideration of evidence of impairment requires management’s judgement. In making this determination the factors considered include, for example:
• Whether the decline of the financial investment’s fair value is substantial.A substantial decline in fair value might be indicative of a credit loss event that would lead to a measurable decrease in the estimated future cash flows.
• The impact of the duration of the security on the calculation of the revised estimated cash flows. • The duration of a security for maturity helps to inform whether assessments of estimated future cash flows that are higher than market
value are reasonable.• The duration and extent to which the amortised cost exceeds fair value.
This factor provides an indication of how the contractual cash flows and effective interest rate of a financial asset compares with the implicit market estimate of cash flows and the risk attaching to a ‘fair value’ measurement. The length of time for which that level of difference has been in place may also provide further evidence as to whether the market assessment implies an impairment loss has arisen.
• The financial condition and prospects of the issuer or other observable conditions that indicate the investment may be impaired. If a loss event that will have a detrimental effect on cash flows is identified an impairment loss in the income statement is recognised. The loss recognised is determined as the difference between the book cost and the fair value of the relevant impaired securities. This loss comprises the effect of the expected loss of contractual cash flows and any additional market-price-driven temporary reductions in values.
For Jackson’s residential mortgage-backed and other asset-backed securities, all of which are classified as available-for-sale, the model used to analyse cash flows, begins with the current delinquency experience of the underlying collateral pool for the structure, by applying assumptions about how much of the currently delinquent loans will eventually default, and multiplying this by an assumed loss severity. Additional factors are applied to anticipate ageing effect. After applying a cash flow simulation an indication is obtained as to whether or not the security has suffered, or is anticipated to suffer, contractual principal or interest payment shortfall. If a shortfall applies an impairment charge is recorded. The difference between the fair value and book cost for unimpaired securities accounted for as available-for-sale, is accounted for as unrealised gains or losses, with the movements in the accounting period being accounted for in other comprehensive income. The Group’s review of fair value involves several criteria, including economic conditions, credit loss experience, other issuer-specific developments and future cash flows. These assessments are based on the best available information at the time. Factors such as market liquidity, the widening of bid/ask spreads and a change in cash flow assumptions can contribute to future price volatility. If actual experience differs negatively from the assumptions and other considerations used in the consolidated financial statements, unrealised losses currently in equity may be recognised in the income statement in future periods. The preceding note in this section provides explanation on how fair value is determined when the markets for the financial investments are not active. Further, additional details on the impairments of the available-for-sale securities of Jackson are described in notes D3 and G5.
Assets held at amortised costFinancial assets classified as loans and receivables under IAS 39 are carried at amortised cost using the effective interest rate method. Certain mortgage loans of the UK insurance operations have been designated at fair value through profit and loss as this loan portfolio is managed and evaluated on a fair value basis and these are included within loans in the balance sheet. The loans and receivables include loans collateralised by mortgages, deposits and loans to policyholders. In estimating future cash flows, the Group looks at the expected cash flows of the assets and applies historical loss experience of assets with similar credit risks that has been adjusted for conditions in the historical loss experience which no longer exist or for conditions that are expected to arise. The estimated future cash flows are discounted using the financial asset’s original or variable effective interest rate and exclude credit losses that have not yet been incurred. The risks inherent in reviewing the impairment of any investment include the risk that market results may differ from expectations; facts and circumstances may change in the future and differ from estimates and assumptions; or the Group may later decide to sell the asset as a result of changed circumstances.

164
Prudential plc Annual Report 2010
FINANCIAL STATEMENTS > NOTES ON THE GROUP FINANCIAL STATEMENTS
A: BACKGROUND AND ACCOUNTING POLICIESCONTINUED
A3: CRITICAL ACCOUNTING POLICIES, ESTIMATES AND JUDGEMENTS > CONTINUED
Insurance contractsProduct classificationIFRS 4 requires contracts written by insurers to be classified as either ‘insurance contracts’ or ‘investment contracts’ depending on the level of insurance risk transferred. Insurance risk is a pre-existing risk, other than financial risk, transferred from the contract holder to the contract issuer. If significant insurance risk is transferred by the contract then it is classified as an insurance contract. Contracts that transfer financial risk but not significant insurance risk are termed investment contracts. Furthermore, some contracts, both insurance and investment, contain discretionary participating features representing the contractual right to receive additional benefits as a supplement to guaranteed benefits:
a that are likely to be a significant portion of the total contract benefits;b whose amount or timing is contractually at the discretion of the insurer; andc that are contractually based on asset or fund performance, as discussed in IFRS 4.
Accordingly, insurers must perform a product classification exercise across their portfolio of contracts issued to determine the allocation to these various categories. IFRS 4 permits the continued usage of previously applied GAAP for insurance contracts and investment contracts with discretionary participating features. Except for UK regulated with-profits funds, as described subsequently, this basis has been applied by the Group. For investment contracts that do not contain discretionary participating features, IAS 39 and, where the contract includes an investment management element, IAS 18, apply measurement principles to assets and liabilities attaching to the contract.
Valuation assumptionsi Contracts of with-profits fundsThe Group’s insurance contracts and investment contracts with discretionary participating features are primarily with-profits and other protection type policies. For UK regulated with-profits funds, the contract liabilities are valued by reference to the UK Financial Services Authority’s (FSA) realistic basis. In aggregate, this basis has the effect of placing a value on the liabilities of UK with-profits contracts, which reflects the amounts expected to be paid based on the current value of investments held by the with-profits funds and current circumstances. The basis of determining liabilities for the Group’s with-profits business has little or no effect on the results attributable to shareholders. This is because movements on liabilities of the with-profits funds are absorbed by the unallocated surplus. Except through indirect effects, or in remote circumstances as described below, changes to liability assumptions are therefore reflected in the carrying value of the unallocated surplus, which is accounted for as a liability rather than shareholders’ equity. A detailed explanation of the basis of liability measurement is contained in note D2(g)(ii). The Group’s other with-profits contracts are written in with-profits funds that operate in some of the Group’s Asian operations. The liabilities for these contracts and those of Prudential Annuities Limited, which is a subsidiary company of the PAC with-profits funds, are determined differently. For these contracts the liabilities are estimated using actuarial methods based on assumptions relating to premiums, interest rates, investment returns, expenses, mortality and surrenders. The assumptions to which the estimation of these reserves is particularly sensitive are: the interest rate used to discount the provision and the assumed future mortality experience of policyholders. For liabilities determined using the basis described above for UK regulated with-profits funds, and the other liabilities described in the preceding paragraph, changes in estimates arising from the likely range of possible changes in underlying key assumptions have no direct impact on the reported profit. This lack of sensitivity reflects the with-profits fund structure, basis of distribution, and the application of previous GAAP to the unallocated surplus of with-profits funds as permitted by IFRS 4. Changes in liabilities of these contracts that are caused by altered estimates are absorbed by the unallocated surplus of the with-profits funds with no direct effect on shareholders’ equity. The Company’s obligations and more detail on such circumstances are described in note H14.
ii Other contractsContracts, other than those of with-profits funds, are written in shareholder-backed operations of the Group. The significant shareholder-backed product groupings and the factors that may significantly affect IFRS results due to experience against assumptions or changes of assumptions vary significantly between business units. For some types of business the effect of changes in assumptions may be significant, whilst for others, due to the nature of the product, assumption setting may be of less significance. The nature of the products and the significance of assumptions are discussed in notes D2, D3 and D4. From the perspective of shareholder results the key sensitivity relates to the assumption for allowance for credit risk for UK annuity business.

165F
INA
NC
IAL
S
TA
TE
ME
NT
SA
: BA
CK
GR
OU
ND
AN
D
AC
CO
UN
TIN
G P
OL
ICIE
S
JacksonJackson offers individual fixed annuities, fixed index annuities, immediate annuities, variable annuities, individual and variable life insurance and institutional products. With the exception of institutional products and an incidental amount of business for annuity certain contracts, which are accounted for as investment contracts under IAS 39, all of Jackson’s contracts are accounted for under IFRS 4 as insurance contracts by applying US GAAP, the previous GAAP used before IFRS adoption. The accounting requirements under these standards and the effect of changes in valuation assumptions are considered below for fixed annuity, variable annuity and traditional life insurance contracts. Fixed annuity contracts, which are investment contracts under US GAAP terminology, are accounted for by applying in the first instance a retrospective deposit method to determine the liability for policyholder benefits. This is then augmented by potentially three additional amounts, namely deferred income, any amounts previously assessed against policyholders that are refundable on termination of the contract, and any premium deficiency, i.e., any probable future loss on the contract. These types of contracts contain considerable interest rate guarantee features. Notwithstanding the accompanying market risk exposure, except in the circumstances of interest rate scenarios where the guarantee rates included in contract terms are higher than crediting rates that can be supported from assets held to cover liabilities, the accounting measurement of Jackson’s fixed annuity products is not generally sensitive to interest rate risk. This position derives from the nature of the products and the US GAAP basis of measurement. Variable annuity contracts written by Jackson may provide for guaranteed minimum death, income, or withdrawal benefit features. In general terms, liabilities for these benefits are accounted for under US GAAP by using estimates of future benefits and fees under best estimate assumptions. For variable annuity business the key assumption is the expected long-term level of equity market returns, which for 2010 and 2009 was 8.4 per cent per annum (after deduction of external fund management fees) determined using a mean reversion methodology. Under the mean reversion methodology, projected returns over the next five years are flexed (subject to capping) so that, combined with the actual rates of return for the current and the previous two years the 8.4 per cent rate is maintained. The projected rates of return are capped at no more than 15 per cent for each of the next five years. Further details are explained in note D3(g). These returns affect the level of future expected profits through their effects on the fee income with consequential impact on the amortisation of deferred acquisition costs as described below and the required level of provision for guaranteed minimum death benefit claims. For traditional life insurance contracts, provisions for future policy benefits are determined using the net level premium method and assumptions as of the issue date as to mortality, interest, policy lapses and expenses plus provisions for adverse deviation. Except to the extent of mortality experience, which primarily affects profits through variations in claim payments and the guaranteed minimum death benefit reserves, the profits of Jackson are relatively insensitive to changes in insurance risk. This reflects the principally spread and fee-based nature of Jackson’s business.
Asian operationsThe insurance products written in the Group’s Asian operations principally cover with-profits business, unit-linked business, and other non-participating business. The results of with-profits business are relatively insensitive to changes in estimates and assumptions that affect the measurement of policyholder liabilities. As for the UK business, this feature arises because unallocated surplus is accounted for by the Group as a liability. The results of Asian unit-linked business are also relatively insensitive to changes in estimates or assumptions. The remaining non-participating business in Asia has some limited sensitivity to interest rates. Further details are provided in D4(j). Deferred acquisition costsSignificant costs are incurred in connection with acquiring new insurance business. Except for acquisition costs of with-profits contracts of the UK regulated with-profits funds, which are accounted for under the realistic FSA regime as described in note A4, these costs, which vary with, and are primarily related to, the production of new business, are capitalised and amortised against margins in future revenues on the related insurance policies. The recoverability of the asset is measured and the asset is deemed impaired if the projected future margins are less than the carrying value of the asset. To the extent that the future margins differ from those anticipated, then an adjustment to the carrying value of the deferred acquisition cost asset will be necessary. The deferral and amortisation of acquisition costs is of most relevance to the Group’s results for shareholder-financed long-term business of Jackson and Asian operations. The majority of the UK shareholder-backed business is for individual and group annuity business where the incidence of acquisition costs is negligible.
JacksonFor term business, acquisition costs are deferred and amortised in line with expected premiums. For annuity business, acquisition costs are deferred and amortised in line with expected gross profits on the relevant contracts. For interest-sensitive business, the key assumption is the long-term spread between the earned rate and the rate credited to policyholders, which is based on the annual spread analysis. In addition, expected gross profits depend on mortality assumptions, assumed unit costs and terminations other than deaths (including the related charges), all of which are based on a combination of Jackson’s actual industry experience and future expectations. A detailed analysis of actual experience is measured by internally developed mortality studies. For variable annuity business, the key assumption is the expected long-term level of equity market returns as described above. The level of acquisition costs carried in the statement of financial position is also sensitive to unrealised valuation movements on debt securities held to back the liabilities and solvency capital. Further details are explained in notes D3(g) and H1.

166
Prudential plc Annual Report 2010
FINANCIAL STATEMENTS > NOTES ON THE GROUP FINANCIAL STATEMENTS
A: BACKGROUND AND ACCOUNTING POLICIESCONTINUED
A3: CRITICAL ACCOUNTING POLICIES, ESTIMATES AND JUDGEMENTS > CONTINUED
Asian operationsFor those territories applying US GAAP, principles similar to those set out in the Jackson paragraph above are applied to the deferral and amortisation of acquisition costs. For other Asian territories, except where the underlying reserving basis makes implicit allowance for the future fees that cover acquisition costs, the deferral and amortisation of acquisition costs is consistent with Modified Statutory Basis where costs associated with the production of new business are amortised in line with the emergence of margins.
PensionsThe Group applies the requirements of IAS 19, ‘Employee benefits’ and associated interpretations including IFRIC 14 ’IAS 19 – The Limit on a Defined Benefit Asset, Minimum Funding Requirements and their Interaction’, to its defined benefit pension schemes. The principal defined benefit pension scheme is the Prudential Staff Pension Scheme (PSPS). For PSPS the terms of the trust deed restrict shareholders’ access to any underlying surplus. Accordingly, applying the interpretation of IFRIC 14, any underlying IAS 19 basis surplus is not recognised for IFRS reporting. The financial position for PSPS recorded in the IFRS financial statements reflects the higher of any underlying IAS 19 deficit and any obligation for deficit funding. The economic participation in the surplus or deficits attaching to the PSPS and the smaller Scottish Amicable Pensions Scheme (SAPS) are shared between the PAC with-profits sub-fund (WPSF) and shareholder operations. The economic interest reflects the source of contributions over the scheme life, which in turn reflects the activity of the members during their employment. In the case of PSPS, movements in the apportionment of the financial position for PSPS between the WPSF and shareholders’ funds in 2010 reflect the 70/30 ratio applied to the base deficit position as at 31 December 2005 but with service cost and contributions for ongoing service apportioned by reference to the cost allocation for activity of current employees. For SAPS the ratio is estimated to be approximately 50/50 between the WPSF and shareholders’ funds. Due to the inclusion of actuarial gains and losses in the income statement rather than being recognised in other comprehensive income, the results of the Group are affected by changes in interest rates for corporate bonds that affect the rate applied to discount projected pension payments, changes in mortality assumptions and changes in inflation assumptions. Deferred taxDeferred tax assets are recognised to the extent that they are regarded as recoverable, that is to the extent that, on the basis of all the available evidence, it can be regarded as more likely than not that there will be suitable taxable profits against which the losses can be relieved. The taxation regimes applicable across the Group apply separate rules to trading and capital profits and losses. The distinction between temporary differences that arise from items of either a capital or trading nature may affect the recognition of deferred tax assets. The judgements made, and uncertainties considered, in arriving at deferred tax balances in the financial statements are discussed in note H4.
GoodwillGoodwill impairment testing requires the exercise of judgement by management as to prospective future cash flows. Further information is disclosed in note H1.
A4: SIGNIFICANT ACCOUNTING POLICIES
a Financial instruments other than financial instruments classified as long-term business contracts Investment classificationUnder IAS 39, subject to specific criteria, financial instruments should be accounted for under one of the following categories: financial investments at fair value through profit and loss, financial investments held on an available-for-sale basis, financial investments held-to-maturity or loans and receivables. Upon initial recognition, financial investments are measured at fair value plus, in the case of a financial asset or financial liability not at fair value through profit or loss, transaction costs that are directly attributable to the acquisition or issue of the financial asset or financial liability. These IAS 39 classifications have been changed by IFRS 9 ‘Financial Investments: Classification and Measurement’ which is not required to be adopted until 2013 and is still subject to EU endorsement. This standard has not been adopted by the Group in 2010. The Group holds financial investments on the following bases:
i Financial assets and liabilities at fair value through profit and loss – this comprises assets and liabilities designated by management as fair value through profit and loss on inception and derivatives that are held for trading. These investments are measured at fair value with all changes thereon being recognised in investment income.

167F
INA
NC
IAL
S
TA
TE
ME
NT
SA
: BA
CK
GR
OU
ND
AN
D
AC
CO
UN
TIN
G P
OL
ICIE
S
ii Financial investments on an available-for-sale basis – this comprises assets that are designated by management and/or do not fall into any of the other categories. Available-for-sale financial assets are initially recognised at fair value plus attributable transaction costs. For available-for-sale debt securities, the difference between their cost and par value is amortised to the income statement using the effective interest rate. Available-for-sale financial assets are subsequently measured at fair value. Interest income is recognised on an effective interest basis in the income statement. Except for foreign exchange gains and losses on debt securities, not in functional currency, which are included in the income statement, unrealised gains and losses are recognised in other comprehensive income (i.e. outside of the income statement). Upon disposal or impairment, accumulated unrealised gains and losses are transferred from other comprehensive income to the income statement as realised gains or losses.
iii Loans and receivables – this comprises non-quoted investments that have fixed or determinable payments and are not designated as fair value through profit and loss or available-for-sale. These investments include loans collateralised by mortgages, deposits, loans to policyholders and other unsecured loans and receivables. These investments are initially recognised at fair value plus transaction costs. Subsequently, these investments are carried at amortised cost using the effective interest method.
As permitted under IAS 39 the Group has designated certain financial assets as fair value through profit and loss as these assets are managed and their performance is evaluated on a fair value basis. These assets represent all of the Group’s financial assets other than the majority of loans and receivables and debt securities held by Jackson. Debt securities held by Jackson are accounted for on an available-for-sale basis. The use of the fair value option is consistent with the Group’s risk management and investment strategies. The Group uses the trade date method to account for regular purchases and sales of financial assets.
Use of fair valuesThe Group uses current bid prices to value its investments with quoted prices. Actively traded investments without quoted prices are valued using prices provided by third parties. If there is no active established market for an investment, the Group applies an appropriate valuation technique such as a discounted cash flow technique. Additional details are provided in note G1.
ImpairmentsThe Group assesses at each statement of financial position date, whether there is objective evidence that a financial asset or group of financial assets not held at fair value through profit and loss is impaired. A financial asset or group of financial assets is impaired and impairment losses are incurred only if there is objective evidence of impairment as a result of one or more events that have occurred after the initial recognition of the asset (a loss event) and that a loss event (or events) has an impact on the estimated future cash flows of the financial asset or group of financial assets that can be reliably estimated. Objective evidence that a financial asset or group of financial assets is impaired includes observable data that comes to the attention of the Group. For assets designated as available-for-sale, the initial impairment is the cumulative loss which is removed from the available-for-sale reserve within equity and recognised in the income statement. Any subsequent impairment loss is measured as the cumulative loss, less any impairment loss previously recognised. For loans and receivables carried at amortised cost, the impairment amount is the difference between carrying value and the present value of the expected cash flows discounted at the original effective interest rate. If, in subsequent periods, an impaired debt security held on an available-for-sale basis or an impaired loan or receivable recovers in value (in part or in full), and this recovery can be objectively related to an event occurring after the impairment, then the previously recognised impairment loss is reversed through the income statement (in part or in full).
Derivatives and hedge accountingDerivative financial instruments are used to reduce or manage investment, interest rate and currency exposures, to facilitate efficient portfolio management and for investment purposes. The Group may designate certain derivatives as hedges. This includes fair value hedges, cash flow hedges and hedges of net investments in foreign operations. If the criteria for hedge accounting are met then the following accounting treatments are applied from the date at which the designation is made and the accompanying requisite documentation is in place:
i Hedges of net investments in foreign operations – the effective portion of any change in fair value of derivatives or other financial instruments designated as net investment hedges are recognised in other comprehensive income (i.e. outside of the income statement). The ineffective portion of changes in the fair value of the hedging instrument is recorded in the income statement. The gain or loss on the hedging instrument recognised directly in other comprehensive income, is recognised in the income statement on disposal of the foreign operation.
ii Fair value hedges – movements in the fair value of the hedged item attributable to the hedged risk are recognised in the income statement.
iii Cash flow hedges – the effective portion of changes in the fair value of derivatives designated as cash flow hedges is recognised in other comprehensive income (i.e. outside of the income statement). Movements in fair value relating to the ineffective portion are booked in the income statement. Amounts recognised in other comprehensive income are recorded in the income statement in the periods in which the hedged item affects profit or loss.

168
Prudential plc Annual Report 2010
FINANCIAL STATEMENTS > NOTES ON THE GROUP FINANCIAL STATEMENTS
A: BACKGROUND AND ACCOUNTING POLICIESCONTINUED
A4: SIGNIFICANT ACCOUNTING POLICIES > CONTINUED
All derivatives that do not meet the relevant hedging criteria are carried at fair value with movements in fair value being recorded in the income statement. The primary areas of the Group’s continuing operations where derivative instruments are held are the UK with-profits funds and annuity business, and Jackson. For the Group’s continuing operations, hedge accounting under IAS 39 is not usually applied. The exceptions, where hedge accounting has been applied in 2010 and 2009, are summarised in note G3. For UK with-profits funds the derivative programme is undertaken as part of the efficient management of the portfolio as a whole. As noted in section D2 value movements on the with-profits funds investments are reflected in changes in asset-share liabilities to policyholders or the liability for unallocated surplus. Shareholders’ profit and equity are not affected directly by value movements on the derivatives held. For UK annuity business the derivatives are held to contribute to the matching as far as practical, of asset returns and duration with those of liabilities to policyholders. The carrying value of these liabilities is sensitive to the return on the matching financial assets including derivatives held. Except for the extent of minor mismatching, value movements on derivatives held for this purpose do not affect shareholders’ profit or equity. For Jackson an extensive derivative programme is maintained. Value movements on the derivatives held can be very significant in their effect on shareholder results. The Group has chosen generally not to seek to construct the Jackson derivative programme so as to facilitate hedge accounting where theoretically possible, under IAS 39. Further details on this aspect of the Group’s financial reporting are described in note A3.
Embedded derivativesEmbedded derivatives are present in host contracts issued by various Group companies, in particular for Jackson. They are embedded within other non-derivative host financial instruments and insurance contracts to create hybrid instruments. Embedded derivatives meeting the definition of an insurance contract are accounted for under IFRS 4. Where economic characteristics and risks of the embedded derivatives are not closely related to the economic characteristics and risks of the host instrument, and where the hybrid instrument is not measured at fair value with the changes in fair value recognised in the income statement, the embedded derivative is bifurcated and carried at fair value as a derivative in accordance with IAS 39. In addition, the Group applies the requirement of IFRS 4 to not separate and fair value surrender options embedded in host contracts and with-profits investment contracts whose strike price is either a fixed amount or a fixed amount plus interest. Further details on the valuation basis for embedded derivatives attaching to Jackson’s life assurance contracts are provided in note D3(g).
Securities lending including repurchase agreementsThe Group is party to various securities lending agreements under which securities are loaned to third-parties on a short-term basis. The loaned securities are not derecognised; rather, they continue to be recognised within the appropriate investment classification. The Group’s policy is that collateral in excess of 100 per cent of the fair value of securities loaned is required from all securities’ borrowers and typically consists of cash, debt securities, equity securities or letters of credit. In cases where the Group takes possession of the collateral under its securities lending programme, the collateral, and corresponding obligation to return such collateral, are recognised in the consolidated statement of financial position.
Derecognition of financial assets and liabilitiesThe Group’s policy is to derecognise financial assets when it is deemed that substantially all the risks and rewards of ownership have been transferred. The Group also derecognises a financial asset when the contractual rights to the cash flows from the financial asset expire. Where the Group neither transfers nor retains substantially all the risks and rewards of ownership, the Group will derecognise the financial asset where it is deemed that the Group has not retained control of the financial asset. Where the transfer does not result in the Group transferring the right to receive the cash flows of the financial assets, but does result in the Group assuming a corresponding obligation to pay the cash flows to another recipient, the financial assets are also accordingly derecognised providing all of the following conditions are met:
• the Group has no obligation to pay amounts to the eventual recipients unless it collects the equivalent amounts from the original asset;• the Group is prohibited by the terms of the transfer contract from selling or pledging the original asset; and• the Group has an obligation to remit any cash flows it collects on behalf of the eventual recipients without material delay.
The Group derecognises financial liabilities only when the obligation specified in the contract is discharged, cancelled or has expired.
BorrowingsAlthough initially recognised at fair value, net of transaction costs, borrowings, excluding liabilities of consolidated collateralised debt obligations, are subsequently accounted for on an amortised cost basis using the effective interest method. Under the effective interest method, the difference between the redemption value of the borrowing and the initial proceeds (net of related issue costs) is amortised through the income statement to the date of maturity or for hybrid debt, over the expected life of the instrument.

169F
INA
NC
IAL
S
TA
TE
ME
NT
SA
: BA
CK
GR
OU
ND
AN
D
AC
CO
UN
TIN
G P
OL
ICIE
S
Financial liabilities designated at fair value through profit and lossConsistent with the Group’s risk management and investment strategy and the nature of the products concerned, the Group has designated under IAS 39 classification certain financial liabilities at fair value through profit and loss as these instruments are managed and their performance evaluated on a fair value basis. These instruments include liabilities related to consolidated collateralised debt obligations and net assets attributable to unit holders of consolidated unit trusts and similar funds.
b Long-term business contractsIncome statement treatmentPremiums and claimsPremium and annuity considerations for conventional with-profits policies and other protection type insurance policies are recognised as revenue when due. Premiums and annuity considerations for linked policies, unitised with-profits and other investment type policies are recognised as revenue when received or, in the case of unitised or unit-linked policies, when units are issued. These amounts exclude UK premium taxes and similar duties where Prudential collects and settles taxes borne by the customer. Policy fees charged on linked and unitised with-profits policies for mortality, asset management and policy administration are recognised as revenue when related services are provided. Claims paid include maturities, annuities, surrenders and deaths. Maturity claims are recorded as charges on the policy maturity date. Annuity claims are recorded when each annuity instalment becomes due for payment. Surrenders are charged to the income statement when paid and death claims are recorded when notified. For investment contracts which do not contain discretionary participating features, the accounting is carried out in accordance with IAS 39 to reflect the deposit nature of the arrangement, with premiums and claims reflected as deposits and withdrawals and taken directly to the statement of financial position as movements in the financial liability balance.
Acquisition costsWith the exception of costs incurred in respect of with-profits contracts valued on a realistic basis, costs of acquiring new insurance business, principally commissions, marketing and advertising costs and certain other costs associated with policy issuance and underwriting that are not reimbursed by policy charges, are specifically identified and capitalised as part of deferred acquisition costs (DAC), which are included as an asset in the statement of financial position. The DAC asset in respect of insurance contracts is amortised against margins in future revenues on the related insurance policies, to the extent that the amounts are recoverable out of the margins. Recoverability of the unamortised DAC asset is assessed at the time of policy issue and reviewed if profit margins have declined. Under IFRS, investment contracts (excluding those with discretionary participation features) accounted for as financial liabilities in accordance with IAS 39 which also offers investment management services, require the application of IAS 18 for the revenue attached to these services. The Group’s investment contracts primarily comprise certain unit-linked savings contracts in the UK and Asia and contracts with fixed and guaranteed terms in the US (such as guaranteed investment contracts and annuity-certains) all of which offer an investment service. Incremental, directly attributable acquisition costs relating to the investment management element of these contracts are capitalised and amortised in line with the related revenue. If the contracts involve up-front charges, this income is also deferred and amortised through the income statement in line with contractual service provision.
UK regulated with-profits fundsPrudential’s long-term business written in the UK comprises predominantly life insurance policies with discretionary participating features under which the policyholders are entitled to participate in the returns of the funds supporting these policies. Business similar to this type is also written in certain of the Group’s Asian operations subject to local market and regulatory conditions. Such policies are called with-profits policies. Prudential maintains with-profits funds within the Group’s long-term business funds, which segregate the assets and liabilities and accumulate the returns related to that with-profits business. The amounts accumulated in these with-profits funds are available to provide for future policyholder benefit provisions and for bonuses to be distributed to with-profits policyholders. The bonuses, both annual and final, reflect the right of the with-profits policyholders to participate in the financial performance of the with-profits funds. Shareholders’ profits with respect to bonuses declared on with-profits business correspond to the shareholders’ share of the cost of bonuses as declared by the Board of directors. The shareholders’ share currently represents one-ninth of the cost of bonuses declared for with-profits policies. Annual bonuses are declared and credited each year to with-profits policies. The annual bonuses increase policy benefits and, once credited, become guaranteed. Annual bonuses are charged to the profit and loss account in the year declared. Final bonuses are declared each year and accrued for all policies scheduled to mature and for death benefits expected to be paid during the next financial year. Final bonuses are not guaranteed and are only paid on policies that result from claims through the death of the policyholder or maturity of the policy within the period of declaration or by concession on surrender. No policyholder benefit provisions are recorded for future annual or final bonus declarations. The policyholders’ liabilities of the regulated with-profits funds are accounted for under FRS 27. Under FRS 27 for the UK with-profits funds:
• no deferred acquisition costs and related deferred tax are recognised; and• adjusted realistic basis liabilities instead of MSB liabilities are recognised.

170
Prudential plc Annual Report 2010
FINANCIAL STATEMENTS > NOTES ON THE GROUP FINANCIAL STATEMENTS
A: BACKGROUND AND ACCOUNTING POLICIESCONTINUED
A4: SIGNIFICANT ACCOUNTING POLICIES > CONTINUED
FRS 27 realistic basis liabilities are underpinned by the FSA’s Peak 2 basis of reporting. This Peak 2 basis requires the value of liabilities to be calculated as:
• a with-profits benefits reserve (WPBR); plus• future policy related liabilities (FPRL); plus• the realistic current liabilities of the fund.
The WPBR is primarily based on the retrospective calculation of accumulated asset shares but is adjusted to reflect future policyholder benefits and other outgoings. The FPRL must include a market consistent valuation of costs of guarantees, options and smoothing, less any related charges, and this amount is determined using either a stochastic approach, hedging costs or a series of deterministic projections with attributed probabilities. The assumptions used in the stochastic models are calibrated to produce risk-free returns on each asset class. Volatilities of, and correlations between, investment returns from different asset classes are as determined by the Group’s Portfolio Management Group on a market consistent basis. The cost of guarantees, options and smoothing is very sensitive to the bonus, market value reduction (MVR) and investment policies the Group employs and therefore the stochastic modelling incorporates a range of management actions that would help to protect the fund in adverse scenarios. Substantial flexibility has been included in the modelled management actions in order to reflect the discretion that the Group retains in adverse investment conditions, thereby avoiding the creation of unreasonable minimum capital requirements. The management actions assumed are consistent with management’s policy for with-profits funds and the disclosures made in the publicly available Principles and Practices of Financial Management. The realistic basis liabilities representing the Peak 2 basis realistic liabilities for with-profits business included in Form 19 of the FSA regulatory returns include the element for the shareholders’ share of the future bonuses. For accounting purposes under FRS 27, this latter item is reversed because, consistent with the current basis of financial reporting, shareholder transfers are recognised only on declaration. Unallocated surplusThe unallocated surplus represents the excess of assets over policyholder liabilities for the Group’s with-profits funds. As allowed under IFRS 4, the Group has opted to continue to record unallocated surplus of with-profits funds wholly as a liability. The annual excess (shortfall) of income over expenditure of the with-profits funds, after declaration and attribution of the cost of bonuses to policyholders and shareholders, is transferred to (from) the unallocated surplus each year through a charge (credit) to the income statement. The balance retained in the unallocated surplus represents cumulative income arising on the with-profits business that has not been allocated to policyholders or shareholders. The balance of the unallocated surplus is determined after full provision for deferred tax on unrealised appreciation on investments.
Other insurance contracts (i.e. contracts which contain significant insurance risk as defined under IFRS 4)For these contracts UK GAAP has been applied, which reflects the MSB. Under this basis the following approach applies:
Other UK insurance contractsOther UK insurance contracts that contain significant insurance risk include unit-linked, annuity and other non-profit business. For the purposes of local regulations, segregated accounts are established for linked business for which policyholder benefits are wholly or partly determined by reference to specific investments or to an investment-related index. The interest rates used in establishing policyholder benefit provisions for pension annuities in the course of payment are adjusted each year. Mortality rates used in establishing policyholder benefit are based on published mortality tables adjusted to reflect actual experience.
Overseas subsidiariesThe assets and liabilities of insurance contracts of overseas subsidiaries are determined initially using local GAAP bases of accounting with subsequent adjustments where necessary to comply with the Group’s accounting policies.
JacksonThe future policyholder benefit provisions for Jackson’s conventional protection-type policies are determined using the net level premium method under US GAAP principles and assumptions as of the issue date as to mortality, interest, policy lapses and expenses plus provisions for adverse deviations. For non-conventional protection-type policies, the policyholder benefit provision included within policyholder liabilities in the consolidated statement of financial position is the policyholder account balance.

171F
INA
NC
IAL
S
TA
TE
ME
NT
SA
: BA
CK
GR
OU
ND
AN
D
AC
CO
UN
TIN
G P
OL
ICIE
S
For the business of Jackson, the determination of the expected emergence of margins, against which the amortisation profile of the DAC asset is established, is dependent on certain key assumptions. For single premium deferred annuity business, the key assumption is the expected long-term spread between the earned rate and the rate credited to policyholders. For variable annuity business, the key assumption is the expected long-term level of equity market returns which, for 2010 and 2009, was 8.4 per cent per annum, implemented using a mean reversion methodology. These returns affect the level of future expected profits through their effects on fee income and the required level of provision for guaranteed minimum death benefit claims. Jackson accounts for the majority of its investment portfolio on an available-for-sale basis (see investment policies above) whereby unrealised gains and losses are recognised in other comprehensive income. As permitted by IFRS 4, Jackson has used shadow accounting. Under shadow accounting, to the extent that recognition of unrealised gains or losses on available-for-sale securities causes adjustments to the carrying value and amortisation patterns of DAC and deferred income, these adjustments are recognised in other comprehensive income to be consistent with the treatment of the gains or losses on the securities. More precisely, shadow DAC adjustments reflect the change in DAC that would have arisen if the assets held in the statement of financial position had been sold, crystallising unrealised gains or losses, and the proceeds reinvested at the yields currently available in the market.
Asian operationsExcept for the operations in Taiwan, Vietnam and Japan, the future policyholder benefit provisions for Asian businesses are determined in accordance with methods prescribed by local GAAP adjusted to comply, where necessary, with UK GAAP. For the Hong Kong business, which is a branch of the PAC, and the Singapore and Malaysian operations, the valuation principles and sensitivities to changes of assumptions of conventional with-profits and other protection-type policies are similar to those described above for equivalent products written by the UK operations. Refinements to the local reserving methodology are generally treated as change in estimates, dependent on the nature of the change. Such a refinement arose in 2009 in respect of Malaysia as explained in note D4(i). For the operations in Taiwan, Vietnam and Japan, countries where local GAAP is not appropriate in the context of the previously applied MSB, accounting for insurance contracts is based on US GAAP. For these three operations the business written is primarily non-participating and linked business. The future policyholder benefit provisions for non-linked business are determined using the net level premium method, with an allowance for surrenders, maintenance and claim expenses. Rates of interest used in establishing the policyholder benefit provisions vary by operation depending on the circumstances attaching to each block of business. Where appropriate, liabilities for participating business for these three operations include provisions for the policyholders’ interest in realised investment gains and other surpluses that have yet to be declared as bonuses. Although the basis of valuation of Prudential’s overseas operations is in accordance with the requirements of the Companies Act 2006 and ABI SORP, the valuation of policyholder benefit provisions for these businesses may differ from that determined on a UK MSB for UK operations with the same features. These differences are permitted under IFRS 4.
Liability adequacyThe Group performs liability adequacy testing on its insurance provisions to ensure that the carrying amounts of provisions (less related DAC and present value of in-force business – see policy on business acquisitions and disposals) is sufficient to cover current estimates of future cash flows. When performing the liability adequacy test, the Group discounts all contractual cash flows and compares this amount to the carrying value of the liability. Any deficiency is immediately charged to the income statement.
ReinsuranceIn the normal course of business, the Group seeks to reduce loss exposure by reinsuring certain levels of risk in various areas of exposure with other insurance companies or reinsurers. An asset or liability is recognised in the consolidated statement of financial position representing premiums due to, or payments due from reinsurers and the share of benefits and claims recoverable from reinsurers. The measurement of reinsurance assets is consistent with the measurement of the underlying direct insurance contracts. The treatment of any gains or losses arising on the purchase of reinsurance contracts is dependent on the underlying accounting basis of the entity concerned amongst other things.
Investment contracts (contracts which do not contain significant insurance risk as defined under IFRS 4)For investment contracts with discretionary participation features, the accounting basis is consistent with the accounting for similar with-profits insurance contracts. Other investment contracts are accounted for on a basis that reflects the hybrid nature of the arrangements whereby part is accounted for as a financial instrument under IAS 39 and the investment management service component is accounted for under IAS 18. For those investment contracts in the US with fixed and guaranteed terms, the Group uses the amortised cost model to measure the liability. On contract inception, the liability is measured at fair value less incremental, directly attributable acquisition costs. Remeasurement at future reporting dates is on an amortised cost basis utilising an effective interest rate methodology whereby the interest rate utilised discounts to the net carrying amount of the financial liability. Those investment contracts without fixed and guaranteed terms are designated at fair value through profit and loss because the resulting liabilities are managed and their performance is evaluated on a fair value basis. Fair value is based upon the fair value of the underlying assets of the fund. Where the contract includes a surrender option its carrying value is subject to a minimum carrying value equal to its surrender value.

172
Prudential plc Annual Report 2010
FINANCIAL STATEMENTS > NOTES ON THE GROUP FINANCIAL STATEMENTS
A: BACKGROUND AND ACCOUNTING POLICIESCONTINUED
A4: SIGNIFICANT ACCOUNTING POLICIES > CONTINUED
c Other assets, liabilities, income and expenditureBasis of consolidationThe Group consolidates those entities it is deemed to control. The degree of control is determined by the ability of the Group to govern the financial and operating policies of an entity in order to obtain benefits. Consideration is given to other factors such as potential voting rights. The Group has consolidated special purpose entities (SPEs), such as funds holding collateralised debt obligations (CDOs), where evaluation of the substance of the relationship between the SPE and the Group indicates that the Group is deemed to control the SPE under IFRS. The Group holds investments in internally and externally managed open-ended investment companies (OEICs) and unit trusts. These are consolidated where the Group’s percentage ownership level is 50 per cent or greater. The Group’s percentage ownership levels in these entities can fluctuate from day to day according to changes in the Group’s and third-party participation in the funds. In instances where the Group’s ownership of internally managed funds declines marginally below 50 per cent and, based on historical analysis and future expectations the decline in ownership is expected to be temporary, the funds continue to be consolidated as subsidiaries under IAS 27. Where the Group exercises significant influence or has the power to exercise significant influence over an entity, generally through ownership of 20 per cent or more of the entity’s voting rights, but does not control the entity, then this is considered to be an investment in an associate. With the exception of those referred to below, the Group’s investments in associates are recorded at the Group’s share of the associates’ net assets including any goodwill and intangibles arising upon initial acquisition. The carrying value of investments in associates is adjusted each year for the Group’s share of the entities’ profit or loss. This does not apply to investments in associates held by the Group’s insurance or investment funds including the venture capital business or mutual funds and unit trusts, which as permitted by IAS 28 are carried at fair value through profit and loss. The Group’s investments in joint ventures are recognised using proportional consolidation whereby the Group’s share of an entity’s individual balances are combined line-by-line with similar items into the Group financial statements. Other interests in entities, where significant influence is not exercised, are carried as investments at fair value through profit and loss. The consolidated financial statements of the Group include the assets, liabilities and results of the Company and subsidiary undertakings in which Prudential has a controlling interest, using accounts drawn up to 31 December 2010 except where entities have non-coterminous year ends. In such cases, the information consolidated is based on the accounting period of these entities and is adjusted for material changes up to 31 December. Accordingly, the information consolidated is deemed to cover the same period for all entities throughout the Group. The results of subsidiaries are included in the financial statements from the date control commences to the date control ceases. All inter-company transactions are eliminated on consolidation. Results of asset management activities include those for managing internal funds.
Investment propertiesInvestments in leasehold and freehold properties not for occupation by the Group, including properties under development for future use as investment properties, are carried at fair value, with changes in fair value included in the income statement. Properties are valued annually either by the Group’s qualified surveyors or by taking into consideration the advice of professional external valuers using the Royal Institution of Chartered Surveyors (RICS) guidelines. The RICS guidelines apply separate assumptions to the value of the land, buildings and tenancy associated with each property. Each property is externally valued at least once every three years. The cost of additions and renovations is capitalised and considered when estimating fair value. Fair value is based on active market prices, adjusted, if necessary, for any difference in the nature, location or condition of the specific property. If this information is not available, the Group uses alternative valuation methods such as discounted cash flow projections or recent prices in less active markets. Leases of investment property where the Group has substantially all the risks and rewards of ownership are classified as finance leases (leasehold property). Finance leases are capitalised at the lease’s inception at the lower of the fair value of the leased property and the present value of the minimum lease payments. Where a lease has a contingent rent element, the rent is calculated in accordance with individual lease terms and charged as an expense as incurred.
Pension schemesThe Group operates a number of pension schemes around the world. The largest of these schemes is the PSPS, a defined benefit scheme. The Group also operates defined contribution schemes. Defined contribution schemes are schemes where the Company pays contributions into a fund and the Company has no legal or constructive obligation to pay further contributions should the assets of that fund be insufficient to pay the employee benefits relating to employee service in both current and prior periods. Defined benefit schemes are post-employment benefit plans that are not defined contribution schemes.

173F
INA
NC
IAL
S
TA
TE
ME
NT
SA
: BA
CK
GR
OU
ND
AN
D
AC
CO
UN
TIN
G P
OL
ICIE
S
For the Group’s defined benefit schemes, if the present value of the defined benefit obligation exceeds the fair value of the scheme assets, then a liability is recorded in the Group’s statement of financial position. By contrast, if the fair value of the assets exceeds the present value of the defined benefit obligation then the surplus will only be recognised if the nature of the arrangements under the trust deed, and funding arrangements between the Trustee and the Company support the availability of refunds or recoverability through agreed reductions in future contributions. In addition, if there is a constructive obligation for the Company to pay deficit funding, this is also recognised. The Group utilises the projected unit credit method to calculate the defined benefit obligation. Estimated future cash flows are then discounted at a high-quality corporate bond rate, adjusted to allow for the difference in duration between the bond index and the pension liabilities where appropriate, to determine its present value. These calculations are performed by independent actuaries. The plan assets of the Group’s pension schemes exclude several insurance contracts that have been issued by the Group. These assets are excluded from plan assets in determining the pension obligation recognised in the consolidated statement of financial position. The aggregate of the actuarially determined service costs of the currently employed personnel and the unwind of discount on liabilities at the start of the period, less the expected investment return on scheme assets at the start of the period, is charged to the income statement. Actuarial gains and losses as a result of changes in assumptions or experience variances are also charged or credited to the income statement. Contributions to the Group’s defined contribution schemes are expensed when due. Once paid, the Group has no further payment obligations. Any prepayments are reflected as an asset on the statement of financial position.
Share-based paymentsThe Group offers share award and option plans for certain key employees and a Save As You Earn (SAYE) plan for all UK and certain overseas employees. The arrangements for distribution to employees of shares held in trust relating to share award plans and for entitlement to dividends depend upon the particular terms of each plan. Shares held in trust relating to these plans are conditionally gifted to employees. The compensation expense charged to the income statement is primarily based upon the fair value of the options granted, the vesting period and the vesting conditions. Vesting conditions exclude the ability of an employee to voluntarily exit a scheme and such exits are treated as an acceleration of vesting and hence a shortening of the period over which the expense is charged. The Group revises its estimate of the number of options likely to be exercised at each statement of financial position date and adjusts the charge to the income statement accordingly. Where the share-based payment depends upon vesting outcomes attaching to market-based performance conditions, additional modelling is performed to estimate the fair value of the awards. No subsequent adjustment is then made to the fair value charge for awards that do not vest on account of these performance conditions not being met. The Company has established trusts to facilitate the delivery of Prudential plc shares under employee incentive plans and savings-related share option schemes. None of the trusts that hold shares for employee incentive and savings plans continue to hold these shares once they are issued to employees. The cost to the Company of acquiring these treasury shares held in trusts is shown as a deduction from shareholders’ equity. TaxThe Group’s UK subsidiaries each file separate tax returns. Jackson and other foreign subsidiaries, where permitted, file consolidated income tax returns. In accordance with UK tax legislation, where one domestic UK company is a 75 per cent owned subsidiary of another UK company or both are 75 per cent owned subsidiaries of a common parent, the companies are considered to be within the same UK tax group. For companies within the same tax group, trading profits and losses arising in the same accounting period may be offset for purposes of determining current and deferred taxes. Current tax expense is charged or credited to operations based upon amounts estimated to be payable or recoverable as a result of taxable operations for the current year. To the extent that losses of an individual UK company are not offset in any one year, they can be carried back for one year or carried forward indefinitely to be offset against profits arising from the same company. Deferred taxes are provided under the liability method for all relevant temporary differences, being the difference between the carrying amount of an asset or liability in the statement of financial position and its value for tax purposes. IAS 12, ‘Income Taxes’ does not require all temporary differences to be provided for, in particular, the Group does not provide for deferred tax on undistributed earnings of subsidiaries where the Group is able to control the timing of the distribution and the temporary difference created is not expected to reverse in the foreseeable future. The tax effects of losses available for carry forward are recognised as an asset. Deferred tax assets are only recognised when it is more likely than not, that future taxable profits will be available against which these losses can be utilised. Deferred tax related to charges or credits taken to other comprehensive income is also credited or charged to other comprehensive income and is subsequently recognised in the income statement together with the deferred gain or loss. The tax charge for long-term business includes tax expense on with-profits funds attributable to both the policyholders and the shareholders. Different tax rules apply under UK law depending upon whether the business is life insurance or pension business. Tax on the life insurance business is based on investment returns less expenses attributable to that business. Tax on the pension business is based on the shareholders’ profits or losses attributable to that business. The shareholders’ portion of the long-term business is taxed at the shareholders’ rate with the remaining portion taxed at rates applicable to the policyholders.

174
Prudential plc Annual Report 2010
FINANCIAL STATEMENTS > NOTES ON THE GROUP FINANCIAL STATEMENTS
A: BACKGROUND AND ACCOUNTING POLICIESCONTINUED
A4: SIGNIFICANT ACCOUNTING POLICIES > CONTINUED
Deferred tax is measured at the tax rates that are expected to apply to the period when the asset is realised or the liability settled, based on tax rates (and laws) that have been enacted or are substantively enacted at the end of the reporting period.
Basis of presentation of tax chargesTax charges in the income statement reflect the aggregate of the shareholder tax on the long-term business result and on the Group’s other results. Under UK Listing Authority rules, profit before tax is required to be presented. This requirement, coupled with the fact that IFRS does not contemplate tax charges which are attributable to policyholders and unallocated surplus of with-profits funds and unit-linked policies, necessitates the reporting of total tax charges within the presented results. The result before all taxes (i.e. ‘profit before tax’ as shown in the income statement) represents income net of post-tax transfers to unallocated surplus of with-profits funds, before tax attributable to policyholders and unallocated surplus of with-profits funds, unit-linked policies and shareholders. Separately within the income statement, ‘profit before tax attributable to shareholders’ is shown after deduction of taxes attributable to policyholders and unallocated surplus of with-profits funds and unit-linked policies. Tax charges on this measure of profit reflect the tax charges attributable to shareholders. In determining the tax charges attributable to shareholders, the Group has applied a methodology consistent with that previously applied under UK GAAP reflecting the broad principles underlying the tax legislation of life assurance companies.
Property, plant and equipmentAll property, plant and equipment such as owner occupied property, computer equipment and furniture and fixtures, are carried at depreciated cost. Costs including expenditure directly attributable to the acquisition of the assets are capitalised. Depreciation is calculated and charged on a straight-line basis over an asset’s estimated useful life. The residual values and useful lives are reviewed at each statement of financial position date. If the carrying amount of an asset is greater than its recoverable amount then its carrying value is written down to that recoverable amount. Leasehold improvements to owner occupied property are depreciated over the shorter of the economic life and the life of the lease. Assets held under finance leases are capitalised at their fair value.
Business acquisitions and disposalsBusiness acquisitions are accounted for by applying the purchase method of accounting, which adjusts the net assets of the acquired company to fair value at the date of purchase. The excess of the acquisition consideration over the fair value of the assets and liabilities of the acquired entity is recorded as goodwill. Expenses related to acquiring new subsidiaries are expensed in the period in which they are incurred. Should the fair value of the identifiable assets and liabilities of the entity exceed the acquisition consideration then this amount is recognised immediately in the income statement. Income and expenses of acquired entities are included in the income statement from the date of acquisition. Income and expenses of entities sold during the period are included in the income statement up to the date of disposal. The gain or loss on disposal is calculated as the difference between sale proceeds, net of selling costs, less the net assets of the entity at the date of disposal. For life insurance company acquisitions, the adjusted net assets include an identifiable intangible asset for the present value of in-force business which represents the profits that are expected to emerge from the acquired insurance business. The present value of in-force business is calculated using best estimate actuarial assumptions for interest, mortality, persistency and expenses and is amortised over the anticipated lives of the related contracts in the portfolio. The net carrying amount of insurance liabilities acquired less the value of in-force business, represents the fair value of the insurance liabilities acquired. An intangible asset may also be recognised in respect of acquired investment management contracts representing the fair value of contractual rights acquired under these contracts. GoodwillGoodwill arising on acquisitions of subsidiaries and businesses is capitalised and carried on the Group statement of financial position as an intangible asset at initial value less any accumulated impairment losses. Goodwill impairment testing is conducted annually and when there is an indication of impairment. For the purposes of impairment testing, goodwill is allocated to cash generating units. These cash generating units reflect the smallest group of assets that includes the goodwill and generates cash flows that are largely independent of the cash inflows from other groups of assets. If the carrying amount of the cash generating unit exceeds its recoverable amount then the goodwill is considered impaired. Impairment losses are recognised immediately in the income statement and may not be reversed in future periods.
Acquired intangible assetsIntangible assets acquired on the purchase of a subsidiary or portfolio of contracts are fair valued at acquisition and carried at cost less amortisation and any accumulated impairment losses. Amortisation calculated is charged on a straight-line basis over the estimated useful life of the assets. The residual values and useful lives are reviewed at each statement of financial position date.

175F
INA
NC
IAL
S
TA
TE
ME
NT
SA
: BA
CK
GR
OU
ND
AN
D
AC
CO
UN
TIN
G P
OL
ICIE
S
Cash and cash equivalentsCash and cash equivalents consist of cash at bank and in hand, deposits held at call with banks, treasury bills and other short-term highly liquid investments with less than 90 days maturity from the date of acquisition.
Rights of offsetAssets and liabilities in the consolidated financial statements are only reported on a net basis when there is a legally enforceable right to offset and there is an intention to settle on a net basis.
SegmentsUnder IFRS 8, the Group determines and presents operating segments based on the information that is internally provided to the Group Executive Committee (‘GEC’), which is the Group’s chief operating decision maker. An operating segment is a component of the Group that engages in business activities from which it may earn revenues and incur expenses, including revenues and expenses that relate to transactions with any of the Group’s other components. An operating segment’s operating results are reviewed regularly by the GEC to make decisions about resources to be allocated to the segment and assess its performance, and for which discrete financial information is available. The operating segments identified by the Group reflect the Group’s organisational structure, which is by both geography (Asia, US and UK) and by product line (insurance operations and asset management). Insurance operations principally comprise of products that contain both significant and insignificant elements of insurance risk. The products are managed together and there is no distinction between these two categories other than for accounting purposes. This segment also includes the commission earned on general insurance business and investment subsidiaries held for supporting the Group’s insurance operations. Asset management comprises both internal and third-party asset management services, inclusive of portfolio and mutual fund management, where the Group acts as an advisor, and broker-dealer activities. The nature of the products and the managing of the business differ from the risks inherent in the insurance operations segments, and the regulatory environment of the asset management industry differs from that of the insurance operations segments. The Group’s operating segments as determined in accordance with IFRS 8, are as follows:
Insurance operations • Asia• US (Jackson)• UK
Asset management operations • M&G • Asian asset management• US broker dealer and asset management (including Curian)
Prudential Capital has been incorporated into the M&G operating segment for the purposes of segment reporting. The Group’s operating segments are also its reportable segments. The performance measure of operating segments utilised by the Company is IFRS operating profit attributable to shareholders based on longer-term investment returns. This measure excludes the recurrent items of short-term fluctuations in investment returns and the shareholders’ share of actuarial and other gains and losses on defined benefit pension schemes. In addition, for 2010 this measure excluded costs associated with the terminated AIA transaction and gain arising upon the dilution of the Group’s holding in PruHealth. For 2009 it excluded the non-recurrent cost of hedging the Group IGD capital surplus included within short-term fluctuations in investment returns and the loss on sale and the results of the Taiwan agency business during the period of ownership. In 2010 the Company amended its presentation of operating profit for its US insurance operations to exclude the net equity hedge accounting effect previously included relating principally to its variable annuity business as explained below in note A4(d). These amounts are included in short-term fluctuations in investment returns. Prior year comparatives have been amended accordingly. There is no change to total profit for continuing operations before tax attributable to shareholders arising from this altered treatment. Operating earnings per share is based on operating profit based on longer-term investment returns, after tax and non-controlling interests. Further details on the determination of the performance measure of ‘operating profit based on longer-term investment returns’ is provided below in note A4 (d). Segment results that are reported to the GEC include items directly attributable to a segment as well as those that can be allocated on a reasonable basis. Unallocated items are mainly in relation to the Group Head Office and Asia Regional Head Office.
Shareholders’ dividendsInterim dividends are recorded in the period in which they are paid. Final dividends are recorded in the period in which they are approved by shareholders.

176
Prudential plc Annual Report 2010
FINANCIAL STATEMENTS > NOTES ON THE GROUP FINANCIAL STATEMENTS
A: BACKGROUND AND ACCOUNTING POLICIESCONTINUED
A4: SIGNIFICANT ACCOUNTING POLICIES > CONTINUED
Share capitalWhere there is no obligation to transfer assets, shares are classified as equity. The difference between the proceeds received on issue of the shares, net of share issue costs, and the nominal value of the shares issued, is credited to share premium. Where the Company purchases shares for the purposes of employee incentive plans, the consideration paid, net of issue costs, is deducted from retained earnings. Upon issue or sale any consideration received is credited to retained earnings net of related costs.
Foreign exchangeThe Group’s consolidated financial statements are presented in pounds sterling, the Group’s presentation currency. Accordingly, the results and financial position of foreign subsidiaries must be translated into the presentation currency of the Group from their functional currencies, i.e. the currency of the primary economic environment in which the entity operates. All assets and liabilities of foreign subsidiaries are converted at year end exchange rates whilst all income and expenses are converted at average exchange rates where this is a reasonable approximation of the rates prevailing on transaction dates. The impact of these currency translations is recorded as a separate component in the Statement of comprehensive income. Foreign currency borrowings that are used to provide a hedge against Group equity investments in overseas subsidiaries are translated at year end exchange rates and movements recognised in other comprehensive income. Other foreign currency monetary items are translated at year end exchange rates with changes recognised in the income statement. Foreign currency transactions are translated at the spot rate prevailing at the time.
d Operating profit based on longer-term investment returnsThe Group provides supplementary analysis of profit before tax attributable to shareholders that distinguishes operating profit based on longer-term investment returns from other constituent elements of the total profit. The Group uses operating profit based on longer-term investment returns to measure the performance of its operational segments. For the purposes of measuring operating profit, investment returns on shareholder-financed business are based on the expected longer-term rates of return. This reflects the particular features of long-term insurance business where assets and liabilities are held for the long-term and for which the accounting basis for insurance liabilities under current IFRS is not generally conducive to demonstrating trends in underlying performance for life businesses exclusive of changes in market conditions. In determining profit on this basis the following key elements are applied to the results of the Group’s shareholder-financed operations. The approach to determining profit on this basis was altered in 2010 from that previously applied in 2009 in respect of the net equity hedge accounting effect for variable and fixed index annuity US life business. Comparative results have been adjusted accordingly. The approach to determining operating profit based on longer-term investment returns reflected in segment results shown in note B1 is as follows:
i Debt and equity securitiesLonger-term investment returns comprise income and longer-term capital returns. For debt securities the longer-term capital returns comprise two elements. These are a risk margin reserve (RMR) based charge for expected defaults, which is determined by reference to the credit quality of the portfolio, and amortisation of interest-related realised gains and losses to operating results based on longer-term investment returns to the date when sold bonds would have otherwise matured. The shareholder-backed operation for which the RMR charge is most significant is Jackson National Life. For 2010 and 2009 Jackson has used the ratings resulting from the regulatory ratings detail issued by the National Association of Insurance Commissioners (NAIC) for residential mortgage-backed securities (RMBS) to determine the average annual RMR. In addition, in 2010, NAIC extended the new ratings framework to commercial mortgage-backed securities (CMBS), which Jackson has used for 2010. These were developed by external third parties; PIMCO (for RMBS) and BlackRock Solutions (for CMBS), and are considered by management more relevant information for the MBS securities concerned than using ratings by Nationally Recognised Statistical Rating Organisations (NRSRO). For other securities Jackson uses ratings by NRSRO.
ii US variable and fixed index annuity business(i) Current treatmentThe following value movements for Jackson’s variable and fixed index annuity business are excluded from operating profit based on longer-term investment returns:
• Fair value movements for equity-based derivatives;• Fair value movements for embedded derivatives for Guaranteed Minimum Withdrawal Benefit (GMWB) ‘not for life’ and fixed index
annuity business, and Guaranteed Minimum Income Benefit (GMIB) reinsurance;• Movements in accounts carrying value of GMDB and GMWB ‘for life’ liabilities; • Fee assessment, and claim payments, in respect of guarantee liabilities; and• Related changes to amortisation of deferred acquisition costs for each of the above items.

177F
INA
NC
IAL
S
TA
TE
ME
NT
SA
: BA
CK
GR
OU
ND
AN
D
AC
CO
UN
TIN
G P
OL
ICIE
S
(ii) Change of treatment in 2010For previous reporting of the 2009 results, all of the above items were included in operating profit based on longer-term investment returns with the intention of broadly matching the impacts with two exceptions. The exceptions were for the effect of GMIB reinsurance and movements in carrying values of free standing derivatives and embedded derivatives arising from changes in the level of observed implied equity volatility and changes in the discount rate applied from year to year. Both of these items remain in short-term fluctuations in investment returns in 2010. Previously, for the purposes of determining operating profit based on longer-term investment returns, the charge for these features was determined using historical longer-term equity volatility levels and long-term average AA corporate bond rate curves with the movement relating to the change in difference in long-term and current rates being included in short-term fluctuations (as shown in note B1). However, despite this use of longer-term equity volatility assumption levels and AA corporate bond rate curves, accounting volatility arose within the operating profit based on longer-term investment returns that was not representative of the underlying economic result. This feature arose due to the movement in the change in the accounting values of the derivatives and Jackson’s liabilities for variable and fixed indexed annuity guarantees included in the operating profit. Under IFRS, liabilities for GMDB and ‘for life’ GMWB are not fair valued. Instead, they are accounted for under IFRS using ‘grandfathered’ US GAAP in accordance with FASB ASC Subtopic 944-80, Financial Services – Insurance – Separate Accounts (formerly SOP 03-1). This accounting basis produces a distorting accounting effect on the operating profit that is not representative of the true economics of Jackson’s hedging programme. Over the long term the impact of this accounting distortion should cumulatively net out to a broadly neutral effect, but in the short term the operating profit can be highly volatile. The recent growth in Jackson’s variable annuity business had resulted in this short-term effect having a greater impact on the Group operating profit than in prior years. Further, these accounting mismatches are magnified in periods of significant market movements. These factors have prompted a reassessment of the presentation of operating profit based on longer-term investment returns. The following items have been reclassified from operating profit to short-term fluctuations in investment returns:
• The fair value movement in free standing hedging derivatives, excluding the impact of the difference between longer-term and current period implied equity volatility levels;
• The movement in liabilities for those embedded derivative liabilities which are fair valued in accordance with IFRS, primarily GMWB ‘not for life’ and fixed index annuity business, excluding the impacts of the differences between longer-term and current period equity volatility and incorporating 10-year average yield curves, in lieu of current period yield curves;
• Movements in IFRS basis guarantee liabilities for GMWB ‘for life’, being those policies where a minimum annual withdrawal is permitted for the duration of the policyholders’ life subject to certain conditions, and GMDB business for which, under the US GAAP rules applied under IFRS, the reserving methodology under US GAAP principles generally gives rise to a muted impact of current period market movements;
• Fee assessment, and claims payments, in respect of guarantee liabilities; and• Related changes to the amortisation of deferred acquisition costs for each of the above items.
The change reflects management’s IFRS 8 segment measure. Within the supplementary analysis of profit, the change is presentational only. It has no impact on profit before tax or shareholders’ equity. The impact of this change is as follows:
2010 £m 2009 £m
Previous basis Change Revised basis Previous basis Change Revised basis
Operating profit based on longer-term investment returns Jackson 466 367 833 459 159 618 Rest of Group 1,108 – 1,108 946 – 946
Total 1,574 367 1,941 1,405 159 1,564Short-term fluctuations in investment returns on
shareholder-backed business 244 (367) (123) 36 (159) (123)Shareholders’ share of actuarial and other gains
and loss on defined benefit pension schemes (10) – (10) (74) – (74)Costs of terminated AIA transaction (377) – (377) – – –Gain on dilution of holding in PruHealth 30 – 30 – – –Loss on sale and results of Taiwan agency business – – – (621) – (621)
Profit from continuing operations before tax attributable to shareholders 1,461 – 1,461 746 – 746

178
Prudential plc Annual Report 2010
FINANCIAL STATEMENTS > NOTES ON THE GROUP FINANCIAL STATEMENTS
A: BACKGROUND AND ACCOUNTING POLICIESCONTINUED
A4: SIGNIFICANT ACCOUNTING POLICIES > CONTINUED
US operations – Embedded derivatives for variable annuity guarantee featuresThe Guaranteed Minimum Income Benefit (GMIB) liability, which is fully reinsured, subject to a deductible and annual claim limits, is accounted for in accordance with FASB ASC Subtopic 944-80 Financial Services – Insurance – Separate Accounts (formerly SOP 03-1) under IFRS using ‘grandfathered’ US GAAP. As the corresponding reinsurance asset is net settled, it is considered to be a derivative under IAS 39 and the asset is therefore recognised at fair value. As the GMIB benefit is economically reinsured the mark to market element of the reinsurance asset is included as a component of short-term fluctuations in investment returns.
iii Derivative value movementsDerivative value movements are excluded from operating results based on longer-term investment returns. Non-equity based derivatives are primarily held by Jackson as part of a broadly-based hedging programme for features of Jackson’s bond portfolio (for which value movements are booked in the statement of comprehensive income rather than the income statement) and product liabilities (for which US GAAP accounting as grandfathered under IFRS 4 does not reflect the economic features being hedged). Value movements for Jackson’s equity-based derivatives and variable and fixed index annuity product embedded derivatives were in prior periods included in operating profits based on longer-term investment returns. In 2010 these value movements, which are variable in nature, have been included in short-term fluctuations and 2009 comparatives have been adjusted accordingly. There are two exceptions to the basis described above in sections (a) to (c) for determining operating results based on longer-term investment returns. These are for:
• Unit-linked and US variable annuity business. For such business the policyholder unit liabilities are directly reflective of the asset value movements. Accordingly all asset value movements are recorded in the operating results based on longer-term investment returns.
• Assets covering non-participating business liabilities that are interest rate sensitive. For UK annuity business policyholder liabilities are determined by reference to current interest rates. The value movements of the assets covering liabilities are closely correlated with the related change in liabilities. Accordingly asset value movements are recorded within the operating results based on longer-term investment returns. Policyholder liabilities include a margin for credit risk. Variations between actual and best estimate expected impairments are recorded as a component of short-term fluctuations in investment returns.
iv Other liabilities to policyholders and embedded derivatives for product guaranteesUnder IFRS, the degree to which the carrying values of liabilities to policyholders are sensitive to current market conditions varies between territories depending upon the nature of the ‘grandfathered’ measurement basis. In general, in those instances where the liabilities are particularly sensitive to routine changes in market conditions, the accounting basis is such that the impact of market movements on the assets and liabilities is broadly equivalent in the income statement, and operating profit based on longer-term investments returns is not distorted. In these circumstances, there is no need for the movement in the liability to be bifurcated between the elements that relate to longer-term market conditions and short-term effects. However, some types of business movements in liabilities do require bifurcation to ensure that at the net level (i.e. after allocated investment return and change for policyholder benefits) the operating result reflects longer-term market returns.Examples where such bifurcation is necessary are:
a AsiaVietnamese participating businessFor the participating business in Vietnam the liabilities include policyholders’ interest in investment appreciation and other surplus. Bonuses paid in a reporting period and accrued policyholders’ interest in investment appreciation and other surpluses primarily reflect the level of realised investment gains above contract specific hurdle levels. For this business, operating profit based on longer-term investment returns includes the aggregate of longer-term returns on the relevant investments, a credit or charge equal to movements on the liability for the policyholders’ interest in realised investment gains (net of any recovery of prior deficits on the participating pool), less amortisation over five years of current and prior movements on such credits or charges. The overall purpose of these adjustments is to ensure that investment returns included in operating results equal longer-term returns but that in any one reporting period movements on liabilities to policyholders caused by investment returns are substantially matched in the presentation of the supplementary analysis of profit before tax attributable to policyholders.
Non-participating businessLiabilities are bifurcated so that the total movement in the carrying value of liabilities is split between that which is included in operating results based on longer-term investment returns, and the residual element for the effect of using year end rates is included in short-term fluctuations and in the income statement.

179F
INA
NC
IAL
S
TA
TE
ME
NT
SA
: BA
CK
GR
OU
ND
AN
D
AC
CO
UN
TIN
G P
OL
ICIE
S
Guaranteed Minimum Death Benefit (GMDB) product featuresFor unhedged GMDB liabilities accounted for under IFRS using ‘grandfathered’ US GAAP, such as in the Japanese business, the change in carrying value is determined under FASB ASC Subtopic 944-80 Financial Services – Insurance – Separate Accounts (formerly SOP 03-1), which partially reflects changes in market conditions. Under the Company’s segmental basis of reporting the operating profit reflects the change in liability based on longer-term market conditions with the difference between the charge to the operating result and the movement reflected in the total result included in short-term fluctuations in investment returns.
b UK shareholder-backed annuity businessWith one exception, the operating result based on longer-term investment returns reflects the impact of all value movements on policyholder liabilities for annuity business in PRIL and the PAC non-profit sub-fund. The exception is for the impact on credit risk provisioning of actual downgrades during the period. As this feature arises due to short-term market conditions, the effect of downgrades, if any, in a particular period, on the overall provisions for credit risk is included in the category of short-term fluctuations in investment returns. The effects of other changes to credit risk provisioning are included in the operating result, as is the net effect of changes to the valuation rate of interest due to portfolio rebalancing to align more closely with management benchmark.
e Fund management and other non-insurance businessesFor these businesses, the particular features applicable for life assurance noted above do not apply. For these businesses it is inappropriate to include returns in the operating result on the basis described above. Instead, it is appropriate to generally include realised gains and losses (including impairments) in the operating result with unrealised gains and losses being included in short-term fluctuations. For this purpose impairments are calculated as the credit loss determined by comparing the projected cash flows discounted at the original effective interest rate to the carrying value. In some instances it may also be appropriate to amortise realised gains and losses on derivatives and other financial instruments to operating results over a time period that reflects the underlying economic substance of the arrangements.
A5: NEW ACCOUNTING PRONOUNCEMENTS
New accounting pronouncementsThe following standards, interpretations and amendments have either been adopted for the first time in 2010 or have been issued but are not yet effective in 2010, including those which have not yet been adopted in the EU. This is not intended to be a complete list as only those standards, interpretations and amendments that are anticipated to have an impact upon the Group’s financial statements have been discussed.
Accounting pronouncements adopted in 2010Revised IFRS 3, ‘Business combinations’ and Amendments to IAS 27, ‘Consolidated and separate financial statements’ and IAS 31, ‘Interests in joint ventures’The Group has applied the revised IFRS 3 and amended IAS 27 and IAS 31 from 1 January 2010. The revised IFRS 3 and amended IAS 27 and IAS 31 are the outcomes of the second phase of the IASB’s and the US Financial Accounting Standards Board’s (FASB) joint business combination project. The change in accounting policy as a result of the adoption of these standards has been applied prospectively. No restatement to 2009 comparatives is required. The more significant changes from the revised IFRS 3 include:
• the immediate expensing of acquisition-related costs rather than inclusion in goodwill;• recognition and measurement at fair value of contingent consideration classified as financial instruments at acquisition date with
subsequent changes to income; and• additional items or adjustments to items recognised in the business combination are permitted to be applied retrospectively during
the measurement period to reflect new information obtained about facts and circumstances that existed as of the acquisition date. The measurement period ends as soon as the acquirer receives the necessary information or learns that more information is not obtainable but is subject to an overall limit for one year.
The amendments to IAS 27 reflect changes to the accounting for non-controlling interests (known as non-controlling interests prior to the amendments). From 1 January 2010, transactions that increase or decrease non-controlling interests without a change of control are accounted as equity transactions and therefore no goodwill is recognised. As a consequence any gains or losses are reported directly in equity and not in the income statement. The amendments to IAS 31 reflect changes to the accounting for changes in joint control over an entity. From 1 January 2010, when a jointly controlled entity becomes an associate of an investor, the investor shall measure at fair value any investment the investor retains in the former jointly controlled entity. The investor shall recognise in profit or loss any difference between:
(a) the fair value of any retained investment and any proceeds from disposing of the part interest in the jointly controlled entity; and(b) the carrying amount of an investment at the date when joint control is lost.

180
Prudential plc Annual Report 2010
FINANCIAL STATEMENTS > NOTES ON THE GROUP FINANCIAL STATEMENTS
A: BACKGROUND AND ACCOUNTING POLICIESCONTINUED
A5: NEW ACCOUNTING PRONOUNCEMENTS > CONTINUED
Previously, no explicit guidance was provided. The adoption of revised IFRS 3 and amended IAS 27 and IAS 31 has resulted in presentational and disclosure changes in the Group’s financial statements, and affected the accounting for the acquisition of United Overseas Bank (UOB) Life Assurance Limited in Singapore. The disclosure on this acquisition is provided in note I1. As a result of the adoption of the revised IFRS 3, the Group has expensed the UOB Life acquisition-related costs incurred of £2 million which would otherwise have been included within goodwill. The Group has also recognised a gain of £30 million related to the change of treatment of PruHealth from a joint venture to an associate, in line with the revisions to IAS 31 set out above as described in note I2(a).
Improvements to IFRSs (2009)The 2009 annual improvements include minor changes to 12 IFRSs. Amongst others, these include changes to IAS 17 ‘Leases’ on the treatment of lease of land with an indefinite economic life and to IAS 36 ‘Impairment of assets’ on the largest unit to which goodwill should be allocated being the operating segment level as defined by IFRS 8. The Group has reviewed and adopted these changes in 2010 with no significant impact on the Group’s results and financial position.
Amendments to IFRS 2 – Group cash-settled share-based payment transactionsIn June 2009, the IASB issued further amendments to IFRS 2 which sets out the accounting requirements for share-based payments. These amendments clarified existing guidance, in particular by specifying that an entity that receives goods or services in a share-based payment arrangement must account for those goods or services no matter which entity in the group settles the transaction and no matter whether the transaction is settled in shares or cash. There was no impact on the Group’s financial statements upon adoption of this standard.
Amendment to IAS 39, ‘Financial instruments: Recognition and measurement’ – Eligible Hedged ItemsThis amendment to IAS 39 clarifies how the principles that determine whether a hedged risk or portion of cash flows is eligible for designation should be applied in particular situations. The adoption of this amendment had no impact on the Group’s designated IAS 39 hedges.
Accounting pronouncements endorsed by the EU but not yet effectiveThe following accounting pronouncements potentially relevant to the Group have been issued and endorsed for use in the EU but are not mandatory for adoption for the 31 December 2010 year end.
Amendments to IAS 24, ‘Related party disclosures’The main revisions which will apply from 2011 relate to exemption for government-related entities and are therefore not applicable to the Group. The amendment also clarifies and simplifies the definition of a related party albeit the nature of the change is minor. The adoption of these revisions is not expected to have any impact on the Group’s related party disclosures.
Amendment to IFRIC, ‘14 Prepayment of a minimum funding requirement’This amendment will apply from 2011 and removes an unintended consequence of IFRIC 14 relating to voluntary pension pre-payments when there is a minimum funding requirement. IFRIC 14 was amended to require an asset to be recognised for any surplus arising from voluntary pre-payment of minimum funding contributions in respect of future service. The adoption of this amendment is not expected to have an impact on the Group’s financial statements.

181F
INA
NC
IAL
S
TA
TE
ME
NT
SA
: BA
CK
GR
OU
ND
AN
D
AC
CO
UN
TIN
G P
OL
ICIE
S
IFRIC 19, ‘Extinguishing financial liabilities with equity instruments’In November 2009, the IFRIC issued guidance on how to account for the extinguishment of a financial liability by the issue of equity instruments. This interpretation is effective for accounting periods beginning on or after 1 July 2010. This interpretation is not expected to have a material effect on the Group’s financial statements.
Improvements to IFRSs (2010)The changes from this annual improvement which were issued in May 2010 and mostly effective from 2011 include clarification of financial instruments disclosures and of the statement of changes in equity. The Group is in the process of evaluating the implications of these changes.
Accounting pronouncements not yet endorsed by the EUThe following accounting pronouncements potentially relevant to the Group have been issued but not yet endorsed for use in the EU.
IFRS 9, ‘Financial Instruments: Classification and measurement’ In November 2009, the IASB issued a new standard which altered the classification and measurement of financial instruments. Under the new standard only two possible classifications arise, rather than the four existing classifications currently available under IAS 39, and will result in all financial assets being valued at amortised cost or fair value through profit and loss. In October 2010, the IASB issued requirements on the accounting for financial liabilities. These requirements will be added to IFRS 9 and maintain the existing amortised cost measurement for most liabilities and will require changes in fair value due to changes in the entity’s own credit risk to be recognised in the other comprehensive income (OCI) section of the comprehensive income statement, rather than within profit or loss for liabilities measured at fair value. IFRS 9 applies to financial statements for annual periods beginning on or after 1 January 2013. Entities are permitted to apply the new requirements in earlier periods, however, if they do, they must also apply the requirements in IFRS 9 that relate to financial assets. The standard is not mandatory until 1 January 2013 and is yet to be endorsed by the European Union. The Group is still assessing the full impact of this standard.
Amendments to IFRS 7, ‘Financial instruments: Disclosures – Transfers of financial assets’The amendments, which were issued in October 2010 and effective for annual periods beginning on or after 1 January 2012, introduce new disclosure requirements about transfers of financial assets. These include disclosures for financial assets that are not derecognised in their entirety and financial assets that are derecognised in their entity but for which the entity retains continuing involvement. The Group is evaluating the implications of the amendments but they are not expected to have a significant impact on the Group’s disclosures.
Amendments to IAS 12, ‘Income taxes’On 20 December 2010, the IASB published amendments to IAS 12 Deferred Tax: Recovery of Underlying Assets following the exposure draft issued on 10 September 2010. The amendments are effective for annual periods beginning on or after 1 January 2012. The amendments require the measurement of deferred tax assets and liabilities arising from investment properties and plant, property and equipment valued at fair value on the presumption that the carrying amount of the asset will be, normally, recovered through sale. These amendments are not expected to have a material effect on the Group’s financial statements.

182
Prudential plc Annual Report 2010
FINANCIAL STATEMENTS > NOTES ON THE GROUP FINANCIAL STATEMENTS
B: SUMMARY OF RESULTS
B1: SEGMENT DISCLOSURE – INCOME STATEMENT
The determination of the operating segments and performance measure of the operating segments of the Group are as detailed in note A4. Further segmentation of the income segment is provided in note F1 of these financial statements.
2010 £m 2009 £m
ASIAN OPERATIONSInsurance operations:note ii
Underlying results before exceptional credit 536 353Exceptional credit for Malaysia operationsD4(i) – 63
Total Asian insurance operations 536 416Development expenses (4) (6)
Total Asian insurance operations after development expenses 532 410Asian asset management 72 55
Total Asian operations 604 465
US OPERATIONSJackson (US insurance operations)notes ii,iv 833 618Broker-dealer and asset managementnote iv 22 4
Total US operations 855 622
UK OPERATIONSUK insurance operations:note ii
Long-term business 673 606 General insurance commissionnote v 46 51
Total UK insurance operations 719 657M&G 284 238
Total UK operations 1,003 895
TOTAL SEGMENT PROFIT 2,462 1,982
OTHER INCOME AND EXPENDITURE Investment return and other income 30 22Interest payable on core structural borrowings (257) (209)Corporate expenditure (220) (203)Charge for share-based payments for Prudential schemesnote viii (3) (5)
Total (450) (395)
Solvency II implementation costs (45) –Restructuring costsnote ix (26) (23)
Operating profit based on longer-term investment returnsnote i 1,941 1,564Short-term fluctuations in investment returns on Shareholder-backed businessnote vi (123) (123)Shareholders’ share of actuarial and other gains and losses on defined benefit pension schemesnote vii (10) (74)Costs of terminated AIA transactionnote x (377) –Gain on dilution of holding in PruHealthI2(a) 30 –Loss on sale and results for Taiwan agency businessnote iii – (621)
PROFIT FROM CONTINUING OPERATIONS BEFORE TAX ATTRIBUTABLE TO SHAREHOLDERS 1,461 746
Notes i Operating profit based on longer-term investment returns. Operating profit based on longer-term investment returns is a supplemental measure of results and is the basis on which management regularly
review the performance of the Group’s segments as defined by IFRS 8. For the purposes of measuring operating profit, investment returns on shareholder-financed business are based on expected long-term rates of return as discussed in note A4. The expected long-term rates of return are intended to reflect historical real rates of return and, where appropriate, current inflation expectations adjusted for consensus economic and investment forecasts. The most significant operation that requires adjustment for the difference between actual and long-term investment returns is Jackson. The amounts included in operating results for long-term capital returns for Jackson’s debt securities comprise two

183F
INA
NC
IAL
S
TA
TE
ME
NT
SB
: SUM
MA
RY
O
F R
ESU
LTS
components. These are a risk margin reserve based charge for long-term expected defaults, which is determined by reference to the credit quality of the portfolio, and amortisation of interest-related realised gains and losses to operating results based on longer-term results to the date when sold bonds would otherwise have matured. Consistent with the policy of including longer-term investment returns in the measure of operating profit, movements in policyholder liabilities are also, where appropriate, delineated between amounts included in operating profits and movements arising from short-term market conditions, which are recorded in short-term fluctuations in investment returns. The presentation of operating profit based on longer-term investment returns has been revised in 2010 and the 2009 comparatives have been amended accordingly (see note (iv)).
ii Effect of changes to assumptions, estimates and bases of determining life assurance liabilities. The results of the Group’s long-term business operations are affected by changes to assumptions, estimates and bases of preparation. These are described in notes D2(i), D3(i) and D4(i). iii Sale of Taiwan agency business. In order to facilitate comparisons of operating profit based on longer-term investment returns that reflect the Group’s retained operations, the
results attributable to the Taiwan business for which the sale process was completed in June 2009 are included separately within the segmental analysis of profit for 2009.
iv Jackson operating results based on longer-term investment returns. The Group has amended the presentation of operating profit for its US insurance operations to remove net equity hedge accounting effect
(incorporating related amortisation of deferred acquisition costs) and include it in short-term fluctuations. The 2009 comparatives have been amended accordingly. The effect of this change is explained note A4(d)(ii).
IFRS basis operating profits for US operations include the following amounts (net of related change in amortisation of deferred acquisition costs, where applicable) so as to derive longer-term investment returns.
2010 £m 2009 £m
Debt securities: Amortisation of interest related realised gains and losses 63 47 Risk margin reserve charge for longer-term credit related losses (see below) (55) (60)Equity type investments: Longer-term returns (8) 69
The risk margin reserve (RMR) charge for longer-term credit related losses included in operating profit based on longer-term investment returns for 2010 is based on an average annual RMR of 26 basis points (2009: 27 basis points) on average book values of US $44.2 billion for the year as shown below.
2010 2009
Moody’s rating category (or equivalent under NAICratings of MBS)
Average book
value (US $m)
RMR %
Annual expected losses
Average book
value (US $m)
RMR %
Annual expected losses
US $m £m US $m £m
A3 or higher 20,622 0.06 (12) (8) 19,509 0.03 (5) (3)Baa1, 2, 3 20,785 0.26 (53) (34) 21,072 0.23 (47) (30)Ba1, 2, 3 1,935 1.04 (20) (13) 2,035 1.13 (23) (15)B1, 2, 3 500 2.99 (15) (10) 594 2.86 (17) (11)Below B3 321 3.88 (13) (8) 691 3.91 (27) (17)
Total 44,163 0.26 (113) (73) 43,901 0.27 (119) (76)
Related change to amortisation of deferred acquisition costs (see below)
28 18 25 16
Risk margin reserve charge to operating profit for longer-term credit related losses (85) (55) (94) (60)
For the period ended 31 December 2010, Jackson has continued the practice commenced in the second half of 2009 in relation to RMBS and for 2010 for CMBS to determine the risk margin charge included in operating profit based on longer-term investment returns using the regulatory rating as determined by third parties; PIMCO (for RMBS) and BlackRock Solutions (for CMBS) on behalf of the National Association of Insurance Commissioners (NAIC). See note A4(d) for further information.
The longer-term rates of return for equity-type investments are currently based on spreads over 10 year US treasury rates of 400 to 600 basis points. The longer-term rates of return for equity-type investments ranged from 6.5 per cent to 7.9 per cent at 31 December 2010 and 6.7 per cent to 7.4 per cent at 31 December 2009 depending on the type of investments.
Consistent with the basis of measurement of insurance assets and liabilities for Jackson’s IFRS results, the charges and credits to operating profits based on longer-term investment returns are partially offset by related changes to amortisation of deferred acquisition costs.
v UK operations transferred its general insurance business to Churchill in 2002, with general insurance commission representing the commission receivable net of expenses for Prudential-branded general insurance products as part of this arrangement.

184
Prudential plc Annual Report 2010
FINANCIAL STATEMENTS > NOTES ON THE GROUP FINANCIAL STATEMENTS
B: SUMMARY OF RESULTSCONTINUED
B1: SEGMENT DISCLOSURE – INCOME STATEMENT > CONTINUED
vi Short-term fluctuations in investment returns on shareholder-backed business.
2010 £m 2009 £m
Insurance operations: Asia 114 31 US (378) (132) UK 116 108Other operations: IGD hedge costs – (235) Other 25 105
25 (130)
Total (123) (123)
General overview of defaults The Group incurred defaults of £nil in 2010 (2009: £11 million) on its debt securities portfolio. The defaults of £11 million in 2009 were
experienced by the UK Shareholder-backed annuity business.
Asian insurance operations The fluctuations for Asian insurance operations in 2010 of £114 million primarily reflect unrealised gains on the debt securities held by
shareholders’ funds, as well as a £30 million unrealised gain on the Group’s 8.66 per cent stake in China Life Insurance Company of Taiwan. For 2009, the gain of £31 million primarily relate to strong market performance in Taiwan and Japan partially offset by the fall in the Vietnamese bond markets.
US insurance operations The short-term fluctuations in investment returns for US insurance operations for the year comprise the following items:
2010 £m 2009 £m
Short-term fluctuations related to debt securities: Charges in the year Losses on sales of impaired and deteriorating bonds (99) (6) Bond write downs (124) (630) Recoveries/reversals 10 5
Total charges in the year* (213) (631)Less: risk margin charge included in operating profit based on longer-term investment returnsB1 (iv) 73 76
(140) (555)
Interest related realised gains (losses): Arising in the year 224 125 Less: amortisation gains and losses arising in current and prior years to operating profit based on longer-term
investment returns (82) (59)
142 66
Related change to amortisation of deferred acquisition costs (3) 75
Total short-term fluctuations related to debt securities (1) (414)Derivatives (other than equity related): market value movements (net of related change to amortisation of deferred acquisition costs)† (15) 385Net equity hedge results based on longer-term equity volatility and interest rates (net of related change to amortisation of deferred acquisition costs)‡ (367) (159)Equity related derivatives: volatility and interest rate normalisation (net of related change to amortisation of deferred acquisition costs)# 2 85Equity type investments: actual less longer-term return (net of related change to amortisation of deferred acquisition costs)B1(iv) 3 (59)Other items (net of related change to amortisation of deferred acquisition costs) – 30
Total (378) (132)

185F
INA
NC
IAL
S
TA
TE
ME
NT
SB
: SUM
MA
RY
O
F R
ESU
LTS
* The charges on debt securities of Jackson incurred in 2010 and 2009 of £213 million and £631 million respectively, comprise the following:
Defaults
£m
Bond write downs
£m
Losses on sale of
impaired and
deteriorating bonds
£m
Recoveries/ reversals
£m
2009Total
£m
2010Total
£m
Residential mortgage-backed securitiesPrime (including agency) – 21 35 – 56 268Alt-A – 35 20 (1) 54 182Sub-prime – 15 (2) – 13 49
Total residential mortgage-backed securities – 71 53 (1) 123 499Corporate debt securities – 1 40 (4) 37 107Other – 52 6 (5) 53 25
Total – 124 99 (10) 213 631
Within other bond write downs of £52 million (2009: £30 million), £40 million (2009: £30 million) relate to Piedmont securities. Piedmont is an investment vehicle investing in certain asset-backed and mortgage-backed securities in the US.
† The loss of £15 million (2009: gain of £385 million) is for the value movement for non-equity freestanding derivatives held to manage the fixed annuity and other general account business. Under IAS 39, unless hedge accounting is applied, value movements on derivatives are recognised in the income statement.For the derivatives programme attaching to the fixed annuity and other general account business the Group has continued its approach of not seeking to apply hedge accounting under IAS 39. This decision reflects the inherent constraints of IAS 39 for hedge accounting investments and life assurance assets and liabilities under ‘grandfathered’ US GAAP under IFRS 4.
‡ The Group has amended its presentation of equity-based derivatives and associated guarantee liabilities to remove the net equity hedge accounting effect (incorporating related amortisation of deferred acquisition costs) from operating profit based on longer-term investment returns and include it in short-term fluctuations. The 2009 comparatives have been amended accordingly. The effect of this change is explained in note A4(d)(ii).
# Prior to the change in the presentation of operating profit of the US insurance operations as explained in note A4(d)(ii), the effect of the difference in the value movements for freestanding derivatives and embedded derivatives arising from changes between longer-term and actual levels of implied equity volatility and end of period AA corporate bond yield curves was reflected in short-term fluctuations in investment return. This normalisation reflects the use of longer-term implied equity volatility levels, and also, for embedded derivatives 10 year average AA corporate bond yield curves, in the value movement included in net equity hedge accounting effect and is unaffected by the change in the presentation of the net equity hedge accounting effect.
This volatility and interest rate normalisation of value movements for freestanding and embedded derivatives gave rise to a £2 million gain (2009: £85 million). The net equity hedge accounting effect based on longer-term equity volatility and interest rate is as described above in note ‡.
In addition to the items discussed above, for US insurance operations, included within the statement of comprehensive income, is an increase in net unrealised gains on debt securities classified as available-for-sale of £1,221 million (2009: reduction in net unrealised losses of £2,669 million). Temporary market value movements do not reflect defaults or impairments. Additional details on the movement in the value of the Jackson portfolio are included in note D3.
UK insurance operations The short-term fluctuations gain for UK insurance operations of £116 million (2009: £108 million) reflected principally asset value movements,
principally for shareholder-backed annuity business.
IGD hedge costs During the severe equity market conditions experienced in the first quarter of 2009 coupled with historically high equity volatility the Group
entered into exceptional short-dated hedging contracts to protect against potential tail-events on the IGD capital position, in addition to the regular operational hedging programmes. The hedge contracts expired in 2009 and have not been renewed.
Other Short-term fluctuations of other operations, in addition to the previously discussed IGD hedge costs, arise from:
2010 £m 2009 £m
Unrealised value movements on swaps held centrally to manage Group assets and liabilities (25) 28Unrealised value movements on Prudential Capital’s bond portfolio 48 66Unrealised value movements on investments held by other operations 2 11
25 105

186
Prudential plc Annual Report 2010
FINANCIAL STATEMENTS > NOTES ON THE GROUP FINANCIAL STATEMENTS
B: SUMMARY OF RESULTSCONTINUED
B1: SEGMENT DISCLOSURE – INCOME STATEMENT > CONTINUED
vii Shareholders’ share of actuarial and other gains and losses on defined benefit pension schemes
2010 £m 2009 £m
ACTUARIAL GAINS AND LOSSES
Actual less expected return on scheme assets 31 23Experience (losses) gains on scheme liabilities (5) 17Losses on changes of assumptions for scheme liabilities (41) (147)
(15) (107)Less: amount attributable to the PAC with-profits sub-fund 5 47
(10) (60)
OTHER GAINS AND LOSSES
Movement in the provision for deficit funding of PSPS – (48)Less: amount attributable to the PAC with-profits sub-fund – 34
– (14)
Total (10) (74)
The actuarial gains and losses shown in the table above relate to the Scottish Amicable and M&G. The amounts did not include actuarial gains and losses for the Prudential Staff Pension Scheme (PSPS) for which the Group has not recognised its interest in the scheme’s underlying surplus.
The losses of £41 million on change of assumptions comprise mainly the effect of a decrease in the risk discount rate partially offset by the effect of decrease in inflation rates.
Other gains and losses in 2009 related to the change in the provision for deficit funding obligation for PSPS. There was no change in 2010. Further details on the Group’s defined benefit pension schemes are shown in note I3.viii Share-based payments The charge for share-based payments for Prudential schemes is for the SAYE and Group performance-related schemes.ix Restructuring costs are incurred in the UK as part of EEV covered business (£26 million) and as part of central operations of £nil (EEV non-
covered business) (2009: £16 million and £7 million respectively).x The following costs were incurred in relation to the proposed, and subsequently terminated transaction, to purchase AIA Group Limited and
related rights issue.
2010 £m
AIG termination break fee 153 Underwriting fees 58 Costs associated with foreign exchange hedging 100 Adviser fees and other 66
TOTAL COSTS BEFORE TAX 377 Associated tax relief (93)
Total costs after tax 284
Of the £377 million total costs before tax, the £100 million associated with foreign exchange hedging has been recorded within ‘Investment
return’ and the other £277 million has been recorded as ‘Other expenditure’ within ‘Acquisition costs and other expenditure’ in the consolidated income statement.
B2: EARNINGS PER SHARE
Basic earnings per share is calculated by dividing the earnings attributable to ordinary shareholders by the weighted average number of ordinary shares outstanding during the year, excluding those held in employee share trusts and consolidated unit-trusts and OEICs, which are treated as cancelled. For diluted earnings per share, the weighted average number of shares in issue is adjusted to assume conversion of all dilutive potential ordinary shares. The Group’s only class of dilutive potential ordinary shares are those share options granted to employees where the exercise price is less than the average market price of the Company’s ordinary shares during the year. No adjustment is made if the impact is anti-dilutive overall. Earnings per share are calculated based on earnings attributable to ordinary shareholders, after related tax and non-controlling interests.

187F
INA
NC
IAL
S
TA
TE
ME
NT
SB
: SUM
MA
RY
O
F R
ESU
LTS
2010
Before tax B1
£m
Tax F5
£m
Non-controlling
interests £m
Net of tax and non-
controllinginterests
£m
Basic earnings
per share Pence
Diluted earnings
per share Pence
Based on operating profit based on longer-term investment returns, excluding exceptional tax credit 1,941 (371) (5) 1,565 62.0p 61.9p
Exceptional tax credit* – 158 – 158 6.3p 6.3p
Based on operating profit based on longer-term investment returns 1,941 (213) (5) 1,723 68.3p 68.2p
Short-term fluctuations in investment returns on shareholder-backed business (123) 92 – (31) (1.2p) (1.2p)
Shareholders’ share of actuarial and other gains and losses on defined benefit pension schemes (10) 3 – (7) (0.3p) (0.3p)
Costs of terminated AIA transaction (377) 93 – (284) (11.3p) (11.3p)Gain on dilution of holding in PruHealth 30 – – 30 1.2p 1.2p
Based on profit for the year from continuing operations including exceptional tax credit 1,461 (25) (5) 1,431 56.7p 56.6p
* The tax charge attributable to shareholders’ return includes an exceptional tax credit of £158 million which primarily relates to the impact of settlement agreed with the UK tax authorities.
2009(1)
Before tax B1
£m
Tax F5
£m
Non-controlling
interests £m
Net of tax and non-
controllinginterests
£m
Basic earnings
per share Pence
Diluted earnings
per share Pence
Based on operating profit based on longer-term investment returns 1,564 (374) (2) 1,188 47.5p 47.4p
Short-term fluctuations in investment returns on shareholder-backed business (123) 280 1 158 6.3p 6.3p
Shareholders’ share of actuarial and other gains and losses on defined benefit pension schemes (74) 21 – (53) (2.1p) (2.1p)
Adjustment from loss on sale and result of Taiwan agency business (621) 18 – (603) (24.1p) (24.0p)
Based on profit for the year from continuing operations 746 (55) (1) 690 27.6p 27.6p
Adjustments for post-tax results of discontinued operations (14) – – (14) (0.6p) (0.6p)
Based on profit for the year 732 (55) (1) 676 27.0p 27.0p
Note(1) The Group has amended the presentation of IFRS operating profit for its US operations to remove net equity hedge accounting effect
(incorporating related amortisation of deferred acquisition costs) and include it in short-term fluctuations. The 2009 comparatives have been amended accordingly.

188
Prudential plc Annual Report 2010
FINANCIAL STATEMENTS > NOTES ON THE GROUP FINANCIAL STATEMENTS
B: SUMMARY OF RESULTSCONTINUED
B2: EARNINGS PER SHARE > CONTINUED
Number of sharesA reconciliation of the weighted average number of ordinary shares used for calculating basic and diluted earnings per share is set out as below:
2010 £m 2009 £m
Weighted average shares for calculation of basic earnings per share 2,524 2,501Shares under option at end of year 13 12Number of shares that would have been issued at fair value on assumed option exercise (8) (7)
Weighted average shares for calculation of diluted earnings per share 2,529 2,506
B3: DIVIDENDS
2010 £m 2009 £m
Dividends declared and paid in reporting periodParent company: Interim dividend (2010: 6.61p, 2009: 6.29p per share) 168 159 Second interim/Final dividend for prior period (2010: 13.56p, 2009: 12.91p per share) 343 322
Total 511 481
As a result of shares issued in lieu of dividends of £62 million (2009: £137 million), dividends paid in cash, as set out in the consolidated cash flow statement, were £449 million (2009: £344 million).
2010 £m 2009 £m
Parent company dividends relating to reporting period: Interim dividend (2010: 6.61p, 2009: 6.29p per share) 168 159 Final/second interim dividend (2010: 17.24p, 2009: 13.56p per share) 439 343
Total 607 502
Interim dividends are recorded in the period in which they are paid. Final dividends are recorded in the period in which they are approved by shareholders. The second interim dividend of 13.56 pence per ordinary share for the year ended 31 December 2009 was paid to eligible shareholders on 27 May 2010 and the 2010 interim dividend of 6.61 pence per ordinary share was paid to eligible shareholders on 23 September 2010. Following the Board’s decision to rebase the dividend upwards and subject to shareholders’ approval, the 2010 final dividend of 17.24 pence per ordinary share will be paid on 26 May 2011 in sterling to shareholders on the principal and Irish branch registers at 6.00pm BST on Friday, 1 April 2011 (the ‘Record Date’), and in Hong Kong dollars to shareholders on the Hong Kong branch register at 4.30pm Hong Kong time on the Record Date (‘HK Shareholders’). Holders of US American Depositary Receipts (‘US Shareholders’) will be paid their dividend in US dollars on or about five days after the payment date of the dividend to shareholders on the principal register. The dividend will be paid on or about 2 June 2011 in Singapore dollars to shareholders with shares standing to the credit of their securities accounts with The Central Depository (Pte.) Limited (‘CDP’) at 5.00pm Singapore time on the Record Date (‘SG Shareholders’). The dividend payable to the HK Shareholders will be translated at the exchange rate ruling at the close of business on 8 March 2011. The exchange rate at which the dividend payable to the SG Shareholders will be translated will be determined by CDP. The dividend will distribute an estimated £439 million of shareholders’ funds. The scrip dividend alternative is not being offered in respect of this dividend. In its place shareholders will be offered a Dividend Reinvestment Plan (DRIP).

189F
INA
NC
IAL
S
TA
TE
ME
NT
SB
: SUM
MA
RY
O
F R
ESU
LTS
B4: EXCHANGE TRANSLATION
Exchange movement recognised in other comprehensive income
2010 £m 2009 £m
Asian operations 164 (189)US operations 88 (244)Unallocated to a segment (central funds) (35) 227
217 (206)
The movements for Asian and US operations reflect the application of year end exchange rates to the assets and liabilities and average exchange rates to the income statement on translation of these operations into the presentation currency of the Group. The movement unallocated to a segment mainly reflects the translation of currency borrowings and forward contracts which have been designated as a net investment hedge against the currency risk of the net investment in Jackson.The exchange rates applied were:
Local currency: £
Closingrate at
31 Dec 2010Averagefor 2010
Closingrate at
31 Dec 2009Averagefor 2009
Opening rate at
1 Jan 2009
Hong Kong 12.17 12.01 12.52 12.14 11.14Indonesia 14,106.51 14,033.41 15,171.52 16,173.28 15,799.22Malaysia 4.83 4.97 5.53 5.51 5.02Singapore 2.01 2.11 2.27 2.27 2.07India 70.01 70.66 75.15 75.70 70.05Vietnam 30,526.26 29,587.63 29,832.74 27,892.39 25,205.87US 1.57 1.55 1.61 1.57 1.44
B5: NEW BUSINESS
Insurance products and investment products note i
Insurance products gross premiums
Investment products gross inflows note ii Total
2010 £m 2009 £m 2010 £m 2009 £m 2010 £m 2009 £m
Asian operations 2,514 2,019 80,597 71,176 83,111 73,195US operations 11,439 8,909 – 6 11,439 8,915UK operations 5,910 5,014 26,372 24,875 32,282 29,889
Group total 19,863 15,942 106,969 96,057 126,832 111,999

190
Prudential plc Annual Report 2010
FINANCIAL STATEMENTS > NOTES ON THE GROUP FINANCIAL STATEMENTS
B: SUMMARY OF RESULTSCONTINUED
B5: NEW BUSINESS > CONTINUED
Insurance products – new business premiums and contributions note i
Single Regular Annual Equivalents
2010 £m 2009 £m 2010 £m 2009 £m 2010 £m 2009 £m
GROUP INSURANCE OPERATIONSAsia – ex Japan 1,104 785 1,391 1,131 1,501 1,209US 11,417 8,885 22 24 1,164 912UK 5,656 4,768 254 246 820 723
GROUP TOTAL – EX JAPAN 18,177 14,438 1,667 1,401 3,485 2,844Japan(iv) 13 57 6 46 7 52
GROUP TOTAL 18,190 14,495 1,673 1,447 3,492 2,896
ASIAN INSURANCE OPERATIONSHong Kong 107 94 276 232 287 241Indonesia 141 41 269 186 283 190Malaysia 58 63 198 140 204 146Philippines 64 14 17 10 23 11Singapore 318 297 143 98 175 128Thailand 15 14 25 14 26 16Vietnam 1 1 41 35 41 35
SE ASIA OPERATIONS INC. HONG KONG 704 524 969 715 1,039 767China (Group’s 50% interest) 103 72 48 38 58 45India (Group’s 26% interest) 85 47 180 163 188 168Korea 66 38 89 118 96 122Taiwan(iii) 146 104 105 97 120 107
TOTAL ASIA OPERATIONS – EX JAPAN 1,104 785 1,391 1,131 1,501 1,209
US INSURANCE OPERATIONSFixed Annuities 836 1,053 – – 84 105Fixed Index Annuities 1,089 1,433 – – 109 143Life 11 10 22 24 23 25Variable Annuities 9,481 6,389 – – 948 639
TOTAL US INSURANCE OPERATIONS 11,417 8,885 22 24 1,164 912
UK & EUROPE INSURANCE OPERATIONS (vi)
Direct and Partnership Annuities 593 590 – – 59 59Intermediated Annuities 221 242 – – 22 24Internal Vesting Annuities 1,235 1,357 – – 124 136
TOTAL INDIVIDUAL ANNUITIES 2,049 2,189 – – 205 219
Corporate Pensions 228 192 198 191 221 210On-shore Bonds 1,660 1,444 – – 166 145Other Products 774 881 56 55 133 143Wholesale 945 62 – – 95 6
TOTAL UK & EUROPE INSURANCE OPS 5,656 4,768 254 246 820 723
GROUP TOTAL – EX JAPAN 18,177 14,438 1,667 1,401 3,485 2,844

191F
INA
NC
IAL
S
TA
TE
ME
NT
SB
: SUM
MA
RY
O
F R
ESU
LTS
Investment products – funds under management notes ii and iv
2010 £m
1 Jan 2010
Market gross
inflows Redemptions
Market exchange
translation and other
movements 31 Dec 2010
Asian operations 19,474 80,597 (80,812) 2,789 22,048US operations – – – – –UK operations 70,306 26,372 (17,267) 9,915 89,326
GROUP TOTAL 89,780 106,969 (98,079) 12,704 111,374
2009 £m
1 Jan 2009
Market gross
inflows Redemptions
Market exchange
translation and other
movements 31 Dec 2009
Asian operations 15,232 71,176 (69,177) 2,243 19,474US operations 50 6 (66) 10 –UK operations 46,997 24,875 (11,397) 9,831 70,306
GROUP TOTAL 62,279 96,057 (80,640) 12,084 89,780
Notesi The tables shown above are provided as an indicative volume measure of transactions undertaken in the reporting period that have the potential
to generate profits for shareholders. The amounts shown are not, and not intended to be, reflective of premium income recorded in the IFRS income statement.
Annual Premium Equivalents (APEs) are calculated as the aggregate of regular new business amounts and one-tenth of single new business amounts. New business premiums for regular premium products are shown on an annualised basis. Department of Work and Pensions (DWP) rebate business is classified as single recurrent business. Internal vesting business is classified as new business where the contracts include an open market option.
The format of the tables shown above is consistent with the distinction between insurance and investment products as applied for previous financial reporting periods. With the exception of some US institutional business, products categorised as ‘insurance’ refer to those classified as contracts of long-term insurance business for regulatory reporting purposes, i.e. falling within one of the classes of insurance specified in Part II of Schedule 1 to the Regulated Activities Order under FSA regulations.
The details shown above for insurance products include contributions for contracts that are classified under IFRS 4 ‘Insurance Contracts’ as not containing significant insurance risk. These products are described as investment contracts or other financial instruments under IFRS. Contracts included in this category are primarily certain unit-linked and similar contracts written in UK insurance operations and Guaranteed Investment Contracts and similar funding agreements written in US operations.
ii Investment products referred to in the table for funds under management above are unit trust, mutual funds and similar types of retail fund management arrangements. These are unrelated to insurance products that are classified as ‘investment contracts’ under IFRS 4, as described in the preceding paragraph, although similar IFRS recognition and measurement principles apply to the acquisition costs and fees attaching to this type of business.
iii The tables above include new business for the Taiwan bank distribution operation. New business of the Taiwan Agency business, which was sold in June 2009 (as explained in note I2(b) is excluded from the tables.
iv New business sales for the Group’s Japanese insurance subsidiary, which ceased selling new business with effect from 15 February 2010, have been presented separately from the remainder of the Group.
v New business and market gross inflows and redemptions have been translated at the average exchange rate for the year applicable. Funds under management at points in time are translated at the exchange rate applicable at those dates.
vi The Prudential’s European operation is based in Ireland and sells products into Jersey, Guernsey, Isle of Man, Gibraltar, Cyprus, Malta, Belgium, Spain and UK.

192
Prudential plc Annual Report 2010
FINANCIAL STATEMENTS > NOTES ON THE GROUP FINANCIAL STATEMENTS
B: SUMMARY OF RESULTSCONTINUED
B6: GROUP STATEMENT OF FINANCIAL POSITION
To explain more comprehensively the assets, liabilities and capital of the Group’s businesses it is appropriate to provide an analysis of the Group’s statement of financial position by operating segment and type of business. The tables below aggregate the three asset management segments for ease of presentation and hence should be read in conjunction with the associated tables on asset management in note E2.
a Group statement of financial position by operating segmenti Position at 31 December 2010
2010 £m
Total insurance
opera- tions
Asset manage-
ment opera-
tions E2
Unallo- cated to a
segment (central
opera-tions)
Intra-group
elimina- tions
31 Dec 2010
Group total
Insurance operations
BY OPERATING SEGMENTUK
D2US D3
Asia D4
ASSETSIntangible assets attributable to shareholders: Goodwill – – 236 236 1,230 – – 1,466 Deferred acquisition costs and other intangible
assets 118 3,543 939 4,600 9 – – 4,609
TotalH1 118 3,543 1,175 4,836 1,239 – – 6,075
Intangible assets attributable to with-profits funds: In respect of acquired subsidiaries for venture
fund and other investment purposes 166 – – 166 – – – 166 Deferred acquisition costs and other intangible
assets 13 – 97 110 – – – 110
TotalH2 179 – 97 276 – – – 276
Total 297 3,543 1,272 5,112 1,239 – – 6,351
Deferred tax assetsH4 214 1,391 98 1,703 123 362 – 2,188 Other non-investment and non-cash assetsH3-H6 4,633 1,241 811 6,685 999 4,159 (5,761) 6,082 Investment of long-term business and other
operations: Investment properties 11,212 26 9 11,247 – – – 11,247 Investments accounted for using the equity
method 69 – 2 71 – – – 71 Financial investments: Loansnote d 2,302 4,201 1,340 7,843 1,418 – – 9,261 Equity securities and portfolio holdings in
unit trusts 40,519 31,501 14,464 86,484 151 – – 86,635 Debt securitiesnote d 74,304 26,366 14,108 114,778 1,574 – – 116,352 Other investments 3,998 1,199 382 5,579 59 141 – 5,779 Deposits 9,022 212 638 9,872 80 – – 9,952
Total investmentsG1,H7,H8,note c 141,426 63,505 30,943 235,874 3,282 141 – 239,297
Properties held for saleH9 254 3 – 257 – – – 257 Cash and cash equivalentsH10 2,839 232 1,601 4,672 1,436 523 – 6,631
TOTAL ASSETS 149,663 69,915 34,725 254,303 7,079 5,185 (5,761) 260,806
Note(i) Further segmental analysis: The non-current assets of the Group comprise goodwill, intangible assets other than DAC and present value of acquired in-force business and
property, plant and equipment included within ‘other non-investment and non-cash assets’. Items defined as financial instruments or related to insurance contracts are excluded. Of the Group’s total non-current assets at 31 December 2010 of £2,454 million (2009: £1,965 million), £1,708 million (2009: £1,444 million) was held in the UK by the UK insurance operations, M&G and central operations, £131 million (2009: £112 million) was held in the US and £615 million (2009: £409 million) was held in Asia.
No individual country in Asia held non-current assets at the end of the year which exceeded 10 per cent of the Group total.

193F
INA
NC
IAL
S
TA
TE
ME
NT
SB
: SUM
MA
RY
O
F R
ESU
LTS
2010 £m
Total insurance
opera- tions
Asset manage-
ment opera-
tions E2
Unallo- cated to a
segment (central
opera-tions)
Intra-group
elimina- tions
31 Dec 2010
Group total
Insurance operations
BY OPERATING SEGMENTUK
D2US D3
Asia D4
EQUITY AND LIABILITIESEquityShareholders’ equityH11 2,148 3,815 2,149 8,112 1,787 (1,868) – 8,031 Non-controlling interests 35 – 5 40 4 – – 44
Total equity 2,183 3,815 2,154 8,152 1,791 (1,868) – 8,075
LiabilitiesPolicyholder liabilities and unallocated surplus of
with-profits funds: Insurance contract liabilitiesH12 84,152 58,641 28,498 171,291 – – – 171,291 Investment contract liabilities with discretionary participation featuresG1 25,613 – 119 25,732 – – – 25,732 Investment contract liabilities without discretionary participation featuresG1 15,765 1,882 57 17,704 – – – 17,704 Unallocated surplus of with-profits funds (reflecting application of ‘realistic’ basis provisions for UK regulated with-profits funds)D2(g)ii,H12 10,187 – 66 10,253 – – – 10,253
Total policyholder liabilities and unallocated surplus of with-profits fundsnote e 135,717 60,523 28,740 224,980 – – – 224,980
Core structural borrowings of shareholder-financed operations:H13
Subordinated debt – – – – – 2,718 – 2,718 Other – 159 – 159 250 549 – 958
Total – 159 – 159 250 3,267 – 3,676
Operational borrowings attributable to shareholder-financed operationsG1,H13 162 90 189 441 3 2,560 – 3,004
Borrowings attributable to with-profits operationsH13 1,522 – – 1,522 – – – 1,522 Other non-insurance liabilities:G1,H4,H14,H15 Obligations under funding, securities lending and
sale and repurchase agreements 2,398 1,801 – 4,199 – – – 4,199 Net asset value attributable to unit holders of
consolidated unit trusts and similar funds 1,755 33 1,126 2,914 458 – – 3,372 Deferred tax liabilities 1,738 1,776 495 4,009 5 210 – 4,224 Current tax liabilities 399 34 70 503 33 295 – 831 Accruals and deferred income 340 – 109 449 244 14 – 707 Other creditors 1,939 511 1,122 3,572 4,039 471 (5,761) 2,321 Provisions 442 19 61 522 157 50 – 729 Derivative liabilities 792 799 222 1,813 78 146 – 2,037 Other liabilities 276 355 437 1,068 21 40 – 1,129
Total 10,079 5,328 3,642 19,049 5,035 1,226 (5,761) 19,549
Total liabilities 147,480 66,100 32,571 246,151 5,288 7,053 (5,761) 252,731
TOTAL EQUITY AND LIABILITIES 149,663 69,915 34,725 254,303 7,079 5,185 (5,761) 260,806

194
Prudential plc Annual Report 2010
FINANCIAL STATEMENTS > NOTES ON THE GROUP FINANCIAL STATEMENTS
B: SUMMARY OF RESULTSCONTINUED
B6: GROUP STATEMENT OF FINANCIAL POSITION > CONTINUED
ii Position at 31 December 2009
2009 £m
Total insurance
opera- tions
Asset manage-
ment opera-
tions E2
Unallo- cated to a
segment (central
opera-tions)
Intra-group
elimina- tions
31 Dec 2009
Group total
Insurance operations
BY OPERATING SEGMENTUK
D2US D3
Asia D4
ASSETSIntangible assets attributable to shareholders: Goodwill – – 80 80 1,230 – – 1,310 Deferred acquisition costs and other
intangible assets 127 3,092 822 4,041 8 – – 4,049
TotalH1 127 3,092 902 4,121 1,238 – – 5,359
Intangible assets attributable to with-profits funds: In respect of acquired subsidiaries for venture
fund and other investment purposes 124 – – 124 – – – 124 Deferred acquisition costs and other
intangible assets 9 – 97 106 – – – 106
TotalH2 133 – 97 230 – – – 230
Total 260 3,092 999 4,351 1,238 – – 5,589
Deferred tax assetsH4 292 1,944 132 2,368 132 208 – 2,708Other non-investment and non-cash assetsH3-H6 3,074 1,404 880 5,358 718 4,393 (5,044) 5,425Investment of long-term business and other operations: Investment properties 10,861 33 11 10,905 – – – 10,905 Investments accounted for using the equity
method 4 – 2 6 – – – 6 Financial investments: Loansnote d 1,815 4,319 1,207 7,341 1,413 – – 8,754 Equity securities and portfolio holdings in
unit trusts 37,051 20,984 11,182 69,217 137 – – 69,354 Debt securitiesnote d 67,772 22,831 9,984 100,587 1,164 – – 101,751 Other investments 3,630 955 258 4,843 113 176 – 5,132 Deposits 11,557 454 746 12,757 63 – – 12,820
Total investmentsG1,H7,H8,note c 132,690 49,576 23,390 205,656 2,890 176 – 208,722
Properties held for saleH9 – 3 – 3 – – – 3Cash and cash equivalentsH10 2,265 340 837 3,442 970 895 – 5,307
TOTAL ASSETS 138,581 56,359 26,238 221,178 5,948 5,672 (5,044) 227,754

195F
INA
NC
IAL
S
TA
TE
ME
NT
SB
: SUM
MA
RY
O
F R
ESU
LTS
2009 £m
Total insurance
opera- tions
Asset manage-
ment opera-
tions E2
Unallo- cated to a
segment (central
opera-tions)
Intra group
elimina- tions
31 Dec 2009
Group total
Insurance operations
BY OPERATING SEGMENTUK
D2US D3
Asia D4
EQUITY AND LIABILITIESEquityShareholders’ equityH11 1,939 3,011 1,462 6,412 1,659 (1,800) – 6,271Non-controlling interests 28 – 1 29 3 – – 32
Total equity 1,967 3,011 1,463 6,441 1,662 (1,800) – 6,303
LiabilitiesPolicyholder liabilities and unallocated surplus of
with-profits funds: Insurance contract liabilitiesH12 77,655 46,346 21,712 145,713 – – – 145,713 Investment contract liabilities with discretionary participation featuresG1 24,780 – 100 24,880 – – – 24,880Investment contract liabilities without discretionary
participation featuresG1 13,794 1,965 46 15,805 – – – 15,805 Unallocated surplus of with-profits funds (reflecting application of ‘realistic’ basis provisions for UK regulated with-profits funds)D2(g)ii,H12 9,966 – 53 10,019 – – – 10,019
Total policyholder liabilities and unallocated surplus of with-profits fundsnote e 126,195 48,311 21,911 196,417 – – – 196,417
Core structural borrowings of shareholder-financed operations:H13
Subordinated debt – – – – – 2,691 – 2,691 Other – 154 – 154 – 549 – 703
Total – 154 – 154 – 3,240 – 3,394
Operational borrowings attributable to shareholder-financed operationsG1,H13 158 203 210 571 142 2,038 – 2,751
Borrowings attributable to with-profits operationsH13 1,284 – – 1,284 – – – 1,284Other non-insurance liabilities:G1,H4,H14,H15
Obligations under funding, securities lending and sale and repurchase agreements 2,108 1,374 – 3,482 – – – 3,482
Net asset value attributable to unit holders of consolidated unit trusts and similar funds 2,534 47 818 3,399 410 – – 3,809
Deferred tax liabilities 1,606 1,858 384 3,848 5 19 – 3,872 Current tax liabilities 426 89 85 600 35 580 – 1,215 Accruals and deferred income 271 – 105 376 209 9 – 594 Other creditors 726 532 760 2,018 3,292 1,346 (5,044) 1,612 Provisions 406 10 50 466 127 50 – 643 Derivative liabilities 709 461 146 1,316 49 136 – 1,501 Other liabilities 191 309 306 806 17 54 – 877
Total 8,977 4,680 2,654 16,311 4,144 2,194 (5,044) 17,605
Total liabilities 136,614 53,348 24,775 214,737 4,286 7,472 (5,044) 221,451
TOTAL EQUITY AND LIABILITIES 138,581 56,359 26,238 221,178 5,948 5,672 (5,044) 227,754

196
Prudential plc Annual Report 2010
FINANCIAL STATEMENTS > NOTES ON THE GROUP FINANCIAL STATEMENTS
B: SUMMARY OF RESULTSCONTINUED
B6: GROUP STATEMENT OF FINANCIAL POSITION > CONTINUED
b Group statement of financial position by business type
2010 £m 2009 £m
Shareholder-backed business
BY BUSINESS TYPE
Partici-patingfunds
Unit-linked
andvariableannuity
Non-linked
business
Assetmanage-
mentoperations
E2
Unallo-cated to a
segment(central
operations)
Intra-group
elimina-tion
31 Dec2010
Grouptotal
31 Dec2009
Grouptotal
AssetsIntangible assets attributable to shareholders: Goodwill – – 236 1,230 – – 1,466 1,310 Deferred acquisition costs and other intangible assets – – 4,600 9 – – 4,609 4,049
TotalH1 – – 4,836 1,239 – – 6,075 5,359
Intangible assets attributable to with-profits funds: In respect of acquired subsidiaries for venture
fund and other investment purposes 166 – – – – – 166 124 Deferred acquisition costs and other intangible assets 110 – – – – – 110 106
TotalH2 276 – – – – – 276 230
Total 276 – 4,836 1,239 – – 6,351 5,589
Deferred tax assetsH4 109 – 1,594 123 362 – 2,188 2,708Other non-investment and non-cash assetsH3-H6 2,749 651 3,285 999 4,159 (5,761) 6,082 5,425Investment of long-term business and
other operations: Investment properties 8,993 745 1,509 – – – 11,247 10,905 Investments accounted for using the equity method – – 71 – – – 71 6 Financial investments: Loansnote d 2,144 – 5,699 1,418 – – 9,261 8,754 Equity securities and portfolio holdings in
unit trusts 31,371 54,274 839 151 – – 86,635 69,354 Debt securitiesnote d 53,261 9,054 52,463 1,574 – – 116,352 101,751 Other investments 3,887 131 1,561 59 141 – 5,779 5,132 Deposits 7,272 749 1,851 80 – – 9,952 12,820
Total investmentsG1,H7,H8, note c 106,928 64,953 63,993 3,282 141 – 239,297 208,722
Properties held for saleH9 254 – 3 – – – 257 3Cash and cash equivalentsH10 1,915 1,490 1,267 1,436 523 – 6,631 5,307
TOTAL ASSETS 112,231 67,094 74,978 7,079 5,185 (5,761) 260,806 227,754

197F
INA
NC
IAL
S
TA
TE
ME
NT
SB
: SUM
MA
RY
O
F R
ESU
LTS
2010 £m 2009 £m
Shareholder-backed business
BY BUSINESS TYPE
Partici-patingfunds
Unit-linked
andvariableannuity
Non-linked
business
Assetmanage-
mentoperations
E2
Unallo-cated to a
segment(central
operations)
Intra-group
elimina-tion
31 Dec2010
Grouptotal
31 Dec2009
Grouptotal
EQUITY AND LIABILITIESEquityShareholders’ equityH11 – – 8,112 1,787 (1,868) – 8,031 6,271Non-controlling interests 35 – 5 4 – – 44 32
Total equity 35 – 8,117 1,791 (1,868) – 8,075 6,303
LiabilitiesPolicyholder liabilities and unallocated surplus of
with-profits funds: Contract liabilities (including amounts in respect
of contracts classified as investment contracts under IFRS 4) 92,544 65,598 56,585 – – – 214,727 186,398
Unallocated surplus of with-profits funds (reflecting application of ‘realistic’ basis provisions for UK regulated with-profits funds)D2g(ii),H12 10,253 – – – – – 10,253 10,019
Total policyholder liabilities and unallocated surplus of with-profits fundsnote e 102,797 65,598 56,585 – – – 224,980 196,417
Core structural borrowings of shareholder-financed operations:H13
Subordinated debt – – – – 2,718 – 2,718 2,691 Other – – 159 250 549 – 958 703
Total – – 159 250 3,267 – 3,676 3,394
Operational borrowings attributable to shareholder-financed operationsG1,H13 – – 441 3 2,560 – 3,004 2,751Borrowings attributable to with-profits
operationsG1,H13 1,522 – – – – – 1,522 1,284Deferred tax liabilities 1,576 25 2,408 5 210 – 4,224 3,872Other non-insurance liabilities 6,301 1,471 7,268 5,030 1,016 (5,761) 15,325 13,733
Total liabilities 112,196 67,094 66,861 5,288 7,053 (5,761) 252,731 221,451
TOTAL EQUITY AND LIABILITIES 112,231 67,094 74,978 7,079 5,185 (5,761) 260,806 227,754

198
Prudential plc Annual Report 2010
FINANCIAL STATEMENTS > NOTES ON THE GROUP FINANCIAL STATEMENTS
B: SUMMARY OF RESULTSCONTINUED
B6: GROUP STATEMENT OF FINANCIAL POSITION > CONTINUED
c Reconciliation of movement in investments A reconciliation of the Group’s directly held investments from the beginning of the year to the end of the year is as follows:
Insurance operations Totalinsurance
operations£m
AssetManage-
ment£m
Unallo-cated to a
segment£m
Grouptotal
£mUK£m
US£m
Asia£m
AT 31 DECEMBER 2008/1 JANUARY 2009 Total investments (including derivative assets) 121,862 46,171 21,809 189,842 3,303 289 193,434 Less: investments held by consolidated investment funds (609) – (1,101) (1,710) – – (1,710) Less: derivative liabilitiesG3 (3,401) (863) (32) (4,296) (292) (244) (4,832)
Directly held investments, net of derivative liabilities 117,852 45,308 20,676 183,836 3,011 45 186,892
Net cash inflow (outflow) from operating activities 1,432 2,755 3,028 7,215 (148) (52) 7,015Disposal of Taiwan agency business – – (3,261) (3,261) – – (3,261)Realised gains (losses) in the year 108 (529) (243) (664) 34 4 (626)Unrealised gains and losses and exchange movements
in the year 10,623 1,581 2,326 14,530 (56) 43 14,517Reclassification of property under development 131 – – 131 – – 131
Movement in the year of directly held investments, net of derivative liabilities 12,294 3,807 1,850 17,951 (170) (5) 17,776
AT 31 DECEMBER 2009/1 JANUARY 2010 Total investments (including derivative assets) 132,690 49,576 23,390 205,656 2,890 176 208,722 Less: investments held by consolidated investment funds (1,835) – (718) (2,553) – – (2,553) Less: derivative liabilitiesG3 (709) (461) (146) (1,316) (49) (136) (1,501)
Directly held investments, net of derivative liabilities 130,146 49,115 22,526 201,787 2,841 40 204,668
Net cash inflow from operating activities 1,329 7,306 2,167 10,802 329 120 11,251Realised gains (losses) in the year 2,233 21 984 3,238 11 (148) 3,101Unrealised gains and losses and exchange movements
in the year 5,958 6,264 3,301 15,523 23 (17) 15,529Dilution of PruHealth investment 56 – – 56 – – 56Acquisition of UOB Life Assurance Ltd – – 1,004 1,004 – – 1,004
Movement in the year of directly held investments, net of derivative liabilities 9,576 13,591 7,456 30,623 363 (45) 30,941
AT 31 DECEMBER 2010 Total investments (including derivative assets) 141,426 63,505 30,943 235,874 3,282 141 239,297 Less: investments held by consolidated investment funds (912) – (739) (1,651) – – (1,651) Less: derivative liabilitiesG3 (792) (799) (222) (1,813) (78) (146) (2,037)
Directly held investments, net of derivative liabilities 139,722 62,706 29,982 232,410 3,204 (5) 235,609
* The above reconciliation analyses the movement of directly held investments net of derivative liabilities. The deduction of derivative liabilities reflects the fact that these are considered an integral part of the Group’s investment portfolio and the exclusion from investments is merely a matter of required balance sheet presentation. The analysis excludes investments held in the balance sheet as a result of the consolidation of Open-Ended Investment Companies (OEICs) and unit trusts, as the Group’s exposure is merely to its share of the value of the fund as a whole rather than to the underlying investments and other assets and liabilities.

199F
INA
NC
IAL
S
TA
TE
ME
NT
SB
: SUM
MA
RY
O
F R
ESU
LTS
d Debt securities and loansi Information on the credit risks of debt securities
2010 £m 2009 £m
Insurance operations Totalinsurance
operations
AssetManage-
mentGroup
totalGroup
totalUK US Asia
S&P – AAA 18,833 4,187 2,934 25,954 884 26,838 22,106S&P – AA+ to AA- 6,885 801 2,138 9,824 143 9,967 9,060S&P – A+ to A- 21,508 5,156 2,843 29,507 452 29,959 26,849S&P – BBB+ to BBB- 12,848 8,202 913 21,963 70 22,033 20,581S&P – Other 3,403 866 1,773 6,042 6 6,048 4,479
63,477 19,212 10,601 93,290 1,555 94,845 83,075
Moody’s – Aaa 765 34 65 864 – 864 870Moody’s – Aa1 to Aa3 360 32 115 507 14 521 687Moody’s – A1 to A3 632 36 130 798 – 798 1,144Moody’s – Baa1 to Baa3 949 73 95 1,117 2 1,119 919Moody’s – Other 233 135 49 417 – 417 411
2,939 310 454 3,703 16 3,719 4,031
Implicit ratings of MBS based on NAIC valuations (see below) – NAIC 1 – 3,083 – 3,083 – 3,083 747 – NAIC 2 – 181 – 181 – 181 105 – NAIC 3-6 – 232 – 232 – 232 473
– 3,496 – 3,496 – 3,496 1,325
Fitch 630 176 49 855 – 855 1,342Other 7,258 3,172 3,004 13,434 3 13,437 11,978
Total debt securities 74,304 26,366 14,108 114,778 1,574 116,352 101,751
In the table above, with the exception of residential mortgage-backed securities within Jackson, Standard & Poor’s (S&P) ratings have been used where available. For securities where S&P ratings are not immediately available, those produced by Moody’s and then Fitch have been used as an alternative. During 2009, the National Association of Insurance Commissioners in the US revised the regulatory ratings process for more than 20,000 residential mortgage-backed securities. In addition, in 2010, NAIC applied the revised ratings process for commercial mortgage-backed securities. The table above includes these securities, held by Jackson, using the regulatory ratings levels established by an external third party (PIMCO). Notes D2(d), D3(d), D4(d) and E2 provide further details on the credit risks of debt securities by segment.

200
Prudential plc Annual Report 2010
FINANCIAL STATEMENTS > NOTES ON THE GROUP FINANCIAL STATEMENTS
B: SUMMARY OF RESULTSCONTINUED
B6: GROUP STATEMENT OF FINANCIAL POSITION > CONTINUED
ii Group exposure to holdings in asset-backed securitiesThe Group’s exposure to holdings in asset-backed securities which comprise residential mortgage-backed securities (RMBS), commercial mortgage backed securities (CMBS), CDO funds and other asset-backed securities (ABS), at 31 December 2010 is as follows:
2010 £m 2009 £m
SHAREHOLDER-BACKED OPERATIONS:UK insurance operationsnote i 1,181 2,044US insurance operationsnote ii 6,135 6,376Asian insurance operationsnote iii 113 59Other operationsnote iv 437 326
7,866 8,805
WITH-PROFITS OPERATIONS: UK insurance operationsnote i 5,237 6,451Asian insurance operationsnote iii 435 378
5,672 6,829
TOTAL 13,538 15,634
i UK insurance operationsThe UK insurance operations’ exposure to asset-backed securities at 31 December 2010 comprises:
2010 £m 2009 £m
Shareholder-backed business (2010: 51% AAA, 23% AA) 1,181 2,044With-profits operations (2010: 52% AAA, 13% AA) 5,237 6,451
Total 6,418 8,495
All of the £1,181 million (2009: £2,044 million) exposure of the shareholder-backed business relates to the UK market, primarily to investments held by PRIL. £3,685 million of the £5,237 million (2009: £4,695 million of the £6,451 million) exposure of the with-profits operations relates to exposure to the UK market while the remaining £1,552 million (2009: £1,756 million) relates to exposure to the US market.
ii US insurance operationsThe US insurance operations’ exposure to asset-backed securities at 31 December 2010 comprises:
2010 £m 2009 £m
RMBS*: Sub-prime (2010: 40% AAA, 11% AA) 224 194 Alt-A (2010: 15% AAA, 6% AA) 415 443 Prime including agency (2010: 79% AAA, 2% AA) 2,145 2,679CMBS* (2010: 36% AAA, 15% AA) 2,375 2,104CDO funds (2010: 4% AAA, 4% AA),† including £1 million exposure to sub-prime 162 79Other ABS (2010: 26% AAA, 20% AA), including £37 million exposure to sub-prime 814 877
Total 6,135 6,376
* RMBS ratings refer to the rating implicit within NAIC risk-based capital valuation (see note d(i)). For 2010, CMBS ratings refer to the NAIC rating.† Including the Group’s economic interest in Piedmont and other consolidated CDO funds. Further details on Jackson’s RMBS sub-prime and Alt-A securities are given in note D3(d).

201F
INA
NC
IAL
S
TA
TE
ME
NT
SB
: SUM
MA
RY
O
F R
ESU
LTS
iii Asian insurance operationsThe Asian insurance operations’ exposure to asset-backed securities is primarily held by the with-profits operations.The £435 million (2009: £378 million) asset-backed securities exposure of the Asian with-profits operations comprises:
2010 £m 2009 £m
CMBS 251 91CDO funds and other ABS 184 287
Total 435 378
The £435 million (2009: £378 million) includes £341 million (2009: £228 million) held by investment funds consolidated under IFRS in recognition of the control arrangements for those funds and includes an amount not owned by the Group with a corresponding liability of £7 million (2009: £61 million) on the statement of financial position for net asset value attributable to external unit-holders in respect of these funds, which are non-recourse to the Group. Of the £435 million, 43 per cent (2009: £378 million, 72 per cent) are investments graded by Standard & Poor’s.
iv Other operationsOther operations’ exposure to asset-backed securities at 31 December 2010 is held by Prudential Capital and comprises:
2010 £m 2009 £m
RMBS: Prime (2010: 96% AAA, 4% AA) 197 91CMBS (2010: 30% AAA, 23% AA) 184 193CDO funds and other ABS – all without sub-prime exposure (2010: 98% AAA) 56 42
Total 437 326
iii LoansInformation on the credit quality of the portfolio of loans, which almost wholly is for amounts which are neither past due or impaired is shown in notes D2, D3, D4 and E2. Details of allowances for loans, losses and amounts past due are shown in notes G1 and G2. No additional analysis is provided of the element of loans and receivables that were neither past due nor impaired from those of the total portfolio on the grounds of the immateriality of the difference between the neither past due nor impaired element and the total portfolio.

202
Prudential plc Annual Report 2010
FINANCIAL STATEMENTS > NOTES ON THE GROUP FINANCIAL STATEMENTS
B: SUMMARY OF RESULTSCONTINUED
B6: GROUP STATEMENT OF FINANCIAL POSITION > CONTINUED
e Reconciliation of movement in policyholder liabilities and unallocated surplus of with-profits fundsA reconciliation of the total policyholder liabilities and unallocated surplus of with-profits funds of the Group from the beginning of the year to the end of the year is as follows:
Insurance operations
UK£m
US£m
Asia£m
Total £m
AT 1 JANUARY 2009 115,961 45,361 21,069 182,391Premiums 6,867 9,177 3,807 19,851Surrenders (3,971) (3,255) (1,201) (8,427)Maturities/Deaths (7,239) (733) (342) (8,314)
Net flows (4,343) 5,189 2,264 3,110Shareholders’ transfers post-tax (202) – (20) (222)Changes in reserving basis in Malaysia – – (63) (63)Assumption changes (shareholder-backed business) (46) – (4) (50)Investment-related items and other movements 14,118 2,986 4,242 21,346Foreign exchange translation differences 707 (5,225) (2,069) (6,587)Disposal of Taiwan agency business – – (3,508) (3,508)
AT 31 DECEMBER 2009/ 1 JANUARY 2010 126,195 48,311 21,911 196,417
Comprising – Policyholder liability 116,229 48,311 21,858 186,398 – Unallocated surplus of with-profits funds 9,966 – 53 10,019
Premiums 7,890 11,735 4,308 23,933 Surrenders (3,779) (3,598) (2,241) (9,618)Maturities/Deaths (7,303) (769) (498) (8,570)
Net flows (3,192) 7,368 1,569 5,745 Shareholders’ transfers post-tax (223) – (24) (247)Assumption changes (shareholder-backed business) (46) – 19 (27) Investment-related items and other movements 13,218 3,464 2,216 18,898 Foreign exchange translation differences (208) 1,380 2,081 3,253 Dilution of holding in PruHealth investment (27) – – (27)Acquisition of UOB Life Assurance Limited – – 968 968
AT 31 DECEMBER 2010 135,717 60,523 28,740 224,980
Comprising – Policyholder liability 125,530 60,523 28,674 214,727 – Unallocated surplus of with-profits funds 10,187 – 66 10,253
Average policyholder liability balances*
2010 120,880 54,417 25,750 201,047
2009 111,969 46,837 19,630 178,436
* Adjusted for acquisition and disposals in the period and excluding unallocated surplus of with-profits funds.
The items above represent the amount attributable to changes in policyholder liabilities and unallocated surplus of with-profits funds as a result of each of the components listed. Premiums, surrenders and maturities/deaths represent the amounts impacting policyholder liabilities and may not represent the total cash paid/received (for example, premiums are net of any deductions to cover acquisition costs and claims represent the policyholder liabilities released).

203F
INA
NC
IAL
S
TA
TE
ME
NT
SC
: GR
OU
P R
ISK
MA
NA
GE
ME
NT
C: GROUP RISK MANAGEMENT
a: OVERVIEW
As a provider of financial services, including insurance, the management of risk lies at the heart of the Group’s business. The control procedures and systems established within the Group are designed to manage, rather than eliminate, the risk of failure to meet business objectives. They can only provide reasonable and not absolute assurance against material misstatement or loss, and focus on aligning the levels of risk-taking with the achievement of business objectives. The Group’s internal control processes are detailed in the Group Governance Manual. This is supported by the Group Risk Framework, which provides an overview of the Group-wide philosophy and approach to risk management. Where appropriate, more detailed policies and procedures have been developed at Group and/or business unit levels. These include Group-wide mandatory policies on certain operational risks, including: health, safety, fraud, money laundering, bribery, business continuity, information security and operational security, and policies on certain financial risks. Additional guidelines are provided for some aspects of actuarial and financial activity. Prudential’s risk governance framework requires that all of the Group’s businesses and functions establish processes for identifying, evaluating and managing the key risks faced by the Group. The risk governance framework is based on the concept of ‘three lines of defence’: Risk management; risk oversight and independent assurance. Primary responsibility for strategy, performance management and risk control lies with the Board, which has established the Group Risk Committee to assist in providing leadership, direction and oversight, and with the Group Chief Executive and the chief executive of each business unit. Risk oversight is provided by Group-level risk committees, chaired by the Group Chief Risk Officer or the Chief Financial Officer. Independent assurance on the Group’s internal control and risk management systems is provided by the Group Audit Committee, supported by the Group-wide Internal Audit. The Group’s risk reporting framework forms an important part of the Group’s business planning process. Business units review their risks as part of the annual preparation of their business plans and review opportunities and risks against business objectives regularly with Group executive management. Additional information on the Group’s risk framework is included in the risk and capital management section of the Group’s business review. The management of the risk attached to the Group’s financial instruments and insurance liabilities, together with the inter-relationship with the management of capital may be summarised in the following sections.
b: GROUP RISK APPETITE
The Group risk appetite framework sets out the Group’s appetite for risk exposures as well as the approach to risk management and return optimisation. The Group defines and monitors aggregate risk limits for its earnings volatility and its capital requirements based on financial and non-financial stresses.
i Earnings volatility: The objectives of the limits are to ensure that (a) the volatility of earnings is consistent with stakeholder expectations, (b) the Group has adequate earnings (and cash flows) to service debt, expected dividends and to withstand unexpected shocks, and (c) earnings (and cash flows) are managed properly across geographies and are consistent with the Group’s funding strategies. The two measures applied to monitor the volatility of the Group’s earnings are International Financial Reporting Standards (IFRS) operating profit based on longer-term investment returns and European Embedded Value (EEV) operating profit based on longer-term investment returns although IFRS and EEV total profits are also considered.
ii Capital requirements: The limits aim to ensure that (a) the Group meets its internal economic capital requirements, (b) the Group achieves its desired target rating to meet its business objectives, and (c) supervisory intervention is avoided. The two measures applied by the Group are the EU Insurance Groups Directive (IGD) capital requirements and internal economic capital requirements. In addition, the Group also monitors capital requirements on a local statutory basis. Business units must establish suitable market, credit, insurance and liquidity limits that maintain financial risk exposures within the defined Group risk appetite. The Group’s risk appetite framework forms an integral part of its annual business planning cycle. The Group Risk function monitors the Group’s risk profile against the agreed limits. Using submissions from business units, Group Risk calculates the Group’s aggregated position (allowing for diversification effects between business units) relative to the limits implied by the risk appetite statements. Market risk is managed such that as conditions evolve the risk profile is maintained within risk appetite. In addition to business unit operational limits on credit risk, the Group sets counterparty risk limits at Group level. The limits on the total Group-wide exposures to a single counterparty are specified within different credit rating ‘categories’. Group Risk and the Group Credit Risk Committee monitor the Group’s actual exposures against these limits on at least a monthly basis, escalating matters to Group Executive Risk Committee as appropriate.

204
Prudential plc Annual Report 2010
FINANCIAL STATEMENTS > NOTES ON THE GROUP FINANCIAL STATEMENTS
C: GROUP RISK MANAGEMENTCONTINUED
c: RISK MITIGATION AND HEDGING
The Group manages its actual risk profile against its tolerance of risk. To do this, the Group maintains risk registers that include details of the identified risks and of the controls and mitigating actions employed in managing them. Any mitigation strategies involving large transactions, such as a material derivative transaction, are subject to scrutiny at Group level before implementation. The Group uses a range of risk management and mitigation strategies. The most important of these include: adjusting asset portfolios to reduce investment risks (such as duration mismatches or overweight counterparty exposures); using derivatives to hedge market risks; implementing reinsurance programmes to limit insurance risk; implementing corporate insurance programmes to limit the impact of operational risks; and revising business plans where appropriate.
i Use of derivativesIn the UK business, equity exposure is incurred in the with-profits fund, and it includes a large inherited estate. The inherited estate itself is partially protected against falls in equity markets by a derivative hedging portfolio. In the US, to protect the shareholders against the volatility introduced by embedded options, Jackson uses both a comprehensive hedging programme and reinsurance. Jackson makes use of the natural offsets that exist between the variable annuity guarantees and the fixed index annuity book, and then uses a combination of OTC options and futures to hedge the residual risk, allowing for significant market shocks and limiting the amount of capital at risk. Internal positions are generally netted before any external hedge positions are considered. Jackson manages fixed annuity interest rate exposure through a combination of interest rate swaps and interest rate options, to protect capital against rates rising quickly and through the contractual ability to reset crediting rates annually. Prudential principally operates in the UK, the US, and in 13 countries in Asia. The geographical diversity of the Group’s business means that Prudential is inevitably subject to the risk of exchange rate fluctuations. The Group does not generally seek to hedge foreign currency revenues, as these are substantially retained locally to support the growth of the Group’s business and meet local regulatory and market requirements. However, in cases where a surplus arising in an overseas operation supports Group capital or shareholders’ interest, this exposure is hedged if it is economically optimal to do so. Currency borrowings, swaps and other derivatives are used to manage exposures. Further details of the Group’s use of derivatives are explained in note G3.
ii Asset/liability managementPrudential manages its assets and liabilities locally, in accordance with local regulatory requirements and reflecting the differing types of liabilities of each business unit. Stochastic asset/liability modelling is carried out locally by business units to perform dynamic solvency testing and assess capital requirements. Reserve adequacy testing under a range of scenarios and dynamic solvency analysis is carried out, including under certain scenarios mandated by the US, the UK and Asian regulators. A stochastic approach models the inter-relationship between asset and liability movements, taking into account asset correlation and policyholder behaviour, under a large number of possible scenarios. These scenarios are projected forward over a period of time, typically 25 years, and the liabilities and solvency position of the fund are calculated in each scenario in each future year. This allows the identification of which extreme scenarios will have the most adverse effects and what the best estimate outcome may be. The fund’s policy on management actions, including bonus and investment policy, is then set in order that they are consistent with the available capital and the targeted risk of default. This differs from a deterministic model, which would only consider the results from one carefully selected scenario. For businesses that are most sensitive to interest rate changes, such as immediate annuity business, Prudential uses cash flow analysis to create a portfolio of fixed income securities whose value changes in line with the value of liabilities when interest rates change. This type of analysis helps protect profits and the capital position from changing interest rates. In the UK, the cash flow analysis is used in Prudential’s annuity business while, in the US, it is used for its interest-sensitive and fixed index annuities and stable value products such as Guaranteed Investment Contracts (GICs). Perfect matching is not possible, for example because of the nature of the liabilities (which might include guaranteed surrender values) and options for prepayment contained in the assets or the unavailability of assets with a sufficiently long duration. For businesses that are most sensitive to equity price changes, Prudential uses stochastic modelling and scenario testing to look at the expected future returns on its investments under different scenarios that best reflect the large diversity in returns that equities can produce. This allows Prudential to devise an investment and with-profits policyholder bonus strategy that, on the model assumptions, allows it to optimise returns to its policyholders and shareholders over time, while maintaining appropriate financial strength. Prudential uses this method extensively in connection with its UK with-profits business. All of Prudential’s investments are held either for risk management or investment purposes. This is because almost all of the investments support policyholder or customer liabilities of one form or another. Any assets that Prudential holds centrally that are not supporting customer liabilities are predominantly invested in short-term fixed income and fixed maturity securities. The Group has contingency plans in place for a range of operational risk scenarios, including incident management and business continuity plans. As a contingency plan for liquidity risk, the Group has arranged access to committed revolving credit facilities and committed securities lending facilities.

205F
INA
NC
IAL
S
TA
TE
ME
NT
SC
: GR
OU
P R
ISK
MA
NA
GE
ME
NT
d: RISK EXPOSURES
The Group publishes separately within ‘Additional Information’ of its Group Annual Report a section on key risk factors, which discusses inherent risks in the business and trading environment.
i Market risksMarket risk is the risk that arises from adverse changes in the value of, or income from, assets and changes in interest rates or exchange rates.
Equity and interest rate riskPrudential faces equity risk and interest rate risk because most of its assets are investments that are either equity type investments and subject to equity price risk, or bonds, mortgages or cash deposits, the values of which are subject to interest rate risk. The amount of risk borne by Prudential’s shareholders depends on the extent to which its customers share the investment risk through the structure of Prudential’s products. The split of Prudential’s investments between equity investments and interest-sensitive instruments depends principally on the type of liabilities supported by those investments and the amount of capital Prudential has available. The nature of some liabilities allows Prudential to invest a substantial portion of its investment funds in equity and property investments that Prudential believes produce greater returns over the long term. On the other hand Prudential has some liabilities that contain guaranteed returns and allow instant access (for example, interest-sensitive fixed annuities and immediate annuities), which generally will be supported by fixed income investments.
Foreign exchange riskPrudential faces foreign exchange risk, primarily because its presentation currency is pounds sterling, whereas approximately 73 per cent of Prudential’s operating profit from continuing operations based on longer-term investment returns, as described in note B1, for the year ended 31 December 2010, came from US and Asian operations. The exposure relating to the translation of reported earnings is not separately managed although its impact is reduced by interest payments on foreign currency borrowings and by the adoption of average exchange rates for the translation of foreign currency revenues. Approximately 79 per cent of the Group’s IFRS basis shareholders’ equity at 31 December 2010 arose in Prudential’s US and Asian operations (2009: approximately 77 per cent). To mitigate the exposure of the US component there are US$2.3 billion of borrowings held centrally, which are formally designated as net investment hedges at 31 December 2010. Net of the currency position arising from these borrowings some 61 per cent of the Group’s shareholders’ funds are represented by net assets in currencies other than sterling. Additional details on the market risks’ exposures of the UK, US and Asian insurance operations are provided in notes D2, D3 and D4, respectively.
ii Credit riskCredit risk is the risk of loss if another party fails to meet its obligations, or fails to do so in a timely fashion. Credit risk is the Group’s most significant financial risk. Some of Prudential’s businesses, in particular Jackson, the PAC with-profits fund and Prudential’s UK pension annuity business hold large amounts of interest-sensitive investments that contain credit risk on which a certain level of defaults is expected. These expected losses are considered when Prudential determines the crediting rates, deposit rates and premium rates for the products that will be supported by these assets. The key shareholder business exposed to credit risks is Jackson. Certain over-the-counter derivatives contain a credit risk element that is controlled through evaluation of collateral agreements and master netting agreements on interest rate and currency swaps. Prudential is also exposed to credit-related losses in the event of non-performance by counterparties. Further analysis of the credit quality of debt securities held by the Group is shown in note B6. Additional details on the credit quality of the debt security portfolios of UK, US and Asian insurance operations are shown in notes D2, D3 and D4, respectively.
iii Liquidity riskLiquidity risk is the risk that a business, though solvent on a balance sheet basis, either does not have the financial resources to meet its obligations as they fall due or can secure them only at excessive cost. The assets of insurers are in general relatively liquid, whilst liabilities to policyholders are mainly illiquid. Accordingly, for insurers, the focus of managing liquidity risk concentrates on parent capital and liquidity measures. Prudential regularly monitors and analyses its liquidity position at the Group level and performs stress tests of this position. The liquidity of the Group is monitored on a monthly basis by comparing the predicted cash needs of the Group centre, to meet corporate and financing costs (net of expected dividends from the business units), to the liquid resources available to it. These liquid resources include cash held and cash that could be raised through internal resources (for example by reporting unencumbered bonds). Base case and stress scenarios are reported monthly to the Balance Sheet and Capital Management Committee. The main stress is the assumption that the external financing markets are completely closed to Prudential, so no new external funding can be obtained, and existing funding cannot be rolled over. In addition, Group liquidity risk reports are prepared regularly. In summary, these address the sufficiency of external back-up lines, internal sources of liquidity, and monitor how external liabilities and other commitments over the next 12 months compare with internal and external sources. Currently, the parent company has significant internal resources of liquidity which are sufficient to meet all of its foreseeable future needs without having to utilise external funding. The Group maintains £2.1 billion of undrawn syndicated and bilateral committed banking facilities, maturing between 2011 and 2015.

206
Prudential plc Annual Report 2010
FINANCIAL STATEMENTS > NOTES ON THE GROUP FINANCIAL STATEMENTS
C: GROUP RISK MANAGEMENTCONTINUED
d: RISK EXPOSURES > CONTINUED
iv Insurance riskInsurance risk is the inherent uncertainty as to the occurrence, amount and timing of insurance liabilities. This includes adverse mortality, morbidity and persistency experience. Prudential needs to make assumptions about a number of factors in determining the pricing of its products and for reporting the results of its long-term business operations. In common with other industry participants, the profitability of the Group’s businesses depends on a mix of factors including mortality and morbidity trends, persistency, investment performance, unit cost of administration and new business acquisition expenses. For example, the assumption that Prudential makes about future expected levels of mortality is particularly relevant for its UK annuity business where, in exchange for their accumulated pension fund, pension annuity policyholders receive a guaranteed payment, for as long as they live. Prudential conducts extensive research into longevity risk using data from its substantial annuitant portfolio. As part of its pension annuity pricing and reserving policy, Prudential UK assumes that current rates of mortality continuously improve over time at levels based on adjusted data from the Continuous Mortality Investigations (CMI) projections as published by the Institute and Faculty of Actuaries. Prudential’s persistency assumptions reflect recent past experience for each relevant line of business, and any expectations of future persistency. Where appropriate, allowance is also made for the relationship, which is either assumed or historically observed, between persistency and investment returns, and for the resulting additional risk.
v Non-financial risks – operational, business environment and strategic riskOperational risk is the risk of direct or indirect loss resulting from inadequate or failed internal processes, people or systems, or from external events. This includes legal and regulatory compliance risk. Business environment risk may arise from exposure to forces in the external environment that could significantly change the fundamentals that drive the business’s overall objectives and strategy. Strategic risk may arise from ineffective, inefficient or inadequate senior management processes for the development and implementation of business strategy in relation to the business environment and the Group’s capabilities. Prudential is exposed to operational, business environment and strategic risk in the course of running its businesses. Prudential processes a large number of complex transactions across numerous and diverse products, and is subject to a number of different legal and regulatory, including tax, regimes. Prudential also has a significant number of third-party relationships that are important to the distribution and processing of its products, both as market counterparties and as business partners. This results in reliance upon the operational performance of these outsourcing partners. The Group uses the qualitative and quantitative analysis of operational risk exposures material to the Group to support business decision making and lessons learned activities; the ongoing improvement of the control environment; the informing of overall levels of capital held; and determination of the adequacy of Prudential’s corporate insurance programme. With regard to business environment risk, the Group has a wide-ranging programme of active and constructive engagement with governments, policymakers and regulators in our key markets and with relevant international institutions, undertaken both directly and indirectly via trade associations. The Group has procedures in place to monitor and track political and regulatory developments. Where appropriate, the Group provides submissions and technical input to officials and others, either via submissions to formal consultations or through interactions with officials. With regard to strategic risk, business units and the Group Head Office are required to adopt a forward-looking approach to risk management by performing risk assessments as part of the annual strategic planning process. This supports the identification of potential threats and the initiatives needed to address them, as well as competitive opportunities. The impact on the underlying business unit and/or Group-wide risk profile is also considered to ensure that strategic initiatives are within the Group’s risk appetite.

207F
INA
NC
IAL
S
TA
TE
ME
NT
SC
: GR
OU
P R
ISK
MA
NA
GE
ME
NT
e: REGULATORY CAPITAL REQUIREMENTS
Regulatory capital requirements apply at an individual company level for the Group’s life assurance and asset management business. These are described in sections D5 and E3 respectively. In addition, the Group as a whole is subject to the capital adequacy requirements of the European Union (EU) Insurance Groups Directive (IGD) as implemented by the FSA in the UK. The IGD pertains to groups whose activities are primarily concentrated in the insurance sector. The IGD capital adequacy requirements involves aggregating surplus capital held in our regulated subsidiaries, from which Group borrowings, except those subordinated debt issues that qualify as capital, are deducted. No credit for the benefit of diversification is permitted under this approach. The test is passed when this aggregate number is positive: a negative result at any point in time is a notifiable breach of UK regulatory requirements. Due to the geographically diverse nature of Prudential’s operations, the application of these requirements to Prudential is complex. In particular, for many of the Group’s Asian operations the assets, liabilities and capital requirements have to be recalculated based on FSA regulations as if the companies were directly subject to FSA regulation. The FSA has established a structure for determining how much hybrid debt can count as capital which is similar to that used for banks. It categorises capital as Tier 1 (equity and preference shares), Upper Tier 2 and Lower Tier 2. Up to 15 per cent of Tier 1 capital can be in the form of hybrid debt and is called ‘Innovative Tier 1’. At 31 December 2010 the Group held £1,463 million (2009: £1,422 million) of Innovative Tier 1 capital in the form of perpetual securities, £nil (2009: £nil) of Upper Tier 2 and £1,255 million (2009: £1,269 million) of Lower Tier 2 capital. In addition, Jackson held £159 million of surplus notes at the end of the financial year 2010 (2009: £154 million) which, although the US does not have a similar capital categorisation under its regulatory framework, are akin to the FSA’s Lower Tier 2 Capital and have been disclosed as such in note H13. Further details on Group borrowings are shown in note H13. At 31 December 2009, Prudential met the requirements of the IGD with £3.4 billion of surplus capital before allowing for the 2009 final dividend. In addition, during 2010, Prudential met the requirements of the FSA under the IGD. The IGD position as at 31 December 2010 will be submitted to the FSA by 30 April 2011 and at the time of preparation of these financial statements the surplus capital under the test was estimated to be around £4.3 billion before allowing for the 2010 final dividend giving a solvency ratio of circa 305 per cent. The main components of the increase in IGD surplus during 2010 are:
• Net capital generation mainly through operating earnings (in-force releases less investment in new business) of £1.7 billion;• Release of tax provisions of £0.2 billion;• Foreign exchange movements of positive £0.1 billion;• Offset by dividend payments, external financing costs and other central costs, costs incurred in relation to the terminated AIA
transaction and inadmissible assets arising on the purchase of UOB’s life assurance subsidiary in Singapore.
Prudential’s approach to capital allocation takes into account a range of factors, especially risk adjusted returns on capital, the impact of alternative capital measurement bases (accounting, regulatory, economic and ratings agency assessments), tax efficiency, and wider strategic objectives. Prudential optimises capital allocation across the Group by using a consistent set of capital performance metrics across all business units to ensure meaningful comparison. Capital utilisation, return on capital and new business value creation are measured at a product level. The use of these capital performance metrics is embedded into our decision-making processes for product design and product pricing. Prudential’s capital performance metrics are based on economic capital, which provides a view of our capital requirements across the Group, allowing for realistic diversification benefits. Economic capital also provides valuable insights into our risk profile and is used both for risk measurement and capital management.

208
Prudential plc Annual Report 2010
FINANCIAL STATEMENTS > NOTES ON THE GROUP FINANCIAL STATEMENTS
D: LIFE ASSURANCE BUSINESSES
D1: GROUP OVERVIEW
a Products and classification for IFRS reportingThe measurement basis of assets and liabilities of long-term business contracts is dependent upon the classification of the contracts under IFRS. Under IFRS 4, contracts are initially classified as being either ‘insurance’ contracts, if the level of insurance risk in the contracts is significant, or ‘investment’ contracts, if the risk is insignificant.
Insurance contractsInsurance contracts are permitted to be accounted for under previously applied GAAP. The Group has chosen to adopt this approach. However, as an improvement to accounting policy, permitted by IFRS 4, the Group has applied the measurement principles for with-profits contracts of UK regulated entities and disclosures of the UK Standard FRS 27 from 1 January 2005. An explanation of the provisions under FRS 27 is provided in note D2. Under the previously applied GAAP, UK GAAP, the assets and liabilities of contracts are reported in accordance with the MSB of reporting as set out in the ABI SORP. The insurance contracts of the Group’s shareholder-backed business fall broadly into the following categories:
• UK insurance operations – bulk and individual annuity business, written primarily by Prudential Retirement Income Limited and other categories of
non-participating UK business;• Jackson
– fixed and variable annuity business and life insurance; and• Prudential Corporation Asia
– non-participating term, whole life, and unit-linked policies, together with accident and health policies.
Investment contractsInvestment contracts are further delineated under IFRS 4 between those with and without discretionary participation features. For those contracts with discretionary participation features, IFRS 4 also permits the continued application of previously applied GAAP. The Group has adopted this approach, again subject to the FRS 27 improvement. For investment contracts that do not contain discretionary participation features, IAS 39 and, where the contract includes an investment management element, IAS 18, apply measurement principles to assets and liabilities attaching to the contract that may diverge from those previously applied. Contracts of the Group, which are classified as investment contracts that do not contain discretionary participation features, can be summarised as:
• UK – certain unit-linked savings and similar contracts;
• Jackson – GICs and funding agreements – minor amounts of ‘annuity certain’ contracts; and
• Prudential Corporation Asia – minor amounts for a number of small categories of business.
The accounting for the investment contracts of UK insurance operations and Jackson’s GICs and funding agreements are considered in turn below:
i Certain UK unit-linked savings and similar contractsDeferred acquisition costsAcquisition costs are deferred to the extent that it is appropriate to recognise an asset that represents the entity’s contractual right to benefit from providing investment management services and are amortised as the entity recognises the related revenue. IAS 18 further reduces the costs potentially capable of deferral to incremental costs only. Deferred acquisition costs are amortised to the income statement in line with service provision.
Deferred income reservesThese are required to be established under IAS 18 with amortisation over the expected life of the contract. The majority of the relevant UK contracts are single premium with the initial deferred income reflecting the ‘front-end load’ i.e. the difference between the premium paid and the amount credited to the unit fund. Deferred income is amortised to the income statement in line with service provision. The amortisation profile is either on a straight-line basis or, if more appropriate, a further deferral of income recognition is applied.

209F
INA
NC
IAL
S
TA
TE
ME
NT
SD
: LIF
E A
SSUR
AN
CE
B
USIN
ESSE
S
Sterling reservesPrudent provisions established for possible future expenses not covered by future margins at a policy level reflecting the regulatory approach in the UK are not permitted for those contracts with insignificant insurance risk that are classified as investment contracts.
ii Jackson – GICs and funding arrangementsUnder a traditional GIC, the policyholder makes a lump sum deposit. The interest rate paid is fixed and established when the contract is issued. Funding agreements are of a similar nature but the interest rate may be floating, based on a rate linked to an external index. The US GAAP accounting requirements for such contracts are very similar to those under IFRS on the amortised cost model for liability measurement.
b Concentration of riski Business acceptedThe Group’s exposure to life assurance risks is well diversified. This is achieved through the geographical spread of the Group’s operations and, within those operations, through a broad mix of product types. As part of the risk management framework, the Group regularly monitors concentration of risk using a variety of risk monitoring tools including:
• Scenario testing and sensitivity analysis of the Group capital and profitability metrics involving IGD, Group economic capital, EEV and IFRS help identify concentrations of risks by risk types, products and business units, as well as the benefits of diversification of risks.
An example of the diversification benefits for Prudential is that adverse scenarios do not affect all business units in the same way, providing natural hedges within the Group. For example, the Group’s US business is sensitive to increasing interest rates, whereas, in contrast, several business units in Asia benefit from increasing rates. Conversely, these Asian business units are sensitive towards low interest rates, whereas certain products in the US benefit from falling interest rates. The economic capital framework also takes into account situations where factors are correlated, for example the extent of correlation between UK and US economies.
• Business units are also required to disclose to the Group risk function all material risks, along with information on their severity and likelihood, and mitigating actions taken or planned.
Credit risk remains one of the largest risk exposures. This reflects the relative size of exposure in Jackson and the UK shareholder annuities business. The Group manages concentration of credit risks by setting limits on the maximum exposure to each counterparty based on their credit ratings.
ii Ceded businessThe Group cedes certain business to other insurance companies. Although the ceding of insurance does not relieve the Group of liability to its policyholders, the Group participates in such agreements for the purpose of managing its loss exposure. The Group evaluates the financial condition of its reinsurers and monitors concentration of credit risk from similar geographic regions, activities or economic characteristics of the reinsurers to minimise its exposure from reinsurer insolvencies. Reinsurance recoverable insurance assets are not a significant component of the Group’s statement of financial position and accordingly, exposure to concentrations of reinsurance risk is not significant to the Group. At 31 December 2010, 97 per cent (2009: 98 per cent) of the reinsurance recoverable insurance assets were ceded by the Group’s UK and US operations, of which 90 per cent (2009: 92 per cent) of the balance were from reinsurers with Standard & Poor’s rating A- and above.
c GuaranteesNotes D2(e), D3(e) and D4(e) provide details of guarantee features of the Group’s life assurance products. In the UK, guarantees of the with-profits products are valued for accounting purposes on a market consistent basis for 2010 as described in section D2(g)(ii). The UK business also has products with guaranteed annuity option features, mostly within SAIF, as described in section D2(e). There is little exposure to financial options and guarantees in the shareholder-backed business of the UK operations. The US business annuity products have a variety of option and guarantee features as described in section D3(e). Jackson’s derivative programme seeks to manage the exposures as described in section D3(f). The Group’s exposure to guarantees was significantly reduced during 2009 as a result of the disposal of the Taiwan agency business. d Sensitivity of EEV basis profit and equity for market and other risksThe Group prepares supplementary EEV basis financial statements for half yearly and annual publication. These statements include sensitivity disclosures which are part of the market risk information provided to key management. The 2010 EEV sensitivity disclosures are shown in note 15 of the EEV basis supplementary information in this Annual Report.

210
Prudential plc Annual Report 2010
FINANCIAL STATEMENTS > NOTES ON THE GROUP FINANCIAL STATEMENTS
D: LIFE ASSURANCE BUSINESSESCONTINUED
D1: GROUP OVERVIEW > CONTINUED
e Sensitivity of IFRS basis profit or loss and equity to market and other risks i Overview of risks by business unitThe financial and insurance assets and liabilities attaching to the Group’s life assurance business are, to varying degrees, subject to market and insurance risk and other changes of experience assumptions that may have a material effect on IFRS basis profit or loss and equity. Market risk is the risk that the fair value or future cash flows of a financial instrument or, in the case of liabilities of insurance contracts, their carrying value will fluctuate because of changes in market prices. Market risk comprises three types of risk, namely:
• Currency risk: due to changes in foreign exchange rates;• interest rate risk: due to changes in market interest rates; and• other price risk: due to fluctuations in market prices (other than those arising from interest rate risk or currency risk).
Policyholder liabilities relating to the Group’s life assurance businesses are also sensitive to the effects of other changes in experience, or expected future experience, such as for mortality, other insurance risk and lapse risk. In addition, the profitability of the Group’s life assurance businesses and, as described in Section E, asset management business, is indirectly affected by the performance of the assets covering policyholder liabilities and related capital.
Three key points are to be noted, namely:
• The Group’s with-profits and unit-linked funds absorb most market risk attaching to the funds’ investments. Except for second order effects, for example on asset management fees and shareholders’ share of cost of bonuses for with-profits business, shareholder results are not directly affected by market value movements on the assets of these funds;
• The Group’s shareholder results are most sensitive to market risks for assets of shareholder-backed business; and• The main exposures of the Group’s IFRS basis results to market risk for life assurance operations on investments of shareholder-
backed business are for debt securities.
The most significant items for which the IFRS basis shareholders’ profit or loss and equity for the Group’s life assurance business is sensitive to these variables are shown in the following tables. The distinction between direct and indirect exposure is not intended to indicate the relative size of the sensitivity.
Market and credit risk
Type of business Investments/derivatives Liabilities/unallocated surplus Other exposure Insurance and lapse risk
UK insurance operations (see also section D2(j))With-profits business
(including Prudential Annuities Limited)
Net neutral direct exposure (Indirect exposure only) Investment performance subject to smoothing through declared bonuses
Persistency risk to future shareholder transfers
SAIF sub-fund Net neutral direct exposure (Indirect exposure only) Asset management fees earned by M&G
Unit-linked business Net neutral direct exposure (Indirect exposure only) Investment performance through asset management fees
Persistency risk
Asset/liability mismatch risk
Shareholder-backed annuity business
Credit risk
Interest rate risk for assets in excess of liabilities i.e. representing shareholder capital
Mortality experience and assumptions for longevity

211F
INA
NC
IAL
S
TA
TE
ME
NT
SD
: LIF
E A
SSUR
AN
CE
B
USIN
ESSE
S
Market and credit risk
Type of business Investments/derivatives Liabilities/unallocated surplus Other exposure Insurance and lapse risk
US insurance operations (see also section D3(j))All business Currency risk Persistency risk
Variable annuity business Net effect of market risk arising from incidence of guarantee features and variability of asset management fees offset by derivative hedging programme
Fixed index annuity business
Derivative hedge programme to the extent not fully hedged against liability and fund performance
Incidence of equity participation features
Fixed index annuities, Fixed annuities and GIC business
Credit riskInterest rate risk
Spread difference between earned rate and rate credited to policyholders
Lapse risk but the effects of extreme events are mitigated by the use of swaption contracts
These risks are reflected in volatile profit or loss and shareholders’ equity for derivative value movements and impairment losses, and, in addition, for shareholders’ equity for value movements on fixed income securities classified as ‘available fo sale’ under IAS 39
Asian insurance operations (see also section D4(j))
All business Currency risk
Mortality and morbidity risk Persistency risk
With-profits business Net neutral direct exposure (Indirect exposure only) Investment performance subject to smoothing through declared bonuses
Unit-linked business Net neutral direct exposure (Indirect exposure only) Investment performance through asset management fees
Non-participating business
Interest rate and price risk Long-term interest rates .

212
Prudential plc Annual Report 2010
FINANCIAL STATEMENTS > NOTES ON THE GROUP FINANCIAL STATEMENTS
D: LIFE ASSURANCE BUSINESSESCONTINUED
D1: GROUP OVERVIEW > CONTINUED
ii IFRS shareholder results – Exposures for market and other risk Key Group exposuresDetailed analyses of sensitivity of IFRS basis profit or loss and equity to market and other risks are provided in notes D2(j), D3(j), D4(j) and E4. The sensitivity analyses provided show the effect on IFRS basis profit or loss and equity to changes in the relevant risk variables, all of which are reasonably possible at the relevant balance sheet date. The IFRS operating profit based on longer-term investment returns for UK insurance operations has high potential sensitivity for changes to longevity assumptions affecting the carrying value of liabilities to policyholders for shareholder-backed annuity business. In addition, at the total IFRS profit level the result is sensitive to temporary value movements on assets backing IFRS equity. For Jackson at the level of operating profit based on longer-term investment returns, the results are sensitive to market conditions to the extent of income earned on spread-based products not mitigated by the interest derivative programmes and second order equity-based exposure in respect of variable annuity asset management fees. Further information is given below under the US operations section of market and credit risk. Jackson’s derivative programme is used to substantially mitigate equity market risk attaching to its equity-based products and interest rate risk associated with its spread-based products. Movements in interest rates and credit spreads materially affect the carrying value of derivatives which are used to manage the liabilities to policyholders and backing investment assets of fixed annuity and other general account business. Combined with the use of US GAAP measurement (as grandfathered under IFRS 4) for the asset and liabilities for the insurance contract liabilities, which is largely insensitive to current period market movements, the Jackson total profit (i.e. including short-term fluctuations in investment returns) is very sensitive to market movements. In addition to these effects the Jackson IFRS equity is sensitive to the impact of interest rate and credit spread movements on the value of fixed income securities. Movements in unrealised appreciation on these securities are included as movement in equity (i.e. outside the income statement). See note D3(j) for details of the hedging. For Asian operations, the operating profit based on longer-term investment returns is mainly affected by the impact of market levels on unit-linked business persistency, and other insurance risk. At the total IFRS profit level the Asian result is affected by short-term value movements on the asset portfolio for non-linked shareholder-backed business. M&G profits are affected primarily by movements in the growth in funds under management and by the effect of any impairment on the loan book and fair value movements on debt securities held by Prudential Capital.
Market and credit riskUK insurance operationsWith-profits business
• With-profits businessShareholder results of UK with-profits business are sensitive to market risk only through the indirect effect of investment performance on declared policyholder bonuses. The investment assets of the PAC with-profits fund are subject to market risk. However, changes in their carrying value, net of related changes to asset-share liabilities of with-profit contracts, affect the level of unallocated surplus of the fund. As unallocated surplus is accounted for as a liability under IFRS, movements in its value do not affect shareholders’ profit or equity. The shareholder results of the UK with-profits fund correspond to the shareholders’ share of the cost of bonuses declared on the with-profits business. This currently corresponds to one-ninth of the cost of bonuses declared. Investment performance is a key driver of bonuses, and hence the shareholders’ share of cost of bonuses. Due to the ‘smoothed’ basis of bonus declaration the sensitivity to investment performance in a single year is low. However, over multiple periods it is important.
• Prudential Annuities Limited (PAL)PAL writes annuity business, but as PAL is owned by the PAC with-profits sub-fund, changes in the carrying value of PAL’s assets and liabilities are reflected in the liability for unallocated surplus which as described above, do not affect shareholder results.
• Scottish Amicable Insurance Fund (SAIF)SAIF is a ring-fenced fund in which, apart from asset management fees, shareholders have no interest. Accordingly, the Group’s IFRS profit and equity are insensitive to the direct effects of market risk attaching to SAIF’s assets and liabilities.

213F
INA
NC
IAL
S
TA
TE
ME
NT
SD
: LIF
E A
SSUR
AN
CE
B
USIN
ESSE
S
Shareholder-backed businessThe factors that may significantly affect the IFRS results of UK shareholder-backed business are the mortality experience and assumptions and credit risk attaching to the annuity business of Prudential Retirement Income Limited and the PAC non-profit sub-fund.
• Prudential Retirement Income Limited (PRIL)The assets covering PRIL’s liabilities are principally debt securities and other investments that are held to match the expected duration and payment characteristics of the policyholder liabilities. These liabilities are valued for IFRS reporting purposes by applying discount rates that reflect the market rates of return attaching to the covering assets. Except to the extent of any asset/liability duration mismatch which is reviewed regularly, and exposure to credit risk, the sensitivity of the Group’s results to market risk for movements in the carrying value of PRIL’s liabilities and covering assets is broadly neutral on a net basis. The main market risk sensitivity for PRIL arises from interest rate risk on the debt securities which substantially represent IFRS equity. This equity comprises the net assets held within the long-term fund of the Company that cover regulatory basis liabilities that are not recognised for IFRS reporting purposes, for example contingency reserves, and shareholder capital held outside the long-term fund. The principal items affecting the IFRS results for PRIL are mortality experience and assumptions, and credit risk.
• PAC non-profit sub-fundThe PAC non-profit sub-fund principally comprises annuity business previously written by Scottish Amicable Life, credit life, unit-linked and other non-participating business. The financial assets covering the liabilities for those types of business are subject to market risk. However, for the annuity business the same considerations as described above for PRIL apply, whilst the liabilities of the unit-linked business change in line with the matching linked assets. Other liabilities of the PAC non-profit sub-fund are broadly insensitive to market risk.
• Other shareholder-backed unit-linked businessDue to the matching of policyholder liabilities to attaching asset value movements, the UK unit-linked business is not directly affected by market or credit risk. The principal factor affecting the IFRS results is investment performance through asset management fees.
US insurance operations (Jackson)The IFRS basis results of Jackson are highly sensitive to market risk on the assets covering liabilities other than variable annuity business segregated in the separate accounts. Invested assets covering liabilities (other than the separate accounts) and related capital comprise principally debt securities classified as available-for-sale. Value movements for these securities are reflected as movements in shareholders’ equity through the statement of comprehensive income. Other invested assets and derivatives are carried at fair value with the value movements reflected in the income statement. By contrast, the IFRS insurance liabilities for business written by Jackson, by the application of grandfathered GAAP under IFRS 4, are measured on US GAAP bases which with the exception of certain items covered by the equity hedging programme, are generally insensitive to temporary changes in market conditions or the short-term returns on the attaching asset portfolios. These differences in carrying value of debt securities, other invested assets, derivatives and insurance liabilities give rise to potentially significant volatility in the IFRS income statement and shareholders’ equity. As with other shareholder-backed business the profit or loss for Jackson is presented in the Group’s segmental analysis of profit as described in note B1, by distinguishing the result for the year between an operating result based on longer-term investment returns and short-term fluctuations in investment returns. In this way the most significant direct effect of market changes that have taken place to the Jackson result are separately identified. Excluding these short-term effects, the factors that most significantly affect the Jackson IFRS operating result based on long-term investment returns are:
• Variable annuity business – the spread differential between the earned rate and the rate credited to policyholders on the general account funds and the effect of market movements on fees earned on separate account funds;
• Fixed annuity business – the spread differential between the earned rate and the rate credited to policyholders; and• Fixed index annuity business – the spread differential between the earned rate and the rate credited to policyholders.
In addition, the total profit for Jackson is affected by the level of impairment losses on the debt securities portfolio, net effect of market risk arising from the incidence and valuation of guarantee features, guaranteed benefit payments and equity index participation features, offset by variability of benefit related fees and equity derivative hedging performance, short-term value movements on derivatives held to manage the fixed annuity and other general account business, and other temporary value movements on portfolio investments classified as fair value through profit and loss. The Group has amended its presentation of operating profit for its US insurance operations to remove the net equity hedge accounting effect and include it in short-term fluctuations as explained further in note A4(d)(ii). Following this change the operating profit based on longer-term investment returns of the US insurance operations of £833 million for 2010 (2009: £618 million) excludes £367 million (2009: £159 million) negative net equity hedge accounting effects, net of related change to amortisation of deferred acquisition costs. The presentation of results for 2009 has been amended accordingly.

214
Prudential plc Annual Report 2010
FINANCIAL STATEMENTS > NOTES ON THE GROUP FINANCIAL STATEMENTS
D: LIFE ASSURANCE BUSINESSESCONTINUED
D1: GROUP OVERVIEW > CONTINUED
Asian insurance operationsFor Asian with-profits business the same features apply as described above for UK with-profits business. Similarly, as for other parts of the Group, for unit-linked business the main factor affecting IFRS basis results is investment performance through asset management fees. The sensitivity of the IFRS basis results of the Group’s Asian operations to market risk is primarily restricted to the non-participating business. This sensitivity is primarily reflected through the volatility of asset returns coupled with the fact that the accounting carrying value of liabilities to policyholders are only partially sensitive to changed market conditions. As for UK shareholder-backed operations and Jackson, the IFRS profit is distinguished in the Group’s segmental analysis so as to distinguish operating profits based on longer-term investment returns and short-term fluctuations in investment returns.
Insurance and lapse riskThe features described above cover the main sensitivities of IFRS profit and loss and equity for market, insurance and credit risk. Lapse and longevity risk may also be a key determination of IFRS basis results with variable impacts. In the UK, adverse persistency experience can affect the level of profitability from with-profits and unit-linked business. For with-profits business in any given year, the amount represented by the shareholders’ share of cost of bonus may only be marginally affected. However, altered persistency trends may affect future expected shareholder transfers. By contrast, Group IFRS operating profit is particularly sensitive to longevity outlook that results in changes of assumption for the UK shareholder-backed annuity business. Jackson is sensitive to lapse risk. However, Jackson uses certain swaption derivatives to ameliorate the effect of a sharp rise in interest rates, which would be the most likely cause of a sudden change in policyholder behaviour. In Asia, adverse persistency experience can impact the IFRS profitability of certain business written in the region. This risk is managed at a business unit level through monthly monitoring of experience and the implementation of management actions as necessary. These actions could include product enhancements, increased management focus on premium collection as well as other customer retention efforts. The potential financial impact of lapses is often mitigated through the specific features of the products, e.g. surrender charges.
iii Impact of diversification on risk exposureThe Group enjoys significant diversification benefits. This arises because not all risk scenarios will happen at the same time and across all geographic regions. The Group tests the sensitivities of results to different correlation factors such as:
Correlation across geographic regions• Financial risk factors• Non-financial risk factor
Correlation across risk factors• Longevity risk• Expenses• Persistency• Other risks
The effect of Group diversification is to significantly reduce the aggregate standalone volatility risk to IFRS operating profit based on longer-term investment returns. The effect is almost wholly explained by the correlations across risk types, in particular longevity risk.
f Duration of liabilitiesUnder the terms of the Group’s contracts, as for life assurance contracts generally, the contractual maturity date is the earlier of the end of the contract term, death, other insurable events or surrender. The Group has therefore chosen to provide details of liability duration that reflect the actuarially determined best estimate of the likely incidence of these factors on contract duration. Details are shown in sections D2(k), D3(k) and D4(k). In the years 2006 to 2010, claims paid on the Group’s life assurance contracts including those classified as investment contracts under IFRS 4 ranged from £15 billion to £18 billion. Indicatively, it is to be expected that, of the Group’s policyholder liabilities (excluding unallocated surplus) at 31 December 2010 of £214.7 billion, the amounts likely to be paid in 2011 will be of a similar magnitude.

215F
INA
NC
IAL
S
TA
TE
ME
NT
SD
: LIF
E A
SSUR
AN
CE
B
USIN
ESSE
S
D2: UK INSURANCE OPERATIONS
a Summary statement of financial positionIn order to reflect the different types of UK business and fund structure, the statement of financial position of the UK insurance operations may be analysed by the assets and liabilities of the Scottish Amicable Insurance Fund (SAIF), the PAC with-profits sub-fund (WPSF), unit-linked assets and liabilities and annuity (principally PRIL) and other business. The assets and liabilities of these funds and subsidiaries are shown in the table below.
£94.8 billion of the £141.4 billion of investments are held by SAIF and the PAC WPSF. Shareholders are exposed only indirectly to value movements on these assets.
PAC with-profits sub-fund note i Other funds and subsidiariesUK insurance
operations
ScottishAmicable
InsuranceFund
note ii£m
ExcludingPrudential
AnnuitiesLimited
£m
PrudentialAnnuities
Limitednote iii
£m
Totalnote iv
£m
Unit-linkedassets
and liabilities
£m
Annuityand otherlong-term
business£m
Total£m
2010 Total
£m
2009 Total
£m
ASSETSIntangible assets attributable to
shareholders: Deferred acquisition costs and other
intangible assets – – – – – 118 118 118 127
– – – – – 118 118 118 127
Intangible assets attributable to PAC with-profits fund:
In respect of acquired subsidiaries for venture fund and other investment purposes – 166 – 166 – – – 166 124
Deferred acquisition costs – 13 – 13 – – – 13 9
– 179 – 179 – – – 179 133
Total – 179 – 179 – 118 118 297 260
Deferred tax assets 2 93 14 107 – 105 105 214 292Other non-investment and
non-cash assets 412 1,810 322 2,132 557 1,532 2,089 4,633 3,074 Investments of long-term business
and other operations: Investment propertiesnote viii 673 7,589 731 8,320 745 1,474 2,219 11,212 10,861 Investments accounted for using the
equity method – – – – – 69 69 69 4 Financial investments: Loansnote v 153 979 138 1,117 – 1,032 1,032 2,302 1,815 Equity securities and portfolio
holdings in unit trusts 3,105 23,716 229 23,945 13,434 35 13,469 40,519 37,051 Debt securitiesnote D2c 4,704 29,013 12,785 41,798 6,045 21,757 27,802 74,304 67,772 Other investmentsnote vi 276 3,241 178 3,419 73 230 303 3,998 3,630 Deposits 793 6,038 435 6,473 498 1,258 1,756 9,022 11,557
Total investmentsnote b 9,704 70,576 14,496 85,072 20,795 25,855 46,650 141,426 132,690
Properties held for sale – 254 – 254 – – – 254 –Cash and cash equivalents 170 1,127 82 1,209 1,153 307 1,460 2,839 2,265
TOTAL ASSETS 10,288 74,039 14,914 88,953 22,505 27,917 50,422 149,663 138,581

216
Prudential plc Annual Report 2010
FINANCIAL STATEMENTS > NOTES ON THE GROUP FINANCIAL STATEMENTS
D: LIFE ASSURANCE BUSINESSESCONTINUED
D2: UK INSURANCE OPERATIONS > CONTINUED
PAC with-profits sub-fund note i Other funds and subsidiariesUK insurance
operations
ScottishAmicable
InsuranceFund
note ii£m
ExcludingPrudential
AnnuitiesLimited
£m
PrudentialAnnuities
Limitednote iii
£m
Totalnote iv
£m
Unit-linkedassets
and liabilities
£m
Annuityand otherlong-term
business£m
Total£m
2010 Total
£m
2009 Total
£m
EQUITY AND LIABILITIESEquityShareholders’ equity – – – – – 2,148 2,148 2,148 1,939Non-controlling interests – 35 – 35 – – – 35 28
Total equity – 35 – 35 – 2,148 2,148 2,183 1,967
LiabilitiesPolicyholder liabilities and unallocated
surplus of with-profits funds: Contract liabilities (including amounts
in respect of contracts classified as investment contracts under IFRS 4) 9,759 59,545 12,282 71,827 21,671 22,273 43,944 125,530 116,229
Unallocated surplus of with-profits funds (reflecting application of ‘realistic’ provisions for UK regulated with-profits funds)note vii – 8,363 1,824 10,187 – – – 10,187 9,966
Total 9,759 67,908 14,106 82,014 21,671 22,273 43,944 135,717 126,195
Operational borrowings attributable to shareholder-financed operations – – – – – 162 162 162 158Borrowings attributable to with-profits
funds 118 1,404 – 1,404 – – – 1,522 1,284Deferred tax liabilities 80 903 252 1,155 – 503 503 1,738 1,606Other non-insurance liabilities 331 3,789 556 4,345 834 2,831 3,665 8,341 7,371
Total liabilities 10,288 74,004 14,914 88,918 22,505 25,769 48,274 147,480 136,614
TOTAL EQUITY AND LIABILITIES 10,288 74,039 14,914 88,953 22,505 27,917 50,422 149,663 138,581
Notesi For the purposes of this table and subsequent explanation, references to the PAC WPSF also include, for convenience, the amounts attaching
to the Defined Charges Participating Sub-fund, which comprises 3.5 per cent of the total assets of WPSF and includes the with-profits annuity business transferred to Prudential from the Equitable Life Assurance Society on 1 December 2007 (with assets of approximately £1.7 billion). Profits to shareholders on this with-profits annuity business emerge on a ‘charges less expenses’ basis and policyholders are entitled to 100 per cent of the investment earnings.
ii SAIF is a separate sub-fund within the PAC long-term business fund.iii Wholly-owned subsidiary of the PAC WPSF that writes annuity business.iv Excluding policyholder liabilities of the Hong Kong branch of PAC.v The loans of the Group’s UK insurance operations of £2,302 million (2009: £1,815 million) comprise loans held by the PAC WPSF of £1,270 million
(2009: £1,106 million) and loans held by shareholder-backed business of £1,032 million (2009: £709 million). The loans held by the PAC WPSF comprise mortgage loans of £256 million, policy loans of £21 million and other loans of £993 million
(2009: £145 million, £24 million and £937 million respectively). The mortgage loans are collateralised by properties. Other loans held by the PAC with-profits fund are all commercial loans and comprise mainly syndicated loans.
The loans held by the UK shareholder-backed business comprise mortgage loans collateralised by properties of £1,027 million (2009: £702 million) and other loans of £5 million (2009: £7 million).

217F
INA
NC
IAL
S
TA
TE
ME
NT
SD
: LIF
E A
SSUR
AN
CE
B
USIN
ESSE
S
vi Other investments comprise:2010 £m 2009 £m
Derivative assets*(note G3) 926 910Partnerships in investment pools and other† 3,072 2,720
3,998 3,630
* In the UK, Prudential uses derivatives to reduce equity and credit risk, interest rate and currency exposures, and to facilitate efficient portfolio management. After derivative liabilities of £792 million (2009: £709 million), which are also included in the statement of financial position, the overall derivative position was a net asset of £134 million (2009: £201 million).
† Partnerships in investment pools and other comprise mainly investments held by the PAC with-profits fund. These investments are primarily venture fund investments and investment in property funds and limited partnerships.
vii Unallocated surplus of with-profits funds Prudential’s long-term business written in the UK comprises predominantly life insurance policies under which the policyholders are entitled
to participate in the returns of the funds supporting these policies. Business similar to this type is also written in certain of the Group’s Asian operations, subject to local market and regulatory conditions. Such policies are called with-profits policies. Prudential maintains with-profits funds within the Group’s long-term business funds, which segregate the assets and liabilities and accumulate the returns related to that with-profits business. The amounts accumulated in these with-profits funds are available to provide for future policyholder benefit provisions and for bonuses to be distributed to with-profits policyholders. The bonuses, both annual and final, reflect the right of the with-profits policyholders to participate in the financial performance of the with-profits funds. Shareholders’ profits with respect to bonuses declared on with-profits business correspond to the shareholders’ share of the cost of bonuses as declared by the PAC Board of directors. The shareholders’ share currently represents one-ninth of the cost of bonuses declared for with-profits policies.
The unallocated surplus represents the excess of assets over policyholder liabilities for the Group’s with-profits funds. As allowed under IFRS 4, the Group has opted to continue to record unallocated surplus of with-profits funds wholly as a liability. The annual excess (shortfall) of income over expenditure of the with-profits funds, after declaration and attribution of the cost of bonuses to policyholders and shareholders, is transferred to (from) the unallocated surplus each year through a charge (credit) to the income statement. The balance retained in the unallocated surplus represents cumulative income arising on the with-profits business that has not been allocated to policyholders or shareholders. The balance of the unallocated surplus is determined after full provision for deferred tax on unrealised appreciation on investments.
viii Investment properties At 31 December 2010, the Group’s UK insurance operations had £11,212 million (2009: £10,861 million) of investment properties. The following
table shows the property portfolio by type of investment. The properties are shown at market value below in accordance with the policies described in note A4.
2010 2009
£m % £m %
Office buildings 4,617 41.2 4,820 44.4Shopping centres/commercial 3,777 33.7 3,699 34.0Retail warehouses/industrial 2,184 19.5 1,780 16.4Development 402 3.6 20 0.2Other 232 2.0 542 5.0
Total 11,212 100.0 10,861 100.0 Approximately 46.2 per cent (2009: 42.4 per cent) of the UK held investment property is located in London and Southeast England including
Buckinghamshire, Berkshire, East and West Sussex, Hampshire, Isle of Wight, Kent, Oxfordshire and Surrey, with 36.7 per cent (2009: 39.8 per cent) located throughout the rest of the UK and the remaining 17.1 per cent (2009: 17.8 per cent) located overseas.

218
Prudential plc Annual Report 2010
FINANCIAL STATEMENTS > NOTES ON THE GROUP FINANCIAL STATEMENTS
D: LIFE ASSURANCE BUSINESSESCONTINUED
D2: UK INSURANCE OPERATIONS > CONTINUED
b Reconciliation of movement in investmentsA reconciliation of the total investments of UK insurance operations from the beginning of the year to the end of the year is as follows:
PAC with-profits sub-fundOther funds and
subsidiaries
ScottishAmicable
InsuranceFund
£m
ExcludingPrudential
AnnuitiesLimited
£m
PrudentialAnnuities
Limited£m
Total£m
Unit-linkedassets
and liabilities
£m
Annuityand otherlong-term
business£m
UK insurance
operationsTotal
£m
AT 1 JANUARY 2009 Total investments (including derivative assets) 10,438 62,814 13,329 76,143 15,571 19,710 121,862 Less: Investments held by consolidated investment funds – (145) – (145) (424) (40) (609) Less: Derivative liabilities (414) (2,331) (280) (2,611) (14) (362) (3,401)
Directly held investments, net of derivative liabilities 10,024 60,338 13,049 73,387 15,133 19,308 117,852
Net cash inflow (outflow) from operating activities (1,226) 507 (30) 477 258 1,923 1,432Realised gains (losses) in the year 165 554 (20) 534 (285) (306) 108Unrealised gains and losses and exchange movements
in the year 848 4,935 610 5,545 2,586 1,644 10,623Reclassification of property under development – 131 – 131 – – 131
Movement in the year of directly held investments, net of derivative liabilities (213) 6,127 560 6,687 2,559 3,261 12,294
AT 31 DECEMBER 2009/1 JANUARY 2010 Total investments (including derivative assets) 9,848 67,832 13,794 81,626 18,421 22,795 132,690 Less: Investments held by consolidated investment funds – (1,050) (19) (1,069) (729) (37) (1,835) Less: Derivative liabilitiesnote G3 (37) (317) (166) (483) – (189) (709)
Directly held investments, net of derivative liabilities 9,811 66,465 13,609 80,074 17,692 22,569 130,146
Net cash inflow (outflow) from operating activities (762) (838) (21) (859) 1,000 1,950 1,329Realised gains in the year 368 1,502 73 1,575 267 23 2,233Unrealised gains and losses and exchange movements
in the year 249 2,963 608 3,571 1,131 1,007 5,958Dilution of PruHealth investment – – – – – 56 56
Movement in the year of directly held investments, net of derivative liabilities (145) 3,627 660 4,287 2,398 3,036 9,576
AT 31 DECEMBER 2010 Total investments (including derivative assets) 9,704 70,576 14,496 85,072 20,795 25,855 141,426 Less: Investments held by consolidated investment funds – (140) (22) (162) (705) (45) (912) Less: Derivative liabilitiesnote G3 (38) (344) (205) (549) – (205) (792)
Directly held investments, net of derivative liabilities 9,666 70,092 14,269 84,361 20,090 25,605 139,722

219F
INA
NC
IAL
S
TA
TE
ME
NT
SD
: LIF
E A
SSUR
AN
CE
B
USIN
ESSE
S
c Reconciliation of movement in policyholder liabilities and unallocated surplus of with-profits fundsA reconciliation of the total policyholder liabilities and unallocated surplus of with-profits funds of UK insurance operations from the beginning of the year to the end of the year is as follows:
Other shareholder-backed funds and subsidiaries
SAIFand PAC
with-profitssub-fund
£m
Unit-linked
liabilities £m
Annuityand otherlong-term
business£m
UK insurance operations
Total£m
AT 1 JANUARY 2009 82,108 16,318 17,535 115,961Premiums 3,271 1,860 1,736 6,867Surrenders (2,394) (1,535) (42) (3,971)Maturities/Deaths (5,147) (670) (1,422) (7,239)
Net flowsnote a (4,270) (345) 272 (4,343)Shareholders transfers post-tax (202) – – (202)Switches (270) 270 – –Assumption changes (shareholder-backed business)note D2i, note c – – (46) (46)Investment-related items and other movementsnote b 9,365 2,849 1,904 14,118Foreign exchange translation differences 764 (57) – 707
AT 31 DECEMBER 2009/1 JANUARY 2010 87,495 19,035 19,665 126,195Comprising:– Policyholder liabilities 77,529 19,035 19,665 116,229 – Unallocated surplus of with-profits funds 9,966 – – 9,966
Premiums 3,311 2,301 2,278 7,890 Surrenders (2,453) (1,272) (54) (3,779)Maturities/Deaths (5,079) (726) (1,498) (7,303)
Net flowsnote a (4,221) 303 726 (3,192)Shareholders transfers post-tax (223) – – (223)Switches (236) 236 – –Assumption changes (shareholder-backed business)note D2i, note c – – (46) (46)Investment-related items and other movementsnote b 9,165 2,097 1,956 13,218 Dilution of holding in PruHealth – – (27) (27)Foreign exchange translation differences (207) – (1) (208)
AT 31 DECEMBER 2010 91,773 21,671 22,273 135,717 Comprising: – Policyholder liabilities 81,586 21,671 22,273 125,530 – Unallocated surplus of with-profits funds 10,187 – – 10,187
Average policyholder liabilities balances*
2010 79,558 20,353 20,969 120,880
2009 75,692 17,677 18,600 111,969
* Excluding the unallocated surplus of the with-profits funds and as adjusted for corporate transactions in the period.
Notesa Net flows of negative £3,192 million have improved from negative £4,343 million in 2009, principally as a result of increased premiums due to
bulk annuity transaction in 2010 and improved unit-linked flows.b Investment-related items and other movements of £13,218 million across fund types reflected the continued strong performance of UK equity
markets in 2010, as well as the continued increase in value of debt securities.c Assumption changes principally represent the net impact of changes to the mortality assumptions and expense assumptions.

220
Prudential plc Annual Report 2010
220 FINANCIAL STATEMENTS > NOTES ON THE GROUP FINANCIAL STATEMENTS
D: LIFE ASSURANCE BUSINESSESCONTINUED
D2: UK INSURANCE OPERATIONS > CONTINUED
d Information on credit risk of debt securitiesThe following table summarises by rating the securities held by UK insurance operations as at 31 December 2010 and 2009:
PAC with-profits sub-fund Other funds and subsidiariesUK insurance
operations
ScottishAmicable
InsuranceFund
£m
ExcludingPrudential
AnnuitiesLimited
£m
PrudentialAnnuities
Limited£m
Total£m
Unit-linkedassets
and liabilities
£mPRIL
£m
Otherannuity
and long-term
business£m
2010 Total
£m
2009 Total
£m
S&P – AAA 1,128 5,741 3,315 9,056 2,459 5,224 966 18,833 16,091S&P – AA+ to AA- 346 2,045 1,334 3,379 608 2,299 253 6,885 6,472S&P – A+ to A- 1,211 7,568 3,778 11,346 1,672 6,467 812 21,508 19,693S&P – BBB+ to BBB- 1,011 6,960 1,153 8,113 836 2,464 424 12,848 12,183S&P – Other 359 2,662 178 2,840 34 149 21 3,403 2,667
4,055 24,976 9,758 34,734 5,609 16,603 2,476 63,477 57,106
Moody’s – Aaa 78 428 56 484 80 93 30 765 463Moody’s – Aa1 to Aa 9 81 51 132 52 141 26 360 276Moody’s – A1 to A3 27 169 214 383 33 169 20 632 801Moody’s – Baa1 to Baa3 63 358 248 606 92 155 33 949 815Moody’s – Other 16 116 31 147 10 57 3 233 339
193 1,152 600 1,752 267 615 112 2,939 2,694
Fitch 28 207 118 325 48 208 21 630 1,022Other 428 2,678 2,309 4,987 121 1,622 100 7,258 6,950
Total debt securities 4,704 29,013 12,785 41,798 6,045 19,048 2,709 74,304 67,772
Where no external ratings are available, internal ratings produced by the Group’s asset management operation, which are prepared on the Company’s assessment of a comparable basis to external ratings, are used where possible. Of the £7,258 million total debt securities held in 2010 (2009: £6,950 million) which are not externally rated, £2,210 million were internally rated AAA to A-, £3,861 million were internally rated BBB to B- and £1,187 million were rated below B- or unrated (2009: £2,190 million, £3,445 million and £1,315 million respectively). The majority of unrated debt security investments were held in SAIF and the PAC with-profits fund and relate to convertible debt and other investments which are not covered by ratings analysts nor have an internal rating attributed to them. Of the £1,722 million PRIL and other annuity and long-term business investments which are not externally rated, £7 million were internally rated AAA, £92 million AA, £496 million A, £899 million BBB, £82 million BB and £146 million were internally rated B+ and below. As detailed in note D2(i) below, the primary sensitivity of IFRS basis profit or loss and shareholders’ equity relates to non-linked shareholder-backed business which covers ‘PRIL’ and ‘other annuity and long-term business’ in the table above.
e Products and guaranteesPrudential’s long-term products in the UK consist of life insurance, pension products and pension annuities. These products are written primarily in:
• One of three separate sub-funds of the PAC long-term fund, namely the with-profits sub-fund, SAIF, and the non-profit sub-fund;• Prudential Annuities Limited, which is owned by the PAC with-profits sub-fund;• Prudential Retirement Income Limited, a shareholder-owned subsidiary; or• Other shareholder-backed subsidiaries writing mainly non-profit unit-linked business.

221F
INA
NC
IAL
S
TA
TE
ME
NT
SD
: LIF
E A
SSUR
AN
CE
B
USIN
ESSE
S
i With-profits products and PAC with-profits sub-fundWithin the statement of financial position of UK insurance operations at 31 December 2010, as shown in note D2(a), there are policyholder liabilities and unallocated surplus of £82.0 billion (2009: £77.5 billion) that relate to the WPSF. These amounts include the liabilities and capital of Prudential Annuities Limited, a wholly-owned subsidiary of the fund. The WPSF mainly contains with-profits business but it also contains some non-profit business (unit-linked, term assurances and annuities). The WPSF’s profits are apportioned 90 per cent to its policyholders and 10 per cent to shareholders as surplus for distribution is determined via the annual actuarial valuation. The WPSF held a provision of £24 million at 31 December 2010 (2009: £31 million) to honour guarantees on a small amount of guaranteed annuity products. SAIF’s exposure to guaranteed annuities is described below. Beyond the generic guarantees described above, there are very few explicit options or guarantees such as minimum investment returns, surrender values or annuities at retirement and any granted have generally been at very low levels. With-profits products provide returns to policyholders through bonuses that are ‘smoothed’. There are two types of bonuses: ‘annual’ and ‘final’. Annual bonuses are declared once a year, and once credited, are guaranteed in accordance with the terms of the particular product. Unlike annual bonuses, final bonuses are guaranteed only until the next bonus declaration. The main factors that influence the determination of bonus rates are the return on the investments of the with-profits fund, inflation, taxation, the expenses of the fund chargeable to policyholders and the degree to which investment returns are smoothed. The overall rate of return earned on investments and the expectation of future investment returns are the most important influences on bonus rates. A high proportion of the assets backing the with-profits business are invested in equities and real estate. If the financial strength of the with-profits business is affected, then a higher proportion of fixed interest or similar assets might be held by the fund. Further details on the determination of the two types of the bonuses: ‘regular’ and ‘final’, the application of significant judgement, key assumptions and the degree of smoothing of investment returns in determining the bonus rates are provided below.
Regular bonus ratesFor regular bonuses, the bonus rates are determined for each type of policy primarily by targeting the bonus level at a prudent proportion of the long-term expected future investment return on underlying assets. The expected future investment return is reduced as appropriate for each type of policy to allow for items such as expenses, charges, tax and shareholders’ transfers. However, the rates declared may differ by product type, or by the date of payment of the premium or date of issue of the policy or if the accumulated annual bonuses are particularly high or low relative to a prudent proportion of the achieved investment return. When target bonus levels change the PAC Board has regard to the overall strength of the long-term fund when determining the length of time over which it will seek to achieve the amended prudent target bonus level. In normal investment conditions, PAC expects changes in regular bonus rates to be gradual over time, and these are not expected to exceed one per cent per annum over any year. However, the PAC directors retain the discretion whether or not to declare a regular bonus each year, and there is no limit on the amount by which regular bonus rates can change.
Final bonus ratesA final bonus which is normally declared yearly, may be added when a claim is paid or when units of a unitised product are realised. The rates of final bonus usually vary by type of policy and by reference to the period, usually a year, in which the policy commences or each premium is paid. These rates are determined by reference to the asset shares for the sample policies but subject to the smoothing approach, explained below. In general, the same final bonus scale applies to maturity, death and surrender claims except that:
• The total surrender value may be impacted by the application of a Market Value Reduction – MVR – (for accumulating with-profits policies) and is affected by the surrender bases (for conventional with-profits business); and
• For the SAIF and Scottish Amicable Life (SAL), the final bonus rates applicable on surrender may be adjusted to reflect expected future bonus rates.
Application of significant judgementThe application of the above method for determining bonuses requires the PAC Board of directors to apply significant judgement in many respects, including in particular the following:
• Determining what constitutes fair treatment of customers: Prudential is required by UK law and regulation to consider the fair treatment of its customers in setting bonus levels. The concept of determining what constitutes fair treatment, while established by statute, is not defined.
• Smoothing of investment returns: This is an important feature of with-profits products. Determining when particular circumstances, such as a significant rise or fall in market values, warrant variations in the standard bonus smoothing limits that apply in normal circumstances requires the PAC Board to exercise significant judgement.
• Determining at what level to set bonuses to ensure that they are competitive: The overall return to policyholders is an important competitive measure for attracting new business.

222
Prudential plc Annual Report 2010
FINANCIAL STATEMENTS > NOTES ON THE GROUP FINANCIAL STATEMENTS
D: LIFE ASSURANCE BUSINESSESCONTINUED
D2: UK INSURANCE OPERATIONS > CONTINUED
Key assumptionsAs noted above, the overall rate of return on investments and the expectation of future investment returns are the most important influences in bonus rates, subject to the smoothing described below. Prudential determines the assumptions to apply in respect of these factors, including the effects of reasonably likely changes in key assumptions, in the context of the overarching discretionary and smoothing framework that applies to its with-profits business as described above. As such, it is not possible to specifically quantify the effects of each of these assumptions or of reasonably likely changes in these assumptions. Prudential’s approach, in applying significant judgement and discretion in relation to determining bonus rates, is consistent conceptually with the approach adopted by other firms that manage a with-profits business. It is also consistent with the requirements of UK law, which require all UK firms that carry out a with-profits business to define, and make publicly available, the Principles and Practices of Financial Management (PPFM) that are applied in the management of their with-profits funds. Accordingly, Prudential’s PPFM contains an explanation of how it determines regular and final bonus rates within the discretionary framework that applies to all with-profits policies, subject to the general legislative requirements applicable. The purpose of Prudential’s PPFM is therefore to:
• explain the nature and extent of the discretion available;• show how competing or conflicting interests or expectations of:
– different groups and generations of policyholders; and – policyholders and shareholders are managed so that all policyholders and shareholders are treated fairly; and
• provide a knowledgeable observer (e.g. a financial adviser) with an understanding of the material risks and rewards from starting and continuing to invest in a with-profits policy with Prudential.
Furthermore, in accordance with industry-wide regulatory requirements, the PAC Board has appointed:
• an Actuarial Function Holder who provides the PAC Board with all actuarial advice;• a With-Profits Actuary whose specific duty is to advise the PAC Board on the reasonableness and proportionality of the manner in
which its discretion has been exercised in applying the PPFM and the manner in which any conflicting interests have been addressed; and
• a With-Profits Committee of independent individuals, which assesses the degree of compliance with the PPFM and the manner in which conflicting rights have been addressed.
Smoothing of investment returnIn determining bonus rates for the UK with-profits policies, smoothing is applied to the allocation of the overall earnings of the UK with-profits fund of which the investment return is a significant element. The smoothing approach differs between accumulating and conventional with-profits policies to reflect the different contract features. In normal circumstances, Prudential does not expect most payout values on policies of the same duration to change by more than 10 per cent up or down from one year to the next, although some larger changes may occur to balance payout values between different policies. Greater flexibility may be required in certain circumstances, for example following a significant rise or fall in market values, and in such situations the PAC Board may decide to vary the standard bonus smoothing limits in order to protect the overall interests of policyholders. The degree of smoothing is illustrated numerically by comparing in the following table the relatively ‘smoothed’ level of policyholder bonuses declared as part of the surplus for distribution with the more volatile movement in investment return and other items of income and expenditure of the UK component of the PAC with-profits fund for each year presented.

223F
INA
NC
IAL
S
TA
TE
ME
NT
SD
: LIF
E A
SSUR
AN
CE
B
USIN
ESSE
S
2010 £m 2009 £m
Net income of the fund:Investment return 8,815 10,461Claims incurred (6,390) (6,253)Movement in policyholder liabilities (4,301) (3,692)Add back policyholder bonuses for the year (as shown below) 2,019 1,827Claims incurred and movement in policyholder liabilities (including charge for provision for asset shares and excluding policyholder bonuses) (8,672) (8,118)Earned premiums, net of reinsurance 3,148 3,063Other income 9 (2)Acquisition costs and other expenditure (600) (842)Tax (charge) (528) (640)
Net income of the fund before movement in unallocated surplus 2,172 3,922Movement in unallocated surplus 70 (1,893)
Surplus for distribution 2,242 2,029
Surplus for distribution allocated as follows:– 90% policyholders bonus (as shown above) 2,019 1,827– 10% shareholders’ transfers 223 202
2,242 2,029
ii Annuity businessPrudential’s conventional annuities include level, fixed-increase and retail price index (RPI) annuities. They are mainly written within the subsidiaries PAL, PRIL, Prudential Pensions Limited and the PAC with-profits sub-fund, but there are some annuity liabilities in the non-profit sub-fund and SAIF. Prudential’s fixed-increase annuities incorporate automatic increases in annuity payments by fixed amounts over the policyholder’s life. The RPI annuities that Prudential offers provide for a regular annuity payment to which an additional amount is added periodically based on the increase in the UK RPI. Prudential’s with-profits annuities, which are written in the WPSF, combine the income features of annuity products with the investment smoothing features of with-profits products and enable policyholders to obtain exposure to investment return on the WPSF’s equity shares, property and other investment categories over time. Policyholders select a ‘required smoothed return bonus’ from the specific range Prudential offers for the particular product. The amount of the annuity payment each year depends upon the relationship between the required smoothed return bonus rate selected by the policyholder when the product is purchased and the smoothed return bonus rates Prudential subsequently declares each year during the term of the product. If the total bonus rates fall below the anticipated rate, then the annuity income falls. At 31 December 2010, £35.6 billion (2009: £32.3 billion) of investments relate to annuity business of PAL and PRIL. These investments are predominantly in debt securities (including retail price index-linked bonds to match retail price index-linked annuities), loans and deposits and are duration matched with the estimated duration of the liabilities they support.
iii SAIFSAIF is a ring-fenced sub-fund of the PAC long-term fund formed following the acquisition of the mutually owned Scottish Amicable Life Assurance Society in 1997. No new business may be written in SAIF, although regular premiums are still being paid on policies in force at the time of the acquisition and incremental premiums are permitted on these policies. The fund is solely for the benefit of policyholders of SAIF. Shareholders have no interest in the profits of this fund although they are entitled to asset management fees on this business. The process for determining policyholder bonuses of SAIF with-profits policies, which constitute the vast majority of obligations of the funds, is similar to that for the with-profits policies of the WPSF. However, in addition, the surplus assets in SAIF are allocated to policies in an orderly and equitable distribution over time as enhancements to policyholder benefits i.e. in excess of those based on asset share. Provision is made for the risks attaching to some SAIF unitised with-profits policies that have MVR-free dates and for those SAIF products which have a guaranteed minimum benefit on death or maturity of premiums accumulated at four per cent per annum. The Group’s main exposure to guaranteed annuities in the UK is through SAIF and a provision of £336 million was held in SAIF at 31 December 2010 (2009: £284 million) to honour the guarantees. As SAIF is a separate sub-fund solely for the benefit of policyholders of SAIF this provision has no impact on the financial position of the Group’s shareholders’ equity.
224
Prudential plc Annual Report 2010
FINANCIAL STATEMENTS > NOTES ON THE GROUP FINANCIAL STATEMENTS
D: LIFE ASSURANCE BUSINESSESCONTINUED
D2: UK INSURANCE OPERATIONS > CONTINUED
iv Unit-linked (non-annuity) and other non-profit businessPrudential UK insurance operations also have an extensive book of unit-linked policies of varying types and provide a range of other non-profit business such as credit life and protection contracts. These contracts do not contain significant financial guarantees. There are no guaranteed maturity values or guaranteed annuity options on unit-linked policies except for minor amounts for certain policies linked to cash units within SAIF.
f Exposure to market riski Non-linked life and pension businessFor with-profits business, the absence of guaranteed surrender values and the flexibility given by the operation of the bonus system means that a high proportion of the investments backing the with-profits business are in equities and real estate with the balance in debt securities, deposits and loans. The investments supporting the protection business are small in value and tend to be assets of a fixed term duration reflecting the guaranteed nature of the liabilities.
ii Pension annuity businessPrudential’s UK annuity business mainly employs fixed income investments (including UK retail price index-linked assets) because the liabilities consist of guaranteed payments for as long as each annuitant or surviving partner is alive. Retail price index-linked assets are used to back pension annuities where the payments are linked to the RPI.
iii Unit-linked businessExcept through the second order effect on asset management fees, the unit-linked business of the UK insurance operations is not exposed to market risk. The lack of exposure arises from the contract nature whereby policyholder benefits reflect asset value movements of the unit-linked funds. g Process for setting assumptions and determining contract liabilitiesi OverviewThe calculation of the contract liabilities involves the setting of assumptions for future experience. This is done following detailed review of the relevant experience including, in particular, mortality, expenses, tax, economic assumptions and where applicable, persistency. For with-profits business written in the WPSF or SAIF, a market consistent valuation is performed (as described in section (ii) below). Additional assumptions required are for persistency and the management actions under which the fund is managed. Assumptions used for a market consistent valuation typically do not contain margins, whereas those used for the valuation of other classes of business do. Mortality assumptions are set based on the results of the most recent experience analysis looking at the experience over recent years of the relevant business. For non-profit business, a margin for adverse deviation is added. Different assumptions are applied for different product groups. For annuitant mortality, assumptions for current mortality rates are based on recent experience investigations and expected future improvements in mortality. The expected future improvements are based on recent experience and projections of the business and industry experience generally. Maintenance and, for some classes of business, termination expense assumptions are expressed as per policy amounts. They are set based on the expenses incurred during the year, including an allowance for ongoing investment expenditure and allocated between entities and product groups in accordance with the operation’s internal cost allocation model. For non-profit business a margin for adverse deviation is added to this amount. Expense inflation assumptions are set consistent with the economic basis and based on the difference between yields on nominal gilts and index-linked gilts. The actual renewal expenses incurred on behalf of SAIF by other Group companies are recharged in full to SAIF. The assumptions for asset management expenses are based on the charges specified in agreements with the Group’s asset management operations, plus a margin for adverse deviation for non-profit business. Tax assumptions are set equal to current rates of taxation. For non-profit business excluding unit-linked business, the valuation interest rates used to discount the liabilities are based on the yields as at the valuation date on the assets backing the technical provisions. For fixed interest securities the gross redemption yield is used except for the PAL and PRIL annuity business where the internal rate of return of the assets backing the liabilities is used. Properties are valued using the rental yield, and for equities it is the greater of the dividend yield and the average of the dividend yield and the earnings yield. An adjustment is made to the yield on non risk-free fixed interest securities and property to reflect credit risk. To calculate the non-unit reserves for linked business, assumptions have been set for the gross unit growth rate and the rate of inflation of maintenance expenses, as well as for the valuation interest rate as described above.

225F
INA
NC
IAL
S
TA
TE
ME
NT
SD
: LIF
E A
SSUR
AN
CE
B
USIN
ESSE
S
ii WPSF and SAIFThe policyholder liabilities reported for the WPSF are primarily for two broad types of business. These are accumulating and conventional with-profits contracts. The policyholder liabilities of the WPSF are accounted for under FRS 27. The provisions have been determined on a basis consistent with the detailed methodology included in regulations contained in the FSA’s rules for the determination of reserves on the FSA’s ‘realistic’ Peak 2 basis. In aggregate, the regime has the effect of placing a value on the liabilities of UK with-profits contracts, which reflects the amounts expected to be paid based on the current value of investments held by the with-profits funds and current circumstances. These contracts are a combination of insurance and investment contracts with discretionary participation features, as defined by IFRS 4. The FSA’s Peak 2 calculation under the realistic regime requires the value of liabilities to be calculated as:
• The with-profits benefits reserve (WPBR); plus• future policy related liabilities (FPRL); plus• the realistic current liabilities of the fund.
The WPBR is primarily based on the retrospective calculation of accumulated asset shares but is adjusted to reflect future expected policyholder benefits and other outgoings. Asset shares are calculated as the accumulation of all items of income and outgo that are relevant to each policy type. Income comprises credits for premiums, investment returns (including unrealised gains), and miscellaneous profits. Outgo comprises charges for tax (including an allowance for tax on unrealised gains), guarantees and smoothing, mortality and morbidity, shareholders’ profit transfers, miscellaneous losses, and expenses and commission (net of any tax relief). The FPRL must include a market consistent valuation of costs of guarantees, options and smoothing, less any related charges, and this amount must be determined using either a stochastic approach, hedging costs or a series of deterministic projections with attributed probabilities. The assumptions used in the stochastic models are calibrated to produce risk-free returns on each asset class. Volatilities of, and correlations between, investment returns from different asset classes are as determined by the Group’s Portfolio Management Group and aim to be market consistent. The cost of guarantees, options and smoothing is very sensitive to the bonus, market value reduction (MVR), and investment policy employed and therefore the stochastic modelling incorporates a range of management actions that would help to protect the fund in adverse investment scenarios. Substantial flexibility has been included in the modelled management actions in order to reflect the discretion that is retained in adverse investment conditions, thereby avoiding the creation of unreasonable minimum capital requirements. The management actions assumed are consistent with the Group’s management policy for with-profits funds and the Group’s disclosures in the publicly available PPFM. The contract liabilities for with-profits business also require assumptions for persistency. These are set based on the results of recent experience analysis.
iii Annuity businessCredit risk provisionsFor IFRS reporting, the results for UK shareholder-backed annuity business are particularly sensitive to the allowances made for credit risk. The allowance is reflected in the deduction from the valuation rate of interest for discounting projected future annuity payments to policyholders that would have otherwise applied. Since mid-2007 there has been a significant increase in the actual and perceived credit risk associated with corporate bonds as reflected in the significant widening that has occurred in corporate bond spreads. Although bond spreads over swap rates have narrowed from their peak in March 2009, they are still high compared with the levels seen in the years immediately preceding the start of the dislocated markets in 2007. The allowance that should therefore be made for credit risk remains a particular area of judgement.
The additional yield received on corporate bonds relative to swaps can be broken into the following constituent parts:
(a) the expected level of future defaults;(b) the credit risk premium that is required to compensate for the potential volatility in default levels; (c) the liquidity premium that is required to compensate for the lower liquidity of corporate bonds relative to swaps; and(d) the mark to market risk premium that is required to compensate for the potential volatility in corporate bond spreads (and hence
market values) at the time of sale.
The sum of (c) and (d) is often referred to as ‘liquidity premium’. The credit risk allowance is a function of the asset mix and the credit quality of the underlying portfolio. At 31 December 2010, 84 per cent (2009: 80 per cent) of the assets backing the UK shareholder annuity and other business were debt securities as shown in D2 (a). This comprises both government and corporate bonds. Government bonds are generally given a credit default allowance of zero. For corporate bonds the credit allowance varies by credit rating. An analysis of the credit ratings of debt securities is included in note D2 (d). Given that the normal business model for Prudential’s annuity business is to hold bonds to match long-term liabilities, the valuation rate that is applied to discount the future annuity payments includes a liquidity premium that reflects the residual element of current bond spreads over swap rates after providing for the credit risk.

226
Prudential plc Annual Report 2010
FINANCIAL STATEMENTS > NOTES ON THE GROUP FINANCIAL STATEMENTS
D: LIFE ASSURANCE BUSINESSESCONTINUED
D2: UK INSURANCE OPERATIONS > CONTINUED
Historically, until the second half of 2007, when corporate bond spreads widened significantly, the allowance for credit risk was calculated as the long-term expected defaults and a long-term credit risk premium. This long-term credit risk was supplemented by a short-term allowance from 31 December 2007 to allow for the concern that credit ratings applied by the rating agencies may be downgraded and defaults in the short-term might be higher than the long-term assumptions. The weighted components of the bond spread over swap rates for shareholder-backed fixed and linked annuity business for PRIL at 31 December 2010, 2009 and 2008, based on the asset mix at the relevant balance sheet date are shown below.
2010
31 December 2010
Pillar I Regulatory basis (bps)
Adjustment from regulatory to IFRS basis (bps) note v
IFRS (bps)
Bond spread over swap ratesnote i 160 – 160
Credit risk allowance Long-term expected defaultsnote ii 16 – 16 Long-term credit risk premiumnote iii 10 – 10 Short-term allowance for credit risknote iv 42 (26) 16
Total credit risk allowance 68 (26) 42
Liquidity premium 92 26 118
2009
31 December 2009
Pillar I Regulatory basis (bps)
Adjustment from regulatory to IFRS basis (bps) note v
IFRS (bps)
Bond spread over swap ratesnote i 175 – 175
Credit risk allowance Long-term expected defaultsnote ii 19 – 19 Long-term credit risk premiumnote iii 13 – 13 Short-term allowance for credit risknote iv 39 (24) 15
Total credit risk allowance 71 (24) 47
Liquidity premium 104 24 128

227F
INA
NC
IAL
S
TA
TE
ME
NT
SD
: LIF
E A
SSUR
AN
CE
B
USIN
ESSE
S
2008
31 December 2008
Pillar I Regulatory basis (bps)
Adjustment from regulatory to IFRS basis (bps) note v
IFRS (bps)
Bond spread over swap ratesnote i 323 – 323
Credit risk allowance Long-term expected defaultsnote ii 15 – 15 Long-term credit risk premiumnote iii 11 – 11 Short-term allowance for credit risknote iv 54 (25) 29
Total credit risk allowance 80 (25) 55
Liquidity premium 243 25 268
Notes(i) Bond spread over swap rates reflect market observed data.(ii) For the valuations prior to 31 December 2010, long-term expected defaults were derived by applying Moody’s data from 1970 to 2004 uplifted by
between 100 per cent (B) and 200 per cent (AAA) according to credit rating on the annuity asset portfolio. The credit rating assigned to each asset held was based on external credit rating and for this purpose the credit rating assigned to each asset held was the lowest credit rating published by Moody’s, Standard and Poors and Fitch.
For the 31 December 2010 valuation, long-term expected defaults are derived by applying Moody’s data from 1970 to 2009 and the definition of the credit rating used has been revised from the lowest credit rating to the second highest credit rating published by Moody’s, Standard and Poors and Fitch.
(iii) For the valuations prior to 31 December 2010, the long-term credit risk premium provides compensation against the risk of potential volatility in the level of defaults and is derived by applying the 95th percentile from Moody’s data from 1970 to 2004 to the annuity asset portfolio. For the 31 December 2010 valuation, the long-term credit risk premium is derived from Moody’s data from 1970 to 2009.
The combined effect of this change and the changes described in (ii) above is neutral on the long-term credit risk allowance for PRIL.(iv) The short-term allowance for credit risk assumed in the Pillar 1 solvency valuations at 31 December 2008 was determined as 25 per cent of the
increase in corporate bond spreads (as estimated from the movements in published corporate bond indices) since 31 December 2006. Subsequent to this date movements have reflected events in the period, namely the impact of credit migration, the decision not to release favourable default experience, new business and asset trading amongst other items. This is demonstrated by the analyses below.
(v) The very prudent Pillar 1 regulatory basis reflects the overriding objective of ensuring sufficient provisions and capital to ensure payments to policyholders can be made. The approach for IFRS aims to establish liabilities that are closer to ‘best estimate’. IFRS default assumptions are therefore set between the EEV and Pillar I assumptions.
Factors affecting the credit risk allowance at 31 December 2010The main factors influencing the credit risk allowance at 31 December 2010 are as follows:
a Credit downgrades and default experienceThe credit risk allowances have been adjusted during 2010 to take account of emerging downgrade and default experience. Experience in relation to changes in credit rating has improved in 2010 and no assets defaulted for the PRIL business during the year. The allowance for short-term downgrades has been reduced to offset the impact of credit downgrades on the long-term assumptions. In addition, the allowance for short-term defaults has been updated to eliminate any experience profits that would otherwise have arisen due to default experience being better than allowed for in the opening reserves.
b Asset tradingSince the second half of 2009, the Group started trading out of subordinated financial debt into higher quality assets. The continuation of the reduction in the subordinated financial debt holdings in 2010 improved the overall credit quality of the corporate bond portfolio and so allowed for a release of long-term credit reserves. On a Pillar 1 basis this transaction had no overall impact on the solvency surplus of PRIL, the PAC non-participating sub-fund and PAL. On an IFRS basis, the reduction in subordinated financial debt holdings generated a pre-tax IFRS operating loss of £4 million (2009: loss of £51 million).
c Asset purchases in respect of new businessSimilar to 2009, the assets purchased during 2010 to back new business have been of better average credit quality than the assets held at 31 December 2008, in particular no subordinated bank debt or sub-investment grade assets have been bought to back new business. As a result of the lower credit risk of the new business assets the overall allowance for credit risk required at 31 December 2010 is reduced when the new business assets and in-force assets are aggregated together.

228
Prudential plc Annual Report 2010
FINANCIAL STATEMENTS > NOTES ON THE GROUP FINANCIAL STATEMENTS
D: LIFE ASSURANCE BUSINESSESCONTINUED
D2: UK INSURANCE OPERATIONS > CONTINUED
d Overall impact on the PRIL credit risk allowanceAfter taking account of the factors noted above the movement on the average basis points allowances for PRIL on the Pillar 1 regulatory and IFRS bases are as follows:
Pillar 1 Regulatory basis (bps)
IFRS (bps)
Long-term Short-term Total Long-term Short-term Total
Total allowance for credit risk at 31 December 2009 32 39 71 32 15 47
Credit downgrades 1 (1) – 1 (1) – Retention of surplus from favourable default
experience – 7 7 – 3 3 Asset trading (5) – (5) (5) – (5)New business – (2) (2) – (1) (1)Other (2) (1) (3) (2) – (2)
Total allowance for credit risk at 31 December 2010 26 42 68 26 16 42
Overall this has led to the credit allowance for Pillar 1 purposes to be 43 per cent (2009: 41 per cent) of the bond spread over swap rates. For IFRS purposes it represents 26 per cent (2009: 27 per cent) of the bond spread over swap rates. The reserves for credit risk allowance at 31 December 2010 for UK shareholder annuity fund were as follows:
Pillar 1 Regulatory basis £bn
IFRS £bn
Long-term Short-term Total Long-term Short-term Total
PRIL 0.6 1.0 1.6 0.6 0.4 1.0 PAC non-profit sub-fund 0.1 0.1 0.2 0.1 – 0.1
Total 0.7 1.1 1.8 0.7 0.4 1.1
MortalityThe mortality assumptions are set in light of recent population and internal experience. The assumptions used are percentages of standard actuarial mortality tables with an allowance for future mortality improvements. Where annuities have been sold on an enhanced basis to impaired lives an additional age adjustment is made. The percentages of the standard table used are selected according to the source of business. In 2009, Prudential’s annuity business liabilities were determined using the Continuous Mortality Investigation (‘CMI’) medium cohort projections with a floor. In November 2009 a new mortality projection model was released by the CMI. This model is expected to become the new industry standard. The new model has been applied in determining the 2010 results with calibration to reflect an appropriate view of future mortality improvement. In recognition of the trend in assumed mortality improvements the Company has in previous years included margins in its annuity liabilities. In determining the 2010 results the appropriate level of these margins has been reassessed. See note D2 (i) below for the net effect of applying the new model, releases of margin, and changes to other related mortality assumptions.

229F
INA
NC
IAL
S
TA
TE
ME
NT
SD
: LIF
E A
SSUR
AN
CE
B
USIN
ESSE
S
The tables and range of percentages used are set out in the following tables:
PAL PRIL
2010 Males Females Males Females
In payment
In deferment
92% – 98% PCMA00 with future improvements in line with Prudential’s own calibration of the CMI 2009 mortality model, with a long-term improvement rate of 2.25%
AM92 minus 4 years
88% – 100% PCFA00 with future improvements in line with Prudential’s own calibration of the CMI 2009 mortality model, with a long-term improvement rate of 1.25%
AF92 minus 4 years
94% – 95% PCMA00 with future improvements in line with Prudential’s own calibration of the CMI 2009 mortality model, with a long-term improvement rate of 2.25%
AM92 minus 4 years
86% – 97% PCFA00 with future improvements in line with Prudential’s own calibration of the CMI 2009 mortality model, with a long-term improvement rate of 1.25%
AF92 minus 4 years
PAL PRIL
2009 Males Females Males Females
In payment
In deferment
102% – 126% PNMA00 (C = 2000) with medium cohort improvement table with a minimum annual improvement of 2.25% up to age 90, tapering to zero at age 120
AM92 minus 4 years
84% – 117% PNFA00 (C = 2000) with 75% of medium cohort improvement table with a minimum annual improvement of 1.25% up to age 90, tapering to zero at age 120
AF92 minus 4 years
96% – 102% PNMA00 (C = 2000) with medium cohort improvement table with a minimum annual improvement of 2.25% up to age 90, tapering to zero at age 120
AM92 minus 4 years
87% – 98% PNFA00 (C = 2000) with 75% of medium cohort improvement table with a minimum annual improvement of 1.25% up to age 90, tapering to zero at age 120
AF92 minus 4 years
PAL PRIL
2008 Males Females Males Females
In payment
In deferment
102% – 126% PNMA00 (C = 2000) with medium cohort improvement table with a minimum annual improvement of 2.25% up to age 90, tapering to zero at age 120
AM92 minus 4 years
84% – 117% PNFA00 (C = 2000) with 75% of medium cohort improvement table with a minimum annual improvement of 1.25% up to age 90, tapering to zero at age 120
AF92 minus 4 years
97% – 102% PNMA00 (C = 2000) with medium cohort improvement table with a minimum annual improvement of 2.25% up to age 90, tapering to zero at age 120
AM92 minus 4 years
88% – 98% PNFA00 (C = 2000) with 75% of medium cohort improvement table with a minimum annual improvement of 1.25% up to age 90, tapering to zero at age 120
AF92 minus 4 years
iv Unit-linked (non-annuity) and other non-profit businessThe majority of other long-term business written in the UK insurance operations is unit-linked business or other business with similar features. For these contracts the attaching liability reflects the unit value obligation and provision for expenses and mortality risk. The latter component is determined by applying mortality assumptions on a basis that is appropriate for the policyholder profile. For unit-linked business, the assets covering unit liabilities are exposed to market risk, but the residual risk when considering the unit-linked liabilities and assets together is limited to the effect on fund-based charges. For those contracts where the level of insurance risk is insignificant the assets and liabilities arising under the contracts are distinguished between those that relate to the financial instrument liability and acquisition costs and deferred income that relate to the component of the contract that relates to investment management. Acquisition costs and deferred income are recognised consistent with the level of service provision in line with the requirements of IAS 18.

230
Prudential plc Annual Report 2010
FINANCIAL STATEMENTS > NOTES ON THE GROUP FINANCIAL STATEMENTS
D: LIFE ASSURANCE BUSINESSESCONTINUED
D2: UK INSURANCE OPERATIONS > CONTINUED
h ReinsuranceThe Group’s UK insurance business cedes only minor amounts of business outside the Group. During 2010, reinsurance premiums for externally ceded business were £128 million (2009: £122 million) and reinsurance recoverable insurance assets were £608 million (2009: £502 million) in aggregate. The gains and losses recognised in profit and loss for the 2010 contracts were immaterial. During 2009 the Group’s UK insurance business wrote a longevity swap on certain aspects of the UK’s annuity back-book liabilities. This resulted in a one-off benefit of £34 million to IFRS profit before tax in 2009. The gains and losses recognised in profit and loss for other contracts in 2009 were immaterial.
i Effect of changes in assumptions used to measure insurance assets and liabilities2010Credit riskThe approach to reserving for credit risk is set out in note D2(g)(iii). Other operating assumption changesNote D2(g)(iii) above explains the application of a new mortality projection model in 2010 to determine the Prudential’s annuity business. The net effect of applying the new model, releases of margins and changes to other related mortality assumptions for shareholder-backed business is a credit of £8 million. With a £38 million benefit from altered expense assumptions the overall credit for shareholder-backed business is £46 million. For the with-profits sub-fund, the aggregate effect of assumption changes in 2010 was a net charge to unallocated surplus of £62 million, relating to changes in mortality, expense, persistency and economic assumptions.
2009Credit riskThe approach to reserving for credit risk is set out in note D2(g)(iii).
Other operating assumptions changesOverall mortality experience was in line with expectations and no change was therefore required to the overall strength of mortality assumptions at 31 December 2009. For the shareholder-backed business, the aggregate effect of assumption changes in 2009 was a net credit to the shareholder result of £46 million, primarily related to changes to the deflation reserve, expense assumptions and modelling changes. For the with-profits sub-fund, the aggregate effect of assumption changes in 2009 was a net credit to unallocated surplus of £65 million principally for altered expense assumptions.
j Sensitivity of IFRS basis profit or loss and equity to market and other risksThe risks to which the IFRS basis results of the UK insurance operations are sensitive are asset/liability matching, mortality experience and payment assumptions for shareholder-backed annuity business. Further details are described below.
i With-profits businessSAIFShareholders have no interest in the profits of SAIF but are entitled to the asset management fees paid on the investment of the assets of the fund.
With-profits sub-fund businessFor with-profits business (including non-participating business of PAL which is owned by the WPSF) adjustments to liabilities and any related tax effects are recognised in the income statement. However, except for any impact on the annual declaration of bonuses, shareholders’ profit for with-profits business is unaffected. This is because IFRS basis profits for with-profits business, which are determined on the same basis as on preceding UK GAAP, solely reflect one-ninth of the cost of bonuses declared for the year. The main factors that influence the determination of bonus rates are the return on the investments of the fund, the effect of inflation, taxation, the expenses of the fund chargeable to policyholders and the degree to which investment returns are smoothed. Mortality and other insurance risk are relatively minor factors. Unallocated surplus represents the excess of assets over policyholder liabilities of the fund. As unallocated surplus of the WPSF is recorded as a liability, movements in its value do not affect shareholders’ profits or equity. The level of unallocated surplus is particularly sensitive to the level of investment returns on the portion of the life fund assets that represents the surplus. The effects for 2010 and 2009 are demonstrated in note D5.

231F
INA
NC
IAL
S
TA
TE
ME
NT
SD
: LIF
E A
SSUR
AN
CE
B
USIN
ESSE
S
ii Shareholder-backed annuity businessProfits from shareholder-backed annuity business are most sensitive to:
• The extent to which the duration of the assets held closely matches the expected duration of the liabilities under the contracts. Assuming close matching, the impact of short-term asset value movements as a result of interest rate movements will broadly offset changes in the value of liabilities caused by movements in valuation rates of interest;
• actual versus expected default rates on assets held;• the difference between long-term rates of return on corporate bonds and risk-free rates;• the variance between actual and expected mortality experience;• the extent to which expected future mortality experience gives rise to changes in the measurement of liabilities; and• changes in renewal expense levels.
A decrease in assumed mortality rates of one per cent would decrease gross profits by approximately £53 million (2009: £44 million). A decrease in credit default assumptions of five basis points would increase gross profits by £119 million (2009: £91 million). A decrease in renewal expenses (excluding asset management expenses) of five per cent would increase gross profits by £23 million (2009: £17 million). The effect on profits would be approximately symmetrical for changes in assumptions that are directionally opposite to those explained above.
iii Unit-linked and other businessUnit-linked and other business represents a comparatively small proportion of the in-force business of the UK insurance operations. Profits from unit-linked and similar contracts primarily arise from the excess of charges to policyholders, for management of assets under the Company’s stewardship, over expenses incurred. The former is most sensitive to the net accretion of funds under management as a function of new business and lapse and timing of death. The accounting impact of the latter is dependent upon the amortisation of acquisition costs in line with the emergence of margins (for insurance contracts) and amortisation in line with service provision (for the investment management component of investment contracts). By virtue of the design features of most of the contracts which provide low levels of mortality cover, the profits are relatively insensitive to changes in mortality experience.
iv Shareholder exposure to interest rate risk and other market riskBy virtue of the fund structure, product features and basis of accounting described in note D2(e) and (g), the policyholder liabilities of the UK insurance operations are, except for pension annuity business, not generally exposed to interest rate risk. For pension annuity business, liabilities are exposed to fair value interest rate risk. However, the net exposure to the PAC WPSF (for PAL) and shareholders (for liabilities of PRIL and the non-profit sub-fund) is very substantially ameliorated by virtue of the close matching of assets with appropriate duration. The level of matching from period to period can vary depending on management actions and economic factors so it is possible for a degree of mis-matching profits or losses to arise. The close matching by the Group of assets of appropriate duration to annuity liabilities is based on maintaining economic and regulatory capital. The measurement of liabilities under capital reporting requirements and IFRS is not the same, with contingency reserves and some other margins for prudence within the assumptions required under the FSA regulatory solvency basis not included for IFRS reporting purposes. As a result IFRS equity is higher than regulatory capital and therefore more sensitive to interest rate risk. The estimated sensitivity of the UK non-linked shareholder-backed business (principally pension annuities business) to a movement in interest rates is as follows.
2010 £m 2009 £m
A decrease of 2%
A decrease of 1%
An increase of 1%
An increase of 2%
A decrease of 2%
A decrease of 1%
An increase of 1%
An increase of 2%
Carrying value of debt securities and derivatives 6,547 2,938 (2,434) (4,481) 5,372 2,422 (2,020) (3,731)Policyholder liabilities (5,977) (2,723) 2,109 3,929 (5,125) (2,304) 1,905 3,498Related deferred tax effects (154) (58) 88 149 (69) (33) 32 65
Net sensitivity of profit after tax and shareholders’ equity 416 157 (237) (403) 178 85 (83) (168)
In addition the shareholder-backed portfolio of UK non-linked insurance operations covering liabilities and shareholders’ equity includes equity securities and investment property. Excluding any second order effects on the measurement of the liabilities for future cash flows to the policyholder, a fall in their value would have given rise to the following effects on pre-tax profit, profit after tax, and shareholders’ equity.

232
Prudential plc Annual Report 2010
FINANCIAL STATEMENTS > NOTES ON THE GROUP FINANCIAL STATEMENTS
D: LIFE ASSURANCE BUSINESSESCONTINUED
D2: UK INSURANCE OPERATIONS > CONTINUED
2010 £m 2009 £m
A decrease of 20%
A decrease of 10%
A decrease of 20%
A decrease of 10%
Pre-tax profit (302) (151) (292) (146)Related deferred tax effects 82 41 82 41
Net sensitivity of profit after tax and shareholders’ equity (220) (110) (210) (105)
A 10 or 20 per cent increase in their value would have an approximately equal and opposite effect on profit and shareholders’ equity to the sensitivities shown above. The market risk sensitivities shown above reflect the impact of temporary market movements and, therefore, the primary effect of such movements would, in the Group’s segmental analysis of profits, be included within the short-term fluctuations in investment returns. In the equity risk sensitivity analysis given above, the Group has considered the impact of an instantaneous 20 per cent fall in equity markets. If equity markets were to fall by more than 20 per cent, the Group believes that this would not be an instantaneous fall but rather this would be expected to occur over a period of time during which the Group would be able to put in place mitigating management actions.
k Duration of liabilitiesWith the exception of most unitised with-profits bonds and other whole of life contracts the majority of the contracts of the UK insurance operations have a contract term. However, in effect, the maturity term of contracts reflects the earlier of death, maturity, or lapsation. In addition, with-profits contract liabilities as noted in note D2(g) include projected future bonuses based on current investment values. The actual amounts payable will vary with future investment performance of SAIF and the WPSF. The tables below show the carrying value of the policyholder liabilities. Separately, the Group uses cash flow projections of expected benefit payments as part of the determination of the value of in-force business when preparing EEV basis results. The tables below also show the maturity profile of the cash flows used for 2010 and 2009 for that purpose for insurance contracts, as defined by IFRS, i.e. those containing significant insurance risk, and investment contracts, which do not.
2010 £m
With-profits businessAnnuity business
(Insurance contracts) Other
Insurance contracts
Investment contracts Total PAL PRIL Total
Insurancecontracts
Investmentcontracts Total TOTAL
Policyholder liabilities 43,691 25,613 69,304 12,282 16,442 28,724 11,737 15,765 27,502 125,530
2010 %
Expected maturity: 0 to 5 years 46 31 40 32 29 30 35 29 32 365 to 10 years 25 25 25 25 23 24 26 21 23 2410 to 15 years 13 19 16 18 17 18 18 20 19 1715 to 20 years 7 14 10 12 13 12 10 11 11 1120 to 25 years 4 8 6 7 8 8 6 8 7 7Over 25 years 5 3 3 6 10 8 5 11 8 5

233F
INA
NC
IAL
S
TA
TE
ME
NT
SD
: LIF
E A
SSUR
AN
CE
B
USIN
ESSE
S
2009 £m
With-profits businessAnnuity business
(Insurance contracts) Other
Insurance contracts
Investment contracts Total PAL PRIL Total
Insurancecontracts
Investmentcontracts Total TOTAL
Policyholder liabilities 40,780 24,780 65,560 11,969 14,292 26,261 10,614 13,794 24,408 116,229
2009 %
Expected maturity: 0 to 5 years 50 29 41 32 31 32 34 35 35 385 to 10 years 26 25 26 25 23 24 25 22 23 2510 to 15 years 13 19 15 18 17 17 18 19 18 1615 to 20 years 6 14 9 11 12 12 11 11 11 1020 to 25 years 3 9 6 7 8 7 7 6 6 6Over 25 years 2 4 3 7 9 8 5 7 7 5
Notesi The cash flow projections of expected benefit payments used in the maturity profile table above are from value of in-force business and exclude
the value of future new business, including vesting of internal pension contracts.ii Benefit payments do not reflect the pattern of bonuses and shareholder transfers in respect of the with-profits business.iii Investment contracts under Other comprise certain unit-linked and similar contracts accounted for under IAS 39 and IAS 18.iv For business with no maturity term included within the contracts, for example with-profits investment bonds such as Prudence Bond, an
assumption is made as to likely duration based on prior experience.v The maturity tables shown above have been prepared on a discounted basis. Details of undiscounted cash flow for investment contracts are
shown in note G2.

234
Prudential plc Annual Report 2010
FINANCIAL STATEMENTS > NOTES ON THE GROUP FINANCIAL STATEMENTS
D: LIFE ASSURANCE BUSINESSESCONTINUED
D3: US INSURANCE OPERATIONS
a Summary results and statement of financial positioni Results and movements in shareholders’ equity
2010 £m 2009(1) £m
Operating profit based on longer-term investment returns 833 618Short-term fluctuations in investment returns (378) (132)
Profit before shareholder tax 455 486Tax (117) 102
Profit for the year 338 588
2010 £m 2009 £m
Profit for the year (as above) 338 588Items recognised in other comprehensive income:Exchange movements 85 (231) Unrealised valuation movements on securities classified as available-for-sale: Unrealised holding gains arising during the year 1,170 2,249 Less losses included in the income statement 51 420
Total unrealised valuation movements 1,221 2,669Related change in amortisation of deferred income and acquisition costs (469) (1,069)Related tax (247) (557)
Total other comprehensive income 563 812
Total comprehensive income for the year 901 1,400Dividends, interest payments to central companies and other movements (97) (87)
Net increase in equity 804 1,313Shareholders’ equity at beginning of year 3,011 1,698
Shareholders’ equity at end of year 3,815 3,011
Note(i) The Group has amended the presentation of operating profit for its US insurance operations to remove the net equity hedge accounting effect
(incorporating related amortisation of deferred acquisition costs) and include it in short-term fluctuations. The 2009 comparatives have been amended accordingly. Note A4(d)(ii) explains the effect of the change.
Included within the movements in shareholders’ equity is a net increase in value of Jackson’s debt securities classified as ‘available-for-sale’ under IAS 39 of £1,221 million (2009: £2,669 million). With the exception of debt securities for US insurance operations classified as ‘available-for-sale’ under IAS 39, unrealised value movements on the Group’s investments are booked within the income statement. However, for debt securities classified as ‘available-for-sale’, unless impaired, fair value movements are recognised in other comprehensive income. Realised gains and losses, including impairments, are recorded in the income statement. This classification is applied for most of the debt securities of the Group’s US operations. In 2010, Jackson recorded £124 million (2009: £630 million) of impairment losses arising from:
2010 £m 2009 £m
Residential mortgage-backed securities 71 509Public fixed income 1 91Other 52 30
124 630

235F
INA
NC
IAL
S
TA
TE
ME
NT
SD
: LIF
E A
SSUR
AN
CE
B
USIN
ESSE
S
Further details on the impairment losses recognised in the year are shown in note B1. Jackson’s portfolio of debt securities is managed proactively with credit analysts closely monitoring and reporting on the credit quality of its holdings. Jackson continues to review its investments on a case-by-case basis to determine whether any decline in fair value represents an impairment. In addition, investments in structured securities are subject to a rigorous review of their future estimated cash flows, including expected and stress case scenarios, to identify potential shortfalls in contractual payments (both interest and principal). Impairment charges are recorded on structured securities when the Company forecasts a contractual payment shortfall. Situations where such a shortfall would not lead to a recognition of a loss are rare. However, some structured securities do not have a single determined set of future cash flows and instead, there can be a reasonable range of estimates that could potentially emerge. With this variability, there could be instances where the projected cash flow shortfall under management’s base case set of assumptions is so minor that relatively small and justifiable changes to the base case assumptions would eliminate the need for an impairment loss to be recognised. The impairment loss reflects the difference between the fair value and book value. In 2010, there was a movement in the statement of financial position value for debt securities classified as available-for-sale from a net unrealised gain of £4 million to a net unrealised gain of £1,210 million (2009: net unrealised loss of £2,897 million to a net unrealised gain of £4 million).This increase reflects the effects of tightening credit spreads in the US bond market and lower interest rates. During 2010, the gross unrealised gain in the statement of financial position increased from £970 million at 31 December 2009 to £1,580 million at 31 December 2010 while the gross unrealised loss decreased from £966 million at 31 December 2009 to £370 million at 31 December 2010. Details of the securities in an unrealised loss position are shown in D3(d) below. These features are included in the table shown below of the movements in the values of available-for-sale securities:
2010 2009
Changes inunrealised
appreciation‡
Foreign exchange
translation
Reflected as part of movement in other comprehensive income
£m £m £m £m
Assets fair valued at below book valueBook value* 4,372 8,220Unrealised loss (370) 634 (38) (966)
Fair value (as included in statement of financial position) 4,002 7,254
Assets fair valued at or above book valueBook value* 20,743 14,444Unrealised gain 1,580 587 23 970
Fair value (as included in statement of financial position) 22,323 15,414
TotalBook value* 25,115 22,664Net unrealised gain (loss) 1,210 1,221 (15) 4
Fair value (as included in statement of financial position)† 26,325 22,668
Reflected as part of movement in other comprehensive income Movement in unrealised appreciation 1,221 2,669Exchange movements (15) 232
1,206 2,901
* Book value represents cost/amortised cost of the debt securities.† Debt securities for US operations as included in the statement of financial position of £26,366 million (2009: £22,831 million) comprise £26,325 million
(2009: £22,668 million) in respect of securities classified as ‘available-for-sale’ and £41 million (2009: £163 million) for securities of consolidated investment funds classified as fair value through profit and loss.
‡ Translated at the average rate of US$1.55: £1.
Included within the movement in gross unrealised losses for the debt securities of Jackson of £634 million (2009: £1,925 million) as shown above was a net increase in value of £84 million (2009: £72 million decrease) relating to the sub-prime and Alt-A securities as referred to in section B6.

236
Prudential plc Annual Report 2010
FINANCIAL STATEMENTS > NOTES ON THE GROUP FINANCIAL STATEMENTS
D: LIFE ASSURANCE BUSINESSESCONTINUED
D3: US INSURANCE OPERATIONS > CONTINUED
ii Statement of financial position
US insurance operations
Variable annuity separate account
assets and liabilities
note i £m
Fixed annuity, GIC
and other business
note i £m
2010Total
£m
2009Total
£m
ASSETSIntangible assets attributable to shareholders: Deferred acquisition costs and other intangible assets – 3,543 3,543 3,092
Total – 3,543 3,543 3,092
Deferred tax assets – 1,391 1,391 1,944Other non-investment and non-cash assets – 1,241 1,241 1,404Investments of long-term business and other operations: Investment properties – 26 26 33 Financial investments: Loansnote ii – 4,201 4,201 4,319 Equity securities and portfolio holdings in unit trustsnote v 31,203 298 31,501 20,984 Debt securitiesnote D3d – 26,366 26,366 22,831 Other investmentsnote iii – 1,199 1,199 955 Deposits – 212 212 454
Total investmentsnote G 31,203 32,302 63,505 49,576
Properties held for sale – 3 3 3
Cash and cash equivalents – 232 232 340
TOTAL ASSETS 31,203 38,712 69,915 56,359
EQUITY AND LIABILITIESEquityShareholders’ equity – 3,815 3,815 3,011
Total equity – 3,815 3,815 3,011
LiabilitiesPolicyholder liabilities:note iv
Contract liabilities (including amounts in respect of contracts classified as investment contracts under IFRS 4) 31,203 29,320 60,523 48,311
Total 31,203 29,320 60,523 48,311
Core structural borrowings of shareholder-financed operations – 159 159 154Operational borrowings attributable to shareholder-financed operations – 90 90 203Deferred tax liabilities – 1,776 1,776 1,858Other non-insurance liabilities – 3,552 3,552 2,822
Total liabilities 31,203 34,897 66,100 53,348
TOTAL EQUITY AND LIABILITIES 31,203 38,712 69,915 56,359

237F
INA
NC
IAL
S
TA
TE
ME
NT
SD
: LIF
E A
SSUR
AN
CE
B
USIN
ESSE
S
Notesi Assets and liabilities attaching to variable annuity business that are not held in the separate account are shown within other business.ii Loans The loans of the Group’s US insurance operations of £4,201 million (2009: £4,319 million) comprise mortgage loans of £3,641 million
(2009: £3,774 million), policy loans of £548 million (2009: £530 million) and other loans of £12 million (2009: £15 million). All of the mortgage loans are commercial mortgage loans which are collateralised by properties. The property types are mainly industrial, multi-family residential, suburban office, retail and hotel. The breakdown by property type is as follows:
2010 % 2009 %
Industrial 31 32Multi-family residential 18 18Office 19 20Retail 21 19Hotels 10 10Other 1 1
100 100
The US insurance operations’ commercial mortgage loan portfolio does not include any single-family residential mortgage loans and is therefore not exposed to the risk of defaults associated with residential sub-prime mortgage loans. The average loan size is £6.6 million (2009: £6.3 million). The portfolio has a current estimated average loan to value of 73 per cent (2009: 74 per cent) which provides significant cushion to withstand substantial declines in value.
The policy loans are fully secured by individual life insurance policies or annuity policies. These loans are accounted for at amortised cost, less any impairment.
iii Other investments comprise:
2010 £m 2009 £m
Derivative assetsnote G3* 645 519Partnerships in investment pools and other† 554 436
1,199 955
* In the US, Prudential uses derivatives to reduce interest rate risk, to facilitate efficient portfolio management to match liabilities under annuity policies, and for certain equity-based product management activities. After taking account of the derivative liability of £799 million (2009: £461 million), which is also included in the statement of financial position, the derivative position for US operations is a net liability of £154 million (2009: net asset of £58 million).
† Partnerships in investment pools and other comprise primarily investments in limited partnerships. These include interest in the PPM America Private Equity Fund and diversified investments in 161 (2009: 159) other partnerships by independent money managers that generally invest in various equities and fixed income loans and securities.
iv Summary policyholder liabilities (net of reinsurance) and reserves at 31 December 2010 The policyholder liabilities, net of reinsurers’ share of £694 million (2009: £667 million), reflect balances in respect of the following:
2010 £m 2009 £m
Policy reserves and liabilities on non-linked business: Reserves for future policyholder benefits and claims payable 1,567 1,645 Deposits on investment contracts (as defined under IFRS ‘grandfathered’ US GAAP) 25,494 23,706 Guaranteed investment contracts 1,565 1,654Unit-linked (variable annuity) business 31,203 20,639
59,829 47,644
In addition to the policyholder liabilities above, Jackson has entered into a programme of funding arrangements under contracts which, in substance, are almost identical to GICs. The liabilities under these funding arrangements totalled £1,411 million (2009: £1,444 million) and are included in ‘other non-insurance liabilities’ in the statement of financial position above.
v Equity securities and portfolio holdings in unit trusts include investments in mutual funds, the majority of which are equity based.

238
Prudential plc Annual Report 2010
FINANCIAL STATEMENTS > NOTES ON THE GROUP FINANCIAL STATEMENTS
D: LIFE ASSURANCE BUSINESSESCONTINUED
D3: US INSURANCE OPERATIONS > CONTINUED
b Reconciliation of movement in investmentsA reconciliation of the total investments of US insurance operations from the beginning of the year to the end of the year is as follows:
Variable annuity
separate account
assets andliabilities
£m
Fixed annuity, GIC and other
business £m
US insurance operations
Total £m
AT 1 JANUARY 2009 Total investments (including derivative assets) 14,538 31,633 46,171 Less: Derivative liabilities – (863) (863)
Directly held investments, net of derivative liabilities 14,538 30,770 45,308
Net cash inflow (outflow) from operating activities 4,050 (1,295) 2,755Realised losses in the year – (529) (529)Unrealised gains and losses and exchange movements in the year 2,051 (470) 1,581
Movement in the year of directly held investments, net of derivative liabilities 6,101 (2,294) 3,807
AT 31 DECEMBER 2009/1 JANUARY 2010 Total investments (including derivative assets) 20,639 28,937 49,576 Less: Derivative liabilitiesnote G3 – (461) (461)
Directly held investments, net of derivative liabilities 20,639 28,476 49,115
Net cash inflow from operating activities 6,441 865 7,306Realised gains in the year – 21 21Unrealised gains and losses and exchange movements in the year 4,123 2,141 6,264
Movement in the year of directly held investments, net of derivative liabilities 10,564 3,027 13,591
AT 31 DECEMBER 2010 Total investments (including derivative assets) 31,203 32,302 63,505 Less: Derivative liabilitiesnote G3 – (799) (799)
Directly held investments, net of derivative liabilities 31,203 31,503 62,706

239F
INA
NC
IAL
S
TA
TE
ME
NT
SD
: LIF
E A
SSUR
AN
CE
B
USIN
ESSE
S
c Reconciliation of movement in policyholder liabilitiesA reconciliation of the total policyholder liabilities of US insurance operations from the beginning of the year to the end of the year is as follows:
Variable annuity
separate account
liabilities £m
Fixed annuity, GIC and other
business £m
US insurance operations
Total £m
AT 1 JANUARY 2009 14,538 30,823 45,361Premiums 4,667 4,510 9,177Surrenders (882) (2,373) (3,255)Maturities/Deaths (199) (534) (733)
Net flowsnote b 3,586 1,603 5,189Transfers from general to separate account 984 (984) –Investment-related items and other movementsnote c 3,368 (382) 2,986Foreign exchange translation differencesnote a (1,837) (3,388) (5,225)
AT 31 DECEMBER 2009/1 JANUARY 2010 20,639 27,672 48,311Premiums 7,420 4,315 11,735 Surrenders (1,403) (2,195) (3,598)Maturities/Deaths (259) (510) (769)
Net flowsnote b 5,758 1,610 7,368 Transfers from general to separate account 1,411 (1,411) - Investment-related items and other movementsnote c 2,875 589 3,464 Foreign exchange translation differencesnote a 520 860 1,380
AT 31 DECEMBER 2010 31,203 29,320 60,523
Average policyholder liabilities2010 25,921 28,496 54,4172009 17,589 29,248 46,837
Notesa Movements in the year have been translated at an average rate of 1.55 (2009: 1.57). The closing balance has been translated at closing rate of
1.57 (2009: 1.61). Differences upon retranslation are included in foreign exchange translation differences of £1,380 million (2009: £5,225 million).b Net flows for the year were £7,368 million compared with £5,189 million in 2009, driven largely by increased new business volumes for the
variable annuity business.c Positive investment-related items and other movements in variable annuity separate account liabilities of £2,875 million in 2010 and
£3,368 million in 2009 represent increases in the US equity market during the respective periods. Fixed annuity, GIC and other business investment and other movements primarily reflects the movement in the valuation of the product guarantees and interest credited to policyholder accounts. In 2010, interest credited exceeded the small reduction in the guarantee valuation to give an overall increase in liabilities. In 2009, there was a more significant fall in the valuation of guarantees.

240
Prudential plc Annual Report 2010
FINANCIAL STATEMENTS > NOTES ON THE GROUP FINANCIAL STATEMENTS
D: LIFE ASSURANCE BUSINESSESCONTINUED
D3: US INSURANCE OPERATIONS > CONTINUED
d Information on credit risks of debt securities
2010 £m 2009 £m
Summary Carrying
valueCarrying
value
Corporate and government security and commercial loans: Government 2,440 379 Publicly traded and SEC Rule 144A securities 14,747 12,959 Non-SEC Rule 144A securities 3,044 3,117
Total 20,231 16,455Residential mortgage-backed securities 2,784 3,316Commercial mortgage-backed securities 2,375 2,104Other debt securities 976 956
Total debt securities 26,366 22,831
i Credit qualityFor statutory reporting in the US, debt securities are classified into six quality categories specified by the Securities Valuation Office of the National Association of Insurance Commissioners (NAIC). The categories range from Class 1 (the highest) to Class 6 (the lowest). Performing securities are designated as Classes 1 to 5. Securities in or near default are designated Class 6. Securities designated as Class 3, 4, 5 and 6 are non-investment grade securities. Generally, securities rated AAA to A by nationally recognised statistical ratings organisations are reflected in Class 1, BBB in Class 2, BB in Class 3 and B and below in Classes 4 to 6. If a designation is not currently available from the NAIC, Jackson’s investment adviser, PPM America, provides the designation for the purposes of disclosure below.
The following table shows the quality of the publicly traded and non-SEC Rule 144A debt securities by NAIC classifications:
2010 2009
Carrying value Carrying value
£m % of total £m % of total
NAIC designation:1 5,338 36 4,688 362 8,550 58 7,508 583 644 5 598 54 201 1 122 15 11 – 40 –6 3 – 3 –
14,747 100 12,959 100
The following table shows the quality of the non-SEC Rule 144A private placement portfolio by NAIC classifications:
2010 2009
Carrying value Carrying value
£m % of total £m % of total
NAIC designation:1 1,125 37 1,084 352 1,772 58 1,792 573 114 4 162 54 18 1 54 25 13 – 20 16 2 – 5 –
3,044 100 3,117 100

241F
INA
NC
IAL
S
TA
TE
ME
NT
SD
: LIF
E A
SSUR
AN
CE
B
USIN
ESSE
S
Included within other debt securities of £976 million (2009: £956 million) in the summary shown above are £723 million (2009: £652 million) of asset-backed securities held directly by Jackson, of which £527 million (2009: £447 million) were NAIC designation 1 and £135 million (2009: £152 million) NAIC designation 2. In addition, other debt securities includes £211 million (2009: £172 million) in respect of securities held by the Piedmont trust entity and £42 million (2009: £132 million) from the consolidation of investment funds managed by PPM America. In addition to the ratings disclosed above, the following table summarises by rating the debt securities, as at 31 December 2010 using Standard and Poor’s (S&P), Moody’s, Fitch and implicit ratings of mortgage-backed securities (MBS) based on NAIC valuations:
2010 £m 2009 £m
Carrying value
Carrying value
S&P – AAA 4,187 3,287S&P – AA+ to AA- 801 846S&P – A+ to A- 5,156 5,192S&P – BBB+ to BBB- 8,202 7,659S&P – Other 866 895
19,212 17,879
Moody’s – Aaa 34 273Moody’s – Aa1 to Aa3 32 43Moody’s – A1 to A3 36 32Moody’s – Baa1 to Baa3 73 64Moody’s – Other 135 57
310 469
Implicit ratings of MBS based on NAIC valuations (see below)NAIC 1 3,083 747NAIC 2 181 105NAIC 3-6 232 473
3,496 1,325
Fitch 176 281Other* 3,172 2,877
Total debt securities 26,366 22,831
* The amounts within Other which are not rated by S&P, Moody’s, Fitch nor are MBS securities using the revised regulatory ratings have the following NAIC classifications:
2010 £m 2009 £m
NAIC 1 1,193 1,102NAIC 2 1,849 1,623NAIC 3-6 130 152
3,172 2,877
In the table above, with the exception of some residential mortgage-backed securities and commercial mortgage-backed securities for 2010, and for residential mortgage-backed securities for 2009, commercial mortgage-backed securities S&P ratings have been used where available. For securities where S&P ratings are not immediately available, those produced by Moody’s and then Fitch have been used as an alternative. During 2009, the NAIC in the US revised the regulatory ratings process for more than 20,000 residential mortgage-backed securities. In addition, in 2010, the NAIC expanded the revised process to include commercial mortgage-backed securities. The table above includes these securities, where held by Jackson, using the regulatory rating levels established by external third parties (PIMCO for residential mortgage-backed securities and BlackRock Solutions for commercial mortgage-backed securities).

242
Prudential plc Annual Report 2010
FINANCIAL STATEMENTS > NOTES ON THE GROUP FINANCIAL STATEMENTS
D: LIFE ASSURANCE BUSINESSESCONTINUED
D3: US INSURANCE OPERATIONS > CONTINUED
ii Determining the fair value of debt securities when the markets are not activeUnder IAS 39, unless categorised as ‘held to maturity’ or ‘loans and receivables’ debt securities are required to be fair valued. Where available, quoted market prices are used. However, where securities do not have an externally quoted price based on regular trades or are quoted in markets that are no longer active as a result of market conditions, IAS 39 requires that valuation techniques be applied. Note G1 sets out further details of the Group’s approach to determining fair value and classifies these fair values into a three level hierarchy as required by IFRS 7. At 31 December 2010, 0.3 per cent of Jackson’s debt securities were classified as level 3 (2009: three per cent) comprising fair values where there are significant inputs which are not based on observable market data.
iii Asset-backed securities funds exposuresIncluded within the debt securities of Jackson at 31 December 2010 are exposures to asset-backed securities as follows:
2010 £m 2009 £m
RMBS Sub-prime (31 Dec 2010: 40% AAA, 11% AA)† 224 194 Alt-A (31 Dec 2010: 15% AAA, 6% AA) 415 443 Prime including agency (31 Dec 2010: 79% AAA, 2% AA) 2,145 2,679CMBS (31 Dec 2010: 36% AAA, 15% AA)† 2,375 2,104CDO funds (31 Dec 2010: 4% AAA, 4% AA)*, including £1 million exposure to sub-prime 162 79ABS (31 Dec 2010: 26% AAA, 20% AA), including £37 million exposure to sub-prime 814 877
6,135 6,376
* Including Group’s economic interest in Piedmont and other consolidated CDO funds.† MBS ratings refer to the rating implicit within NAIC risk-based capital valuation (see D3(i) previous page).
Jackson defines its exposure to sub-prime mortgages as investments in residential mortgage-backed securities in which the underlying borrowers have a US Fair Isaac Credit Organisation (FICO) credit score of 680 or lower.
iv Debt securities classified as available-for-sale in an unrealised loss positionThe following tables show some key attributes of those securities that are in an unrealised loss position at 31 December 2010.
a Fair value of securities as a percentage of book value The unrealised losses in Jackson’s statement of financial position on unimpaired securities are £370 million (2009: £966 million). This relates to assets with fair market value and book value of £4,002 million (2009: £7,254 million) and £4,372 million (2009: £8,220 million) respectively. The following table shows the fair value of the debt securities in a gross unrealised loss position for various percentages of book value at 31 December:
2010 £m 2009 £m
Fair value of securities as a percentage of book value Fair value Unrealised
loss Fair value Unrealised
loss
Between 90% and 100% 3,390 (102) 5,127 (169)Between 80% and 90% 273 (44) 1,201 (203)Below 80% note d 339 (224) 926 (594)
Total 4,002 (370) 7,254 (966)
Included within the table above are amounts relating to sub-prime and Alt–A securities of:
2010 £m 2009 £m
Fair value of securities as a percentage of book value Fair value Unrealised
loss Fair value Unrealised
loss
Between 90% and 100% 98 (6) 102 (3)Between 80% and 90% 55 (9) 160 (28)Below 80% note d 56 (25) 159 (88)
Total 209 (40) 421 (119)

243F
INA
NC
IAL
S
TA
TE
ME
NT
SD
: LIF
E A
SSUR
AN
CE
B
USIN
ESSE
S
b Unrealised losses by maturity of security
2010 £m 2009 £m
Unrealisedloss
Unrealised loss
Less than 1 year – –1 to 5 years (6) (29)5 to 10 years (47) (127)More than 10 years (49) (92)Mortgage-backed and other debt securities (268) (718)
Total (370) (966)
c Age analysis of unrealised losses for the years indicatedThe following table shows the aged analysis for all the unrealised losses in the portfolio by reference to the length of time the securities have been in an unrealised loss position:
2010 £m 2009 £m
Non- investment
gradeInvestment
grade Total
Non- investment
gradeInvestment
grade Total
Less than 6 months (3) (67) (70) (7) (51) (58)6 months to 1 year (2) – (2) (25) (59) (84)1 year to 2 years (13) (20) (33) (59) (234) (293)2 years to 3 years (27) (55) (82) (125) (199) (324)More than 3 years (58) (125) (183) (35) (172) (207)
(103) (267) (370) (251) (715) (966)
At 31 December 2010, the gross unrealised losses in the statement of financial position for the sub-prime and Alt-A securities in an unrealised loss position were £40 million (2009: £119 million), as shown above in note (a). Of these losses £1 million (2009: £21 million) relate to securities that have been in an unrealised loss position for less than one year and £39 million (2009: £98 million) to securities that have been in an unrealised loss position for more than one year.
d Securities whose fair value were below 80 per cent of the book valueAs shown in the table (a) above, £224 million of the £370 million of gross unrealised losses at 31 December 2010 (2009: £594 million of the £966 million of gross unrealised losses) related to securities whose fair values were below 80 per cent of the book value. The analysis of the £224 million, (2009: £594 million) by category of debt securities and by age analysis indicating the length of time for which their fair value was below 80 per cent of the book value, are as follows:
2010 £m 2009 £m
Category analysisFair
valueUnrealised
lossFair
valueUnrealised
loss
Residential mortgage-backed securitiesPrime (including agency) 88 (39) 322 (153)Alt-A 15 (4) 77 (33)Sub-prime 41 (20) 82 (55)
144 (63) 481 (241)Commercial mortgage-backed securities 8 (29) 87 (86)Other asset-backed securities 123 (105) 183 (188)
Total structured securities 275 (197) 751 (515)Corporates 64 (27) 175 (79)
Total 339 (224) 926 (594)

244
Prudential plc Annual Report 2010
FINANCIAL STATEMENTS > NOTES ON THE GROUP FINANCIAL STATEMENTS
D: LIFE ASSURANCE BUSINESSESCONTINUED
D3: US INSURANCE OPERATIONS > CONTINUED
Age analysis of fair value being below 80 per cent for the period indicated:
2010 £m 2009 £m
Age analysisFair
valueUnrealised
lossFair
valueUnrealised
loss
Less than 3 months – (1) 153 (45)3 months to 6 months – – 5 (3)More than 6 months 339 (223) 768 (546)
339 (224) 926 (594)
e Products and guaranteesJackson provides long-term savings and retirement products to retail and institutional customers throughout the US. Jackson offers fixed annuities (interest-sensitive, fixed indexed and immediate annuities), variable annuities (VA), life insurance and institutional products.
i Fixed annuitiesInterest-sensitive annuitiesAt 31 December 2010, interest-sensitive fixed annuities accounted for 19 per cent (2009: 24 per cent) of policy and contract liabilities of Jackson. Interest-sensitive fixed annuities are primarily deferred annuity products that are used for retirement planning and for providing income in retirement. They permit tax-deferred accumulation of funds and flexible payout options. The policyholder of an interest-sensitive fixed annuity pays Jackson a premium, which is credited to the policyholder’s account. Periodically, interest is credited to the policyholder’s account and in some cases administrative charges are deducted from the policyholder’s account. Jackson makes benefit payments at a future date as specified in the policy based on the value of the policyholder’s account at that date. The policy provides that at Jackson’s discretion it may reset the interest rate, subject to a guaranteed minimum. The minimum guarantee varies from 1.5 per cent to 5.5 per cent (2009: 1.5 per cent to 5.5 per cent) depending on the jurisdiction of issue and the date of issue, with 78 per cent (2009: 82 per cent) of the fund at three per cent or less. The average guarantee rate is 3.1 per cent (2009: 3.1 per cent). Approximately 45 per cent (2009: 61 per cent) of the interest-sensitive fixed annuities Jackson wrote in 2010 provide for a market value adjustment, that could be positive or negative, on surrenders in the surrender period of the policy. This formula-based adjustment approximates the change in value that assets supporting the product would realise as interest rates move up or down. The minimum guaranteed rate is not affected by this adjustment.
Fixed indexed annuitiesFixed indexed annuities accounted for 9 per cent (2009: 10 per cent) of Jackson’s policy and contract liabilities at 31 December 2010. Fixed indexed annuities vary in structure, but generally are deferred annuities that enable policyholders to obtain a portion of an equity-linked return (based on participation rates and caps) but provide a guaranteed minimum return. These guaranteed minimum rates are generally set at 1.25 to 3 per cent. Jackson hedges the equity return risk on fixed indexed products using futures and options linked to the relevant index as well as through offsetting equity exposure in the VA product. The cost of these hedges is taken into account in setting the index participation rates or caps. Jackson bears the investment and surrender risk on these products.
Immediate annuitiesAt 31 December 2010, immediate annuities accounted for two per cent (2009: two per cent) of Jackson’s policy and contract liabilities. Immediate annuities guarantee a series of payments beginning within a year of purchase and continuing over either a fixed period of years and/or the life of the policyholder. If the term is for the life of the policyholder, then Jackson’s primary risk is mortality risk. The implicit interest rate on these products is based on the market conditions that exist at the time the policy is issued and is guaranteed for the term of the annuity.
ii Variable annuitiesAt 31 December 2010, VAs accounted for 58 per cent (2009: 49 per cent) of Jackson’s policy and contract liabilities. VAs are deferred annuities that have the same tax advantages and payout options as interest-sensitive and fixed indexed annuities. The primary differences between VAs and interest-sensitive or fixed indexed annuities are investment risk and return. If a policyholder chooses a VA, the rate of return depends upon the performance of the selected fund portfolio. Policyholders may allocate their investment to either the fixed or variable account. Investment risk on the variable account is borne by the policyholder, while investment risk on the fixed account is borne by Jackson through guaranteed minimum fixed rates of return. At 31 December 2010, approximately 12 per cent (2009: approximately 14 per cent) of VA funds were in fixed accounts.

245F
INA
NC
IAL
S
TA
TE
ME
NT
SD
: LIF
E A
SSUR
AN
CE
B
USIN
ESSE
S
Jackson issues VA contracts where it contractually guarantees to the contractholder either a) return of no less than total deposits made to the contract adjusted for any partial withdrawals, b) total deposits made to the contract adjusted for any partial withdrawals plus a minimum return, or c) the highest contract value on a specified anniversary date adjusted for any withdrawals following the contract anniversary. These guarantees include benefits that are payable in the event of death (guaranteed minimum death benefit (GMDB)), annuitisation (guaranteed minimum income benefit (GMIB)), or at specified dates during the accumulation period (guaranteed minimum withdrawal benefit (GMWB)) and guaranteed minimum accumulation benefit (GMAB). Jackson hedges these risks using equity options and futures contracts as described in note D3(f). The GMIB is no longer offered, with existing coverage being reinsured.
iii Life insuranceJackson’s life insurance products accounted for seven per cent (2009: nine per cent) of Jackson’s policy and contract liabilities at 31 December 2010. The products offered include variable universal life insurance, term life insurance and interest-sensitive life insurance.
iv Institutional productsJackson’s institutional products consist of GICs, funding agreements (including agreements issued in conjunction with Jackson’s participation in the US Federal Home Loan Bank programme) and medium-term note funding agreements. At 31 December 2010, institutional products accounted for five per cent of policy and contract liabilities (2009: six per cent). Under a traditional GIC, the policyholder makes a lump sum deposit. The interest rate paid is fixed and established when the contract is issued. If deposited funds are withdrawn earlier than the specified term of the contract, an adjustment is made that approximates a market value adjustment. Under a funding agreement, the policyholder either makes a lump sum deposit or makes specified periodic deposits. Jackson agrees to pay a rate of interest, which may be fixed but which is usually a floating short-term interest rate linked to an external index. The average term of the funding arrangements is one to two years. Funding agreements terminable by the policyholder with less than 90 days’ notice account for less than one per cent (2009: one per cent) of total policyholder reserves. Medium-term note funding agreements are generally issued to support trust instruments issued on non-US exchanges or to qualified investors (as defined by SEC Rule 144A). Through the funding agreements, Jackson agrees to pay a rate of interest, which may be fixed or floating, to the holders of the trust instruments.
f Exposure to market risk and risk managementJackson’s main exposures are to market risk through its exposure to interest rate risk and equity risk. Approximately 91 per cent (2009: 90 per cent) of its general account investments support interest-sensitive and fixed indexed annuities, life business and surplus and nine per cent (2009: ten per cent) support institutional business. All of these types of business contain considerable interest rate guarantee features and, consequently, require that the assets that support them are primarily fixed income or fixed maturity.
Prudential is exposed primarily to the following risks in the US arising from fluctuations in interest rates:
• the risk of loss related to meeting guaranteed rates of accumulation following a sharp and sustained fall in interest rates;• the risk of loss related to policyholder withdrawals following a sharp and sustained increase in interest rates; and• the risk of mismatch between the expected duration of certain annuity liabilities and prepayment risk and extension risk inherent in
mortgage-backed securities.
Prudential is also exposed to the following risks in the US arising from equity market movements:
• the risk of loss related to the incidence of benefits related to guarantees issued in connection with its VA contracts; and• the risk of loss related to meeting contractual accumulation requirements in FIA contracts.
Jackson enters into financial derivative transactions, including those noted below to reduce and manage business risks. These transactions manage the risk of a change in the value, yield, price, cash flows, or quantity of, or a degree of exposure with respect to assets, liabilities or future cash flows, which Jackson has acquired or incurred. Jackson uses free-standing derivative instruments for hedging purposes. Additionally, certain liabilities, primarily trust instruments supported by funding agreements, fixed indexed annuities, certain GMWB variable annuity features and reinsured GMIB variable annuity features contain embedded derivatives as defined by IAS 39, ‘Financial Instruments: Recognition and Measurement’. Jackson does not account for such derivatives as either fair value or cash flow hedges as might be permitted if the specific hedge documentation requirements of IAS 39 were followed. Financial derivatives, including derivatives embedded in certain host liabilities that have been separated for accounting and financial reporting purposes are carried at fair value.

246
Prudential plc Annual Report 2010
FINANCIAL STATEMENTS > NOTES ON THE GROUP FINANCIAL STATEMENTS
D: LIFE ASSURANCE BUSINESSESCONTINUED
D3: US INSURANCE OPERATIONS > CONTINUED
Value movements on the derivatives are reported within the income statement. In preparing Jackson’s segment profit as shown in note B1, value movements on Jackson’s derivative contracts, are included within short-term fluctuations in investment returns and excluded from operating results based on longer-term investment returns (defined as segment profit). The types of derivatives used by Jackson and their purpose are as follows:
• interest rate swaps generally involve the exchange of fixed and floating payments over the period for which Jackson holds the instrument without an exchange of the underlying principal amount. These agreements are used for hedging purposes;
• put-swaption contracts provide the purchaser with the right, but not the obligation, to require the writer to pay the present value of a long-duration interest rate swap at future exercise dates. Jackson purchases and writes put-swaptions with maturities up to 10 years. Put-swaptions hedge against significant movements in interest rates;
• equity index futures contracts and equity index options (including various call and put options and put spreads) are used to hedge Jackson’s obligations associated with its issuance of fixed indexed immediate and deferred annuities and certain VA guarantees. These annuities and guarantees contain embedded options which are fair valued for financial reporting purposes;
• total return swaps in which Jackson receives equity returns or returns based on reference pools of assets in exchange for short-term floating rate payments based on notional amounts, are held for both hedging and investment purposes;
• cross-currency swaps, which embody spot and forward currency swaps and additionally, in some cases, interest rate swaps and equity index swaps, are entered into for the purpose of hedging Jackson’s foreign currency denominated funding agreements supporting trust instrument obligations;
• spread cap options are used as a macro-economic hedge against declining short-term interest rates. Jackson receives quarterly settlements based on the spread between the two-year and the 10-year constant maturity swap rates in excess of a specified spread; and
• credit default swaps, represent agreements under which Jackson has purchased default protection on certain underlying corporate bonds held in its portfolio. These contracts allow Jackson to sell the protected bonds at par value to the counterparty if a defined default event occurs in exchange for periodic payments made by Jackson for the life of the agreement.
Note D3(j) parts (iii) and (iv) show the sensitivities of Jackson’s results through its exposure to equity risk and interest rate risk.
g Process for setting assumptions and determining contract liabilitiesUnder the MSB of reporting applied under IFRS 4 for insurance contracts, providing the requirements of the Companies Act, UK GAAP standards and the ABI SORP are met, it is permissible to reflect the previously applied UK GAAP basis. Accordingly, and consistent with the basis explained in note A4, in the case of Jackson the carrying values of insurance assets and liabilities are consolidated into the Group accounts based on US GAAP. Under US GAAP, investment contracts (as defined for US GAAP purposes) are accounted for by applying in the first instance a retrospective deposit method to determine the liability for policyholder benefits. This is then augmented by potentially three additional amounts. These amounts are for:
• any amounts that have been assessed to compensate the insurer for services to be performed over future periods (i.e. deferred income);
• any amounts previously assessed against policyholders that are refundable on termination of the contract; and• any probable future loss on the contract (i.e. premium deficiency).
Capitalised acquisition costs and deferred income for these contracts are amortised over the life of the book of contracts. The present value of the estimated gross profits is generally computed using the rate of interest that accrues to policyholder balances (sometimes referred to as the contract rate). Estimated gross profits include estimates of the following elements, each of which will be determined based on the best estimate of amounts of the following individual elements over the life of the book of contracts without provision for adverse deviation for:
• amounts expected to be assessed for mortality less benefit claims in excess of related policyholder balances;• amounts expected to be assessed for contract administration less costs incurred for contract administration;• amounts expected to be earned from the investment of policyholder balances less interest credited to policyholder balances; • amounts expected to be assessed against policyholder balances upon termination of contracts (sometimes referred to as surrender
charges); and• other expected assessments and credits.

247F
INA
NC
IAL
S
TA
TE
ME
NT
SD
: LIF
E A
SSUR
AN
CE
B
USIN
ESSE
S
VA contracts written by Jackson may, as described above, provide for GMDB, GMIB, GMWB and GMAB features. In general terms, liabilities for these benefits are accounted for under US GAAP by using estimates of future benefits and fees under best estimate persistency assumptions. In accordance with US GAAP, the grandfathered basis for IFRS, which specifies how certain guarantee features should be accounted for the GMDB and certain ‘for life’ GMWB liabilities are not fair valued but are instead determined each period end by estimating the expected value of benefits in excess of the projected account balance and recognising the excess ratably over the life of the contract based on total expected assessments. At 31 December 2010, these liabilities were valued using a series of deterministic investment performance scenarios, a mean investment return of 8.4 per cent (2009: 8.4 per cent) and assumptions for lapse, mortality and expense that are the same as those used in amortising the capitalised acquisition costs. The direct GMIB liability is determined by estimating the expected value of the annuitisation benefits in excess of the projected account balance at the date of annuitisation and recognising the excess ratably over the accumulation period based on total expected assessments. The assumptions used for calculating the direct GMIB liability at 31 December 2010 and 2009 are consistent with those used for calculating the GMDB and ‘for life’ GMWB liabilities. The change in these reserves, along with claim payments and associated fees included in reserves are included along with the hedge results in short-term fluctuations, resulting in removal of the market impact from the operating profit based on longer-term investment returns. Jackson regularly evaluates estimates used and adjusts the additional GMDB and GMIB liability balances, with a related charge or credit to benefit expense, if actual experience or other evidence suggests that earlier assumptions should be revised. GMIB benefits are essentially fully reinsured, subject to annual claim limits. As this reinsurance benefit is net settled, it is considered to be a derivative under IAS 39 and is, therefore, recognised at fair value with the change in fair value included as a component of short-term derivative fluctuations. GMWB ‘not for life’ features, are considered to be embedded derivatives under IAS 39. Therefore, provisions for these benefits are recognised at fair value, with the change in fair value included in short-term fluctuations. For GMWB and GMIB reinsurance embedded derivatives that are fair valued under IAS 39, Jackson bases its volatility assumptions solely on implied market volatility with no reference to historical volatility levels and explicitly incorporates Jackson’s own credit risk in determining discount rates. Volatility assumptions are based on a weighting of available market data on implied volatility for durations up to ten years, at which point the projected volatility is held constant. Non-performance risk is incorporated into the calculation through the use of discount interest rates sourced from a AA corporate credit curve. Other risk margins, particularly for market illiquidity and policyholder behaviour are also incorporated into the model through the use of explicitly conservative assumptions. On a periodic basis, Jackson rationalises the resulting fair values based on comparisons to other models and market movements. With the exception of the GMDB, GMIB, GMWB and GMAB features of VA contracts, the financial guarantee features of Jackson’s contracts are in most circumstances not explicitly valued, but the impact of any interest guarantees would be reflected as they are earned in the current account value (i.e. the US GAAP liability). For traditional life insurance contracts, provisions for future policy benefits are determined under US GAAP using the net level premium method and assumptions as of the issue date as to mortality, interest, policy lapses and expenses plus provisions for adverse deviation. Institutional products are accounted for as investment contracts under IFRS with the liability classified as being in respect of financial instruments rather than insurance contracts, as defined by IFRS 4. In practice, there is no material difference between the IFRS and US GAAP basis of recognition and measurement for these contracts. Certain institutional products representing obligations issued in currencies other than US dollars have been hedged for changes in exchange rates using cross-currency swaps. The fair value of derivatives embedded in funding agreements, as well as foreign currency transaction gains and losses, are included in the carrying value of the trust instruments supported by funding agreements recorded in other non-insurance liabilities.
Deferred acquisition costs Under IFRS 4, the Group applies grandfathered US GAAP for measuring the insurance assets and liabilities of Jackson. In the case of Jackson term business, acquisition costs are deferred and amortised in line with expected premiums. For annuity and interest-sensitive life business, acquisition costs are deferred and amortised in line with a combination of historical and future expected gross profits on the relevant contracts. For fixed and indexed annuity and interest-sensitive life business, the key assumption is the long-term spread between the earned rate on investments and the rate credited to policyholders, which is based on an annual spread analysis. Expected gross profits also depend on mortality assumptions, assumed unit costs and terminations other than deaths (including the related charges), all of which are based on a combination of actual experience of Jackson, industry experience and future expectations. A detailed analysis of actual mortality, lapse, and expense experience is performed using internally developed experience studies. As with fixed and indexed annuity and interest-sensitive life business, acquisition costs for Jackson’s variable annuity products are amortised in line with the emergence of profits. The measurement of the amortisation in part reflects current period fees (including those for guaranteed minimum death, income, or withdrawal benefits) earned on assets covering liabilities to policyholders, and the historical and expected level of future gross profits which depends on the assumed level of future fees, as well as components related to mortality, lapse, and expense.

248
Prudential plc Annual Report 2010
FINANCIAL STATEMENTS > NOTES ON THE GROUP FINANCIAL STATEMENTS
D: LIFE ASSURANCE BUSINESSESCONTINUED
D3: US INSURANCE OPERATIONS > CONTINUED
Under US GAAP (as grandfathered under IFRS 4) the projected gross profits reflect an assumed long-term level of equity return which, for Jackson, is 8.4 per cent after deduction of net external fund management fees. This is applied to the period end level of separate account equity assets after application of a mean reversion technique that removes a portion of the effect of levels of short-term variability in current market returns. Under the mean reversion technique applied by Jackson, the projected level of return for each of the next five years is adjusted from period to period so that in combination with the actual rates of return for the preceding two years and the current year, the 8.4 per cent annual return is realized on average over the entire eight year period. Projected returns after the mean reversion period revert back to the 8.4 per cent target. A capping feature, which currently applies due to the very sharp market falls in 2008, is that the projected rates of return for the next five years can be no more than 15 per cent (gross of asset management fee) per annum. If Jackson had not applied the mean reversion methodology and had instead applied a constant 8.4 per cent annual return from today’s asset values, the Jackson DAC balance of £3,543 million would fall approximately £80 million to £3,463 million at 31 December 2010. The amortisation charge to the income statement is reflected in operating profit and short-term fluctuations in investment returns. The amortisation charge to the operating profit in a reporting period will incorporate an element of acceleration or deceleration that reflects the variance between the actual level of return attained and the assumed level in the mean reversion calculation. In 2010, the element of DAC amortisation charge included in operating profit includes £11 million of accelerated amortisation. This amount reflects actual separate account return shortfalls in the periods compared with the assumed level of 15 per cent for the year. For 2009, reflecting the excess of actual separate account returns over the 15 per cent assumed level, the operating profit incorporates a credit for decelerated amortisation of £39 million. For 2010, the separate account return (gross of asset management fees) was approximately 13 per cent. In 2011, while the capping feature is in effect, each one per cent divergence of the actual separate account return below or above the assumed return of 15 per cent is estimated to give rise to accelerated or decelerated amortisation, respectively, of approximately £6 million (£3 million if the projected rate falls below the 15 per cent cap). In the absence of significant market declines between now and the end of 2011, Jackson would expect to see higher amortisation levels than normal in 2011. This would essentially represent a reversal of the mean reversion benefits to date, as at that point highly negative returns from 2008 will no longer be included in the mean reverting return calculation.
Statement of changes in equity – ‘shadow DAC adjustments’Consequent upon the positive unrealised valuation movement in 2010 of £1,221 million (2009: positive £2,669 million) there is a debit of £496 million (2009: £1,069 million debit) for altered ‘shadow’ amortisation booked within other comprehensive income. These adjustments reflect movement from period to period, in the changes to the pattern of reported gross profits that would have happened if the assets reflected in the statement of financial position had been sold, crystallising the unrealised gains or losses, and the proceeds reinvested at the yields currently available in the market. At 31 December 2010 the cumulative ‘shadow DAC balance’ was negative £520 million (2009: negative £10 million).
h ReinsuranceThe principal reinsurance ceded by Jackson outside the Group is on term life insurance, direct and assumed accident and health business and GMIB variable annuity guarantees. In 2010, the premiums for such ceded business amounted to £83 million (2009: £82 million). Net commissions received on ceded business and claims incurred ceded to external reinsurers totalled £12 million and £72 million respectively, during 2010 (2009: £12 million and £66 million respectively). There were no deferred gains or losses on reinsurance contracts in either 2010 or 2009. The reinsurance asset for business ceded outside the Group was £694 million (2009: £667 million).
i Effect of changes in assumptions used to measure insurance assets and liabilities2010There are no changes of assumptions that had a material impact on the 2010 results of US insurance operations. Separately, in 2010, the Group amended its presentation of operating profit for its US insurance operations to exclude the net equity hedge accounting effect of negative £367 million (2009: negative £159 million) relating to its variable and fixed index annuity business and reclassified it as a short-term fluctuation within the Group’s supplementary analysis of profit. This is explained further in note A4(d)(ii). This change had no effect on the measurement of insurance assets and liabilities and therefore on total profit or shareholders’ equity.
2009Measurement basis for embedded derivatives of variable annuity business and other policyholder liabilityCertain variable annuity products sold by Jackson include Guaranteed Minimum Withdrawal Benefits (GMWB) with lifetime benefits which, in accordance with the Group’s accounting policies, are measured within the IFRS balance sheet at fair value. This requires a number of assumptions related to projected future cash flows, including those driven by policyholder behaviours such as lapses, fund selections and withdrawals utilisation.

249F
INA
NC
IAL
S
TA
TE
ME
NT
SD
: LIF
E A
SSUR
AN
CE
B
USIN
ESSE
S
During 2009 the GMWB utilisation assumptions were revised to take account of the more recent experience of policyholder behaviour. Previously policyholder behaviour for the utilisation of GMWB was assumed to be largely driven by the extent to which benefits were ‘in the money’. For 2009, the assumption has been altered to take account of recent experience which shows that the attained age of the policyholder is the key factor in determining utilisation levels. This has led to a release in policyholder liabilities of £96 million which is offset by a corresponding DAC amortisation charge of £68 million to give an overall impact on profit before tax of £28 million. This assumption change has been offset by sundry other assumption changes such that the overall impact on operating profit of policyholder liability assumption changes, after taking into account DAC amortisation offsets, is a charge of £4 million. 2010 has been prepared on a consistent basis to 2009.
j Sensitivity of IFRS basis profit and equity to market and other risksi Currency fluctuationsConsistent with the Group’s accounting policies, the profits of the Group’s US operations are translated at average exchange rates and shareholders’ equity at the closing rate for the reporting period. For 2010, the rates were US$1.55 (2009: US$1.57) and US$1.57 (2009: US$1.61) to £1 sterling, respectively. A 10 per cent increase or decrease in these rates would reduce or increase profit (loss) before tax attributable to shareholders, profit (loss) for the year and shareholders’ equity attributable to US insurance operations respectively as follows:
A 10% increase in exchange rates
A 10% decrease in exchange rates
2010 £m 2009 £m 2010 £m 2009 £m
Profit (loss) before tax attributable to shareholders note i (41) (44) 50 54Profit (loss) for the year (31) (54) 37 65Shareholders’ equity attributable to US insurance operations (347) (274) 424 335
Notei Sensitivity on profit (loss) before tax i.e. aggregate of the operating profit based on longer-term investment returns and short-term fluctuations, as
discussed in note B1.
ii Other sensitivitiesThe principal determinants of variations in operating profit based on longer-term returns are:
• growth in the size of assets under management covering the liabilities for the contracts in force;• variations in fees and other income, offset by variations in market value adjustment payments and, where necessary,
strengthening of liabilities;• spread returns for the difference between investment returns and rates credited to policyholders; and• amortisation of deferred acquisition costs.
For term business, acquisition costs are deferred and amortised in line with expected premiums. For annuity business, acquisition costs are deferred and amortised in line with expected gross profits on the relevant contracts. For interest-sensitive business, the key assumption is the expected long-term spread between the earned rate and the rate credited to policyholders, which is based on an annual spread analysis. In addition, expected gross profits depend on mortality assumptions, assumed unit costs and terminations other than deaths (including the related charges) all of which are based on a combination of actual experience of Jackson, industry experience and future expectations. A detailed analysis of actual experience is measured by internally developed mortality and persistency studies. For variable annuity business, the key assumption is the expected long-term level of equity market returns, which for 2010 and 2009 was 8.4 per cent per annum implemented using a mean reversion methodology. These returns affect the level of future expected profits through their effects on the fee income and the required level of provision for guaranteed minimum benefits. The mean reversion methodology dampens the impact of equity market movements during a particular year, but does not fully eliminate the effects of movements in the equity markets. In addition, the mean reversion methodology includes both a cap and a floor that determine the maximum impact that the methodology may have. The projected rates of return are capped at no more than 15 per cent for each of the next five years. Further details are explained in note D3(g) above. Except to the extent of mortality experience, which primarily affects profits through variations in claim payments and GMDB reserves, the profits of Jackson are relatively insensitive to changes in insurance risk.

250
Prudential plc Annual Report 2010
FINANCIAL STATEMENTS > NOTES ON THE GROUP FINANCIAL STATEMENTS
D: LIFE ASSURANCE BUSINESSESCONTINUED
D3: US INSURANCE OPERATIONS > CONTINUED
iii Exposure to equity riskVariable annuity contracts relatedJackson issues variable annuity contracts through its separate accounts for which investment income and investment gains and losses accrue to, and investment risk is borne by, the contract holder (traditional variable annuities). It also issues variable annuity and life contracts through separate accounts where it contractually guarantees to the contract holder (variable contracts with guarantees) either a) return of no less than deposits made to the contract adjusted for any partial withdrawals, b) total deposits made to the contract adjusted for any partial withdrawals plus a minimum return, or c) the highest contract value on a specified anniversary date adjusted for any withdrawals following the contract anniversary. These guarantees include benefits that are payable in the event of death (GMDB), annuitisation (GMIB), at specified dates during the accumulation period (GMWB) or at the end of a specified period (GMAB). At 31 December 2010 and 2009, Jackson had variable annuity contracts with guarantees, for which the net amount at risk (‘NAR’) is generally the amount of guaranteed benefit in excess of current account value, as follows:
31 December 2010Minimum
return
Account value
£m
Net amount at risk
£m
Weighted average
attained age
Period until expected
annuitisation
Return of net deposits plus a minimum return GMDB 0-6% 25,540 2,106 64.0 years GMWB – Premium only 0% 2,742 149 GMWB – For life 0-5%* 1,996 415† GMAB – Premium only 0% 48 1 Highest specified anniversary account value minus withdrawals post-anniversary GMDB 3,742 466 63.3 years GMWB – Highest anniversary only 2,010 343 GMWB – For life 852 196† Combination net deposits plus minimum return, highest specified anniversary account value minus withdrawals post-anniversary GMDB 0-6% 1,768 311 65.7 years GMIB 0-6% 1,933 418 5.1 years GMWB – For life 0-8%* 15,025 672†
31 December 2009Minimum
return
Account value
£m
Net amount at risk
£m
Weighted average
attained age
Period until expected
annuitisation
Return of net deposits plus a minimum return GMDB 0-6% 16,915 2,834 63.8 years GMWB – Premium only 0% 2,505 277 GMWB – For life 0-5%* 1,240 471†
GMAB – Premium only 0% 27 2 Highest specified anniversary account value minus withdrawals post-anniversary GMDB 2,933 691 62.8 years GMWB – Highest anniversary only 1,694 496 GMWB – For life 811 258†
Combination net deposits plus minimum return, highest specified anniversary account value minus withdrawals post-anniversary GMDB 0-6% 1,307 384 65.1 years GMIB 0-6% 1,815 488 5.9 years GMWB – For life 0-7%* 6,934 568†
* Ranges shown based on simple interest. The upper limits of five per cent, seven per cent and eight per cent simple interest are approximately equal to 4.1 per cent, 5.5 per cent and six per cent respectively, on a compound interest basis over a typical 10-year bonus period.
† The NAR for GMWB – ‘For life’ has been estimated as the present value of future expected benefit payments remaining after the amount of the ‘not for life’ guaranteed benefit is zero.

251F
INA
NC
IAL
S
TA
TE
ME
NT
SD
: LIF
E A
SSUR
AN
CE
B
USIN
ESSE
S
Account balances of contracts with guarantees were invested in variable separate accounts as follows:
2010 £m 2009 £m
Mutual fund type Equity 23,841 15,477 Bond 3,417 2,340 Balanced 3,345 2,186 Money market 451 522
Total 31,054 20,525
As noted in note D3(f), Jackson is exposed to equity risk through the options embedded in the fixed indexed liabilities and GMDB and GMWB guarantees included in certain VA benefits as illustrated above. This risk is managed using a comprehensive equity hedging programme to minimise the risk of a significant economic impact as a result of increases or decreases in equity market levels while taking advantage of naturally offsetting exposures in Jackson’s operations. Jackson purchases external futures and options that hedge the risks inherent in these products, while also considering the impact of rising and falling separate account fees. As a result of this hedging programme, if the equity markets were to increase further in the future, Jackson’s free-standing derivatives would decrease in value. However, over time, this movement would be broadly offset by increased separate account fees and reserve decreases, net of the related changes to amortisation of deferred acquisition costs. Due to the nature of the free-standing and embedded derivatives, this hedge, while highly effective on an economic basis, may not completely mute the immediate impact of the market movements as the free-standing derivatives reset immediately while the hedged liabilities reset more slowly and fees are recognised prospectively. The opposite impacts would be observed if the equity markets were to decrease. At 31 December 2010, based on the hedges in place at that time, it is estimated that an immediate decrease in the equity markets of 10 per cent would result in an accounting benefit, net of related DAC amortisation, before tax of up to £100 million, excluding the impact on future separate account fees (2009: £60 million). After related deferred tax there would have been an estimated increase in shareholders’ equity at 31 December 2010 of up to £60 million (2009: £40 million). An immediate decrease in the equity markets of 20 per cent is estimated to result in an accounting benefit, net of related DAC amortisation, before tax of up to £170 million (2009: £110 million), excluding the impact on future separate account fees. After related deferred tax there would have been an estimated increase in shareholders’ equity at 31 December 2010 of up to £110 million (2009: £80 million). An immediate increase in the equity markets of 10 and 20 per cent is estimated to result in an approximately equal and opposite estimated effect on profit and shareholders’ equity as that disclosed above for a decrease. The actual impact on financial results would vary contingent upon the volume of new product sales and lapses, changes to the derivative portfolio, correlation of market returns and various other factors including volatility, interest rates and elapsed time.
Other exposure to equity risk In addition to the above, Jackson is also exposed to equity risk from its holding of equity securities, partnerships in investment pools and other financial derivatives. A range of reasonably possible movements in the value of equity securities, partnerships in investment pools and other financial derivatives have been applied to Jackson’s holdings at 31 December 2010 and 31 December 2009. The table below shows the sensitivity to a 10 and 20 per cent fall in value and the impact that this would have on pre-tax profit, net of related changes in amortisation of DAC, profit after tax and shareholders’ equity.
2010 £m 2009 £m
A decrease of 20%
A decrease of 10%
A decrease of 20%
A decrease of 10%
Pre-tax profit, net of related changes in amortisation of DAC (143) (72) (117) (58)Related deferred tax effects 50 25 41 20
Net sensitivity of profit after tax and shareholders’ equity (93) (47) (76) (38)
A 10 or 20 per cent increase in their value is estimated to have an approximately equal and opposite effect on profit and shareholders’ equity to the sensitivities shown above. In the equity risk sensitivity analysis given above, the Group has considered the impact of an instantaneous 20 per cent fall in equity markets. If equity markets were to fall by more than 20 per cent, the Group believes that this would not be an instantaneous fall but rather this would be expected to occur over a period of time during which the Group would be able to put in place mitigating management actions.

252
Prudential plc Annual Report 2010
FINANCIAL STATEMENTS > NOTES ON THE GROUP FINANCIAL STATEMENTS
D: LIFE ASSURANCE BUSINESSESCONTINUED
D3: US INSURANCE OPERATIONS > CONTINUED
iv Exposure to interest rate riskNotwithstanding the market risk exposure described in note D3(f), except in the circumstances of interest rate scenarios where the guarantee rates included in contract terms are higher than crediting rates that can be supported from assets held to cover liabilities, the accounting measurement of fixed annuity liabilities of Jackson products is not generally sensitive to interest rate risk. This position derives from the nature of the products and the US GAAP basis of measurement described in notes D3(e) and D3(g). The GMWB features attaching to variable annuity business (other than ‘for-life’) represents embedded derivatives which are fair valued and so will be sensitive to changes in interest rate. Debt securities and related derivatives are marked to fair value. Value movements on derivatives, net of related changes to amortisation of DAC and deferred tax, are recorded within profit and loss. Fair value movements on debt securities, net of related changes to amortisation of DAC and deferred tax, are recorded within other comprehensive income. The estimated sensitivity of these items and policyholder liabilities to a one per cent and two per cent decrease and increase in interest rates at 31 December 2010 and 2009 is as follows:
2010 £m 2009 £m
A 2%decrease
A 1%decrease
A 1%increase
A 2%increase
A 2%decrease
A 1%decrease
A 1%increase
A 2%increase
Profit and lossDirect effect Derivatives value change 842 363 (277) (529) (319) (148) 159 370 Policyholder liabilities (547) (243) 219 416 (418) (185) 170 334Related effect on amortisation of DAC 47 23 (34) (63) 364 162 (156) (328)
Pre-tax profit effect: Operating profit based on longer-term
investment returns 579 245 (181) (345) (144) (62) 56 109 Short-term fluctuations in investment returns (237) (102) 89 169 (229) (109) 117 267
342 143 (92) (176) (373) (171) 173 376Related effect on charge for deferred tax (120) (50) 32 62 131 60 (60) (131)
Net profit effect 222 93 (60) (114) (242) (111) 113 245
Other comprehensive incomeDirect effect on carrying value of debt securities 2,663 1,454 (1,454) (2,663) 2,183 1,179 (1,179) (2,183)Related effect on amortisation of DAC (1,174) (641) 641 1,174 (764) (413) 413 764Related effect on movement in deferred tax (521) (285) 285 521 (497) (268) 268 497
Net effect 968 528 (528) (968) 922 498 (498) (922)
Total net effect on IFRS equity 1,190 621 (588) (1,082) 680 387 (385) (677)

253F
INA
NC
IAL
S
TA
TE
ME
NT
SD
: LIF
E A
SSUR
AN
CE
B
USIN
ESSE
S
k Duration of liabilitiesThe table below shows the carrying value of policyholder liabilities. Separately, the Group uses cash flow projections of expected benefit payments as part of the determination of the value of in-force business when preparing EEV basis results. The table below also shows the maturity profile of the cash flows used for that purpose for 2010 and 2009:
2010 £m 2009 £m
Fixed annuity and
other business (including
GICs and similar
contracts) Variableannuity Total
Fixed annuity and
other business (including
GICs and similar
contracts) Variableannuity Total
Policyholder liabilities 29,320 31,203 60,523 27,672 20,639 48,311
% % % % % %
Expected maturity: 0 to 5 years 50 50 50 52 50 515 to 10 years 27 29 28 27 28 2810 to 15 years 11 12 12 10 12 1115 to 20 years 5 6 5 5 6 520 to 25 years 3 2 3 3 2 2Over 25 years 4 1 2 3 2 3
The maturity tables shown above have been prepared on a discounted basis. Details of undiscounted cash flows for investment contracts are shown in note G2.

254
Prudential plc Annual Report 2010
FINANCIAL STATEMENTS > NOTES ON THE GROUP FINANCIAL STATEMENTS
D: LIFE ASSURANCE BUSINESSESCONTINUED
D4: ASIAN INSURANCE OPERATIONS
a Summary statement of financial position
Asian insurance operations
With-profits business
note i £m
Unit-linked assets and
liabilities£m
Other£m
2010Total
£m
2009Total
£m
ASSETSIntangible assets attributable to shareholders: Goodwill – – 236 236 80 Deferred acquisition costs and other intangible assets – – 939 939 822
Total – – 1,175 1,175 902
Intangible assets attributable to with-profit funds: Deferred acquisition costs and other intangible assets 97 – – 97 97Deferred tax assets – – 98 98 132Other non-investment and non-cash assets 205 94 512 811 880Investments of long-term business and other operations: Investment properties – – 9 9 11 Investments accounted for using the equity method – – 2 2 2 Financial investments: Loansnote ii 874 – 466 1,340 1,207 Equity securities and portfolio holdings in unit trusts 4,321 9,637 506 14,464 11,182 Debt securitiesnote d 6,759 3,009 4,340 14,108 9,984 Other investments 192 58 132 382 258 Deposits 6 251 381 638 746
Total investmentsnote b 12,152 12,955 5,836 30,943 23,390
Cash and cash equivalents 536 337 728 1,601 837
TOTAL ASSETS 12,990 13,386 8,349 34,725 26,238
EQUITY AND LIABILITIESEquityShareholders’ equity – – 2,149 2,149 1,462Non-controlling interests – – 5 5 1
Total equity – – 2,154 2,154 1,463
LiabilitiesPolicyholder liabilities and unallocated surplus of with-profits funds: Contract liabilities (including amounts in respect of contracts
classified as investment contracts under IFRS 4) 10,958 12,724 4,992 28,674 21,858 Unallocated surplus of with-profits funds 66 – – 66 53
Total 11,024 12,724 4,992 28,740 21,911
Other non-insurance liabilities:Operational borrowings attributable to
shareholders-financed operations – – 189 189 210 Deferred tax liabilities 341 25 129 495 384 Other non-insurance liabilities 1,625 637 885 3,147 2,270
Total liabilities 12,990 13,386 6,195 32,571 24,775
TOTAL EQUITY AND LIABILITIES 12,990 13,386 8,349 34,725 26,238

255F
INA
NC
IAL
S
TA
TE
ME
NT
SD
: LIF
E A
SSUR
AN
CE
B
USIN
ESSE
S
Notesi The statement of financial position for with-profits business comprises the with-profits assets and liabilities of the Hong Kong, Malaysia
and Singapore with-profits operations. Assets and liabilities of other participating business are included in the column for ‘other business’.ii The loans of the Group’s Asian insurance operations of £1,340 million (2009: £1,207 million) comprise mortgage loans of £25 million
(2009: £13 million), policy loans of £528 million (2009: £437 million) and other loans of £787 million (2009: £757 million). The mortgage and policy loans are secured by properties and life insurance policies respectively. The majority of the other loans are commercial loans held by the Malaysian operation and which are all investment graded by two local rating agencies.
Summary policyholder liabilities (net of reinsurance) and unallocated surplusAt 31 December 2010, the policyholder liabilities (net of reinsurance of £41 million (2009: £18 million)) and unallocated surplus for Asian operations of £28.7 billion (2009: £21.9 billion) comprised the following:
2010 £m 2009 £m
Singapore 9,731 6,960Hong Kong 6,621 5,762Malaysia 2,544 1,823Indonesia 1,475 968Korea 1,897 1,519Taiwan 968 545Other countries 5,463 4,316
Total Asian operations 28,699 21,893
b Reconciliation of movement in investmentsA reconciliation of the total investments of Asian insurance operations from the beginning of the year to the end of the year is as follows:
With-profits business
£m
Unit-linked assets and
liabilities£m
Other£m
Asian insurance
operationsTotal
£m
AT 1 JANUARY 2009 Total investments (including derivative assets) 8,866 7,330 5,613 21,809 Less: Investments held by consolidated investment funds (705) (153) (243) (1,101) Less: Derivative liabilities – – (32) (32)
Directly held investments, net of derivative liabilities 8,161 7,177 5,338 20,676
Net cash inflow from operating activities 565 1,243 1,220 3,028Disposal of Taiwan agency business – (734) (2,527) (3,261)Realised gains (losses) in the year (183) 1 (61) (243)Unrealised gains and losses and exchange movements in the year 671 2,048 (393) 2,326
Movement in the year of directly held investments, net of derivative liabilities 1,053 2,558 (1,761) 1,850
AT 31 DECEMBER 2009/1 JANUARY 2010 Total investments (including derivative assets) 9,547 9,953 3,890 23,390 Less: Investments held by consolidated investment funds (270) (218) (230) (718) Less: Derivative liabilitiesnote G3 (63) – (83) (146)
Directly held investments, net of derivative liabilities 9,214 9,735 3,577 22,526
Net cash inflow from operating activities 278 838 1,051 2,167Realised gains in the year 638 327 19 984Unrealised gains and losses and exchange movements in the year 993 1,786 522 3,301Acquisition of UOB Life Assurance Limited 527 3 474 1,004
Movement in the year of directly held investments, net of derivative liabilities 2,436 2,954 2,066 7,456
AT 31 DECEMBER 2010 Total investments (including derivative assets) 12,152 12,955 5,836 30,943 Less: Investments held by consolidated investment funds (382) (266) (91) (739) Less: Derivative liabilitiesnote G3 (120) – (102) (222)
Directly held investments, net of derivative liabilities 11,650 12,689 5,643 29,982

256
Prudential plc Annual Report 2010
FINANCIAL STATEMENTS > NOTES ON THE GROUP FINANCIAL STATEMENTS
D: LIFE ASSURANCE BUSINESSESCONTINUED
D4: ASIAN INSURANCE OPERATIONS > CONTINUED
c Reconciliation of movement in policyholder liabilities and unallocated surplus of with-profits fundsA reconciliation of the total policyholder liabilities and unallocated surplus of with-profits funds of Asian insurance operations from the beginning of the year to the end of the year is as follows:
With-profits business
£m
Unit-linked assets and
liabilities£m
Other£m
Asian insurance
operationsTotal
£m
AT 1 JANUARY 2009 8,094 7,220 5,755 21,069
Premiums New businessnote ii 46 643 517 1,206 In-force 777 1,223 601 2,601
823 1,866 1,118 3,807Surrendersnote iii (361) (666) (174) (1,201)Maturities/Deaths (253) (19) (70) (342)
Net flows 209 1,181 874 2,264Change in reserving basis in Malaysianote iv – (9) (54) (63)Change in other reserving basis – – (4) (4)Shareholders’ transfers post-tax (20) – – (20)Investment-related items and other movements 1,431 2,661 150 4,242Foreign exchange translation differencesnote i (853) (612) (604) (2,069)Disposal of Taiwan agency businessnote vi – (724) (2,784) (3,508)
AT 31 DECEMBER 2009/1 JANUARY 2010 8,861 9,717 3,333 21,911Comprising: – Policyholder liabilities 8,808 9,717 3,333 21,858 – Unallocated surplus of with-profits funds 53 – – 53
Premiums New businessnote ii 141 1,072 452 1,665 In-force 897 1,130 616 2,643
1,038 2,202 1,068 4,308 Surrendersnote iii (441) (1,572) (228) (2,241)Maturities/Deaths (326) (40) (132) (498)
Net flows 271 590 708 1,569 Change in other reserving basis – – 19 19Shareholders’ transfers post-tax (24) – – (24)Investment-related items and other movementsnote v 693 1,405 118 2,216 Foreign exchange translation differencesnote i 719 1,009 353 2,081 Acquisition of UOB Life Assurance Limitednote vii 504 3 461 968
AT 31 DECEMBER 2010 11,024 12,724 4,992 28,740
Comprising: – Policyholder liabilities 10,958 12,724 4,992 28,674 – Unallocated surplus of with-profits funds 66 – – 66
Average policyholder liability balances*
201010,135 11,222 4,393 25,750
2009 8,371 8,107 3,152 19,630
*Adjusted for transactions in the period and excluding the unallocated surplus of with-profits funds.

257F
INA
NC
IAL
S
TA
TE
ME
NT
SD
: LIF
E A
SSUR
AN
CE
B
USIN
ESSE
S
Notesi Movements in the year have been translated at the average exchange rate for the year ended 31 December 2010. The closing balance has been
translated at the closing spot rates as at 31 December 2010. Differences upon retranslation are included in foreign exchange translation differences of positive £2,081 million in 2010 (2009: negative £2,069 million).
ii The increase in policyholder liabilities due to new business premium for the unit-linked business was predominantly driven by an increase in sales during the year of individual linked products.
iii Following the recovery of the stock markets in Asia in late 2009 and 2010, policyholders in Asia took the opportunity to capitalise on the increased value of their unit-linked policies through withdrawals, principally in Indonesia, Malaysia, and India.
The depressed state of the investment markets in late 2008 and 2009 resulted in both the number of, and average value of, withdrawals of investment related products decreasing.
iv The change in reserving basis in Malaysia of £63 million reflects the change made following the adoption of a risk-based capital (RBC) approach to the local regulatory reporting in that country.
v The positive investment related items and other movements in 2010 for with-profits (£693 million) and unit-linked business (£1,405 million) are mainly driven from Asian equity market gains in the period.
vi The disposal of Taiwan agency business reflects the liabilities transferred at the date of disposal. vii The acquisition of UOB Life Assurance Limited reflects the liabilities acquired at the date of acquisition.
d Information on credit risks of debt securitiesThe following table summarises the credit quality of the debt securities of the Asian insurance operations as at 31 December 2010 by rating agency ratings:
2010 £m 2009 £m
With-profits business
Unit-linkedbusiness
Otherbusiness Total Total
S&P – AAA 2,199 349 386 2,934 2,259S&P – AA+ to AA- 744 100 1,294 2,138 1,594S&P – A+ to A- 1,337 861 645 2,843 1,496S&P – BBB+ to BBB- 729 24 160 913 682S&P – Other 649 465 659 1,773 917
5,658 1,799 3,144 10,601 6,948
Moody’s – Aaa 49 10 6 65 134Moody’s – Aa1 to Aa3 44 48 23 115 349Moody’s – A1 to A3 55 16 59 130 309Moody’s – Baa1 to Baa3 50 10 35 95 40Moody’s – Other 31 – 18 49 15
229 84 141 454 847
Fitch 4 33 12 49 39Other 868 1,093 1,043 3,004 2,150
Total debt securities 6,759 3,009 4,340 14,108 9,984
Of the £1,043 million (2009: £517 million) debt securities for other business which are not rated in the table above, £350 million (2009: £225 million) are in respect of government bonds and £666 million (2009: £265 million) are in respect of corporate bonds rated as investment grade by local external ratings agencies, and £5 million (2009: £22 million) structured deposits issued by banks which are themselves rated but where the specific deposits have not been.
e Products and guaranteesThe life insurance products offered by the Group’s Asian operations include a range of with-profits and non-participating term, whole life, endowment and unit-linked policies. The Asian operations also offer health, disability, critical illness and accident coverage to supplement its core life products. The terms and conditions of the contracts written by the Asian operations and, in particular, the products’ options and guarantees, vary from territory to territory depending upon local market circumstances. In general terms, the Asian participating products provide savings and protection where the basic sum assured can be enhanced by a profit share (or bonus) from the underlying fund as determined at the discretion of the insurers. The Asian operations’ non-participating term, whole life and endowment products offer savings and/or protection where the benefits are guaranteed or determined by a set of defined market-related parameters. Unit-linked products combine savings with protection, the cash value of the policy depends on the value of the underlying unitised funds. Health and Protection (H&P) policies provide mortality or morbidity benefits and include health, disability, critical illness and accident coverage. H&P products are commonly offered as supplements to main life policies but can be sold separately.

258
Prudential plc Annual Report 2010
FINANCIAL STATEMENTS > NOTES ON THE GROUP FINANCIAL STATEMENTS
D: LIFE ASSURANCE BUSINESSESCONTINUED
D4: ASIAN INSURANCE OPERATIONS > CONTINUED
Subject to local market circumstances and regulatory requirements, the guarantee features described in note D2(e) in respect of UK business broadly apply to similar types of participating contracts written in the Hong Kong branch, Singapore and Malaysia. Participating products have both guaranteed and non-guaranteed elements. Non-participating long-term products are the only ones where the insurer is contractually obliged to provide guarantees on all benefits. Investment-linked products have the lowest level of guarantee, if any. Product guarantees in Asia can be broadly classified into four main categories, namely premium rate, cash value and interest rate guarantees, policy renewability and convertibility options. The risks on death coverage through premium rate guarantees are low due to appropriate product pricing.
Cash value and interest rate guarantees are of three types:
• Maturity values Maturity values are guaranteed for non-participating products and on the guaranteed portion of participating products. Declared annual bonuses are also guaranteed once vested. Future bonus rates and cash dividends are not guaranteed on participating products.
• Surrender values Surrender values are guaranteed for non-participating products and on the guaranteed portion of participating products. The surrender value of declared reversionary bonuses are also guaranteed once vested. Market value adjustments and surrender penalties are used where the law permits such adjustments in cash values.
• Interest rate guarantees It is common in Asia for regulations or market-driven demand and competition to provide some form of capital value protection and minimum crediting interest rate guarantees. This would be reflected within the guaranteed maturity and surrender values. The guarantees are borne by shareholders for non-participating and investment-linked (non-investment guarantees only) products. Participating product guarantees are predominantly supported by the segregated life funds and their estates.
Whole of life contracts with floor levels of policyholder benefits that accrue at rates set at inception and do not vary subsequently with market conditions are written in the Korean life operations. This is to a much lesser extent than the policies written by the Taiwan agency business which was sold in the first half of 2009, as Korea has a much higher proportion of linked and health business. The Korean business has non-linked liabilities and linked liabilities at 31 December 2010 of £408 million and £1,491 million respectively (2009: £349 million and £1,173 million respectively). The other area of note in respect of guarantees is the Japanese business where pricing rates are higher than current bond yields. Lapse risk is a feature in that policyholders could potentially surrender their policies on guaranteed terms if interest rates significantly increased leaving the potential for losses if bond values had depreciated significantly. However, the business is matched to a relatively short realistic liability duration. The method for determining liabilities of insurance contracts for UK GAAP and IFRS purposes for some Asian operations is based on US GAAP principles and this method applies to contracts with cash value and interest rate guarantees. Following standard US GAAP procedure, premium deficiency reserve calculations are performed each year to establish whether the carrying values of the liabilities are sufficient. On the US GAAP basis the calculations are deterministic, that is to say based on a single set of projections, and expected long-term rates of return are applied.
f Exposure to market riskThe Asian operations sell with-profits and unit-linked policies and, although the with-profits business generally has a lower terminal bonus element than in the UK, the investment portfolio still contains a proportion of equities and, to a lesser extent, property. Non-participating business is largely backed by debt securities or deposits. The exposure to market risk of the Group arising from its Asian operations is therefore at modest levels. This arises from the fact that the Asian operations have a balanced portfolio of with-profits, unit-linked and other types of business.
g Process for setting assumptions and determining liabilitiesThe future policyholder benefit provisions for Asian businesses in the Group’s IFRS accounts and previously under the MSB, are determined in accordance with methods prescribed by local GAAP adjusted to comply, where necessary, with UK GAAP. For Asian operations in countries where local GAAP is not well established and in which the business written is primarily non-participating and linked business, US GAAP is used as the most appropriate reporting basis. This basis is applied in Japan, Vietnam and Taiwan. The future policyholder benefit provisions for non-linked business are determined using the net level premium method, with an allowance for surrenders, maintenance and claims expenses. Rates of interest used in establishing the policyholder benefit provisions vary by operation depending on the circumstances attaching to each block of business.

259F
INA
NC
IAL
S
TA
TE
ME
NT
SD
: LIF
E A
SSUR
AN
CE
B
USIN
ESSE
S
h ReinsuranceThe Asian businesses cede only minor amounts of business outside the Group with immaterial effects on reported profit. During 2010, reinsurance premiums for externally ceded business were £146 million (2009: £119 million) and the reinsurance assets were £41 million (2009: £18 million) in aggregate. i Effect of changes in bases, estimates and assumptions used to measure insurance assets and liabilities2010In 2010, one-off changes made to reserving assumptions resulted in a release from liabilities of £19 million.
2009In 2009, the local regulatory basis in Malaysia was replaced by the Malaysian authority’s risk-based capital (RBC) framework. In the light of this development, the Company has remeasured the liabilities by reference to the method applied under the new RBC framework, but with an overlay constraint to the method such that negative reserves derived at an individual policyholder level are not included. This change resulted in a one-off release from liabilities at 1 January 2009 of £63 million. Excluding the change in Malaysia, the 2009 result for Asian operations was reduced by the effect of a number of individually small assumption changes of, in aggregate £4 million. j Sensitivity of IFRS basis profit and equity to market and other risksCurrency translationConsistent with the Group’s accounting policies, the profits of the Asian insurance operations are translated at average exchange rates and shareholders’ equity at the closing rate for the reporting period. For 2010, the rates for the most significant operations are given in note B4. A 10 per cent increase or decrease in these rates would have reduced or increased profit before tax attributable to shareholders, profit for the year and shareholders’ equity, excluding goodwill, attributable to Asian operations respectively as follows:
A 10% increase inexchange rates
A 10% decrease inexchange rates
2010 £m
2009 £m
2010 £m
2009 £m
(Loss) profit before tax attributable to shareholdersnote i (65) (40) 80 49(Loss) profit for the year (58) (35) 71 43Shareholders’ equity, excluding goodwill, attributable to Asian operations (193) (129) 236 158
Notei Sensitivity on profit before tax i.e. aggregate of the operating profit based on longer-term investment returns, short-term fluctuations in
investment returns, and actuarial gains and losses on defined benefit pension schemes but excluding the loss on sale and results for Taiwan agency business, as discussed in note B1.
Other risksi With-profits businessSimilar principles to those explained for UK with-profits business apply to profit emergence for the Asian with-profits business. Correspondingly, the profit emergence reflects bonus declaration and is relatively insensitive to period by period fluctuations in insurance risk or interest rate movements.
ii Unit-linked businessAs for the UK insurance operations, the profits and shareholders’ equity related to the Asian operations is primarily driven by charges related to invested funds. For the Asian operations, substantially all of the contracts are classified as insurance contracts under IFRS 4, i.e. containing significant insurance risk. The sensitivity of profits and equity to changes in insurance risk is minor and, to interest rate risk, not material.
iii Other businessa Interest rate risk Asian operations offer a range of insurance and investment products, predominately with-profits and non-participating term, whole life endowment and unit-linked. Excluding with-profit and unit-linked business, the results of the Asian business are sensitive to the vagaries of routine movements in interest rates.

260
Prudential plc Annual Report 2010
FINANCIAL STATEMENTS > NOTES ON THE GROUP FINANCIAL STATEMENTS
D: LIFE ASSURANCE BUSINESSESCONTINUED
D4: ASIAN INSURANCE OPERATIONS > CONTINUED
For the purposes of analysing sensitivity to variations in interest rates, it has been determined for the majority of territories that a movement of one per cent in the 10 year government bond rate can be considered reasonably possible. At 31 December 2010, 10 year government bond rates vary from territory to territory and range from 1.1 per cent to 12.25 per cent (2009: 1.3 per cent to 11.45 per cent). Exception to this arises in Japan and Taiwan where reasonably possible interest rate movements have been determined as 0.5 per cent (2009: Japan and Taiwan 0.5 per cent). These reasonably possible changes would have the following impact:
2010 £m 2009 £m
A decrease of 1%
note i
A decrease of 1%
note i
Pre-tax profit 110 91Related deferred tax (where applicable) (41) (22)
Net effect on profit and equity 69 69
Notei One per cent sensitivity has been used in all territories (except Japan and Taiwan (0.5 per cent)) (2009: Japan and Taiwan 0.5 per cent). The pre-tax impacts, if they arose, would mostly be recorded within the category short-term fluctuations in investments returns in the Group’s
segmental analysis of profit before tax. At 31 December 2010, an increase in the rates of one per cent (Japan and Taiwan (0.5 per cent)) (2009: one per cent except Japan and Taiwan
0.5 per cent) is estimated to have the effect of decreasing pre-tax profit by £112 million (2009: £109 million). After adjusting these results for deferred tax the reasonable possible effect on shareholders’ equity is a decrease of £82 million (2009: £83 million).
b Equity price riskThe non-linked shareholder business has limited exposure to equity and property investment (£515 million at 31 December 2010). Generally changes in equity and property investment values are not automatically matched by investments in policyholder liabilities. However, for the Vietnam business, to the extent that equity investment appreciation is realised through sales of securities then policyholders’ liabilities are adjusted to the extent that policyholders participate. The estimated sensitivity to a 10 and 20 per cent change in equity and property prices for shareholder-backed Asian other business, which would be reflected in the short-term fluctuation component of the Group’s segmental analysis of profit before tax at 31 December 2010 and 2009, would be as follows:
2010 £m 2009 £m
A decrease of 20%
A decrease of 10%
A decrease of 20%
A decrease of 10%
Pre-tax profit (103) (52) (58) (29)Related deferred tax (where applicable) 10 5 8 4
Net effect on profit and equity (93) (47) (50) (25)
A 10 or 20 per cent increase in their value is estimated to have an approximately equal and opposite effect on profit and shareholders’ equity to the sensitivities shown above. In the equity risk sensitivity analysis given above the Group has considered the impact of an instantaneous 20 per cent fall in equity markets. If equity markets were to fall by more than 20 per cent, the Group believes that this would not be an instantaneous fall but rather this would be expected to occur over a period of time during which the Group would be able to put in place mitigating management actions.
c Insurance riskMany of the territories in Asia are exposed to mortality/morbidity risk and provision is made within IFRS policyholder liabilities on a prudent regulatory basis to cover the potential exposure. If these prudent assumptions were strengthened by five per cent (estimated at one in ten year shock) then it is estimated that post-tax IFRS profit would be impacted by approximately £21 million (2009: £9 million) (with a corresponding change to IFRS shareholders’ equity). Mortality/morbidity has a symmetrical effect on portfolio and so a weakening of mortality/morbidity assumptions would have an approximately equal and opposite similar impact.

261F
INA
NC
IAL
S
TA
TE
ME
NT
SD
: LIF
E A
SSUR
AN
CE
B
USIN
ESSE
S
k Duration of liabilitiesThe table below shows the carrying value of policyholder liabilities. Separately the Group uses cash flow projections of expected benefit payments as part of the determination of the value of in-force business when preparing EEV basis results. The table below also shows the maturity profile of the cash flows, taking account of expected future premiums and investment returns used for that purpose for 2010 and 2009:
2010 £m 2009 £m
Policyholder liabilities 28,674 21,858
% %
Expected maturity: 0 to 5 years 24 245 to 10 years 20 2110 to 15 years 15 1515 to 20 years 12 1220 to 25 years 10 9Over 25 years 19 19

262
Prudential plc Annual Report 2010
FINANCIAL STATEMENTS > NOTES ON THE GROUP FINANCIAL STATEMENTS
D: LIFE ASSURANCE BUSINESSESCONTINUED
D5: CAPITAL POSITION STATEMENT FOR LIFE ASSURANCE BUSINESSES
a Summary statementThe Group’s estimated capital position for life assurance businesses with reconciliations to shareholders’ equity is shown below. Available capital for each fund or group of companies is determined by reference to local regulation at 31 December 2010 and 2009.
2010 £m
31 December 2010 SAIFWPSFnote i
Total PAC
with-profits
fund
OtherUK life
assurancesubsidi-
aries andfundsnote ii Jackson
Asian life
assurancesubsidi-
aries
Total life
assuranceopera-
tions
M&G(includingPrudential
Capital)
Parentcompany
and share-holders’
equity ofother
subsidi-aries and
fundsGroup
total
GROUP SHAREHOLDERS’ EQUITY
Held outside long-term funds: Net assets – – – 716 3,815 1,913 6,444 254 (1,532) 5,166 Goodwill – – – – – 236 236 1,153 77 1,466
Total – – – 716 3,815 2,149 6,680 1,407 (1,455) 6,632Held in long-term fundsnote iii – – – 1,399 – – 1,399 – – 1,399
Total Group shareholders’ equity – – – 2,115 3,815 2,149 8,079 1,407 (1,455) 8,031
ADJUSTMENTS TO REGULATORY BASIS
Unallocated surplus of with-profits fundsnote v – 10,187 10,187 – – 66 10,253Shareholders’ share of realistic
liabilities – (2,938) (2,938) – – – (2,938)Deferred acquisition costs of non-participating business
not recognised for regulatory reporting purposes and goodwill – (13) (13) (116) (3,543) (993) (4,665)
Jackson surplus notesnote iv – – – – 159 – 159Investment and policyholder
liabilities valuation differences between IFRS basis and regulatory basis for Jacksonnote viii – – – – 1,900 – 1,900
Adjustment from IAS 19 basis pension deficit attributable to WPSF to pension liability for regulatory purposesnote vii – 60 60 – – – 60
Valuation difference on PAL between IFRS basis and regulatory basis – (1,202) (1,202) – – – (1,202)
Other adjustments to restate these amounts to a regulatory basis (with SAIF and the WPSF on a Peak 2 realistic basis)note v – 706 706 (292) 576 156 1,146
Total adjustments – 6,800 6,800 (408) (908) (771) 4,713
TOTAL AVAILABLE CAPITAL RESOURCES OF LIFE ASSURANCE BUSINESSES ON LOCAL REGULATORY BASES – 6,800 6,800 1,707 2,907 1,378 12,792

263F
INA
NC
IAL
S
TA
TE
ME
NT
SD
: LIF
E A
SSUR
AN
CE
B
USIN
ESSE
S
2010 £m
31 December 2010 SAIFWPSFnote i
Total PAC
with-profits
fund
Other UK life
assurancesubsidi-
aries andfundsnote ii Jackson
Asian life assurance
subsidi-aries
Total life assurance
operations
POLICYHOLDER LIABILITIESWith-profits liabilities of UK regulated with-profits funds: Insurance contracts 9,115 31,395 40,510 – – 5,284 45,794 Investment contracts (with discretionary participation
features) 376 25,237 25,613 – – 119 25,732
Total 9,491 56,632 66,123 – – 5,403 71,526
Other liabilities: Insurance contracts:With-profits liabilities of non-UK regulated funds – – – – – 5,555 5,555 Unit-linked, including variable annuity – 2,128 2,128 8,882 31,203 12,724 54,937 Other life assurance business 268 13,067 13,335 19,297 27,438 4,935 65,005Investment contracts without
discretionary participation features (principally unit-linked and similar contracts in the UK and GIC liabilities of Jackson)note vi – – – 15,765 1,882 57 17,704
Total 268 15,195 15,463 43,944 60,523 23,271 143,201
TOTAL POLICYHOLDER LIABILITIES SHOWN IN THE CONSOLIDATED STATEMENT OF FINANCIAL POSITION 9,759 71,827 81,586 43,944 60,523 28,674 214,727

264
Prudential plc Annual Report 2010
FINANCIAL STATEMENTS > NOTES ON THE GROUP FINANCIAL STATEMENTS
D: LIFE ASSURANCE BUSINESSESCONTINUED
D5: CAPITAL POSITION STATEMENT FOR LIFE ASSURANCE BUSINESSES > CONTINUED
2009 £m
31 December 2009 SAIFWPSFnote i
Total PAC
with-profits
fund
OtherUK life
assurancesubsidi-
aries andfundsnote ii Jackson
Asian life
assurancesubsidi-
aries
Total life
assuranceopera-
tions
M&G(includingPrudential
Capital)
Parentcompany
and share-holders’
equity ofother
subsidi-aries and
fundsGroup
total
GROUP SHAREHOLDERS’ EQUITY
Held outside long-term funds: Net assets – – – 788 3,011 1,382 5,181 173 (1,507) 3,847 Goodwill – – – – – 80 80 1,153 77 1,310
Total – – – 788 3,011 1,462 5,261 1,326 (1,430) 5,157Held in long-term fundsnote iii – – – 1,114 – – 1,114 – – 1,114
Total Group shareholders’ equity – – – 1,902 3,011 1,462 6,375 1,326 (1,430) 6,271
ADJUSTMENTS TO REGULATORY BASIS
Unallocated surplus of with-profits fundsnote v – 9,966 9,966 – – 53 10,019Shareholders’ share of realistic liabilities – (3,001) (3,001) – – – (3,001)Deferred acquisition costs of non-participating business
not recognised for regulatory reporting purposes and goodwill (2) (7) (9) (124) (3,092) (786) (4,011)
Jackson surplus notesnote iv – – – – 154 – 154Investment and policyholder
liabilities valuation differences between IFRS basis and regulatory basis for Jacksonnote viii – – – – 2,221 – 2,221
Adjustment from IAS 19 basis pension deficit attributable to WPSF to pension liability for regulatory purposesnote vii – 65 65 – – – 65
Valuation difference on PAL between IFRS basis and regulatory basis – (1,294) (1,294) – – – (1,294)
Other adjustments to restate these amounts to a regulatory basis (with SAIF and the WPSF on a Peak 2 realistic basis)note v 2 703 705 (171) 194 400 1,128
Total adjustments – 6,432 6,432 (295) (523) (333) 5,281
TOTAL AVAILABLE CAPITAL RESOURCES OF LIFE ASSURANCE BUSINESSES ON LOCAL REGULATORY BASES – 6,432 6,432 1,607 2,488 1,129 11,656

265F
INA
NC
IAL
S
TA
TE
ME
NT
SD
: LIF
E A
SSUR
AN
CE
B
USIN
ESSE
S
2009 £m
31 December 2009 SAIFWPSFnote i
Total PAC
with-profits
fund
Other UK life
assurancesubsidi-
aries andfundsnote ii Jackson
Asian life assurance
subsidi-aries
Total life assurance
operations
POLICYHOLDER LIABILITIESWith-profits liabilities of UK
regulated with-profits funds: Insurance contracts 9,285 28,449 37,734 – – 4,766 42,500 Investment contracts (with discretionary participation features) 396 24,384 24,780 – – 100 24,880
Total 9,681 52,833 62,514 – – 4,866 67,380
Other liabilities: Insurance contracts: With-profits liabilities of non-UK regulated funds – – – – – 3,942 3,942 Unit-linked, including variable annuity – 1,998 1,998 6,793 20,639 9,717 39,147 Other life assurance business 291 12,726 13,017 18,113 25,707 3,287 60,124Investment contracts without
discretionary participation features (principally unit-linked and similar contracts in the UK and GIC liabilities of Jackson)note vi – – – 13,794 1,965 46 15,805
Total 291 14,724 15,015 38,700 48,311 16,992 119,018
TOTAL POLICYHOLDER LIABILITIES SHOWN IN THE CONSOLIDATED STATEMENT OF FINANCIAL POSITION 9,972 67,557 77,529 38,700 48,311 21,858 186,398
Notesi WPSF unallocated surplus includes amounts related to the Hong Kong branch. Policyholder liabilities of the Hong Kong branch are included in
the amounts of Asian life assurance subsidiaries.ii Excluding PAC shareholders’ equity that is included in ‘parent company and shareholders’ equity of other subsidiaries and funds’.iii The term shareholders’ equity held in long-term funds refers to the excess of assets over liabilities attributable to shareholders of funds which are
required by law to be maintained with segregated assets and liabilities.iv For regulatory purposes the Jackson surplus notes are accounted for as capital.v Other adjustments to shareholders’ equity and unallocated surplus include amounts for the value of non-participating business for UK regulated
with-profits funds, deferred tax, admissibility and other items measured differently on the regulatory basis. For Jackson the principal reconciling item is deferred tax related to the differences between IFRS and regulatory bases as shown in the table above and other methodology differences.
vi Insurance business accounted for as financial instruments under IAS 39.vii In determining the IAS 19 adjustment for the purposes of this table the deficit in the Group’s main pension scheme used for the calculation
includes amounts for investments in Prudential insurance policies (see note I3).viii The investment and policyholder liabilities valuation difference between IFRS and regulatory bases for Jackson is mainly due to not all
investments being carried at fair value under the regulatory basis and also due to the valuation difference on annuity reserves.

266
Prudential plc Annual Report 2010
FINANCIAL STATEMENTS > NOTES ON THE GROUP FINANCIAL STATEMENTS
D: LIFE ASSURANCE BUSINESSESCONTINUED
D5: CAPITAL POSITION STATEMENT FOR LIFE ASSURANCE BUSINESSES > CONTINUED
b Basis of preparation, capital requirements and managementEach of the Group’s long-term business operations is capitalised to a sufficiently strong level for its individual circumstances. Details of the Group’s major operations are shown below.
i UK insurance operationsThe FSA rules which govern the Prudential regulation of insurance form part of the Prudential Sourcebook for Insurers, the General Prudential Sourcebook and Interim Prudential Sourcebook for Insurers. Overall, the net requirements of the General Prudential Sourcebook are intended to align the capital adequacy requirements for insurance business more closely with those of banking and investment firms and building societies, for example, by addressing tiers of capital, rather than looking at net admissible assets. An insurer must hold capital resources equal at least to the Minimum Capital Requirement (MCR). The Prudential Sourcebook for Insurers also contains rules on Individual Capital Assessments. Under these rules and the rules of the General Prudential Sourcebook all insurers must assess for themselves the amount of capital needed to back their business. If the FSA views the results of this assessment as insufficient, it may draw up its own Individual Capital Guidance for a firm, which can be superimposed as a requirement.
PAC WPSF and SAIFUnder FSA rules, insurers with with-profits liabilities of more than £500 million must hold capital equal to the higher of the MCR and the Enhanced Capital Requirement (ECR). The ECR is intended to provide a more risk responsive and ‘realistic’ measure of a with-profit insurer’s capital requirements, whereas the MCR is broadly speaking equivalent to the previous required minimum margin under the Interim Prudential Sourcebook and satisfies the minimum EU Standards. Determination of the ECR involves the comparison of two separate measurements of the firm’s resources requirement, which the FSA refers to as the ‘twin peaks’ approach.
The two separate peaks are:
i The requirement comprised by the mathematical reserves plus the ‘Long-Term Insurance Capital Requirement’ (LTICR), together known as the ‘regulatory peak’; and
ii a calculation of the ‘realistic’ present value of the insurer’s expected future contractual liabilities together with projected ‘fair’ discretionary bonuses to policyholders, plus a risk capital margin, together known as the ‘realistic peak’.
Available capital of the WPSF and SAIF of £6.8 billion (2009: £6.4 billion) represents the excess of assets over liabilities on the FSA realistic basis. Unlike the previously discussed FRS 27 basis, realistic liabilities on the regulatory basis include the shareholders’ share of future bonuses. These amounts are shown before deduction of the risk capital margin (RCM) which is estimated to be £1.5 billion at 31 December 2010 (2009: £1.4 billion). The FSA’s basis of setting the RCM is to target a level broadly equivalent to a Standard & Poor’s credit rating of BBB and to judge this by ensuring there are sufficient assets to absorb a one in 200 year event. The RCM calculation achieves this by setting rules for the determination of margins to cover defined stress changes in asset values and yields for market risk, credit risk and termination risk for with-profits policies. As noted in section D2(g)(ii), PAC has discretion in its management actions in the case of adverse investment conditions. Management actions encompass, but are not confined to, investment allocation decisions, levels of reversionary bonuses, crediting rates and total claim values. To illustrate the flexibility of management actions, rates of regular bonus are determined for each type of policy primarily by targeting them at a prudent proportion of the long-term expected future investment return on the underlying assets. The expected future investment return is reduced as appropriate for each type of policy to allow for items such as expenses, charges, tax and shareholders’ transfers. However, the rates declared may differ by product type, or by date of payment of the premiums or date of issue of the policy, if the accumulated annual bonuses are particularly high or low relative to a prudent proportion of the achieved investment return. When target bonus levels change, the PAC Board has regard to the overall financial strength of the long-term fund when determining the length of time over which it will seek to achieve the amended product target bonus level. In normal investment conditions, PAC expects changes to regular bonus rates to be gradual over time and changes are not expected to exceed one per cent per annum over any year. However, discretion is retained as to whether or not a regular bonus is declared each year, and there is no limit on the amount by which regular bonus rates can be changed. As regards smoothing of maturity and death benefits, in normal circumstances PAC does not expect most pay-out values on policies of the same duration to change by more than 10 per cent up or down from one year to the next, although some larger changes may occur to balance pay-out values between different policies. Greater flexibility may be required in certain circumstances, for example, following a significant rise or fall in market values (either sudden or over a period of years) and in such situations the PAC Board may decide to vary the standard bonus smoothing limits to protect the overall interests of policyholders. For surrender benefits, any substantial fall in the market value of the assets of the with-profits sub-fund would lead to changes in the application of MVRs for accumulating with-profits policies, firstly to increase the size of MVRs already being applied and, secondly, to extend the range of policies for which an MVR is applied.

267F
INA
NC
IAL
S
TA
TE
ME
NT
SD
: LIF
E A
SSUR
AN
CE
B
USIN
ESSE
S
Other UK life assurance subsidiaries and fundsThe available capital of £1,707 million (2009: £1,607 million) reflects the excess of regulatory basis assets over liabilities of the subsidiaries and funds, before deduction of the capital resources requirement of £1,086 million (2009: £952 million). The capital resources requirement for these companies broadly reflects a formula which, for active funds, equates to a percentage of regulatory reserves plus a percentage of death strains. Death strains represent the payments made to policyholders upon death in excess of amounts explicitly allocated to fund the provisions for policyholders claims and maturities.
ii Jackson The regulatory framework for Jackson is governed by the requirements of the US NAIC approved risk-based capital standards. Under these requirements life insurance companies report for the most part on a formula-based capital standard that they calculate by applying factors to various asset, premium and reserve items and separate model based calculations of risk associated primarily with variable annuity products. The risk-based capital formula takes into account the risk characteristics of a company, including asset risk, insurance risk, interest rate risk, market risk and business risk. The available capital of Jackson shown above of £2,907 million (2009: £2,488 million) reflects US regulatory basis assets less liabilities including asset valuation reserves. The asset valuation reserve is designed to provide for future credit-related losses on debt securities and losses on equity investments. Available capital includes a reduction for the effect of the interest maintenance reserve, which is designed by state regulators to defer recognition of non-credit related realised capital gains and losses and to recognise them rateably in the future. Jackson’s risk-based capital ratio is significantly in excess of regulatory requirements. At 31 December 2010, Jackson had a permitted practice in effect as granted by the local regulator allowing Jackson to carry certain interest rate swaps at book value, as if statutory hedge accounting were in place, instead of at fair value as would have been otherwise required. Jackson was also required to demonstrate the effectiveness of its interest rate swap programme pursuant to the Michigan Insurance Code. The total effect of this permitted practice, which expires on 1 October 2011 was to increase statutory surplus by £83 million at 31 December 2010. iii Asian operationsThe available capital shown above of £1,378 million (2009: £1,129 million) represents the excess of local regulatory basis assets over liabilities before deduction of required capital of £572 million (2009: £438 million). These amounts have been determined applying the local regulations in each of the operations. The businesses in Asia are subject to local capital requirements in the jurisdictions in which they operate. The Hong Kong business branch of PAC and its capital requirements are subsumed within those of the PAC long-term fund. For the other material Asian operations, the details of the basis of determining regulatory capital and regulatory capital requirements are as follows:
SingaporeIn Singapore a risk-based regulatory framework applies rather than one based on a net premium approach. For participating business, a gross premium reserve, determined using prudent best estimate assumptions and which makes allowance for future bonus, is held. The amount held is subject to a minimum of the higher of the assets attributed to participating business and a gross premium reserve calculated on specified assumptions, but without allowance for future bonus, that include prescribed provisions for adverse deviations (PADs). For non-participating business, gross premium reserves are held. For linked business the value of units is held together with a non-unit reserve calculated in accordance with standard actuarial methodology.
IndonesiaPolicy reserves for traditional business are determined on a modified net premium basis. The valuation interest rates are capped at nine per cent for local currency products and five per cent for foreign currency products. For linked business the value of units is held together with a non-unit reserve calculated in accordance with standard actuarial methodology. Solvency capital is determined using a risk-based capital approach. Insurance companies in Indonesia are expected to maintain the level of net assets above 120 per cent of solvency capital. Due to the 2008 financial crisis, the local regulator provided relief in solvency capital and the measure continues until further notice.
JapanMathematical reserves for traditional business are determined on a net premium basis using prescribed mortality and interest rates. Interest rates reflect the original pricing assumptions. For linked business the value of units is held together with a non-unit reserve calculated in accordance with standard actuarial methodology. With regard to solvency, the adjusted solvency capital assets of the Company must exceed 200 per cent of the risk related capital requirement value at risk. It is thus a risk-based capital approach.

268
Prudential plc Annual Report 2010
FINANCIAL STATEMENTS > NOTES ON THE GROUP FINANCIAL STATEMENTS
D: LIFE ASSURANCE BUSINESSESCONTINUED
D5: CAPITAL POSITION STATEMENT FOR LIFE ASSURANCE BUSINESSES > CONTINUED
MalaysiaIn Malaysia, a risk-based capital framework applies since 2009. For participating business, a gross premium reserve on the guaranteed and non-guaranteed benefits determined using best estimate assumptions is held. The amount held is subject to a minimum of a gross premium reserve on the guaranteed benefits, determined using best estimate assumptions along with provisions of risk margin for adverse deviations (PRADs) discounted at the risk-free rate. For non-participating business, gross premium reserves determined using best estimate assumptions along with provisions of risk margin for adverse deviations (PRADs) discounted at the risk-free rate are held. For linked business the value of units is held together with a non-unit reserve calculated in accordance with standard actuarial methodology. The risk-free rate is derived from a yield curve of zero-coupon spot yields of Malaysian Government Securities.
VietnamMathematical reserves are calculated using a modified net premium approach, using a stable set of assumptions agreed with the regulator. The capital requirement is determined as four per cent of reserves plus a specified percentage of 0.1 per cent of sums at risk for policies with original term less than or equal to five years or 0.3 per cent of sums at risk for policies with original term of more than five years. An additional capital requirement of Vietnamese Dong 200 billion is also required for companies transacting unit-linked business.
KoreaPolicy reserves for traditional business are determined on net premium reserve basis using pricing mortality and prescribed standard interest rates. For linked business, the value of units is held together with the non-unit reserves calculated in accordance with regulatory standard actuarial methodology. The capital requirement in Korea has moved to a risk-based regulatory framework in April 2009 with a two-year transition period where insurers can choose between the prior and new framework. The risk-based regulatory framework was adopted in 2009 by the Company. Under the new framework, insurance companies in Korea are expected to maintain a level of free surplus in excess of the capital requirements with the general target level of solvency margin being in excess of 150 per cent of the risk-based capital.
iv Group capital requirementsIn addition to the requirements at individual company level, FSA requirements under the IGD apply additional prudential requirements for the Group as a whole. Discussion of the Group’s estimated IGD position at 31 December 2010, together with market risk sensitivity disclosure provided to key management, is provided in the business review section of the Group’s 2010 Annual Report and in section C. c Movements in total available capitalTotal available capital for the Group’s life assurance operations has changed during 2010 as follows:
2010 £m
WPSFnote i
OtherUK life
assurancesubsidiaries
and fundsnote iii
Jacksonnote ii
Asian life assurance
subsidiariesnote iv
Group total
AVAILABLE CAPITAL AT 31 DECEMBER 2009 6,432 1,607 2,488 1,129 11,656Changes in assumptions (83) 30 – (2) (55)Changes in management policy 364 – – – 364Changes in regulatory requirements – – (60) – (60)New business and other factors (note v) 87 70 479 251 887
AVAILABLE CAPITAL AT 31 DECEMBER 2010 6,800 1,707 2,907 1,378 12,792

269F
INA
NC
IAL
S
TA
TE
ME
NT
SD
: LIF
E A
SSUR
AN
CE
B
USIN
ESSE
S
Detail on the movement for 2009 is as follows:
2009 £m
WPSFnote i
OtherUK life
assurancesubsidiaries
and fundsnote iii
Jacksonnote ii
Asian life assurance
subsidiariesnote iv
Group total
AVAILABLE CAPITAL AT 31 DECEMBER 2008 5,362 1,053 2,758 1,410 10,583Changes in assumptions 18 23 – 2 43Changes in management policy – 26 – (101) (75)Changes in regulatory requirements – – 128 178 306New business and other factors (note v) 1,052 505 (398) (360) 799
AVAILABLE CAPITAL AT 31 DECEMBER 2009 6,432 1,607 2,488 1,129 11,656
Notesi WPSF The increase in 2010 reflects primarily the positive effect of changes in management policy in respect of hedge strategy, asset allocation, and
other risk alignment changes. The increase in 2009 reflected primarily the positive investment returns earned on the opening available capital and £18 million positive
effect of changes in assumptions on a regulatory basis. ii Jackson The increase of £419 million in 2010 reflects an underlying increase of £340 million (applying the 2010 year end exchange rate of $1.57:£1) and
£79 million of exchange translation gains. The decrease of £270 million in 2009 reflected an underlying increase of £33 million (applying the 2009 year end exchange rate of $1.61:£1)
and £303 million of exchange translation loss. The underlying movement of the available capital of Jackson included the effects of capital contributions, dividends paid to the parent company,
impairment losses and also the effects of hedging transactions.iii Other UK life assurance subsidiaries and funds The effect from the changes in assumptions of valuation interest rates on insurance liabilities is broadly matched by the corresponding effect on
assets leaving no significant impact on the available capital.iv Asian life assurance subsidiaries The increase of £251 million in 2010 reflects an underlying increase of £127 million (applying the relevant 2010 year end exchange rates) and
£124 million of exchange translation gain. The underlying increase of available capital in 2010 included the effects of the acquisition of UOB Life Assurance Limited in Singapore in February 2010.
The decrease of £281 million in 2009 reflected an underlying decrease of £152 million (applying the relevant 2009 year end exchange rates) and £129 million of exchange translation loss. The underlying decrease of available capital in 2009 included the effects of the change to a risk-based capital framework in Malaysia from 1 January 2009 as explained in section b above and also the sale of the Taiwan agency business in June 2009.
v New business and other factors comprise the effect of changes in new business, valuation interest rate, investment return, foreign exchange and other factors.
d Transferability of available capitalFor PAC and all other UK long-term insurers, long-term business assets and liabilities must, by law, be maintained in funds separate from those for the assets and liabilities attributable to non-life insurance business or to shareholders. Only the ‘established surplus’, the excess of assets over liabilities in the long-term fund determined through a formal valuation, may be transferred so as to be available for other purposes. Distributions from the with-profits sub-fund to shareholders reflect the shareholders’ one-ninth share of the cost of declared policyholders’ bonuses. Accordingly, the excess of assets over liabilities of the PAC long-term fund is retained within that company. The retention of the capital enables it to support with-profits and other business of the fund by, for example, providing the benefits associated with smoothing and guarantees. It also provides investment flexibility for the fund’s assets by meeting the regulatory capital requirements that demonstrate solvency and by absorbing the costs of significant events or fundamental changes in its long-term business without affecting the bonus and investment policies. For other UK long-term business subsidiaries, the amounts retained within the companies are at levels which provide an appropriate level of capital strength in excess of the regulatory minimum. For Jackson, capital retention is maintained at a level consistent with an appropriate rating by Standard & Poor’s. Currently Jackson is rated AA. Jackson can pay dividends on its capital stock only out of earned surplus unless prior regulatory approval is obtained. Furthermore, dividends which exceed the greater of statutory net gain from operations for the prior year or 10 per cent of Jackson’s statutory surplus require prior regulatory approval. For Asian subsidiaries, the amounts retained within the companies are at levels that provide an appropriate level of capital strength in excess of the local regulatory minimum. For ring-fenced with-profits funds, the excess of assets over liabilities is retained with distribution tied to the shareholders’ share of bonuses through declaration of actuarially determined surplus. The Singapore and Malaysian businesses may, in general, remit dividends to the UK, provided the statutory insurance fund meets the capital adequacy standard required under local statutory regulations.

270
Prudential plc Annual Report 2010
FINANCIAL STATEMENTS > NOTES ON THE GROUP FINANCIAL STATEMENTS
D: LIFE ASSURANCE BUSINESSESCONTINUED
D5: CAPITAL POSITION STATEMENT FOR LIFE ASSURANCE BUSINESSES > CONTINUED
Available capital of the non-insurance business units is transferable to the life assurance businesses after taking account of an appropriate level of operating capital, based on local regulatory solvency targets, over and above basis liabilities. The economic capital model described in section D1 (concentration of risks) takes into account restrictions on mobility of capital across the Group with capital transfers to and from business units triggered at a solvency level consistent with these targets. The model takes into account restrictions on the availability to the Group of the estate of the various with-profits funds throughout the Group.
e Sensitivity of liabilities and total capital to changed market conditions and capital management policiesPrudential manages its assets, liabilities and capital locally, in accordance with local regulatory requirements and reflecting the different types of liabilities Prudential has in each business. As a result of the diversity of products offered by Prudential and the different regulatory requirements in which it operates, Prudential employs differing methods of asset/liability and capital management, depending on the business concerned. Stochastic modelling of assets and liabilities is undertaken in the UK, Jackson and Asia to assess the economic capital requirements under different confidence intervals and time horizons. In addition, reserve adequacy testing under a range of scenarios and dynamic solvency testing is carried out, including under certain scenarios mandated by the UK, US and Asian regulators. A stochastic approach models the inter-relationship between asset and liability movements, taking into account asset correlation, management actions and policyholder behaviour under a large number of alternative economic scenarios. These scenarios are projected forward over a period of time, typically 25 years or longer, and the liabilities and solvency position of the fund are calculated in each scenario in each future year. The fund’s policy on management actions, including bonus and investment policy, continue to be set in order that they are consistent with the available capital and the targeted risk of default. The sensitivity of liabilities and other components of total capital vary depending upon the type of business concerned and this conditions the approach to asset/liability management. For example, for businesses that are most sensitive to interest rate changes, such as immediate annuity business, Prudential uses cash flow analysis to create a portfolio of debt securities whose value changes in line with the value of liabilities when interest rates change. This type of analysis helps protect profits from changing interest rates. This type of analysis is used in the UK for annuity business and by Jackson for its interest-sensitive and fixed indexed annuities and stable value products. For businesses that are most sensitive to equity price changes, Prudential uses stochastic modelling and scenario testing to look at the future returns on its investments under different scenarios which best reflect the large diversity in returns that equities can produce. This allows Prudential to devise an investment and with-profits policyholder bonus strategy that, on the model assumptions, allows it to optimise returns to its policyholders and shareholders over time while maintaining appropriate financial strength. Prudential uses this methodology extensively in connection with its UK with-profits business.
f Intra-group arrangements in respect of SAIFShould the assets of SAIF be inadequate to meet the guaranteed benefit obligations to the policyholders of SAIF, the PAC long-term fund would be liable to cover any such deficiency. Due to the quality and diversity of the assets in SAIF and the ability of SAIF to revise guaranteed benefits in the event of an asset shortfall, the directors believe that the probability of either the PAC long-term fund or the Group’s shareholders’ funds, under their obligation to maintain the capital position of long-term funds generally, having to contribute to SAIF is remote.

271F
INA
NC
IAL
S
TA
TE
ME
NT
S
E: A
SSET M
AN
AG
EM
EN
T
(INC
LUD
ING
US B
RO
KE
R-D
EA
LER
) A
ND
OT
HE
R O
PE
RA
TIO
NS
E: ASSET MANAGEMENT (INCLUDING US BROKER-DEALER) AND OTHER OPERATIONS
E1: INCOME STATEMENT FOR ASSET MANAGEMENT OPERATIONS
The Group’s asset management operations are based in the UK, Asia and the US where they operate different models and under different brands tailored to their markets. Asset management in the UK is undertaken through M&G which is made up of three distinct businesses, being Retail, Wholesale and Finance, and whose operations include retail asset management, institutional fixed income, pooled life and pension funds, property and private finance. Asset management in Asia serves both the life companies in Asia by managing the life funds and funds underlying the investment linked products and third-party customers through mutual fund business. Asia offers mutual fund investment products in a number of countries within the region, allowing customers to participate in debt, equity and money market investments. Asset management in the US is undertaken through PPM America which manages assets for the Group’s US, UK and Asian affiliates plus also provides investment services to other affiliated and unaffiliated institutional clients including CDOs, private investment funds, institutional accounts and mutual funds. In addition, broker-dealer activities are undertaken in the US where trades in securities are carried out for both third-party customers and for its own account. Other operations covers unallocated corporate activities and includes the head office functions.
a The profit included in the income statement in respect of asset management operations for the year is as follows:
Asset management operations
2010 £m 2009 £m
M&G US Asia§ Total Total
Revenue (excluding revenue of consolidated investment funds and NPH broker-dealer fees) 943 229 251 1,423 1,097
Revenue of consolidated investment funds* 11 – – 11 102 NPH broker-dealer fees† – 369 – 369 317
Gross revenue 954 598 251 1,803 1,516
Charges (excluding revenue of consolidated investment funds and NPH broker-dealer fees) (617) (207) (179) (1,003) (744)
Charges of consolidated investment funds* (11) – – (11) (102)NPH broker-dealer fees† – (369) – (369) (317)
Gross charges (628) (576) (179) (1,383) (1,163)
PROFIT BEFORE TAX 326 22 72 420 353
Comprising:Operating profit based on longer-term investment returns 284 22 72 378 297 Short-term fluctuations in investment returns‡ 47 – – 47 70 Shareholders’ share of actuarial gains and losses on defined benefit pension schemes (5) – – (5) (14)
PROFIT BEFORE TAX 326 22 72 420 353
* Revenue in respect of consolidated investment funds. The investment funds are managed on behalf of third-parties and are consolidated under IFRS in recognition of the control arrangements for the funds. The gains (losses) in respect of the investment funds are non-recourse to M&G and the Group and are added back through charges and consequently there is no impact on the profit before tax.
† NPH broker-dealer fees represents commissions received and then paid to the writing broker on sales of investment products.‡ Short-term fluctuations for M&G are primarily in respect of unrealised value movements on Prudential Capital’s bond portfolio.§ Included within Asian asset management charges of £179 million are £60 million of commissions (2009: £57 million).

272
Prudential plc Annual Report 2010
FINANCIAL STATEMENTS > NOTES ON THE GROUP FINANCIAL STATEMENTS
E: ASSET MANAGEMENT (INCLUDING US BROKER-DEALER) AND OTHER OPERATIONSCONTINUED
E1: INCOME STATEMENT FOR ASSET MANAGEMENT OPERATIONS > CONTINUED
b M&G operating profit based on longer-term investment returns:
2010 £m 2009 £m
Asset management fee income 612 457Other income 3 13Staff costs (263) (205)Other costs (123) (100)
Underlying profit before performance-related fees 229 165Performance-related fees 17 12
Operating profit from asset management operations 246 177Operating profit from Prudential Capital 38 61
Total M&G operating profit based on longer-term investment returns 284 238
The difference between the fees and other income shown above in respect of asset management operations, and the revenue figure for M&G shown (excluding consolidated investment funds) in the main table primarily relates to total revenue of Prudential Capital including short-term fluctuations of £136 million (2009: £155 million) and commissions which have been netted off in arriving at the fee income of £612 million (2009: £457 million) in the table above. The difference in the presentation of commission is aligned with how management reviews the business.

273F
INA
NC
IAL
S
TA
TE
ME
NT
S
E: A
SSET M
AN
AG
EM
EN
T
(INC
LUD
ING
US B
RO
KE
R-D
EA
LER
) A
ND
OT
HE
R O
PE
RA
TIO
NS
E2: STATEMENT OF FINANCIAL POSITION FOR ASSET MANAGEMENT OPERATIONS
Assets, liabilities and shareholders’ funds included in the Group consolidated statement of financial position in respect of asset management operations are as follows:
Asset management operations
2010 £m 2009 £m
M&Gnote iii
US Asia Total Total
ASSETSIntangible assets: Goodwill 1,153 16 61 1,230 1,230 Deferred acquisition costs 9 – – 9 8
Total 1,162 16 61 1,239 1,238
Other non-investment and non-cash assets 854 174 94 1,122 850Financial investments: Loansnote i 1,418 – – 1,418 1,413 Equity securities and portfolio holdings in unit trusts 141 – 10 151 137 Debt securitiesnote ii 1,560 – 14 1,574 1,164 Other investmentsnote v 51 1 7 59 113 Deposits 33 22 25 80 63
Total financial investments 3,203 23 56 3,282 2,890
Cash and cash equivalentsnote v 1,269 39 128 1,436 970
TOTAL ASSETS 6,488 252 339 7,079 5,948
EQUITY AND LIABILITIESEquityShareholders’ equity 1,407 122 258 1,787 1,659Non-controlling interests 4 – – 4 3
Total equity 1,411 122 258 1,791 1,662
LIABILITIESCore structural borrowing of shareholder-financed operations 250 – – 250 –Intra Group debt represented by operational borrowings at
Group levelnote iv 2,560 – – 2,560 2,038Net asset value attributable to external holders of consolidated
unit trusts and similar fundsnote v 458 – – 458 410Other non-insurance liabilities 1,809 130 81 2,020 1,838
Total liabilities 5,077 130 81 5,288 4,286
TOTAL EQUITY AND LIABILITIES 6,488 252 339 7,079 5, 948
Notesi Loans
The M&G loans of £1,418 million (2009: £1,413 million) relate to loans and receivables managed by Prudential Capital. These assets are generally secured but have no external credit ratings. Internal ratings prepared by the Group’s asset management operations as part of the risk management process, are £213 million A+ to A– (2009: £92 million), £873 million BBB+ to BBB– (2009: £835 million), £219 million BB+ to BB– (2009: £330 million) and £113 million B+ to B– (2009: £156 million).
ii Debt securities Of the total debt securities of £1,574 million in 2010 (2009: £1,164 million) of which £1,560 relates to M&G (2009: £1,149 million), £1,468 million were rated AAA to A– by Standard and Poor’s or Aaa rated by Moody’s (2009: £1,072 million).
iii M&G includes those assets and liabilities in respect of Prudential Capital. iv Intra Group debt represented by operational borrowings at Group level
Operational borrowings for M&G are in respect of Prudential Capital’s short-term fixed income security programme and comprise £2,311 million (2009: £2,031million) of commercial paper and £249 million (2009: £7 million) of medium-term notes.
v Consolidated investment funds The M&G statement of financial position shown above includes investment funds which are managed on behalf of third-parties. In respect of these funds, the statement of financial position includes cash and cash equivalents of £304 million (2009: £269 million), £167 million of other investments (2009: £158 million), £(13) million of other net assets and liabilities (2009: £(17) million) and the net asset value attributable to external unit holders of £458 million (2009: £410 million) which are non-recourse to M&G and the Group.

274
Prudential plc Annual Report 2010
FINANCIAL STATEMENTS > NOTES ON THE GROUP FINANCIAL STATEMENTS
E: ASSET MANAGEMENT (INCLUDING US BROKER-DEALER) AND OTHER OPERATIONSCONTINUED
E2: STATEMENT OF FINANCIAL POSITION FOR ASSET MANAGEMENT OPERATIONS > CONTINUED
Reconciliation of movement in investments
A reconciliation of the total investments of asset management operations from the beginning of the year to the end of the year is as follows:
M&G£m
US£m
Asia£m
Total£m
AT 1 JANUARY 2009 Total investments (including derivative assets) 3,216 40 47 3,303 Less: Derivative liabilities (292) – – (292)
Directly held investments, net of derivative liabilities 2,924 40 47 3,011
Net cash outflow from operating activities (124) (21) (3) (148)Realised gains in the year 34 – – 34Unrealised gains and losses and exchange movements in the year (48) (4) (4) (56)
Movement in the year of directly held investments, net of derivative liabilities (138) (25) (7) (170)
AT 31 DECEMBER 2009/1 JANUARY 2010 Total investments (including derivative assets) 2,835 15 40 2,890 Less: Derivative liabilitiesnote G3 (49) – – (49)
Directly held investments, net of derivative liabilities 2,786 15 40 2,841
Net cash inflow from operating activities 310 8 11 329Realised gains in the year 11 – – 11Unrealised gains and losses and exchange movements in the year 18 – 5 23
Movement in the year of directly held investments, net of derivative liabilities 339 8 16 363
AT 31 DECEMBER 2010 Total investments (including derivative assets) 3,203 23 56 3,282 Less: Derivative liabilitiesnote G3 (78) – – (78)
Directly held investments, net of derivative liabilities 3,125 23 56 3,204
E3: REGULATORY AND OTHER SURPLUS
Certain asset management operations are subject to regulatory requirements. The movement in the year of the surplus regulatory capital position of these operations, combined with the movement in the IFRS basis shareholders’ funds for unregulated asset management operations, is as follows:
Asset management operations
2010 £m 2009 £m
M&G US Asia Total Total
REGULATORY AND OTHER SURPLUSBeginning of year 85 111 126 322 155Gains during the year 245 12 55 312 97Movement in capital requirement 9 – (32) (23) 125Capital injection – – 1 1 9Distributions made (152) (4) (38) (194) (37)Exchange movement – 3 11 14 (27)
End of year 187 122 123 432 322
The movement in the year reflects gains driven by profits generated during the year and also changes in regulatory requirements. Distributions consist of dividends paid up to the parent company.
The M&G figures include those for Prudential Capital.

275F
INA
NC
IAL
S
TA
TE
ME
NT
S
E: A
SSET M
AN
AG
EM
EN
T
(INC
LUD
ING
US B
RO
KE
R-D
EA
LER
) A
ND
OT
HE
R O
PE
RA
TIO
NS
E4: SENSITIVITY OF PROFIT AND EQUITY TO MARKET AND OTHER FINANCIAL RISK
i Currency translationConsistent with the Group’s accounting policies, the profits of the Asia and PPM America asset management operations are translated at average exchange rates and shareholders’ equity at the closing rate for the reporting period. For 2010, the rates for the most significant operations are given in note B4. A 10 per cent increase in the relevant Asian exchange rates would have reduced reported profit before tax attributable to shareholders and shareholders’ equity, excluding goodwill attributable to Asia and PPM America asset management operations, by £9 million (2009: £5 million) and £28 million (2009: £23 million) respectively.
ii Other sensitivities to other financial risks for asset management operationsThe principal sensitivities to other financial risk of asset management operations are credit risk on the bridging loan portfolio (as described in note E2) of the Prudential Capital operation and the indirect effect of changes to market values of funds under management. Due to the nature of the asset management operations there is limited direct sensitivity to movements in interest rates. Total debt securities held at 31 December 2010 by asset management operations were £1,574 million (2009: £1,164 million), the majority of which are held by the Prudential Capital operation. Debt securities held by M&G and Prudential Capital are in general variable rate bonds and so market value is limited in sensitivity to interest rate movements and consequently any change in interest rates would not have a material impact on profit or shareholder’s equity. Asset management operations do not hold significant investments in property or equities.
E5: OTHER OPERATIONS
Other operations consist of unallocated corporate activities relating to Group Head Office and the Asia regional head office, with net income and expenditure for the year of negative £450 million (2009: negative £395 million) as detailed in note B1. An analysis of the assets and liabilities of other operations is shown in note B6.

276
Prudential plc Annual Report 2010
FINANCIAL STATEMENTS > NOTES ON THE GROUP FINANCIAL STATEMENTS
F: INCOME STATEMENT NOTES
F1: SEGMENTAL INFORMATION
Year ended 31 December 2010 £m
Insurance operations Asset management (note E1)
Totalsegment
Unallo-cated
corporateGroup
totalUK US Asia M&G US Asia
Gross premiums earned 6,371 11,817 6,380 – – – 24,568 – 24,568Outward reinsurance premiums (128) (83) (146) – – – (357) – (357)
Earned premiums, net of reinsurance 6,243 11,734 6,234 – – – 24,211 – 24,211Investment returnnote ii 14,374 4,576 2,744 186 1 3 21,884 (115) 21,769Other income 233 (24) 139 768 597 248 1,961 (295) 1,666
Total revenue, net of reinsurance 20,850 16,286 9,117 954 598 251 48,056 (410) 47,646
Benefits and claims (18,674) (15,472) (6,462) – – – (40,608) – (40,608)Outward reinsurers’ share of benefits
and claims 243 49 43 – – – 335 – 335Movement in unallocated surplus
of with-profits fundsnote iv 70 – (315) – – – (245) – (245)
Benefits and claims and movements in unallocated surplus of with-profits funds, net of reinsurance (18,361) (15,423) (6,734) – – – (40,518) – (40,518)
Acquisition costs and other operating expenditurenote F3 (1,093) (395) (1,662) (628) (576) (179) (4,533) (266) (4,799)
Finance costs: interest on core structural borrowings of shareholder-financed operations – (13) – – – – (13) (244) (257)
Total charges, net of reinsurance (19,454) (15,831) (8,396) (628) (576) (179) (45,064) (510) (45,574)
Profit (loss) before tax (being tax attributable to shareholders’ and policyholders’ returns)note i 1,396 455 721 326 22 72 2,992 (920) 2,072
Tax charge attributable to policyholders’ returns (536) – (75) – – – (611) – (611)
Profit (loss) from continuing operations before tax attributable to shareholders 860 455 646 326 22 72 2,381 (920) 1,461
This is represented in the segmental analysis of profit from continuing operations before tax attributable to shareholders in note B1 as follows:
Year ended 31 December 2010 £m
Insurance operations Asset managementTotal
segment
Unallo-cated
corporateGroup
totalUK US Asia M&G US Asia
Operating profit based on longer-term investment returnsnote iii 719 833 532 284 22 72 2,462 (521) 1,941
Short-term fluctuations in investment returns on shareholder-backed business 116 (378) 114 47 – – (101) (22) (123)
Shareholders’ share of actuarial and other gains and losses on defined benefit pension schemes (5) – – (5) – – (10) – (10)
Costs of terminated AIA transaction – – – – – – – (377) (377)Gain on dilution of holding in PruHealth
investment 30 – – – – – 30 – 30
Profit (loss) from continuing operations before tax attributable to shareholders 860 455 646 326 22 72 2,381 (920) 1,461

277F
INA
NC
IAL
S
TA
TE
ME
NT
SF: IN
CO
ME
STA
TE
ME
NT
N
OT
ES
Year ended 31 December 2009 £m
Insurance operations Asset management (note E1)
Totalsegment
Unallo-cated
corporateGroup
totalUK US Asia M&G US Asia
Gross premiums earned 5,757 9,197 5,345 – – – 20,299 – 20,299Outward reinsurance premiums (122) (82) (119) – – – (323) – (323)
Earned premiums, net of reinsurance 5,635 9,115 5,226 – – – 19,976 – 19,976Investment returnnote ii 17,366 5,070 4,357 420 68 74 27,355 (466) 26,889Other income 176 (18) 110 379 432 143 1,222 12 1,234
Total revenue, net of reinsurance 23,177 14,167 9,693 799 500 217 48,553 (454) 48,099
Benefits and claims (18,521) (13,297) (8,083) – – – (39,901) – (39,901)Outward reinsurers’ share of benefits
and claims 214 12 39 – – – 265 – 265Movement in unallocated surplus of
with-profits fundsnote iv (1,893) – 334 – – – (1,559) – (1,559)
Benefits and claims and movements in unallocated surplus of with-profits funds, net of reinsurance (20,200) (13,285) (7,710) – – – (41,195) – (41,195)
Acquisition costs and other operating expenditurenote F3 (1,508) (383) (1,536) (505) (496) (162) (4,590) 18 (4,572)
Finance costs: interest on core structural borrowings of shareholder-financed operations – (13) – – – – (13) (196) (209)
Loss on sale of Taiwan agency business – – (559) – – – (559) – (559)
Total charges, net of reinsurance (21,708) (13,681) (9,805) (505) (496) (162) (46,357) (178) (46,535)
Profit (loss) before tax (being tax attributable to shareholders’ and policyholders’ returns)note i 1,469 486 (112) 294 4 55 2,196 (632) 1,564
Tax charge attributable to policyholders’ returns (750) – (68) – – – (818) – (818)
Profit (loss) from continuing operations before tax attributable to shareholders 719 486 (180) 294 4 55 1,378 (632) 746
This is represented in the segmental analysis of profit from continuing operations before tax attributable to shareholders in note B1 as follows:
Year ended 31 December 2009 £m
Insurance operations Asset managementTotal
segment
Unallo-cated
corporateGroup
totalUK US Asia M&G US Asia
Operating profit based on longer-term investment returnsnote iii 657 618 410 238 4 55 1,982 (418) 1,564
Short-term fluctuations in investment returns on shareholder-backed business 108 (132) 31 70 – – 77 (200) (123)
Shareholders’ share of actuarial and other gains and losses on defined benefit pension schemes (46) – – (14) – – (60) (14) (74)
Loss on sale and results for Taiwan agency business – – (621) – – – (621) – (621)
Profit (loss) from continuing operations before tax attributable to shareholders 719 486 (180) 294 4 55 1,378 (632) 746

278
Prudential plc Annual Report 2010
FINANCIAL STATEMENTS > NOTES ON THE GROUP FINANCIAL STATEMENTS
F: INCOME STATEMENT NOTESCONTINUED
F1: SEGMENTAL INFORMATION > CONTINUED
Notesi The measure is the formal profit (loss) before tax measure under IFRS but is not the result attributable to shareholders.ii Investment return principally comprises: – Interest and dividends; – Realised and unrealised gains and losses on securities and derivatives classified as fair value through profit and loss under IAS 39; and – Realised gains and losses, including impairment losses, on securities classified as available-for-sale under IAS 39.iii The Group has amended the presentation of operating profit for its US insurance operations to remove the net equity hedge accounting effect
(incorporating related amortisation of deferred acquisition costs) and include it in short-term fluctuations. The 2009 comparatives have been amended accordingly. Note A4d(ii) explains the effect of the change.
iv The movement in unallocated surplus of with-profits funds for Asia above includes movement relating to the Hong Kong branch of PAC. For the purpose of the presentation of unallocated surplus of with-profits funds within the statement of financial position, the Hong Kong branch balance is shown within the unallocated surplus of the PAC with-profits sub-fund.
F2: REVENUE
2010 £m 2009 £m
LONG-TERM BUSINESS PREMIUMSInsurance contract premiums 23,647 19,347Investment contracts with discretionary participation feature premiums 750 789Inwards reinsurance premiums 171 163Less: reinsurance premiums ceded (357) (323)
Earned premiums, net of reinsurancenote iv 24,211 19,976
INVESTMENT RETURNRealised and unrealised gains and losses on securities at fair value through profit and loss 14,728 18,175Realised and unrealised losses and gains on derivatives at fair value through profit and loss (891) 1,164Realised losses on available-for-sale securities, previously recognised in other comprehensive income (51) (420)Realised losses on loans (12) (115)Interestnotes i,ii 5,976 5,575Dividends 1,394 1,755Other investment return 625 755
Investment return 21,769 26,889
FEE INCOME FROM INVESTMENT CONTRACT BUSINESS AND ASSET MANAGEMENTnotes iii,iv 1,666 1,234
TOTAL REVENUE 47,646 48,099
Notesi The segmental analysis of interest income is as follows:
2010 £m 2009 £m
Insurance operations: UK 4,371 3,848 US 1,014 1,051 Asia 412 522
Asset management operations: M&G 127 140 US – 2 Asia 2 2
TOTAL SEGMENT 5,926 5,565
Unallocated corporate 50 10
TOTAL 5,976 5,575
ii Interest income includes £21 million (2009: £17 million) accrued in respect of impaired securities. iii Fee income includes £11 million (2009: £1 million) relating to financial instruments that are not held at fair value through profit and loss. These fees primarily related to prepayment fees, late fees and syndication fees.

279F
INA
NC
IAL
S
TA
TE
ME
NT
SF: IN
CO
ME
STA
TE
ME
NT
N
OT
ES
iv The following table provides additional segmental analysis of revenue from external customers:
2010 £m
Asia US UK Intragroup Total
Revenue from external customers:Insurance operations 6,373 11,710 6,476 (10) 24,549Asset management 248 597 768 (314) 1,299Unallocated corporate – – 29 – 29Intragroup revenue eliminated on consolidation (77) (72) (175) 324 –
Total revenue from external customers 6,544 12,235 7,098 – 25,877
2009 £m
Asia US UK Intragroup Total
Revenue from external customers:Insurance operations 5,336 9,097 5,822 (11) 20,244Asset management 213 499 513 (271) 954Unallocated corporate – – 12 – 12Intragroup revenue eliminated on consolidation (70) (67) (145) 282 –
Total revenue from external customers 5,479 9,529 6,202 – 21,210
Revenue from external customers is made up of the following:
2010 £m 2009 £m
Earned premiums, net of reinsurance 24,211 19,976Fee income from investment contract business and asset management (included within ‘Other income’) 1,666 1,234
Total revenue from external customers 25,877 21,210
In their capacity as fund managers to fellow Prudential Group subsidiaries, M&G, the US and the Asian asset management businesses earn fees for investment management and related services. Intragroup fees included within asset management revenue were £314 million (2009: £271 million) earned £165 million (2009: £134 million) by M&G, £72 million (2009: £67 million) by the US asset management segment and £77 million (2009: £70 million) by the Asian asset management segment. In 2010, the remaining £10 million (2009: £11 million) of intragroup revenue was recognised by UK insurance operations. These services are charged at appropriate arm’s length prices, typically priced as a percentage of funds under management. Revenue from external customers of Asian, US and UK insurance operations shown above are net of outwards reinsurance premiums of £146 million, £83 million and £128 million respectively (2009: £119 million, £82 million and £122 million respectively). In Asia, revenue from external customers from no individual country exceeds 10 per cent of the Group total. The largest country is Hong Kong with a total revenue from external customers of £1,246 million (2009: £1,013 million). Due to the nature of the business of the Group, there is no reliance on any major customers.

280
Prudential plc Annual Report 2010
FINANCIAL STATEMENTS > NOTES ON THE GROUP FINANCIAL STATEMENTS
F: INCOME STATEMENT NOTESCONTINUED
F3: ACQUISITION COSTS AND OTHER EXPENDITURE
2010 £m 2009 £m
Acquisition costs incurrednotes i,ii 2,024 1,796Acquisition costs deferred less amortisation of acquisition costs (918) (763)Administration costs and other expenditure 3,496 2,924Movements in amounts attributable to external unit holdersnote v 197 615
Total acquisition costs and other expenditurenotes iii,iv,vi 4,799 4,572
Notesi The acquisition costs as shown on the table above relate to policy acquisition costs. Acquisition costs from business combinations are included
within other expenditure. Acquisition costs in 2010 comprise amounts related to insurance contracts of £941 million (2009: £871 million), and investment contracts and asset management contracts of £165 million (2009: £162 million).
ii There were no fee expenses relating to financial liabilities held at amortised cost included in acquisition costs in 2010 and 2009.iii The total depreciation and amortisation expense is £309 million (2009: £377 million). Of this amount, £226 million (2009: £305 million) relates to
amortisation of deferred acquisition costs of insurance contracts and asset management contracts, which is primarily borne by the insurance operations. The segmental analysis of total depreciation and amortisation expense is as follows:
2010 £m 2009 £m
Insurance operations: UK 35 25 US (6) 88 Asia 258 246
Asset management operations: M&G 8 2 US 2 2 Asia 4 4
TOTAL SEGMENT 301 367
Unallocated corporate 8 10
TOTAL 309 377
iv Interest expense, excluding interest on core structural borrowings of shareholder-financed operations, amounted to £113 million (2009: £89 million) and is included within total acquisition costs and other operating expenditure as part of investment management expenses. The segmental analysis of this interest expense is as follows:
2010 £m 2009 £m
Insurance operations: UK 28 28 US 33 32 Asia 13 1
Asset management operations: M&G 19 – US – – Asia – –
TOTAL SEGMENT 93 61
Unallocated corporate 20 28
TOTAL 113 89
v Movements in amounts attributable to external unit holders comprises £61 million (2009: £310 million) for UK insurance operations £136 million (2009: £305 million) for Asian insurance operations.

281F
INA
NC
IAL
S
TA
TE
ME
NT
SF: IN
CO
ME
STA
TE
ME
NT
N
OT
ES
vi The total amounts for acquisition costs and other expenditure shown above includes Corporate Expenditure shown in note B1 (Segment disclosure – income statement). The charge for Corporate Expenditure comprises:
2010 £m 2009 £m
Group head office: Regular and project costs (147) (140) Provision for property leases and other non-recurrent items (25) (6)
(172) (146)
Asia regional office: Gross costs (90) (95) Recharges to Asia operations 42 38
(48) (57)
Total (220) (203)
F4: FINANCE COSTS: INTEREST ON CORE STRUCTURAL BORROWINGS OF SHAREHOLDER-FINANCED OPERATIONS
Finance costs consist of £244 million (2009: £196 million) interest on core debt of the parent company and £13 million (2009: £13 million) on US insurance operations’ surplus notes.
F5: TAX
a Total tax charge by nature of expenseAn analysis of the total tax benefit (expense) of continuing operations recognised in the income statement by nature of benefit (expense) is as follows:
2010 £m 2009 £m
Current tax expense: Corporation tax (378) (500) Adjustments in respect of prior years 287 (29)
Total current tax (91) (529)
Deferred tax arising from: Origination and reversal of temporary differences (518) (340) Expense in respect of a previously unrecognised tax loss, tax credit or temporary difference
from a prior period (27) (4)
Total deferred tax charge (545) (344)
Total tax charge (636) (873)
The total tax expense arises as follows:
2010 £m 2009 £m
Current tax expense: UK (61) (527) Foreign (30) (2)
(91) (529)
Deferred tax (charge) credit: UK (252) (368) Foreign (293) 24
(545) (344)
Total (636) (873)

282
Prudential plc Annual Report 2010
FINANCIAL STATEMENTS > NOTES ON THE GROUP FINANCIAL STATEMENTS
F: INCOME STATEMENT NOTESCONTINUED
F5: TAX > CONTINUED
The current tax charge of £91 million includes £13 million for 2010 (2009: charge of £6 million) in respect of the tax charge for Hong Kong. The Hong Kong current tax charge is calculated as 16.5 per cent for all periods on either (i) five per cent of the net insurance premium or (ii) the estimated assessable profits, depending on the nature of the business written. The total tax charge of £636 million for 2010 (2009: charge of £873 million) comprises a charge of £313 million (2009: charge of £895 million) for UK tax and a charge of £323 million (2009: credit of £22 million) for overseas tax. This tax charge comprises tax attributable to policyholders and unallocated surplus of with-profits funds, unit-linked policies and shareholders. The tax charge attributable to shareholders of £25 million for 2010 (2009: charge of £55 million) comprises a credit of £187 million (2009: charge of £176 million) for UK tax and a charge of £212 million (2009: credit of £121 million) for overseas tax. The tax charge attributable to shareholders’ returns includes an exceptional tax credit of £158 million which primarily relates to the impact of a settlement agreed with the UK Tax authorities. This exceptional tax credit is recorded within ‘Adjustments in respect of prior years’. In addition, adjustments in respect of prior years also includes other changes that arose as a result of routine revision of tax returns. The total deferred tax (charge) arises as follows:
2010 £m 2009 £m
Unrealised gains and losses on investments (217) (35)Balances relating to investment and insurance contracts (28) (12)Short-term timing differences (431) (105)Capital allowances (8) 1Unused tax losses 139 (193)
Deferred tax charge (545) (344)
In 2010, a deferred tax charge of £287 million (2009: charge of £546 million) has been taken through other comprehensive income. Other movements in deferred tax totalling a £40 million charge is mainly comprised of foreign exchange movements. When these amounts are taken with the deferred tax charge shown above the result is an increase of £0.9 billion in the Group’s net deferred tax liability (2009: increase of £0.8 billion).
b Reconciliation of effective tax rateThe total tax charge is attributable to shareholders and policyholders as summarised in the income statement.
i Summary of pre-tax profit and tax (charge)The income statement includes the following items:
2010 £m 2009 £m
Profit before tax 2,072 1,564Tax charge attributable to policyholders’ returns (611) (818)
Profit before tax attributable to shareholders 1,461 746Tax attributable to shareholders’ profits: Tax charge (636) (873) Less: tax attributable to policyholders’ returns 611 818
Tax (charge) attributable to shareholders’ returns (25) (55)
Profit from continuing operations after tax 1,436 691

283F
INA
NC
IAL
S
TA
TE
ME
NT
SF: IN
CO
ME
STA
TE
ME
NT
N
OT
ES
ii OverviewFor the purposes of explaining the relationship between tax expense and accounting profit, it is appropriate to consider the sources of profit and tax by reference to those that are attributable to shareholders and policyholders, as follows:
2010 £m 2009 £m
Attributable to shareholders
Attributable to policyholders* Total
Attributable to shareholders
Attributable topolicyholders* Total
Profit before tax 1,461 611 2,072 746 818 1,564Taxation charge: Expected tax rate 28% 100% 49% 31% 100% 67% Expected tax charge (406) (611) (1,017) (233) (818) (1,051) Variance from expected tax chargenote v(ii) 381 – 381 178 – 178 Actual tax (charge) (25) (611) (636) (55) (818) (873)Average effective tax rate 2% 100% 31% 7% 100% 56%
* For the column entitled ‘Attributable to policyholders’, the profit before tax represents income, net of post-tax transfers to unallocated surplus of with-profits funds, before tax attributable to policyholders and unallocated surplus of with-profits funds and unit-linked policies.
Due to the requirements of the financial reporting standards IAS 1 and IAS 12, the profit (loss) before tax and tax charge reflect the aggregate of amounts that are attributable to shareholders and policyholders. Profit (loss) before tax comprises profit attributable to shareholders and pre-tax profit attributable to policyholders of linked and with-profits funds and unallocated surplus of with-profits funds. The total tax charge for linked and with-profits business includes tax expense on unit-linked and with-profits funds attributable to policyholders, the unallocated surplus of with-profits funds and the shareholders’ profits. This feature arises from the basis of taxation applied to life and pension business, principally in the UK, but with similar bases applying in certain Asian operations, and is explained in note (iii) below. Furthermore, the basis of preparation of Prudential’s financial statements incorporates the additional feature that, as permitted under IFRS 4, the residual equity of the Group’s with-profits funds, i.e. unallocated surplus, is recorded as a liability with transfers to and from that liability reflected in pre-tax profits. This gives rise to anomalous effective tax rates for profits attributable to policyholders (as described in note (iv) below). In meeting the reconciliation requirements set out in paragraph 81(c) of IAS 12, the presentation shown in this disclosure note seeks to ensure that the explanation of the relationship between tax expense and accounting profit draw properly the distinction between the elements of the profit and tax charge that are attributable to policyholders and shareholders as explained below in notes (iv) and (v) respectively. Due to the nature of the basis of taxation of UK life and pension business (as described in note (iii) below), and the significance of the results of the business to the Group, it is inappropriate to seek to explain the effective tax rate on profit before tax by the traditional approach that would apply for other industries. The shareholder elements are the components of the profit and tax charge that are of most direct relevance to investors, and it is this aspect that the IAS 12 reconciliation requirement is seeking to explain for companies that do not need to account for both with-profits and unit-linked funds, where tax is borne by the Company on the policyholders’ behalf and which is not contemplated by the IFRS requirement.

284
Prudential plc Annual Report 2010
FINANCIAL STATEMENTS > NOTES ON THE GROUP FINANCIAL STATEMENTS
F: INCOME STATEMENT NOTESCONTINUED
F5: TAX > CONTINUED
iii Basis of taxation for UK life and pension businessDifferent rules apply under UK tax law for taxing pension business and life insurance business and there are detailed rules for apportioning the investment return and profits of the fund between the types of business. The investment return referable to pension business, and some other less significant classes of business, is exempt from taxation, but tax is charged on the profit that shareholders derive from writing such business at the corporate rate of tax. The rules for taxing life insurance business are more complex. Initially, the UK regime seeks to tax the regulatory basis investment return less management expenses (I-E) on this business as it arises. However, in determining the actual tax charge, a calculation of the shareholder profits for taxation purposes from writing life insurance business also has to be made and compared with the I-E profit. If the shareholder profit is higher than the I-E amount, extra income is attributable to the I-E calculation until the I-E profit equals the shareholder profit. If on the other hand, the I-E profit is the greater, then an amount equal to the shareholder profit is taxed at the corporate rate of tax, with the remainder of the I-E profit being taxed at the lower policyholder rate of tax. The purpose of this approach is to ensure that the Company is always at a minimum taxed on the profit, as defined for taxation purposes by reference to the Company’s regulatory returns (rather than IFRS basis results), that it has earned. The shareholders’ portion of the long-term business is taxed at the shareholders’ rate, with the remaining portion taxed at rates applicable to the policyholders. It is to be noted that the calculations described are determined using data from the regulatory basis returns rather than the IFRS basis results. The differences between the regulatory and accounting bases are very significant and extremely complex, rendering any explanation in general purpose financial statements to be of little if any use to users.
iv Profits attributable to policyholders and related taxAs noted above, it is necessary under IFRS requirements to include the total tax charge of the Company (both policyholder and shareholder elements) in the tax charge disclosed in the income statement. For with-profits business, total pre-tax profits reflect the aggregate of profits attributable to policyholders and shareholders. However, amounts attributable to the equity of with-profits funds are carried in the liability for unallocated surplus. Also, as described in note (iii), UK with-profits business is taxed on a basis that affects policyholders’ unallocated surplus of with-profits funds and shareholders. For the PAC with-profits sub-fund, transfers to and from unallocated surplus are recorded in the income statement, so that after charging the total tax borne by the fund, the net balance reflects the statutory transfer from the fund for the year. The statutory transfer represents 10 per cent of the actuarially determined surplus for the year that is attributable to shareholders. For SAIF, similar transfers are made. However, in the case of SAIF, a net nil balance is derived, reflecting the lack of shareholder interest in the financial performance of the fund (other than through asset management arrangements). The accounting anomaly that arises under IFRS is that due to the fact that the net of tax profit attributable to with-profits policyholders is zero, the Company’s presentation of pre-tax profit attributable to policyholders reflects an amount that is the mirror image of the tax charge attributable to policyholders. For unit-linked business, pre-tax profits also reflect the aggregate of profits attributable to policyholders and shareholders. The pre-tax profits attributable to policyholders represent fees earned that are used to pay tax borne by the Company on policyholders’ behalf. The net of tax profit attributable to policyholders for unit-linked business is thus zero. The combined effect of these features is such that providing a reconciliation of the tax charge attributable to policyholders to an expected charge based on the standard corporate rate of tax on IFRS basis profits attributable to policyholders is not relevant. In summary, for accounting purposes, in all cases and for all reporting periods, the apparent effective rate for profit attributable to policyholders and unallocated surplus is 100 per cent. However, it is to be noted that the 100 per cent rate does not reflect a rate paid on the profits attributable to policyholders. It instead reflects the basis of accounting for unallocated surplus coupled with the distinction made for performance reporting between sources of profit attributable to shareholders, policyholders and unallocated surplus and IFRS requirements in respect of reporting of all pre-tax profits and all tax charges irrespective of policyholder or shareholder economic interest.

285F
INA
NC
IAL
S
TA
TE
ME
NT
SF: IN
CO
ME
STA
TE
ME
NT
N
OT
ES
v Reconciliation of tax charge on profit attributable to shareholders for continuing operations:
2010 £m (except for tax rates)
Asian insurance
operations
US insurance
operations
UK insurance
operationsOther
operations Total
Profit (loss) before tax attributable to shareholders: Operating profit based on longer-term investment returnsnote iii 532 833 719 (143) 1,941 Short-term fluctuations in investment returns 114 (378) 116 25 (123) Shareholders’ share of actuarial and other gains and losses on defined benefit pension schemes – – (5) (5) (10) Cost of terminated AIA transaction (377) (377) Gain on dilution of holding in PruHealth – – 30 – 30
Total 646 455 860 (500) 1,461
Expected tax rates:note i
Operating profit based on longer-term investment returnsnote iii 22% 35% 28% 28% 29% Short-term fluctuations in investment returns 25% 35% 28% 28% 52% Shareholders’ share of actuarial and other gains and losses on defined benefit pension schemes – – 28% 28% 20% Cost of terminated AIA transaction – – – 28% 28% Gain on dilution of holding in PruHealth – – 28% – 28%
Expected tax (charge) credit based on expected tax rates: Operating profit based on longer-term investment returnsnote iii (117) (292) (201) 40 (570) Short-term fluctuations in investment returns (29) 132 (32) (7) 64 Shareholders’ share of actuarial and other gains and losses on defined benefit pension schemes – – 1 1 2 Cost of terminated AIA transaction – – – 106 106 Gain on dilution of holding in PruHealth – – (8) – (8)
Total (146) (160) (240) 140 (406)
Variance from expected tax charge:note ii Operating profit based on longer-term investment returnsnote iii 59 43 18 237 357 Short-term fluctuations in investment returns 21 – – 7 28 Shareholders’ share of actuarial and other gains and losses on defined benefit pension schemes – – – 1 1 Cost of terminated AIA transaction – – – (13) (13) Gain on dilution of holding in PruHealth – – 8 – 8
Total 80 43 26 232 381
Actual tax (charge) credit: Operating profit based on longer-term investment returns, excluding exceptional tax creditnote iii (58) (249) (183) 119 (371) Exceptional tax credit* – – – 158 158
Operating profit based on longer-term investment returns (58) (249) (183) 277 (213) Short-term fluctuations in investment returns (8) 132 (32) – 92 Shareholders’ share of actuarial and other gains and losses on defined benefit pension schemes – – 1 2 3 Cost of terminated AIA transaction – – – 93 93 Gain on dilution of holding in PruHealth – – – – –
Total (66) (117) (214) 372 (25)
Actual tax rate: Operating profit based on longer-term investment returns 11% 30% 25% 194% 11% Total profit 10% 26% 25% 74% 2%Actual tax rate (excluding exceptional tax credit):* Operating profit based on longer-term investment returns 11% 30% 25% 83% 19% Total profit 10% 26% 25% 43% 13%
* The tax charge attributable to shareholders’ return includes an exceptional tax credit of £158 million which primarily relates to the impact of a settlement agreed with the UK tax authorities.

286
Prudential plc Annual Report 2010
FINANCIAL STATEMENTS > NOTES ON THE GROUP FINANCIAL STATEMENTS
F: INCOME STATEMENT NOTESCONTINUED
F5: TAX > CONTINUED
2009* £m (except for tax rates)
Asian insurance
operations
US insurance
operations
UK insurance
operationsOther
operations Total
Profit (loss) before tax attributable to shareholders: Operating profit based on longer-term investment returnsnote iii 410 618 657 (121) 1,564 Short-term fluctuations in investment returns 31 (132) 108 (130) (123) Shareholders’ share of actuarial and other gains and losses on defined benefit pension schemes – – (46) (28) (74) Loss on sale and results for Taiwan agency business (621) – – – (621)
Total (180) 486 719 (279) 746
Expected tax rates:note i
Operating profit based on longer-term investment returnsnote iii 24% 35% 28% 28% 30% Short-term fluctuations in investment returns 25% 35% 28% 36% 45% Shareholders’ share of actuarial and other gains and losses on defined benefit pension schemes – – 28% 28% 28% Loss on sale and results for Taiwan agency business 25% – – – 25%
Expected tax (charge) credit based on expected tax rates: Operating profit based on longer-term investment returnsnote iii (98) (216) (184) 34 (464) Short-term fluctuations in investment returns (8) 46 (30) 47 55 Shareholders’ share of actuarial and other gains and losses on defined benefit pension schemes – – 13 8 21 Loss on sale and results for Taiwan agency business 155 – – – 155
Total 49 (170) (201) 89 (233)
Variance from expected tax charge:note ii
Operating profit based on longer-term investment returnsnote iii 35 76 (29) 8 90 Short-term fluctuations in investment returns 15 196 – 14 225 Shareholders’ share of actuarial and other gains and losses on defined benefit pension schemes – – – – – Loss on sale and results for Taiwan agency business (137) – – – (137)
Total (87) 272 (29) 22 178
Actual tax (charge) credit: Operating profit based on longer-term investment returnsnote iii (63) (140) (213) 42 (374) Short-term fluctuations in investment returns 7 242 (30) 61 280 Shareholders’ share of actuarial and other gains and losses on defined benefit pension schemes – – 13 8 21 Loss on sale and results for Taiwan agency business 18 – – – 18
Total (38) 102 (230) 111 (55)
Actual tax rate: Operating profit based on longer-term investment returns 15% 23% 32% 35% 24% Total profit (21)% (21)% 32% 40% 7%
* The Group has amended the presentation of operating profit for its US insurance operations to remove the net equity hedge accounting effect (incorporating related amortisation of deferred acquisition costs) and include it in short-term fluctuations. The 2009 comparatives have been amended accordingly. Note A4d(ii) explains the effect of the change.

287F
INA
NC
IAL
S
TA
TE
ME
NT
SF: IN
CO
ME
STA
TE
ME
NT
N
OT
ES
Notes(i) Expected tax rates for profit (loss) attributable to shareholders:
• The expected tax rates shown in the table above reflect the corporation tax rates generally applied to taxable profits of the relevant country jurisdictions.
• For Asian operations the expected tax rates reflect the corporation tax rates weighted by reference to the source of profits of operations contributing to the aggregate business result.
• The expected tax rate for Other operations reflects the mix of business between UK and overseas operations, which are taxed at a variety of rates. The rates will fluctuate from year to year dependent on the mix of profits.
(ii) For 2010 and 2009, the principal variances arise from a number of factors, including:(a) Asian long-term operations For 2010 and 2009, profits in certain countries which are not taxable partly offset by the inability to fully recognise deferred tax assets on
losses being carried forward. (b) Jackson For 2010, the benefit of a deduction from taxable income of a proportion of dividends received attributable to the variable annuity business.
For 2009, the ability to fully recognise deferred tax assets on losses brought forward which we were previously unable to recognise together with income subject to a lower level of taxation and the benefit of a deduction from taxable income of a proportion of dividends received attributable to the variable annuity business.
(c) UK insurance operations For 2010, routine revisions to prior period tax returns. For 2009, adjustments in respect of prior year tax charge and different tax bases of
UK life business.(d) Other operations For 2010, an exceptional tax credit which primarily relates to the impact of the settlement agreed with the UK tax authorities and the ability
to recognise a deferred tax credit on various tax losses which we were previously unable to recognise, partly offset by the inability to fully recognise a tax credit in respect of non deductible capital costs incurred in relation to the terminated AIA transaction. For 2009, the ability to recognise a deferred tax asset on various tax losses which we were previously unable to recognise partly offset by adjustments in respect of the prior year tax charge.
(e) For 2009, the actual tax rate in relation to Asia excluding the result for the sold Taiwan agency business would have been 13 per cent.(iii) Operating profit based on longer-term investment returns is net of attributable restructuring costs and development expenses.

288
Prudential plc Annual Report 2010
FINANCIAL STATEMENTS > NOTES ON THE GROUP FINANCIAL STATEMENTS
F: INCOME STATEMENT NOTESCONTINUED
F6: ALLOCATION OF INVESTMENT RETURN BETWEEN POLICYHOLDERS AND SHAREHOLDERS
Investment return is attributable to policyholders and shareholders. A key feature of the accounting policies under IFRS is that the investment return included in the income statement relates to all investment assets of the Group, irrespective of whether the return is attributable to shareholders, or to policyholders or the unallocated surplus of with-profits funds, the latter two of which have no net impact on shareholders’ profit. The table below provides a breakdown of the investment return for each regional operation attributable to each type of business.
2010 £m 2009 £m
ASIAN OPERATIONS Policyholder returns Assets backing unit-linked liabilities 1,279 2,539 With-profits business 1,039 1,519
2,318 4,058
Shareholder returns 429 373
Total 2,747 4,431
US OPERATIONS Policyholder returns Assets held to back (separate account) unit-linked liabilities 3,520 3,760
Shareholder returns Realised gains and losses (including impairment losses on available-for-sale bonds) 21 (529) Value movements on derivative hedging programme for general account business 20 340 Interest/dividend income and value movements on other financial instruments for which
fair value movements are booked in the income statement 1,016 1,567
1,057 1,378
Total 4,577 5,138
UK OPERATIONS Policyholder returns Scottish Amicable Insurance Fund (SAIF) 1,075 1,438 Assets held to back unit-linked liabilities 2,119 2,947 With-profits fund (excluding SAIF) 8,815 10,461
12,009 14,846
Shareholder returns Prudential Retirement Income Limited (PRIL) 1,717 1,827 Other business 834 1,113
2,551 2,940
Total 14,560 17,786
UNALLOCATED CORPORATE Shareholder returns (115) (466)
GROUP TOTAL Policyholder returns 17,847 22,664 Shareholder returns 3,922 4,225
Total 21,769 26,889

289F
INA
NC
IAL
S
TA
TE
ME
NT
SF: IN
CO
ME
STA
TE
ME
NT
N
OT
ES
The returns as shown in the table above, are delineated between those returns allocated to policyholders and those allocated to shareholders. In making this distinction, returns allocated to policyholders are those from investments in which shareholders have no direct economic interest, namely:
• unit-linked business in the UK, Asia and SAIF in the UK, for which the investment return is wholly attributable to policyholders;• separate account business of US operations, the investment return of which is also wholly attributable to policyholders; and• with-profits business (excluding SAIF) in the UK and Asia (in which the shareholders’ economic interest, and the basis of recognising
IFRS basis profits, is restricted to a share of the actuarially determined surplus for distribution (in the UK 10 per cent)). Except for this surplus the investment return of the with-profit funds is attributable to policyholders (through the asset-share liabilities) or the unallocated surplus, which is accounted for as a liability under IFRS 4.
The investment return related to the types of business above does not impact shareholders’ profits directly. However, there is an indirect impact, for example, investment-related fees or the effect of investment return on the shareholders’ share of the cost of bonuses of with-profits funds. Investment returns for unit-linked and similar products have reciprocal impact on benefits and claims, with a decrease in market returns on the attached pool of assets affecting policyholder benefits on these products. Similarly for with-profits funds there is a close correlation between increases or decreases in investment returns and the level of combined charge for policyholder benefits and movement on unallocated surplus that arises from such returns.
Shareholder returnsFor shareholder-backed non-participating business of the UK (comprising PRIL and other non-linked non-participating business) and of the Asian operations, the investment return is not directly attributable to policyholders and therefore does impact shareholders’ profit directly. However, it should be noted that for UK shareholder-backed annuity business, principally PRIL, where the durations of asset and liability cash flows are closely matched, the discount rate applied to measure liabilities to policyholders (under ‘grandfathered’ UK GAAP and under IFRS 4) reflects movements in asset yields (after allowances for the future defaults) of the backing portfolios. Therefore, the net impact on the shareholders’ profits of the investment return of the assets backing liabilities of the UK shareholder-backed annuity business is after taking into account the consequential effect on the movement in policyholder liabilities. Changes in shareholder investment returns for US operations reflect primarily movements in the investment income, movements in the value of the derivative instruments held to manage the general account assets and liability portfolio, and realised gains and losses. However, separately reflecting Jackson’s types of business an allocation is made to policyholders through the application of crediting rates. The shareholder investment return for US operations also includes the fair value movement of the derivatives and the movement on the related liabilities of the variable annuity guarantees under Jackson’s dynamic hedging programme. The majority of the investments held to back the US non-participating business are debt securities for which the available-for-sale designation is applied for IFRS basis reporting. Under this designation the return included in the income statement reflects the aggregate of investment income and realised gains and losses (including impairment losses). However, movements in unrealised appreciation or depreciation are recognised in other comprehensive income. The return on these assets is attributable to shareholders.

290
Prudential plc Annual Report 2010
FINANCIAL STATEMENTS > NOTES ON THE GROUP FINANCIAL STATEMENTS
F: INCOME STATEMENT NOTESCONTINUED
F7: BENEFITS AND CLAIMS AND MOVEMENTS IN UNALLOCATED SURPLUS OF WITH-PROFITS FUNDS,
NET OF REINSURANCE
Benefits and claims represent payments, including final bonuses, to policyholders in respect of maturities, surrenders and deaths plus the change in technical provisions (which primarily represents the movement in amounts owed to policyholders). Benefits and claims are amounts attributable to policyholders. The movement in unallocated surplus of with-profits funds represents the transfer to (from) the unallocated surplus each year through a charge (credit) to the income statement of the annual excess (shortfall) of income over expenditure of the with-profits funds, after declaration and attribution of the cost of bonuses to policyholders and shareholders. Benefits and claims and movements in unallocated surplus of with-profits funds net of reinsurance can be further analysed as follows:
2010 £m
Asia US UK Total
Claims incurred (2,595) (4,348) (9,941) (16,884)Increase in policyholder liabilities (3,824) (11,075) (8,490) (23,389)Movement in unallocated surplus of with-profits funds (315) – 70 (245)
(6,734) (15,423) (18,361) (40,518)
2009 £m
Asia US UK Total
Claims incurred (1,814) (4,092) (9,875) (15,781)Increase in policyholder liabilities (6,230) (9,193) (8,432) (23,855)Movement in unallocated surplus of with-profits funds 334 – (1,893) (1,559)
(7,710) (13,285) (20,200) (41,195)

291F
INA
NC
IAL
S
TA
TE
ME
NT
SG
: FIN
AN
CIA
L A
SSET
S A
ND
LIA
BIL
ITIE
S
G: FINANCIAL ASSETS AND LIABILITIES
G1: FINANCIAL INSTRUMENTS – DESIGNATION AND FAIR VALUES
The Group designates all financial assets as either fair value through profit and loss, available-for-sale, or as loans and receivables. Financial liabilities are designated as either fair value through profit and loss, amortised cost, or as investment contracts with discretionary participation features accounted for under IFRS 4 as described in note A4.
2010 £m
Fair valuethrough
profitand loss
Available-for-sale
Loans andReceivables
Totalcarrying
value Fair value
FINANCIAL ASSETSCash and cash equivalents – – 6,631 6,631 6,631Deposits – – 9,952 9,952 9,952Equity securities and portfolio holdings in unit trusts 86,635 – – 86,635 86,635Debt securitiesnote i 90,027 26,325 – 116,352 116,352Loansnote ii 227 – 9,034 9,261 9,083Other investmentsnote iii 5,779 – – 5,779 5,779Accrued investment income – – 2,668 2,668 2,668Other debtors – – 903 903 903
182,668 26,325 29,188 238,181
2010 £m
Fair valuethrough
profitand lossv
Amortisedcost
IFRS 4basic value
Totalcarrying
value Fair value
FINANCIAL LIABILITIESCore structural borrowings of shareholder-financed operationsnotes i,H13 – 3,676 – 3,676 3,866Operational borrowings attributable to shareholder-financed operationsH13 – 3,004 – 3,004 2,991Borrowings attributable to with-profits fundsH13 82 1,440 – 1,522 1,524Obligations under funding, securities lending and sale and repurchase agreements – 4,199 – 4,199 4,236Net asset value attributable to unit holders of consolidated unit trust and similar funds 3,372 – – 3,372 3,372Investment contracts with discretionary participation featuresnote iv – – 25,732 25,732 –Investment contracts without discretionary participation features 15,822 1,882 – 17,704 17,652Other creditors – 2,321 – 2,321 2,321Derivative liabilities 2,037 – – 2,037 2,037Other liabilities – 1,129 – 1,129 1,129
21,313 17,651 25,732 64,696

292
Prudential plc Annual Report 2010
FINANCIAL STATEMENTS > NOTES ON THE GROUP FINANCIAL STATEMENTS
G: FINANCIAL ASSETS AND LIABILITIESCONTINUED
G1: FINANCIAL INSTRUMENTS – DESIGNATION AND FAIR VALUES > CONTINUED
2009 £m
Fair valuethrough
profitand loss
Available-for-sale
Loans andReceivables
Totalcarrying
value Fair value
FINANCIAL ASSETSCash and cash equivalents – – 5,307 5,307 5,307Deposits – – 12,820 12,820 12,820Equity securities and portfolio holdings in unit trusts 69,354 – – 69,354 69,354Debt securitiesnote i 79,083 22,668 – 101,751 101,751Loansnote ii – – 8,754 8,754 8,686Other investmentsnote iii 5,132 – – 5,132 5,132Accrued investment income – – 2,473 2,473 2,473Other debtors – – 762 762 762
153,569 22,668 30,116 206,353
2009 £m
Fair valuethrough
profitand lossv
Amortisedcost
IFRS 4basic value
Totalcarrying
value Fair value
FINANCIAL LIABILITIESCore structural borrowings of shareholder-financed operationsnotes i,H13 – 3,394 – 3,394 3,424Operational borrowings attributable to shareholder-financed operationsH13 – 2,751 – 2,751 2,751Borrowings attributable to with-profits fundsH13 105 1,179 – 1,284 1,281Obligations under funding, securities lending and sale and repurchase agreements – 3,482 – 3,482 3,540Net asset value attributable to unit holders of consolidated unit trust and similar funds 3,809 – – 3,809 3,809Investment contracts with discretionary participation featuresnote iv – – 24,880 24,880 –Investment contracts without discretionary participation features 13,840 1,965 – 15,805 15,866Other creditors – 1,612 – 1,612 1,612Derivative liabilities 1,501 – – 1,501 1,501Other liabilities – 877 – 877 877
19,255 15,260 24,880 59,395
Notesi As at 31 December 2010, £685 million (2009: £659 million) of convertible bonds were included in debt securities and £352 million
(2009: £347 million) were included in borrowings.ii Loans and receivables are reported net of allowance for loan losses of £52 million (2009: £44 million).iii See note G3 for details of the derivative assets included. The balance also contains the PAC with-profits fund’s participation in various investment
funds and limited liability property partnerships.iv It is impractical to determine the fair value of investment contracts with discretionary participation features due to the lack of a reliable basis to
measure such features.v For financial liabilities designated as fair value through profit and loss there was no impact on profit from movements in credit risk during 2010
and 2009.

293F
INA
NC
IAL
S
TA
TE
ME
NT
SG
: FIN
AN
CIA
L A
SSET
S A
ND
LIA
BIL
ITIE
S
Determination of fair valueThe fair values of the financial assets and liabilities as shown in the table above have been determined on the following bases. The fair values of the financial instruments for which fair valuation is required under IFRS are determined by the use of current market bid prices for exchange-quoted investments, or by using quotations from independent third-parties, such as brokers and pricing services or by using appropriate valuation techniques. Investments valued using valuation techniques include financial investments which by their nature do not have an externally quoted price based on regular trades and financial investments for which markets are no longer active as a result of market conditions, e.g. market illiquidity. The valuation techniques used include comparison to recent arm’s length transactions, reference to other instruments that are substantially the same, discounted cash flow analysis, option adjusted spread models and, if applicable, enterprise valuation. These techniques may include a number of assumptions relating to variables such as credit risk and interest rates. Changes in assumptions relating to these variables could positively or negatively impact the reported fair value of these instruments. When determining the inputs into the valuation techniques used priority is given to publicly available prices from independent sources, when available, but overall the source of pricing is chosen with the objective of arriving at a fair value measurement which reflects the price at which an orderly transaction would take place between market participants on the measurement date. The fair value estimates are made at a specific point in time, based upon available market information and judgements about the financial instruments, including estimates of the timing and amount of expected future cash flows and the credit standing of counterparties. Such estimates do not reflect any premium or discount that could result from offering for sale at one time the Group’s entire holdings of a particular financial instrument, nor do they consider the tax impact of the realisation of unrealised gains or losses from selling the financial instrument being fair valued. In some cases the disclosed value cannot be realised in immediate settlement of the financial instrument. The loans and receivables have been shown net of provisions for impairment. The fair value of loans has been estimated from discounted cash flows expected to be received. The rate of discount used was the market rate of interest. The estimated fair value of derivative financial instruments reflects the estimated amount the Group would receive or pay in an arm’s length transaction. This amount is determined using quoted prices if exchange listed, quotations from independent third-parties or valued internally using standard market practices. In accordance with the Group’s risk management framework, all internally generated valuations are subject to assessment against external counterparties’ valuations. For investment contracts in the US with fixed and guaranteed terms the fair value is determined based on the present value of future cash flows discounted at current interest rates. The fair value of other financial liabilities is determined using discounted cash flows of the amounts expected to be paid.
Level 1, 2 and 3 fair value measurement hierarchy of Group financial instruments In March 2009, IFRS 7 ‘Financial Instruments: Disclosures’ was amended by the IASB to require certain additional disclosures to be included in IFRS financial statements. This includes, as is presented below, a table of financial instruments carried at fair value analysed by level of the IFRS 7 defined fair value hierarchy. This hierarchy is based on the inputs of the fair value measurement and reflects the lowest level input that is significant to that measurement. The classification criteria and its application to Prudential can be summarised as follows:
Level 1: Quoted prices (unadjusted) in active markets for identical assets and liabilitiesLevel 1 principally includes exchange listed equities, mutual funds with quoted prices, exchange traded derivatives such as futures and options, and national government bonds unless there is evidence that trading in a given instrument is so infrequent that the market could not possibly be considered active. It also includes other financial instruments (including net assets attributable to unit-holders of consolidated unit trusts and similar funds) where there is clear evidence that the year end valuation is based on a traded price in an active market.
Level 2: Inputs other than quoted prices included within level 1 that are observable either directly (i.e. as prices) or indirectly (i.e. derived from prices)Level 2 principally includes corporate bonds and other non-national government debt securities which are valued using observable inputs, together with over-the-counter derivatives such as forward exchange contracts and non-quoted investment funds valued with observable inputs. It also includes net assets attributable to unit-holders of consolidated unit trusts and similar funds and investment contract liabilities that are valued using observable inputs. The nature of Prudential’s operations in the US and the UK mean that a significant proportion of the assets backing non-linked shareholder-backed business are held in corporate bonds, structured securities and other non-national government debt securities. These assets, in line with market practice, are generally valued using independent pricing providers in the US and third-party broker quotes in the UK and Asia either directly or via third-parties, such as IDC or Bloomberg. Such assets are generally classified as level 2 as the nature of these quotations means that they do not strictly meet the definition of level 1 assets. These valuations are determined using independent external quotations from multiple sources and are subject to a number of monitoring controls, such as monthly price variances, stale price reviews and variance analysis on prices achieved on subsequent trades.Pricing services, where available, are used to obtain the third-party broker quotes. Where pricing services providers are used, a single valuation is obtained and applied.

294
Prudential plc Annual Report 2010
FINANCIAL STATEMENTS > NOTES ON THE GROUP FINANCIAL STATEMENTS
G: FINANCIAL ASSETS AND LIABILITIESCONTINUED
G1: FINANCIAL INSTRUMENTS – DESIGNATION AND FAIR VALUES > CONTINUED
When prices are not available from pricing services, quotes are sourced directly from brokers. Prudential seeks to obtain a number of quotes from different brokers so as to obtain the most comprehensive information available on their executability. Where quotes are sourced directly from brokers, the price used in the valuation is normally selected from one of the quotes based on a number of factors, including the timeliness and regularity of the quotes and the accuracy of the quotes considering the spreads provided. The selected quote is the one which best represents an executable quote for the security at the measurement date. Generally, no adjustment is made to the prices obtained from independent third-parties. Adjustment is made in only limited circumstances, where it is determined that the third-party valuations obtained do not reflect fair value (e.g. either because the value is stale and/or the values are extremely diverse in range). These are usually securities which are distressed or that could be subject to a debt restructure or where reliable market prices are no longer available due to an inactive market or market dislocation. In these instances, prices are derived using internal valuation techniques including those as described above in this note with the objective of arriving at a fair value measurement which reflects the price at which an orderly transaction would take place between market participants on the measurement date. The techniques used require a number of assumptions relating to variables such as credit risk and interest rates. Examples of such variables include an average credit spread based on the corporate bond universe and the relevant duration of the asset being valued. Prudential measures the input assumptions based on the best available information at the measurement dates. Securities valued in such manner are classified as level 3 where these significant inputs are not based on observable market data. In addition level 2 includes debt securities that are valued internally using standard market practices. Of the total level 2 debt securities of £89,948 million at 31 December 2010 (2009: £83,301 million), £6,638 million are valued internally (2009: £6,426 million). The majority of such securities are valued using matrix pricing, which is based on assessing the credit quality of the underlying borrower to derive a suitable discount rate relative to government securities of a comparable duration. Under matrix pricing, the debt securities are priced taking the credit spreads on comparable quoted public debt securities and applying these to the equivalent debt instruments factoring a specified liquidity premium. The majority of the parameters used in this valuation technique are readily observable in the market and, therefore, are not subject to interpretation.
Level 3: Significant inputs for the asset or liability that are not based on observable market data (unobservable inputs)Level 3 principally includes investments in private equity funds, investments in property funds which are exposed to bespoke properties or risks, investments which are internally valued or subject to a significant number of unobservable assumptions and certain derivatives which are bespoke or long dated. It also includes debt securities which are rarely traded or traded only in privately negotiated transactions and hence where it is difficult to assert that these have been based on observable market data. The inherent nature of the vast majority of these assets means that, in normal market conditions, there is unlikely to be significant change in the specific underlying assets classified as level 3. At 31 December 2010 the Group held £4,194 million (2009: £5,190 million), two per cent of the fair valued financial instruments (2009: three per cent), within level 3. Of these amounts £3,359 million (2009: £3,510 million) was held by the Group’s participating funds and therefore shareholders’ profit and equity are not impacted by movements in the valuation of these financial instruments. Total level 3 assets represented 3.3 per cent of the total assets of the participating funds at 31 December 2010 (2009: 3.7 per cent). Total level 3 liabilities at 31 December 2010 were £371 million out of total participating fund liabilities of £112,196 million (2009: £348 million out of £104,817 million). Of the £866 million level 3 fair valued financial investments at 31 December 2010 (2009: £1,684 million), net of derivative liabilities which support non-linked shareholder-backed business (1.6 per cent of the total financial investments net of derivative liabilities backing this business) (2009: 3.6 per cent), £728 million are externally valued and £138 million are internally valued (2009: £1,653 million and £31 million respectively). Internal valuations, which represent 0.2 per cent of the total financial investments net of derivative liabilities supporting non-linked shareholder-backed business at 31 December 2010 (2009: 0.06 per cent), are inherently more subjective than external valuations. If the value of all level 3 investments backing non-linked shareholder-backed business was varied downwards by 10 per cent, the change in valuation would be £14 million (2009: £3 million), which would reduce shareholders’ equity by this amount before tax. Of this amount a £7 million decrease (2009: £5 million increase) would pass through the income statement substantially as part of short-term fluctuations in investment returns outside of operating profit and a £7 million decrease (2009: offset by an £8 million decrease) would be included as part of other comprehensive income, being unrealised movements on assets classified as available-for-sale.

295F
INA
NC
IAL
S
TA
TE
ME
NT
SG
: FIN
AN
CIA
L A
SSET
S A
ND
LIA
BIL
ITIE
S
31 December 2010 £m
Level 1 Level 2 Level 3 Total
WITH-PROFITS Equity securities and portfolio holdings in unit trusts 29,675 1,281 415 31,371 Debt securities 11,114 41,375 772 53,261 Other investments (including derivative assets) 137 1,207 2,543 3,887 Derivative liabilities (56) (626) (25) (707)
Total financial investments, net of derivative liabilities 40,870 43,237 3,705 87,812 Borrowings attributable to the with-profits fund held at fair value – (82) – (82)Net asset value attributable to unit holders of consolidated unit trusts and
similar funds (519) (511) (346) (1,376)
Total 40,351 42,644 3,359 86,354 Percentage of total 47% 49% 4% 100%
UNIT-LINKED AND VARIABLE ANNUITY SEPARATE ACCOUNTEquity securities and portfolio holdings in unit trusts 54,272 2 – 54,274 Debt securities 3,784 5,268 2 9,054 Other investments (including derivative assets) 43 88 – 131 Derivative liabilities – – – –
Total financial investments, net of derivative liabilities 58,099 5,358 2 63,459 Investment contracts without discretionary participation features held at fair value – (13,841) – (13,841)Net asset value attributable to unit holders of consolidated unit trusts and
similar funds (1,360) – – (1,360)
Total 56,739 (8,483) 2 48,258 Percentage of total 118% (18)% – 100%
NON-LINKED SHAREHOLDER-BACKEDLoans – 227 – 227 Equity securities and portfolio holdings in unit trusts 808 21 161 990 Debt securities 10,389 43,305 343 54,037 Other investments (including derivative assets) 52 1,146 563 1,761 Derivative liabilities (80) (1,049) (201) (1,330)
Total financial investments, net of derivative liabilities 11,169 43,650 866 55,685 Investment contracts without discretionary participation features held at fair value – (1,981) – (1,981)Net asset value attributable to unit holders of consolidated unit trusts and
similar funds (220) (383) (33) (636)
Total 10,949 41,286 833 53,068 Percentage of total 20% 78% 2% 100%
GROUP TOTALLoans – 227 – 227 Equity securities and portfolio holdings in unit trusts 84,755 1,304 576 86,635 Debt securities 25,287 89,948 1,117 116,352 Other investments (including derivative assets) 232 2,441 3,106 5,779 Derivative liabilities (136) (1,675) (226) (2,037)
Total financial investments, net of derivative liabilities 110,138 92,245 4,573 206,956 Borrowings attributable to the with-profits fund held at fair value – (82) – (82)Investment contracts without discretionary participation features held at fair value – (15,822) – (15,822)Net asset value attributable to unit holders of consolidated unit trusts and similar funds (2,099) (894) (379) (3,372)
Total 108,039 75,447 4,194 187,680 Percentage of total 58% 40% 2% 100%

296
Prudential plc Annual Report 2010
FINANCIAL STATEMENTS > NOTES ON THE GROUP FINANCIAL STATEMENTS
G: FINANCIAL ASSETS AND LIABILITIESCONTINUED
G1: FINANCIAL INSTRUMENTS – DESIGNATION AND FAIR VALUES > CONTINUED
31 December 2009 £m
Level 1 Level 2 Level 3 Total
WITH-PROFITS Equity securities and portfolio holdings in unit trusts 28,688 799 475 29,962Debt securities 7,063 39,051 1,213 47,327Other investments (including derivative assets) 79 1,199 2,170 3,448Derivative liabilities (54) (504) (25) (583)
Total financial investments, net of derivative liabilities 35,776 40,545 3,833 80,154Borrowings attributable to the with-profits fund held at fair value – (105) – (105)Net asset value attributable to unit holders of consolidated unit trusts and
similar funds (1,354) (305) (323) (1,982)
Total 34,422 40,135 3,510 78,067Percentage of total 44% 51% 5% 100%
UNIT-LINKED AND VARIABLE ANNUITY SEPARATE ACCOUNTEquity securities and portfolio holdings in unit trusts 38,616 4 – 38,620Debt securities 3,283 5,525 40 8,848Other investments (including derivative assets) 30 80 – 110Derivative liabilities – – – –
Total financial investments, net of derivative liabilities 41,929 5,609 40 47,578Investment contracts without discretionary participation features held at fair value – (12,242) – (12,242)Net asset value attributable to unit holders of consolidated unit trusts and
similar funds (1,324) (7) (2) (1,333)
Total 40,605 (6,640) 38 34,003Percentage of total 119% (19)% 0% 100%
NON-LINKED SHAREHOLDER-BACKEDEquity securities and portfolio holdings in unit trusts 557 36 179 772Debt securities 5,783 38,725 1,068 45,576Other investments (including derivative assets) 155 787 632 1,574Derivative liabilities (20) (703) (195) (918)
Total financial investments, net of derivative liabilities 6,475 38,845 1,684 47,004Investment contracts without discretionary participation features held at fair value – (1,598) – (1,598)Net asset value attributable to unit holders of consolidated unit trusts and
similar funds (110) (342) (42) (494)
Total 6,365 36,905 1,642 44,912Percentage of total 14% 82% 4% 100%
GROUP TOTALEquity securities and portfolio holdings in unit trusts 67,861 839 654 69,354Debt securities 16,129 83,301 2,321 101,751Other investments (including derivative assets) 264 2,066 2,802 5,132Derivative liabilities (74) (1,207) (220) (1,501)
Total financial investments, net of derivative liabilities 84,180 84,999 5,557 174,736Borrowings attributable to the with-profits fund held at fair value – (105) – (105)Investment contracts without discretionary participation features held at fair value – (13,840) – (13,840)Net asset value attributable to unit holders of consolidated unit trusts and
similar funds (2,788) (654) (367) (3,809)
Total 81,392 70,400 5,190 156,982Percentage of total 52% 45% 3% 100%

297F
INA
NC
IAL
S
TA
TE
ME
NT
SG
: FIN
AN
CIA
L A
SSET
S A
ND
LIA
BIL
ITIE
S
Reconciliation of movements in level 3 financial instruments measured at fair valueThe following tables reconcile the value of level 3 financial instruments at 1 January 2010 to that presented at 31 December 2010 and at 1 January 2009 to that presented at 31 December 2009. Total gains and losses recorded in the income statement in the year represents realised gains and losses, including interest and dividend income unrealised gains and losses on financial instruments classified at fair value through profit and loss and foreign exchange movements on an individual entity’s overseas investments. All these amounts are included within ‘investment return’ within the income statement. Total gains and losses recorded in other comprehensive income includes unrealised gains and losses on debt securities held as available-for-sale within Jackson and foreign exchange movements arising from the retranslation of the Group’s overseas subsidiaries and branches. The transfers out from level 3 during 2010 comprise mainly transfers within the Jackson’s portfolio. Certain broker-priced assets of Jackson were previously classified as level 3 holdings as a result of illiquidity in the market and the resultant lack of observability into the assumptions used to produce those fair values. During 2010, as a result of ongoing consideration regarding the use of assumptions by pricing sources and the changes in the level of observability of these inputs over recent periods, Jackson determined that these assets would be more appropriately categorised as level 2. As a result, Jackson transferred debt securities of £606 million and derivative assets of £101 million from level 3 to level 2. The remaining transfers out of level 3 of the Group are primarily debt securities reclassifications from level 3 to level 2 which reflect improving liquidity during the period. The transfers out from level 3 during 2009 included a transfer of £2,072 million from level 3 to level 2 in respect of structured securities of Jackson. At 31 December 2008, Jackson had utilised internal valuations for certain structured securities given the illiquidity of the market at that time. These assets had therefore been classified as level 3 given the unobservable nature of assumptions within the internal valuation models used. During the first half of 2009, improvements were observed in the level of liquidity for these structured securities such that external prices based on observable inputs from pricing services or brokers were used to value nearly all of the structured securities at 31 December 2009. The remaining transfers in and out of level 3 in 2009 represented sundry individual asset reclassifications, none of which are materially significant as highlighted in the table below.

298
Prudential plc Annual Report 2010
FINANCIAL STATEMENTS > NOTES ON THE GROUP FINANCIAL STATEMENTS
G: FINANCIAL ASSETS AND LIABILITIESCONTINUED
G1: FINANCIAL INSTRUMENTS – DESIGNATION AND FAIR VALUES > CONTINUED
At 1 Jan2010
£m
Totalgains/
losses inincome
statement£m
Totalgains/losses
recordedin other
compre-hensiveincome
£mPurchases
£mSales
£mSettled
£m
Transfersinto
level 3£m
Transfersout of
level 3£m
At 31 Dec
2010£m
WITH-PROFITS Equity securities and portfolio holdings in
unit trusts 475 (6) – 48 (59) – – (43) 415Debt securities 1,213 (113) 18 15 (158) (34) 11 (180) 772Other investments (including derivative
assets) 2,170 309 5 372 (312) – – (1) 2,543Derivative liabilities (25) – – – – – – – (25)
Total financial investments, net of derivative liabilities 3,833 190 23 435 (529) (34) 11 (224) 3,705
Net asset value attributable to unit holders of consolidated unit trusts and similar funds (323) (32) – 9 – – – – (346)
Total 3,510 158 23 444 (529) (34) 11 (224) 3,359
UNIT-LINKED AND VARIABLE ANNUITY SEPARATE ACCOUNTS
Debt securities 40 – 3 2 (4) (18) – (21) 2
Total financial investments, net of derivative liabilities 40 – 3 2 (4) (18) – (21) 2
Net asset value attributable to unit holders of consolidated unit trusts and similar funds (2) – – – – – – 2 –
Total 38 – 3 2 (4) (18) – (19) 2
NON-LINKED SHAREHOLDER-BACKEDEquity securities and portfolio holdings in
unit trusts 179 43 5 30 (95) – 2 (3) 161Debt securities 1,068 49 72 46 (213) (27) 61 (713) 343Other investments (including derivative
assets) 632 15 32 129 (144) – – (101) 563Derivative liabilities (195) (5) (1) – – – – – (201)
Total financial investments, net of derivative liabilities 1,684 102 108 205 (452) (27) 63 (817) 866
Net asset value attributable to unit holders of consolidated unit trusts and similar funds (42) (17) (1) (16) 43 – – – (33)
Total 1,642 85 107 189 (409) (27) 63 (817) 833
GROUP TOTALEquity securities and portfolio holdings in
unit trusts 654 37 5 78 (154) – 2 (46) 576Debt securities 2,321 (64) 93 63 (375) (79) 72 (914) 1,117Other investments (including derivative
assets) 2,802 324 37 501 (456) – – (102) 3,106Derivative liabilities (220) (5) (1) – – – – – (226)
Total financial investments, net of derivative liabilities 5,557 292 134 642 (985) (79) 74 (1,062) 4,573
Net asset value attributable to unit holders of consolidated unit trusts and similar funds (367) (49) (1) (7) 43 – – 2 (379)
Total 5,190 243 133 635 (942) (79) 74 (1,060) 4,194

299F
INA
NC
IAL
S
TA
TE
ME
NT
SG
: FIN
AN
CIA
L A
SSET
S A
ND
LIA
BIL
ITIE
S
At 1 Jan2009
£m
Totalgains/
losses inincome
statement£m
Totalgains/losses
recordedin other
compre-hensiveincome
£mPurchases
£mSales
£mSettled
£m
Transfersinto
level 3£m
Transfersout of
level 3£m
At 31 Dec
2009£m
WITH-PROFITS Equity securities and portfolio holdings in unit trusts 509 (3) (1) 26 (56) – – – 475Debt securities 1,342 (14) (11) 50 (225) (17) 142 (54) 1,213Other investments (including derivative assets) 2,122 (211) (89) 403 (55) – – – 2,170Derivative liabilities – (2) – – (23) – – – (25)
Total financial investments, net of derivative liabilities 3,973 (230) (101) 479 (359) (17) 142 (54) 3,833Net asset value attributable to unit holders of
consolidated unit trusts and similar funds (381) 9 – 49 – – – – (323)
Total 3,592 (221) (101) 528 (359) (17) 142 (54) 3,510
UNIT-LINKED AND VARIABLE ANNUITY SEPARATE ACCOUNT
Debt securities 33 2 1 16 – (8) – (4) 40
Total financial investments, net of derivative liabilities 33 2 1 16 – (8) – (4) 40Net asset value attributable to unit holders of
consolidated unit trusts and similar funds – – – (1) – – (1) – (2)
Total 33 2 1 15 – (8) (1) (4) 38
NON-LINKED SHAREHOLDER-BACKEDEquity securities and portfolio holdings in unit trusts 318 (47) (34) 21 (55) – – (24) 179Debt securities 3,996 (15) (565) 104 (473) (2) 200 (2,177) 1,068Other investments (including derivative assets) 692 130 (76) 153 (308) – 43 (2) 632Derivative liabilities (246) 93 – (64) 23 – (1) – (195)
Total financial investments, net of derivative liabilities 4,760 161 (675) 214 (813) (2) 242 (2,203) 1,684Net asset value attributable to unit holders of
consolidated unit trusts and similar funds (65) 17 6 – – – – – (42)
Total 4,695 178 (669) 214 (813) (2) 242 (2,203) 1,642
GROUP TOTALEquity securities and portfolio holdings in unit trusts 827 (50) (35) 47 (111) – – (24) 654Debt securities 5,371 (27) (575) 170 (698) (27) 342 (2,235) 2,321Other investments (including derivative assets) 2,814 (81) (165) 556 (363) – 43 (2) 2,802Derivative liabilities (246) 91 – (64) – – (1) – (220)
Total financial investments, net of derivative liabilities 8,766 (67) (775) 709 (1,172) (27) 384 (2,261) 5,557Net asset value attributable to unit holders of
consolidated unit trusts and similar funds (446) 26 6 48 – – (1) – (367)
Total 8,320 (41) (769) 757 (1,172) (27) 383 (2,261) 5,190

300
Prudential plc Annual Report 2010
FINANCIAL STATEMENTS > NOTES ON THE GROUP FINANCIAL STATEMENTS
G: FINANCIAL ASSETS AND LIABILITIESCONTINUED
G1: FINANCIAL INSTRUMENTS – DESIGNATION AND FAIR VALUES > CONTINUED
Of the total gains and losses in the income statement in 2010 of £243 million gains, £315 million relates to financial instruments still held at the end of the year, which can be analysed as £18 million for equity securities, £110 million for debt securities, £243 million for other investments, £(6) million for derivative liabilities and £(50) million for net asset value attributable to unit holders of consolidated unit trusts and similar funds. Of the total gains and losses in the income statement in 2009 of £41 million losses, £(205) million relates to financial instruments still held at the end of the year, which can be analysed as £41 million losses for equity securities, £44 million losses for debt securities, £221 million losses for other investments, £76 million gains for derivative liabilities and £25 million gains for net asset value attributable to unit holders of consolidated unit trusts and similar funds.
Transfers between level 1 and level 2During 2010, transfers from level 1 to level 2 amounted to £354 million in respect of certain investment funds held by the Group’s participating funds which arose to reflect the change in the observability of the inputs used in valuing these funds. There were no significant transfers between level 1 and level 2 during 2009. Interest income and expenseThe interest income on financial assets not at fair value through profit and loss for the year ended 31 December 2010 from continuing operations was £1,994 million (2009: £1,998 million). The interest expense on financial liabilities not at fair value through profit and loss for the year ended 31 December 2010 from continuing operations was £427 million (2009: £366 million).
G2: MARKET RISK
Interest rate riskThe following table shows an analysis of the classes of financial assets and liabilities and their direct exposure to interest rate risk. Each applicable class of the Group’s financial assets or liabilities is analysed between those exposed to fair value interest rate risk, cash flow interest rate risk and those with no direct interest rate risk exposure:
2010 £m
Fair valueinterest
rate risk
Cash flowinterest
rate risk
Not directly exposed to
interestrate risk Total
FINANCIAL ASSETSCash and cash equivalents – – 6,631 6,631Deposits 887 8,941 124 9,952Debt securities 110,168 5,824 360 116,352Loans 6,238 3,001 22 9,261Other investments (including derivatives) 1,616 448 3,715 5,779
118,909 18,214 10,852 147,975
FINANCIAL LIABILITIESCore structural borrowings of shareholder-financed operations 3,676 – – 3,676Operational borrowings attributable to shareholder-financed operations 2,624 377 3 3,004Borrowings attributable to with-profits funds 679 710 133 1,522Obligations under funding, securities lending and sale and repurchase agreements 631 3,568 – 4,199Investment contracts without discretionary participation features 988 894 15,822 17,704Derivative liabilities 705 431 901 2,037Other liabilities 121 129 879 1,129
9,424 6,109 17,738 33,271

301F
INA
NC
IAL
S
TA
TE
ME
NT
SG
: FIN
AN
CIA
L A
SSET
S A
ND
LIA
BIL
ITIE
S
2009 £m
Fair valueinterest
rate risk
Cash flowinterest
rate risk
Not directly exposed to
interestrate risk Total
FINANCIAL ASSETSCash and cash equivalents – – 5,307 5,307Deposits 896 11,884 40 12,820Debt securities 95,817 5,550 384 101,751Loans 5,923 2,816 15 8,754Other investments (including derivatives) 1,381 368 3,383 5,132
104,017 20,618 9,129 133,764
FINANCIAL LIABILITIESCore structural borrowings of shareholder-financed operations 3,394 – – 3,394Operational borrowings attributable to shareholder-financed operations 2,128 620 3 2,751Borrowings attributable to with-profits funds 804 312 168 1,284Obligations under funding, securities lending and sale and repurchase agreements 611 2,871 – 3,482Investment contracts without discretionary participation features 1,098 867 13,840 15,805Derivative liabilities 647 286 568 1,501Other liabilities 79 92 706 877
8,761 5,048 15,285 29,094
Liquidity analysisi) Contractual maturities of financial liabilitiesThe following table sets out the contractual maturities for applicable classes of financial liabilities, excluding derivative liabilities and investment contracts that are separately presented. The financial liabilities are included in the column relating to the contractual maturities at the undiscounted cash flows (including contractual interest payments) due to be paid assuming conditions are consistent with those of year end.
2010 £m
Totalcarrying
value1 year
or less
After 1 year to5 years
After 5 years to10 years
After 10 years to15 years
After 15 years to20 years
Over20 years
No statedmaturity Total
FINANCIAL LIABILITIESCore structural borrowings of shareholder-financed operationsH13 3,676 164 861 731 1,314 835 1,244 1,469 6,618Operational borrowings attributable to shareholder-financed operationsH13 3,004 2,510 561 3 3 3 10 – 3,090Borrowings attributable to with-profits fundsH13 1,522 155 1,051 161 2 2 121 182 1,674Obligations under funding, securities lending and sale and repurchase agreements 4,199 4,199 – – – – – – 4,199Other liabilities 1,129 867 16 50 – – – 196 1,129Net asset value attributable to unit holders of consolidated unit-trusts and similar funds 3,372 3,372 – – – – – – 3,372Other creditors 2,321 2,321 – – – – – – 2,321
19,223 13,588 2,489 945 1,319 840 1,375 1,847 22,403

302
Prudential plc Annual Report 2010
FINANCIAL STATEMENTS > NOTES ON THE GROUP FINANCIAL STATEMENTS
G: FINANCIAL ASSETS AND LIABILITIESCONTINUED
G2: MARKET RISK > CONTINUED
2009 £m
Totalcarrying
value1 year
or less
After 1 year to5 years
After 5 years to10 years
After 10 years to15 years
After 15 years to20 years
Over20 years
No statedmaturity Total
FINANCIAL LIABILITIESCore structural borrowings of shareholder-financed operationsH13 3,394 148 588 733 1,394 877 1,343 1,422 6,505Operational borrowings attributable to shareholder-financed operationsH13 2,751 2,351 435 9 9 9 31 – 2,844Borrowings attributable to with-profits fundsH13 1,284 228 882 102 – – – 205 1,417Obligations under funding, securities lending and sale and repurchase agreements 3,482 3,482 – – – – – – 3,482Other liabilities 877 643 11 14 – – – 211 879Net asset value attributable to unit holders of consolidated unit-trusts and similar funds 3,809 3,809 – – – – – – 3,809Other creditors 1,612 1,612 – – – – – – 1,612
17,209 12,273 1,916 858 1,403 886 1,374 1,838 20,548
ii) Maturity analysis of derivativesThe following table provides a maturity analysis of derivative assets and liabilities:
2010 £m
Totalcarrying
value 1 yearor less
After 1 year to 3 years
After 3 years to
5 yearsAfter
5 years Total
Net derivative position 2 1 1 – – 2
2009 £m
Totalcarrying
value 1 yearor less
After 1 year to 3 years
After 3 years to
5 yearsAfter
5 years Total
Net derivative position 279 340 10 (1) – 349
The net derivative positions as shown in the table above comprise the following derivative assets and liabilities:
2010 £m 2009 £m
Derivative assets 2,039 1,780Derivative liabilities (2,037) (1,501)
Net derivative position 2 279
The majority of derivative assets and liabilities have been included at fair value within the one year or less column representing the basis on which they are managed (i.e. to manage principally asset or liability value exposures). Contractual maturities are not considered essential for an understanding of the timing of the cash flows for these instruments and in particular the Group has no cash flow hedges. The only exception is certain identified interest rate swaps which are fully expected to be held until maturity solely for the purposes of matching cash flows on separately held assets and liabilities. For these instruments the undiscounted cash flows (including contractual interest amounts) due to be paid under the swap contract assuming conditions are consistent with those at year end are included in the column relating to the contractual maturity of the derivative. The table below shows the maturity profile for investment contracts on an undiscounted basis to the nearest billion. This maturity profile has been based on the cash flow projections of expected benefit payments as part of the determination of the value of in-force business when preparing EEV basis results.

303F
INA
NC
IAL
S
TA
TE
ME
NT
SG
: FIN
AN
CIA
L A
SSET
S A
ND
LIA
BIL
ITIE
S
2010 £bn
1 yearor less
After 1 year to5 years
After 5 years to10 years
After 10 years to15 years
After 15 years to20 years
Over20 years
Totalundis-
countedvalue
Carryingvalue
Life assurance investment contracts 3 12 15 14 12 15 71 43
2009 £bn
1 yearor less
After 1 year to5 years
After 5 years to10 years
After 10 years to15 years
After 15 years to20 years
Over20 years
Totalundis-
countedvalue
Carryingvalue
Life assurance investment contracts 3 11 13 13 11 17 68 41
Most investment contracts have options to surrender early, albeit these are often subject to surrender or other penalties. It is therefore the case that most contracts could be said to have a contractual maturity of less than one year, but in reality the additional charges and term of the contracts means these are unlikely to be exercised in practice and the more useful information is to present information on expected payment. The maturity profile above excludes certain corporate unit-linked business with gross policyholder liabilities of £11 billion (2009: £9 billion) which has no stated maturity but which is repayable on demand. This table has been prepared on an undiscounted basis and accordingly the amounts shown for life assurance investment contracts differ from those disclosed on the statement of financial position. Durations of long-term business contracts, covering insurance and investment contracts, on a discounted basis are included in section D. The vast majority of the Group’s financial assets are held to back the Group’s policyholder liabilities. Although asset/liability matching is an important component of managing policyholder liabilities (both those classified as insurance and those classified as investments), this profile is mainly relevant for managing market risk rather than liquidity risk. Within each business unit this asset/liability matching is performed on a portfolio by portfolio basis. In terms of liquidity risk a large proportion of the policyholder liabilities contain discretionary surrender values or surrender charges, meaning that many of the Group’s liabilities are expected to be held for the long term. Much of the Group’s investment portfolios is in marketable securities, which can therefore be converted quickly to liquid assets. For the reasons above an analysis of the Group’s assets by contractual maturity is not considered necessary to evaluate the nature and extent of the Group’s liquidity risk.
Credit riskThe Group’s maximum exposure to credit risk of financial instruments before any allowance for collateral or allocation of losses to policyholders is represented by the carrying value of financial instruments on the balance sheet that have exposures to credit risk. These assets comprise cash and cash equivalents, deposits, debt securities, loans and derivative assets, and other debtors, the carrying value of which are disclosed at the start of this note and note G3 for derivative assets. The collateral in place in relation to derivatives is described in G4. Notes D2, D3 and D4, describe the security for these loans held by the Group, as disclosed at the start of this note. Of the total loans and receivables held £74 million (2009: £64 million) are past their due date but have not been impaired. Of the total past due but not impaired, £26 million is less than one year past their due date and £9 million is more than six months but less than one year past their due date (2009: £64 million and £11 million respectively). The Group expects full recovery of these loans and receivables. No further analysis has been provided of the age of financial assets that are past due at the end of the reporting period but not impaired as the amounts are immaterial. No further analysis has been provided of the element of loans and receivables that was neither past due nor impaired for the total portfolio. This is on the grounds of immateriality of the difference between the neither past due nor impaired elements and the total portfolio. Financial assets that would have been past due or impaired had the terms not been renegotiated amounted to £97 million (2009: £55 million). There was no collateral held against loans that are past due and impaired or that are past due but not impaired at 31 December 2010 (2009: £nil). In addition, during the year the Group took possession of £22 million (2009: £15 million) of other collateral held as security, which mainly consists of assets that could be readily convertible into cash.

304
Prudential plc Annual Report 2010
FINANCIAL STATEMENTS > NOTES ON THE GROUP FINANCIAL STATEMENTS
G: FINANCIAL ASSETS AND LIABILITIESCONTINUED
G2: MARKET RISK > CONTINUED
Currency riskAs at 31 December 2010, the Group held 18 per cent (2009: 19 per cent) and 14 per cent (2009: 13 per cent) of its financial assets and financial liabilities respectively, in currencies, mainly US dollar and Euro, other than the functional currency of the relevant business unit. The financial assets, of which 70 per cent (2009: 74 per cent) are held by the PAC with-profits fund, allow the PAC with-profits fund to obtain exposure to foreign equity markets. The financial liabilities, of which 28 per cent (2009: 34 per cent) are held by the PAC with-profits fund, mainly relate to foreign currency borrowings. The exchange risks inherent in these exposures are mitigated through the use of derivatives, mainly forward currency contracts (note G3 below). The amount of exchange gains recognised in the income statement in 2010, except for those arising on financial instruments measured at fair value through profit and loss, is £82 million (2009: £201 million losses). This constitutes £16 million losses (2009: £41 million losses) on Medium Term Notes (MTN) liabilities and £98 million of net gains (2009: £160 million net losses), mainly arising on investments of the PAC with-profits fund. The gains/losses on MTN liabilities are fully offset by value movements on cross-currency swaps, which are measured at fair value through profit and loss.
G3: DERIVATIVES AND HEDGING
DerivativesThe Group enters into a variety of exchange traded and over-the-counter derivative financial instruments, including futures, options, forward currency contracts and swaps such as interest rate swaps, cross-currency swaps, swaptions and credit default swaps. All over-the-counter derivative transactions are conducted under standardised ISDA (International Swaps and Derivatives Association Inc) master agreements and the Group has collateral agreements between the individual Group entities and relevant counterparties in place under each of these market master agreements. The total fair value balances of derivative assets and liabilities as at 31 December 2010 were as follows:
2010 £m
UK insurance operations
US insurance operations
Asian insurance
operationsAsset
managementUnallocatedto a segment
Group total
Derivative assets 926 645 310 44 114 2,039Derivative liabilities (792) (799) (222) (78) (146) (2,037)
134 (154) 88 (34) (32) 2
2009 £m
UK insurance operations
US insurance operations
Asian insurance
operationsAsset
managementUnallocatedto a segment
Group total
Derivative assets 910 519 150 48 153 1,780Derivative liabilities (709) (461) (146) (49) (136) (1,501)
201 58 4 (1) 17 279
The above derivative assets are included in ‘other investments’ in the primary statements.

305F
INA
NC
IAL
S
TA
TE
ME
NT
SG
: FIN
AN
CIA
L A
SSET
S A
ND
LIA
BIL
ITIE
S
The notional amount of the derivatives, distinguishing between UK insurance and US operations, was as follows:
2010 £m
UK insurance operationsNotional amount on whichfuture payments are based
US insurance operationsNotional amount on whichfuture payments are based
As at 31 December 2010 Asset Liability Asset Liability
Cross-currency swaps* 808 921 379 173Equity index put options – 1,458 – –Swaptions – 18 13,093 3,832Futures 3,068 7,150 – 2,701Forwards* 19,668 19,793 – –Inflation swaps 3,032 2,945 – –Credit default swaps 1,148 20 26 –Credit derivatives – – – 134Put options – – 8,048 –Equity options 34 – 3,514 867Total return swaps 215 215 – 192Interest rate swaps* 4,035 4,403 7,185 8,495
2009 £m
UK insurance operationsNotional amount on whichfuture payments are based
US insurance operationsNotional amount on whichfuture payments are based
As at 31 December 2009 Asset Liability Asset Liability
Cross-currency swaps* 808 881 376 168Swaptions 900 900 12,694 5,263Futures 2,267 2,987 – 1,534Forwards* 20,235 20,184 – –Inflation swaps 2,337 2,205 – –Credit default swaps 90 12 – –Credit derivatives – – – 189Put options – – 9,072 –Equity options 30 552 3,246 562Total return swaps 420 421 – –Interest rate swaps* 5,529 5,710 1,579 3,957
* In addition, the other operations, including the Group Treasury function and the Asian operations, have cross-currency swap assets and liabilities with notional amounts of £492 million (2009: £819 million) and £209 million (2009: £122 million) respectively, forward currency contracts assets and liabilities with notional amounts of £2,619 million (2009: £570 million) and £440 million (2009: £958 million) respectively, interest rate swaps assets and liabilities of £832 million (2009: £793 million) and of £195 million (2009: £522 million), respectively, and cliquet options assets of £nil (2009: £7 million).
These derivatives are used for efficient portfolio management to obtain cost effective and efficient exposure to various markets in accordance with the Group’s investment strategies and to manage exposure to interest rate, currency, credit and other business risks. See also note D3 for use of derivatives by the Group’s US operations. The Group uses various interest rate derivative instruments such as interest rate swaps to reduce exposure to interest rate volatility. The UK insurance operations use various currency derivatives in order to limit volatility due to foreign currency exchange rate fluctuations arising on securities denominated in currencies other than sterling. See also note G2 above. In addition, total return swaps and interest rate swaps are held for efficient portfolio management. As part of the efficient portfolio management of the PAC with-profits fund, the fund may, from time to time, invest in cash-settled forward contracts over Prudential plc shares, which are accounted for consistently with other derivatives. This is in order to avoid a mismatch of the with-profits investment portfolio with the investment benchmarks set for its equity-based investment funds. The contracts will form part of the long-term investments of the with-profits fund. These contracts are subject to a number of limitations for legal and regulatory reasons.
306
Prudential plc Annual Report 2010
FINANCIAL STATEMENTS > NOTES ON THE GROUP FINANCIAL STATEMENTS
G: FINANCIAL ASSETS AND LIABILITIESCONTINUED
G3: DERIVATIVES AND HEDGING > CONTINUED
Some of the Group’s products, especially those sold in the US, have certain guarantee features linked to equity indexes. A mismatch between product liabilities and the performance of the underlying assets backing them, exposes the Group to equity index risk. In order to mitigate this risk, the relevant business units purchase swaptions, equity options and futures to match asset performance with liabilities under equity-indexed products. The US operations and some of the UK operations hold large amounts of interest-rate sensitive investments that contain credit risks on which a certain level of defaults is expected. These entities have purchased some swaptions in order to manage the default risk on certain underlying assets and hence reduce the amount of regulatory capital held to support the assets.
HedgingThe Group has formally assessed and documented the effectiveness of the following hedges under IAS 39.
Fair value hedgesThe Group used interest rate derivatives to hedge the interest rate exposures on its US$300 million, 6.5 per cent perpetual subordinated capital securities until September 2010. The hedge terminated at this point. The impact on the Group’s income statement was immaterial. Where the hedge relationship has been de-designated and re-designated, the fair value adjustment to the hedged item up to the point of de-designation continues to be reported as part of the basis of the hedged item and is amortised to the income statement based on a recalculated effective interest rate over the residual period to the first break clause date of the perpetual subordinated capital securities. The Group has chosen to designate as a fair value hedge certain fixed to floating rate swaps which hedge the fair value exposure to interest rate movements of certain of the Group’s operational borrowings. The fair value of the derivatives designated as fair value hedges above at 31 December 2010, was an asset of £5 million (2009: asset of £7 million and liability of £1 million). Movements in the fair value of the hedging instruments of a net loss of £1 million (2009: net loss of £11 million) and the hedged items of a net gain of £1 million (2009: net gain of £11 million) are recorded in the income statement in respect of the fair value hedges above. Cash flow hedgesThe Group has no cash flow hedges in place.
Net investment hedgesThe Group has designated perpetual subordinated capital securities totalling US$2.3 billion (2009: US$1.55 billion) as a net investment hedge to hedge the currency risks related to the net investment in Jackson. The carrying value of the subordinated capital securities was £1,462 million as at 31 December 2010 (2009: £966 million). The foreign exchange loss of £45 million (2009: gain of £118 million) on translation of the borrowings to pounds sterling at the statement of financial position date is recognised in the translation reserve in shareholders’ equity. This net investment hedge was 100 per cent effective.
G4: DERECOGNITION AND COLLATERAL
Securities lending and reverse repurchase agreementsThe Group has entered into securities lending (including repurchase agreements) whereby blocks of securities are loaned to third-parties, primarily major brokerage firms. The amounts above the fair value of the loaned securities required to be held as collateral by the agreements depend on the quality of the collateral, calculated on a daily basis. The loaned securities are not removed from the Group’s consolidated statement of financial position, rather they are retained within the appropriate investment classification. Collateral typically consists of cash, debt securities, equity securities and letters of credit. At 31 December 2010, the Group had lent £8,708 million (2009: £10,501 million) of which £6,488 million (2009: £7,910 million) was lent by the PAC with-profits fund of securities and held collateral under such agreements of £9,334 million (2009: £10,669 million) of which £6,910 million (2009: £8,086 million) was held by the PAC with-profits fund. At 31 December 2010, the Group had entered into reverse repurchase transactions under which it purchased securities and had taken on the obligation to resell the securities for the purchase price of £1,208 million (2009: £1,587 million), together with accrued interest.
Collateral and pledges under derivative transactionsAt 31 December 2010, the Group had pledged £800 million (2009: £644 million) for liabilities and held collateral of £804 million (2009: £586 million) in respect of over-the-counter derivative transactions.

307F
INA
NC
IAL
S
TA
TE
ME
NT
SG
: FIN
AN
CIA
L A
SSET
S A
ND
LIA
BIL
ITIE
S
G5: IMPAIRMENT OF FINANCIAL ASSETS
In accordance with the Group’s accounting policy set out in note A4, impairment reviews were performed for available-for-sale securities and loans and receivables. In addition, impairment reviews were undertaken for the reinsurers’ share of insurance contract liabilities. During the year ended 31 December 2010, impairment losses of £145 million (2009: £647 million) were recognised for available-for-sale securities and loans and receivables. These were £124 million (2009: £630 million) in respect of available-for-sale securities held by Jackson and £21 million (2009: £17 million) in respect of loans and receivables. The 2010 impairment charge for loans and receivables of £21 million (2009: £17 million) relates to loans held by the UK with-profits fund and mortgage loans held by Jackson. Impairment losses recognised on available-for-sale securities amounted to £124 million (2009: £630 million). Of this amount, 90 per cent (2009: 86 per cent) has been recorded on structured asset-backed securities, primarily due to reduced cash flow expectations on such securities that are collateralised by diversified pools of primarily below investment grade securities. Of the losses related to the impairment of fixed maturity securities, the top five individual corporate issuers made up 32 per cent (2009: 11 per cent), reflecting a deteriorating business outlook of the companies concerned. The impairment losses have been recorded in ‘investment return’ in the income statement. In 2010, the Group realised gross losses on sales of available-for-sale securities of £160 million (2009: £134 million) with 45 per cent (2009: 60 per cent) of these losses related to the disposal of fixed maturity securities of 15 (2009: five) individual issuers, which were disposed of as part of risk reduction programmes intended to limit future credit loss exposure. Of the £160 million (2009: £134 million), £99 million (2009: £6 million) relates to losses on sales of impaired and deteriorating securities. The effect of those reasonably likely changes in the key assumptions underlying the estimates that underpin the assessment of whether impairment has taken place depends on the factors described in note A3. A key indicator of whether such impairment may arise in future, and the potential amounts at risk, is the profile of gross unrealised losses for fixed maturity securities accounted for on an available-for-sale basis by reference to the time periods by which the securities have been held continuously in an unrealised loss position and by reference to the maturity date of the securities concerned. For 2010 the amounts of gross unrealised losses for fixed maturity securities classified as available-for-sale under IFRS in an unrealised loss position was £370 million (2009: £966 million). Notes B1 and D3 provide further details on the impairment charges and unrealised losses of Jackson’s available-for-sale securities.

308
Prudential plc Annual Report 2010
FINANCIAL STATEMENTS > NOTES ON THE GROUP FINANCIAL STATEMENTS
H: OTHER INFORMATION ON STATEMENT OF FINANCIAL POSITION ITEMS
H1: INTANGIBLE ASSETS ATTRIBUTABLE TO SHAREHOLDERS
a Goodwill
2010 £m 2009 £m
COSTAt 1 January 1,430 1,461Disposal of Taiwan Agency business – (44)Additional consideration paid on previously acquired businesses – 13Acquisition of UOB Life Assurance Limited in Singapore 141 –Exchange differences 15 –
At 31 December 1,586 1,430
AGGREGATE IMPAIRMENTAt 1 January and 31 December (120) (120)
NET BOOK AMOUNT AT 31 DECEMBER 1,466 1,310
Impairment testingGoodwill does not generate cash flows independently of other groups of assets and thus is assigned to cash generating units (CGUs) for the purposes of impairment testing. These CGUs are based upon how management monitors the business and represent the lowest level to which goodwill can be allocated on a reasonable basis. An allocation to CGUs of the Group’s goodwill attributable to shareholders is shown below:
2010 £m 2009 £m
M&G 1,153 1,153Other 313 157
1,466 1,310
‘Other’ represents goodwill amounts allocated across CGUs in Asia and US operations. Other goodwill amounts are not individually material. During 2010 £141 million (SGD313 million) of goodwill was recognised upon the acquisition of UOB Life Assurance Limited. Upon translation at the year end exchange rate, the carrying value of this UOB Life Assurance goodwill at 31 December 2010 was £156 million.
Assessment of whether goodwill may be impairedGoodwill is tested for impairment by comparing the CGU’s carrying amount, including any goodwill, with its recoverable amount. With the exception of M&G, the goodwill attributable to shareholders in the statement of financial position mainly relates to acquired life businesses. The Company routinely compares the aggregate of net asset value and acquired goodwill on an IFRS basis of acquired life business with the value of the business as determined using the EEV methodology, as described in note D1. Any excess of IFRS over EEV carrying value is then compared with EEV basis value of current and projected future new business to determine whether there is any indication that the goodwill in the IFRS statement of financial position may be impaired. The assumptions underpinning the Group’s EEV basis of reporting are included in the EEV basis supplementary information in this Annual Report. In particular at 31 December 2010, the EEV of the CGU containing the UOB Life Assurance goodwill (being the Singapore insurance operations) materially exceeded its IFRS net asset value and so no impairment was deemed to arise.

309F
INA
NC
IAL
S
TA
TE
ME
NT
S
H: O
TH
ER
INFO
RM
AT
ION
ON
STA
TEM
ENT
OF FIN
AN
CIA
L P
OSIT
ION
ITE
MS
M>he recoverable amount for the M&G CGU has been determined by calculating its value in use. This has been calculated by aggregating the present value of future cash flows expected to be derived from the M&G operating segment (based upon management projections).
The discounted cash flow valuation has been based on a three-year plan prepared by M&G, and approved by management, and cash flow projections for later years. The value in use is particularly sensitive to a number of key assumptions as follows:
i The set of economic, market and business assumptions used to derive the three-year plan. The direct and secondary effects of recent developments, e.g. changes in global equity markets, are considered by management in arriving at the expectations for the financial projections for the plan.
ii The assumed growth rate on forecast cash flows beyond the terminal year of the plan. A growth rate of 2.5 per cent (2009: 2.5 per cent) has been used to extrapolate beyond the plan period representing management’s best estimate view of the long-term growth rate of the business after considering the future and past growth rates and external sources of data.
iii The risk discount rate. Differing discount rates have been applied in accordance with the nature of the individual component businesses. For retail and institutional business a risk discount rate of 12 per cent (2009: 12 per cent) has been applied to post-tax cash flows. The pre-tax risk discount rate was 16 per cent (2009: 16 per cent). Management have determined the risk discount rate by reference to an average implied discount rate for comparable UK listed asset managers calculated by reference to risk-free rates, equity risk premiums of five per cent and an average ‘beta’ factor for relative market risk of comparable UK listed asset managers. A similar approach has been applied for the other component businesses of M&G.
iv That asset management contracts continue on similar terms.
Management believes that any reasonable change in the key assumptions would not cause the recoverable amount of M&G to fall below its carrying amount.
Japanese life companyThe aggregate goodwill impairment of £120 million at 31 December 2010 and 2009 relates to the goodwill held in relation to the Japanese life operation which was impaired in 2005.
b Deferred acquisition costs and other intangible assets attributable to shareholdersThe deferred acquisition costs and other intangible assets in the Group consolidated statement of financial position attributable to shareholders comprise:
2010 £m 2009 £m
Deferred acquisition costs (DAC) related to insurance contracts as classified under IFRS 4 4,316 3,823Deferred acquisition costs related to investment management contracts, including life assurance contracts classified as financial instruments and investment management contracts under IFRS 4 110 107
4,426 3,930
Present value of acquired in-force policies for insurance contracts as classified under IFRS 4 70 52Present value of future profits of acquired investment management contracts, including life assurance contracts classified as financial instruments and investment management contracts under IFRS 4 – 1Distribution rights 113 66
183 119
Total of deferred acquisition costs and other intangible assets 4,609 4,049

310
Prudential plc Annual Report 2010
FINANCIAL STATEMENTS > NOTES ON THE GROUP FINANCIAL STATEMENTS
H: OTHER INFORMATION ON STATEMENT OF FINANCIAL POSITION ITEMSCONTINUED
H1: INTANGIBLE ASSETS ATTRIBUTABLE TO SHAREHOLDERS > CONTINUED
Deferred acquisition costs
UK£m
US(i)
£mAsia
£m
Asset management
£m
Otherintangibles
£m
Total2010
£m
Total2009
£m
BALANCE AT 1 JANUARY 124 3,092 706 8 119 4,049 5,349Additions 19 851 210 5 50 1,135 1,071Acquisition of UOB Life Assurance Ltd – – – – 12 12 –Amortisation to the income statement:
Operating profit (20) (334) (208) (4) (13) (579) (469)Amortisation related to short-term
fluctuations in investment returns – 358 – – – 358 153(20) 24 (208) (4) (13) (221) (316)
Exchange differences – 72 50 – 15 137 (550)Change in shadow DAC related to
movement in unrealised appreciation of Jackson’s securities classified as available-for-sale (see note D3(g) for explanation) – (496) – – – (496) (1,069)
Dilution of holding in PruHealth (7) – – – – (7) –DAC movement on sale of Taiwan
agency business – – – – – – (436)
BALANCE AT 31 DECEMBER 116 3,543 758 9 183 4,609 4,049
Notei The DAC amount in respect of US insurance operations includes £2,834 million (2009: £1,938 million) in respect of variable annuity business,
£1,229 million (2009: £1,164 million) in respect of other business and £(520) million (2009: £(10) million) in respect of cumulative shadow DAC.
Deferred acquisition costs related to insurance contracts attributable to shareholdersThe movement in deferred acquisition costs relating to insurance contracts attributable to shareholders is as follows:
2010 £m 2009 £m
DEFERRED ACQUISITION COSTS AT 1 JANUARY 3,823 5,097Additions 1,064 1,054Amortisation (190) (286)Exchange differences 122 (537)Change in shadow DAC related to movement in unrealised appreciation of Jackson’s securities
classified as available-for-sale (496) (1,069)Dilution of holding in PruHealth (7) –DAC movement on sale of Taiwan agency business – (436)
DEFERRED ACQUISITION COSTS AT 31 DECEMBER 4,316 3,823
Deferred acquisition costs related to investment management contracts attributable to shareholdersIncremental costs associated with the origination of investment management contracts written by the Group’s insurance and asset management businesses are capitalised and amortised as the related revenue is recognised.

311F
INA
NC
IAL
S
TA
TE
ME
NT
S
H: O
TH
ER
INFO
RM
AT
ION
ON
STA
TEM
ENT
OF FIN
AN
CIA
L P
OSIT
ION
ITE
MS
2010 £m 2009 £m
AT 1 JANUARYGross amount 162 148Accumulated amortisation (55) (40)
NET BOOK AMOUNT 107 108
Additions (through internal development) 21 14Amortisation (18) (15)
AT 31 DECEMBER 110 107
COMPRISING:Gross amount 183 162Accumulated amortisation (73) (55)
NET BOOK AMOUNT 110 107
Present value of acquired in-force business of long-term business contracts attributable to shareholdersThe present value of acquired in-force business (PVAIF) relating to investment contracts without discretionary participation features represents the contractual right to benefit from providing these investment management services in the future. The fair value is measured as the present value of the future profits of the investment management component of these contracts. These contracts are accounted for under the provisions of IAS 18. The PVAIF balance relating to insurance contracts is accounted for under UK GAAP as permitted by IFRS 4. The present value of future profits of acquired investment management contracts which was fully amortised during the year related to unit-linked contracts acquired as part of the M&G acquisition in 1999. Amortisation is charged to the ‘acquisition costs and other operating expenditure’ line in the income statement over the period of provision of asset management services as those profits emerge.
2010 £m 2009 £m
Insurancebusiness
Investmentmanagement
Insurancebusiness
Investmentmanagement
AT 1 JANUARYCost 175 12 184 12Accumulated amortisation (123) (11) (120) (11)
NET BOOK AMOUNT 52 1 64 1
Acquisition of UOB Life Assurance Ltd(note I1) 12 – – –Exchange differences 10 – (6) –Amortisation charge (4) (1) (6) –
AT 31 DECEMBER 70 – 52 1
COMPRISING:Cost 203 – 175 12Accumulated amortisation (133) – (123) (11)
NET BOOK AMOUNT 70 – 52 1
Distribution rights attributable to the Asian insurance operationsDistribution rights relate to facilitation fees paid in respect of the bancassurance partnership arrangements in Asia for the bank distribution of Prudential’s insurance products for a fixed period of time. The distribution rights amounts are amortised over the term of the distribution contracts.

312
Prudential plc Annual Report 2010
FINANCIAL STATEMENTS > NOTES ON THE GROUP FINANCIAL STATEMENTS
H: OTHER INFORMATION ON STATEMENT OF FINANCIAL POSITION ITEMSCONTINUED
H1: INTANGIBLE ASSETS ATTRIBUTABLE TO SHAREHOLDERS > CONTINUED
2010 £m 2009 £m
AT 1 JANUARYGross amount 79 84Accumulated amortisation (13) (5)
66 79
Additions(i) 50 3Amortisation charge (8) (9)Exchange differences 5 (7)
AT 31 DECEMBER 113 66
COMPRISING:Gross amount 136 79Accumulated amortisation (23) (13)
113 66
Notei In addition to the acquired assets and liabilities of UOB Life Assurance in 2010, as explained in note I1, the Group entered into distribution
agreements with UOB for consideration of SGD 110 million (£50 million). The distribution rights have been accounted for as an intangible asset.
H2: INTANGIBLE ASSETS ATTRIBUTABLE TO WITH-PROFITS FUNDS
a Goodwill in respect of acquired investment subsidiaries for venture fund and other investment purposes
2010 £m 2009 £m
AT 1 JANUARY 124 174Additions in the year(note I8(iii)) 42 –Impairment – (50)
AT 31 DECEMBER 166 124
All the goodwill relates to the UK insurance operations segment. The venture fund investments consolidated by the Group relates to investments by PAC with-profits fund managed by M&G. The goodwill shown in the table above relates to these venture fund investments. Goodwill is tested for impairment for these investments by comparing the investment’s carrying value including goodwill with its recoverable amount. The recoverable amount of the investments is determined by calculating their fair value less costs to sell. The fair value is determined by using a discounted cash flow valuation. The valuations are based on cash flow projections to 2015 prepared by management after considering the historical experience and future growth rates of the business. The key assumption applied in the calculations is the risk discount rate ranging from 10 to 14 per cent derived by reference to risk-free rates and an equity premium risk. In 2010, no goodwill was deemed to be impaired following the impairment testing carried out. In 2009, following the impairment testing carried out, £50 million of the goodwill was deemed to be impaired. In 2009, the impairment charge was recorded under ‘acquisition costs and other expenditure’ but was also taken account of in determining the charge/credit in the income statement for the transfer to the liability for unallocated surplus of with-profits funds. Accordingly, the charge did not affect shareholders’ profits or equity.
b Deferred acquisition costs and other intangible assetsOther intangible assets in the Group consolidated statement of financial position attributable to with-profits funds consist of:
2010 £m 2009 £m
Deferred acquisition costs related to insurance contracts attributable to the PAC with-profits fund 13 9Distribution rights attributable to with-profits funds of the Asian insurance operations 97 97
110 106

313F
INA
NC
IAL
S
TA
TE
ME
NT
S
H: O
TH
ER
INFO
RM
AT
ION
ON
STA
TEM
ENT
OF FIN
AN
CIA
L P
OSIT
ION
ITE
MS
Deferred acquisition costs related to insurance contracts attributable to the PAC with-profits fundThe movement in deferred acquisition costs relating to insurance contracts attributable to the PAC with-profits fund is as follows:
2010 £m 2009 £m
AT 1 JANUARY 9 13Additions 9 –Amortisation charge (5) (4)
AT 31 DECEMBER 13 9
The above costs relate to non-participating business written by the PAC with-profits sub-fund. No deferred acquisition costs are established for the participating business.
Distribution rights attributable to with-profit funds of the Asian insurance operationsDistribution rights relate to facilitation fees paid in relation to the bancassurance partnership arrangements in Asia for the bank distribution of Prudential’s insurance products for a fixed period of time. The distribution rights amounts are amortised over the term of the distribution contracts.
2010 £m 2009 £m
AT 1 JANUARYGross amount 103 115Accumulated amortisation (6) (2)
97 113
Additions – –Amortisation charge (4) (4)Exchange differences 4 (12)
AT 31 DECEMBER 97 97
COMPRISING:Gross amount 108 103Accumulated amortisation (11) (6)
97 97
H3: REINSURERS’ SHARE OF INSURANCE CONTRACT LIABILITIES
2010 £m 2009 £m
Insurance contract liabilities 1,167 1,114Claims outstanding 177 73
1,344 1,187
The movement on reinsurers’ share of insurance contract liabilities is as follows:
2010 £m 2009 £m
AT 1 JANUARY 1,114 1,176Movement in the year 31 24Foreign exchange translation differences 22 (86)
AT 31 DECEMBER 1,167 1,114

314
Prudential plc Annual Report 2010
FINANCIAL STATEMENTS > NOTES ON THE GROUP FINANCIAL STATEMENTS
H: OTHER INFORMATION ON STATEMENT OF FINANCIAL POSITION ITEMSCONTINUED
H4: TAX ASSETS AND LIABILITIES
AssetsOf the £555 million (2009: £636 million) current tax recoverable, the majority is expected to be recovered in one year or less.
Deferred tax asset
2010 £m 2009 £m
Unrealised losses on investments 449 1,156Balances relating to investment and insurance contracts 11 20Short-term timing differences 1,152 1,228Capital allowances 16 18Unused deferred tax losses 560 286
Total 2,188 2,708
The deferred tax asset at 31 December 2010 and 2009 arises in the following parts of the Group:
2010 £m 2009 £m
UK insurance operations: SAIF 2 2 PAC with-profits fund (including PAL) 108 141 Other 104 149US insurance operations 1,391 1,944Asian insurance operations 98 132Other operations 485 340
Total 2,188 2,708
The decrease in deferred tax asset primarily relates to the reduction in unrealised losses on investments due to the improved investment markets. Deferred tax assets are recognised to the extent that they are regarded as recoverable, that is to the extent that, on the basis of all available evidence, it can be regarded as more likely than not that there will be suitable taxable profits from which the future reversal of the underlying temporary differences can be deducted. The taxation regimes applicable across the Group apply separate rules to trading and capital profits and losses. The distinction between temporary differences that arise from items of either a trading or capital nature may affect the recognition of deferred tax assets. Accordingly, for the 2010 results and statement of financial position at 31 December 2010, the possible tax benefit of approximately £143 million (2009: £257 million), which may arise from capital losses valued at approximately £0.5 billion (2009: £1.2 billion), is sufficiently uncertain that it has not been recognised. In addition, a potential deferred tax asset of £298 million (2009: £607 million), which may arise from tax losses and other potential temporary differences totalling £1.2 billion (2009: £2.1 billion) is sufficiently uncertain that it has not been recognised. Forecasts as to when the tax losses and other temporary differences are likely to be utilised indicate that they may not be utilised in the short-term.
LiabilitiesThe current tax liability decreased to £831 million (2009: £1,215 million) due to an exceptional tax credit which primarily relates to the impact of a settlement agreed with the UK tax authorities together with the ability to recognise a tax credit on costs incurred in relation to the terminated AIA transaction.

315F
INA
NC
IAL
S
TA
TE
ME
NT
S
H: O
TH
ER
INFO
RM
AT
ION
ON
STA
TEM
ENT
OF FIN
AN
CIA
L P
OSIT
ION
ITE
MS
Deferred tax liability
2010 £m 2009 £m
Unrealised gains on investments 1,678 1,744Balances relating to investment and insurance contracts 1,057 961Short-term timing differences 1,477 1,159Capital allowances 12 8
Total 4,224 3,872
The increase in deferred tax liability primarily relates to the rise in deferred acquisition costs (shown within short-term timing differences above) as a result of the increase in insurance new business during the year. Unprovided deferred income tax liabilities on temporary differences associated with investments in subsidiaries, associates and interests in joint ventures are considered to be insignificant due to the availability of various UK tax exemptions and reliefs. The UK government’s tax rate change to 27 per cent has had the effect of reducing the UK with-profits and shareholder-backed business elements of the net deferred tax balances as at 31 December 2010 by £11 million. The tax change to 27 per cent is effective from 1 April 2011 but enacted at 31 December 2010.The subsequent proposed phased rate changes to 24 per cent are expected to have the effect of reducing the UK with-profits and shareholder-backed business elements of the net deferred tax balances at 31 December 2010 by £65 million.
H5: ACCRUED INVESTMENT INCOME AND OTHER DEBTORS
2010 £m 2009 £m
ACCRUED INVESTMENT INCOMEInterest receivable 1,844 1,718Other 824 755
Total 2,668 2,473
OTHER DEBTORSPremiums receivable: From policyholders 141 148 From intermediaries 28 17 From reinsurers 27 82Other 707 515
Total 903 762
TOTAL ACCRUED INVESTMENT INCOME AND OTHER DEBTORS 3,571 3,235
Of the £3,571 million (2009: £3,235 million) of accrued investment income and other debtors, £151 million (2009: £134 million) is expected to be settled after one year or more.

316
Prudential plc Annual Report 2010
FINANCIAL STATEMENTS > NOTES ON THE GROUP FINANCIAL STATEMENTS
H: OTHER INFORMATION ON STATEMENT OF FINANCIAL POSITION ITEMSCONTINUED
H6: PROPERTY, PLANT AND EQUIPMENT
Property, plant and equipment comprise Group occupied properties, development property (until 2009) and tangible assets. A reconciliation of the carrying amount of these items from the beginning of the year to the end of the year is as follows:
Groupoccupiedproperty
£m
Developmentproperty
£m
Tangibleassets
£mTotal
£m
AT 1 JANUARY 2009Cost 292 131 717 1,140Accumulated depreciation (29) – (476) (505)
NET BOOK AMOUNT 263 131 241 635
YEAR ENDED 31 DECEMBER 2009Opening net book amount 263 131 241 635Exchange differences (9) – (31) (40)Depreciation charge (4) – (70) (74)Additions 2 – 89 91Disposals (including amounts disposed of with the Taiwan agency business) (99) – (15) (114)Reclassified as investment property* – (131) – (131)
CLOSING NET BOOK AMOUNT 153 – 214 367
AT 1 JANUARY 2010Cost 173 – 661 834Accumulated depreciation (20) – (447) (467)
Net book amount 153 – 214 367
YEAR ENDED 31 DECEMBER 2010Opening net book amount 153 – 214 367Exchange differences 5 – 9 14Depreciation charge (4) – (68) (72)Additions 19 – 74 93Arising on acquisitions of subsidiaries – – 220 220Disposals – – (10) (10)
CLOSING NET BOOK AMOUNT 173 – 439 612
AT 31 DECEMBER 2010Cost 197 – 908 1,105Accumulated depreciation (24) – (469) (493)
NET BOOK AMOUNT 173 – 439 612
* In line with the 2008 IASB Annual Improvements Project, all development properties were reclassified as investment properties with effect from
1 January 2009.
The total property, plant and equipment relates to continuing operations only.
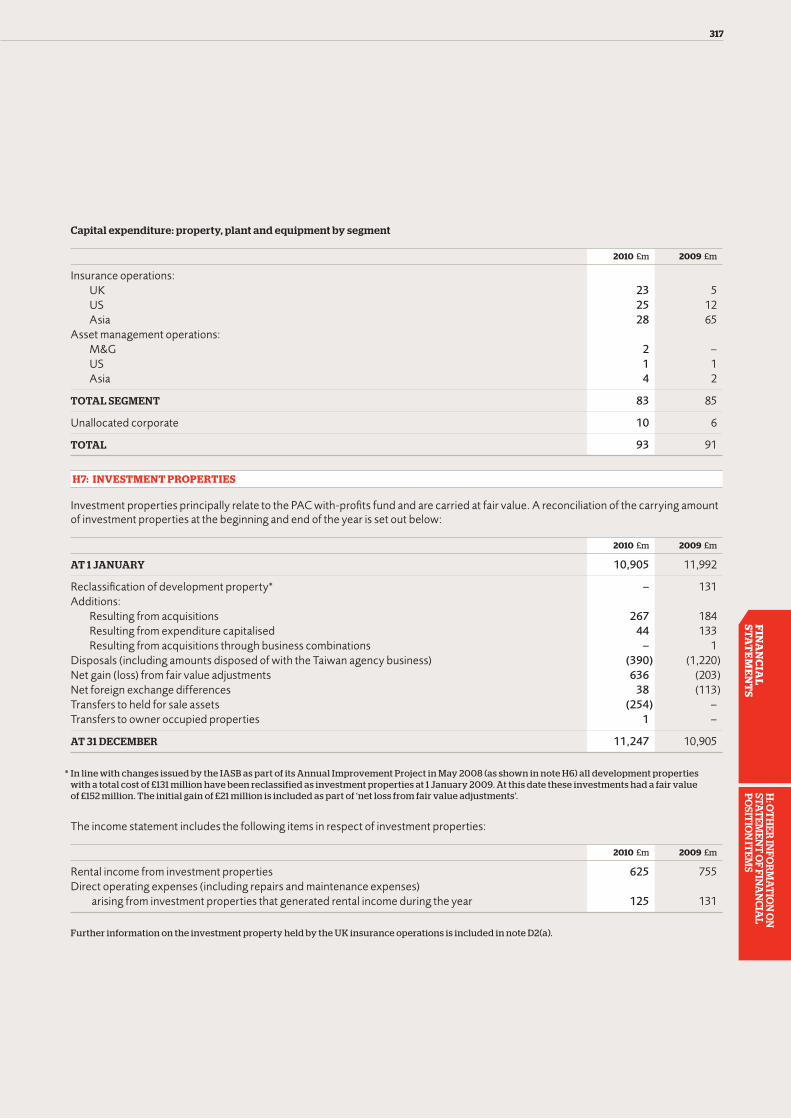
317F
INA
NC
IAL
S
TA
TE
ME
NT
S
H: O
TH
ER
INFO
RM
AT
ION
ON
STA
TEM
ENT
OF FIN
AN
CIA
L P
OSIT
ION
ITE
MS
Capital expenditure: property, plant and equipment by segment
2010 £m 2009 £m
Insurance operations: UK 23 5 US 25 12 Asia 28 65Asset management operations: M&G 2 – US 1 1 Asia 4 2
TOTAL SEGMENT 83 85
Unallocated corporate 10 6
TOTAL 93 91
H7: INVESTMENT PROPERTIES
Investment properties principally relate to the PAC with-profits fund and are carried at fair value. A reconciliation of the carrying amount of investment properties at the beginning and end of the year is set out below:
2010 £m 2009 £m
AT 1 JANUARY 10,905 11,992
Reclassification of development property* – 131Additions: Resulting from acquisitions 267 184 Resulting from expenditure capitalised 44 133 Resulting from acquisitions through business combinations – 1Disposals (including amounts disposed of with the Taiwan agency business) (390) (1,220)Net gain (loss) from fair value adjustments 636 (203)Net foreign exchange differences 38 (113)Transfers to held for sale assets (254) –Transfers to owner occupied properties 1 –
AT 31 DECEMBER 11,247 10,905
* In line with changes issued by the IASB as part of its Annual Improvement Project in May 2008 (as shown in note H6) all development properties with a total cost of £131 million have been reclassified as investment properties at 1 January 2009. At this date these investments had a fair value of £152 million. The initial gain of £21 million is included as part of ‘net loss from fair value adjustments’.
The income statement includes the following items in respect of investment properties:
2010 £m 2009 £m
Rental income from investment properties 625 755Direct operating expenses (including repairs and maintenance expenses) arising from investment properties that generated rental income during the year 125 131
Further information on the investment property held by the UK insurance operations is included in note D2(a).

318
Prudential plc Annual Report 2010
FINANCIAL STATEMENTS > NOTES ON THE GROUP FINANCIAL STATEMENTS
H: OTHER INFORMATION ON STATEMENT OF FINANCIAL POSITION ITEMSCONTINUED
H7: INVESTMENT PROPERTIES > CONTINUED
Investment properties of £3,435 million (2009: £3,177 million) are held under finance leases. A reconciliation between the total of future minimum lease payments at the statement of financial position date and their present value is shown below:
2010 £m 2009 £m
Future minimum lease payments at 31 December 1,107 1,683Future finance charges on finance leases (972) (1,517)
Present value of minimum lease payments 135 166
Future minimum lease payments are due as follows: Less than 1 year 7 9 1 to 5 years 28 38 Over 5 years 1,072 1,636
Total 1,107 1,683
The present values of these minimum lease payments are: Less than 1 year 7 8 1 to 5 years 24 38 Over 5 years 104 120
Total 135 166
Contingent rent is that portion of the lease payments that is not fixed in amount but is based on the future value of a factor that changes other than with the passage of time. There was no contingent rent recognised as income or expense in 2010 and 2009. The Group’s policy is to rent investment properties to tenants through operating leases. Minimum future rentals to be received on non-cancellable operating leases are receivable in the following periods:
2010 £m 2009 £m
Less than 1 year 601 6621 to 5 years 2,121 2,282Over 5 years 5,616 7,792
Total 8,338 10,736
The total minimum future rentals to be received on non-cancellable sub-leases for land and buildings at 31 December 2010 are £3,366 million (2009: £3,684 million).
H8: INVESTMENTS IN ASSOCIATES AND JOINT VENTURES
Investments in associatesThe Group had three associates at 31 December 2010 (2009: three) that are accounted for using the equity method. The Group’s associates are a 30 per cent interest in The Nam Khang, a Vietnamese property developer, a 30 per cent interest in Apollo Education and Training Organisation Vietnam and a 25 per cent interest in PruHealth, following the loss of joint control in the period (see note I2). OYO Developments Limited a 25 per cent associate was disposed during the year. The Group also has investments in associates which meet the IAS 28 criteria for measurement at fair value through profit and loss in accordance with IAS 39.

319F
INA
NC
IAL
S
TA
TE
ME
NT
S
H: O
TH
ER
INFO
RM
AT
ION
ON
STA
TEM
ENT
OF FIN
AN
CIA
L P
OSIT
ION
ITE
MS
Associates accounted for using the equity methodA summary of the movements in investments in associates accounted for using the equity method in 2010 and 2009 is set out below:
Share ofcapital
£m
Share ofreserves
£m
Share ofnet assets
£mGoodwill
£m
Total carrying
value£m
BALANCE AT 1 JANUARY 2009 12 (4) 8 2 10Exchange translations and other movements (7) 4 (3) (1) (4)Share of loss for the year after tax – – – – –
BALANCE AT 31 DECEMBER 2009 5 – 5 1 6
Transfer of PruHealth to associates (note I2) 1 65 66 – 66Acquisition/capital injection in PruHealth 9 – 9 – 9Exchange translation and other movements (3) (1) (4) – (4)Share of loss for the year after tax – (6) (6) – (6)
BALANCE AT 31 DECEMBER 2010 12 58 70 1 71
There have been no changes recognised in the other comprehensive income of associates that would also be recognised in the other comprehensive income by the Group. The Group’s share of the assets, liabilities, revenues and profit and loss of associates accounted for using the equity method at 31 December 2010 and 2009 is as follows:
2010 £m 2009 £m
FINANCIAL POSITIONTotal assets (excluding goodwill) 70 5Total liabilities – –
Net assets 70 5
RESULTS OF OPERATIONSRevenue* 39 1Loss in the year* (6) –
* The 2010 amounts include the Group’s share of PruHealth’s revenue and profit and loss for the five months ended 31 December 2010.Prior to August 2010, PruHealth was accounted for as a joint venture (see note I2 and the note below).
Associates carried at fair value through profit and lossThe Group’s associates that are carried at fair value through profit and loss comprise investments in OEICs, unit trusts, funds holding collateralised debt obligations, property unit trusts, and venture capital investments of the PAC with-profits fund where the Group has significant influence. These investments are incorporated both in the UK and overseas, and some have year ends which are non-coterminous with that of the Group. In these instances, the investments are recorded at fair value at 31 December 2010 based on valuations or pricing information at that specific date. The aggregate fair value of associates carried at fair value through profit and loss where there are published price quotations is approximately £5 billion (2009: £6 billion) at 31 December 2010. The aggregate assets of these associates are approximately £6 billion (2009: £9 billion). Aggregate liabilities, excluding liabilities to unit holders and shareholders for unit trusts and OEICs, are approximately £1 billion (2009: £2 billion). Fund revenues, with revenue arising in unit trusts and OEICs deemed to constitute the investment return for these vehicles, were approximately £0.4 billion (2009: £0.8 billion) and net loss in the year, excluding unit trusts and OEICs where all investment returns accrue to unit holders or shareholders respectively, was approximately £0.1 billion (2009: profit of £0.2 billion).

320
Prudential plc Annual Report 2010
FINANCIAL STATEMENTS > NOTES ON THE GROUP FINANCIAL STATEMENTS
H: OTHER INFORMATION ON STATEMENT OF FINANCIAL POSITION ITEMSCONTINUED
H8: INVESTMENTS IN ASSOCIATES AND JOINT VENTURES > CONTINUED
Investments in joint venturesJoint ventures represent activities over which the Group exercises joint control through contractual agreement with one or more parties. The Group’s significant joint ventures, which are accounted for using proportionate consolidation, comprise various joint ventures relating to property investments where the Group has a 50 per cent interest as well as the following interests:
Investment % held Principal activity Country
CITIC Prudential Life Insurance Company Limited 50 Life assurance ChinaCITIC Prudential Fund Management Company Limited 49 Asset management ChinaPrudential ICICI Asset Management Company Limited 49 Asset management IndiaPrudential BSN Takaful Berhad 49 General and life insurance MalaysiaBOCI Prudential Asset Management Limited 36 Asset management ChinaICICI Prudential Life Insurance Company Limited 26 Life assurance India
The investments noted in the table above have the same accounting year end as the Group, except for ICICI Prudential Life Insurance Company Limited and Prudential ICICI Asset Management Company Limited. Although these investments have reporting periods ending 31 March, 12 months of financial information up to 31 December is recorded. Accordingly, the information covers the same period as that of the Group. The summarised financial data for the Group’s share of investments in joint ventures is as follows:
2010 £m 2009 £m
FINANCIAL POSITIONCurrent assets 327 386Non-current assets 3,386 2,462
Total assets 3,713 2,848
Current liabilities (329) (150)Non-current liabilities (3,093) (2,392)
Total liabilities (3,422) (2,542)
Net equity 291 306
RESULTS OF OPERATIONSRevenues* 1,195 974Expenses* (1,135) (945)
Net profit (loss) 60 29
* The 2010 amounts include the Group’s share of PruHealth’s results for the seven months ended 31 July 2010. On 1 August 2010 the Group’s interest in PruHealth was diluted and the Group’s investment was reclassified as an associate (see note I2 and the note above).
There are several minor service agreements in place between the joint ventures and the Group. During 2010, the aggregate amount of the transactions was £29.7 million (2009: £14.1 million) and the balance outstanding as at 31 December 2010 was £69.5 million (2009: £54.6 million). The joint ventures have no significant contingent liabilities to which the Group is exposed nor does the Group have any significant contingent liabilities in relation to its interest in the joint ventures.
H9: PROPERTIES HELD FOR SALE
Investment properties are classified as held for sale when contracts have been exchanged but the sale has not been completed at the period end. At 31 December 2010 the value of assets held for sale was £257 million (2009: £3 million). Gains on disposal of held for sale assets are recorded in ‘investment return’ within the income statement.

321F
INA
NC
IAL
S
TA
TE
ME
NT
S
H: O
TH
ER
INFO
RM
AT
ION
ON
STA
TEM
ENT
OF FIN
AN
CIA
L P
OSIT
ION
ITE
MS
H10: CASH AND CASH EQUIVALENTS
Cash and cash equivalents consist of cash at bank and in hand, deposits held at call with banks, treasury bills and other short-term highly liquid investments with less than 90 days maturity from the date of acquisition. Cash and cash equivalents included in the cash flow statement comprise the following statement of financial position amounts:
2010 £m 2009 £m
Cash 6,167 5,071Cash equivalents 464 236
TOTAL CASH AND CASH EQUIVALENTS 6,631 5,307
Cash and cash equivalents held centrally are considered to be available for general use by the Group. These funds amount to £523 million and £895 million at 31 December 2010 and 2009, respectively. The remaining funds are considered not to be available for general use by the Group, and include funds held for the benefit of policyholders.
H11: SHAREHOLDERS’ EQUITY: SHARE CAPITAL, SHARE PREMIUM AND RESERVES
2010 £m 2009 £m
SHARE CAPITAL AND SHARE PREMIUMShare capital 127 127Share premium 1,856 1,843RESERVESRetained earnings 4,982 3,964Translation reserve 454 203Available-for-sale reserve 612 134
TOTAL SHAREHOLDERS’ EQUITY 8,031 6,271
A summary of the ordinary shares in issue is set out below:
Share capital and share premium
2010
Number ofordinary
shares
Sharecapital
£m
Sharepremium
£m
Issued shares of 5p each fully paid: At 1 January 2010 2,532,227,471 127 1,843 Shares issued under share option schemes 2,455,227 – 13 Shares issued in lieu of cash dividends 10,911,808 – 62 Reserve movements in respect of shares issued in lieu of cash dividends – – (62)
At 31 December 2010 2,545,594,506 127 1,856
2009
Number ofordinary
shares
Sharecapital
£m
Sharepremium
£m
Issued shares of 5p each fully paid: At 1 January 2009 2,496,947,688 125 1,840 Shares issued under share option schemes 605,721 – 3 Shares issued in lieu of cash dividends 34,674,062 2 136 Reserve movements in respect of shares issued in lieu of cash dividends – – (136)
At 31 December 2009 2,532,227,471 127 1,843

322
Prudential plc Annual Report 2010
FINANCIAL STATEMENTS > NOTES ON THE GROUP FINANCIAL STATEMENTS
H: OTHER INFORMATION ON STATEMENT OF FINANCIAL POSITION ITEMSCONTINUED
H11: SHAREHOLDERS’ EQUITY: SHARE CAPITAL, SHARE PREMIUM AND RESERVES > CONTINUED
Amounts recorded in share capital represent the nominal value of the shares issued. The difference between the proceeds received on issue of shares, net of issue costs, and the nominal value of shares issued is credited to the share premium account. Shares issued in lieu of cash dividends are considered to take the legal form of bonus issue shares and have been accounted for as such. At 31 December 2010, there were options outstanding under Save As You Earn schemes to subscribe for 12,802,482 (2009: 12,230,833) shares at prices ranging from 288 pence to 572 pence (2009: 266 pence to 572 pence) and exercisable by the year 2016 (2009: 2016). The cost of own shares of £75 million as at 31 December 2010 (2009: £75 million) is deducted from retained earnings. The Company has established trusts to facilitate the delivery of shares under employee incentive plans and savings-related share option schemes. At 31 December 2010, 4.5 million (2009: 5.3 million) Prudential plc shares with a market value of £30 million (2009: £34 million) were held in such trusts. Of this total, 4.4 million (2009: 4.8 million) shares were held in trusts under employee incentive plans. In 2010, the Company purchased 5.7 million (2009: 3.4 million) shares in respect of employee incentive plans at a cost of £32 million (2009: £17 million). The maximum number of shares held in the year was 5.3 million which was at the beginning of the year. Of the total shares held in trust, 0.1 million (2009: 0.5 million) shares were held by a qualifying employee share ownership trust. These shares are expected to be fully distributed in the future on maturity of savings-related share option schemes. The shares purchased each month are as follows:
Share Price
2010Number of
sharesLow
£High
£Cost
£
January 9,338 6.38 6.38 59,530 February 11,638 5.68 5.68 66,046 March 3,908,274 5.16 6.09 20,884,460 April 11,129 5.63 5.63 62,601 May 14,638 5.59 5.59 81,753 June 190,991 5.26 5.66 1,075,712 July 13,457 5.14 5.14 69,102 August 10,016 5.86 5.86 58,644 September 13,727 5.25 5.84 78,539 October 11,634 6.37 6.37 74,108 November 385,321 5.74 6.49 2,244,770 December 1,153,611 6.04 6.65 7,445,358
TOTAL 5,733,774 32,200,623
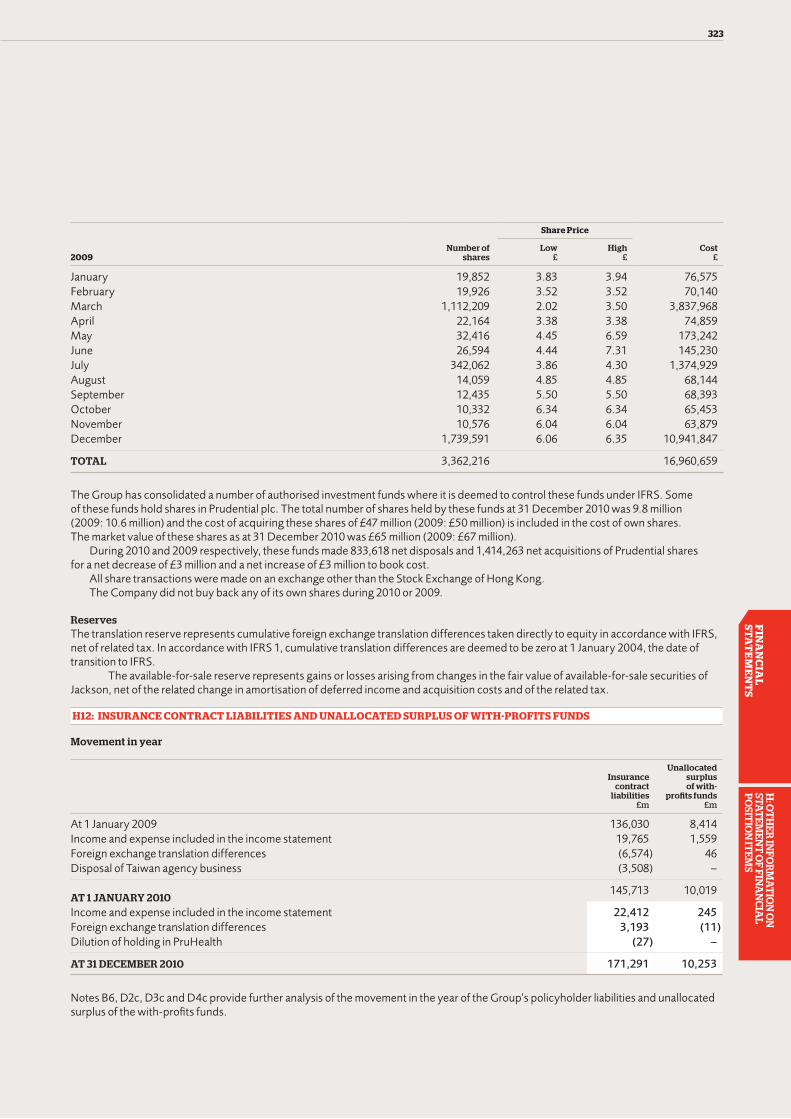
323F
INA
NC
IAL
S
TA
TE
ME
NT
S
H: O
TH
ER
INFO
RM
AT
ION
ON
STA
TEM
ENT
OF FIN
AN
CIA
L P
OSIT
ION
ITE
MS
Share Price
2009Number of
sharesLow
£High
£Cost
£
January 19,852 3.83 3.94 76,575 February 19,926 3.52 3.52 70,140 March 1,112,209 2.02 3.50 3,837,968 April 22,164 3.38 3.38 74,859 May 32,416 4.45 6.59 173,242 June 26,594 4.44 7.31 145,230 July 342,062 3.86 4.30 1,374,929 August 14,059 4.85 4.85 68,144 September 12,435 5.50 5.50 68,393 October 10,332 6.34 6.34 65,453 November 10,576 6.04 6.04 63,879 December 1,739,591 6.06 6.35 10,941,847
TOTAL 3,362,216 16,960,659
The Group has consolidated a number of authorised investment funds where it is deemed to control these funds under IFRS. Some of these funds hold shares in Prudential plc. The total number of shares held by these funds at 31 December 2010 was 9.8 million (2009: 10.6 million) and the cost of acquiring these shares of £47 million (2009: £50 million) is included in the cost of own shares. The market value of these shares as at 31 December 2010 was £65 million (2009: £67 million).
During 2010 and 2009 respectively, these funds made 833,618 net disposals and 1,414,263 net acquisitions of Prudential shares for a net decrease of £3 million and a net increase of £3 million to book cost.
All share transactions were made on an exchange other than the Stock Exchange of Hong Kong.The Company did not buy back any of its own shares during 2010 or 2009.
ReservesThe translation reserve represents cumulative foreign exchange translation differences taken directly to equity in accordance with IFRS, net of related tax. In accordance with IFRS 1, cumulative translation differences are deemed to be zero at 1 January 2004, the date of transition to IFRS.
The available-for-sale reserve represents gains or losses arising from changes in the fair value of available-for-sale securities of Jackson, net of the related change in amortisation of deferred income and acquisition costs and of the related tax.
H12: INSURANCE CONTRACT LIABILITIES AND UNALLOCATED SURPLUS OF WITH-PROFITS FUNDS
Movement in year
Insurancecontract
liabilities £m
Unallocatedsurplus of with-
profits funds £m
At 1 January 2009 136,030 8,414Income and expense included in the income statement 19,765 1,559Foreign exchange translation differences (6,574) 46Disposal of Taiwan agency business (3,508) –
AT 1 JANUARY 2010145,713 10,019
Income and expense included in the income statement 22,412 245Foreign exchange translation differences 3,193 (11)Dilution of holding in PruHealth (27) –
AT 31 DECEMBER 2010 171,291 10,253
Notes B6, D2c, D3c and D4c provide further analysis of the movement in the year of the Group’s policyholder liabilities and unallocated surplus of the with-profits funds.

324
Prudential plc Annual Report 2010
FINANCIAL STATEMENTS > NOTES ON THE GROUP FINANCIAL STATEMENTS
H: OTHER INFORMATION ON STATEMENT OF FINANCIAL POSITION ITEMSCONTINUED
H13: BORROWINGS
Core structural borrowings of shareholder-financed operations
2010 £m 2009 £m
InnovativeTier 1*
InnovativeTier 2* Senior† Total Total
CENTRAL OPERATIONSSubordinated debt: ¤500m 5.75% Subordinated Notes 2021note i 428 428 443 ¤20m Medium-Term Subordinated Notes 2023note ii 17 17 18 £435m 6.125% Subordinated Notes 2031 428 428 428 £400m 11.375% Subordinated Notes 2039 382 382 380 US$1,000m 6.5% Perpetual Subordinated Capital Securities 639 639 619 US$250m 6.75% Perpetual Subordinated Capital Securitiesnote iii 160 160 155 US$300m 6.5% Perpetual Subordinated Capital Securitiesnote iii 192 192 192 US$750m 11.75% Perpetual Subordinated Capital Securities 472 472 456
1,463 1,255 – 2,718 2,691Senior debt: £300m 6.875% Bonds 2023 300 300 300 £250m 5.875% Bonds 2029 249 249 249
– – 549 549 549
TOTAL CENTRAL OPERATIONS 1,463 1,255 549 3,267 3,240
PRUCAP £250m bank loan note iv 250 250 –JACKSON US$250m 8.15% Surplus Notes 2027 note v 159 159 154
TOTAL notes vi, vii 1,463 1,414 799 3,676 3,394
* These debt classifications are consistent with the treatment of capital for regulatory purposes, as defined in the FSA Handbook.† The senior debt ranks above subordinated debt in the event of liquidation.
Notesi The €500 million 5.75 per cent borrowings have been swapped into borrowings of £333 million with interest payable at six month £LIBOR plus
0.962 per cent.ii The €20 million borrowings were issued at 20-year Euro Constant Maturity Swap (capped at 6.5 per cent). These have been swapped into
borrowings of £14 million with interest payable at three month £LIBOR plus 1.2 per cent.iii The US$250 million 6.75 per cent borrowings and the US$300 million 6.5 per cent borrowings can be converted, in whole or in part, at the
Company’s option and subject to certain conditions, on any interest payment date falling on or after 23 March 2010 and 23 March 2011 respectively, into one or more series of Prudential preference shares.
iv The £250 million PruCap bank loan was made in two tranches: £135 million maturing in June 2014, currently drawn at a cost of six month £LIBOR plus 1.2 per cent and £115 million maturing in August 2012, currently drawn at a cost of twelve month £LIBOR plus 1.41 per cent.
v The Jackson borrowings are unsecured and subordinated to all present and future indebtedness, policy claims and other creditor claims of Jackson.vi Maturity analysis The following table sets out the contractual maturity analysis of the Group’s core structural borrowings:
2010 £m 2009 £m
Less than 1 year – –1 to 2 years 115 –2 to 3 years – –3 to 4 years 135 –4 to 5 years – –Over 5 years 3,426 3,394
Total 3,676 3,394

325F
INA
NC
IAL
S
TA
TE
ME
NT
S
H: O
TH
ER
INFO
RM
AT
ION
ON
STA
TE
ME
NT
OF FIN
AN
CIA
L P
OSIT
ION
ITE
MS
vii Management analyses the net core structural borrowings position as follows:
2010 £m 2009 £m
Total core structural borrowings (as above) 3,676 3,394Less: Holding company cash and short-term investments(recorded within the consolidated statement of financial position) (1,232) (1,486)
Net core structural borrowings of shareholder-financed operations 2,444 1,908
Operational borrowings attributable to shareholder-financed operations
2010 £m 2009 £m
BORROWINGS IN RESPECT OF SHORT-TERM FIXED INCOME SECURITIES PROGRAMMESCommercial paper 2,311 2,031Medium-Term Notes 2010 – 7Bank Notes 2013 249 –
2,560 2,038
NON-RECOURSE BORROWINGS OF US OPERATIONSnote i
Jacksonnote ii 10 –Investment subsidiaries 20 20Piedmont and CDO fundsnote iii 60 183
90 203
OTHER BORROWINGSBank loans and overdrafts 5 148Obligations under finance leases 2 3Other borrowingsnote iv 347 359
354 510
TOTALnotes v, vi 3,004 2,751
Notesi In all instances the holders of the debt instruments issued by these subsidiaries and funds do not have recourse beyond the assets of those
subsidiaries and funds.ii This represents senior debt issued through the Federal Home Loan Bank of Indianapolis and was secured on collateral posted with FHLB by
Jackson. iii Piedmont is an investment trust investing in certain asset-backed and mortgage-backed securities in the US. These borrowings pertain to debt
instruments issued to external parties.iv Other borrowings represents amounts whose repayment to the lender is contingent on future surpluses emerging from certain contracts
specified under the arrangement. If insufficient surplus emerges on the contracts, there is no recourse to other assets of the Group and the liability is not payable to the degree of shortfall.
v In addition to the listed debt above, £200 million Floating Rate Notes were issued by Prudential plc in October 2010 which mature in April 2011. These Notes have been wholly subscribed by a Group subsidiary and accordingly have been eliminated on consolidation in the Group financial statements. These Notes were originally issued in October 2008 and have been reissued upon their maturity.
vi Maturity analysis The following table sets out the contractual maturity analysis of the Group’s operational borrowings attributable to shareholder-financed
operations:
2010 £m 2009 £m
Less than 1 year 2,496 2,1831 to 2 years 98 1212 to 3 years 401 2393 to 4 years – 1724 to 5 years – 6Over 5 years 9 30
Total 3,004 2,751

326
Prudential plc Annual Report 2010
FINANCIAL STATEMENTS > NOTES ON THE GROUP FINANCIAL STATEMENTS
H: OTHER INFORMATION ON STATEMENT OF FINANCIAL POSITION ITEMSCONTINUED
H13: BORROWINGS > CONTINUED
Borrowings attributable to with-profits operations
2010 £m 2009 £m
Non-recourse borrowings of consolidated investment funds note i 1,287 1,016£100m 8.5% Undated Subordinated Guaranteed Bonds of Scottish Amicable Finance plc note ii 100 100Other borrowings (predominantly obligations under finance leases) 135 168
TOTAL note iii 1,522 1,284
Notesi In all instances the holders of the debt instruments issued by these funds do not have recourse beyond the assets of those funds.ii The interests of the holders of the bonds issued by Scottish Amicable Finance plc, a subsidiary of the Scottish Amicable Insurance Fund, are
subordinate to the entitlements of the policyholders of that fund.iii Maturity analysis The following table sets out the contractual maturity analysis of the Group’s borrowings attributable to with-profits operations:
2010 £m 2009 £m
Less than 1 year 96 331 to 2 years 635 772 to 3 years 99 7063 to 4 years 74 14 to 5 years 1 1Over 5 years 617 466
Total 1,522 1,284
H14: PROVISIONS AND CONTINGENCIES
Provisions
2010 £m 2009 £m
Provision in respect of defined benefit pension schemes:I3
Deficit, gross of deferred tax, based on scheme assets held, including investments in Prudential insurance policies: Attributable to PAC with-profits fund (i.e. absorbed by the liability for unallocated surplus) 106 122 Attributable to shareholder-financed operations (i.e. to shareholders’ equity) 114 128
220 250 Add back: Investments in Prudential insurance policies 227 187
Provision after elimination of investments in Prudential insurance policies and matching policyholder liability from Group statement of financial position 447 437Other provisions (see below) 282 206
TOTAL PROVISIONS 729 643

327F
INA
NC
IAL
S
TA
TE
ME
NT
S
H: O
TH
ER
INFO
RM
AT
ION
ON
STA
TE
ME
NT
OF FIN
AN
CIA
L P
OSIT
ION
ITE
MS
Analysis of other provisions:
2010 £m 2009 £m
At 1 January 206 155Charged to income statement: Additional provisions 182 148 Unused amounts released (10) (13)Used during the year (106) (75)Exchange differences 10 (9)
At 31 December 282 206
Comprising: Legal provisions 20 15 Restructuring provisions 26 17 Other provisions 236 174
TOTAL 282 206
Of the other provisions balance of £282 million (2009: £206 million), £141 million (2009: £148 million) is expected to be settled within one year. Employer contributions expected to be paid into defined benefit pension schemes within one year are shown in note I3.
Legal provisionsOf the legal provisions of £20 million (2009: £15 million), £19 million (2009: £11 million) relates to Jackson. Jackson has been named in civil proceedings, which appear to be substantially similar to other class action litigation brought against many life insurers in the US, alleging misconduct in the sale of insurance products. During 2010 and 2009, £1 million and £9 million was paid respectively. In 2010, Jackson established an additional £9 million reserve for potential litigation. We expect the provision balance to be utilised over the next six years.
Restructuring provisionsRestructuring provisions of £26 million (2009: £17 million) primarily relate to restructuring activities of UK insurance operations. The provisions pertain to property liabilities resulting from the closure of regional sales centres and branches and staff terminations and other transformation costs to enable streamlining of operations. These activities resulted in additional provisions in 2010 of £14 million. During 2010, £2 million (2009: £1 million) of unused provision was released, and £3 million (2009: £3 million) was paid. We expect the provision balance to be paid out within the next six years.
Other provisionsOther provisions of £236 million (2009: £174 million) include provisions of £200 million (2009: £143 million) relating to staff benefit schemes which are mostly benefits that will generally be paid out within the next three years. During 2010, another £148 million (2009: £112 million) was provided (including exchange movement of £2 million (2009: £6 million)), £6 million (2009: £10 million) of unused provision was released and £92 million (2009: £54 million) was paid. Other provisions also include £28 million (2009: £27 million) relating to various onerous contracts where, in 2010, an additional £10 million (2009: £15 million) was provided and £8 million (2009: £4 million) was used. Other provisions also include £4 million (2009: £4 million) of regulatory provisions, where £nil (2009: £9 million) was provided, £1 million (2009: £2 million) of unused provision was released and £nil (2009: £3 million) was paid.
Contingencies and related obligationsLitigation regarding the Prudential Staff Pension Scheme (PSPS) and other mattersThe Company is currently awaiting the decision of the English High Court in a case that was heard in early 2011 involving PSPS. This case relates to the defined benefit section of PSPS and was heard at the request of the trustees of the scheme who are seeking to clarify the Company’s obligations relating to discretionary pension increases. In the event that the English High Court decides that the obligations relating to discretionary pension increases are greater than the Company currently believes, the assumptions applied for IAS 19 reporting purposes, and therefore the level of surplus of the Scheme may be affected. The Court decision might also affect the level of future deficit funding agreed concurrently with the next actuarial valuation as at 5 April 2011.

328
Prudential plc Annual Report 2010
FINANCIAL STATEMENTS > NOTES ON THE GROUP FINANCIAL STATEMENTS
H: OTHER INFORMATION ON STATEMENT OF FINANCIAL POSITION ITEMSCONTINUED
H14: PROVISIONS AND CONTINGENCIES > CONTINUED
The impact of such changes on the deficit funding obligations of the shareholders’ funds of the Group would be determined in the context of the pre-existing features applicable to the PSPS scheme described below:
(i) Although underlying surpluses of the scheme are not recognised for IAS 19 Group accounting purposes under IFRIC 14, the surplus determined on the actuarial valuation basis would be considered in the context of setting altered levels of future deficit funding, and
(ii) the allocation of any such altered future deficit funding between the PAC life fund and shareholder-backed operations would be in a 70/30 ratio. This ratio was determined following detailed consideration in 2005 of the source of previous contributions and has been applied from then when deficit funding has been required.
Additional details on the Prudential Staff Pension Scheme and these features are included in note I3. Consistent with the Company’s expectations as to the decision of the Court, no amount has been provided in the 2010 financial statements for this item. In addition to the legal proceedings relating to Jackson mentioned under the legal provisions section above, and PSPS, the Group is involved in other litigation and regulatory issues. Whilst the outcome of each of the above matters cannot be predicted with certainty, the Company believes that the ultimate outcome of such litigation and regulatory issues will not have a material adverse effect on the Group’s financial condition, results of operations, or cash flows.
Pension mis-selling reviewThe pensions review by the UK insurance regulator of past sales of personal pension policies required all UK life insurance companies to review their cases of potential mis-selling and record a provision for the estimated costs. The Group met the requirement of the FSA to issue offers to all cases by 30 June 2002. The table below summarises the change in the pension mis-selling provision for the years ended 31 December 2010 and 2009. The change in the provision is included in benefits and claims in the income statement and the movement in unallocated surplus of with-profits funds has been determined accordingly.
2010 £m 2009 £m
Balance at beginning of year 322 345Changes to actuarial assumptions and method of calculation 37 20Discount unwind 2 3Redress to policyholders (46) (44)Payment of administrative costs (1) (2)
Balance at end of year 314 322
The pension mis-selling provision is included within the liabilities in respect of investment contracts with discretionary participation features under IFRS 4.
The pension mis-selling provision at 31 December 2010 set out above of £314 million is stochastically determined on a discounted basis. The average discount rate implied in the movement in the year is four per cent. The undiscounted amounts at 31 December 2010 expected to be paid in each of the years ending 31 December are as follows:
2010 £m
Year ended 31 December2011 402012 102013 92014 102015 9Thereafter 441
Total undiscounted amount 519Aggregate discount (205)
Discounted pension mis-selling provision at 31 December 2010 314

329F
INA
NC
IAL
S
TA
TE
ME
NT
S
H: O
TH
ER
INFO
RM
AT
ION
ON
STA
TE
ME
NT
OF FIN
AN
CIA
L P
OSIT
ION
ITE
MS
The directors believe that, based on current information, the provision, together with future investment return on the assets backing the provision, will be adequate to cover the costs of pension mis-selling including administration costs. Such provision represents the best estimate of probable costs and expenses. However, there can be no assurance that the current provision level will not need to be increased. The costs associated with the pension mis-selling review have been met from the inherited estate (see below). Accordingly, these costs have not been charged to the asset shares used in the determination of policyholder bonus rates. Hence policyholders’ pay-out values have been unaffected by pension mis-selling. In 1998, Prudential stated that deducting mis-selling costs from the inherited estate would not impact its bonus or investment policy and it gave an assurance that if this unlikely event were to occur, it would make available support to the fund from shareholder resources for as long as the situation continued, so as to ensure that policyholders were not disadvantaged. The assurance was designed to protect both existing policyholders at the date it was announced, and policyholders who subsequently purchased policies while the pension mis-selling review was continuing. The bonus and investment policy for each type of with-profits policy is the same irrespective of whether or not the assurance applies and this is expected to continue for the foreseeable future. Hence removal of the assurance for new business has had no impact on policyholder returns.
Mortgage endowment products reviewIn common with several other UK insurance companies, the Group used to sell low-cost endowment products related to repayment of residential mortgages. At sale, the initial sum assured is set at a level such that the projected benefits, including an estimate of the annual bonus receivable over the life of the policy, will equal or exceed the mortgage debt. Because of a decrease in expected future investment returns since these products were sold, the FSA is concerned that the maturity value of some of these products will be less than the mortgage debt. The FSA has worked with insurance companies to devise a programme whereby the companies write to customers indicating whether they may have a possible shortfall and outline the actions that the customers can take to prevent this possibility. The Group is exposed to mortgage endowment products in respect of policies issued by Scottish Amicable Life plc (SAL) and the Scottish Amicable Life Assurance Society (SALAS) which were transferred into SAIF. At 31 December 2010, provisions of £2 million (2009: £4 million) in respect of the SAL policies and £20 million (2009: £35 million) in SAIF were held within policyholder liabilities to cover potential compensation in respect of mortgage endowment product mis-selling claims. As SAIF is a separate sub-fund of the Prudential Assurance long-term business fund, wholly attributable to the policyholders of the fund, this provision has no impact on shareholders. In addition, in the year ended 31 December 2010 Prudential Assurance’s main with-profits fund paid compensation of £2 million (2009: £2 million) in respect of mortgage endowment products mis-selling claims and at 31 December 2010 held a provision of £32 million (2009: £47 million) in respect of further compensation. The movement in this provision has no impact on the Group’s profit before tax. In May 2006, the Group introduced a deadline for both Prudential and Scottish Amicable mortgage endowment complaints. Impacted customers have three years to lodge a mis-selling complaint in line with the time limit prescribed by the FSA and the ABI.
Guaranteed annuitiesPrudential Assurance used to sell guaranteed annuity products in the UK and at 31 December 2010 held a provision of £24 million (2009: £31 million) within the main with-profits fund within policyholder liabilities to honour guarantees on these products. The Group’s main exposure to guaranteed annuities in the UK is through SAIF and at 31 December 2010 a provision of £336 million (2009: £284 million) was held in SAIF to honour the guarantees. As SAIF is a separate sub-fund of the Prudential Assurance long-term business fund, wholly attributable to the policyholders of the fund, the movement in this provision has no impact on shareholders.
Other mattersInherited estate of the PAC long-term fundThe assets of the with-profits sub-fund (WPSF) within the long-term insurance fund of The Prudential Assurance Company Limited (PAC) comprise the amounts that it expects to pay out to meet its obligations to existing policyholders and an additional amount used as working capital. The amount payable over time to policyholders from the WPSF is equal to the policyholders’ accumulated asset shares plus any additional payments that may be required by way of smoothing or to meet guarantees. The balance of the assets of the WPSF is called the ‘inherited estate’ and has accumulated over many years from various sources. The inherited estate, as working capital, enables PAC to support with-profits business by providing the benefits associated with smoothing and guarantees, by providing investment flexibility for the fund’s assets, by meeting the regulatory capital requirements that demonstrate solvency and by absorbing the costs of certain significant events or fundamental changes in its long-term business without affecting the bonus and investment policies. The size of the inherited estate fluctuates from year to year depending on the investment return and the extent to which it has been required to meet smoothing costs, guarantees and other events.

330
Prudential plc Annual Report 2010
FINANCIAL STATEMENTS > NOTES ON THE GROUP FINANCIAL STATEMENTS
H: OTHER INFORMATION ON STATEMENT OF FINANCIAL POSITION ITEMSCONTINUED
H14: PROVISIONS AND CONTINGENCIES > CONTINUED
Support for long-term business funds by shareholders’ fundsAs a proprietary insurance company, PAC is liable to meet its obligations to policyholders even if the assets of the long-term funds are insufficient to do so. The assets, represented by the unallocated surplus of with-profits funds, in excess of amounts expected to be paid for future terminal bonuses and related shareholder transfers (‘the excess assets’) in the long-term funds could be materially depleted over time by, for example, a significant or sustained equity market downturn, costs of significant fundamental strategic change or a material increase in the pension mis-selling provision. In the unlikely circumstance that the depletion of the excess assets within the long-term fund was such that the Group’s ability to satisfy policyholders’ reasonable expectations was adversely affected, it might become necessary to restrict the annual distribution to shareholders or to contribute shareholders’ funds to the long-term funds to provide financial support. In 1997, the business of SALAS, a mutual society, was transferred to PAC. In effecting the transfer, a separate sub-fund, SAIF, was established within PAC’s long-term business fund. This sub-fund contains all the with-profits business and all other pension business that was transferred. No new business has been or will be written in the sub-fund and the sub-fund is managed to ensure that all the invested assets are distributed to SAIF policyholders over the lifetime of SAIF policies. With the exception of certain amounts in respect of the unitised with-profits life business, all future earnings arising in SAIF are retained for SAIF policyholders. Any excess (deficiency) of revenue over expense within SAIF during a period is attributable to the policyholders of the fund. Shareholders have no interest in the profits of SAIF but are entitled to the asset management fees paid on this business. With the exception of certain guaranteed annuity products mentioned earlier in this note, and certain products which include a minimum guaranteed rate of accumulation, the majority of SAIF with-profits policies do not guarantee minimum rates of return to policyholders. Should the assets of SAIF be inadequate to meet the guaranteed benefit obligations to the policyholders of SAIF, the PAC long-term fund would be liable to cover any such deficiency. Due to the quality and diversity of the assets in SAIF and the ability of SAIF to revise guaranteed benefits in the event of an asset shortfall, the directors believe that the probability of either the PAC long-term fund or the Group’s shareholders’ funds having to contribute to SAIF is remote.
Guarantees and commitmentsGuarantee funds in both the UK and the US provide for payments to be made to policyholders on behalf of insolvent life insurance companies. These guarantee funds are financed by payments assessed on solvent insurance companies based on location, volume and types of business. The Group estimated its reserve for future guarantee fund assessments for Jackson, included within other liabilities to be £16 million at 31 December 2010 (2009: £15 million). Similar assessments for the UK businesses were not significant. The directors believe that the reserve is adequate for all anticipated payments for known insolvencies. At 31 December 2010, Jackson has unfunded commitments of £363 million (2009: £339 million) related to its investments in limited partnerships and of £88 million (2009: £89 million) related to commercial mortgage loans. These commitments were entered into in the normal course of business and the directors do not expect a material adverse impact on the operations to arise from them. Jackson owns debt instruments issued by securitisation trusts managed by PPM America. At 31 December 2010, the support provided by certain forbearance agreements Jackson entered into with the counterparty to certain of these trusts could potentially expose Jackson to maximum losses of £332 million, if circumstances allowed the forbearance period to cease. Jackson believes that, so long as the forbearance period continues, the risk of loss under the agreements is remote. The Group has provided other guarantees and commitments to third-parties entered into in the normal course of business but the Company does not consider that the amounts involved are significant.
H15: OTHER LIABILITIES
2010 £m 2009 £m
Creditors arising from direct insurance and reinsurance operations 821 615Interest payable 66 83Other items 242 179
TOTAL 1,129 877

331F
INA
NC
IAL
S
TA
TE
ME
NT
SI: O
TH
ER
NO
TE
S
I: OTHER NOTES
I1: ACQUISITION OF UNITED OVERSEAS BANK LIFE ASSURANCE LIMITED
On 1 February 2010, the Group acquired from United Overseas Bank (UOB) its 100 per cent interest in UOB Life Assurance Limited in Singapore for total cash consideration, after post-completion adjustments of SGD67 million (£32 million), of SGD495 million (£220 million). As part of the transaction the Group also entered into a long-term strategic partnership to develop a major regional bancassurance business with UOB. In addition to the amounts above, the Group incurred £2 million of acquisition-related costs (excluding integration costs). These have been excluded from the consideration transferred and have been recognised as an expense in the period, in the consolidated income statement.
Goodwill arising on acquisition
£m
Cash consideration 220Less: fair value of identifiable net assets acquired (79)
Goodwill arising on acquisition 141
Goodwill arose on the acquisition of UOB Life Assurance Limited in Singapore because the acquisition included revenue and cost synergies. These synergies could not be recognised as assets separately from goodwill because they are not capable of being separated from the Group and sold, transferred, licensed, rented or exchanged, either individually or together with any related contracts and did not arise from contractual or other legal rights. None of the goodwill arising on this transaction is expected to be deductible for tax purposes.
Assets acquired and liabilities assumed at the date of acquisition
£m
Assets:Intangible assets attributable to shareholders: present value of acquired in-force business 12Other non-investment and non-cash assets 16Investments of long-term business and other operations 1,004Cash and cash equivalents 89
Total assets 1,121
Liabilities:Policyholder liabilities 968Other non-insurance liabilities 74
Total liabilities 1,042
FAIR VALUE OF IDENTIFIABLE NET ASSETS ACQUIRED 79
Total assets include loans and receivables with a fair value of £15 million. This value represents the gross contractual amount and all amounts have been collected. The consolidated statement of cash flows contains a £133 million net cash outflow in respect of this acquisition representing cash consideration of £220 million, acquisition related costs paid of £2 million less cash and cash equivalents acquired of £89 million.
Impact of acquisition on the results of the Group Included in the Group’s consolidated profit before tax for the year is £8 million attributable to UOB Life Assurance Limited in Singapore. Consolidated revenue, including investment returns, for the year includes £125 million in respect of UOB Life Assurance Limited in Singapore. Had the acquisition been effected at 1 January 2010, the revenue and profit of the Group from continuing operations for the year ended 31 December 2010 would not have been materially different.

332
Prudential plc Annual Report 2010
FINANCIAL STATEMENTS > NOTES ON THE GROUP FINANCIAL STATEMENTS
I: OTHER NOTESCONTINUED
I2: DILUTION OF THE GROUP’S HOLDING IN PRUHEALTH IN 2010 AND SALE OF TAIWAN AGENCY BUSINESS IN 2009
a Dilution of the Group’s holding in PruHealth in 2010On 1 August 2010, Discovery Holdings of South Africa, the Group’s joint venture partner in its investment in PruHealth, completed the acquisition of the entire share capital of Standard Life Healthcare, a wholly-owned subsidiary of the Standard Life Group, for £138 million. Discovery funded the purchase of the Standard Life Healthcare transaction, and contributed Standard Life Healthcare to PruHealth as a capital investment on completion. As a result of the transaction, Discovery have increased their shareholding in PruHealth from the previous level of 50 per cent to 75 per cent, and Prudential’s shareholding has been reduced from 50 per cent of the previous joint venture structure to 25 per cent of the new structure with the much enlarged business. As a result of this dilution in holding and the consequential loss of control, PruHealth has been reclassified from a joint venture to an associate and the entity is no longer proportionally consolidated from the date of the transaction. In accordance with IAS 31 ‘Interests in joint ventures’ a gain of £30 million arises upon the dilution, representing the difference between the fair value of the enlarged 25 per cent investment still held and the book value of the original 50 per cent investment holding.
b Sale of Taiwan agency business in 2009In 2009, the Company sold the assets and liabilities of its agency distribution business and its agency force in Taiwan to China Life Insurance Company Ltd of Taiwan for the nominal sum of NT$1. In addition, the Company invested £45 million to purchase a 9.99 per cent stake in China Life through a share placement. The business transferred represented 94 per cent of Prudential’s in-force liabilities in Taiwan and included Prudential’s legacy interest rate guaranteed products. The sale was completed on 19 June 2009. The Company retains its interest in life insurance business in Taiwan through its retained bank distribution partnerships and its direct investment in China Life made in 2009. At 31 December 2010 the Company’s interest in China Life was 8.66 per cent (2009: 9.99 per cent). The effect on the IFRS income statement was a pre-tax loss of £621 million comprising a loss on sale of £559 million and trading losses before tax up to the date of sale of £62 million. After allowing for tax and other adjustments, the reduction to shareholders’ equity was £607 million. The loss on disposal of £559 million includes cumulative foreign exchange gains of £9 million recycled through the profit and loss account as required by IAS 21. Cash and cash equivalents disposed of were £388 million and restructuring and other costs incurred in cash in the year were £64 million. In addition, the Company invested £45 million in China Life as described above. Accordingly, the cash outflow for the Group arising from the sale of the Taiwan agency business, as shown in the consolidated statement of cash flows, was £497 million.
I3: STAFF AND PENSION PLANS
a Staff and employment costsThe average number of staff employed by the Group during the year was:
2010 2009
Business operations: Asian operations 17,988 19,502 US operations 3,545 3,371 UK operations 4,459 4,516
TOTAL 25,992 27,389
The costs of employment were:
2010 £m 2009 £m
Business operations: Wages and salaries 1,052 878 Social security costs 69 61 Other pension costs (see below) 95 95 Pension actuarial and other losses (gains) charged to income statement 26 138
121 233
TOTAL 1,242 1,172

333F
INA
NC
IAL
S
TA
TE
ME
NT
SI: O
TH
ER
NO
TE
S
Other pension costs comprises £58 million (2009: £57 million) relating to defined benefit schemes and £37 million (2009: £38 million) relating to defined contribution schemes of continuing operations. Of the defined contribution scheme costs, £26 million (2009: £27 million) related to overseas defined contribution schemes. The £58 million (2009: £57 million) relating to defined benefit schemes comprises a charge of £27 million (2009: £29 million) relating to PSPS and a charge of £31 million (2009: £28 million) for other schemes. Consistent with the derecognition of the Company’s interest in the underlying IAS 19 surplus of PSPS as described in note (b)(i)1 below, the £27 million (2009: £29 million) for PSPS represents the cash cost of contributions for ongoing service of active members and the unwind of discount on the opening provision for deficit funding for PSPS. The charge of £31 million (2009: £28 million) for other schemes comprises £18 million (2009: £19 million) charge on an economic basis, reflecting the total assets of the schemes, and a further £13 million (2009: £9 million) charge to adjust for amounts invested in Prudential insurance policies to arrive at the IAS 19 basis charge. The loss of £26 million (2009: £138 million) for actuarial and other gains comprises a loss of £15 million (2009: £155 million) for actuarial and other losses on an economic basis and £11 million actuarial gains (2009: £17 million) to adjust for amounts invested in Prudential insurance policies. The derivation of these amounts is shown in note (b)(i)7.
b Pension plansi Defined benefit plans1 Summary The Group business operations operate a number of pension schemes. The specific features of these plans vary in accordance with the regulations of the country in which the employees are located, although they are, in general, funded by the Group and based either on a cash balance formula or on years of service and salary earned in the last year or years of employment. The largest defined benefit scheme is the principal UK scheme, namely the Prudential Staff Pension Scheme (PSPS); 86 per cent (2009: 86 per cent) of the underlying scheme liabilities of the Group defined benefit schemes are accounted for within PSPS. The Group also operates two smaller defined benefit schemes for UK employees in respect of Scottish Amicable and M&G. For all three schemes the projected unit method was used for the most recent full actuarial valuations. There is also a small defined benefit scheme in Taiwan but as part of the sale of the Taiwan agency business completed in June 2009, the Group settled the majority of the obligations under the scheme as a significant number of employees transferred out. Defined benefit schemes in the UK are generally required to be subject to full actuarial valuation every three years in order to assess the appropriate level of funding for schemes in relation to their commitments. These valuations include assessments of the likely rate of return on the assets held within the separate trustee administered funds. PSPS was last actuarially valued as at 5 April 2008. This valuation demonstrated the scheme to be 106 per cent funded by reference to the Scheme Solvency Target that forms the basis of the scheme’s statutory funding objective. No formal deficit funding plan was required. However, in recognition of the fall in value of the Scheme’s investments between 5 April 2008 and the completion of the actuarial valuation, an additional funding akin to deficit funding was agreed with the Trustees. This is subject to a reassessment when the next valuation is completed. The total contribution being currently made by the Group into the scheme, representing the annual accrual cost and deficit fundings, are £50 million per annum. Deficit funding for PSPS is apportioned in the ratio of 70/30 between the PAC life fund and shareholder-backed operations following detailed consideration in 2005 of the sourcing of previous contributions. Employer contributions for ongoing service of current employees are apportioned in the ratio relevant to current activity. In 2010, total contributions for the year including expenses and augmentations were £55 million at 31 December (2009: £67 million). The market value of scheme assets as at 5 April 2008 was £4,759 million. The actuarial assumptions used in determining benefit obligations and the net periodic benefit costs for the purposes of the valuation were as follows:
Rate of increase in salaries NilRate of inflation 3.5%Rate of increase of pensions in payment for inflation:Guaranteed (maximum 5%) 3.5%Guaranteed (maximum 2.5%) 2.5%Discretionary NilExpected returns on plan assets 4.55%
Mortality assumptionsThe tables used for PSPS pensions in payment at 5 April 2008 were:
Base post retirement mortality:For current male (female) pensioners 108.6 per cent (103.4 per cent) of the mortality rates of the 2000 series mortality tables, published by the Continuous Mortality Investigation Bureau. For male (female) non-pensioners 113.4 per cent (97.4 per cent) of the 2000 series rates.
Allowance for future improvements to post retirement mortality:For males (females) 100 per cent (75 per cent) of Medium Cohort subject to a minimum rate of improvement of 1.75 per cent (1 per cent) up to the age of 90, decreasing linearly to zero by age of 120.

334
Prudential plc Annual Report 2010
FINANCIAL STATEMENTS > NOTES ON THE GROUP FINANCIAL STATEMENTS
I: OTHER NOTESCONTINUED
I3: STAFF AND PENSION PLANS > CONTINUED
The valuation of the Scottish Amicable Pension Scheme as at 31 March 2008 demonstrated the scheme to be 91 per cent funded, with a shortfall of actuarially determined liabilities of nine per cent, representing a deficit of £38 million. Based on this valuation, deficit funding amounts designed to eliminate the actuarial deficit over a seven year period were made from July 2009 of £7.3 million per annum. Since the valuation date, there has been deterioration in the funding level. During 2010, the Group agreed to pay additional funding of £5.8 million per annum from October 2010 until conclusion of the next formal valuation, or until the funding level reaches 90 per cent, whichever is the earlier. The IAS 19 deficit of the Scottish Amicable Pension Scheme at 31 December 2010 of £146 million (2009: £139 million) has been allocated approximately 50 per cent to the PAC with-profits fund and 50 per cent to the shareholders’ fund. The valuation of the M&G Pension Scheme as at 31 December 2008 was finalised in January 2010 and demonstrated the scheme to be 76 per cent funded. Based on this valuation, deficit funding amounts designed to eliminate the actuarial deficit over a five year period are being made from January 2010 of £14.1 million per annum for the first two years and £9.3 million per annum for the subsequent three years. The IAS 19 deficit of the M&G Pension Scheme on an economic basis at 31 December 2010 was £27 million (2009: £36 million) and is wholly attributable to shareholders. The next triennial valuations for the PSPS, Scottish Amicable and M&G pension schemes are scheduled to take place by 5 April 2011, 31 March 2011 and 31 December 2011. Under the IAS 19 valuation basis, the Group applies IFRIC 14, ‘IAS 19 – The Limit on a Defined Benefit Asset, Minimum Funding Requirements and their Interaction’. Under IFRIC 14, for PSPS, where the Group does not have unconditional right of refund to any surplus in the scheme, the surplus is not recognised. Additionally, the Group has to recognise a liability for committed deficit funding obligation to PSPS. At 31 December 2010, the Group has not recognised the underlying PSPS surplus of £485 million gross of deferred tax (2009: £513 million) and has recognised a liability for deficit funding to 30 June 2012 for PSPS of £47 million, gross of deferred tax (2009: £75 million). The asset and liabilities of PSPS are unaffected by the impact of the application of IFRIC 14. PSPS is managed on an economic basis for the longer-term benefit of its current and deferred pensioners and active members. The surplus in PSPS is available to absorb future adverse asset value movements and, if required, strengthening in mortality assumptions. As at 31 December 2010, after the effect of the application of IFRIC 14, the shareholders’ share of the pension liability for PSPS deficit funding obligation and the deficits of the defined benefit pension schemes amounted to a £83 million liability net of related tax relief (2009: £92 million). These amounts are determined after including amounts invested by the M&G scheme in Prudential policies as explained later in this note. On the economic basis (including investments of the M&G scheme in Prudential policies as assets), for 2010, a £27 million (2009: £32 million) pre-tax shareholder charge to operating results based on longer-term returns arises. In addition, outside the operating result but included in total profits is a pre-tax shareholder loss of £10 million (2009: £74 million) for shareholders’ share of actuarial and other gains and losses. In addition, also on the economic basis, the PAC with-profits sub-fund was charged £18 million (2009: charge of £16 million) for its share of the pension charge of PSPS and Scottish Amicable and charged with £5 million (2009: £81 million) for its share of net actuarial and other losses on the scheme assets and liabilities. As shareholder profits for the PAC with-profits sub-fund reflects the surplus for distribution, these amounts are effectively absorbed by an increased credit in the income statement for the transfer to the liability for unallocated surplus. At 31 December 2010, after the effect of the application of IFRIC 14, the total share of the liability for deficit funding on PSPS and the deficit on the smaller Scottish Amicable Scheme attributable to the PAC with-profits fund amounted to a liability of £99 million (2009: £110 million) net of related tax relief.
2 Corporate governanceThe rules of the Group’s largest pension arrangement, the defined benefit section of PSPS, a final salary scheme, specify that, in exercising its investment powers, the Trustee’s objective is to achieve the best overall investment return consistent with the security of the assets of the scheme. In doing this, consideration is given to the nature and duration of the scheme’s liabilities. The Trustee sets the benchmark for the asset mix, following analysis of the liabilities by the Scheme’s Actuary and, having taken advice from the Investment Managers, then selects benchmark indices for each asset type in order to measure investment performance against a benchmark return. The Trustee reviews strategy, the asset mix benchmark and the Investment Managers’ objectives every three years, to coincide with the Actuarial Valuation, or earlier if the Scheme Actuary recommends. Interim reviews are conducted annually based on changing economic circumstances and financial market levels. The Trustee sets the general investment policy and specifies any restrictions on types of investment and the degrees of divergence permitted from the benchmark, but delegates the responsibility for selection and realisation of specific investments to the Investment Managers. In carrying out this responsibility, the Investment Managers are required by the Pensions Act 1995 to have regard to the need for diversification and suitability of investments. Subject to a number of restrictions contained within the relevant asset management agreements, the Investment Managers are authorised to invest in any class of investment asset. However, the Investment Managers will not invest in any new class of investment asset without prior consultation with the Trustee. The Trustee consults the Principal Employer, the Prudential Assurance Company, on these investment principles, but the ultimate responsibility for the investment of the assets of the scheme lies with the Trustee.

335F
INA
NC
IAL
S
TA
TE
ME
NT
SI: O
TH
ER
NO
TE
S
The investment policies and strategies for the other two UK defined benefit schemes, the M&G Group Pension Scheme and the Scottish Amicable Staff Pension Scheme, which are both final salary schemes, follow similar principles, but have different target allocations reflecting the particular requirements of the schemes.
3 AssumptionsThe actuarial assumptions used in determining benefit obligations and the net periodic benefit costs for the years ended 31 December were as follows:
2010 % 2009 %
Discount rate* 5.45 5.8Rate of increase in salaries 5.55 5.7Rate of inflation 3.55 3.7Rate of increase of pensions in payment for inflation: Guaranteed (maximum 5%) 3.55 3.7 Guaranteed (maximum 2.5%)† 2.5 2.5 Discretionary† 2.5 2.5Expected returns on plan assets 5.9 4.5
* The discount rate has been determined by reference to an ‘AA’ corporate bond index adjusted, where applicable, to allow for the difference in duration between the index and the pension liabilities.
† The rates of 2.5 per cent shown are those for PSPS. Assumed rates of increase of pensions in payment for inflation for all other schemes are 3.55 per cent in 2010 (2009: 3.7 per cent).
The calculations are based on current actuarially calculated mortality estimates with a specific allowance made for future improvements in mortality. The 2010 specific allowance is in line with custom calibration of the 2009 mortality model from the Continuous Mortality Investigation Bureau of the Institute and Faculty of Actuaries (‘CMI’). The 2009 specific allowance was broadly based on adjusted versions of the medium cohort projections prepared by the CMI.
The tables used for PSPS immediate annuities in payment at 31 December 2010 were:
Male: 108.6 per cent PNMA00 with improvements in line with a custom calibration of the CMI’s 2009 mortality model, with a long-term mortality improvement rate of 1.75 per cent per annum; andFemale: 103.4 per cent PNFA00 with improvements in line with a custom calibration of the CMI’s 2009 mortality model, with a long-term mortality improvement rate of 1.00 per cent per annum.
The tables used for PSPS immediate annuities in payment at 31 December 2009 were:
Male: 108.6 per cent PNMA00 with medium cohort improvements subject to a floor of 1.75 per cent up to the age of 90, decreasing linearly to zero by age of 120; and Female: 103.4 per cent PNFA00 with 75 per cent medium cohort improvements subject to a floor of 1.00 per cent up to the age of 90 and decreasing linearly to zero by age of 120.
The assumed life expectancies on retirement at age 60, based on the mortality table used was:
2010 years 2009 years
Male Female Male Female
Retiring today 27.7 29.0 27.4 28.6Retiring in 20 years’ time 30.3 31.1 30.1 30.8
The mean term of the current PSPS liabilities is around 18 years. Using external actuarial advice provided by the scheme actuaries being Towers Watson for the valuation of PSPS, Aon Consulting Limited for the M&G scheme, and Xafinity Consulting for the Scottish Amicable scheme, the most recent full valuations have been updated to 31 December 2010, applying the principles prescribed by IAS 19.

336
Prudential plc Annual Report 2010
FINANCIAL STATEMENTS > NOTES ON THE GROUP FINANCIAL STATEMENTS
I: OTHER NOTESCONTINUED
I3: STAFF AND PENSION PLANS > CONTINUED
In July 2010, the UK Government announced plans to use the Consumer Price Index (CPI) in place of the Retail Price Index (RPI) in its determination of the statutory minimum pension increases for private sector occupational pension schemes. In December 2010, the Government published the statutory revaluation order for 2011 which confirms the change to use CPI. In addition, the Government has also published in December 2010 a consultation paper which sets out the Government’s views on the impact that the switch from RPI to CPI will have on the private sector occupational pension schemes. The consultation period closed on 2 March 2011. For the Group’s UK defined benefit schemes, the pensions in deferment and/or pensions in payment for certain tranches of these schemes are subject to statutory increases in accordance with the schemes’ rules and may therefore be affected by the Government’s decision to change the indexation from RPI to CPI. Other tranches, where RPI is specified in the scheme rules, are unaffected. The above has no impact on the results for the year ended 31 December 2010. The impact of this change, if and when made, will be recognised in a future period. Using the underlying information as at 31 December 2010, the estimated effect of such a change would give rise to an accounting benefit of approximately £30 million to the Group’s operating profit based on longer-term investment returns and profit attributable to shareholders before tax and £20 million shareholders’ equity.
4 Summary financial positionThe Group liability in respect of defined benefit pension schemes is as follows:
2010 £m 2009 £m
Economic position: Deficit, gross of deferred tax, based on scheme assets held, including investments in Prudential insurance policies: Attributable to the PAC with-profits fund (i.e. absorbed by the liability for unallocated surplus) (106) (122) Attributable to shareholder-backed operations (i.e. to shareholders’ equity) (114) (128)
Economic deficit – as explained in note 5 below (220) (250)Exclude: investments in Prudential insurance policies (offset on consolidation in the Group financial
statements against insurance liabilities) (227) (187)
Deficit under IAS 19 included in provisions in the statement of financial position – as explained in note 7 below (447) (437)
The following disclosures explain the economic position and IAS 19 basis of accounting after eliminating investment in Prudential insurance policies on consolidation.
5 Group economic financial positionThe following tables illustrate the movement on the financial position of the Group’s defined benefit pension schemes on an economic basis. The underlying position on an economic basis reflects the assets (including investments in Prudential policies that are offset against liabilities to policyholders on the Group consolidation) and the liabilities of the schemes. At 31 December 2010, the investments in Prudential policies comprise £118 million (2009: £101 million) for PSPS and £227 million (2009: £187 million) for the M&G scheme. Separately, the economic financial position also includes the effect of the application of IFRIC 14, ‘IAS 19 – The Limit on a Defined Benefit Asset, Minimum Funding Requirements and their Interaction’. For PSPS, where there are constraints in the trust deed to prevent the company access, the surplus is not recognised and a liability to additional funding is established (as described earlier).

337F
INA
NC
IAL
S
TA
TE
ME
NT
SI: O
TH
ER
NO
TE
S
Estimated pension scheme deficit – economic basisMovements on the pension scheme deficit (determined on the ‘economic basis’) are as follows, with the effect of the application of IFRIC 14 being shown separately:
2010 £m
(Charge) credit to income statement
Surplus (deficit) in scheme at
1 January 2010
Operating results
(based on longer-term investment
returns)note a
Actuarial and other gains
and lossesnote b
Contributions paid
Surplus (deficit) in scheme at
31 Dec 2010note c
ALL SCHEMESUNDERLYING POSITION (WITHOUT THE EFFECT OF IFRIC 14)
(7)Surplus (deficit) 338 (109) 90 312Less: amount attributable to PAC with-profits fund (285) (11) 71 (39) (264)
Shareholders’ share: Gross of tax surplus (deficit) 53 (18) (38) 51 48 Related tax (15) 5 11 (14) (13)
Net of shareholders’ tax 38 (13) (27) 37 35
EFFECT OF IFRIC 14 Surplus (deficit) (588) (38) 94 – (532)Less: amount attributable to PAC with-profits fund 407 29 (66) – 370
Shareholders’ share: Gross of tax surplus (deficit) (181) (9) 28 – (162) Related tax 51 2 (9) – 44
Net of shareholders’ tax (130) (7) 19 – (118)
WITH THE EFFECT OF IFRIC 14 Surplus (deficit) (250) (45) (15) 90 (220)Less: amount attributable to PAC with-profits fund 122 18 5 (39) 106
Shareholders’ share: Gross of tax surplus (deficit) (128) (27) (10) 51 (114) Related tax 36 7 2 (14) 31
Net of shareholders’ tax (92) (20) (8) 37 (83)

338
Prudential plc Annual Report 2010
FINANCIAL STATEMENTS > NOTES ON THE GROUP FINANCIAL STATEMENTS
I: OTHER NOTESCONTINUED
I3: STAFF AND PENSION PLANS > CONTINUED
2009 £m
(Charge) credit to income statement
Surplus (deficit) in scheme at
1 January 2009
Operating results
(based on longer-term investment
returns)note a
Actuarial and other gains
and lossesnote b
Contributions paid
Disposal ofTaiwan agency
business*
Surplus (deficit) in scheme at 31 Dec 2009
note c
ALL SCHEMESUNDERLYING POSITION (WITHOUT THE EFFECT OF IFRIC 14) Surplus (deficit) 644 (71) (337) 85 17 338Less: amount attributable to PAC with-profits fund (483) 33 207 (42) – (285)
Shareholders’ share: Gross of tax surplus (deficit) 161 (38) (130) 43 17 53 Related tax (47) 11 36 (11) (4) (15)
Net of shareholders’ tax 114 (27) (94) 32 13 38
EFFECT OF IFRIC 14 Surplus (deficit) (793) 23 182 – – (588)Less: amount attributable to PAC with-profits fund 550 (17) (126) – – 407
Shareholders’ share: Gross of tax surplus (deficit) (243) 6 56 – – (181) Related tax 68 (2) (15) – – 51
Net of shareholders’ tax (175) 4 41 – – (130)
WITH THE EFFECT OF IFRIC 14 Surplus (deficit) (149) (48) (155) 85 17 (250)Less: amount attributable to PAC with-profits fund 67 16 81 (42) – 122
Shareholders’ share: Gross of tax surplus (deficit) (82) (32) (74) 43 17 (128) Related tax 21 9 21 (11) (4) 36
Net of shareholders’ tax (61) (23) (53) 32 13 (92)
* Including the effect of exchange translation difference.
a The components of the (charge) credit to operating results (gross of allocation of the share attributable to the PAC with-profits fund) are as follows:
2010 £m 2009 £m
Service cost (38) (34)Finance (expense) income: Interest on pension scheme liabilities (294) (277) Expected return on assets 325 240
Total (charge) credit without the effect of IFRIC 14 (7) (71)Effect of IFRIC 14 for pension schemes (38) 23
Total charge after the effect of IFRIC 14 (45) (48)

339F
INA
NC
IAL
S
TA
TE
ME
NT
SI: O
TH
ER
NO
TE
S
The net charge to operating profit (gross of the share attributable to the PAC with-profits fund) of £45 million (2009: £48 million) is made up of a charge of £27 million (2009: £29 million) relating to PSPS and a charge of £18 million (2009: £19 million) for other schemes. This net charge represents:
2010 £m 2009 £m
Underlying IAS 19 charge for other pension schemes (18) (19)Cash costs for PSPS (23) (25)Unwind of discount on opening provision for deficit funding for PSPS (4) (4)
(45) (48)
Consistent with the derecognition of the Company’s interest in the underlying IAS 19 surplus of PSPS, the charge to operating profit on longer-term investment returns for PSPS reflects the cash cost of contributions for ongoing service of active members. In addition, the charge to the operating results also includes a charge for the unwind of discount on the opening provision for deficit funding for PSPS.
b The components of the credit (charge) for actuarial and other gains and losses (gross of allocation of the share attributable to the PAC with-profits fund but excluding the charge relating to the sold Taiwan agency business) are as follows:
2010 £m 2009 £m
Actual less expected return on assets 306 108Losses on changes of assumptions for plan liabilities (411) (521)Experience (losses) gains on liabilities (4) 76
Total charge without the effect of IFRIC 14 (109) (337)Effect of IFRIC 14 for pension schemes 94 182
Actuarial and other gains and losses after the effect of IFRIC 14 (15) (155)
The net charge for actuarial and other gains and losses is recorded within the income statement but, within the segmental analysis of profit, the shareholders’ share of actuarial and other gains and losses (i.e. net of allocation of the share to the PAC with-profits funds) is excluded from operating profit based on longer-term investment returns. The 2010 actuarial losses of £109 million primarily reflects the effect of decrease in risk discount rates and the change in economic assumptions underlying PSPS commutation factors partially offset by the effect of decreases in inflation rates and the excess of market returns over long-term assumptions. Consistent with the derecognition of the Company’s interest in the underlying IAS 19 surplus of PSPS, the actuarial gains and losses do not include those of PSPS. In addition, as a result of applying IFRIC 14, the Group has recognised a provision for deficit funding in respect of PSPS. The change in 2010 in relation to this provision recognised above as other gains and losses on defined benefit pension schemes was £nil (2009: £48 million).

340
Prudential plc Annual Report 2010
FINANCIAL STATEMENTS > NOTES ON THE GROUP FINANCIAL STATEMENTS
I: OTHER NOTESCONTINUED
I3: STAFF AND PENSION PLANS > CONTINUED
c On the ‘economic basis’, after including the underlying assets represented by the investments in Prudential insurance policies as scheme assets, the underlying statements of financial position of the schemes at 31 December were:
2010 2009
PSPS£m
Otherschemes
note iii£m
Total£m %
PSPS£m
Otherschemes
note iii£m
Total£m %
Equities 548 277 825 14 830 266 1,096 20Bonds 3,864 339 4,203 70 3,406 280 3,686 67Properties 199 29 228 4 272 15 287 5Cash-like investmentsnote i 740 8 748 12 441 2 443 8
Total value of assets 5,351 653 6,004 100 4,949 563 5,512 100Present value of benefit obligations (4,866) (826) (5,692) (4,436) (738) (5,174)
485 (173) 312 513 (175) 338
Effect of the application of IFRIC 14 for pension schemes: Derecognition of PSPS surplus (485) – (485) (513) – (513) Adjust for deficit funding for PSPS (47) – (47) (75) – (75)
Pre-tax deficitnote ii (47) (173) (220) (75) (175) (250)
Notesi The PSPS has entered into a derivatives based strategy to match the duration and inflation profile of its liabilities. This involved a reallocation
from other investments to cash-like investments with an interest and inflation swap overlay. In broad terms, the scheme is committed to making a series of payments related to LIBOR on a nominal amount and in return the scheme receives a series of fixed and inflation-linked payments which match a proportion of its liabilities. As at 31 December 2010, the nominal value of the interest and inflation-linked swaps amounted to £1.1 billion (2009: £1.1 billion) and £1.8 billion (2009: £1.9 billion) respectively.
ii The resulting scheme deficit arising from the excess of liabilities over assets at 31 December 2010 of £220 million (2009: £250 million) comprised a deficit of £106 million (2009: £122 million) attributable to the PAC with-profits fund and deficit of £114 million (2009: £128 million) attributable to shareholder operations.
iii In addition to PSPS, there are two smaller schemes in the UK, the Scottish Amicable Pension Scheme, and the M&G Pension Scheme, with a combined deficit at 31 December 2010 of £173 million (2009: £175 million), gross of tax. There is also a small scheme in Taiwan, with a negligible amount of deficit at 31 December 2010 and 2009. As part of the sale of the Taiwan agency business in June 2009 the Group has settled the majority of the obligations under the Taiwan scheme relating to the employees who were transferred out.
The movements in the deficit on the ‘economic basis’ between scheme assets and liabilities were:
2010 £m 2009 £m
Current service cost (13) (11)Other finance income (5) (8)Cash costs and unwind of discount on opening provision for deficit funding for PSPS (27) (29)Contributions 90 85Actuarial and other gains and losses (15) (155)Movement due to the sold Taiwan agency business and exchange translation difference – 17
Net increase (decrease) in deficit 30 (101)

341F
INA
NC
IAL
S
TA
TE
ME
NT
SI: O
TH
ER
NO
TE
S
6 Movement in IAS 19 basis financial positionThe change in the present value of the benefit obligation and the change in fair value of the assets for the total of the PSPS, Scottish Amicable, M&G and Taiwan schemes over the period were as follows:
2010 £m
PSPS Other schemes Total
Provisionfor deficit
funding
IAS 19 basis:change in fair value of plan
assets
Investments in Prudential
insurancepolicies
Economic basis:
totalassets
IAS 19 basis:change in
present valueof benefit
obligations
Economic basis:
netobligations
Fair value of plan assets, beginning of year 376 187 563 563Present value of benefit obligation,
beginning of year (738) (738)Provision for deficit funding for PSPS (75) (75)
(75) 376 187 563 (738) (250)Service cost – current charge only (13) (13)Interest cost (43) (43)Expected return on plan assets 25 13 38 38Employee contributions 1 1 (1) –Employer contributions 55 15 20 35 90Actuarial gains (losses) 20 11 31 (46) (15)Benefit payments (10) (5) (15) 15Cash costs and unwind of discount on the opening
provision for deficit funding for PSPS (27) (27)
Fair value of plan assets, end of year 426 227 653 653Present value of benefit obligation, end of year (826) (826)Provision for deficit funding of PSPS (47) (47)
Economic basis deficit (220)

342
Prudential plc Annual Report 2010
FINANCIAL STATEMENTS > NOTES ON THE GROUP FINANCIAL STATEMENTS
I: OTHER NOTESCONTINUED
I3: STAFF AND PENSION PLANS > CONTINUED
2009 £m
PSPS Other schemes Total
Provisionfor deficit
funding
IAS 19 basis:change in fair value of plan
assets
Investments in Prudential
insurancepolicies
Economic basis:
totalassets
IAS 19 basis:change in
present valueof benefit
obligations
Economic basis:
netobligations
Fair value of plan assets, beginning of year 357 157 514 514Present value of benefit obligation,
beginning of year (598) (598)Provision for deficit funding for PSPS (65) (65)
(65) 357 157 514 (598) (149)Service cost – current charge only (11) (11)Interest cost (35) (35)Expected return on plan assets 18 9 27 27Employee contributions 1 1 (1) –Employer contributions 67 9 9 18 85Actuarial gains (losses) 6 17 23 (130) (107)Benefit payments (11) (6) (17) 17 –Cash costs and unwind of discount on the opening
provision for deficit funding for PSPS (29) (29)Movement in the provision for deficit funding
for PSPS (48) (48)Disposal of Taiwan agency business, including
exchange translation difference (3) (3) 20 17
Fair value of plan assets, end of year 376 187 563 563Present value of benefit obligation, end of year (738) (738)Provision for deficit funding of PSPS (75) (75)
Economic basis deficit (250)
7 IAS 19 basis financial position as consolidatedThe IAS 19 basis pensions deficit can be summarised as follows:
2010 £m 2009 £m 2008 £m 2007 £m 2006 £m
Fair value of plan assets, end of year 5,659 5,224 5,057 5,150 4,988Present value of funded benefit obligation (5,438) (4,951) (4,493) (4,826) (5,023)
Funded status 221 273 564 324 (35)Present value of unfunded obligations (M&G scheme)* (254) (223) (180) (189) (187)
(33) 50 384 135 (222)
Effect of the application of IFRIC 14 for pension schemesDerecognition of PSPS’ surplus (485) (513) (728) (528) (141)Set up obligation for deficit funding for PSPS (47) (75) (65) (102) (143)Adjustment in respect of investment of PSPS in Prudential policies 118 101 103 140 126
Deficit recognised in the statement of financial position (447) (437) (306) (355) (380)
* The M&G pension scheme assets are invested in Prudential insurance policies. For IFRS accounting purposes, the M&G scheme is in effect unfunded.Please see above for more details.

343F
INA
NC
IAL
S
TA
TE
ME
NT
SI: O
TH
ER
NO
TE
S
2010 £m 2009 £m
COMPONENTS OF NET PERIODIC PENSION COSTCurrent service cost (38) (34)Interest cost (294) (277)Expected return on assets – economic basis 325 240Less: expected return on investments of scheme assets in Prudential insurance policies (21) (16)Expected return on assets – IAS 19 basis† 304 224
(28) (87)
Effect of the application of IFRIC 14 (30) 30
Pension cost (as referred to in note I3a) (58) (57)
Actuarial gains and losses – economic basis (109) (337)Less: actuarial gains on investments of scheme assets in Prudential insurance policies (20) 8
(129) (329)Effect of the application of IFRIC 14 103 191
Actuarial gains and losses – IAS 19 basis* (as referred to in note I3a) (26) (138)
Net periodic pension cost (included within acquisition and other operating expenditure in the income statement) (84) (195)
* Consistent with the derecognition of the Company’s interest in the underlying IAS 19 surplus of PSPS, the effect on the net periodic pension cost for PSPS was to replace the usual IAS 19 pension charges and credits with the cash cost of contribution for ongoing services of active members and also not to report the actuarial gains and losses.
† In determining the expected return on scheme assets for 2010, the 5.9 per cent (2009: 4.5 per cent) rate shown below has been applied to the opening assets.
The long-term expected rate of return has been taken to be the weighted average (by market value) of the long-term expected rates of return on each major asset class shown below:
2010 2009 2008 2007 2006
£m % £m % £m % £m % £m %
SCHEME ASSETS (IAS 19 BASIS BEFORE EFFECT OF IFRIC 14)
Equity 610 11 917 18 875 17 1,332 26 1,432 29Bonds 4,095 72 3,587 69 2,619 52 1,299 25 2,185 44Properties 206 4 278 5 290 6 583 11 621 12Cash-like investments 748 13 442 8 1,273 25 1,936 38 750 15
Total 5,659 100 5,224 100 5,057 100 5,150 100 4,988 100
Prospectively for 2011 % 2010 % 2009 %
LONG-TERM EXPECTED RATE OF RETURNEquity 8.2 8.5 6.8Bonds 4.6 5.3 4.8Properties 6.9 6.75 6.05Cash-like investments 4.75 4.75 2.0
Weighted average long-term expected rate of return 5.1 5.9 4.5
The expected rates of return have been determined by reference to long-term expectations, the carrying value of the assets and equity and other market conditions at the statement of financial position date. The actual return on scheme assets was a gain of £631 million (2009: £348 million) on an IAS 19 basis.
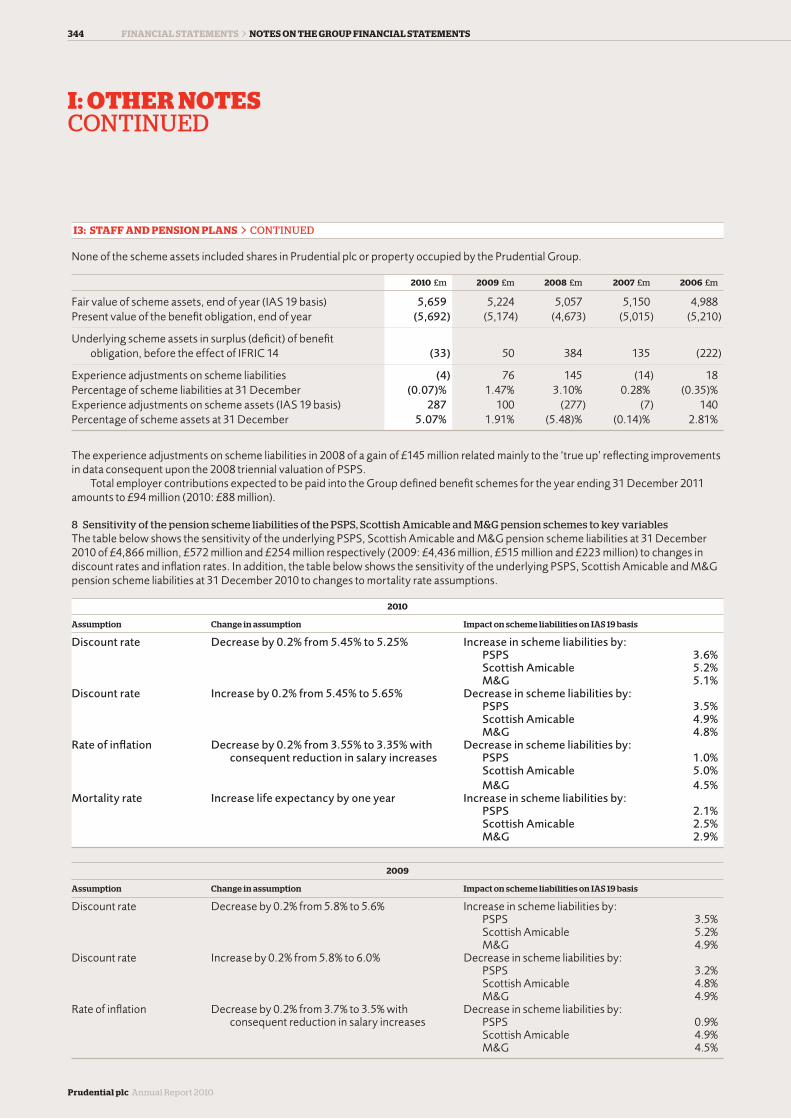
344
Prudential plc Annual Report 2010
FINANCIAL STATEMENTS > NOTES ON THE GROUP FINANCIAL STATEMENTS
I: OTHER NOTESCONTINUED
I3: STAFF AND PENSION PLANS > CONTINUED
None of the scheme assets included shares in Prudential plc or property occupied by the Prudential Group.
2010 £m 2009 £m 2008 £m 2007 £m 2006 £m
Fair value of scheme assets, end of year (IAS 19 basis) 5,659 5,224 5,057 5,150 4,988Present value of the benefit obligation, end of year (5,692) (5,174) (4,673) (5,015) (5,210)
Underlying scheme assets in surplus (deficit) of benefit obligation, before the effect of IFRIC 14 (33) 50 384 135 (222)
Experience adjustments on scheme liabilities (4) 76 145 (14) 18Percentage of scheme liabilities at 31 December (0.07)% 1.47% 3.10% 0.28% (0.35)%Experience adjustments on scheme assets (IAS 19 basis) 287 100 (277) (7) 140Percentage of scheme assets at 31 December 5.07% 1.91% (5.48)% (0.14)% 2.81%
The experience adjustments on scheme liabilities in 2008 of a gain of £145 million related mainly to the ‘true up’ reflecting improvements in data consequent upon the 2008 triennial valuation of PSPS. Total employer contributions expected to be paid into the Group defined benefit schemes for the year ending 31 December 2011 amounts to £94 million (2010: £88 million).
8 Sensitivity of the pension scheme liabilities of the PSPS, Scottish Amicable and M&G pension schemes to key variables The table below shows the sensitivity of the underlying PSPS, Scottish Amicable and M&G pension scheme liabilities at 31 December 2010 of £4,866 million, £572 million and £254 million respectively (2009: £4,436 million, £515 million and £223 million) to changes in discount rates and inflation rates. In addition, the table below shows the sensitivity of the underlying PSPS, Scottish Amicable and M&G pension scheme liabilities at 31 December 2010 to changes to mortality rate assumptions.
2010
Assumption Change in assumption Impact on scheme liabilities on IAS 19 basis
Discount rate Decrease by 0.2% from 5.45% to 5.25% Increase in scheme liabilities by: PSPS 3.6% Scottish Amicable 5.2% M&G 5.1%
Discount rate Increase by 0.2% from 5.45% to 5.65% Decrease in scheme liabilities by: PSPS 3.5% Scottish Amicable 4.9% M&G 4.8%
Rate of inflation Decrease by 0.2% from 3.55% to 3.35% with Decrease in scheme liabilities by: consequent reduction in salary increases PSPS 1.0%
Scottish Amicable 5.0% M&G 4.5%
Mortality rate Increase life expectancy by one year Increase in scheme liabilities by: PSPS 2.1% Scottish Amicable 2.5% M&G 2.9%
2009
Assumption Change in assumption Impact on scheme liabilities on IAS 19 basis
Discount rate Decrease by 0.2% from 5.8% to 5.6% Increase in scheme liabilities by: PSPS 3.5% Scottish Amicable 5.2% M&G 4.9%
Discount rate Increase by 0.2% from 5.8% to 6.0% Decrease in scheme liabilities by: PSPS 3.2% Scottish Amicable 4.8% M&G 4.9%
Rate of inflation Decrease by 0.2% from 3.7% to 3.5% with Decrease in scheme liabilities by: consequent reduction in salary increases PSPS 0.9%
Scottish Amicable 4.9% M&G 4.5%

345F
INA
NC
IAL
S
TA
TE
ME
NT
SI: O
TH
ER
NO
TE
S
The sensitivity of the underlying pension scheme liabilities to changes in discount, inflation and mortality rates as shown above does not directly equate to an impact on the profit or loss attributable to shareholders or shareholders’ equity due to the effect of the application of IFRIC 14 on PSPS and the allocation of a share of the interest in financial position of the PSPS and Scottish Amicable schemes to the PAC with-profits fund as described above. The sensitivity to the changes in the key variables as shown in the table above has no significant impact on the pension costs included in the Group’s operating results. This is due to the pension costs charged in each of the periods presented being derived largely from market conditions at the beginning of the period. After applying IFRIC 14 and to the extent attributable to shareholders, any residual impact from the changes to these variables is reflected as actuarial gains and losses on defined benefit pension schemes within the supplementary analysis of profits. The relevance of this to each of the three UK schemes is described further below. For PSPS, the underlying surplus of the scheme of £485 million (2009: £513 million) has not been recognised under IFRIC 14. Any change in the underlying scheme liabilities to the extent that it is not sufficient to alter PSPS into a liability in excess of the deficit funding provision will not have an impact on the Group’s results and financial position. Based on the underlying financial position of PSPS as at 31 December 2010, none of the changes to the underlying scheme liabilities for the changes in the variables shown in the table above have had an impact on the Group’s 2010 results and financial position. In the event that a change in the PSPS scheme liabilities results in a deficit position for the scheme which is recognisable, the deficit recognised affects the Group’s results and financial position only to the extent of the amounts attributable to shareholder operations. The amounts attributable to the PAC with-profits fund are absorbed by the liability for unallocated surplus and have no direct effect on the profit or loss attributable to shareholders or shareholders’ equity. The deficit of the Scottish Amicable pension scheme has been allocated approximately 50 per cent to the PAC with-profits fund and 50 per cent to the shareholders. Accordingly, half of the changes to the scheme liabilities for the changes in the variables shown in the table above would have had an impact on the Group’s shareholder results and financial position. The M&G pension scheme is wholly attributable to shareholders.
9 Transfer value of PSPS schemeAt 31 December 2010, it is estimated that the assets of the scheme are broadly sufficient to cover the liabilities of PSPS on a ‘buyout’ basis including an allowance for expenses. The ‘buyout’ basis refers to a basis that might apply in the circumstance of a transfer to another appropriate financial institution. In making this assessment it has been assumed that a more conservative investment strategy applies together with a more prudent allowance for future mortality improvements and no allowance for discretionary pension increases.
ii Other pension plansThe Group operates various defined contribution pension schemes including schemes in Jackson and Asia. The cost of the Group’s contributions for continuing operations to these schemes in 2010 was £37 million (2009: £38 million).
I4: SHARE-BASED PAYMENTS
The Group maintains 10 main share award and share option plans relating to Prudential plc shares, which are described below. The Group Performance Share Plan (GPSP) is the incentive plan in which all executive directors and other senior executives within the Group can participate. This scheme was established as a replacement for the Restricted Share Plan (RSP) under which no further awards could be made after March 2006. Awards are granted either in the form of a nil cost option, conditional right over shares, or such other form that shall confer to the participant an equivalent economic benefit, with a vesting period of three years. The performance measure for the awards is that Prudential’s Total Shareholder Return (TSR) outperforms an index comprising of peer companies. Vesting of the awards between each performance point is on a straight line sliding scale basis. Participants are entitled to the value of reinvested dividends that would have accrued on the shares that vest. Beginning in 2010, newly issued shares will be used in settling the awards that vest and are released. The RSP was, until March 2006, the Group’s long-term incentive plan for executive directors and other senior executives designed to provide rewards linked to shareholder return. Each year participants were granted a conditional option to receive a number of shares. There was a deferment period of three years at the end of which the award vested to an extent that depended on the performance of the Group’s shares including notional reinvested dividends and on the Group’s underlying financial performance. After vesting, the option may be exercised at zero cost at any time, subject to closed period rules, in the balance of a 10-year period. Shares are purchased in the open market by a trust for the benefit of qualifying employees.

346
Prudential plc Annual Report 2010
FINANCIAL STATEMENTS > NOTES ON THE GROUP FINANCIAL STATEMENTS
I: OTHER NOTESCONTINUED
I4: SHARE-BASED PAYMENTS > CONTINUED
The Business Unit Performance Plan (BUPP) is an incentive plan created to provide a common framework under which awards would be made to senior employees in the UK, Jackson and Asia including the Chief Executive Officers. Awards under this plan are based on growth in Shareholder Capital Value on the European Embedded Value (EEV) basis with performance measured over three years. Upon vesting of awards made up to 2008, half of the awards will be released as shares and the other half released in cash. Since the year ended 31 December 2009 all awards made will be settled in shares after vesting. Participants are entitled to receive the value of reinvested dividends over the performance period for those shares that vest. The growth parameters for the awards are relevant to each region and vesting of the awards between each performance point is on a straight line sliding scale basis. Beginning in 2010, newly issued shares will be used in settling the awards that vest and are released. During 2009, the Remuneration Committee decided that future BUPP awards for the UK business unit would be based on the same relative TSR measure applied to GPSP awards. As a result, 2010 awards made under the UK BUPP reflect those TSR conditions applied to 2010 GPSP awards. The Group maintains four share option schemes satisfied by the issue of new shares. UK-based executive directors are eligible to participate in the Prudential HM Revenue & Customs (HMRC) approved UK Savings Related Share Option Scheme (SAYE scheme) and the Asia-based executive directors can participate in the equivalent International SAYE scheme. Dublin-based employees are eligible to participate in the Prudential International Assurance Sharesave Plan, and Hong Kong-based agents can participate in the Non-employee Savings Related Share Option Scheme. The schemes allow participants to save towards the exercise of options over Prudential plc shares, at an option price set at the beginning of the savings period as determined by reference to the average market value of the ordinary shares on the three business days immediately preceding the invitation at a discount of 20 per cent to the market price. Participants may save up to £250 per month for three or five years. On maturity at the end of the set term, participants may exercise their options within six months of the end of the savings period and purchase Prudential plc shares. If an option is not exercised within six months, participants are entitled to a refund of their cash contributions plus interest if applicable under the rules. The exercise period of the options granted may be advanced to an earlier date in certain circumstances, for example on retirement, and may be extended in certain circumstances, for example on the death of the participant the personal representative may exercise the options beyond the normal exercise period. Shares are issued to satisfy options that are exercised. No options may be granted under the schemes if the grant would cause the number of shares which have been issued, or which remain issuable pursuant to options granted in the preceding 10 years under the scheme and other share option schemes operated by the Company, or which have been issued under any other share incentive scheme of the Company, to exceed 10 per cent of the Company’s ordinary share capital at the proposed date of grant. UK-based executive directors are also eligible to participate in the Company’s HMRC approved Share Incentive Plan which allows all UK-based employees to purchase shares of Prudential plc (partnership shares) on a monthly basis out of gross salary. For every four partnership shares bought, an additional matching share is awarded, purchased on the open market. Dividend shares accumulate while the employee participates in the plan. Partnership shares may be withdrawn from the scheme at any time. If the employee withdraws from the plan within five years, the matching shares are forfeit and if within three years, dividend shares are forfeit. Jackson operates a performance-related share award which, subject to the prior approval of the Jackson Remuneration Committee, may grant share awards to eligible Jackson employees in the form of a contingent right to receive shares or a conditional allocation of shares. These share awards have vesting periods of four years and are at nil cost to the employee. Award holders do not have any right to dividends or voting rights attaching to the shares. The shares are held in the employee share trust in the form of American Depository Receipts which are tradable on the New York Stock Exchange. The Prudential Corporation Asia Long-Term Incentive Plan (PCA LTIP) is an incentive plan created in 2008 for senior employees and Chief Executive Officers to replace the Asia Business Unit Performance Plan (BUPP). Awards under the new PCA LTIP will vest after three years subject to the employee being in employment at the time of vesting without any performance conditions. Awards will be discretionary and on a year by year basis determined by Prudential’s full year financial results and the employee’s contribution to the business. All awards will be in Prudential shares except for countries where share awards are not feasible due to securities and/or tax reasons, where awards will be replaced by the cash value of the shares that would otherwise have been transferred. Certain senior executives have annual incentive plans with awards paid in cash up to the target level of their plan. The portion of any award for above target performance is made in the form of awards of shares deferred for three years, with the release of shares subject to close periods. The shares are held in the employee share trust and shares equivalent to dividends otherwise payable will accumulate for the benefit of award holders during the deferral period up to the release date. In addition, there are other share awards including the Prudential Corporation Asia Deferred Bonus Plan (PCA DBP), Prudential Capital Deferred Bonus Plan (PruCap DBP) and other arrangements. There are no performance conditions attaching to these deferred bonus plans and awards vest in full subject to the individual being employed by Prudential at the end of the vesting period. The other arrangements relate to various awards that have been made without performance conditions to individual employees, typically in order to secure their appointment or ensure retention.

347F
INA
NC
IAL
S
TA
TE
ME
NT
SI: O
TH
ER
NO
TE
S
2010 2009
Options outstanding under SAYE schemes
Numberof options
millions
Weightedaverage
exerciseprice
£
Numberof options
millions
Weightedaverage
exerciseprice
£
Beginning of year: 12.2 3.20 6.8 4.54 Granted 2.2 4.61 10.7 2.96 Exercised (0.6) 3.15 (0.4) 3.98 Forfeited (0.2) 3.44 (0.5) 3.87 Cancelled (0.5) 3.37 (3.8) 4.58 Lapsed (0.3) 3.89 (0.6) 4.42
End of year 12.8 3.40 12.2 3.20
Options immediately exercisable, end of year 0.2 5.52 0.3 4.45
The weighted average share price of Prudential plc for the year ended 31 December 2010 was £5.68 compared to £4.17 for the year ended 31 December 2009.
Movements in share awards outstanding under the Group’s share-based compensation plans relating to Prudential plc shares at 31 December 2010 and 2009 were as follows:
2010 2009
Awards outstanding under incentive plans including conditional options
Number ofawards
millions
Number ofawards
millions
Beginning of year: 19.2 14.5 Granted 11.2 11.1 Exercised (4.7) (3.4) Forfeited (1.2) (1.0) Expired (0.6) (2.0)
End of year 23.9 19.2
The following table provides a summary of the range of exercise prices for Prudential plc options outstanding at 31 December 2010.
Outstanding Exercisable
Range of exercise prices
Numberoutstanding
millions
Weightedaverage
remainingcontractual
life years
Weightedaverage
exerciseprices
£
Numberexercisable
millions
Weightedaverage
exerciseprices
£
Between £0 and £1 – – – – –Between £1 and £2 – – – – –Between £2 and £3 9.0 2.6 2.88 – –Between £3 and £4 0.1 1.3 3.59 – 3.67Between £4 and £5 3.3 3.3 4.51 – 4.07Between £5 and £6 0.4 1.0 5.59 0.2 5.63Between £6 and £7 – – – – –Between £7 and £8 – – – – –
12.8 2.8 3.40 0.2 5.52

348
Prudential plc Annual Report 2010
FINANCIAL STATEMENTS > NOTES ON THE GROUP FINANCIAL STATEMENTS
I: OTHER NOTESCONTINUED
I4: SHARE-BASED PAYMENTS > CONTINUED
The following table provides a summary of the range of exercise prices for Prudential plc options outstanding at 31 December 2009.
Outstanding Exercisable
Range of exercise prices
Numberoutstanding
millions
Weightedaverage
remainingcontractual
life years
Weightedaverage
exerciseprices
£
Numberexercisable
millions
Weightedaverage
exerciseprices
£
Between £0 and £1 – – – – –Between £1 and £2 – – – – –Between £2 and £3 10.0 3.6 2.88 – –Between £3 and £4 0.1 1.0 3.62 0.1 3.43Between £4 and £5 1.5 3.0 4.37 0.2 4.73Between £5 and £6 0.6 1.9 5.60 0.0 5.65Between £6 and £7 – – – – –Between £7 and £8 – – – – –
12.2 3.4 3.20 0.3 4.45
The years shown above for weighted average remaining contractual life include the time period from end of vesting period to expiration of contract. The weighted average fair values of Prudential plc options and awards granted during the period are as follows:
2010 £ 2009 £
Weighted average fair value Weighted average fair value
GPSPSAYE
Options Awards GPSPSAYE
Options Awards
2.74 2.91 5.14 3.52 1.55 4.67
The fair value amounts relating to all options including conditional nil cost options above were determined using the Black-Scholes and the Monte Carlo option-pricing models using the following assumptions:
2010 2009
GPSPSAYE
Options GPSPSAYE
Options
Dividend yield (%) 3.43 3.43 4.41 4.41Expected volatility (%) 42.69 64.65 56.21 60.55Risk-free interest rate (%) 1.70 1.07 1.92 2.15Expected option life (years) 3.00 3.49 3.00 3.67Weighted average exercise price (£) – 4.61 – 2.96Weighted average share price (£) 5.70 6.38 4.83 3.82
Under IFRS, compensation costs for all share-based compensation plans are determined using either the Black-Scholes model or the Monte Carlo model. Share options and awards are valued using the share price at the date of grant. The compensation costs for all awards and options are recognised in net income over the plans’ respective vesting periods. The Group uses the Black-Scholes model to value all options and awards other than the GPSP, for which the Group uses a Monte Carlo model in order to allow for the impact of the TSR performance conditions. These models are used to calculate fair values for share options and awards at the grant date based on the quoted market price of the stock at the measurement date, the amount, if any, that the employees are required to pay, the dividend yield, expected volatility, risk-free interest rates and exercise prices. The expected volatility is measured as the standard deviation of expected share price returns based on statistical analysis of daily share prices over a period up to the grant date equal to the expected life of options. Risk-free interest rates are UK gilt rates with projections for three and five-year terms to match corresponding vesting periods. Dividend yield is determined as the average yield over the year of grant and expected dividends are not incorporated into the measurement of fair value. For the GPSP, volatility and correlation

349F
INA
NC
IAL
S
TA
TE
ME
NT
SI: O
TH
ER
NO
TE
S
between Prudential and an index constructed from a simple average of the TSR growth of 11 companies is required. For grants in 2010, an average index volatility and correlation of 35 per cent and 82 per cent respectively, were used. Changes to the subjective input assumptions could materially affect the fair value estimate. When options are granted or awards made to employees, an estimate is made of what percentage is more than likely to vest, be forfeited, lapse or cancelled based on historical information. Based on these estimates, compensation expense to be accrued at that date is calculated and amortised over the vesting period. For early exercises of options or release of awards due to redundancy, death or resignation, the compensation expense is immediately recognised and for forfeitures due to employees leaving the Group, any previously recognised expense is reversed. However, if an employee loses their award because of the Group’s failure to meet the performance criteria, previously recognised expense is not reversed. During the year, the Group granted share options to certain non-employee independent financial advisors. Those options were measured using the Black-Scholes option pricing model with assumptions consistent with those of other share options. These transactions were measured using an option model because the Group does not receive a separate and measurable benefit from those non-employees in exchange for the options granted. As such, the fair value of the options themselves is more readily determinable than the services received in return.
c Total share-based payment expenseTotal expense recognised in the year in the consolidated financial statements related to share-based compensation is as follows:
2010 £m 2009 £m
Share-based compensation expense 47 37Amount accounted for as equity-settled 37 29Carrying value at 31 December of liabilities arising from share-based payment transactions 17 13Intrinsic value of above liabilities for which rights had vested at 31 December 6 7
I5: KEY MANAGEMENT REMUNERATION
Key management constitutes the directors of Prudential plc as they have authority and responsibility for planning, directing and controlling the activities of the Group. Total key management remuneration amounts to £21,677,000 (2009: £20,989,000). This comprises salaries and short-term benefits of £9,594,000 (2009: £11,570,000), post-employment benefits of £926,000 (2009: £1,132,000), leaving benefits of £ nil (2009: £915,000) and share-based payments of £11,157,000 (2009: £7,372,000). Post-employment benefits comprise the change in the transfer value of the accrued benefit relating to directors’ defined benefit pension schemes in the year and the total contributions made to directors’ other pension arrangements. The share-based payments charge is the sum of £7,320,000 (2009: £5,270,000), which is determined in accordance with IFRS 2, ‘Share-Based Payments’ (see note I4) and £3,837,000 (2009: £2,102,000) of deferred share awards. Total key management remuneration includes total directors’ emoluments of £14,225,000 (2009: £15,090,000) as shown in the directors’ remuneration table and related footnotes in the directors’ remuneration report, and additional amounts in respect of pensions and share-based payments. Further information on directors’ remuneration is given in the directors’ remuneration report.
I6: FEES PAYABLE TO AUDITOR
2010 £m 2009 £m
Fees payable to the Company’s auditor for the audit of the Company’s annual accounts 1.9 1.8Fees payable to the Company’s auditor and its associates for other services: Audit of subsidiaries and associates pursuant to legislation 6.1 5.5 Other services supplied pursuant to legislation 2.4 2.7 Other services relating to taxation 0.4 0.6 Valuation and actuarial services 0.1 0.1 Services relating to other corporate finance transactions 0.1 0.7 All other services 1.0 1.0 Services relating to the AIA transaction 5.5 –
Total 17.5 12.4
In addition, there were fees incurred of £0.1 million (2009: £0.2 million) for the audit of pension schemes.

350
Prudential plc Annual Report 2010
FINANCIAL STATEMENTS > NOTES ON THE GROUP FINANCIAL STATEMENTS
I: OTHER NOTESCONTINUED
I6: FEES PAYABLE TO AUDITOR > CONTINUED
The fees for services relating to the AIA transaction of £5.5 million were primarily comprised of the following services:
• Accountants’ Report on historical financial information on Prudential Group• Consulting Actuaries’ Report on AIA EEV information• Technical accounting advice• Financial due diligence• Working capital review• Synergies review• Extraction comfort
All services were specifically approved by the Prudential Group Audit Committee. The Audit Committee regularly monitors the non-audit services provided to the Group by its auditor and has developed a formal Auditor Independence Policy which sets out the types of services that the auditor may provide, consistent with the guidance in Sir Robert Smith’s report ‘Audit Committees – Combined Code Guidance’ and with the provisions of the US Sarbanes-Oxley Act. The Audit Committee annually reviews the auditor’s objectivity and independence. More information on these issues is given in the corporate governance report within this Annual Report.
I7: RELATED PARTY TRANSACTIONS
Transactions between the Company and its subsidiaries are eliminated on consolidation. In addition, the Company has transactions and outstanding balances with certain unit trusts, OEICs, collateralised debt obligations and similar entities which are not consolidated and where a Group company acts as manager. These entities are regarded as related parties for the purposes of IAS 24. The balances are included in the Group’s statement of financial position sheet at fair value or amortised cost in accordance with their IAS 39 classifications. The transactions are included in the income statement and include amounts paid on issue of shares or units, amounts received on cancellation of shares or units and paid in respect of the periodic charge and administration fee. Further details of the aggregate assets, liabilities, revenues, profits or losses and reporting dates of entities considered to be associates under IFRS are disclosed in note H8. Executive officers and directors of the Company may from time to time purchase insurance, asset management or annuity products marketed by Group companies in the ordinary course of business on substantially the same terms as those prevailing at the time for comparable transactions with other persons. Apart from the transactions with directors referred to below, no director had interests in shares, transactions or arrangements that require disclosure, other than those given in the directors’ remuneration report. Key management remuneration is disclosed in note I5. In 2010 and 2009, other transactions with directors were not deemed to be significant both by virtue of their size and in the context of the directors’ financial positions. As indicated above, all of these transactions are on terms broadly equivalent to those that prevail in arm’s length transactions.
I8: SUBSIDIARY UNDERTAKINGS
i Principal subsidiariesThe principal subsidiary undertakings of the Company at 31 December 2010, all wholly owned were:
Main activityCountry of
incorporation
The Prudential Assurance Company Limited Insurance England and WalesPrudential Annuities Limited* Insurance England and WalesPrudential Retirement Income Limited (PRIL)* Insurance ScotlandM&G Investment Management Limited* Asset management England and WalesJackson National Life Insurance Company* Insurance USPrudential Assurance Company Singapore (Pte) Limited* Insurance Singapore
* Owned by a subsidiary undertaking of the Company.
Each subsidiary has one class of ordinary shares and operates mainly in its country of incorporation, except for PRIL which operates mainly in England and Wales. Details of all Prudential subsidiaries, joint ventures and associates will be annexed to the next Annual Returns of Prudential plc filed with the UK Registrar of Companies and the Registrar of Companies in Hong Kong.

351F
INA
NC
IAL
S
TA
TE
ME
NT
SI: O
TH
ER
NO
TE
S
ii Dividend restrictions and minimum capital requirementsCertain Group subsidiaries are subject to restrictions on the amount of funds they may transfer in the form of cash dividends or otherwise to the parent company. UK insurance companies are required to maintain solvency margins which must be supported by capital reserves and other resources, including unrealised gains on investments. Jackson can pay dividends on its capital stock only out of earned surplus unless prior regulatory approval is obtained. Furthermore, without the prior regulatory approval, dividends cannot be distributed if all dividends made within the preceding 12 months exceed the greater of Jackson’s statutory net gain from operations or 10 per cent of Jackson’s statutory surplus for the prior year. In 2010, the maximum amount of dividends that could be paid by Jackson without prior regulatory approval is US$377 million (£241 million) (in 2009: US$454 million (£281 million)). The Group’s Asian subsidiaries may remit dividends to the Group, in general, provided the statutory insurance fund meets the capital adequacy standard required under local statutory regulations. The Group capital position statement for life assurance businesses is set out in note D5, showing the available capital reflecting the excess of regulatory basis over liabilities for each fund or group of companies determined by reference to the local regulation of the subsidiaries. In addition, disclosure is also provided in note D5 of the local capital requirement of each of the fund or group of companies.
iii Acquisition and disposal of subsidiariesDuring 2010, the Group acquired a 100 per cent interest in United Overseas Bank Life Assurance Limited (UOB) in Singapore. Further details are set out in note I1. On 1 October 2010, the PAC with-profits fund, via its venture fund holdings and as part of its investment portfolio, acquired control of Meterserve (North West) Limited and Meterserve (North East) Limited (together referred to as ‘Meterserve’), increasing its 50 per cent stake to 100 per cent. As this transaction is within the with-profits fund it has no impact on shareholders’ profit or equity for the period ended 31 December 2010. The impact on the Group’s consolidated revenue, including investment returns, is not material. Had the acquisition been effected at 1 January 2010, the revenue and profit of the Group from continuing operations for the year ended 31 December 2010 would not have been materially different. A summary of the consideration, goodwill and net assets acquired relating to Meterserve is provided in the table below:
2010 £m
Cash consideration paid 22Fair value of existing stake 25
Total consideration 47
Net assets acquired:Property, plant and equipment 219Derivative assets (35)Other non-investment and non-cash assets 11Cash and cash equivalents 10Borrowings attributable to with-profits funds (194)Other non-insurance liabilities (6)
Fair value of net assets acquired 5
Total goodwill arising on acquisition attributable to the with-profits fund 42
The acquisition costs associated with this transaction were expensed as incurred and totalled less than £1 million. Goodwill represents management’s expectation of future income streams and is not allowable for tax. As noted above the transaction increased the previously held stake from 50 per cent to 100 per cent. The fair value of the existing stake at the date of the transaction was £25 million. As the investment was held in the Group’s balance sheet as a financial instrument classified as at fair value through profit and loss no gain or loss arises as a result of the transaction. There were no new acquisitions or disposals by the PAC with-profits fund in 2009. However, during 2009, the holding in the voting equity interest of Red Funnel increased from 90 per cent to 100 per cent. Red Funnel is a venture capital holding owned by the PAC with-profits fund managed by M&G. Other than the above there were no other material acquisitions or disposals of subsidiaries during 2010 or 2009.

352
Prudential plc Annual Report 2010
FINANCIAL STATEMENTS > NOTES ON THE GROUP FINANCIAL STATEMENTS
I: OTHER NOTESCONTINUED
I9: COMMITMENTS
i Operating leasesThe Group leases various offices to conduct its business. Leases in which a significant portion of the risks and rewards of ownership are retained by the lessor are classified as operating leases. Payments made under operating leases (net of any incentives received from the lessor) are charged to the income statement on a straight-line basis over the period of the lease.
2010 £m 2009 £m
Future minimum lease payments for non-cancellable operating leases fall due during the following periods:Not later than 1 year 70 63Later than 1 year and not later than 5 years 236 178Later than 5 years 120 104
The total minimum future sublease rentals to be received on non-cancellable operating leases for land and buildings for the year ended 31 December 2010 were £nil (2009: £nil). Minimum lease rental payments for the year ended 31 December 2010 of £92 million (2009: £105 million) are included in the consolidated income statement.
ii Capital commitmentsThe Group has provided, from time to time, certain guarantees and commitments to third-parties including funding the purchase or development of land and buildings and other related matters. The contractual obligations to purchase or develop investment properties at 31 December 2010 was £28 million (2009: £nil).
I10: DISCONTINUED OPERATIONS
The charge of £14 million in 2009, which is net of £nil tax, reflects completion adjustments for a previously disposed business.
I11: CASH FLOWS
Structural borrowings of shareholder-financed operations comprise core debt of the parent company and Jackson surplus notes. Core debt excludes borrowings to support short-term fixed income securities programmes, non-recourse borrowings of investment subsidiaries of shareholder-financed operations and other borrowings of shareholder-financed operations. Cash flows in respect of these borrowings are included within cash flows from operating activities. Structural borrowings of with-profits operations relate solely to the £100 million 8.5 per cent undated subordinated guaranteed bonds which contribute to the solvency base of the Scottish Amicable Insurance fund (SAIF) a ring-fenced sub-fund of the PAC with-profits fund. Cash flows in respect of other borrowings of with-profits funds, which principally relate to consolidated investment funds, are included within cash flows from operating activities.
I12: POST BALANCE SHEET EVENTS
In January 2011, the Company issued US$550 million 7.75 per cent Tier 1 subordinated debt, primarily to retail investors. The proceeds, net of costs, were US$539 million and are intended to finance the repayments of the ¤500 million Tier 2 subordinated notes in December 2011.

353F
INA
NC
IAL
S
TA
TE
ME
NT
SA
DD
ITIO
NA
L U
NA
UD
ITE
D
FIN
AN
CIA
L IN
FO
RM
AT
ION
INDEX TO THE ADDITIONAL UNAUDITED FINANCIAL INFORMATION
I. Selected historical financial information of Prudential354 Selected historical financial information of Prudential
II. IFRS profit and loss information357 (a) Analysis of long-term insurance business pre-tax IFRS
operating profit based on longer-term investment returns by driver
362 (b) Asian operations – analysis of IFRS operating profit by territory
363 (c) Analysis of asset management operating profit based on longer-term investment returns
III. IFRS balance sheet information365 (a) Memorandum fair value of Jackson's GMDB and
GMWB liabilities 367 (b) IFRS shareholders' funds summary by business unit
and net asset value per share
IV. Other information368 (a) Funds under management 368 (b) Effect of foreign currency rate movements on results371 (c) Option schemes
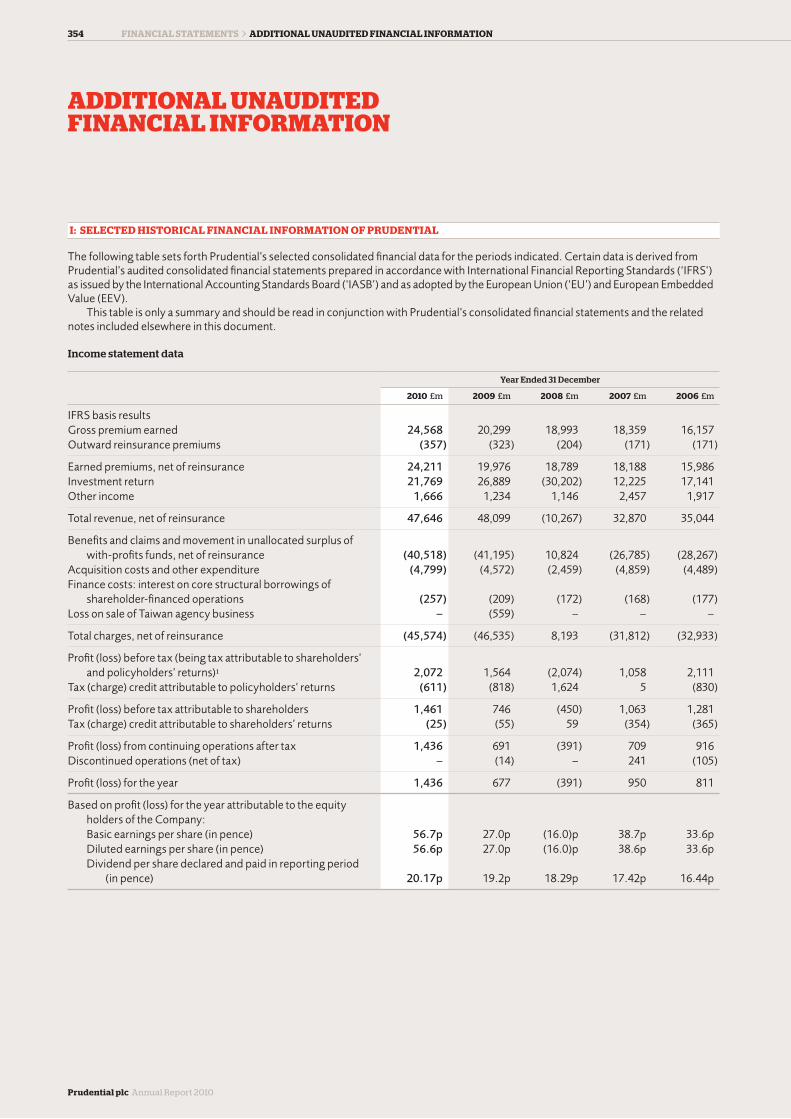
354
Prudential plc Annual Report 2010
FINANCIAL STATEMENTS > ADDITIONAL UNAUDITED FINANCIAL INFORMATION
ADDITIONAL UNAUDITED FINANCIAL INFORMATION
I: SELECTED HISTORICAL FINANCIAL INFORMATION OF PRUDENTIAL
The following table sets forth Prudential’s selected consolidated financial data for the periods indicated. Certain data is derived from Prudential’s audited consolidated financial statements prepared in accordance with International Financial Reporting Standards (‘IFRS’) as issued by the International Accounting Standards Board (‘IASB’) and as adopted by the European Union (‘EU’) and European Embedded Value (EEV).
This table is only a summary and should be read in conjunction with Prudential’s consolidated financial statements and the related notes included elsewhere in this document.
Income statement data
Year Ended 31 December
2010 £m 2009 £m 2008 £m 2007 £m 2006 £m
IFRS basis resultsGross premium earned 24,568 20,299 18,993 18,359 16,157Outward reinsurance premiums (357) (323) (204) (171) (171)
Earned premiums, net of reinsurance 24,211 19,976 18,789 18,188 15,986Investment return 21,769 26,889 (30,202) 12,225 17,141Other income 1,666 1,234 1,146 2,457 1,917
Total revenue, net of reinsurance 47,646 48,099 (10,267) 32,870 35,044
Benefits and claims and movement in unallocated surplus of with-profits funds, net of reinsurance (40,518) (41,195) 10,824 (26,785) (28,267)
Acquisition costs and other expenditure (4,799) (4,572) (2,459) (4,859) (4,489)Finance costs: interest on core structural borrowings of
shareholder-financed operations (257) (209) (172) (168) (177)Loss on sale of Taiwan agency business – (559) – – –
Total charges, net of reinsurance (45,574) (46,535) 8,193 (31,812) (32,933)
Profit (loss) before tax (being tax attributable to shareholders’ and policyholders’ returns) 1 2,072 1,564 (2,074) 1,058 2,111
Tax (charge) credit attributable to policyholders’ returns (611) (818) 1,624 5 (830)
Profit (loss) before tax attributable to shareholders 1,461 746 (450) 1,063 1,281Tax (charge) credit attributable to shareholders’ returns (25) (55) 59 (354) (365)
Profit (loss) from continuing operations after tax 1,436 691 (391) 709 916Discontinued operations (net of tax) – (14) – 241 (105)
Profit (loss) for the year 1,436 677 (391) 950 811
Based on profit (loss) for the year attributable to the equity holders of the Company:
Basic earnings per share (in pence) 56.7p 27.0p (16.0)p 38.7p 33.6p Diluted earnings per share (in pence) 56.6p 27.0p (16.0)p 38.6p 33.6p Dividend per share declared and paid in reporting period
(in pence) 20.17p 19.2p 18.29p 17.42p 16.44p

355F
INA
NC
IAL
S
TA
TE
ME
NT
SA
DD
ITIO
NA
L U
NA
UD
ITE
D
FIN
AN
CIA
L IN
FO
RM
AT
ION
Supplementary IFRS income statement data
2010 £m 2009 £m 2008 £m 2007 £m 2006 £m
Operating profit based on longer-term investment returns2 1,941 1,564 1,212 1,152 1,068Short-term fluctuations in investment returns on shareholder-
backed business (123) (123) (1,650) (51) 88Shareholders’ share of actuarial and other gains and losses on
defined benefit pension schemes (10) (74) (13) (1) 76Costs of terminated AIA transaction (377) – – – –Gain on dilution of holding in PruHealth 30 – – – –Loss on sale and results of Taiwan agency business – (621) 1 (37) 49
Profit (loss) from continuing operations before tax attributable to shareholders2 1,461 746 (450) 1,063 1,281
Operating earnings per share (reflecting operating profit based on longer-term investment returns after related tax and non-controlling interests and excluding 2010 exceptional tax credit) (in pence) 62.0p 47.5p 38.1p 31.3p 28.8p
Operating earnings per share (reflecting operating profit based on longer-term investment returns after related tax and non-controlling interests and including 2010 exceptional tax credit) (in pence) 68.3p 47.5p 38.1p 31.3p 28.8p
Supplementary EEV income statement data
2010 £m 2009 £m 2008 £m 2007 £m 2006 £m
Operating profit based on longer-term investment returns2 3,696 3,090 2,865 2,353 1,998Short-term fluctuations in investment returns on shareholder-
backed business (30) 351 (4,967) 200 692Mark to market value movements on core borrowings (164) (795) 656 223 85Shareholders’ share of actuarial and other gains and losses on
defined benefit pension schemes (11) (84) (14) (5) 207Effect of changes in economic assumptions (10) (910) (398) 632 163Costs of terminated AIA transaction (377) – – – –Gain on dilution of holding in PruHealth 3 – – – –Profit on sale and results of Taiwan agency business – 91 (248) 267 77
Profit (loss) from continuing operations before tax attributable to shareholders 3,107 1,743 (2,106) 3,670 3,222
Operating earnings per share (reflecting operating profit based on longer-term investment returns after related tax and non-controlling interests and excluding 2010 exceptional tax credit) (in pence) 106.9p 88.8p 85.1p 69.2p 58.2p
Operating earnings per share (reflecting operating profit based on longer-term investment returns after related tax and non-controlling interests and including 2010 exceptional tax credit) (in pence) 113.2p 88.8p 85.1p 69.2p 58.2p

356
Prudential plc Annual Report 2010
ADDITIONAL UNAUDITED FINANCIAL INFORMATIONCONTINUED
FINANCIAL STATEMENTS > ADDITIONAL UNAUDITED FINANCIAL INFORMATION
I: SELECTED HISTORICAL FINANCIAL INFORMATION OF PRUDENTIAL > CONTINUED
New business dataNew business3 excluding Japan and Taiwan.
AER
2010 £m 2009 £m 2008 £m 2007 £m 2006 £m
Annual premium equivalent (APE) sales: – Asia 1,501 1,209 1,174 1,044 814 – US 1,164 912 716 671 613 – UK 820 723 947 910 900
– Total APE sales 3,485 2,844 2,837 2,625 2,327
EEV new business profit (NBP) 2,028 1,619 1,205 1,103 975
NBP margin (% APE) 58% 57% 42% 42% 42%
Statement of financial position data
As of and for the Year Ended 31 December 2010 £m 2009 £m 2008 £m 2007 £m 2006 £m
IFRS basis results Total assets 260,806 227,754 215,542 219,382 216,528 Total policyholder liabilities and unallocated surplus of with-profits funds 224,980 196,417 182,391 190,317 178,539 Core structural borrowings of shareholder –
financed operations 3,676 3,394 2,958 2,492 3,063 Total liabilities 252,731 221,451 210,429 213,218 210,972 Total equity 8,075 6,303 5,113 6,164 5,556
Other data
As of and for the Year Ended 31 December 2010 £bn 2009 £bn 2008 £bn 2007 £bn 2006 £bn
Funds under management4 340 290 249 267 251EEV shareholders’ equity, excluding non-controlling interests 18.2 15.3 15.0 14.6 11.9Insurance Groups Directive capital surplus (as adjusted)5 4.3 3.4 1.5 1.9 1.2
Notes1 This measure is the formal profit (loss) before tax measure under IFRS but is not the result attributable to shareholders. 2 Operating profits are determined on the basis of including longer-term investment returns. EEV and IFRS operating profits are stated after
excluding the effect of short-term fluctuations in investment returns against long-term assumptions, the shareholders’ share of actuarial and other gains and losses on defined benefit pension schemes, transaction costs arising from business combinations in the period, costs associated with the terminated AIA transaction, and the effect of disposal and results of the Taiwan agency business, for which the sale process was completed in June 2009. In 2010, the Group amended the presentation of IFRS operating profit for its US insurance operations to remove the net equity hedge accounting effect (incorporating related amortisation of deferred acquisition costs) and include it in short-term fluctuations. The prior period comparatives for 2009 and 2008 have been amended accordingly.
In addition, for EEV basis results, operating profit excludes the effect of changes in economic assumptions and the market value movement on core borrowings.
3 New business sales exclude the results of the Japanese life operation which ceased writing new business in February 2010, and the results of the Taiwan agency business for which the sale process was completed in June 2009.
4 Funds under management comprise funds of the Group held in the statement of financial position and external funds that are managed by Prudential asset management operations.
5 The surpluses shown are before allowing for the final dividends for each year, which are paid in the following year. The 2010 surplus is estimated. Since 2007, following the sale of Egg Banking, Prudential has been subject to the capital adequacy requirements of the Insurance Groups Directive (IGD) which applies to groups whose activities are mainly in the insurance sector. Prior to the sale of Egg Banking, Prudential was subject to the capital adequacy requirements of the Financial Conglomerates Directive (FCD) which applies to groups with significant cross-sector activities in insurance and banking/investment services. Prudential was classified as an insurance conglomerate under the FCD. As the requirements for insurance conglomerates under the FCD are closely aligned to the requirements for insurance groups under the IGD, the move for Prudential from FCD to IGD did not result in a significant impact.

357F
INA
NC
IAL
S
TA
TE
ME
NT
SA
DD
ITIO
NA
L U
NA
UD
ITE
D
FIN
AN
CIA
L IN
FO
RM
AT
ION
II(a): ANALYSIS OF LONG-TERM INSURANCE BUSINESS PRE-TAX IFRS OPERATING PROFIT BASED ON LONGER-TERM
INVESTMENT RETURNS BY DRIVER
This schedule classifies the Group’s pre-tax operating earnings from long-term insurance operations into the underlying drivers of those profits, using the following categories:
i Spread income represents the difference between net investment income (or premium income in the case of the UK annuities new business) and amounts credited to policyholder accounts. It excludes the longer-term investment return on assets in excess of those covering shareholder-backed policyholder liabilities, which has been separately disclosed as expected return on shareholder assets.
ii Fee income represents profits driven by net investment performance, being asset management fees that vary with the size of the underlying policyholder funds net of investment management expenses.
iii With-profits business represents the shareholders’ transfer from the with-profits fund in the period.
iv Insurance margin primarily represents profits derived from the insurance risks of mortality, morbidity and persistency.
v Margin on revenues primarily represents amounts deducted from premiums to cover acquisition costs and administration expenses.
vi Acquisition costs and administration expenses represent expenses incurred in the period attributable to shareholders. It excludes items such as restructuring costs and Solvency II costs which are not included in the segment profit for insurance as well as items that are more appropriately included in other source of earnings lines (e.g. investment expenses are netted off investment income as part of spread income or fee income as appropriate).
vii DAC adjustments comprises DAC amortisation for the period, excluding amounts related to short-term fluctuations, net of costs deferred in respect of new business.
Analysis of pre-tax IFRS operating profit by source
2010 £m
Asia US UK Unallocated Total
Spread income 70 692 251 – 1,013 Fee income 122 506 60 – 688 With-profits 32 – 310 – 342 Insurance margin 392 188 12 – 592 Margin on revenues 1,018 – 223 – 1,241 Expenses Acquisition costs (656) (851) (167) – (1,674) Administration expenses (467) (344) (113) – (924) DAC adjustments 2 517 (1) – 518 Expected return on shareholder assets 19 125 98 – 242
Long-term business operating profit 532 833 673 – 2,038 Asset management operating profit 72 22 284 – 378 GI commission – – 46 – 46 Other income and expenditure* – – – (521) (521)
Total operating profit based on longer-term investment returns 604 855 1,003 (521) 1,941
* Including restructuring and Solvency II implementation costs.

358
Prudential plc Annual Report 2010
ADDITIONAL UNAUDITED FINANCIAL INFORMATIONCONTINUED
FINANCIAL STATEMENTS > ADDITIONAL UNAUDITED FINANCIAL INFORMATION
II(a): ANALYSIS OF LONG-TERM INSURANCE BUSINESS PRE-TAX IFRS OPERATING PROFIT BASED ON LONGER-TERM
INVESTMENT RETURNS BY DRIVER > CONTINUED
2009i £m
Asia US UK Unallocated Total
Spread income 31 524 198 – 753 Fee income 80 324 54 – 458 With-profits 29 – 281 – 310 Insurance margin 253 154 41 – 448 Margin on revenues 766 – 275 – 1,041 Expenses Acquisition costs (605) (690) (192) – (1,487) Administration expenses (382) (259) (173) – (814) DAC adjustments 150 467 (3) – 614 Expected return on shareholder assets 25 98 125 – 248 Non-recurrent release of reserves for Malaysia life operations 63 – – – 63
Long-term business operating profit 410 618 606 – 1,634 Asset management operating profit 55 4 238 – 297 GI commission – – 51 – 51 Other income and expenditure* – – – (418) (418)
Total operating profit based on longer-term investment returns 465 622 895 (418) 1,564
2008i £m
Asia US UK Unallocated Total
Spread income 38 461 35 – 534 Fee income 54 292 57 – 403 With-profits 30 – 395 – 425 Insurance margin 198 161 (12) – 347 Margin on revenues 672 – 314 – 986 Expenses Acquisition costs (619) (451) (172) – (1,242) Administration expenses (331) (217) (212) – (760) DAC adjustments 173 – 32 – 205 Expected return on shareholder assets 16 89 108 – 213
Long-term business operating profit 231 335 545 – 1,111 Asset management operating profit 52 7 286 – 345 GI commission – – 44 – 44 Other income and expenditure* – – – (288) (288)
Total operating profit based on longer-term investment returns 283 342 875 (288) 1,212
* Including restructuring and Solvency II implementation costs.
Notei During 2010 the Group amended its presentation of operating profit for its US insurance operations to remove the net equity hedge accounting
effect associated with Jackson’s variable annuity and fixed index annuity products, which are now classified in the Group’s supplementary analysis of profit before tax attributable to shareholders as part of short-term fluctuations in investment returns. 2009 and 2008 operating profit have been amended accordingly and so net equity hedge effects of £159 million negative and £71 million positive have been removed from the previously stated operating profits of £1,405 million and £1,283 million to give restated values of £1,564 million and £1,212 million, respectively.

359F
INA
NC
IAL
S
TA
TE
ME
NT
SA
DD
ITIO
NA
L U
NA
UD
ITE
D
FIN
AN
CIA
L IN
FO
RM
AT
ION
Margin analysis of long-term insurance businessThe following analysis expresses certain of the Group’s sources of operating profit as a margin of policyholder liabilities or other suitable driver. Details of the Group’s average policyholder liability balances are given in note B6(e).
Total
2010 2009 2008
Long-term businessProfit
£m
AverageLiability
£mMargin
bpsProfit
£m
AverageLiability
£mMargin
bpsProfit
£m
AverageLiability
£mMargin
bps
Spread income 1,013 53,858 188 753 51,000 148 534 44,281 121 Fee income 688 57,496 120 458 43,373 106 403 38,850 104 With-profits 342 89,693 38 310 84,063 37 425 89,075 48 Insurance margin 592 448 347 Margin on revenues 1,241 1,041 986 Expenses Acquisition costs* (1,674) 3,492 (48)% (1,487) 2,896 (51)% (1,242) 2,879 (43)% Administration expenses (924) 111,354 (83) (814) 94,373 (86) (760) 83,131 (91) DAC adjustments 518 614 205 Expected return on shareholder assets 242 248 213 Non-recurrent release of reserve for Malaysia Life – 63 –
Operating profit 2,038 1,634 1,111
Asia
2010 2009 2008
Long-term businessProfit
£m
AverageLiability
£mMargin
bpsProfit
£m
AverageLiability
£mMargin
bpsProfit
£m
AverageLiability
£mMargin
bps
Spread income 70 4,393 159 31 3,152 98 38 2,421 157 Fee income 122 11,222 109 80 8,107 99 54 6,419 84 With-profits 32 10,135 32 29 8,371 35 30 7,168 42 Insurance margin 392 253 198 Margin on revenues 1,018 766 672 Expenses Acquisition costs* (656) 1,508 (44)% (605) 1,261 (48)% (619) 1,216 (51)% Administration expenses (467) 15,615 (299) (382) 11,259 (339) (331) 8,840 (374) DAC adjustments 2 150 173 Expected return on shareholder assets 19 25 16 Non-recurrent release of reserve for Malaysia Life – 63 –
Operating profit 532 410 231
* The ratio for acquisition costs is calculated as a percentage of APE including with-profits sales and Japan (2010: £7 million; 2009: £52 million). Acquisition costs include only those relating to shareholders.
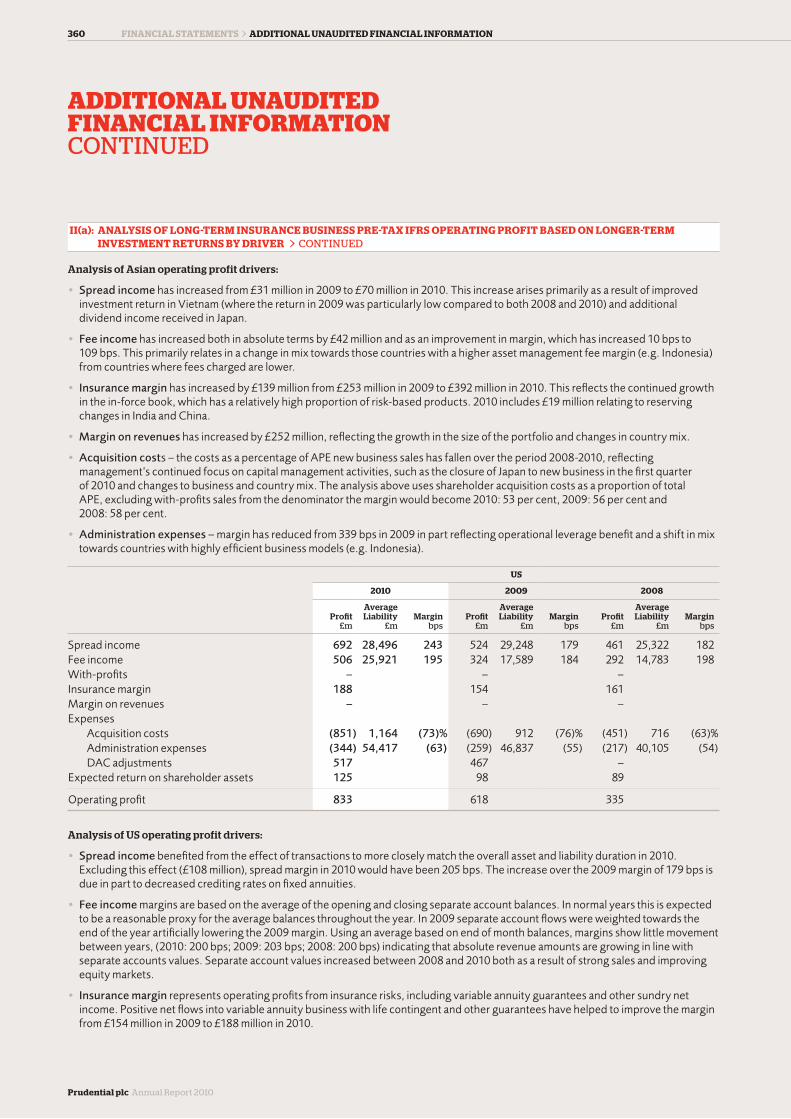
360
Prudential plc Annual Report 2010
ADDITIONAL UNAUDITED FINANCIAL INFORMATIONCONTINUED
FINANCIAL STATEMENTS > ADDITIONAL UNAUDITED FINANCIAL INFORMATION
II(a): ANALYSIS OF LONG-TERM INSURANCE BUSINESS PRE-TAX IFRS OPERATING PROFIT BASED ON LONGER-TERM
INVESTMENT RETURNS BY DRIVER > CONTINUED
Analysis of Asian operating profit drivers:
• Spread income has increased from £31 million in 2009 to £70 million in 2010. This increase arises primarily as a result of improved investment return in Vietnam (where the return in 2009 was particularly low compared to both 2008 and 2010) and additional dividend income received in Japan.
• Fee income has increased both in absolute terms by £42 million and as an improvement in margin, which has increased 10 bps to 109 bps. This primarily relates in a change in mix towards those countries with a higher asset management fee margin (e.g. Indonesia) from countries where fees charged are lower.
• Insurance margin has increased by £139 million from £253 million in 2009 to £392 million in 2010. This reflects the continued growth in the in-force book, which has a relatively high proportion of risk-based products. 2010 includes £19 million relating to reserving changes in India and China.
• Margin on revenues has increased by £252 million, reflecting the growth in the size of the portfolio and changes in country mix.
• Acquisition costs – the costs as a percentage of APE new business sales has fallen over the period 2008-2010, reflecting management’s continued focus on capital management activities, such as the closure of Japan to new business in the first quarter of 2010 and changes to business and country mix. The analysis above uses shareholder acquisition costs as a proportion of total APE, excluding with-profits sales from the denominator the margin would become 2010: 53 per cent, 2009: 56 per cent and 2008: 58 per cent.
• Administration expenses – margin has reduced from 339 bps in 2009 in part reflecting operational leverage benefit and a shift in mix towards countries with highly efficient business models (e.g. Indonesia).
US
2010 2009 2008
Profit £m
AverageLiability
£mMargin
bpsProfit
£m
AverageLiability
£mMargin
bpsProfit
£m
AverageLiability
£mMargin
bps
Spread income 692 28,496 243 524 29,248 179 461 25,322 182 Fee income 506 25,921 195 324 17,589 184 292 14,783 198 With-profits – – – Insurance margin 188 154 161 Margin on revenues – – – Expenses Acquisition costs (851) 1,164 (73)% (690) 912 (76)% (451) 716 (63)% Administration expenses (344) 54,417 (63) (259) 46,837 (55) (217) 40,105 (54) DAC adjustments 517 467 – Expected return on shareholder assets 125 98 89
Operating profit 833 618 335
Analysis of US operating profit drivers:
• Spread income benefited from the effect of transactions to more closely match the overall asset and liability duration in 2010. Excluding this effect (£108 million), spread margin in 2010 would have been 205 bps. The increase over the 2009 margin of 179 bps is due in part to decreased crediting rates on fixed annuities.
• Fee income margins are based on the average of the opening and closing separate account balances. In normal years this is expected to be a reasonable proxy for the average balances throughout the year. In 2009 separate account flows were weighted towards the end of the year artificially lowering the 2009 margin. Using an average based on end of month balances, margins show little movement between years, (2010: 200 bps; 2009: 203 bps; 2008: 200 bps) indicating that absolute revenue amounts are growing in line with separate accounts values. Separate account values increased between 2008 and 2010 both as a result of strong sales and improving equity markets.
• Insurance margin represents operating profits from insurance risks, including variable annuity guarantees and other sundry net income. Positive net flows into variable annuity business with life contingent and other guarantees have helped to improve the margin from £154 million in 2009 to £188 million in 2010.

361F
INA
NC
IAL
S
TA
TE
ME
NT
SA
DD
ITIO
NA
L U
NA
UD
ITE
D
FIN
AN
CIA
L IN
FO
RM
AT
ION
• Acquisition costs have increased in 2010 in absolute terms compared to 2009 following an increase in sales volumes. However, acquisition costs as a percentage of APE has fallen from 76 per cent in 2009 to 73 per cent in 2010 as more advisers are electing to take asset-based commission, which is paid over the life of the policy based on fund value. This asset-based commission is treated as an administration expense in this analysis as opposed to a cost of acquisition, resulting in a lower acquisition cost ratio but a higher administration expenses margin.
2008 acquisition costs as a percentage of APE sales were 63 per cent, lower than 2009 and 2010. This is primarily because sales of GICs in 2008 (APE £120 million), on which no acquisition costs are incurred, reduces the margin for that year. Excluding GIC APE sales the acquisition cost ratio for 2008 becomes 76 per cent, in line with 2009.
• Administration expenses margin has increased to 63 bps in 2010, partly as a result of higher asset based commission, which lowers acquisition costs but increases the expenses classified as administration expenses in the table above.
UK
2010 2009 2008
Profit £m
AverageLiability
£mMargin
bpsProfit
£m
AverageLiability
£mMargin
bpsProfit
£m
AverageLiability
£mMargin
bps
Spread income 251 20,969 120 198 18,600 106 35 16,538 21 Fee income 60 20,353 29 54 17,677 31 57 17,648 32 With-profits 310 79,558 39 281 75,692 37 395 81,907 48 Insurance margin 12 41 (12)Margin on revenues 223 275 314 Expenses Acquisition costs* (167) 820 (20)% (192) 723 (27)% (172) 947 (18)% Administration expenses (113) 41,322 (27) (173) 36,277 (48) (212) 34,186 (62) DAC adjustments (1) (3) 32 Expected return on shareholder assets 98 125 108
Operating profit 673 606 545
* The ratio for acquisition costs is calculated as a percentage of APE including with-profits sales. Acquisition costs include only those relating to shareholders.
Analysis of UK operating profit drivers:
• Spread income has increased by £53 million to £251 million in 2010, reflecting in a higher margin of 120 bps, up from 106 bps in 2009. The improved margin primarily reflects the beneficial impacts of the bulk annuity deal written in 2010, improved margins on retail annuity new business and improved spread on equity release business following its closure to new business. Spread income was lower in 2008 due to lower margins on new business and the establishment of credit default and deflation reserves in that year in light of the credit crisis offset by the impact of actions to rebalance the credit portfolio.
• Fee income has increased by 11 per cent to £60 million broadly in line with the value of unit-linked liabilities following the improvement in equity markets.
• Margin on revenues represents premiums charges for expenses and other sundry net income received by the UK. Lower amounts were recorded in 2010 (£223 million) compared to 2009 (£275 million) reflecting, in part, lower premiums from shareholder-backed retail business in 2010 as compared to 2009.
• Insurance margin has fallen by £29 million to £12 million in 2010, reflecting that 2009 included a one-off benefit of £34 million in respect of a longevity swap on certain aspects of the UK’s annuity back-book liabilities, which was not repeated in 2010.
• Acquisition costs as a percentage of new business sales has fallen from 27 per cent in 2009 to 20 per cent in 2010. This reflects in part the impact of the bulk annuity deal which contributed £88 million APE in the period with a relatively low level of acquisition costs, together with the closure of equity release to new business as well as on-going cost saving initiatives.
The ratio above expresses the percentage of shareholder acquisition costs as a percentage of total APE sales. It is therefore impacted by the level of with-profits sales in the year. Acquisition costs as a percentage of shareholder-backed new business sales were 36 per cent in 2010 (49 per cent in 2009), with the most significant impact being the effect of the bulk annuity deal.
• Administration expenses have fallen by £60 million to £113 million and the ratio from 48 bps in 2009 to 27 bps in 2010. This is primarily the result of cost savings initiatives initiated by the UKIO in line with the business’ stated objectives.

362
Prudential plc Annual Report 2010
ADDITIONAL UNAUDITED FINANCIAL INFORMATIONCONTINUED
FINANCIAL STATEMENTS > ADDITIONAL UNAUDITED FINANCIAL INFORMATION
II(b): ASIAN OPERATIONS – ANALYSIS OF IFRS OPERATING PROFIT BY TERRITORY
Operating profit based on longer-term investment returns for Asian operations is analysed as follows:
2010 £m 2009 £m
Chinanote ii (12) 4 Hong Kong 51 48 Indianote iii 60 12 Indonesia 157 102 Japan (6) (18)Korea 12 6 Malaysia – Underlying results 97 65 – Exceptional creditnote i 63 Philippines 2 2 Singapore 129 112 Taiwan bancassurance businessnote iv (4) (7)Thailand 2 (1)Vietnam 43 30 Other 5 (2)
TOTAL INSURANCE OPERATIONSnote v 536 416 Development expenses (4) (6)
TOTAL LONG-TERM BUSINESS OPERATING PROFIT 532 410 Asset management 72 55
TOTAL ASIAN OPERATIONS 604 465
Notesi For the Malaysia life business, under the basis applied previously, 2008 IFRS basis liabilities were determined on the local regulatory basis using
prescribed interest rates such that a high degree of prudence resulted. As of 1 January 2009, the local regulatory basis has been replaced by the Malaysian authority’s risk-based capital (RBC) framework. In the light of this development, the Company has re-measured the liabilities by reference to the method applied under the new RBC framework, which is more realistic than the previous approach, but with an overlay constraint to the method such that negative reserves derived at an individual policyholder level are not included. This change has resulted in a one-off release from liabilities at 1 January 2009 of £63 million.
ii China’s operating loss of £12 million is after a net charge of £17 million for local reserving changes and associated impacts that have been reflected in the Group’s IFRS accounts. Excluding this effect, China’s underlying result is a £5 million profit.
iii The operating profit of £60 million from India, a joint venture, includes £36 million arising from changes that improve the reserving estimation technique.
iv Sale of Taiwan agency business In order to facilitate comparisons of operating profit based on longer-term investment returns that reflect the Group’s retained operations, the
results attributable to the Taiwan agency business for which the sale process was completed in June 2009 are excluded from analysis of operating profit.
v Analysis of operating profit between new and in-force business The result for insurance operations comprises amounts in respect of new business and business in-force as follows:
2010 £m 2009 £m
New business strain (excluding Japan) (56) (72)Japan (1) (6)
New business strain (including Japan) (57) (78)Business in force 593 494
Total 536 416
The IFRS new business strain corresponds to approximately four per cent of new business APE premiums for 2010 (2009: approximately six per cent of new business APE).
The strain reflects the aggregate of the pre-tax regulatory basis strain to net worth after IFRS adjustments for deferral of acquisition costs and deferred income where appropriate.

363F
INA
NC
IAL
S
TA
TE
ME
NT
SA
DD
ITIO
NA
L U
NA
UD
ITE
D
FIN
AN
CIA
L IN
FO
RM
AT
ION
II(c): ANALYSIS OF ASSET MANAGEMENT OPERATING PROFIT BASED ON LONGER-TERM INVESTMENT RETURNS
2010 £m
M&Gi Asiai PruCap US Total
Operating income before performance-related fees 615 185 88 229 1,117 Performance-related fees 17 6 – – 23
Operating income* 632 191 88 229 1,140 Operating expense (386) (119) (50) (207) (762)
Operating profit based on longer-term investment returns 246 72 38 22 378
Average funds under management (FUM)† £186.5 bn £47.2 bn Margin based on operating income† 34 bps 40 bps Cost/income ratio‡ 63% 64%
2009 £m
M&Gi Asiai PruCap US Total
Operating income before performance-related fees 470 157 89 183 899 Performance-related fees 12 3 – – 15
Operating income* 482 160 89 183 914 Operating expense (305) (105) (28) (179) (617)
Operating profit based on longer-term investment returns 177 55 61 4 297
Average funds under management (FUM)† £157.5 bn £39.6 bn Margin based on operating income† 31 bps 40 bps Cost/income ratio‡ 65% 67%
2008 £m
M&Gi Asiai PruCap US Total
Operating income before performance-related fees 480 144 123 139 886 Performance-related fees 43 3 – – 46
Operating income* 523 147 123 139 932 Operating expense (295) (95) (65) (132) (587)
Operating profit based on longer-term investment returns 228 52 58 7 345
Average funds under management (FUM)† £154.0 bn £36.9 bn Margin based on operating income† 34 bps 40 bps Cost/income ratio‡ 61% 66%
* Operating income is net of commissions and includes performance related fees.† Margin represents operating income as a proportion of the related funds under management (FUM). Opening and closing internal and external funds
managed by the respective entity have been used to derive the average. Any funds held by the Group’s insurance operations which are managed by third parties outside of the Prudential Group are excluded from these amounts.
‡ Cost/income ratio is calculated as a percentage of income excluding performance-related fees.

364
Prudential plc Annual Report 2010
ADDITIONAL UNAUDITED FINANCIAL INFORMATIONCONTINUED
FINANCIAL STATEMENTS > ADDITIONAL UNAUDITED FINANCIAL INFORMATION
II(c): ANALYSIS OF ASSET MANAGEMENT OPERATING PROFIT BASED ON LONGER-TERM INVESTMENT
RETURNS > CONTINUED
i M&G and Asia asset management businesses can be further analysed as follows:
M&G
Operating income*
Retail £m
Margin of FUM†
bpsInstitutional §
£m
Margin of FUM†
bpsTotal
£m
Margin of FUM†
bps
2010 345 93 287 19 632 34 2009 255 102 227 17 482 31 2008 243 122 280 21 523 34
Asia
Operating income*
Retail £m
Margin of FUM†
bpsInstitutional §
£m
Margin of FUM†
bpsTotal
£m
Margin of FUM†
bps
2010 120 62 71 26 191 40 2009 98 60 62 27 160 40 2008 91 59 56 26 147 40
* Operating income is net of commissions and includes performance-related fees.† Margin represents operating income as a proportion of the related funds under management (FUM). Opening and closing internal and external
funds managed by the respective entity have been used to derive the average. Any funds held by the Group’s insurance operations which are managed by third-parties outside of the Prudential Group are excluded from these amounts.
§ Institutional includes internal funds.

365F
INA
NC
IAL
S
TA
TE
ME
NT
SA
DD
ITIO
NA
L U
NA
UD
ITE
D
FIN
AN
CIA
L IN
FO
RM
AT
ION
III(a): MEMORANDUM FAIR VALUE OF JACKSON’S GMDB AND GMWB LIABILITIES
The IFRS accounting for minimum death and withdrawal benefits guarantees of the Group’s US insurance operations has a mixed measurement approach.
‘Not for life’ Guaranteed Minimum Withdrawal Benefits (GMWB) are accounted for as ‘embedded derivatives’. Where the economic characteristics and risks of embedded derivatives are not closely related to the economic characteristics and risks of the host insurance contract, and where the contract is not measured at fair value with the changes in fair value recognised in the income statement, the embedded derivative is bifurcated and carried at fair value as a derivative in accordance with IAS 39. In Jackson, the embedded derivative liabilities for GMWB liabilities are fair valued using the economic assumptions shown below, in line with IAS 39 (FAS 157 – ‘Fair Value Measurements’.)
Where a significant insurance element is present, such as for Guaranteed Minimum Death Benefit (GMDB) and ‘for life’ GMWB, the guarantees are accounted for as part of the accounting applied to the host insurance contracts. Under IFRS 4, the insurance contract accounting applied prior to IFRS adoption has continued to be applied. Accordingly for US variable annuity business the US GAAP standards applicable to insurance contract accounting are applied. Consistent with that approach, the GMDB and ‘for life’ GMWB guarantees are valued under FASB Accounting Standards codification Topic 944 (sub-topics 944-20, 944-40 and 944-80), formerly known as ‘SOP 03-1’ (Statement of Position 03-1: ‘Accounting and Reporting by Insurance Enterprises Contracts and for Separate Accounts’).
The two reserving methodologies typically produce quite different patterns of results. It is the variation in assumptions, and the way the two reserving methods react to emerging experience, that produces potentially significant differences in reserve patterns through time.
Both methods determine a hypothetical fee or charge (referred to in the rest of this note as ‘fee assessment’) that is anticipated to fund future projected benefit payments arising using the assumptions applicable for that method. After determination at issue, the FAS 157 fee assessment is fixed for the life of the policy, so that variations in experience from that assumed at issue, as well as cash flow timing issues, will create a liability or asset as the value of future benefits becomes more or less, respectively, than the value of the fee assessments.
The SOP 03-1 fee assessment, on the other hand, is recomputed at each valuation date to take into account emerging experience and cash flow timing differences. After redetermination based on valuation date parameters, the new fee assessment is applied retrospectively from issue date to recompute the current reserve provision. This retrospective aspect of the calculation is not present in the FAS 157 methodology.
The chart below compares the assumption bases for the two methods in general terms as well as showing representative comparative values as of 31 December 2010. The comparative values for the projected earned rate and AA corporate bond rate are the 10-year rate in both cases, and the comparative value for volatility is the 5-year rate.
Assumption SOP 03-1 IAS 39 (FAS 157)
Fund earned rate 8.4% before fees Quoted rate swap curve (10-year rate: 3.4% before fees)
Discount rate 8.4% AA corporate rate curve (10-year rate: 4.8%)
Equity volatility 15% Implied curve (5-year volatility: 24%)
To provide an approximate translation of values from the SOP 03-1 basis to the IAS 39 basis, the table below shows estimates of the impact of changing each primary economic assumption from the SOP 03-1 values to the IAS 39 values.
Two other items are shown in addition: a reconciling item to account for the difference in how each method adjusts for emerging economic experience (labelled as the ‘method’ component below), and a further adjustment to recognise the impact of additional fees collected over and above those considered for reserving purposes (i.e. the difference between fees actually collected and the hypothetical fee assessment referenced earlier).

366
Prudential plc Annual Report 2010
ADDITIONAL UNAUDITED FINANCIAL INFORMATIONCONTINUED
FINANCIAL STATEMENTS > ADDITIONAL UNAUDITED FINANCIAL INFORMATION
III(a): MEMORANDUM FAIR VALUE OF JACKSON’S GMDB AND GMWB LIABILITIES > CONTINUED
Guaranteed benefit liability supplemental disclosure as of 31 December 2010
As recorded in the 31 December 2010 financial statements: NoteGMDB
£m
GMWB ‘for life’
£m
GMWB ‘not for life’
£mTotal
£m
– SOP 03-1 1 220 29 249– IAS 39 fair value 1 201 201
Total per 31 December 2010 financial statements 450 Change in assumed fund earned rate 2 375 25 n/a 400 Change in discount rate 3 200 50 n/a 250 Change in equity volatility assumption 4 225 0 n/a 225 Change in method 5 (150) (25) n/a (175)
700
Hypothetical IAS 39 basis fair value 6 870 280 1,150Adjustment to full fees 7 (200) (600) (800)
Hypothetical fair value with full fee recognition 8 670 (320) 350
Notes1 Note GMWB benefits have reported components on both an SOP 03-1 and IAS 39 basis.2 Change in fund earned rate: 8.4 per cent to 3.4 per cent, producing significantly higher values of future benefit payments due to lower future
assumed fund growth and therefore greater potential for future guaranteed benefit payouts. For GMWBs, future fee income is less dramatically affected, given that for most benefit forms fee income is based on a more stable benefit base rather than a current account value.
3 Change in discount rate: 8.4 per cent to 4.8 per cent, producing significantly higher values, both for future benefit payments and future fees, with a net increase in liability. The absolute impact of this item will be influenced not only by the rate difference, but also by current market conditions, as the proportional impact of a particular rate change will be diluted if applied to a lower absolute value of future cash flows.
4 Change in equity volatility assumption: 15 per cent to 24 per cent, producing higher values, primarily for future benefit payments. The impact is muted for GMWBs due primarily to the length of time until benefit payments occur, and also by the SOP 03-1 methodology itself.
5 Generally, it is expected that the SOP 03-1 methodology will ‘lag’ market events in terms of reflecting their impact in the reserve calculation. This is because of the retrospective aspect of the calculation described above. This line item is also the balancing item in the reconciliation so contains any cross-effects from other variables.
6 Representation of an approximate hypothetical IAS 39 (FAS 157) value were all guaranteed benefits to be reported on this basis.7 Value of actual fees collected, on an IAS 39 assumption basis, over and above those already considered in the reserve calculation. The reserve
calculation restricts the level of future guarantee fees to a level that is sufficient to meet the expected benefit payments at issue using at issue assumptions to avoid profit recognition at inception.
8 Resulting modified hypothetical IAS 39 value including adjustment for the value of fees in excess of those considered in the reserve calculation.
In all cases, values shown above, were they to be reflected in actual financial statements, would be significantly offset by an adjustment to deferred acquisition costs, which is impacted by changes in gross profit elements of the variable annuity product. Thus, for example, it might be expected that the GMDB impacts shown would be offset by some 70 to 75 per cent of the change illustrated, and the GMWB impacts shown would be offset by some 50 to 55 per cent of the change illustrated. The table below illustrates the approximate impact on shareholders’ equity.
Estimated impact on shareholders’ equity
Accounts carrying value
to hypothetical IAS 39 basis
fair value£m
Accounts carrying value
to hypothetical fair value
with full fee recognition
£m
Estimated increase/(decrease) in liability 700 (100)Related adjustments to: DAC (475) (50) Deferred tax (75) 50
Estimated decrease/(increase) in shareholders’ equity 150 (100)
All numbers rounded to the nearest £25 million.

367F
INA
NC
IAL
S
TA
TE
ME
NT
SA
DD
ITIO
NA
L U
NA
UD
ITE
D
FIN
AN
CIA
L IN
FO
RM
AT
ION
III(b): IFRS SHAREHOLDERS’ FUNDS SUMMARY BY BUSINESS UNIT AND NET ASSET VALUE PER SHARE
i Shareholders’ funds summary
2010 £m 2009 £m
ASIAN OPERATIONS Insurance operations Net assets of operation 1,913 1,382 Acquired goodwill 236 80 Total 2,149 1,462 Asset management Net assets of operation 197 161 Acquired goodwill 61 61 Total 258 222
Total 2,407 1,684
US OPERATIONS Jackson (net of surplus note borrowings) 3,815 3,011 Broker-dealer and asset management operations: Net assets of operation 106 95 Acquired goodwill 16 16 Total 122 111
Total 3,937 3,122
UK OPERATIONS Insurance operations: Long-term business operations 2,115 1,902 Other 33 37 Total 2,148 1,939M&G Net assets of operation 254 173 Acquired goodwill 1,153 1,153 Total 1,407 1,326
Total 3,555 3,265
OTHER OPERATIONS Holding company net borrowings (2,035) (1,754) Shareholders' share of provision for future deficit funding of the Prudential Staff Pension Scheme
(net of tax) (10) (16) Other net assets (liabilities) 177 (30)
Total (1,868) (1,800)
TOTAL OF ALL OPERATIONS 8,031 6,271
ii Net asset value per share
2010 £m 2009 £m
Closing equity shareholders' funds 8,031 6,271 Net asset value per share attributable to equity shareholdersnote i 315p 248p
Note i Based on the closing issued share capital as at 31 December 2010 of 2,546 million shares (2009: 2,532 million shares).

368
Prudential plc Annual Report 2010
ADDITIONAL UNAUDITED FINANCIAL INFORMATIONCONTINUED
FINANCIAL STATEMENTS > ADDITIONAL UNAUDITED FINANCIAL INFORMATION
IV(a): FUNDS UNDER MANAGEMENT
i Summary
2010 £bn 2009 £bn
Business area Asian operations 30.9 23.7 US operations 63.6 49.6 UK operations 145.2 135.6
Internal funds under management 239.7 208.9 External fundsnote i 100.4 80.9
Total funds under management 340.1 289.8
Notei External funds shown above for 2010 of £100.4 billion (2009: £80.9 billion) comprise £111.4 billion (2009: £89.8 billion) in respect of investment
products, as published in the New Business schedules (see Note B5) less £11.0 billion (2009: £8.9 billion) that are classified within internal funds.
ii Internal funds under management – analysis by business area
Asian operations US operations UK operations Total
2010 £bn
2009 £bn
2010 £bn
2009 £bn
2010 £bn
2009 £bn
2010 £bn
2009 £bn
Investment propertiesnote i – – 0.1 0.1 11.5 11.0 11.6 11.1 Equity securities 14.5 11.4 31.5 21.0 40.7 37.0 86.7 69.4 Debt securities 14.1 10.0 26.4 22.8 75.9 69.1 116.4 101.9 Loans and receivables 1.3 1.2 4.2 4.3 3.8 3.3 9.3 8.8 Other investments 1.0 1.1 1.4 1.4 13.3 15.2 15.7 17.7
Total 30.9 23.7 63.6 49.6 145.2 135.6 239.7 208.9
Notei As included in the investments section of the consolidated statement of financial position at 31 December 2010 except for £0.4 billion
(2009: £0.2 billion) investment properties which are held-for-sale or occupied by the Group and, accordingly under IFRS, are included in other statement of financial position captions.
IV(b): EFFECT OF FOREIGN CURRENCY RATE MOVEMENTS ON RESULTS
i Rates of exchangeThe profit and loss accounts of foreign subsidiaries are translated at average exchange rates for the year. Assets and liabilities of foreign subsidiaries are translated at closing exchange rates. Foreign currency borrowings that have been used to provide a hedge against Group equity investments in overseas subsidiaries are also translated at closing exchange rates. The impact of these translations is recorded as a component of the movement in shareholders’ equity.
The following translation rates have been applied:
Closing Average Closing Average
Local currency: £ 2010 2010 2009 2009
Hong Kong 12.17 12.01 12.52 12.14 Indonesia 14,106.51 14,033.41 15,171.52 16,173.28 Malaysia 4.83 4.97 5.53 5.51 Singapore 2.01 2.11 2.27 2.27 India 70.01 70.66 75.15 75.70Vietnam 30,526.26 29,587.63 29,832.74 27,892.39USA 1.57 1.55 1.61 1.57

369F
INA
NC
IAL
S
TA
TE
ME
NT
SA
DD
ITIO
NA
L U
NA
UD
ITE
D
FIN
AN
CIA
L IN
FO
RM
AT
ION
ii Effect of rate movements on resultsIFRS basis results
As published 2010
note i £m
Memorandum 2009
note i and ii £m
Asian operations: Long-term operations 536 451 Development expenses (4) (6)
Total Asian insurance operations after development costs 532 445 Asset management 72 58
Total Asia operations 604 503
US operations Jacksonnote iii 833 626 Broker-dealer, asset management and Curian operations 22 4
Total US operations 855 630
UK operations Long-term business 673 606 General insurance commission 46 51
Total UK insurance operations 719 657 M&G 284 238
Total UK operations 1,003 895
Total segment profit 2,462 2,028
Other income and expenditure (450) (396) Restructuring costs (26) (23) Solvency II costs (45) –
Operating profit from continuing operations based on longer-term investment returns 1,941 1,609
Shareholders’ funds 8,031 6,473
Notesi The ‘as published’ operating profit for 2010 and ‘memorandum’ operating profit for 2009 have been calculated by applying average 2010
exchange rates (CER). The ‘as published’ shareholders’ funds for 2010 and 'memorandum’ shareholders’ funds for 2009 have been calculated by applying closing
period end 2010 exchange rates.ii The 2009 operating profit of Asian long-term operations excludes the results of the Taiwan agency business for which the sale process was
completed in June 2009.iii The Company has amended the presentation of IFRS operating profit for its US insurance operations to remove the net equity hedge accounting
credit/charge (incorporating related amortisation of deferred acquisition costs) and include it in short-term fluctuations. The 2009 ‘memorandum’ operating profit amounts have been amended accordingly.

370
Prudential plc Annual Report 2010
ADDITIONAL UNAUDITED FINANCIAL INFORMATIONCONTINUED
FINANCIAL STATEMENTS > ADDITIONAL UNAUDITED FINANCIAL INFORMATION
IV(b): EFFECT OF FOREIGN CURRENCY RATE MOVEMENTS ON RESULTS > CONTINUED
EEV basis results
As published 2010
note i £m
Memorandum 2009
note i and ii £m
Asian operations: New business: Excluding Japan 902 783 Japan (1) (13)
Total 901 770 Business in force 549 420
Long-term operations 1,450 1,190 Asset management 72 58 Development expenses (4) (6)
Total Asia operations 1,518 1,242
US operations New business 761 673 Business in force 697 576
Jackson 1,458 1,249 Broker-dealer, asset management and Curian operations 22 4
Total US operations 1,480 1,253
UK operations New business 365 230 Business in force 571 640
Long-term business 936 870 General insurance commission 46 51
Total insurance 982 921 M&G 284 238
Total UK operations 1,266 1,159
Other income and expenditure (494) (434) Restructuring costs (28) (27) Solvency II costs (46) –
Operating profit from continuing operations based on longer-term investment returns 3,696 3,193
Shareholders’ funds 18,207 15,904
Notesi The ‘as published’ operating profit for 2010 and ‘memorandum’ operating profit for 2009 have been calculated by applying average 2010
exchange rates (CER). The ‘as published’ shareholders’ funds for 2010 and ‘memorandum’ shareholders’ funds for 2009 have been calculated by applying closing
period end 2010 exchange rates.ii The 2009 operating profit of Asian long-term operations excludes the results of the Taiwan agency business for which the sale process was
completed in June 2009.

371F
INA
NC
IAL
S
TA
TE
ME
NT
SA
DD
ITIO
NA
L U
NA
UD
ITE
D
FIN
AN
CIA
L IN
FO
RM
AT
ION
IV(c): OPTION SCHEMES
The Group maintains four share option schemes satisfied by the issue of new shares. UK-based executive directors are eligible to participate in the UK Savings Related Share Option Scheme, and Asia-based executives can participate in the International Savings Related Share Option Scheme. Dublin-based employees are eligible to participate in the Prudential International Assurance Sharesave Plan, and Hong Kong-based agents can participate in the Non-employee Savings Related Share Option Scheme. Further details of the schemes and accounting policies are detailed in Note I4 of the IFRS basis condensed consolidated financial statements.
All options were granted at £nil consideration. No options have been granted to substantial shareholders, suppliers of goods or services (excluding options granted to agents under the Non-employee Savings Related Share Option Scheme) or in excess of the individual limit for the relevant scheme.
The options schemes will terminate as follows, unless the directors resolve to terminate the plans at an earlier date:
• UK Savings Related Share Option Scheme: 8 May 2013• International Savings Related Share Option Scheme: 19 May 2011• Prudential International Assurance Sharesave Plan: 19 May 2011• Non-employee Savings Related Share Option Scheme: 9 May 2012
The weighted average share price of Prudential plc for the year ended 31 December 2010 was £5.68 (2009: £4.17).Particulars of options granted to directors are included in the Directors’ Remuneration Report on page 124.The closing price of the shares immediately before the dates on which the options were granted during the current period was £6.16.The following analyses show the movement in options for each of the option schemes for the year ended 31 December 2010.

372
Prudential plc Annual Report 2010
ADDITIONAL UNAUDITED FINANCIAL INFORMATIONCONTINUED
FINANCIAL STATEMENTS > ADDITIONAL UNAUDITED FINANCIAL INFORMATION
IV(c): OPTION SCHEMES > CONTINUED
UK Savings Related Share Option Scheme
Exercise period Number of options
Date of grantExercise
price £ Beginning EndBeginning
of period Granted Exercised Cancelled Forfeited LapsedEnd of period
09 Oct 2002 3.29 01 Dec 2009 31 May 2010 27,010 – 20,231 – – 6,779 –17 Apr 2003 2.66 01 Jun 2010 30 Nov 2010 273,250 – 273,250 – – – –01 Oct 2003 3.62 01 Dec 2010 31 May 2011 4,343 – 1,568 – – – 2,77515 Apr 2004 3.46 01 Jun 2009 30 Nov 2009 942 – – – – 942 –15 Apr 2004 3.46 01 Jun 2011 30 Nov 2011 17,946 – – – – – 17,94630 Sep 2004 3.43 01 Dec 2009 31 May 2010 15,014 – 6,543 – 191 8,280 –30 Sep 2004 3.43 01 Dec 2011 31 May 2012 8,430 – – – – – 8,43012 Apr 2005 3.87 01 Jun 2008 30 Nov 2008 8,121 – – 8,121 – – –12 Apr 2005 3.87 01 Jun 2010 30 Nov 2010 49,694 – 45,256 – – 4,438 –12 Apr 2005 3.87 01 Jun 2012 30 Nov 2012 12,222 – – – – – 12,22229 Sep 2005 4.07 01 Dec 2010 31 May 2011 37,483 – 26,426 – – 460 10,59729 Sep 2005 4.07 01 Dec 2012 31 May 2013 11,172 – – 1,680 – – 9,49220 Apr 2006 5.65 01 Dec 2009 31 May 2010 661 – 661 – – – –20 Apr 2006 5.65 01 Jun 2011 30 Nov 2011 15,933 – 678 569 – 802 13,88420 Apr 2006 5.65 01 Jun 2013 30 Nov 2013 8,169 – – 605 – – 7,56428 Sep 2006 4.75 01 Dec 2009 31 May 2010 83,095 – 42,821 21,690 – 18,584 –28 Sep 2006 4.75 01 Dec 2011 31 May 2012 55,381 – – 1,033 3,449 2,896 48,00328 Sep 2006 4.75 01 Dec 2013 31 May 2014 13,325 – – – – – 13,32526 Apr 2007 5.72 01 Jun 2010 30 Nov 2010 48,685 – 11,119 132 1,653 32,223 3,55826 Apr 2007 5.72 01 Jun 2012 30 Nov 2012 10,284 – – 1,374 – 573 8,33726 Apr 2007 5.72 01 Jun 2014 30 Nov 2014 1,118 – – 615 – – 50327 Sep 2007 5.52 01 Dec 2010 31 May 2011 53,257 – 25,015 1,874 695 640 25,03327 Sep 2007 5.52 01 Dec 2012 31 May 2013 19,960 – – 874 – 1,216 17,87027 Sep 2007 5.52 01 Dec 2014 31 May 2015 5,249 – – 2,653 928 – 1,66825 Apr 2008 5.51 01 Jun 2011 30 Nov 2011 63,326 – 3,187 5,145 2,455 1,587 50,95225 Apr 2008 5.51 01 Jun 2013 30 Nov 2013 35,835 – 1,595 3,128 – 2,892 28,22025 Apr 2008 5.51 01 Jun 2015 30 Nov 2015 4,836 – – – 3,166 – 1,67025 Sep 2008 4.38 01 Dec 2011 31 May 2012 181,003 – 4,055 9,642 1,140 12,168 153,99825 Sep 2008 4.38 01 Dec 2013 31 May 2014 62,042 – 2,054 4,207 765 5,980 49,03625 Sep 2008 4.38 01 Dec 2015 31 May 2016 23,161 – 2,341 – – 5,963 14,85727 Apr 2009 2.88 01 Jun 2012 30 Nov 2012 3,454,462 – 54,222 124,900 52,437 84,581 3,138,32227 Apr 2009 2.88 01 Jun 2014 30 Nov 2014 2,099,760 – 13,349 44,054 1,735 47,092 1,993,53027 Apr 2009 2.88 01 Jun 2016 30 Nov 2016 212,170 – 1,040 3,637 113 4,646 202,73425 Sep 2009 4.25 01 Dec 2012 31 May 2013 299,769 – 2,444 22,705 3,157 6,651 264,81225 Sep 2009 4.25 01 Dec 2014 31 May 2015 109,447 – 442 1,463 4,390 1,825 101,32728 Sep 2010 4.61 01 Dec 2013 31 May 2014 – 317,521 – 2,730 234 – 314,55728 Sep 2010 4.61 01 Dec 2015 31 May 2016 – 138,655 – 4,017 – – 134,638
7,326,555 456,176 538,297 266,848 76,508 251,218 6,649,860
The total number of securities available for issue under the scheme is 6,649,860, which represents 0.261 per cent of the issued share capital at 31 December 2010.
The weighted average closing price of the shares immediately before the dates on which the options were exercised during the current period was £5.70.
The fair value of options granted under the Plan in the period was £2.91.

373F
INA
NC
IAL
S
TA
TE
ME
NT
SA
DD
ITIO
NA
L U
NA
UD
ITE
D
FIN
AN
CIA
L IN
FO
RM
AT
ION
International Savings Related Share Option Scheme
Exercise period Number of options
Date of grantExercise
price £ Beginning EndBeginning
of period Granted Exercised Cancelled Forfeited LapsedEnd of period
30 Sep 2004 3.43 01 Dec 2009 31 May 2010 741 – – – – 741 –12 Apr 2005 3.87 01 Jun 2010 30 Nov 2010 758 – – – – – 75820 Apr 2006 5.65 01 Jun 2009 30 Nov 2009 5,732 – – – 4,021 1,711 –20 Apr 2006 5.65 01 Jun 2011 30 Nov 2011 820 – – – – – 82028 Sep 2006 4.75 01 Dec 2009 31 May 2010 26,951 – 20,387 – 4,435 2,129 –28 Sep 2006 4.75 01 Dec 2011 31 May 2012 968 – – – 259 – 70926 Apr 2007 5.72 01 Jun 2010 30 Nov 2010 93,401 – 3,179 1,612 – – 88,61026 Apr 2007 5.72 01 Jun 2012 30 Nov 2012 17,847 – – – – – 17,84727 Sep 2007 5.52 01 Dec 2010 31 May 2011 44,517 – 2,584 1,108 360 – 40,46525 Apr 2008 5.51 01 Jun 2011 30 Nov 2011 32,754 – – 5,686 – – 27,06825 Apr 2008 5.51 01 Jun 2013 30 Nov 2013 4,192 – – – – – 4,19225 Sep 2008 4.38 01 Dec 2011 31 May 2012 252,450 – 11,410 4,340 – – 236,70025 Sep 2008 4.38 01 Dec 2013 31 May 2014 6,951 – – – – – 6,95127 Apr 2009 2.88 01 Jun 2012 30 Nov 2012 2,105,236 – 47,332 83,676 68,123 – 1,906,10527 Apr 2009 2.88 01 Jun 2014 30 Nov 2014 116,072 – 6,490 14,246 5,307 – 90,02925 Sep 2009 4.25 01 Dec 2012 31 May 2013 141,426 – – 5,595 2,994 – 132,83725 Sep 2009 4.25 01 Dec 2014 31 May 2015 3,529 – – 847 – – 2,68228 Sep 2010 4.61 01 Dec 2013 31 May 2014 – 176,353 – 1,303 – – 175,05028 Sep 2010 4.61 01 Dec 2015 31 May 2016 – 6,501 – – – – 6,501
2,854,345 182,854 91,382 118,413 85,499 4,581 2,737,324
The total number of securities available for issue under the scheme is 2,737,324, which represents 0.108 per cent of the issued share capital at 31 December 2010.
The weighted average closing price of the shares immediately before the dates on which the options were exercised during the current period was £5.83.
The fair value of options granted under the Plan in the period was £2.91.
Prudential International Assurance Sharesave Plan
Exercise period Number of options
Date of grantExercise
price £ Beginning EndBeginning
of period Granted Exercised Cancelled Forfeited LapsedEnd of period
29 Sep 2005 4.07 01 Dec 2008 31 May 2009 495 – – – – 495 –20 Apr 2006 5.65 01 Jun 2009 30 Nov 2009 1,469 – – – – 1,469 –28 Sep 2006 4.75 01 Dec 2009 31 May 2010 1,110 – – – – 1,110 –27 Sep 2007 5.52 01 Dec 2010 31 May 2011 618 – – – – – 61825 Sep 2008 4.38 01 Dec 2011 31 May 2012 1,520 – – – – – 1,52027 Apr 2009 2.88 01 Jun 2012 30 Nov 2012 34,125 – 1,184 – 2,621 – 30,32027 Apr 2009 2.88 01 Jun 2014 30 Nov 2014 6,567 – – – – – 6,56725 Sep 2009 4.25 01 Dec 2012 31 May 2013 4,327 – – – 1,901 – 2,426
50,231 – 1,184 – 4,522 3,074 41,451
The total number of securities available for issue under the scheme is 41,451, which represents 0.002 per cent of the issued share capital at 31 December 2010.
The weighted average closing price of the shares immediately before the dates on which the options were exercised during the current period was £5.47.
The fair value of options granted under the Plan in the period was £2.91.
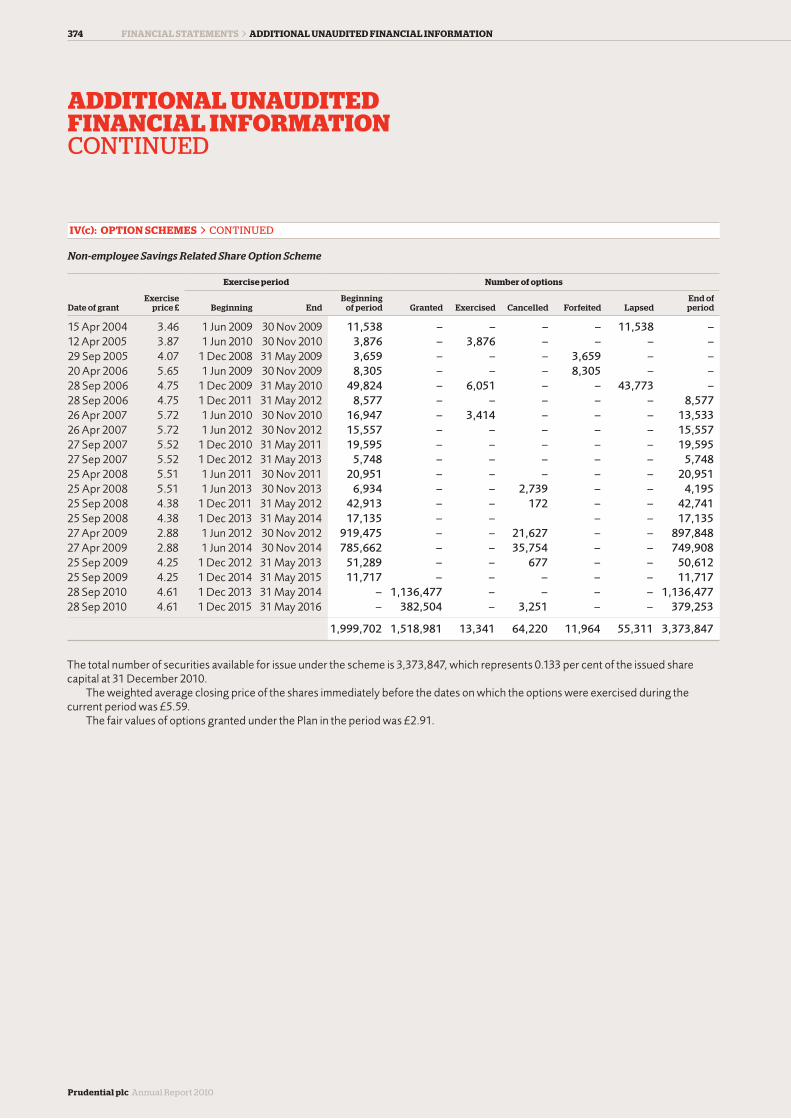
374
Prudential plc Annual Report 2010
ADDITIONAL UNAUDITED FINANCIAL INFORMATIONCONTINUED
FINANCIAL STATEMENTS > ADDITIONAL UNAUDITED FINANCIAL INFORMATION
IV(c): OPTION SCHEMES > CONTINUED
Non-employee Savings Related Share Option Scheme
Exercise period Number of options
Date of grantExercise
price £ Beginning EndBeginning
of period Granted Exercised Cancelled Forfeited LapsedEnd of period
15 Apr 2004 3.46 1 Jun 2009 30 Nov 2009 11,538 – – – – 11,538 –12 Apr 2005 3.87 1 Jun 2010 30 Nov 2010 3,876 – 3,876 – – – –29 Sep 2005 4.07 1 Dec 2008 31 May 2009 3,659 – – – 3,659 – –20 Apr 2006 5.65 1 Jun 2009 30 Nov 2009 8,305 – – – 8,305 – –28 Sep 2006 4.75 1 Dec 2009 31 May 2010 49,824 – 6,051 – – 43,773 –28 Sep 2006 4.75 1 Dec 2011 31 May 2012 8,577 – – – – – 8,57726 Apr 2007 5.72 1 Jun 2010 30 Nov 2010 16,947 – 3,414 – – – 13,53326 Apr 2007 5.72 1 Jun 2012 30 Nov 2012 15,557 – – – – – 15,55727 Sep 2007 5.52 1 Dec 2010 31 May 2011 19,595 – – – – – 19,59527 Sep 2007 5.52 1 Dec 2012 31 May 2013 5,748 – – – – – 5,74825 Apr 2008 5.51 1 Jun 2011 30 Nov 2011 20,951 – – – – – 20,95125 Apr 2008 5.51 1 Jun 2013 30 Nov 2013 6,934 – – 2,739 – – 4,19525 Sep 2008 4.38 1 Dec 2011 31 May 2012 42,913 – – 172 – – 42,74125 Sep 2008 4.38 1 Dec 2013 31 May 2014 17,135 – – – – 17,13527 Apr 2009 2.88 1 Jun 2012 30 Nov 2012 919,475 – – 21,627 – – 897,84827 Apr 2009 2.88 1 Jun 2014 30 Nov 2014 785,662 – – 35,754 – – 749,90825 Sep 2009 4.25 1 Dec 2012 31 May 2013 51,289 – – 677 – – 50,61225 Sep 2009 4.25 1 Dec 2014 31 May 2015 11,717 – – – – – 11,71728 Sep 2010 4.61 1 Dec 2013 31 May 2014 – 1,136,477 – – – – 1,136,47728 Sep 2010 4.61 1 Dec 2015 31 May 2016 – 382,504 – 3,251 – – 379,253
1,999,702 1,518,981 13,341 64,220 11,964 55,311 3,373,847
The total number of securities available for issue under the scheme is 3,373,847, which represents 0.133 per cent of the issued share capital at 31 December 2010.
The weighted average closing price of the shares immediately before the dates on which the options were exercised during the current period was £5.59.
The fair values of options granted under the Plan in the period was £2.91.

375F
INA
NC
IAL
S
TA
TE
ME
NT
SPA
RE
NT
CO
MPA
NY
BALANCE SHEET OF THE PARENT COMPANY
FINANCIAL STATEMENTS > PARENT COMPANY
31 December 2010 Note 2010 £m 2009 £m
FIXED ASSETS Investments: Shares in subsidiary undertakings 5 9,410 10,071 Loans to subsidiary undertakings 5 849 899
10,259 10,970
CURRENT ASSETS Debtors: Amounts owed by subsidiary undertakings 4,244 2,760 Deferred tax 345 180 Other debtors 6 7 Derivative assets 8 112 151 Cash at bank and in hand 162 360
4,869 3,458
LESS LIABILITIES: AMOUNTS FALLING DUE WITHIN ONE YEAR Commercial paper 7 (2,311) (2,031)Other borrowings 7 (200) (207)Derivative liabilities 8 (146) (136)Amounts owed to subsidiary undertakings (1,084) (1,279)Tax payable (169) (379)Sundry creditors (19) (4)Accruals and deferred income (59) (41)
(3,988) (4,077)
NET CURRENT ASSETS (LIABILITIES) 881 (619)
TOTAL ASSETS LESS CURRENT LIABILITIES 11,140 10,351
LESS LIABILITIES: AMOUNTS FALLING DUE AFTER MORE THAN ONE YEAR Subordinated liabilities 7 (2,718) (2,687)Debenture loans 7 (549) (549)Other borrowings 7 (249) –Amounts owed to subsidiary undertakings (3,398) (3,326)
(6,914) (6,562)
TOTAL NET ASSETS (EXCLUDING PENSION) 4,226 3,789 Pension asset (net of related deferred tax) 9 41 37
TOTAL NET ASSETS (INCLUDING PENSION) 4,267 3,826
CAPITAL AND RESERVES Share capital 10 127 127 Share premium 10 1,856 1,843 Profit and loss account 11 2,284 1,856
Shareholders’ funds 11 4,267 3,826
The financial statements of the parent company on pages 375 to 386 were approved by the Board of directors on 8 March 2011 and signed on its behalf.
HARVEY MCGRATHCHAIRMAN
TIDJANE THIAMGROUP CHIEF EXECUTIVE
NIC NICANDROUCHIEF FINANCIAL OFFICER

376
Prudential plc Annual Report 2010
NOTES ON THE PARENT COMPANY FINANCIAL STATEMENTS
FINANCIAL STATEMENTS > NOTES ON THE PARENT COMPANY FINANCIAL STATEMENTS
1: NATURE OF OPERATIONS
Prudential plc (the Company) is a parent holding company. The Company together with its subsidiaries (collectively, the Group) is an international financial services group with its principal operations in the UK, the US and Asia. The Group operates in the UK through its subsidiaries, primarily The Prudential Assurance Company Limited, Prudential Annuities Limited, Prudential Retirement Income Limited and M&G Investment Management Limited. In the US, the Group’s principal subsidiary is Jackson National Life Insurance Company. The Group also has operations in Hong Kong, Malaysia, Singapore, Indonesia and other Asian countries. The Company is responsible for the financing of each of its subsidiaries.
2: BASIS OF PREPARATION
The financial statements of the Company, which comprise the balance sheet and related notes, are prepared in accordance with Part 15 of the Companies Act 2006, which applies to companies generally. The Company has taken advantage of the exemption under Section 408 of the Companies Act 2006 from presenting its own profit and loss account.
The financial statements are prepared in accordance with applicable accounting standards under UK Generally Accepted Accounting Practice (UK GAAP), including Financial Reporting Standards (FRS) and Statements of Standard Accounting Practice (SSAP).
The Company has not prepared a cash flow statement on the basis that its cash flow is included within the cash flow statement in the consolidated financial statements. The Company has also taken advantage of the exemption within FRS 29, ‘Financial Instruments: Disclosures’, from the requirements of this standard on the basis that the Company’s results are included in the publicly available consolidated financial statements of the Group that include disclosures that comply with IFRS 7, ‘Financial Instruments: Disclosures’, which is equivalent to FRS 29.
The amendments to FRS 20 ‘Group cash settled share-based payment transactions’ which expanded FRS 2 to bring into scope group cash-settled share-based payment transactions became effective for the Company in 2010. These amendments incorporated the guidance in UITF 41, ‘Scope of FRS 20’ and UITF 44, ‘Group and Treasury Share Transactions’ which were withdrawn as a result. In particular, the amendments specify that the entity which has the obligation to settle the share-based payment arrangement shall recognise it as an ‘equity-settled transaction’ if it is settled in its own equity instruments and as ‘cash-settled transaction’ otherwise, no matter which entity in the Group receives the goods or service in the arrangement. The Company’s share-based payment accounting treatment prior to 2010 was consistent with these amendments and accordingly, there was no impact on the Company’s results and financial position upon the adoption of these amendments.
In addition, following the UK Government’s announcement in July 2010 of the use of the Consumer Price Index (CPI) rather than the Retail Price Index (RPI) in its determination of the statutory minimum pension increases for private sector occupational pension schemes, in December 2010, the ASB’s Urgent Issues Task Force (UITF) published its abstract UITF 48 providing guidance on the accounting implications of the change. See note 9 for further details.
Further, in 2010, the Company adopted the Improvements to Financial Reporting Standards 2009, the Amendment to FRS 25 ‘Financial Instruments: Presentation’ – Puttable Financial Instruments and Obligations Arising On Liquidation. Their adoption had no material impact on the financial statements of the Company.
3: SIGNIFICANT ACCOUNTING POLICIES
Shares in subsidiary undertakingsShares in subsidiary undertakings are shown at the lower of cost and estimated realisable value.
Loans to subsidiary undertakingsLoans to subsidiary undertakings are shown at cost, less provisions.
DerivativesDerivative financial instruments are used to reduce or manage interest rate and currency exposures. Derivative financial instruments are carried at fair value with changes in fair value included in the profit and loss account.
Under FRS 26, hedge accounting is permissible only if certain criteria are met regarding the establishment of documentation and continued measurement of hedge effectiveness. For derivative financial instruments designated as fair value hedges, the movements in the fair value are recorded in the profit and loss account with the accompanying change in fair value of the hedged item attributable to the hedged risk.
BorrowingsBorrowings are initially recognised at fair value, net of transaction costs, and subsequently accounted for on an amortised cost basis using the effective interest method. Under the effective interest method, the difference between the redemption value of the borrowing and the initial proceeds, net of transaction costs, is amortised through the profit and loss account to the date of maturity, or, for hybrid debt, over the expected life of the instrument.

377F
INA
NC
IAL
S
TA
TE
ME
NT
SPA
RE
NT
CO
MPA
NY
DividendsInterim dividends are recorded in the period in which they are paid. Final dividends are recorded in the period in which they are approved by shareholders.
Share premiumThe difference between the proceeds received on issue of shares and the nominal value of the shares issued is credited to the share premium account.
Foreign currency translationForeign currency borrowings that have been used to finance or provide a hedge against Group equity investments in overseas subsidiaries are translated at year-end exchange rates. The impact of these currency translations is recorded within the profit and loss account for the year.
Other assets and liabilities denominated in foreign currencies are also converted at year end exchange rates with the related foreign currency exchange gains or losses reflected in the profit and loss account for the year.
TaxCurrent tax expense is charged or credited to operations based upon amounts estimated to be payable or recoverable as a result of taxable operations for the current year. To the extent that losses of an individual UK company are not offset in any one year, they can be carried back for one year or carried forward indefinitely to be offset against profits arising from the same company.
Deferred tax assets and liabilities are recognised in accordance with the provisions of FRS 19. The Company has chosen not to apply the option available of recognising such assets and liabilities on a discounted basis to reflect the time value of money. Except as set out in FRS 19, deferred tax is recognised in respect of all timing differences that have originated but not reversed by the balance sheet date. Deferred tax assets are recognised to the extent that it is regarded as more likely than not that they will be recovered.
The Group’s UK subsidiaries each file separate tax returns. In accordance with UK tax legislation, where one domestic UK company is a 75 per cent owned subsidiary of another UK company or both are 75 per cent owned subsidiaries of a common parent, the companies are considered to be within the same UK tax group. For companies within the same tax group, trading profits and losses arising in the same accounting period may be offset for the purposes of determining current and deferred taxes.
PensionsThe Company assumes a portion of the pension surplus or deficit of the Group’s largest pension scheme, the Prudential Staff Pension Scheme (PSPS) and applied the requirements of FRS 17 (as amended in December 2006) to its interest in the PSPS surplus or deficit. Further details are disclosed in note 9.
A pension surplus or deficit is recorded as the difference between the present value of the scheme liabilities and the fair value of the scheme assets. The Company’s share of pension surplus is recognised to the extent that the Company is able to recover a surplus either through reduced contributions in the future or through refunds from the scheme.
The assets and liabilities of the defined benefit pension schemes of the Prudential Group are subject to a full triennial actuarial valuation using the projected unit method. Estimated future cash flows are then discounted at a high quality corporate bond rate, adjusted to allow for the difference in duration between the bond index and the pension liabilities where appropriate, to determine its present value. These calculations are performed by independent actuaries.
The aggregate of the actuarially determined service costs of the currently employed personnel and the unwind of the discount on liabilities at the start of the period, gains and losses on settlements and curtailments, less the expected investment return on the scheme assets at the start of the period, is recognised in the profit and loss account. To the extent that part or all of the Company’s interest in the pension surplus is not recognised as an asset, the unrecognised surplus is initially applied to extinguish any past service costs, losses on settlements or curtailments that would otherwise be included in the profit and loss account. Next, the expected investment return on the scheme’s assets is restricted so that it does not exceed the total of the current service cost, interest cost and any increase in the recoverable surplus. Any further adjustment for the unrecognised surplus is treated as an actuarial gain or loss.
Actuarial gains and losses as a result of the changes in assumptions, the difference between actual and expected investment return on scheme assets and experience variances are recorded in the statement of total recognised gains and losses. Actuarial gains and losses also include adjustment for unrecognised pension surplus as described above.
Share-based paymentsThe Group offers share award and option plans for certain key employees and a SAYE plan for all UK and certain overseas employees. The share-based payment plans operated by the Group are mainly equity-settled plans with a few cash-settled plans.
Under FRS 20, where the Company, as the parent company, has the obligation to settle the options or awards of its equity instruments to employees of its subsidiary undertakings, and such share-based payments are accounted for as equity-settled in the Group financial statements, the Company records an increase in the investment in the subsidiary undertakings for the value of the share options and awards granted with a corresponding credit entry recognised directly in equity. The value of the share options and awards granted is based upon the fair value of the options and awards at the grant date, the vesting period and the vesting conditions.

378
Prudential plc Annual Report 2010
NOTES ON THE PARENT COMPANY FINANCIAL STATEMENTSCONTINUED
FINANCIAL STATEMENTS > NOTES ON THE PARENT COMPANY FINANCIAL STATEMENTS
4: RECONCILIATION FROM UK GAAP TO IFRS
The Company financial statements are prepared in accordance with UK GAAP and the consolidated financial statements are prepared in accordance with IFRS as issued by the IASB and endorsed by the EU. The tables below provide a reconciliation between UK GAAP and IFRS.
2010 £m 2009 £m
PROFIT AFTER TAX Profit for the financial year of the Company in accordance with UK GAAP 881 913IFRS adjustment (8) (5)
Profit for the financial year of the Company (including dividends from subsidiaries) in accordance with IFRS 873 908
Share in the IFRS profit (loss) of the Group, net of distributions to the Company 558 (232)
PROFIT AFTER TAX OF THE GROUP ATTRIBUTABLE TO SHAREHOLDERS IN ACCORDANCE WITH IFRS 1,431 676
2010 £m 2009 £m
NET EQUITY Shareholders’ equity of the Company in accordance with UK GAAP 4,267 3,826 IFRS adjustment (51) (53)
Shareholders’ equity of the Company in accordance with IFRS 4,216 3,773 Share in the IFRS net equity of the Group 3,815 2,498
SHAREHOLDERS’ EQUITY OF THE GROUP IN ACCORDANCE WITH IFRS 8,031 6,271
The profit for the financial year of the Company in accordance with UK GAAP and IFRS includes dividends declared in the year from subsidiary undertakings of £1,318 million and £1,039 million for the years ended 31 December 2010 and 2009, respectively.
The ‘IFRS adjustment’ lines in the above tables represent the difference in the accounting treatment for pension schemes between UK GAAP and IFRS. Under UK GAAP, the parent company’s interest in the surplus of one of the pension schemes recognised on the balance sheet represents the element which is recoverable through reduced future contributions. Under IFRS, as the terms of the relevant trust deed restrict shareholders’ access to any underlying surplus, not only is the underlying IAS 19 basis surplus not recognised, but the Company’s share of the obligation for deficit funding has also to be recognised on the balance sheet.
The shares in the IFRS profit and net equity of the Group represent the Company’s equity in the earnings and net assets of its subsidiaries and associates.
As stated in note 3, under UK GAAP, the Company accounts for its investments in subsidiary undertakings at the lower of cost and estimated realisable value. For the purpose of this reconciliation, no adjustment is made to the Company in respect of any valuation adjustments to shares in subsidiary undertakings which would be eliminated on consolidation.

379F
INA
NC
IAL
S
TA
TE
ME
NT
SPA
RE
NT
CO
MPA
NY
5: INVESTMENTS OF THE COMPANY
2010 £m
Shares in subsidiary
undertakings
Loans to subsidiary
undertakings
At 1 January 10,071 899 Transfer of investment in subsidiary undertaking (667) – Additional investment in subsidiary undertakings 6 – Foreign exchange movement – 16 Loan repayment – (66)
At 31 December 9,410 849
The transfer of investment in subsidiary undertaking relates to the sale of shares in a central finance subsidiary to another such company. The additional investment in subsidiary undertakings relates to share-based payments reflecting the value of payments settled by
the Company for the employees of its subsidiary undertakings in 2010.
6: SUBSIDIARY UNDERTAKINGS
The principal subsidiary undertakings of the Company at 31 December 2010, all wholly-owned, were:
Main activity Country of incorporation
The Prudential Assurance Company Limited Insurance England and WalesPrudential Annuities Limited* Insurance England and WalesPrudential Retirement Income Limited (PRIL)* Insurance ScotlandM&G Investment Management Limited* Asset management England and WalesJackson National Life Insurance Company* Insurance USPrudential Assurance Company Singapore (Pte) Limited* Insurance Singapore
* Owned by a subsidiary undertaking of the Company.
Each subsidiary has one class of ordinary shares and operates mainly in its country of incorporation, except for PRIL which operates mainly in England and Wales.
Details of all Prudential subsidiaries, joint ventures and associates will be annexed to the Company’s next Annual Returns filed with the UK Registrar of Companies and the Registrar of Companies in Hong Kong.

380
Prudential plc Annual Report 2010
NOTES ON THE PARENT COMPANY FINANCIAL STATEMENTSCONTINUED
FINANCIAL STATEMENTS > NOTES ON THE PARENT COMPANY FINANCIAL STATEMENTS
7: BORROWINGS
Core structural borrowings Other borrowings Total
2010 £m 2009 £m 2010 £m 2009 £m 2010 £m 2009 £m
Core structural borrowings: ¤500m 5.75% Subordinated Notes 2021note i 428 443 – – 428 443 £300m 6.875% Bonds 2023 300 300 – – 300 300 ¤20m Medium-Term Subordinated Notes 2023note ii 17 18 – – 17 18 £250m 5.875% Bonds 2029 249 249 – – 249 249 £435m 6.125% Subordinated Notes 2031 428 428 – – 428 428 £400m 11.375% Subordinated Notes 2039 382 380 – – 382 380 US$1,000m 6.5% Perpetual Subordinated Capital Securities 639 619 – – 639 619 US$250m 6.75% Perpetual Subordinated Capital Securitiesnote iii 160 155 – – 160 155 US$300m 6.5% Perpetual Subordinated Capital Securitiesnotes iii, iv 192 188 – – 192 188 US$750m 11.75% Perpetual Subordinated Capital Securities 472 456 – – 472 456
Total core structural borrowings 3,267 3,236 – – 3,267 3,236 Other borrowings: Commercial papernote v – – 2,311 2,031 2,311 2,031 Medium-Term Notes 2010 – – – 7 – 7 Floating Rate Notes 2011note vi – – 200 200 200 200 Medium-Term Notes 2013note v – – 249 – 249 –
Total borrowings 3,267 3,236 2,760 2,238 6,027 5,474
Borrowings are repayable as follows: Within 1 year or on demand – – 2,511 2,238 2,511 2,238 Between 1 and 5 years – – 249 – 249 – After 5 years 3,267 3,236 – – 3,267 3,236
3,267 3,236 2,760 2,238 6,027 5,474
Recorded in the balance sheet as: Subordinated liabilitiesnote vii 2,718 2,687 Debenture loans 549 549
3,267 3,236
Notesi The €500 million 5.75 per cent borrowings have been swapped into borrowings of £333 million with interest payable at six month £LIBOR plus
0.962 per cent.ii The €20 million borrowings were issued at 20-year Euro Constant Maturity Swap (capped at 6.5 per cent). These borrowings have been swapped
into borrowings of £14 million with interest payable at three month £LIBOR plus 1.2 per cent.iii The US$250 million 6.75 per cent borrowings and the US$300 million 6.5 per cent borrowings can be converted, in whole or in part, at the
Company’s option and subject to certain conditions, on any interest payment date falling on or after 23 March 2010 and 23 March 2011, respectively into one or more series of Prudential preference shares.
iv Interest on the US$300 million 6.5 per cent borrowings was swapped into floating rate payments but, in 2008, swapped back into fixed rate payments of 6.5 per cent until September 2010. Upon the maturity of the floating to fixed swap in September 2010, the fixed to floating swap was also cancelled. Hedge accounting was applied at both the Group consolidated level and Company level until the cancellation of the fixed to floating interest rate of swap of the US$300 million 6.5 per cent borrowings in September 2010. Due to different dates of commencement of this accounting treatment, the hedge values differed between these two levels.
v These borrowings support a short-term fixed income securities programme.vi The Company issued £200 million Floating Rate Notes in 2010 which mature in April 2011. All Notes have been subscribed to by a Group
subsidiary and accordingly have been eliminated on consolidation in the Group financial statements. These Notes were originally issued in October 2008 and have been reissued upon their maturity.
vii The interests of the holders of the Subordinated Notes and the Subordinated Capital Securities are subordinate to the entitlements of other creditors of the Company.

381F
INA
NC
IAL
S
TA
TE
ME
NT
SPA
RE
NT
CO
MPA
NY
8: DERIVATIVE FINANCIAL INSTRUMENTS
2010 £m 2009 £m
Fair value assets
Fair value liabilities
Fair value assets
Fair value liabilities
Derivative financial instruments held to manage interest rate and currency profile:
Interest rate swaps 13 – 33 8 Cross-currency swaps 99 – 118 – Inflation-linked swap – 146 – 128
Total 112 146 151 136
The change in fair value of the derivative financial instruments of the Company was a loss before tax of £33 million (2009: gain before tax of £83 million).
The Company had a US$300 million fair value hedge in place which hedged the interest rate exposure on the US$300 million 6.5 per cent perpetual subordinated capital securities until the hedge was cancelled in September 2010.
The derivative financial instruments are valued internally using standard market practices. In accordance with the Company’s risk management framework, all internally generated valuations are subject to independent assessment against external counterparties’ valuations.
9: PENSION SCHEME FINANCIAL POSITION
The majority of UK Prudential staff are members of the Group’s pension schemes. The largest scheme is the Prudential Staff Pension Scheme (the ‘Scheme’) which is primarily a closed defined benefit scheme. At 31 December 2010, on the FRS 17, ‘Retirement Benefits’ basis of valuation, the underlying pension liabilities of the Scheme accounted for 86 per cent (2009: 86 per cent) of the liabilities of the Group’s defined benefit schemes.
For the purpose of preparing consolidated financial statements, the Group applies IFRS basis accounting including IAS 19, ‘Employee Benefits’. However, the individual accounts of the Company continue to follow UK GAAP including FRS 17. The FRS 17 disclosures are aligned with IAS 19. Under IFRS, the Group applies IFRIC 14, interpretation guidance to IAS 19 with the effect of derecognising the Group’s interest in the Scheme’s surplus and recognising an additional liability for the deficit funding obligation for the Scheme in the Group financial statements. Further details are described in note I3 ‘Staff and pension plans’ of the notes on the financial statements of the Group.
At 31 December 2005, the allocation of surpluses and deficits attaching to the Scheme between the Company and the unallocated surplus of the Prudential Assurance Company’s (PAC) with-profits funds was apportioned in the ratio 30/70 between the Company and the PAC with-profits fund following detailed consideration of the sourcing of previous contributions. This ratio was applied to the base deficit position at 1 January 2006 and for the purpose of determining the allocation of the movements in that position up to 31 December 2010. The FRS 17 service charge and ongoing employer contributions are allocated by reference to the cost allocation for current activity.
Defined benefit schemes are generally required to be subject to full actuarial valuation every three years to assess the appropriate level of funding for schemes having regard to their commitments. These valuations include assessments of the likely rate of return on the assets held within the separate trustee administered funds. The Scheme was last actuarially valued as at 5 April 2008 using the projected unit method. The next triennial valuation of the Scheme is scheduled to take place as at 5 April 2011.
The 2008 valuation demonstrated the Scheme to be 106 per cent funded by reference to the Scheme Solvency Target that forms the basis of the Scheme’s statutory funding objective. Accordingly, the total contributions to be made by the Group to the Scheme, representing the annual accrual cost and deficit funding, were reduced from the previous arrangement of £70-£75 million per annum to £50 million per annum effective from 1 July 2009. As the Scheme was in a surplus position at the valuation date, no formal recovery plan was required. However, recognising that there had been a significant deterioration in the value of the Scheme’s assets from 5 April 2008 to the date of the finalisation of the valuation, an additional funding akin to deficit funding was agreed with the Scheme Trustees subject to a reassessment when the next valuation is completed.
In 2010, total contributions for the year, including expenses and augmentations, were £55 million (2009: £67 million).Using external actuarial advice provided by the professionally qualified actuaries, Towers Watson, for the valuation of the Scheme,
the most recent full valuations have been updated to 31 December 2010 applying the principles prescribed by FRS 17.

382
Prudential plc Annual Report 2010
NOTES ON THE PARENT COMPANY FINANCIAL STATEMENTS CONTINUED
FINANCIAL STATEMENTS > NOTES ON THE PARENT COMPANY FINANCIAL STATEMENTS
9: PENSION SCHEME FINANCIAL POSITION > CONTINUED
The key assumptions adopted were:
2010 % 2009 %
Rate of inflation 3.55 3.7 Rate of increase in salaries 5.55 5.7 Rate of increase in pension payments for inflation: Guaranteed (maximum 5%) 3.55 3.7 Guaranteed (maximum 2.5%) 2.5 2.5 Discretionary 2.5 2.5 Rate used to discount Scheme liabilities 5.45 5.8
Long-term expected rate of return:
Prospectivelyfor 2011 % 2010 % 2009 %
Equities 8.2 8.5 6.8 Bonds 4.6 5.3 4.8 Properties 6.9 6.75 6.1 Other assets 4.75 4.75 2.0
Weighted average long-term expected rate of return 5.1 5.9 4.5
The long-term expected rates of return have been determined after applying due consideration to the requirements of paragraph 54 of FRS 17, in particular, taking account of the values of the assets.
In July 2010, the UK Government announced plans to use the Consumer Price Index (CPI) in place of the Retail Price Index (RPI) in its determination of the statutory minimum pension increases for private sector occupational pension schemes. In December 2010, the Government published the statutory revaluation order for 2011 which confirms the change to use CPI. In addition, the Government has also published in December 2010 a consultation paper which sets out the Government’s views on the impact that the switch from RPI to CPI will have on the private sector occupational pension schemes. The consultation period closed on 2 March 2011.
Only those tranches of the Scheme which are subject to statutory increases in accordance with the Scheme rules may be affected by the Government’s decision to change the indexation from RPI to CPI. Other tranches of the Scheme are unaffected.
In line with the guidance of UITF 48, the above has no impact on the results for the year ended 31 December 2010. For the Government’s announcement to have had an effect on the 2010 results, it would have been necessary for communication of the altered arrangement to have been made to the members of the schemes for which benefits are paid by reference to RPI, as a constructive obligation. No such communication has been completed. Accordingly, the Company has not recognised this change for the year ended 31 December 2010. The impact of the change, if and when made, will be recognised in a future period. However, as the Company is only able to recognise a restricted FRS 17 surplus for the Scheme, any reduction in the underlying Scheme liabilities has no effect on the profit or shareholders’ funds of the Company.
Further details of the Scheme, including mortality assumptions, are shown in note I3 ‘Staff and pension plans’ of the notes on the financial statements of the Group.

383F
INA
NC
IAL
S
TA
TE
ME
NT
SPA
RE
NT
CO
MPA
NY
The assets and liabilities of the Scheme were:
31 Dec 2010 31 Dec 2009 31 Dec 2008 31 Dec 2007 31 Dec 2006
£m % £m % £m % £m % £m %
Equities 548 10.3 830 16.8 823 17.1 1,278 26.1 1,346 28.3 Bonds 3,864 72.2 3,406 68.8 2,430 50.6 1,134 23.2 2,077 43.8 Properties 199 3.7 272 5.5 283 5.9 545 11.2 580 12.2 Cash-like investments 740 13.8 441 8.9 1,267 26.4 1,932 39.5 745 15.7
Total value of assets 5,351 100.0 4,949 100.0 4,803 100.0 4,889 100.0 4,748 100.0 Present value of Scheme liabilities 4,866 4,436 4,075 4,361 4,607
Underlying surplus in the Scheme 485 513 728 528 141
Surplus in the Scheme recognised by the Company 56 52 50 163 48
Amount reflected in the balance sheet of the Company, net of deferred tax 41 37 36 117 34
The surplus in the Scheme recognised in the balance sheet of the Company represents the element of the amount which is recoverable through reduced future contributions and is net of the apportionment to the PAC with-profits fund.
Underlying Scheme liabilities and assetsThe change in the present value of the underlying Scheme liabilities and the change in the fair value of the underlying Scheme assets are as follows:
2010 £m 2009 £m
Present value of Scheme liabilities, at 1 January 4,436 4,075 Service costs 25 23 Interest costs 251 242 Employee contributions 1 2 Actuarial losses 369 315 Benefit payments (216) (221)
Present value of Scheme liabilities, at 31 December 4,866 4,436
2010 £m 2009 £m
Fair value of Scheme assets, at 1 January 4,949 4,803 Expected return on Scheme assets 287 213 Employee contributions 1 2 Employer contributions* 55 67 Actuarial gains 275 85 Benefit payments (216) (221)
Fair value of Scheme assets, at 31 December 5,351 4,949
* The contributions include deficit funding, ongoing service contributions, expenses and augmentations.

384
Prudential plc Annual Report 2010
NOTES ON THE PARENT COMPANY FINANCIAL STATEMENTSCONTINUED
FINANCIAL STATEMENTS > NOTES ON THE PARENT COMPANY FINANCIAL STATEMENTS
9: PENSION SCHEME FINANCIAL POSITION > CONTINUED
Pension credit (charge) and actuarial (losses) gains of the SchemeThe pension credit (charge) recognised in the Company’s profit and loss account is as follows:
Pension credit (charge): 2010 £m 2009 £m
Operating charge: Service costs (25) (23)Finance income (expense): Interest on Scheme liabilities (251) (242) Expected return on Scheme assets 287 213 36 (29)
Total pension credit (charge) of the Scheme 11 (52)
Pension charge attributable to the Company (6) (25)
The pension charge attributable to the Company is net of the apportionment to the PAC with-profits fund and is related to the surplus recognised on the balance sheet of the Company.
2010 £m 2009 £m 2008 £m 2007 £m 2006 £m
Actuarial gains (losses): Actual less expected return on Scheme assets (5% (2009: 2%)
(2008: 5%) (2007: 0%) (2006: 3%) of assets) 275 85 (259) (12) 141 Experience gains (losses) on Scheme liabilities (0% (2009: 1%)
(2008: 3%) (2007: 0%) (2006: 0%) of liabilities) 1 59 127 (10) 17 Changes in assumptions underlying the present value of
Scheme liabilities (370) (374) 200 324 232
Total actuarial (losses) gains (2% (2009: 5%) (2008: 2%) (2007: 7%) (2006: 8%) of Scheme liabilities) (94) (230) 68 302 390
Actuarial (losses) gains attributable to the Company (14) (3) (143) 91 118
The total actual return on Scheme assets was a gain of £562 million (2009: £298 million).The experience gains on Scheme liabilities in 2008 of £127 million related mainly to the ‘true-up’ reflecting improvements in data
consequent upon the 2008 triennial valuation.The actuarial gains (losses) attributable to the Company are net of the apportionment to the PAC with-profits fund and are related
to the surplus recognised in the balance sheet of the Company. In 2010, the actuarial losses attributable to the Company included an amount credited of £14 million (2009: £66 million) for the adjustment to the unrecognised portion of surplus which has not been deducted from the pension charge.
The actuarial losses before tax of £14 million (2009: £3 million) attributable to the Company are recorded in the statement of total recognised gains and losses. Cumulative actuarial gains as at 31 December 2010 amount to £74 million (2009: £88 million).
Total employer contributions expected to be paid into the Scheme for the year ending 31 December 2011 amount to £54 million, reflecting the annual accrual cost and deficit funding, and expenses.

385F
INA
NC
IAL
S
TA
TE
ME
NT
SPA
RE
NT
CO
MPA
NY
10: SHARE CAPITAL AND SHARE PREMIUM
A summary of the ordinary shares in issue is set out below:
2010
Issued shares of 5 pence each fully paid
Number of ordinary
shares
Share capital
£m
Share premium
£m
At 1 January 2,532,227,471 127 1,843 Shares issued under share option schemes 2,455,227 – 13 Shares issued in lieu of cash dividends 10,911,808 – 62 Reserve movements in respect of shares issued in lieu of cash dividends – – (62)
At 31 December 2,545,594,506 127 1,856
At 31 December 2010, there were options to subscribe for 12,802,482 (2009: 12,230,833) shares at prices ranging from 288 pence to 572 pence (2009: 266 pence to 572 pence) and exercisable by the year 2016 (2009: 2016). Further information on the Group’s employee share options is given in note I4 ‘Share-based payments’ of the notes on the financial statements of the Group.
11: PROFIT OF THE COMPANY AND RECONCILIATION OF THE MOVEMENT IN SHAREHOLDERS’ FUNDS
The profit after tax of the Company for the year was £881 million (2009: £913 million). After dividends of £511 million (2009: £481 million), actuarial losses net of tax in respect of the pension scheme of £10 million (2009: £2 million), share-based payment credits of £6 million (2009: £10 million) and scrip dividends of £62 million (2009: £136 million), retained profit at 31 December 2010 amounted to £2,284 million (2009: £1,856 million).
A reconciliation of the movement in shareholders’ funds of the Company for the years ended 31 December 2010 and 2009 is given below:
2010 £m 2009 £m
Profit for the year note 4 881 913Dividends (511) (481)
370 432Actuarial losses recognised in respect of the pension scheme net of related taxnote 9 (10) (2)Share-based paymentsnote 5 6 10New share capital subscribednote 10 75 141
Net increase in shareholders’ funds 441 581Shareholders’ funds at beginning of year 3,826 3,245
Shareholders’ funds at end of year 4,267 3,826

386
Prudential plc Annual Report 2010
FINANCIAL STATEMENTS > NOTES ON THE PARENT COMPANY FINANCIAL STATEMENTS
12: OTHER INFORMATION
a Information on directors’ remuneration is given in the directors’ remuneration report section of this Annual Report and note I5 ‘Key management remuneration’ of the notes on the financial statements of the Group.
b Information on transactions of the directors with the Group is given in note I7 ‘Related party transactions’ of the notes on the financial statements of the Group.
c The Company employs no staff.d Fees payable to the Company’s auditor for the audit of the Company’s annual accounts were £0.1 million (2009: £0.1 million).
In addition, the Company paid fees for other services of £6.0 million (2009: £0.2 million). e In certain instances the Company has guaranteed that its subsidiaries will meet their obligations when they fall due for payment.
13: POST BALANCE SHEET EVENTS
In January 2011, the Company issued US$550 million 7.75% Tier 1 subordinated debt, primarily to retail investors. The proceeds, net of costs, were US$539 million and are intended to finance the repayment of the ¤500m Tier 2 subordinated debt in December 2011.
Following the Board’s decision to rebase the dividend upwards and subject to shareholders’ approval, a final dividend for 2010 of 17.24 pence per ordinary share will be paid on 26 May 2011 in sterling to shareholders on the principal and Irish branch registers at 6.00pm BST on Friday, 1 April 2011 (the Record Date), and in Hong Kong dollars to shareholders on the Hong Kong branch register at 4.30pm Hong Kong time on the Record Date (HK Shareholders).
Holders of US American Depositary Receipts will be paid their dividend in US dollars on or about five days after the payment date of the dividend to shareholders on the principal register. The dividend will be paid on or about 2 June 2011 in Singapore dollars to shareholders with shares standing to the credit of their securities accounts with The Central Depository (Pte) Limited (CDP) at 5.00pm Singapore time on the Record Date (SG Shareholders).
The dividend payable to the HK Shareholders will be translated at the exchange rate ruling at the close of business on 8 March 2011. The exchange rate at which the dividend payable to the SG Shareholders will be translated will be determined by the CDP.
The dividend will distribute an estimated £439 million of shareholders’ funds. The scrip dividend alternative is not being offered in respect of this dividend. In its place, shareholders will be offered a Dividend Reinvestment Plan (DRIP).
NOTES ON THE PARENT COMPANY FINANCIAL STATEMENTSCONTINUED

387F
INA
NC
IAL
S
TA
TE
ME
NT
S
DIR
EC
TO
RS’
RE
SPO
NSIB
ILIT
IES/
AU
DIT
OR
’S RE
PO
RT
FINANCIAL STATEMENTS > STATEMENT OF DIRECTORS’ RESPONSIBILITIES
The directors are responsible for preparing the Annual Report and the Group and parent company financial statements in accordance with applicable law and regulations.
Company law requires the directors to prepare Group and parent company financial statements for each financial year. Under that law the directors are required to prepare the Group financial statements in accordance with International Financial Reporting Standards (IFRS) as adopted by the European Union (EU) and applicable law and have elected to prepare the parent company financial statements in accordance with UK Accounting Standards and applicable law (UK Generally Accepted Accounting Practice).
Under company law the directors must not approve the financial statements unless they are satisfied that they give a true and fair view of the state of affairs of the Group and parent company and of their profit or loss for that period. In preparing each of the Group and parent company financial statements, the directors are required to:
• Select suitable accounting policies and then apply them consistently;
• make judgements and estimates that are reasonable and prudent;
• for the Group financial statements, state whether they have been prepared in accordance with IFRS as adopted by the EU;
• for the parent company financial statements, state whether applicable UK Accounting Standards have been followed, subject to any material departures disclosed and explained in the parent company financial statements; and
• prepare the financial statements on the going concern basis unless it is inappropriate to presume that the Group and the parent company will continue in business.
The directors are responsible for keeping adequate accounting records that are sufficient to show and explain the parent company’s transactions and disclose with reasonable accuracy at any time the financial position of the parent company and enable them to ensure that its financial statements comply with the Companies Act 2006. They have general responsibility for taking such steps as are reasonably open to them to safeguard the assets of the Group and to prevent and detect fraud and other irregularities.
Under applicable law and regulations, the directors are also responsible for preparing a directors’ report, directors’ remuneration report and corporate governance statement that comply with that law and those regulations.
The directors are responsible for the maintenance and integrity of the corporate and financial information included on the Company’s website. Legislation in the UK governing the preparation and dissemination of financial statements may differ from legislation in other jurisdictions.
The directors of Prudential plc, whose names and positions are set out on pages 100 to 103 confirm that to the best of their knowledge:
• The financial statements, prepared in accordance with the applicable set of accounting standards, give a true and fair view of the assets, liabilities, financial position and profit or loss of the Company and the undertakings included in the consolidation taken as a whole; and
• the directors’ report includes a fair review of the development and performance of the business and the position of the Company and the undertakings included in the consolidation taken as a whole, together with a description of the principal risks and uncertainties that they face.
STATEMENT OF DIRECTORS’ RESPONSIBILITIES IN RESPECT OF THE ANNUAL REPORT AND THE FINANCIAL STATEMENTS
388
Prudential plc Annual Report 2010
We have audited the financial statements of Prudential plc for the year ended 31 December 2010 set out on pages 153 to 352 and 375 to 386. The financial reporting framework that has been applied in the preparation of the group financial statements is applicable law and International Financial Reporting Standards (IFRSs) as adopted by the EU. The financial reporting framework that has been applied in the preparation of the parent company financial statements is applicable law and UK Accounting Standards (UK Generally Accepted Accounting Practice).
This report is made solely to the Company’s members, as a body, in accordance with Chapter 3 of Part 16 of the Companies Act 2006. Our audit work has been undertaken so that we might state to the Company’s members those matters we are required to state to them in an auditor’s report and for no other purpose. To the fullest extent permitted by law, we do not accept or assume responsibility to anyone other than the Company and the Company’s members, as a body, for our audit work, for this report, or for the opinions we have formed.
Respective responsibilities of directors and auditorAs explained more fully in the Directors’ Responsibilities Statement set out on page 387, the directors are responsible for the preparation of the financial statements and for being satisfied that they give a true and fair view. Our responsibility is to audit, and express an opinion on, the financial statements in accordance with applicable law and International Standards on Auditing (UK and Ireland). Those standards require us to comply with the Auditing Practices Board’s (APB’s) Ethical Standards for Auditors.
Scope of the audit of the financial statementsA description of the scope of an audit of financial statements is provided on the APB’s website at www.frc.org.uk/apb/scope/private.cfm
Opinion on financial statementsIn our opinion:
• the financial statements give a true and fair view of the state of the Group’s and of the parent company’s affairs as at 31 December 2010 and of the Group’s profit for the year then ended;
• the Group financial statements have been properly prepared in accordance with IFRSs as adopted by the EU;
• the parent company financial statements have been properly prepared in accordance with UK Generally Accepted Accounting Practice;
• the financial statements have been prepared in accordance with the requirements of the Companies Act 2006; and, as regards the group financial statements, Article 4 of the IAS Regulation.
Opinion on other matters prescribed by the Companies Act 2006In our opinion:
• the part of the Directors’ Remuneration Report to be audited has been properly prepared in accordance with the Companies Act 2006; and
• the information given in the Directors’ Report for the financial year for which the financial statements are prepared is consistent with the financial statements.
Matters on which we are required to report by exceptionWe have nothing to report in respect of the following:
Under the Companies Act 2006 we are required to report to you if, in our opinion:
• adequate accounting records have not been kept by the parent company, or returns adequate for our audit have not been received from branches not visited by us; or
• the parent company financial statements and the part of the Directors’ Remuneration Report to be audited are not in agreement with the accounting records and returns; or
• certain disclosures of directors’ remuneration specified by law are not made; or
• we have not received all the information and explanations we require for our audit.
Under the Listing Rules we are required to review:
• the directors’ statement, set out on page 121, in relation to going concern;
• the part of the Corporate Governance Statement set out in the Governance report relating to the Company’s compliance with the nine provisions of the June 2008 Combined Code specified for our review; and
• certain elements of the report to shareholders by the Board on directors’ remuneration.
G BAINBRIDGESENIOR STATUTORY AUDITOR
for and on behalf of KPMG Audit Plc, Statutory Auditor Chartered AccountantsLondon
8 March 2011
INDEPENDENT AUDITOR’S REPORT TO THE MEMBERS OF PRUDENTIAL PLC
FINANCIAL STATEMENTS > INDEPENDENT AUDITOR’S REPORT

389F
INA
NC
IAL
S
TA
TE
ME
NT
SE
EV
BA
SIS SUP
PL
EM
EN
TA
RY
IN
FO
RM
AT
ION
OPERATING PROFIT BASED ON LONGER-TERM INVESTMENT RETURNS i
Results analysis by business area
Note 2010 £m 2009 £mv
ASIAN OPERATIONS New business: Excluding Japan 2 902 725 Japaniv (1) (12)
Total 901 713 Business in force 3 549 392
Long-term business 1,450 1,105 Asset management 72 55 Development expenses (4) (6)
Total 1,518 1,154
US OPERATIONS New business 2 761 664 Business in force 3 697 569
Long-term business 1,458 1,233 Broker-dealer and asset management 22 4
Total 1,480 1,237
UK OPERATIONS New business 2 365 230 Business in force 3 571 640
Long-term business 936 870 General insurance commission 46 51
Total UK insurance operations 982 921 M&G 284 238
Total 1,266 1,159
OTHER INCOME AND EXPENDITURE Investment return and other income 30 22 Interest payable on core structural borrowings (257) (209) Corporate expenditure (220) (203) Charge for share-based payments for Prudential schemes (3) (5) Charge for expected asset management marginii (44) (38)
Total (494) (433)
Solvency II implementation costsiii (46) – Restructuring costsiii (28) (27)
OPERATING PROFIT BASED ON LONGER-TERM INVESTMENT RETURNSi 3,696 3,090
Analysed as profits (losses) from: New business: Excluding Japan 2 2,028 1,619 Japaniv (1) (12)
Total 2,027 1,607 Business in force 3 1,817 1,601
Long-term business 3,844 3,208 Asset management 378 297 Other results (526) (415)
Total 3,696 3,090
EUROPEAN EMBEDDED VALUE (EEV) BASIS RESULTS
FINANCIAL STATEMENTS > EUROPEAN EMBEDDED VALUE (EEV) BASIS SUPPLEMENTARY INFORMATION

390
Prudential plc Annual Report 2010
EUROPEAN EMBEDDED VALUE (EEV) BASIS RESULTSCONTINUED
FINANCIAL STATEMENTS > EUROPEAN EMBEDDED VALUE (EEV) BASIS SUPPLEMENTARY INFORMATION
Notesi EEV basis operating profit based on longer-term investment returns excludes the recurrent items of short-term fluctuations in investment
returns, the mark to market value movements on core borrowings, the shareholders’ share of actuarial and other gains and losses on defined benefit pension schemes, and the effect of changes in economic assumptions. In addition, for 2010, operating profit excludes costs associated with the terminated AIA transaction and the gain arising upon the dilution of the Group’s holding in PruHealth. For 2009, operating profit excluded the non-recurrent cost of hedging the Group IGD capital surplus included within short-term fluctuations in investment returns and the profit on sale and results of the sold Taiwan agency business.
The amounts for these items are included in total EEV profit attributable to shareholders. The Company believes that operating profit, as adjusted for these items, better reflects underlying performance. Profit before tax and basic earnings per share include these items together with actual investment returns. This basis of presentation has been adopted consistently throughout this supplementary information.
ii The value of future profits or losses from asset management and service companies that support the Group’s covered businesses are included in the profits for new business and the in-force value of the Group’s long-term business. The results of the Group’s asset management operations include the profits from management of internal and external funds. For EEV basis reporting, Group shareholders’ other income is adjusted to deduct the expected margins for the period on management of covered business. The deduction is on a basis consistent with that used for projecting the results for covered business. Group operating profit accordingly includes the variance between actual and expected profit in respect of covered business.
iii Restructuring costs comprise the charge of £(26) million recognised on an IFRS basis and an additional £(2) million recognised on the EEV basis for the shareholders’ share of restructuring costs incurred by the PAC with-profits fund (2009: £(23) million on an IFRS basis and an additional £(4) million on the EEV basis). For 2010, Solvency II implementation costs comprise the charge of £(45) million recognised on an IFRS basis and an additional £(1) million recognised on the EEV basis.
iv New business profits for the Group’s Japanese insurance subsidiary, which ceased selling new business with effect from 15 February 2010, have been presented separately from those of the remainder of the Group.
v Exchange translation The comparative results have been prepared using previously reported average exchange rates for the year.

391F
INA
NC
IAL
S
TA
TE
ME
NT
SE
EV
BA
SIS SUP
PL
EM
EN
TA
RY
IN
FO
RM
AT
ION
SUMMARISED CONSOLIDATED INCOME STATEMENT
Note 2010 £m 2009 £m
OPERATING PROFIT BASED ON LONGER-TERM INVESTMENT RETURNS Asian operations 1,518 1,154 US operations 1,480 1,237 UK operations: UK insurance operations 982 921 M&G 284 238 1,266 1,159 Other income and expenditure (494) (433)Solvency II implementation costs (46) – Restructuring costs (28) (27)
OPERATING PROFIT BASED ON LONGER-TERM INVESTMENT RETURNS 3,696 3,090 Short-term fluctuations in investment returns 4 (30) 351 Mark to market value movements on core borrowings 9 (164) (795)Shareholders’ share of actuarial and other gains and losses on defined benefit
pension schemes (11) (84) Effect of changes in economic assumptions 5 (10) (910)Costs of terminated AIA transaction 6 (377) – Gain on dilution of holding in PruHealth 18 3 – Profit on sale and results for Taiwan agency business 19 – 91
PROFIT FROM CONTINUING OPERATIONS BEFORE TAX (INCLUDING ACTUAL INVESTMENT RETURNS) 3,107 1,743
Tax attributable to shareholders’ profit 11 (530) (481)
PROFIT FROM CONTINUING OPERATIONS AFTER TAX BEFORE NON-CONTROLLING INTERESTS 2,577 1,262
Discontinued operations (net of tax) – (14)
PROFIT FOR THE YEAR 2,577 1,248
Attributable to: Equity holders of the Company 2,573 1,245 Non-controlling interests 4 3
PROFIT FOR THE YEAR 2,577 1,248

392
Prudential plc Annual Report 2010
FINANCIAL STATEMENTS > EUROPEAN EMBEDDED VALUE (EEV) BASIS SUPPLEMENTARY INFORMATION
EARNINGS PER SHARE (IN PENCE)
Note 2010 2009
From operating profit based on longer-term investment returns, after related tax and non-controlling interests of £2,700m* (2009: £2,221m) 12 106.9p 88.8p
Based on profit after tax and non-controlling interests of £2,573m (2009: £1,245m) 12 101.9p 49.8p
* Excluding an exceptional tax credit of £158 million which primarily relates to the impact of a settlement agreed with the UK tax authorities – see note 11.
DIVIDENDS PER SHARE (IN PENCE)
2010 2009
Dividends relating to reporting year: Interim dividend (2010 and 2009) 6.61p 6.29p Final/second interim dividend (2010 and 2009) 17.24p 13.56p
Total 23.85p 19.85p
Dividends declared and paid in reporting year: Current year interim dividend 6.61p 6.29p Second interim/final dividend for prior year 13.56p 12.91p
Total 20.17p 19.20p
MOVEMENT IN SHAREHOLDERS’ EQUITY (EXCLUDING NON-CONTROLLING INTERESTS)
Note 2010 £m 2009 £m
Profit for the year attributable to equity shareholders 2,573 1,245 Items taken directly to equity: Exchange movements on foreign operations and net investment hedges: Exchange movements arising during the year 659 (761) Related tax 34 11 Dividends (511) (481) New share capital subscribed (including shares issued in lieu of cash dividends) 75 141 Reserve movements in respect of share-based payments 37 29 Treasury shares: Movement in own shares held in respect of share-based payment plans (4) 3 Movement in Prudential plc shares purchased by unit trusts consolidated under IFRS 3 (3) Mark to market value movements on Jackson assets backing surplus and required capital (gross movement) 105 205 Related tax (37) (72)
Net increase in shareholders’ equity 10 2,934 317 Shareholders’ equity at beginning of year (excluding non-controlling interests) 7,10 15,273 14,956
SHAREHOLDERS’ EQUITY AT END OF YEAR (EXCLUDING NON-CONTROLLING INTERESTS) 7,10 18,207 15,273
EUROPEAN EMBEDDED VALUE (EEV) BASIS RESULTSCONTINUED

393F
INA
NC
IAL
S
TA
TE
ME
NT
SE
EV
BA
SIS SUP
PL
EM
EN
TA
RY
IN
FO
RM
AT
ION
2010 £m 2009 £m
COMPRISING: Note
Long-termbusiness
operations
Asset management
and other operations Total
Long-term business
operations
Asset management
and other operations Total
Asian operations: Net assets of operations 7,445 197 7,642 5,781 161 5,942 Acquired goodwill 236 61 297 80 61 141
7 7,681 258 7,939 5,861 222 6,083
US operations: Net assets of operations 4,799 106 4,905 4,122 95 4,217 Acquired goodwill – 16 16 – 16 16
7 4,799 122 4,921 4,122 111 4,233
UK insurance operations: Net assets of operations 5,970 33 6,003 5,439 37 5,476 M&G: Net assets of operations – 254 254 – 173 173 Acquired goodwill – 1,153 1,153 – 1,153 1,153
– 1,407 1,407 – 1,326 1,326
7 5,970 1,440 7,410 5,439 1,363 6,802
Other operations: Holding company net borrowings at market value 9 – (2,212) (2,212) – (1,780) (1,780) Other net assets (liabilities) – 149 149 – (65) (65)
7 – (2,063) (2,063) – (1,845) (1,845)
SHAREHOLDERS’ EQUITY AT END OF YEAR (EXCLUDING NON-CONTROLLING INTERESTS) 7 18,450 (243) 18,207 15,422 (149) 15,273
Representing: Net assets 18,214 (1,473) 16,741 15,342 (1,379) 13,963 Acquired goodwill 236 1,230 1,466 80 1,230 1,310
18,450 (243) 18,207 15,422 (149) 15,273

394
Prudential plc Annual Report 2010
FINANCIAL STATEMENTS > EUROPEAN EMBEDDED VALUE (EEV) BASIS SUPPLEMENTARY INFORMATION
NET ASSET VALUE PER SHARE (IN PENCE)
2010 2009
Based on EEV basis shareholders’ equity of £18,207 million (2009: £15,273 million) 715p 603p Number of issued shares at year end (millions) 2,546 2,532
RETURN ON EMBEDDED VALUE* 18% 15%
* Return on embedded value is based on EEV operating profit after tax and non-controlling interests (adjusted to exclude an exceptional tax credit of £158 million (as shown in note 11)) as a percentage of opening EEV basis shareholders’ equity.
SUMMARY STATEMENT OF FINANCIAL POSITION
Note 2010 £m 2009 £m
TOTAL ASSETS LESS LIABILITIES, BEFORE DEDUCTION FOR INSURANCE FUNDS 231,667 201,501 Less insurance funds:* Policyholder liabilities (net of reinsurers’ share) and unallocated surplus
of with-profits funds (223,636) (195,230) Less shareholders’ accrued interest in the long-term business 10,176 9,002
(213,460) (186,228)
TOTAL NET ASSETS 7,10 18,207 15,273
Share capital 127 127 Share premium 1,856 1,843 IFRS basis shareholders’ reserves 6,048 4,301
Total IFRS basis shareholders’ equity 7 8,031 6,271 Additional EEV basis retained profit 7 10,176 9,002
SHAREHOLDERS’ EQUITY (EXCLUDING NON-CONTROLLING INTERESTS) 7,10 18,207 15,273
* Including liabilities in respect of insurance products classified as investment contracts under IFRS 4.
The supplementary information on pages 389 to 433 was approved by the Board of directors on 8 March 2011 and signed on its behalf.
HARVEY MCGRATH TIDJANE THIAM NIC NICANDROUCHAIRMAN GROUP CHIEF EXECUTIVE CHIEF FINANCIAL OFFICER
EUROPEAN EMBEDDED VALUE (EEV) BASIS RESULTSCONTINUED

395F
INA
NC
IAL
S
TA
TE
ME
NT
SE
EV
BA
SIS SUP
PL
EM
EN
TA
RY
IN
FO
RM
AT
ION
NOTES ON THE EEV BASIS RESULTS
1 BASIS OF PREPARATION, METHODOLOGY AND ACCOUNTING PRESENTATION
The EEV basis results have been prepared in accordance with the EEV Principles issued by the CFO Forum of European Insurance Companies in May 2004 and expanded by the Additional Guidance on EEV Disclosures published in October 2005. Where appropriate, the EEV basis results include the effects of adoption of International Financial Reporting Standards (IFRS).
The directors are responsible for the preparation of the supplementary information in accordance with the EEV Principles.
a Covered businessThe EEV results for the Group are prepared for ‘covered business’, as defined by the EEV Principles. Covered business represents the Group’s long-term insurance business for which the value of new and in-force contracts is attributable to shareholders. The EEV basis results for the Group’s covered business are then combined with the IFRS basis results of the Group’s other operations.
The definition of long-term business operations is consistent with previous practice and comprises those contracts falling under the definition of long-term insurance business for regulatory purposes together with, for US operations, contracts that are in substance the same as guaranteed investment contracts (GICs) but do not fall within the technical definition. Under the EEV Principles, the results for covered business incorporate the projected margins of attaching internal asset management.
With two principal exceptions, covered business comprises the Group’s long-term business operations. The principal exceptions are for the closed Scottish Amicable Insurance Fund (SAIF) and for the presentational treatment of the financial position of the Group’s principal defined benefit pension scheme, the Prudential Staff Pension Scheme (PSPS). A small amount of UK Group pensions business is also not modelled for EEV reporting purposes.
SAIF is a ring-fenced sub-fund of the Prudential Assurance Company (PAC) long-term fund, established by a Court approved Scheme of Arrangement in October 1997. SAIF is closed to new business and the assets and liabilities of the fund are wholly attributable to the policyholders of the fund.
As regards PSPS, the deficit funding liability attaching to the shareholder-backed business is included in the total for Other operations, reflecting the fact that the deficit funding is being paid for by the parent company, Prudential plc.
b Methodologyi Embedded valueOverviewThe embedded value is the present value of the shareholders’ interest in the earnings distributable from assets allocated to covered business after sufficient allowance has been made for the aggregate risks in that business. The shareholders’ interest in the Group’s long-term business comprises:
• present value of future shareholder cash flows from in-force covered business (value of in-force business), less deductions for: − the cost of locked-in required capital; − the time value of cost of options and guarantees;
• locked-in required capital; and• shareholders’ net worth in excess of required capital (free surplus).
The value of future new business is excluded from the embedded value.Notwithstanding the basis of presentation of results (as explained in note 1c(iv)) no smoothing of market or account balance values,
unrealised gains or investment return is applied in determining the embedded value or profit before tax. Separately, the analysis of profit is delineated between operating profit based on longer-term investment returns and other constituent items, as explained in note 1c(i).
Valuation of in-force and new businessThe embedded value results are prepared incorporating best estimate assumptions about all relevant factors including levels of future investment returns, expenses, persistency and mortality. These assumptions are used to project future cash flows. The present value of the future cash flows is then calculated using a discount rate which reflects both the time value of money and the non-diversifiable risks associated with the cash flows that are not otherwise allowed for.
Best estimate assumptionsBest estimate assumptions are used for the cash flow projections, where best estimate is defined as the mean of the distribution of future possible outcomes. The assumptions are reviewed actively and changes are made when evidence exists that material changes in future experience are reasonably certain.
Assumptions required in the calculation of the value of options and guarantees, for example relating to volatilities and correlations, or dynamic algorithms linking liabilities to assets, have been set equal to the best estimates and, wherever material and practical, reflect any dynamic relationships between the assumptions and the stochastic variables.

396
Prudential plc Annual Report 2010
1 BASIS OF PREPARATION, METHODOLOGY AND ACCOUNTING PRESENTATION > CONTINUED
Principal economic assumptionsFor the Group’s UK and US operations, the 2010 and 2009 EEV basis results have been determined using economic assumptions where the long-term expected rates of return on investments and risk discount rates are set by reference to period end rates of return on cash or fixed income securities (the ‘active’ basis).
For Asian operations, the 2009 EEV basis results for Japan, Korea and US dollar denominated business written in Hong Kong were determined on the ‘active’ basis. For other Asian countries the investment return assumptions and risk discount rates for 2009 were based on an assessment of longer-term economic conditions (the ‘passive’ basis).
In 2010, the approach has been altered to determine the EEV basis results for all Asian territories on an active basis of economic assumption setting, in line with the Group’s other operations, and reflecting the fact that markets in a number of Asian countries are becoming increasingly developed.
For those Asian operations whose EEV basis results were previously determined on the ‘passive’ basis of economic assumption setting, the effect of the change in 2010 to move to an ‘active’ basis is as follows:
£m
Pre-tax operating profits from: New businessnote 2 5 Business in forcenote 3 (58)
Total (53)Effect on short-term fluctuations in investment returns and changes in economic assumptions 16
Total profit before tax (37)
Shareholders’ funds as at 31 December 2010 (39)
For 2010 and 2009, for all the Group’s operations, expected returns on equity and property asset classes are derived by adding a risk premium, based on the long-term view of Prudential’s economists to the risk free rate.
The total profit that emerges over the lifetime of an individual contract as calculated using the embedded value basis is the same as that calculated under the IFRS basis. Since the embedded value basis reflects discounted future cash flows, under this methodology the profit emergence is advanced thus more closely aligning the timing of the recognition of profits with the efforts and risks of current management actions, particularly with regard to business sold during the year.
New businessThe contribution from new business represents profits determined by applying operating assumptions as at the end of the year.
In determining the new business contribution for UK immediate annuity and lifetime mortgage business, which is interest rate sensitive, it is appropriate to use assumptions reflecting point of sale market conditions, consistent with how the business is priced. For other business within the Group, end of period economic assumptions are used.
Valuation movements on investmentsWith the exception of debt securities held by Jackson, investment gains and losses during the year (to the extent that changes in capital values do not directly match changes in liabilities) are included directly in the profit for the year and shareholders’ equity as they arise.
The results for any covered business conceptually reflects the aggregate of the IFRS results and the movements on the additional shareholders’ interest recognised on the EEV basis. Thus the start point for the calculation of the EEV results for Jackson, as for other businesses, reflects the market value movements recognised on the IFRS basis.
However, in determining the movements on the additional shareholders’ interest, the basis for calculating the Jackson EEV result acknowledges that for debt securities backing liabilities the aggregate EEV results reflect the fact that the value of in-force business instead incorporates the discounted value of future spread earnings. This value is not affected generally by short-term market movements on securities that are broadly speaking held for the longer-term.
Fixed income securities backing the free surplus and required capital for Jackson are accounted for at fair value. However, consistent with the treatment applied under IFRS for Jackson securities classified as available-for-sale, movements in unrealised appreciation on these securities are accounted for in equity rather than in the income statement, as shown in the movement in shareholders’ equity.
NOTES ON THE EEV BASIS RESULTSCONTINUED
FINANCIAL STATEMENTS > EUROPEAN EMBEDDED VALUE (EEV) BASIS SUPPLEMENTARY INFORMATION

397F
INA
NC
IAL
S
TA
TE
ME
NT
SE
EV
BA
SIS SUP
PL
EM
EN
TA
RY
IN
FO
RM
AT
ION
Cost of capitalA charge is deducted from the embedded value for the cost of capital supporting the Group’s long-term business. This capital is referred to as required capital. The cost is the difference between the nominal value of the capital and the discounted value of the projected releases of this capital allowing for investment earnings (net of tax) on the capital.
The annual result is affected by the movement in this cost from year-to-year which comprises a charge against new business profit and generally a release in respect of the reduction in capital requirements for business in force as this runs off.
Where required capital is held within a with-profits long-term fund, the value placed on surplus assets in the fund is already discounted to reflect its release over time and no further adjustment is necessary in respect of required capital.
Financial options and guaranteesNature of options and guarantees in Prudential’s long-term businessAsian operationsSubject to local market circumstances and regulatory requirements, the guarantee features described below in respect of UK business broadly apply to similar types of participating contracts principally written in the PAC Hong Kong branch, Singapore and Malaysia. Participating products have both guaranteed and non-guaranteed elements.
Non-participating long-term products are the only ones where the insurer is contractually obliged to provide guarantees on all benefits. Whole of life contracts with floor levels of policyholder benefits that accrue at rates set at inception and do not vary subsequent with market conditions are written in the Korean life operations and also are a feature of the UOB in-force book acquired in 2010. The amounts of these policies written in these operations are much smaller than the amounts of similar policies written by the Taiwan Life business which was sold in the first half of 2009, as detailed in note 19.
US operations (Jackson)The principal options and guarantees in Jackson are associated with the fixed annuity and Variable Annuity (VA) lines of business.
Fixed annuities provide that, at Jackson’s discretion, it may reset the interest rate credited to policyholders’ accounts, subject to a guaranteed minimum. The guaranteed minimum return varies from 1.5 per cent to 5.5 per cent (2009: 1.5 per cent to 5.5 per cent), depending on the particular product, jurisdiction where issued, and date of issue. At 31 December 2010, 83 per cent (2009: 82 per cent) of the account values on fixed annuities relates to policies with guarantees of 3 per cent or less. The average guarantee rate is 2.9 per cent (2009: 3.0 per cent).
Fixed annuities also present a risk that policyholders will exercise their option to surrender their contracts in periods of rapidly rising interest rates, possibly requiring Jackson to liquidate assets at an inopportune time.
Jackson issues VA contracts where it contractually guarantees to the contract holder either: a) return of no less than total deposits made to the contract adjusted for any partial withdrawals, b) total deposits made to the contract adjusted for any partial withdrawals plus a minimum return, or c) the highest contract value on a specified anniversary date adjusted for any withdrawals following the specified contract anniversary. These guarantees include benefits that are payable at specified dates during the accumulation period (Guaranteed Minimum Withdrawal Benefit (GMWB)), as death benefits (Guaranteed Minimum Death Benefits (GMDB)) or as income benefits (Guaranteed Minimum Income Benefits (GMIB)). Jackson reinsures and hedges these risks using equity options and futures contracts. These guarantees generally protect the policyholder’s value in the event of poor equity market performance.
Jackson also issues fixed index annuities that enable policyholders to obtain a portion of an equity-linked return while providing a guaranteed minimum return. The guaranteed minimum returns would be of a similar nature to those described above for fixed annuities.
UK insurance operationsThe only significant financial options and guarantees in the UK insurance operations arise in the with-profits fund and SAIF.
With-profits products provide returns to policyholders through bonuses that are smoothed. There are two types of bonuses: annual and final. Annual bonuses are declared once a year and, once credited, are guaranteed in accordance with the terms of the particular product. Unlike annual bonuses, final bonuses are guaranteed only until the next bonus declaration. The with-profits fund held a provision on the Pillar I Peak 2 basis of £24 million (2009: £31 million) at 31 December 2010 to honour guarantees on a small amount of guaranteed annuity option products.
Beyond the generic features and the provisions held in respect of guaranteed annuities described above, there are very few explicit options or guarantees of the with-profits fund such as minimum investment returns, surrender values, or annuity values at retirement and any granted have generally been at very low levels.
The Group’s main exposure to guaranteed annuity options in the UK is through SAIF and a provision on the Pillar I Peak 2 basis of £336 million (2009: £284 million) was held in SAIF at 31 December 2010 to honour the guarantees. As SAIF is a separate sub-fund of the Prudential Assurance Company long-term fund which is attributable to policyholders of the fund, the movement in the provision has no direct impact on shareholders.

398
Prudential plc Annual Report 2010
1 BASIS OF PREPARATION, METHODOLOGY AND ACCOUNTING PRESENTATION > CONTINUED
Time valueThe value of financial options and guarantees comprises two parts. One is given by a deterministic valuation on best estimate assumptions (the intrinsic value). The other part arises from the variability of economic outcomes in the future (the time value).
Where appropriate, a full stochastic valuation has been undertaken to determine the value of the in-force business including the cost of capital. A deterministic valuation of the in-force business is also derived using consistent assumptions and the time value of the financial options and guarantees is derived as the difference between the two.
The economic assumptions used for the stochastic calculations are consistent with those used for the deterministic calculations. Assumptions specific to the stochastic calculations reflect local market conditions and are based on a combination of actual market data, historic market data and an assessment of long-term economic conditions. Common principles have been adopted across the Group for the stochastic asset models, for example, separate modelling of individual asset classes but with an allowance for correlation between the various asset classes. Details of the key characteristics of each model are given in note 16.
ii Level of required capitalIn adopting the EEV Principles, Prudential has based required capital on its internal targets for economic capital subject to it being at least the local statutory minimum requirements. Economic capital is assessed using internal models but, when applying the EEV Principles, Prudential does not take credit for the significant diversification benefits that exist within the Group. For with-profits business written in a segregated life fund, as is the case in Asia and the UK, the capital available in the fund is sufficient to meet the required capital requirements. For shareholder-backed business the following capital requirements apply:
• Asian operations: the level of required capital has been set at the higher of local statutory requirements and the economic capital requirement;
• US operations: the level of required capital has been set to an amount at least equal to 235 per cent of the risk-based capital required by the National Association of Insurance Commissioners (NAIC) at the Company Action Level (CAL); and
• UK insurance operations: the capital requirements are set at the higher of Pillar I and Pillar II requirements for shareholder-backed business of UK insurance operations as a whole, which for 2010 and 2009 was Pillar I.
iii Allowance for risk and risk discount ratesOverviewUnder the EEV Principles, discount rates used to determine the present value of future cash flows are set equal to risk-free rates plus a risk margin. The risk margin should reflect any non-diversifiable risk associated with the emergence of distributable earnings that is not allowed for elsewhere in the valuation. Prudential has selected a granular approach to better reflect differences in market risk inherent in each product group. The risk discount rate so derived does not reflect an overall Group market beta but instead reflects the expected volatility associated with the cash flows for each product category in the embedded value model.
Since financial options and guarantees are explicitly valued under the EEV methodology, discount rates under EEV are set excluding the effect of these product features.
The risk margin represents the aggregate of the allowance for market risk, additional allowance for credit risk where appropriate, and allowance for non-diversifiable non-market risk. No allowance is required for non-market risks where these are assumed to be fully diversifiable. The majority of non-market and non-credit risks are considered to be diversifiable.
Market risk allowanceThe allowance for market risk represents the beta multiplied by an equity risk premium. Except for UK shareholder-backed annuity business (as explained below) such an approach has been used for all of the Group’s businesses.
The beta of a portfolio or product measures its relative market risk. The risk discount rates reflect the market risk inherent in each product group and hence the volatility of product cash flows. These are determined by considering how the profits from each product are affected by changes in expected returns on various asset classes. By converting this into a relative rate of return it is possible to derive a product specific beta.
Product level betas are calculated each year. They are combined with the most recent product mix to produce appropriate betas and risk discount rates for each major product grouping.
Additional credit risk allowanceThe Group’s methodology is to allow appropriately for credit risk. The allowance for credit risk is to cover:
• expected long-term defaults;• credit risk premium (to reflect the volatility in default levels); and• short-term downgrades and defaults.
These allowances are initially reflected in determining best-estimate returns and through the market risk allowance described above. However, for those businesses which are largely backed by holdings of debt securities these allowances in the projected returns and market risk allowances may not be sufficient and an additional allowance may be appropriate.
The practical application of the allowance for credit risk varies depending upon the type of business as described below.
NOTES ON THE EEV BASIS RESULTSCONTINUED
FINANCIAL STATEMENTS > EUROPEAN EMBEDDED VALUE (EEV) BASIS SUPPLEMENTARY INFORMATION

399F
INA
NC
IAL
S
TA
TE
ME
NT
SE
EV
BA
SIS SUP
PL
EM
EN
TA
RY
IN
FO
RM
AT
ION
Asian operations For Asian operations, the allowance for credit risk incorporated in the projected rates of return and the market risk allowance are sufficient. Accordingly no additional allowance for credit risk is required.
US businessFor Jackson business, the allowance for long-term defaults is reflected in the risk margin reserve charge which is deducted in determining the projected spread margin between the earned rate on the investments and the policyholder crediting rate.
The risk discount rate incorporates an additional allowance for credit risk premium and short-term defaults for general account business of 150 basis points and for variable annuity business of 30 basis points to reflect the fact that a proportion of the variable annuity business is allocated to the general account.
The level of allowance differs from that for UK annuity business for investment portfolio differences and to take account of the management actions available in adverse economic scenarios to reduce crediting rates to policyholders, subject to guarantee features of the products.
UK businessa Shareholder-backed annuity businessFor Prudential’s UK shareholder-backed annuity business, Prudential has used a market consistent embedded value (MCEV) approach to derive an implied risk discount rate which is then applied to the projected best estimate cash flows.
In the annuity MCEV calculations, the future cash flows are discounted using the swap yield curve plus an allowance for liquidity premium based on Prudential’s assessment of the expected return on the assets backing the annuity liabilities after allowing for expected long-term defaults, credit risk premium and short-term downgrades and defaults. For the purposes of presentation in the EEV results, the results on this basis are reconfigured. Under this approach the projected earned rate of return on the debt securities held is determined after allowing for expected long-term defaults and, where necessary, an additional allowance for an element of short-term downgrades and defaults to bring the allowance in the earned rate up to best estimate levels. The allowances for credit risk premium and additional short-term default allowance are incorporated into the risk margin included in the discount rate.
b With-profit fund PAL annuity businessFor UK annuity business written by PAL the basis for determining the aggregate allowance for credit risk is consistent with that applied for UK shareholder-backed annuity business and includes provision for short-term defaults and credit risk premium. The allowance for credit risk in PAL is taken into account in determining the projected cash flows to the with-profits fund, which are in turn discounted at the risk discount rate applicable to all of the projected cash flows of the fund.
c With-profit fund holdings of debt securitiesThe UK with-profits fund holds debt securities as part of its investment portfolio backing policyholder liabilities and unallocated surplus. The assumed earned rate for with-profit holdings of corporate bonds is defined as the risk-free rate plus an assessment of the long-term spread over gilts, net of expected long-term defaults. This approach is similar to that applied for equities and properties for which the projected earned rate is defined as the risk-free rate plus a long-term risk premium. Allowance for non-diversifiable non-market risks Finance theory cannot be used to determine the appropriate component of beta for non-diversifiable non-market risks since there is no observable risk premium associated with it that is akin to the equity risk premium. Recognising this, a pragmatic approach has been applied.
A base level allowance of 50 basis points is applied to cover the non-diversifiable non-market risks associated with the Group’s businesses. For the Group’s US business and UK business for other than shareholder-backed annuity, no additional allowance is necessary. For UK shareholder-backed annuity business, an additional allowance of 50 basis points is used to reflect the longevity risk which is of particular relevance. For the Group’s Asian operations in China, India, Indonesia, Philippines, Taiwan, Thailand and Vietnam, additional allowances are applied for emerging market risk ranging from 100 to 250 basis points.
iv Management actionsIn deriving the time value of financial options and guarantees, management actions in response to emerging investment and fund solvency conditions have been modelled. Management actions encompass, but are not confined to investment allocation decisions, levels of reversionary and terminal bonuses and credited rates. Bonus rates are projected from current levels and varied in accordance with assumed management actions applying in the emerging investment and fund solvency conditions.
In all instances, the modelled actions are in accordance with approved local practice and therefore reflect the options actually available to management. For the PAC with-profits fund, the actions assumed are consistent with those set out in the Principles and Practices of Financial Management.

400
Prudential plc Annual Report 2010
1 BASIS OF PREPARATION, METHODOLOGY AND ACCOUNTING PRESENTATION > CONTINUED
v With-profits business and the treatment of the estateThe proportion of surplus allocated to shareholders from the PAC with-profits fund has been based on the present level of 10 per cent. The value attributed to the shareholders’ interest in the estate is derived by increasing final bonus rates (and related shareholder transfers) so as to exhaust the estate over the lifetime of the in-force with-profits business. In those few extreme scenarios where the total assets of the life fund are insufficient to meet policyholder claims in full, the excess cost is fully attributed to shareholders. Similar principles apply, where appropriate, for other with-profit funds of the Group’s Asian operations.
vi Pension costsThe Group operates three defined benefit schemes in the UK. The principal scheme is the Prudential Staff Pension Scheme (PSPS). The other two, much smaller, schemes are the Scottish Amicable and M&G schemes.
Under IFRS the surpluses or deficits attaching to these schemes are accounted for in accordance with the provisions of IAS 19 that apply the principles of IFRIC 14, providing guidance on assessing the limit in IAS 19 on the amount of surplus in a defined benefit pension scheme that can be recognised as an asset.
Under the EEV basis the IAS 19 basis surpluses (to the extent not restricted under IFRIC 14) or deficits are initially allocated in the same manner. The shareholders’ 10 per cent interest in the PAC with-profits fund estate is determined after inclusion of the portion of the IAS 19 basis surpluses or deficits attributable to the fund. Adjustments under EEV in respect of accounting for surpluses or deficits on the Scottish Amicable Pension Scheme are reflected as part of UK operations and for other defined benefit schemes the adjustments are reflected as part of ‘Other operations’, as shown in note 7.
Separately, the projected cash flows of in-force covered business include the cost of contributions to the defined benefit schemes for future service based on the contribution basis applying to the schemes at the time of the preparation of the results.
vii Debt capitalCore structural debt liabilities are carried at market value. As the liabilities are generally held to maturity or for the long-term, no deferred tax asset or liability has been established on the difference, compared to the IFRS carrying value. Accordingly, no deferred tax credit or charge is recorded in the results for the reporting period in respect of the mark to market value adjustment.
viii Foreign currency translationForeign currency profits and losses have been translated at average exchange rates for the year. Foreign currency assets and liabilities have been translated at year-end rates of exchange. The purpose of translating the profits and losses at average exchange rates, notwithstanding the fact that EEV profit represents the incremental value added on a discounted cash flow basis, is to maintain consistency with the methodology applied for IFRS basis reporting.
c Accounting presentationi Analysis of profit before taxTo the extent applicable, presentation of the EEV profit for the year is consistent with the basis that the Group applies for analysis of IFRS basis profits before shareholder taxes between operating and non-operating results. Operating results reflect the underlying results including longer-term investment returns and, except as explained in note 1c(iv) below, the unwind of discount on the value of in-force business. Operating results include the impact of routine changes of estimates and non-economic assumptions.
Non-operating results comprise the recurrent items of short-term fluctuations in investment returns, the shareholders’ share of actuarial and other gains and losses on defined benefit pension schemes, the mark to market value movements on core borrowings and the effect of changes in economic assumptions.
In addition, for 2010, the Company incurred costs associated with the terminated AIA transaction and the Group’s holding in PruHealth was diluted. The effect of both of these items has been shown separately from operating profits based on longer-term investment returns.
In 2009, during the severe equity market conditions experienced in the first quarter, coupled with historically high equity volatility, the Group incurred non-recurrent costs from an exceptional short-dated hedge to protect against potential tail events on the Group IGD capital position in addition to regular operational hedging programmes. These costs incurred in 2009 have been shown separately within short-term fluctuations in investment returns. Also, in June 2009, the Group completed the disposal of the Taiwan agency business. The effect of this disposal and the results of the Taiwan agency business have been presented separately outside of the operating result.
ii Operating profitFor the investment element of the assets covering the net worth of long-term insurance business, investment returns are recognised in operating results at the expected long-term rate of return. These expected returns are calculated by reference to the asset mix of the portfolio. For the purpose of calculating the longer-term investment return to be included in the operating result of the PAC with-profits fund of UK operations, where assets backing the liabilities and unallocated surplus are subject to market volatility, asset values at the beginning of the reporting period are adjusted to remove the effects of short-term market movements as explained in note 1c (iv) below.
NOTES ON THE EEV BASIS RESULTSCONTINUED
FINANCIAL STATEMENTS > EUROPEAN EMBEDDED VALUE (EEV) BASIS SUPPLEMENTARY INFORMATION

401F
INA
NC
IAL
S
TA
TE
ME
NT
SE
EV
BA
SIS SUP
PL
EM
EN
TA
RY
IN
FO
RM
AT
ION
For the purpose of determining the long-term returns for debt securities of US operations for fixed annuity and other general account business, a risk margin charge is included which reflects the expected long-term rate of default based on the credit quality of the portfolio. For Jackson, interest-related realised gains and losses are amortised to the operating results over the maturity period of the sold bonds and for equity-related investments, a long-term rate of return is assumed, which reflects the aggregation of year-end risk-free rates and equity risk premium. For US variable annuity separate account business, operating profit includes the unwind of discount on the opening value of in force adjusted to reflect year-end projected rates of return with the excess or deficit of the actual return recognised within non-operating profit, together with the related hedging activity.
For UK annuity business, rebalancing of the asset portfolio backing the liabilities to policyholders may from time to time take place to align it more closely with the internal benchmark of credit quality that management applies. Such rebalancing will result in a change in the projected yield on the asset portfolio and the allowance for default risk. The net effect of these changes is reflected in the result for the year. In general, the effect is booked in operating results.
iii Effect of changes in operating assumptionsOperating profits include the effect of changes to operating assumptions on the value of in-force at the end of the period. For presentational purposes, the effect of change is delineated to show the effect on the opening value of in-force with the experience variance being determined by reference to the end of period assumptions.
iv Unwind of discount and other expected returnsThe unwind of discount and other expected returns is determined by reference to the value of in-force business, required capital and surplus assets at the start of the period as adjusted for the effect of changes in economic and operating assumptions reflected in the current period.
For UK insurance operations the amount included within operating results based on longer-term investment returns represents the unwind of discount on the value of in-force business at the beginning of the period (adjusted for the effect of current period assumption changes), the unwind of discount on additional value representing the shareholders’ share of smoothed surplus assets retained within the PAC with-profits fund (as explained in note 1b(v) above), and the expected return on shareholders’ assets held in other UK long-term business operations. Surplus assets retained within the PAC with-profits fund are smoothed for this purpose to remove the effects of short-term investment volatility from operating results. In the summary statement of financial position and for total profit reporting, asset values and investment returns are not smoothed.
v Pension costsProfit before taxMovements on the shareholders’ share of surpluses (to the extent not restricted by IFRIC 14) and deficits of the Group’s defined benefit pension schemes adjusted for contributions paid in the year are recorded within the income statement. Consistent with the basis of distribution of bonuses and the treatment of the estate described in note 1b(iv) and (v), the shareholders’ share incorporates 10 per cent of the proportion of the financial position attributable to the PAC with-profits fund. The financial position is determined by applying the requirements of IAS 19. Actuarial and other gains and lossesFor pension schemes in which the IAS 19 position reflects the difference between the assets and liabilities of the scheme, actuarial and other gains and losses comprise:
• the difference between actual and expected return on the scheme assets;• experience gains and losses on scheme liabilities;• the impact of altered economic and other assumptions on the discounted value of scheme liabilities; and• for pension schemes where the IAS 19 position reflects a deficit funding obligation, actuarial and other gains and losses includes the
movement in estimates of deficit funding requirements.
These items are recorded in the income statement but, consistent with the IFRS basis of presentation, are excluded from operating results based on longer-term investment returns.
vi Effect of changes in economic assumptionsMovements in the value of in-force business at the beginning of the period caused by changes in economic assumptions, net of the related change in the time value of cost of option and guarantees, are recorded in non-operating results.
vii TaxationThe profit for the year for covered business is in most cases calculated initially at the post-tax level. The post-tax profit for covered business is then grossed up for presentation purposes at the effective rates of tax applicable to the countries and periods concerned. In the UK the effective rate applied for 2010 is 27 per cent (2009: 28 per cent). For Jackson, the US federal tax rate of 35 per cent is applied to gross up movements on the value of in-force business. The overall tax rate includes the impact of tax effects determined on a local regulatory basis. For Asia, similar principles apply subject to the availability of taxable profits.

402
Prudential plc Annual Report 2010
1 BASIS OF PREPARATION, METHODOLOGY AND ACCOUNTING PRESENTATION > CONTINUED
viii Inter-company arrangementsThe EEV results for covered business incorporate the effect of the reinsurance arrangement of non-profit immediate pension annuity liabilities of SAIF (which is not covered business) to PRIL. In addition, the analysis of free surplus and value of in-force business takes account of the impact of contingent loan arrangements between Group companies.
ix Foreign exchange ratesForeign currency results have been translated as discussed in note 1b(viii), for which the principal exchange rates are as follows:
Local currency: £Closing rate
at 31 Dec 2010Average rate
for 2010Closing rate
at 31 Dec 2009Average rate
for 2009Opening rate at 1 Jan 2009
China 10.32 10.46 11.02 10.70 9.86 Hong Kong 12.17 12.01 12.52 12.14 11.14 India 70.01 70.66 75.15 75.70 70.05 Indonesia 14,106.51 14,033.41 15,171.52 16,173.28 15,799.22 Korea 1,776.86 1,786.23 1,880.45 1,989.75 1,810.92 Malaysia 4.83 4.97 5.53 5.51 5.02 Singapore 2.01 2.11 2.27 2.27 2.07 Taiwan 45.65 48.65 51.65 51.65 47.28 US 1.57 1.55 1.61 1.57 1.44
x Discontinued operationsThe charge of £(14) million in 2009, which is net of £nil tax, reflected completion adjustments for a previously disposed business.
2 ANALYSIS OF NEW BUSINESS CONTRIBUTION note iv
Year ended 31 December 2010
New business premiumsAnnual
premium and contribution equivalents
(APE)note i
£m
Present value of new
business premiums
(PVNBP) note i
£m
Pre-tax new business
contributionnote ii,iii
£m
New business margin note i
Single£m
Regular£m
(APE)%
(PVNBP)%
Asian operationsnotes v, vi 1,104 1,391 1,501 7,493 902 60 12.0 US operationsnote vii 11,417 22 1,164 11,572 761 65 6.6 UK insurance operationsnote viii 5,656 254 820 6,842 365 45 5.3
Total 18,177 1,667 3,485 25,907 2,028 58 7.8
Year ended 31 December 2009
New business premiumsAnnual
premium and contribution equivalents
(APE)note i
£m
Present value of new
business premiums
(PVNBP) note i
£m
Pre-tax new business
contributionnotes ii,iii
£m
New business margin note i
Single£m
Regular£m
(APE)%
(PVNBP)%
Asian operationsnote v 785 1,131 1,209 5,982 725 60 12.1 US operationsnote vii 8,885 24 912 9,048 664 73 7.3 UK insurance operationsnote viii 4,768 246 723 5,902 230 32 3.9
Total 14,438 1,401 2,844 20,932 1,619 57 7.7
NOTES ON THE EEV BASIS RESULTSCONTINUED
FINANCIAL STATEMENTS > EUROPEAN EMBEDDED VALUE (EEV) BASIS SUPPLEMENTARY INFORMATION

403F
INA
NC
IAL
S
TA
TE
ME
NT
SE
EV
BA
SIS SUP
PL
EM
EN
TA
RY
IN
FO
RM
AT
ION
New business margin (APE) %
2010 2009
Asian operations:note v China 47 50 Hong Kong 74 70 India 20 19 Indonesia 75 73 Korea 31 44 Taiwan 13 18 Other 79 87 Weighted average for all Asian operations 60 60
Notesi New business margins are shown on two bases, namely the margins by reference to Annual Premium Equivalents (APE) and the Present Value of
New Business Premiums (PVNBP) and are calculated as the ratio of the value of new business profit to APE and PVNBP. APE are calculated as the aggregate of regular new business amounts and one-tenth of single new business amounts. PVNBP are calculated as equalling single premiums plus the present value of expected premiums of new regular premium business, allowing for lapses and other assumptions made in determining the EEV new business contribution.
ii In determining the EEV basis value of new business written in the period the policies incept, premiums are included in projected cash flows on the same basis of distinguishing annual and single premium business as set out for statutory basis reporting.
iii New business contributions represent profits determined by applying operating assumptions as at the end of the year. In general, the use of point of sale or end of period economic assumptions is not significant in determining the new business contribution for different types of business and across financial reporting periods. However, to obtain proper measurement of the new business contribution for business which is interest rate sensitive, it is appropriate to use assumptions reflecting point of sale market conditions, consistent with how the business was priced. In practice, the only area within the Group where this has a material effect is for UK shareholder-backed annuity business. For other business within the Group end of period economic assumptions are used.
iv The amounts shown in the tables are translated at average exchange rates for the period.v The tables above include new business for the Taiwan bank distribution operation. New business excludes the Taiwan Agency business, which
was sold in June 2009 (as explained in note 19) and the Japanese insurance operations, in which the Company ceased selling new business from 15 February 2010.
vi The new business contribution in 2010 of £902 million for Asian operations includes a benefit of around £5 million arising from the application of the ‘active’ basis of economic assumption setting rather than the previously applied basis of an assessment of longer-term economic conditions, as described in note 1b.
vii The decrease in new business margin for US operations from 2009 to 2010 primarily reflects the changes to the assumed new business spread margins for Fixed Annuity and Fixed Index Annuity business as described in note 16a.
viii The increase in new business margin for UK operations from 2009 to 2010 primarily reflects the signing of a bulk annuity buy-in insurance agreement.
3 OPERATING PROFIT FROM BUSINESS IN FORCE
Group summary
Year ended 31 December 2010 £m
Asian operations
note i
US operations
note ii
UK operations
note iii Total
Unwind of discount and other expected returns 573 369 550 1,492 Effect of change in operating assumptions (23) 3 (3) (23)Experience variances and other items (1) 325 24 348
Total 549 697 571 1,817
Year ended 31 December 2009 £m
Asian operations
note i
US operations
note ii
UK operations
note iii Total
Unwind of discount and other expected returns 489 344 588 1,421 Effect of change in operating assumptions (12) 101 – 89 Experience variances and other items (85) 124 52 91
Total 392 569 640 1,601

404
Prudential plc Annual Report 2010
3 OPERATING PROFIT FROM BUSINESS IN FORCE > CONTINUED
NotesAnalysis by business uniti Asian operations
2010 £m 2009 £m
Unwind of discount and other expected returnsa 573 489 Effect of change in operating assumptions: Mortality and morbidityb 89 26 Expensec (62) (32)Persistencyd (75) (78)Othere 25 72 (23) (12)Experience variance and other items: Mortality and morbidityf 45 52 Expenseg (39) (43)Persistencyh (48) (76)Otheri 41 (18) (1) (85)
Total Asian operationsj 549 392
Notes a The increase in unwind of discount and other expected returns from £489 million for 2009 to £573 million for 2010 mainly arises from the
growth in the opening value of the in-force book. b The credit of £89 million (2009: £26 million) for mortality and morbidity assumption changes mainly arises in Indonesia of £72 million
comprising £36 million for relaxation of morbidity assumptions and £36 million to reflect recent experience in relation to protection benefits provided by unit-linked policies. The favourable effect of £26 million in 2009 primarily arises in Indonesia of £24 million reflecting recent experience.
c The charge of £(62) million in 2010 for expense assumption changes includes a charge in Korea of £(40) million, to reflect higher policy maintenance costs. Also included for 2010 is a charge of £(16) million in Malaysia relating to altered maintenance expense assumptions. The charge of £(32) million for strengthened expense assumptions in 2009 arises principally in Hong Kong of £(23) million with the balance arising across the regions.
d The charge of £(75) million in 2010 for the effect of changes in persistency assumptions mainly arises in Indonesia (£(33) million), Malaysia (£(26) million) and India (£(24) million) partly offset by a credit in Hong Kong (£16 million). The charge in Indonesia of £(33) million primarily relates to Shariah and single premium policies for which lower renewal rates have been experienced. The charge in Malaysia of £(26) million reflects altered premium holiday and other lapse assumptions and the charge in India of £(24) million represents changes in the paid-up assumption on linked business.
The negative effect of the change in persistency assumptions of £(78) million in 2009 is mainly a direct consequence of the impact on policyholders’ savings behaviour from adverse economic and market conditions, arising mostly with investment related products, principally in Korea (£(25) million), Indonesia (£(24) million) and Hong Kong (£(12) million).
e The credit of £72 million for other assumption changes in 2009 comprises the one-off positive impact of £69 million for altered projected net of tax cash flows arising from a regulatory reclassification of health and protection products in Hong Kong, a credit of £13 million for the effect of altered application of the Group’s EEV methodology and a net charge of £(10) million for other items. The £13 million effect comprises adjustments for asset management margins in Indonesia and Korea of £37 million and a charge of £(24) million to better align the assumed capital requirement with internal management and pricing bases, primarily in China, Indonesia, Philippines and Vietnam, and other minor adjustments with a neutral net effect.
f The favourable effect of £45 million in 2010 (2009: £52 million) for mortality and morbidity experience variances reflects better than expected experience, most significantly in Hong Kong, Singapore and Malaysia.
g The expense experience variance of £(39) million in 2010 (2009: £(43) million) includes a charge of £(18) million (2009: £(16) million) for expense overruns for operations which are at a relatively early stage of development, for which actual expenses are in excess of those factored into the product pricing. Also included in 2010 is £(9) million arising in Taiwan (2009: £(8) million) reflecting over-runs whilst the business rebuilds scale following the sale of the Agency business and in 2009, an expense variance of £(10) million arose in Korea, reflecting the lower level of sales in the period.
h The negative persistency experience variance of £(48) million in 2010 mainly arises in India of £(27) million relating to higher paid-ups and surrenders on unit-linked business and in Malaysia of £(26) million for higher partial withdrawals on unit-linked business as customers sought to monetise a proportion of their funds following two years of exceptional returns.
The charge of £(76) million in 2009 relating to negative persistency experience arises across the region with the largest impacts in Korea (£(29) million), India (£(11) million) and Japan (£(9) million).
i The credit of £41 million in 2010 for other experience and other items includes a credit of £24 million arising in Indonesia for the impact of additional riders being added to in-force policies during the year, funded from the policyholder unit linked account balances.
j The in-force operating profit for 2010 of £549 million reflects the effect of setting economic assumptions on an ‘active’ basis rather than the previously applied ‘passive’ basis as described in note 1(b), the impact of which was to lower in-force operating profits in 2010 by £58 million, principally for altered unwind of discount.
NOTES ON THE EEV BASIS RESULTSCONTINUED
FINANCIAL STATEMENTS > EUROPEAN EMBEDDED VALUE (EEV) BASIS SUPPLEMENTARY INFORMATION

405F
INA
NC
IAL
S
TA
TE
ME
NT
SE
EV
BA
SIS SUP
PL
EM
EN
TA
RY
IN
FO
RM
AT
ION
ii US operations
2010 £m 2009 £m
Unwind of discount and other expected returnsa 369 344 Effect of changes in operating assumptions: Guaranteed Minimum Withdrawal Benefit (GMWB) policyholder behaviourb – 156 Mortalityc 10 33 Variable Annuity (VA) feesd 27 (13) Othere (34) (75) 3 101 Experience variances and other items: Spread experience variancef 158 (3) Amortisation of interest-related realised gains and lossesg 82 59 Expenseh 32 40 Mortalityi 21 32 Persistencyj 23 7 Other 9 (11)
325 124
Total US operations 697 569
Notes a The increase in unwind of discount and other expected returns from £344 million for 2009 to £369 million for 2010 primarily represents an
increase in the return on net worth arising from a higher opening value between 1 January 2009 and 1 January 2010. b The positive impact of the change in GMWB policyholder behaviour assumptions of £156 million for 2009 reflects the altered assumptions
relating to the utilisation of withdrawal features available to policyholders on Variable Annuity (VA) contracts which have been modified to take account of the more recent experience of policyholder behaviour when benefits are ‘in the money’. Previously, policyholder behaviour for the utilisation of GMWB was assumed to be largely driven by the extent to which benefits were in the money. For 2009, the assumption was altered to take account of recent experience which shows that the attained age of the policyholder is the key factor in determining utilisation levels.
c The credit of £10 million for updates to mortality assumptions in 2010 represents a credit of £29 million for business other than variable annuity, reflecting recent experience, partially offset by a negative effect on variable annuity business of £(19) million for a change in the modelling of mortality rates. The £33 million credit for mortality in 2009 primarily reflects lower mortality rates for the Life of Georgia business, based upon actual experience since the acquisition of the business in 2005.
d The effect of the change of assumption for VA fees represents the capitalised value of the change in the projected level of policyholder advisory fees, which vary according to the size and mix of VA funds. The credit of £27 million for 2010 reflects an increase in the projected level of fees paid by policyholders, according to the current fund mix. The negative effect of the change in 2009 of £(13) million represents a reduction in the level of fees.
e The charge of £(34) million for other operating assumption changes in 2010 includes a credit of £4 million for the overall effect of changes to persistency assumptions and the net effect of a number of items including a charge of £(19) million for the altered projection of life reserves run-off. The effect of other changes in assumptions in 2009 of £(75) million primarily represents the negative impact of changes in persistency assumptions of £(53) million, reflecting an increase in the assumed utilisation of the partial withdrawal option on Variable and Fixed Annuity business of £(29) million and £(24) million for the effect of other altered lapse rates, in line with experience.
f The spread assumption for Jackson is determined on a longer-term basis, net of provision for defaults. The spread experience variance in 2010 is a positive £158 million, arising principally from transactions undertaken in the year to more closely match the overall asset and liability duration the effect of which is expected to persist in 2011 but at a reduced level.
g The amortisation of interest-related gains and losses reflects the same treatment applied to the supplementary analysis of IFRS profit. When bonds that are neither impaired nor deteriorating are sold and reinvested there will be a consequent change in the investment yield. The realised gain or loss is amortised into the result over the period when the bonds would have otherwise matured to better reflect the long-term returns included in operating profits. The increase in amortisation of interest-related gains and losses from £59 million in 2009 to £82 million in 2010 reflects the increased level of realised gains in the second half of 2009, on which a full year’s amortisation is recognised in 2010.
h The positive expense experience variance of £32 million (2009: £40 million) primarily represents favourable experience variance relating to marketing expenses.
i The positive mortality experience variance of £21 million (2009: £32 million) primarily relates to life products. j The positive persistency experience variance of £23 million primarily arises from favourable experience on annuity and institutional
business.

406
Prudential plc Annual Report 2010
3 OPERATING PROFIT FROM BUSINESS IN FORCE > CONTINUED
iii UK insurance operations
2010 £m 2009 £m
Unwind of discount and other expected returnsa 550 588 Effect of changes in operating assumptions: Updated mortality assumptions, net of release of marginsb (40) – Expensec 37 – (3) – Effect of change in UK corporate tax rated 41 – Other itemse (17) 52
Total UK insurance operations 571 640
Notes a The decrease in unwind of discount and other expected returns from 2009 of £588 million to £550 million in 2010 mainly arises from the
impact of the reduction in discount rates, reflecting the decrease in gilt rates of 0.4 per cent. b The Continuous Mortality Investigation (CMI) model and Core Projection parameters have been reviewed and a custom parameterisation
of the CMI model has been made where some aspects of the pattern of convergence from current rates of improvements to long-term rates of improvement have been altered. The assumption change shown above of a charge of £(40) million represents the effect of the implementation of the custom parameterisation on the opening value of in-force business at 1 January 2010, offset by the effects of other mortality assumption changes and the release of margins on the base mortality assumptions.
c The credit of £37 million in 2010 for changes in operating expense assumptions relates to renewal expense assumptions on shareholder backed annuity business.
d At 31 December 2010 a change to reduce the UK corporate tax rate from 28 per cent to 27 per cent with effect from 1 April 2011 had been enacted in the legislative process. The effect of the change in the corporate tax rate of £41 million represents the pre-tax benefit arising from the change in projecting the tax cash flows attaching to in-force business.
e The credit of £52 million in 2009 includes a credit of £22 million for the effects of rebalancing the UK annuity business asset portfolio backing the liabilities to policyholders, reflecting the altered value arising from the revised projected yield and allowances for default risk.
4 SHORT-TERM FLUCTUATIONS IN INVESTMENT RETURNS
Short-term fluctuations in investment returns, net of the related change in the time value of cost of options and guarantees, arise as follows:
2010 £m 2009 £m
Insurance operations: Asianote i 287 437 USnote ii (678) (401) UKnote iii 336 445 Other operations: IGD hedge costsnote iv – (235) Othernote v 25 105
Total (30) 351
Notesi Asian operations
2010 £m 2009 £m
Indonesia 55 40Hong Kong 51 113Taiwan 40 20Malaysia 37 40Singapore 16 159Other operations 88 65
287 437
For 2010 short-term fluctuations for Asian operations of £287 million primarily reflect the favourable performance in equity markets across the territories. The short-term fluctuations for other operations in 2010 of £88 million include an unrealised gain of £30 million on the Group’s 8.66 per cent stake in China Life Insurance Company of Taiwan, which at 31 December 2010 was valued at £100 million. For 2009, the short-term fluctuations in investment returns in Asia of £437 million reflect the effect of strong equity market performance in particular for participating business and unit-linked business where the in-force value benefits from increases in shareholder transfers and from the capitalisation of increased projected fees due to the higher asset base at the end of the year.
NOTES ON THE EEV BASIS RESULTSCONTINUED
FINANCIAL STATEMENTS > EUROPEAN EMBEDDED VALUE (EEV) BASIS SUPPLEMENTARY INFORMATION

407F
INA
NC
IAL
S
TA
TE
ME
NT
SE
EV
BA
SIS SUP
PL
EM
EN
TA
RY
IN
FO
RM
AT
ION
ii US operations The fluctuations for US operations comprise the following items:
2010 £m 2009 £m
Actual realised losses less default assumption and amortisation of interest-related gains and losses for fixed income securities and related swap transactionsa (351) (367)
Actual less long-term return on equity based investments and other itemsb 5 (144)Investment return related (loss) gain due primarily to changed expectation of profits on in-force variable annuity
business in future periods based on current period equity returns, net of related hedging activity for equity related productsc (332) 110
(678) (401)
Notes a The charges relating to fixed income securities for 2010 of £(351) million and 2009 of £(367) million shown above primarily represent the
excess of credit-related losses in the year on the US statutory basis over the amortisation of interest-related gains and longer-term default assumption included within operating profit, together with for 2010, the impact of de-risking activities within the portfolio.
b The charge in 2009 of £(144) million for actual less long-term return on equity based investments and other items primarily relates to the shortfall of actual return against the expected return on investments in limited partnerships.
c This item arises due to the market returns, net of related hedging activity, being higher or lower than the assumed longer-term rate of return. This gives rise to higher or lower than expected period end values of variable annuity assets under management with a resulting effect on the projected value of future account values and hence future profitability from altered fees. For 2010 the US equity market returns were 14.5 per cent compared to the assumed longer-term rate of 6.8 per cent for the period which was more than offset by the impact of hedging activity. For 2009 the US equity market returns were approximately 24 per cent compared to the assumed longer-term rate of 7.4 per cent for the period.
iii UK insurance operations The short-term fluctuations in investment returns for UK insurance operations represents:
2010 £m 2009 £m
With-profitsa 218 430 Shareholder-backed annuityb 84 (40)Unit-linked and otherc 34 55
336 445
Notes a For with-profits business the credit for 2010 of £218 million reflects the positive 12.0 per cent actual investment return on the investments
of the PAC with-profits fund (covering policyholder liabilities and unallocated surplus) against the assumed long-term rate of 6.7 per cent. The credit of £430 million for 2009 reflects the positive variance of 8.6 per cent against the assumed long-term investment return.
b Short-term fluctuations in investment returns for shareholder-backed annuity business include gains (losses) on surplus assets relative to the expected return due to a fall (rise) in yields, the difference between actual and expected default experience and mismatching profits and losses arising from the impacts of changes in yields on assets and liabilities of differing durations. The short-term fluctuations in investment returns for 2010 of a credit of £84 million represent better than expected default experience of £64 million, higher than expected gains arising on surplus assets of £55 million, partially offset by mismatching losses of £(21) million, and other impacts of £(14) million. The charge of £(40) million for 2009 represents mismatching losses of £(105) million, partially offset by better than expected default experience of £22 million with the remaining balance of £43 million consisting of positive movements in other asset values partially offset by losses on surplus assets.
c The credit of £34 million for 2010 (2009: credit of £55 million) primarily relates to unit-linked business representing the increase in capitalised value of future fees arising from the positive movements in market values experienced during the relevant reporting periods.
iv IGD hedge costs During the severe equity market conditions experienced in the first quarter of 2009, coupled with historically high equity volatility, the Group
entered into exceptional short-dated hedging contracts to protect against potential tail-events on the IGD capital position, in addition to the regular operational hedging programmes. The hedge contracts have expired and have not been renewed.
v Other operations Short-term fluctuations in investment returns of other operations, in addition to the previously discussed IGD hedge costs for 2009, arise from:
2010 £m 2009 £m
Unrealised value movements on swaps held centrally to manage Group assets and liabilities (25) 28 Unrealised value movements on Prudential Capital bond portfolio 48 66 Unrealised value movements on investments held by other operations 2 11
25 105

408
Prudential plc Annual Report 2010
FINANCIAL STATEMENTS > EUROPEAN EMBEDDED VALUE (EEV) BASIS SUPPLEMENTARY INFORMATION
NOTES ON THE EEV BASIS RESULTSCONTINUED
5 EFFECT OF CHANGES IN ECONOMIC ASSUMPTIONS
The effects of changes in economic assumptions for in-force business, net of the related change in the time value of cost of options and guarantees, included within the profit from continuing operations before tax (including actual investment returns) arise as follows:
2010 £m 2009 £m
Asian operationsnote i (71) (174)US operationsnote ii (1) (518)UK insurance operationsnote iii 62 (218)
Total (10) (910)
Notesi The charge of £(71) million in Asian operations for the effect of changes in economic assumptions in 2010 primarily represents the effect of
derisking certain asset portfolios in Hong Kong and Singapore of £(73) million, together with the impact of the reduction in fund earned rates and risk discount rates as shown in note 16(a), including the effect of altering the basis of setting economic assumptions to the ‘active’ basis as described in note 1(b). The charge for 2009 of £(174) million primarily reflects increases in risk discount rates and fund earned rates, with the largest impact arising for Hong Kong US dollar denominated business arising from the increase in US dollar government bond yields, partly offset by a credit of £96 million for the effect of altered economic assumptions for Indonesia and Korea arising from a change in the application of the Group’s methodology for these operations (as discussed in note 16a).
ii The charge of £(1) million for the effect of changes in economic assumptions, net of the related change in the time value of cost of options and guarantees, for US operations for 2010 reflects the following:
2010 £m 2009 £m
Effect of changes in treasury rates, beta and equity risk premium:a Fixed annuity and other general account business 111 (398) Variable Annuity (VA) business (112) 181
Increase in risk margin allowance for credit riskb – (301)
(1) (518)
Notes a For Jackson, the charge for the effect of changes in economic assumptions represents the aggregate of the effects of changes to projected
returns and the risk discount rate. The risk discount rate, as discussed in note 1b(iii), represents the aggregate of the risk-free rate and margin for market risk, credit risk and non-diversifiable non-market risk.
For fixed annuity and other general account business the effect of changes to the risk-free rate, which is defined as the 10-year treasury rate, is reflected in the risk discount rate. This discount rate is in turn applied to projected cash flows which principally reflect projected spread, which is largely insensitive to changes in the risk-free rate. Secondary effects on the cash flows also result from changes to assumed future yield and resulting policyholder behaviour. For VA business, changes to the risk-free rate are also reflected in determining the risk discount rate. However, the projected cash flows are also reassessed for altered investment returns on the underlying separate account assets from which fees are charged. For 2010, the effect of these changes resulted in an overall credit for fixed annuity and other general account business of £111 million and a charge of £(112) million for VA business reflecting the reduction of 0.6 per cent in the risk-free rate (as shown in note 16a).
For 2009, the effect of these changes resulted in an overall charge for fixed annuity and other general account business of £(398) million and an overall credit on VA business of £181 million, reflecting the increase in the risk-free rate of 1.6 per cent.
b For 2010 and 2009, the Group has included an additional allowance for credit risk. In determining this allowance a number of factors were considered. These factors, in particular, include:
i How much of the credit spread on debt securities represents an increased credit risk not reflected in the Risk Margin Reserve (RMR) long-term default assumptions, and how much is liquidity premium. In assessing this effect consideration has been given to a number of approaches to estimating the liquidity premium by considering statistical data over the four years from 2006 to 2009; and
ii Policyholder benefits for Jackson fixed annuity business are not fixed. It is possible in adverse economic scenarios to pass on a component of credit loss to policyholders (subject to guarantee features) through lower crediting rates. Consequently, it is only necessary to allow for the balance of the credit risk in the risk discount rate.
After taking these and other more detailed factors into account and, based on market conditions in late 2009, the risk discount rate for general account business was increased by 150 basis points as an additional allowance for credit risk. For VA business, the additional allowance increase was set at 20 per cent of the non-VA business increase to reflect the fact that a proportion of the VA business is allocated to general account holdings of debt securities. For 2010 these additional allowances have been maintained at 2009 levels. The additional allowance to be applied in future reporting periods will be altered, as necessary, for future credit conditions and as the business in force alters over time.

409F
INA
NC
IAL
S
TA
TE
ME
NT
SE
EV
BA
SIS SUP
PL
EM
EN
TA
RY
IN
FO
RM
AT
ION
iii The effect of changes in economic assumptions, net of the related change in the time value of cost of options and guarantees, of a credit of £62 million for UK insurance operations for 2010 comprises the effect of:
2010 £m 2009 £m
Shareholder-backed
annuity business
note a
With-profits and other
businessnote b Total
Shareholder-backed
annuity business
note a
With- profits and other
businessnote b Total
(Decrease) increase in expected long-term rates of return (102) (80) (182) (284) 191 (93)Decrease (increase) in risk discount rates 55 183 238 240 (311) (71)Other changes (6) 12 6 25 (79) (54)
(53) 115 62 (19) (199) (218)
Notes a For 2010, the effects of decreases in expected long-term rates of return and risk discount rates for shareholder-backed annuity business
primarily reflect the reduction in gilt rates of 0.4 per cent, as shown in note 16a. In 2009, the overall charge of £(19) million reflects the effects of regular economic assumption changes. However, the amounts for the component line items shown above reflect a change in the composition of the default allowance between best estimate levels (which are reflected in the long-term rates of return) and allowance for credit risk premium and additional short-term defaults reflected in the risk discount rate.
b For 2010, the credit of £115 million for with-profits and other business reflects a decrease in risk discount rates which more than offsets the reduction in fund earned rates, primarily driven by the decrease in gilt rates of 0.4 per cent in the year. In 2009, the charge of £(199) million for with-profits and other business reflects the fact that the risk discount rate has increased significantly more than the earned rate as a result of the revised correlation assumptions, lower equity backing ratio and very low cash return.
6 COSTS OF TERMINATED AIA TRANSACTION
The following costs were incurred in relation to the proposed and subsequently terminated transaction, to purchase AIA Group Limited and related rights issue.
2010 £m
AIG termination break fee 153 Underwriting fees 58 Costs associated with foreign exchange hedging 100 Adviser fees and other 66
TOTAL COSTS BEFORE TAX 377 Associated tax relief (93)
Total costs after tax 284

410
Prudential plc Annual Report 2010
FINANCIAL STATEMENTS > EUROPEAN EMBEDDED VALUE (EEV) BASIS SUPPLEMENTARY INFORMATION
NOTES ON THE EEV BASIS RESULTSCONTINUED
7 SHAREHOLDERS’ FUNDS (EXCLUDING NON-CONTROLLING INTERESTS) – SEGMENTAL ANALYSIS
2010 £m 2009 £m
ASIAN OPERATIONS Long-term business: Net assets of operations – EEV basis shareholders’ fundsnote iv 7,445 5,781 Acquired goodwillnote iii 236 80
7,681 5,861 Asset management:note i
Net assets of operations 197 161 Acquired goodwill 61 61
258 222
7,939 6,083
US OPERATIONS Jackson – EEV basis shareholders’ funds (net of surplus note borrowings of £172 million
(2009: £158 million)note 9) 4,799 4,122 Broker-dealer and asset management operationsnote i
Net assets of operations 106 95 Acquired goodwill 16 16
122 111
4,921 4,233
UK OPERATIONS Insurance operations: Long-term business operations: Smoothed shareholders’ funds 5,911 5,547 Actual shareholders’ funds less smoothed shareholders’ funds 59 (108) EEV basis shareholders’ funds 5,970 5,439 Other note i 33 37
6,003 5,476
M&G:note i Net assets of operations 254 173 Acquired goodwill 1,153 1,153
1,407 1,326
7,410 6,802
OTHER OPERATIONS Holding company net borrowings at market value note 9 (2,212) (1,780)Other net assets (liabilities)note i 149 (65)
(2,063) (1,845)
Total 18,207 15,273

411F
INA
NC
IAL
S
TA
TE
ME
NT
SE
EV
BA
SIS SUP
PL
EM
EN
TA
RY
IN
FO
RM
AT
ION
2010 £m 2009 £m
REPRESENTING:
Statutory IFRS basis
shareholders’ equity
Additional retained profit on
an EEV basis
EEV basis shareholders’
equity
Statutory IFRS basis
shareholders’ equity
Additional retained profit on
an EEV basis
EEV basis shareholders’
equity
Asian operations 2,149 5,532 7,681 1,462 4,399 5,861 US operations 3,815 984 4,799 3,011 1,111 4,122 UK insurance operations 2,115 3,855 5,970 1,902 3,537 5,439
Total long-term business operations 8,079 10,371 18,450 6,375 9,047 15,422 Other operationsnote ii (48) (195) (243) (104) (45) (149)
Group total 8,031 10,176 18,207 6,271 9,002 15,273
Notesi With the exception of the share of the Prudential Staff Pension Scheme (PSPS) deficit attributable to the PAC with-profits fund, which is included
in ‘Other operations’ net assets (liabilities), these amounts have been determined on the statutory IFRS basis. The overall pension scheme deficit, net of tax, attributable to shareholders relating to PSPS is determined as shown below:
2010 £m 2009 £m
IFRS basis deficit (relating to shareholder-backed operations) (10) (16)Additional EEV deficit (relating to shareholders’ 10 per cent share of the IFRS basis deficit attributable to the PAC with-profits fund) (3) (5)
EEV basis (13) (21)
ii The additional retained profit on an EEV basis for ‘Other operations’ represents the mark to market value difference on holding company net borrowings of a charge of £(177) million (2009: charge of £(26) million) and the effect of accounting for pension costs for the Prudential Staff Pension Scheme.
iii The increase in acquired goodwill for Asian long-term business operations from £80 million in 2009 to £236 million in 2010 represents £141 million arising from the acquisition of United Overseas Bank Life Assurance Limited (as shown in note 17) and £15 million for exchange rate movements.
iv The EEV basis shareholders’ funds for Asian long-term business of £7,445 million for 2010 have been determined after including the £(39) million effect of moving from a passive to an active basis of economic assumption setting, as described in note 1b.

412
Prudential plc Annual Report 2010
FINANCIAL STATEMENTS > EUROPEAN EMBEDDED VALUE (EEV) BASIS SUPPLEMENTARY INFORMATION
NOTES ON THE EEV BASIS RESULTSCONTINUED
8 ANALYSIS OF MOVEMENT IN FREE SURPLUS
Free surplus is the excess of the net worth over the capital required to support the covered business. Where appropriate, adjustments are made to the regulatory basis net worth from the local regulatory basis so as to include backing assets movements at fair value rather than cost so as to comply with the EEV Principles. Prudential has based required capital on its internal targets for economic capital subject to it being at least the local statutory minimum requirements, as described in note 1b(ii).
2010 £m
LONG-TERM BUSINESS AND ASSET MANAGEMENT OPERATIONSnote i
Long-term business
note 13
Asset management
and UK general
insurance commission
note ii
Free surplus of long-term
business, asset management
and UK general insurance
commission
Underlying movement: New business: Excluding Japan (643) – (643) Japan (2) – (2) Total (645) – (645) Business in force: Expected in-force cash flows (including expected return on net assets) 1,829 310 2,139 Effects of changes in operating assumptions, operating experience variances and
other operating items 220 – 220
1,404 310 1,714 Changes in non-operating itemsnote iii (120) 26 (94)
1,284 336 1,620 Net cash flows to parent companynote iv (735) (200) (935)Exchange movements, timing differences and other itemsnote v 134 (12) 122
NET MOVEMENT IN FREE SURPLUS 683 124 807 Balance at 1 January 2010 2,065 466 2,531
BALANCE AT 31 DECEMBER 2010 2,748 590 3,338
Representing: Asian operations 1,045 197 1,242 US operations 1,163 106 1,269 UK operations 540 287 827
2,748 590 3,338
1 January 2010 Representing: Asian operations 801 161 962 US operations 749 95 844 UK operations 515 210 725
2,065 466 2,531
Notesi All figures are shown net of tax.ii For the purposes of this analysis, free surplus for asset management operations and the UK general insurance commission is taken to be IFRS
basis shareholders’ funds as shown in note 7.iii Changes in non-operating items This represents short-term fluctuations in investment returns, the shareholders’ share of actuarial and other gains and losses on defined benefit
pension schemes and the effect of changes in economic assumptions for long-term business operations. Short-term fluctuations in investment returns primarily reflect temporary market movements on the portfolio of investments held by the
Group’s shareholder-backed operations together with the shareholders’ 10 per cent interest in the value movements on the assets in the with-profits funds.
iv Net cash flows to parent company for long-term business operations reflect the flows as included in the holding company cash flow at transaction rates.

413F
INA
NC
IAL
S
TA
TE
ME
NT
SE
EV
BA
SIS SUP
PL
EM
EN
TA
RY
IN
FO
RM
AT
ION
v Exchange movements, timing differences and other items represent:
2010 £m
Long-term business
Asset management
and UK general
insurance commission Total
Exchange movementsnote 13 78 18 96 Mark to market value movements on Jackson assets backing surplus and required capitalnote 13 68 – 68 Other (12) (30) (42)
134 (12) 122
9 NET CORE STRUCTURAL BORROWINGS OF SHAREHOLDER-FINANCED OPERATIONS
2010 £m 2009 £m
IFRS basis
Mark to market value
adjustmentnote ii
EEV basis at market value IFRS basis
Mark to market value
adjustmentnote ii
EEV basis at market value
Holding company* cash and short-term investments (1,232) – (1,232) (1,486) – (1,486)
Core structural borrowings – central fundsnote i 3,267 177 3,444 3,240 26 3,266
Holding company net borrowings 2,035 177 2,212 1,754 26 1,780 Core structural borrowings – PruCapnote iii 250 – 250 – – – Core structural borrowings – Jackson 159 13 172 154 4 158
Net core structural borrowings of shareholder – financial operations 2,444 190 2,634 1,908 30 1,938
* Including central finance subsidiaries.
Notesi EEV basis holding company borrowings comprise:
2010 £m 2009 £m
Perpetual subordinated capital securities (Innovative Tier 1) 1,491 1,351 Subordinated debt (Lower Tier 2) 1,372 1,372 Senior debt 581 543
3,444 3,266
In May 2009, the Company repaid maturing £249 million senior debt and in the same month the Company issued £400 million subordinated notes in part to replace the maturing debt.
In July 2009, the Company issued US$750 million perpetual subordinated capital securities. In accordance with the EEV Principles, core borrowings are carried at market value. As the liabilities are generally held to maturity or for the
long-term, no deferred tax asset or liability has been established on the market value adjustment above. ii The movement in the mark to market value adjustment represents:
Mark to market movement in balance sheet: 2010 £m 2009 £m
Beginning of year 30 (821)Change: Income statement 164 795 Foreign exchange effects (4) 56
End of year 190 30
iii The £250 million PruCap bank loan was made in two tranches: £135 million maturing in June 2014 and £115 million maturing in August 2012.

414
Prudential plc Annual Report 2010
FINANCIAL STATEMENTS > EUROPEAN EMBEDDED VALUE (EEV) BASIS SUPPLEMENTARY INFORMATION
NOTES ON THE EEV BASIS RESULTSCONTINUED
10 RECONCILIATION OF MOVEMENT IN SHAREHOLDERS’ FUNDS (EXCLUDING NON-CONTROLLING INTERESTS)
2010 £m
Long-term business operations
Asian operations
US operations
UK insurance
operations
Total long-term business
operationsOther
operationsGroup
Total
OPERATING PROFIT (BASED ON LONGER-TERM INVESTMENT RETURNS)
Long-term business: New business: Excluding Japannote 2 902 761 365 2,028 – 2,028 Japan (1) – – (1) – (1) Total 901 761 365 2,027 – 2,027 Business in forcenote 3 549 697 571 1,817 – 1,817
1,450 1,458 936 3,844 – 3,844 Asia development expenses (4) – – (4) – (4)UK general insurance commission – – – – 46 46 M&G – – – – 284 284 Asian asset management operations – – – – 72 72 US broker-dealer and asset management – – – – 22 22 Other income and expenditure – – – – (494) (494)Solvency II implementation costs – (4) (7) (11) (35) (46)Restructuring costs – – (28) (28) – (28)
OPERATING PROFIT BASED ON LONGER-TERM INVESTMENT RETURNS 1,446 1,454 901 3,801 (105) 3,696
Short-term fluctuations in investment returnsnote 4 287 (678) 336 (55) 25 (30)Mark to market value movements on
core borrowingsnote 9 – (9) – (9) (155) (164)Shareholders’ share of acturial and other
gains and losses on defined benefit pension schemes – – (5) (5) (6) (11)
Effect of changes in economic assumptionsnote 5 (71) (1) 62 (10) – (10)Cost of terminated AIA transactionnote 6 – – – – (377) (377)Gain on dilution of holding in PruHealthnote 18 – – 3 3 – 3
PROFIT (LOSS) FROM CONTINUING OPERATIONS BEFORE TAX (INCLUDING ACTUAL INVESTMENT RETURNS) 1,662 766 1,297 3,725 (618) 3,107
Tax (charge) credit attributable to shareholders’ profit (loss):note 11
Tax on operating profitnote iii (329) (509) (260) (1,098) 264 (834)Tax on short-term fluctuations in
investment returns (12) 325 (91) 222 – 222 Tax on shareholders’ share of actuarial and
other gains and losses on defined benefit pension schemes – – – – 2 2
Tax on effect of changes in economic assumptions 4 – (17) (13) – (13)Tax on costs of terminated AIA transactionnote 6 – – – – 93 93
Total tax (charge) credit (337) (184) (368) (889) 359 (530)
Non-controlling interests – – – – (4) (4)
PROFIT (LOSS) FOR THE YEAR 1,325 582 929 2,836 (263) 2,573

415F
INA
NC
IAL
S
TA
TE
ME
NT
SE
EV
BA
SIS SUP
PL
EM
EN
TA
RY
IN
FO
RM
AT
ION
2010 £m
Long-term business operations
Asian operations
US operations
UK insurance
operations
Total long-term business
operationsOther
operationsGroup
Total
OTHER MOVEMENTSExchange movements on foreign operations
and net investment hedgesnote i 530 124 – 654 5 659 Related tax – – – – 34 34 Intra-group dividends (including statutory
transfer)note v (365) (81) (398) (844) 844 – External dividends – – – – (511) (511)Reserve movements in respect of
share-based payments – – – – 37 37 Acquisition of UOB Lifenotes iv and 17 79 – – 79 (79) – Investment in operationsnote v 103 – 21 124 (124) – Other transfersnote vi (8) (16) (21) (45) 45 – Movement in own shares held in respect
of share-based payment plans – – – – (4) (4)Movement in Prudential plc shares purchased
by unit trusts consolidated under IFRS – – – – 3 3 New share capital subscribed – – – – 75 75 Mark to market value movements on Jackson
assets backing surplus and required capital (net of related tax of £37 million)note 13 – 68 – 68 – 68
NET INCREASE IN SHAREHOLDERS’ EQUITY 1,664 677 531 2,872 62 2,934 Shareholders’ equity at 1 January 2010notes ii and 7 5,781 4,122 5,439 15,342 (69) 15,273
SHAREHOLDERS’ EQUITY AT 31 DECEMBER 2010notes ii and 7 7,445 4,799 5,970 18,214 (7) 18,207
Notesi Profits are translated at average exchange rates, consistent with the method applied for statutory IFRS basis results. The amounts recorded
above for exchange rate movements reflect the difference between 2010 and 2009 exchange rates as applied to shareholders’ funds at 1 January 2010 and the difference between 31 December 2010 and average 2010 rates for profits.
ii For the purposes of the table above, goodwill related to Asia long-term operations (as shown in note 7) is included in Other operations.iii The tax charge attributable to shareholders’ profit includes an exceptional tax credit of £158 million as detailed in note 11(ii).iv The charge of £(79) million for Other operations relating to the acquisition of UOB Life represents cash consideration paid of £(220) million offset
by goodwill arising on the acquisition of £141 million (as shown in note 17).v Total intra-group dividends and investment in operations represent:
Asianoperations
£m
USoperations
£m
UKinsurance
operations£m
Totallong-term
businessoperations
£m
Other operations
£mTotal
£m
Intra-group dividends (including statutory transfer) (365) (81) (398) (844) 844 –Investment in operationsa 103 – 21 124 (124) –
Totalb (262) (81) (377) (720) 720 –
a Investment in operations reflects increases in share capital. b For long-term business operations, the difference between the total above of £(720) million for intra-group dividends (including statutory
transfer) and investment in operations and the net cash flows to parent company of £(735) million (as shown in note 8) primarily relates to timing differences, intra-group loans and other non-cash items.

416
Prudential plc Annual Report 2010
FINANCIAL STATEMENTS > EUROPEAN EMBEDDED VALUE (EEV) BASIS SUPPLEMENTARY INFORMATION
NOTES ON THE EEV BASIS RESULTSCONTINUED
10 RECONCILIATION OF MOVEMENT IN SHAREHOLDERS’ FUNDS (EXCLUDING NON-CONTROLLING
INTERESTS) > CONTINUED
vi Other transfers from long-term business operations to Other operations in 2010 represent:
Asianoperations
£m
USoperations
£m
UKinsurance
operations£m
Totallong-term
businessoperations
£m
Adjustment for net of tax asset management projected profits of covered business (11) (3) (20) (34)Other adjustments 3 (13) (1) (11)
(8) (16) (21) (45)
11 TAX ATTRIBUTABLE TO SHAREHOLDERS’ PROFIT
The tax charge (credit) comprises:
2010 £m 2009 £m
TAX CHARGE ON OPERATING PROFIT BASED ON LONGER-TERM INVESTMENT RETURNS:Long-term business: Asian operationsnote i 329 239 US operations 509 416 UK insurance operationsnote i 260 245
1,098 900 Other operations (106) (34)
Total tax charge on operating profit based on longer-term investment returns, excluding exceptional tax credit 992 866
Exceptional tax creditnote ii (158) –
TOTAL TAX CHARGE ON OPERATING PROFIT BASED ON LONGER-TERM INVESTMENT RETURNS, INCLUDING EXCEPTIONAL TAX CREDITnote ii 834 866
TAX CREDIT ON ITEMS NOT INCLUDED IN OPERATING PROFIT: Tax credit on short-term fluctuations in investment returnsnote iii (222) (26)Tax credit on shareholders’ share of actuarial and other gains and losses on defined benefit
pension schemes (2) (23)Tax charge (credit) on effect of changes in economic assumptions 13 (336)Tax credit on costs of terminated AIA transaction (93) –
Total tax credit on items not included in operating profit (304) (385)
TAX CHARGE ON PROFIT ON ORDINARY ACTIVITIES FROM CONTINUING OPERATIONS (INCLUDING TAX ON ACTUAL INVESTMENT RETURNS) 530 481
Notesi Including tax relief on Asia development expenses and restructuring costs borne by UK insurance operations.ii The tax charge on operating profit based on longer-term investment returns in 2010 of £834 million includes an exceptional tax credit
of £158 million which primarily relates to the impact of the settlement agreed with the UK tax authorities.iii The tax charge on short-term fluctuations in investment returns for 2010 of £(222) million includes a credit of £52 million for a net present value
reduction in US deferred tax liabilities following changes to variable annuity reserving in accordance with revised statutory guidance.

417F
INA
NC
IAL
S
TA
TE
ME
NT
SE
EV
BA
SIS SUP
PL
EM
EN
TA
RY
IN
FO
RM
AT
ION
12 EARNINGS PER SHARE (EPS)
2010 £m 2009 £m
Operating EPS: Operating profit before tax 3,696 3,090 Tax excluding exceptional tax credit (992) (866) Non-controlling interests (4) (3)
Operating profit after tax and non-controlling interests excluding exceptional tax credit 2,700 2,221Exceptional tax credit* 158 –
Operating profit after tax and non-controlling interests including exceptional tax credit 2,858 2,221 Operating EPS (pence) excluding exceptional tax credit 106.9p 88.8pExceptional tax credit (pence) 6.3p –Operating EPS (pence) including exceptional tax credit 113.2p 88.8p
Total EPS: Profit from continuing operations before tax 3,107 1,743 Tax (530) (481) Discontinued operations (net of tax) – (14) Non-controlling interests (4) (3)
Total profit after tax and non-controlling interests 2,573 1,245 Total EPS (pence) including exceptional tax credit 101.9p 49.8p
Average number of shares (millions) 2,524 2,501
* The tax charge attributable to shareholders’ return includes an exceptional tax credit of £158 million which primarily relates to the impact of a settlement agreed with the UK tax authorities.
The average number of shares reflects the average number in issue adjusted for shares held by employee share trusts and consolidated unit trusts and OEICs which are treated as cancelled.

418
Prudential plc Annual Report 2010
FINANCIAL STATEMENTS > EUROPEAN EMBEDDED VALUE (EEV) BASIS SUPPLEMENTARY INFORMATION
NOTES ON THE EEV BASIS RESULTSCONTINUED
13 RECONCILIATION OF NET WORTH AND VALUE OF IN-FORCE BUSINESS note i
2010 £m
Free Surplus
note 8Required
capitalTotal net
worth
Value of in-force
business note iv
Total long-term
business
GROUP SHAREHOLDERS’ EQUITY AT 1 JANUARY 2010 2,065 2,994 5,059 10,283 15,342 New business contribution:notes ii,iii
Excluding Japan (643) 461 (182) 1,615 1,433 Japan (2) – (2) 1 (1) Total (645) 461 (184) 1,616 1,432 Existing business – transfer to net worth 1,690 (372) 1,318 (1,318) – Expected return on existing business 139 84 223 918 1,141 Changes in operating assumptions and experience variances 220 (4) 216 (86) 130 Changes in non-operating assumptions, experience variances
and non-controlling interests (120) 85 (35) 168 133
PROFIT AFTER TAX AND NON-CONTROLLING INTERESTS FROM LONG-TERM BUSINESS 1,284 254 1,538 1,298 2,836
Exchange movements on foreign operations and net investment hedges 78 119 197 457 654
Acquisition of United Overseas Bank (UOB) Life 18 48 66 13 79 Intra-group dividends (including statutory transfer)
and investment in operationsnote v (720) – (720) – (720)Mark to market value movements on Jackson assets
backing surplus and required capital 68 – 68 – 68 Other transfers from net worth (45) – (45) – (45)
SHAREHOLDERS’ EQUITY AT 31 DECEMBER 2010 2,748 3,415 6,163 12,051 18,214
REPRESENTING: ASIAN OPERATIONS SHAREHOLDERS’ EQUITY AT 1 JANUARY 2010 801 585 1,386 4,395 5,781 New business contribution:notes ii,iii
Excluding Japan (278) 84 (194) 866 672 Japan (2) – (2) 1 (1) Total (280) 84 (196) 867 671 Existing business – transfer to net worth 500 20 520 (520) – Expected return on existing business 103 (9) 94 404 498 Changes in operating assumptions and experience variances 3 (15) (12) (40) (52)Changes in non-operating assumptions and experience
variances and non-controlling interests 146 1 147 61 208
PROFIT AFTER TAX AND NON-CONTROLLING INTERESTS FROM LONG-TERM BUSINESS 472 81 553 772 1,325
Exchange movements on foreign operations and net investment hedges 57 76 133 397 530
Acquisition of United Overseas Bank (UOB) Life 18 48 66 13 79 Intra-group dividends (including statutory transfer) and
investment in operationsnote v (295) – (295) 33 (262)Other transfers from net worth (8) – (8) – (8)
SHAREHOLDERS’ EQUITY AT 31 DECEMBER 2010 1,045 790 1,835 5,610 7,445

419F
INA
NC
IAL
S
TA
TE
ME
NT
SE
EV
BA
SIS SUP
PL
EM
EN
TA
RY
IN
FO
RM
AT
ION
2010 £m
Free Surplus
note 8Required
capitalTotal net
worth
Value of in-force
business note iv
Total long-term
business
US OPERATIONS SHAREHOLDERS’ EQUITY AT 1 JANUARY 2010 749 1,405 2,154 1,968 4,122 New business contributionnote ii (300) 270 (30) 525 495 Existing business – transfer to net worth 692 (329) 363 (363) – Expected return on existing business 31 56 87 153 240 Changes in operating assumptions and experience variances 191 18 209 1 210 Changes in non-operating assumptions and experience
variances and non-controlling interests (192) 42 (150) (213) (363)
PROFIT AFTER TAX AND NON-CONTROLLING INTERESTS FROM LONG-TERM BUSINESS 422 57 479 103 582
Exchange movements on foreign operations and net investment hedges 21 43 64 60 124
Intra-group dividends (including statutory transfer) and investment in operations (81) – (81) – (81)
Mark to market value movements on Jackson assets backing surplus and required capital 68 – 68 – 68
Other transfers from net worth (16) – (16) – (16)
SHAREHOLDERS’ EQUITY AT 31 DECEMBER 2010 1,163 1,505 2,668 2,131 4,799
UK INSURANCE OPERATIONS Shareholders’ equity at 1 January 2010 515 1,004 1,519 3,920 5,439 New business contributionnote ii (65) 107 42 224 266 Existing business – transfer to net worth 498 (63) 435 (435) – Expected return on existing business 5 37 42 361 403 Changes in operating assumptions and experience variances 26 (7) 19 (47) (28)Changes in non-operating assumptions and experience
variances and non-controlling interests (74) 42 (32) 320 288
PROFIT AFTER TAX AND NON-CONTROLLING INTERESTS FROM LONG-TERM BUSINESS 390 116 506 423 929
Intra-group dividends (including statutory transfer) and investment in operationsnote v (344) – (344) (33) (377)
Other transfers from net worth (21) – (21) – (21)
SHAREHOLDERS’ EQUITY AT 31 DECEMBER 2010 540 1,120 1,660 4,310 5,970
Notesi All figures are shown net of tax.ii The movements arising from new business contribution and new business capital usage are as follows:
2010 £m
NEW BUSINESS CAPITAL USAGE
Asian operations (excluding
Japan)note iii
US operations
UK insurance
operations
Total long-term
business operations
note iiiJapan
note iii
Total long-term
business operations
Pre-tax new business contributionnote 2 902 761 365 2,028 (1) 2,027 Tax (230) (266) (99) (595) – (595)
Post-tax new business contribution 672 495 266 1,433 (1) 1,432
Free surplus invested in new business (278) (300) (65) (643) (2) (645)
Post-tax new business contribution per £1 million free surplus invested 2.4 1.7 4.1 2.2 (0.5) 2.2

420
Prudential plc Annual Report 2010
FINANCIAL STATEMENTS > EUROPEAN EMBEDDED VALUE (EEV) BASIS SUPPLEMENTARY INFORMATION
NOTES ON THE EEV BASIS RESULTSCONTINUED
13 RECONCILIATION OF NET WORTH AND VALUE OF IN-FORCE BUSINESS note i > CONTINUED
2009 £m
NEW BUSINESS CAPITAL USAGE
Asian operations (excluding
Japan)note iii
US operations
UK insurance
operations
Total long-term
business operations
note iiiJapan
note iii
Total long-term
business operations
Pre-tax new business contributionnote 2 725 664 230 1,619 (12) 1,607 Tax (180) (232) (64) (476) – (476)
Post-tax new business contribution 545 432 166 1,143 (12) 1,131
Free surplus invested in new business (231) (326) (103) (660) (15) (675)
Post-tax new business contribution per £1 million free surplus invested 2.4 1.3 1.6 1.7 (0.8) 1.7
MOVEMENTS ARISING FROM NEW BUSINESS CONTRIBUTION 2010 £m 2009 £m
Free surplus invested in new business: Excluding Japan (643) (660) Japan (2) (15) Total (645) (675)Required capital 461 451
Total net worth (184) (224)Value of in-force business 1,616 1,355
Total post-tax new business contribution 1,432 1,131
iii New business contribution and free surplus invested in new business for the Group’s Japanese insurance subsidiary, which ceased selling new business with effect from 15 February 2010, have been presented separately from those of the remainder of the Group.
iv The value of in-force business includes the value of future margins from current in-force business less the cost of holding required capital and represents:
2010 £m
Asian operations
US operations
UK insurance
operations Group
Value of in-force business before deduction of cost of capital and guarantees 5,941 2,584 4,635 13,160 Cost of capitala (321) (183) (236) (740)Cost of time value of guaranteesb,c (10) (270) (89) (369)
Net value of in-force business 5,610 2,131 4,310 12,051
2009 £m
Asian operations
US operations
UK insurance
operations Group
Value of in-force business before deduction of cost of capital and of guarantees 4,605 2,351 4,181 11,137 Cost of capital (198) (175) (221) (594)Cost of time value of guarantees (12) (208) (40) (260)
Net value of in-force business 4,395 1,968 3,920 10,283
a The increase in cost of capital for Asian operations from 2009 of £(198) million to £(321) million at 2010 mainly arises from the addition of new business, the effect of changes in economic assumptions resulting from changes in economic factors (including the impact of moving from a ‘passive’ to ‘active’ basis as described in note 1b) and the impact of foreign exchange.
b The increase in the cost of time value of guarantees for US operations from 2009 of £(208) million to 2010 of £(270) million primarily relates to Variable Annuity (VA) business, mainly arising from the new business written in the period, reflecting the significant increase in VA sales.
c The increase in the cost of time value of guarantees for UK operations from 2009 of £(40) million to 2010 of £(89) million primarily reflects the effects of short-term fluctuations in investment returns together with the reduction in risk free rate of 0.4 per cent.
v The amounts shown in respect of free surplus and the value of in-force business for Asian and UK operations for intra-group dividends and investment in operations include the impact of contingent loan funding.

421F
INA
NC
IAL
S
TA
TE
ME
NT
SE
EV
BA
SIS SUP
PL
EM
EN
TA
RY
IN
FO
RM
AT
ION
14 EXPECTED TRANSFER OF VALUE OF IN-FORCE BUSINESS TO FREE SURPLUS
The discounted value of in-force business and required capital can be reconciled to the 2010 and 2009 totals in the tables below for the emergence of free surplus as follows:
2010 £m 2009 £m
Required capitalnote 13 3,415 2,994 Value of in-force (VIF)note 13 12,051 10,283 Add back: deduction for cost of time value of guaranteesnote 13 369 260 Other itemsnote (845) (865)
14,990 12,672
Note‘Other items’ represents deductions for amounts incorporated into VIF where there is no definitive timeframe for when the payments will be made. In particular, other items includes the deduction of the value of the shareholders’ interest in the estate, the value of which is derived by increasing final bonus rates so as to exhaust the estate over the lifetime of the in-force with-profits business. This is an assumption to give an appropriate valuation. To be conservative this item is excluded from the expected free surplus generation profile below.
Cash flows are projected on a deterministic basis and are discounted at the appropriate risk discount rate. The modelled cash flows use the same methodology underpinning the Group’s embedded value reporting and so are subject to the same assumptions and sensitivities.
The table below shows how the VIF generated by the in-force business and the associated required capital is modelled as emerging into free surplus over future years.
2010 £m
Expected period of conversion of future post-tax distributable earnings and required capital flows to free surplus
2010 Total as shown above 1-5 years 6-10 years 11-15 years 16-20 years 20+ years
Asian operations 6,329 2,304 1,407 866 591 1,161 US operations 4,078 2,358 1,007 421 173 119 UK insurance operations 4,583 1,792 1,173 755 468 395
Total 14,990 6,454 3,587 2,042 1,232 1,675
100% 43% 24% 14% 8% 11%
2009 £m
Expected period of conversion of future post-tax distributable earnings and required capital flows to free surplus
2009 Total as shown above 1-5 years 6-10 years 11-15 years 16-20 years 20+ years
Asian operations 4,911 1,716 1,121 687 455 932 US operations 3,739 2,129 980 364 153 113 UK insurance operations 4,022 1,591 1,035 653 401 342
Total 12,672 5,436 3,136 1,704 1,009 1,387
100% 43% 25% 13% 8% 11%

422
Prudential plc Annual Report 2010
FINANCIAL STATEMENTS > EUROPEAN EMBEDDED VALUE (EEV) BASIS SUPPLEMENTARY INFORMATION
15 SENSITIVITY OF RESULTS TO ALTERNATIVE ASSUMPTIONS
a Sensitivity analysis – economic assumptionsThe tables below show the sensitivity of the embedded value as at 31 December 2010 (31 December 2009) and the new business contribution after the effect of required capital for 2010 and 2009 to:
• one per cent increase in the discount rates;• one per cent increase and decrease in interest rates, including all consequential changes (assumed investment returns for
all asset classes, market values of fixed interest assets, risk discount rates);• one per cent rise in equity and property yields;• 10 per cent fall in market value of equity and property assets (not applicable for new business contribution); • holding company statutory minimum capital (by contrast to economic capital);• five basis point increase in long-term expected defaults; and• 10 basis point increase in the liquidity premium for UK shareholder-backed annuities.
In each sensitivity calculation, all other assumptions remain unchanged except where they are directly affected by the revised economic conditions.
2010 £m
Asian operations (including
Japan*)US
operations
UK insurance
operations
Total long-term
business operations
NEW BUSINESS PROFIT FOR 2010 As reportednote 10 901 761 365 2,027
Discount rates – 1% increase (111) (51) (53) (215)Interest rates – 1% increase (7) 34 (8) 19 Interest rates – 1% decrease (20) (40) 8 (52)Equity/property yields – 1% rise 41 63 12 116 Long-term expected defaults – 5 bps increase – – (13) (13)Liquidity premium – 10 bps increase – – 26 26
* The impact of the sensitivities above for Japan for 2010 is negligible.
2009 £m
Asian operations (including
Japan)US
operations
UK insurance
operations
Total long-term
businessoperations
NEW BUSINESS PROFIT FOR 2009 As reported 713 664 230 1,607
Discount rates – 1% increase (91) (48) (43) (182)Interest rates – 1% increase (3) 8 (7) (2)Interest rates – 1% decrease 3 (12) 8 (1)Equity/property yields – 1% rise 31 39 11 81 Long-term expected defaults – 5 bps increase – – (9) (9)Liquidity premium – 10 bps increase – – 18 18
NOTES ON THE EEV BASIS RESULTSCONTINUED

423F
INA
NC
IAL
S
TA
TE
ME
NT
SE
EV
BA
SIS SUP
PL
EM
EN
TA
RY
IN
FO
RM
AT
ION
2010 £m
Asian operations
US operations
UK insurance
operations
Total long-term
businessoperations
EMBEDDED VALUE OF LONG-TERM OPERATIONS AT 31 DECEMBER 2010
As reportednote 10 7,445 4,799 5,970 18,214
Discount rates – 1% increase (643) (164) (437) (1,244)Interest rates – 1% increase (220) (148) (254) (622)Interest rates – 1% decrease 176 103 336 615 Equity/property yields – 1% rise 308 120 227 655 Equity/property market values – 10% fall (174) (5) (339) (518)Statutory minimum capital 104 127 5 236 Long-term expected defaults – 5 bps increase – – (87) (87)Liquidity premium – 10 bps increase – – 174 174
2009 £m
Asian operations
US operations
UK insurance
operations
Total long-term
businessoperations
EMBEDDED VALUE OF LONG-TERM OPERATIONS AT 31 DECEMBER 2009
As reportednote 10 5,781 4,122 5,439 15,342
Discount rates – 1% increase (522) (146) (401) (1,069)Interest rates – 1% increase (183) (137) (231) (551)Interest rates – 1% decrease 231 55 298 584 Equity/property yields – 1% rise 255 82 213 550 Equity/property market values – 10% fall (147) (10) (298) (455)Statutory minimum capital 28 123 6 157 Long-term expected defaults – 5 bps increase – – (76) (76)Liquidity premium – 10 bps increase – – 152 152

424
Prudential plc Annual Report 2010
FINANCIAL STATEMENTS > EUROPEAN EMBEDDED VALUE (EEV) BASIS SUPPLEMENTARY INFORMATION
15 SENSITIVITY OF RESULTS TO ALTERNATIVE ASSUMPTIONS > CONTINUED
b Sensitivity analysis – non-economic assumptionsThe tables below show the sensitivity of the embedded value as at 31 December 2010 (31 December 2009) and the new business contribution after the effect of required capital for 2010 and 2009 to:
• 10 per cent proportionate decrease in maintenance expenses (a 10 per cent sensitivity on a base assumption of £10 per annum would represent an expense assumption of £9 per annum);
• 10 per cent proportionate decrease in lapse rates (a 10 per cent sensitivity on a base assumption of five per cent would represent a lapse rate of 4.5 per cent per annum); and
• five per cent proportionate decrease in base mortality and morbidity rates (i.e. increased longevity).
2010 £m
Asian operations (including
Japan*)US
operations
UK insurance
operations
Total long-term
business operations
NEW BUSINESS PROFIT FOR 2010 As reportednote 10 901 761 365 2,027
Maintenance expenses – 10% decrease 27 9 5 41 Lapse rates – 10% decrease 81 31 8 120 Mortality and morbidity – 5% decrease 50 7 (20) 37 Change representing effect on: Life business 50 7 1 58 UK annuities – – (21) (21)
* The impact of the sensitivities above for Japan for 2010 is negligible.
2009 £m
Asian operations (including
Japan)US
operations
UK insurance
operations
Total long-term
business operations
NEW BUSINESS PROFIT FOR 2009 As reported 713 664 230 1,607
Maintenance expenses – 10% decrease 19 9 8 36 Lapse rates – 10% decrease 56 34 11 101 Mortality and morbidity – 5% decrease 37 7 (11) 33 Change representing effect on: Life business 37 7 1 45 UK annuities – – (12) (12)
NOTES ON THE EEV BASIS RESULTSCONTINUED

425F
INA
NC
IAL
S
TA
TE
ME
NT
SE
EV
BA
SIS SUP
PL
EM
EN
TA
RY
IN
FO
RM
AT
ION
2010 £m
Asian operations
US operations
UK insurance
operations
Total long-term
business operations
EMBEDDED VALUE OF LONG-TERM OPERATIONS AT 31 DECEMBER 2010
As reportednote 10 7,445 4,799 5,970 18,214
Maintenance expenses – 10% decrease 104 39 48 191 Lapse rates – 10% decrease 293 158 67 518 Mortality and morbidity – 5% decrease 233 81 (181) 133 Change representing effect on: Life business 233 81 12 326 UK annuities – – (193) (193)
2009 £m
Asian operations
US operations
UK insurance
operations
Total long-term
businessoperations
EMBEDDED VALUE OF LONG-TERM OPERATIONS AT 31 DECEMBER 2009
As reportednote 10 5,781 4,122 5,439 15,342
Maintenance expenses – 10% decrease 77 33 43 153 Lapse rates – 10% decrease 232 141 70 443 Mortality and morbidity – 5% decrease 169 78 (157) 90 Change representing effect on: Life business 169 78 11 258 UK annuities – – (168) (168)
Effect of proposed change in UK corporation tax ratesThe 2010 results include the impact of the change in UK corporate tax rate that has been enacted to reduce the rate from 28 to 27 per cent from 1 April 2011. The effect of further reductions in the UK corporate tax rate to reduce the rate by one per cent per annum each year from the effective rate of 27 per cent applied in 2010 to 24 per cent in 2014 would increase the net of tax value of the in-force business of UK insurance operations at 1 January 2010 by around £80 million.
16 ASSUMPTIONS
a Principal economic assumptionsDeterministic assumptionsThe tables below summarise the principal financial assumptions:
Assumed investment returns reflect the expected future returns on the assets held and allocated to the covered business at the valuation date.
Equity risk premiums in Asia range from 3.25 per cent to 8.7 per cent (2009: 3.0 per cent to 8.35 per cent). In the US and the UK, the equity risk premium is 4.0 per cent (2009: 4.0 per cent).

426
Prudential plc Annual Report 2010
FINANCIAL STATEMENTS > EUROPEAN EMBEDDED VALUE (EEV) BASIS SUPPLEMENTARY INFORMATION
16 ASSUMPTIONS > CONTINUED
ASIAN OPERATIONSnote i
31 Dec 2010 %
Chinanote vi
Hong Kong
notes iii,vIndia Indonesia
notes iii,viJapan Korea
note viMalaysia notes iv,v
Philippinesnotes iii,vi
Singapore note v
Taiwan
Thailand Vietnamnote vi
Risk discount rate: New business 10.45 5.1 13.1 13.0 4.9 7.9 7.0 13.2 5.4 5.0 10.5 18.85 In force 10.45 5.1 13.1 13.0 4.9 8.1 7.1 13.2 6.1 5.2 10.5 18.85 Expected long-term rate of inflation 2.5 2.25 4.0 5.0 – 3.0 2.5 4.0 2.0 1.0 3.0 5.5 Government bond yield 3.95 3.3 8.1 7.75 1.1 4.6 4.0 6.4 2.7 1.6 3.8 12.1
31 Dec 2009 %
Chinanote vi
Hong Kong
notes iii,vIndia Indonesia
notes iii,viJapan Korea
note viMalaysia notes iv,v
Philippinesnotes iii,vi
Singapore note v
Taiwan
Thailand Vietnamnote vi
Risk discount rate: New business 11.75 5.5 14.25 13.8 5.1 8.2 9.1 15.75 5.7 7.5 13.0 16.75 In force 11.75 5.7 14.25 13.8 5.1 8.4 9.3 15.75 6.8 7.5 13.0 16.75 Expected long-term rate of inflation 4.0 2.25 5.0 6.0 – 2.75 2.75 5.0 1.75 2.25 3.0 6.0 Government bond yield 8.25 3.9 9.25 10.25 1.9 5.5 6.5 9.25 4.25 5.5 6.75 10.25
Asia total %
31 Dec 2010 31 Dec 2009
Weighted risk discount rate:note ii
New business (excluding Japan) 8.4 9.0 In force 8.1 8.8
Notesi In preparing the EEV basis results for 2010 the ‘active’ basis of economic assumption setting has been applied for all Asian operations.
For 2009 the ‘active’ basis was applied in preparing the EEV results for Japan, Korea and US dollar denominated business written in Hong Kong, as described in note 1(b).
ii The weighted risk discount rates for Asian operations shown above have been determined by weighting each country’s risk discount rates by reference to the EEV basis new business result and the closing value of in-force business.
iii The assumptions shown are for US dollar denominated business which comprises the largest proportion of the in-force Hong Kong business. The risk discount rates shown for Indonesia and Philippines are for local currency denominated business which comprises the largest proportion of the in-force business in those territories.
iv The risk discount rate for Malaysia reflects both the Malaysia life and Takaful operations.v The mean equity return assumptions for the most significant equity holdings in the Asian operations were:
31 Dec 2010 % 31 Dec 2009 %
Hong Kong 7.3 7.9 Malaysia 10.0 12.4 Singapore 8.7 10.2
To obtain the mean, an average over all simulations of the accumulated return at the end of the projection period is calculated. The annual average return is then calculated by taking the root of the average accumulated return minus 1.
vi In 2009, the Group reconsidered the application of the Group’s methodology for certain less established operations, with a consequent change in the risk discount rates used for Indonesia and Korea and a change in the assumed capital requirement to better align with internal management and pricing bases, primarily in China, Indonesia, Philippines and Vietnam.
NOTES ON THE EEV BASIS RESULTSCONTINUED

427F
INA
NC
IAL
S
TA
TE
ME
NT
SE
EV
BA
SIS SUP
PL
EM
EN
TA
RY
IN
FO
RM
AT
ION
US OPERATIONS (JACKSON)
31 Dec 2010 % 31 Dec 2009 %
Assumed new business spread margins:note iii
Fixed Annuity business (including the proportion of variable annuity business invested in the general account):note i
First five years: January to June issues 2.0 2.75 July to December issues 2.0 2.25 Long-term assumption 2.0 2.0 Fixed Index Annuity business: January to June issues 2.5 3.5 July to December issues 2.5 2.5 Risk discount rate: Variable annuity 7.8 8.2 Non-variable annuity 5.6 6.2 Weighted average total:note ii New business 7.6 7.8 In force 6.9 7.2 US 10-year treasury bond rate at end of period 3.3 3.9 Pre-tax expected long-term nominal rate of return for US equities 7.3 7.9 Expected long-term rate of inflation 2.3 2.4
Notesi For new business issuances in 2010, the assumed spread margin for fixed annuities and for the proportion of variable annuity business
invested in the general account of 2.0 per cent applies from inception for all durations and reflects the combined effects of net annualised yields on new assets of 4.8 per cent and crediting rates. The spread assumptions for 2009 of 2.75 per cent for January to June issuances and 2.25 per cent for July to December issuances, reflected the exceptional combined benefit of high investment yields which were 6.4 per cent for 2009, and lower crediting rates. The assumptions for 2009 included a provision that crediting rates and spreads would normalise in the future. Therefore, the assumption for new business spreads shown above were set at the higher new level for the first five years before reducing over the following 10 years with the valuation of new business taking into account an assumed associated risk of increased lapse under certain interest rate scenarios.
ii The weighted average risk discount rates reflect the mix of business between variable annuity and non-variable annuity business. The decrease in the weighted average risk discount rates from 2009 to 2010 primarily reflects the decrease in the US 10-year Treasury bond rate of 60 bps, partly offset by a change in the product mix with the 2010 results seeing an increase in the proportion of new and in-force business arising from Variable Annuity business.
iii Credit risk treatment The projected cash flows incorporate the expected long-term spread between the earned rate and the rate credited to policyholders. The
projected earned rates reflect book value yields which are adjusted over time to reflect projected reinvestment rates. Positive net cash flows are assumed to be reinvested in a mix of corporate bonds, commercial mortgages and limited partnerships. The yield on those assets is assumed to grade from the current level to a yield that allows for a long-term assumed credit spread on the reinvested assets of 1.25 per cent over 10 years. The expected new business spread margins are determined after allowing for a Risk Margin Reserve (RMR) allowance for 2010 of 26 bps (2009: 28 bps) for longer-term defaults as described in note 1b(iii). The RMR of 26 bps represents the allowance, as at the valuation applied in the cash flow projections of the value of the in-force business.
In the event that longer-term default levels are higher, then unlike for UK annuity business where policyholder benefits are not changeable, Jackson has some discretion to adjust crediting rates, subject to contract guarantee levels and general market competition considerations.
The results for Jackson reflect the application of the discount rates shown above, which for 2010 and 2009 reflect the inclusion of an additional allowance for a combination of credit risk premium and short-term default allowance as described in note 1b(iii) and note 5.
In the event that US 10-year treasury rates increase, the altered embedded value results would reflect a lower contribution from fixed annuity business and a partially offsetting increase for variable annuity business as the projected earned rate, as well as the discount rate, would increase for this type of business.

428
Prudential plc Annual Report 2010
FINANCIAL STATEMENTS > EUROPEAN EMBEDDED VALUE (EEV) BASIS SUPPLEMENTARY INFORMATION
16 ASSUMPTIONS > CONTINUED
UK INSURANCE OPERATIONSnote iv
31 Dec 2010 % 31 Dec 2009 %
SHAREHOLDER-BACKED ANNUITY BUSINESS: Risk discount rate:notes i,iv
New business 7.3 8.7 In force 9.9 10.2 Pre-tax expected long-term nominal rate of return for shareholder-backed annuity business:note iii
Fixed annuities 5.1 5.6 Inflation-linked annuities 5.2 5.8 OTHER BUSINESS: Risk discount rate:notes ii,iv New business 6.9 7.7 In force 7.0 7.4 Pre-tax expected long-term nominal rates of investment return: UK equities 8.0 8.4 Overseas equities 7.3 to 10.2 7.9 to 10.3 Property 6.7 6.7 Gilts 4.0 4.4 Corporate bondsnote iv 5.7 6.1 Expected long-term rate of inflation 3.55 3.7 Post-tax expected long-term nominal rate of return for the PAC with-profits fund: Pension business (where no tax applies) 6.7 6.9 Life business 5.9 6.0
Notesi The risk discount rate applied to shareholder-backed annuity business has been determined after allowing for credit risk as detailed in
note iv below. ii The risk discount rates for new business and business in force for UK insurance operations other than shareholder-backed annuities reflect
weighted rates based on the type of business.iii The pre-tax rates of return for shareholder-backed annuity business are based on the gross redemption yield on the backing assets net of a best
estimate allowance for future defaults.iv Credit spread treatment For with-profits business, the embedded value reflects the discounted value of future shareholder transfers. These transfers are directly
affected by the level of projected rates of return on investments, including debt securities. For 2010 and 2009 results the assumed earned rate for with-profit holdings of corporate bonds is defined as the risk-free rate plus an assessment of the long-term spread over gilts, net of expected long-term defaults. This approach is similar to that applied for equities and properties for which the projected earned rate is defined as the risk-free rate plus a long-term risk premium.
For UK shareholder-backed annuity business, different dynamics apply both in terms of the nature of the business and the EEV methodology applied. For this type of business the assets are generally held to maturity to match long duration liabilities. It is therefore appropriate under EEV methodology to include a liquidity premium in the economic basis used. The appropriate EEV risk discount rate is set in order to equate the EEV with a ‘market consistent embedded value’ including liquidity premium. The liquidity premium in the ‘market consistent embedded value’ is derived from the yield on the assets held after deducting an appropriate allowance for credit risk. The risk discount rate in EEV reflects the excess of the total allowance for credit risk over the best estimate default assumptions. For Prudential Retirement Income Limited (PRIL), which has approximately 88 per cent of UK shareholder-backed annuity business, the allowance for credit risk for the in-force business at 31 December 2010 is made up of:
a 16 basis points for fixed annuities and 14 basis points for inflation-linked annuities in respect of long-term expected defaults. This is derived by applying Moody’s data from 1970 to 2009 uplifted by between 100 per cent (B) and 200 per cent (AAA) according to credit rating, to the asset portfolios.
b 11 basis points for fixed annuities and 9 basis points for inflation-linked annuities in respect of long-term credit risk premium for the potential volatility in default levels. This is derived by applying the 95th worst percentile from Moody’s data from 1970 to 2009, to the asset portfolios.
c 43 basis points for fixed annuities and 39 basis points for inflation-linked annuities in respect of additional short-term credit risk, reflecting short-term credit rating downgrades and defaults in excess of the long-term assumptions. This element of the overall credit assumption has not been derived by reference to credit spreads; rather it has been reduced in order to offset the impact of actual downgrades during the period on the long-term assumptions in (a) and (b) above and increased to eliminate the positive experience variance that would otherwise have arisen from the small number of actual defaults that were experienced in the period. In addition, the assumptions have been updated to reflect changes in the asset mix, arising particularly from the sale of subordinated financial debt and the addition of higher credit quality new business assets (compared to the in-force portfolio).
NOTES ON THE EEV BASIS RESULTSCONTINUED

429F
INA
NC
IAL
S
TA
TE
ME
NT
SE
EV
BA
SIS SUP
PL
EM
EN
TA
RY
IN
FO
RM
AT
ION
The credit assumptions used and the residual liquidity premium element of the bond spread over swap rates is as follows:
IN-FORCE BUSINESS 2010 (bps) 2009 (bps)
Bond spread over swap rates 160 175
Credit risk allowance Long-term expected defaults 16 19 Long-term credit risk premium 10 13 Short-term allowance for credit risk 42 39
Total credit risk allowance2 68 71
Liquidity premium 92 104
NEW BUSINESS1 2010 (bps) 2009 (bps)
Bond spread over swap rates 117 198 Total credit risk allowance2 38 54
Liquidity premium 79 144
Notes 1 The new business liquidity premium is based on the weighted average of the point of sale liquidity premium. 2 For 2010 and 2009, specific assets were allocated to the year’s new business with the appropriate allowance for credit risk which was 38 basis
points (2009: 54 basis points). The reduced allowance for new business in comparison to that for the in-force book reflects the assets held and other factors that influence the necessary level of provision.
The overall allowance for credit risk is prudent by comparison with historic rates of default and would be sufficient to withstand a wide range of extreme credit events over the expected lifetime of the annuity business.
Stochastic assumptionsThe economic assumptions used for the stochastic calculations are consistent with those used for the deterministic calculations described above. Assumptions specific to the stochastic calculations, such as the volatilities of asset returns, reflect local market conditions and are based on a combination of actual market data, historic market data and an assessment of longer-term economic conditions. Common principles have been adopted across the Group for the stochastic asset models, for example, separate modelling of individual asset classes but with allowance for correlation between the various asset classes. Details are given below of the key characteristics and calibrations of each model.
Asian operations• The same asset return models as used in the UK, appropriately calibrated, have been used for the Asian operations as described for
UK insurance operations below. The principal asset classes are government and corporate bonds. Equity holdings are much lower than in the UK whilst property holdings do not represent a significant investment asset.
• The stochastic cost of guarantees is primarily only of significance for the Hong Kong, Korea, Malaysia and Singapore operations.• The mean stochastic returns are consistent with the mean deterministic returns for each country. The expected volatility of equity
returns for 2010 and 2009 ranges from 18 per cent to 35 per cent, and the volatility of government bond yields ranges for 2010 from 0.9 per cent to 2.4 per cent (2009: 1.3 per cent to 2.4 per cent).
US operations (Jackson)• Interest rates are projected using a log-normal generator calibrated to the market yield curve at the valuation date;• Corporate bond returns are based on Treasury securities plus a spread that has been calibrated to current market conditions and
varies by credit quality; and• Variable annuity equity returns and bond interest rates have been stochastically generated using a log-normal model with parameters
determined by reference to historical data. The volatility of equity fund returns for 2010 ranges from 19.0 per cent to 32.1 per cent, (2009: 18.6 per cent to 28.1 per cent) depending on the risk class and the class of equity, and the standard deviation of interest rates ranges from 2.0 per cent to 2.4 per cent (2009: 1.4 per cent to 1.6 per cent).
UK insurance operations• Interest rates are projected using a two-factor model calibrated to the initial market yield curve;• The risk premium on equity assets is assumed to follow a log-normal distribution;• The corporate bond return is calculated as the return on a zero-coupon bond plus a spread. The spread process is a mean reverting
stochastic process; and• Property returns are modelled in a similar fashion to corporate bonds, namely as the return on a riskless bond, plus a risk premium,
plus a process representative of the change in residual values and the change in value of the call option on rents.

430
Prudential plc Annual Report 2010
FINANCIAL STATEMENTS > EUROPEAN EMBEDDED VALUE (EEV) BASIS SUPPLEMENTARY INFORMATION
16 ASSUMPTIONS > CONTINUED
Mean returns have been derived as the annualised arithmetic average return across all simulations and durations. For each projection year, standard deviations have been calculated by taking the square root of the annualised variance of the returns over all the simulations. These have been averaged over all durations in the projection. For equity and property, the standard deviations relate to the total return on these assets. The standard deviations applied are as follows:
2010 % 2009 %
Equities: UK 18.0 18.0 Overseas 18.0 18.0 Property 15.0 15.0
b Demographic assumptionsPersistency, mortality and morbidity assumptions are based on an analysis of recent experience but also reflect expected future experience. Where relevant, when calculating the time value of financial options and guarantees, policyholder withdrawal rates vary in line with the emerging investment conditions according to management’s expectations.
c Expense assumptionsExpense levels, including those of service companies that support the Group’s long-term business operations, are based on internal expense analysis investigations and are appropriately allocated to acquisition of new business and renewal of in-force business. Exceptional expenses are identified and reported separately. It is Prudential’s policy not to take credit for future cost reduction programmes until the savings have been delivered. For Asian life operations, the expenses comprise costs borne directly and recharged costs from the Asia Regional Head Office, that are attributable to covered business. The assumed future expenses for these operations also include projections of these future recharges. Expenditure of the Regional Head Office that is not allocated to the covered business or asset management operations is charged as incurred. These costs are primarily for corporate related activities. Development expenses are also charged as incurred. Corporate expenditure for Group Head Office, to the extent not allocated to the PAC with-profits funds, together with Solvency II implementation and restructuring costs, are charged to EEV basis results as incurred.
d Taxation and other legislationCurrent taxation and other legislation have been assumed to continue unaltered except where changes have been announced and the relevant legislation passed.
17 ACQUISITION OF UNITED OVERSEAS BANK LIFE ASSURANCE LIMITED
On 1 February 2010, the Group acquired from United Overseas Bank (UOB) its 100 per cent interest in UOB Life Assurance Limited in Singapore for total cash consideration, after post-completion adjustments of SGD67 million (£32 million), of SGD495 million (£220 million). As part of the transaction the Group also entered into a long-term strategic partnership to develop a major regional bancassurance business with UOB. In addition to the amounts above the Group incurred £2 million of acquisition-related costs (excluding integration costs).
Goodwill arising on acquisition
£m
Cash consideration 220 Less: fair value of identifiable net assets acquired (79)
Goodwill arising on acquisition 141
Goodwill arose on the acquisition of UOB Life Assurance Limited in Singapore because the acquisition included revenue and cost synergies. These synergies could not be recognised as assets separately from goodwill because they are not capable of being separated from the Group and sold, transferred, licensed, rented or exchanged, either individually or together with any related contracts and did not arise from contractual or other legal rights. None of the goodwill arising on this transaction is expected to be deductible for tax purposes.
NOTES ON THE EEV BASIS RESULTSCONTINUED

431F
INA
NC
IAL
S
TA
TE
ME
NT
SE
EV
BA
SIS SUP
PL
EM
EN
TA
RY
IN
FO
RM
AT
ION
18 DILUTION OF HOLDING IN PRUHEALTH
On 1 August 2010, Discovery Holdings of South Africa, the Group’s joint venture partner in its investment in PruHealth completed the acquisition of the entire share capital of Standard Life Healthcare, a wholly-owned subsidiary of the Standard Life Group, for £138 million. Discovery funded the purchase of the Standard Life Healthcare transaction, and contributed Standard Life Healthcare to PruHealth as a capital investment on completion. As a result of the transaction, Discovery have increased their shareholding in PruHealth from the previous level of 50 per cent to 75 per cent, and Prudential’s shareholding has been reduced from 50 per cent of the previous joint venture structure to 25 per cent of the new structure with the much enlarged business. A gain of £3 million arises upon the dilution, representing the difference between the fair value of the enlarged 25 per cent investment still held and the book value of the original 50 per cent investment holding.
19 SALE OF THE TAIWAN AGENCY BUSINESS IN 2009
2009 £m
Profit on sale and results for Taiwan agency business 91
In 2009, the Company sold the assets and liabilities of its agency distribution business and its agency force in Taiwan to China Life Insurance Company Ltd of Taiwan for the nominal sum of NT$1. In addition, the Company invested £45 million to purchase a 9.99 per cent stake in China Life through a share placement. The sale was completed on 19 June 2009. The Company retained its interest in life insurance business in Taiwan through its retained bank distribution partnerships and its direct investment of 9.99 per cent in China Life made in 2009. At 31 December 2010 the Company’s interest in China Life was 8.66 per cent. The profit on sale and results for the period of ownership comprise:
£m
Proceeds –Net asset value attributable to equity holders of Company after the effect of completion and other adjustments
and provision for restructuring costs 135Goodwill written off (44)
91
Representing:Profit arising on sale and result for long-term business operations 148Goodwill written off (44)Adjustments in respect of restructuring costs borne by non-covered business (13)
91
20 POST BALANCE SHEET EVENTS
In January 2011, the Company issued US$550 million 7.75 per cent Tier 1 subordinated debt, primarily to retail investors. The proceeds, net of costs, were US$539 million and are intended to finance the repayment of the ¤500 million Tier 2 subordinated notes in December 2011.

432
Prudential plc Annual Report 2010
FINANCIAL STATEMENTS > EUROPEAN EMBEDDED VALUE (EEV) BASIS SUPPLEMENTARY INFORMATION
21 NEW BUSINESS PREMIUMS AND CONTRIBUTIONS notes i,ii,iii
Single Regular
Annual premium and contribution
equivalents (APE)
Present value of new business premiums
(PVNBP)
2010 £m 2009 £m 2010 £m 2009 £m 2010 £m 2009 £m 2010 £m 2009 £m
GROUP INSURANCE OPERATIONS Asia – excl Japannote iii 1,104 785 1,391 1,131 1,501 1,209 7,493 5,982 US 11,417 8,885 22 24 1,164 912 11,572 9,048 UK 5,656 4,768 254 246 820 723 6,842 5,902
GROUP TOTAL – EXCL JAPAN 18,177 14,438 1,667 1,401 3,485 2,844 25,907 20,932 Japannote iii 13 57 6 46 7 52 39 263
GROUP TOTAL 18,190 14,495 1,673 1,447 3,492 2,896 25,946 21,195
ASIAN INSURANCE OPERATIONS Hong Kong 107 94 276 232 287 241 1,693 1,414 Indonesia 141 41 269 186 283 190 1,011 671 Malaysia 58 63 198 140 204 146 1,153 814 Philippines 64 14 17 10 23 11 108 39 Singapore 318 297 143 98 175 128 1,357 1,033 Thailand 15 14 25 14 26 16 100 54 Vietnam 1 1 41 35 41 35 148 128
SE Asian operations inc. Hong Kong 704 524 969 715 1,039 767 5,570 4,153 China (Group’s 50% interest) 103 72 48 38 58 45 336 253 India (Group’s 26% interest) 85 47 180 163 188 168 582 581 Korea 66 38 89 118 96 122 486 568 Taiwan 146 104 105 97 120 107 519 427
TOTAL ASIAN OPERATIONS – EXCL JAPAN 1,104 785 1,391 1,131 1,501 1,209 7,493 5,982
US INSURANCE OPERATIONS Fixed annuities 836 1,053 – – 84 105 836 1,053 Fixed index annuities 1,089 1,433 – – 109 143 1,089 1,433 Life 11 10 22 24 23 25 166 173 Variable annuities 9,481 6,389 – – 948 639 9,481 6,389
TOTAL US INSURANCE OPERATIONS 11,417 8,885 22 24 1,164 912 11,572 9,048
UK INSURANCE OPERATIONS Direct and partnership annuities 593 590 – – 59 59 593 590 Intermediated annuities 221 242 – – 22 24 221 242 Internal vesting annuities 1,235 1,357 – – 124 136 1,235 1,357
Total individual annuities 2,049 2,189 – – 205 219 2,049 2,189
Corporate pensions 228 192 198 191 221 210 1,099 1,007 Onshore bonds 1,660 1,444 – – 166 145 1,660 1,444 Other products 774 881 56 55 133 143 1,089 1,200 Wholesalenote iv 945 62 – – 95 6 945 62
TOTAL UK INSURANCE OPERATIONS 5,656 4,768 254 246 820 723 6,842 5,902
GROUP TOTAL – EXCL JAPAN 18,177 14,438 1,667 1,401 3,485 2,844 25,907 20,932
NOTES ON THE EEV BASIS RESULTSCONTINUED

433F
INA
NC
IAL
S
TA
TE
ME
NT
SE
EV
BA
SIS SUP
PL
EM
EN
TA
RY
IN
FO
RM
AT
ION
Notesi The tables shown above are provided as an indicative volume measure of transactions undertaken in the reporting period that have the potential
to generate profits for shareholders. The amounts shown are not, and not intended to be, reflective of premium income recorded in the IFRS income statement.
Annual Premiums Equivalents (APE) are calculated as the aggregate of regular new business amounts and one-tenth of single new business amounts and are subject to roundings. The Present Value of New Business Premiums (PVNBP) are calculated as equalling single premiums plus the present value of expected premiums of new regular premium business, allowing for lapses and other assumptions made in determining the EEV new business contribution.
New business premiums reflect those premiums attaching to covered business, including premiums for contracts classified as investment products for IFRS basis reporting. New business premiums for regular premium products are shown on an annualised basis. Internal vesting business is classified as new business where the contracts include an open market option.
ii The table above includes new business for the Taiwan bank distribution operation. New business of the Taiwan Agency business, which was sold in June 2009, is excluded from the table.
iii New business sales for the Group’s Japanese insurance subsidiary, which ceased selling new business with effect from 15 February 2010, have been presented separately from the remainder of the Group.
iv UK wholesale sales for 2010 include amounts for a bulk annuity buy-in insurance agreement with an APE of £88 million.

434
Prudential plc Annual Report 2010
FINANCIAL STATEMENTS > STATEMENT OF DIRECTORS’ RESPONSIBILITIES
The directors have chosen to prepare supplementary information in accordance with the EEV Principles issued in May 2004 by the European CFO Forum as supplemented by the Additional Guidance on EEV Disclosures issued in October 2005.
When compliance with the EEV Principles is stated, those principles require the directors to prepare supplementary information in accordance with the Embedded Value Methodology (EVM) contained in the EEV Principles and to disclose and explain any non-compliance with the EEV guidance included in the EEV Principles.
In preparing the EEV supplementary information, the directors have:
• Prepared the supplementary information in accordance with the EEV Principles;
• identified and described the business covered by the EVM;• applied the EVM consistently to the covered business;• determined assumptions on a realistic basis, having regard
to past, current and expected future experience and to any relevant external data, and then applied them consistently;
• made estimates that are reasonable and consistent; and• described the basis on which business that is not covered
business has been included in the supplementary information, including any material departures from the accounting framework applicable to the Group’s financial statements.
STATEMENT OF DIRECTORS’ RESPONSIBILITIES IN RESPECT OF THE EUROPEAN EMBEDDED VALUE (EEV) BASIS SUPPLEMENTARY INFORMATION

435F
INA
NC
IAL
S
TA
TE
ME
NT
SE
EV
BA
SIS SUP
PL
EM
EN
TA
RY
IN
FO
RM
AT
ION
FINANCIAL STATEMENTS > INDEPENDENT AUDITOR’S REPORT
We have audited the EEV basis supplementary information (‘the supplementary information’) of Prudential plc (‘the Company’) for the year ended 31 December 2010 set out on pages 389 to 433. The financial reporting framework that has been applied in the preparation of the supplementary information is the European Embedded Value Principles issued in May 2004 by the European CFO Forum as supplemented by the Additional Guidance on European Embedded Value Disclosures issued in October 2005 (together ‘the EEV Principles’) using the methodology and assumptions set out on pages 395 to 400 and 425 to 430 respectively. The supplementary information should be read in conjunction with the Group financial statements which are on pages 153 to 352.
This report is made solely to the Company in accordance with the terms of our engagement. Our audit work has been undertaken so that we might state to the Company those matters we have been engaged to state in this report and for no other purpose. To the fullest extent permitted by law, we do not accept or assume responsibility to anyone other than the Company for our audit work, for this report, or for the opinions we have formed.
Respective responsibilities of directors and auditorAs explained more fully in the Directors’ Responsibilities Statement set out on page 434, the directors have accepted responsibility for the preparation of the supplementary information on the EEV basis in accordance with the EEV Principles.
Our responsibility is to audit, and express an opinion on, the supplementary information in accordance with the terms of our engagement and having regard to International Standards on Auditing (UK and Ireland). Those standards require us to comply with the Auditing Practices Board’s (APB’s) Ethical Standards for Auditors.
Scope of the audit of the supplementary informationAn audit involves obtaining evidence about the amounts and disclosures in the supplementary information sufficient to give reasonable assurance that the supplementary information is free from material misstatement, whether caused by fraud or error. This includes an assessment of: whether the accounting policies are appropriate to Group’s circumstances and have been consistently applied and adequately disclosed; and the reasonableness of significant accounting estimates made by the directors. In view of the purpose for which the supplementary information has been prepared, however, we did not assess the overall presentation of the supplementary information which would have been required if we were to express an audit opinion under International Standards on Auditing (UK and Ireland).
Opinion on supplementary informationIn our opinion, the EEV basis supplementary information of the Company for the year ended 31 December 2010 has been properly prepared, in all material respects, in accordance with the EEV Principles using the methodology and assumptions set out on pages 395 to 400 and 425 to 430 respectively.
G BAINBRIDGE FOR AND ON BEHALF OF KPMG AUDIT PLC Chartered Accountants London
8 March 2011
INDEPENDENT AUDITOR’S REPORT TO PRUDENTIAL PLC ON THE EUROPEAN EMBEDDED VALUE (EEV) BASIS SUPPLEMENTARY INFORMATION

436
Prudential plc Annual Report 2010

437
438 Risk factors443 Shareholder information445 How to contact us
AD
DIT
ION
AL
IN
FO
RM
AT
ION
ADDITIONAL INFORMATION

438
Prudential plc Annual Report 2010
ADDITIONAL INFORMATION > RISK FACTORS
A number of factors (risk factors) affect Prudential’s operating results and financial condition and, accordingly, the trading price of its shares. The risk factors mentioned below should not be regarded as a complete and comprehensive statement of all potential risks and uncertainties. The information given is as of the date of this report, is not updated, and any forward looking statements are made subject to the reservations specified below under ‘Forward Looking Statements’.
Prudential’s approaches to managing risks are explained in the ‘Business review’ section under ‘Risk and capital management’.
Risks relating to Prudential’s businessPrudential’s businesses are inherently subject to market fluctuations and general economic conditionsPrudential’s businesses are inherently subject to market fluctuations and general economic conditions. Uncertain or negative trends in international economic and investment climates could adversely affect Prudential’s business and profitability. The adverse effects of volatility arising from such uncertainty and negative trends, including the unprecedented market dislocation across asset classes and geographical markets witnessed in 2008 and in the first half of 2009, have been and would be felt principally through the following:
• investment impairments or reduced investment returns, as a result of market volatility, could impair Prudential’s ability to write significant volumes of new business which would have a negative impact on its assets under management and profit;
• higher credit defaults and wider credit and liquidity spreads resulting in realised and unrealised credit losses, as experienced during 2008 and 2009, when illiquidity and credit spreads reached all-time highs;
• Prudential in the normal course of business enters into a variety of transactions with counterparties, including derivative transactions. Failure of any of these counterparties to discharge their obligations, or where adequate collateral is not in place, could have an adverse impact on Prudential’s results; and
• estimates of the value of financial instruments are difficult because in certain illiquid or closed markets, determining the value at which financial instruments can be realised is highly subjective. Processes to ascertain value and estimates of value require substantial elements of judgement, assumptions and estimates (which may change over time). Increased illiquidity also adds to uncertainty over the accessibility of financial resources and may reduce capital resources as valuations decline.
During the period of market dislocation in 2008 and the first half of 2009, Prudential had to operate against a challenging background of unprecedented volatility in the global capital and equity markets and interest rates and widespread economic uncertainty. Government interest rates fell to historic lows in
the US, global credit spreads widened to historic levels, and credit markets seized up reducing liquidity. These factors had a significant adverse effect on Prudential’s business and profitability during that period. Although global markets partially stabilised in 2009 and 2010, interest rates remain low, and many of the challenges of 2008 persist in the credit markets. New challenges may continue to emerge.
For some non-unit-linked investment products, in particular those written in some of the Group’s Asian operations, it may not be possible to hold assets which will provide cash flows to match exactly those relating to policyholder liabilities. This is particularly true in those countries where bond markets are not developed and in certain markets where regulated surrender values are set with reference to the interest rate environment prevailing at the time of policy issue. This results in a mismatch due to the duration and uncertainty of the liability cash flows and the lack of sufficient assets of a suitable duration. While this residual asset/liability mismatch risk can be managed, it cannot be eliminated. Where interest rates in these markets remain lower than interest rates used to calculate surrender values over a sustained period, this could have an adverse impact on Prudential’s reported profit.
In the US, fluctuations in prevailing interest rates can affect results from Jackson National Life Insurance Company (‘Jackson’) which has a significant spread-based business, with the majority of its assets invested in fixed income securities. In particular, fixed annuities and stable value products written by Jackson expose Prudential to the risk that changes in interest rates, which are not fully reflected in the interest rates credited to customers, will reduce spread. The spread is the difference between the rate of return Jackson is able to earn on the assets backing the policyholders’ liabilities and the amounts that are credited to policyholders in the form of benefit increases, subject to minimum crediting rates.
Declines in spread from these products or other spread businesses that Jackson conducts could have a material impact on its businesses or results of operations. Jackson also writes a significant amount of variable annuities that offer capital or income protection guarantees. There could be unforeseen market circumstances where the derivatives that it enters into to hedge its market risks may not fully offset its losses, and any cost of the guarantees that remain unhedged will also affect Prudential’s results.
A significant part of the profit from Prudential’s UK insurance operations is related to bonuses for policyholders declared on with-profits products, which are broadly based on historical and current rates of return on equity, real estate and fixed income securities, as well as Prudential’s expectations of future investment returns.
RISK FACTORS

439A
DD
ITIO
NA
L
INF
OR
MA
TIO
N
Prudential is subject to the risk of potential sovereign debt credit deterioration owing to the amounts of sovereign debt obligations held in its investment portfolioPrudential is subject to the risk of potential sovereign debt credit deterioration and default. Investment in sovereign debt obligations involves risks not present in debt obligations of corporate issuers. Investing in such instruments creates exposure to the direct or indirect consequences of political, social or economic changes (including changes in governments, heads of states or monarchs) in the countries in which the issuers are located and the creditworthiness of the sovereign. In addition, the issuer of the debt or the governmental authorities that control the repayment of the debt may be unable or unwilling to repay principal or pay interest when due in accordance with the terms of such debt, and Prudential may have limited recourse to compel payment in the event of a default. A sovereign debtor’s willingness or ability to repay principal and to pay interest in a timely manner may be affected by, among other factors, its cash flow situation, its relations with its central bank, the extent of its foreign currency reserves, the availability of sufficient foreign exchange on the date a payment is due, the relative size of the debt service burden to the economy as a whole, the sovereign debtor’s policy toward local and international lenders, and the political constraints to which the sovereign debtor may be subject. Periods of economic uncertainty may affect the volatility of market prices of sovereign debt to a greater extent than the volatility inherent in debt obligations of other types of issues. If a sovereign were to default on its obligations, this could have a material adverse effect on Prudential’s financial condition and results of operations.
Prudential is subject to the risk of exchange rate fluctuations owing to the geographical diversity of its businessesDue to their geographical diversity, Prudential’s businesses are subject to the risk of exchange rate fluctuations. Prudential’s operations in the US and Asia, which represent a significant proportion of operating profit and shareholders’ funds, generally write policies and invest in assets denominated in local currency. Although this practice limits the effect of exchange rate fluctuations on local operating results, it can lead to significant fluctuations in Prudential’s consolidated financial statements upon translation of results into pounds sterling. The currency exposure relating to the translation of reported earnings is not currently separately managed. The impact of gains or losses on currency translations is recorded as a component of shareholders’ funds within other comprehensive income. Consequently, this could impact on Prudential’s gearing ratios (defined as debt over debt plus shareholders’ funds).
Prudential conducts its businesses subject to regulation and associated regulatory risks, including the effects of changes in the laws, regulations, policies and interpretations and any accounting standards in the markets in which it operatesChanges in government policy, legislation (including tax) or regulatory interpretation applying to companies in the financial services and insurance industries in any of the markets in which Prudential operates, which in some circumstances may be applied retrospectively, may adversely affect Prudential’s product range, distribution channels, capital requirements and, consequently, reported results and financing requirements. Also, regulators in jurisdictions in which Prudential operates may change the level of capital required to be held by individual businesses or could introduce possible changes in the regulatory framework for pension arrangements and policies, the regulation of selling practices and solvency requirements. Furthermore, as a result of the recent interventions by governments in response to global economic conditions, it is widely expected that there will be a substantial increase in government regulation and supervision of the financial services industry, including the possibility of higher capital requirements, restrictions on certain types of transaction structure, and enhanced supervisory powers.
Current EU directives, including the EU Insurance Groups Directive (IGD) require European financial services groups to demonstrate net aggregate surplus capital in excess of solvency requirements at the group level in respect of shareholder-owned entities. The test is a continuous requirement, so that Prudential needs to maintain a somewhat higher amount of regulatory capital at the group level than otherwise necessary in respect of some of its individual businesses to accommodate, for example, short-term movements in global foreign exchange rates, interest rates, deterioration in credit quality and equity markets. The EU is also developing a new solvency framework for insurance companies, referred to as ‘Solvency II’. The new approach will be based on the concept of three pillars – minimum capital requirements, supervisory review of firms’ assessment of risk, and enhanced disclosure requirements – and will cover valuations, the treatment of insurance groups, the definition of capital and the overall level of capital requirements. A key aspect of Solvency II is that the assessment of risks and capital requirements will be aligned more closely with economic capital methodologies, and may allow Prudential to make use of its internal economic capital models, if approved by the Financial Services Authority (FSA) or other relevant supervisory authority. The Solvency II Directive was formally approved by a meeting of the EU’s Economic and Financial Affairs Council on 10 November 2009. The European Commission is in the process of consulting on the detailed rules that will complement the high-level Principles of the Directive, referred to as ‘implementing measures’, which are not expected to be finalised until late 2011. There is a significant uncertainty regarding the final outcome of this process. As a result there is a risk that the effect of the measures finally adopted could be adverse for Prudential, including potentially a significant increase in capital required to support its business.

440
Prudential plc Annual Report 2010
ADDITIONAL INFORMATION > RISK FACTORS
Various jurisdictions in which Prudential operates have created investor compensation schemes that require mandatory contributions from market participants in some instances in the event of a failure of a market participant. As a major participant in the majority of its chosen markets, circumstances could arise where Prudential, along with other companies, may be required to make such contributions.
The Group’s accounts are prepared in accordance with current International Financial Reporting Standards (IFRS) applicable to the insurance industry. The International Accounting Standards Board (IASB) introduced a framework that it described as Phase I, which permitted insurers to continue to use the statutory basis of accounting for insurance assets and liabilities that existed in their jurisdictions prior to January 2005. In July 2010, the IASB has published an Exposure Draft for its Phase II on insurance accounting, which would introduce significant changes to the statutory reporting of insurance entities that prepare accounts according to IFRS. The IASB has indicated a target date of June 2011 for issuing a final standard but it remains uncertain whether and how the proposals in the Exposure Draft will become definitive IFRS and when such changes might take effect.
Any changes or modification of IFRS accounting policies may require a change in the future results or a restatement of reported results.
European Embedded Value (EEV) basis results are published as supplementary information by Prudential using principles issued by the European CFO (Chief Financial Officers) Forum. The EEV basis is a value-based reporting method for Prudential’s long-term business which is used by market analysts and which underpins a significant part of the key performance indicators used by Prudential’s management for both internal and external reporting purposes. In June 2008, in an effort to improve the consistency and transparency of embedded value reporting, the CFO Forum published the Market Consistent Embedded Value (MCEV) Principles. Following a review of the impact of turbulent market conditions on the MCEV Principles, the CFO Forum announced in May 2009 the postponement of the mandatory reporting on an MCEV basis and subsequently, in October 2009, changes in the Principles to allow for the inclusion of a liquidity premium, which is the additional return investors require for investing in less liquid assets and is a key component in the calculation of the profitability of UK annuity business. It also announced that it was performing further work to develop more detailed application guidance to increase consistency going forward. When the work has been completed, Prudential will consider its approach to the new Principles. The adoption of the new Principles would give rise to different embedded value results from those prepared under the application of European Embedded Value Principles.
The resolution of several issues affecting the financial services industry could have a negative impact on Prudential’s reported results or on its relations with current and potential customersPrudential is, and in the future may be, subject to legal and regulatory actions in the ordinary course of its business, both in the UK and internationally. These actions could involve a review of business sold in the past under acceptable market practices at the time, such as the requirement in the UK to provide redress to certain past purchasers of pension and mortgage endowment policies, changes to the tax regime affecting products and regulatory reviews on products sold and industry practices, including, in the latter case, businesses it has closed.
Regulators particularly, but not exclusively, in the US and the UK are moving towards a regime based on principles-based regulation which brings an element of uncertainty. These regulators are increasingly interested in the approach that product providers use to select third-party distributors and to monitor the appropriateness of sales made by them. In some cases, product providers can be held responsible for the deficiencies of third-party distributors.
In the US, federal and state regulators have focused on, and continue to devote substantial attention to, the mutual fund, fixed index annuity and insurance product industries. This focus includes new regulations in respect of the suitability of sales of certain products. As a result of publicity relating to widespread perceptions of industry abuses, there have been numerous regulatory inquiries and proposals for legislative and regulatory reforms.
In Asia, regulatory regimes are developing at different speeds, driven by a combination of global factors and local considerations. There is a risk that new requirements are introduced that challenge current practices, or are retrospectively applied to sales made prior to their introduction.
Litigation, disputes and regulatory investigations may adversely affect Prudential’s profitability and financial conditionPrudential is, and may be in the future, subject to legal actions, disputes and regulatory investigations in the ordinary course of its insurance, investment management and other business operations. These legal actions, disputes and investigations may relate to aspects of Prudential’s businesses and operations that are specific to Prudential or that are common to companies that operate in Prudential’s markets. Legal actions and disputes may arise under contracts, regulations (including tax) or from a course of conduct taken by Prudential, and may be class actions. Although Prudential believes that it has adequately provided in all material aspects for the costs of litigation and regulatory matters, no assurance can be provided that such provisions are sufficient. Given the large or indeterminate amounts of damages sometimes sought, and the inherent unpredictability of litigation and disputes, it is possible that an adverse outcome could, from time to time, have an adverse effect on Prudential’s results of operations or cash flows.
RISK FACTORSCONTINUED

441A
DD
ITIO
NA
L
INF
OR
MA
TIO
N
Prudential’s businesses are conducted in highly competitive environments with developing demographic trends and continued profitability depends on management’s ability to respond to these pressures and trendsThe markets for financial services in the UK, US and Asia are highly competitive, with several factors affecting Prudential’s ability to sell its products and continued profitability, including price and yields offered, financial strength and ratings, range of product lines and product quality, brand strength and name recognition, investment management performance, historical bonus levels, developing demographic trends and customer appetite for certain savings products. In some of its markets, Prudential faces competitors that are larger, have greater financial resources or a greater market share, offer a broader range of products or have higher bonus rates or claims-paying ratios. Further, heightened competition for talented and skilled employees and agents with local experience, particularly in Asia, may limit Prudential’s potential to grow its business as quickly as planned.
In Asia, the Group’s principal regional competitors are international financial companies, including Allianz, AXA, ING, AIA and Manulife. In a number of markets, local companies have a very significant market presence.
Within the UK, Prudential’s principal competitors in the life market include many of the major retail financial services companies including, in particular, Aviva, Legal & General, Lloyds Banking Group and Standard Life.
Jackson’s competitors in the US include major stock and mutual insurance companies, mutual fund organisations, banks and other financial services companies such as AIG, AXA Financial Inc., Hartford Life Inc., Lincoln National, MetLife and TIAA-CREF.
Prudential believes competition will intensify across all regions in response to consumer demand, technological advances, the impact of consolidation, regulatory actions and other factors. Prudential’s ability to generate an appropriate return depends significantly upon its capacity to anticipate and respond appropriately to these competitive pressures.
Downgrades in Prudential’s financial strength and credit ratings could significantly impact its competitive position and hurt its relationships with creditors or trading counterpartiesPrudential’s financial strength and credit ratings, which are used by the market to measure its ability to meet policyholder obligations, are an important factor affecting public confidence in most of Prudential’s products, and as a result its competitiveness. Downgrades in Prudential’s ratings, as a result of, for example, decreased profitability, increased costs, increased indebtedness or other concerns, could have an adverse effect on its ability to
market products and retain current policyholders. In addition, the interest rates Prudential pays on its borrowings are affected by its debt credit ratings, which are in place to measure the Group’s ability to meet its contractual obligations.
Prudential’s long-term senior debt is rated as A2 (negative outlook) by Moody’s, A+ by Standard & Poor’s and A by Fitch;
Prudential’s short-term debt is rated as P-1 by Moody’s, A-1 by Standard & Poor’s and F1 by Fitch;
The Prudential Assurance Company Limited long-term fund is rated Aa2 (negative outlook) by Moody’s, AA by Standard & Poor’s and AA by Fitch;
Jackson’s financial strength is rated AA by Standard & Poor’s and Fitch, A1 (negative outlook) by Moody’s, and A+ by AM Best.
In addition, changes in methodologies and criteria used by rating agencies could result in downgrades that do not reflect changes in the general economic conditions or Prudential’s financial condition.
Adverse experience in the operational risks inherent in Prudential’s business could have a negative impact on its results of operationsOperational risks are present in all of Prudential’s businesses, including the risk of direct or indirect loss resulting from inadequate or failed internal and external processes, systems and human error or from external events. Prudential’s business is dependent on processing a large number of complex transactions across numerous and diverse products, and is subject to a number of different legal and regulatory regimes. In addition, Prudential outsources several operations, including a significant part of its UK back office and customer-facing functions as well as a number of IT functions, resulting in reliance upon the operational processing performance of its outsourcing partners.
Further, because of the long-term nature of much of the Group’s business, accurate records have to be maintained for significant periods. Prudential’s systems and processes incorporate controls which are designed to manage and mitigate the operational risks associated with its activities. For example, any weakness in the administration systems or actuarial reserving processes could have an impact on its results of operations during the effective period. Prudential has not experienced or identified any operational risks in its systems or processes during 2010, which have subsequently caused, or are expected to cause, a significant negative impact on its results of operations.

442
Prudential plc Annual Report 2010
ADDITIONAL INFORMATION > RISK FACTORS
Adverse experience against the assumptions used in pricing products and reporting business results could significantly affect Prudential’s results of operationsPrudential needs to make assumptions about a number of factors in determining the pricing of its products and setting reserves and for reporting its capital levels and the results of its long-term business operations. For example, the assumption that Prudential makes about future expected levels of mortality is particularly relevant for its UK annuity business. In exchange for a premium equal to the capital value of their accumulated pension fund, pension annuity policyholders receive a guaranteed payment, usually monthly, for as long as they are alive. Prudential conducts rigorous research into longevity risk, using data from its substantial annuitant portfolio. As part of its pension annuity pricing and reserving policy, Prudential’s UK business assumes that current rates of mortality continuously improve over time at levels based on adjusted data from the Continuous Mortality Investigations (CMI) as published by the Institute and Faculty of Actuaries. If mortality improvement rates significantly exceed the improvement assumed, Prudential’s results of operations could be adversely affected.
A further example is the assumption that Prudential makes about future expected levels of the rates of early termination of products by its customers (persistency). This is particularly relevant to its lines of business other than its UK annuity business. Prudential’s persistency assumptions reflect recent past experience for each relevant line of business. Any expected deterioration in future persistency is also reflected in the assumption. If actual levels of future persistency are significantly lower than assumed (that is, policy termination rates are significantly higher than assumed), the Group’s results of operations could be adversely affected.
Another example is the impact of epidemics and other effects that cause a large number of deaths. Significant influenza epidemics have occurred three times in the last century, but the likelihood, timing or the severity of future epidemics cannot be predicted. The effectiveness of external parties, including governmental and non-governmental organisations, in combating the spread and severity of any epidemics could have a material impact on the Group’s loss experience.
In common with other industry participants, the profitability of the Group’s businesses depends on a mix of factors including mortality and morbidity trends, policy surrender rates, investment performance and impairments, unit cost of administration and new business acquisition expense.
As a holding company, Prudential is dependent upon its subsidiaries to cover operating expenses and dividend paymentsThe Group’s insurance and investment management operations are generally conducted through direct and indirect subsidiaries
As a holding company, Prudential’s principal sources of funds are remittances from subsidiaries, shareholder-backed funds, the shareholder transfer from long-term funds and any amounts
that may be raised through the issuance of equity, debt and commercial paper. Certain of the subsidiaries are restricted by applicable insurance, foreign exchange and tax laws, rules and regulations that can limit the payment of dividends, which in some circumstances could limit the ability to pay dividends to shareholders or to make available funds held in certain subsidiaries to cover operating expenses of other members of the Group.
Prudential operates in a number of markets through joint ventures and other arrangements with third-parties (including in China and India), involving certain risks that Prudential does not face with respect to its consolidated subsidiariesPrudential operates, and in certain markets is required by local regulation to operate, through joint ventures (including in China and India). For the Group’s joint venture operations, management control is exercised jointly with the venture participants. The level of control exercisable by the Group depends on the terms of the joint venture agreements, in particular, the allocation of control among, and continued co-operation between, the joint venture participants. Prudential may also face financial or other exposure in the event that any of its joint venture partners fails to meet its obligations under the joint venture or encounters financial difficulty. In addition, a significant proportion of the Group’s product distribution is carried out through arrangements with third-parties not controlled by Prudential and is dependent upon continuation of these relationships. A temporary or permanent disruption to these distribution arrangements could adversely affect the results of operations of Prudential.
Prudential’s Articles of Association contain an exclusive jurisdiction provisionUnder Prudential’s Articles of Association, certain legal proceedings may only be brought in the courts of England and Wales. This applies to legal proceedings by a shareholder (in its capacity as such) against Prudential and/or its directors and/or its professional service providers. It also applies to legal proceedings between Prudential and its directors and/or Prudential and Prudential’s professional service providers that arise in connection with legal proceedings between the shareholder and such professional service provider. This provision could make it difficult for US and other non-UK shareholders to enforce their shareholder rights.
Changes in tax legislation may result in adverse tax consequencesTax rules, including those relating to the insurance industry, and their interpretation, may change, possibly with retrospective effect, in any of the jurisdictions in which Prudential operates. Significant tax disputes with tax authorities, and any change in the tax status of any member of the Group or in taxation legislation or its interpretation could affect Prudential’s profitability and ability to provide returns to shareholders or alter the post-tax returns to shareholders.
RISK FACTORSCONTINUED

443A
DD
ITIO
NA
L
INF
OR
MA
TIO
N
Annual General MeetingThe 2011 Annual General Meeting (AGM) will be held on 19 May 2011 at 11.00am in the Churchill Auditorium at The Queen Elizabeth II Conference Centre, Broad Sanctuary, Westminster, London SW1P 3EE. The directors believe the AGM is an important opportunity to communicate directly with shareholders. The Notice of Meeting and all other details for the AGM are available at our website www.prudential.co.uk/investors/AGM information
Shareholder enquiriesFor enquiries about shareholdings, including dividends and lost share certificates, please contact the Company’s registrars:
By post: Equiniti Limited Aspect House Spencer Road Lancing West Sussex BN99 6DA
By telephone:Tel: 0871 384 2035 Fax: 0871 384 2100Textel: 0871 384 2255 (for hard of hearing) Calls to 0871 numbers are charged at 8p per minute from a BT landline. Other telephone providers costs may vary. International shareholders tel: +44 (0)121 415 7026
Dividend mandatesShareholders may find it convenient to have their dividends paid directly to their bank or building society account. If you wish to take advantage of this facility, please call Equiniti and request a Cash Dividend Mandate form. Alternatively, you may download a form from www.prudential.co.uk/prudential-plc/investors/shareholder_services/forms
Cash dividend alternativeThe Company has introduced a new Dividend Re-investment Plan (DRIP). It will be offered for the first time in connection with the 2010 final dividend. Consequently, the scrip dividend scheme has been discontinued.
Once shareholders have signed up to the DRIP they will automatically receive shares for all future dividends in respect of which a DRIP alternative is offered. The election may be cancelled at any time by the shareholder. Further details of the DRIP and the timetable are available on the Company’s website at www.prudential.co.uk/prudential-plc/investors
Analysis of shareholder accounts as at 31 December 2010
Size of shareholding
Number of shareholder
accounts
% of total number of
shareholder accounts
Number of shares
% of total number of
shares
1,000,001 upwards 269 0.41 2,207,270,343 86.71500,001–1,000,000 149 0.23 102,594,369 4.03100,001–500,000 476 0.72 113,585,023 4.4610,001–100,000 1,979 3.00 51,146,680 2.015,001–10,000 2,768 4.19 19,283,246 0.761,001–5,000 17,724 26.83 39,516,636 1.551–1,000 42,683 64.62 12,198,209 0.48
TOTAL 66,048 100.00 2,545,594,506 100.00
Dividend information
2010 final dividend
Shareholders registered on the
UK register
Shareholders registered on the
Irish branch register
Shareholders registered on the
Hong Kong branch register
Shareholders with ordinary
shares standingto the credit of
their CDP securities
accounts
Ex dividend date 30 March 2011 30 March 2011 31 March 2011 30 March 2011Record date 1 April 2011 1 April 2011 1 April 2011 1 April 2011
Payment date 26 May 2011 26 May 2011 26 May 2011On or about 2 June 2011
ADDITIONAL INFORMATION > SHAREHOLDER INFORMATION
SHAREHOLDER INFORMATION

444
Prudential plc Annual Report 2010
ADDITIONAL INFORMATION > SHAREHOLDER INFORMATION
Electronic communicationsShareholders are encouraged to elect to receive shareholder documents electronically by registering with Shareview at www.shareview.co.uk This will save on printing and distribution costs and create environmental benefits. Once you have registered, you will be sent an email notification whenever shareholder documents are available on our website and you will be provided with a link to that information. When registering, you will need your shareholder reference number which can be found on your share certificate or proxy form. The option to receive shareholder documents electronically is not available to shareholders holding shares through The Central Depository (Pte) Limited (CDP). Please contact Equiniti if you require any assistance or further information.
Share dealing servicesThe Company’s Registrars, Equiniti, offer a postal dealing facility for buying and selling Prudential plc ordinary shares; please see the Equiniti address above or telephone 0871 384 2248. They also offer a telephone and internet dealing service, Shareview, which provides a simple and convenient way of selling Prudential plc shares. For telephone sales call 0871 384 2020 between 8.30am and 4.30pm, Monday to Friday, and for internet sales log on to www.shareview.co.uk/dealing
ShareGiftShareholders who only have a small number of shares whose value makes it uneconomic to sell them may wish to consider donating them to ShareGift (Registered Charity 1052686). The relevant share transfer form may be obtained from our website www.prudential.co.uk/prudential-plc/investors/shareholder_services/forms or from Equiniti. Further information about ShareGift may be obtained on +44 (0)20 7930 3737 or from www.ShareGift.org There are no implications for capital gains tax purposes (no gain or loss) on gifts of shares to charity in the UK and it is also possible to obtain income tax relief.
Hong Kong branch registerThe Company operates a branch register for shareholders in Hong Kong. All enquiries regarding Hong Kong branch register accounts and requests for the Chinese version of the 2010 Annual Report should be directed to Computershare Hong Kong Investor Services Limited, 17M Floor, Hopewell Centre, 183 Queen’s Road East, Wan Chai, Hong Kong. Telephone: +852 2862 8555. Dividends will be paid in Hong Kong Dollars to shareholders on the Hong Kong Register.
Singapore shareholder enquiriesShareholders who have shares standing to the credit of their securities accounts with CDP in Singapore may refer queries to the CDP at 4 Shenton Way, #02-01, SGX Centre 2, Singapore 068807. Telephone +65 6535 7511. Enquiries regarding shares held in Depository Agent Sub-accounts should be directed to your Depository Agent or broker. Dividends will be paid in Singapore Dollars to shareholders with shares standing to the credit of a Central Deposit and Securities account.
Irish branch registerThe Company operates a branch register for shareholders in Ireland. All enquiries regarding Irish branch register accounts should be directed to Capita Registrars (Ireland) Limited, Unit 5, Manor Street Business Park, Manor Street, Dublin 7. Telephone: + 353 1 810 2400.
American Depositary Receipts (ADRs)The Company’s ordinary shares are listed on the New York Stock Exchange in the form of American Depositary Shares, evidenced by ADRs and traded under the symbol PUK. Each American Depositary Share represents two ordinary shares. All enquiries regarding ADR holder accounts should be directed to JP Morgan, the authorised depositary bank, at JPMorgan Chase & Co, P O Box 64504, St.Paul, MN 55164-0504, USA, Telephone General (800) 990-1135 or from outside the US +651 453-2128 or log on to www.adr.com
SHAREHOLDER INFORMATIONCONTINUED

445A
DD
ITIO
NA
L
INF
OR
MA
TIO
N
Prudential plcLaurence Pountney Hill London EC4R 0HH Tel: +44 (0)20 7220 7588 www.prudential.co.uk
Harvey McGrathChairman
Tidjane ThiamGroup Chief Executive
Nic NicandrouChief Financial Officer
Margaret ColtmanGroup General Counsel & Company Secretary
John FoleyGroup Chief Risk Officer
Peter GoerkeGroup Human Resources Director
John MurrayInterim Group Communications Director
Prudential UK & Europe3 Sheldon Square London W2 6PR Tel: +44 (0)20 7334 9000 www.pru.co.uk
Rob DeveyChief Executive
M&GLaurence Pountney Hill London EC4R 0HH Tel: +44 (0)20 7626 4588 www.mandg.co.uk
Michael McLintockChief Executive
Prudential Corporation Asia13th Floor One International Finance Centre 1 Harbour View Street Central Hong Kong Tel: +852 2918 6300 www.prudentialcorporation-asia.com
Barry StoweChief Executive
Jackson National Life Insurance Company1 Corporate Way Lansing Michigan 48951 USA Tel: +1 517 381 5500 www.jackson.com
Mike WellsPresident & Chief Executive Officer
Institutional Analyst and Investor EnquiriesTel: +44 (0)20 7548 3300 E-mail: [email protected]
UK Register Private Shareholder EnquiriesTel: 0871 384 2035 International shareholders tel: +44 (0) 121 415 7026
Irish Branch Register Shareholder EnquiriesTel: + 353 1 810 2400
Hong Kong Branch Register Shareholder EnquiriesTel: +852 2862 8555
The Central Depository (Pte) Limited Shareholder EnquiriesTel: +65 6535 7511
American Depository Receipts Holder EnquiriesTel: + 1 651 453 2128
Media EnquiriesTel: +44 (0)20 7548 3559 E-mail: [email protected]
ADDITIONAL INFORMATION > HOW TO CONTACT US
HOW TO CONTACT US

446
Prudential plc Annual Report 2010
Prudential public limited companyIncorporated and registered in England and Wales
Registered officeLaurence Pountney HillLondon EC4R 0HHRegistered number 1397169
www.prudential.co.uk
Prudential plc is a company incorporated, some of whose subsidiaries are authorised and regulated by the Financial Services Authority (FSA).
Forward-Looking Statements This report may contain certain ‘forward-looking statements’ with respect to certain of Prudential’s plans and its current goals and expectations relating to its future financial condition, performance, results, strategy and objectives. Statements that are not historical facts, including statements about our beliefs and expectations, are forward-looking statements. These statements are based on current plans, estimates and projections, and therefore you should not place undue reliance on them. By their nature, all forward-looking statements involve risk and uncertainty. A number of important factors could cause Prudential’s actual future financial condition or performance or other indicated results to differ materially from those indicated in any forward-looking statement. Such factors include, but are not limited to, future market conditions, fluctuations in interest rates and exchange rates, and the performance of financial markets generally; the policies and actions of regulatory authorities, including, for example, new government initiatives related to the financial crisis and the effect of the European Union’s
‘Solvency II’ requirements on Prudential’s capital maintenance requirements; the impact of competition, inflation, and deflation; experience in particular with regard to mortality and morbidity trends, lapse rates and policy renewal rates; the timing, impact and other uncertainties of future acquisitions or combinations within relevant industries; the impact of changes in capital, solvency standards or accounting standards, and tax and other legislation and regulations in the jurisdictions in which Prudential and its affiliates operate; and the impact of legal actions and disputes. These and other important factors may for example result in changes to assumptions used for determining results of operations or re-estimations of reserves for future policy benefits. Further discussion of these and other important factors that could cause Prudential’s actual future financial condition or performance or other indicated results to differ, possibly materially, from those anticipated in Prudential’s forward-looking statements can be found under the heading ‘Risk factors’ in this Report and in Item 3 ‘Risk Factors’ of Prudential’s most recent annual report on Form 20-F filed with the U.S. Securities and Exchange Commission, as well as under the heading ‘Risk factors’ in any subsequent Prudential Half Year Financial Report. This Annual Report and subsequent Half Year Financial Report are/will be available on the Company’s website at www.prudential.co.uk.
Any forward-looking statements contained in this report are made only as of the date hereof. Prudential undertakes no obligation to update the forward-looking statements contained in this statement or any other forward-looking statements it may make, whether as a result of future events, new information or otherwise except as required pursuant to the Prospectus Rules, the Listing Rules, the Disclosure and Transparency Rules, the Hong Kong Listing Rules or the SGX-ST listing rules.
ADDITIONAL INFORMATION > HOW TO CONTACT US
HOW TO CONTACT USCONTINUED

447A
DD
ITIO
NA
L
INF
OR
MA
TIO
N

Prudential plc Annual Report 2010
This Annual Report is printed on paper made from 50 per cent recycled post-consumer waste. The paper is Forest Stewardship Council (FSC) accredited. This Annual Report can be recycled.
Design FurtherPrint Royle Print


Prudential public limited companyIncorporated and registered in England and Wales
Registered officeLaurence Pountney HillLondon EC4R 0HHRegistered number 1397169
www.prudential.co.uk
Prudential plc is a holding company, some of whose subsidiaries are authorised and regulated by the Financial Services Authority (FSA).