a growth business with strong momentum - prudential plc
TRANSCRIPT

Annual Report 2005
A growth businesswith strong momentum
Prudential plc is an international retail financial services group that aims to help people secure andenhance their own and their dependants’ financial well-being by providing savings, protection and other products and services suited to their needs.
We have strong franchises in three of the largest and most attractive markets in the world, where rising wealth and changing demographics are fuelling demand for life insurance and other long-term savings andprotection products.
Our strategy is to build successful and increasinglyprofitable businesses in each of these markets, andthereby maximise returns to our shareholders over time.
Contents1 Group financial highlights2 Chairman’s statement4 Group Chief Executive’s review8 Business review
16 Financial review34 Corporate responsibility review36 Board of directors38 Corporate governance report 46 Remuneration report58 Directors’ report60 Summary of statutory and supplementary IFRS and EEV basis results61 Index to the Group financial statements62 Consolidated income statement63 Statement of changes in equity65 Consolidated balance sheet67 Consolidated cash flow statement68 Notes on the Group financial statements
186 Balance sheet of the parent company187 Notes on the parent company financial statements196 Statement of directors’ responsibilities in respect of the Annual
Report and the financial statements197 Independent auditor’s report to the members of Prudential plc198 Supplementary International Financial Reporting Standards (IFRS)
basis results200 Notes on the supplementary IFRS basis results201 Risk factors204 European Embedded Value (EEV) basis supplementary information208 Notes on the EEV basis supplementary information230 Statement of directors’ responsibilities in respect of the European
Embedded Value (EEV) basis supplementary information230 Independent auditor’s report to Prudential plc on the European
Embedded Value (EEV) basis supplementary information231 Shareholder information232 How to contact us
Pru
de
ntial p
lcA
nn
ual R
ep
ort 2
00
5
Prudential public limited companyIncorporated and registered in England and Wales
Registered office:Laurence Pountney HillLondon EC4R 0HH
Registered number: 1397169
Prudential plc is a holding company, subsidiaries of which are authorised and regulated by the Financial Services Authority (FSA).
www.prudential.co.uk
PR2178_Report_covers_tp.qxd 11/4/06 10:41 Page 2

Prudential at a glance
Prudential is a leading life and pensions provider in the United Kingdom.
M&G is Prudential’s UK and European fundmanager with £149 billion of funds undermanagement as at 31 December 2005.
Egg plc is an innovative financial services company,providing a range of banking and financial servicesproducts through its internet site, www.egg.com
Jackson National Life (JNL) is one of the largest lifeinsurance companies in the United States with overthree million policies and contracts in force.
Prudential has life insurance operations in 12 countriesand in 2005 was awarded six new life licences forcities in China, making a total of 10 operational in 2005. Prudential also has fund managementoperations in nine Asian countries following theaddition of China and Vietnam in 2005.
Products■ Annuities■ Corporate pensions■ With-profits and unit-linked bonds■ Savings and investments■ Protection■ Equity release■ Health insurance
Product distribution channels■ Business to business (consulting actuaries and
benefit advisers)■ Partnerships (affinities and banks)■ Independent financial advisers■ Multi-tie panels■ Direct to customers (telephone, internet
and mail)
CustomersMore than seven million
Staff6,700
LocationsBelfastDublinLondonMumbaiReadingStirling
M&G independently manages assets on behalf of awide range of retail and institutional investors. M&Galso acts as fund manager on many of the life andpensions products sold by Prudential in the UK andEurope, as well as managing Prudential’s balancesheet for profit.
Retail business■ Open Ended Investment Companies (OEICs)
and Unit Trusts (UTs)■ Investment Trusts (ITs)■ Individual Savings Accounts (ISAs) and Personal
Equity Plans (PEPs)
M&G and Prudential branded mutual funds aredistributed to retail investors in the UK, Europe and South Africa. M&G manages £14.6 billion of retail assets, invested in equities, fixed incomeand property.
In the UK, M&G is the fourth largest retail fundmanager, with over one million unit holder accounts.
Institutional business■ Segregated fixed interest, pooled pension funds,
structured and private finance■ Segregated and pooled global macro strategy
mandates■ Institutional customers include pension funds,
insurance companies and other financial institutions
M&G manages £21.6 billion of institutional assets,invested in equities, fixed income, property andprivate equity.
Internal business■ M&G manages assets on behalf of Prudential’s
long-term business funds, including with-profitsand unit-linked funds, annuities and corporatepension products.
M&G manages £113 billion of assets for Prudential customers, invested in equities, fixed income, property and private equity.
Staff1,400
LocationsUK: London, ChelmsfordEurope: Germany, Austria, Italy, Spain, FranceOther: Australia, South Africa
Also part of M&GPrudential Property Investment Managers (PruPIM)PPM CapitalPPM South Africa
■ Banking – unsecured personal loans, credit cards,mortgages and savings accounts
■ Insurance – distribution of general insuranceproducts
Egg has over five per cent share of the UK creditcard market.
CustomersOver three million.
Staff2,200
LocationsDerbyDudleyLondon
JNL offers fixed, fixed index, and variable annuities, term and permanent life insurance and institutional products. Through its affiliates and subsidiaries, JNL also provides assetmanagement and retail brokerage services.
JNL markets products in 50 states and the District of Columbia (in the State of New Yorkthrough Jackson National Life Insurance Company of New York) through independentbroker-dealers, independent agents, banks,regional broker-dealers and the registeredinvestment adviser channel.
JNL’s investment portfolio manager, PPM AmericaInc., manages around US$71 billion of assets.
CustomersMore than three million policies and contracts in force.
Staff2,600
LocationHeadquartered in Lansing, Michigan
Prudential is Europe’s leading life insurer in Asia in terms of market coverage and number of top fivemarket positions and one of the region’s largestforeign owned fund managers.
Prudential Corporation Asia provides acomprehensive range of savings, protection and investment products tailored to the needs of each local market.
It pioneered unit-linked products in Singapore,Malaysia, Indonesia, the Philippines and Taiwan.
Currently, Prudential Corporation Asia has anetwork of over 170,000 agents serving more thanseven million customers around the region.
Major strategic partnerships■ Bank of China International for Mandatory
Provident Fund business in Hong Kong■ CITIC Group for life and fund management
business in China ■ ICICI Bank for life and mutual funds business
in India■ In addition, Prudential Corporation Asia has a
number of distribution partnerships that include a number of leading banks.
Staff9,900
LocationsChinaHong KongIndiaIndonesiaJapanKoreaMalaysiaThe PhilippinesSingaporeTaiwanThailandVietnam
APE sales grew 10 per cent in 2005 to £900 million.
IFRS operating profit increased 35 per cent to £400 million in 2005.
Further informationwww.pru.co.uk
Telephone: 0800 000 000
In 2005, operating profit grew 20 per cent to £163 million and underlying profits grew 25 per cent to £138 million.
Gross fund inflows increased by 35 per cent to £7.9 billion. Net fund inflows nearly doubledto £3.9 billion.
Further informationwww.mandg.co.ukwww.mandg-investments.dewww.mandg-investments.atwww.prupim.comwww.ppmcapital.comwww.ppm-sa.com
Customer helpline: 0800 390 390
Independent financial adviser (IFA) helpline:0800 328 3191
2005 overall group operating income was £527 million, up from £496 million in 2004.
The UK banking business made an operatingprofit of £60 million, compared to £72 million in 2004.
Following Prudential’s offer for the minorityshareholding, Egg shares were delisted on 20 February 2006.
Further informationwww.egg.com
Telephone: 020 7526 2500
Record APE sales of £515 million were up 13 per cent on prior year. New business profitmargin (% of APE) of 41 per cent up from 32 per cent in the prior year.
EEV operating profit on continuing operations of £755 million, up 104 per cent on prior year.
IFRS operating profit on continuing operations of £362 million, up 27 per cent on prior year.
Further informationwww.jnl.com
Telephone: 00 1 517 381 5500
Sales on an APE basis grew 23 per cent.
Represents 48 per cent of total Group newbusiness profit.
Third party funds under management of £10.1 billion, up 29 per cent over 2004 oncomparable basis.
IFRS operating profit of £157 million, up 67 per cent on 2004.
Further informationwww.prudentialcorporation-asia.com
Telephone: 00 852 2918 6300
Our brands
Operations and products
Financial highlightsComparisons are quoted at constant
exchange rates
This report may contain certain ‘forward-looking statements’ with respect to certain of Prudential’s plans and its current goals and expectations relating toits future financial condition, performance, results, strategy and objectives. Statements containing the words ‘believes’, ‘intends’, ‘expects’, ‘plans’, ‘seeks’and ‘anticipates’, and words of similar meaning, are forward-looking. By their nature, all forward-looking statements involve risk and uncertainty becausethey relate to future events and circumstances which are beyond Prudential’s control including among other things, UK domestic and global economic andbusiness conditions, market related risks such as fluctuations in interest rates and exchange rates, and the performance of financial markets generally; thepolicies and actions of regulatory authorities, the impact of competition, inflation, and deflation; experience in particular with regard to mortality andmorbidity trends, lapse rates and policy renewal rates; the timing, impact and other uncertainties of future acquisitions or combinations within relevantindustries; and the impact of changes in capital, solvency or accounting standards, and tax and other legislation and regulations in the jurisdictions in whichPrudential and its affiliates operate. This may for example result in changes to assumptions used for determining results of operations or re-estimations ofreserves for future policy benefits. As a result, Prudential’s actual future financial condition, performance and results may differ materially from the plans,goals, and expectations set forth in Prudential’s forward-looking statements. Prudential undertakes no obligation to update the forward-looking statementscontained in this report or any other forward-looking statements it may make.
Prudential public limited companyIncorporated and registered in England and Wales
Registered office:Laurence Pountney HillLondon EC4R 0HHRegistered number: 1397169
Prudential plc is a holding company, subsidiaries of which areauthorised and regulated by the Financial Services Authority.
www.prudential.co.uk
Front cover photograph by Philip Ip (Hong Kong).
PR2178_Report_covers_tp.qxd 11/4/06 10:41 Page 3

Prudential plc Annual Report 2005 1
Results summary2005 2004
European Embedded Value (EEV) basis results* £m £m
UK insurance operations 426 486
M&G 163 136
Egg 44 61
UK operations 633 683
US operations 755 368
Asian operations 568 464
Other income and expenditure (244) (241)
Operating profit from continuing operations based on longer-term investment returns 1,712 1,274
Goodwill impairment charge (120) –
Short-term fluctuations in investment returns 1,001 570
Shareholders’ share of actuarial and other gains and losses of defined benefit pension schemes (47) (12)
Effect of changes in economic assumptions and time value of cost of options and guarantees (302) (48)
Profit from continuing operations before tax 2,244 1,784
Operating earnings per share from continuing operations after related tax and minority interests* 56.6p 43.2p
Basic earnings per share 66.9p 53.7p
Shareholders’ funds, excluding minority interests £10.3bn £8.6bn
International Financial Reporting Standards (IFRS) basis results**
Statutory IFRS basis results 2005 2004
Profit after tax attributable to equity holders of the Company £748m £517m
Basic earnings per share 31.6p 24.4p
Shareholders’ funds, excluding minority interests £5.2bn £4.5bn
Based on Based onstatutory IFRS pro forma
basis results IFRS resultsSupplementary IFRS basis information 2005 2004
Operating profit from continuing operations based on longer-term investment returns £957m £699m
Profit after tax attributable to equity holders of the Company £748m £602m
Operating earnings per share from continuing operations after related tax and minority interests** 32.2p 22.7p
Basic earnings per share 31.6p 28.4p
Shareholders’ funds, excluding minority interests £5.2bn £4.7bn
2005 2004
Dividends per share declared and paid in reporting period 15.95p 15.48p
Dividends per share relating to reporting period 16.32p 15.84p
Funds under management £234bn £197bn
*EEV basis resultsThe EEV basis results have been prepared in accordance with the EEV principles issued by the CFO Forum of European Insurance Companies in May 2004 and expanded by the Additional Guidance on EEV disclosures published in October 2005. Previously the Group has reported embedded value based supplementary information on the achievedprofits basis.
Operating earnings per share is calculated using operating profit from continuing operations based on longer-term investment returns after related tax and minority interests. This profit excludes goodwill impairment charges, the post-tax effects of short-term fluctuations in investment returns, the shareholders’ share of actuarial and other gains andlosses of defined benefit pension schemes, the effect of changes in economic assumptions, and changes in the time value of cost of options and guarantees. The amounts forthese items are included in the calculation of EEV basis basic earnings per share.
**IFRS basis resultsThe basis of preparation reflects the formal adoption of IFRS basis reporting for the 2005 results. This basis of reporting was anticipated in the Company’s interim reporting in July 2005 and, on all substantive matters, the basis of measurement and presentation of IFRS basis results included in this Annual Report is the same as applied at that time.
References to ‘statutory IFRS basis’ results throughout this Annual Report reflect results contained in the statutory basis financial statements for 2005. These statementsincorporate changes from the basis of preparation for the 2004 financial statements that were included in determining the interim 2005 results. These changes reflect:
(i) Measurement changes arising from policies the Group has applied on the adoption of all IFRS standards, other than IAS 32, ‘Financial Instruments: Disclosure and Presentation’,IAS 39, ‘Financial Instruments: Recognition and Measurement’ and IFRS 4, ‘Insurance Contracts’, from 1 January 2004. The 2005 results include the effect of adoption of thosethree standards from 1 January 2005.
(ii) Changes to the format of the results and other presentational changes that the Group has applied in its 2005 financial statements.
(iii) A discretionary change of policy for the basis of determining longer-term investment returns included in operating profit based on longer-term investment returns.
The pro forma IFRS basis results included in this Annual Report are included as supplementary information and are not results that form part of the Group’s financial statements.The pro forma IFRS results reflect the application of the statutory IFRS changes noted above and the estimated effect on the Group’s results for 2004 if IAS 32, IAS 39 and IFRS 4had been applied from 1 January 2004 to the Group’s insurance operations.
Operating earnings per share is calculated using operating profit from continuing operations based on longer-term investment returns after related tax and minority interests. This profit excludes goodwill impairment charges, the post-tax effects of short-term fluctuations in investment returns, and the shareholders’ share of actuarial and other gainsand losses on defined benefit pension schemes. The amounts for these items are included in the calculation of IFRS basis basic earnings per share.
Group financial highlights

2 Prudential plc Annual Report 2005
2005 was a good year for Prudential’sbusinesses around the world. Each of ouroperations made strong progress, andfinished the year well positioned to takeadvantage of the opportunities for profitablegrowth in 2006 and beyond.
At a Group level, total insurance sales for the year to 31 December
2005 rose 15 per cent to £2,146 million; operating profit on a
European Embedded Value (EEV) basis increased 33 per cent to
£1,712 million; operating profit under the International Financial
Reporting Standards (IFRS) basis increased 36 per cent to
£957 million. The full year dividend per share has increased
three per cent to 16.32 pence per share.
During the year, we welcomed Mark Tucker back to Prudential,
as Group Chief Executive. Mark previously worked in most of the
Group’s businesses over nearly 20 years, and this broad knowledge,
combined with his drive and energy, have brought greater clarity
and confidence about the Group’s longer-term plans and capital
management programme, enabling us to map out the steps that
we need to take to deliver long-term value to shareholders.
In the UK, where we are already a leading life and pensions
company, we plan to extract significantly more value from the
market as a whole by taking a more collaborative approach
between our individual businesses. The decision to return Egg
to full ownership within the Group has been an important step
towards this, and gives us a strong base from which to pursue our
ambition to build a broader retail financial services presence.
In the United States, we see enormous potential to capitalise on
the emerging needs of the ‘baby boomer’ generation which is
starting to move into retirement, using our market-leading position
in variable annuities, and our strengths in IT, product innovation
and relationship-based distribution.
Chairman’s statement
2005 was a good year forPrudential’sbusinessesaround the world
Sir David Clementi

Prudential plc Annual Report 2005 3
In Asia, the drivers of growth are as compelling as ever, and we
expect to continue to expand aggressively in the region over the
coming years, while still attaining our goal to go cash positive
during 2006.
Turning to our asset management businesses, we see these as
significant and increasing contributors to the overall Group.
Not only do they underpin the performance of our traditional
insurance products, they also provide an attractive enhancement
to our range of products enabling us to accommodate the needs
of the vast bulk of retail investors. Just as importantly, asset
management provides a powerful source of non-capital-intensive
profits for the Group.
Across the Group, we continue to share knowledge and skills, and
are increasingly looking at resources such as IT on a global basis.
We see considerable scope for further collaboration of this kind
in future.
An integral part of our strategy is to ensure we build trusting, long-
term relationships with consumers and, as part of this, we continue
to support the communities in which we operate through a range
of financial education initiatives. Details of our programme are
given in the Corporate Responsibility section of this Report.
During the year, we made a number of Board changes. In addition
to Mark Tucker’s appointment as Group Chief Executive in
May, we also appointed Nick Prettejohn as Chief Executive of
Prudential UK, effective from January this year, following the
departure of Mark Wood in October. Keki Dadiseth was appointed
as a non-executive director in April last year. He brings to the
Board considerable international experience, particularly of
Asian markets.
We announced in April of this year that Lord Turnbull would join
our Board following the Annual General Meeting in May. He was
the Secretary of the Cabinet and Head of the Home Civil Service
from 2002 to 2005, prior to which he was Permanent Secretary at
HM Treasury. Following the Annual General Meeting, Rob Rowley
will step down from the Board and I would like to thank him for his
significant contribution since he joined in 1999.
The Group’s Restricted Share Plan ends this year. At the Annual
General Meeting we will put forward new long-term incentive
arrangements for executive directors, which will replace the Group
Restricted Share Plan and the current business unit incentive
schemes. Recruiting and retaining the highest calibre executives is
of course crucial to our long-term success. The new arrangements
we have developed aim to be competitive within the broad
international marketplace in which we operate, and we hope
that shareholders will support them.
One further matter on which I must comment is the proposal we
received recently from Aviva that we should combine our two
businesses. Your Board did not consider that the proposal made
was in the best interests of Prudential’s shareholders, and it was
subsequently withdrawn by Aviva. Your Board believes we are
well placed: we have the business opportunities; the management
depth; and the capital strength to continue to expand profitably
our operations around the world and to generate further growth in
the value of your Company. As always, the experience and talents
of all our staff will be critical to our success, and I would like to
thank them for their continued support and commitment.
Sir David Clementi
Chairman
+3 per centFull year dividend per share upby three per cent to 16.32 pence

4 Prudential plc Annual Report 2005
2005 was a successful year for Prudential.
The Group has continued to expand itsinsurance business strongly and our assetmanagement businesses have also had anexcellent year.
Total Group operating profit before tax, on a European Embedded
Value (EEV) basis, was £1,712 million, an increase of 33 per cent.
Statutory IFRS operating profit before tax was up 36 per cent at
£957 million.
The continuing momentum of the Group can be seen in the
growth of insurance premium income in 2005 to £13.8 billion
(2004: £12.2 billion) and funds under management of £234 billion
at the end of 2005 (2004: £197 billion).
New business sales in our insurance operations increased by
15 per cent to £2,146 million on an annual premium equivalent
(APE) basis and each of our regional operations achieved double-
digit growth. New business profits increased by 15 per cent across
the Group to £867 million, and operating profit before tax on the
insurance business on an EEV basis increased by 30 per cent to
£1,743 million.
In our asset management businesses, external funds under
management increased to £46 billion up 23 per cent.
A final dividend of 11.02 pence per share has been recommended
by the Board bringing the full year dividend to 16.32 pence per
share, an increase of three per cent from 2004. The full year
dividend is covered 1.7 times by post-tax IFRS profit after minority
interests. We intend to maintain our current dividend policy, with
the level of dividend growth being determined after considering
the opportunities to invest in those areas of our business offering
attractive growth prospects, our financial flexibility and the
development of our statutory profits over the medium to long term.
Shareholders’ funds, on an EEV basis, grew strongly to £10.3 billion
at the end of 2005 (2004: £8.6 billion) and the Group’s return on
embedded value was 15.7 per cent (2004: 13.4 per cent) at reported
exchange rates.
Group Chief Executive’s review
Compellingpositions in theworld’s leadingfinancial servicesmarkets
Mark Tucker

Prudential plc Annual Report 2005 5
In May 2005, I set up a team of senior executives with a brief to
identify the ambitions and business strategies best suited to
maximise sustainable growth in value for the Group’s shareholders
over the longer term.
The key conclusions of the review were that:
■ Demographic trends and the increasing concentration of wealth
in the hands of those approaching retirement or already retired
presents a major opportunity to establish the Group as a leading
provider of ‘financial services for retirement’ by playing to our
strengths and areas of competitive advantage;
■ the Group is well positioned in markets that offer highly attractive
opportunities for strong organic growth over the next 10 years;
■ to exploit these opportunities fully we need to broaden our
customer proposition and product range to align them more
closely with anticipated retail financial sector profit pools;
■ in addition, we must complement our strong and important
intermediary links by expanding the proportion of revenue
derived from direct customers; and ensure that we build deep
life-cycle relationships with our customers;
■ we should also develop the global reach and profile of our
excellent asset management businesses.
Consistent with this strategy, and to support closer workings
between our UK insurance business and Egg, we announced the
terms of an Offer to acquire the 21.7 per cent of shares in Egg that
the Group did not already own.
Each of our businesses has operational autonomy within its market
and this is critical to our success, since it is the key to our ability to
tailor products and services to meet local market needs. However,
the review also concluded that there are material synergies that
can be achieved through closer working across the Group,
consistent with our decentralised approach; and work is underway
to identify and capture these, for example by establishing a single
global IT infrastructure and support unit with expected cost savings
of £20-£25 million per annum.
Finally, the review concluded we must continue to enhance the
effectiveness of our capital management processes, to ensure that
investment and capital allocation decisions are focused on those
areas of activity that will generate the best returns to shareholders.
Prudential is developing compelling positions in the world’s leading
retail financial services markets. I am confident of the outlook for
the Group and we aim to deliver significant profitable growth.
UK insurance and retail banking operations
The Prudential-branded UK insurance business continued to
develop its shareholder-backed business successfully and
increased APE sales by 10 per cent in the year, to £900 million.
The internal rate of return on new business written in the year
was 14 per cent, meeting the target set for 2007 two years early.
We continued in 2005 to increase the scale of our annuity business
and at the same time reduce the average duration of the total book.
We have also continued to develop our product range in 2005.
In October we entered the lifetime mortgage market, a market
that is set to grow rapidly to an estimated £7 billion by 2008. Our
innovative product has been designed with the customer, adviser
and regulator in mind and initial customer interest has been
encouraging. We have also made good progress in unit-linked and
off-shore bond sales which grew 31 per cent and 15 per cent
respectively in the year.
The A-Day proposals offer the opportunity to attract new business
as customers increase contributions and consolidate their pension
arrangements. We have already launched a new Flexible
Retirement Plan and we will undertake a review of our overall
individual pensions offering during 2006. In addition, we have
established a unit to communicate directly with our existing
pension customers.
The UK insurance business has a balanced distribution model with
strong positions across all major segments – IFA and multi-tie
intermediaries, direct marketing and telesales, employee benefit
consultants and a well developed single-tie Partnership channel.
We continued to make good progress in diversifying distribution,
£1,712 millionTotal EEV operating profit fromcontinuing operations up 33 per centAt constant exchange rates

6 Prudential plc Annual Report 2005
reaching agreements with a range of providers including Barclays,
National Australia Bank, St. James’s Place and with Royal London
to provide pension annuities for vesting Scottish Life policies.
In addition, we continued to be successful in gaining access to
multi-ties in the year. Prudential is in a strong position to benefit as
the IFA market changes over the next 18-24 months and recently
achieved a ‘5 star’ IFA service rating for its investment products
and ‘4 star’ rating overall, demonstrating strong progress in this
important area.
In retail banking, Egg’s UK operations delivered an underlying
profit of £60 million (2004: £72 million). Egg was successful in
testing market conditions improving its net interest margin against
a background of falling base rates and also lowering its cost income
ratio. There has been a general deterioration in consumer credit
conditions, however, Egg’s experience here has been substantially
better than the market average.
Following our decision to acquire the minority shareholding in Egg,
we have targeted annualised cost savings of £40 million across
our UK operations by 2007. During 2006, we will undertake a
further review of the cost base in these operations. We also see
opportunities for revenue synergies across our UK brands’ five
million marketable customers.
Our central focus in the UK is to use the strong franchises that
we have to improve returns. We are targeting growth but also
managing for value and we will not commit capital if we do not
see the individual product returns that we require emerging over
a reasonable timeframe.
US insurance operations
Jackson National Life (JNL), the Group’s US operation, is a
significant cash-generative business with the market positioning
to continue its strong track record of profitable growth in the
retirement market.
JNL continued to show strong growth in 2005, increasing new
business sales by 13 per cent to £515 million APE with growth in
variable annuities of 31 per cent. Both the margin and the internal
rate of return on new business moved ahead strongly in the year.
During the year, JNL also successfully integrated the Life of
Georgia book of business acquired in May, transferring 1.5 million
policies on to its low cost flexible platform. We fully expect to beat
the 12 per cent return target for the transaction.
JNL’s strength in variable annuities, its ability to bring products
to market rapidly and its positioning in advice-based distribution
channels means it is very well placed to take advantage of the
significant retirement savings flows expected from the ‘baby
boomer’ generation over the coming years.
JNL’s priorities are to continue to focus on developing their
position in the variable annuity market and to expand the business
through bolt-on acquisitions that meet targeted rates of return.
Asia insurance operations
Prudential has an unrivalled exposure and weighting to the high
growth and high profit markets of Asia. Prudential Corporation
Asia saw new business on an APE basis increase by 23 per cent to
£731 million with double-digit rates of growth achieved in Korea,
China, India, Singapore and Indonesia.
Profitability on new business and internal rates of return remain
high and we will continue to emphasise unit-linked products,
which offer higher returns and greater capital efficiency. Unit-
linked products accounted for 63 per cent of sales across the
region in 2005.
We are maintaining momentum in the expansion of our distribution
capability. Agency distribution is the dominant channel throughout
the region and 75 per cent of our sales are from this source. Our
proprietary agent distribution force across the region reached
170,000 in 2005 with particularly rapid expansion in agent numbers
in India and China. We will continue to increase agent numbers
in these and other markets as the bedrock on which we build
our market share and market leadership positions. We will also
maintain a clear focus on improving the productivity of our agent
force across the whole region, and this is particularly significant for
growth in those countries in which we have been long established.
We see material scope to increase sales volumes through our
40 existing bank distribution relationships and we intend to enter
into new partnership agreements. We shall also continue to access
direct and broker channels as they develop in individual markets.
As part of our global drive to attain new levels of cost efficiency,
in Asia we are developing a ‘regional hub’ basis for sharing back
Group Chief Executive’s review continued
£867millionNew business profit up 15 per centto £867 millionAt constant exchange rates
+15per centNew business APE sales of £2,146 million, up 15 per centAt constant exchange rates

Prudential plc Annual Report 2005 7
office servicing and call centre facilities to leverage scale advantages
beyond the reach of individual business operations. In March 2005
the first regional hub, servicing the Singapore and Malaysian life
insurance operations, was launched. We have plans to open an
additional hub in China in the second half of 2006, where we
already have a regional IT development centre.
I am pleased to report that, whilst continuing our programme
of rapid expansion and profitable growth in Asia, we are also
expecting the region to become cash positive in 2006, in line with
our previous predictions.
Asset management
Operating profit before tax across our asset management businesses
in the UK, the US and Asia increased to £195 million up 16 per cent.
M&G in the UK had an excellent year with record gross and net
inflows and strong profit growth. In Asia, underlying growth in
retail funds under management was 29 per cent.
These businesses, together with PPMA, our asset management
business in the US, continued to support their own sales growth
and add significant value to the Group’s insurance operations
through their excellent investment performance.
The priorities in asset management are to continue to target
growth in external funds under management by capitalising on
a growth in demand for transparent investment products, access
to more global products, the continuing rise of open architecture
platforms and a rapidly expanding role for cross-border sales off a
common platform. We will create value through superior investment
performance and capitalise on international opportunities through
greater collaboration.
Balance sheet and capital management
Improving capital efficiency is at the heart of the Group’s
commitment to deliver sustainable increases in shareholder value
and we will maintain a rigorous approach to capital allocation and
deployment.
As of 15 March, we estimate that the Group’s capital surplus at the
end of 2005 on a regulatory basis, as measured by the Financial
Conglomerates Directive, was around £825 million, little changed
from the previous year. In July, we took advantage of good market
conditions in the US retail market to raise US$300 million of
perpetual capital securities, which qualifies as Group regulatory
capital. The primary use of the proceeds will be to refinance a
non-qualifying £150 million bond that matures in 2007.
The Group is confident that it has the capital and cash resources
to fund its planned organic growth.
In summary■ The Group delivered strong results in 2005 across all its businesses;
■ we have compelling positions in the world’s leading retail
financial services markets and the resources to capitalise on
these;
■ in the UK, we have three excellent and profitable franchises in
Prudential, Egg and M&G on which to build for the future;
■ in the US, JNL is a significant cash-generative business with the
market positioning for profitable growth in the retirement market.
It has competitive advantage in the sectors in which it chooses to
operate; and the ability to participate in market consolidation
through bolt-on acquisitions;
■ in Asia, we have an unrivalled exposure to opportunities for
life insurance sales and profit growth across the region, whilst
continuing our programme of rapid expansion and profit growth.
We are also expecting the region to become cash positive in
2006; and
■ our asset management businesses have significant growth
prospects and are providing solid cash flow generation.
There is tremendous scope to deliver increasing value for
shareholders from each individual business operation, and from
the Group as a whole which derives both financial advantage and
resilience from the diversity of its portfolio of businesses, and the
opportunities for collaboration between them.
Mark Tucker
Group Chief Executive
£234 billionFunds under managementincreased 19 per centAt reported exchange rates
8 Prudential plc Annual Report 2005
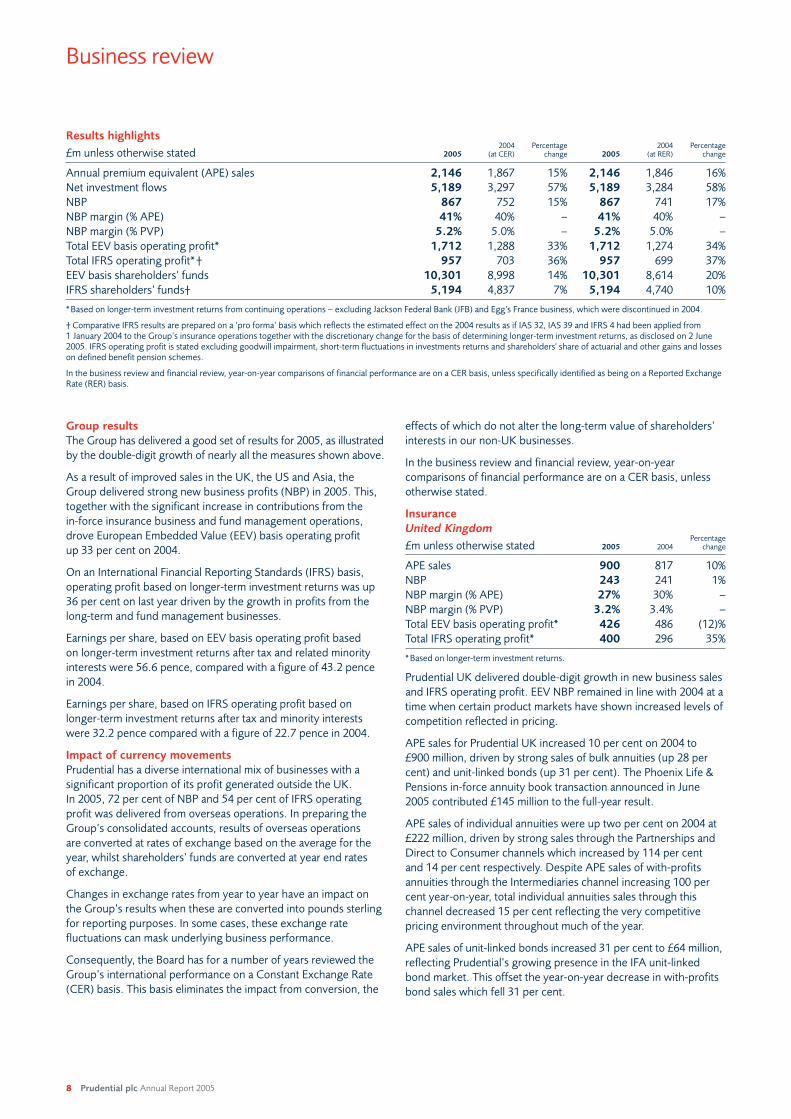
Group results
The Group has delivered a good set of results for 2005, as illustrated
by the double-digit growth of nearly all the measures shown above.
As a result of improved sales in the UK, the US and Asia, the
Group delivered strong new business profits (NBP) in 2005. This,
together with the significant increase in contributions from the
in-force insurance business and fund management operations,
drove European Embedded Value (EEV) basis operating profit
up 33 per cent on 2004.
On an International Financial Reporting Standards (IFRS) basis,
operating profit based on longer-term investment returns was up
36 per cent on last year driven by the growth in profits from the
long-term and fund management businesses.
Earnings per share, based on EEV basis operating profit based
on longer-term investment returns after tax and related minority
interests were 56.6 pence, compared with a figure of 43.2 pence
in 2004.
Earnings per share, based on IFRS operating profit based on
longer-term investment returns after tax and minority interests
were 32.2 pence compared with a figure of 22.7 pence in 2004.
Impact of currency movements
Prudential has a diverse international mix of businesses with a
significant proportion of its profit generated outside the UK.
In 2005, 72 per cent of NBP and 54 per cent of IFRS operating
profit was delivered from overseas operations. In preparing the
Group’s consolidated accounts, results of overseas operations
are converted at rates of exchange based on the average for the
year, whilst shareholders’ funds are converted at year end rates
of exchange.
Changes in exchange rates from year to year have an impact on
the Group’s results when these are converted into pounds sterling
for reporting purposes. In some cases, these exchange rate
fluctuations can mask underlying business performance.
Consequently, the Board has for a number of years reviewed the
Group’s international performance on a Constant Exchange Rate
(CER) basis. This basis eliminates the impact from conversion, the
effects of which do not alter the long-term value of shareholders’
interests in our non-UK businesses.
In the business review and financial review, year-on-year
comparisons of financial performance are on a CER basis, unless
otherwise stated.
Insurance
United Kingdom Percentage
£m unless otherwise stated 2005 2004 change
APE sales 900 817 10%
NBP 243 241 1%
NBP margin (% APE) 27% 30% –
NBP margin (% PVP) 3.2% 3.4% –
Total EEV basis operating profit* 426 486 (12)%
Total IFRS operating profit* 400 296 35%
*Based on longer-term investment returns.
Prudential UK delivered double-digit growth in new business sales
and IFRS operating profit. EEV NBP remained in line with 2004 at a
time when certain product markets have shown increased levels of
competition reflected in pricing.
APE sales for Prudential UK increased 10 per cent on 2004 to
£900 million, driven by strong sales of bulk annuities (up 28 per
cent) and unit-linked bonds (up 31 per cent). The Phoenix Life &
Pensions in-force annuity book transaction announced in June
2005 contributed £145 million to the full-year result.
APE sales of individual annuities were up two per cent on 2004 at
£222 million, driven by strong sales through the Partnerships and
Direct to Consumer channels which increased by 114 per cent
and 14 per cent respectively. Despite APE sales of with-profits
annuities through the Intermediaries channel increasing 100 per
cent year-on-year, total individual annuities sales through this
channel decreased 15 per cent reflecting the very competitive
pricing environment throughout much of the year.
APE sales of unit-linked bonds increased 31 per cent to £64 million,
reflecting Prudential’s growing presence in the IFA unit-linked
bond market. This offset the year-on-year decrease in with-profits
bond sales which fell 31 per cent.
Business review
Results highlights 2004 Percentage 2004 Percentage
£m unless otherwise stated 2005 (at CER) change 2005 (at RER) change
Annual premium equivalent (APE) sales 2,146 1,867 15% 2,146 1,846 16%
Net investment flows 5,189 3,297 57% 5,189 3,284 58%
NBP 867 752 15% 867 741 17%
NBP margin (% APE) 41% 40% – 41% 40% –
NBP margin (% PVP) 5.2% 5.0% – 5.2% 5.0% –
Total EEV basis operating profit* 1,712 1,288 33% 1,712 1,274 34%
Total IFRS operating profit*† 957 703 36% 957 699 37%
EEV basis shareholders’ funds 10,301 8,998 14% 10,301 8,614 20%
IFRS shareholders’ funds† 5,194 4,837 7% 5,194 4,740 10%
*Based on longer-term investment returns from continuing operations – excluding Jackson Federal Bank (JFB) and Egg’s France business, which were discontinued in 2004.
† Comparative IFRS results are prepared on a ‘pro forma’ basis which reflects the estimated effect on the 2004 results as if IAS 32, IAS 39 and IFRS 4 had been applied from1 January 2004 to the Group’s insurance operations together with the discretionary change for the basis of determining longer-term investment returns, as disclosed on 2 June2005. IFRS operating profit is stated excluding goodwill impairment, short-term fluctuations in investments returns and shareholders' share of actuarial and other gains and losseson defined benefit pension schemes.
In the business review and financial review, year-on-year comparisons of financial performance are on a CER basis, unless specifically identified as being on a Reported ExchangeRate (RER) basis.

Prudential plc Annual Report 2005 9
Prudential UK’s NBP increased marginally on 2004 to £243 million.
This was driven by the increase in sales volumes which was offset
by a fall in the NBP margin (from 30 per cent in 2004 to 27 per cent
in 2005 on an APE basis). The movement in margin reflected the
shift in product mix in 2005 as Prudential continued to expand its
shareholder-backed product range, however, throughout the year
there continued to be competitive pressure on margins across a
range of products which Prudential substantially resisted.
Total EEV basis operating profits fell 12 per cent on 2004 to
£426 million primarily due to a persistency assumption change
made at the half year. The charge of £148 million reflects a
strengthening of persistency assumptions across all products,
primarily in respect of with-profits bonds.
Increased IFRS profits arising from shareholder-backed annuities
contributed to the 35 per cent increase in total IFRS operating
profits, based on longer-term investment returns. In addition, the
very strong investment performance of Prudential’s life fund over
recent years resulted in an increase in total IFRS operating profits
from the with-profits business attributable to shareholders.
Prudential UK operates through four diversified distribution
channels. The Intermediaries channel, which accounted for 29 per
cent of APE sales in 2005, distributes a range of medium to long-
term savings products primarily through financial advisers and
includes sales generated through multi-ties. The Business to
Business channel, which accounted for 28 per cent of 2005 APE
sales, distributes corporate pensions through work-site marketing
in partnership with consulting actuaries and employee benefit
consultants. The Partnerships channel has responsibility for
developing relationships with banks and other distributors,
including other insurers and accounted for 30 per cent of APE
sales in 2005, up from just six per cent in 2003. The remaining
13 per cent of APE sales were generated by the Direct to
Customer channel which focuses primarily on the sale of annuities
to individual pension customers.
The Partnerships channel signed a number of significant new
agreements during the year. These included St. James’s Place for
annuities; National Australia Bank for annuities and healthcare;
Wesleyan’s multi-tie panel for protection; Zurich Financial Services
and Openwork for annuities; and the Barclays multi-tie panel.
In addition, Prudential and Royal London reached agreement
for all pension annuities arising from vestings of policies written
under the Scottish Life brand in the period between January 2005
and December 2010 to be reassured to Prudential as they come
into payment.
Following the introduction of the new depolarisation rules, many
IFA groups have used the opportunity to establish multi-tie panels.
Prudential has made good progress with the new panels announced
to date and is strongly positioned to take advantage of the depolarised
marketplace as this develops over the next few years. Prudential
achieved APE sales of £4 million through this channel in 2005 and
expects that multi-ties will start to have a greater impact on sales in
the future.
Prudential’s Business to Business distribution channel delivers
pension solutions to many of the FTSE 350 companies and is a
market leader in the provision of pension schemes to the UK
public sector. During 2005, Prudential continued to expand the
services it offers in this area to enable advisers to address the
employee benefit challenges of their clients.
PruHealth, a healthcare product that links health and fitness to the
cost of medical insurance plans, celebrated its first anniversary in
the third quarter of 2005. The business has made good progress
with sales growing on average more than 30 per cent per month in
2005. Total premium income for the year was £9 million and
PruHealth now has over 30,000 lives insured.
Prudential launched a new lifetime mortgage product, Prudential
Property Release Plan, in October. This innovative product gives
customers greater flexibility and control over the time of when
they draw down funds, thereby reducing total interest charges over
the lifetime of the loan. Performance to date has been encouraging
with growing support from both advisers and customers.
Prudential transferred its UK personal lines general insurance
business to Winterthur in 2002 and formed a strategic alliance with
Churchill, to offer Prudential branded general insurance products.
Under the terms of the agreement Prudential receives commission,
the levels of which to date have been offset against payments
received at the time of the original transaction, therefore no profits
are recognised on this business at this time. However, under the
agreement, Prudential is entitled to receive full commission
payments and associated profit, from 2008 onwards.
Including these individuals with Prudential branded general
insurance policies, to whom Prudential can sell long-term products,
Prudential has 2.5 million marketable customers.
2006 is expected to be a year of change for the retirement savings
market due to Government pensions reforms which come into
force on 6 April (A-Day). Prudential believes the changes will have
a positive impact and create an improved savings environment
over time, although it is unclear how quickly consumers will
respond to these new regulations.
Prudential has made a significant investment in its A-Day preparations
including systems developments and customer communications. It
currently expects pension arrangements will be compliant with the
new regulations and that customers will be aware of the changes.
In addition, Prudential is reviewing its product range to identify
where to focus future product developments to enable customers
to take better advantage of the new regime.
As a consequence of this, Prudential launched a new individual
personal pension designed to offer greater transparency and
flexibility. The new Pru Flexible Retirement Plan was launched in
December and is available through financial advisers.
The Pensions Commission published its second report in
November in which it proposed significant reform of the UK’s state
and private pension systems. Prudential, with its extensive
experience of pensions savings, will continue to play an active role
in this debate and in helping to shape the new structure.
The Prudential Assurance Company’s (PAC) long-term fund
remains very strong. On a realistic basis, with liabilities recorded on
a market consistent basis, the free assets were valued at around
£8.0 billion at 31 December 2005, before a deduction for the risk
capital margin, and the fund is rated AA+ by Standard & Poor’s and
Aa1 by Moody’s. The with-profits sub-fund delivered a pre-tax
return of 20 per cent in 2005 and over the last five years, the fund
has achieved a total return of 41 per cent against six per cent for
the FTSE 100 total return index and 12 per cent for the FTSE All-
Share total return index (figures are to 31 December 2005, before
tax and charges).

10 Prudential plc Annual Report 2005
Much of this excellent investment performance was achieved
through the active asset allocation of the fund. As part of its asset
allocation process, Prudential constantly evaluates prospects for
different markets. At the end of the first quarter of 2005, based on
Prudential’s judgement about the relative valuations of these assets,
Prudential increased its exposure to equities while decreasing its
exposure to corporate bonds and direct property.
As a result of the strong investment performance achieved in
2005, Prudential UK announced in February 2006 that it will be
increasing policy values for the vast majority of with-profits policies
maturing in 2006.
The closer partnership of Egg with Prudential’s UK life and
pensions business, as announced in December, is expected to
achieve revenue synergies and total annualised pre-tax cost
savings across the combined business of £40 million by the end
of 2007. This work to maximise the synergies between the two
businesses has already started with PruHealth policies now being
sold through Egg. This is an attractive opportunity for PruHealth
and the first of what we believe will be a number of effective
synergies between Prudential’s UK businesses.
Prudential UK will continue to pursue profitable opportunities in its
chosen product areas and distribution channels.
United States
Jackson National Life (JNL) operates in the largest retirement
savings market in the world, with 67 per cent, or US$12.9 trillion
(Source: Cerulli Associates), of the world’s retirement savings
assets concentrated in the US at the end of 2005. JNL provides
retirement income and savings solutions in the mass and mass-
affluent segments of the US market, primarily to pre- and post-
retirees. It offers tools that help people plan for their retirement,
and manufactures products with specialised features and guarantees
to meet customer needs. By seeking to add value to both the
representatives who sell JNL products, and to their customers,
JNL has built a strong position in the US retirement market.
JNL delivered APE sales of £515 million during 2005, representing
a 13 per cent increase on the 2004 result. This result was achieved
in an individual annuity market that was down two per cent on
prior year (Source: LIMRA).
JNL’s NBP of £211 million were up 45 per cent on 2004, reflecting
a 13 per cent increase in APE sales, and a significant improvement
in new business margin to 41 per cent from 32 per cent in 2004.
The improved margin reflects a favourable business mix; an
increase in the spread assumption for fixed index annuities
reflecting the spread being achieved; improved average policy
sizes for variable and fixed annuities; economic assumption
changes, including an increase in the equity risk premium, and
benefits derived from product pricing. Pricing benefits include the
price increase, introduced in May 2004, on the Perspective II
product. The margin on institutional business improved due to the
longer average duration contracts written by JNL during 2005.
Total EEV basis operating profit, based on longer-term investment
returns, of £755 million was up 104 per cent on 2004. This reflects
a 45 per cent increase in NBP and an in force profit of £530 million,
up 123 per cent on the prior year. This result was driven by an
operating assumption change following price increases introduced
on two older books of term life business (£140 million), a
favourable spread variance, and an increase in the unwind of the
in-force business.
Total IFRS operating profit of £362 million, based on longer-term
investment returns, was up 27 per cent on 2004. The 2004 result
benefited from two one-off items, a favourable legal settlement
and an accounting adjustment arising from the adoption of new
accounting guidance, totalling £29 million. The 17 per cent
growth in long-term business operating profit primarily reflects
a £119 million increase in spread income and record variable
annuity fee income due to significant growth in separate account
assets and the returns earned on those assets.
From 1999 to 2005, JNL has increased GAAP assets by a
compound annual growth rate of 8.4 per cent from US$42 billion
to US$68 billion, statutory premiums, excluding GIC deposits, from
US$4.5 billion to US$7.7 billion, and has grown variable annuity
reserves from US$5 billion to US$18 billion. JNL has also increased
its ranking in the US annuity market from 15th to 12th since 1999,
and has achieved this with a net capital inflow over the period of
US$11 million from the parent company.
JNL sells variable, fixed and fixed index annuities, as well as life
insurance and institutional products. All three annuity products are
long-term personal retirement products, which offer tax-deferred
accumulation on the funds invested until proceeds are withdrawn
from the policy. Fixed annuities offer customers a guarantee
of principal and a minimum guaranteed rate of return on their
premiums. Fixed index annuities also offer these features, but vary
from fixed annuities in that they offer potential upside from equity
Business review continued
United States2004 Percentage 2004 Percentage
£m unless otherwise stated 2005 (at CER) change 2005 (at RER) change
APE sales 515 456 13% 515 453 14%
NBP 211 146 45% 211 145 46%
NBP margin (% APE) 41% 32% – 41% 32% –
NBP margin (%PVP) 4.1% 3.2% – 4.1% 3.2% –
Total EEV basis operating profit* 755 370 104% 755 368 105%
Total IFRS operating profit* 362 284 27% 362 282 28%
*Based on longer-term investment returns from continuing operations (i.e. excluding Jackson Federal Bank (JFB) which was sold in October 2004 and including broker-dealer andfund management profits.

Prudential plc Annual Report 2005 11
index participation. Variable annuity products differ from the fixed
annuity products in that the returns to the customer will depend
upon the performance of the underlying fund portfolio. JNL’s
variable annuity products offer a range of protection options, such
as death and withdrawal benefits which are priced separately by
JNL, and which can be elected by customers according to their
needs. JNL manages its exposure to equity market movements
through a comprehensive derivative programme. Value movements
in these derivatives are included in operating profit so as to broadly
offset changes in policyholder liabilities caused by equity volatility.
During 2005, JNL again delivered record sales, with total APE sales
for the year of £515 million up 13 per cent on 2004, and retail sales
of £417 million, up 12 per cent. Variable annuity APE sales of
£261 million were up 31 per cent on prior year, compared with
market growth of 2.5 per cent during 2005 (Source: VARDS),
primarily reflecting the continued success of its unbundled variable
annuity contract ‘Perspective II’. Utilising the flexible product
design enabled by leading technology, advisors can customise the
product to meet the individual needs of the consumer, including
individually priced benefit options and guarantees, such that
consumers only pay for what they want.
JNL improved fixed index annuity APE sales by 44 per cent to
£62 million during the year, improving its market position to
seventh for the year, up from ninth in 2004 (Source: LIMRA). Fixed
annuity APE sales of £79 million in 2005 were down 31 per cent on
2004, reflecting the continued low interest rate environment and
relatively flat yield curve in the US. JNL has continued to pursue
value and hence has been unwilling to compromise entry spreads
in this market. JNL was ranked the seventh largest provider of
traditional individual deferred fixed annuities during 2005
(Source: LIMRA).
Institutional APE sales of £98 million were up 15 per cent on 2004.
JNL took advantage of attractive issuance opportunities during
2005, and continues to participate in this market on an
opportunistic basis.
Seventy per cent of retail premiums received in 2005 were for
products and product features that did not exist at the beginning
of 2004. In January 2005, JNL launched its ‘Perspective Advisors II’
variable annuity, and in March launched ‘Perspective L Series’
variable annuity contract, both of which included the full menu of
Perspective II benefits. These two products generated combined
sales of US$678 million in the year. JNL also extended its range of
life products during the year with the addition of ‘Ultimate
Investor’, a variable universal life contract. The flexibility of JNL’s
technology, and demonstrable competency in execution, have
resulted in an ability to quickly and efficiently meet the changing
needs of consumers and advisors.
JNL continued to develop its wholesale distribution capability
during 2005. JNL’s long-term commitment to meeting the needs of
broker-dealers and their clients, through the provision of product
flexibility, sales support tools, technology and customer service,
continues to pay dividends. During 2005, JNL increased its share
of variable annuity sales through the independent broker-dealer
channel from 6.8 per cent to 9.1 per cent, and its share of the
regional broker-dealer channel from 3.9 per cent to 4.9 per cent
(Source: VARDS).
JNL also distributes through its independent broker-dealer,
National Planning Holdings (NPH), which is a network of four
independent broker-dealers that represents approximately 2,600
registered advisors. NPH employs sophisticated technology that
allows representatives to operate efficiently and productively.
In 2005, NPH increased total revenues by three per cent to
£231 million. At June 2005, NPH was ranked the sixth largest
independent broker-dealer by revenue (Source: Financial
Planning Magazine).
As a result of capital conservation measures introduced in previous
years and further strong earnings, JNL continued to generate
significant levels of capital, improving the capital ratio from 8.5 per
cent in 2004 to 9.2 per cent in 2005. JNL’s statutory capital, surplus
and asset valuation reserve position improved year-on-year by
US$434 million, after deducting the US$150 million of capital
remitted to the parent company.
Curian Capital, which offers customised separately managed
accounts, continues to build a strong position with net investment
flows of £298 million in the year. Curian, which can be accessed
with a minimum account balance of US$25,000, offers customers
access to technology that enables individual portfolio construction,
and access to institutional-quality money managers. Advisors
benefit from the efficiencies of on-line processing and compliance.
Curian Capital now has US$1.7 billion (£973 million) of assets
under management compared with US$1.1 billion (£615 million)
at the start of 2005.
JNL has completed the integration of the 1.5 million Life of Georgia
policies onto its own operating platform. This achievement clearly
demonstrates JNL’s operational effectiveness and its increasing
capability in consolidating large blocks of business. This acquisition
doubled the number of JNL’s in-force life and annuity policies,
adding scale to its operating platform and expanding its distribution
capability, as well as further diversifying its income streams. This
transaction enabled JNL to grow its life business at a higher return
and faster rate than could be achieved organically. JNL expects to
achieve the target internal rate of return after tax on this transaction
of 12 per cent, and will continue to consider further US bolt-on
acquisitions as opportunities arise.
With its relationship driven distribution, innovative product
manufacturing capability and low cost operating model, JNL is well
positioned to take advantage of the evolving opportunities in the
US retirement market. As ‘baby boomers’ retire and shift their
focus from asset accumulation to income distribution, one of
JNL’s main objectives will be to capture a proportion of these
flows. With an emphasis on sales of low capital intensive variable
annuity products, solid operating results and strong investment
performance, JNL is capable of self-generating the capital
necessary to support its future growth at the required returns and
return a growing remittance to the parent company.
The ageing demographics of the US, with the first of the 77 million
‘baby boomers’ reaching 60 this year, will, over the next decade,

12 Prudential plc Annual Report 2005
create a very significant increase in the level of distributions from
retirement savings plans. Life expectancy in the US continues to
increase while at the same time the average retirement age is
decreasing. This has led to a large increase in the average time
individuals will spend in retirement. Consequently, there is a
growing risk that individuals’ finances will be insufficient to cover
the costs of living through retirement. These consumers will have a
growing need for independent financial advice and will increasingly
seek guarantees and longevity protections from the products
they purchase.
Asia
Asia’s life insurance markets are very attractive with large scale and
high growth rates supported by consistently strong economic
growth, favourable demographics and market liberalisations.
However, there are some formidable barriers to successful entry
including entrenched incumbents, the pace of change and nature
of regulations, mandatory partners in some markets and a shortage
of experienced staff. Acquisition opportunities, particularly of scale
businesses, are limited and in North Asian markets are likely to
involve back books that currently experience negative spread and
hence require material provisions under European regulatory
capital requirements.
Since the mid 1990s, Prudential has been progressively building its
Asian platform, strengthening and protecting its market-leading
positions in its established markets (Singapore, Hong Kong and
Malaysia), entering emerging markets (Thailand, Indonesia,
Philippines, Vietnam), securing strong joint venture partners for
the sizable opportunities in India and China (ICICI and CITIC
respectively) and taking positions in the large North Asian markets
of Taiwan, Japan and Korea. Prudential now has over seven million
customers in Asia, up from 1.5 million in 2000.
In all its markets, Prudential has been focused on building
proprietary distribution as the most effective way of delivering
sustainable new business volumes and managing the customer
proposition; typically through growing tied agency and integrated
bancassurance arrangements (such as with Standard Chartered
Bank in Hong Kong). Prudential also prioritises economic capital
efficiency, profitability and customer centricity in its Asian product
portfolio as seen, for example, with the introduction of unit-linked
products across the region, an emphasis on regular premium
policies (89 per cent of APE sales in 2005), life stage themed
marketing and purposely limiting participation in the lowest margin
and highly tactical sectors.
During 2005, the business continued to make very solid progress
in a number of key areas.
In China, six new cities were added including Wuhan, the
provincial capital of Hubei. CITIC-Prudential now has 10 cities
operational in China and a further new provincial capital, Jinan in
Shandong, was added in January 2006. The main challenge facing
foreign players trying to become established in China is the need
to develop local management teams to support geographic
expansion. Prudential has a real advantage in being able to
leverage its existing Chinese speaking operations to help incubate
new teams quickly. In 2005, new business APE for China increased
by 47 per cent over 2004.
Strengthening distribution continues to be a major priority. In 2005
agent numbers grew by 26 per cent to over 170,000 with geographic
expansion in India and China being a key driver (up 36 per cent
and 37 per cent respectively). In Indonesia, the business has
excellent momentum and has increased agent numbers by 89 per
cent during the year. In the established markets, improving agency
productivity is a key initiative and, whilst this improved in 2005,
there is still significant room for growth. Prudential’s multi-channel
distribution model in Korea is a real asset as, whilst volumes from
direct campaigns such as a home shopping channel have waned
and bank distribution has been limited by regulatory caps and
industrial action, new business APE growth for 2005 of 88 per cent
reflects great success in increasing the number of tied financial
advisers (up 132 per cent) and extending the number of general
agents (brokers).
Currently 75 per cent of Prudential’s new business APE comes
from its tied agency distribution and whilst this will remain the
primary channel for some time, there is the potential to further
expand alternate channels, particularly banks and direct marketing.
Bancassurance with Standard Chartered Bank in Hong Kong
continues to be especially successful and there is considerable
potential particularly in Singapore, Malaysia and Taiwan over
the short to medium term. The life business in Japan remains
challenging and after piloting a Financial Adviser channel with little
success and high running costs this was closed in January 2006;
the emphasis is now on developing profitable partnership
distribution opportunities.
Business review continued
Asia2004 Percentage 2004 Percentage
£m unless otherwise stated 2005 (at CER) change 2005 (at RER) change
APE sales 731 594 23% 731 576 27%
NBP 413 365 13% 413 355 16%
NBP margin (% APE) 56% 61% – 56% 62% –
NBP margin (% PVP) 10.2% 10.4% – 10.2% 10.4% –
Total EEV basis operating profit* 576 473 22% 576 460 25%
Total IFRS operating profit* 195 119 64% 195 117 67%
*Based on longer-term investment returns and excluding fund management operations, development and Asia regional head office expenses.

Prudential plc Annual Report 2005 13
Taiwan’s macroeconomic environment remains challenging with
interest rates currently at record lows leading to negative spread
issues affecting the whole industry, particularly on tranches of
business sold pre 2002. Prudential has a comparatively small book
of this business and remains confident that any potential deficits
are more than adequately supported by the profitable new
business, particularly unit-linked, it has been writing for a number
of years. The Taiwanese life insurance industry is currently
dominated by players pursuing short-term volume whereas
Prudential remains firmly focused on long-term profitability. In
2005, Prudential’s new business APE mix was 73 per cent linked
products compared to the industry total of 29 per cent and new
business volumes were in line with 2004. NBP margins in Taiwan
were 51 per cent compared to 61 per cent the previous year. The
change is due to a higher proportion of capital efficient and
popular new retirement-focused regular premium unit-linked
savings plans that are investment-orientated.
Prudential’s increasing scale is enabling it to move ahead with
plans for a step change in its operating platform. A new business
processing hub was launched in Kuala Lumpur, Malaysia in early
2005 under the name Prudential Services Asia. This is already
successfully processing business for the Malaysian and Singaporean
life operations and plans are underway for a second hub to be
launched in China.
Over the last year significant progress was made with embedding a
risk management and compliance framework. Prudential employs
‘three lines of defence’; the operational management in each
business, strong risk management related functions and an
independent internal audit function. Prudential’s policies are clear
that any breach of regulatory standards attributable to staff
malpractice is unacceptable.
In financial terms, 2005 was another strong year. Prudential’s new
business APE grew by 23 per cent to £731 million over 2004. The
NBP margin was 56 per cent, compared to 61 per cent in 2004
representing changes in the average geographic mix (net two
percentage points), economic assumption changes (net two
percentage points) and product mix (net one percentage point).
Looking at these changes in more detail, Korea and India now
contribute 26 per cent of total APE compared to 18 per cent in
2004, average NBP margins in these countries are 37 per cent
and 29 per cent respectively. The impact attributed to economic
assumption changes is driven principally by increases to the risk
discount rates in China and Korea. This was more than offset by
a favourable shift in product mix in Korea where average margins
remained slightly ahead of 2004 at 37 per cent. The other main
product mix related impact was due to the lower margins on the
retirement linked product in Taiwan as discussed above which led
to a change in average margins from 61 per cent to 51 per cent.
With the exception of Taiwan, all markets have increased NBP
over 2004.
Long-term EEV operating profits of £576 million are up 22 per cent
over 2004 and are driven by NBP of £413 million and unwind of
discount of £162 million with small operating assumption changes
and experience variances netting out to £1 million.
IFRS operating profits based on longer-term investment returns,
increased 64 per cent to £195 million from £119 million in 2004,
however, 2005 does include a net £30 million from various
non-recurring items including a net £44 million profit as
previously disclosed at the half year and subsequently reduced
by £14 million of restructuring charges in Japan. Excluding these,
growth was 39 per cent reflecting the steady increase in profits
from the established markets with total IFRS operating profits
of £127 million, up 14 per cent, the emergence of profits on the
IFRS basis from the new business being sold across the region
and lower expenses in Japan.
Prudential Asia’s high proportion of profitable, regular premium
business combined with sound operational management means
cash flows can be predicted with some certainty. As previously
announced, the business is on target to fund continued strong
growth internally and begin remitting surplus cash back to the
Group from 2006 onwards.
In summary, Prudential has an excellent track record of building
a profitable business in Asia and the scale of the opportunity for
continued growth is clear.
Asset management
Prudential’s three asset management businesses are aligned with
their respective markets in the UK, Asia and the US. They operate
under different brands and with different models, each of which
is described further below.
M&GPercentage
£m unless otherwise stated 2005 2004 change
Gross investment flows 7,916 5,845 35%
Net investment flows 3,862 2,004 93%
Underlying profit before
performance-related fees 138 110 25%
Total IFRS operating profit* 163 136 20%
*Based on longer-term investment returns.
M&G is Prudential’s UK and European fund management business
and has £149 billion of funds under management, of which
£113 billion relates to Prudential’s long-term business funds. M&G
operates in markets where it has a leading position and competitive
advantage, including retail fund management, institutional fixed
income, pooled life and pension funds, property and private
finance. M&G also manages Prudential’s balance sheet for profit.
M&G has scale in all key asset classes: it is one of the largest active
managers in the UK stockmarket, one of the largest bond investors
in the UK and one of the UK’s largest property investors.
M&G’s operating profit based on longer-term investment returns
in 2005 including performance-related fees (PRF) was £163 million,
an increase of 20 per cent on last year. Underlying profit
(excluding PRF) of £138 million was 25 per cent higher than in
2004, an extremely strong result given that the previous year

14 Prudential plc Annual Report 2005
included £7 million of non-recurring provision releases. Adjusting
for this gives a like-for-like increase in profits of 34 per cent over
2004. This continues a strong upward trend which has seen
underlying profits grow from £49 million in 2002 to £138 million
last year, reflecting the strengths of M&G’s diversified business,
disciplined cost management and the successful development of
new sources of revenue.
PRF in 2005 were £24 million, including £17 million as a result of
several exceptionally profitable realisations by PPM Capital that are
not expected to recur. M&G received £7 million of performance
fees for managing Prudential’s long-term and annuity funds, which
continued to beat their strategic and competitor benchmarks
during the year.
M&G enjoyed a record year for sales during 2005, with gross fund
inflows increasing 35 per cent to £7.9 billion. Net fund inflows also
grew significantly, almost doubling to £3.9 billion and external
funds under management, which represent a quarter of M&G’s
total funds, rose by 26 per cent to £36.2 billion.
Gross fund inflows into M&G’s retail businesses were their highest
ever at £3.8 billion and were nearly double the previous year. Net
retail fund inflows totalled £1.3 billion, more than triple those in
2004. In the UK, M&G generated the highest ever retail sales in its
75 year history across a combination of its equity, fixed income and
property funds. M&G International, which sells funds in Germany,
Austria, Italy, Luxembourg and Switzerland, more than tripled its
funds under management during the year. M&G’s South African
business saw a doubling of retail funds under management. Retail
fund performance continued to be very strong, especially M&G’s
equity funds which saw 92 per cent of funds beating their UK
sector average over three years.
M&G’s institutional business saw gross fund inflows of £4.1 billion.
Significant growth in the areas of private finance and property
helped net fund inflows increase 59 per cent to £2.5 billion. M&G
continued its successful strategy of generating new revenue
streams with attractive margins using expertise developed for
internal funds, especially in the area of non-correlated assets such
as leveraged loans. M&G broke new ground in this asset class
during the year with the launch of Europe’s first pure leveraged
loan fund, the M&G European Loan Fund. The success of M&G’s
Collateralised Debt Obligation (CDO) programme also continued
during 2005 with the launch of five new CDOs. In property, the
development of external vehicles managed by Prudential Property
Investment Managers (PruPIM) for third party clients delivered
strong fund inflows.
Asia
The Asian fund management business had £26.2 billion of funds
under management as at 31 December 2005, of which £10.1 billion
related to third party funds in operations in India, Taiwan, Japan,
Korea, Malaysia, Singapore and Hong Kong. Prudential is a top
five foreign provider of mutual funds in all countries in which it
operates with the exception of Japan where significant progress
has been made in a very competitive market. In 2005, the fund
management business continued to expand geographically with
the securing of fund management licences in China, through a
joint venture with CITIC, and in Vietnam. This takes the total
number of countries in which the business has a presence to nine.
Operating profit from the Asian fund management operations was
£12 million for the year, the decrease from 2004 reflecting the
exceptional costs of £16 million incurred due to bond fund
restructuring required as a result of industry wide issues in Taiwan.
The geographic expansion of the past few years has been matched
by growth in market share, with Korea, Japan, India and Malaysia
being notable successes. Geographic diversification along with this
growth in scale has resulted in a strong upward trend in profits
with underlying profits increasing from £9 million in 2001 to
£28 million in 2005.
Net inflows from third parties of £1.3 billion were driven by strong
net inflows in Japan of £905 million and Korea of £926 million
though these were offset by net outflows in Taiwan of £745 million
due to an unsettled bond fund market.
Total reported third party funds under management of £10.1 billion
was up 13 per cent on 2004. In August last year, ICICI increased
its stake in Prudential’s India asset management joint venture from
45 per cent to 51 per cent. As a result, Prudential no longer
consolidates this business at 100 per cent and the year end
numbers are reported at 49 per cent, resulting in a £1.5 billion
reduction in funds under management for the year. On a
comparable basis, full year 2005 funds under management
grew 29 per cent on 2004.
Business review continued
Asia2004 Percentage 2004 Percentage
£m unless otherwise stated 2005 (at CER) change 2005 (at RER) change
Net investment flows 1,327 1,293 3% 1,327 1,280 4%
Total IFRS operating profit* 12 20 (40)% 12 19 (37)%
*Based on longer-term investment returns. Underlying IFRS operating profit of £28 million, offset by £16 million of charges related to bond funds in Taiwan.
PPM America 2004 Percentage 2004 Percentage
£m unless otherwise stated 2005 (at CER) change 2005 (at RER) change
Funds Under Management (£bn) 41 40 3% 41 36 14%
Total IFRS operating profit* 20 12 67% 20 12 67%
*Based on longer-term investment returns.

Prudential plc Annual Report 2005 15
PPM America
PPM America, based in Chicago, is Prudential’s North American
institutional investment manager, specialising in public and private
fixed income and equity, and real estate securities, and, through its
affiliate PPM Finance, Inc., commercial mortgage lending. At the
end of 2005, PPM America had funds under management of
£41 billion (including PPM Finance), of which 68 per cent relates
primarily to JNL policyholder assets, 29 per cent to funds managed
on behalf of other Prudential UK and Asian affiliates, and three per
cent to funds managed for external clients, including CDOs and
similar products.
In 2005, PPM America increased IFRS profits by 67 per cent,
primarily due to a one-off £5 million revaluation related to investment
vehicles managed by PPM America.
Banking2005 2004** Percentage
£m £m change
IFRS operating profit based on
longer-term investment returns,
from continuing operations*:
UK banking business 60 72 (17)%
Restructuring costs (10) (5) (100)%
Transaction costs (7) (6) (17)%
Other 1 0 100%
44 61 (28)%
Highlights of UK banking business:
Net interest income 312 287 9%
Non-interest income 215 209 3%
Cost-to-income ratio 43% 49% –
Bad debts (241) (182) (32)%
*Continuing operations – excludes Egg France and Funds Direct, which werediscontinued in 2004.
**2004 comparatives are on an IFRS basis, except for adjustments for IAS 32 and IAS 39 which have been adopted from 1 January 2005, as permitted by IFRS transitionrules.
Egg is an innovative financial services company primarily offering
banking products and services, specifically, unsecured personal
loans, credit cards, mortgages and savings accounts. Egg is now one
of the world’s largest on-line banks with approximately 3.7 million
predominantly young and upmarket customers acquired since launch.
Operating profit from the core UK banking business was £60 million,
compared with £72 million in 2004. This result represents a strong
performance given a very challenging set of market conditions with
sharply reducing growth in unsecured borrowings, narrowing
margins following the increase in average base rates and a sharp
deterioration across the industry in underlying credit quality.
Regulatory changes also impacted this year’s business performance.
In particular, the introduction of new measures into the sales
processes of payment protection insurance products in 2005 has
led to a significant reduction in income from these products across
the industry.
Despite this market environment, Egg managed to increase margins
on credit cards via increased pricing and through focusing on the
active management of its existing customer base to maximise
borrowing balances. The degree of deterioration in credit quality
was at a level substantially below the market.
Egg has completed the re-focus on its successful core UK banking
business over the last 12 months. The exit from France was
completed in the first quarter of 2005 with total costs incurred
within the provision established in 2004. In October 2005, Egg
completed the sale of Funds Direct, its investment wrap platform
business. Total operating profit from continuing operations in 2005
includes £10 million of restructuring costs.
This reorganisation aligned Egg’s cost base with its strategic focus
on the UK business and contributed to a £17 million reduction in
total expenses between 2005 and 2004.
Transaction costs of £7 million were incurred during 2005 in
relation to Prudential’s acquisition of the minority shareholdings
in Egg.
The immediate benefits from the restructuring implemented in
early 2005, together with Egg’s effective cost management
contributed to the continued downward trend in Egg’s cost to
income ratio. It was 43 per cent for 2005, compared to 49 per cent
and 53 per cent for 2004 and 2003 respectively.
The capital position at the end of the year continued to be very
strong with total capital ratio of 14.8 per cent, improving from
12.5 per cent in 2004.
The launch of Egg Money in September has further strengthened
the brand awareness and reinforced the innovative values of Egg.
This product concept also reflects Egg’s strategy of deepening its
relationship with customers which is a key differentiator and route
to higher levels of cross sales and ultimately a broader range of
product offerings. Egg Money won an award from Which? for
‘Best Money Innovation’ in November 2005.
On 1 December 2005, the Boards of Prudential and Egg
announced a recommended Offer by Prudential for the whole of
the issued and to be issued shares of Egg not already owned by
the Prudential Group. This represented approximately 21.7 per
cent of the existing issued share capital of Egg.
The Offer valued the existing issued share capital of Egg at
approximately £973 million, a 15 per cent premium to the market
capitalisation of Egg of £845 million on 30 November 2005, being
the last Business Day prior to announcement of the Offer.
Prudential offered 0.2237 New Prudential Shares for each
Egg Share.
On 23 January 2006, Prudential announced that it had received
acceptances in respect of 80.3 per cent of the issued ordinary
share capital that it did not already own bringing Prudential’s
ownership of the Egg Group to 95.7 per cent. Prudential also
announced its intention to extend the offer until further notice.
On 20 February 2006, Egg shares were delisted from the Official List.
It is anticipated that the acquisition of the minority will enable
Prudential and Egg to capitalise on the product capabilities,
customer relationships and brand strengths of Prudential, M&G
and Egg and will also facilitate the realisation of substantial
annualised pre-tax cost savings, with £40 million expected to
be realised by the end of 2007, as well as opportunities for
revenue synergies.

16 Prudential plc Annual Report 2005
Sales and funds under management
Prudential delivered strong sales growth during 2005 with total
new insurance sales up 13 per cent to £13.8 billion at constant
exchange rates (CER). This resulted in record insurance sales of
£2.1 billion on the annual premium equivalent (APE) basis, an
increase of 15 per cent on 2004. At reported exchange rates
(RER), APE was up 16 per cent on 2004. The strong growth is
reflected across all regions with APE up on 2004 by 10 per cent in
the UK, 13 per cent in the US and 23 per cent in Asia at CER.
Total gross investment sales for 2005 were £26.4 billion, up six per
cent on 2004 at RER. Net investment flows of £5.2 billion were up
58 per cent on last year at RER.
Total investment funds under management in 2005 increased by
24 per cent from £37.2 billion to £46.3 billion at RER, reflecting
net investment flows of £5.2 billion and net market and other
movements of £3.9 billion.
At 31 December 2005, total insurance and investment funds under
management were £234 billion, an increase of 19 per cent up from
2004 at RER.
Present value of new business premiums in 2005 increased by
12 per cent to £16.8 billion. Present value of new business
premiums is the preferred basis of disclosing margin under
EEV principles, and from the half year 2006 we will provide
commentary on this basis. We will continue to provide detail on
the APE basis for the foreseeable future until familiarity with the
new basis of reporting is developed.
Basis of preparation of results
From 1 January 2005, Prudential is required to account for its long-
term insurance business on an International Financial Reporting
Standards (IFRS) basis. In broad terms, IFRS profits for long-term
business contracts reflect the aggregate of statutory transfers from
with-profits funds and profits on a traditional accounting basis for
other long-term business. Although the statutory transfers from
with-profits funds are closely aligned with cash flow generation,
the pattern of IFRS profits over time from shareholder-backed
long-term businesses will generally differ from the cash flow
Long-term business APE sales
Double-digit growth in all business units
1,000
£m
800
600
400
200
0
US AsiaUK
Up 23%
Up 13%
Up 10%
20042005
pattern. Over the life of a contract, however, aggregate IFRS profits
will be the same as aggregate cash flow.
As a signatory to the European CFO Forum’s EEV Principles,
Prudential also reports supplementary results on the European
Embedded Value (EEV) basis for the Group’s long-term business,
including asset management operations and service companies
that support the long-term businesses. These results are combined
with the IFRS basis results of the Group’s other businesses.
Reference to operating profit relates to profit including the
expected long-term rate of return on investments, but excludes
exceptional items, short-term fluctuations in investment returns
and the effect of changes in economic assumptions.
International Financial Reporting Standards basis reporting
The European Union (EU) requires that all listed European groups
prepare their 2005 financial statements in accordance with EU
approved International Financial Reporting Standards (IFRS). The
IFRS basis replaces the previous modified statutory basis (MSB)
of reporting. To prepare the market for the changes the Group
reported the impact of restating its 2004 results in its Economic
and Financial Reporting announcement on 2 June 2005.
The announcement explained that the IFRS changes have been
implemented in two stages. First, for the purposes of formal IFRS
adoption from 1 January 2004 all standards other than IAS 32,
‘Financial Instruments: Disclosure and Presentation’, IAS 39,
‘Financial Instruments: Recognition and Measurement’, and IFRS 4,
‘Insurance Contracts’ have been applied.
Due to the complications for the retrospective application,
particularly for the banking industry for financial instruments, the
International Accounting Standards Board (IASB) allowed adoption
of these three standards from 1 January 2005. The Group has
chosen to adopt this approach. However, mindful of the impact on
the Group’s insurance operations, particularly Jackson National Life
(JNL), the Group has prepared supplementary pro forma results
that show the effect of adopting these standards if they had been
applied in 2004 for those businesses. The two areas of change that
are of particular relevance to Prudential’s results are:
■ Altered valuation bases for JNL derivatives and fixed income
securities; and
■ recognition of the shareholders’ share of deficits on defined
benefit pension schemes in shareholders’ equity.
In preparing its IFRS basis results the Group has chosen to continue
to provide supplementary analysis of the profit before shareholder
tax so as to distinguish operating results based on longer-term
investment returns, actuarial gains and losses on defined benefit
pension schemes, and exceptional items. The Group has also made
a discretionary change of accounting policy at the same time as the
adoption of IFRS standards. The change principally affects the
determination of longer-term returns for JNL that are credited to
operating results. Total profit before tax is unaffected by this change.
Total profit before tax now includes value movements on
derivatives that JNL uses for economic hedging together with
Financial review

Prudential plc Annual Report 2005 17
actuarial gains and losses on the Group’s defined benefit pension
schemes, and is expected to be more volatile as a result. In
addition, IFRS basis shareholders’ funds will be more volatile from
period to period because of market value movements on fixed
income securities of JNL which are classified as available for sale.
The adoption of IFRS does not have a significant impact on the
business or the underlying financial position.
European Embedded Value basis reporting
Life insurance products are, by their nature, long-term and the
profit on this business is generated over a significant number
of years. Accounting under IFRS does not, in Prudential’s
opinion, properly reflect the inherent value of these future
profit streams.
Prudential believes that embedded value reporting provides
investors with a better measure of underlying profitability of the
Group’s long-term businesses and is a valuable supplement to
statutory accounts.
As a signatory to the European CFO Forum’s EEV Principles,
Prudential has adopted EEV methodology for its 2005 year end
results. This replaces the achieved profits basis of reporting. The
main impact of the change from the achieved profits basis on the
results arises from the effects of changes to the assumed level of
locked-in capital allocated to each business, the adoption of
product specific risk discount rates, and an explicit valuation of
the time value of options and guarantees. The EEV results also
include the value of future profits from fund management and
service operations that support the long-term business. In most
other respects the approach that Prudential used for its achieved
profits reporting already conforms to the requirements of the
EEV Principles.
On the EEV basis, the shareholders’ interest in the Group’s long-
term businesses comprises:
■ The present value of future shareholder cash flows from in-force
covered business (value of in-force business), less a deduction
for the cost of locked-in (encumbered) capital;
■ the locked-in (encumbered) capital; and
■ shareholders’ net worth in excess of encumbered capital.
Stochastic valuations have been undertaken to determine the value
of in-force business including the cost of capital. A deterministic
valuation of the in-force business is also derived using consistent
assumptions, and the time value of the financial options and
guarantees is derived as the difference between the two.
The Group EEV results also incorporate the effect of the
discretionary change to the basis of determining longer-term
investment returns included in operating profits and IFRS changes
for pension scheme accounting and non-insurance operations as
described below.
European Embedded Value basis operating profit
Total EEV basis operating profit from continuing operations
based on longer-term investment returns was £1,712 million,
up 33 per cent from 2004 at CER. At RER, the result was up
34 per cent. This result reflects a combination of strong growth
in all the insurance and funds management businesses.
Prudential’s insurance business achieved significant growth, both
in terms of new business profits (NBP) and in-force profit, resulting
in a 30 per cent increase in operating profit over 2004 at CER.
In 2005, the Group has generated record NBP from insurance
business of £867 million which was 15 per cent above 2004 at CER,
2004 2004EEV basis operating profit based on longer-term 2005 (at CER) Percentage 2005 (at RER) Percentage
investment returns £m £m change £m £m change
Insurance business:
UK 426 486 (12)% 426 486 (12)%
US 741 384 93% 741 382 94%
Asia 576 473 22% 576 460 25%
Development expenses (20) (15) (33)% (20) (15) (33)%
1,723 1,328 30% 1,723 1,313 31%
Fund management business:
M&G 163 136 20% 163 136 20%
US broker-dealer and fund management 24 15 60% 24 15 60%
Curian (10) (29) 66% (10) (29) 66%
Asia fund management 12 20 (40)% 12 19 (37)%
189 142 33% 189 141 34%
Banking:
Egg (UK) 44 61 (28)% 44 61 (28)%
Other income and expenditure (244) (243) 0% (244) (241) 1%
Operating profit from continuing operations based on longer-term
investment returns 1,712 1,288 33% 1,712 1,274 34%

18 Prudential plc Annual Report 2005
driven by strong sales momentum across all markets. At RER, NBP
was up 17 per cent. The average Group NBP margin was 41 per
cent up from 40 per cent in 2004 on an APE basis and 5.2 per cent
up from 5.0 per cent on a present value of premiums basis. The
overall margin has been broadly maintained over the last two
years, reflecting careful management of product mix within each
business. In-force profit increased 48 per cent on 2004 at CER
to £876 million. At RER, in-force profit was up 49 per cent.
The in-force profit includes a £148 million charge in respect of a
persistency assumption change in the UK and a credit in the US of
£140 million reflecting an operating assumption change following
price increases introduced on two blocks of in-force term life
business announced at the half year. In aggregate, net assumption
changes were negative £54 million, with net positive experience
variances and other items of £79 million.
Results from fund management and banking business were
£233 million, an increase of 15 per cent at CER on 2004. This was
mainly driven by the significant contribution from M&G.
Other income and expenditure was negative £244 million compared
with negative £243 million at CER in 2004. This reflected an
increase in investment return on centrally held assets and other
income offset by higher interest payable and head office costs.
UK insurance operations
EEV basis operating profit based on longer-term investment
returns of £426 million was down 12 per cent on 2004. 62 per cent
of the profit was attributable to the with-profits fund.
Prudential UK’s new business profit remained in line with 2004 at
£243 million. This was driven by the 10 per cent increase in APE
sales volumes which was offset by a fall in the new business profit
margin (from 30 per cent in 2004 to 27 per cent in 2005 on an APE
basis). The movement in margin reflected the shift in product mix
in 2005 as Prudential continued to expand its shareholder-backed
product range, however, throughout the year there continued to
be competitive pressure on margins across a range of products
which Prudential substantially resisted.
New business profits
Value added by new business
1,000
£m
800
600
400
200
0
20052004
UKUSAsia
Prudential allocates shareholder capital to support new business
growth across a wide range of products in the UK. The weighted
average post-tax Internal Rate of Return (IRR) on the capital
allocated to new business growth in the UK in 2005 was 14 per
cent achieving the 2007 target set at the time of the Rights Issue
two years early. This increase was achieved by broadly maintaining
or improving individual product IRR’s during the year coupled with
a favourable product mix.
UK in-force profit of £183 million was down 25 per cent on 2004.
The profits arising from the unwind of discount from the in-force
book were partially offset by adverse operating assumption
changes and other experience variances.
At the half year, persistency assumptions were strengthened
across a number of products, primarily in respect of with-profits
bonds. This resulted in a charge of £148 million for 2005 on an
EEV basis. In the case of Prudence Bond, which accounts for a
significant proportion of the assumption change, Prudential
expected surrenders to fall after the favourable bonus declaration
in February 2005. In the event, following the bonus declaration,
customers continued to surrender their policies leading to a
strengthening of the assumption by 40 per cent. The assumption
change reflects Prudential’s current experience and, post tax,
represents three per cent of the overall embedded value of the
UK business.
The persistency assumptions represent Prudential’s current best
estimate of future experience. In the case of Prudence Bond, a
product with no set maturity or term and no surrender penalties
after five years, future customer behaviour may differ from past
experience, making it difficult to anticipate future actual surrenders
with certainty.
However, the attractiveness of Prudence Bond as a long-term
investment is demonstrated by investment returns that a typical
customer has achieved. A Prudence Bond policy will have seen its
value increase from £10,000 to £18,137 over the 10 years up to 6
April 2006. This payout represents an overall annualised return of
6.1 per cent over each of the last 10 years net of tax and charges.
Prudential continues to actively manage the conservation of its
in-force book and is currently running within assumptions.
During the year, Prudential carried out a review of its mortality
experience across all of its non-profit annuity business. As a result
of this review, it strengthened the realistic and statutory male
assumptions and weakened the realistic female assumptions to
align the realistic assumptions with recent experience. The total
effect of the changes was to reduce operating profit by £47 million,
of which the main reduction arose from increasing the cost of capital.
New annuity business written in 2005 has been priced on the new
basis for both EEV and IFRS.
Other charges of £46 million in the UK include £45 million of costs
associated with complying with new regulatory requirements
including Sarbanes-Oxley, product development and distribution
development; a negative £19 million expense variance; and a net
positive £18 million of other items. Prudential believe the
Financial review continued

Prudential plc Annual Report 2005 19
announced cost savings from its UK insurance operations and
Egg’s collaboration, together with other initiatives will lead to a
lowering of the absolute cost base going forwards.
In 2005, Prudential wrote to 440,000 of its customers contracted-
out of the State Second Pension (S2P) and provided updated
information and views to enable them to make an informed
decision about whether to contract back into S2P or remain
contracted-out, stating that Prudential believed that most people
should contract back in for the 2005/6 tax year onwards. As a
result of this we expect premiums from DWP rebate business to
fall in 2006 and subsequent years.
US operations
In the US, EEV operating profit based on longer-term investment
returns from long-term operations was £741 million, up 93 per cent
at CER and up 94 per cent from prior year at RER.
Jackson National Life (JNL) new business profit of £211 million
was up 45 per cent on 2004, reflecting a 13 per cent increase in
APE sales, and a significant improvement in new business margin
to 41 per cent from 32 per cent in 2004. On a present value of
premiums basis, the margin increased from 3.2 per cent to
4.1 per cent. The improved margin reflects a favourable business
mix; an increase in the spread assumption for fixed index annuities
reflecting the spread being achieved; improved average policy
sizes for variable and fixed annuities; economic assumption
changes, including an increase in the equity risk premium; and
benefits derived from product pricing. Pricing benefits include
the fee increase, introduced in May 2004, on the Perspective II
product. The margin on institutional business improved due to the
longer average duration contracts written by JNL during 2005.
The new business margin achieved on variable annuity business
in 2005 was 50 per cent compared with 36 per cent in 2004. The
improved margin was driven by economic assumption changes,
and a full year of benefit associated with the re-pricing mentioned
above. The economic assumption changes include an increase in
the equity risk premium from three per cent to four per cent which
Prudential believes more accurately reflects the volatility of equities.
The fixed index annuity margin has improved from the prior year
due to an increase in the long-term spread assumption from
175bps to 190bps, reflecting the spread being achieved.
For JNL, the average IRR on new business was 15 per cent which
reflects JNL’s strong pricing discipline.
In the US, the in-force profit of £530 million is 123 per cent up on
2004 at CER. The increase was primarily due to increased unwind
of discount on the in-force business, an operating assumption
change following price increases introduced on two older books of
term life business (£140 million), and improved spread variance.
The increase in the unwind of discount reflects the increase in risk
discount rates, following an increase in the equity risk premium
from three per cent to four per cent. Improved spread variance of
£89 million is up from £41 million in the prior year, and reflects
achieved spreads in excess of the current weighted portfolio target
on the regular portfolio. The spread variance in 2005 also includes
a number of non-recurring items including mortgage prepayment
fees, make-whole payments and total return swap income which
together represent £60 million of the spread variance.
As a discretionary change of accounting policy, implemented at the
same time as the adoption of IFRS, the Group has replaced the
previous basis of five year averaging of gains and losses on bonds
with a method that more closely reflects longer-term returns.
On the new basis, longer-term returns on fixed income securities
comprise two elements. The first element is a risk margin reserve
(RMR) charge for long-term default experience of £58 million for
2005. The present value of future RMR charges is reflected in the
opening embedded value. The second element is amortisation of
£53 million of interest related realised gains and losses. These
gains and losses are amortised to operating profit over the bonds’
original maturities.
The excess or deficit of actual realised gains and losses for fixed
income securities for the period over these components of longer-
term returns is included in short-term fluctuations in investment
returns as a separate component of total profit for the period.
Following this change of policy for JNL’s EEV basis operating profit,
the component for longer-term returns for fixed income securities
is expected in the future to be a more stable feature than on the
previous basis, which was affected by the volatility of realised
gains and losses over a five year period. Total profit, including
actual investment returns, is unaffected by the change. Further
details of the change of policy are explained in the notes to the
EEV and IFRS basis results. In 2005, JNL experienced a net realised
gain of £1 million on its corporate bond portfolio. This is reflected
in total EEV basis profit before tax.
Asia operations
EEV basis operating profit based on longer-term investment
returns from long-term operations (excluding development
and regional head office costs) was £576 million for the year,
up 22 per cent at CER and 25 per cent at RER on 2004.
In Asia, NBP of £413 million was up 13 per cent at CER on 2004
with increased sales offset partially by NBP margin. During 2005,
APE sales were up 23 per cent on 2004 and the NBP margins were
56 per cent on an APE basis and 10.2 per cent on a present value
of premiums basis, compared with 61 per cent and 10.4 per cent
respectively in 2004 at CER. The key drivers of lower margins in
Asia compared to prior year were country mix (reduction of two
percentage points), product mix – principally in Taiwan (reduction
of one percentage point) and assumption changes (reduction of
two percentage points).
Korea and India now contribute 26 per cent of total APE compared
to 18 per cent in 2004. Average NBP margins in these countries are
37 per cent and 29 per cent respectively. The impact attributed to
economic assumption changes is driven principally by increases to
the risk discount rates in China and Korea. This was more than
offset by a favourable shift in product mix in Korea where average
margins remained slightly ahead of 2004 at 37 per cent. The other
main product mix related impact was due to the lower margins on
the new retirement unit-linked product in Taiwan which led to a
change in average margins from 61 per cent to 51 per cent.

20 Prudential plc Annual Report 2005
Asia’s in-force profit (before development expenses and the Asian
fund management business) increased to £163 million in 2005 from
£108 million in 2004 at CER. This reflects a higher value related to
the unwind of the discount rate as the in-force business builds scale.
In Asia we have target IRRs on new business at a country level of
10 percentage points over the country risk discount rate. Risk
discount rates vary from five per cent to 18 per cent depending
upon the risks in each country market. These target rates of return
are average rates and the marginal return on capital on a particular
product could be above or below the target.
We have, however, exceeded the target in each of Asia’s markets
in 2005 except for Thailand and Japan, which have yet to reach
scale. In aggregate, IRR on new business exceeded 20 per cent on
average new business risk discount rates for 2005 of 9.8 per cent.
Asset management, banking and other
M&G
M&G’s operating profit was £163 million, an increase of 20 per
cent on last year. This included £24 million in performance-related
fees (PRF), of which £17 million was earned by PPM Capital
following another year of extremely profitable realisations on
behalf of its clients. These are not expected to recur.
Underlying profit (excluding PRF) of £138 million was 25 per cent
higher than in 2004, an extremely strong result given that the
previous year included £7 million of non-recurring provision
releases. Adjusting for this gives a like-for-like increase in profit
of 34 per cent over 2004.
In the past few years, growth in income from M&G’s existing
businesses has been reinforced by the successful development
of revenue streams from new activities. These include Prudential
Finance, which manages Prudential’s balance sheet for profit, private
finance, including CDOs, and Prudential Property Investment
Managers (PruPIM), which increasingly manages assets for external
investors. In its retail businesses, sales of equity funds have risen
significantly in both the UK, as a result of strong investment
performance, and overseas, where M&G continues to build new
distribution channels in selected European and other markets.
The benefits of this business diversification are clearly demonstrated
by the strong upward trend in profits that M&G has posted –
underlying profits have increased consistently from £49 million in
2002 to £138 million in 2005. Profits growth in 2005 was largely
due to the impact of higher asset prices in equity and property
markets, combined with the impact of positive net inflows over a
period of several years. In addition, discipline continues to be
exercised over costs, which have risen only slightly this year after
four years in which they were held flat.
US broker-dealer and fund management businesses
The broker-dealer and fund management operations reported
profits of £24 million, compared with £15 million in 2004, primarily
due to a one-off £5 million revaluation related to an investment
vehicle managed by PPM America.
Curian
Curian, which provides innovative fee-based separately managed
accounts, recorded losses of £10 million in 2005, improved from
losses of £29 million in 2004, as the business continues to build
scale. At year end 2005, Curian had grown assets under
management to US$1.7 billion (£973 million) from US$1.1 billion
(£615 million) at year end 2004.
Asian fund management business
The fund management business in Asia has expanded into new
markets in the past few years and is now in nine markets across
Asia. Geographic diversification along with this growth in scale has
resulted in a strong upward trend in profits.
Profit from the Asian fund management operations was £12 million
for the year, down 37 per cent from 2004 reflecting the exceptional
costs of £16 million incurred due to bond fund restructuring
required as a result of industry wide issues in Taiwan. Underlying
profit from the Asian fund management operations, excluding
charges of £16 million, grew by 47 per cent to £28 million, a strong
result indicative of the economies of scale the business is now
generating. Adjusting for the reporting of India at 49 per cent
from 26 August 2005 results in an increase in profits of 55 per cent
over 2004.
At the Group level, profit before tax includes £6 million in profit
attributable to realising value created in India when ICICI increased
its stake in Prudential’s Indian asset management joint venture
from 45 per cent to 51 per cent. This amount is included in short-
term fluctuations but excluded from operating profit based on
longer-term investment returns.
Egg
Egg’s total continuing operating profit in 2005 was £44 million,
compared with £61 million in 2004. This reflected the increasingly
challenging market conditions and £10 million restructuring costs
incurred in the first half of 2005.
Operating profit of the core UK banking business was £60 million.
The reduction from £72 million for 2004 primarily reflected the fact
that although Egg successfully grew income by £31 million in a
difficult market and cut £17 million from its cost base, this was
more than offset by an increase of £59 million in bad debts due
to the changing mix in the portfolio, business growth plus a
deterioration in credit quality driven by economic factors across
the UK unsecured lending market.
The UK unsecured lending market only grew marginally in 2005
and, indeed, there was a net reduction in credit card balances in
the second half of the year. Against this tough market environment,
Egg managed to drive up the return on its credit card portfolio by
focusing on growing interest bearing balances and successfully
Financial review continued

Prudential plc Annual Report 2005 21
repricing the card to reflect the higher funding costs, given base
rates had risen on average compared to 2004. This contributed to
an increase of £32 million in net interest income.
As a result of the effective cost management, together with the
benefits of reorganisation early this year, Egg’s cost to income ratio
continued its downward trend to 43 per cent for 2005, improving
from 49 per cent and 53 per cent for 2004 and 2003 respectively.
In 2005, a sharp deterioration in credit quality has adversely
affected the UK retail banking sector leading to an increase in
impairment charges across the sector, including Egg, compared
to expectations. The result Egg achieved, which we believe is
better than average industry performance, is due to the tactical
decision to tighten its lending criteria early in the credit cycle,
active portfolio management and its underlying higher quality
card portfolio.
Regulatory attention continues to be devoted to the creditor
insurance market and we believe the introduction of new measures
into the sales processes for payment protection products has led to
a reduction of approximately 20 per cent on the commission revenue
earned on this product across the banking sector. Egg experienced
similar reductions, a solid performance for an on-line bank.
Through the acquisition of the minority interests of Egg and the
closer partnership of Egg with Prudential UK life and pension
businesses, Prudential expects to achieve total annualised pre-tax
cost savings across the combined businesses of £40 million by
the end of 2007. Costs of approximately £50 million pre-tax are
estimated to be incurred from this restructuring. This will be
provided for in 2006.
Other
Asia’s development expenses (excluding the regional head office
expenses) increased by 33 per cent at CER to £20 million, compared
with £15 million in 2004. These development expenses primarily
related to our newer operations and establishing our services hub
in Malaysia.
Other net expenditure remained constant over 2004. This
reflected other income as a result of the interest earned on the
net proceeds from the 2004 Rights Issue offset by higher interest
payable. Head office costs (including Asia regional head office
costs of £30 million) were £100 million, up £19 million on 2004.
The increase mainly reflects the substantial work being undertaken
for the implementation of IFRS and EEV reporting, Sarbanes-Oxley
and other regulatory costs.
Total EEV basis – result before tax for continuing operations
(Year-on-year comparisons below are based on RER.)
The result before tax and minority interests was a profit of
£2,244 million up 26 per cent on 2004. This reflects an increase
in operating profit from £1,274 million to £1,712 million, together
with a favourable movement of £431 million in short-term
fluctuations in investment returns from £570 million to £1,001 million.
This is offset by negative movements, principally £223 million due
to changes in economic assumptions and a goodwill impairment
charge of £120 million.
The UK long-term business component of short-term fluctuations in
investment returns of £995 million primarily reflects the difference
between an actual investment return for the with-profits life fund
of 20 per cent and the long-term assumed return of seven per cent.
The US long-term business short-term fluctuations in investment
returns of £65 million include a positive £63 million in respect of
the difference between actual investment returns and long-term
returns included in operating profit. The primary factor was a
return in excess of assumptions on limited partnership
investments. It also includes a positive £4 million in relation to
changed expectations of future profitability on variable annuity
business in force due to the actual separate account return
exceeding the long-term return reported within operating profit.
In Asia, long-term business short-term investment fluctuations
were £41 million, compared to £91 million last year. This mainly
reflects improving equity markets in a number of countries.
Negative economic assumption changes of £349 million in 2005
compared with negative economic assumption changes of
£126 million in 2004. Economic assumption changes in 2005
comprised negative £81 million in the UK, negative £3 million
in the US and negative £265 million in Asia.
In the UK, economic assumption changes of negative £81 million
reflect the impact of the increase in the future investment return
assumption offset by the increase in the risk discount rate. The
increases arise because although interest rates have decreased
over 2005, the equity risk premium assumption has increased from
three per cent to four per cent.
In the US, economic assumption changes of negative £3 million
primarily reflect increases in the risk discount rates following
the increase in the equity risk premium from three per cent to
four per cent, partially offset by an increase in the separate account
return assumption.
Asia’s negative economic assumption changes of £265 million
primarily reflect the effect of lower bond yields in Taiwan which
necessitated a reduction in the Fund Earned Rate assumptions. The
economic scenarios used to calculate 2005 EEV basis results reflect
the assumption of a phased progression of the bond yields from
the current rates to the long-term expected rates. The projections
assume that, in the average scenario, the current bond yields of
around two per cent trend towards 5.5 per cent at 31 December
2012. Allowance is made for the mix of assets in the fund, our
future investment strategy and the market value depreciation of
the bonds as a result of the assumed yield increases. This gives rise
to an average assumed Fund Earned Rate that trends from 2.3 per
cent to 5.4 per cent in 2013 and falls below 2.3 per cent for seven

22 Prudential plc Annual Report 2005
years due to the depreciation of bond values as yields rise.
Thereafter, the Fund Earned Rate fluctuates around a target of
5.9 per cent. This compares to a grading of 3.4 per cent at
31 December 2004 to 5.9 per cent by 31 December 2012 for the
2004 results. Consistent with our EEV methodology, a constant
discount rate has been applied to the projected cash flows.
The effect of change in the time value of cost of options and
guarantees was positive £47 million for the year, consisting
of £31 million, £11 million and £5 million for the UK, the US
and Asia, respectively.
Total EEV basis – result after tax for continuing operations
The result after tax, minority interests and discontinued operations
was £1,582 million. The tax charge of £653 million compares with a
tax charge of £553 million in 2004. Minority interests in the Group
results were £12 million.
The effective tax rate at an operating profit level was 21 per cent
(2004: 27 per cent), reflecting the lower effective tax rates in
the UK and certain Asian territories. The effective tax rate at a
total EEV level was 29 per cent (2004: 31 per cent) on a profit
of £2,244 million. The higher effective rate of tax compared with
that at an operating profit level is primarily due to the effect of
impairment of goodwill (which does not attract tax relief), and the
impact of short-term fluctuations in investment returns and
changes in economic assumptions not all of which are tax affected.
The reduction in the 2005 effective tax rate arises from a number
of factors, including settlement of a number of outstanding issues
with HMRC and benefit taken for prior year losses incurred in
France following a recent European Court of Justice decision.
EEV basis shareholders’ funds
Analysis of movement: 2005
12,000
£m
11,000
10,000
9,000
8,000
7,000
6,000
G HF I J K NMLEDA B C
A Opening 2005 EEV basis shareholders’ funds (+£8,614m)B New business EEV profits (+£867m)C In-force EEV profits (+£876m)D M&G (+£163m)E Egg (+£44m)F Other non-life operations (+£26m)G Other income and expenditure (incl Asia Dev exp) (-£264m)H Goodwill impairment charge (-£120m)
I Short-term fluctuations in investment returns (+£1,001m)J Effect of changes in economic assumptions (-£349m)K Tax, minority interests and others (-£619m)L FX movements (+£442m)M External dividends (-£380m)N Closing 2005 shareholders’ funds (+£10,301m)
Return on embedded value
Prudential’s return on embedded value for 2005 was 15.7 per cent,
up from 13.4 per cent in 2004 reflecting the Group’s continued
focus on profitable growth. The return is based on post-tax EEV
operating profit from continuing operations as a percentage of
opening embedded value.
International Financial Reporting Standards (IFRS) results
IFRS operating profit (based on longer-term investment
returns)
Reference to operating profit relates to profit including investment
returns at the expected long-term rate of return but excludes
short-term fluctuations in investment returns, actuarial gains and
losses of defined benefit pension schemes and exceptional items.
Group operating profit before tax from continuing operations on
the IFRS basis was £957 million, an increase of 36 per cent on the
pro forma IFRS basis for 2004 at CER. At RER, operating profit
was up 37 per cent on prior year. This reflects strong growth in
insurance and funds management businesses.
In the UK, IFRS operating profit increased 35 per cent to £400 million
in 2005. This reflected a nine per cent increase in profits attributable
to the with-profits business, a consequence of bonus declarations
announced in February 2005 and February 2006, a 44 per cent
increase in profits arising from annuities business, and IFRS profits
arising from the Phoenix Life and Pensions transaction completed
in June 2005.
In the US, IFRS operating profit of £362 million was up 27 per cent
on 2004. IFRS operating profit for long-term business was
£348 million, up 17 per cent from £298 million in 2004. The
US operations’ results are based on US GAAP, adjusted where
necessary to comply with IFRS as the Group’s basis of presenting
operating profit is based on longer-term investment returns. In
determining the US results, longer-term returns for fixed income
securities incorporate a risk margin reserve (RMR) charge for
longer-term defaults and amortisation of interest-related realised
gains and losses.
The growth in the US operations’ long-term IFRS operating profit
reflects a continued ability to deliver improved investment returns,
with greater spread and fee income offset by higher amortisation
of deferred acquisition costs (DAC). In 2005, spread income was
£119 million higher than in 2004, and included a number of non-
recurring items including mortgage prepayment fees, make-whole
payments and total return swap income which together represented
£60 million of spread income. JNL achieved record fee income
during 2005, driven by a 42 per cent increase in separate account
assets held at year end, and improved returns on these assets.
The 2004 result benefited from two one-off items, a favourable
legal settlement of £28 million (£21 million after related charge to
amortisation of deferred acquisition costs) and a positive £8 million
adjustment arising from the adoption of new accounting guidance
Financial review continued

Prudential plc Annual Report 2005 23
in SOP 03-01, ‘Accounting and Reporting by Insurance Enterprises
for Certain Non-traditional Long Duration Contracts and for
Separate Accounts’. This adjustment relates to a change in the
method of valuing certain liabilities.
The improvement in non-long-term business profits was primarily
driven by reduced losses recorded by Curian, down to £10 million
from £29 million in 2004, as the business continues to build scale.
The result also benefited from an improvement in PPMA profits,
primarily due to a one-off £5 million revaluation of an investment
vehicle managed by PPMA.
Prudential Corporation Asia’s operating profit for long-term
business before development expenses of £20 million was
£195 million, an increase of 64 per cent on 2004 at CER and
included a net £44 million profit related to exceptional items
reported at the half year subsequently reduced by £14 million in
restructuring costs for Japan. At reported rates, operating profits
were 67 per cent up on last year. The majority of this profit
currently comes from the larger and more established operations
of Singapore, Hong Kong and Malaysia, which represent £127 million
of the total operating profit in 2005, excluding exceptional items,
compared to £111 million last year. In addition, markets such
as Indonesia and Vietnam are becoming larger contributors to
operating profits. Five life operations made IFRS losses: China and
India which are relatively new businesses rapidly building scale;
Thailand and Taiwan which are marginally loss making; and Japan
where the loss increased over 2004 due to restructuring costs
incurred during the year.
Total IFRS profits – result before tax for continuing
operations
(Year-on-year comparisons below are based on RER.)
Total IFRS profits before tax attributable to shareholders and
minority interests were £998 million in 2005, compared with
£985 million on the pro forma basis for 2004. The increase reflects:
growth in operating profit of £258 million offset by a goodwill
impairment charge of £120 million in relation to the Japanese life
business; decrease in short-term fluctuations in investment return,
down £82 million from 2004; and a £43 million negative movement
from the prior year in actuarial gains and losses attributable to
shareholder-backed operations in respect of the Group’s defined
benefit pension schemes.
The development of the Japanese life business has been slower
than expected and, following its restructuring and the annual
impairment review, Prudential concluded that the purchased
goodwill associated with this business of £120 million should be
written off.
The results for discontinued operations reflects the sale of Jackson
Federal Bank and the discontinuation of Egg’s France and Funds
Direct operations.
Pro forma* Pro forma*2004 2004
2005 (at CER) Percentage 2005 (at RER) PercentageIFRS operating profit based on longer-term investment returns £m £m change £m £m change
Insurance business:
UK 400 296 35% 400 296 35%
US 348 298 17% 348 296 18%
Asia 195 119 64% 195 117 67%
Asia development expenses (20) (15) (33)% (20) (15) (33)%
923 698 32% 923 694 33%
Fund management business:
M&G 163 136 20% 163 136 20%
US broker-dealer and fund management 24 15 60% 24 15 60%
Curian (10) (29) 66% (10) (29) 66%
Asia fund management 12 20 (40)% 12 19 (37)%
189 142 33% 189 141 34%
Banking:
Egg (UK) 44 61 (28)% 44 61 (28)%
Other income and expenditure (199) (198) (1)% (199) (197) (1)%
Operating profit from continuing operations based on longer-term
investment returns 957 703 36% 957 699 37%
*The comparative IFRS results shown above are prepared on a ‘pro forma’ basis which reflects the estimated effect on the 2004 results as if IAS 32, IAS 39 and IFRS 4 had beenapplied from 1 January 2004 to the Group’s insurance operations together with the discretionary change for the basis of determining longer-term investment returns, as disclosedon 2 June 2005.

24 Prudential plc Annual Report 2005
Total IFRS profits – result after tax for continuing
operations
Profit after tax and minority interests was £748 million compared
with £602 million in 2004. The effective rate of tax on operating
profits, based on longer-term investment returns, was 19 per cent
(2004: 30 per cent). The effective rate of tax at the total IFRS profit
level for continuing operations for 2005 was 24 per cent (2004:
29 per cent). The reduction in the 2005 effective tax rate arises
from a number of factors, including settlement of a number of
outstanding issues with HMRC and benefit taken for prior year
losses incurred in France following a recent European Court of
Justice decision.
Earnings per share
Earnings per share, based on EEV basis operating profit after tax
and related minority interests were 56.6 pence, compared to
43.2 pence in 2004. Earnings per share, based on IFRS operating
profit after tax and related minority interests, were 32.2 pence,
compared with a 2004 figure of 22.7 pence.
Basic earnings per share, based on total EEV basis profit from
continuing operations for the year after minority interests, were
66.8 pence, compared with a figure of 56.8 pence in 2004.
Basic earnings per share, based on IFRS profit from continuing
operations for the year after minority interests, were 31.5 pence,
in line with the 2004 figure.
Dividend per share
We intend to maintain our current dividend policy, with the level of
dividend growth being determined after considering the
opportunities to invest in those areas of our business offering
attractive growth prospects, our financial flexibility and the
development of our statutory profits over the medium to long term.
The Board recommends a full year dividend per share for 2005 of
16.32 pence, an increase of three per cent over the full year 2004
dividend of 15.84 pence.
Dividend cover based on reported post-tax IFRS operating profits
from continuing operations is 1.9 times. Dividend cover based on
reported IFRS operating profits from continuing operations and
normalised tax rate of 30 per cent is 1.7 times.
Balance sheet
Explanation of balance sheet structure
The Group’s capital on an IFRS basis comprises of shareholders’
funds £5,194 million; subordinated long-term and perpetual debt
of £2,098 million; other core structured borrowings £1,093 million
and the unallocated surplus of with-profits funds of £11.4 billion.
Subordinated or hybrid debt is debt capital which has some equity
like features and which would rank below other senior debt in the
event of a liquidation. These features allow hybrid debt to be treated
as capital for Financial Services Authority (FSA) regulatory purposes.
All of the Group’s hybrid debt which qualifies in this way is held
at the Group level and is therefore taken as capital into the parent
solvency test under the Financial Conglomerates Directive (FCD).
The FSA has established a structure for determining how much
hybrid debt can count as capital which is similar to that used for
banks. It categorises capital as Tier 1 (equity and preference
shares), Upper Tier 2 debt and Lower Tier 2 debt. Up to 15 per
cent of Tier 1 can be in the form of hybrid debt and called
‘Innovative Tier 1’. At 31 December 2005, the Group (including
Egg) held £865 million of Innovative Tier 1 capital, in the form of
perpetual securities, £186 million Upper Tier 2 and £1,112 million
of Lower Tier 2 capital. Following the implementation of the FCD,
it is advantageous to the Group from a regulatory capital
standpoint to raise its long-term debt in hybrid form and it is the
Group’s policy to take advantage of favourable market conditions
as they arise to do so.
The unallocated surplus of the with-profits funds represents assets
in the Life Fund which have not yet been allocated either to
policyholders or shareholders and which are not generally
available to the Group other than as they emerge through the
statutory transfer of the shareholders’ share of the surplus as it
emerges from the fund over time.
Asset and liability management
Prudential manages its assets and liabilities locally, in accordance
with local regulatory requirements and reflecting the differing
types of liabilities Prudential has in each business. As a result of the
diversity of products Prudential offers and the different regulatory
environments in which it operates, Prudential employs different
methods of asset/liability management on both an in-force and
new business basis. Stochastic modelling of assets and liabilities is
undertaken in the UK, the US and Asia to assess economic capital
requirements for different confidence intervals and time horizons.
In addition, reserve adequacy testing under a range of scenarios
and dynamic solvency analysis is carried out, including certain
scenarios mandated by the US, the UK and Asian regulators.
Weighted average cost of capital (WACC)
Our commitment to our shareholders is to maximise the value of
Prudential over time by delivering superior financial returns.
Prudential’s weighted average cost of capital (WACC) is circa
9.2 per cent, which is based on the net core debt and shares
outstanding at the end of 2005, an equity market premium of four
per cent and a market beta of 1.4. Prudential’s WACC has
increased since the end of 2004 largely due to an increase in the
assumed equity risk premium. Prudential continues to retain a
significant portion of the Rights Issue proceeds which results in a
higher proportion of the Group’s capital being funded by equity
which, in turn, results in a temporary increase in the Group’s
WACC over its long-term WACC.
Financial review continued

Prudential plc Annual Report 2005 25
Shareholders’ funds
On the EEV basis, which recognises the shareholders’ interest in
long-term businesses, shareholders’ funds at 31 December 2005
were £10.3 billion, an increase of £1.7 billion from the 2004 year
end level after restating for relevant IFRS changes. This 20 per cent
increase primarily reflects: total EEV basis operating profit of
£1,712 million; a £1,001 million favourable movement in short-
term fluctuations in investment returns; and the positive impact of
£442 million for foreign exchange movements. These were offset
by: a £302 million negative movement due to changes in economic
assumptions; a tax charge of £653 million; dividend payments of
£325 million made to shareholders (net of scrip dividend); and the
impairment charge of £120 million in respect of purchased
goodwill associated with the Japanese life business.
At year end 2005, the embedded value for the Asian long-term
business as a whole was £2.0 billion. The established markets
of Hong Kong, Singapore and Malaysia contribute £1.8 billion
to the embedded value generated across the region with Korea
(£136 million) and Vietnam (£127 million) making further substantial
contributions. Our other markets of China, India, Indonesia, Japan,
Thailand and the Philippines in aggregate contribute £211 million
in embedded value. Growth in embedded value for the Asian
business as a whole has been partially offset by a negative
embedded value in Taiwan of £311 million which includes the
associated cost of economic capital, and reflects the low interest
rate environment in Taiwan.
The current mix of business in Taiwan is weighted heavily towards
unit-linked and protection products, representing 73 per cent and
16 per cent of new business APE in 2005, respectively. As a result,
interest rates have little effect on new business profitability and a
one per cent reduction in assumed interest rates would reduce
new business margins in Taiwan by only two percentage points.
However, the in-force book in Taiwan, predominantly made up of
whole of life policies, has an embedded value that is sensitive to
interest rate changes. A one per cent decrease in interest rates,
along with consequential changes to assumed investment returns
for all asset classes, market values of fixed interest assets and risk
discount rates, would result in a £174 million decrease in Taiwan’s
embedded value. A similar one per cent positive shift in interest
rates would increase embedded value by £106 million. Sensitivity
of the embedded value to interest rate changes varies considerably
across the region. In aggregate, a one per cent decrease in interest
rates, along with all consequential changes noted above, would
result in only a six per cent decrease to Asia’s embedded value.
Statutory IFRS basis shareholders’ funds at 31 December 2005
were £5.2 billion. This compares with £4.7 billion on the pro forma
IFRS basis at 31 December 2004. The increase primarily reflects:
profit after tax and minority interests of £748 million and positive
foreign exchange movements of £268 million, offset by dividend
payments to shareholders (net of scrip dividend) of £325 million.
Cash flow
The table below shows the Group holding company cash flow.
Prudential believes that this format gives a clearer presentation of
the use of the Group’s resources than the format of the statement
required by IFRS.2005 2004
£m £m
Cash remitted by business units:
UK life fund transfer* 194 208
UK other dividends (including special
dividend) 103 100
JNL 85 62
Asia 73 67
M&G 62 84
Total cash remitted to Group 517 521
Net interest paid (115) (119)
Dividends paid (378) (323)
Scrip dividends and share options 55 119
Cash remittances after interest and
dividends 79 198
Tax received 107 34
Corporate activities (66) (56)
Cash flow before investment in businesses 120 176
Capital invested in business units:
UK (249) (189)
Asia (169) (158)
Total capital invested in business units (418) (347)
Decrease in cash before Rights Issue
proceeds (298) (171)
Rights Issue proceeds 0 1,021
(Decrease) increase in cash (298) 850
*In respect of prior year’s bonus declarations.
The Group holding company received £517 million in cash
remittances from business units in 2005 (2004: £521 million)
comprising the shareholders’ statutory life fund transfer of
£198 million relating to the 2004 bonus declarations, of which
£194 million was remitted from the UK and £4 million from Asia,
together with other remittances from subsidiaries of £319 million.
This includes a special dividend of £100 million from the Prudential
Assurance Company (PAC) shareholders’ funds in respect of profit
arising from earlier business disposals and a separate payment of
US$150 million from JNL. The reduced transfer from M&G is due
to a higher level of reinvestment in 2005 in new activities together
with a remittance of surplus cash in 2004.
After net dividends and interest paid, there was a net cash inflow
of £79 million (2004: £198 million).
During 2005, the Group holding company paid £66 million in
respect of corporate activities and received £107 million in respect

26 Prudential plc Annual Report 2005
of tax. Tax received in 2004 of £34 million was after an exceptional
payment of £60 million related to the sale of equity securities
backing the general insurance business. The £107 million balance
in 2005 represents surrendered tax losses reimbursed by the
Group. The Group invested £418 million (2004: £347 million) in
its business units, comprising £249 million in its UK Operations and
£169 million in Asia. During 2006, Prudential continues to expect
that Asia will be a net capital provider to the Group.
In aggregate this gave rise to a decrease in cash of £298 million
(2004: £850 million increase, after Rights Issue proceeds).
As a result of the bonus declarations made in February 2005
and February 2006, the shareholder transfer is expected to be
£223 million in 2006.
Cash invested to support the UK business in 2006 is expected to
be less than 2005, up to £230 million depending on the mix of
business written and the opportunities available.
Shareholders’ borrowings and financial flexibility
Net core structural borrowings at 31 December 2005 were
£1,611 million compared with £1,236 million at 31 December
2004. This reflects the net cash outflow of £298 million, exchange
conversion losses of £92 million and IFRS adjustments of negative
£15 million.
After adjusting for holding company cash and short-term
investments of £1,128 million, core structural borrowings of
shareholder-financed operations (excluding Egg) at the end of
2005 totalled £2,739 million, compared with £2,797 million at
the end of 2004. This decrease reflected the repayment of
US$250 million bonds, the issuance of US$300 million Perpetual
Subordinated Capital Securities, the repayment of £171 million of
short-term borrowings, exchange conversion losses of £98 million
and IFRS adjustments noted above.
Core long-term loans at the end of 2005 included £1,830 million
at fixed rates of interest with maturity dates ranging from 2007 to
perpetuity. £1,010 million of the core borrowings were denominated
in US dollars, to hedge partially the currency exposure arising from
the Group’s investment in JNL.
Prudential has in place an unlimited global commercial paper
programme. At 31 December 2005, commercial paper of
£408 million, US$1,538 million and €228 million has been issued
under this programme. Prudential also has in place a £5,000 million
medium-term note (MTN) programme. At 31 December 2005,
subordinated debt outstanding under this programme were
£435 million and €520 million, and senior debt outstanding was
US$18 million. In addition, the holding company has access to
£1,500 million committed revolving credit facilities, provided by
15 major international banks and a £500 million committed
securities lending liquidity facility. These facilities have not been
drawn on during the year. The commercial paper programme,
the MTN programme, the committed revolving credit facilities and
the committed securities lending liquidity facility are available for
general corporate purposes and to support the liquidity needs of
the parent company.
The Group’s insurance and asset management operations are
funded centrally. Egg, as a separate bank, is responsible for its own
financing. The Group’s core debt is managed to be within a target
level consistent with its current debt ratings. At 31 December 2005,
the gearing ratio (debt, net of cash and short-term investments, as a
proportion of EEV shareholders’ funds plus debt) was 13.5 per cent
compared with 12.5 per cent at 31 December 2004.
Prudential plc enjoys strong debt ratings from both Standard &
Poor’s and Moody’s. Prudential long-term senior debt is rated AA–
(negative outlook) and A2 (stable outlook) from Standard & Poor’s
and Moody’s respectively, while short-term ratings are A1+ and P-1.
Based on EEV basis operating profit from continuing operations
and interest payable on core structural borrowings (excluding Egg),
interest cover was 10.8 times in 2005 compared with 9.3 times
in 2004.
Treasury policy
The Group operates a central treasury function, which has overall
responsibility for managing its capital funding programme as well
as its central cash and liquidity positions.
The aim of Prudential’s capital funding programme, which includes
the £5,000 million MTN programme together with the unlimited
commercial paper programme, is to maintain a strong and flexible
funding capacity.
In the UK and Asia, Prudential uses derivatives to reduce equity
risk, interest rate and currency exposures, and to facilitate efficient
investment management. In the US, JNL uses derivatives to reduce
interest rate risk, to facilitate efficient portfolio management and to
match liabilities under fixed index policies.
It is Prudential’s policy that all free-standing derivatives are used to
hedge exposures or facilitate efficient portfolio management.
Amounts at risk are covered by cash or by corresponding assets.
Due to the geographical diversity of Prudential’s businesses, it
is subject to the risk of exchange rate fluctuations. Prudential’s
international operations in the US and Asia, which represent a
significant proportion of operating profit and shareholders’ funds,
generally write policies and invest in assets denominated in local
currency. Although this practice limits the effect of exchange rate
fluctuations on local operating results, it can lead to significant
fluctuations in Prudential’s consolidated financial statements upon
conversion of results into pounds sterling. The currency exposure
relating to the conversion of reported earnings is not separately
managed, as it is not in the economic interests of the Group to
Financial review continued

Prudential plc Annual Report 2005 27
do so. The impact of gains or losses on currency conversions
is recorded as a component of shareholders’ funds within the
statement of recognised income and expense. The impact of
exchange rate fluctuations in 2005 is discussed elsewhere in this
financial review.
Unallocated surplus of with-profits funds
During 2005, the unallocated surplus, which represents the excess
of assets over policyholder liabilities for the Group’s with-profits
funds on a statutory basis, grew from £8.3 billion at 1 January (after
the effect of adoption of IFRS and the realistic reporting regime in
the UK) to £11.4 billion at 31 December. This reflects an increase
in the cumulative retained earnings arising on with-profits business
that have yet to be allocated to policyholders or shareholders. The
change in 2005 predominantly reflects the positive investment
return earned by the PAC with-profits fund as a result of investment
gains in the UK equity market.
Regulatory capital requirements
The FCD, which affects groups with significant cross-sector
activities in insurance and banking/investment services, came
into force for Prudential from 1 January 2005. Prior to this, since
1 January 2001 Prudential was required to meet the solvency
requirements of the Insurance Groups Directive (IGD), as
implemented by the FSA. The FSA has implemented the FCD by
applying the sectoral rules of the largest sector, hence a group
such as Prudential is classified as an insurance-led conglomerate
and is required to focus on the capital adequacy requirements
of the IGD, the Consolidated Life Directive and the Insurance
Company Accounts Directive.
The FCD requires a continuous parent company solvency test
which requires the aggregating of surplus capital held in the
regulated subsidiaries, from which Group borrowings are
deducted, other than those subordinated debt issues which qualify
as capital. No credit for the benefit of diversification is allowed
for under this approach. The test is passed when this aggregate
number is positive, and a negative result at any point in time is
a notifiable breach of UK regulatory requirements. In practice,
whether Prudential is classified as a financial conglomerate or
insurance group, there is very little difference in application of
the rules. This is because the FSA has decided to make the test
mandatory from 31 December 2006 to all insurance groups.
Due to the geographically diverse nature of Prudential’s
operations, the application of these requirements to Prudential are
complex. In particular, for many of our Asian operations, the
assets, liabilities and capital requirements have to be recalculated
based on FSA regulations as if the companies were directly subject
to FSA regulation.
There have been two additional FSA requirements applicable this
year. Firstly, the elimination of goodwill in the valuation of non-
insurance subsidiaries, for which we had already factored in the
full impact in our disclosure of the 2004 IGD position, ahead of the
FSA’s rules coming into force. Secondly, accounting for pension
fund deficits, which has had an approximate £0.1 billion impact
this year to the 2005 FCD position.
The FCD position will be submitted to the FSA by 30 April 2006
but is currently estimated to be around £825 million.
The EU is continuing to develop a new prudential framework for
insurance companies, ‘the Solvency II project’. The main aim of
this framework is to ensure the financial stability of the insurance
industry and protect policyholders through establishing solvency
requirements better matched to the true risks of the business. Like
Basel 2, the new approach is expected to be based on the concept
of three pillars – minimum capital requirements, supervisory
review of firms’ assessments of risk and enhanced disclosure
requirements. In particular, companies will be encouraged to
improve their risk management processes, including making use of
internal economic capital models to enable a better understanding
of the business. The emphasis on transparency and comparability
would help ensure a level playing field.
Solvency II is being led by the European Commission’s (EC)
Internal Market Director-General, with formal ‘Level 1’ agreement
by the European Parliament and Council on framework directive
made after a full consultation process. The detailed regulatory
requirements are negotiated at ‘Level 2’ with the EC receiving
guidance from the European Insurance and Occupational Pensions
Committee (EIOPC) where HM Treasury represents the UK.
The EC have directed the Committee of European Insurance and
Occupational Pensions Supervisors (CEIOPS), where the FSA
represents the UK, to provide guidance on many technical aspects
of the framework (Level 3). CEIOPS will also develop voluntary
guidance for national regulators to ensure consistent interpretation
of Level 2 measures. To this end, the EC and CEIOPS have jointly
issued Calls for Advice in order to incorporate broader feedback
from industry, for which Prudential has actively engaged in mainly
through its participation in the European Chief Risk Officer
(CRO) Forum.
Financial strength of insurance operations
United Kingdom
The fund is very strong with an inherited estate measured on an
essentially deterministic valuation basis of around £9.0 billion
compared with £6.8 billion at the end of 2004. On a realistic basis,
with liabilities recorded on a market consistent basis, the free
assets were valued at around £8.0 billion before a deduction for
the risk capital margin.
The PAC long-term fund is rated AA+ by Standard & Poor’s and
Aa1 by Moody’s.

28 Prudential plc Annual Report 2005
The table below shows the change in the investment mix of
Prudential’s main with-profits fund:
1999 2004 2005% % %
UK equities 58 33 40
International equities 14 15 19
Property 11 18 15
Bonds 13 29 21
Cash and other asset classes 4 5 5
Total 100 100 100
For the main UK with-profits fund 83 per cent of fixed income
securities are investment grade with 25 per cent rated AA or
above. For Prudential Annuities Limited 95 per cent of the fixed
income securities are investment grade with 48 per cent rated
AA or above. For Prudential Retirement Income Limited 98 per
cent of total assets are investment grade with 57 per cent rated
AA or above.
With-profits contracts are long-term contracts with relatively low
guaranteed amounts; this, combined with the strong financial
position of the fund, enables Prudential to invest primarily in
equities and property. At the end of 2005, the equity backing ratio
(equity plus property) was nearly 74 per cent which reflects an
approximate 10 per cent increase in the equity exposure over the
year with a corresponding reduction in the bond and, to a lesser
extent, the property exposure – a strategy driven by the perceived
attractive pricing of equities relative to other assets in the earlier
part of 2005, which led us to move back into equities. To some
extent this is a retracing of the substantial (and successful) equity
reduction strategy implemented towards the end of the late 90s
‘bubble’ period. The fund remains extremely well diversified
geographically, by asset type and within the underlying stock
portfolios, which we believe is an attractive feature of the Prudential
with-profits proposition. It helps reduce risk or expected volatility
by insulating the total fund from potential weakness in any particular
market or stock. The active management of the asset mix in recent
years has had a substantial beneficial impact on investment
returns. The broad asset mix will continue to be reviewed as the
economic environment and market valuations change.
The investment return on the Prudential main with-profits fund
was 20 per cent in the year to 31 December 2005 compared with
the rise in the FTSE All Share (Total Return) Index of 22 per cent
over the same period. Over the last 10 years the with-profits fund
has consistently generated positive fund returns with three, five
and 10-year compound returns of 16.6 per cent per annum, 7.1
per cent per annum and 10.1 per cent per annum respectively,
compared with corresponding increases in the FTSE All Share
Index (Total Return) of 18.5 per cent, 2.2 per cent and 7.9 per
cent. These returns demonstrate the benefits of the fund’s
strategic asset allocation and long-term outperformance.
United States
The capital adequacy position of JNL remains strong, having
improved the capital ratio from 8.5 per cent in 2004 to 9.2 per cent
in 2005. JNL’s statutory capital, surplus and asset valuation reserve
position improved year-on-year by US$434 million, after deducting
the US$150 million of capital remitted to the parent company.
JNL’s financial strength is rated AA by Standard & Poor’s (negative
outlook) and A1 by Moody’s.
JNL’s invested asset mix on a US regulatory basis (including
Jackson National Life of New York but excluding policy loans and
reverse repo leverage) is as follows:
2003 2004 2005% % %
Bonds:
Investment Grade Public 58 60 58
Investment Grade Private 19 19 19
Non-Investment Grade Public 5 4 5
Non-Investment Grade Private 2 2 2
Commercial mortgages 10 11 11
Private equities and real estate 4 3 3
Equities, cash and other assets 2 1 2
Total 100 100 100
Asia
Prudential Corporation Asia maintains solvency margins in each
of its operations so that these are at or above the local regulatory
requirements. Across the region less than 20 per cent of non-
linked funds are invested in equities.
Both Singapore and Malaysia have discrete life funds, and in 2005
good investment returns saw their free asset ratios increase. The
Hong Kong life operation is a branch of Prudential Assurance
Company Limited and its solvency is covered by that business.
Taiwan has Risk Based Capital regulatory solvency margins and
Prudential ensures sufficient capital is retained in the business to
cover these requirements.
Redress of mortgage endowment products
Prudential Assurance’s main long-term business with-profits fund
paid compensation of £24 million in 2005 in respect of mortgage
endowment product mis-selling claims and held provisions of
£63 million at 31 December 2005 to cover further claims. These
compensation payments and provisions have had no impact on
policyholders’ asset shares. As a result, policyholders’ bonuses and
the shareholders’ share of these bonuses are unaffected, resulting
in no impact on the Group’s profit before tax.
A provision of £6 million was held at 31 December 2005 by
shareholders’ funds to cover potential compensation in respect of
mis-selling claims for Scottish Amicable mortgage endowment
products sold since the acquisition of Scottish Amicable in 1997. In
addition, a provision of £50 million was held at 31 December 2005
Financial review continued

Prudential plc Annual Report 2005 29
for the closed Scottish Amicable Insurance Fund (SAIF) in respect
of mortgage endowment products sold prior to acquisition. This
provision has no impact on shareholders. No further Scottish
Amicable mortgage endowment products were sold after April 2001.
Inherited estate
The long-term fund contains the amount that the Company
expects to pay out to meet its obligations to existing policyholders
and an additional amount used as working capital. The amount
payable over time to policyholders from the with-profits sub-fund
is equal to the policyholders’ accumulated asset shares plus any
additional payments that may be required for smoothing or to
meet guarantees. The balance of the assets of the with-profits sub-
fund is called the ‘inherited estate’ and represents the major part of
the working capital of Prudential’s long-term fund which enables
the Company to support with-profits business by:
■ Providing the benefits associated with smoothing and
guarantees;
■ providing investment flexibility for the fund’s assets;
■ meeting the regulatory capital requirements, which demonstrate
solvency; and
■ absorbing the costs of significant events, or fundamental changes
in its long-term business without affecting bonus and investment
policies.
The size of the inherited estate fluctuates from year to year
depending on the investment return and the extent to which
it has been required to meet smoothing costs, guarantees and
other events.
The Company believes that it would be beneficial if there were
greater clarity as to the status of the inherited estate. In due
course, after discussions with the FSA, the Company may
therefore take steps to achieve that clarity, whether through
guidance from the court or otherwise. In any event the Company
expects that the entire inherited estate will need to be retained
within the long-term fund for the foreseeable future to provide
working capital, and so it is not considering any distribution of
the inherited estate to policyholders and shareholders.
The costs associated with the mis-selling review of Prudential’s
with-profits personal pensions have been met from the inherited
estate. Accordingly, these costs have not been charged to the
asset shares used in the determination of policyholder bonus rates.
Hence policyholders’ pay-out values have been unaffected by
personal pension mis-selling.
In 1998, Prudential stated that deducting personal pensions
mis-selling costs from the inherited estate of the with-profits
sub-fund would not impact the Company’s bonus or investment
policy. The Company gave an assurance that if this unlikely event
were to occur, it would make available support to the fund from
shareholder resources for as long as the situation continued, to
ensure that policyholders were not disadvantaged.
The assurance was designed to protect both existing policyholders
at the date it was announced, and policyholders who subsequently
purchased policies while the pension mis-selling review was
continuing. This review was completed on 30 June 2002 and
consequently the assurance has not applied to new business
issued since 1 January 2004. Therefore the maximum amount
of capital support available under the terms of the assurance will
reduce over time as claims are paid on the policies covered by it.
Defined benefit pension schemes
The Group operates four defined benefit schemes, three in the
UK, of which the principal scheme is the Prudential Staff Pension
Scheme (PSPS), and a small scheme in Taiwan. The level of surplus
or deficit of assets over liabilities for defined benefit schemes is
currently measured in three ways: the actuarial valuation, FRS 17
(for subsidiary accounting in the UK), and IAS 19 for the Group
financial statements. FRS 17 and IAS 19 are very similar. As at
31 December 2005 the shareholders’ share of the deficit of these
schemes amounted to £153 million net of related tax relief.
Defined benefit schemes in the UK are generally required to be
subject to full actuarial valuation every three years to assess the
appropriate level of funding for schemes having regard to their
commitments. These valuations include assessments of the likely
rate of return on the assets held within the separate trustee
administered funds. PSPS was last actuarially valued as at 5 April
2002 and this valuation demonstrated the Scheme to be 110 per
cent funded, with an excess of actuarially determined assets over
liabilities of 10 per cent, representing a fund surplus of £376 million.
As a result, no change in employers’ contributions from the current
12.5 per cent of salaries has been required until now.
The PSPS valuation as at 5 April 2005 is currently being finalised
and is expected to show a small deficit on the actuarial basis. The
Company expects that for 2006 and future years the employers’
contributions for ongoing service of current employees will
approximately double whilst, in addition, deficit funding amounts
designed to eliminate the actuarial deficit over a 10-year period
will be made. Total contributions to the Scheme for these two
components are expected to be of the order of £70-75 million per
annum over a 10-year period. This compares with contributions in
2005 of £19 million.
Under IAS 19 the basis of valuation differs markedly from the
full triennial valuation basis. In particular, it would require assets
of the Scheme to be valued at their market value at the year end,
while pension liabilities would be required to be discounted at
a rate consistent with the current rate of return on a high quality
corporate bond. As a result, the difference between IAS 19 basis
assets and liabilities can be volatile. For those schemes such as
PSPS, which hold a significant proportion of their assets in equity

30 Prudential plc Annual Report 2005
investments, the volatility can be particularly significant. Under
IAS 19, for 2005, a £22 million pre-tax shareholder charge to
operating results based on longer-term returns arises, outside
the operating result, but included in total profits is a pre-tax
shareholder charge of a further £51 million. This is comprised of
two components. First, £31 million of net actuarial gains arises on
the movement in the shareholders’ share of the scheme deficits.
The second component is a charge of £20 million which arises
from the need under UK GAAP (when applied to the Group’s
insurance contracts under IFRS) to set aside amounts for future
expenses on certain contracts. The £20 million charge reflects
the increase relating to the increased future contributions for
ongoing service.
Surpluses and deficits on the Group’s defined benefit schemes are
apportioned to the PAC life fund and shareholders’ funds based on
estimates of employees’ service between them. Previously, for the
purposes of memorandum FRS 17 disclosure, the deficit on the
PSPS Scheme has been apportioned in the ratio 80/20 between
the life fund and shareholder-backed operations. During the year,
additional analysis has been undertaken and the ratio reassessed
as 70/30. At 31 December 2005, the total share of the deficits on
PSPS and the much smaller Scottish Amicable scheme attributable
to the PAC life fund amounted to £296 million net of related tax relief.
Risk management
A significant part of the Group’s business involves the acceptance
and management of risk. The Group’s risk management model
requires the primary responsibility for risk management at an
operational level to rest with business unit chief executives. The
second line of defence of risk comprises oversight functions
reporting to the Group Chief Executive, Group Chief Risk Officer
and Group Risk function together with business unit risk functions
and risk management committees. The third line of defence
comprises independent assurance from Internal Audit reporting to
business unit and Group audit committees.
The Group operates a comprehensive planning process. Executive
management and the Board receive regular reports on the financial
position of the Group, actual performance against plan, together
with updated forecasts. The insurance operations of the Group
all prepare a financial condition report, which is reported on to
the Board.
The Group’s risk management procedures are further described in
the Corporate Governance Report. Further discussion on key risk
factors of the Group is included on pages 201 to 203.
Internal rate of return
The internal rate of return (IRR) is equivalent to the discount rate at
which the present value of the post-tax cash flows expected to be
earned over the life time of the business written in shareholder-
backed life funds is equal to the total invested capital to support
the writing of the business. The capital included in the calculation
of the IRR is the initial capital in excess of the premiums received
required to pay acquisition costs and set up the statutory capital
requirement. The time value of options and guarantees are included
in the calculation.
Products and drivers of insurance operations’ profit
United Kingdom
In common with other UK long-term insurance companies,
Prudential’s products are structured as either with-profits (or
participating) products, or non-participating products including
annuities in payment and unit-linked products. Depending upon
the structure, the level of shareholders’ interest in the value of
policies and the related profit or loss varies.
With-profits policies are supported by a with-profits sub-fund and
can be single premium (for example, Prudence Bond) or regular
premium (for example, certain corporate pension products).
Prudential’s primary with-profits sub-fund is part of PAC’s long-
term fund. The return to shareholders on virtually all with-profits
products is in the form of a statutory transfer to PAC shareholders’
funds which is analogous to a dividend from PAC’s long-term fund
and is dependent upon the bonuses credited or declared on
policies in that year. Prudential’s with-profits policyholders currently
receive 90 per cent of the distribution from the main with-profits
sub-fund as bonus additions to their policies and shareholders
receive 10 per cent as a statutory transfer.
The profits from almost all of Prudential’s new non-participating
business accrue solely to shareholders. Such business is written in
the non-profit sub-fund within PAC’s long-term fund, or in various
shareholder-owned direct or indirect subsidiaries, the most
significant of which is Prudential Retirement Income Limited (PRIL),
which also writes all new immediate annuities arising from vesting
deferred annuity policies in the with-profits sub-fund of PAC.
There is a substantial volume of in-force non-participating business
in PAC’s with-profits sub-fund and that fund’s wholly owned
subsidiary Prudential Annuities Limited (PAL) which is closed to
new business; profits from this business accrue to the with-profits
sub-fund.
United States
JNL’s principal retail savings products are sold as single premium
fixed, variable or fixed index deferred annuities.
Interest-sensitive fixed annuities are products which allow for
tax-deferred accumulation of funds, with flexible payout options.
They are used for retirement planning and for providing income
in retirement. The policyholder pays JNL a premium, which is
credited to the policyholder’s account. Periodically, interest is
credited to the policyholder’s account and administrative charges
are deducted, as appropriate. JNL may reset the interest rate on
each policy anniversary, subject to a guaranteed minimum, in line
with state regulations. When the annuity matures, JNL either pays
the policyholder the amount in the policyholder account or begins
making payments to the policyholder in the form of an immediate
annuity product. This latter product is similar to a UK annuity in
Financial review continued
Prudential plc Annual Report 2005 31
payment. Fixed annuity policies provide for early surrender charges
for the first six to nine years of the policy. In addition, the policy
may be subject to a market value adjustment at the time of early
surrender. JNL’s profits on fixed annuities arise primarily from the
spread between the return it earns on investments and the interest
credited to the policyholder’s account (net of any surrender
charges or market value adjustment) less expenses.
Fixed index annuities (formerly referred to as equity-indexed
annuities) are deferred annuities that enable policyholders to
obtain a portion of an equity-linked return but provide a
guaranteed minimum return. JNL guarantees an annual minimum
interest rate, although actual earnings may be higher and are
based on a participation in an equity index over its indexed option
period. JNL’s profit arises from the investment income earned and
the fees charged on the policy, less the expenses incurred, which
include the costs of the guarantees, and the return credited to the
policy. Fixed index annuities contain provision for early surrender.
Variable annuities are tax advantaged deferred annuities where the
rate of return depends upon the performance of the underlying
portfolio, similar in principle to UK unit-linked products. They are
used for retirement planning and to provide income in retirement.
The policyholder’s premiums are held apart from JNL’s general
account assets, in a ‘separate’ account, which is analogous to a
unit-linked fund. The policyholder can allocate the premiums
between a variety of variable sub-accounts with a choice of fund
managers and/or guaranteed fixed-rate options. The value of the
portion of the separate account allocated to variable sub-accounts
fluctuates with the underlying investment. Variable annuity policies
provide for early surrender charges.
JNL offers a choice of guarantee benefit options within its variable
annuity product range which customers can elect and pay for.
These include the guaranteed minimum death benefit (GMDB),
which guarantees on death the policyholder receives a minimum
value regardless of past market performance. These guaranteed
death benefits might be expressed as the return of original premium,
the highest past anniversary value of the policy, or as the original
premium accumulated at a fixed rate of interest. In addition, there
are two other types of guarantee, guaranteed minimum withdrawal
benefits (GMWB) and guaranteed minimum income benefits
(GMIB). GMWBs provide a guaranteed return of the principal
invested by allowing for periodic withdrawals which are limited to
a maximum percentage of the initial premium. GMIBs provide for
a minimum level of benefits upon annuitisation regardless of the
value of the investments underlying the contract at the time of
annuitisation. The GMIB is reinsured.
Asia
The life insurance products offered by Prudential Corporation Asia
include a range of with-profits (participating) and non-participating
term, whole life and endowment and unit-linked policies. Prudential
also offers health, disablement, critical illness and accident cover
to supplement its core life products.
Prudential’s business in Asia is focused on regular premium
products that provide both savings and protection benefits.
In 2005, the new business profit mix was 63 per cent unit-linked,
25 per cent non-linked and 12 per cent Accident and Health
(A&H) products.
Unit-linked products combine savings with protection and the cash
value of the policy depends on the value of the underlying unitised
funds. Participating products provide savings with protection
where the basic sum assured can be enhanced by a profit share
(or bonus) from the underlying fund as determined at the
discretion of the insurer. Non-participating products offer savings
with protection where the benefits are guaranteed or determined
by a set of defined market related parameters. A&H products
provide mortality or morbidity benefits and include health,
disablement, critical illness and accident covers. A&H products
are commonly offered as supplements to main life policies but
can also be sold separately.
The profits from participating policies are shared between the
policyholder and insurer (typically in a 90:10 ratio) in the same way
as with-profits business in the UK. Under unit-linked products the
profits that arise from managing the policy, its investments and the
insurance risk accrue entirely to shareholders, with investment
gains accruing to the policyholder within the underlying unitised
fund. The profits from A&H and non-participating products consist
of any surplus remaining after paying policy benefits.
Unit-linked products tend to have higher profits on the EEV basis
of reporting than traditional non-linked products as expenses and
charges are better matched and solvency capital requirements are
lower. At the end of 2005 Prudential Corporation Asia offered unit-
linked products in 10 of the 12 countries in Asia in which it operates.
In addition to the life products described above, Prudential offers
mutual fund investment products in India, Taiwan, Japan, Singapore,
Malaysia, Hong Kong, Korea and Vietnam, allowing customers to
participate in debt, equity and money market investments. The
Company earns a fee based on assets under management.
Description of EEV basis reporting
Prudential’s results are prepared on two bases of accounting, the
supplementary EEV basis and the IFRS basis for the financial
statements. Over the life of any given product, the total profit
recognised will be the same under either the IFRS or the EEV basis.
However, the two methods recognise the emergence of that profit
differently, with profits emerging earlier under the EEV basis than
under IFRS. This section explains how the two bases operate and
why they are used.
Prudential’s primary financial statements are prepared in
accordance with the IFRS basis of reporting of long-term business.
In broad terms, IFRS profits for long-term business reflect the
aggregate of statutory transfers from with-profits funds and profit
on a traditional accounting basis for other long-term business.

32 Prudential plc Annual Report 2005
However, the products sold by the life insurance industry are by
their nature long-term, as it commits to service the products for
many years into the future. In many cases policies require customers
to continue to pay further premiums in the future. The profit on
these insurance sales is generated over a significant number of
years and IFRS basis profits do not, in Prudential’s opinion, properly
reflect the inherent value of these future profit streams.
From 1997, Prudential and other major UK quoted financial groups
adopted the achieved profits basis, a form of embedded value
reporting, as a supplementary accounting measure in order to give
a better reflection of the value attaching to long-term insurance
business. Achieved profits basis financial statements were
prepared under guidance issued by the ABI in December 2001.
In May 2004 the CFO Forum representing the Chief Financial
Officers of 19 European Insurers, published the European
Embedded Value (EEV) Principles which are designed to improve
the transparency and consistency of embedded value reporting.
Member companies, of which Prudential is one, agreed to adopt
the principles for supplementary reporting no later than the
financial year end commencing 1 January 2005. Prudential has
fully adopted the Principles for the first time in respect of full year
2005 results.
For Prudential, EEV reporting represents an evolution from the
achieved profits basis previously used for supplementary reporting
and we welcome the improved clarity and consistency of
information that it will provide to investors. We reiterate our view
that embedded value information provides investors with a more
realistic reflection of the current performance of life insurance
business. In summary, the principal changes from current achieved
profits reporting are in respect of three areas:
■ Inclusion of an explicit allowance for the impact of options and
guarantees. This will typically require stochastic calculations, under
which a large number of simulations are performed that provide a
representation of the future behaviour of financial markets;
■ more active allowance for the combined impact of risk profile,
encumbered capital and explicit valuation of options and
guarantees in the selection of discount rates. This will ensure that
the risks to the emergence of shareholder cash flows are properly
accounted for; and
■ enhanced disclosure that will enable informed investors to more
fully understand the key risks within the business together with
management’s approach to them, and the basis of preparation
of results.
In other respects we expect that the EEV basis of reporting to be
similar to the achieved profits basis.
The EEV basis not only provided a good indicator of the value
being added by management in a given accounting period but it
also demonstrates whether shareholder capital is being deployed
to best effect. Indeed insurance companies in many countries use
comparable bases of accounting for management purposes.
Prudential believes that the EEV basis provides useful information
for shareholders. In contrast, for many types of contract, the IFRS
result does not reflect the long-term benefit that will arise in the
future from current management initiatives and capital expenditure
in the year under review, as it focuses instead on the amounts
accruing to shareholders in the current year only from business
already in force.
The EEV basis is a value based method of reporting in that it
reflects the change in value of the business over the accounting
period. This value is called the shareholders’ funds on the EEV
basis which, at a given point in time, is the value of future cash
flows expected to arise from the current book of long-term
insurance business plus the net worth of the Company. In
determining these expected cash earnings, Prudential makes full
allowance for the risks attached to their emergence and associated
cost of capital and takes into account recent experience in
assessing likely future persistency, mortality and expenses.
Economic assumptions as to future investment returns and inflation
are based on market data.
The change in value is typically analysed as shown in the EEV basis
shareholders’ funds chart into the following components: the value
added from new business sold during the year; the change in value
from existing business already in place at the start of the year;
short-term fluctuations in investment returns; change in the time
value of cost of options and guarantees and economic assumption
changes; other items (for example, profit from other Group
operations, tax, foreign exchange, exceptional items); and dividends.
The value added from new business (being the present value of
the future cash flows arising from new business written in the year)
is a key metric used in the management of the business. The change
in value of business in force at the start of the year demonstrates
how the existing book is being managed. Together they provide
management and shareholders with valuable information about
the underlying development of the business and the success or
otherwise of management actions.
EEV basis shareholders’ funds
Movement over two years
12,000
£m
10,000
8,000
6,000
2,000
4,000
0
GFEDA B C
A Opening 2004 EEV basis shareholders’ fundsB New business EEV profitsC In-force EEV profitsD OtherE Short-term fluctuations in investment returns, change in cost of guarantees, effect of changes in economic assumptions and shareholders’ share of actuarial and other gains and losses of defined benefit pension schemesF DividendsG Closing 2005 EEV basis shareholders’ funds
Financial review continued

Prudential plc Annual Report 2005 33
As indicated above, EEV basis results are prepared by first of all
making assumptions about all relevant factors including levels of
future investment return, expenses, surrender levels and mortality.
These best estimate assumptions are used to project future cash
flows. The present value of the future cash flows is then calculated
using a discount rate which reflects both the time value of money
and the risks associated with the cash flows. The risk discount rate
is determined using the actual yield on long-term government
bonds plus a risk margin. The projected future cash flows are
prepared on a set of assumptions specific to product group,
and the actual outcome may be different from that projected.
Where the actual outcome is different, this will be reflected in
the experience variances for that year.
The total profit that emerges over the lifetime of an individual
contract as calculated using the EEV basis is the same as that
calculated under the IFRS basis. However, since the EEV basis
reflects discounted future cash flows under this methodology
the profit emergence is advanced, thus more closely aligning the
timing of the recognition of benefits with the efforts and risks of
current management actions, particularly with regard to business
sold during the year.
The assumptions used for the EEV basis of accounting are
set out on pages 212 to 214 in the notes that accompany the
supplementary EEV basis information. An indication of the
sensitivity of the results to changes in the key assumptions
of interest rate and investment return is provided on pages
226 to 228.
The EEV basis can be illustrated by considering a theoretical
individual contract. Using assumptions for the drivers of future
income and expenditure (including levels of future investment
return, expenses, surrender levels and mortality) a profile of
future cash flows can be estimated. These cash flows are then
discounted back to the point of sale to give a new business profit.
The EEV basis profits emerging in each subsequent accounting
period will comprise the unwinding of the discount (which arises
from discounting future cash flows for one fewer period) and the
profit or loss arising from any difference between the actual cash
flow and the cash flow which had been assumed in the accounting
period under review, together with the effect of any changes of
assumption where the directors believe a revision is required to
the original estimates of future experience.
EEV basis methodology
Set assumptions
Project cash flows
Net present
value
Analysis of change
External reporting
Internal reporting
Set out below is an illustrative profit profile for a typical with-profits
product. The pattern of actual profit emergence will vary by product.
The different timing of profit recognition under the two bases is
demonstrated in the next chart, which shows the cumulative level
of profit recognition for the yearly profits shown in the previous
chart. It illustrates that under the EEV basis profits emerge earlier,
but the eventual total profit is the same under both bases.
Philip Broadley
Group Finance Director
Illustration of IFRS basis and EEV basis cumulative
profit profiles for a typical with-profits product
100
% of profit
50
60
70
80
90
40
30
20
10
0
4 5 6years
7 8 9 101 2 3
Cumulative IFRS basisCumulative EEV basis
Illustration of IFRS basis and EEV basis profit profiles
for a typical with-profits product
1,600
units of profit
1,400
1,200
1,000
800
600
400
200
0
6years
75 8 9 104321
IFRS basisEEV basis

34 Prudential plc Annual Report 2005
Acting responsibly
At Prudential, corporate responsibility (CR) is not an optional extra.
It is fundamental to how we operate and is a philosophy that is
now embedded in the business.
We recognise that our stakeholders increasingly support those
companies that define and exhibit sound values around trust,
ethics and environmental responsibility.
We also believe that a company’s performance in key areas
of conduct such as corporate governance, environmental
management and employment practices can have a significant
impact on its financial performance.
Over the last year we have therefore reviewed our CR strategy to
ensure that it continues to align our business objectives with our
stakeholder concerns.
Management and policy
Prudential has developed a Group Governance Framework which
is underpinned by a Group Governance Manual and associated
processes. This encompasses all key policies and procedures, for
example our Group Code of Business Conduct, our CR Policy and
our Health and Safety Policy. We set our own codes and policies
that often go further than legislative requirements.
Prudential also operates a Group Risk Framework which focuses
on reputation issues, including those of a social, ethical and
environmental nature. The controls, which are applicable across
the Group, are set out in the Group Governance Manual.
Prudential’s Group Finance Director, Philip Broadley, has Board
level responsibility for social, environmental and ethical risk
Corporate responsibility review
Trust (SSAT) and National Institute of
Adult Continuing Education (NIACE),
thousands of adults and children are
now benefiting and learning how to
make decisions that will have a profound
effect on the quality of their lives.
We extended our initiative to Asia in
2004, with an innovative programme
called ‘Investing in Your Future’, which
focuses on women, who are often
responsible for planning for their family’s
financial needs. This was first launched
in China and rolled out to Vietnam in
2005. During 2006, we will extend this
programme into India. To date, more
than 5,000 women have graduated from
the programme in Asia.
More details of our international financial
literacy programme are available in our
2005/06 ‘Learning for Life’ publication.
The booklet can be accessed at
www.prudential.co.uk/prudential-
plc/cr/library/research/
Investing in our communities
In 2005, we invested £4.7 million in
a wide range of projects around our
business, supporting education, welfare
and environmental initiatives. This total
includes the significant contribution
made by many of our people around
the Group through volunteering,
often linked with professional skills
development. It also includes direct
donations to charitable organisations
of £3.5 million. A detailed breakdown
of Prudential’s investment in the
community and our policy on not
making political donations is laid out
on page 59.
A new international employee
volunteering programme, ‘The
Chairman’s Award’, was launched across
the Group in December 2005. The
initiative encourages employees to
volunteer with charities within their local
communities. The charities involved all
address the needs of the elderly or
children, and run projects that have
aspects of financial literacy at their core,
thereby supporting the Group’s CR
programme. We now have projects in
most of our markets.
In 2005, Prudential’s employees and
our businesses around the world made
significant financial contributions in
response to four separate disasters: the
Asian tsunami; Hurricane Katrina in the
US; the London bombings and the
Mumbai floods.
The Prudential Caring Fund was set up in
January 2005, to help the local residents
in countries severely impacted by the
devastating Asian tsunami. Over £800,000
was raised from voluntary employee
donations, along with matched funding
by Prudential’s business units in the UK,
the US and Asia.
The money raised has been distributed
to the countries hardest hit by the
tsunami: Indonesia (the primary
recipient); India; Thailand and Sri Lanka.
We used our local knowledge to identify
Stakeholder dialogue
Stakeholder engagement enables our
employees and relevant external groups
to help shape what we do and ensure
that their reasonable expectations are
translated into business value. In 2005,
the CR unit discussed the CR programme
with customers and consumers in the
UK, using PruBus, a qualitative research
study. Prudential UK has separately
continued to hold monthly MeetPru
events, which give our customers the
opportunity to meet members of the UK
executive team and ask questions about
both their own policies and broader
issues, including the CR programme.
Improving financial capability
Our financial education programme is
based on the recognition that we need
to play our part in enabling consumers
to make the right decisions for their
individual needs. Such decisions range
from debt management to savings needs.
Informing and empowering consumers
to make such decisions will, we believe,
build better and more permanent
relationships between consumers
and providers.
We began developing our Financial
Literacy programme in the United
Kingdom in 2001. Five years later,
we are seeing significant progress.
In the UK, via partnerships with diverse
organisations such as Citizens Advice,
the Personal Finance Education Group
(pfeg), Specialist Schools and Academies

Prudential plc Annual Report 2005 35
management. The Board discusses Prudential’s performance on
this at least once a year. The Board also reviews and approves our
CR report and strategy.
The Corporate Responsibility Committee is a specialist Group-
wide committee chaired by the Group Finance Director, and
is responsible for reviewing business conduct and social and
environmental policy.
Our CR unit develops our strategy, provides training across the
Group, and works closely with individual business units to provide
advice ensuring that our core values are maintained and assisting
with the adaptation of Group-wide initiatives so that they meet
local needs.
In 2005, we engaged KPMG LLP to conduct a review of our CR
management and internal and external reporting arrangements.
KPMG provided a report to our senior management team,
summarising recommendations for improvement. In particular,
KPMG highlighted that Prudential would benefit from conducting
another formal review of the material CR risks for the business. In
response to this, a CR risk workshop was organised in February
2006, with participation from all of the business units.
In 2006, we have engaged KPMG to review the key CR performance
indicators identified in our workshop, which we will use to help
develop our CR risk management strategy for reporting and
external assurance.
appropriate charities to ensure our
donations made the most impact. Our
support focused on children and the
rebuilding and/or improvement of
schools and libraries.
In Indonesia, for example, we are
working with United Nations Children’s
Fund (UNICEF) to support their
‘Creating Learning Communities for
Children’ initiative. Our support will help
improve the quality of education at over
90 primary schools by improving school
management, community participation,
and the entire teaching/learning process
– training over 1,700 teachers and
benefiting over 21,000 students.
Socially responsible investment (SRI)
M&G‘s approach to socially responsible
investment (SRI) is set out in the booklet
‘Issues Arising from Share Ownership’,
available at www.mandg.co.uk
SRI has focused principally on equity
markets, with the property investment
community slower to address the issue
of sustainability. However, with more
than £17.2 billion (as at 31 December
2005) of funds under management,
Prudential Property Investment Managers
Limited (PruPIM), a subsidiary of M&G,
is one of the UK’s largest commercial
property investment managers and
accounts for approximately 80 per cent
of Prudential’s direct environmental
impact in the UK. Through participation
in the Institutional Investors Group on
climate change and our participation
on the property working group of the
United Nations Environment Programme
Finance Initiative (UNEP FI), PruPIM is
creating awareness of the implications of
climate change for property investment
and how we should address this.
Employee work-life balance
Engaging with employees and
understanding their expectations about
corporate values, transparency, career
development, performance management,
diversity and work-life balance is
important. This understanding helps us to
attract, retain and motivate our employees.
In Asia, for example, employee
education is provided across our Asian
markets through PRUuniversity, which
is available to all staff and is offered in
12 languages. Programmes are centrally
credited and many are endorsed by
external learning institutions. The courses
cover CR, management and leadership,
technical and business skills as well as a
comprehensive range of self-improvement
material including language courses.
Further information about our approach
to equal opportunities and employee
involvement can be found on pages 58
and 59.
Environment/sustainable
development
Protecting the environment is essential
for the quality of life of current and
future generations. The challenge is to
combine continuing economic growth
with long-term sustainable development.
As such, we will endeavour to ensure
our policies and business actions
promote the consideration of the
environment.
PruPIM is the first UK property company
to achieve full ISO14001 certification,
the internationally recognised
environmental management standard.
The scope of this certification covers all
PruPIM’s operations, including its
property investment portfolio in the UK
and its head office function, in High
Holborn, London.
In the US, Jackson National Life (JNL)
has carefully monitored and worked to
minimise any negative environmental
impact since it moved to its current
headquarters in 2000, working with state
and local authorities on new projects
which protect the environment.
Further information can be found in
‘Acting Responsibly’, our full Corporate
Responsibility Report 2005/6, accessed
at www.prudential.co.uk/
prudential-plc/cr/ A hard copy of the
report is available from our CR unit:
Laurence Pountney Hill, London
EC4R 0HH. Tel: 020 7548 3706.

6. Mark Norbom
Executive director. Aged 48
Mark Norbom has been an executive director
of Prudential and Chief Executive, Prudential
Corporation Asia since January 2004. Previously,
he was President and Chief Executive Officer of
General Electric Japan, and a company officer of
General Electric Company. He has spent 23 years
with General Electric in various posts in the United
States, Taiwan, Indonesia, Thailand and Japan.
7. Nick Prettejohn
Executive director. Aged 45
Nick Prettejohn has been an executive director
of Prudential and Chief Executive, Prudential UK &
Europe since 1 January 2006. He is also a member
of the Financial Services Practitioner Panel.
Previously, he was Chief Executive of Lloyd’s
of London from July 1999 until December 2005.
He joined the Corporation of Lloyd’s in 1995 as
Head of Strategy, and played a key role in the
Reconstruction and Renewal process, which
reorganised Lloyd’s after the losses of the late
1980s and early 1990s. Following the successful
completion of the reorganisation in 1996 he
became Managing Director of Lloyd’s Business
Development Unit and in 1998 he also assumed
responsibility for Lloyd’s North America business
unit. Prior to his appointment to Lloyd’s he was
responsible for corporate strategy at National
Freight Corporation plc, and prior to that he was
a partner at management consultants Bain and Co
and a director of private equity company Apax
Partners. He is also a board member of the Royal
Opera House.
36 Prudential plc Annual Report 2005
1. Sir David Clementi MA FCA MBA
Chairman and Chairman of the Nomination
Committee. Aged 57
Sir David Clementi has been Chairman of Prudential
since 1 December 2002. In August 2005 he was
appointed as President of the Investment Property
Forum. In October 2003, he joined the FSA’s
Financial Capability Steering Group, and in July
2003 he was appointed by the Secretary of State
for Constitutional Affairs to carry out a review of
the regulation of legal services in England and
Wales, which was completed in December 2004.
In February 2003 he joined the Financial Reporting
Council. In addition, Sir David is a non-executive
director of Rio Tinto plc, which he joined on
28 January 2003. From September 1997 to August
2002 he was Deputy Governor of the Bank of
England. During this time he served as a member
of the Monetary Policy Committee and as a non-
executive director of the Financial Services
Authority. From 1975 to August 1997 he worked
for the Kleinwort Benson Group, latterly as Chief
Executive.
2. Mark Tucker ACA
Group Chief Executive. Aged 48
Mark Tucker was re-appointed as an executive
director on 6 May 2005, on which date he also
became Group Chief Executive. From May 2004
to March 2005 he was Group Finance Director,
HBOS plc and director of Halifax plc. Previously,
he was an executive director of Prudential from
1999 to 2003, and from 1993 to 2003 he was Chief
Executive of Prudential Corporation Asia, and also
held senior positions in Prudential’s businesses in
the UK and US. He first joined Prudential in 1986,
having previously been a tax consultant at
PriceWaterhouse UK in London.
3. Philip Broadley FCA
Group Finance Director. Aged 45
Philip Broadley has been an executive director of
Prudential and Group Finance Director since May
2000. In May 2005 he was appointed as a non-
executive director of Egg plc, which delisted on
20 February 2006. He is currently Chairman of the
100 Group of Finance Directors and a member of
the Insurance Advisory Group of the International
Accounting Standards Board. He is also President of
the Przezornosc Charitable Foundation, which has
been established in Poland in recognition of former
policyholders with whom the Company lost contact.
Previously, he was with the UK firm of Arthur
Andersen, where he became a partner in 1993.
4. Clark Manning FSA MAAA
Executive director. Aged 47
Clark Manning has been an executive director of
Prudential since January 2002. He is also President
and Chief Executive Officer of Jackson National
Life. He was previously Chief Operating Officer,
Senior Vice President and Chief Actuary of Jackson
National Life, which he joined in 1995. Prior to that,
he was Senior Vice President and Chief Actuary
for SunAmerica Inc, and prior to that Consulting
Actuary at Milliman & Robertson Inc. He has more
than 20 years’ experience in the life insurance
industry, and holds both a bachelor’s degree in
actuarial science and an MBA from the University
of Texas. He also holds professional designations of
Fellow of the Society of Actuaries (FSA) and Member
of the American Academy of Actuaries (MAAA).
5. Michael McLintock
Executive director. Aged 44
Michael McLintock has been an executive director
of Prudential since September 2000. He is also
Chief Executive of M&G, a position he held at the
time of M&G’s acquisition by Prudential in March
1999. He joined M&G in October 1992. He is also a
non-executive director of Close Brothers Group plc.
Board of directors
Chairman Executive directors
1 2 3
4 5
6 7

Prudential plc Annual Report 2005 37
8. Keki Dadiseth FCA
Independent non-executive director and member of
the Audit and Remuneration Committees. Aged 60
Keki Dadiseth has been an independent non-
executive director of Prudential since April 2005.
He is a member of the International Advisory
Boards of Marsh & McLennan Companies Inc. and
DaimlerChrysler Benz. He is also an International
Advisor to Goldman Sachs. In 2005 he was appointed
to the Board of Nicholas Piramal India Limited and
Siemens Limited in India, and he is a director of
The Indian Hotels Company Limited and the Indian
School of Business. Before he retired from Unilever
in May 2005, he was Director, Home and Personal
Care, responsible for the HPC business of Unilever
worldwide, a Board member of Unilever PLC and
Unilever N.V. and a member of the Executive
Committee. He joined Hindustan Lever Ltd in India
in 1973.
9. Michael Garrett
Independent non-executive director and member
of the Remuneration Committee. Aged 63
Michael Garrett has been an independent non-
executive director of Prudential since September
2004. He worked for Nestlé from 1961, becoming
Head of Japan (1990-1993), and then Zone Director
and Member of the Executive Board, responsible
for Asia and Oceania, and in 1996 his responsibilities
were expanded to include Africa and the Middle
East. He retired as Executive Vice President of
Nestlé in April 2005. In addition, he served the
Government of Australia as Chairman of the Food
Industry Council and as a Member of the Industry
Council of Australia, and was also member of the
Advisory Committee for an APEC (Asia-Pacific
Economic Cooperation) Food System, a Member of
The Turkish Prime Minister’s Advisory Group and
the WTO (World Trade Organization) Business
Advisory Council in Switzerland. He remains a
director of Nestlé companies in India and Japan,
and was appointed Chairman of the Evian Group
in 2001, a think tank and forum for dialogue
promoting free trade. He also serves as a non-
executive director on the Boards of the Bobst
Group Switzerland and Hasbro Inc. in the USA.
10. Bridget Macaskill
Independent non-executive director and
member of the Remuneration and Nomination
Committees. Aged 57
Bridget Macaskill has been an independent non-
executive director of Prudential since September
2003. She rejoined the Board of Prudential having
previously resigned due to a potential conflict of
interest in March 2001. She is a non-executive
director of J Sainsbury Plc and the Federal National
Mortgage Association (Fannie Mae). She was
previously Chairman and Chief Executive Officer of
OppenheimerFunds Inc, a major New York based
investment management company.
11. Roberto Mendoza
Independent non-executive director and Chairman
of the Remuneration Committee. Aged 60
Roberto Mendoza has been an independent non-
executive director of Prudential since May 2000.
He was appointed as Chairman of the Remuneration
Committee in July 2002. He is also Chairman of
Integrated Finance Limited, and he was the non-
executive Chairman of Egg plc, which delisted
on 20 February 2006. Previously, he was Vice
Chairman and director of JP Morgan & Co. Inc., a
non-executive director of Reuters Group PLC and
The BOC Group plc, and a managing director of
Goldman Sachs.
12. Kathleen O’Donovan ACA
Independent non-executive director and member
of the Audit Committee. Aged 48
Kathleen O’Donovan has been an independent
non-executive director of Prudential since May
2003. She is a non-executive director and Chairman
of the Audit Committees of EMI Group plc and
Great Portland Estates PLC. She is also Chairman of
the Invensys Pension Scheme. Previously, she was a
non-executive director and Chairman of the Audit
Committee of the Court of the Bank of England,
and a non-executive director of O2 plc. Prior to that,
she was Chief Financial Officer of BTR and Invensys,
and before that she was a partner at Ernst & Young.
13. James Ross
Independent non-executive director and member
of the Audit and Nomination Committees. Aged 67
James Ross has been an independent non-executive
director since May 2004. He holds non-executive
directorships with McGraw Hill and Datacard in the
United States and Schneider Electric in France. He
is also Chairman of the Leadership Foundation for
Higher Education. He was previously Chairman of
National Grid plc and Littlewoods plc. He was also
Chief Executive of Cable and Wireless plc and
Chairman and Chief Executive of BP America Inc.,
and a Managing Director of the British Petroleum
Company plc.
14. Rob Rowley FCMA
Senior independent non-executive director,
Chairman of the Audit Committee and member
of the Nomination Committee. Aged 56
Rob Rowley has been an independent non-
executive director of Prudential since July 1999. He
was appointed as Chairman of the Audit Committee
in June 2000 and as Senior Independent Director of
Prudential in December 2003. He is also executive
Deputy Chairman of Cable and Wireless plc and a
non-executive director of Liberty International plc.
Until the end of 2005, he was also a non-executive
director of Taylor Nelson Sofres plc. He retired as a
director of Reuters Group PLC in December 2001,
where he was Finance Director from 1990 to 2000.
Ages as at 15 March 2006
Non-executive directors
9 10
11 12
13 14
8

38 Prudential plc Annual Report 2005
The directors are committed to high standards of corporate
governance and support the Combined Code on Corporate
Governance issued by the Financial Reporting Council (the Code).
Apart from the requirement under the Code that shareholders be
sent the notice of Annual General Meeting at least 20 working
days before the meeting, the Company has complied throughout
the financial year ended 31 December 2005 with all the Code
provisions set out in Section 1 of the Code. As a result of the late
publication of FRS 27, ‘Life Assurance’ which was only released on
13 December 2004, the Company was unable to comply with the
20 working day requirement under the Code and so gave the
statutory 21 clear days’ notice of the Annual General Meeting.
We have applied the principles of the Code in the manner
described below and in the remuneration report.
The Board
As at 31 December 2005, the Board comprised the Chairman,
five executive directors and seven independent non-executive
directors. Since the year end, Nick Prettejohn has been appointed
as an additional executive director with effect from 1 January 2006.
The non-executive directors bring a wide range of business,
financial and global experience to the Board. Biographical details
of the current Board members appear on pages 36 and 37. The
roles of Chairman and Group Chief Executive are separate and
clearly defined, and have been approved by the Board so that no
individual has unfettered powers of decision. The Chairman is
responsible for the leadership and governance of the Board as a
whole and the Group Chief Executive for the management of the
Group and the implementation of Board strategy and policy on the
Board’s behalf. In discharging his responsibility, the Group Chief
Executive is advised and assisted by the Group Executive
Committee, comprising all the business unit heads and a Group
Head Office team of functional specialists. Rob Rowley is the
Company’s Senior Independent Director, to whom concerns may
be conveyed by shareholders if they are unable to resolve them
through the existing mechanisms for investor communications,
or where such channels are inappropriate. The Chairman meets,
at least annually, with the non-executive directors without the
executive directors being present.
During 2005, the Board met 14 times and held a separate two-day
strategy meeting. Each year, one of the Board meetings is held
at one of the Group’s business operations to facilitate a fuller
understanding of the diversity of the business. In June 2005, a
Board meeting was held in Beijing, following a day of discussion on
the Asian business and future market opportunities for Prudential
Corporation Asia across the region. Presentations were given by
senior members of the Prudential Corporation Asia management team.
All the directors attended all scheduled Board meetings occurring
during their period of appointment, apart from Jonathan Bloomer
and Mark Wood, who were not required to attend Board meetings
after it had been agreed that they would cease to be directors of
the Company. There were four additional Board meetings, and the
majority of the directors attended most of those meetings. Where
a director was not able to attend any of the additional meetings,
their views were canvassed by the Chairman prior to the meeting.
The table on page 42 details the number of Board and Committee
meetings attended by each director throughout the year. A further
six Board Committee meetings took place during the year. In
addition, the Chairman met with the non-executive directors
without the executive directors being present in March, July
and December.
The Board’s terms of reference, which are regularly reviewed, set
out those matters specifically reserved to it for decision, in order
to ensure that it exercises control over the Group’s affairs. These
include, amongst other things, approval of the annual and interim
results, strategy and corporate objectives, operating plans,
significant transactions and matters affecting the Company’s
share capital.
A corporate governance framework approved by the Board maps
out the internal approvals processes and those matters which
may be delegated. These principally relate to the operational
management of the Group’s businesses and include pre-determined
authority limits delegated by the Board to the Group Chief
Executive for further delegation by him in respect of matters
which are necessary for the effective day-to-day running and
management of the business.
The chief executive of each business unit, who in respect of his
business unit responsibilities reports to the Group Chief Executive,
has authority for management of that business unit and has
established a management board comprising its most senior
executives. In accordance with the Group Governance Framework,
business unit chief executives are required to certify annually their
compliance with the requirements of the framework. The Board
has adopted a Code of Business Conduct, which sets out the
behaviour expected of staff in their dealings with shareholders,
customers, fellow employees, suppliers and other stakeholders of
the Group. A copy of the Company’s Code of Business Conduct
may be found on the website www.prudential.co.uk/prudential-
plc/cr/managementpolicies/codeofconduct
The Board is responsible for ensuring that an effective system for
succession planning and management development is in place.
This is delivered through an established review process that is
applied across all the businesses and covers both director and
senior management succession and development. The Board
reviews the outcomes of the review annually and actions arising
from the review are implemented as part of the management
development agenda.
All directors have direct access to the services of the Company
Secretary who advises them on all corporate governance matters,
on Board procedures, and on compliance with applicable rules and
regulations. In order to ensure good information flows, full Board
and Committee papers are provided to the directors by the
Company Secretary approximately one week before each Board
or Committee meeting. The Company Secretary also supports the
Chairman in providing tailored induction programmes for new
directors and on-going training for all directors.
Other commitments of the Chairman and changes during the year
are detailed in his biography on page 36. The Board is satisfied that
Corporate governance report

Prudential plc Annual Report 2005 39
these other commitments are not such as to interfere with the
performance of the Chairman’s duties for the Group.
Board Committees
The Board has established the following standing committees of
non-executive directors with written terms of reference which are
kept under regular review:
Audit Committee report
At Prudential, the Audit Committee is a key element of the
governance framework. This report sets out its responsibilities
and the work the Committee has done to meet its objectives.
Role of the Committee
The Committee’s principal oversight responsibilities cover:
■ Internal control and risk management;
■ internal audit;
■ external audit (including auditor independence); and
■ financial reporting.
The Committee has formal terms of reference set by the Board,
which are reviewed regularly.
Membership
All the members of the Audit Committee are independent non-
executive directors. The members of the Committee are:
Rob Rowley FCMA (Chairman)
Keki Dadiseth FCA (appointed 5 May 2005)
Kathleen O’Donovan ACA
James Ross
Full biographical details of the members of the Audit Committee,
including their relevant experience, are set out on page 37.
The Board has designated Rob Rowley as its Audit Committee
financial expert for Sarbanes-Oxley Act purposes; he also has
recent and relevant financial experience for the purposes of
the Code.
The Committee continued to receive detailed presentations from
senior management throughout the year. These presentations
were designed to keep members up to date and aware of the
impact on the business of changes to international accounting
standards and practices, including International Financial Reporting
Standards (IFRS) and European Embedded Value (EEV).
Meetings
The Audit Committee met nine times during the year. Additionally,
by invitation, the Chairman of the Board, Group Chief Executive,
Group Finance Director, Group Chief Risk Officer, Group Company
Secretary, Heads of Internal Audit, Group Risk and Group
Compliance, as well as the external auditor, attended some
of the meetings.
The Chairman held preparatory meetings with the Group Chief
Internal Auditor, the Group Chief Risk Officer, the external auditor
and the Group Finance Director before each Committee meeting.
A detailed forward agenda has been developed which ensures all
matters for which the Committee is responsible are addressed at
the appropriate time of the year. The principal business of the
Committee’s meetings includes:
■ Half year and full year results, press releases and annual report
and accounts;
■ accounting policies and key judgmental areas, Group policies for
compliance with relevant regulations worldwide, including
Sarbanes-Oxley procedures;
■ US filings and related external audit opinion;
■ external auditor’s interim management letter, external auditor’s
full year memorandum, external audit opinion and final
management letter;
■ auditor independence, external auditor’s plans and audit strategy,
effectiveness of the external audit process, external auditor’s
qualifications, expertise and resources and economic service;
■ framework and effectiveness of the Group’s systems of internal
control and Turnbull compliance statement;
■ effectiveness of the Group Risk Framework and half-yearly key
risk report;
■ internal audit plan and resources, reassurance on the audit
framework and internal audit effectiveness;
■ effectiveness of compliance processes and controls and
performance against the Group Compliance Plan;
■ Audit Committee effectiveness and Audit Committee terms
of reference;
■ Group Security annual report, report on anti-money laundering
and reporting of allegations from whistleblowers;
■ International Accounting Standards (IAS) and practices, including
EEV and IFRS; and
■ changes in and implementation of Group Accounting Policies
in compliance with IAS and practices, including the European
CFO Forum Principles and Guidance on Embedded Values (EEV)
and IFRS.
During the year, the Committee’s standing agenda items also
included reports from Group Internal Audit, Group Risk, Group
Compliance and Group Security. In addition, the Committee
also received presentations from some of the business unit
chief executives.
The Audit Committee Chairman reported to the Board on matters
of particular significance after each Committee meeting. The minutes
of Committee meetings were circulated to all Board members.
The Committee recognises the need to meet without the presence
of executive management. Such a session was held in July 2005
with the external and internal auditors.
Business unit audit committees
Each business unit has its own audit committee whose members
and chairman are independent of the individual business unit.
The chairman of these committees is approved by the Chairman
of the Group Audit Committee. The committees are attended by

40 Prudential plc Annual Report 2005
business unit senior management including the Chief Executive
and heads of finance, risk, compliance and internal audit. Business
unit committees have similar terms of reference to the Group Audit
Committee, and report significant issues to the Group Audit
Committee when they arise. They approve the business unit
internal audit plans and oversee the adequacy of internal audit
resources; receive presentations from external audit; and meet
privately with local external audit and the business unit heads of
internal audit.
Internal control and risk management
The Audit Committee reviewed the Group’s statement on internal
control systems prior to its endorsement by the Board. It also
reviewed the policies and processes for identifying, assessing and
managing business risks. The Committee also received the minutes
of the Disclosure Committee and the Group Operational Risk
Committee and noted their activities. Further information on these
Committees appears on pages 44 and 45.
From 31 December 2006, the Group must undertake an annual
assessment of the effectiveness of internal control over financial
reporting under Section 404 of the Sarbanes-Oxley Act. In
common with other companies, which must comply with this
legislation, this has required the Group to undertake a significant
project to document and test its internal controls over financial
reporting. The Committee has overseen the progress of this
project through regular status reports submitted by management
in 2005. During the year, the Group’s external auditor, KPMG
Audit Plc, reported to the Committee on the Company’s progress
towards compliance with Section 404.
Internal audit
The Audit Committee regards its relationship with internal audit as
a particularly important one. Group Internal Audit plays an important
role in supporting the Committee to fulfil its responsibilities under
the Code and the Sarbanes-Oxley Act. Each of the Group’s
business units has an internal audit team, the heads of which, from
1 January 2006, report to the Group-wide Internal Audit Director.
Internal audit resources, plans and work are overseen by the
Group Audit Committee and by business unit audit committees.
Across the Group, total internal audit headcount stands at 113.
The Group-wide Internal Audit Director reports functionally to
the Committee and for management purposes to the Group Chief
Risk Officer.
During the year, the committees reviewed and approved internal
audit’s plans, resources and the results of its work. Reporting to
the Group Audit Committee by Group Internal Audit is through
the formal reports four times during the year and through private
meetings, as well as regular private meetings between the
Chairman of the Committee and the Group-wide Internal Audit
Director. Additionally, the Chairman of the Committee attended
the Group’s internal audit conference in September 2005.
The Committee assesses the effectiveness of internal audit through
a review carried out by external advisers, and through ongoing
dialogue with the Group-wide Internal Audit Director. An internal
review of internal audit arrangements and standards was also
conducted in 2005, to ensure that the activities and resources of
internal audit are most effectively organised to support the
oversight responsibilities of the Committee.
External audit
The Audit Committee has a key oversight role in relation to the
external auditor, KPMG Audit Plc, whose primary relationship
is with the Committee. The Group’s Auditor Independence
Policy ensures that the independence and objectivity of the
external auditor is not impaired, and that the Group maintains a
sufficient choice of appropriately qualified audit firms. The policy
sets out four key principles which underpin the provision of
non-audit services by the external auditor, namely that the auditor
should not:
■ Audit its own firm’s work;
■ make management decisions for the Group;
■ have a mutuality of financial interest with the Group; or
■ be put in the role of advocate for the Group.
The Committee reviewed and updated the policy in December 2005.
The Group has a policy that at least once every five years, the
Audit Committee undertakes a formal review to assess whether
the external audit should be re-tendered. The external audit
was last put out to competitive tender in 1999 when the present
auditor was appointed. In both February 2004 and July 2005, the
Committee formally considered the need to re-tender the external
audit service and concluded that given the significant changes in
audit and regulatory requirements, the interests of the Company
were better served by retaining the existing auditor through a
period of transition. In addition, the Committee concluded that
there was nothing in the performance of the auditor requiring
a change.
During the year, the Audit Committee assessed the qualification,
expertise and resources, effectiveness and independence of the
external auditor. In addition to the questioning of the external
auditor and the Group Finance Director that is a regular feature
of meetings, the review of the effectiveness of the external audit
process was conducted through a questionnaire-based exercise
administered by Group Internal Audit, supplemented by interviews
with senior finance staff and Audit Committee members.
For the year ended 31 December 2005, fees for audit services of
£6.8 million were approved by the Committee. All fees for non-
audit services were approved by the Committee, in accordance
with the Group’s Auditor Independence Policy, prior to work
commencing. The Audit Committee reviewed the non-audit
services being provided to the Group by its external auditor at
regular intervals in 2005. During the year, fees for non-audit
services of £5.6 million were approved by the Audit Committee.
Fees for non-audit services amounted to 45 per cent of total fees
paid to KPMG Audit Plc. These fees primarily related to assurance
services associated with the implementation of IFRS and EEV
accounting requirements, Sarbanes-Oxley requirements and other
regulatory changes, and also to due diligence work related to the
Corporate governance report continued
Prudential plc Annual Report 2005 41
acquisition of the Egg minority. A more detailed analysis is set out
in note I4 on page 180.
Financial reporting
The Audit Committee reviewed the interim and annual financial
statements before their submission to the Board, paying particular
attention to critical accounting policies and practices and any
changes in them; decisions requiring a major element of
judgement; unusual transactions; clarity of disclosures; significant
audit adjustments; the going concern assumption; compliance with
accounting standards; and compliance with obligations under the
Code and other applicable laws and regulations.
As described above, the Committee is regularly briefed by senior
management on developments in international accounting
standards, and during the year it continued to review the progress
of the Group’s project to implement IFRS and EEV reporting.
Confidential reporting
At each meeting, the Committee received and reviewed a report
on calls to the confidential reporting line, which is made available
to employees to enable them to communicate confidentially on
matters of concern, and actions taken in response to these calls.
The Committee also considered whether any internal control
implications arose from communications received. No internal
control implications were raised from calls to the confidential helpline.
Audit Committee effectiveness
During the year, the Audit Committee undertook a formal review
of its own effectiveness and the Committee is satisfied, based on
the findings of this review, that it had been operating as an
effective Audit Committee, meeting all applicable legal and
regulatory requirements. Further reviews of the effectiveness of
the Audit Committee will be undertaken annually.
Remuneration Committee report
Roberto Mendoza (Chairman)
Keki Dadiseth (appointed 1 April 2005)
Michael Garrett
Bridget Macaskill
Kathleen O’Donovan (until 22 September 2005)
James Ross (until 22 September 2005)
Rob Rowley (until 22 September 2005)
Full biographical details of the members of the Remuneration
Committee, including their relevant experience, are set out on
page 37.
The Remuneration Committee is comprised exclusively of
independent non-executive directors of the Company. While the
Chairman and Group Chief Executive are not members, they
attend meetings unless they have a conflict of interest.
The Remuneration Committee normally has scheduled meetings
at least three times a year and a number of additional meetings,
as required, to review remuneration policy. The Remuneration
Committee determines the remuneration packages of the
Chairman and executive directors. During 2005, a total of
11 meetings were held. In framing its remuneration policy, the
Committee has given full consideration to the provisions of
Schedule A to the Code. The remuneration report prepared by
the Board is set out in full on pages 46 to 57. In preparing the
report, the Board has followed the provisions of the Code and
The Directors’ Remuneration Report Regulations 2002.
Except in relation to the remuneration of the Group Chief Executive,
when only the Chairman is consulted, the Remuneration Committee
consults the Chairman and the Group Chief Executive about the
Committee’s proposals relating to the remuneration of all executive
directors. Following the publication of the Code in July 2003, the
terms of reference of the Committee were reviewed and amended.
They were widened to include monitoring the level and structure
of remuneration for a defined population of senior management
as determined by the Board. The Committee agreed principles for
the level and structure of remuneration for this population. The
Committee has access to professional advice inside and outside
the Company.
Nomination Committee report
Sir David Clementi (Chairman)
Jonathan Bloomer (until 5 May 2005)
Bridget Macaskill
Kathleen O’Donovan (until 22 September 2005)
James Ross (from 22 September 2005)
Rob Rowley
The Nomination Committee now comprises exclusively
independent non-executive directors and the Chairman and until
5 May 2005 included the former Group Chief Executive. The
current Group Chief Executive is also closely involved in the work
of the Committee and is invited to attend and contribute to
meetings of the Committee. The Committee meets as required to
consider candidates for appointment to the Board and to make
recommendations to the Board in respect of those candidates. The
Committee, in consultation with the Board, evaluates the balance
of skills, knowledge and experience on the Board and makes
recommendations regarding appointments based on merit and
against objective criteria and the requirements of the Group’s
business. In appropriate cases, search consultants are used to
identify suitable candidates.
During 2005, the Committee held four meetings resulting in the
appointment by the Board of Mark Tucker as Group Chief
Executive on 6 May 2005, and Nick Prettejohn as executive
director on 1 January 2006. Full biographical details of these new
directors are set out on page 36.
During the year, the Nomination Committee continued the search
for additional non-executive directors and employed professional
search consultants who oversaw the initial process. This process
is ongoing.
Board Committees – terms of reference
The full terms of reference of the Audit, Remuneration and
Nomination Committees are available on the Company’s website at
www.prudential.co.uk/prudential-plc/aboutpru/
corporategovernance/boardcommittees
Hard copies may be obtained upon written request to the
Company Secretary at the Company’s registered office.

42 Prudential plc Annual Report 2005
Independent professional advice
The Board has approved a procedure whereby directors have the
right in furtherance of their duties to seek independent
professional advice at the Company’s expense.
Copies of any instructions and advice given by an independent
professional adviser to a director are supplied by the director to
the Company Secretary who will, where appropriate, circulate to
other directors sufficient information to ensure that other members
of the Board are kept informed on issues arising which affect the
Company or any of its subsidiaries.
Directors’ independence, development and re-election
Throughout the year all the non-executive directors were
considered by the Board to be independent in character and
judgement. No non-executive director:
■ Has been an employee of the Group within the last five years;
■ has, or has had within the last three years, a material business
relationship with the Group;
■ receives remuneration from the Group other than a director’s fee;
■ has close family ties with any of the Group’s advisers, directors or
senior employees;
■ represents a significant shareholder; or
■ has served on the Board for more than nine years.
During the year, cross-directorships existed with Roberto Mendoza
and Philip Broadley who both sat on the board of Egg plc, the
Company’s subsidiary which, until 20 February 2006, had its own
listing on the London Stock Exchange. Under the Company’s
Relationship Agreement with Egg, established prior to its flotation
in 2000, the Company agreed with Egg that, absent specific
events, the number of Company related directors should represent
less than half the total number of directors in office. The Company
had the right, whilst it continued to own more than 10 per cent of
the voting shares, to nominate one director and also, whilst it
continued to own more than 15 per cent of the voting shares,
to appoint the Chairman of the board. Jonathan Bloomer was
accordingly appointed as the Company’s nominated director and
on his retirement from the Board of the Company on 5 May 2005,
Philip Broadley was appointed the Company’s nominated
representative on the board of Egg. Roberto Mendoza was
appointed as the Chairman of the board of Egg. Consequently,
Roberto Mendoza and Philip Broadley disclosed their interests as
Chairman and director of Egg. The Board does not consider that
this relationship in any way affected Mr Mendoza’s status as an
independent director of the Company. On 1 December 2005, the
Company announced its intention to acquire the remaining 21 per
cent of Egg plc. Mr Mendoza and Mr Broadley did not participate
in discussions at Egg regarding this acquisition. Nor did they
form part of the Independent Committee of the board of Egg
recommending the Offer from the Company. Since the year-end
Corporate governance report continued
Attendance at Board and Committee meetings
The number of full Board and Committee meetings attended by each director during 2005 was as follows:
Full Audit Remuneration NominationBoard Committee Committee Committee
Meetings* Meetings** Meetings*** Meetings
Number of meetings in year 14 9 11 4
Sir David Clementi 14 (14) n/a n/a 4 (4)
Jonathan Bloomer1 4 (7) n/a n/a 0 (2)
Philip Broadley 14 (14) n/a n/a n/a
Keki Dadiseth2 9 (9) 5 (5) 6 (6) n/a
Michael Garrett3 11 (14) n/a 11 (11) n/a
Bridget Macaskill 14 (14) n/a 11 (11) 3 (4)
Clark Manning 14 (14) n/a n/a n/a
Michael McLintock 14 (14) n/a n/a n/a
Roberto Mendoza 14 (14) n/a 11 (11) n/a
Mark Norbom 14 (14) n/a n/a n/a
Kathleen O’Donovan 14 (14) 9 (9) 7 (7) 2 (2)
James Ross 14 (14) 8 (9) 7 (7) 4 (4)
Rob Rowley 14 (14) 9 (9) 7 (7) 4 (4)
Mark Tucker4 7 (7) n/a n/a n/a
Mark Wood5 10 (11) n/a n/a n/a
Figures in brackets indicate the maximum number of meetings in the period in which the individual was a Board or Committee member.
*During 2005 there were 10 scheduled Board meetings and four additional Board meetings.
**During 2005 there were eight scheduled Audit Committee meetings and one additional meeting.
***During 2005 there were eight scheduled Remuneration Committee meetings and three additional meetings.
1. Resigned as a director on 5 May 2005 but not required to attend Board or Committee meetings on or after 24 March 2005.
2. Appointed as a director on 1 April 2005.
3. Attended all scheduled meetings, but was unable to attend additional meetings because of prior commitments and submitted his comments to the Chairman prior to eachadditional meeting.
4. Appointed as a director on 6 May 2005.
5. Resigned as a director on 17 October 2005 but not required to attend Board meetings on or after 16 October 2005.

Prudential plc Annual Report 2005 43
on 20 February 2006, Egg delisted its shares from the London
Stock Exchange. On 15 March 2006, the Company owned
96.66 per cent of Egg.
It is proposed that Keki Dadiseth will be appointed a director
of ICICI Prudential Life Insurance Company Limited, an Indian
company which is owned 26 per cent by Prudential, and of
Prudential ICICI Asset Management Company Limited, an Indian
company which is owned 49 per cent by Prudential. The Board
does not consider that these appointments will in any way affect
Mr Dadiseth’s status as an independent director of Prudential.
The Group is one of the UK’s largest institutional investors and
the Board does not believe that this situation compromises the
independence of those non-executive directors who are also on
the boards of companies in which the Company has a shareholding.
The Board also believes that such shareholdings should not
preclude the Company from having the most appropriate and
highest calibre non-executive directors.
Non-executive directors are appointed initially for a three-year
term. The terms and conditions of appointment of non-executive
directors are available for inspection at the Company’s registered
office during normal business hours and at the Annual General
Meeting. Their appointment is reviewed towards the end of this
period against performance and the requirements of the Group’s
businesses. Upon appointment, all directors embark upon a wide-
ranging induction programme covering, amongst other things, the
principal bases of accounting for the Group’s results, the role of
the Audit Committee and the ambit of the internal audit function.
In addition, they receive detailed briefings on the Group’s principal
businesses, its product range, the markets in which it operates and
the overall competitive environment. Other areas addressed
include legal issues affecting directors of financial services
companies, the Group’s governance arrangements, its investor
relations programme, as well as its remuneration policies.
A programme of on-going professional development was
undertaken for all directors in 2005, which covered a number
of sector-specific and business issues as well as legal, accounting
and regulatory changes and developments. A cornerstone of the
programme was a series of presentations made to the Board by
the Prudential Corporation Asia management team on the Asian
business and future market opportunities, during the Board visit
to Beijing in June 2005. Throughout their period in office, the
directors are continually updated on the Group’s businesses and
the regulatory and industry-specific environments in which it
operates. These updates can be in the form of written briefings
or meetings with senior executives and, where appropriate,
external sources. Directors are also advised on appointment
of their legal and other duties and obligations as a director of a
listed company both in writing and in face-to-face meetings with
the Company Secretary.
All directors are required to submit themselves for re-election at
the Annual General Meeting at least every three years, and annually
following their reaching the age of 70.
Performance evaluation
An evaluation was carried out of the performance of the Board and
its Committees, and of the individual directors, for the year 2005,
in line with the requirements of the Code. The aim was to improve
individual contributions, the effectiveness of the Board and its
Committees and the Group’s performance.
The evaluation of the Board as a whole and of the Chairman was
carried out by an independent consultant, following a briefing by
the Chairman and the Senior Independent Director. Interviews
were conducted with each Board member by the independent
consultant. The interview questions were based on the Code
and sought views on the effectiveness of the Board and on the
Chairman’s performance. The independent consultant prepared
its report based on the interviews with directors. The overall
results of the evaluation were presented to and reviewed by the
Board in February 2006. The non-executive directors met, under
the leadership of the Senior Independent Director, to consider
the report of the independent consultant and to review the
performance of the Chairman. The performance of individual non-
executive directors and the Group Chief Executive was evaluated
by the Chairman in a meeting with each non-executive director
and with the Group Chief Executive. The Group Chief Executive
individually appraised the performance of the executive directors.
Relations with shareholders
As a major institutional investor, the Company is acutely aware of
the importance of maintaining good relations with its shareholders.
The Company regularly holds discussions with major shareholders
and a programme of meetings took place during 2005. Board
members also regularly receive copies of the latest analysts’ and
brokers’ reports on the Company and the sector, to further
develop their knowledge and understanding of external views
about the Company. The Chairman and the Senior Independent
Director gave feedback to the Board on issues raised with them
by major shareholders. Should major shareholders wish to meet
newly appointed directors they are welcome to do so.
The Annual General Meeting will be held at The Auditorium, The
Mermaid Conference Centre, Puddle Dock, Blackfriars, London
EC4V 3DB on 18 May 2006 at 11.00am. The Company believes the
Annual General Meeting is an important forum for both institutional
and private shareholders and encourages attendance by all its
shareholders. At its Annual General Meeting in 2005, the Company
indicated the balance of proxies lodged for and against each
resolution after it had been dealt with on a show of hands, and the
total percentage of share capital voted on all resolutions. This practice
provides shareholders present with sufficient information regarding
the level of support and opposition to each resolution. The Company
discloses the number of the proxy votes cast on each resolution on
its website after the Annual General Meeting. At the 2006 Annual
General Meeting, as with last year’s meeting, shareholders will be
given the opportunity to put questions to the Board on matters
relating to the Group’s operation and performance.
The Group maintains a corporate website www.prudential.co.uk
containing a wide range of information of interest to private and
institutional investors including the Group’s financial calendar.
Financial reporting
The directors have a duty to report to shareholders on the
performance and financial position of the Group and are
responsible for preparing the financial statements on pages 62 to

44 Prudential plc Annual Report 2005
195 and the European Embedded Value (EEV) basis supplementary
information on pages 204 to 229. It is the responsibility of the
auditor to form independent opinions, based on its audit of the
financial statements and its review of the EEV basis supplementary
information; and to report its opinions to the Company’s
shareholders. Its opinions are given on pages 197 and 230.
Risk management and internal control
As a provider of financial services, including insurance, the Group’s
business is the managed acceptance of risk. The system of internal
control is an essential and integral part of the risk management
process. Prudential management has established a comprehensive
framework of internal controls for the management of risk within
the Group and its business units. The Board has overall responsibility
for the internal controls. The Board has conducted a review of the
effectiveness of the Group’s system of internal control. The focus
on aligning the taking of risk with the achievement of business
objectives means that the control procedures and systems the
Group has established are designed to manage, rather than
eliminate, the risk of failure to meet business objectives and can
only provide reasonable and not absolute assurance against
material mis-statement or loss. The system of internal control
includes financial, operational and compliance controls and risk
management. Aspects are delegated to the Group-level risk
committees and Group Executive Committee as well as to senior
management within the Group and business units.
The Group’s internal control framework includes detailed
procedures laid down in financial and actuarial procedure manuals.
The Group prepares an annual business plan with three-year
projections. Executive management and the Board receive monthly
reports on the financial position of the Group and actual performance
against plan, together with updated forecasts. The insurance
operations of the Group all prepare a financial condition report,
which is reported on to the Board.
As part of the annual preparation of its business plan, all of the
Group’s businesses and functions are required to carry out a
review of risks. This involves an assessment of the impact and
likelihood of key risks and of the effectiveness of the controls in
place to manage them. The assessment is reviewed regularly
throughout the year. In addition, business units review opportunities
and risks to business objectives regularly with the Group Chief
Executive and Group Finance Director and the Group Chief
Risk Officer.
Business units are required to confirm annually that they have
undertaken risk management during the year as required by the
Group Risk Framework and that they have reviewed the
effectiveness of the system of internal control. The results of this
review are reported to and reviewed by the Group Audit
Committee, and it was confirmed that the processes described
above and required by the Group Risk Framework were in place
throughout the period covered by this report, and complied with
Internal Control: Guidance on the Combined Code (the Turnbull
guidance). Business unit internal audit teams execute risk-based
audit plans throughout the Group, from which all significant issues
are reported to the Group Audit Committee.
Group Risk Framework
The Board believes that good risk management and mitigation
protects and enhances the Group’s embedded and franchise value.
The Group Risk Framework requires that all of the Group’s
businesses and functions establish processes for identifying,
evaluating and managing the key risks faced by the Group. The
Group Risk Framework is based on the concept of ‘three lines
of defence’. Primary management responsibility for strategy,
performance management and risk control lies with the Board, the
Group Chief Executive and the Chief Executive and management
of each business unit (the first line of defence). The second line of
defence is oversight of the Group Risk Framework by the Group
Risk Committees, Group Chief Risk Officer and the Group Risk
function working with counterparts in the business units, in
addition to other Group functions, including Group Compliance
and Group Security. The third line of defence is independent
assurance on the effectiveness of the Group’s and business unit
control and risk management systems provided by internal audit
reporting to business unit and Group Audit Committees. During
2005, a Group Chief Risk Officer was appointed, reporting directly
to the Group Chief Executive. The Group Chief Risk Officer
oversees the Group Risk function, Group Compliance, Group
Security and, for management purposes, Group Internal Audit.
This demonstrates the importance which the Board and
management attach to risk management within Prudential. It also
increases the Group’s ability to manage risk in a co-ordinated way
and benefit from optimising the management of the risk oversight
and compliance functions under the Group Chief Risk Officer.
The Group Risk Framework includes the following Group-level
committees: the Group Asset Liability Committee; the Group
Operational Risk Committee and the Group Balance Sheet
Management Committee.
The Group Asset Liability Committee is the senior management
forum responsible for oversight of market, credit and insurance
risks across the Group. It is chaired by the Group Chief Risk Officer
and its membership includes senior business unit and Group
executives involved in the management of market, credit and
insurance risks framework. The Group Asset Liability Committee
reports to the Group Chief Executive.
The Group Balance Sheet Management Committee is the senior
management forum responsible for oversight of the Group’s
balance sheet strategy, including debt capacity and capital
structure. Its membership includes senior management involved
in the operation of the Group’s policies for balance sheet
management, including liquidity, financing and capital adequacy.
The Group Balance Sheet Management Committee is chaired
by the Group Finance Director and reports to the Group
Chief Executive.
The Group Operational Risk Committee is the senior management
forum responsible for oversight of the non-financial operational
risks, business environment risks, and strategic risks facing the
Group and oversight of the Group Risk Framework including
monitoring operational risk and related policies and processes as
Corporate governance report continued

Prudential plc Annual Report 2005 45
they are applied throughout the Group. The Group Operational
Risk Committee is chaired by the Group Chief Risk Officer and its
membership includes representatives of the business unit and
Group Risk functions. The Group Operational Risk Committee
reports to the Group Chief Executive.
The Group Chief Risk Officer and the Group Risk Committees are
supported by the Group Risk function and the risk committees and
risk functions in each business unit. Quarterly risk reports from the
business units and Group are reported to Group Risk covering risks
of Group significance. Regular reports are also made to the Group
and business unit audit committees by management, internal audit
and compliance functions. Updates on the Group Risk Framework
and the Group’s risk profile have been reported to the Group
Executive Committee and Group Audit Committee and Board
during 2005. This has included the Group Executive Committee
assessment of Group-level risks.
Group Risk acts as secretariat and facilitates the agenda of the
Group Asset Liability Committee and Group Operational Risk
Committee. Group Risk acts as adviser in respect of all risks faced
by Prudential Group, and establishes and maintains the risk
management agenda across the Group, including through the
design, implementation and maintenance of economic capital
models, a consistent and harmonised risk management framework
and policies, including recommendations as to risk appetite and
risk-adjusted profitability. The Group Economic Capital Framework
includes the modelling and quantification of the Group’s financial
and non-financial operational risk economic capital position.
Business units undertake risk self-assessments in accordance with
the Group Risk Framework, with dedicated risk functions and
named individuals responsible for the operation of the Group Risk
Framework within each business unit. The operation of this
includes business units’ communication and application of the
Group Risk Framework internally, including risk co-ordinators,
identified risk owners, and regular risk reviews. Quarterly risk
reports from the business units and Group are reported to Group
Risk and the Group-level risk committees covering risks of Group
significance. Regular reports are also made to the Group and
business unit audit committees by management, internal audit,
compliance and legal functions.
The Group is committed to developing its risk management
techniques and methodologies, both to maintain high standards
of risk management practice, and to fulfil the requirements of
regulators. The control system continues to evolve and Group
Risk carry out reviews and research to identify industry best
practice together with ensuring that the standards and policies
within the Group are progressively developed to improve risk
management practice.
Disclosure Committee
The Sarbanes-Oxley Act 2002 (the Act) was passed by the US
Congress in July 2002 to establish new or enhanced standards for
corporate accountability in the US. As a result of the listing of its
securities on the New York Stock Exchange, the Company must
comply with the relevant provisions of the Act.
The Company has already adopted procedures to comply with all
applicable provisions of the Act.
In particular, in relation to Section 302 of the Act which covers
disclosure controls and procedures, a Disclosure Committee has
been established, reporting to the Group Chief Executive, chaired
by the Group Finance Director and comprising members of senior
management. The objectives of this Committee are to:
■ Assist the Group Chief Executive and the Group Finance Director
in designing, implementing and periodically evaluating the
Company’s disclosure controls and procedures;
■ monitor compliance with the Company’s disclosure controls
and procedures;
■ review and provide advice to the Group Chief Executive and the
Group Finance Director with regard to the scope and content
of all public disclosures of the Company which are of material
significance to the market or investors; and
■ review and consider, and where applicable follow up on, matters
raised by other components of the disclosure process, including
assessments made by the Group Audit Committee, the internal
auditor or the external auditor of the Company’s internal controls
to the extent they are relevant to the disclosure process.
In discharging these objectives, the Committee helps to support
the Group Chief Executive’s and the Group Finance Director’s
certifications of the effectiveness of disclosure procedures and
controls required by Section 302 of the Act.
The provisions of Section 404 of the Act require Prudential’s
management to report on the effectiveness of internal control over
financial reporting in its annual report on Form 20-F which is filed
with the US Securities and Exchange Commission. The first
requirement for this report is for the year ended 31 December
2006, and in common with other companies which have to comply
with this requirement, the Group has undertaken a significant
project to document and test its internal control over financial
reporting in the format required by the Act.
Additionally, the Disclosure Committee has regard to the UK
Listing Regime, effective from 1 July 2005, and evaluates whether
or not a particular matter would constitute ‘inside information’ and
therefore would require to be disclosed to the market.

46 Prudential plc Annual Report 2005
Introduction
This report to shareholders sets out:
■ The role of the Remuneration Committee;
■ our remuneration policy for executive directors for 2005 and
2006; and
■ tables of information showing details of the remuneration paid
and share interests of all the directors for the year ended
31 December 2005.
The Remuneration Committee
Role of the Remuneration Committee
The Board believes that a properly constituted and effective
Remuneration Committee is key to ensuring that executive
directors’ remuneration is aligned with shareholders’ interests
and enhances the competitiveness of the Company. The terms
of reference of the Remuneration Committee are available on
the Company’s website and a copy may be obtained from the
Company Secretary. The Board has delegated to the Remuneration
Committee the setting of the remuneration policy and individual
remuneration packages for the Chairman and the executive
directors. The fees of non-executive directors are a matter for the
Board itself. The Chairman and the Group Chief Executive attend
Remuneration Committee meetings to provide background and
context on matters relating to the remuneration of the other
executive directors, but do not attend when their own remuneration
is discussed. No director has any involvement in determining his or
her own remuneration. The Remuneration Committee meets on at
least three occasions each year and more frequently if necessary.
In 2005 the Committee met on 11 occasions.
Membership of the Remuneration Committee
The members of the Remuneration Committee during 2005, who
are listed below, were all independent non-executive directors:
Roberto Mendoza (Chairman)
Keki Dadiseth (from 1 April 2005)
Michael Garrett
Bridget Macaskill
Kathleen O’Donovan (until 22 September 2005)
James Ross (until 22 September 2005)
Rob Rowley (until 22 September 2005)
Advisers to the Remuneration Committee
During 2005 the Group Human Resources Director was invited to
provide the Committee with her views and advice on matters
considered by the Committee. The Committee appointed Deloitte
to provide consultancy and market data and Freshfields Bruckhaus
Deringer to advise on legal matters. Towers Perrin and McLagan
provided the Company with survey information on remuneration
and Freshfields Bruckhaus Deringer provided other legal advice.
Deloitte also provided certain risk and other advisory services to
the Company.
Compliance with the Directors’ Remuneration Regulations
This report has been approved by the Board and, as required by
The Directors’ Remuneration Report Regulations 2002 (the
Regulations), a resolution will be put to shareholders at the Annual
General Meeting inviting them to consider and approve it. This
report complies with the requirements of the Regulations and
KPMG Audit Plc have audited the sections contained in pages 52
to 57 as required by the Companies Act 1985.
Compliance with the Combined Code
During the year, the Company has complied with Schedule A and
Schedule B and the provisions relating to the Principles of Good
Governance and Code of Best Practice of the Combined Code
then in force regarding directors’ remuneration.
Remuneration policy
The aim of the Company’s remuneration policy is to enable the
Company to recruit and retain the highest calibre executives.
To achieve this objective, Prudential must continue to use
remuneration practices relevant to the different markets in which
the Company does business around the world. At the same time,
the Remuneration Committee considers remuneration within the
context of the UK’s regulatory framework and shareholder views,
and is guided by UK corporate governance standards.
The Remuneration Committee recognises that a successful
remuneration policy needs to be sufficiently flexible to take account
of changes in the Company’s business environment. The Committee
will keep the policy under review, consulting with major shareholders
before making any material changes. Any changes to the policy will
be described in future remuneration reports.
Key principles of the remuneration policy
The principles developed by the Remuneration Committee reflect
the relative importance of those elements that are fixed and those
that are variable and related to performance:
■ A high proportion of total remuneration will be delivered through
performance-related reward;
■ the total remuneration package for each executive director will
be set in relation to the relevant employment market;
■ a significant element of performance-related reward will be
provided in the form of shares;
■ performance for business unit executives will be measured at
both a business unit and Group level; and
■ performance measures will include both absolute financial
measures and comparative measures as appropriate to provide
a clear alignment between the creation of shareholder value
and reward.
Total remuneration levels
Total remuneration means basic salary, short- and long-term
incentives and pension. Award levels for the Group Chief Executive
are set by the Remuneration Committee by reference to the total
remuneration levels of other chief executives of major companies.
The total remuneration levels for the other executive directors are
set similarly by reference to levels in their relevant markets. All pay
data is externally provided.
Remuneration policy for executive directors
During 2005, the Remuneration Committee reviewed the
remuneration policy and decided that certain changes in long-term
incentives were appropriate. The proposed policy for 2006,
including the elements of remuneration and details of proposed
new long-term incentive plans are set out in the Notice of Annual
General Meeting 2006 that accompanies this Report and are
summarised below. The remuneration policy that applied in 2005
is set out on page 48.
Elements of the remuneration package
The remuneration package for the Company’s executive directors
comprises the following elements:
Remuneration reportFor year ended 31 December 2005

Prudential plc Annual Report 2005 47
■ A basic salary;
■ an annual incentive;
■ long-term incentives, paid in cash or shares depending on the
plan; and
■ pension entitlement and other benefits.
2006 remuneration policy
Basic salary
The Remuneration Committee normally reviews executive
directors’ salaries each year on an individual basis. The policy on
basic salaries will be to review individual salaries with respect to
the relevant market taking into account total remuneration.
The basic salaries of the executive directors at 1 January 2006 are:
Philip Broadley £530,000 per annum
Clark Manning US$925,000 per annum
Michael McLintock £320,000 per annum
Mark Norbom £515,000 per annum
Nick Prettejohn £575,000 per annum
Mark Tucker £840,000 per annum
Annual incentive plans
Annual incentive payouts for executive directors depend on
performance and are paid in cash or shares as indicated below.
Annual bonuses for 2006 will be based on a combination of Group
and business unit financial measures and the individual strategic
targets set for each individual director.
Annual bonus awards are not pensionable. The annual incentive
for executive directors is aligned with the interests of shareholders
in that any part of the annual incentive award made for
performance above target will be in the form of a share award.
Receipt of these shares is deferred and the shares are normally
only released after three years. Dividends accumulate for the
benefit of award holders during the deferral period. For 2006, this
structure has been extended to include the Chief Executive of
Jackson National Life (JNL).
During the review of executive director remuneration, the
Committee came to the conclusion that in order to bring the total
compensation opportunity for target performance closer towards
the median market practice, the annual bonus award at target and
maximum for Mark Tucker should be increased from the 2005 level
of 50 per cent of basic salary for target and 110 per cent of basic
salary for maximum. The levels for the other directors remain
unchanged and for 2006 the maximum award levels are as follows:
NotesClark Manning is also eligible to receive an annual bonus which provides for apercentage share of a bonus pool based on the profits of JNL. He is additionallyeligible to participate in a US tax qualified all-employee profit sharing plan.
Michael McLintock’s annual incentive award is in line with remuneration levels in theinvestment management industry and is based on the profits of M&G, the fundperformance of M&G and Group and individual performance.
Target Maximum% of basic salary % of basic salary
Philip Broadley 50 110
Clark Manning 100 120
Michael McLintock 300 500
Mark Norbom 50 110
Nick Prettejohn 50 110
Mark Tucker 75 125
2006 long-term incentive award policy
Our long-term incentive plans are designed to drive the underlying
financial performance of the business. The incentive plans
recognise that strong business unit performance is critical to Group
performance. In order to grow the value of Prudential for
shareholders, the Board needs to focus on growing each area of
business. Executive directors that run a business unit therefore
also participate in a long-term incentive plan geared to their
business reflecting those responsibilities. In all cases the
performance period is three years; for example, the 2006 awards
run from the beginning of 2006 to the end of 2008.
2006 Group Performance Share Plan
Shareholder approval is being sought for the introduction of a new
Group Performance Share Plan to replace the Restricted Share Plan
(RSP) which expires this year.
The proposed new plan, in which all executive directors will
participate, delivers shares subject to performance measured over
three years. To improve the alignment with our shareholders’ long-
term interests, participants will be entitled to receive the value of
reinvested dividends over the performance period for those shares
that vest.
The performance condition for the initial awards will be based
on Total Shareholder Return (TSR) out-performance of an index
comprised of peer companies. This approach, which focuses on
returns above the index, is considered to be more robust than a
rank-based approach when the number of comparator companies
is relatively few. The approach also ensures that maximum vesting
is only achieved if the Company outperforms the average comparator
performance by a significant margin.
The comparator companies have been carefully selected to
represent the international industry in which Prudential operates:
Aegon; Allianz; Aviva; Axa; Friends Provident; Generali; ING;
Legal & General; Manulife and Old Mutual. The Remuneration
Committee will keep the group of companies under review.
TSR will be measured on a local currency basis. This approach is
considered to have the benefits of simplicity and directness of
comparison with the performance of the comparator companies.
2006 awards will vest on the basis of the schedule set out below:
Vesting between each performance point is on a straight-line sliding scale basis.
The Remuneration Committee must also be satisfied that the
quality of the underlying financial performance justifies the level of
award delivered at the end of the performance period and would
adjust awards accordingly at its discretion.
2006 business unit long-term incentive plans
Shareholder approval is being sought for the introduction of a new
Business Unit Performance Plan. This plan provides a common
framework under which awards will be made to the Chief
Executives of Prudential UK & Europe, JNL and Prudential
Corporation Asia to replace the existing incentive plans for these
individuals. Michael McLintock will receive 2006 awards under the
TSR relative to the Index at the end of the third year Percentage of award that vests
Less than Index return Nil
Index performance 25%
Index performance x 110% 75%
Index performance x 120% 100%

48 Prudential plc Annual Report 2005
M&G Chief Executive Long-term Incentive Plan as described in the
section on 2005 long-term incentive plans on page 49.
The Group Chief Executive and the Group Finance Director will
not participate in this plan.
Half of the awards will be denominated and delivered in shares.
The remaining half will be paid in cash. Participants will normally
be entitled to receive the value of reinvested dividends over the
performance period for those shares that vest.
The performance condition for the awards under the Business Unit
Performance Plan will be based on growth in Shareholder Capital
Value. This is the increase in shareholders’ capital and reserves
on a European Embedded Value (EEV) basis (using the European
Embedded Value Principles for reporting adopted by European
insurance companies).
This measure has been chosen on the basis that it is transparent
and reflects the creation of value for shareholders. Shareholder
Capital Value will be based on the figure disclosed in the Annual
Report, on a constant exchange rate basis for the relevant business
and adjusted for capital injections and dividends in the period.
The growth parameters for the awards will be relevant to each
region. For 2006 awards under the new Business Unit Performance
Plan, the proposed targets are as follows:
Vesting between each performance point is on a straight-line sliding scale basis.
The Remuneration Committee must also be satisfied that the
quality of the underlying financial performance justifies the level of
award delivered at the end of the performance period, and would
adjust awards accordingly at its discretion.
2006 long-term incentive awards
The proposed awards for 2006 under the new plans are set
out below.
*In the case of the Chief Executive M&G, this is the M&G Chief Executive LTIP asdescribed in the section on 2005 business-specific long-term incentive plans on page 49.
**Estimated value.
Group Performance Business UnitShare Plan Performance Plan*
Group Chief Executive 200% na
Group Finance Director 160% na
Chief Executive, Prudential Corporation Asia 140% 140%
Chief Executive, JNL 230% 230%
Chief Executive, M&G 100% c.200%**
Chief Executive, Prudential UK & Europe 130% 130%
Compound annual growth in Shareholder Capital Value per annum over three years
Percentage of award that vests UK & Europe JNL Asia
0% <8% <8% <15%
30% 8% 8% 15%
75% 11% 10% 22.5%
100% 14% 12% 30%
Pensions
The 2006 policy for pensions is described in the section on
directors’ pensions and life assurance on page 56.
Shareholding guidelines
As part of the remuneration review, a guideline is being introduced
that executive directors should hold a substantial number of shares
according to the following schedule. The executive directors will
be encouraged to build up their shareholding over a five-year
period (with an interim target of one times salary after three years).
Group Chief Executive 2 x basic salary
Chief Executive M&G 2 x basic salary
Other executive directors 1 x basic salary
Shares earned and deferred under the annual incentive plan are
included in the guideline.
At least half the shares released from long-term incentive awards
after tax would be retained by the executive director until the
guideline is met.
Nick Prettejohn
Nick Prettejohn joined as a director from 1 January 2006. He was
paid £265,000 to compensate for loss of bonus for 2005 and
£183,490 for the loss of a long-term incentive award due in 2005
from his previous employer. In order to compensate him for the
loss of substantial amounts of outstanding long-term remuneration,
he will have rights to Prudential plc shares that vest as set out below:
In normal circumstances, releases are conditional on Nick
Prettejohn being employed by Prudential at the date of vesting.
If there is a change of control of Prudential he may become entitled
to retain any unvested awards.
2005 remuneration policy
The remuneration policy for 2005 was the same as for 2006 with
the exception of the long-term incentive plans, the annual
incentive plan for Mark Tucker and pensions. The 2005 long-term
incentive awards are described below and the 2005 policy for
pensions is described in the section on directors’ pensions and life
assurance on page 56.
2005 long-term incentive awards
The long-term incentive plans operating in 2005 are described
below. All the outstanding long-term awards held by the executive
directors are detailed on pages 53 to 55.
2005 Restricted Share Plan
The Restricted Share Plan (RSP) rewards Prudential’s achievement
of Total Shareholder Return (TSR) relative to other companies that
were in the FTSE 100 at the beginning of each three-year
performance period.
For any awards under the RSP to vest, the Remuneration Committee
must be satisfied with the Company’s underlying financial performance
over the performance period. At the end of each performance period,
depending on the Company’s performance, executive directors
may be granted a right to receive shares at no cost to the individual.
31 Mar 31 Oct 31 Oct 31 Oct2006 2006 2007 2008
Number of Prudential shares 10,000 40,000 16,000 5,500
Remuneration report continued
For year ended 31 December 2005

Prudential plc Annual Report 2005 49
Awards vest on the basis of the schedule set out below:
Vesting between each performance point is on a straight-line sliding scale basis.
In normal circumstances, directors may take up their right to
receive shares at any time during the following seven years.
Dividends do not accumulate on awards.
In 2005 for Mark Tucker the maximum conditional award was 200
per cent of basic salary as was the award for Jonathan Bloomer. For
Philip Broadley, Clark Manning, Mark Norbom and Mark Wood,
the awards were equivalent to 160 per cent of basic salary and for
Michael McLintock the award was equivalent to 80 per cent of
basic salary.
2005 business-specific long-term incentive plans
Clark Manning
In 2005 Clark Manning participated in a cash-based long-term plan
that rewards the growth in appraisal value of JNL. The award
payout equals an initial award value adjusted by the Prudential plc
share price change over the performance period. In order for any
award to be made under the 2005 plan the growth rate over the
performance period must be eight per cent per annum compound
or greater. At this level of performance the initial award value is
US$864,240. If the on-target performance level of 11.5 per cent
per annum compound is achieved the initial award value is
doubled. If the annual growth rate is at least 17.5 per cent the
payout increases to a maximum of three times the initial award
value. For performance between these points payouts are on a
straight line sliding scale.
Michael McLintock
In 2005 Michael McLintock participated in the M&G Chief
Executive Long-Term Incentive Plan that provides a cash reward
through phantom M&G share awards and options, whose value
depends on the profit and fund performance of M&G over the
performance period. The change in the phantom share price
equals the change in M&G profit, modified up or down by the
investment performance of M&G, over the performance period.
For 2005 the face value of the share award was £225,000.
Provided the phantom share options have value, they may be
exercised in part or in full during annual exercise periods after
three to seven years from the start of the performance period. For
2005 the phantom option award had a face value of £367,800.
Mark Norbom
In 2005 Mark Norbom participated in the Asian Long-Term
Incentive Plan which is a cash-based plan that measures an index
of added value geared to new business profit growth in our Asian
businesses. For the 2005 award the plan will only pay out if the
growth rate is greater than 15 per cent per annum compound over
the performance period. At this level of performance a payment of
50 per cent of basic salary is made. The on-target payout is 100 per
cent of salary, for which an annual growth rate of 35 per cent is
TSR relative to the index at the end of the third year Percentage of award that vests
Less than 50th percentile Nil
50th percentile 25%
80th percentile 100%
required. If an annual growth rate of 50 per cent or more is
achieved, the maximum of 150 per cent of basic salary is paid.
For performance between these points payouts are on a straight
line sliding scale basis.
Mark Wood
In 2005 Mark Wood participated in a cash-based long-term plan
that rewards the growth in appraisal value of Prudential UK &
Europe over the performance period. This plan only paid out if the
growth rate was greater than eight per cent per annum compound
over the performance period. At this level of performance a
payment of 50 per cent of basic salary would be made. The on-
target payout was 75 per cent of basic salary for which a growth
rate of 11.5 per cent was required. If a growth rate of 17.5 per cent
or more were achieved the maximum of 100 per cent of basic
salary was payable. For performance between these points payouts
were on a straight-line sliding scale basis.
Chairman’s letter of appointment and benefits
The Chairman is paid annual fees and the contractual notice
periods are 12 months from either party. The Chairman participates
in a medical insurance scheme, has life assurance cover and has
the use of a car and driver. He is entitled to a supplement to his
fees, intended for pension purposes. He is not a member of any
Group pension scheme providing retirement benefits.
Directors’ service contracts and letters of appointment
Executive directors have contracts that terminate on their normal
retirement date, which is the date of their 60th birthday. The
normal notice of termination that the Company is required to give
executive directors is 12 months, although for newly appointed
directors there may be an initial contractual period of up to two
years before the 12 months’ notice period applies. The service
contracts for all current executive directors contain a 12 months’
notice period from the Company. When considering termination of
service contracts, the Remuneration Committee will have regard to
the specific circumstances of each case, including a director’s
obligation to mitigate his loss.
The contract for Clark Manning is a renewable one-year fixed-term
contract. The contract is renewable automatically upon the same
terms and conditions unless the Company or Clark Manning gives
at least 90 days’ notice prior to the end of the relevant term. In the
case of the former, Clark Manning is entitled to continued payment
of salary and benefits for the period of one year from the day such
notice is delivered to him. The contract can also be terminated by
the Company or Clark Manning by giving 12 months’ notice.
Payments of Clark Manning’s salary during the period following
the termination of employment will be reduced by the amount of
any compensation earned by him from any subsequent employer
or from any person for whom he performs services. Benefits to
be provided during such period will also be cancelled to the
extent that comparable benefits are available to him from these
alternative sources.
Executive directors, with the exception of Michael McLintock,
are required to give 12 months’ notice of termination to the
Company. Michael McLintock is required to give six months’
notice to the Company.

50 Prudential plc Annual Report 2005
*The contract can also be terminated by issuing a non-renewal notice as describedabove.
Nick Prettejohn joined as a director on 1 January 2006.
Jonathan Bloomer resigned from the Company and his
employment ended on 5 May 2005.
Mark Wood resigned as a director of the Company effective
17 October 2005 and his employment ended on 1 February 2006.
Non-executive directors do not have service contracts but are
appointed pursuant to letters of appointment with notice periods
of six months without liability for compensation.
*Under the terms of their letters of appointment, the non-executive directors serve foran initial term of three years following their election by shareholders at the AnnualGeneral Meeting after their appointment by the Board.
Benefits and protections
Executive directors receive certain benefits, principally
participation in medical insurance schemes, the provision of a cash
allowance for a car (except for Clark Manning and Mark Norbom),
and, in some cases the use of a car and driver and security
arrangements. Mark Norbom also receives expatriate allowances.
No benefits are pensionable. The executive directors’ pension
arrangements and life assurance provisions are set out in the
pensions and life assurance section on pages 56 and 57.
Except for Clark Manning, the executive directors are eligible to
participate in either the Company’s UK or International Savings-
Related Share Option Scheme. Options granted under these
schemes are not subject to performance conditions.
Executive directors are entitled to participate in arrangements in
certain M&G investment products on the same terms as available
to external investors, apart from the minimum level of investment.
In addition, the Company provides certain protections for directors
and senior managers against personal financial exposure that they
may incur in their capacity as such. This includes qualifying third
party indemnity provisions (as defined under section 309B of the
Date of initial Commencement Expiry date appointment date of current of current
Name by the Board term* term
Non-executive directors
Keki Dadiseth 1 Apr 2005 AGM 2005 AGM 2008
Michael Garrett 1 Sep 2004 AGM 2005 AGM 2008
Bridget Macaskill 1 Sep 2003 AGM 2004 AGM 2007
Roberto Mendoza 25 May 2000 AGM 2004 AGM 2007
Kathleen O’Donovan 8 May 2003 AGM 2004 AGM 2007
James Ross 6 May 2004 AGM 2005 AGM 2008
Rob Rowley 8 Jul 1999 AGM 2003 AGM 2006
Date of Notice period Notice periodName contract to the Company from the Company
Executive directors
Philip Broadley 12 Apr 2000 12 months 12 months
Clark Manning 7 May 2002 12 months* 12 months*
Michael McLintock 21 Nov 2001 6 months 12 months
Mark Norbom 23 Dec 2003 12 months 12 months
Mark Tucker 24 Mar 2005 12 months 12 months
Former executive directors
Jonathan Bloomer 5 Mar 1999 12 months 12 months
Mark Wood 5 Oct 2001 12 months 12 months
Companies Act 1985) in force for the benefit of the directors of the
Company and of associated companies (as defined under section
309A of the Companies Act 1985), both at the time the Directors’
Report was approved under section 234A of the Companies Act
1985 and during 2005.
Policy on external appointments
Subject to the Board’s approval, executive directors are able
to accept external appointments as non-executive directors of
other organisations.
Non-executive directors’ remuneration
Non-executive directors are not eligible to participate in annual
incentive plans, long-term incentive plans or pension arrangements.
Their fees are determined by the Board and reflect their individual
responsibilities including committee membership as appropriate.
The Board reviews the fees annually and the last change was made
in 2005.
The basic fee is £50,000 per annum. The additional Audit
Committee chairmanship fee is £40,000 per annum. An additional
fee of £15,000 per annum is paid to the other members of the
Audit Committee. The additional Remuneration Committee
chairmanship fee is £20,000 per annum, although the Chairman
of the Remuneration Committee waived the last increase to the
chairmanship fee and receives only £10,000 per annum.
Annually, the non-executive directors use the net value of £25,000
of their total annual fees to purchase shares in the Company.
Shares are purchased each quarter and are held at least until
retirement from the Board.
During the period in which he was Chairman of Egg, Roberto
Mendoza received a fee of £75,000 per annum.
Performance graph
The line graph below represents the comparative Total
Shareholder Return (TSR) of the Company during the five years
from 1 January 2001 to 31 December 2005.
This graph shows the Company’s TSR performance against the
FTSE 100 index, which is a broad equity market index of UK
companies of comparable size and complexity to Prudential.
TSR over the performance period is the growth in value of a share
plus the value of dividends paid, assuming that the dividends are
reinvested in the Company’s shares on the day on which they
were paid.
Prudential TSR v FTSE 100 Total Returns Index (TRI)
120
100
80
60
40
20
0Dec 02 Dec 03 Dec 04 Dec 05Dec 01Dec 00
Prudential TSRFTSE 100 TRI
Total shareholder return %
Remuneration report continued
For year ended 31 December 2005

Prudential plc Annual Report 2005 51
Directors’ shareholdings
The current shareholding policy is that as a condition of serving, all executive and non-executive directors are required to have beneficial
ownership of 2,500 ordinary shares in the Company. This interest in shares must be acquired within two months of appointment to the
Board if the director does not have such an interest in that number upon appointment.
As stated on page 50, non-executive directors have also used a proportion of their fees to purchase additional shares in the Company on
a quarterly basis.
The interests of directors in ordinary shares of the Company are set out below and include shares acquired under the Share Incentive
Plan, the deferred annual incentive awards that are detailed in the table on other share awards on page 55, and Mark Norbom’s interests
in the shares awarded on appointment that are detailed in the same table.
The interests of directors in shares of the Company include changes between 31 December 2005 and 15 March 2006. All interests
are beneficial.1 Jan 2005* 31 Dec 2005 15 Mar 2006**
Philip Broadley1,2 29,619 32,853 33,517
Sir David Clementi 16,615 23,849 23,849
Keki Dadiseth 2,500 4,012 4,012
Michael Garrett3 12,757 15,674 15,674
Bridget Macaskill 9,707 12,581 12,581
Clark Manning 24,163 24,953 24,953
Michael McLintock 109,625 202,809 202,809
Roberto Mendoza4 133,627 140,517 207,627
Mark Norbom5 584,323 618,026 618,026
Kathleen O’Donovan 7,564 10,185 10,185
James Ross 5,236 8,111 8,111
Rob Rowley 40,969 44,415 44,625
Mark Tucker 86,523 134,353 134,353
*Or date of appointment if later.
**Changes to interests in shares were either due to acceptance of the Offer by Prudential for shares in Egg (Egg shareholders were entitled to receive 0.2237 new Prudentialshares for every Egg share held) or due to purchases under the Share Incentive Plan, under which shares are purchased on a monthly basis on predetermined purchase days.
Nick Prettejohn joined as a director on 1 January 2006 and at 15 March 2006 had a beneficial interest in 2,570 Prudential plc shares.
Notes1. Philip Broadley’s shareholding at 1 January 2005 includes 65 shares received as a result of a scrip dividend which were not reported in the 2004 Annual Report.
2. The shares in the table include shares purchased under the Prudential Services Limited Share Incentive Plan together with Matching Shares (on a 1:4 basis) that will only bereleased if the employee remains in employment for three years. For Philip Broadley the total number of Matching Shares at 31 December 2005 was 49.
3. Michael Garrett’s shareholding at 1 January 2005 includes 1,666 shares received as a result of the Rights Issue which were not reported in the 2004 Annual Report.
4. Roberto Mendoza’s shareholding at 1 January 2005 includes 1,427 shares received as a result of the Rights Issue which were not reported in the 2004 Annual Report.
5. Mark Norbom’s interests in shares included 1,265.50 American Depositary Receipts (representing 2,531 ordinary shares) at 1 January 2005 and 1,306.263 AmericanDepositary Receipts (representing 2,612 ordinary shares) at 31 December 2005.
The interests of directors in shares of the Company’s subsidiary, Egg plc, which was listed until 20 February 2006, are shown below,
including changes between 31 December 2005 and 15 March 2006.1 Jan 2005 31 Dec 2005 15 Mar 2006
Philip Broadley 2,610 2,610 0
Roberto Mendoza 300,000 300,000 0
Rob Rowley 940 940 0

52 Prudential plc Annual Report 2005
Directors’ remuneration for 2005Total Total
Other emoluments emolumentsSalary/fees Bonus payments Benefits* 2005 2004
£000 £000 £000 £000 £000 £000
Chairman
Sir David Clementi 450 29 479 460
Executive directors
Jonathan Bloomer (until 5 May 2005; note 1) 279 150 26 455 1,120
Philip Broadley (note 2) 500 459 41 1,000 788
Clark Manning (note 3) 467 1,263 21 1,751 1,486
Michael McLintock (notes 4 and 5) 320 1,515 43 1,878 1,774
Mark Norbom (notes 6 to 9) 500 370 90 214 1,174 1,342
Mark Tucker (from 6 May 2005; notes 10 and 11) 509 503 118 1,130 –
Mark Wood (note 12) 464 358 43 865 966
Total executive directors 3,039 4,618 90 506 8,253 7,476
Non-executive directors
Bart Becht (until 31 August 2004) – – 33
Keki Dadiseth (from 1 April 2005; notes 13 to 15) 37 37 –
Michael Garrett (from 1 September 2004) 50 50 17
Bridget Macaskill 50 50 50
Roberto Mendoza 135 135 135
Kathleen O’Donovan 60 60 55
James Ross (from 6 May 2004) 60 60 36
Rob Rowley 90 90 90
Sandy Stewart (until 6 May 2004) – – 49
Total non-executive directors 482 482 465
Overall total 3,971 4,618 90 535 9,214 8,401
*Benefits include cash allowances for cars.
Notes1. In addition to the emoluments in the table, under the terms of his termination of employment, Jonathan Bloomer was paid a total of £1,600,000.
2. It is intended that a deferred share award valued at £209,090 from his 2005 annual bonus will be made to Philip Broadley. This is included in the 2005 bonus figure.
3. Clark Manning’s bonus figure excludes a contribution of £6,926 from a profit sharing plan that has been made into a 401k retirement plan which is included in the table onpension contributions on page 57.
4. In 2005 a deferred share award valued at £435,547 from his 2004 annual bonus was made to Michael McLintock. This is included in the 2004 total and further details areshown in the section on other share awards on page 55.
5. It is intended that a deferred share award valued at £554,732 from his 2005 annual bonus will be made to Michael McLintock. This is included in the 2005 bonus figure.
6. In 2005 a deferred share award valued at £157,795 from his 2004 annual bonus was made to Mark Norbom. This is included in the 2004 total and further details are shown inthe section on other share awards on page 55.
7. It is intended that a deferred share award valued at £119,790 from his 2005 annual bonus will be made to Mark Norbom. This is included in the 2005 bonus figure.
8. In 2005 Mark Norbom was also paid £90,349 in dividend equivalents from the awards detailed in the section on other share awards on page 55. This amount is included in thecolumn headed other payments.
9. Mark Norbom’s benefits include those that reflect his expatriate status, which include costs of £146,943 related to housing.
10. It is intended that a deferred share award valued at £243,453 from his 2005 annual bonus will be made to Mark Tucker. This is included in the 2005 bonus figure.
11. Mark Tucker is eligible to be paid a housing allowance of £11,017 per month until 30 April 2006. This is included in the benefits figure.
12. Mark Wood’s salary and benefits in the table are the total up to 16 October 2005 which was the last day he was an executive director. In 2005 a deferred share award valued at£168,550 from his 2004 annual bonus was made to Mark Wood. This is included in the 2004 total and further details are shown in the section on other share awards on page 55.
13. Keki Dadiseth was appointed as a director of Prudential plc with effect from 1 April 2005, and as a member of the Audit Committee with effect from 5 May 2005.
14. In accordance with an agreement that the Company entered into with Keki Dadiseth, he did not retain his director’s fee for his first two months of his appointment; instead hisfee was paid to Unilever PLC, where he served as an executive director until May 2005. For those first two months, no portion of the fees which were paid to Unilever in lieu ofpayment to him was applied to the purchase of shares in the Company. With effect from June 2005, Prudential paid non-executive director fees to Keki Dadiseth, and a portion ofthose fees were used to purchase shares in the Company, as is the practice for all of Prudential's non-executive directors.
15. In addition the Company pays an allowance of £10,391 per annum to Keki Dadiseth in respect of his accommodation expenses in London whilst on the Company's business,in lieu of reimbursing hotel costs, as is the usual practice for directors who are not resident in the UK.
The Remuneration Committee reviewed each executive director’s individual contribution and the continuing strong operating
performance of the Group in 2005 against the 2005 business plans and was satisfied that the bonus payments made for the year are fully
justified.
Executive directors – non-executive director earnings
Executive directors who are released to serve as non-executive directors of other external companies retain the earnings resulting from
such duties. In 2005, Michael McLintock earned £45,000 from an external company. Other directors served as non-executive directors
on the Boards of companies in the educational and cultural sectors without receiving a fee for those services.
Remuneration report continued
For year ended 31 December 2005
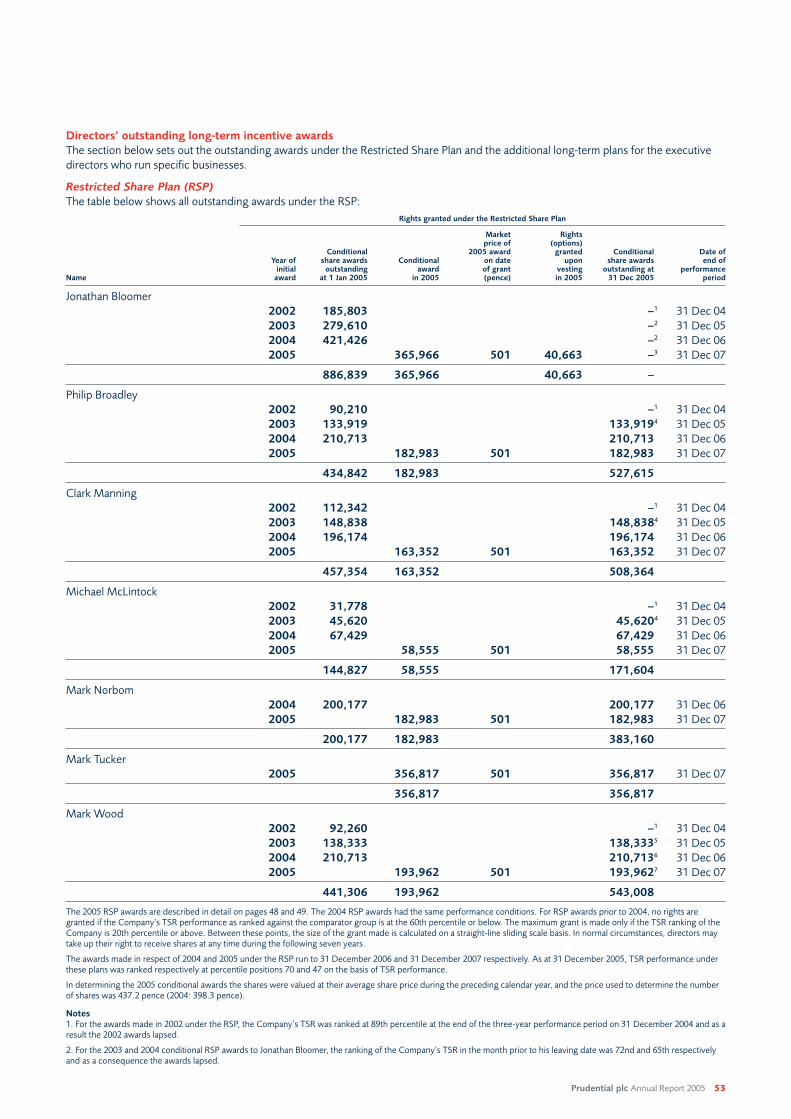
Prudential plc Annual Report 2005 53
Directors’ outstanding long-term incentive awards
The section below sets out the outstanding awards under the Restricted Share Plan and the additional long-term plans for the executive
directors who run specific businesses.
Restricted Share Plan (RSP)
The table below shows all outstanding awards under the RSP:
Rights granted under the Restricted Share Plan
Market Rightsprice of (options)
Conditional 2005 award granted Conditional Date ofYear of share awards Conditional on date upon share awards end of
initial outstanding award of grant vesting outstanding at performanceName award at 1 Jan 2005 in 2005 (pence) in 2005 31 Dec 2005 period
Jonathan Bloomer
2002 185,803 –1 31 Dec 04
2003 279,610 –2 31 Dec 05
2004 421,426 –2 31 Dec 06
2005 365,966 501 40,663 –3 31 Dec 07
886,839 365,966 40,663 –
Philip Broadley
2002 90,210 –1 31 Dec 04
2003 133,919 133,9194 31 Dec 05
2004 210,713 210,713 31 Dec 06
2005 182,983 501 182,983 31 Dec 07
434,842 182,983 527,615
Clark Manning
2002 112,342 –1 31 Dec 04
2003 148,838 148,8384 31 Dec 05
2004 196,174 196,174 31 Dec 06
2005 163,352 501 163,352 31 Dec 07
457,354 163,352 508,364
Michael McLintock
2002 31,778 –1 31 Dec 04
2003 45,620 45,6204 31 Dec 05
2004 67,429 67,429 31 Dec 06
2005 58,555 501 58,555 31 Dec 07
144,827 58,555 171,604
Mark Norbom
2004 200,177 200,177 31 Dec 06
2005 182,983 501 182,983 31 Dec 07
200,177 182,983 383,160
Mark Tucker
2005 356,817 501 356,817 31 Dec 07
356,817 356,817
Mark Wood
2002 92,260 –1 31 Dec 04
2003 138,333 138,3335 31 Dec 05
2004 210,713 210,7136 31 Dec 06
2005 193,962 501 193,9627 31 Dec 07
441,306 193,962 543,008
The 2005 RSP awards are described in detail on pages 48 and 49. The 2004 RSP awards had the same performance conditions. For RSP awards prior to 2004, no rights aregranted if the Company’s TSR performance as ranked against the comparator group is at the 60th percentile or below. The maximum grant is made only if the TSR ranking of theCompany is 20th percentile or above. Between these points, the size of the grant made is calculated on a straight-line sliding scale basis. In normal circumstances, directors maytake up their right to receive shares at any time during the following seven years.
The awards made in respect of 2004 and 2005 under the RSP run to 31 December 2006 and 31 December 2007 respectively. As at 31 December 2005, TSR performance underthese plans was ranked respectively at percentile positions 70 and 47 on the basis of TSR performance.
In determining the 2005 conditional awards the shares were valued at their average share price during the preceding calendar year, and the price used to determine the numberof shares was 437.2 pence (2004: 398.3 pence).
Notes1. For the awards made in 2002 under the RSP, the Company’s TSR was ranked at 89th percentile at the end of the three-year performance period on 31 December 2004 and as aresult the 2002 awards lapsed.
2. For the 2003 and 2004 conditional RSP awards to Jonathan Bloomer, the ranking of the Company’s TSR in the month prior to his leaving date was 72nd and 65th respectivelyand as a consequence the awards lapsed.

54 Prudential plc Annual Report 2005
Restricted Share Plan (RSP) continuedNotes continued3. For the 2005 conditional RSP award to Jonathan Bloomer, the ranking of the Company’s TSR in the month prior to his leaving date was 14th and as a result 11.11 per cent of hisaward was released. This percentage takes into account pro-rating for his service during the three-year performance period.
4. For the 2003 conditional RSP award the ranking of the Company’s TSR at the end of the three-year performance period ending on 31 December 2005 was 71st and as a resultno release will be made from this award.
5. For the 2003 conditional RSP award to Mark Wood, the ranking of the Company’s TSR in the month prior to his date of resignation of his directorship was 67th percentile andas a result no release will be made from this award.
6. For the 2004 conditional RSP award to Mark Wood, the ranking of the Company’s TSR in the month prior to his date of resignation of his directorship was 61st percentile andas a result no release will be made from this award.
7. For the 2005 conditional RSP award to Mark Wood, the ranking of the Company’s TSR in the month prior to his date of resignation of his directorship was 27th percentile andas a result, subject to non-competition and non-solicitation conditions, 27.5 per cent of his award will be released. This percentage takes into account pro-rating for his serviceduring the three-year performance period.
Rights that were exercised under the RSP during 2005 are shown in the following table.
Rights RSP rights Market priceRSP rights granted exercised RSP rights Exercise on date Earliest Latest
Year of outstanding at during during outstanding at Price paid price of exercise exercise exerciseright grant 1 Jan 2005 2005 2005 31 Dec 2005 for award (pence) (pence) date date
Jonathan Bloomer 2000 59,650 59,650 – – Nil 536.5 17 Mar 00 05 Nov 05
2001 40,474 40,474 – – Nil 536.5 02 Apr 01 05 Nov 05
2002 8,571 8,571 – – Nil 536.5 15 Mar 02 05 Nov 05
2005 40,663 40,663 – – Nil 536.5 06 May 05 05 Nov 05
108,695 40,663 149,358 –
Business-specific long-term incentive plans
Details of all outstanding awards under other long-term incentive plans up to and including 2005 are set out in the table below and
described on page 49. Except where stated, the performance period for all awards was three years.
Face value of Face value ofconditional conditional
awards Conditionally Payments awards Date ofoutstanding at awarded made outstanding at end of
Year of 1 Jan 2005 in 2005 in 2005 31 Dec 2005 performanceinitial awards £000 £000 £000 £000 period
Clark Manning Phantom JNL options 2001 660 83 – 31 Dec 04Phantom JNL shares 2001 330 372 – 31 Dec 04Business cash LTIP 2002 1,425 Nil – 31 Dec 04Business cash LTIP 2003 1,425 1,425 31 Dec 05Business cash LTIP 2004 1,425 1,425 31 Dec 06Business cash LTIP 2005 1,425 1,425 31 Dec 07
Michael McLintockPhantom M&G options 2000 184 184 31 Dec 02Phantom M&G options 2001 368 368 31 Dec 03Phantom M&G options 2002 368 368 31 Dec 04Phantom M&G shares 2002 225 524 – 31 Dec 04Phantom M&G options 2003 368 368 31 Dec 05Phantom M&G shares 2003 225 225 31 Dec 05Phantom M&G options 2004 368 368 31 Dec 06Phantom M&G shares 2004 225 225 31 Dec 06Phantom M&G options 2005 368 368 31 Dec 07Phantom M&G shares 2005 225 225 31 Dec 07
Mark NorbomBusiness cash LTIP 2004 713 713 31 Dec 06Business cash LTIP 2005 750 750 31 Dec 07
Mark WoodBusiness cash LTIP 2002 450 Nil – 31 Dec 04Business cash LTIP 2003 470 470 31 Dec 05Business cash LTIP 2004 500 500 31 Dec 06Business cash LTIP 2005 530 530 31 Dec 07
Total cash payments made in 2005 979
NotesClark ManningClark Manning’s 2001 cash long-term incentive plans had four-year performance periods respectively with payouts in both cases depending on JNL US GAAP net income in thefinal year. For the 2001 award the results led to payments of US$675,900 for the share element and US$151,800 for the option element. The face values of the awards for ClarkManning are converted at the average exchange rate for 2005 which was US$1.8192 = £1 (2004: US$1.8326 = £1). Upon joining the Board, Clark Manning also participated inthe 2002 JNL Chief Executive LTIP which has a performance period of three years. The performance conditions are the same as described in the business-specific long-termincentive plans section on page 49. The compound growth rate of the JNL appraisal value was below the threshold for a payment to be made in respect of the award. For the2003 Business cash LTIP the growth rate in appraisal value was 12.83 per cent and a payment of US$2,703,461 was made.
Remuneration report continued
For year ended 31 December 2005

Prudential plc Annual Report 2005 55
Michael McLintockMichael McLintock’s 2002 and 2003 cash long-term incentive plans had the same performance conditions as described for his business-specific long-term incentive plandescribed on page 49. For both awards, the phantom share price at the beginning of the performance period was £1. For the 2002 award the phantom share price at the end was £2.33. This resulted in a payment from the phantom share award of £524,250 and a phantom option award of 367,800 units. He did not exercise any of these options. For the 2003 award, the phantom share price at the end was £2.03. This resulted in a phantom share award of £456,750.
Mark NorbomMark Norbom’s 2004 and 2005 cash long-term incentive plans had the same performance conditions as described for his business-specific long-term incentive plan described on page 49.
Mark WoodMark Wood’s 2002 and 2003 cash long-term incentive plans had the same performance conditions as described for his business-specific long-term incentive plan described on page 49. For the 2002 award the compound growth rate of the UK appraisal value was below the threshold for a payment to be made in respect of the award.
Mark Wood resigned as a director effective 17 October 2005 and his employment with the Group terminated on 1 February 2006. Under the terms of the termination of hiscontract, payments will be made in 2006 from his 2003, 2004 and 2005 LTIP awards, taking into account performance and pro-rating for service during each respectiveperformance period. Subject to non-competition and non-solicitation conditions, these payments are respectively £235,000 by 31 March 2006, £180,556 on or before 31 July2006 and £103,056 on or before 31 December 2006.
Other share awards
The table below sets out the share awards that have been deferred from annual incentive plan payouts and awards to Mark Norbom
relating to his appointment. The values of the deferred share awards are included in the bonus and total figures in the directors’
remuneration table on page 52. The number of shares is calculated using the average share price over the three business days
commencing on the day of the announcement of the Group’s annual financial results for the relevant year. For the 2004 awards the
average share price was 492 pence.
Shares awarded
Market Marketprice at price at
Conditional Conditional Date of original date ofYear of share awards Conditionally Scrip Shares share awards end of Shares date of vesting
initial outstanding awarded dividends released in outstanding at restricted released Date of award or releasegrant at 1 Jan 2005 in 2005 accumulated 2005 31 Dec 2005 period in 2005 release (pence) (pence)
Philip Broadley
Deferred 2003 annual
incentive award 2004 6,033 196 – 6,229 31 Dec 06
Michael McLintock
Deferred 2003 annual
incentive award 2004 53,938 1,764 – 55,702 31 Dec 06
Deferred 2004 annual
incentive award1 2005 88,525 2,895 – 91,420 31 Dec 07
Mark Norbom
Awards under
appointment terms2 2004 15,339 15,339 – 1 Jan 05 15,339 2 Mar 05 439 486.25
2004 15,339 – 15,339 1 Jan 06
2004 89,353 – 89,353 1 Jan 07
2004 31,596 – 31,596 1 Jan 08
2004 15,339 – 15,339 1 Jan 09
2004 414,826 – 414,826 20 Feb 13
Deferred 2004 annual
incentive award1 2005 32,072 1,049 – 33,121 31 Dec 07
Mark Wood
Deferred 2004 annual
incentive award1,3 2005 34,258 1,120 – 35,378 31 Dec 07
Notes1. The value of the 2004 deferred share award from the annual incentive plan is included in the total 2004 figures in the directors’ remuneration table on page 52.
2. In order to secure the appointment of Mark Norbom, he has been awarded rights to Prudential plc shares, which vest as set out in the table. These awards will normally vestdependent on continuing employment at the date of vesting except for the element compensating for the loss of supplemental pension rights which vests on his leavingPrudential providing this is after 20 February 2013. If there is a change of control of Prudential or a sale of all or part of the Asian business, he may become entitled to retain anyunvested awards in accordance with the vesting schedules above. The equivalent of dividend distributions will be made from these awards during the restricted period and thecash dividend equivalents paid in 2005 from these awards are included in the directors’ remuneration table on page 52.
3. Mark Wood resigned as a director with effect from 17 October 2005 and as part of the terms of the termination of his employment, his deferred shares under the 2004 annualincentive plan will be released subject to non-competition and non-solicitation conditions. The award is expected to be released on or before 15 July 2006.

56 Prudential plc Annual Report 2005
Directors’ share options
Options outstanding under the Savings-Related Share Option (SAYE) Scheme are set out below. The Savings-Related Share Option
Scheme is open to all UK and certain overseas employees. Options under this scheme up to HM Revenue and Customs limits are granted
at a 20 per cent discount and cannot normally be exercised until a minimum of three years has elapsed. No payment has been made for
the grant of any options. The price to be paid for exercise of these options is shown in the table below. No variations to any outstanding
options have been made.Exercise
Market price (pence)price on Market Original adjusted
Year of Options exercise Options Options Options price at exercise for Rights Earliest Latestinitial outstanding Exercised date forfeit granted outstanding at 31 Dec 2005 price Issue on exercise exercisegrant at 1 Jan 2005 in 2005 (pence) in 2005 in 2005 31 Dec 2005 (pence) (pence) 11 Nov 2004 date date
Jonathan Bloomer 2000 2,357 2,357 – – 751 715 6 May 05 5 Nov 05
Philip Broadley 2000 2,716 2,716 550 364 346 1 Jun 07 30 Nov 07
Michael McLintock 2003 6,153 6,153 550 280 266 1 Jun 08 30 Nov 08
Mark Tucker 2005 – 2,297 2,297 550 407 – 1 Dec 08 31 May 09
Mark Wood 2001 2,974 2,974 550 648 617 1 Dec 08 31 May 09
Notes1. No gains were made by directors in 2005 on the exercise of share options (2004: £559,020).
2. The highest and lowest share prices during 2005 were 551.5 pence and 445 pence respectively.
Directors’ pensions and life assurance
It is the Company’s policy to offer executive directors the facility to save for retirement through efficient pension vehicles and UK
executive directors are offered a combination of HM Revenue and Customs approved pension schemes and supplementary provision.
Changes to UK pensions regulations take effect from April 2006 (A-Day). Executive directors will not be compensated for the effects of
any change in their taxation position as a result of these changes. The Company has reviewed its policy and for future executive director
appointments its policy will be a simple salary supplement for executive directors of 25 per cent of salary. This would include, where
relevant, any company contributions to the staff defined contribution pension plan, which directors would be eligible to join. For defined
benefit schemes, the policy will be to retain a notional scheme earnings cap, replicating the HM Revenue and Customs earnings cap,
which will no longer exist after A-Day. The effect of this will be to maintain the current policy for pension provision for executive directors
who are currently eligible for defined benefit arrangements.
The description below applies to both 2005 and 2006, with the exception that, after A-Day, where the HM Revenue and Customs
earnings cap is referred to, this will mean the notional scheme earnings cap and the Funded Unapproved Retirement Benefit Scheme
(FURBS) is being discontinued.
UK HM Revenue and Customs approved pension schemes
Executive directors employed in the UK are eligible to participate in HM Revenue and Customs approved pension schemes on the same basis
as other employees who joined at that time, providing benefits based on basic salary up to the HM Revenue and Customs earnings cap.
The schemes include defined benefit and defined contribution arrangements. Philip Broadley participates in a non-contributory scheme that
provides a pension of one-sixtieth of Final Pensionable Earnings for each year of service on retirement at age 60, as did Mark Wood. Michael
McLintock participates in a contributory scheme that provides a target pension of two-thirds of Final Pensionable Earnings on retirement at
age 60 for an employee with 30 years or more potential service, for which his contribution is four per cent of basic salary. Jonathan Bloomer
was only eligible to receive a lump sum death benefit of four times basic salary up to the earnings cap from the pension scheme.
On death in service a total sum from all these schemes of four times pensionable salary plus spouse’s and children’s pensions are payable.
No employees with employment offers after 30 June 2003 were eligible for membership of the defined benefit schemes.
Other supplementary arrangements
Sir David Clementi is provided with a salary supplement, part of which is a contribution to a personal pension, and life assurance of four
times his annual fees.
Mark Tucker is provided with a salary supplement only. Philip Broadley and Michael McLintock are entitled to supplements based on the
portion of their basic salary not covered for pension benefits under an HM Revenue and Customs approved scheme, as were Jonathan
Bloomer and Mark Wood. These supplements are paid directly to them, or to a FURBS established in their name up to A-Day. They are
provided with life assurance cover related to salary over the HM Revenue and Customs earnings cap. The cover is broadly equivalent to
the death in service benefits provided under the relevant UK HM Revenue and Customs approved pension scheme.
Clark Manning participates in a US tax-qualified defined contribution plan (a 401k plan). He is also provided with life assurance cover of
two times basic salary.
Remuneration report continued
For year ended 31 December 2005

Prudential plc Annual Report 2005 57
Mark Norbom is provided with a salary supplement for pension purposes, and life assurance provision of four times his basic salary.
From 1 January 2006, Nick Prettejohn is provided with pension benefits the same as those described above in the policy to apply after
A-Day.
Details of directors’ pension entitlements under HM Revenue and Customs approved defined benefit schemes and the pre-tax amount of
any salary supplements and contributions to FURBS or other pension arrangements paid by the Company are set out below:
Additionalpension
earned duringyear ended
31 Dec 2005
AllowingIgnoring forinflation inflation Transfer value of Amount of Pre-tax salary
on on accrued benefit (B-A) less supplements and pension pension at 31 Dec4 contributions contributions
Years of Accrued earned to earned to made by to FURBS orpensionable benefit at 31 Dec 31 Dec 2005 2004 directors other pension
Age at service at 31 Dec 2005 20042 20043 B A during 2005 arrangements5
31 Dec 2005 31 Dec 20051 £000 £000 £000 £000 £000 £000 £000
Sir David Clementi 56 – – – – – – – 126
Jonathan Bloomer 51 – – – – – – – 113
Philip Broadley 44 5 10 2 2 82 61 21 126
Clark Manning 47 – – – – – – – 14
Michael McLintock 44 13 31 3 3 336 265 58 78
Mark Norbom 47 – – – – – – – 155
Mark Tucker 48 – – – – – – – 127
Mark Wood 52 4 8 2 2 96 65 31 182
Notes1. Or date of leaving if earlier.
2. As required by Stock Exchange Listing rules.
3. As required by the Companies Act remuneration regulations.
4. The transfer value equivalent has been calculated in accordance with Actuarial Guidance Note GN11.
5. As described under Other Supplementary Arrangements.
No enhancements to the retirement benefits paid to or receivable by directors or former directors other than the discretionary pension
increases awarded to all pensioners have been made during the year.
Total contributions to directors’ pension arrangements were £1,111,602 (2004: £1,124,000) of which £361,145 (2004: £353,000) related
to money purchase schemes.
Signed on behalf of the Board of directors
Roberto Mendoza Sir David Clementi
Chairman of the Remuneration Committee Chairman

58 Prudential plc Annual Report 2005
The Directors’ Report of Prudential plc for the year ended
31 December 2005 comprises these pages and the sections
of the Annual Report referred to in these pages.
Principal activity and business review
Prudential plc is the Group holding company and the principal
activity of its subsidiary undertakings is the provision of financial
services in the UK, the US and Asia. Particulars of principal
subsidiary undertakings are given in note I6 on page 181. The
Group’s businesses and likely future developments are reviewed
in the Chairman’s statement on pages 2 and 3, the Group Chief
Executive’s review on pages 4 to 7, the business review on pages 8
to 15 and the financial review on pages 16 to 33, which contain
details of the development of the businesses of the Group during
the financial year and of the Group’s position at the end of it.
Important events affecting the Company after the end of the
financial year are detailed in note I8 on page 185.
Financial statements and supplementary information
The consolidated income statement is shown on page 62 and the
consolidated balance sheet on pages 65 and 66 shows the state of
affairs of the Group at 31 December 2005. The Company’s balance
sheet appears on page 186. Information prepared on the European
Embedded Value basis of financial reporting is provided on pages
204 to 229. A summary of the results is shown on page 60.
Changes in the Company’s share capital during 2005 are given in
note H11 on pages 159 and 160.
Dividends
The directors recommend that the shareholders declare a final
dividend for 2005 of 11.02 pence per share payable on 26 May
2006 to shareholders on the register at the close of business on
24 March 2006. The interim dividend for 2005 was 5.3 pence
per share. The total dividend for the year, including the interim
dividend and the recommended final dividend, amounts to
16.32 pence per share compared with 15.84 pence per share
for 2004. The total cost of dividends in respect of 2005 was
£393 million.
Financial instruments
The Group is exposed to financial risk through its financial assets,
financial liabilities, and policyholder liabilities. The financial risk
factors affecting the Group include market risk, foreign exchange
risk, credit risk and liquidity risk. Information on the financial risk
management objectives and policies of the Group and the
exposure of the Group to the financial risk factors is given in
Section C on pages 100 to 102.
Further information on the use of derivatives and hedge
accounting by the Group is also provided in notes D3 and G3
on pages 115 and 145 respectively.
Payment policy
It is the policy of the Group to agree terms of payment when
orders for goods and services are placed and to pay in accordance
with those terms. Trade creditor days, based on the ratio of
amounts which were owed to trade creditors at the year-end to the
aggregate of the amounts invoiced by trade creditors during the
year, were 22 days.
Directors
A list of the present directors is set out on pages 36 and 37.
Keki Dadiseth, Mark Tucker and Nick Prettejohn were appointed
as directors on 1 April 2005, 6 May 2005 and 1 January 2006
respectively. In accordance with the Articles of Association,
Mark Tucker and Nick Prettejohn will retire and offer themselves
for election at the Annual General Meeting on 18 May 2006.
Jonathan Bloomer and Mark Wood resigned as directors of the
Company on 5 May 2005 and 17 October 2005 respectively.
Sir David Clementi, Michael McLintock, Mark Norbom and
Kathleen O’Donovan will retire by rotation at the Annual General
Meeting and offer themselves for re-election. Details of each
director’s interests in shares and debentures of the Company and
its subsidiary, Egg plc, which was listed until 20 February 2006,
are set out in the remuneration report on page 51. Protections
afforded to directors, including qualifying third party indemnities
under the provisions of the Companies Act 1985, are detailed in
the remuneration report on page 50.
Employees
The following information is given principally in respect of
employees of the Group in the UK. The policy towards employees
overseas is the same but the practical application of the policy
varies according to local requirements.
Equal opportunity
Prudential recognises, respects and values difference and diversity.
Its equal opportunities policy is to be fair, responsible and caring
in all aspects of the business. The Group seeks to ensure all
employees and applicants to its businesses are given equal
opportunity in all aspects of employment to ensure that the
Group’s businesses attract, retain and promote the best available
talent. All the businesses work to embed these principles in all
aspects of their management practices and to ensure that this is
evident to employees in their day-to-day work.
It is Group policy to give full and fair consideration and
encouragement to the employment of applicants with suitable
aptitudes and abilities, and to continuing the employment of staff
who become disabled, and to providing training and career
development opportunities to disabled employees.
Employee involvement
The Group has effective communication channels through which
employees’ views can be sought on issues which concern them.
Throughout the Group there is close consultation between
management and other employees on appropriate matters of
concern, with a view to keeping employees informed about the
progress of the Group’s business and the economic factors
affecting it. Communication with employees is achieved in a
number of ways, including one-to-one staff briefings and through
the Group’s intranet site. Prudential’s European Employee Forum
provides an opportunity for elected employee representatives to
consult with senior management on strategic European business
issues. M&G’s Staff Consultative Committee and UK Insurance
Operations’ Employee Forum promote communication and
consultation throughout their respective businesses and provide
for dialogue on a range of issues of interest to their staff.
Directors’ report

Prudential plc Annual Report 2005 59
During 2005, further improvements were made to staff consultative
arrangements following a review by all Prudential UK based
operations started in 2004. This review was given impetus by the
UK legislation on Information and Consultation and was conducted
with a view to improving the effectiveness of arrangements,
consulting trade unions and other staff groups as appropriate.
In 2005 employees were again invited to participate in the
Prudential Savings-Related Share Option Scheme. The Scheme has
now been operating for 22 years and 60 per cent of UK staff
currently participate. The Prudential International Savings-Related
Share Option Scheme (ISSOS) for employees has been operating
since 2000 in Hong Kong, Malaysia and Singapore; since 2001 in
Taiwan and India; and since 2003 in Korea. On average 13 per cent
of employees in those countries covered by the ISSOS currently
participate. In addition, since 2002 Prudential has operated the
International Savings-Related Share Option Scheme for Non-
Employees (ISSOSNE) for its agents in Hong Kong. Currently
eight per cent of agents participate.
Following shareholder agreement in 2000 to authorise the Board
to introduce a Share Incentive Plan, The Prudential UK Share
Incentive Plan (SIP) was introduced in 2004 for employees of
Prudential UK Services Limited and The Prudential Assurance
Company Limited, and in 2005 for employees of Prudential
Services Limited. This plan enables employees to buy Prudential
shares on a tax-efficient basis. For every four Partnership shares
bought, an additional Matching share is granted. Currently 29 per
cent of eligible staff participate.
The trustees of each of the Group’s UK pension schemes include
elected individuals.
Donations
Prudential is committed to supporting the communities where
it is an employer. In 2005 the Group spent £4.7 million in support
of the community. Within this, direct donations to charitable
organisations amounted to £3.5 million, of which £2.3 million came
from European Union (EU) operations. This is broken down as
follows: Education £1,068,000; Social and Welfare £1,039,000;
Environment and Regeneration £91,000; Cultural £84,000 and
Staff Volunteering £56,000. The aggregate figure for charitable
donations from Prudential’s non-EU subsidiaries (Jackson National
Life and Prudential Corporation Asia) amounted to £1.2 million.
It is the Group’s policy not to make donations to political parties
or to incur political expenditure, within the meaning of those
expressions as defined in the Political Parties, Elections and
Referendums Act 2000, and the Group did not make any such
donations or incur any such expenditure in 2005.
Annual General Meeting
The Company’s Annual General Meeting will be held on 18 May
2006 at The Auditorium, The Mermaid Conference Centre,
Puddle Dock, Blackfriars, London EC4V 3DB at 11.00am.
Auditor
A resolution for the re-appointment of KPMG Audit Plc as auditor
of the Company until the end of the 2007 Annual General Meeting
will be put to the Annual General Meeting on 18 May 2006.
Authority to purchase own shares
At the Annual General Meeting in 2005, the shareholders granted
authority to the directors for the purchase by the Company of its
own shares in accordance with the relevant provisions of the
Companies Act 1985. This authority will expire at the end of the
Annual General Meeting to be held in 2006 or 18 months from the
date granted, whichever is earlier.
Shareholders
The number of accounts on the share register at 31 December
2005 was 60,942 (2004: 69,632). Further information about
shareholdings in the Company is given on page 231. As at 15 March
2006 the Company had received notification in accordance with
Sections 198 to 208 of the Companies Act 1985 from Legal &
General Investment Management Limited, Barclays PLC and
Fidelity Investments of holdings of 4.02 per cent, 3.10 per cent and
3.13 per cent respectively of the Company’s ordinary share capital.
On behalf of the Board of directors
Peter Maynard
Company Secretary
15 March 2006
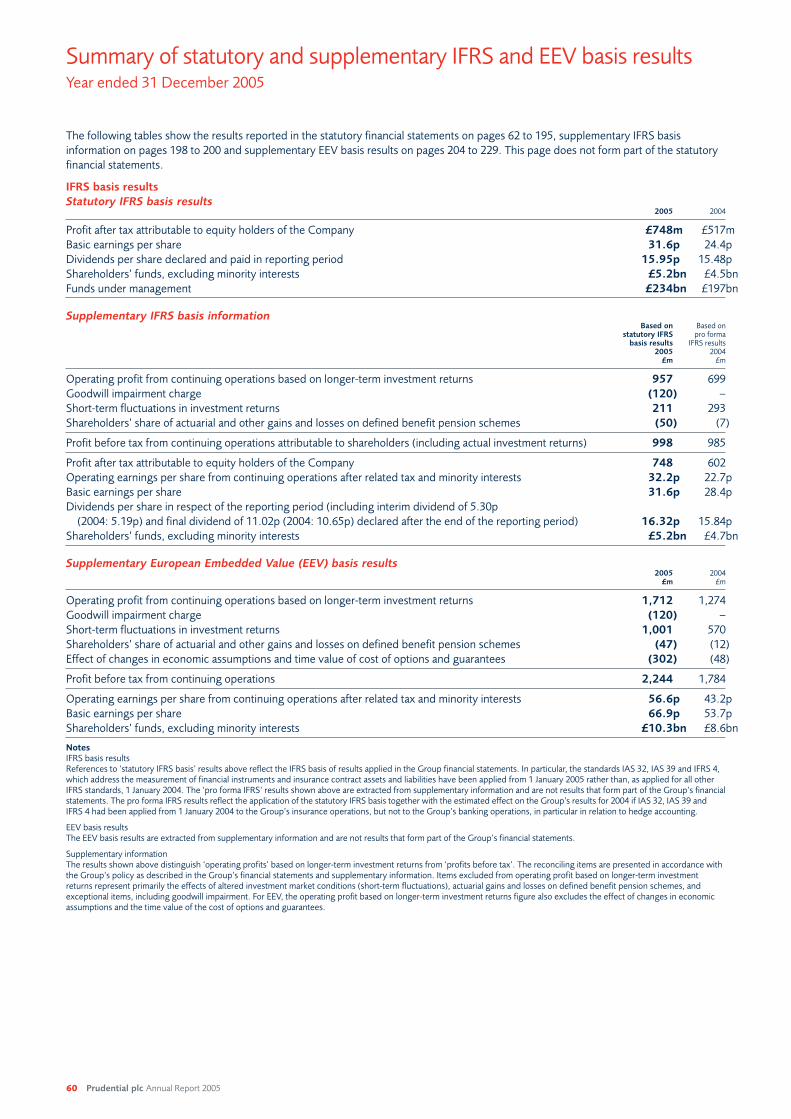
60 Prudential plc Annual Report 2005
The following tables show the results reported in the statutory financial statements on pages 62 to 195, supplementary IFRS basis
information on pages 198 to 200 and supplementary EEV basis results on pages 204 to 229. This page does not form part of the statutory
financial statements.
IFRS basis results
Statutory IFRS basis results2005 2004
Profit after tax attributable to equity holders of the Company £748m £517m
Basic earnings per share 31.6p 24.4p
Dividends per share declared and paid in reporting period 15.95p 15.48p
Shareholders’ funds, excluding minority interests £5.2bn £4.5bn
Funds under management £234bn £197bn
Supplementary IFRS basis informationBased on Based on
statutory IFRS pro formabasis results IFRS results
2005 2004£m £m
Operating profit from continuing operations based on longer-term investment returns 957 699
Goodwill impairment charge (120) –
Short-term fluctuations in investment returns 211 293
Shareholders’ share of actuarial and other gains and losses on defined benefit pension schemes (50) (7)
Profit before tax from continuing operations attributable to shareholders (including actual investment returns) 998 985
Profit after tax attributable to equity holders of the Company 748 602
Operating earnings per share from continuing operations after related tax and minority interests 32.2p 22.7p
Basic earnings per share 31.6p 28.4p
Dividends per share in respect of the reporting period (including interim dividend of 5.30p
(2004: 5.19p) and final dividend of 11.02p (2004: 10.65p) declared after the end of the reporting period) 16.32p 15.84p
Shareholders’ funds, excluding minority interests £5.2bn £4.7bn
Supplementary European Embedded Value (EEV) basis results2005 2004
£m £m
Operating profit from continuing operations based on longer-term investment returns 1,712 1,274
Goodwill impairment charge (120) –
Short-term fluctuations in investment returns 1,001 570
Shareholders’ share of actuarial and other gains and losses on defined benefit pension schemes (47) (12)
Effect of changes in economic assumptions and time value of cost of options and guarantees (302) (48)
Profit before tax from continuing operations 2,244 1,784
Operating earnings per share from continuing operations after related tax and minority interests 56.6p 43.2p
Basic earnings per share 66.9p 53.7p
Shareholders’ funds, excluding minority interests £10.3bn £8.6bn
NotesIFRS basis resultsReferences to ‘statutory IFRS basis’ results above reflect the IFRS basis of results applied in the Group financial statements. In particular, the standards IAS 32, IAS 39 and IFRS 4,which address the measurement of financial instruments and insurance contract assets and liabilities have been applied from 1 January 2005 rather than, as applied for all otherIFRS standards, 1 January 2004. The ‘pro forma IFRS’ results shown above are extracted from supplementary information and are not results that form part of the Group’s financialstatements. The pro forma IFRS results reflect the application of the statutory IFRS basis together with the estimated effect on the Group’s results for 2004 if IAS 32, IAS 39 and IFRS 4 had been applied from 1 January 2004 to the Group’s insurance operations, but not to the Group’s banking operations, in particular in relation to hedge accounting.
EEV basis resultsThe EEV basis results are extracted from supplementary information and are not results that form part of the Group’s financial statements.
Supplementary informationThe results shown above distinguish ‘operating profits’ based on longer-term investment returns from ‘profits before tax’. The reconciling items are presented in accordance withthe Group’s policy as described in the Group’s financial statements and supplementary information. Items excluded from operating profit based on longer-term investmentreturns represent primarily the effects of altered investment market conditions (short-term fluctuations), actuarial gains and losses on defined benefit pension schemes, andexceptional items, including goodwill impairment. For EEV, the operating profit based on longer-term investment returns figure also excludes the effect of changes in economicassumptions and the time value of the cost of options and guarantees.
Summary of statutory and supplementary IFRS and EEV basis resultsYear ended 31 December 2005

Prudential plc Annual Report 2005 61
Primary statements
Consolidated income statement
Statement of changes in equity
Consolidated balance sheet
Consolidated cash flow statement
Notes on the Group financial statementsNote
Section A: Background and adoption of International
Financial Reporting Standards (IFRS)
Nature of operations A1
Basis of preparation A2
Critical accounting policies, estimates and judgements A3
Significant accounting policies A4
Changes from previous accounting basis and reconciliation
to previously published 2004 results on first-time adoption
of IFRS A5
Changes of accounting policy in 2005 A6
New accounting pronouncements A7
Section B: Summary of results
Supplementary analysis of profit before tax attributable
to shareholders B1
Earnings per share B2
Dividends B3
New business B4
Group balance sheet B5
Section C: Group risk management C
Section D: Life assurance business
Group overview D1
UK insurance operations D2
US operations D3
Asian operations D4
Capital position statement for life assurance businesses D5
Section E: Banking operations
Income statement for banking operations E1
Balance sheet for banking operations E2
Risk management overview E3
Maturities of assets and liabilities and liquidity risk E4
Losses on loans and advances E5
Market risk E6
Credit risk E7
Section F: Income statement notes
Segmental information F1
Revenue F2
Acquisition costs and other operating expenditure F3
Finance costs: interest on core structural borrowings of
shareholder-financed operations F4
Tax F5
Discontinued operations F6
Note
Section G: Financial assets and liabilities
Financial instruments – designation and fair values G1
Market risk G2
Derivatives and hedging G3
Derecognition, securitisation and collateral G4
Impairment of financial assets G5
Section H: Other information on balance sheet items
Goodwill H1
Other intangible assets H2
Reinsurers’ share of policyholder liabilities H3
Tax assets and liabilities H4
Accrued investment income and other debtors H5
Property, plant and equipment H6
Investment properties H7
Investments in participating interests H8
Assets and liabilities held for sale H9
Cash and cash equivalents H10
Shareholders’ equity: share capital, share premium
and reserves H11
Insurance contract liabilities and unallocated surplus
of with-profits funds H12
Borrowings H13
Provisions and contingencies H14
Other liabilities H15
Section I: Other notes
Staff and pension plans I1
Share-based payments I2
Key management remuneration I3
Fees payable to auditors I4
Related party transactions I5
Subsidiary undertakings I6
Commitments I7
Post-balance sheet events I8
Foreign exchange translation I9
Cash flows I10
Group financial statements

62 Prudential plc Annual Report 2005
2005 2004Note £m £m
Gross premiums earned 15,225 16,408
Outward reinsurance premiums (197) (256)
Earned premiums, net of reinsurance F2 15,028 16,152
Investment income F2 24,013 15,750
Other income F2 2,084 2,002
Total revenue, net of reinsurance F2 41,125 33,904
Benefits and claims and movement in unallocated surplus of with-profits funds (33,100) (26,593)
Acquisition costs and other operating expenditure F3 (5,552) (5,563)
Finance costs: interest on core structural borrowings of shareholder-financed operations F4 (208) (187)
Goodwill impairment charge H1 (120) –
Total charges (38,980) (32,343)
Profit before tax* 2,145 1,561
Tax attributable to policyholders’ returns (1,147) (711)
Profit before tax attributable to shareholders 998 850
Tax expense F5 (1,388) (951)
Less: tax attributable to policyholders’ returns 1,147 711
Tax attributable to shareholders’ profits F5 (241) (240)
Profit from continuing operations after tax 757 610
Discontinued operations (net of tax) F6 3 (94)
Profit for the year 760 516
Attributable to:
Equity holders of the Company 748 517
Minority interests 12 (1)
Profit for the year 760 516
Earnings per share
Basic (based on 2,365m and 2,121m shares respectively):
Based on profit from continuing operations attributable to the equity holders of the Company 31.5p 27.5p
Based on profit (loss) from discontinued operations attributable to the equity holders of the Company 0.1p (3.1)p
31.6p 24.4p
Diluted (based on 2,369m and 2,124m shares respectively):
Based on profit from continuing operations attributable to the equity holders of the Company 31.5p 27.5p
Based on profit (loss) from discontinued operations attributable to the equity holders of the Company 0.1p (3.1)p
31.6p 24.4p
*Profit before tax represents income net of post-tax transfers to unallocated surplus of with-profits funds, before tax attributable to policyholders and unallocated surplus of with-profits funds, unit-linked policies and shareholders’ profits.
Consolidated income statementYear ended 31 December 2005

Prudential plc Annual Report 2005 63
2005
Available-for-sale
Share Share Retained Translation securities Hedging Shareholders’ Minority Totalcapital premium earnings reserve reserve reserve equity interests equity
Note £m £m £m £m £m £m £m £m £m
Reserves
Profit for the year 748 748 12 760
Items recognised directly in equity:
Exchange movements 268 268 268
Movement on cash flow hedges (4) (4) 1 (3)
Unrealised valuation movements
on securities classified as
available-for-sale from
1 January 2005:
Unrealised holding losses arising
during the year (773) (773) (773)
Less reclassification adjustment
for losses included in the
income statement 22 22 22
Unrealised investment losses, net (751) (751) (751)
Related change in amortisation
of deferred income and
acquisition costs 307 307 307
Related tax 65 152 1 218 218
Total items recognised directly in equity 333 (292) (3) 38 1 39
Total income and expense for the year 748 333 (292) (3) 786 13 799
Cumulative effect of changes in
accounting policies on adoption
of IAS 32, IAS 39 and IFRS 4,
net of applicable taxes at
1 January 2005 A6 2 (173) 397 226 (3) 223
Dividends B3 (380) (380) (380)
Reserve movements in respect
of share-based payments 15 15 (1) 14
Change in minority interests arising
principally from purchase and
sale of venture investment
companies and property
partnerships of the PAC
with-profits fund 26 26
Share capital and share premium
New share capital subscribed H11 0 55 55 55
Transfer to retained earnings in
respect of shares issued in
lieu of cash dividends H11 (51) 51 0 0
Treasury shares
Movement in own shares in
respect of share-based
payment plans 0 0 0
Movement on Prudential plc
shares purchased by unit
trusts consolidated under IFRS 3 3 3
Net increase in equity 6 264 333 105 (3) 705 35 740
At beginning of year:
As previously reported under
UK GAAP 119 1,558 2,604 4,281 71 4,352
Changes arising from adoption
of IFRS A5 368 (160) 208 66 274
As restated under IFRS A5 119 1,558 2,972 (160) 4,489 137 4,626
At end of year 119 1,564 3,236 173 105 (3) 5,194 172 5,366
Statement of changes in equityYear ended 31 December 2005

64 Prudential plc Annual Report 2005
2004
Share Share Retained Translation Shareholders’ Minority Totalcapital premium earnings reserve equity interests equity
Note £m £m £m £m £m £m £m
Reserves
Profit for the year 517 517 (1) 516
Items recognised directly in equity:
Exchange movements (172) (172) (172)
Related tax 12 12 12
Total items recognised directly in equity (160) (160) (160)
Total income and expense for the year 517 (160) 357 (1) 356
Dividends B3 (323) (323) (323)
Reserve movements in respect of share-based payments 10 10 10
Change in minority interests arising principally from
purchase and sale of venture investment companies
and property partnerships of the PAC with-profits fund 1 1
Share capital and share premium
Proceeds from Rights Issue, net of expenses H11 17 1,004 1,021 1,021
Other new share capital subscribed H11 2 117 119 119
Transfer to retained earnings in respect of shares
issued in lieu of cash dividends H11 (116) 116 0 0
Treasury shares
Movement in own shares in respect of share-based
payment plans (2) (2) (2)
Movement on Prudential plc shares purchased by
unit trusts consolidated under IFRS 14 14 14
Net increase in equity 19 1,005 332 (160) 1,196 0 1,196
At beginning of year:
As previously reported under UK GAAP 100 553 2,587 3,240 107 3,347
Changes arising from adoption of IFRS A5 53 53 30 83
As restated under IFRS A5 100 553 2,640 3,293 137 3,430
At end of year 119 1,558 2,972 (160) 4,489 137 4,626
Statement of changes in equity continued
Year ended 31 December 2005

Prudential plc Annual Report 2005 65
Assets2005 2004
Note £m £m
Goodwill:
Attributable to PAC with-profits fund 607 784
Attributable to shareholders 1,341 1,461
Total H1 1,948 2,245
Other intangible assets:
PAC with-profits fund 35 798
Other operations 2,405 2,244
Total H2 2,440 3,042
Other non-investment and non-cash assets:
Property, plant and equipment H6 910 967
Reinsurers’ share of policyholder liabilities H3 1,278 1,018
Deferred tax assets H4 755 827
Current tax recoverable H4 231 159
Accrued investment income G1, H5 1,791 1,733
Other debtors G1, H5 1,318 1,188
Total 6,283 5,892
Investments of long-term business, banking and other operations:
Investment properties H7 13,180 13,303
Investments accounted for using the equity method H8 5 5
Financial investments: G1
Loans and receivables 13,245 12,430
Equity securities and portfolio holdings in unit trusts 71,985 54,466
Debt securities 82,471 76,374
Other investments 3,879 2,537
Deposits 7,627 5,271
Total investments 192,392 164,386
Held for sale assets H9 728 100
Cash and cash equivalents H10 3,586 4,341
Total assets B5 207,377 180,006
Consolidated balance sheet31 December 2005

66 Prudential plc Annual Report 2005
Equity and liabilities2005 2004
Note £m £m
Equity
Shareholders’ equity H11 5,194 4,489
Minority interests 172 137
Total equity 5,366 4,626
Liabilities
Banking customer accounts G1 5,830 6,607
Policyholder liabilities and unallocated surplus of with-profits funds:*
Insurance contract liabilities H12 120,436
Investment contract liabilities with discretionary participation features G1 26,523
Investment contract liabilities without discretionary participation features G1 12,026
Technical provisions in respect of non-linked business 104,996
Technical provisions for linked liabilities 24,066
Unallocated surplus of with-profits funds:
Reflecting application of ‘realistic’ basis provisions for UK regulated with-profits funds H12 11,357
Reflecting previous UK GAAP basis of provisioning 16,149
Total policyholder liabilities and unallocated surplus of with-profits funds 170,342 145,211
Core structural borrowings of shareholder-financed operations:
Subordinated debt (other than Egg) H13 1,646 1,429
Other H13 1,093 1,368
2,739 2,797
Egg subordinated debt H13 452 451
Total G1, H13 3,191 3,248
Other borrowings:
Operational borrowings attributable to shareholder-financed operations G1, H13 6,432 6,421
Borrowings attributable to with-profits funds G1, H13 1,898 2,137
Other non-insurance liabilities:
Obligations under funding, securities lending and sale and repurchase agreements G1 4,529 3,819
Net asset value attributable to unit holders of consolidated unit trusts and similar funds G1 965 808
Current tax liabilities H4 962 1,018
Deferred tax liabilities H4 2,991 2,279
Accruals and deferred income G1 506 655
Other creditors G1 1,478 996
Provisions H14 972 1,006
Other liabilities G1, H15 1,769 1,175
Held for sale liabilities H9 146 –
Total 14,318 11,756
Total liabilities B5 202,011 175,380
Total equity and liabilities 207,377 180,006
*The presentation of insurance and investment contract liabilities to policyholders reflects the adoption of IAS 32, IAS 39 and IFRS 4 at 1 January 2005. The comparative liabilitiesfor 2004 reflect the previous UK GAAP basis.
The consolidated financial statements on pages 62 to 195 were approved by the Board of Directors on 15 March 2006.
Sir David Clementi Mark Tucker
Chairman Group Chief Executive
Philip Broadley
Group Finance Director
Consolidated balance sheet continued
31 December 2005

Prudential plc Annual Report 2005 67
2005 2004Note £m £m
Cash flows from operating activities
Profit before tax* 2,145 1,561
Changes in operating assets and liabilities:
Investments (21,462) (14,741)
Banking customer accounts (861) (330)
Other non-investment and non-cash assets (970) (105)
Policyholder liabilities (including unallocated surplus) 21,126 13,639
Other liabilities (including operational borrowings) 180 1,061
Interest income and expense and dividend income included in profit before tax (8,410) (7,371)
Other non-cash items 0 73
Operating cash items:
Interest receipts 5,946 5,660
Dividend receipts 2,680 1,853
Tax paid (573) (450)
Net cash flows from operating activities (199) 850
Cash flows from investing activities
Purchases of property, plant and equipment H6 (160) (227)
Proceeds from disposal of property, plant and equipment 6 4
Acquisition of subsidiaries, net of cash balances I6 (68) (92)
Disposal of subsidiaries, net of cash balances I6 252 218
Net cash flows from investing activities 30 (97)
Cash flows from financing activities
Structural borrowings of the Group: I10
Shareholder-financed operations:
Issue 168 344
Redemption (308) (61)
Interest paid (204) (189)
With-profits operations:
Interest paid (9) (9)
Equity capital:
Issues of ordinary share capital H11 55 1,140
Dividends paid B3 (380) (323)
Net cash flows from financing activities (678) 902
Net (decrease) increase in cash and cash equivalents (847) 1,655
Cash and cash equivalents at beginning of year 4,341 2,756
Effect of exchange rate changes on cash and cash equivalents 92 (70)
Cash and cash equivalents at end of year H10 3,586 4,341
*Profit before tax represents income net of post-tax transfers to unallocated surplus of with-profits funds, before tax attributable to policyholders and unallocated surplus of with-profits funds, unit-linked policies and shareholders’ profits. It does not represent profit before tax attributable to shareholders.
Consolidated cash flow statementYear ended 31 December 2005

68 Prudential plc Annual Report 2005
A: Background and adoption of International Financial Reporting Standards (IFRS)
A1: Nature of operationsPrudential plc (the Company) together with its subsidiaries (collectively, the Group or Prudential) is an international financial services
group with its principal operations in the UK, the US and Asia. The Group operates in the UK through its subsidiaries, primarily The
Prudential Assurance Company Limited (PAC), Prudential Annuities Limited (PAL), Prudential Retirement Income Limited (PRIL), M&G
Group Limited and Egg plc. In the US, the Group’s principal subsidiary is Jackson National Life Insurance Company (JNL). The Group also
has operations in Hong Kong, Malaysia, Singapore, Taiwan and other Asian countries. Prudential offers a wide range of retail financial
products and services and fund management services throughout these territories. The retail financial products and services principally
include life insurance, pensions and annuities as well as collective investments and deposit and mortgage banking services.
Long-term business products written in the UK and Asia are principally with-profits deposit administration, other conventional and
unitised with-profits policies and non-participating pension annuities in the course of payment. Long-term business also includes linked
business written in the UK and Asia. The principal products written by JNL are interest-sensitive deferred annuities and whole-life policies,
variable annuities, guaranteed investment contracts, fixed index deferred annuities and term life insurance.
Prudential plc is a public limited company incorporated and registered in England and Wales. The registered office is:
Laurence Pountney Hill
London
EC4R 0HH
Registered number: 1397169
A2: Basis of preparationThe consolidated financial statements consolidate the Group and the Group’s interest in associates and jointly controlled entities.
The parent company financial statements present information about the Company as a separate entity and not about the Group.
The consolidated financial statements have been prepared and approved by the directors in accordance with International Financial
Reporting Standards (IFRS) as adopted by the European Union (EU). The Company has elected to prepare its parent company financial
statements in accordance with UK Generally Accepted Accounting Principles (GAAP). These are presented on pages 186 to 195.
The Group has applied all IFRS and interpretations adopted by the EU at 31 December 2005, and has early adopted the amendment to
IAS 39, ‘The Fair Value Option’ and IAS 19, ‘Employee Benefits’ (as amended in 2004).
The accounting policies set out below have, unless otherwise stated, been applied consistently to all periods presented in these Group
financial statements and in preparing an opening IFRS balance sheet at 1 January 2004 for the purposes of the transition to IFRS. The
principal exception is that, as more fully explained below, financial instruments and insurance accounting is determined on different
bases in 2005 and 2004 due to the basis of application of the transitional provisions of IFRS 1, ‘First-time Adoption of International
Financial Reporting Standards’ in relation to the standards IAS 32, IAS 39 and IFRS 4.
A3: Critical accounting policies, estimates and judgements(a) Critical accounting policies
Adoption of IAS 32, IAS 39 and IFRS 4
Three standards, IAS 32, ‘Financial Instruments: Disclosure and Presentation’, IAS 39, ‘Financial Instruments: Recognition and
Measurement’ and IFRS 4, ‘Insurance Contracts’, have been adopted as at 1 January 2005 rather than 1 January 2004. This treatment
is consistent with the policy typically applied by groups with banking operations where the practical consequences of adopting these
standards for 2004 are significant.
Accordingly, the amounts recorded for revenue and expenses and assets and liabilities of certain items reflected in the Group’s financial
statements are not on a consistent basis in 2005 compared to amounts recorded for the comparative period. The main area where
this inconsistency applies is valuation and accounting presentation of fair value movements of derivatives and debt securities of JNL
(as described below). In addition, the measurement of assets and liabilities and income and expenses of those UK unit-linked contracts,
and those with similar features, that do not contain significant insurance risk, is altered.
The Group has chosen to report separately pro forma results, as supplementary information that does not form part of the Group financial
statements, that show the 2004 results attributable to shareholders as if the Group had applied these standards to its insurance operations
from 1 January 2004. The pro forma results are shown on pages 198 to 200.
Insurance contract accounting
With the exception of contracts described in note D1, the Group’s life assurance contracts are classified as insurance contracts and
investment contracts with discretionary participating features. As permitted by IFRS 4, assets and liabilities of these contracts (see below)
are accounted for under previously applied GAAP. Accordingly, except as described below, the modified statutory basis (MSB) of
reporting as set out in the revised Statement of Recommended Practice (SORP) issued by the Association of British Insurers (ABI) in
November 2003 has been applied for the 2005 results.
In the UK, for the 2004 comparative results, with the exception of minor accounting adjustments, the technical provisions reflect the
UK regulatory basis of reporting that has applied previously for many years. This effectively constitutes the Peak 1 basis under the current
Financial Services Authority (FSA) regime.
Notes on the Group financial statements

Prudential plc Annual Report 2005 69
A3: Critical accounting policies, estimates and judgements continuedFrom 1 January 2005 the Group has chosen to improve its accounting for UK regulated with-profits funds by the voluntary application
of the UK accounting standard FRS 27, ‘Life Assurance’. Under this standard, the main accounting changes that are required for UK
with-profits funds are:
■ Derecognition of deferred acquisition costs and related deferred tax; and
■ replacement of MSB liabilities with adjusted realistic basis liabilities.
The primary effect of these changes is to fundamentally alter the basis of accounting and carrying value of deferred acquisition costs
(as set out in note H2) and the reported level of unallocated surplus of with-profits funds (as set out in note H12).
Under UK GAAP, the fund for future appropriations (FFA) represents the excess of assets over policyholder liabilities for the Group’s
with-profit funds. Under IFRS the FFA is termed unallocated surplus and the Group has opted to account for it wholly as a liability with
no allocation to equity. This treatment reflects the fact that shareholders’ participation in the cost of bonuses arises only on distribution.
As a consequence of this accounting treatment, shareholder profits on with-profits business continue to reflect the one-ninth cost of
declared bonus previously applied under UK GAAP.
For JNL, applying the MSB as applicable to overseas operations, the assets and liabilities of insurance contracts are accounted for under
insurance accounting prescribed by US GAAP. For Asian operations the local GAAP is applied with adjustments, where necessary, to
comply with UK GAAP. For Asian operations in countries where local GAAP is not well established and in which the business written is
primarily non-participating business, US GAAP is used as the most appropriate proxy to local GAAP.
The usage of these bases of accounting has varying effects on the way in which product options and guarantees are measured. For UK
regulated with-profits funds, for the 2005 results, options and guarantees are valued on a market consistent basis. The basis is described
in note D2(d)(ii). For other operations a market consistent basis is not applied under the accounting basis described in note A4. Details of
the guarantees, basis of setting assumptions, and sensitivity to altered assumptions are described in notes D3 and D4.
Valuation and accounting presentation of fair value movements of derivatives and debt securities of JNL
Under IAS 39, derivatives are required to be carried at fair value. Unless hedge accounting is applied, value movements on derivatives
are recognised in the income statement.
For derivative instruments of JNL, the Group has considered at length whether it is appropriate to undertake the necessary operational
changes to qualify for hedge accounting so as to achieve matching of value movements in hedging instruments and hedged items in the
performance statements. In reaching the decision a number of factors were particularly relevant. These were:
■ IAS 39 hedging criteria has been designed primarily in the context of hedging and hedging instruments that are assessable as financial
instruments that are either stand-alone or separable from host contracts, rather than, for example, duration characteristics of insurance
contracts;
■ the high hurdle levels under IAS 39 of ensuring hedge effectiveness at the level of individual hedge transactions for specific transactions;
■ the difficulties in applying the macro hedge provisions under IAS 39 (which are more suited to banking arrangements) to JNL’s
derivative book;
■ the complexity of asset and liability matching of US life insurers such as those with JNL’s product range; and finally
■ whether it is possible or desirable, without an unacceptable level of costs and restraint on commercial activity, to achieve the accounting
hedge effectiveness required under IAS 39.
In this regard, the issues surrounding the IAS 39 application are very similar to those considered by other US life insurers when the
US financial reporting standard FAS 133 was first applied for US GAAP reporting. Taking account of these considerations the Group has
decided that, except for certain minor categories of derivatives, it is not appropriate to seek to achieve hedge accounting under IAS 39
by completely reconfiguring the structure of JNL’s derivative book. As a result of this decision the total income statement results are more
volatile as the movements in the value of JNL’s derivatives are reflected within it.
Under IAS 39, unless carried at amortised cost (subject to impairment provisions where appropriate) under the held-to-maturity category,
debt securities are also carried at fair value. The Group has chosen not to classify any financial assets as held-to-maturity. Debt securities
of JNL are designated as available-for-sale with value movements being recorded as movements within shareholders’ equity.
Presentation of results before tax
The total tax charge for the Group reflects tax that in addition to relating to shareholders’ profits is also attributable to policyholders and
unallocated surplus of with-profits funds and unit-linked policies. This is explained in more detail in note F5. However, pre-tax profits
are determined after transfers to or from unallocated surplus of with-profits funds. These transfers are in turn determined after taking
account of tax borne by with-profits funds. Consequently reported profit before the total tax charge is not representative of pre-tax profits
attributable to shareholders. In order to provide a measure of pre-tax profits attributable to shareholders the Group has chosen to adopt
an income statement presentation of the tax charge and pre-tax results that delineates between policyholder and shareholder components.

70 Prudential plc Annual Report 2005
A3: Critical accounting policies, estimates and judgements continuedSupplementary analysis of results and earnings attributable to shareholders
With the exception of debt securities held by JNL and Egg and assets classified as loans and receivables, all financial investments are
designated as fair value through profit and loss. Short-term fluctuations in investment returns on such assets held by with-profits funds,
and those of investment property for the accounting treatment is similarly based, do not affect reported shareholder results. This is
because (i) unallocated surplus of with-profits funds are accounted for as liabilities and (ii) excess or deficits of income and expenditure
of the funds over the required surplus for distribution are transferred to or from unallocated surplus. However, for shareholder-backed
businesses the short-term fluctuations affect the result for the year and the Group provides additional analysis of results to provide
information on results beforehand after short-term fluctuations in investment returns.
Previously under UK GAAP, the Group used operating profit based on longer-term investment returns before amortisation of goodwill
as a supplemental measure of its results. For the purposes of measuring operating profit, investment returns on shareholder-financed
business were based on the expected longer-term rates of return. For debt securities, the longer-term returns (including losses arising on
the recognition of permanent diminutions in value) were averaged over five years for inclusion in operating profit. Under IFRS, the Group
continues to use operating profit based on longer-term investment returns as a supplemental measure of its results, although the basis of
calculation has been improved, as disclosed in note A4 (b) (iv) on page 81.
(b) Critical accounting estimates and judgements
Investments
Determining the fair value of unquoted investments
Of the Group’s financial investments, assets with a fair value of £4.9 billion are not quoted on active markets. Their fair values are
determined in full or in part by using valuation techniques. These techniques include discounted cash flow analysis, option-adjusted
spread models and enterprise valuation and may include a number of assumptions relating to variables such as credit risk and interest
rates. Changes in assumptions relating to these variables could positively or negatively impact the reported fair value of these instruments.
This impact would, however, be mostly mitigated by an equal and offsetting transfer to the liability for unallocated surplus as the majority
of these investments are held by the UK with-profits fund. Further information on these instruments is provided in note G1.
Determining impairments relating to financial assets
Available-for-sale securities
Financial investments carried on an available-for-sale basis, such as JNL’s debt securities portfolio, are considered to be impaired if there
has been a significant and prolonged period of decline in fair value below its amortised cost or if there is objective evidence of impairment.
The consideration of this requires management’s judgement. Among the factors considered is whether the decline in fair value results
from a change in quality of the security itself, or from a downward movement in the market as a whole and the likelihood of recovering the
carrying value based on the current and short-term prospects of the issuer. Unrealised losses that are considered to be primarily the result
of market conditions, such as increasing interest rates, unusual market volatility, or industry-related events, and where the Group also
believes there is a reasonable expectation for recovery and, furthermore, it has the intent and ability to hold the investment until maturity
or the market recovery, are usually determined to be temporary. Prudential’s review of fair value involves several criteria including economic
conditions, credit loss experience, other issuer-specific developments and future cash flows. These assessments are based on the best
available information at the time. Factors such as market liquidity, the widening of bid/ask spreads and a change in cash flow assumptions
can contribute to future price volatility. If actual experience differs negatively from the assumptions and other considerations used in the
consolidated financial statements, unrealised losses currently in equity may be recognised in the income statement in future periods.
Assets held at amortised cost
For financial assets carried at amortised cost, the Group measures the amount of the impairment loss by comparing the carrying amount
of the asset with the present value of its estimated future cash flows.
In estimating the future cash flows, the Group looks at the expected cash flows of the assets and applies historical loss experience of
assets with similar credit risks which have been adjusted for conditions in the historical loss experience which no longer exist, or for
conditions which are expected to arise. The estimated future cash flows are discounted using the financial asset’s original or variable
effective interest rate and exclude credit losses that have not yet been incurred.
The risks inherent in reviewing the impairment of any investment include the risk that market results may differ from expectations; facts
and circumstances may change in the future and differ from estimates and assumptions; or the Group may later decide to sell the security
as a result of changed circumstances.
Insurance contracts
Product classification
IFRS 4 requires contracts written by insurers to be classified as either ‘insurance contracts’ or ‘investment contracts’ depending on the
level of insurance risk transferred. If significant insurance risk is transferred by the contract then it is classified as an insurance contract.
Contracts that transfer financial risk but not significant insurance risk are termed investment contracts. Furthermore, some contracts, both
insurance and investment, contain discretionary participation features representing the contractual right to receive additional benefits as a
supplement to guaranteed benefits. Accordingly, insurers must perform a product classification exercise across their portfolio of contracts
issued to determine the allocation to these various categories. Further details of this exercise are given in note D1.
Notes on the Group financial statements continued

Prudential plc Annual Report 2005 71
A3: Critical accounting policies, estimates and judgements continuedValuation assumptions
The Group’s insurance contracts and investment contracts with discretionary participation features are primarily with-profits and other
protection type policies. For UK regulated with-profits funds for 2005 the contract liabilities are valued by reference to the UK FSA’s
realistic basis. This is described in note D2. For other contracts, and for UK with-profits contracts in 2004, the liabilities are estimated using
actuarial methods based on assumptions relating to premiums, interest rates, investment returns, expenses, mortality and surrenders. The
assumptions to which the estimation of these reserves is particularly sensitive are the interest rate used to discount the provision and the
assumed future mortality experience of policyholders. Further information on valuation assumptions in respect of the Group’s insurance
contracts is provided in section D. From the perspective of shareholder’s results, the key sensitivity relates to assumed future investment
returns for the Taiwan life operation. This sensitivity is discussed in more detail in note D4(h).
Deferred acquisition costs
Significant costs are incurred in connection with acquiring new insurance business. Except for acquisition costs of with-profits contracts
of the UK regulated with-profits funds, which are accounted for under the realistic FSA regime as described in note A4, these costs, which
vary with, and are primarily related to, the production of new business, are capitalised and amortised against margins in future revenues
on the related insurance policies. The recoverability of the asset is measured and the asset is deemed impaired if the projected future
margins are less than the carrying value of the asset. To the extent that the future margins differ from those anticipated, then an adjustment
to the carrying value of the deferred acquisition cost asset will be necessary.
The deferral and amortisation of acquisition costs is of most relevance to the Group’s reported profits for shareholder-financed long-term
business operations, principally JNL in the US. In 2005 and 2004, except as described in sections D3(f) and D4(f), the amortisation of
deferred acquisition costs was at expected levels.
Pensions
The Group applies the requirements of IAS 19, ‘Employee Benefits’ to its defined benefit pension schemes. The economic participation in
the deficits attaching to the main Prudential Staff Pension Scheme (PSPS) and the smaller Scottish Amicable Pension Scheme (SAPS) are
shared between the PAC with-profits sub-fund (WPSF) and shareholder operations. The economic interest reflects the source of contributions
over the scheme life, which in turn reflects the activity of the members during their employment. In the case of PSPS, at 31 December
2004, the attribution between WPSF and shareholders’ funds was in the ratio 80/20. In 2005, following extensive analysis, this ratio was
revised to 70/30. For SAPS the ratio for both 2005 and 2004 is estimated to be 50/50 between the WPSF and shareholders’ funds.
Deferred tax
Deferred tax assets are recognised to the extent that they are regarded as recoverable, that is to the extent that, on the basis of all the
available evidence, it can be regarded as more likely than not that there will be suitable taxable profits against which the losses can be
relieved. The UK taxation regime applies separate rules to trading and capital profits and losses. The distinction between temporary
differences that arise from items of either a capital or trading nature may affect the recognition of deferred tax assets. The judgements
made, and uncertainties considered, in arriving at deferred tax balances included in the financial statements are discussed in note H4.
Goodwill
Goodwill impairment testing requires the exercise of judgement by management as to prospective future cash flows.
A4: Significant accounting policies(a) Background
Description of the accounting policies applied in the 2005 financial statements is complicated by the basis of adoption and application
of IFRS standards for 2005 and the 2004 comparative results. Accordingly, the policies set out in note A4(b) below should be read in the
context of this background information.
With the three exceptions, referred to in note A3(a) above, all IFRS standards have been adopted on transition to IFRS from 1 January
2004 on the basis described in this note. The effect of adoption of these standards on previously published 2004 results is explained in
note A5.
IAS 32, IAS 39 and IFRS 4 standards have been adopted from 1 January 2005 when, at the same time, the Group has improved the policy
applied for UK regulated with-profits funds. Comparatives have not been restated for this change. Note A6 provides a summary of the
changes made in 2005 and their numeric effect on shareholders’ equity at 1 January 2005.
In summary, the accounting bases applied across the two years reflect the following:
Financial instruments (other than long-term business contracts classified as financial instruments)
For 2004, previous UK GAAP has been applied. For 2005, the adoption of the standards IAS 32 and IAS 39 gives rise to presentation,
recognition and measurement changes. The most significant changes relate to the measurement basis of the debt securities and
derivatives of JNL. The accounting policies are described in note (b) (i) below.

72 Prudential plc Annual Report 2005
A4: Significant accounting policies continuedLong-term business contracts
Income statement
For 2004, the income statement includes premiums and claim payments on all contracts that were then classified under previous
GAAP as insurance, including deposit style ‘investment contracts’ where the insurance risk in the contracts is insignificant. For 2005, the
recognition basis in the income statement remains the same except for investment contracts, as defined under IFRS 4, which do not contain
discretionary participation features, where the accounting reflects the deposit nature of the arrangement. Consequently, premiums and
claims on these contracts are not recognised in the income statement.
UK regulated with-profits funds
The UK GAAP basis applied in 2004 was the MSB, which closely reflected the Peak 1 regulatory basis of the UK FSA with the addition of
deferred acquisition costs. For 2005, this basis has been replaced under a policy improvement to align with the UK accounting standard
FRS 27, ‘Life Assurance’.
Other insurance contracts
UK GAAP has been applied in both 2004 and 2005. In this respect UK GAAP also reflects the MSB. For overseas operations local GAAP
or, in some cases, US GAAP has been applied but with the necessary changes to comply with UK GAAP.
Investment contracts
UK GAAP has been applied for 2004. Investment contracts with discretionary participation features are also accounted for in accordance
with UK GAAP in 2005, in common with insurance contracts. For 2005, investment contracts without discretionary participation features
are accounted for on a basis that reflects the hybrid nature of the arrangements whereby the deposit component is accounted for as a
financial instrument under IAS 39 and the service component is accounted for under IAS 18, ‘Revenue’.
Other assets, liabilities, income and expenditure
All other items are accounted for in both the 2004 and 2005 results and notes on the financial statements under the relevant IFRS standard.
Presentation of supplementary analysis of profit before tax attributable to shareholders
The Group has adopted a policy of presenting an analysis of profit before tax attributable to shareholders that distinguishes operating
profit based on longer-term investment returns from other constituent elements of the total profit. It should be noted that the comparative
analysis for 2004 is prepared on an inconsistent basis from that in 2005 as a result of the delayed adoption of insurance contract and
financial instrument standards as referred to above, from 1 January 2005, as permitted under IFRS 1 transition rules.
The summary above should be read in conjunction with the full description of significant accounting policies described elsewhere in this
note and in notes A5 and A6 for a comprehensive explanation.
(b) Accounting policies applied
(i) Financial instruments (other than long-term business contracts classified as financial instruments under IFRS 4)
2004
Previous UK GAAP has been applied as follows:
Other than banking business
Equity securities and debt securities
Equity securities were carried at fair value. Debt securities were carried at fair value, except those held by JNL which, subject to provision
for permanent diminutions in value, were carried at amortised cost. Fair value was based on quoted market prices for listed securities,
and on quotations provided by external fund managers, brokers, independent pricing services or values as determined by the directors
for unlisted securities. Changes in fair value were recognised in investment returns during the year of the change. Debt securities held by
JNL were carried at amortised cost as permitted by paragraph 24 of schedule 9A to the Companies Act 1985. The amortised cost basis of
valuation was appropriate under the provisions of the ABI SORP for JNL’s redeemable debt securities as they were deemed held as part
of a portfolio of such securities intended to be held to maturity.
Mortgages and other loans
Loans collateralised by mortgages and other unsecured loans were carried at unpaid principal balances, net of unamortised discounts
and premiums and an allowance for loan losses, except for loans held by UK insurance operations which were carried at fair value.
The allowance for loan losses was maintained at a level considered adequate to absorb losses in the mortgage loan portfolio.
Loans to policyholders
Loans to policyholders were carried at unpaid principal balances and fully collateralised by the cash value of policies.
Deposits with credit institutions
Deposits with credit institutions were carried at fair value. Changes in fair value were included in investment income for the year.
Derivatives
With the principal exception of derivatives held by JNL, these instruments were carried at fair value with changes in fair value included
in investment income. Derivative instruments of JNL and certain other minor holdings were accounted for at amortised cost.
Notes on the Group financial statements continued

Prudential plc Annual Report 2005 73
A4: Significant accounting policies continuedBanking business
Debt securities intended to be held for continuing use were carried at cost less any provision for permanent diminution in value. Discount
or premiums on purchase were amortised through the profit and loss account over the period from date of purchase to date of maturity.
Debt securities, which were held for resale, were stated at their net realisable value.
Derivative instruments were accounted for in a manner consistent with the assets and liabilities or positions being hedged. Profits or
losses and interest on these instruments were recognised in accordance with the accounting treatment of the underlying transaction
as an adjustment to interest receivable or interest payable.
2005
The accounting policies for financial instruments in 2005 are changed in a number of areas, as described in note A6. In general, where
a fair value basis of measurement was applied for 2004, this basis has been continued for 2005. However, for instruments previously
carried at cost, or amortised cost, the general effect of the standards adopted is for the use of fair value to be extended. The most
significant changes relate to the measurement basis of the debt securities and derivatives of JNL.
The accounting policies applied in 2005 are as follows:
Investment classification
Upon initial recognition, financial investments are measured at fair value. Subsequently, the Group is permitted, subject to specific
criteria, to designate its investments as either financial investments at fair value through profit and loss, financial investments held on
an available-for-sale basis, financial investments held to maturity, or loans and receivables. The Group holds financial investments on
the following bases:
(i) Financial investments at fair value through profit and loss – this comprises assets designated by management as fair value through profit
and loss on inception. These investments are measured at fair value with all changes thereon being recognised in investment income.
(ii) Financial investments on an available-for-sale basis – this comprises assets that are designated by management and/or do not fall into
any of the other categories. These investments are carried at fair value. Interest income is recognised on an effective interest basis in the
income statement. Unrealised gains and losses relating to changes in fair value are recognised in equity. Upon disposal or impairment,
accumulated unrealised gains and losses are transferred from equity to the income statement as realised gains or losses.
(iii) Loans and receivables – this comprises investments that have fixed or determinable payments and are not designated as fair value
through profit and loss or available-for-sale. These investments include loans collateralised by mortgages, deposits, loans to policyholders
and other unsecured loans and receivables. These investments are carried at amortised cost using the effective interest method.
The Group has designated certain financial assets as fair value through profit and loss as these assets are managed and their performance
is evaluated on a fair value basis. These assets represent all of the Group’s financial assets except all loans and receivable and debt securities
held by JNL and Egg. Debt securities held by JNL and Egg are accounted for on an available-for-sale basis. The use of the fair value option
is consistent with the Group’s risk management and investment strategies.
The Group uses the trade date method to account for regular way purchases and sales of financial assets with the exception of Egg’s loans
and advances to customers which are on a settlement day basis.
Use of fair values
The Group uses current bid prices to value its quoted investments. Actively traded investments without quoted prices are valued using
external broker bid prices. If there is no active established market for an investment, the Group applies an appropriate valuation technique
such as a discounted cash flow technique.
Impairments
The Group assesses at each balance sheet date whether there is objective evidence that a financial asset or group of financial assets not
held at fair value through profit and loss is impaired. A financial asset or group of financial assets is impaired and impairment losses are
incurred only if there is objective evidence of impairment as a result of one or more events that have occurred after the initial recognition
of the asset (a ‘loss event’) and that loss event (or events) has an impact on the estimated future cash flows of the financial asset or group
of financial assets that can be reliably estimated. Objective evidence that a financial asset or group of financial assets is impaired includes
observable data that comes to the attention of the Group. For assets designated as available-for-sale, the impairment is measured as the
difference between the amortised cost of the asset and its fair value, removed from the available-for-sale reserve within equity and
recognised in the income statement.
For loans and receivables carried at amortised cost, the impairment amount is the difference between amortised cost and the present
value of the expected cash flows discounted at the original effective interest rate.
If, in subsequent periods, an impaired debt security held on an available-for-sale basis or an impaired loan or receivable recovers in value
(in part, or in full), and this recovery can be objectively related to an event occurring after the impairment, then the previously recognised
impairment loss is reversed through the income statement (in part, or in full).

74 Prudential plc Annual Report 2005
A4: Significant accounting policies continuedDerivatives and hedge accounting
Derivative financial instruments are used to reduce or manage investment, interest rate and currency exposures, to facilitate efficient
portfolio management and for investment purposes. The Group’s policy is that amounts at risk through derivative transactions are covered
by cash or by corresponding assets.
The Group may designate certain derivatives as hedges. This includes fair value hedges, cash flow hedges and hedges of net investments
in foreign operations. If the criteria for hedge accounting are met then the following accounting treatments are applied from the date at
which the designation is made and the accompanying requisite documentation is in place:
(i) Hedges of net investments in foreign operations – the effective portion of any change in fair value of derivatives or other financial
instruments designated as net investment hedges are recognised in equity. The ineffective portion of changes in the fair value of the
hedging instrument is recorded in the income statement. The gain or loss on the hedging instrument recognised directly in equity is
recognised in the income statement on disposal of the foreign operation.
(ii) Fair value hedges – movements in the fair value of the hedged item attributable to the hedged risk are recognised in the income statement.
(iii) Cash flow hedges – the effective portion of changes in the fair value of derivatives designated as cash flow hedges are recognised
in equity. Movements in fair value relating to the ineffective portion are booked in the income statement. Amounts recognised directly
in equity are recorded in the income statement in the periods in which the hedged item affects profit or loss.
All derivatives that do not meet the relevant hedging criteria are carried at fair value with movements in fair value being recorded in the
income statement.
Embedded derivatives
Embedded derivatives are held by various Group companies including JNL and Egg. They are embedded within other non-derivative
host financial instruments to create hybrid instruments. Where economic characteristics and risks of the embedded derivatives are not
closely related to the economic characteristics and risks of the host instrument, and where the hybrid instrument is not measured at fair
value with the changes in fair value recognised in the income statement, depending on the classification of the host instrument, the host
is then measured in accordance with the relevant requirements of IAS 39.
Securities lending including repurchase agreements
The Group is party to various securities lending agreements under which securities are loaned to third parties on a short-term basis.
The loaned securities are not derecognised; rather, they continue to be recognised within the appropriate investment classification. The
Group’s policy is that collateral in excess of 100 per cent of the fair value of securities loaned is required from all securities borrowers and
typically consists of cash, debt securities, equity securities or letters of credit.
In cases where the Group takes possession of the collateral under its securities lending programme, the collateral, and corresponding
obligation to return such collateral are recognised in the consolidated balance sheet. To further minimise credit risk, the financial condition
of counterparties is monitored on a regular basis.
Derecognition of financial assets and liabilities
The Group’s policy is to derecognise financial assets when it is deemed that substantially all the risks and rewards of ownership have been
transferred. The Group also derecognises a financial asset when the contractual rights to the cash flows from the financial asset expire.
Where the Group neither transfers nor retains substantially all the risks and rewards of ownership, the Group will derecognise the financial
asset where it is deemed that the Group has not retained control of the financial asset.
Where the transfer does not result in the Group transferring the right to receive the cash flows of the financial assets, but does result
in the Group assuming a corresponding obligation to pay the cash flows to another recipient, the financial assets are also accordingly
derecognised providing the following conditions are met:
■ The Group has no obligation to pay amounts to the eventual recipients unless it collects the equivalent amounts from the original asset;
■ the Group is prohibited by the terms of the transfer contract from selling or pledging the original asset; or
■ the Group has no obligation to remit any cash flows it collects on behalf of the eventual recipients without material delay.
The Group derecognises financial liabilities only when the obligation specified in the contract is discharged, cancelled or has expired.
Securitisation of assets
Egg has issued debt securities in order to finance certain portfolios of loan and investment assets. These obligations are secured on Egg’s
assets. The securitised assets and the related liabilities are presented gross within the relevant headings in the balance sheet under the
‘gross presentation’ method.
Borrowings
Although initially recognised at fair value, net of transaction costs, borrowings, excluding liabilities of consolidated collateralised debt
obligations, are subsequently accounted for on an amortised cost basis using the effective interest method. Under the effective interest
method, the difference between the redemption value of the borrowing and the initial proceeds (net of related issue costs) is amortised
through the income statement to the date of maturity.
Notes on the Group financial statements continued

Prudential plc Annual Report 2005 75
A4: Significant accounting policies continuedFinancial liabilities designated at fair value through profit and loss
The Group has designated under IAS 39 classification, certain financial liabilities at fair value through profit and loss as these instruments
are managed and their performance evaluated on a fair value basis. These instruments include liabilities related to consolidated collateralised
debt obligations and net assets attributable to unit holders of consolidated unit trusts and similar funds.
(ii) Long-term business contracts
Income statement treatment
2004
Premiums and claims
Premium and annuity considerations for conventional with-profits policies and other protection type insurance polices are recognised when
due. Premiums and annuity considerations for linked policies, unitised with-profits and other investment type policies are recognised when
received or, in the case of unitised or unit-linked policies, when units are issued. These amounts exclude any taxes or duties assessed
based on premiums.
Policy fees charged on linked and unitised with-profits policies for mortality, asset management and policy administration are recognised
as revenue when related services are provided.
Claims paid include maturities, annuities, surrenders and deaths. Maturity claims are recorded on the policy maturity date. Annuity claims
are recorded when the annuity becomes due for payment. Surrenders are recorded when paid, and death claims are recorded when notified.
Premiums and claims include receipts and payments on deposit style ‘investment contracts’ where the insurance risk in the contracts
is insignificant.
Acquisition costs
Costs of acquiring new business, principally commissions, marketing and advertising costs and certain other costs associated with policy
issuance and underwriting that are not reimbursed by policy charges are specifically identified and capitalised as deferred acquisition costs
(DAC), which are included as an asset in the balance sheet. The DAC asset is amortised against margins in future revenues on the related
insurance policies, to the extent that the amounts are recoverable out of the margins. Recoverability of the unamortised DAC asset is
assessed at the time of policy issue, and reviewed if profit margins have declined.
2005
For 2005, the recognition basis in the income statement remains the same except for investment contracts which do not contain
discretionary participating features, where the accounting reflects the deposit nature of the arrangement, with premium and claims
reflected as deposits and withdrawals taken directly to the balance sheet.
Under IFRS, investment contracts (excluding those with discretionary participation features) are required to be accounted for as financial
liabilities in accordance with IAS 39 and, where relevant, the provisions of IAS 18, in respect of the attaching investment management
features of the contracts. The Group’s investment contracts primarily comprise of certain unit-linked savings contracts in the UK and Asia
and contracts with fixed and guaranteed terms in the US (such as guaranteed investment contracts and annuity-certains).
Incremental, directly attributable acquisition costs relating to the investment management element of these contracts are capitalised and
amortised in line with the related revenue. If the contracts involve up-front charges, this income is also deferred and amortised through
the income statement in line with contractual service provision.
UK regulated with-profits funds
2004
The UK GAAP basis applied in 2004 was the MSB, which closely reflected the Peak 1 regulatory basis of the UK FSA.
Prudential’s long-term business written in the UK comprises predominantly life insurance policies under which the policyholders are
entitled to participate in the returns of the funds supporting these policies. Business similar to this type is also written in certain of the
Group’s Asian operations and subject to local market and regulatory conditions. Such policies are called ‘with-profits’ policies. Prudential
maintains with-profits funds within the Group’s long-term business funds, which segregate the assets and liabilities and accumulate the
returns related to that with-profits business. The amounts accumulated in these with-profits funds are available to provide for future
policyholder benefit provisions and for bonuses to be distributed to with-profits policyholders. The bonuses, both annual and final, reflect
the right of the with-profits policyholders to participate in the financial performance of the with-profits funds. Shareholders’ profits with
respect to bonuses declared on with-profits business correspond to the shareholders’ share of the cost of bonuses as declared by the
Board of directors. The shareholders’ share currently represents one-ninth of the cost of bonuses declared for with-profits policies.
Annual bonuses are declared and credited each year to with-profits policies. The annual bonuses increase policy benefits and, once
credited, become guaranteed. Annual bonuses are charged to the profit and loss account in the year declared. Final bonuses are declared
each year and accrued for all policies scheduled to mature and death benefits expected to be paid during the next financial year. Final
bonuses are not guaranteed and are only paid on policies that result from claims through the death of the policyholder or maturity of the
policy within the period of declaration or by concession on surrender. No policyholder benefit provisions are recorded for future annual
or final bonus declarations.
76 Prudential plc Annual Report 2005
A4: Significant accounting policies continuedConventional with-profits business
Future policyholder benefit provisions on conventional with-profits and other protection-type policies were calculated using the net
premium valuation method. The net premium was calculated such that it would be sufficient at the outset of the policy to provide only for
the discounted value of the original guaranteed death and maturity benefits on the chosen valuation assumptions. The provision was then
calculated by subtracting the present value of future net premiums from the present value of future benefits (including vested bonuses)
using a prudent discount rate.
Under the net premium valuation method, vested bonuses were included in the cash flows assessed but future allocations of bonuses are
not included explicitly, although they were implicitly taken into account in the discount rate used, which was based on the return available
on suitable investments. The detailed methodology for UK companies is included in regulations contained in the FSA rules. In particular,
the returns available from equity and property assets are based on expected income and/or earnings and no allowance was made for
potential future capital growth.
Accumulating with-profits business
For accumulating with-profits business, the calculation of the long-term business provision was based on a gross premium bonus reserve
valuation. In general terms, a gross premium valuation basis is one in which the premiums brought into account are the full amounts
receivable under the contract. The method included explicit estimates of premiums, expected claims, future regular bonuses, costs
of maintaining contracts and future renewal expenses. Cash flows were discounted at the valuation rate of interest. The methodology
for UK companies is included in the FSA rules. The discount rate was based on the expected return on the assets deemed to back the
liabilities as prescribed by the FSA rules.
For PAC business, the calculation was based on a valuation under which future reversionary bonuses were added to the guaranteed
liabilities existing at the valuation date. The provision was then calculated as the present value of future policyholder benefits plus the
present value of future expenses, without assumption for withdrawals.
An addition was made in respect of future premiums if this produced a higher provision. The assumptions to which the estimation of the
long-term business provision was particularly sensitive included the assumed future reversionary bonuses, the interest rate used to discount
the provision, the assumed future per policy expenses and the assumed future mortality experience of policyholders.
For PAC business, the provision was taken as the lower of:
■ The accumulated fund or the value at the bid price of the notional number of units allocated to policyholders, in both cases excluding
final bonus; and
■ the surrender or transfer value which, having regard to policyholders’ reasonable expectations, would be payable at the valuation date,
or, if greater, the value of the guaranteed liabilities excluding final bonus calculated on a gross premium bonus reserve method.
The amounts shown in the consolidated balance sheet for the year ended 31 December 2004, for with-profits contracts and unallocated
surplus of the PAC with-profits fund have been determined in accordance with the MSB. With the exception of minor accounting
adjustments, the technical provisions reflect the UK regulatory basis of reporting that has applied for many years, and which effectively
constitutes the Peak 1 basis under the new FSA regime.
2005
For 2005, the basis described above has been replaced under a policy improvement to align with the UK accounting standard FRS 27,
‘Life Assurance’.
FRS 27 is underpinned by the FSA’s Peak 2 basis of reporting. This Peak 2 basis, which came into effect for the first time for 2004
regulatory reporting, requires the value of liabilities to be calculated as:
■ A with-profits benefits reserve (WPBR); plus
■ future policy related liabilities (FPRL); plus
■ the realistic current liabilities of the fund.
The WPBR is primarily based on the retrospective calculation of accumulated asset shares but is adjusted to reflect future policyholder
benefits and other outgoings. By contrast, the Peak 1 basis addresses, at least explicitly, only declared bonuses.
The FPRL must include a market consistent valuation of costs of guarantees, options and smoothing, less any related charges, and this
amount is determined using either a stochastic approach, hedging costs or a series of deterministic projections with attributed probabilities.
Under the Peak 1 basis there is an allowance on a deterministic basis for the intrinsic value of these costs.
The assumptions used in the stochastic models are calibrated to produce risk-free returns on each asset class. Volatilities of, and
correlations between, investment returns from different asset classes are as determined by the Group’s Portfolio Management Group
but are also market consistent.
Notes on the Group financial statements continued

Prudential plc Annual Report 2005 77
A4: Significant accounting policies continuedThe cost of guarantees, options and smoothing is very sensitive to the bonus, market value reduction (MVR) and investment policy the
Company employs and therefore the stochastic modelling incorporates a range of management actions that would help to protect the
fund in adverse scenarios. Substantial flexibility has been included in the modelled management actions in order to reflect the discretion
that the Company retains in adverse investment conditions, thereby avoiding the creation of unreasonable minimum capital requirements.
The management actions assumed are consistent with management’s policy for with-profits funds and the disclosures made in the publicly
available Principles and Practices of Financial Management.
Under FRS 27, the main changes that are required for UK with-profits funds are:
■ Derecognition of deferred acquisition costs and related deferred tax; and
■ replacement of MSB liabilities for with-profits business with adjusted realistic basis liabilities.
Adjusted realistic basis liabilities represent the Peak 2 basis realistic liabilities for with-profits business included in Form 19 of the FSA
regulatory returns, but after excluding the element for the shareholders’ share of the future bonuses. This latter item is recognised as a
liability for the purposes of regulatory returns but, for accounting purposes under FRS 27, consistent with the current basis of financial
reporting, shareholder transfers are recognised only on declaration.
Unallocated surplus
The unallocated surplus represents the excess of assets over policyholder liabilities for the Group’s with-profits funds. In 2005, as allowed
under IFRS 4, the Group has opted to continue to record unallocated surplus of with-profits funds wholly as a liability. The annual excess
(shortfall) of income over expenditure of the with-profits funds, after declaration and attribution of the cost of bonuses to policyholders
and shareholders, is transferred to (from) the unallocated surplus each year through a charge (credit) to the income statement. The
balance retained in the unallocated surplus represents cumulative income arising on the with-profits business that has not been allocated
to policyholders or shareholders. The balance of the unallocated surplus is determined after full provision for deferred tax on unrealised
appreciation on investments.
Other insurance contracts (contracts which contain significant insurance risk as defined under IFRS 4)
UK GAAP has been applied in both 2004 and 2005. UK GAAP for these contracts reflects the MSB. Under this basis the following
approach applies.
UK insurance contracts
Other UK insurance contracts, including unit-linked contracts, that contain significant insurance risk, are accounted for consistently in
2004 and 2005. Segregated accounts are established for linked business for which policyholder benefits are wholly or partly determined
by reference to specific investments or to an investment-related index. The interest rates used in establishing policyholder benefit provisions
for pension annuities in the course of payment are adjusted each year. Mortality rates used in establishing policyholder benefit provisions
were based on published mortality tables adjusted to reflect actual experience.
Overseas subsidiaries
Results of overseas subsidiaries are determined initially using local GAAP bases of accounting with subsequent adjustments where
necessary to comply with the Group’s accounting policies.
Jackson National Life
The future policyholder benefit provisions for JNL’s conventional protection-type policies are determined using the net level premium
method under US GAAP principles and assumptions as of the issue date as to mortality, interest, policy lapses and expenses plus
provisions for adverse deviations. For non-conventional protection-type policies, the policyholder benefit provision included within
policyholder liabilities in the consolidated balance sheet is the policyholder account balance.
For the business of JNL, the determination of the expected emergence of margins, against which the amortisation profile of the DAC
asset is established, is dependent on certain key assumptions. For single premium deferred annuity business, the key assumption is
the expected long-term spread between the earned rate and the rate credited to policyholders. For variable annuity business, the key
assumption is the expected long-term level of equity market returns which, for 2005 and 2004, was 8.4 per cent per annum implemented
using a mean reversion methodology. These returns affect the level of future expected profits through their effects on fee income and the
required level of provision for guaranteed minimum death benefit claims.
In 2005, JNL accounts for the majority of its investment portfolio on an available-for-sale basis (see investment policies above) whereby
unrealised gains and losses are recognised directly in equity. As permitted by IFRS 4, JNL has used shadow accounting. Under shadow
accounting, to the extent that recognition of unrealised gains or losses on available-for-sale securities causes adjustments to the carrying
value and amortisation patterns of deferred acquisition costs and deferred income, these adjustments are recognised directly in equity to
be consistent with the treatment of the gains or losses on the securities.

78 Prudential plc Annual Report 2005
A4: Significant accounting policies continuedAsian operations
The future policyholder benefit provisions for Asian businesses are determined in accordance with methods prescribed by local GAAP
adjusted to comply, where necessary, with UK GAAP. For the Hong Kong business, which is a branch of the PAC, and the Singapore and
Malaysian operations the valuation principles and sensitivities to changes of assumptions of conventional with-profits and other protection-
type policies are similar to those described above for equivalent products written by the UK operations.
For Asian operations in countries where local GAAP is not well established and in which the business written is primarily non-participating
and linked business, US GAAP is used as the most appropriate proxy to local GAAP. The future policyholder benefit provisions for non-
linked business are determined using the net level premium method, with an allowance for surrenders, maintenance and claim expenses.
Rates of interest used in establishing the policyholder benefit provisions vary by operation depending on the circumstances attaching to
each block of business.
Although the basis of valuation of Prudential’s overseas operations is in accordance with the requirements of the Companies Act 1985
and ABI SORP, the valuation of policyholder benefit provisions for these businesses may differ from that determined on a UK MSB for
UK operations with the same features.
Liability adequacy
The Group performs liability adequacy testing on its insurance provisions to ensure that the carrying amounts of provisions (less related
deferred acquisition costs and present value of in-force business – see policy on Business Acquisitions and Disposals) is sufficient to
cover current estimates of future cash flows. When performing the liability adequacy test, the Group discounts all contractual cash flows
and compares this amount to the carrying value of the liability. Any deficiency is immediately charged to the income statement.
Reinsurance
In the normal course of business, the Group seeks to reduce loss exposure by reinsuring certain levels of risk in various areas of exposure
with other insurance companies or reinsurers. An asset or liability is recognised in the consolidated balance sheet representing premiums
due to or payments due from reinsurers, and the share of losses recoverable from reinsurers. The measurement of reinsurance assets is
consistent with the measurement of the underlying direct insurance contracts.
Gains arising on the purchase of reinsurance contracts by JNL are deferred and amortised over the contract duration. Any loss is recognised
in the income statement immediately.
Investment contracts (contracts which do not contain significant insurance risk as defined under IFRS 4)
For investment contracts with discretionary participation features, the accounting basis in 2005 and 2004 is consistent with the accounting
for similar with-profits insurance contracts. For investment contracts without discretionary participation features, UK GAAP has been
applied for 2004. For 2005, investment contracts are accounted for on a basis that reflects the hybrid nature of the arrangements whereby
part is accounted for as a financial instrument under IAS 39 and the investment management service component is accounted for under
IAS 18 as described in note A6.
For those investment contracts in the US with fixed and guaranteed terms, the Group uses the amortised cost model to measure the liability.
On contract inception the liability is measured at fair value less incremental, directly attributable, acquisition costs. Remeasurement at
future reporting dates is on an amortised cost basis utilising an effective interest rate methodology whereby the interest rate utilised
discounts to the net carrying amount of the financial liability.
Those investment contracts without fixed and guaranteed terms are designated at fair value through profit and loss. Fair value is based
upon the fair value of the underlying assets of the fund. Where the contract includes a surrender option its carrying value is subject to
a minimum carrying value equal to its surrender value.
(iii) Other assets, liabilities, income and expenditure
All other items are accounted for in both the 2004 and 2005 results and notes on the financial statements under the relevant IFRS standard.
Basis of consolidation
The Group consolidates those entities it is deemed to control. The degree of control is determined by the ability of the Group to govern the
financial and operating policies of an entity in order to obtain benefits. Consideration is made of other factors such as potential voting rights.
The Group has consolidated some special purpose entities (SPE), such as funds holding collateralised debt obligations (CDO) where
equity investors do not have the characteristics of a controlling financial interest or do not have sufficient equity at risk for the entity to
finance its activities without additional subordinated financial support from other parties. These SPEs are consolidated because the Group
is deemed to control them under IFRS.
Where the Group holds investments in Open-ended Investment Companies (OEICs) and unit trusts and the Group’s ownership share
falls marginally below 50 per cent due to the fluctuating nature of the internal and external participation in these vehicles, the Group
will continue to consolidate the OEIC or unit trust when the fall in percentage ownership below 50 per cent is deemed to be temporary.
Notes on the Group financial statements continued
Prudential plc Annual Report 2005 79
A4: Significant accounting policies continuedWhere the Group exercises significant influence or has the power to exercise significant influence over an entity, generally through
ownership of 20 per cent or more of the entity’s voting rights, but does not control the entity then this is considered to be an investment
in an associate. With the exception of those referred to below, the Group’s investments in associates are recorded at the Group’s share of
the associate’s net assets. The carrying value of investments in associates is adjusted each year for the Group’s share of the entities’ profit
or loss. This does not apply to investments in associates held by the Group’s insurance or investment funds including the venture capital
business or mutual funds and unit trusts, which are carried at fair value through profit and loss.
The Group’s investments in joint ventures are recognised using proportional consolidation whereby the Group’s share of an entity’s
individual balances are combined line-by-line with similar items into the Group financial statements.
Other interests in entities, where significant influence is not exercised, are carried as investments at fair value through profit and loss.
The consolidated financial statements of the Group include the assets, liabilities and results of the Company and subsidiary undertakings
in which Prudential has a controlling interest, using accounts drawn up to 31 December 2005 except where entities have non-coterminous
year ends. In such cases, the information consolidated is based on the accounting period of these entities and is adjusted for material
changes up to 31 December. Accordingly, the information consolidated is deemed to cover the same period for all entities throughout
the Group. The results of subsidiaries are included in the financial statements from the date acquired to the effective date of disposal.
All inter-company transactions are eliminated on consolidation. Results of investment management activities include those for managing
internal funds.
Investment properties
Investments in tenant occupied leasehold and freehold properties are carried at fair value, with changes in fair value included in the
income statement. Properties are valued annually either by the Group’s qualified surveyors or professional external valuers using The
Royal Institution of Chartered Surveyors (RICS) guidelines. The RICS guidelines apply separate assumptions to the value of the land,
buildings, and tenancy associated with each property. Each property is externally valued at least once every three years. The cost of
additions and renovations is capitalised and considered when estimating fair value.
Leases of investment property where the Group has substantially all the risks and rewards of ownership are classified as finance leases
(leasehold property). Finance leases are capitalised at the lease’s inception at the lower of the fair value of the leased property and the
present value of the minimum lease payments. Where a lease has a contingent rent element, the rent is calculated in accordance with
individual lease terms and charged as an expense as incurred.
Pension schemes
The Group operates a number of pension schemes around the world. The largest of these schemes is the PSPS, a defined benefit
scheme. The Group also operates defined contribution schemes. Defined contribution schemes are schemes where the Company pays
contributions into a fund and the Company has no legal or constructive obligation to pay further contributions should the assets of that
fund be insufficient to pay the employee benefits relating to employee service in both current and prior periods. Defined benefit schemes
are post-employment benefits plans that are not defined contribution schemes.
For the Group’s defined benefit schemes, if the present value of the defined benefit obligation exceeds the fair vale of the schemes assets,
then a liability is recorded in the Group’s balance sheet. The Group utilises the projected unit credit method to calculate the defined
benefit obligation. Estimated future cash flows are then discounted at a high-quality corporate bond rate to determine its present value.
These calculations are performed by independent actuaries.
The plan assets of the Group’s pension schemes exclude several insurance contracts that have been issued by the Group. These assets
are excluded from plan assets in determining the pension obligation recognised in the consolidated balance sheet.
The aggregate of the actuarially determined service costs of the currently employed personnel and the unwind of discount on liabilities at
the start of the period, less the expected investment return on scheme assets at the start of the period, is charged to the income statement.
Actuarial gains and losses as a result of changes in assumptions or experience variances are also charged or credited to the income statement.
Contributions to the Group’s defined contribution schemes are expensed when due. Once paid, the Group has no further payment
obligations. Any prepayments are reflected as an asset on the balance sheet.
Share-based payments
The Group offers share award and option plans for certain key employees and a Save As You Earn plan (SAYE) plan for all UK and certain
overseas employees. The arrangements for distribution to employees of shares held in trust relating to share award plans and for entitlement
to dividends depend upon the particular terms of each plan. Shares held in trust relating to these plans are conditionally gifted to employees.
The compensation expense charged to the income statement is primarily based upon the fair value of the options granted, the vesting
period and the vesting conditions. The Group revises its estimate of the number of options likely to be exercised at each balance sheet
date and adjusts the charge to the income statement accordingly. Where the share-based payment depends upon vesting outcomes
attaching to market-based performance conditions, additional modelling is required to take into account these conditions which effectively
estimates the number of shares expected to vest. No subsequent adjustment is then made to the fair value charge for awards that do not
vest on account of these performance conditions not being met.

80 Prudential plc Annual Report 2005
A4: Significant accounting policies continuedThe Company has established trusts to facilitate the delivery of Prudential plc shares under employee incentive plans and savings-related share
option schemes. The cost to the Company of acquiring these treasury shares held in trusts is shown as a deduction from shareholders’ equity.
Tax
The Group’s UK subsidiaries each file separate tax returns. JNL and other foreign subsidiaries, where permitted, file consolidated income
tax returns. In accordance with UK tax legislation, where one domestic UK company is a 75 per cent owned subsidiary of another UK
company or both are 75 per cent owned subsidiaries of a common parent, the companies are considered to be within the same UK tax
group. For companies within the same tax group, trading profits and losses arising in the same accounting period may be offset for purposes
of determining current and deferred taxes.
Current tax expense is charged or credited to operations based upon amounts estimated to be payable or recoverable as a result of
taxable operations for the current year. To the extent that losses of an individual UK company are not offset in any one year, they can
be carried back for one year or carried forward indefinitely to be offset against profits arising from the same company.
Deferred taxes are provided under the liability method for all relevant temporary differences, being the difference between the carrying
amount of an asset or liability in the balance sheet and its value for tax purposes. IAS 12, ‘Income Taxes’ does not require all temporary
differences to be provided for, in particular, the Group does not provide for deferred tax on undistributed earnings of subsidiaries where
the Group is able to control the timing of the distribution and the temporary difference created is not expected to reverse in the foreseeable
future. The tax effects of losses available for carry forward are recognised as an asset. Deferred tax assets are only recognised when it is
probable that future taxable profits will be available against which these losses can be utilised. Deferred tax related to charges or credits
taken directly to equity is also credited or charged directly to equity and is subsequently recognised in the income statement together
with the deferred gain or loss.
The tax charge for long-term business includes tax expense on with-profits funds attributable to both the policyholders and the shareholders.
Different tax rules apply under UK law depending upon whether the business is life insurance or pension business. Tax on the life insurance
business is based on investment returns less expenses attributable to that business. Tax on the pension business is based on the shareholders’
profits or losses attributable to that business. The shareholders’ portion of the long-term business is taxed at the shareholders’ rate with
the remaining portion taxed at rates applicable to the policyholders.
Property, plant and equipment
All property, plant and equipment such as owner occupied property, computer equipment and furniture and fixtures, are carried at
depreciated cost. Costs including expenditure directly attributable to the acquisition of the assets are capitalised. Depreciation is
calculated and charged on a straight-line basis over an asset’s estimated useful life. The residual values and useful lives are reviewed at
each balance sheet date. If the carrying amount of an asset is greater than its recoverable amount then its carrying value is written down
to that recoverable amount.
Leasehold improvements to owner occupied property are depreciated over the life of the lease. Assets held under finance leases are
capitalised at their fair value.
Business acquisitions and disposals
Business acquisitions are accounted for by applying the purchase method of accounting, which adjusts the net assets of the acquired
company to fair value at the date of purchase. The excess of the costs of acquisition over the fair value of the acquired entity is recorded
as goodwill. Should the fair value of the identifiable assets and liabilities of the entity exceed the cost of acquisition then this is recognised
immediately in the income statement. Income and expenses of acquired entities are included in the income statement from the date of
acquisition. Revenues and expenses of entities sold during the period are included in the income statement up to the date of disposal.
The gain or loss on disposal is calculated as the difference between sale proceeds net of selling costs less the net assets of the entity at
the date of disposal.
For life insurance company acquisitions, the adjusted net assets include an identifiable intangible asset for the present value of in-force
business which represents the profits that are expected to emerge from the acquired insurance business. The present value of in-force
business is calculated using best estimate actuarial assumptions for interest, mortality, persistency and expenses and is amortised over
the anticipated lives of the related contracts in the portfolio. An intangible asset may also be recognised in respect of acquired investment
management contracts representing the fair value of contractual rights acquired under these contracts.
The Company uses the economic entity method to purchase minority interests. Under the economic entity method any difference
between consideration and the share of net assets acquired is recorded directly in equity.
Goodwill
Goodwill arising on acquisitions of subsidiaries and businesses is capitalised and carried on the Group balance sheet as an intangible asset
at initial value less any accumulated impairment losses. Goodwill impairment testing is conducted annually and when there is an indication
of impairment. For the purposes of impairment testing, goodwill is allocated to cash generating units. These cash generating units reflect
the smallest group of assets that includes the goodwill and generates cash flows that are largely independent of the cash inflows from
other groups of assets. If the carrying amount of the cash generating unit exceeds its recoverable amount then the goodwill is considered
impaired. Impairment losses are recognised immediately in the income statement and may not be reversed in future periods.
Notes on the Group financial statements continued

Prudential plc Annual Report 2005 81
A4: Significant accounting policies continuedCash and cash equivalents
Cash and cash equivalents consist of cash at bank and in hand, deposits held at call with banks, treasury bills and other short-term highly
liquid investments with less than 90 days maturity from the date of acquisition.
Rights of offset
Assets and liabilities in the consolidated financial statements are only reported on a net basis when there is a legally enforceable right to
offset and there is an intention to settle on a net basis.
Segments
In accordance with IAS 14, ‘Segment Reporting’ the Group reports its results and certain other financial information by primary and
secondary segments. The Group’s primary segments are its business segments, namely, long-term business, banking and broker-dealer
and fund management. The Group’s secondary segments are its geographical segments, namely, UK, US and Asia.
Shareholders’ dividends
Dividends to shareholders are recognised as a liability in the period in which they are declared. Where scrip dividends are issued, the
value of such shares, measured as the amount of the cash dividend alternative, is credited to reserves and the amount in excess of the
nominal value of the shares issued is transferred from the share premium account to retained earnings.
Share capital
Where there is no obligation to transfer assets, shares are classified as equity. The difference between the proceeds received on issue
of the shares, net of share issue costs, and the nominal value of the shares issued, is credited to share premium. Where the Company
purchases shares for the purposes of employee incentive plans, the consideration paid, net of issue costs, is deducted from retained
earnings. Upon issue or sale any consideration received is credited to retained earnings net of related costs.
Foreign exchange
The Group’s consolidated financial statements are presented in pound sterling, the Group’s presentation currency. Accordingly, the results
and financial position of foreign subsidiaries must be translated into the presentation currency of the Group from their functional currencies
i.e. the currency of the primary economic environment in which the entity operates. All assets and liabilities of foreign subsidiaries are
converted at year end exchange rates whilst all income and expenses are converted at average exchange rates where this is a reasonable
approximation of the rates prevailing on transaction dates. The impact of these currency translations is recorded as a separate component
of equity.
Foreign currency borrowings that have been used to provide a hedge against Group equity investments in overseas subsidiaries, are
translated at year end exchange rates and taken directly to shareholders’ equity. Other foreign currency monetary items are translated at
year end exchange rates with changes recognised in the income statement. Foreign currency transactions are translated at the spot rate
prevailing at the time.
(iv) Presentation of supplementary analysis of profit before tax attributable to shareholders
The Group provides supplementary analysis of profit before tax attributable to shareholders that distinguishes operating profit based on
longer-term investment returns from other constituent elements of the total profit. As a result of the differences described above, in respect
of adoption of the standards IAS 32, IAS 39 and IFRS 4 from 1 January 2005, the 2004 analysis is prepared on an inconsistent basis from
that in 2005 and those intended to be presented in future years. The key area of difference relates to the valuation basis of derivatives and
debt securities of JNL as described in section B1.
Operating profit based on longer-term investment returns
Previously under UK GAAP, the Group used operating profit based on longer-term investment returns before amortisation of goodwill
as a supplemental measure of its results. For the purposes of measuring operating profit, investment returns on shareholder-financed
business were based on the expected longer-term rates of return. For debt securities, the longer-term returns (including losses arising
on the recognition of permanent diminutions in value) were averaged over five years for inclusion in operating profit.
Under IFRS, the Group continues to use operating profit based on longer-term investment returns as a supplemental measure of its results
as explained in notes A3 and A6. For the purposes of measuring operating profit based on longer-term investment returns, investment
returns on shareholder-financed business continue to be based on the expected longer-term rate of return. However, for debt securities,
the five year averaging approach described above has been replaced with a basis that more closely reflects longer-term experience.
The amounts included in operating results for longer-term capital returns for debt securities comprise two components. These are a risk
margin reserve based charge for expected defaults, which is determined by reference to the credit quality of the portfolio, and amortisation
of interest-related realised gains and losses to operating results based on longer-term investment returns to the date when sold bonds
would have otherwise matured. This change has been applied following a comprehensive review of the Group’s accounting policies and
is unrelated to the requirements of IFRS. The change is of most importance to the determination of the operating result based on longer-
term investment returns of JNL. Total profits are unaffected by the change of basis of determining longer-term investment returns.

82 Prudential plc Annual Report 2005
A4: Significant accounting policies continuedItems excluded from operating profit based on longer-term investment returns
Items excluded from operating profit based on longer-term investment returns but included in profit before tax attributable to shareholders
of continuing operations, include goodwill impairment charges, short-term fluctuations in investment returns (i.e. actual less longer-term
returns), actuarial gains and losses on defined benefit pension schemes and exceptional items.
With the exception of derivatives used for managing equity exposure, value movements on derivatives held by JNL are included within
short-term fluctuations. For the purposes of distinguishing actuarial gains and losses on defined benefit pension schemes in this analysis,
plan assets include Prudential policies held by the schemes.
A5: Changes from previous accounting basis and reconciliation to previously published 2004 resultson first-time adoption of IFRSThe changes of accounting policies from those applied for UK GAAP that arise on the conversion to IFRS basis reporting are numerous
and extend to many elements of income, expenditure, assets and liabilities. The policy changes from the previously published 2004
UK GAAP audited financial statements which are of significance to reported results are detailed below. These changes affect the basis
of preparation for the results for 2004, 2005 and, subject to policy changes, future accounting periods. In addition to these changes,
significant additional policy changes arose in 2005. These additional changes are not required to be retrospectively applied to the 2004
results. The additional changes that affect the 2005 results are described in note A6.
Basis of preparation
Under UK GAAP, the Group’s consolidated financial statements were previously prepared in accordance with applicable accounting
standards under UK GAAP including being in accordance with the SORP issued in November 2003 by the ABI.
The date of adoption of IFRS is 1 January 2004. As at that date the Group has applied all International Accounting Standards Board (IASB)
standards on a basis prescribed or permitted by those standards in the preparation of its consolidated financial statements.
In general, a Group is required to determine its IFRS accounting policies and apply those retrospectively to determine its opening balance
sheet under IFRS. However, in accordance with IFRS 1, the Group has applied the mandatory exceptions and certain optional exemptions
from full retrospective application of IFRS.
Significant exemptions from full retrospective application elected by the Group are as follows:
Business combinations
The Group has elected not to apply retrospectively the provisions of IFRS 3, ‘Business Combinations’ to business combinations that
occurred prior to 1 January 2004. At the date of adoption, therefore, no adjustment was made between UK GAAP and IFRS shareholders’
equity for any historical business combination. Consistent with this approach, goodwill recognised in the opening balance sheet at
1 January 2004 for acquired businesses that have previously been consolidated, is the same as previously shown under UK GAAP.
Goodwill on newly consolidated entities, for example on venture subsidiaries of the PAC with-profits fund, is determined by reference
to net identifiable assets at transition date.
Comparatives
The Group has taken advantage of the exemption within IFRS that allows comparative information presented in the first year of adoption
of IFRS not to comply with the standards IAS 32, IAS 39 and IFRS 4.
Consolidation principles
Inter-company transactions
Previously, under UK GAAP, all inter-company transactions were eliminated on consolidation except for investment management fees
charged by M&G and the Group’s US and Asia fund management operations to long-term business funds.
Under IFRS, all inter-company transactions are eliminated on consolidation. Investment management fees charged by M&G, and the
Group’s US and Asia fund management operations to long-term business funds are recorded within inter-segment revenue and
expenditure as set out in note D but eliminated on consolidation in the income statement.
Entities subject to consolidation
Previously, under UK GAAP, the assets and liabilities and results of entities were consolidated where Prudential had a controlling interest
under the terms of Companies Act legislation, FRS 2, ‘Accounting for Subsidiary Undertakings’ and other relevant UK GAAP interpretations.
Entities are consolidated under IFRS if they fall within the scope of IAS 27, ‘Consolidated and Separate Financial Statements’ and the
IFRIC interpretation, SIC 12, ‘Consolidation – Special Purpose Entities’, of the IASB. Under IFRS, certain investment vehicles are newly
consolidated due to the requirements differing from UK GAAP.
Notes on the Group financial statements continued

Prudential plc Annual Report 2005 83
A5: Changes from previous accounting basis and reconciliation to previously published 2004 resultson first-time adoption of IFRS continuedBasis of presentation of tax charges
Historically, under Companies Act requirements, tax charges attributable to policyholders and unallocated surplus of with-profits funds
and unit-linked policies were charged, together with tax charges attributable to the long-term business result attributable to shareholders,
as an expense in the long-term business technical account of the profit and loss account. In the non-technical section (i.e. the summary
profit and loss section attributable to shareholders) the post-tax balance transferred from the long-term business technical account was
grossed up by attributable shareholder tax to derive the pre-shareholder tax long-term business result. Tax charges in the non-technical
account reflected the aggregate of the shareholder tax on the long-term business result and on the Group’s other results.
Under UK Listing Authority rules, profit before tax is required to be presented. This requirement, coupled with the fact that IFRS does
not contemplate tax charges which are attributable to policyholders and unallocated surplus of with-profits funds and unit-linked policies,
necessitates the reporting of total tax charges within the presented results. The result before all taxes i.e. ‘profit before tax’ as shown in
the income statement represents income net of post-tax transfers to unallocated surplus of with-profits funds, before tax attributable to
policyholders and unallocated surplus of with-profits funds, unit-linked policies and shareholders. Separately, within the income statement
‘profit before tax attributable to shareholders’ is shown after deduction of taxes attributable to policyholders and unallocated surplus of
with-profits funds and unit-linked policies. Tax charges on this measure of profit reflect the tax charges attributable to shareholders. In
determining the tax charges attributable to shareholders, the Group has applied a methodology consistent with that previously applied
under UK GAAP reflecting the broad principles underlying the tax legislation of life assurance companies.
Pension costs
Under UK GAAP, the Group applied the provisions of SSAP 24, ‘Pension Costs’. Consistent with the surplus financial position of the PSPS
(which accounts for 90 per cent of the liabilities of the Group’s defined benefit pension schemes) at 5 April 2002, which was at the time
when the scheme was last subject to a full triennial actuarial valuation, and the scheme rules over minimum levels of funding, no SSAP 24
basis prepayment or provision has been reported in the Group’s UK GAAP balance sheet. Additional disclosures were made in the notes
to the Group’s financial statements concerning the Group’s UK defined benefit schemes, applying the methodology prescribed by FRS 17,
‘Retirement Benefits’.
Under IAS 19, ‘Employee Benefits’, the impact of the surplus or deficit of defined benefit pension schemes on the consolidated net
assets of the Group is determined by the difference between the fair value of assets held within the schemes and the net present value
of projected future cash flows based on accrued liabilities. The net present value is determined by applying a discount rate based on the
yield at the balance sheet date on high-quality corporate bonds.
The deficits on the Group’s defined benefit pension schemes are apportioned between shareholders’ equity and unallocated surplus
of the PAC with-profits fund based on the weighted cumulative activity attaching to the contributions paid into the schemes in the past.
For the PSPS scheme for 2004 it was estimated that 80 per cent of the deficit was attributable to the PAC with-profits sub-fund and
20 per cent to shareholder-backed operations. For 2005, following further detailed consideration of the sourcing of previous contributions
by group companies and funds, the ratio has been altered to 70/30 for the allocation of the deficit between the PAC with-profits sub-fund
and shareholder-backed operations.
The IFRS income statement charge for pension costs normally comprises two items, namely:
(a) The aggregate of the actuarially determined service cost of the currently employed personnel, the unwind of discount on liabilities at
the start of the year, less the expected investment return on the scheme assets at the start of the reporting year; and
(b) Actuarial gains and losses. These gains and losses arise from changes in assumptions, the difference between actual and expected
investment return on the scheme assets, and experience gains and losses on liabilities.
For 2005, additional gains and losses have been recognised as explained in note B1.
Goodwill
Under UK GAAP, with effect from 1 January 1998, goodwill arising from acquisitions was recognised as an asset on the balance sheet and
amortised through the consolidated profit and loss account on a straight-line basis over its estimated useful life, not exceeding 20 years.
Prior to 1 January 1998, goodwill relating to acquisitions was charged directly to shareholders’ funds. As permitted under the transitional
arrangements of FRS 10, ‘Goodwill and Intangible Assets’, amounts previously charged to shareholders’ funds were not reinstated as
assets in the UK GAAP balance sheet.
Under IFRS, subject to reassessment of previously recognised assets and liabilities in accordance with IFRS 1, the goodwill balance at
1 January 2004 reflects the carrying value of UK GAAP goodwill for previously consolidated entities at that date on the basis described
above, as well as goodwill on certain newly consolidated entities. Under IFRS, goodwill is no longer amortised. However, impairment
testing is required annually and on adoption. In addition, as prescribed by IFRS 1. Goodwill previously charged to shareholders’ funds
on transition is not transferred to the income statement upon disposal of the relevant entity. For 2005, an impairment charge in respect
of goodwill attaching to the Japan life insurance business was required.

84 Prudential plc Annual Report 2005
A5: Changes from previous accounting basis and reconciliation to previously published 2004 resultson first-time adoption of IFRS continuedShare-based payments
The Group offers share awards and option plans for certain key employees and a SAYE plan for all UK and certain overseas employees.
The arrangements for distribution to employees of shares held in trusts relating to share award plans and for entitlement to dividends
depend upon the particular terms of each plan. Shares held in trusts relating to non-SAYE plans are conditionally gifted to employees.
Previously, under UK GAAP, compensation for non-SAYE plans was recorded over the periods to which share awards or options were
earned based on intrinsic value. No costs were required to be recorded for SAYE plans.
Under IFRS, share-based payments are accounted for on a fair value basis. The fair value is recognised in the income statement over the
relevant vesting period and adjusted for lapses and forfeitures with the number of shares expected to lapse or be forfeited estimated at
each balance sheet date prior to the vesting date. The only exception is where the share-based payment depends upon vesting outcomes
attaching to market-based performance conditions such as in the case of the Restricted Share Plan (RSP). Under these circumstances
additional modelling is required to take into account these market-based performance conditions which effectively estimate the number
of shares expected to vest. No subsequent adjustment is then made to the fair value charge for shares that do not vest on account of
these performance conditions not being met.
Shareholders’ dividends
Previously, under UK GAAP, shareholders’ dividends were accrued in the period to which they related regardless of when they were
declared. Under IFRS, dividends declared after the balance sheet date in respect of the prior reporting period are treated as a non-adjusting
event. The appropriation reflected in the statement of changes in equity, therefore, includes the final dividend in respect of the prior year.
Notes on the Group financial statements continued

Prudential plc Annual Report 2005 85
A5: Changes from previous accounting basis and reconciliation to previously published 2004 resultson first-time adoption of IFRS continuedReconciliation of income statement for 2004
The following table reconciles the income statement for the year ended 31 December 2004 as previously published under UK GAAP to
the IFRS basis income statement for that year as presented in the comparatives to the 2005 income statement.
IFRS adjustments
Recognition,Presentation measurementof UK GAAP and other
UK GAAP in IFRS format changes IFRS(note i) (note i) (notes ii and iii) basis
Year ended 31 December 2004 £m £m £m £m
Earned premiums, net of reinsurance 16,099 53 16,152
Investment income 13,917 2,082 (249) 15,750
UK fund management result 136 (136) 0
US broker-dealer and fund management result (14) 14 0
Asia fund management result 19 (19) 0
UK banking result (continuing operations) 63 (63) 0
Other income 773 1,229 2,002
Total revenue 30,220 2,704 980 33,904
Benefits and claims and movement in unallocated surplus of with-profits funds (26,598) (83) 88 (26,593)
Acquisition costs and other operating expenditure (2,069) (2,434) (1,060) (5,563)
Finance costs: interest on core structural borrowings of shareholder-financed operations (187) (187)
Amortisation of goodwill (continuing operations) (94) 0 94 0
Total charges (28,761) (2,704) (878) (32,343)
Profit before tax* 1,459 102 1,561
Tax attributable to policyholder’s returns (701) (10) (711)
Profit before tax attributable to shareholders 758 92 850
Tax expense (947) (4) (951)
Less: tax attributable to policyholders’ returns 701 10 711
Tax attributable to shareholders’ profit (246) 6 (240)
Profit from continuing operations after tax 512 98 610
Discontinued operations (net of tax) (94) (94)
Profit for the year 418 98 516
Attributable to:
Equity holders of the Company 428 89 517
Minority interests (10) 9 (1)
Profit for the year 418 98 516
*Profit before tax represents income net of post-tax transfers to unallocated surplus of with-profits funds, before tax attributable to policyholders and unallocated surplus of with-profits funds, unit-linked policies and shareholders’ profits.
Notes(i) UK GAAP resultsThe UK GAAP basis results shown above reflect those previously recorded in the technical accounts and non-technical account of the Group’s profit and loss account underCompanies Act requirements. These results are then reconfigured to be consistent with the format applied for reporting in the Group’s 2005 financial statements under IFRS.
(ii) Recognition, measurement and other changes for results attributable to shareholdersChanges to profit from continuing operations (including actual investment returns) before and after tax attributable to shareholders, for 2004 reflect the effects of IFRS adoption.In summary the effects are for:
2004£m
Egg – primarily relates to charges for share-based payments in respect of Egg shares (2)Additional pension costs and share-based payments costs in respect of Prudential plc shares not allocated by business unit (4)Amortisation of goodwill not applied under IFRS 94Actuarial gains and losses of defined benefit schemes recognised under IFRS (7)Value movements of US investment funds newly consolidated under IFRS 2Share of profits of venture investment companies and property partnerships of the PAC with-profits fund, newly consolidated
under IFRS, that is attributable to external investors 9
Total changes before tax 92Related tax attributable to shareholders 6
Total changes after tax 98
(iii) Recognition, measurement and other changes for results attributable to the with-profits fundsChanges to revenue, charges, and related tax of the Group’s with-profits funds principally relate to measurement differences on investments, consolidation criteria for venturefund and other investment subsidiaries, and pension cost accounting. These amounts have been reflected by changes of an equal and opposite amount to transfers to unallocatedsurplus with no net effect on shareholder results.

86 Prudential plc Annual Report 2005
A5: Changes from previous accounting basis and reconciliation to previously published 2004 resultson first-time adoption of IFRS continuedReconciliations of equity and balance sheet
This table reconciles IFRS shareholders’ equity at 1 January 2004, the IFRS transition date, from that previously published under UK GAAP.
Shareholders’ Minority Totalequity interests equity
At 1 January 2004 £m £m £m
Changes on adoption of statutory IFRS basis
Treasury shares adjustment for Prudential plc shares held by unit trusts newly consolidated
under IFRS (note i) (40) (40)
Minority share of equity of consolidated venture investments companies and property partnerships
of the PAC with-profits fund (note i) 32 32
Shareholders’ share of deficits (net of tax) of UK defined benefit pension schemes (note ii) (110) (110)
Timing difference on recognition of dividend declared after balance sheet date (note iii) 214 214
Other items (11) (2) (13)
Total 53 30 83
Equity at 1 January 2004
As previously published under UK GAAP 3,240 107 3,347
As restated under IFRS 3,293 137 3,430
Notes on the Group financial statements continued

Prudential plc Annual Report 2005 87
A5: Changes from previous accounting basis and reconciliation to previously published 2004 resultson first-time adoption of IFRS continuedThe following table provides a reconciliation of the summarised balance sheet at 31 December 2004 between previously published
UK GAAP and the IFRS balance sheet included in the comparatives to the 2005 financial statements.
Effect of changes on implementation of IFRSrecognition and measurement changes
Defined Otherbenefit recognition
Newly pension and Grossing-upconsolidated schemes measurement and other
entities accounting changes format Total IFRS IFRSUK GAAP (note i) (note ii) (note iii) changes changes basis
At 31 December 2004 £m £m £m £m £m £m £m
Assets
Goodwill:
Attributable to PAC with-profits fund 784 784 784
Attributable to shareholders 1,367 94 94 1,461
Investments: per IFRS balance sheet 1,963 35 162,388 164,386 164,386
Investments: per UK GAAP analysis (non-linked, linked and
banking business assets) 129,468 (129,468) (129,468) 0
Other items 43,741 1,477 102 50 (31,995) (30,366) 13,375
Total assets 174,576 4,224 102 179 925 5,430 180,006
Equity and liabilities
Equity
Shareholders’ equity 4,281 (30) (117) 355 208 4,489
Minority interests 71 68 (2) 66 137
Total equity 4,352 38 (117) 353 274 4,626
Liabilities
Banking customer accounts: per IFRS balance sheet 6,607 6,607 6,607
Banking business liabilities: per UK GAAP balance sheet 11,216 (11,216) (11,216) 0
Policyholder liabilities and unallocated surplus of
with-profits funds:
Technical provisions 129,101 (125) 8 78 (39) 129,062
Unallocated surplus of with-profits funds 16,686 (31) (472) (34) (537) 16,149
Borrowings: per IFRS balance sheet:
Core structural borrowings of shareholder-financed operations 3,248 3,248 3,248
Operational borrowings attributable to shareholder-financed
operations 972 9 5,440 6,421 6,421
Borrowings attributable to with-profits funds 1,888 105 144 2,137 2,137
Borrowings: per UK GAAP balance sheet (subordinated
liabilities, debenture loans and other borrowings) 4,673 (4,673) (4,673) 0
Dividend payable 253 (253) (253) 0
Other non-insurance liabilities 8,295 1,357 816 (9) 1,297 3,461 11,756
Total liabilities 170,224 4,186 219 (174) 925 5,156 175,380
Total equity and liabilities 174,576 4,224 102 179 925 5,430 180,006
Notes(i) Newly consolidated entitiesUnder IAS 27 and SIC 12, the Group is required to consolidate the assets and liabilities of certain entities which have previously not been consolidated. The principal change to shareholders’ equity arises from an adjustment in respect of Prudential plc shares held by unit trusts that are newly consolidated. These shares are accounted for as treasuryshares and the cost of purchase of £44 million and £29 million is deducted from shareholders’ equity at 1 January 2004 and 31 December 2004 respectively. The change to theminority share of equity reflects external parties’ interest in consolidated venture investment companies and property partnerships of the PAC with-profits fund. Measurementchanges to the carrying value of these companies that are attributable to the PAC with-profits fund share are reflected in unallocated surplus.
(ii) Defined benefit pension schemes accountingProvisions for deficits on the Group’s defined benefit pension schemes are absorbed by the unallocated surplus of the PAC with-profits fund and shareholders’ funds on a basis that reflects the weighted cumulative activity attaching to the contributions paid in the past, and after deduction of deferred tax. The M&G scheme held Prudential Groupinsurance policies as scheme assets amounting to £125 million at 31 December 2004. The asset and liability are eliminated on consolidation.
(iii) Other recognition and measurement changesUnder IFRS, dividends declared after the balance sheet date are not recognised as a liability. In addition, subject to required impairment testing, goodwill under IFRS is thecarrying value at adoption date as discussed above. Adjustments in the table include the write-back of amortisation previously charged under UK GAAP from 1 January 2004.
Cash flow
Under IFRS, the cash flow statement includes a number of format and presentational differences to that under UK GAAP. The most
significant difference relates to long-term business fund cash flows.
Previously, under UK GAAP, the Group’s cash flow statement excluded the cash flows of long-term business funds, except for the transfer
to shareholders’ funds. Under IFRS the cash flow statement comprises consolidated cash flows for the Group as a whole, including those
of long-term business funds.
88 Prudential plc Annual Report 2005
A6: Changes of accounting policy in 2005The accounting policy changes from those applied previously for UK GAAP consist of those described in note A5 and the additional
changes described in this note.
Adoption of IAS 32, IAS 39 and IFRS 4
As previously noted, the Group has chosen to apply the exemption within IFRS that allows comparative information presented in the first
year of adoption of IFRS not to comply with IAS 32, IAS 39 and IFRS 4. These standards have been formally adopted on 1 January 2005.
The principal effects of adopting these standards arises in the Group’s UK long-term business contracts, JNL’s debt securities and
derivative instruments, and Egg’s banking assets, liabilities and derivatives positions.
Long-term business
On adoption of these standards, the measurement basis of assets and liabilities of long-term business contracts is dependent upon the
classification of the contracts under IFRS 4 as either ‘insurance’ contracts, if the level of insurance risk in the contracts is significant, or
‘investment’ contracts, if the risk is insignificant. Insurance contracts are permitted to be accounted for under previously applied GAAP.
The Group has chosen to apply this approach. However, as an improvement to accounting policy, permitted by IFRS 4, the Group has
applied the requirements of the UK standard FRS 27 to its UK with-profits funds as explained in note A4. For those ‘investment’ contracts
with discretionary participation features, IFRS 4 also permits the continued application of previously applied GAAP. The Group has chosen
to apply this approach.
For those ‘investment’ contracts that do not contain discretionary participating features, IAS 39 and, where the contract includes an
investment management element, IAS 18, apply measurement principles to the assets and liabilities attaching to the contract that may
diverge from those previously applied under UK GAAP. The changes primarily arise in respect of deferred acquisition costs, deferred
income reserves and provisions for future expenses commonly called ‘sterling reserves’.
Under UK GAAP, acquisition expenses are deferred with amortisation on a basis commensurate with the anticipated emergence of
margins under the contract. Under IFRS, incremental costs that are directly attributable to securing investment management contracts
are recognised as an asset that represents the entity’s contractual right to benefit from providing investment management services and
is amortised as the entity recognises the related revenue. IAS 18 further reduces the costs potentially capable of deferral to incremental
costs only. Deferred acquisition costs are amortised to the income statement in line with service provision.
Deferred income provisions for front-end fees and similar arrangements are required to be established for investment management
contracts under IAS 18 with amortisation over the expected life of the contract in line with service provision. In contrast to UK GAAP,
sterling reserves are not permitted to be recognised under IFRS. An additional feature is that investment contracts are closer in nature to a
deposit style arrangement between the investors and the Company. Under IFRS, premiums and withdrawals for these contracts are recorded
within the balance sheet directly as a movement on the investors liability. After making these and other consequential changes, the IFRS
income statement reflects fee income on the contracts, expenses and taxation rather than the UK GAAP basis profit and loss account.
The investment contract classification applies primarily to certain unit-linked and similar contracts in the UK insurance operations and
guaranteed investment contracts (GICs) of JNL. Significant differences between the timing of recognising profits under UK GAAP and
IFRS bases are confined to the UK contracts only.
JNL debt securities and derivative instruments
Under IAS 39, except for loans and receivables, and unless designated under the very restrictive held-to-maturity classification on an
asset by asset basis, most financial assets, including all derivatives, are measured at fair value. To this extent IAS 39 is consistent with the
basis of valuation applied under UK GAAP for most financial assets of the Group’s UK and Asian insurance operations. On application
of IAS 39, movements in the fair value of investments are recorded either in the income statement or directly in equity, depending upon
the designation and the application of hedge accounting rules. Derivative instruments are carried at fair value with value movements
being recorded in the income statement. Hedge accounting, whereby value movements on derivatives and hedged items are recorded
together in the income statement, is permissible only if certain criteria are met regarding documentation and continued measurement
of hedge effectiveness.
The changes from UK GAAP to the basis applied from 1 January 2005 arising from these valuation requirements are concentrated on
the accounting for the investments and derivatives of JNL. Previously, the debt securities of JNL, unless impaired, were accounted for
at amortised cost with derivatives similarly treated. On adoption of IAS 39, the Group has decided to account for JNL’s debt securities
on an available-for-sale basis whereby the debt securities are accounted for at fair value with movements in fair value being recorded
in the statement of changes in equity i.e. directly to shareholders’ reserves rather than the income statement. Value movements for
JNL’s derivatives are, however, recorded in the income statement as required by IAS 39.
The Group has decided not to seek to hedge account for the majority of JNL’s derivatives under IAS 39. To do so would require a
wholesale reconfiguration of JNL’s derivative book into much smaller components than currently applied by JNL through its economic
hedge programme, accompanied by an extra layer of hedging instruments beyond what is economically rational.
Notes on the Group financial statements continued

Prudential plc Annual Report 2005 89
A6: Changes of accounting policy in 2005 continuedEgg
The changes of policy for Egg arising from the adoption of IAS 39 arise primarily in respect of determination of effective interest rates,
impairment losses on loans and advances to customers, carrying values of wholesale financial instruments and equity savings products.
For credit card receivables, under UK GAAP, the carrying amount of credit card receivables with low or zero rate interest on balance
transfers are carried at cost with interest being accrued at 0 per cent during the incentive period and then at the standard rate thereafter.
Under IAS 39, these receivables are measured on an amortised cost basis.
For loans and advances to customers, specific and formulated provisions are raised against non-performing loans and a general provision
against the balance. Under IAS 39, an impairment loss is only recognised when there is objective evidence that a debt is impaired.
Wholesale instruments, under UK GAAP, were previously accounted for on an amortised cost basis. Under IAS 39, certain wholesale
financial instruments are required to be measured at fair value, and depending on whether they have been classified as fair value through
the profit and loss or available-for-sale, the changes in fair value are recognised in the income statement or in equity respectively. The
adjustments for wholesale financial instruments also include the impact of designating some of Egg’s derivatives as cash flow hedges.
Certain equity savings products contain embedded derivatives. These contracts have been separated under IFRS with the host contract
accounted for on an amortised cost basis and the embedded derivatives on a fair value basis.
The following table demonstrates the effects of adoption of IAS 32, IAS 39 and IFRS 4 on the IFRS balance sheet at 31 December 2004.
Effect of adoption of IAS 32, IAS 39 and IFRS 4
Banking UK and non- Grossing-up
At 31 Dec insurance insurance and other2004 operations JNL operations format At 1 Jan
(note A5) (note i) (note ii) (note iii) changes Total effect 2005£m £m £m £m £m £m £m
Assets
Goodwill 2,245 2,245
Other intangibles:
PAC with-profits fund 798 (765) (765) 33
Other operations 2,244 23 (456) (433) 1,811
Total 3,042 (742) (456) (1,198) 1,844
Other non-investment and non-cash assets:
Property, plant and equipment 967 967
Reinsurers’ share of policyholder liabilities 1,018 1,018
Deferred tax assets 827 10 67 7 84 911
Current tax recoverable 159 159
Accrued investment income 1,733 (50) (50) 1,683
Other debtors 1,188 (1) (49) (50) 1,138
Total 5,892 10 66 (92) (16) 5,876
Investments of long-term business, banking and other operations:
Investment properties 13,303 13,303
Investments accounted for using the equity method 5 5
Financial investments:
Loans and receivables 12,430 (55) 58 3 12,433
Equity securities and portfolio holdings in unit trusts 54,466 (21) (21) 54,445
Debt securities 76,374 (76) 1,023 (2) 945 77,319
Other investments 2,537 1 234 89 95 419 2,956
Deposits 5,271 6 5 (27) (16) 5,255
Total investments 164,386 (145) 1,262 145 68 1,330 165,716
Held for sale assets 100 0 100
Cash and cash equivalents 4,341 0 4,341
Total assets 180,006 (877) 872 53 68 116 180,122

90 Prudential plc Annual Report 2005
A6: Changes of accounting policy in 2005 continuedEffect of adoption of IAS 32, IAS 39 and IFRS 4
BankingUK and non- Grossing-up
At 31 Dec insurance insurance and other2004 operations JNL operations format At 1 Jan
(note A5) (note i) (note ii) (note iii) changes Total effect 2005£m £m £m £m £m £m £m
Equity and liabilities
Equity
Shareholders’ equity 4,489 (22) 273 (25) 226 4,715
Minority interests 137 (3) (3) 134
Total equity 4,626 (22) 273 (28) 223 4,849
Liabilities
Banking customer accounts 6,607 84 84 6,691
Policyholder liabilities and unallocated surplus:
Insurance contract liabilities 103,582 103,582 103,582
Investment contract liabilities with discretionary
participation features 22,661 22,661 22,661
Unallocated surplus of the with-profits funds:
Reflecting application of ‘realistic’ basis provisions
for UK regulated with-profits funds 8,342 8,342 8,342
Reflecting previous UK GAAP basis of provisioning 16,149 (7,807) (8,342) (16,149)
Investment contract liabilities without discretionary
participation features 9,788 9,788 9,788
Technical provisions in respect of non-linked business 104,996 7,020 (51) (111,965) (104,996)
Technical provisions for linked liabilities 24,066 (24,066) (24,066)
Total policyholder liabilities 145,211 (787) (51) 0 (838) 144,373
Core structural borrowings of shareholder-financed operations:
Subordinated debt (other than Egg) 1,429 5 5 1,434
Other 1,368 1,368
2,797 5 5 2,802
Egg subordinated debt 451 451
Total 3,248 5 5 3,253
Operational borrowings attributable to shareholder-financed
operations 6,421 207 62 (13) 256 6,677
Borrowings attributable to with-profits funds 2,137 2,137
Other non-insurance liabilities:
Obligations under funding, securities lending and sale and
repurchase agreements 3,819 3,819
Net asset value attributable to unit holders of consolidated
unit trusts and similar funds 808 808
Current tax liabilities 1,018 (4) (4) 1,014
Deferred tax liabilities 2,279 (91) 218 (6) 121 2,400
Accruals and deferred income 655 (88) (88) 567
Other creditors 996 8 (54) (46) 950
Provisions 1,006 1,006
Other liabilities 1,175 15 229 83 76 403 1,578
Total other non-insurance liabilities 11,756 (68) 443 (65) 76 386 12,142
Total liabilities 175,380 (855) 599 81 68 (107) 175,273
Total equity and liabilities 180,006 (877) 872 53 68 116 180,122
NotesThe changes shown above include the impact of remeasurement for:(i) UK insurance operations(a) The reduction in shareholders’ equity of £22 million includes £20 million relating to certain unit-linked and similar contracts that do not contain significant insurance risk andare therefore categorised as investment contracts under IFRS 4.
Notes on the Group financial statements continued

Prudential plc Annual Report 2005 91
A6: Changes of accounting policy in 2005 continued(b) Changes to insurance assets and liabilities of the PAC with-profits fund following the improvement of accounting policy applied on adoption of IFRS 4. The changes correspondto those applicable if the Group had adopted FRS 27 under UK GAAP. As a result of the policy improvement, liabilities, deferred acquisition costs, deferred tax and unallocatedsurplus of UK regulated with-profits funds are remeasured as described in note A4. At 1 January 2005, the unallocated surplus is subject to a transition adjustment of £(7.8) billion.Shareholders’ equity is not affected by this change.
The unallocated surplus of £8.3 billion at 1 January 2005 post IAS 39 and IFRS 4 adoption, comprises £8.0 billion for the PAC with-profits fund and £0.3 billion for Asian subsidiaries.The £8.0 billion for the PAC with-profits fund represents:
£bn
Regulatory basis realistic surplus of with-profits sub-fund and SAIF 6.0Add back: regulatory basis provision for future shareholder transfers 2.9Less: other adjustments to align with accounting basis (0.9)
Accounts basis 8.0
(ii) Jackson National LifeUnder IAS 39, JNL’s debt securities and derivative financial instruments are remeasured to fair value from the lower of amortised cost and, if relevant, impaired value. Fair valuemovements on debt securities, net of ‘shadow’ changes to deferred acquisition costs and related deferred tax are recorded directly to equity. Fair value movements on derivativesare recorded in the income statement.
(iii) Banking and non-insurance operationsUnder IAS 39, for Egg, changes to opening equity at 1 January 2005 arise from altered policies for effective interest rate on credit card receivables, impairment losses on loansand advances, fair value adjustments on wholesale financial instruments and embedded derivatives in equity savings products. The net effect on shareholders’ equity of thesechanges, after tax, is a deduction of £15 million. A further £10 million reduction in equity arises on fair valuation of certain centrally held financial instruments and derivatives.
Supplemental earnings information and discretionary non-IFRS change of policy for longer-term investment returns
As indicated above, under UK GAAP, the Group used operating profit based on longer-term investment returns before amortisation
of goodwill as a supplemental measure of its results. For the purposes of measuring operating profit, investment returns on shareholder-
financed business were based on the expected longer-term rates of return. For debt securities, the longer-term returns (including losses
arising on the recognition of permanent diminutions in value) were averaged over five years for inclusion in operating profit.
Under IFRS, the Group continues to use operating profit based on longer-term investment returns as a supplemental measure of its results,
as explained in notes A3 and A4. For the purposes of measuring operating profit based on longer-term investment returns, investment
returns on shareholder-financed business continue to be based on the expected longer-term rate of return. However, for debt securities,
the five year averaging approach previously applied under UK GAAP has been replaced with a basis that more closely reflects longer-term
experience. The amounts included in operating results for longer-term capital returns comprises two components. These are a risk margin
reserve based charge for expected defaults, which is determined by reference to the credit quality of the portfolio, and amortisation of
interest-related realised gains and losses to operating results based on longer-term investment returns to the date when sold bonds would
have otherwise matured. This change has been applied following a comprehensive review of the Group’s accounting policies and is
unrelated to the requirements of IFRS. The change is of most importance to the determination of the operating results based on longer-
term investment returns of JNL. Total profits are unaffected by the change of basis in determining longer-term investment returns.
Items excluded from operating profit, but included in total pre-tax profit of continuing operations, include goodwill impairment charges,
short-term fluctuations in investment returns (i.e. actual less longer-term returns), actuarial gains and losses on defined benefit pension
schemes and exceptional items. For the purposes of distinguishing actuarial gains and losses on defined benefit pension schemes in this
analysis, plan assets include Prudential policies held by the scheme. Total profits are unaffected by the change of basis of determining
longer-term investment returns.
The supplemental earnings information in the statutory basis financial statements is presented in note B1. The 2004 and 2005 analyses are
not comparable because the comparative 2004 results do not incorporate the effects of adoption of IAS 32, IAS 39 and IFRS 4 and are thus
inconsistent with the basis of preparation for the 2005 results. A comparison of supplemental earnings information based on the IFRS basis
results for 2005 and pro forma IFRS results for 2004, which reflect the estimated effects of adoption of these three standards on the 2004
results of the Group’s insurance operations, is included in the supplementary IFRS results within the Group’s annual report.

92 Prudential plc Annual Report 2005
A7: New accounting pronouncementsThe following standards, interpretations and amendments have been issued but are not yet effective. This is not intended to be a
complete list as only those standards, interpretations and amendments that are anticipated to have a future impact upon Prudential’s
financial statements have been discussed.
IFRS 7, ‘Financial Instruments: Disclosures’
IFRS 7 replaces IAS 30, ‘Disclosures in the Financial Statements of Banks and Similar Financial Institutions’, which dealt with disclosures for
banking operations, and the disclosure requirements of IAS 32, ‘Financial Instruments: Disclosure and Presentation’. The latter therefore
becomes a standard dealing wholly with presentation of financial instruments. IFRS 7 is intended to complement the principles for
recognising, measuring and presenting financial assets and financial liabilities in IAS 32 and IAS 39, ‘Financial Instruments: Recognition
and Measurement’. The objective of IFRS 7 is to require entities to provide disclosures in their financial statements to enable the users
of financial statements to evaluate the significance of financial instruments for the entity’s financial position and performance and the
nature and extent of risks arising from financial instruments to which the entity is exposed, and how the entity manages those risks.
Consequential amendments have been made to other standards as a result of the release of IFRS 7, notably IAS 1, ‘Presentation of
Financial Statements’ and IFRS 4, ‘Insurance Contracts’.
IFRS 7 was issued on 18 August 2005 and is effective for annual periods beginning on or after 1 January 2007.
Revised IFRS 4, ‘Implementation Guidance’
Revised IFRS 4 ‘Implementation Guidance’ was issued in December 2005 and is effective in conjunction with the adoption of IFRS 7 as
discussed above. The revisions relate to disclosures around insurance contracts.
Amendment to IAS 1, ‘Capital Disclosures’
As a result of the issue of IFRS 7, IAS 1 was amended in August 2005 to include a requirement to disclose information on the entity’s
objectives, policies and processes for managing capital. This amendment will become effective for annual periods beginning on or after
1 January 2007.
Amendment to IAS 39, ‘Cash Flow Hedge Accounting of Forecast Intra-group Transactions’
Amendments in respect of cash flow hedge accounting of forecast intra-group transactions were issued in April 2005 to clarify the
accounting treatment of certain foreign currency cash flow hedges. The amendments are effective for annual periods beginning on
or after 1 January 2006.
Amendment to IAS 39 and IFRS 4, ‘Financial Guarantee Contracts’
Issued in August 2005, the amendments to IAS 39 and IFRS 4 in respect of financial guarantee contracts are effective for annual periods
beginning on or after 1 January 2006. These amendments define a financial guarantee contract and address initial and subsequent
measurement issues. These amendments apply even if the contract meets the definition of an insurance contract under IFRS 4 although
they allow continuation of accounting under IFRS 4 if the contracts were considered to be insurance contracts and documented as such.
The Group is currently assessing the impact of the aforementioned standards, revisions and amendments on its financial statements.
The Group has not early-adopted any of the above noted items.
Notes on the Group financial statements continued

Prudential plc Annual Report 2005 93
B: Summary of results
B1: Supplementary analysis of profit before tax attributable to shareholdersThis information is provided as supplementary information under the Group’s accounting policies. It is not required by IFRS standards.
2004 2005 (note i)
£m £m
UK operationsUK insurance operations (note iii) 400 305M&G 163 136Egg 44 61
Total 607 502
US operationsJackson National Life (note iii) 348 296Broker-dealer and fund management (including Curian losses of £10m (2004: £29m)) 14 (14)
Total 362 282
Asian operationsLong-term business (note iii) 195 117Fund management (note iv) 12 19Development expenses (20) (15)
Total 187 121
Other income and expenditureInvestment return and other income 87 44Interest payable on core structural borrowings (175) (154)Corporate expenditure:
Group Head Office (70) (51)Asia Regional Head Office (30) (29)
Charge for share-based payments for Prudential schemes (11) (7)
Total (199) (197)
Operating profit from continuing operations based on longer-term investment returns (note ii) 957 708Goodwill impairment charge (note v) (120) –Short-term fluctuations in investment returns on shareholder-backed business (note vi) 211 149Shareholders’ share of actuarial and other gains and losses on defined benefit pension schemes (note vii) (50) (7)
Profit from continuing operations before tax attributable to shareholders 998 850
Notes(i) Basis of preparationExcept in respect of three IFRS standards the 2005 and 2004 results in the table above have been prepared consistently. However, as permitted by the IFRS transition rules, andconsistent with the approach of groups with significant banking operations where retrospective application is complex and onerous, the results include the effects of the adoptionof the standards IAS 32, IAS 39 and IFRS 4 from 1 January 2005 rather than 1 January 2004. The 2004 comparative results are therefore prepared on an inconsistent basis fromthose for 2005. Pro forma basis comparative results for 2004, as if these standards had been applied by the Group’s insurance operations from 1 January 2004, are provided assupplementary information to this report. The pro forma results for 2004 are not audited and do not form part of these financial statements either directly or by cross reference.The principal area of inconsistency between the bases of measurement applied in 2004 and 2005 as it affects profits is related to the valuation of derivatives of Jackson NationalLife (JNL). The value movements on these derivatives are recorded in the income statement for 2005. In the analysis shown above, the movements are included in short-termfluctuations in investment returns (see note (vi) below). For 2004, the derivatives were recorded at amortised cost so value movements do not feature. Other smaller valuationdifferences for investment contracts measured under IAS 39 also slightly affect the comparison of operating profits.
(ii) Operating profit based on longer-term investment returnsOperating profit based on longer-term investment returns is a supplemental measure of results. For the purposes of measuring operating profit, investment returns on shareholder-financed business are based on expected long-term rates of return. The expected long-term rates of return are intended to reflect historical real rates of return and, whereappropriate, current inflation expectations adjusted for consensus economic and investment forecasts. The significant operations that require adjustment for the differencebetween actual and long-term investment returns are JNL and certain businesses of the Group’s Asian operations. The amounts included in operating results for long-term capitalreturns for debt securities comprise two components. These are a risk margin reserve based charge for expected defaults, which is determined by reference to the credit qualityof the portfolio, and amortisation of interest-related gains and losses for operating results based on longer-term results to the date when sold bonds would otherwise have matured.
(iii) Effect of changes to assumptions and bases of determining life assurance liabilitiesThe results of the Group’s long-term business operations are affected by changes of assumptions and bases of preparation. These are described in notes D2(f), D3(f) and D4(f).
(iv) Asian fund management businessOperating profit for the Asian fund management business was £12 million for 2005. The decrease from the results for 2004 reflects the exceptional cost of £16 million incurred in Taiwan due to bond fund restructuring required as a result of industry-wide regulatory change.
(v) Goodwill impairment chargeThe charge for goodwill impairment of £120 million relates to the Japan life business. Further details of the Group’s goodwill are shown in note H1.
(vi) Short-term fluctuations in investment returns on shareholder-backed businessThe fluctuations arise as follows:
2005 2004£m £m
US operations:Movements in market value of derivatives used for economic hedging purposes (2004 not applicable as described in note (i) above) 122 –Actual less longer-term investment returns for other items 56 61
Asian operations 32 37Other operations (including £6m (2004: nil) on sale of partial stake in Indian subsidiary – see note H8) 1 51
211 149

94 Prudential plc Annual Report 2005
B1: Supplementary analysis of profit before tax attributable to shareholders continuedNotes continued(vii) Shareholders’ share of actuarial and other gains and losses on defined benefit pension schemes
2005 2004£m £m
Actuarial lossesActual less expected returns on scheme assets 544 115Experience gains (losses) on liabilities 1 (17)Losses on changes of assumptions for plan liabilities (based on long-term inflation of 2.8%) (489) (141)
56 (43)Less: amount attributable to the PAC with-profits fund (58) 36
(2) (7)
Non-recurrent credit (charge)Shareholders’ share of credit arising from reduction in level of assumed future discretionary increases
for Prudential Staff Pension Scheme (PSPS) for pensions in payment to 2.5% 35 –Losses on re-estimation of shareholders’ share of deficits arising from the PSPS (a) (63) –Strengthening in actuarial provisions for increase in ongoing contributions for future service of active scheme members (b) (20) –
(48) –
Total (50) (7)
(a) Up to 31 December 2004, the deficits arising on the PSPS had been assessed as being 80 per cent attributable to the PAC with-profits fund and 20 per cent to shareholderoperations. In 2005, following additional analysis this apportionment has been altered to a ratio of 70/30.
(b) As a result of the April 2005 scheme valuation and subsequent discussions, the contribution levels for future ongoing service of active members will approximately double.The charge of £20 million reflects the actuarial provision for this increase in expenses for certain insurance contracts.
Further details on the Group’s defined benefit pension schemes are shown in note I1.
B2: Earnings per shareBasic earnings per share is calculated by dividing the earnings attributable to ordinary shareholders by the weighted average number
of ordinary shares outstanding during the year, excluding those held in employee share trusts, which are treated as cancelled.
For diluted earnings per share, the weighted average number of shares in issue is adjusted to assume conversion of all dilutive potential
ordinary shares. The Group’s only class of dilutive potential ordinary shares are those share options granted to employees where the
exercise price is less than the average market price of the Company’s ordinary shares during the year.
Net of tax Basic DilutedBefore tax Tax Minority and minority earnings earnings(note B1) (note F5) interests interests per share per share
2005 £m £m £m £m Pence Pence
Based on operating profit based on longer-term investment returns 957 (186) (10) 761 32.2p 32.2p
Adjustments arising from:
Goodwill impairment charge (120) – – (120) (5.1)p (5.1)p
Short-term fluctuations in investment returns on shareholder-backed
business 211 (70) (2) 139 5.9p 5.9p
Shareholders’ share of actuarial and other gains and losses on
defined benefit pension schemes (50) 15 0 (35) (1.5)p (1.5)p
Based on profit for the year from continuing operations 998 (241) (12) 745 31.5p 31.5p
Adjustment for post-tax results of discontinued operations 3 0 0 3 0.1p 0.1p
Based on profit for the year 1,001 (241) (12) 748 31.6p 31.6p
Net of tax Basic DilutedBefore tax Tax Minority and minority earnings earnings(note B1) (note F5) interests interests per share per share
2004 £m £m £m £m Pence Pence
Based on operating profit based on longer-term investment returns 708 (210) (8) 490 23.1p 23.1p
Adjustments arising from:
Short-term fluctuations in investment returns on shareholder-backed
business 149 (32) (18) 99 4.6p 4.6p
Shareholders’ share of actuarial and other gains and losses on
defined benefit pension schemes (7) 2 0 (5) (0.2)p (0.2)p
Based on profit for the year from continuing operations 850 (240) (26) 584 27.5p 27.5p
Adjustment for post-tax results and profits on business disposals
of discontinued operations (108) 14 27 (67) (3.1)p (3.1)p
Based on profit for the year 742 (226) 1 517 24.4p 24.4p
Notes on the Group financial statements continued

Prudential plc Annual Report 2005 95
B2: Earnings per share continuedNumber of shares
A reconciliation of the weighted average number of ordinary shares used for calculating basic and diluted earnings per share is set out
as below:2005 2004
(millions) (millions)
Weighted average shares for calculation of basic earnings per share 2,365 2,121
Shares under option at end of year 13 13
Number of shares that would have been issued at fair value on assumed option exercise (9) (10)
Weighted average shares for calculation of diluted earnings per share 2,369 2,124
B3: Dividends2005 2004
£m £m
Dividends declared and paid in reporting period
Parent company:
Interim dividend (2005: 5.30p, 2004: 5.19p per share) 126 109
Final dividend for prior period (2004: 10.65p, 2003: 10.29p per share) 252 214
Subsidiary company payment to minority interests 2 –
Total 380 323
Parent company dividends relating to reporting period:
Interim dividend (2005: 5.30p, 2004: 5.19p per share) 126 109
Final dividend (2005: 11.02p, 2004: 10.65p per share) 267 252
Total 393 361
A final dividend of 11.02 pence per share was proposed on 15 March 2006. The dividend will be paid on 26 May 2006 to shareholders on
the register at the close of business on 24 March 2006. The dividend will absorb an estimated £267 million of shareholders’ funds. A scrip
dividend alternative will be offered to shareholders.
B4: New businessInsurance products and investment products*
Insurance products Investment productsgross premiums gross inflows Total
2005 2004 2005 2004 2005 2004£m £m £m £m £m £m
UK operations 7,276 6,538 7,916 5,845 15,192 12,383
US operations 5,023 4,420 414 418 5,437 4,838
Asian operations 1,485 1,172 18,457 19,068 19,942 20,240
Group total 13,784 12,130 26,787 25,331 40,571 37,461
*The format of the tables shown above is consistent with the distinction between insurance and investment products as applied for previous financial reporting periods. With the exception of some US institutional business, products categorised as ‘insurance’ refer to those classified as contracts of long-term insurance business for regulatory reportingpurposes, i.e. falling within one of the classes of insurance specified in part II of Schedule 1 to the Regulated Activities Order under FSA regulations.

96 Prudential plc Annual Report 2005
B4: New business continuedInsurance products – new business premiums and contributions*
AnnualSingle Regular premium equivalents
2005 2004 2005 2004 2005 2004£m £m £m £m £m £m
UK insurance operations
Direct to customer
Individual annuities 720 630 – – 72 63
Individual pensions and life 29 19 11 10 14 12
Department of Work and Pensions rebate business 244 265 – – 24 27
Total 993 914 11 10 110 102
Business to business
Corporate pensions 242 153 146 137 170 152
Individual annuities 212 229 – – 21 23
Bulk annuities 511 474 – – 51 47
Total 965 856 146 137 242 222
Intermediated distribution
Life 1,112 1,001 6 5 118 105
Individual annuities 995 1,180 – – 100 118
Individual and corporate pensions 108 189 25 25 36 44
Department of Work and Pensions rebate business 83 89 – – 8 9
Total 2,298 2,459 31 30 262 276
Partnerships
Life 814 790 3 2 84 81
Individual and bulk annuities 1,814 1,249 – – 182 125
Total 2,628 2,039 3 2 266 206
Europe
Life 201 89 – 2 20 11
Total UK insurance operations 7,085 6,357 191 181 900 817
US operations
Fixed annuities 788 1,130 – – 79 113
Fixed index annuities 616 429 – – 62 43
Variable annuities 2,605 1,981 – – 261 198
Life 11 16 14 12 15 14
Guaranteed investment contracts 355 180 – – 35 18
GIC – Medium Term Notes 634 672 – – 63 67
Total US operations 5,009 4,408 14 12 515 453
Asian operations
China 17 9 23 16 25 17
Hong Kong 289 255 83 78 112 103
India (Group’s 26% interest) 4 5 57 33 57 33
Indonesia 42 38 42 28 46 32
Japan 30 17 4 7 7 9
Korea 29 36 132 60 135 64
Malaysia 9 7 66 61 67 62
Singapore 284 199 58 47 86 67
Taiwan 124 88 150 143 162 151
Other 9 8 33 37 34 38
Total Asian operations 837 662 648 510 731 576
Group total 12,931 11,427 853 703 2,146 1,846
*The format of the tables shown above is consistent with the distinction between insurance and investment products as applied for previous financial reporting periods. With the exception of some US institutional business, products categorised as ‘insurance’ refer to those classified as contracts of long-term insurance business for regulatory reportingpurposes, i.e. falling within one of the classes of insurance specified in part II of Schedule 1 to the Regulated Activities Order under FSA regulations.
Annual premium and contribution equivalents are calculated as the aggregate of regular new business amounts and one-tenth of single
new business amounts.
Notes on the Group financial statements continued

Prudential plc Annual Report 2005 97
B4: New business continuedInvestment products – funds under management*
MarketGross and other
1 Jan 2005 inflows Redemptions movements 31 Dec 2005£m £m £m £m £m
UK operations 28,705 7,916 (4,054) 3,629 36,196
US operations 550 414 (116) 125 973
Asian operations 8,538 18,457 (17,130) 267 10,132
Group total 37,793 26,787 (21,300) 4,021 47,301
*The format of the tables shown above is consistent with the distinction between insurance and investment products as applied for previous financial reporting periods. With the exception of some US institutional business, products categorised as ‘insurance’ refer to those classified as contracts of long-term insurance business for regulatory reportingpurposes, i.e. falling within one of the classes of insurance specified in part II of Schedule 1 to the Regulated Activities Order under FSA regulations.
The details shown above for insurance products include contributions for contracts that are classified under IFRS 4, ‘Insurance Contracts’
as not containing significant insurance risk. These products are described as investment contracts or other financial instruments under
IFRS. Contracts included in this category are primarily certain unit-linked and similar contracts written in UK insurance operations, and
GICs and similar funding agreements written in US operations.
UK and Asian investment products referred to in the tables above are unit trust, mutual funds and similar types of retail fund management
arrangements. US investment products relate to assets under administration in Curian. These are unrelated to insurance products that are
classified as ‘investment contracts’ under IFRS 4, as described above, although similar IFRS recognition principles apply to the acquisition
costs and fees attaching to this type of business.
B5: Group balance sheetThe Group’s primary reporting segments are long-term business, banking, and broker-dealer and fund management. The Group’s secondary
reporting segments are geographical namely UK, US, and Asia. Details of disclosures in accordance with the requirements of IAS 14 for
segment assets and liabilities are shown below.
Details of the primary reporting segments are as follows:
Long-term business
This segment comprises long-term products that contain both a significant and insignificant element of insurance risk. The products
are managed together and not classified in this way other than for accounting purposes. This segment also includes activity of the PAC
with-profits funds’ venture investments managed by PPM Capital and other investment subsidiaries held for the purpose of supporting
the Group’s long-term business operations.
Banking
This segment consists of products provided by the Group’s online banking subsidiary, Egg. The 2004 comparatives also include amounts
from Jackson Federal Bank that was sold in October 2004. The nature of these products and the managing of the business differ from
the risks inherent in the other business segments, and the regulatory environment of the banking industry differs from that of the other
business segments.

98 Prudential plc Annual Report 2005
B5: Group balance sheet continuedBroker-dealer and fund management
The investment management segment is comprised of both internal and third-party asset management services, inclusive of portfolio and
mutual fund management, where the Group acts as an advisor, and broker-dealer activities. The nature of the products and the managing
of the business differ from the risks inherent in the other business segments, and the regulatory environment of the investment management
industry differs from that of the other business segments.
Broker-dealerLong-term and fund Unallocated Intra-group
business Banking management to a segment eliminations Total2005 £m £m £m £m £m £m
Consolidated total assets 192,885 10,752 3,208 2,768 (2,236) 207,377
Consolidated total liabilities (187,603) (10,374) (1,597) (4,673) 2,236 (202,011)
Segment assets by geographical segment
UK 154,841
US 41,700
Asia 13,072
Intra-group eliminations (2,236)
Total assets per balance sheet 207,377
Broker-dealerLong-term and fund Unallocated Intra-group
business Banking management to a segment eliminations Total2004 £m £m £m £m £m £m
Consolidated total assets 161,907 12,048 2,834 4,688 (1,471) 180,006
Consolidated total liabilities (157,672) (11,708) (1,193) (6,278) 1,471 (175,380)
Segment assets by geographical segment
UK 138,904
US 32,697
Asia 9,876
Intra-group eliminations (1,471)
Total assets per balance sheet 180,006
To explain more comprehensively the assets, liabilities and capital of the Group’s businesses it is appropriate to provide an analysis of the
Group’s balance sheet by a mixture of primary and secondary segments.
This analysis is shown below for the Group balance sheet at 31 December 2005.
Notes on the Group financial statements continued

Prudential plc Annual Report 2005 99
B5: Group balance sheet continuedUK insurance US Asian
operations Egg Total UK operations operations Unallocated Intra-group Group(note D2) M&G (note E) operations (note D3) (note D4) to a segment eliminations total
£m £m £m £m £m £m £m £m £m
AssetsGoodwill:
Attributable to PAC with-profits fund 607 – – 607 – – – – 607Attributable to shareholders – 1,153 – 1,153 16 172 – – 1,341
Total (note H1) 607 1,153 – 1,760 16 172 – – 1,948
Other intangible assets (primarily deferred acquisition costs):PAC with-profits fund 35 – – 35 – – – – 35Other operations 199 6 – 205 1,634 566 – – 2,405
Total (note H2) 234 6 – 240 1,634 566 – – 2,440
Other non-investment and non-cash assets(notes G1 and H3 to H6) 4,470 256 280 5,006 1,888 566 1,059 (2,236) 6,283
Investments of long-term business, bankingand other operations (note G1) 131,263 1,383 9,747 142,393 37,960 11,264 775 – 192,392
Held for sale assets (note H9) 728 – – 728 – – – – 728Cash and cash equivalents 1,195 26 725 1,946 202 504 934 – 3,586
Total assets 138,497 2,824 10,752 152,073 41,700 13,072 2,768 (2,236) 207,377
Equity and liabilitiesEquityShareholders’ equity (note H11) 1,141 1,398 303 2,842 2,969 1,288 (1,905) – 5,194Minority interests 95 – 75 170 2 – – – 172
Total equity 1,236 1,398 378 3,012 2,971 1,288 (1,905) – 5,366
LiabilitiesBanking customer accounts (note G1) – – 5,830 5,830 – – – – 5,830Policyholder liabilities and unallocated
surplus of with-profits funds:Insurance contract liabilities (note H12) 79,231 – – 79,231 30,479 10,726 – – 120,436Investment contract liabilities with
discretionary participation features(note G1) 26,443 – – 26,443 – 80 – – 26,523
Investment contract liabilities without discretionary participation features(note G1) 10,502 – – 10,502 1,502 22 – – 12,026
Unallocated surplus of with-profits funds (reflecting application of ‘realistic’ basis provisions for UK regulated with-profits funds – seenotes D2(d)(ii) and H12) 11,272 – – 11,272 – 85 – – 11,357
Total policyholder liabilities and unallocated surplus of with-profitsfunds 127,448 – – 127,448 31,981 10,913 – – 170,342
Core structural borrowings of shareholder-financed operations (note H13):Subordinated debt (other than Egg) – – – – – – 1,646 – 1,646Other – – – – 145 – 948 – 1,093
– – – – 145 – 2,594 – 2,739Egg subordinated debt (note H13) – – 452 452 – – – – 452
Total – – 452 452 145 – 2,594 – 3,191
Operational borrowings attributable to shareholder-financed operations(notes G1 and H13) 17 2 3,856 3,875 1,085 – 1,472 – 6,432
Borrowings attributable to with-profits funds (notes G1 and H13) 1,898 – – 1,898 – – – – 1,898
Other non-insurance liabilities(notes G1, H4, H9 and H15) 7,898 1,424 236 9,558 5,518 871 607 (2,236) 14,318
Total liabilities 137,261 1,426 10,374 149,061 38,729 11,784 4,673 (2,236) 202,011
Total equity and liabilities 138,497 2,824 10,752 152,073 41,700 13,072 2,768 (2,236) 207,377

100 Prudential plc Annual Report 2005
C: Group risk management(i) Overview
A significant part of the Group’s business involves the acceptance and management of risk. The Group’s risk management model requires
the primary responsibility for risk management at an operational level to rest with business unit chief executives. The second line of
defence of risk comprises oversight functions reporting to the Group Chief Executive together with business unit risk functions and risk
management committees. The third line of defence comprises independent assurance from Internal Audit reporting to business unit and
Group audit committees.
The Group Risk Framework requires that all of the Group’s businesses and functions establish processes for identifying, evaluating
and managing the key risks faced by the Group. During the year, the risk management of the Group was given additional focus by the
establishment of a newly created role of Group Chief Risk Officer (CRO). The CRO oversees all aspects of the Group’s risk management,
including Financial Risk, Operational Risk, Compliance, and for management purposes, Internal Audit. Additional information on the the
Group’s risk framework, including the Group and business unit level risk committees, is included in the corporate governance section of
the Group’s Annual Report.
As a provider of financial services, including insurance, the Group’s business is the managed acceptance of risk. The system of internal
control is an essential and integral part of the risk management process. As part of the annual preparation of its business plan, all of the
Group’s businesses and functions are required to carry out a review of risks. This involves an assessment of the impact and likelihood
of key risks and of the effectiveness of the controls in place to manage them. The assessment is reviewed regularly throughout the year.
In addition, business units review opportunities and risks to business objectives regularly with the Group Chief Executive, Group Finance
Director and the Group Chief Risk Officer.
Businesses are required to confirm annually that they have undertaken risk management during the year as required by the Group Risk
Framework and that they have reviewed the effectiveness of the system of internal control. The results of this review were reported to
and reviewed by the Audit Committee, and confirmed that the processes described above and required by the Group Risk Framework
were in place throughout the period covered by this report, and complied with Internal Control: Guidance on the Combined Code (the
Turnbull guidance). In addition, Internal Audit executes a comprehensive risk-based audit plan throughout the Group, from which all
significant issues are reported to the Group Audit Committee.
The Group’s internal control framework includes detailed procedures laid down in financial and actuarial procedure manuals. The Group
prepares an annual business plan with three-year projections. Executive management and the Board receive monthly reports on the
Group’s actual performance against plan, together with updated forecasts.
The insurance operations of the Group all prepare a financial condition report which is presented to the Board who receive regular reports
from the Group Finance Director on the financial position of the Group.
(ii) Major risks
The Group publishes separately within its Group Annual Report a section on key risk factors, which discuss inherent risks in the business
and trading environment.
(iii) Financial risks
(a) Foreign exchange risk
Prudential faces foreign exchange risk, primarily because its presentation currency is pounds sterling, whereas approximately 55 per cent
of Prudential’s operating profit from continuing operations based on longer-term investment returns, as described in note B1, for the year
ended 31 December 2005 came from Prudential’s US and Asian operations. The exposure relating to the translation of reported earnings
is not separately managed although its impact is reduced by interest payments on foreign currency borrowings and by the adoption of
average exchange rates for the translation of foreign currency revenues.
Approximately 82 per cent of the Group’s IFRS basis shareholders’ funds at 31 December 2005 arose in Prudential’s US and Asian operations.
To mitigate the exposure of the US component there are US$1.55 billion of borrowings held centrally. The Group also has entered into a
US$2 billion net investment hedge (see note G3). Net of the currency position arising from these instruments some 46 per cent of the
Group’s shareholders’ funds is represented by net assets in currencies other than sterling.
(b) Liquidity risk
Liquidity risk is the risk that Prudential may be unable to meet payment of obligations in a timely manner at a reasonable cost or the risk
of unexpected increases in the cost of funding the portfolio at appropriate maturities or rates. Liquidity management in each business
seeks to ensure that, even under adverse conditions, Prudential has access to the funds necessary to cover surrenders, withdrawals and
maturing liabilities.
In practice, most of Prudential’s invested assets are marketable securities. This, combined with the fact that a large proportion of the
liabilities contain discretionary surrender values or surrenders charges, reduces the liquidity risk. The Group maintains committed
borrowing and securities lending facilities.
Notes on the Group financial statements continued
Prudential plc Annual Report 2005 101
C: Group risk management continued(c) Credit risk
Credit risk is the risk that a counterparty or an issuer of securities, which Prudential holds in its asset portfolio, defaults or another party
fails to perform according to the terms of the contract. Some of Prudential’s businesses, in particular JNL, Egg, the PAC with-profits fund
and Prudential’s UK pension annuity business, hold large amounts of interest-sensitive investments that contain credit risk on which a
certain level of defaults is expected. These expected losses are considered when Prudential determines the crediting rates, deposit rates
and premium rates for the products that will be supported by these assets. The key shareholder businesses exposed to credit risks are JNL
and Egg. Certain over-the-counter derivatives contain a credit risk element that is controlled through evaluation of collateral agreements
and master netting agreements on interest rate and currency swaps. Prudential is also exposed to credit-related losses in the event of
non-performance by counterparties.
Further analysis of the credit risks for JNL is shown in note D3 and for Egg in note E7.
(iv) Operational, compliance and fiscal risk
Operational risk can result from a variety of factors, including failure to obtain proper internal authorisations or maintain internal controls,
failure to document transactions properly, failure of operational and information security procedures or other procedural failures, computer
system or software failures, other equipment failures, fraud, inadequate training or errors by employees. Compliance with internal rules
and procedures designed to manage these risks is monitored by Prudential’s local management boards.
Internal compliance managers who report to the local management boards monitor adherence to local regulatory requirements. The
head of Prudential’s Group Compliance function reports directly to the Group Chief Risk Officer who submits regular reports to the Board
of Directors.
Compliance risk includes the possibility that transactions may not be enforceable under applicable law or regulation as well as the cost
of rectification and fines, and also the possibility that changes in law or regulation could adversely affect Prudential’s position. Prudential
seeks to minimise compliance risk by seeking to ensure that transactions are properly authorised and by submitting new or unusual
transactions to legal advisers for review.
Prudential is exposed to certain fiscal risks arising from changes in tax laws and enforcement policies and in reviews by taxation authorities
of tax positions Prudential has taken in recent years. Prudential manages this risk and risks associated with changes in other legislation and
regulation through ongoing review by relevant departments of proposed changes to legislation and by membership of relevant trade and
professional committees involved in commenting on draft proposals in these areas.
(v) Market risk
Market risk is the risk that future changes in market prices may make a financial instrument less valuable. The primary market risks
Prudential faces are equity risk and interest rate risk because most of its assets are investments that are either equity type investments
and subject to equity price risk, or bonds, mortgages or cash deposits, the values of which are subject to interest rate risk. The amount
of risk borne by Prudential’s shareholders depends on the extent to which its customers share the investment risk through the structure
of Prudential’s products.
The split of Prudential’s investments between equity investments and interest-sensitive instruments depends principally on the type of
liabilities supported by those investments and the amount of capital Prudential has available. This mix of liabilities allows Prudential to
invest a substantial portion of its investment funds in equity and property investments that Prudential believes produce greater returns
over the long term. On the other hand Prudential has some liabilities that contain guaranteed returns and allow instant access (for example,
interest-sensitive fixed annuities, immediate annuities and fixed rate customer bank deposits), which generally will be supported by fixed
income investments.
To reduce investment, interest rate and foreign exchange exposures, and to facilitate efficient investment management, Prudential uses
derivative instruments. Prudential’s policy is that cash or corresponding assets cover amounts at risk through derivative contracts.
(vi) Asset/liability management
Prudential manages its assets and liabilities locally, in accordance with local regulatory requirements and reflecting the differing types
of liabilities Prudential has in each business. As a result of the diversity of products offered by Prudential and the different regulatory
environments in which it operates, Prudential employs different methods of asset/liability management, on both an in-force and new
business basis. Stochastic modelling of assets and liabilities is undertaken in the Group’s insurance operations to assess economic capital
requirements for different confidence intervals and time horizons. In addition, reserve adequacy testing under a range of scenarios and
dynamic solvency analysis is carried out, including under certain scenarios mandated by the US, UK and Asian regulators.
A stochastic approach models the inter-relationship between asset and liability movements, taking into account asset correlation and
policyholder behaviour, under a large number of possible scenarios. These scenarios are projected forward over a period of time, typically
25 years or longer, and the liabilities and solvency position of the fund are calculated in each scenario in each future year. This allows
the identification of which extreme scenarios will have the most adverse effects and what the best estimate outcome may be. The fund’s
policy on management actions, including bonus and investment policy, are then set in order that they are consistent with the available
capital and the targeted risk of default. This differs from a deterministic model, which would only consider the results from one carefully
selected scenario.

102 Prudential plc Annual Report 2005
C: Group risk management continuedFor businesses that are most sensitive to interest rate changes, such as immediate annuity business, Prudential uses cash flow analysis to
create a portfolio of fixed income securities whose value changes in line with the value of liabilities when interest rates change. This type
of analysis helps protect profits from changing interest rates. In the UK, the cash flow analysis is used in Prudential’s annuity and banking
business while, in the US, it is used for its interest-sensitive and fixed index annuities and stable value products such as Guaranteed
Investments Contracts (GICs). Perfect matching is not possible for interest-sensitive and fixed index annuities because of the nature of the
liabilities (which include guaranteed surrender values) and options for prepayment contained in the assets. The US supervisory authorities
require JNL to calculate projections to test JNL’s ability to run off its liabilities with assets equal to statutory reserves in a number of
specified future economic scenarios. If JNL is unable to satisfy all of these tests, which are carried out at least annually, then it may be
required to establish additional statutory reserves.
For businesses that are most sensitive to equity price changes, Prudential uses stochastic modelling and scenario testing to look at the
expected future returns on its investments under different scenarios that best reflect the large diversity in returns that equities can
produce. This allows Prudential to devise an investment and with-profits policyholder bonus strategy that, on the model assumptions,
allows it to optimise returns to its policyholders and shareholders over time while maintaining appropriate financial strength. Prudential
uses this method extensively in connection with its UK with-profits business.
When presenting regulatory returns to the UK supervisory authorities, the calculation of the statutory liabilities for solvency purposes on
the FSA’s Peak 1 basis is required to incorporate a ‘resilience’ reserve that is sufficient to ensure that assets equal to the statutory reserves
(including the resilience reserve) remain equal to statutory reserves in the event of certain prescribed changes in equity and real estate
prices combined with prescribed rises and falls in interest yields.
All of Prudential’s investments are held either for risk management or investment purposes. This is because almost all of the investments
support policyholder or customer liabilities of one form or another. Any assets that Prudential holds centrally that are not supporting
customer liabilities are predominantly invested in short-term fixed income and fixed maturity securities.
(vii) Use of derivatives
In the UK and Asia, Prudential uses derivatives to reduce equity risk, interest rate and currency exposures, and to facilitate efficient
investment management. In the US, Prudential uses derivatives to reduce interest rate risk, to facilitate efficient portfolio management
and to match liabilities under fixed index annuities policies.
Details of the Group’s use of derivatives are explained in note G3.
It is Prudential’s policy that cash or corresponding assets cover amounts at risk through derivative transactions. Derivative financial
instruments used to facilitate efficient portfolio management and for investment purposes are carried at fair value with changes in fair
value included in long-term investment returns.
D: Life assurance business
D1: Group overview(a) Products and classification for IFRS reporting
For 2004, the IFRS results included in these financial statements continue to reflect UK GAAP requirements in relation to long-term
business contracts.
Under IFRS, from 1 January 2005 when the Group adopts IFRS 4, the measurement basis of assets and liabilities of long-term business
contracts is dependent upon the classification of the contracts under IFRS. Under IFRS 4, contracts are initially classified as being either
‘insurance’ contracts, if the level of insurance risk in the contracts is significant, or ‘investment’ contracts, if the risk is insignificant.
‘Insurance’ contracts are permitted to be accounted for under previously applied GAAP. The Group has chosen to adopt this approach.
However, as an improvement to accounting policy, permitted by IFRS 4, the Group has applied the measurement principles and disclosures
of the UK Standard FRS 27 for 2005 reporting. An explanation of the changes under FRS 27 is provided in note D2. 2004 comparatives
are not required to be restated.
‘Investment’ contracts are further delineated under IFRS 4 between those with and without discretionary participation features. For those
contracts with discretionary participation features, IFRS 4 also permits the continued application of previously applied GAAP. The Group
has adopted this approach, again subject to the FRS 27 improvement.
For ‘investment’ contracts that do not contain discretionary participation features, IAS 39 and, where the contract includes an investment
management element, IAS 18, apply measurement principles to assets and liabilities attaching to the contract that may diverge from those
previously applied. Details of the impact for Prudential are described below.
As indicated above, insurance contracts, as defined under IFRS 4 are those contracts that contain significant insurance risk and these
contracts may continue to be accounted for using previously applied GAAP. Under UK GAAP, the assets and liabilities of contracts are
prepared in accordance with the MSB of reporting as set out in the revised SORP issued by the ABI in November 2003.
Notes on the Group financial statements continued

Prudential plc Annual Report 2005 103
D1: Group overview continuedThe insurance contracts of the Group’s shareholder-backed business fall broadly into the following categories:
■ UK insurance operations – bulk and individual annuity business, written by Prudential Retirement Income Limited, Prudential Pensions
Limited, and other categories of non-participating UK business;
■ Jackson National Life – fixed and variable annuity business and life insurance; and
■ Prudential Corporation Asia – non-participating term, whole life, and unit-linked policies, together with accident and health policies.
The assets and liabilities of contracts with insignificant insurance risk previously were accounted for under UK GAAP under the provisions
of the ABI SORP, as described in note A4. Under IFRS 4, the assets and liabilities of these contracts with insignificant insurance risk and
no discretionary participation features are required to be accounted for in accordance with IAS 39 and, where relevant, the provisions of
IAS 18, in respect of attaching investment management features of the contracts. Contracts of the Group whose assets and liabilities are
required to be remeasured from 1 January 2005 under these two standards can be summarised as:
■ UK – certain unit-linked savings and similar contracts;
■ Jackson National Life – GICs
– minor amounts of ‘annuity certain’ contracts; and
■ Prudential Corporation Asia – minor amounts for a number of small categories of business.
The impact on the contracts of UK insurance operations and JNL’s GICs are considered in turn below:
(i) Certain UK unit-linked savings and similar contracts
Change is required for the following contract assets and liabilities.
Deferred acquisition costs
Under UK GAAP, acquisition expenses are deferred with amortisation on a basis commensurate with the anticipated emergence of margins
under the contract. Under IFRS, acquisition costs are deferred to the extent that it is appropriate to recognise an asset that represents the
entity’s contractual right to benefit from providing investment management services and are amortised as the entity recognises the related
revenue. IAS 18 further reduces the costs potentially capable of deferral to incremental costs only. Deferred acquisition costs are amortised
to the income statement in line with service provision.
Deferred income reserves
These are required to be established under IAS 18 with amortisation over the expected life of the contract. The majority of the relevant
UK contracts are single premium with the initial deferred income reflecting the ‘front end load’ i.e. the difference between the premium
paid and the amount credited to the unit fund. Deferred income is amortised to the income statement in line with service provision.
Sterling reserves
Under UK GAAP, reflecting the regulatory approach in the UK, prudent provisions are established for possible future expenses not
covered by future margins at a policy level. Under IFRS, such provisions are no longer permitted.
(ii) Jackson National Life – GICs
Previously, under UK GAAP, the assets and liabilities of JNL’s insurance contracts, including GICs, have been measured by the application
of US GAAP principles with contract liabilities accounted for on an amortised cost basis. Under a traditional GIC, the policyholder makes a
lump sum deposit. The interest rate paid is fixed and established when the contract is issued. Funding agreements are of a similar nature
but the interest rate may be floating, based on a rate linked to an external index. The US GAAP accounting requirements for such contracts
are very similar to those under IFRS on the amortised cost model for liability measurement.
(b) Concentration of risk
(i) Business accepted
The Group has a broadly based exposure to life assurance risk. This is achieved through the geographical spread of the Group’s operations
and, within those operations, through a broad mix of product types. In addition, looking beyond pure insurance risk, the Group considers
itself well developed in its approach to assessment of diversification benefits through its ‘economic capital’ project that is used for internal
business management. The economic capital project seeks to apply a single yardstick to assess and quantify all risks attaching to the Group’s
insurance business and associated capital requirements.
On 2 June 2005, the Group published details of the framework and results to that point of its economic capital project. Under the framework,
cash flows and capital requirements for each of the main business units in the UK, US and Asia are projected over many internally consistent
stochastically generated simulations. The process, using a group solvency model, captures 80 per cent of the business, the other 20 per cent
being modelled on a stand-alone basis and aggregated with the main results using a correlation matrix approach. This is a standard method
of aggregation used by banks and other financial institutions.
Using an iterative modelling process, economic capital is calculated as the amount required at the calculation date such that the cumulative
number of projected defaults is less than a predetermined rate reflecting Prudential’s internal target solvency level. Prudential’s internal
target solvency level has been set as equivalent to the historic default rate on AA-rated bond (equivalent to a cumulative probability of
default of 44 out of 1,000 simulations over 25 years). The economic capital framework thus assesses the capital required to meet Prudential’s
obligations with at least this level of confidence taking into account extreme events. Prudential’s economic capital model covers all material
risks in each business, including (where relevant) financial risks and insurance and business risks.

104 Prudential plc Annual Report 2005
D1: Group overview continuedThe 2 June announcement made reference to unaudited economic capital requirements at 31 December 2004. These results remain
unaudited in these statements except to the extent of being an accurate representation of the information reported at that time.
As at 31 December 2004, Prudential reported that it required £1.8 billion of capital for the Group to cover the risks to its existing contractual
and discretionary insurance liabilities, on an economic basis and its internal target solvency level. This number is after allowance for
diversification across risks and geographies and the capturing of future shareholders’ transfers from the business units. This compares
to available capital of £3.4 billion on an equivalent basis (i.e. GAAP based shareholders’ equity after adjusting to eliminate goodwill,
to include subordinated debt capital and valuation differences). This requirement has been analysed into its contributory parts by risk
type as follows: asset liability matching 28 per cent, credit risk 47 per cent, underwriting (mortality, longevity and morbidity) 10 per cent,
persistency 2 per cent, and operational 13 per cent. The largest risk exposure on a diversified basis, credit risk, reflects the relative size
of the exposure to JNL, Prudential UK shareholder annuities business, and Egg.
An example of the diversification benefits for Prudential is that adverse scenarios do not affect all business units in the same way, providing
natural hedges within the Group. For example, the Group’s US business is sensitive towards increasing interest rates, whereas, in contrast,
several business units in Asia benefit from increasing rates. Conversely, these Asian business units are sensitive towards low interest rates,
whereas the US benefits from falling interest rates. The economic capital project also takes into account situations where factors are
correlated, for example the extent of correlation between Asian and US economies.
(ii) Ceded business
The Group cedes certain business to other insurance companies. Although the ceding of insurance does not relieve the Group of liability to
its policyholders, the Group participates in such agreements for the purpose of managing its loss exposure. The Group evaluates the financial
condition of its reinsurers and monitors concentration of credit risk from similar geographic regions, activities or economic characteristics of
the reinsurers to minimise its exposure from reinsurer insolvencies. There are no significant concentrations of reinsurance risk.
(c) Guarantees
Notes D2(b), D3(b) and D4(b) and (h) provide details of guarantee features of the Group’s life assurance products. In the UK guarantees of
the with-profits products are valued for accounting purposes on a market consistent basis for 2005 as described in section D2(d)(ii). The UK
business also has products with guaranteed annuity option features, mostly within SAIF, as described in section D2(b). There is little exposure
to financial options and guarantees in the shareholder-backed business of the UK operations. The US business annuity products have a
variety of option and guarantee features as described in section D3(b). JNL’s derivative programme seeks to manage the exposures as
described in section D3(c). The most significant exposure for the Group arises on Taiwan whole of life policies as described in section D4(h).
(d) Amount, timing and uncertainty of future cash flows from insurance contracts
The factors that affect the amount, timing and uncertainty of future cash flows from insurance contracts depend upon the businesses
concerned as described in subsequent sections. In general terms, the Group is managed by reference to a combination of measures.
These measures include IFRS basis earnings, net shareholder cash flow to or from business units from or to central funds, and movements
in the value of discounted future expected cash flows of in-force long-term insurance business. The latter item is commonly referred to
as Embedded Value.
The Group prepares and publishes supplementary information in accordance with the European Embedded Value (EEV) principles
issued by the CFO Forum of European Insurance Companies in May 2004 and expanded by the addition of Additional Guidance on
EEV Disclosures published in October 2005. Key elements of the EEV principles are the approach applied to allowing for risk and the
best estimate assumptions of future cash flows arising from the contracts.
The business covered for determining EEV basis results includes investment contracts (i.e. contracts with insignificant insurance risk
as defined under IFRS 4) as well as insurance contracts (i.e. those that contain significant insurance risk). Investment contracts form a
relatively small part of the Group’s long-term business as demonstrated by the carrying values of policyholder liabilities shown in the
Group balance sheet.
The cash flows subject to valuation are those expected under the contracts such as those arising from premiums, claims, expenses after
appropriate estimation of future lapse behaviour and mortality and morbidity experience. The cash flows also include the expected future
cash flows on assets covering liabilities and encumbered capital.
Encumbered capital is based on Prudential’s internal target for economic capital subject to it being at least the local statutory minimum
requirements. Economic capital is assessed using internal models but does not take credit for the significant diversification benefits that
exist within the Group.
Valuation of the future cash flows also takes account of the ‘time value’ of option and guarantee features of the Group’s long-term business
contracts. The time value reflects the variability of economic outcomes in the future. Where appropriate, a full stochastic valuation is
undertaken to determine the value of the in-force business. Common principles are adopted across the Group for the stochastic asset
model classes, for example, separate modelling of individual asset classes but with allowance for correlation between the various asset
classes. In deriving the time value of financial options and guarantees, management actions in response to emerging investment and fund
solvency conditions are modelled. In all instances, the modelled actions are in accordance with approved local practice and therefore
reflect the options actually available to management. For the PAC with-profits sub-fund, the actions are consistent with those set out in
the Principles and Practices of Financial Management.
Notes on the Group financial statements continued

Prudential plc Annual Report 2005 105
D1: Group overview continuedThe present value of the future cash flows is calculated using a risk discount rate which reflects both the time value of money and the
risks associated with the cash flows that are not otherwise allowed for. The risk allowance covers market and non-market risks.
Under Capital Asset Pricing Methodology (CAPM), the discount rate is determined as the aggregate of the risk-free rate and the risk
margin for market risk. The latter is calculated as the ‘beta’ times the equity risk premium. Under CAPM, the beta of a portfolio or product
measures its relative market risk. The risk discount rates reflect the market risk inherent in each product group and hence the volatility of
product cash flows. They are determined by considering how the profits from each product are impacted by changes in expected returns
on various asset classes, and by converting this into a relative rate of return it is possible to derive a product specific beta.
CAPM does not include any allowance for non-market risks since they are assumed to be fully diversifiable. For EEV purposes, however,
a risk margin is added for non-diversifiable non-market risks and to cover Group level risks.
Product specific discount rates are used in order to reflect the risk profile of each major territory and product group. No allowance is
required for non-market risks where these are assumed to be fully diversifiable. The majority of non-market risks are considered to be
diversifiable. Finance theory cannot be used to determine the appropriate component of beta for non-diversifiable non-market risks since
there is no observable risk premium associated with it that is akin to the equity risk premium. Recognising this, a pragmatic approach has
been used. A constant 50 basis points has been added to the risk margin for market risk to cover the non-diversifiable non-market risks
associated with the business.
Product level betas are calculated each year. They are combined with the most recent product mix to produce appropriate beta and risk
discount rates for each major product grouping.
Details of the key assumptions and sensitivity of the EEV value of in-force business are shown in the sections for each geographic segment
that follow in this note. The sensitivity of the present value of the discounted future cash flows under the EEV methodology is of particular
interest. The sensitivity provides an indication of the movement in the net value ascribable to potential variations in the amounts and
timing of future cash flows to shareholders and the uncertainty attached to those cash flows.
(e) Sensitivity of IFRS basis profit or loss and equity to changes that have a material effect
The factors that may significantly affect IFRS results due to changes of experience or assumptions vary significantly between business
units. The most significant items are summarised below.
UK insurance operations■ With-profits business – investment performance subject to smoothing through declared bonuses;
■ unit-linked business – investment performance through fund management fees; and
■ annuity business – mortality experience and assumptions, and credit risk.
Jackson National Life■ Variable annuity business – fund management performance and incidence of guarantee features of the contracts;
■ fixed annuity business – spread differential between earned rate and rate credited to policyholder; and
■ fixed index annuity business – spread differential between earned rate and rate credited to policyholder and incidence of equity index
participation features.
Asian operations■ With-profits business – as for UK Insurance operations;
■ unit-linked business – as for UK Insurance operations; and
■ non-participating business – return on assets covering the Taiwan whole of life policies.
Where appropriate these issues are discussed in notes D2, D3 and D4.
Lapse risk is not mentioned above and has variable impacts. In the UK, adverse persistency experience has led to losses in embedded
value in 2004 and 2005 reflecting a reduced level of projected statutory transfers from the PAC with-profits fund. However, in any given
year the statutory transfer recognised in IFRS profits is only marginally affected by altered persistency trends.
JNL is sensitive to lapse risk. However, JNL has swaption derivatives in place to ameliorate the effect of a sharp rise in interest rates, which
would be the most likely cause of a sudden change in policyholder behaviour.
(f) Duration of liabilities
Under the terms of the Group’s contracts, as for life assurance contracts generally, the contractual maturity date is the earlier of the end
of the contract term, death or surrender. The Group has therefore chosen to provide details of liability duration that reflect the actuarially
determined best estimate of the likely incidence of these three factors on contract duration. Details are shown in sections D2(i), D3(i) and
D4(i). Effective interest rates, as defined in IAS 32, are not applicable to the Group’s insurance contracts and investment contracts with
discretionary participation features.
In the years 2001 to 2005 claims paid on the Group’s life assurance contracts including those now classified as investment contracts under
IFRS 4 ranged from £11.8 billion to £13.8 billion. Indicatively it is to be expected that of the Group’s policyholder liabilities (excluding
unallocated surplus) at 31 December 2005 of £159 billion, the amounts likely to be paid in 2006 will be of a similar magnitude.

106 Prudential plc Annual Report 2005
D2: UK insurance operations(a) Summary balance sheet at 31 December 2005In order to explain the different types of UK business and fund structure, the balance sheet of the UK insurance operations may beanalysed by the assets and liabilities of the Scottish Amicable Insurance Fund, the PAC with-profits sub-fund, annuity business, unit-linkedand other business. The assets and liabilities of these funds and subsidiaries are shown in the table below.
PAC with-profits sub-fund (note i) Other funds and subsidiaries
OtherScottish non-profit
Amicable Excluding Prudential Prudential unit-linkedInsurance Prudential Annuities Retirement and other UK insurance
Fund Annuities Limited Total Income business operations(note ii) Limited (note iii) (note iv) Limited (note v) Total Total
£m £m £m £m £m £m £m £m
AssetsGoodwill attributable to PAC with-profits fund – 607 – 607 – – – 607Other intangibles:
PAC with-profit fund 6 29 – 29 – – – 35Other operations – – – – – 199 199 199
Total 6 29 – 29 – 199 199 234
Other non-investment and non-cash assets 314 2,263 273 2,536 236 1,384 1,620 4,470
Investments of long-term business, banking and other operations:Investment properties 1,586 9,569 401 9,970 214 900 1,114 12,670Financial investments:
Loans and receivables 213 653 211 864 44 9 53 1,130Equity securities and portfolio holdings in
unit trusts 7,515 39,797 369 40,166 6 10,839 10,845 58,526Debt securities 4,710 15,373 14,331 29,704 8,695 6,343 15,038 49,452Other investments 237 2,231 181 2,412 28 11 39 2,688
Deposits 723 3,615 391 4,006 442 1,626 2,068 6,797
Total investments 14,984 71,238 15,884 87,122 9,429 19,728 29,157 131,263
Held for sale assets – 728 – 728 – – – 728Cash and cash equivalents 101 721 75 796 13 285 298 1,195
Total assets 15,405 75,586 16,232 91,818 9,678 21,596 31,274 138,497
Equity and liabilitiesEquityShareholders’ equity – – – – 782 359 1,141 1,141Minority interests 21 74 – 74 – – – 95
Total equity 21 74 – 74 782 359 1,141 1,236
LiabilitiesPolicyholder liabilities and unallocated surplus of
with-profits funds:Insurance contract liabilities 14,011 33,424 14,068 47,492 8,324 9,404 17,728 79,231Investment contract liabilities with discretionary
participation features 751 25,692 – 25,692 – – – 26,443Investment contract liabilities without discretionary
participation features – – – – – 10,502 10,502 10,502Unallocated surplus of with-profit funds (reflecting
application of ‘realistic’ provisions for UK regulated with-profits funds) – 9,683 1,589 11,272 – – – 11,272
Total 14,762 68,799 15,657 84,456 8,324 19,906 28,230 127,448
Operational borrowings attributable to shareholder-financed operations – – – – – 17 17 17
Borrowings attributable to with-profit funds 118 1,780 – 1,780 – – – 1,898Other non-insurance liabilities 504 4,933 575 5,508 572 1,314 1,886 7,898
Total liabilities 15,384 75,512 16,232 91,744 8,896 21,237 30,133 137,261
Total equity and liabilities 15,405 75,586 16,232 91,818 9,678 21,596 31,274 138,497
Notes(i) For the purposes of this table and subsequent explanation, references to the WPSF also include, for convenience, the amounts attaching to the Defined Charges Participating Sub-fund.
(ii) Scottish Amicable Insurance Fund (SAIF) is a separate sub-fund within the PAC long-term business fund.
(iii) Wholly-owned subsidiary of the PAC WPSF that writes annuity business.
(iv) Excluding policyholder liabilities of the Hong Kong branch of PAC.
(v) Within policyholder liabilities of £19,906 million for the non-profit unit-linked and other business is £16,639 million for unit-linked business.
Notes on the Group financial statements continued

Prudential plc Annual Report 2005 107
D2: UK insurance operations continued(b) Products and guarantees
Prudential’s long-term products in the UK consist of life insurance, pension products and pension annuities.
These products are written primarily in:
■ One of three separate sub-funds of the PAC long-term fund, namely the with-profits sub-fund, the SAIF, and the non-profit sub-fund;
■ Prudential Annuities Limited, which is owned by the PAC with-profits sub-fund;
■ Prudential Retirement Income Limited, a shareholder-owned subsidiary; or
■ other shareholder-backed subsidiaries writing mainly non-profit unit-linked business.
(i) With-profits products and PAC with-profits sub-fund
Within the balance sheet of UK insurance operations, there are policyholder liabilities of £73.2 billion and unallocated surplus of £11.3 billion
that relate to the WPSF. The WPSF mainly contains with-profits business but it also contains some non-profit business (unit-linked, term
assurances and annuities). The WPSF’s profits are apportioned 90 per cent to its policyholders and 10 per cent to shareholders as surplus
for distribution is determined via the annual actuarial valuation.
With-profits products provide returns to policyholders through bonuses that are ‘smoothed’. There are two types of bonuses: ‘annual’ and
‘final’. Annual bonuses are declared once a year, and once credited, are guaranteed in accordance with the terms of the particular product.
Unlike annual bonuses, final bonuses are guaranteed only until the next bonus declaration.
When determining policy payouts, including final bonuses, Prudential considers policyholders’ reasonable expectations, the need to
smooth claim values and payments from year to year and competitive considerations, together with ‘asset shares’ for specimen policies.
Asset shares broadly reflect the value of premiums paid plus the investment return on the assets notionally attributed to the policy, less
the other items to be charged such as expenses and the cost of the life insurance cover.
For many years, UK with-profits product providers, such as Prudential, have been required by law and regulation to consider the reasonable
expectations of policyholders in setting bonus levels. This concept is established by statute but is not defined. However, it is defined within
the regulatory framework, which also more recently contains an explicit requirement to treat customers fairly.
The WPSF held a provision of £52 million at 31 December 2005 (2004: £49 million) to honour guarantees on a small amount of
guaranteed annuity products. SAIF’s exposure to guaranteed annuities is described below.
Beyond the generic guarantees described above, there are very few explicit options or guarantees such as of minimum investment
returns, surrender values or annuity at retirement and any granted have generally been at very low levels.
(ii) Annuity business
Prudential’s conventional annuities include level, fixed increase and retail price index (RPI) annuities. They are mainly written within the
subsidiaries PAL, PRIL, Prudential Pensions Limited and the PAC with-profits sub-fund, but there are some annuity liabilities in the WPSF
and SAIF.
Prudential’s fixed-increase annuities incorporate automatic increases in annuity payments by fixed amounts over the policyholder’s life.
The RPI annuities that Prudential offers provide for a regular annuity payment to which an additional amount is added periodically based
on the increase in the UK RPI. Prudential’s with-profits annuities, which are written in the WPSF, combine the income features of annuity
products with the investment smoothing features of with-profits products and enable policyholders to obtain exposure to investment
return on the WPSF’s equity shares, property and other investment categories over time.
Policyholders select an ‘anticipated bonus’ from the specific range Prudential offers for the particular product. The amount of the annuity
payment each year depends upon the relationship between the anticipated bonus rate selected by the policyholder when the product is
purchased and the bonus rates Prudential subsequently declares each year during the term of the product. If the total bonus rates fall
below the anticipated rate, then the annuity income falls.
At 31 December 2005, £25.3 billion of investments relate to annuity business of PAL and PRIL. These investments are predominantly in
debt securities (including retail price index-linked bonds to match retail price index-linked annuities), loans and deposits and are duration
matched with the estimated duration of the liabilities they support.
(iii) SAIF
SAIF is a ring-fenced sub-fund of the PAC long-term fund and was formed following the acquisition of the mutually owned Scottish
Amicable Life Assurance Society in 1997. No new business may be written in SAIF, although regular premiums are still being paid on
policies in force at the time of the acquisition and incremental premiums are permitted on these policies.
The fund is solely for the benefit of policyholders of SAIF. Shareholders have no interest in the profits of this fund although they are
entitled to investment management fees on this business.
The process for determining policyholder bonuses of SAIF with-profits policies, which constitute the vast majority of obligations of the
funds, is similar to that for the with-profit policies of the WPSF. However, in addition, the surplus assets in SAIF are allocated to policies
in an orderly and equitable distribution over time as enhancements to policyholder benefits i.e. in excess of those based on asset share.

108 Prudential plc Annual Report 2005
D2: UK insurance operations continuedProvision is made for the risks attaching to some SAIF unitised with-profits policies that have MVR – free dates and for those SAIF products
which have a guaranteed minimum benefit on death or maturity of premiums accumulated at 4 per cent per annum.
The Group’s main exposure to guaranteed annuities in the UK is through SAIF and a provision of £619 million was held in SAIF at
31 December 2005 (2004: £648 million) to honour the guarantees. As SAIF is a separate sub-fund solely for the benefit of policyholders
of SAIF this provision has no impact on the financial position of the Group’s shareholders’ funds.
(iv) Unit-linked (non-annuity) and other non-profit business
Prudential UK insurance operations also have an extensive book of unit-linked policies of varying types and provide a range of other non-profit
business such as stakeholder, credit life and non-life long-term contracts. These contracts do not contain significant financial guarantees.
There are no guaranteed maturity values or guaranteed annuity options on unit-linked policies except for minor amounts for certain
policies linked to cash units within SAIF.
(c) Exposure to market risk
(i) Non-linked life and pension business
For with-profits business, the absence of guaranteed surrender values and the flexibility given by the operation of the bonus system
means that the majority of the investments backing the with-profits business are in equities and real estate with the balance in debt
securities, deposits and loans.
The investments supporting the protection business are small in value and tend to be fixed maturities reflecting the guaranteed nature
of the liabilities.
(ii) Pension annuity business
Prudential’s UK annuity business employs fixed income investments (including UK retail price index-linked assets) because the liabilities
consist of guaranteed payments for as long as each annuitant is alive. Retail price index-linked assets are used to back pension annuities
where the payments are linked to the RPI.
(iii) Unit-linked business
Except through the second order effect on investment management fees, the unit-linked business of the UK insurance operations is not
exposed to market risk. The lack of exposure arises from the contract nature whereby policyholder benefits reflect asset value movements
of the unit-linked funds.
(d) Process for setting assumptions and determining liabilities
(i) Overview
Calculation of the contract liabilities involves the setting of assumptions for future experience. This is done following detailed review of
the relevant experience including, in particular, mortality, expenses, tax and economic assumptions. For with-profits business written in
the WPSF or SAIF from 2005, for IFRS accounting purposes, a market consistent valuation is performed (as described in section (ii) below).
Additional assumptions required are persistency and the management actions under which the fund is managed. Assumptions used for
market consistent valuation typically do not contain margins, whereas those used for the valuation of other classes of business do.
Mortality assumptions are set based on the results of the most recent experience analysis looking at the experience over recent years of
the relevant business. For non-profit business, a margin for adverse deviation is added. Different assumptions are applied for different
product groups. For annuitant mortality, assumptions for current mortality rates are based on recent experience investigations and
expected future improvements in mortality. The expected future improvements are based on recent experience and projections of the
business and industry generally.
Maintenance and, for some classes of business, termination expense assumptions are expressed as per policy amounts. They are set
based on the expenses incurred during the year, including an allowance for ongoing investment expenditure and allocated between
entities and product groups in accordance with the operation’s internal cost allocation model. For non-profit business a margin for adverse
deviation is added to this amount. Expense inflation assumptions are set consistent with the economic basis and based on the difference
between nominal gilts and index-linked gilts; unit expenses are assumed not to increase in future years at a faster rate than this difference.
The actual renewal expenses charged to SAIF will continue to be based on the tariff arrangement specified in the Scottish Amicable Life
Assurance Society Scheme until 31 December 2007, when the tariff arrangement terminates. This provides an additional margin in SAIF
as the unit costs derived from actual expenses (and used to derive the recommended assumptions) are generally significantly greater
than the tariff costs.
The assumptions for investment management expenses are based on the charges specified in agreements with the Group’s investment
management operations, plus a margin for adverse deviation for non-profit business.
Tax assumptions are set equal to current rates of taxation.
For non-profit business excluding unit-linked business, the valuation interest rates used to discount the liabilities are based on the yields
as at the valuation date on the assets backing the technical provisions. For fixed interest securities the gross redemption yield is used, for
property it is the rental yield, and for equities it is the greater of the dividend yield and the average of the dividend yield and the earnings
yield. An adjustment is made to the yield on non risk-free fixed interest securities and property to reflect credit risk. To calculate the non-unit
reserves for linked business, assumptions have been set for the gross unit growth rate and the rate of inflation of maintenance expenses,
as well as for the valuation interest rate as described above.
Notes on the Group financial statements continued

Prudential plc Annual Report 2005 109
D2: UK insurance operations continued(ii) WPSF and SAIF
The policyholder liabilities reported for the WPSF are primarily for two broad types of business. These are accumulating and conventional
with-profits contracts.
2005
The provisions at 31 December 2005 have been determined on a basis consistent with the detailed methodology included in regulations
contained in the FSA’s rules for the determination of regulatory reporting reserves on the FSA’s ‘realistic’ Peak 2 basis. In aggregate, the
regime has the effect of placing a value on the liabilities of UK with-profits contracts, which reflects the amounts expected to be paid
based on the current value of investments held by the with-profits funds and current circumstances. These contracts are a combination
of insurance and investment contracts with discretionary participation features, as defined by IFRS 4.
The FSA’s Peak 2 calculation under the new realistic regime, which came fully into effect for the first time for 2004 regulatory reporting
requires the value of liabilities to be calculated as:
■ The with-profits benefits reserve (WPBR); plus
■ future policy related liabilities (FPRL); plus
■ the realistic current liabilities of the fund.
The WPBR is primarily based on the retrospective calculation of accumulated asset shares but is adjusted to reflect future expected
policyholder benefits and other outgoings. By contrast, the Peak 1 basis addresses, at least explicitly, only declared bonuses.
Asset shares are calculated as the accumulation of all items of income and outgo that are relevant to each policy type. Income comprises
credits for premiums, investment returns (including unrealised gains), and miscellaneous profits. Outgo comprises charges for tax
(including an allowance for tax on unrealised gains), guarantees and smoothing, mortality and morbidity, shareholders’ profit transfers,
miscellaneous losses, and expenses and commission (net of any tax relief).
The FPRL must include a market consistent valuation of costs of guarantees, options and smoothing, less any related charges, and this amount
must be determined using either a stochastic approach, hedging costs or a series of deterministic projections with attributed probabilities.
The assumptions used in the stochastic models are calibrated to produce risk-free returns on each asset class. Volatilities of, and correlations
between, investment returns from different asset classes are as determined by the Group’s Portfolio Management Group but aim to be
market consistent.
The cost of guarantees, options and smoothing is very sensitive to the bonus, market value reduction (MVR), and investment policy the
Company employs and therefore the stochastic modelling incorporates a range of management actions that would help to protect the
fund in adverse investment scenarios. Substantial flexibility has been included in the modelled management actions in order to reflect the
discretion that the Company retains in adverse investment conditions, thereby avoiding the creation of unreasonable minimum capital
requirements. The management actions assumed are consistent with our management policy for with-profit funds and our disclosures
in the publicly available Principles and Practices of Financial Management.
The contract liabilities for with-profits business also required assumptions for persistency. These are set based on the results of the
Company’s recent experience analysis.
2004
The amounts shown in the consolidated balance sheet at 31 December 2004 for technical provisions and unallocated surplus (fund for
future appropriations) for with-profit business of the WPSF and SAIF have been determined in accordance with the MSB of accounting
applicable at that time. With the exception of minor accounting adjustments, the technical provisions reflect the UK regulatory basis of
reporting that has applied for many years, and which effectively constitutes the Peak 1 basis under the new FSA regime.
Under this basis of accounting, the future policyholder benefit provisions on conventional with-profit policies was calculated using the net
premium valuation method, such that they would be sufficient at the outset of the policy to provide only for the discounted value of the
original guaranteed death and maturity benefits on the chosen valuation assumptions. The provisions were then calculated by subtracting
the present value of future net premiums from the present value of future benefits (including vested bonuses) using a prudent discount rate.
Under the net premium valuation method, vested bonuses are included in the cash flows assessed but future allocations of bonuses are
not included explicitly, although they may be implicitly taken into account in the discount rate used, which is based on the return available
on suitable investments. The detailed methodology for UK companies is included in the regulations contained in the FSA rules. In particular,
the returns available from equity and property assets are based on expected income and/or earnings and no allowance is made for future
capital growth.
The assumptions to which the estimate of the technical provisions for conventional with-profit contracts at 31 December 2004 were
particularly sensitive were the interest rates used to discount the provision and the future mortality experience of policyholders. The net
premium reserves were calculated using assumptions for interest, mortality, morbidity, and expense but without assumptions for withdrawals.
The assumptions were determined as prudent best estimates at the date of valuation. Interest rates used in establishing policyholder
benefit provisions at 31 December 2004 range from 3 per cent to 5 per cent.

110 Prudential plc Annual Report 2005
D2: UK insurance operations continuedFor accumulating with-profit business, the calculation of technical provisions at 31 December 2004 was based on a gross premium
bonus reserve valuation. In general terms, a gross premium valuation basis is one in which the premiums brought into account are the
full amounts receivable under the contract. The method includes explicit estimates of premiums, expected claims, future regular bonuses,
costs of maintaining contracts and future renewal expenses. Cash flows are discounted at the valuation rate of interest. The methodology
for UK companies is included in the FSA rules. The discount rate is based on the expected return on the assets deemed to back the
liabilities as prescribed by the FSA rules.
For PAC business the calculation was based on a valuation under which future reversionary bonuses are added to the guaranteed liabilities
existing at the valuation date. The assumptions to which the estimation of the technical provisions were particularly sensitive were the
assumed future reversionary bonuses, the interest rate used to discount the provisions, the assumed future per policy expenses and the
assumed future mortality experience of policyholders.
For the purposes of calculating the liabilities using the bonus reserve method the assumed interest rates ranged from 2.5 per cent to
5.0 per cent at 31 December 2004, while future reversionary bonuses were assumed to fall immediately from then current levels to zero.
(iii) Annuity business
The contract liabilities for PAL and PRIL are based on the FSA regulatory solvency basis. The valuation is then modified for MSB reporting
purposes to remove certain of the margins for prudence within the assumptions, and contingency reserves, both of which are required
under the solvency basis applied for regulatory purposes, but not for financial accounting.
The contract liabilities are the discounted value of future claim payments, adjusted for investment expenses and future administration
costs. The interest rate used for discounting claim payments is derived from the yield on the assets held with an allowance for default
and mismatching risk. At 31 December 2005, the interest rates applied ranged from 1.0 per cent to 4.6 per cent (2004: 1.5 per cent to
5.0 per cent).
The mortality assumptions are set in light of recent population and internal experience. The assumptions used are percentages of standard
actuarial mortality tables with an allowance for future mortality improvements. Where annuities have been sold on an enhanced basis to
impaired lives an additional age adjustment is made. The percentages of the standard table used are selected according to the source of
business. The range of percentages used is set out in the following tables:
PAL2005 2004
Males Females Males Females
PRIL2005 2004
Males Females Males Females
(iv) Unit-linked (non-annuity) and other non-profit business
The majority of other long-term business written in the UK insurance operations is unit-linked business or other business with similar
features. For these contracts the attaching liability reflects the unit value obligation and provision for mortality risk. The latter component
is determined by applying mortality assumptions on a basis that is appropriate for the policyholder profile.
For unit-linked business, the assets covering unit liabilities are exposed to market risk, but the residual risk when considering the unit-linked
liabilities and assets together is limited to the effect on fund-based charges.
For those contracts where the level of insurance risk is insignificant the assets and liabilities arising under the contracts are distinguished
between those that relate to the financial instrument liability and acquisition costs and deferred income that relate to the component of the
contract that relates to investment management. Acquisition costs and deferred income are recognised consistent with the level of service
provision in line with the requirements of IAS 18.
85% – 104% PFA92
(C = 2004) with 75%
of medium cohort
improvement table
with a minimum annual
improvement of 0.75%
AF92 minus 4 years
90% – 113% PMA92
(C = 2004) with
medium cohort
improvement table
with a minimum annual
improvement of 1.25%
AM92 minus 4 years
84% – 102% PFA92
(C = 2004) with 75%
of medium cohort
improvement table
with a minimum annual
improvement of 0.75%
AF92 minus 4 years
88% – 100% PMA92
(C = 2004) with
medium cohort
improvement table
with a minimum annual
improvement of 1.25%
AM92 minus 4 years
In payment
In deferment
92% – 105% PFA92
(C = 2004) with 75%
of medium cohort
improvement table
with a minimum annual
improvement of 0.75%
AF92 minus 4 years
97% – 111% PMA92
(C = 2004) with
medium cohort
improvement table
with a minimum annual
improvement of 1.25%
AM92 minus 4 years
84% – 105% PFA92
(C = 2004) with 75%
of medium cohort
improvement table
with a minimum annual
improvement of 0.75%
AF92 minus 4 years
93% – 100% PMA92
(C = 2004) with
medium cohort
improvement table
with a minimum annual
improvement of 1.25%
AM92 minus 4 years
In payment
In deferment
Notes on the Group financial statements continued

Prudential plc Annual Report 2005 111
D2: UK insurance operations continued(e) Reinsurance
The Group’s UK insurance business cedes only minor amounts of business outside the Group. During 2005, reinsurance premiums for
externally ceded business were £82 million and reinsurance recoverable insurance assets were £750 million in aggregate. The gains and
losses recognised in profit and loss for these contracts were immaterial.
(f) Effect of changes in assumptions used to measure insurance assets and liabilities
For with-profits business the only change of note is an altered basis of recognising liabilities and unallocated surplus for SAIF. This is
to comply with actuarial guidance GN 45, which requires that for a closed fund where the fund will be distributed fully that the working
capital is shown as zero, with the future enhancements to asset shares being increased by the free capital. Without the adjustment the
unallocated surplus would have been approximately £700 million. Shareholder results and equity are not altered by this change.
The change of mortality table for PAL explained in section D2(d) increased liabilities by £144 million. As PAL is owned by the WPSF
this change had no affect on shareholder profit.
For shareholder-backed non-participating business a number of changes of assumptions were made in 2005. Taken together these
changes had the effect of reducing operating profit based on longer-term investment returns before shareholder tax by £36 million with
consequent increase in liabilities. The reduction arose from a charge of £69 million for strengthened mortality assumptions, being partially
offset by a net credit of £29 million in respect of a reduced level of expected defaults for debt securities, and a credit of £4 million for
other changes.
As described in section A4, the Group provides supplementary analysis of its profit before shareholder tax, distinguishing operating profit
based on longer-term investment returns from short-term fluctuations in investment returns, actuarial gains and losses on defined benefit
pension schemes, and exceptional items. In addition to the £36 million charge described above, an additional £20 million charge for the
effect of change of assumption for renewal expenses, which relates to an increase in ongoing future pensions scheme contributions as
described in section B1, has been recorded as part of actuarial and other gains and losses excluded from operating profit but included in
total profit before shareholder tax.
The net charge of £36 million comprises amounts in respect of PAC (£35 million charge), Prudential Holborn Life (£2 million credit), and
PRIL (£3 million charge).
(g) Amount, timing and uncertainty of future cash flows from insurance contracts
At 31 December 2005, the EEV basis value of the in-force business of the UK insurance operations, after taking account of the cost of
encumbered capital and the cost of the time value of financial options and guarantees, was £4,274 million. This value has been determined
after applying the principles of valuation described in note D1 and the following key assumptions.%
Risk discount rate for in-force business at the start of the year 7.7
Pre-tax expected long-term nominal rates of investment return:
UK equities 8.1
Overseas equities 8.1 to 8.75
Property 6.4
Gilts 4.1
Corporate bonds 4.9
Expected long-term rate of inflation 2.9
Post-tax expected long-term nominal rate of return 7.1
Pensions business (where no tax applies) 6.3
Life business
The sensitivity of this value to changes in key assumptions is as follows:£m
Economic assumptions:
Discount rates – 1% increase (432)
Interest rates (including consequential changes for assumed investment returns for all asset classes,
market values of debt securities, and all risk discount rates):
– 1% increase 108
– 1% decrease (142)
Equity/property yields – 1% rise 297
Equity/property market values – 10% fall (480)
Non-economic assumptions:
Maintenance expenses – 10% decrease 33
Lapse rates – 10% decrease 68
Mortality and morbidity – 5% decrease in base rates (i.e. increased longevity) (62)

112 Prudential plc Annual Report 2005
D2: UK insurance operations continued(h) Sensitivity of IFRS basis profit or loss and equity to changes that have a material effect
The primary sensitivities that have a material effect on the IFRS basis results of the UK insurance operations relate to asset-liability
matching and mortality experience for shareholder-backed annuity business. Further details are described below.
(i) With-profits business
SAIF
Shareholders have no interest in the profits of SAIF but are entitled to the investment management fees paid on the business.
With-profits sub-fund business
For with-profits business (including non-participating business of PAL which is owned by the WPSF) adjustments to liabilities and
any related tax effects are recognised in the income statement. However, except for any impact on the annual declaration of bonuses,
shareholders’ profit for with-profits business is unaffected. This is because IFRS basis profits for with-profits business, which are determined
on the same basis as on preceding UK GAAP, solely reflect one-ninth of the cost of bonuses declared for the year.
The main factors that influence the determination of bonus rates are the return on the investments of the fund, the effect of inflation,
taxation, the expenses of the fund chargeable to policyholders and the degree to which investment returns are smoothed. Mortality
and other insurance risk represent a relatively small component of the factors.
Unallocated surplus represents the excess of assets over policyholder liabilities of the fund. As unallocated surplus of the WPSF is
recorded as a liability, movements in its value do not affect shareholders’ profits or equity.
The level of unallocated surplus is particularly sensitive to the level of investment returns on the portion of the life fund assets that
represent the surplus. The effects for 2005 and 2004 are demonstrated in note D5.
(ii) Shareholder-backed annuity business
Profits from shareholder-backed annuity business are most sensitive to:
■ The extent to which the duration of the assets held closely match the expected duration of the liabilities under the contracts, assuming
close matching, the impact of short-term asset value movements for interest rate movements will broadly offset changes in the values
of liabilities caused by movements in valuation rates of interest;
■ actual versus expected default rates on assets held;
■ the difference between long-term rates of return on corporate bonds and risk-free rates;
■ the variance between actual and expected mortality experience; and
■ the extent to which expected future mortality experience gives rise to changes in the measurement of liabilities.
A decrease in assumed mortality rates of 1 per cent would decrease gross profits by approximately £33 million. A decrease in credit default
assumptions of five basis points would increase gross profits by £65 million. A decrease in renewal expenses (excluding investment
management expenses) of 5 per cent would increase gross profits by £12 million. The effect on profits would be approximately symmetrical
for changes in assumption that are directionally opposite to those explained above.
(iii) Unit-linked and other business
Unit-linked and other business represents a comparatively small proportion of the in-force business of the UK insurance operations.
Profits from unit-linked and similar contracts primarily arise from the excess of charges to policyholders, for management of assets under
the Company’s stewardship, over expenses incurred. The former is most sensitive to the net accretion of funds under management as a
function of new business and lapse and mortality experience. The accounting impact of the latter is dependent upon the amortisation of
acquisition costs in line with the emergence of margins (for insurance contracts) and amortisation in line with service provision (for the
investment management component of investment contracts). By virtue of the design features of most of the contracts which provide low
levels of mortality cover the profits are relatively insensitive to changes in mortality experience.
(iv) Exposure to interest rate risk
By virtue of the fund structure, product features and basis of accounting described in note D2(b) and (d), the policyholder liabilities of the
UK insurance operations are, except for pension annuity business, not generally exposed to interest rate risk. For pension annuity, business
liabilities are exposed to fair value interest rate risk. However, the net exposure to the PAC WPSF (for PAL) and shareholders (for liabilities
of PRIL) is very substantially ameliorated by virtue of the close matching of assets with appropriate duration.
(i) Duration of liabilities
With the exception of most unitised with-profit bonds and other whole of life contracts the majority of the contracts of the UK insurance
operations have a contract term. However, in effect, the maturity term of contracts reflects the earlier of death, maturity, or lapsation. In
addition, with-profit contract liabilities as noted in note D2(d) above include projected future bonuses based on current investment values.
The actual amounts payable will vary with future investment performance of SAIF and the WPSF. To ascribe particular amounts payable to
these contracts in future years does not provide appropriate information.
Notes on the Group financial statements continued

Prudential plc Annual Report 2005 113
D2: UK insurance operations continuedThe Group uses cash flow projections of expected benefit payments as part of the determination of the value of in-force business when
preparing EEV basis results. The maturity profile of the cash flows used for 2005 for that purpose for insurance contracts, as defined by
IFRS, i.e. those containing significant insurance risk, and investment contracts, which do not, is as follows:
Insurance contracts Investment contracts
Unit-linked With-profits PAL PRIL Other With-profits and similar
% % % % % %
Expected maturity:
0 to 5 years 48 32 29 33 25 45
5 to 10 years 29 24 22 25 24 24
10 to 15 years 13 17 17 18 18 14
15 to 20 years 6 12 12 14 14 8
20 to 25 years 3 7 8 6 11 5
Over 25 years 1 8 12 4 8 4
D3: US operations(a) Summary balance sheet at 31 December 2005
Long-term business
Variableannuity
separate Fixed Broker-account annuity, GIC dealer US
assets and and other and fund operationsliabilities* business* Total management total
£m £m £m £m £m
Assets
Goodwill – – – 16 16
Other intangibles – 1,634 1,634 – 1,634
Other non-investment and non-cash assets – 1,799 1,799 89 1,888
Investments:
Investment properties – 41 41 – 41
Financial investments:
Loans and receivables – 3,577 3,577 – 3,577
Equity securities and portfolio holdings in unit trusts 8,574 273 8,847 – 8,847
Debt securities – 24,290 24,290 – 24,290
Other investments – 794 794 31 825
Deposits – 374 374 6 380
Total investments 8,574 29,349 37,923 37 37,960
Cash and cash equivalents – 154 154 48 202
Total assets 8,574 32,936 41,510 190 41,700
Equity and liabilities
Equity
Shareholders’ equity – 2,899 2,899 70 2,969
Minority interests – 2 2 – 2
Total equity – 2,901 2,901 70 2,971
Liabilities
Policyholder liabilities:
Insurance contract liabilities 8,574 21,905 30,479 – 30,479
Investment contract liabilities without discretionary participation
features (GIC and annuity certain) – 1,502 1,502 – 1,502
Total 8,574 23,407 31,981 – 31,981
Core structural borrowings of shareholder-financed operations – 145 145 – 145
Operational borrowings attributable to shareholder-financed operations – 1,085 1,085 – 1,085
Other non-insurance liabilities – 5,398 5,398 120 5,518
Total liabilities 8,574 30,035 38,609 120 38,729
Total equity and liabilities 8,574 32,936 41,510 190 41,700
*Assets and liabilities attaching to variable annuity business that are not held in the separate account are shown within those of other business.

114 Prudential plc Annual Report 2005
D3: US operations continuedSummary policyholder liabilities (net of reinsurance) and reserves at 31 December 2005
The policyholder liabilities, net of reinsurers’ share of £520 million reflect balances in respect of the following:2005
£m
Policy reserves and liabilities on non-linked business:
Reserves for future policyholder benefits and claims payable 971
Deposits on investment contracts (as defined under US GAAP) 20,702
Guaranteed investment contracts 1,214
Unit-linked (variable annuity (VA)) business 8,574
31,461
In addition to the policyholder liabilities above, JNL has entered into a programme of funding arrangements under contracts which, in
substance, are almost identical to GICs. The liabilities under these funding arrangements totalled £3,267 million and are included in ‘other
non-insurance liabilities’ in the balance sheet above.
(b) Products and guarantees
JNL provides long-term savings and retirement products to retail and institutional customers throughout the US. JNL offers individual fixed
annuities, fixed index annuities, immediate annuities, variable annuities, individual and variable life insurance and institutional products.
(i) Fixed annuities
Interest-sensitive annuities
In 2005, interest-sensitive fixed annuities accounted for 36 per cent (2004: 41 per cent) of policy and contract liabilities of JNL. Interest-
sensitive fixed annuities are primarily deferred annuity products that are used for retirement planning and for providing income in
retirement. They permit tax-deferred accumulation of funds and flexible payout options.
The policyholder of an interest-sensitive fixed annuity pays JNL a premium, which is credited to the policyholder’s account. Periodically,
interest is credited to the policyholder’s account and in some cases administrative charges are deducted from the policyholder’s account.
JNL makes benefit payments at a future date as specified in the policy based on the value of the policyholder’s account at that date.
The policy provides that at JNL’s discretion it may reset the interest rate, subject to a guaranteed minimum. The minimum guarantee
varies from 1.5 per cent to 5.5 per cent (2004: 1.5 per cent to 5.5 per cent) depending on the jurisdiction of issue and the date of issue,
with 73 per cent (2004: 73 per cent) of the fund at 3 per cent or less. The average guarantee rate is 3.3 per cent (2004: 3.3 per cent).
Approximately 29 per cent (2004: 22 per cent) of the interest-sensitive fixed annuities JNL wrote in 2005 provide for a market value
adjustment, that could be positive or negative, on surrenders in the surrender period of the policy. This formula-based adjustment
approximates the change in value that assets supporting the product would realise as interest rates move up or down. The minimum
guaranteed rate is not affected by this adjustment.
Fixed index annuities
Fixed index annuities account for 7 per cent (2004: 6 per cent) of JNL’s policy and contract liabilities at 31 December 2005. Fixed indexed
annuities vary in structure, but generally are deferred annuities that enable policyholders to obtain a portion of an equity-linked return but
provide a guaranteed minimum return. These guaranteed minimum rates are generally set at 3 per cent.
JNL hedges the equity return risk on fixed index products using futures and options linked to the relevant index. The cost of these hedges
is taken into account in setting index participation rates and caps. JNL bears the investment and surrender risk on these products.
Immediate annuities
At 31 December 2005, immediate annuities accounted for 2 per cent (2004: 2 per cent) of JNL’s policy and contract liabilities. Immediate
annuities guarantee a series of payments beginning within a year of purchase and continuing over either a fixed period of years and/or
the life of the policyholder. If the term is for the life of the policyholder, then JNL’s primary risk is mortality risk. The implicit interest rate
on these products is based on the market conditions that exist at the time the policy is issued and is guaranteed for the term of the annuity.
(ii) Variable annuities
At 31 December 2005, VAs accounted for 32 per cent (2004: 26 per cent) of JNL’s policy and contract liabilities. VAs are deferred annuities
that have the same tax advantages and payout options as interest-sensitive and fixed index annuities.
The primary difference between VAs and interest-sensitive or fixed index annuities are investment risk and return. If a policyholder
chooses a VA, the rate of return depends upon the performance of the selected fund portfolio. Policyholders may allocate their investment
to either the fixed or variable account. Investment risk on the variable account is borne by the policyholder, while investment risk in the
fixed account is borne by JNL through guaranteed minimum fixed rates of return. At 31 December 2005, approximately 19 per cent
(2004: 26 per cent) of VA funds were in fixed accounts.
Notes on the Group financial statements continued

Prudential plc Annual Report 2005 115
D3: US operations continuedJNL issues VA contracts where it contractually guarantees to the contract holder either a) return of no less than total deposits made to the
contract adjusted for any partial withdrawals, b) total deposits made to the contract adjusted for any partial withdrawals plus a minimum
return, or c) the highest contract value on a specified anniversary date adjusted for any withdrawals following the contract anniversary.
These guarantees include benefits that are payable in the event of death (guaranteed minimum death benefit (GMDB)), annuitisation
(guaranteed minimum income benefit (GMIB)), or at specified dates during the accumulation period (guaranteed minimum withdrawal
benefit (GMWB)). JNL hedges these risks using equity options and futures contracts as described in note D3(c).
(iii) Life insurance
JNL’s life insurance products accounted for 9 per cent (2004: 10 per cent) of JNL’s policy and contract liabilities at 31 December 2005.
The products offered include variable life insurance, term life insurance and interest-sensitive life insurance.
(iv) Institutional products
JNL’s institutional products consist of GICs, funding agreements (including agreements issued in conjunction with JNL’s participation in
the US Federal Home Loan Bank programme) and medium-term note funding agreements. At 31 December 2005, institutional products
accounted for 14 per cent of JNL’s policyholder reserves (2004: 15 per cent). Under a traditional GIC, the policyholder makes a lump sum
deposit. The interest rate paid is fixed and established when the contract is issued. If deposited funds are withdrawn earlier than the
specified term of the contract, an adjustment is made that approximates a market value adjustment.
Under a funding agreement, the policyholder either makes a lump sum deposit or makes specified periodic deposits. JNL agree to pay a
rate of interest, which may be fixed but which is usually a floating short-term interest rate linked to an external index. The average term of
the funding arrangements is one to two years. Funding agreements terminable by the policyholder with less than 90 days notice account
for less than 1 per cent (2004: 2 per cent) of JNL total policyholder reserves.
Medium-term note funding agreements are generally issued to support trust instruments issued on non-US exchanges or to qualified
investors (as defined by SEC rule 144A). Through the funding agreements, JNL agrees to pay a rate of interest, which may be fixed or
floating, to the holders of the trust instruments.
(c) Risk management
JNL’s main exposure to market risk is through its exposure to interest rate risk because approximately 88 per cent (2004: 88 per cent) of its
general account investments support interest-sensitive and fixed index annuities, life business and surplus and 12 per cent (2004: 12 per cent)
support institutional business. All of these types of business contain considerable interest rate guarantee features and, consequently,
require that the assets that support them are primarily fixed income or fixed maturity.
Prudential is exposed primarily to the following risks in the US arising from fluctuations in interest rates:
■ The risk of loss related to meeting guaranteed rates of accumulation following a sharp and sustained fall in interest rates;
■ the risk of loss related to policyholder withdrawals following a sharp and sustained increase in interest rates; and
■ the risk of mismatch between the expected duration of certain annuity liabilities and prepayment risk and extension risk inherent in
mortgage-backed securities.
JNL enters into financial derivative transactions, including swaps, forwards, put-swaptions, futures and options to reduce and manage
business risks. These transactions manage the risk of a change in the value, yield, price, cash flows, or quantity of, or a degree of exposure
with respect to assets, liabilities or future cash flows, which JNL has acquired or incurred.
JNL generally uses free-standing derivative instruments for hedging purposes. Additionally, certain liabilities, primarily trust instruments
supported by funding agreements, fixed index annuities and GMWB and reinsurance GMIB features of variable annuities, issued by
JNL contain embedded derivatives as defined by IAS 39, ‘Financial Instruments: Recognition and Measurement’. JNL does not account
for such derivatives as either fair value or cash flow hedges as might be permitted if specific hedge documentation requirements of IAS 39
were followed. Financial derivatives, including derivatives embedded in certain host liabilities that have been separated for accounting and
financial reporting purposes are carried at fair value.
Value movements on the derivatives are reported within the income statement. Under the Group’s accounting policies supplementary
analysis of the profit before taxes attributable to shareholders is provided as shown in note B1. In preparing this analysis value movements
on JNL derivative contracts, other than for certain equity-based product management activities, are included within short-term fluctuations
in investment returns and excluded from operating results based on longer-term investment returns. Value movements on derivative
instruments used for certain equity-based product management activities are included within operating results based on longer-term
investment returns as the value movements broadly offset the economic impact of changed levels of benefit payments and reserves as
equity markets fluctuate. The types of derivative used by JNL and their purpose are as follows:
■ Interest rate swaps agreements generally involve the exchange of fixed and floating payments over the life of the agreement without
an exchange of the underlying principal amount. These agreements are used for hedging purposes;
■ forwards consist of interest spreadlock agreements, in which JNL locks in the forward interest rate differential between a swap and
the corresponding US Treasury security. The forwards are held for investment purposes;
■ put-swaption contracts provide the purchaser with the right, but not the obligation, to require the writer to pay the present value of
a long-duration interest rate swap at future exercise dates. JNL purchases and writes put-swaptions with maturities up to 10 years.
On a net basis, put-swaptions hedge against significant upward movements in interest rates;

116 Prudential plc Annual Report 2005
D3: US operations continued■ equity index futures contracts and equity index call and put options are used to hedge JNL’s obligations associated with its issuance of
fixed index immediate and deferred annuities and certain VA guarantees. These annuities and guarantees contain embedded options
which are fair valued for accounting and financial reporting purposes;
■ total return swaps in which JNL receives equity returns or returns based on reference pools of assets in exchange for short-term floating
rate payments based on notional amounts, are held for both hedging and investment purposes; and
■ cross-currency swaps, which embody spot and forward currency swaps and additionally, in some cases, interest rate swaps and equity
index swaps, are entered into for the purpose of hedging JNL’s foreign currency denominated funding agreements supporting trust
instrument obligations.
As noted above, JNL is exposed to equity risk through the options embedded in JNL’s fixed indexed liabilities and guarantees included
in certain VA benefits including GMDB and GMWB. This risk is managed using a comprehensive equity hedging programme to minimise
the risk of a significant economic impact as a result of increases or decreases in equity market levels while taking advantage of naturally
offsetting exposures in JNL’s operations. JNL purchases external futures and options that hedge the risks inherent in these products, while
also considering the impact of rising and falling separate account fees. As a result of this hedging programme, if the equity markets were
to increase by 10 per cent, JNL’s free-standing derivatives would decrease in value by approximately £22 million net of related changes to
amortisation of deferred acquisition costs. This would be substantially offset by the positive impact of increased separate account fees and
reserve decreases of approximately £14 million, net of related changes to amortisation of deferred acquisition costs, resulting in a net loss
of approximately £8 million.
For risk management purposes, the US general account portfolio is divided substantially into assets that support the interest-sensitive life
and fixed annuity business, the institutional business and the fixed index business. Prudential hedges the equity return risk on fixed index
products by purchasing futures and options on the relevant index.
Information on credit risk of debt securities and mortgage-backed securities
For statutory reporting in the US, debt securities are classified into six quality categories specified by the Securities Valuation Office of the
National Association of Insurance Commissioners (NAIC). The categories range from Class 1 (the highest) to Class 6 (the lowest). Performing
securities are designated as Classes 1 to 5. Securities in or near default are designated Class 6. Securities designated as Class 3, 4, 5 and 6
are non-investment grade securities. Generally, securities rated AAA to A by nationally recognised statistical ratings organisations are
reflected in Class 1, BBB in Class 2, BB in Class 3 and B and below in Classes 4 to 6. If a designation is not currently available from the
NAIC, JNL’s investment advisor, PPM America, provided the designation for the purposes of disclosure below.
The following table shows the quality of publicly traded and SEC Rule 144A traded debt securities held by the US operations as at
31 December 2005:Carrying value
£m % of total
NAIC designation:
1 5,852 39.0
2 7,622 50.8
3 1,183 7.9
4 320 2.1
5 30 0.2
6 – 0.0
15,007 100.0
The following table shows the quality of the non-SEC Rule 144A traded private placement portfolio:Carrying value
£m % of total
NAIC designation:
1 1,368 42.8
2 1,471 46.0
3 299 9.3
4 51 1.6
5 – –
6 11 0.3
3,200 100.0
Of the residential mortgage-backed securities, 86.9 per cent were rated AAA or the equivalent by a nationally recognised statistical ratings
organisation (including Standard & Poor’s, Moody’s and Fitch) and 99.9 per cent were rated NAIC 1.
Of the commercial mortgage-backed securities, 100 per cent were rated by a nationally recognised statistical ratings organisation
(including Standard & Poor’s, Moody’s and Fitch) and 98.5 per cent were rated investment grade.
Notes on the Group financial statements continued

Prudential plc Annual Report 2005 117
D3: US operations continued(d) Process for setting assumptions and determining liabilities
Under the MSB of reporting applied under IFRS 4 for insurance contracts, providing the requirements of the Companies Act, UK GAAP
standards and the ABI SORP are met, it is permissible to reflect the local basis of provisioning. In the case of JNL, except for adjustments
for certain items, the carrying values of insurance assets and liabilities are consolidated into the Group accounts based on US GAAP. The
exceptions are for IFRS accounting in 2004 for fixed index annuities, which include embedded derivatives that are supported by equity
call options and VA GMWB benefits, and VA GMIB benefits. For 2004, before the adoption of IAS 39, the call options were valued at
amortised cost whilst the VA benefits were recognised as a portion of accumulated assessments related to expected excess benefits
under MSB. For 2005, in line with US GAAP, these are carried at fair value following the adoption of IAS 39 using the Black-Scholes
option valuation methodology.
Under US GAAP, investment contracts (as defined for US GAAP purposes) are accounted for by applying in the first instance a
retrospective deposit method to determine the liability for policyholder benefits. This is then augmented by potentially three additional
amounts. These amounts are for:
■ Any amounts that have been assessed to compensate the insurer for services to be performed over future periods (i.e. deferred income);
■ any amounts previously assessed against policyholders that are refundable on termination of the contract; and
■ any probable future loss on the contract (i.e. premium deficiency).
Capitalised acquisition costs and deferred income for these contracts are amortised over the life of the book of contracts. The present
value of the estimated gross profits is computed using the rate of interest that accrues to policyholder balances (sometimes referred to as
the contract rate). Estimated gross profits include estimates of the following elements, each of which will be determined based on the best
estimate of amounts of the following individual elements over the life of the book of contracts without provision for adverse deviation for:
■ Amounts expected to be assessed for mortality less benefit claims in excess of related policyholder balances;
■ amounts expected to be assessed for contract administration less costs incurred for contract administration;
■ amounts expected to be earned from the investment of policyholder balances less interest credited to policyholder balances;
■ amounts expected to be assessed against policyholder balances upon termination of contracts (sometimes referred to as surrender
charges); and
■ other expected assessments and credits.
VA contracts written by JNL may, as described above, provide for GMDB, GMIB and GMWB features. In general terms, liabilities for these
benefits are accounted for under US GAAP by using estimates of future benefits and fees under best estimate persistency assumptions.
The GMDB liability is determined each period end by estimating the expected value of death benefits in excess of the projected account
balance and recognising the excess rateably over the accumulation period based on total expected assessments. At 31 December 2005,
the GMDB liability was valued using a series of deterministic investment performance scenarios, a mean investment return of 8.4 per cent
(2004: 8.4 per cent) and assumptions for lapse, mortality and expense that are the same as those used in amortisation of capitalised
acquisition costs.
The direct GMIB liability is determined by estimating the expected value of the annuitisation benefits in excess of the projected account
balance at the date of annuitisation and recognising the excess rateably over the accumulation period based on total expected assessments.
The assumptions used for calculating the direct GMIB liability at 31 December 2005 and 2004 are consistent with those used for calculating
the GMDB liability.
JNL regularly evaluates estimates used and adjusts the additional GMDB and GMIB liability balances, with a related charge or credit to
benefit expense, if actual experience or other evidence suggests that earlier assumptions should be revised.
GMIB benefits are essentially fully reinsured, subject to annual claim limits. As this reinsurance benefit is net settled, it is considered to be
a derivative under IAS 39 and is, therefore, recognised at fair value with the change in fair value included as a component of short-term
derivative fluctuations.
Most GMWB features are considered to be embedded derivatives under IAS 39. Therefore, provisions for these benefits are recognised
at fair value, with the change in fair value included in operating profit based on longer-term investment returns. Certain GMWB features
guarantee payments over a lifetime and, therefore, include mortality risk. Provisions for these GMWB amounts, which are not significant,
are valued consistent with the GMDB valuation method discussed above.

118 Prudential plc Annual Report 2005
D3: US operations continuedThe fair values of the GMWB and GMIB reinsurance derivatives are calculated based on actuarial assumptions related to the projected
cash flows, including benefits and related contract charges, over the expected lives of the contracts, incorporating expectations regarding
policyholder behaviour in varying economic conditions. As the nature of these cash flows can be quite varied, stochastic techniques
are used to generate a variety of market return scenarios for evaluation. The generation of these scenarios and the assumptions as to
policyholder behaviour involve numerous estimates and subjective judgements, including those regarding expected market volatility,
correlations of market returns and discount rates, utilisation of the benefit by policyholders under varying conditions, and policyholder
lapsation. At each valuation date, JNL assumes expected returns based on risk-free rates as represented by the LIBOR forward curve
rates as of that date and market volatility as determined with reference to implied volatility data and evaluations of historical volatilities for
various indices. The risk-free spot rates as represented by the LIBOR spot curve as of the valuation date are used to determine the present
value of expected future cash flows produced in the stochastic process.
With the exception of the GMDB, GMIB and GMWB features of VA contracts, the financial guarantee features of JNL’s contracts are
in most circumstances not explicitly valued under the standard US GAAP basis of calculation, but the impact of any interest guarantees
would be reflected as they are earned in the current account value (i.e. the US GAAP liability).
For traditional life insurance contracts, provisions for future policy benefits are determined under US GAAP standard FAS 60, ‘Accounting
and Reporting by Insurance Enterprises’ using the net level premium method and assumptions as of the issue date as to mortality, interest,
policy lapses and expenses plus provisions for adverse deviation.
Institutional products are accounted for as investment contracts under IFRS with the liability classified as being in respect of financial
instruments rather than insurance contracts, as defined by IFRS 4. In practice, there is no material difference between the IFRS and
US GAAP basis of recognition and measurement for these contracts.
Certain institutional products representing obligations issued in currencies other than US dollars have been hedged for changes in
exchange rates using cross-currency swaps. The fair value of derivatives embedded in funding agreements, as well as foreign currency
transaction gains and losses, are included in the carrying value of the trust instruments supported by funding agreements.
(e) Reinsurance
The principal reinsurance ceded by JNL outside the Group is on term life insurance, direct and assumed accident and health business and
certain annuity guarantees. In 2005, the premiums for such ceded business amounted to £78 million. Net commissions received on ceded
business and claims incurred ceded to external reinsurers totalled £13 million and £54 million, respectively, during 2005. There were no
deferred gains or losses on reinsurance contracts in either 2005 or 2004. The reinsurance asset for business ceded outside the Group was
£520 million.
(f) Effect of changes in assumptions used to measure insurance assets and liabilities
The operating profit based on longer-term investment returns of £362 million for US operations for 2005 has been determined after
taking account of material changes of assumptions during the year. Several assumptions were modified in 2005 to conform to more
recent experience. The most significant changes included a DAC write-down of £21 million for Single Premium Deferred Annuities partial
withdrawal changes and a Universal Life SOP 03-1, ‘Accounting and Reporting by Insurance Enterprises for Certain Non-traditional Long
Duration Contracts and Separate Accounts’ reserve increase of £13 million due to increasing the mortality assumption. Several smaller
changes relating to Single Premium Whole Life surrenders and annuity mortality and annuitisation rates, resulted in a £19 million benefit
on adjusting amortisation of deferred acquisition costs. Combined with other minor modifications, the resulting net impact of all changes
during the year was a decrease to pre-tax profits of £7 million.
(g) Amount, timing and uncertainty of future cash flows from insurance contracts
At 31 December 2005, the EEV basis value of in-force business of the US operations, after taking account of the cost of encumbered
capital, and the cost of the time value of financial options and guarantees was £1,251 million. This value has been determined after
applying the principles of valuation described in section (d) of this note. The key assumptions in these projections are the risk discount
rates, which are 8.0 per cent for VA business and 5.2 per cent for other business, and the expected long-term spread between the earned
rate and the rate credited to policyholders for single premium deferred annuity business of 1.75 per cent.
The sensitivity of this value to changes in key assumptions is as follows:£m
Economic assumptions:
Discount rates – 1% increase (133)
Interest rates (including consequential changes for assumed investment returns for all asset classes,
market values of debt securities, and all risk discount rates):
– 1% increase (144)
– 1% decrease 55
Equity/Property yields – 1% rise 42
Equity/Property market values – 10% fall (85)
Non-economic assumptions:
Maintenance expenses – 10% decrease 36
Lapse rates – 10% decrease 90
Mortality and morbidity – 5% decrease in base rates (i.e. increased longevity):
Life 83
Annuity (relating to VA business) 7
Notes on the Group financial statements continued

Prudential plc Annual Report 2005 119
D3: US operations continued(h) Sensitivity of IFRS basis profit or loss and equity to changes that have a material effect
(i) Currency fluctuations
Consistent with the Group’s accounting policies the profits of the Group’s US operations are translated at average exchange rates and
shareholders’ equity at the closing rate for the reporting period. For 2005, the rates were US$1.82 and US$1.72 to £1 sterling respectively.
A 10 per cent increase in these rates would reduce reported profit before tax attributable to shareholders and shareholders’ equity
attributable to US insurance operations by £48 million and £270 million respectively.
(ii) Other sensitivities
The principal determinants of variations in operating profit based on longer-term returns are:
■ Growth in the size of assets under management covering the liabilities for the contracts in force; and
■ spread returns for the difference between investment returns and rates credited to policyholders.
For the purpose of determining longer-term returns, adjustment is necessary for the normalisation of investment returns to remove the
effects of short-term volatility in investment returns.
■ Amortisation of deferred acquisition costs.
For term business, acquisition costs are deferred and amortised in line with expected premiums. For annuity business, acquisition
costs are deferred and amortised in line with expected gross profits on the relevant contracts. For interest-sensitive business, the key
assumption is the expected long-term spread between the earned rate and the rate credited to policyholders, which is based on an
annual spread analysis. In addition, expected gross profits depend on mortality assumptions, assumed unit costs and terminations other
than deaths (including the related charges) all of which are based on a combination of actual experience of the JNL companies, industry
experience and future expectations. A detailed analysis of actual experience is measured by the internally developed mortality studies.
For VA business, the key assumption is the expected long-term level of equity market returns which for 2005 and 2004, was 8.4 per cent
per annum implemented using a mean reversion methodology. These returns affect the level of future expected profits through their
effects on the fee income and the required level of provision for guaranteed minimum death benefit claims.
■ Variations in fees and other income, offset by variations in market value adjustment payments and, where necessary, strengthening of
liabilities.
Except to the extent of mortality experience, which primarily affects profits through variations in claim payments and GMDB reserves,
the profits of JNL are relatively insensitive to changes in insurance risk.
(iii) Exposure to interest rate risk
Notwithstanding the market risk exposure described in section D3(c), except in the circumstances of interest rate scenarios where the
guarantee rates included in contract terms are higher than crediting rates that can be supported from assets held to cover liabilities, the
accounting measurement of liabilities of JNL products is not generally sensitive to interest rate risk. This position derives from the nature
of the products and the US GAAP basis of measurement described in sections D3(b) and D3(d).
(i) Duration of liabilities
The Group uses cash flow projections of expected benefit payments as part of the determination of the value of in-force business when
preparing EEV basis results. The maturity profile of the cash flows used for that purpose for 2005 is as follows:Fixed
annuity andother business
(including GICsand similar Variablecontracts) annuity
% %
Expected maturity:
0 to 5 years 34 34
5 to 10 years 29 31
10 to 15 years 17 19
15 to 20 years 10 10
20 to 25 years 5 4
Over 25 years 5 2

120 Prudential plc Annual Report 2005
D4: Asian operations(a) Summary balance sheet at 31 December 2005
Unit-linkedWith-profit assets and
business liabilities Other Total£m £m £m £m
Assets
Goodwill attributable to shareholders – – 172 172
Other intangibles (primarily deferred acquisition costs) – – 566 566
Total – – 738 738
Other non-investment and non-cash assets 104 11 451 566
Investments of long-term business, banking and other operations:
Investment properties 24 – 15 39
Financial investments:
Loans and receivables 382 – 723 1,105
Equity securities and portfolio holdings in unit trusts 2,444 1,889 626 4,959
Debt securities 1,901 704 2,137 4,742
Other investments 15 3 27 45
Deposits 102 67 205 374
Total investments 4,868 2,663 3,733 11,264
Cash and cash equivalents 114 24 366 504
Total assets 5,086 2,698 5,288 13,072
Equity and liabilities
Equity
Shareholders’ equity – – 1,288 1,288
Liabilities
Policyholder liabilities and unallocated surplus of with-profits funds:
Insurance contract liabilities 4,545 2,698 3,483 10,726
Investment contract liabilities with discretionary participation features 80 – – 80
Investment contract liabilities without discretionary participation features 22 – – 22
Unallocated surplus of with-profits funds 85 – – 85
Total 4,732 2,698 3,483 10,913
Other non-insurance liabilities 354 – 517 871
Total liabilities 5,086 2,698 4,000 11,784
Total equity and liabilities 5,086 2,698 5,288 13,072
Summary policyholder liabilities (net of reinsurance) and unallocated surplus at 31 December 2005
The policyholder liabilities (net of reinsurance of £8 million) and unallocated surplus shown in the table above reflect the following balances:
2005£m
With-profits and other non-linked business 8,122
Unallocated surplus of Asian operations 85
Unit-linked business 2,698
10,905
At 31 December 2005 the policyholder liabilities (net of reinsurance) and unallocated surplus for Asian operations of £10.9 billion (2004:
£7.9 billion) comprised the following:
2005£m
Singapore 3,938
Hong Kong 2,156
Taiwan 2,050
Japan 631
Malaysia 763
Other countries 1,367
Total Asian operations 10,905
This amount covers a range of with-profit, unit-linked and non-participating contracts.
Notes on the Group financial statements continued

Prudential plc Annual Report 2005 121
D4: Asian operations continued(b) Products and guarantees
The life insurance products offered by the Group’s Asian operations include a range of with-profits and non-participating term, whole life,
endowment and unit-linked policies. The Group’s Asian operation also offers health, disability, critical illness, and accident coverage to
supplement its core life products.
The terms and conditions of the contracts written in the Asian operations and, in particular, the products’ options and guarantees, vary
from territory to territory depending upon local market circumstances.
In general terms, the Group’s Asian participating products provide savings and protection where the basic sum assured can be enhanced
by a profit share (or bonus) from the underlying fund as determined at the discretion of the insurers. The Asian operations’ non-participating
term, whole life and products offer savings with protection where the benefits are guaranteed or determined by a set of defined market
related parameters. Unit-linked products combine savings with protection, the cash value of the policy depends on the value of the
underlying unitised funds. Accident and Health (A&H) policies provide mortality or morbidity benefits and include health, disability,
critical illness and accident coverage. A&H products are commonly offered as supplements to main life policies but can be sold separately.
Subject to local market circumstances and regulatory requirements, the guarantee features described above in respect of UK business
broadly apply to similar types of participating contracts written in the PAC Hong Kong branch, Singapore and Malaysia. Participating
products have both guaranteed and non-guaranteed elements.
Non-participating long-term products are the only ones where the insurer is contractually obliged to provide guarantees on all benefits.
Investment-linked products have the lowest level of guarantee if indeed they have any.
Product guarantees in Asia can be broadly classified into four main categories; namely premium rate, cash value and interest guarantees,
policy renewability and convertibility options.
The risks on death coverage through premium rate guarantees are low due to appropriate product pricing.
Cash value and interest rate guarantees are of three types:
■ Maturity values
Maturity values are guaranteed for non-participating products and on the guaranteed portion of participating products. Declared
annual bonuses are also guaranteed once vested. Future bonus rates and cash dividends are not guaranteed in participating products.
■ Surrender values
Surrender values are guaranteed for non-participating products and on the guaranteed portion of participating products. The surrender
value of declared reversionary bonuses are also guaranteed once vested.
Market value adjustments and surrender penalties are used where the law permits such adjustments in cash values.
■ Interest rate guarantees
It is common in Asia for regulations or market driven demand and competition to provide some form of capital value protection and
minimum crediting interest rate guarantees. This would be reflected within the guaranteed maturity and surrender values.
The guarantees are borne by shareholders for non-participating and investment-linked (non-investment guarantees only) products.
Participating product guarantees are predominantly supported by the segregated life fund and its estate.
The most significant book of non-participating business in the Group’s Asian operations is Taiwan’s whole of life contracts. For these
contracts there are floor levels of policyholder benefits that accrue at rates set at inception which are set by reference to minimum terms
established by local regulation also at the time of inception. These rates do not vary subsequently with market conditions.
Under these contracts, the cost of premiums are also fixed at inception based on a number of assumptions at that time, including
long-term interest rates, mortality assumptions and expenses. The guaranteed maturity and surrender values reflect the pricing basis.
The main variable that determines the amounts payable under the contracts is the duration of the contracts, which is determined by
death or surrender. The sensitivity of the IFRS result for these contracts is shown in section (h) below.
Whole life contracts with floor levels of policyholder benefits that accrue at rates set at inception are also written in the Korean life
operations, though to a much less significant extent than in Taiwan. The Korean business has non-linked liabilities and linked liabilities
at 31 December 2005 of £193 million and £91 million respectively. The business is much less sensitive to returns than Taiwan with the
higher proportion of linked and health business.
The other area of note in respect of guarantees is the Japan business where pricing rates are higher than current bond yields. Lapse
risk is a feature in that policyholders could potentially surrender their policies on guaranteed terms if interest rates significantly increased
leaving the potential for losses if bond values had depreciated significantly. However, the business is matched to a relatively short realistic
liability duration.
The method for determining liabilities of insurance contracts for UK GAAP, and hence IFRS, purposes for some Asian operations is based
on US GAAP principles and this method applies to contracts with cash value and interest rate guarantees. Following standard US GAAP
procedure, premium deficiency reserve calculations are performed each year to establish whether the carrying values of the liabilities
are insufficient.

122 Prudential plc Annual Report 2005
D4: Asian operations continuedOn the US GAAP basis the calculations are deterministic, that is to say based off a single set of projections, and expected long-term rates
of return are applied.
(c) Exposure to market risk
In Asia, Prudential sells with-profits and unit-linked policies and, although the with-profits business generally has a lower terminal bonus
element than in the UK, the investment portfolio still contains a proportion of equities and, to a lesser extent, property. Non-participating
business is largely backed by debt securities or deposits. With the principal exception of Taiwan’s whole of life policy book, as described
in section (h) below, the exposure to market risk of the Group arising from its Asian operations is at modest levels. This arises from the
fact that the Group’s Asian operations have a balanced portfolio of with-profits, unit-linked and other types of business.
(d) Process for setting assumptions and determining liabilities
The future policyholder benefit provisions for Asian businesses in the Group’s IFRS accounts and previously under the MSB, are
determined in accordance with methods prescribed by local GAAP adjusted to comply, where necessary, with UK GAAP.
For Asian operations in countries where local GAAP is not well established and in which the business written is primarily non-participating
and linked business, US GAAP is used as the most appropriate reporting basis. Of the more significant Asia operations this basis is applied
in Taiwan, Japan and Vietnam. The future policyholder benefit provisions for non-linked business are determined under FAS 60 using the
net level premium method, with an allowance for surrenders, maintenance and claims expenses. Rates of interest used in establishing the
policyholder benefit provisions vary by operation depending on the circumstances attaching to each block of business.
For the traditional business in Taiwan, the economic scenarios used to calculate the IFRS results reflect the assumption of a phased
progression of bond yields from current rates to long-term expected rates. The projections assume that the current bond yields of around
2 per cent (3 per cent) trend towards 5.5 per cent (5.5 per cent) at 31 December 2012 (2010).
(e) Reinsurance
The Group’s Asian businesses cede only minor amounts of business outside the Group with immaterial effects on reported profit. During
2005, reinsurance premiums for externally ceded business were £37 million and reinsurance recoverable insurance assets were £8 million
in aggregate.
(f) Effect of changes in bases and assumptions used to measure insurance assets and liabilities
The 2005 results for Asian operations are affected in two significant ways for changes of basis or assumption.
For the Singapore life business, under the basis applied previously, 2004 liabilities of non-participating business were determined on a net
premium basis using prescribed interest rates such that a very high degree of prudence resulted. This basis has been replaced under the
Singapore risk-based capital framework, with one that, although still including provisions for adverse deviation, more accurately estimates
the liability. This has resulted in a change of estimate and reduction in the liability of £73 million.
The second item reflects the application of liability adequacy testing for the Taiwan life business which has resulted in a write-off of deferred
acquisition costs of £21 million in 2005. The assumptions for future investment returns for Taiwan are described in section (d) above. The
loss reflects the reduction in 2005 in the expected yields over the trending period to the assumed long-term rate of 5.5 per cent for Taiwanese
government bonds.
There were no other changes of assumptions that had a material impact on the 2005 results of Asian operations.
(g) Amount, timing and uncertainty of future cash flows from insurance contracts
At 31 December 2005, the EEV basis value of in-force business of the Group’s Asian operations, after taking account of the cost of
encumbered capital, and the cost of the time value of financial options and guarantees was £1,226 million. The most significant businesses
in Asia are in Hong Kong, Malaysia, Singapore and Taiwan. These businesses account for 77 per cent of the total value of business in force
for Prudential’s Asian operations. These EEV basis in-force values for the Asian operations have been determined after applying the principles
of valuation described in section D1 and the following key assumptions for the four most significant businesses.
Risk discount Expectedrate (in-force long-term rate Government
business) of inflation bond yield% % %
Hong Kong* 6.15 2.25 4.8
Malaysia 9.0 3.0 7.5
Singapore 6.8 1.75 4.5
Taiwan 9.4 2.25 5.5
*Hong Kong business is predominantly US dollar denominated.
The most significant equity holdings in Asian operations are in Hong Kong, Singapore and Malaysia. The arithmetic average equity
return assumptions for these three territories at 31 December 2005 were 8.6 per cent, 9.3 per cent and 12.8 per cent respectively
(2004: 7.3 per cent, 9.75 per cent, and 12.25 per cent respectively).
For Taiwan the same assumptions are applied as under IFRS (see section (d) above).
Notes on the Group financial statements continued

Prudential plc Annual Report 2005 123
D4: Asian operations continuedThe sensitivity of this value to changes in key assumptions is as follows:
£m
Economic assumptions:
Discount rates – 1% increase (236)
Interest rates (including consequential changes for assumed investment returns for all assets
classes, market values of debt securities, and all risk discount rates):
– 1% increase 49
– 1% decrease (126)
Equity/Property yields – 1% rise 136
Equity/Property market values – 10% fall (75)
Non-economic assumptions:
Maintenance expenses – 10% decrease 45
Lapse rates – 10% decrease 87
Mortality and morbidity – 5% decrease in base rates (i.e. increased longevity) 69
In addition to these disclosures, for Asian operations as a whole it should be noted that the cash flows of the Taiwan life business are
particularly sensitive to projected rates of investment return.
(h) Sensitivity of IFRS basis profit or loss and equity to changes that have a material effect
(i) Currency translation
Consistent with the Group’s accounting policies, the profits of the Group’s Asian operations are translated at average exchange rates and
shareholders’ equity at the closing rate for the reporting period. For 2005, the rates for the most significant operations are given in note I9.
A 10 per cent increase in these rates and those of other Asian operations would have reduced reported profit before tax attributable to
shareholders and shareholders’ equity, excluding goodwill attributable to Asian operations, by £23 million and £101 million respectively.
(ii) Other sensitivities
With-profits business
Similar principles to those explained for UK with-profits business apply to profit emergence for the Group’s Asian with-profit business.
Correspondingly the profit emergence reflects bonus declaration and is relatively insensitive to period by period fluctuations in insurance
risk or interest rate movements.
Unit-linked business
As for the UK insurance operations, the profits and shareholders’ equity related to the Group’s Asian operations is primarily driven by
charges related to invested funds. For the Group’s Asian operations substantially all of the contracts are classified as insurance contracts
under IFRS 4, i.e. containing significant insurance risk. The sensitivity of profits and equity to changes in insurance risk is minor, and to
interest rate risk, not material.
Other non-participating business
The principal other non-participating business of Asian operations is the traditional whole life business written in Taiwan.
The in-force business of Taiwan life operation includes traditional whole of life policies where the premium rates have been set by the
regulator at different points for the industry as a whole. Premium rates were set to give a guaranteed minimum sum assured on death and
a guaranteed surrender value on early surrender based on prevailing interest rates at the time of policy issue. Premium rates also included
allowance for mortality and expenses. The required rates of guarantee have fallen over time as interest rates have reduced from a high of
8 per cent to current levels of around 2 per cent. The current low level of bond rates in Taiwan gives rise to a negative spread against the
majority of these policies. The current cash costs of funding in-force negative spread in Taiwan is around £30 million a year.
The profits attaching to these contracts are particularly affected by the rates of return earned, and estimated to be earned, on the assets
held to cover liabilities and on future investment income and contract cash flows. Under IFRS, the insurance contract liabilities of the
Taiwan business are determined on the US GAAP basis as applied previously under UK GAAP. Under this basis the policy liabilities are
calculated on sets of assumptions, which are locked in at the point of policy inception, and a deferred acquisition cost is held in the
balance sheet.
The adequacy of the insurance contract liabilities is tested by reference to best estimates of expected investment returns on policy cash
flows and reinvested income. The assumed earned rates are used to discount the future cash flows. The assumed earned rates consist of
a long-term best estimate determined by consideration of long-term market conditions, and rates assumed to be earned in the trending in
period. As previously noted in section (d), for 2005, it has been projected that rates of return for Taiwanese bond yields will trend from the
current levels of some 2 per cent to 5.5 per cent by 31 December 2012.

124 Prudential plc Annual Report 2005
D4: Asian operations continuedThe liability adequacy test results are sensitive to the attainment of the trended rates during the trending period. Based on the current
asset mix, margins in other contracts that are used in the assessment of the liability adequacy tests, and currently assumed future rates of
return, if interest rates were to remain at current levels in 2006 the premium reserve, net of deferred acquisition costs, would be broadly
sufficient. If interest rates were to remain at current levels in 2007 then some level of write-off of deferred acquisition costs may be
necessary. However, the amount of the charge, currently estimated at £50-70 million is sensitive for the previously mentioned variables.
The adequacy of the liability is also sensitive to the level of the projected long-term rate. The current long-term assumption of 5.5 per cent
has been determined on a prudent best estimate basis by reference to detailed assessments of the financial dynamics of the Taiwanese
economy. In the event that the rate applied was reduced or increased the carrying value of the liabilities would be affected.
In broad terms, if the assumed long-term rate applied was to fall by 0.25 per cent from 5.5 per cent to 5.25 per cent the impact on IFRS
basis results would be a charge of some £120-130 million. If the rate was to further reduce the incremental increase in liabilities would be
of a similarly commensurate size. The effects of changes in any one year reflect the combination of the short-term and long-term factors
described above.
For the Korean and Japan life business exposures described in section (b) above, the results are comparatively unaffected by changes
of assumption. The accounts basis value of liabilities for both operations are of a similar order of magnitude to those that apply for the
purposes of Group solvency calculations under the Financial Conglomerates Directive (FCD).
(i) Duration of liabilities
The Group uses cash flow projections of expected benefit payments as part of the determination of the value of in-force business when
preparing EEV basis results. The maturity profile of the cash flows, taking account of expected future premiums and investment returns,
is as follows:Asia total
%
Expected maturity:
0 to 5 years 23
5 to 10 years 25
10 to 15 years 19
15 to 20 years 12
20 to 25 years 8
Over 25 years 13
Notes on the Group financial statements continued

Prudential plc Annual Report 2005 125
D5: Capital position statement for life assurance businesses(a) Summary statement
The Group’s capital position for life assurance businesses with reconciliations to shareholders’ funds is shown below. Available capital for
each fund or group of companies is determined by reference to local regulation at 31 December 2004 and 2005.Parent
companyand
shareholders’Other UK equity of
Total PAC subsidiaries Asian life Total life otherWPSF with-profits and funds assurance assurance subsidiaries
SAIF (note i) fund (note ii) JNL subsidiaries operations M&G Egg and funds Group31 December 2005 £m £m £m £m £m £m £m £m £m £m £m
Group shareholders’ equity
Held outside long-term funds:
Net assets 0 0 0 640 2,899 1,034 4,573 245 303 (1,826) 3,295
Goodwill 0 0 0 0 – 111 111 1,153 – 77 1,341
Total 0 0 0 640 2,899 1,145 4,684 1,398 303 (1,749) 4,636
Held in long-term funds (note iii) 0 0 0 558 – – 558 – – – 558
Total Group shareholders’ equity 0 0 0 1,198 2,899 1,145 5,242 1,398 303 (1,749) 5,194
Adjustments to regulatory basis
Unallocated surplus of with-profits
funds (note v) 0 11,272 11,272 – – 85 11,357
Shareholders’ share in realistic liabilities – (3,473) (3,473) – – – (3,473)
Deferred acquisition costs of
non-participating business and
goodwill not recognised for
regulatory reporting purposes (6) (29) (35) (168) (1,624) (619) (2,446)
JNL surplus notes (note iv) – – – – 145 – 145
Part of IAS 19 basis deficit attributable
to WPSF not recognised for regulatory
purposes – 211 211 – – – 211
Other adjustments to restate these
amounts to a regulatory basis
(with SAIF and the WPSF on a Peak 2
realistic basis) (note v) 6 (2) 4 (271) 837 (41) 529
Total adjustments 0 7,979 7,979 (439) (642) (575) 6,323
Total available capital resources
of life assurance businesses
on local regulatory bases 0 7,979 7,979 759 2,257 570 11,565
Other UKsubsidiaries Total life
and Asian life assuranceSAIF WPSF (i) funds (ii) JNL operations operations
Policyholder liabilities £bn £bn £bn £bn £bn £bn
With-profits liabilities of UK regulated
with-profits funds:
Insurance contracts 13,043 32,557 – – 2,053 47,653
Investment contracts (with
discretionary participating features) 751 25,692 – – 80 26,523
Total 13,794 58,249 – – 2,133 74,176
Other liabilities:
Insurance contracts:
With-profit liabilities of non-UK
regulated funds – – – – 2,492 2,492
Unit-linked, including variable annuity – 2,125 7,629 8,574 2,698 21,026
Other life assurance business 968 12,810 10,099 21,905 3,483 49,265
Investment contracts without discretionary
participation features (principally
unit-linked and similar contracts in the
UK and GIC liabilities of JNL) (note vi) – – 10,502 1,502 22 12,026
968 14,935 28,230 31,981 8,695 84,809
Total policyholder liabilities shown
in the consolidated balance sheet 14,762 73,184 28,230 31,981 10,828 158,985

126 Prudential plc Annual Report 2005
D5: Capital position statement for life assurance businesses continuedParent
Other UK company andsubsidiaries shareholders’
and non- equity ofTotal PAC profit funds Asian life Total life other
WPSF with-profits of PAC assurance assurance subsidiariesSAIF (note i) fund (note ii) JNL subsidiaries operations M&G Egg and funds Group
31 December 2004 £m £m £m £m £m £m £m £m £m £m £m
Group shareholders’ equity
Held outside long-term funds:
Net assets 0 0 0 308 2,295 750 3,353 300 273 (1,413) 2,513
Goodwill 0 0 0 0 – 231 231 1,153 – 77 1,461
Total 0 0 0 308 2,295 981 3,584 1,453 273 (1,336) 3,974
Held in long-term funds (note iii) 0 0 0 515 – – 515 – – – 515
Total Group shareholders’ equity 0 0 0 823 2,295 981 4,099 1,453 273 (1,336) 4,489
Adjustments to regulatory basis
Unallocated surplus of with-profits
funds (note v):
Reflecting previous GAAP basis
of measuring liabilities for
with-profit contracts for UK
regulated with-profits funds 1,836 13,928 15,764 – – 385 16,149
Transition adjustment on application
of FRS 27 and IAS 39 (1,305) (6,502) (7,807) – – – (7,807)
Reflecting FSA realistic basis of
measuring liabilities for
with-profit contracts for UK
regulated with-profits funds 531 7,426 7,957 0 0 385 8,342
Shareholders’ share in realistic
liabilities 0 (2,904) (2,904) – – – (2,904)
Deferred acquisition costs of
non-participating business and
goodwill not recognised for
regulatory reporting purposes 0 (31) (31) (115) (1,528) (690) (2,364)
JNL surplus notes (note iv) – – – – 130 – 130
IAS 19 basis deficit attributable
to WPSF not recognised for
regulatory purposes – 525 525 – – – 525
Other adjustments to restate these
amounts to a regulatory basis
(with SAIF and the WPSF on a
Peak 2 realistic basis) (note v) 146 348 494 (160) 899 (55) 1,178
Total adjustments 677 5,364 6,041 (275) (499) (360) 4,907
Total available capital resources
of life assurance businesses
on local regulatory bases 677 5,364 6,041 548 1,796 621 9,006
Notes on the Group financial statements continued

Prudential plc Annual Report 2005 127
D5: Capital position statement for life assurance businesses continuedThe Group’s policyholder liabilities at 31 December 2004 comprise:
Other UK Total lifesubsidiaries Asian life assurance
SAIF WPSF and funds JNL operations operations£m £m £m £m £m £m
With-profits business 10,891 48,285 – – 3,380 62,556
Unit-linked business 0 2,009 14,897 5,392 1,768 24,066
Other life assurance business 846 12,774 6,499 19,596 2,725 42,440
Total policyholder liabilities as shown in
the consolidated balance sheet 11,737 63,068 21,396 24,988 7,873 129,062
Notes(i) WPSF unallocated surplus includes amounts related to the Hong Kong branch. Policyholder liabilities of the Hong Kong branch are included in the amounts of Asian operations.
(ii) Excluding PAC shareholders’ funds that are included in ‘parent company and shareholders’ equity of other subsidiaries and funds’.
(iii) The term shareholders’ equity held in long-term funds refers to the excess of assets over liabilities attributable to shareholders of funds which are required by law to bemaintained with segregated assets and liabilities.
(iv) For regulatory purposes the JNL surplus notes are accounted for as capital.
(v) Other adjustments to shareholders’ equity and unallocated surplus include amounts for the value of non-participating business for UK regulated with-profits funds, deferred tax,admissibility and other items measured differently on the regulatory basis. For Jackson National Life the principal reconciling item is deferred tax related to deferred acquisitioncosts of £568 million (2004: £535 million).
(vi) Insurance business accounted for as financial instruments under IAS 39.
(b) Basis of preparation, capital requirements and management
Each of the Group’s long-term business operations is capitalised to a sufficiently strong level for its individual circumstances. Details by
the Group’s major operations are shown below.
(i) UK insurance operations
PAC WPSF and SAIF
In common with other large UK regulated with-profits funds, PAC is required to hold capital equivalent to the greater of their regulatory
requirement based on EU directives, (i.e. the ‘regulatory peak’) and the new FSA basis calculation of expected liabilities (i.e. the ‘realistic peak’).
Available capital of the WPSF and SAIF of £8.0 billion (2004: £6.0 billion) represents the excess of assets over liabilities on the regulatory
realistic basis. Unlike the previously discussed FRS 27 basis, realistic liabilities on the regulatory basis include the shareholders’ share
of future bonuses. These amounts are shown before deduction of the risk capital margin (RCM) which is estimated to be £2.4 billion
(2004: £1.8 billion) at 31 December 2005.
The FSA’s basis of setting the RCM is to target at a level broadly equivalent to a Standard & Poor’s credit rating of BBB and of judging
this by ensuring there are sufficient assets to absorb a 1 in 200 year event. The RCM calculation achieves this by setting rules for the
determination of margins to cover defined stress changes in asset values and yields for market risk, credit risk, and termination risk for
with-profit policies.
As noted in section D2(d)(ii), the Company has discretion in its management actions in the case of adverse investment conditions.
Management actions encompass, but are not confined to, investment allocation decisions, levels of reversionary bonuses, crediting rates,
and total claim values. To illustrate the flexibility of management actions, rates of regular bonus are determined for each type of policy
primarily by targeting them at a prudent proportion of the long-term expected future investment return on the underlying assets. The
expected future investment return is reduced as appropriate for each type of policy to allow for items such as expenses, charges, tax and
shareholders’ transfers. However, the rates declared may differ by product type, or by date of payment of the premiums or date of issue of
the policy, if the accumulated annual bonuses are particularly high or low relative to a prudent proportion of the achieved investment return.
When target bonus levels change, the PAC board has regard to the overall financial strength of the long-term fund when determining the
length of time over which it will seek to achieve the amended product target bonus level.
In normal investment conditions, the Company expects changes to regular bonus rates to be gradual over time and changes are not
expected to exceed 1 per cent per annum over any year. However, discretion is retained as to whether or not a regular bonus is declared
each year, and there is no limit on the amount by which regular bonus rates can be changed.
As regards smoothing of maturity and death benefits, in normal circumstances the Company does not expect most pay-out values on
policies of the same duration to change by more than 10 per cent up or down from one year to the next, although some larger changes
may occur to balance pay-out values between different policies. Greater flexibility may be required in certain circumstances, for example
following a significant rise or fall in market values (either sudden or over a period of years) and in such situations the PAC board may
decide to vary the standard bonus smoothing limits to protect the overall interests of policyholders.
For surrender benefits, any substantial fall in the market value of the assets of the with-profits sub-fund would lead to immediate changes
in the application of MVRs for accumulating with-profits policies, firstly to increase the size of MVRs already being applied and, secondly,
to extend the range of policies for which an MVR is applied.

128 Prudential plc Annual Report 2005
D5: Capital position statement for life assurance businesses continuedOther UK subsidiaries
The available capital of £759 million (2004: £548 million) reflects the excess of regulatory basis assets over liabilities, before deduction
of the capital resources requirement of £580 million (2004: £462 million).
The capital resources requirement for these companies broadly reflects a formula, which for active funds equates to a percentage of
regulatory reserves plus a percentage of death strains.
(ii) Jackson National Life
The regulatory framework for JNL is governed by the requirements of the US NAIC approved risk-based capital standards. Under the
requirements life insurance companies report on a formula-based capital standard that they calculate by applying factors to various asset,
premium and reserve items. The formula takes into account the risk characteristics of a company, including asset risk, insurance risk,
interest rate risk and business risk.
The available capital of JNL shown above of £2,257 million (2004: £1,796 million) reflects US regulatory basis assets less liabilities
excluding asset valuation reserves but inclusive of provision for interest (the interest maintenance reserve). The asset valuation reserve is
designed to provide for future credit-related losses on debt securities and losses on equity investments. The interest maintenance reserve
is designed by state regulators to defer recognition of non-credit related realised capital gains and losses.
JNL’s risk-based capital ratio is significantly in excess of regulatory requirements.
(iii) Asian operations
The available capital shown above of £570 million (2004: £621 million) represents the excess of local regulatory basis assets over liabilities
before deduction of required capital of £149 million (2004: £177 million). These amounts have been determined applying the local
regulations in each of the operations.
At the country level, Prudential’s businesses in Asia are subject to comprehensive and supervisory schemes in the jurisdictions in which
they operate. The Hong Kong business branch of PAC and its capital requirements are subsumed within those of the PAC long-term fund.
For the Group’s other material Asian operations the details of the basis of determining regulatory capital and regulatory capital requirements
are as follows:
Singapore
A new risk-based regulatory framework was introduced at the start of 2005 to replace the previous framework that used a net premium approach.
For participating business, a gross premium reserve, determined using prudent best estimate assumptions and which makes allowance for
future bonus, is held. The amount held is subject to a minimum of the higher of the assets attributed to participating business and a gross
premium reserve calculated on specified assumptions, but without allowance for future bonus, that include prescribed provisions for
adverse deviations (PADs).
For non-participating business, gross premium reserves are held. For linked business the value of units is held together with a non-unit
reserve calculated in accordance with standard actuarial methodology.
From 1 January 2005, capital requirements are determined using a risk-based capital approach.
Taiwan
Basic policy reserves are determined using a net premium method. Both mortality and interest rates are specified. For more recent issues,
the valuation rate of interest has been linked to the prevailing market rate on 10-year government bonds.
Solvency capital is determined using a risk-based capital approach.
Japan
Mathematical reserves for traditional business are determined on a net premium basis using prescribed mortality and interest rates.
Interest rates reflect the original pricing assumptions.
For linked business the value of units is held together with a non-unit reserve calculated in accordance with standard actuarial methodology.
With regard to solvency, the adjusted solvency capital assets of the Company must exceed 200 per cent of the risk related capital
requirement value at risk. It is thus a risk-based capital approach.
Malaysia
Mathematical reserves for traditional business are determined on a modified net premium basis using prescribed mortality and interest
rates (no higher than 4 per cent).
For linked business the value of units is held together with a non-unit reserve calculated in accordance with standard actuarial methodology.
The capital requirement is determined as 4 per cent of reserves plus a specified percentage of sums at risk. There is an overriding minimum
capital requirement of RM100 million.
Notes on the Group financial statements continued

Prudential plc Annual Report 2005 129
D5: Capital position statement for life assurance businesses continued(iv) Group capital requirements
In addition to the requirements at individual company level, FSA requirements under the FCD apply additional prudential requirements for
the Group as a whole. Discussion of the Group’s estimated FCD position at 31 December 2005 is provided in the operating and financial
review section of the Group’s 2005 Annual Report.
(c) Movements in total available capital
Total available capital for the Group’s life assurance operations has changed during 2005 as follows:2005
£m
Available capital at 31 December 2004 9,006
Changes:
WPSF (note i) 2,615
SAIF (note ii) (677)
JNL (note iii) 461
Other 160
2,559
Available capital at 31 December 2005 11,565
Notes(i) WPSFThe increase in available capital arises from:
2005£m
Investment return, net of tax and investment management expenses 1,329Decrease in inadmissible assets 309Decrease in cost of guarantees 547Decrease in cost of bonus smoothing 195Increase in the value of PAL and non-profit business 212Other 23
2,615
(ii) SAIFThe decrease of £677 million, reflects the impact of FSA actuarial guidance note GN 45 as explained in note D2(f).
(iii) JNLThe increase of £461 million reflects an underlying increase of £252 million (applying the 2005 year end exchange rate of 1.72) and £209 million of exchange translation gain.
(d) Transferability of available capital
For PAC and all other UK long-term insurers, long-term business assets and liabilities must, by law, be maintained in funds separate from
those for the assets and liabilities attributable to non-life insurance business or to shareholders. Only the ‘established surplus’ – the excess
of assets over liabilities in the long-term fund determined through a formal valuation – may be transferred so as to be available for other
purposes. Distributions from the with-profit sub-fund to shareholders reflect the shareholders’ one-ninth share of the cost of declared
policyholders’ bonuses.
Accordingly, the excess of assets over liabilities of the PAC long-term fund is retained within that company. The retention of the capital
enables the Company to support with-profits and other business of the fund by, for example, providing the benefits associated with
smoothing and guarantees. It also provides investment flexibility for the fund’s assets, by meeting the regulatory capital requirements that
demonstrate solvency, and by absorbing the costs of significant events or fundamental changes in its long-term business without affecting
the bonus and investment policies.
For other UK long-term business subsidiaries the amounts retained within the companies are at levels which provide an appropriate level
of capital strength in excess of the regulatory minimum.
For JNL, capital retention is maintained at a level consistent with an appropriate rating by Standard & Poor’s. Currently JNL is rated AA.
JNL can pay dividends on its capital stock only out of earned surplus unless prior regulatory approval is obtained. Furthermore, dividends
which exceed the greater of 10 per cent of JNL’s statutory surplus or statutory net gain from operations for the prior year require prior
regulatory approval.
For Asian subsidiaries, the amounts retained within the companies are at levels that provide an appropriate level of capital strength in
excess of the local regulatory minimum. For ring-fenced with-profit funds the excess of assets over liabilities is retained with distribution
tied to the shareholders’ share of bonuses through declaration of actuarially determined surplus. The Group’s Singapore and Malaysian
businesses may remit dividends to the Group, in general, provided the statutory insurance fund meets the capital adequacy standard
required under local statutory regulations.
Available capital of the non-insurance business units is transferable to the life assurance businesses after taking account of an appropriate
level of operating capital, based on local regulatory solvency targets, over and above basis liabilities. The economic capital model described
in section D1 (concentration of risks) takes into account restrictions on mobility of capital across the Group with capital transfers to and
from business units triggered at a solvency level consistent with these targets. The model takes into account restrictions on the availability
to the Group of the estate of the various with-profits funds throughout the Group.

130 Prudential plc Annual Report 2005
D5: Capital position statement for life assurance businesses continued(e) Sensitivity of liabilities and total capital to changed market conditions and capital management policies
Prudential manages its assets, liabilities, and capital locally, in accordance with local regulatory requirements and reflecting the different
types of liabilities Prudential has in each business. As a result of the diversity of products offered by Prudential and the different regulatory
requirements in which it operates, Prudential employs differing methods of asset/liability and capital management, depending on the
business concerned.
Stochastic modelling of assets and liabilities is undertaken in UK, JNL and Asia to assess the economic capital requirements under different
confidence intervals and time horizons. In addition, reserve adequacy testing under a range of scenarios and dynamic solvency testing is
carried out, including under certain scenarios mandated by the UK, US and Asian regulators.
A stochastic approach models the inter-relationship between asset and liability movements, taking into account asset correlation,
management actions and policyholder behaviour, under a large number of alternative economic scenarios. These scenarios are projected
forward over a period of time, typically 25 years or longer, and the liabilities and solvency position of the fund are calculated in each
scenario in each future year. The fund’s policy on management actions, including bonus and investment policy continue to be set in order
that they are consistent with the available capital and the targeted risk of default.
The sensitivity of liabilities and other components of total capital vary depending upon the type of business concerned and this conditions
the approach to asset/liability management.
For example, for businesses that are most sensitive to interest rate changes, such as immediate annuity business, Prudential uses cash
flow analysis to create a portfolio of debt securities whose value changes in line with the value of liabilities when interest rates change.
This type of analysis helps protect profits from changing interest rates. This type of analysis is used in the UK for annuity business and
by JNL for its interest-sensitive and fixed index annuities and stable value products.
For businesses that are most sensitive to equity price changes, Prudential uses stochastic modelling and scenario testing to look at
the future returns on its investments under different scenarios and best reflect the large diversity in returns that equities can produce.
This allows Prudential to devise an investment and with-profits policyholder bonus strategy that, on the model assumptions, allows it
to optimise returns to its policyholders and shareholders over time while maintaining appropriate financial strength. Prudential uses this
methodology extensively in connection with its UK with-profits business.
Bonuses declared in respect of the Group’s with-profits business are included in the change in long-term business provisions or, where
the policy is no longer in force, in claims incurred.
(f) Intra-group arrangements in respect of SAIF
Should the assets of SAIF be inadequate to meet the guaranteed benefit obligations to the policyholders of SAIF, the PAC long-term fund
would be liable to cover any such deficiency.
Due to the quality and diversity of the assets in SAIF and the ability of SAIF to revise guaranteed benefits in the event of an asset shortfall,
the directors believe that the probability of either the PAC long-term fund, or the Group’s shareholders’ funds under its obligation to
maintenance of the capital position of long-term funds generally, having to contribute to SAIF is remote.
E: Banking operationsThe Group undertakes banking operations through one of its principal subsidiaries, Egg. Financial information in respect to Egg has been
included in this note. The results from Jackson Federal Bank, another Group banking subsidiary that was sold in October 2004, have also
been included in discontinued operations in the income statement below up to the date of disposal.
The Group has presented the income statement and balance sheet for banking operations in a format that demonstrates the characteristics
and principal operations specific to a bank. The format is different to that of the Group consolidated income statement and balance sheet;
however, total profit (loss) for the year and net assets remain the same. To understand how the amounts presented from banking operations
are consolidated in the Group financial statements, refer to the primary segmental information for the income statement in note F1 and the
primary segmental information for the balance sheet in note B5.
Notes on the Group financial statements continued

Prudential plc Annual Report 2005 131
E1: Income statement for banking operationsProfit (loss) included in the Group consolidated income statement in respect to banking operations is as follows:
2005 2004Note £m £m
Interest income 893 902
Interest expense (581) (615)
Net interest income 312 287
Fee and commission income 223 221
Fee and commission expense (23) (25)
Other operating income 16 15
Operating income 528 498
General administrative expenses (216) (232)
Impairment losses on loans and cash advances to customers E5 (241) (183)
Other operating expenses (27) (22)
Profit attributable to shareholders 44 61
Tax attributable to shareholders’ profits 1 (25)
Profit from continuing operations after tax 45 36
Discontinued operations (net of tax) F6 3 (98)
Profit (loss) for the year 48 (62)
Of the profit (loss) for the year in 2005 and 2004, a profit of £9 million and a loss of £20 million, respectively, are attributable to minority
interests in Egg.
Discontinued operations above relate to Egg France, Funds Direct and Jackson Federal Bank (in 2004) and have been treated as discontinued
operations in the Group’s consolidated income statement. For further information on discontinued operations, see note F6.
E2: Balance sheet for banking operationsAssets, liabilities and shareholders’ funds included in the Group consolidated balance sheet with respect to banking operations are
as follows:2005 2004
£m £m
Assets
Cash and balances with central banks 7 14
Loans and advances to banks 718 616
Securities purchased under agreement to resell 200 319
Loans and advances to customers 7,430 7,642
Investment securities 2,117 3,120
Other assets 280 337
Total assets 10,752 12,048
Liabilities
Deposits by banks 2,452 2,352
Securities sold under agreement to repurchase – 131
Customer accounts 5,830 6,607
Debt securities issued 1,404 1,807
Other liabilities 236 360
Subordinated liabilities 452 451
Total liabilities 10,374 11,708
Equity
Shareholders’ equity 303 273
Minority interests 75 67
Total equity 378 340
Total equity and liabilities 10,752 12,048
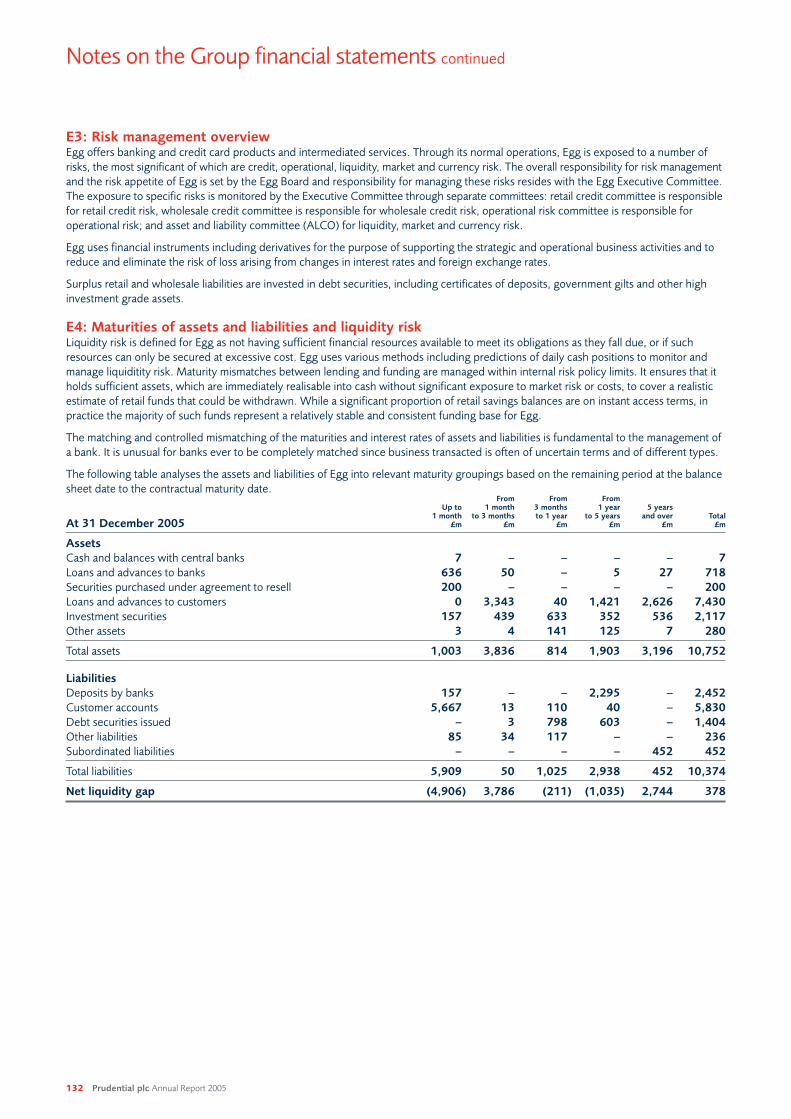
132 Prudential plc Annual Report 2005
E3: Risk management overviewEgg offers banking and credit card products and intermediated services. Through its normal operations, Egg is exposed to a number of
risks, the most significant of which are credit, operational, liquidity, market and currency risk. The overall responsibility for risk management
and the risk appetite of Egg is set by the Egg Board and responsibility for managing these risks resides with the Egg Executive Committee.
The exposure to specific risks is monitored by the Executive Committee through separate committees: retail credit committee is responsible
for retail credit risk, wholesale credit committee is responsible for wholesale credit risk, operational risk committee is responsible for
operational risk; and asset and liability committee (ALCO) for liquidity, market and currency risk.
Egg uses financial instruments including derivatives for the purpose of supporting the strategic and operational business activities and to
reduce and eliminate the risk of loss arising from changes in interest rates and foreign exchange rates.
Surplus retail and wholesale liabilities are invested in debt securities, including certificates of deposits, government gilts and other high
investment grade assets.
E4: Maturities of assets and liabilities and liquidity riskLiquidity risk is defined for Egg as not having sufficient financial resources available to meet its obligations as they fall due, or if such
resources can only be secured at excessive cost. Egg uses various methods including predictions of daily cash positions to monitor and
manage liquiditity risk. Maturity mismatches between lending and funding are managed within internal risk policy limits. It ensures that it
holds sufficient assets, which are immediately realisable into cash without significant exposure to market risk or costs, to cover a realistic
estimate of retail funds that could be withdrawn. While a significant proportion of retail savings balances are on instant access terms, in
practice the majority of such funds represent a relatively stable and consistent funding base for Egg.
The matching and controlled mismatching of the maturities and interest rates of assets and liabilities is fundamental to the management of
a bank. It is unusual for banks ever to be completely matched since business transacted is often of uncertain terms and of different types.
The following table analyses the assets and liabilities of Egg into relevant maturity groupings based on the remaining period at the balance
sheet date to the contractual maturity date.From From From
Up to 1 month 3 months 1 year 5 years1 month to 3 months to 1 year to 5 years and over Total
At 31 December 2005 £m £m £m £m £m £m
Assets
Cash and balances with central banks 7 – – – – 7
Loans and advances to banks 636 50 – 5 27 718
Securities purchased under agreement to resell 200 – – – – 200
Loans and advances to customers 0 3,343 40 1,421 2,626 7,430
Investment securities 157 439 633 352 536 2,117
Other assets 3 4 141 125 7 280
Total assets 1,003 3,836 814 1,903 3,196 10,752
Liabilities
Deposits by banks 157 – – 2,295 – 2,452
Customer accounts 5,667 13 110 40 – 5,830
Debt securities issued – 3 798 603 – 1,404
Other liabilities 85 34 117 – – 236
Subordinated liabilities – – – – 452 452
Total liabilities 5,909 50 1,025 2,938 452 10,374
Net liquidity gap (4,906) 3,786 (211) (1,035) 2,744 378
Notes on the Group financial statements continued
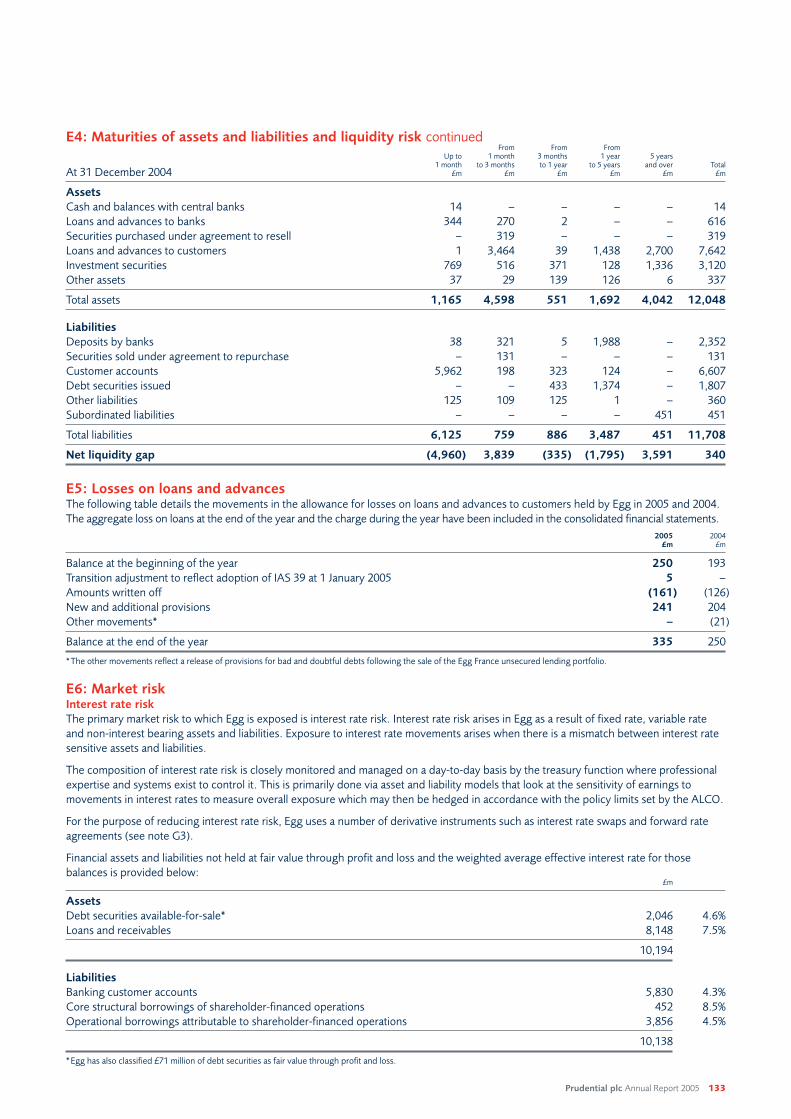
Prudential plc Annual Report 2005 133
E4: Maturities of assets and liabilities and liquidity risk continuedFrom From From
Up to 1 month 3 months 1 year 5 years1 month to 3 months to 1 year to 5 years and over Total
At 31 December 2004 £m £m £m £m £m £m
Assets
Cash and balances with central banks 14 – – – – 14
Loans and advances to banks 344 270 2 – – 616
Securities purchased under agreement to resell – 319 – – – 319
Loans and advances to customers 1 3,464 39 1,438 2,700 7,642
Investment securities 769 516 371 128 1,336 3,120
Other assets 37 29 139 126 6 337
Total assets 1,165 4,598 551 1,692 4,042 12,048
Liabilities
Deposits by banks 38 321 5 1,988 – 2,352
Securities sold under agreement to repurchase – 131 – – – 131
Customer accounts 5,962 198 323 124 – 6,607
Debt securities issued – – 433 1,374 – 1,807
Other liabilities 125 109 125 1 – 360
Subordinated liabilities – – – – 451 451
Total liabilities 6,125 759 886 3,487 451 11,708
Net liquidity gap (4,960) 3,839 (335) (1,795) 3,591 340
E5: Losses on loans and advancesThe following table details the movements in the allowance for losses on loans and advances to customers held by Egg in 2005 and 2004.
The aggregate loss on loans at the end of the year and the charge during the year have been included in the consolidated financial statements.
2005 2004£m £m
Balance at the beginning of the year 250 193
Transition adjustment to reflect adoption of IAS 39 at 1 January 2005 5 –
Amounts written off (161) (126)
New and additional provisions 241 204
Other movements* – (21)
Balance at the end of the year 335 250
*The other movements reflect a release of provisions for bad and doubtful debts following the sale of the Egg France unsecured lending portfolio.
E6: Market riskInterest rate risk
The primary market risk to which Egg is exposed is interest rate risk. Interest rate risk arises in Egg as a result of fixed rate, variable rate
and non-interest bearing assets and liabilities. Exposure to interest rate movements arises when there is a mismatch between interest rate
sensitive assets and liabilities.
The composition of interest rate risk is closely monitored and managed on a day-to-day basis by the treasury function where professional
expertise and systems exist to control it. This is primarily done via asset and liability models that look at the sensitivity of earnings to
movements in interest rates to measure overall exposure which may then be hedged in accordance with the policy limits set by the ALCO.
For the purpose of reducing interest rate risk, Egg uses a number of derivative instruments such as interest rate swaps and forward rate
agreements (see note G3).
Financial assets and liabilities not held at fair value through profit and loss and the weighted average effective interest rate for those
balances is provided below:£m
Assets
Debt securities available-for-sale* 2,046 4.6%
Loans and receivables 8,148 7.5%
10,194
Liabilities
Banking customer accounts 5,830 4.3%
Core structural borrowings of shareholder-financed operations 452 8.5%
Operational borrowings attributable to shareholder-financed operations 3,856 4.5%
10,138
*Egg has also classified £71 million of debt securities as fair value through profit and loss.

134 Prudential plc Annual Report 2005
E6: Market risk continuedSee note G2 for further information on interest rate risk.
Currency risk
The risks arising from assets and liabilities denominated in foreign currencies are managed by a separate treasury function within Egg and
within agreed limits set by the ALCO. During the year, cash flows generated by the foreign currency assets and liabilities are hedged by
using derivative contracts to manage exposure to exchange rate fluctuations.
At 31 December 2005, Egg held £539 million of assets and £2,640 million of liabilities with foreign currency exposure.
E7: Credit riskEgg takes on exposure to credit risk, which is the risk that a counterparty will be unable to pay amounts in full when due. To limit this risk,
Egg places limits on the amount of risk accepted in relation to a particular borrower, groups of borrowers, and to particular geographical
segments. The acceptable risk levels are monitored regularly, and reviewed where appropriate. From Egg’s perspective, the most
important step in managing credit risk is the initial decision whether or not to extend credit. Egg’s retail and wholesale credit committees
define the policies, procedures and sets limits for accepting credit risk.
The following table identifies the geographical concentrations of credit risk, stated in terms of total assets and off balance sheet items,
held by Egg at 31 December 2005 and 2004:2005 2004
£m £m
UK 18,840 18,049
Rest of Europe 399 1,486
North America 26 450
Other 354 445
Total* 19,619 20,430
*This includes £9,104 million (2004: £8,700 million) of off-balance sheet items, which mainly relate to unutilised credit limits on credit cards.
Egg has 3.1 million customers that are defined as ‘marketable’ based on their activity levels, with the majority of these acquired into its
credit card product. These customers are typically aged between 25 and 45, are ABC1 in terms of their social demographics (according
to the definition set by the Central Statistical Office of the UK based on occupation) and earn above average salaries. Full use is made of
software technology and external bureaus in credit scoring both new and top-up lending applications. The counterparty credit quality is
monitored through the analysis of qualitative and quantitative information. There are limits for exposure to individual countries, sectors
and corporate and financial institutions.
The following is a breakdown of the credit risk borne by Egg for financial assets and off-balance sheet items at 31 December 2005:
£m
Loans and advances to banks 718
Securities purchased under agreement to resell 200
Investment securities 2,117
Loans and advances to customers 7,765
Allowances for impairment losses on loans and advances to customers (335)
Fair value of derivative assets 50
Off-balance sheet items (including unutilised credit limits on credit cards) 9,104
Total credit risk net of allowances and provisions 19,619
Egg has certain credit-related commitments in the form of unused credit limits on credit cards and pre-approved but unused borrowing
limits on mortgages and personal loans. At 31 December 2005, these unused limits, included in off-balance sheet items above, amounted
to £9,061 million, £14 million and £29 million respectively. Egg is potentially exposed to a loss totalling these amounts, but it is unlikely that
such a loss would arise as these credit facilities were granted only on the basis of the customers having achieved certain credit standards.
Additionally, it is unlikely that, should all these customers utilise their credit or borrowing limits, that all of them would default on their
debt entirely.
Egg holds significant concentrations of credit risk with other financial institutions. At 31 December 2005, this was estimated at £10.9 billion
of which £5.7 billion related to derivative financial instruments and £2.3 billion to credit default swaps. Egg also has significant credit
exposure in asset-backed security products which totalled approximately £496 million at 31 December 2005. With regard to loans and
advances to customers, Egg has significant concentrations of credit risk in respect of its unsecured lending on credit cards, personal loans
and mortgage lending secured on property in the UK.
Assets pledged as collateral and securitisation
Egg enters into securities lending arrangements, including repurchase agreements, and over-the-counter derivative transactions as part of
normal operating activities. Assets are pledged as collateral to support these activities. Collateral in respect to repurchase agreements was
£30.9 million and £nil at 31 December 2005 and 2004, respectively. Collateral in respect to over-the-counter derivative transactions was
£5.2 million and £2.3 million at 31 December 2005 and 2004, respectively. See note G4 where amounts related to Egg have been included
in the disclosure of these transactions on a Group basis.
For further information on Egg’s securitisation of credit card receivables, see note G4.
Notes on the Group financial statements continued
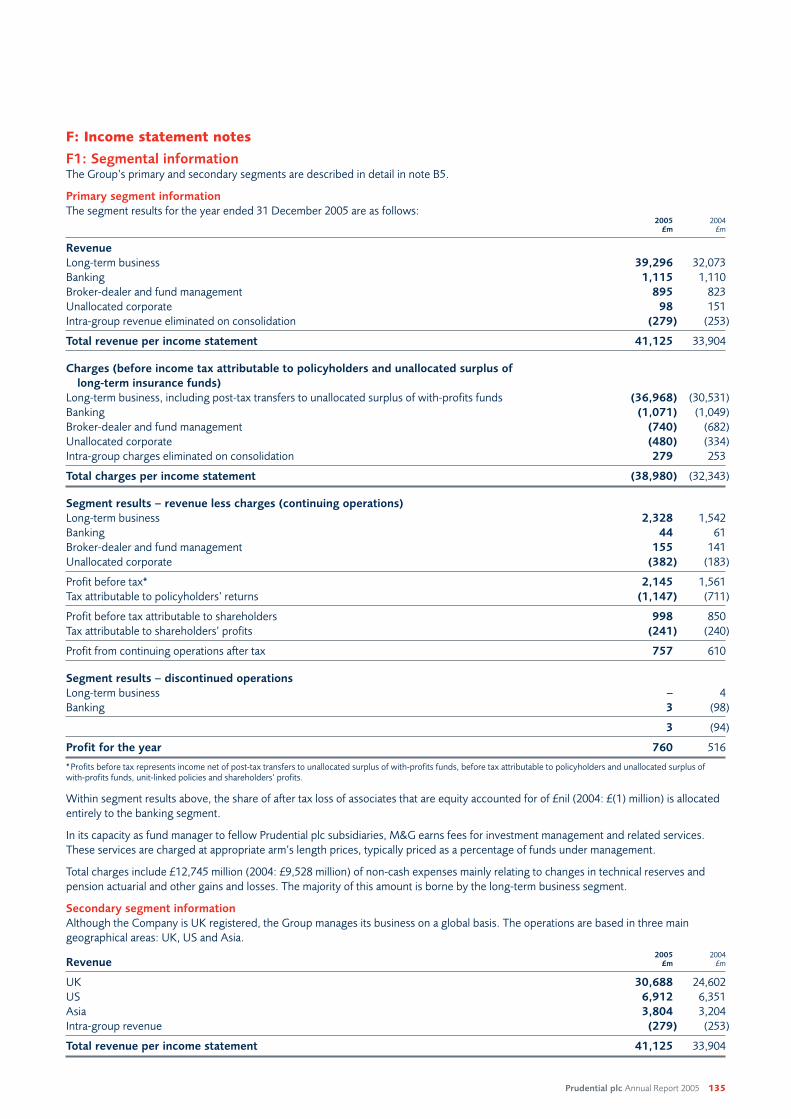
Prudential plc Annual Report 2005 135
F: Income statement notes
F1: Segmental informationThe Group’s primary and secondary segments are described in detail in note B5.
Primary segment information
The segment results for the year ended 31 December 2005 are as follows:2005 2004
£m £m
Revenue
Long-term business 39,296 32,073
Banking 1,115 1,110
Broker-dealer and fund management 895 823
Unallocated corporate 98 151
Intra-group revenue eliminated on consolidation (279) (253)
Total revenue per income statement 41,125 33,904
Charges (before income tax attributable to policyholders and unallocated surplus of
long-term insurance funds)
Long-term business, including post-tax transfers to unallocated surplus of with-profits funds (36,968) (30,531)
Banking (1,071) (1,049)
Broker-dealer and fund management (740) (682)
Unallocated corporate (480) (334)
Intra-group charges eliminated on consolidation 279 253
Total charges per income statement (38,980) (32,343)
Segment results – revenue less charges (continuing operations)
Long-term business 2,328 1,542
Banking 44 61
Broker-dealer and fund management 155 141
Unallocated corporate (382) (183)
Profit before tax* 2,145 1,561
Tax attributable to policyholders’ returns (1,147) (711)
Profit before tax attributable to shareholders 998 850
Tax attributable to shareholders’ profits (241) (240)
Profit from continuing operations after tax 757 610
Segment results – discontinued operations
Long-term business – 4
Banking 3 (98)
3 (94)
Profit for the year 760 516
*Profits before tax represents income net of post-tax transfers to unallocated surplus of with-profits funds, before tax attributable to policyholders and unallocated surplus ofwith-profits funds, unit-linked policies and shareholders’ profits.
Within segment results above, the share of after tax loss of associates that are equity accounted for of £nil (2004: £(1) million) is allocated
entirely to the banking segment.
In its capacity as fund manager to fellow Prudential plc subsidiaries, M&G earns fees for investment management and related services.
These services are charged at appropriate arm’s length prices, typically priced as a percentage of funds under management.
Total charges include £12,745 million (2004: £9,528 million) of non-cash expenses mainly relating to changes in technical reserves and
pension actuarial and other gains and losses. The majority of this amount is borne by the long-term business segment.
Secondary segment information
Although the Company is UK registered, the Group manages its business on a global basis. The operations are based in three main
geographical areas: UK, US and Asia.
2005 2004Revenue £m £m
UK 30,688 24,602
US 6,912 6,351
Asia 3,804 3,204
Intra-group revenue (279) (253)
Total revenue per income statement 41,125 33,904

136 Prudential plc Annual Report 2005
F2: Revenue2005 2004
£m £m
Long-term business premiums (note i) 15,161
Insurance contract premiums 13,583
Investment contracts with discretionary participation feature premiums 1,366
Inwards reinsurance premiums 276 1,247
Less: reinsurance premiums ceded (197) (256)
Earned premiums, net of reinsurance 15,028 16,152
Realised and unrealised gains and losses on investments (2004) 7,333
Realised and unrealised gains and losses on securities at fair value through profit and loss 14,640
Realised losses on available-for-sale securities, previously recognised directly in equity (22)
Interest (note ii) 5,896 5,705
Dividends 2,731 1,883
Other investment income 768 829
Investment income 24,013 15,750
Fee income from investment contract business, fund management, banking and broker-dealer services (note i) 926 653
Income from consolidated venture investments of the PAC with-profits funds 1,158 1,349
Other income 2,084 2,002
Total revenue 41,125 33,904
Notes(i) As a result of the adoption of IFRS 4 on 1 January 2005, premiums received in respect of investment contracts without discretionary participation features are not recognised as income; instead these amounts are accounted for directly in the balance sheet as deposit liabilities. Only fee income associated with such contracts is accounted for in theincome statement in 2005. In 2004, deposits and related fees on these contracts were included within long-term business premiums. In 2004, the long-term business premiumsalso include premiums from insurance contracts and investment contracts with discretionary participation features.
(ii) Interest income is calculated on the effective interest rate method for all financial assets that are not at fair value through profit and loss.
F3: Acquisition costs and other operating expenditure2005 2004
£m £m
Acquisition costs (note i) 1,413 1,419
Staff and pension costs (see note I1) 991 1,186
Administrative and operating costs 3,148 2,958
Total acquisition costs and other operating expenditure 5,552 5,563
Notes(i) Acquisition costs in 2005 comprise amounts related to insurance contracts of £1,307 million, and investment and investment management contacts of £106 million. These costsinclude amortisation of £392 million and £9 million, respectively.
(ii) Total depreciation and amortisation expense amounted to £541 million (2004: £540 million). Of this amount, £401 million (2004: £386 million) relates to amortisation of deferredacquisition costs of insurance contracts and investment management contracts, which primarily is borne by the long-term business segment. Of the remainder of the depreciationand amortisation charge of £140 million (2004: £154 million), £101 million (2004: £107 million) related to long-term business, £28 million (2004: £29 million) to banking, £8 million(2004: £15 million) to fund management and £3 million (2004: £3 million) to central companies.
F4: Finance costs: interest on core structural borrowings of shareholder-financed operationsFinance costs consist of interest on core debt of the parent company and related finance subsidiaries and JNL surplus notes of £175 million
(2004: £154 million) and of £33 million (2004: £33 million) on Egg subordinated debt.
Notes on the Group financial statements continued

Prudential plc Annual Report 2005 137
F5: Tax(a) Total tax expense by nature of expense
An analysis of the total tax expense of continuing operations recognised in the income statement by nature of expense (benefit) is as follows:
2005 2004£m £m
Current tax expense:
Corporation tax 722 537
Adjustments in respect of prior years (209) 38
Benefit from a previously unrecognised tax loss, tax credit or temporary difference from a prior period (2) 0
Total current tax 511 575
Deferred tax arising from:
Origination and reversal of temporary differences 870 374
Benefit from a previously unrecognised tax loss, tax credit or temporary difference from a prior period 5 2
Write-down or reversal of a previous write-down of a deferred tax asset 2 0
Total deferred tax 877 376
Total tax expense 1,388 951
The total tax expense arises as follows:2005 2004
£m £m
Current tax expense:
UK 339 523
Foreign 172 52
511 575
Deferred tax expense:
UK 780 282
Foreign 97 94
877 376
Total 1,388 951
The deferred tax expense arises as follows:2005 2004
£m £m
Unrealised gains and losses on investments 599 286
Short-term timing differences 263 (79)
Capital allowances 13 13
Balances relating to investment and insurance contracts 3 156
Unused tax losses (1) 0
Deferred tax expense 877 376
In 2005, a deferred tax credit of £93 million has been taken directly to reserves. When this amount is taken with the deferred tax expense
shown above, the result is an increase of £784 million in the Group’s net deferred tax liability.
In 2005, there is no tax relating to discontinued operations (2004: £14 million credit) (see note F6).
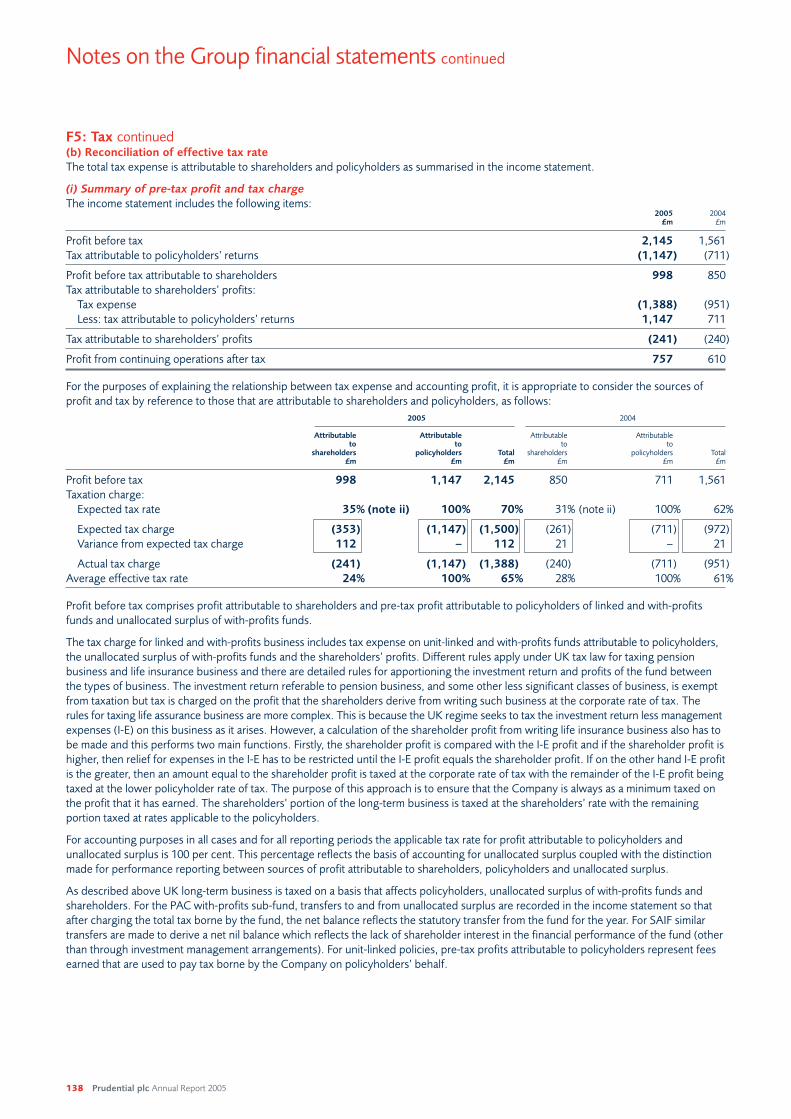
138 Prudential plc Annual Report 2005
F5: Tax continued(b) Reconciliation of effective tax rate
The total tax expense is attributable to shareholders and policyholders as summarised in the income statement.
(i) Summary of pre-tax profit and tax charge
The income statement includes the following items:2005 2004
£m £m
Profit before tax 2,145 1,561
Tax attributable to policyholders’ returns (1,147) (711)
Profit before tax attributable to shareholders 998 850
Tax attributable to shareholders’ profits:
Tax expense (1,388) (951)
Less: tax attributable to policyholders’ returns 1,147 711
Tax attributable to shareholders’ profits (241) (240)
Profit from continuing operations after tax 757 610
For the purposes of explaining the relationship between tax expense and accounting profit, it is appropriate to consider the sources of
profit and tax by reference to those that are attributable to shareholders and policyholders, as follows:
2005 2004
Attributable Attributable Attributable Attributableto to to to
shareholders policyholders Total shareholders policyholders Total£m £m £m £m £m £m
Profit before tax 998 1,147 2,145 850 711 1,561
Taxation charge:
Expected tax rate 35% (note ii) 100% 70% 31% (note ii) 100% 62%
Expected tax charge (353) (1,147) (1,500) (261) (711) (972)
Variance from expected tax charge 112 – 112 21 – 21
Actual tax charge (241) (1,147) (1,388) (240) (711) (951)
Average effective tax rate 24% 100% 65% 28% 100% 61%
Profit before tax comprises profit attributable to shareholders and pre-tax profit attributable to policyholders of linked and with-profits
funds and unallocated surplus of with-profits funds.
The tax charge for linked and with-profits business includes tax expense on unit-linked and with-profits funds attributable to policyholders,
the unallocated surplus of with-profits funds and the shareholders’ profits. Different rules apply under UK tax law for taxing pension
business and life insurance business and there are detailed rules for apportioning the investment return and profits of the fund between
the types of business. The investment return referable to pension business, and some other less significant classes of business, is exempt
from taxation but tax is charged on the profit that the shareholders derive from writing such business at the corporate rate of tax. The
rules for taxing life assurance business are more complex. This is because the UK regime seeks to tax the investment return less management
expenses (I-E) on this business as it arises. However, a calculation of the shareholder profit from writing life insurance business also has to
be made and this performs two main functions. Firstly, the shareholder profit is compared with the I-E profit and if the shareholder profit is
higher, then relief for expenses in the I-E has to be restricted until the I-E profit equals the shareholder profit. If on the other hand I-E profit
is the greater, then an amount equal to the shareholder profit is taxed at the corporate rate of tax with the remainder of the I-E profit being
taxed at the lower policyholder rate of tax. The purpose of this approach is to ensure that the Company is always as a minimum taxed on
the profit that it has earned. The shareholders’ portion of the long-term business is taxed at the shareholders’ rate with the remaining
portion taxed at rates applicable to the policyholders.
For accounting purposes in all cases and for all reporting periods the applicable tax rate for profit attributable to policyholders and
unallocated surplus is 100 per cent. This percentage reflects the basis of accounting for unallocated surplus coupled with the distinction
made for performance reporting between sources of profit attributable to shareholders, policyholders and unallocated surplus.
As described above UK long-term business is taxed on a basis that affects policyholders, unallocated surplus of with-profits funds and
shareholders. For the PAC with-profits sub-fund, transfers to and from unallocated surplus are recorded in the income statement so that
after charging the total tax borne by the fund, the net balance reflects the statutory transfer from the fund for the year. For SAIF similar
transfers are made to derive a net nil balance which reflects the lack of shareholder interest in the financial performance of the fund (other
than through investment management arrangements). For unit-linked policies, pre-tax profits attributable to policyholders represent fees
earned that are used to pay tax borne by the Company on policyholders’ behalf.
Notes on the Group financial statements continued

Prudential plc Annual Report 2005 139
F5: Tax continued(ii) Reconciliation of tax charge on profits attributable to shareholders
AsianUK long-term
insurance business Otheroperations JNL operations operations Total
2005 £m £m £m £m £m
Profit before tax attributable to shareholders:
Operating profit based on longer-term investment returns 400 348 175 34 957
Goodwill impairment charge – – – (120) (120)
Short-term fluctuations in investment returns 36 178 32 (35) 211
Shareholders’ share of actuarial and other gains and losses on defined
benefit pension schemes (20) – 3 (33) (50)
Total 416 526 210 (154) 998
Expected tax rate (note i):
Operating profit based on longer-term investment returns 30% 35% 26% 30% 31%
Goodwill impairment charge – – – 0% 0%
Short-term fluctuations in investment returns 30% 35% 26% 30% 34%
Shareholders’ share of actuarial and other gains and losses on defined
benefit pension schemes 30% – 0% 30% 32%
Total 30% 35% 26% 6% 35%
Expected tax charge based on expected tax rates:
Operating profit based on longer-term investment returns (120) (122) (46) (10) (298)
Goodwill impairment charge – – – 0 0
Short-term fluctuations in investment returns (11) (62) (8) 10 (71)
Shareholders’ share of actuarial and other gains and losses on defined
benefit pension schemes 6 – 0 10 16
Total (125) (184) (54) 10 (353)
Variance from expected tax charge (note ii):
Operating profit based on longer-term investment returns 3 (1) (17) 127 112
Goodwill impairment charge – – – 0 0
Short-term fluctuations in investment returns (5) 9 9 (12) 1
Shareholders’ share of actuarial and other gains and losses on defined
benefit pension schemes (1) – 0 0 (1)
Total (3) 8 (8) 115 112
Actual tax charge:
Operating profit based on longer-term investment returns (117) (123) (63) 117 (186)
Goodwill impairment charge – – – 0 0
Short-term fluctuations in investment returns (16) (53) 1 (2) (70)
Shareholders’ share of actuarial and other gains and losses on defined
benefit pension schemes 5 – 0 10 15
Total (128) (176) (62) 125 (241)
Actual tax rate 31% 33% 30% (81)% 24%
For 2004, the Group’s results reflect the application of IFRS standards with the exception of the standards IAS 32, IAS 39 and IFRS 4.
Also the supplementary basis of profit analysis adopted by the Group, as shown in note B1, is not comparable between 2004 and 2005.
Supplementary information included within the Group’s Annual Report shows an analysis of 2004 profit on the pro forma basis as if IAS 32,
IAS 39 and IFRS 4 had been applied to the Group’s long-term business operations. The reconciliation of the effective tax rate for 2004
relates to the statutory IFRS basis results.

140 Prudential plc Annual Report 2005
F5: Tax continuedAsian
UK long-terminsurance business Other
operations JNL operations operations Total2004 £m £m £m £m £m
Profit before tax attributable to shareholders 325 357 154 14 850
Expected tax rate (note i) 30% 35% 23% 21% 31%
Expected tax charge based on expected tax rates (98) (125) (35) (3) (261)
Variance from expected tax charge (note ii) 7 3 (3) 14 21
Actual tax charge (91) (122) (38) 11 (240)
Actual tax rate 28% 34% 25% (79)% 28%
Notes(i) Expected tax rates for profit attributable to shareholdersExpected tax rates shown in the table above reflect the corporate tax rates generally applied to taxable profits of the relevant country jurisdictions. For Asian operations theexpected tax rates reflect the corporate tax rate weighted by reference to the source of profits of the operations contributing to the aggregate business unit result. The increase in total expected rate from 31 per cent in 2004 to 35 per cent in 2005 is due to the goodwill impairment charge of £120 million in 2005 not being allowable for tax.
(ii) Variances from expected tax charge for results attributable to shareholdersThe principal variances arise from differences between the standard corporation tax rate and actual rates for ‘other’ operations. This is due to a number of factors including:(a) The settlement of outstanding issues with HM Revenue and Customs at amounts below those previously provided.(b) The tax credit arising from relief for excess expenses in respect of the shareholder-backed protection business.(c) Prior year adjustments arising from routine revisions of tax returns.(d) The benefit from Egg’s previously unused French losses.
F6: Discontinued operationsThe £3 million post-tax profit from discontinued operations (2004: £94 million post-tax loss) is comprised of the sum of the gain on disposal
of operations and profit or loss generated by discontinued operations.2005 2004
£m £m
Gain on sale of operations
Pre-tax gain recognised on the sale of operations 0 45
Taxation 0 (19)
Post-tax gain recognised on the sale of operations 0 26
Profit (loss) generated by discontinued operations
Revenue 1 50
Expenses 2 (203)
Pre-tax profit (loss) on results of discontinued operations 3 (153)
Taxation 0 33
Post-tax profit (loss) on results of discontinued operations 3 (120)
Post-tax profit (loss) from discontinued operations 3 (94)
In October 2004, JNL sold Jackson Federal Bank for £166 million. After taking into account net assets and goodwill totalling £128 million at
the date of disposal, the profit on sale was £38 million before tax. Jackson Federal Bank, made an operating profit up to the date of disposal
of £17 million.
In August 2004, the Group sold its interest in Life Assurance Holding Corporation Limited for £41 million. After taking into account the
carrying value of the investment of £34 million at the date of disposal, the profit on sale was £7 million before tax.
In July 2004, Egg announced that it intended to take the necessary steps to withdraw from the French market. Egg France was sold in
2004. The loss before tax of Egg France in 2004 was £150 million which was made up of a provision for exit costs of £113 million and
other operating losses of £37 million.
During the year ended 31 December 2005, the exit process from France by Egg was completed. The final costs incurred were lower than
the provision made in July 2004, therefore, £4 million of the provision was released in the year.
In addition, during 2005, Egg sold Funds Direct, its investment wrap platform business. The sale was completed in October 2005. Funds
Direct incurred losses before tax of £1 million (2004: £20 million) including exit costs in the year.
Jackson Federal Bank, Egg France and Funds Direct are included within banking operations in the segment analysis whilst Life Assurance
Holding Corporation Limited is included within long-term business of UK insurance operations.
Notes on the Group financial statements continued

Prudential plc Annual Report 2005 141
G: Financial assets and liabilities
G1: Financial instruments – designation and fair valuesThe Group formally adopted IAS 39 on 1 January 2005. On application of IAS 39, all financial assets are designated as either fair value
through profit and loss, available-for-sale, or as loans and receivables and financial liabilities are designated as either fair value through
profit and loss or amortised cost or for investment contracts with discretionary participation features accounted for under IFRS 4 as
described in note A4.Fair value Total
through profit Available- Loans and carryingand loss for-sale receivables value Fair value
2005 £m £m £m £m £m
Financial assets
Deposits – – 7,627 7,627 7,627
Equity securities and portfolio holdings in unit trusts 71,985 – – 71,985 71,985
Debt securities (note iii) 56,814 25,657 – 82,471 82,471
Loans and receivables – – 13,245 13,245 14,268
Other investments (note i) 3,879 – – 3,879 3,879
Accrued investment income – – 1,791 1,791 1,791
Other debtors – – 1,318 1,318 1,318
132,678 25,657 23,981 182,316
Fair valuethrough profit Amortised Carrying
and loss cost IFRS 4 value Fair value2005 £m £m £m £m £m
Financial liabilities
Banking customer accounts – 5,830 – 5,830 5,830
Core structural borrowings of shareholder-financed operations
(note iii and note H13) – 3,191 – 3,191 3,550
Operational borrowings attributable to shareholder-financed operations
(note H13) – 6,432 – 6,432 6,432
Borrowings attributable to with-profits funds (note H13) 559 1,339 – 1,898 1,929
Obligations under funding, stock lending and sale and repurchase agreements – 4,529 – 4,529 4,524
Net asset value attributable to unit holders of consolidated unit trust and
similar funds 965 – – 965 965
Investment contracts with discretionary participation features (note ii) – – 26,523 26,523 –
Investment contracts without discretionary participation features 10,524 1,502 – 12,026 12,035
Accruals and deferred income – 506 – 506 506
Other creditors – 1,478 – 1,478 1,478
Other liabilities (including derivatives) 851 918 – 1,769 1,769
12,899 25,725 26,523 65,147
Notes(i) See note G3 for details of the derivative assets included. The balance also contains the PAC with-profit fund’s participation in various investment funds and limited liabilityproperty partnerships.
(ii) It is impractical to determine the fair value of investment contracts with discretionary participation features due to the lack of a reliable basis to measure such features.
(iii) As at 31 December 2005, £450 million of convertible bonds were included in debt securities and £311 million were included in borrowings.
Determination of fair value
The fair values of quoted investments are based on current bid prices, where appropriate. If the market for a financial asset is not active,
the Group establishes fair value by using quotations from independent third parties such as brokers or by using valuation techniques. The
valuation techniques include the use of recent arm’s length transactions, reference to other instruments that are substantially the same,
discounted cash flow analysis and option pricing models.
The fair value estimates are made at a specific point in time, based upon available market information and judgements about the financial
instruments, including estimates of the timing and amount of expected future cash flows and the credit standing of counterparties. Such
estimates do not reflect any premium or discount that could result from offering for sale at one time the Group’s entire holdings of a
particular financial instrument, nor do they consider the tax impact of the realisation of unrealised gains or losses. In some cases the fair
value estimates cannot be substantiated by comparison to independent markets, nor can the disclosed value be realised in immediate
settlement of the financial instrument.
The loans and receivables have been shown net of provisions for impairment. The fair value of loans has been estimated from discounted
cash flows expected to be received. The rate of discount used was the market rate of interest.
The estimated fair value of derivative financial instruments reflects the estimated amount the Group would receive or pay in an arm’s
length transaction. This amount is mainly determined using quotations from independent third parties.

142 Prudential plc Annual Report 2005
G1: Financial instruments – designation and fair values continuedThe fair value of borrowings is based on quoted market prices, where available.
Refer to section A4 for the determination of fair value for investment contracts without fixed and guaranteed terms (notably UK unit-linked
policies). For investment contracts in the US with fixed and guaranteed terms the fair value is determined based on the present value of
future cash flows discounted at current interest rates.
The fair value of other financial liabilities is determined using discounted cash flows of the amounts expected to be paid.
Use of valuation techniques
Valuation techniques – UK
At 31 December 2005, UK insurance operations held investments with a fair value of £3,729 million (of which £3,466 million were held
in the PAC with-profits fund) which were measured in full or in part using valuation techniques. The majority of these assets are private
debt securities such as private placements, project finance, asset securitisations and local authority securities. The securities are mainly
long-dated and not regularly traded and are valued internally using market standard practices. These practices mainly use matrix pricing,
which is based on assessing credit quality of the underlying borrower to derive a suitable discount rate relative to government securities.
In accordance with the Group’s risk management framework, all internally generated calculations are subject to independent assessment
by the M&G Fair Value Committee which comprises members who are independent of the fund managers involved in the day-to-day
trading in these assets.
Changing any one of the underlying assumptions used in determining the fair value would not have a significant impact on the value of
the assets.
The total amount of the change in fair value estimated using valuation techniques, including valuation techniques based on assumptions
not wholly supported by observable market prices or rates, recognised in the profit and loss account in 2005 was £93 million.
Valuation techniques – US
The US operations of Prudential had two groups of assets which were valued using valuation techniques – derivatives and securities held
by the Piedmont trust entity, an 80 per cent JNL held static trust formed as a result of a securitisation of asset-backed securities in 2003.
As at 31 December 2005, the fair value of the Piedmont and derivative assets valued using valuation techniques were £700 million and
£518 million, respectively.
The majority of the factors entering into the valuation of the derivatives are readily observable in the market and, therefore, are not
subject to interpretation in the model. The most significant non-observable factor is the level of implied volatility assumed in the valuation.
However, changing the implied volatility would not have had a significant impact on the fair value of the assets.
Significant estimates and judgement are also employed in valuing certain asset-backed and mortgage-backed securities held by the Piedmont
trust entity. These valuations may impact reported shareholder profit and loss amounts through the determination of impairment and
recovery amounts. While management believes that the estimates and assumptions employed in developing the fair value estimates are
reasonable and present management’s best estimate of such values, a reasonable range of values exists with respect to most assumptions
utilised in determining these values. As a result of the potentially significant variability in the estimates of the assumptions used in these
models, the range of reasonable estimates of the fair value of these securities is significant.
Management has obtained broker bids on these securities that represent the value at which the Group could sell the investments, if forced.
These bids are not based on full knowledge and hence analysis of the investments but represent the best estimate of the worst case decline
in market value of these securities. The broker bids for these securities at 31 December 2005 totalled £514 million, a difference of £186 million.
Interest income and expense
The interest income on financial assets not at fair value through profit and loss was £2,662 million for the year ended 31 December 2005.
The interest expense on financial liabilities not at fair value through profit and loss was £893 million for the year ended 31 December 2005.
Listed investments – 2004
Of the Group’s financial investments of £151,083 million as at 31 December 2004, £115,294 million were listed investments. The amount
of the Group’s total financial investments that were due to mature in less than one year was £15,409 million.
Notes on the Group financial statements continued

Prudential plc Annual Report 2005 143
G2: Market riskInterest rate risk
The following table shows an analysis of the classes of financial assets and liabilities with direct exposure to interest rate risk. Each applicable
class of the Group’s financial assets or liabilities are analysed between those exposed to fair value interest rate risk, cash flow interest rate
risk and those with no direct interest rate risk exposure:Not directly
Fair value Cash flow exposed tointerest interest interestrate risk rate risk rate risk Total
2005 £m £m £m £m
Financial assets
Deposits 4,531 3,096 – 7,627
Debt securities 74,806 7,665 – 82,471
Loans and receivables 4,269 8,976 – 13,245
Other investments (including derivatives) 345 1,553 1,981 3,879
83,951 21,290 1,981 107,222
Financial liabilities
Banking customer accounts – 5,830 – 5,830
Core structural borrowings of shareholder-financed operations 3,191 – – 3,191
Operational borrowings attributable to shareholder-financed operations 1,638 4,780 14 6,432
Borrowings attributable to with-profits funds 916 883 99 1,898
Obligations under funding, securities lending and sale and repurchase agreements 703 3,826 – 4,529
Investment contracts without discretionary participation features 723 779 10,524 12,026
Other liabilities (including derivatives) 275 380 1,114 1,769
7,446 16,478 11,751 35,675
The following table sets out the Group’s commitments to lend funds at a fixed rate:
Weightedaverageinterest
Amount rate2005 £m %
Term to maturity:
Less than 1 year 16 11.9
1 to 5 years 58 5.4
5 to 10 years 52 7.4
10 to 15 years 27 7.4
15 to 20 years 9 5.3
Over 20 years 5 5.6
167
Of the above commitments £104 million related to US operations, £32 million related to the banking operations and £31 million related to
Asian operations.

144 Prudential plc Annual Report 2005
G2: Market risk continuedThe table below details the effective interest rates for applicable classes of financial assets and liabilities not held at fair value through
profit and loss, notably financial assets designated as available-for-sale, loans and receivables and liabilities held at amortised cost:
Balance of financial Range of effectiveinstruments not at interest ratesfair value through applicable as at
profit and loss 31 Dec 2005£m %
Assets
Deposits 7,627 1.6 – 5.4
Debt securities 25,657 4.0 – 8.0
Loans and receivables:
Mortgage loans 4,928 2.3 – 7.6
Policy loans 865 3.0 – 9.0
Other loans 7,452 4.5 – 10.5
46,529
Liabilities
Banking customer accounts 5,830 1.6 – 5.0
Core structural borrowings of shareholder-financed operations 3,191 5.5 – 9.4
Operational borrowings attributable to shareholder-financed operations 6,432 2.2 – 6.5
Borrowings attributable to with-profits funds 1,339 6.0 – 10.0
Obligations under funding, stocklending and sale and repurchase agreements 4,529 2.4 – 8.0
Investment contracts without discretionary participation features 1,502 2.0 – 8.2
Other liabilities (including derivatives) 918 0.0 – 0.0
23,741
For further information on effective interest rates specific to the banking operations, please refer to section E6.
In relation to interest rate exposure, the following table sets out the earlier of contractual maturities and repricing dates for applicable
classes of financial instruments, excluding investment contracts without discretionary participation features:
After After After After Total1 year 1 year to 5 years to 10 years to 15 years to Over No stated carryingor less 5 years 10 years 15 years 20 years 20 years maturity value
2005 £m £m £m £m £m £m £m £m
Financial assets
Deposits 7,029 38 20 – – 52 488 7,627
Debt securities 3,475 11,857 23,162 8,594 9,610 24,754 1,019 82,471
Loans and receivables 3,495 4,275 1,875 1,199 1,393 172 836 13,245
Other investments (including derivatives) 1,893 189 83 29 17 208 1,460 3,879
15,892 16,359 25,140 9,822 11,020 25,186 3,803 107,222
Financial liabilities
Banking customer accounts 5,830 – – – – – – 5,830
Core structural borrowings of
shareholder-financed operations – 399 250 – 857 820 865 3,191
Operational borrowings attributable to
shareholder-financed operations 2,440 3,040 – 139 – 813 – 6,432
Borrowings attributable to with-profits funds 39 309 775 – – 81 694 1,898
Obligations under funding, stocklending and
sale and repurchase agreements 4,529 – – – – – – 4,529
Other liabilities (including derivatives) 1,096 256 70 30 68 130 119 1,769
13,934 4,004 1,095 169 925 1,844 1,678 23,649
Durations of long-term business contracts, including investment contracts, are included in section D.
Notes on the Group financial statements continued

Prudential plc Annual Report 2005 145
G2: Market risk continuedCurrency risk
As at 31 December 2005, the Group held 18 per cent and 21 per cent of its financial assets and financial liabilities respectively, in currencies,
mainly US dollar and Euro, other than the functional currency of the relevant business unit.
The financial assets, of which 86 per cent are held by the PAC with-profits fund, allow the PAC with-profits fund to obtain exposure to
foreign equity markets.
The financial liabilities, of which 22 per cent are held by the PAC with-profits fund, mainly relate to foreign currency borrowings.
The exchange risks inherent in these exposures are mitigated through the use of derivatives, mainly forward currency contracts (see G3 below).
The amount of exchange gains recognised in the income statement in 2005 except for those arising on financial instruments measured
at fair value through profit and loss is £152 million (2004: £27 million). Of this amount, £134 million (2004: £31 million) is offset by value
movements on cross-currency swaps and £12 million (2004: exchange loss of £2 million) relates to investments of the PAC with-profits fund.
See also note E3 for details of the market risks faced by the banking business.
G3: Derivatives and hedgingDerivatives
The Group enters into a variety of exchange traded and over-the-counter derivative financial instruments, including futures, options, forward
currency contracts and swaps such as interest rate swaps, cross-currency swaps, swaptions and credit default swaps.
All over-the-counter derivative transactions are conducted under standardised ISDA (International Swaps and Derivatives Association Inc)
master agreements and the Group has collateral agreements between the individual group entities and relevant counterparties in place
under each of these market master agreements.
The total fair value balances of derivative assets and liabilities as at 31 December 2005 were as follows:
UK insurance Banking Otheroperations US operations operations Total
2005 £m £m £m £m £m
Derivative assets 338 166 50 86 640
Derivative liabilities (403) (208) (77) (163) (851)
(65) (42) (27) (77) (211)
The above derivative assets and derivative liabilities are included in ‘other investments’ and ‘other liabilities’ in the primary statements.
The notional amount of the derivatives, distinguishing between UK insurance, US, banking and other operations were as follows as at
31 December 2005:
UK insurance operations US Banking operations
Notional amount on which Notional amount on which Notional amount on whichfuture payments are based future payments are based future payments are based
Asset Liability Asset Liability Asset Liability£m £m £m £m £m £m
Cross-currency swaps* 800 774 552 392 941 952
Equity index call options – – 796 13 – –
Swaptions 1,125 – 9,320 14,562 – –
Futures 1,621 1,239 9 – – –
Forwards* 10,711 10,878 – – 743 744
Inflation swaps 1,070 1,070 – – – –
Credit default swaps – – – – 2,256 –
Single stock options 83 18 – – – –
Put options – – 1,427 – – –
FTSE swap – – – – 49 49
Total return swaps 479 479 612 120 – –
Interest rate swaps 2,790 3,302 2,367 4,250 2,855 2,855
*In addition, the other operations, including the Group Treasury function and the Asian operations, have cross-currency swap assets and liabilities with notional amounts of£2,761 million and £2,692 million, respectively, forward currency contracts assets and liabilities with notional amounts of £501 million and £167 million, respectively and interestrate swaps of £1,310 million and £1,310 million, respectively.
These derivatives are used for efficient portfolio management to obtain cost effective and efficient exposure to various markets in
accordance with the Group’s investment strategies and to manage exposure to interest rate, currency, credit and other business risks.
See also section D3 for use of derivatives by the Group’s US operations.
The Group uses the various interest rate derivative instruments, such as interest rate swaps to reduce exposure to interest rate volatility.

146 Prudential plc Annual Report 2005
G3: Derivatives and hedging continuedThe UK insurance operations use various currency derivatives in order to limit volatility due to foreign currency exchange rate fluctuations
arising on securities denominated in currencies other than Sterling. See also note G2 above. In addition, total return swaps and interest
rate swaps are held for efficient portfolio management.
As part of the efficient portfolio management of the PAC with-profits fund, the fund may, from time to time, invest in cash-settled forward
contracts over Prudential plc shares, which are accounted for consistently with other derivatives. This is in order to avoid a mismatch of the
with-profits investment portfolio with the investment benchmarks set for its equity-based investment funds. The contracts will form part of
the long-term investments of the with-profits fund. These contracts are subject to a number of limitations for legal and regulatory reasons.
Some of the Group’s products, especially those sold in the US, have certain guarantee features linked to equity indexes. A mismatch
between product liabilities and the performance of the underlying assets backing them exposes the Group to equity index risk. In order
to mitigate this risk, the relevant business units purchase swaptions, equity options and futures to match asset performance with liabilities
under equity-indexed products.
The US operations and some of the UK operations hold large amounts of interest rate sensitive investments that contain credit risks on
which a certain level of defaults is expected. These entities have purchased some swaptions in order to manage the default risk on certain
underlying assets and hence reduce the amount of regulatory capital held to support the assets.
Egg uses derivative instruments for the purpose of supporting the strategic and operational business activities and reducing and eliminating
the risk of loss arising from changes in interest rates and foreign exchange rates. Derivatives are used solely to hedge risk exposures and
Egg does not take any trading position in derivatives.
For the purpose of reducing interest rate risk, Egg uses a number of derivative instruments, including interest rate swaps and forward
agreements. Additionally, swaps are used to provide caps to the funding cost of the credit card product.
Egg has also made general use of credit default swaps to manage credit risk without changing the underlying product or investment portfolios.
For the purpose of reducing currency risk, Egg uses forward exchange contracts and currency swaps.
Hedging
The Group has formally assessed and documented the effectiveness of the following hedges:
Fair value hedges
The Group has a US$1 billion fair value hedge in place which hedges the interest exposure on the US$1 billion, 6.5 per cent perpetual
subordinated capital securities.
In addition, Jackson has entered into a collar fair value hedge, which has been hedge accounted for from 1 March 2005. This common
stock equity collar transaction was entered into to protect the Company’s unrealised gain of US$5.9 million on an equity investment.
The hedge expires in March 2008.
Cash flow hedges
Egg has cash flow hedged certain balance sheet items which are subject to interest rate risk. As at 31 December 2005, the notional
amount of this cash flow hedge was £2,296 million. The cash flows are periodically updated based on the underlying banking portfolios.
Net investment hedges
In November 2005, the Group’s US$500 million net investment hedge relating to the currency exposure of the US operations matured.
In December 2005, the Group entered into a series of forward currency transactions which together form a US$2 billion net investment
hedge of the currency exposure of the net investments in the US operations.
The Group has designated perpetual subordinated capital securities totalling US$1.55 billion as a net investment hedge to hedge the
currency risks related to the net investment in JNL. The carrying value of the subordinated capital securities was £865 million as at
31 December 2005.
The net investment hedges were 100 per cent effective.
Notes on the Group financial statements continued

Prudential plc Annual Report 2005 147
G4: Derecognition, securitisation and collateralSecurities lending and reverse repurchase agreements
The Group has entered into securities lending (including repurchase agreements) whereby blocks of securities are loaned to third parties,
primarily major brokerage firms. The agreements require that amounts between 102 per cent and 105 per cent of the fair value of the
loaned securities be held as collateral, depending on the quality of the collateral, calculated on a daily basis. The loaned securities are not
removed from the Group’s consolidated balance sheet, rather they are retained within the appropriate investment classification. Collateral
typically consists of cash, debt securities, equity securities and letters of credit. At 31 December 2005, the Group had lent £10,594 million
(of which £8,250 million was lent by the PAC with-profits fund) of securities and held collateral under such agreements of £11,112 million
(of which £8,657 million was held by the PAC with-profits fund).
At 31 December 2005, the Group had entered into reverse repurchase transactions under which it purchased securities and had taken on
the obligation to resell the securities for the purchase price, £1,214 million, together with accrued interest.
Collateral and pledges under derivative transactions
At 31 December 2005, the Group had pledged £403 million for liabilities and held collateral of £193 million in respect of over-the-counter
derivative transactions.
Securitisation
During 2005, Egg transferred additional UK credit card receivables to its trust vehicle, Arch (Term) Limited, created in 2002 for the
purpose of asset-backed securitisation, bringing the outstanding balance of assets in this vehicle to £2.8 billion (2004: £2.59 billion). The
noteholders in securitisations from this vehicle have a proportional interest in each account balance in the trust. As at 31 December 2005,
the value of this interest was £2.3 billion (2004: £2.23 billion). This securitisation does not qualify for derecognition under IAS 39 and the
total portfolio is, therefore, included in loans and receivables. The funding giving rise to the note-holders interest is included within
operational borrowings attributable to shareholder-financed operations.
G5: Impairment of financial assetsIn accordance with the Group’s accounting policy set out in note A4, impairment reviews were performed for available-for-sale securities
and loans and receivables. In addition, impairment reviews were undertaken for the reinsurers’ share of policyholder liability provisions.
During the year ended 31 December 2005, an amount of £278 million for impairment losses was recognised, mainly for loans and advances
to customers in Egg and available-for-sale securities held by JNL.
The impairment losses have been recorded in ‘acquisition costs and other operating expenditure’.
H: Other information on balance sheet items
H1: Goodwill2005 2004
£m £m
Cost
At 1 January 2,250 1,813*
Additions 151 537
Disposals (including, for 2005, goodwill of held for sale venture investment subsidiaries – see note H9) (333) (100)
At 31 December 2,068 2,250
Aggregate impairment
At 1 January (5) 0
Impairment losses in the year recognised in the profit and loss (120) (5)
Write-offs related to disposals and discontinued operations 5 0
At 31 December (120) (5)
Net book amount as at 31 December 1,948 2,245
The carrying value of goodwill is attributable to:
The PAC with-profits fund (in respect of venture investment subsidiaries) 607 784
Shareholders (principally in respect of M&G and Asian businesses) 1,341 1,461
1,948 2,245
*Under IFRS 1, the carrying value of goodwill of £1,504 million under UK GAAP is the deemed cost under IFRS on the date of transition, 1 January 2004. An additional£309 million relates to newly consolidated venture investment subsidiaries of the PAC with-profits fund.
The additions of £151 million (2004: £537 million) relate to additions to the PAC with-profits fund venture holdings in which the Group
has a controlling interest. All goodwill additions relate to the UK and the long-term business segments. Additional details on the
acquisitions are provided in note I6.
Goodwill disposals in 2004 relate to the sale of Jackson Federal Bank (£38 million) and sales of a PAC with-profits fund venture subsidiary
(£62 million). In 2005, goodwill disposals relate entirely to PAC with-profits fund venture subsidiaries.

148 Prudential plc Annual Report 2005
H1: Goodwill continuedThe £5 million charge for impairments in 2004 related to the write-down of Funds Direct (£2 million) and Zebank (£3 million), parts of the
Egg group. The impairment has been reflected in discontinued operations (note F6) in the consolidated income statement.
During 2005, the acquired goodwill of the Japanese life company was tested for impairment and a charge of £120 million has been separately
disclosed in the consolidated income statement. The charge reflects the slower than expected development of the Japanese life business.
Impairment testing
Goodwill does not generate cash flows independently of other groups of assets and thus is assigned to cash generating units (CGUs) for
the purposes of impairment testing. These CGUs are based upon how management monitors the business and represent the lowest level
to which goodwill can be allocated on a reasonable basis. An allocation of the Group’s goodwill to CGUs is shown below:
2005 2004£m £m
M&G 1,153 1,153
Japan life company – 120
Venture investment subsidiaries of the PAC with-profits fund 607 784
Other 188 188
1,948 2,245
‘Other’ represents goodwill amounts allocated across cash generating units in Asia and US operations. These goodwill amounts are not
individually material. There are no other intangible assets with indefinite useful lives other than goodwill.
Assessment of whether goodwill may be impaired
With the exception of M&G and venture investment subsidiaries of the PAC with-profits fund the goodwill in the balance sheet relates
to acquired life businesses. The Company routinely compares the aggregate of net asset value and acquired goodwill on an IFRS basis of
acquired life business with the value of the business as determined using the EEV methodology, as described in section D1. Any excess of
IFRS over EEV carrying value is then compared with EEV basis value of current and projected future new business to determine whether
there is any indication that the goodwill in the IFRS balance sheet may be impaired.
Goodwill is tested for impairment by comparing the CGUs carrying amount, excluding any goodwill, with its recoverable amount.
M&G
The recoverable amount for the M&G CGU has been determined by calculating its value in use. This has been calculated by aggregating
the present value of future cash flows expected to be derived from the component businesses of M&G (based upon management
projections) and its current surplus capital.
The discounted cash flow valuation has been based on a three-year plan prepared by M&G, and approved by the directors of Prudential
plc, and cash flow projections for later years.
As a cross check to the discounted cash flow analysis, a review was undertaken of publicly available information for companies engaged in
businesses comparable to the component businesses, including reported market prices for such companies’ shares. In addition, a review
was undertaken of publicly available terms of transactions involving companies comparable to the component businesses. In particular,
comparison has been made of the valuation multiples implied by the discounted cash flow analysis to current trading multiples of companies
comparable to the component businesses, as well as to multiples achieved in precedent transactions.
The value in use is particularly sensitive to a number of key assumptions, as follows:
(i) The assumed growth rate on forecast cash flows beyond the terminal year of the budget. A growth rate of 2.5 per cent has been used
to extrapolate beyond the plan period.
(ii) The risk discount rate. Differing discount rates have been applied in accordance with the nature of the individual component businesses.
For retail and institutional business a risk discount rate of 12 per cent has been applied. This represents the average implied discount rate
for comparable UK listed asset managers calculated by reference to risk-free rates, equity risk premiums of 5 per cent and an average
‘beta’ factor for relative market risk of comparable UK listed asset managers. A similarly granular approach has been applied for the other
component businesses of M&G.
(iii) That asset management contracts continue on similar terms.
Management believes that any reasonable change in the key assumptions would not cause the carrying amount of M&G to exceed its
recoverable amount.
Notes on the Group financial statements continued
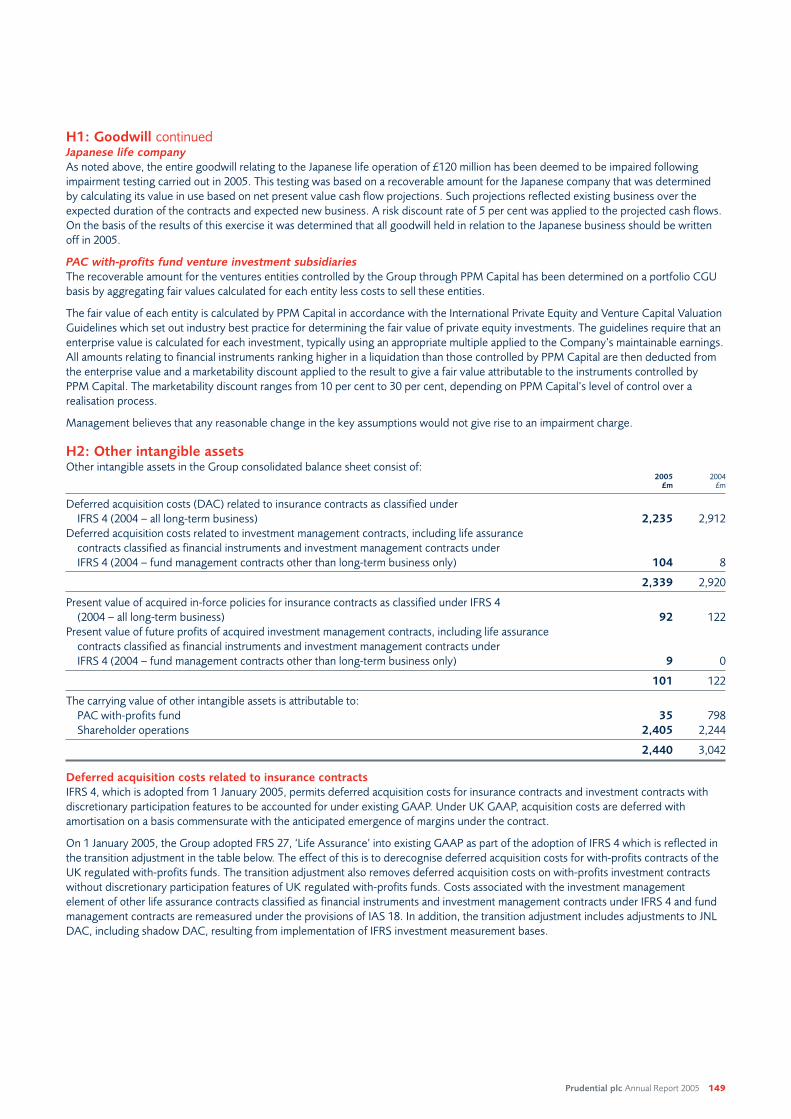
Prudential plc Annual Report 2005 149
H1: Goodwill continuedJapanese life company
As noted above, the entire goodwill relating to the Japanese life operation of £120 million has been deemed to be impaired following
impairment testing carried out in 2005. This testing was based on a recoverable amount for the Japanese company that was determined
by calculating its value in use based on net present value cash flow projections. Such projections reflected existing business over the
expected duration of the contracts and expected new business. A risk discount rate of 5 per cent was applied to the projected cash flows.
On the basis of the results of this exercise it was determined that all goodwill held in relation to the Japanese business should be written
off in 2005.
PAC with-profits fund venture investment subsidiaries
The recoverable amount for the ventures entities controlled by the Group through PPM Capital has been determined on a portfolio CGU
basis by aggregating fair values calculated for each entity less costs to sell these entities.
The fair value of each entity is calculated by PPM Capital in accordance with the International Private Equity and Venture Capital Valuation
Guidelines which set out industry best practice for determining the fair value of private equity investments. The guidelines require that an
enterprise value is calculated for each investment, typically using an appropriate multiple applied to the Company’s maintainable earnings.
All amounts relating to financial instruments ranking higher in a liquidation than those controlled by PPM Capital are then deducted from
the enterprise value and a marketability discount applied to the result to give a fair value attributable to the instruments controlled by
PPM Capital. The marketability discount ranges from 10 per cent to 30 per cent, depending on PPM Capital’s level of control over a
realisation process.
Management believes that any reasonable change in the key assumptions would not give rise to an impairment charge.
H2: Other intangible assetsOther intangible assets in the Group consolidated balance sheet consist of:
2005 2004£m £m
Deferred acquisition costs (DAC) related to insurance contracts as classified under
IFRS 4 (2004 – all long-term business) 2,235 2,912
Deferred acquisition costs related to investment management contracts, including life assurance
contracts classified as financial instruments and investment management contracts under
IFRS 4 (2004 – fund management contracts other than long-term business only) 104 8
2,339 2,920
Present value of acquired in-force policies for insurance contracts as classified under IFRS 4
(2004 – all long-term business) 92 122
Present value of future profits of acquired investment management contracts, including life assurance
contracts classified as financial instruments and investment management contracts under
IFRS 4 (2004 – fund management contracts other than long-term business only) 9 0
101 122
The carrying value of other intangible assets is attributable to:
PAC with-profits fund 35 798
Shareholder operations 2,405 2,244
2,440 3,042
Deferred acquisition costs related to insurance contracts
IFRS 4, which is adopted from 1 January 2005, permits deferred acquisition costs for insurance contracts and investment contracts with
discretionary participation features to be accounted for under existing GAAP. Under UK GAAP, acquisition costs are deferred with
amortisation on a basis commensurate with the anticipated emergence of margins under the contract.
On 1 January 2005, the Group adopted FRS 27, ‘Life Assurance’ into existing GAAP as part of the adoption of IFRS 4 which is reflected in
the transition adjustment in the table below. The effect of this is to derecognise deferred acquisition costs for with-profits contracts of the
UK regulated with-profits funds. The transition adjustment also removes deferred acquisition costs on with-profits investment contracts
without discretionary participation features of UK regulated with-profits funds. Costs associated with the investment management
element of other life assurance contracts classified as financial instruments and investment management contracts under IFRS 4 and fund
management contracts are remeasured under the provisions of IAS 18. In addition, the transition adjustment includes adjustments to JNL
DAC, including shadow DAC, resulting from implementation of IFRS investment measurement bases.

150 Prudential plc Annual Report 2005
H2: Other intangible assets continuedThe movement in deferred acquisition costs relating to insurance contracts and investment contracts with discretionary participation
features is as follows:£m
Deferred acquisition costs at 1 January 2004 2,943
Additions 473
Amortisation (381)
Impairment (2)
Exchange differences (121)
Deferred acquisition costs at 31 December 2004 2,912
Transition adjustment on application of IAS 32, IAS 39 and IFRS 4 (see note A6):
Derecognition of deferred acquisition costs for UK regulated with-profits funds as a result of adopting FRS 27 (765)
Removal of deferred acquisition costs on investment contracts without discretionary participation features (38)
Shadow DAC and other impacts as a result of measurement changes in JNL’s investment portfolio (456)
(1,259)
Deferred acquisition costs at 1 January 2005 1,653
Additions 501
Amortisation (392)
Impairment (21)
Exchange differences 173
Change in shadow DAC 321
Deferred acquisition costs at 31 December 2005 2,235
In 2005, deferred acquisition costs of £21 million relating to the Taiwanese life assurance operation were impaired. See note D4(f) for
further details.
Notes on the Group financial statements continued

Prudential plc Annual Report 2005 151
H2: Other intangible assets continuedDeferred acquisition costs related to investment management contracts
Incremental costs associated with the origination of investment management contracts written by the Group’s insurance and fund
management businesses are capitalised and amortised as the related revenue is recognised. Deferred acquisition costs related to
investment management contracts are all internally generated.
Amortisation of this intangible asset is included in the ‘acquisition costs and other operating expenditure’ line in the income statement.
£m
At 1 January 2004
Gross amount 12
Accumulated amortisation –
Net book amount 12
Year ended 31 December 2004
Opening net book amount 12
Additions (through internal development) 1
Amortisation (5)
At 31 December 2004 8
Transition adjustment on application of IAS 32, IAS 39 and IFRS 4 67
At 1 January 2005
Gross amount 80
Accumulated amortisation (5)
Net book amount 75
Year ended 31 December 2005
Opening net book amount 75
Additions (through internal development) 45
Amortisation (9)
Other changes (7)
Closing net book amount 104
At 31 December 2005
Gross amount 118
Accumulated amortisation (14)
Net book amount 104
Present value of acquired in-force business
Long-term business
Prior to the adoption of IFRS 4, the present value of acquired in-force business (PVAIF) was accounted for under UK GAAP. On 1 January 2005,
following the adoption of IFRS 4, PVAIF relating to investment contracts without discretionary participation features, which was included
within long-term business, is removed and replaced by an asset representing the present value of the future profits of the investment
management component of these contracts, where applicable. These contracts are accounted for under the provisions of IAS 18. The
remainder of the PVAIF balance relates to insurance contracts and continues to be accounted for under UK GAAP as permitted by IFRS 4.
The amortisation charge is included in acquisition costs and other operating expenditure in the income statement.

152 Prudential plc Annual Report 2005
H2: Other intangible assets continuedInvestment management
The present value of future profits of acquired investment management contracts relates to unit-linked contracts acquired as part of the
M&G acquisition in 1999.
Amortisation is charged to the ‘acquisition costs and other operating expenditure’ line in the income statement over the period of provision
of investment management services as those profits emerge.Long-term Investment
business management£m £m
At 1 January 2004
Cost 256 0
Accumulated amortisation (103) 0
Net book amount 153 0
Year ended 31 December 2004
Opening net book amount 153 0
Exchange differences (6) 0
Amortisation charge (25) 0
At 31 December 2004 122 0
Transition adjustment on application of IAS 32, IAS 39 and IFRS 4 (18) 12
At 1 January 2005
Cost 217 12
Accumulated amortisation (113) 0
Net book amount 104 12
Year ended 31 December 2005
Opening net book amount 104 12
Exchange differences 9 0
Amortisation charge (21) (3)
Closing net book amount 92 9
At 31 December 2005
Cost 233 12
Accumulated amortisation (141) (3)
Net book amount 92 9
H3: Reinsurers’ share of policyholder liabilities2005 2004
£m £m
Insurance contract liabilities (note i) 1,203 –
Claims outstanding 75 99
Long-term business provision – 612
Technical provisions for linked liabilities – 307
1,278 1,018
Note(i) Movement on reinsurers’ share of insurance contract liabilities
2005£m
Balance at 31 December 2004 and 1 January 2005 following adoption of IFRS 4* 919Amount included in income statement 242Foreign exchange translation differences 42
Balance at 31 December 2005 1,203
*Comprising long-term business provision plus technical provisions for linked liabilities which all relate to contracts classified as insurance under IFRS 4.
Notes on the Group financial statements continued

Prudential plc Annual Report 2005 153
H4: Tax assets and liabilitiesAssets
Of the £231 million (2004: £159 million) current tax recoverable, the majority is expected to be settled in one year or less.
Deferred tax asset2005 2004
£m £m
Unrealised losses on investments 84 186
Balances relating to investment and insurance contracts 317 357
Short-term timing differences 258 260
Capital allowances 91 21
Unused deferred tax losses 5 3
755 827
Deferred tax assets are recognised to the extent that they are regarded as recoverable, that is to the extent that, on the basis of all
available evidence, it can be regarded as more likely than not that there will be suitable taxable profits from which the future reversal of
the underlying temporary differences can be deducted. The UK taxation regime applies separate rules to trading and capital profits and
losses. The distinction between temporary differences that arise from items of either a capital or trading nature may affect the recognition
of deferred tax assets. Accordingly, for the 2005 results and balance sheet position at 31 December 2005 the possible tax benefit of
approximately £333 million (2004: £430 million), which may arise from capital losses valued at approximately £1.7 billion, is sufficiently
uncertain that it has not been recognised. In addition, a potential deferred tax asset of £67 million, which may arise from trading losses
of approximately £237 million, is sufficiently uncertain that it has not been recognised.
Liabilities
Of the £962 million (2004: £1,018 million) current tax liability, it is not practicable to estimate how much is expected to be settled in one
year or less due to the uncertainty over when outstanding issues will be agreed with HM Revenue and Customs.
Deferred tax liability2005 2004
£m £m
Unrealised gains on investments 1,907 1,477
Balances relating to investment and insurance contracts 554 675
Short-term timing differences 450 131
Capital allowances 80 (4)
2,991 2,279
Unprovided deferred income tax liabilities on temporary differences associated with investment in subsidiaries, associates and interests
in joint ventures are considered to be insignificant due to the availability of various UK tax exemptions and reliefs.
Discounting
Deferred tax asset and liability balances have not been discounted.
H5: Accrued investment income and other debtors2005 2004
£m £m
Accrued investment income
Interest receivable 1,235 1,287
Other 556 446
1,791 1,733
Other debtors
Premiums receivable:
From policyholders 230 106
From intermediaries 10 8
From reinsurers 21 20
Other 1,057 1,054
1,318 1,188
Total 3,109 2,921
Of the £3,109 million (2004: £2,921 million) of accrued investment income and other debtors, £992 million (2004: £990 million) is expected
to be settled after one year or more.

154 Prudential plc Annual Report 2005
H6: Property, plant and equipmentProperty, plant and equipment comprise Group occupied properties, development property and tangible assets. A reconciliation of the
carrying amount of these items from the beginning of the year to the end of the year is as follows:
Group occupied Development Tangibleproperty property assets Total
£m £m £m £m
At 1 January 2004
Cost 266 66 866 1,198
Accumulated depreciation (29) – (458) (487)
Net book amount 237 66 408 711
Year ended 31 December 2004
Opening net book amount 237 66 408 711
Exchange differences (3) – (5) (8)
Depreciation charge (6) – (123) (129)
Additions 17 69 141 227
Arising on acquisition of subsidiaries 63 – 149 212
Disposals (3) – (23) (26)
Impairment – – (20) (20)
Closing net book amount 305 135 527 967
At 1 January 2005
Cost 340 135 1,094 1,569
Accumulated depreciation (35) – (567) (602)
Net book amount 305 135 527 967
Year ended 31 December 2005
Opening net book amount 305 135 527 967
Exchange differences 5 – 6 11
Depreciation charge (6) – (110) (116)
Additions 5 27 128 160
Arising on acquisition of subsidiaries 38 – 44 82
Disposals (105) – (102) (207)
Reclassification from held for investment – 13 – 13
Closing net book amount 242 175 493 910
At 31 December 2005
Cost 279 175 1,082 1,536
Accumulated depreciation (37) – (589) (626)
Net book amount 242 175 493 910
Of the above net book amounts, £125 million (2004: £193 million) of Group occupied property and £269 million (2004: £287 million)
of tangible assets are attributable to consolidated venture investment subsidiaries of the PAC with-profits fund at 31 December 2005.
All additions arising on acquisitions relate to acquisitions of venture investment subsidiaries of the PAC with-profits fund.
Notes on the Group financial statements continued

Prudential plc Annual Report 2005 155
Capital expenditure: property, plant and equipment by primary segment2005 2004
£m £m
Long-term business 124 159
Banking 28 60
Broker-dealer and fund management 6 8
Unallocated corporate 2 –
160 227
Capital expenditure: property, plant and equipment by secondary segment2005 2004
£m £m
UK 117 192
US 14 12
Asia 29 23
160 227
H7: Investment propertiesInvestment properties principally relate to the PAC with-profits fund and are carried at fair value. A reconciliation of the carrying amount
of investment properties at the beginning and end of the year is set out below:2005 2004
£m £m
At 1 January 2005 13,303 11,489
Additions:
Resulting from acquisitions 844 924
Resulting from expenditure capitalised 56 224
Resulting from acquisitions through business combinations 22 –
Disposals (1,224) (295)
Net gains from fair value adjustments 720 1,063
Net foreign exchange differences 24 (2)
Transfers to held for sale assets (note H9) (552) (100)
Transfers to development properties (13) –
At 31 December 2005 13,180 13,303
The income statement includes the following items in respect of investment properties:2005 2004
£m £m
Rental income from investment properties 765 828
Direct operating expenses (including repairs and maintenance expenses) arising from investment properties:
That generated rental income during the year 133 119
That did not generate rental income during the year 7 1
Total direct operating expenses 140 120

156 Prudential plc Annual Report 2005
H7: Investment properties continuedInvestment properties of £4,463 million (2004: £5,095 million) are held under finance leases. A reconciliation between the total of future
minimum lease payments at the balance sheet date, and their present value is shown below:2005 2004
£m £m
Future minimum lease payments at 31 December 564 679
Future finance charges on finance leases (450) (563)
Present value of minimum lease payments 114 116
Future minimum lease payments are due as follows:
Less than 1 year 12 8
1 to 5 years 23 25
Over 5 years 529 646
564 679
The present values of these minimum lease payments are:
Less than 1 year 11 7
1 to 5 years 22 23
Over 5 years 81 86
114 116
Contingent rent is that portion of the lease payments that is not fixed in amount but is based on the future value of a factor that changes
other than with the passage of time. Contingent rent recognised as an expense in 2005 amounted to £21 million (2004: £27 million).
Contingent rents recognised as income in the year amounted to £46 million (2004: £42 million).
The Group’s policy is to rent investment properties to tenants through operating leases. Minimum future rentals to be received on
non-cancellable operating leases are receivable in the following periods:2005 2004
£m £m
Less than 1 year 702 731
1 to 5 years 2,535 2,672
Over 5 years 7,005 7,424
The total minimum future rentals to be received on non-cancellable sub-leases for land and buildings for the year ended 31 December 2005
are £4,006 million (2004: £3,760 million).
H8: Investments in participating interestsThe Group’s investments in participating interests at 31 December 2005 and 2004 comprise associates and joint ventures. Disclosures
relating to these investments are provided below. The Group also had an interest of 15 per cent in Life Assurance Holding Corporation
Limited that was sold in August 2004 and realised a profit on sale of £7 million before tax. This has been further disclosed in the
discontinued operations note (see note F6).
Investments in associates
The Group had one associate at 31 December 2005 and 2004 that is accounted for using the equity method, IfOnline Group Limited
(IfOnline), a company whose principal activity is mortgage intermediation. Until its sale in September 2004, the Group also accounted
for its share in Hazell Carr Pensions Consulting plc (Hazell Carr) as an equity accounted associate.
The Group also has investments in associates which meet the IAS 28 criteria for measurement at fair value through profit and loss in
accordance with IAS 39.
Associates accounted for using the equity method
The Group holds 38.6 per cent of the total issued share capital of IfOnline which comprises 29.9 per cent of the ordinary share capital
and 96.0 per cent of the preference share capital. The Group also holds £1 Founder share capital and £1 AN share capital. IfOnline is
not a listed investment. Equity accounting is applied based on its reporting period of the year to 30 November and is adjusted for material
changes up to 31 December. Accordingly, the information is deemed to cover the same period as that of the Group.
In September 2004, the Company sold its 25 per cent share of Hazell Carr for £5 million. The profit on sale before tax of £2 million is
included in investment income in the consolidated income statement.
Notes on the Group financial statements continued

Prudential plc Annual Report 2005 157
H8: Investments in participating interests continuedA summary of the movements in investments in associates accounted for using the equity method in 2005 and 2004 is set out below:
Share of Share of Share of Total carryingcapital reserves net assets Goodwill value
£m £m £m £m £m
Balance at 1 January 2004 6 (7) (1) 10 9
Share of loss for the year after tax – (1) (1) – (1)
Disposal of Hazell Carr (2) 2 – (3) (3)
Balance at 31 December 2004 4 (6) (2) 7 5
Share of profit for the year after tax – – – – –
Balance at 31 December 2005 4 (6) (2) 7 5
There have been no changes recognised directly in the equity of associates that would also be recognised directly in equity by the Group.
The Group’s share of the assets, liabilities, revenues and profit and loss of associates accounted for using the equity method at
31 December 2005 and 2004 is as follows:
2005 2004£m £m
Financial position
Total assets (excluding goodwill) 1 1
Total liabilities (3) (3)
Net assets (2) (2)
Results of operations
Revenue 2 1
Profit (loss) in the year – (1)
Associates carried at fair value through profit and loss
The Group’s associates that are carried at fair value through profit and loss comprise investments in OEICs, unit trusts, funds holding
collateralised debt obligations, property unit trusts, and venture capital investments of the PAC with-profits fund managed by PPM Capital,
where the Group has significant influence. These investments are incorporated both in the UK and overseas, and some have year ends
which are non-coterminous with that of the Group. In these instances, the investments are recorded at fair value at 31 December 2005
based on valuations or pricing information at that specific date. The aggregate fair value of associates carried at fair value through profit
and loss where there are published price quotations is approximately £2 billion at 31 December 2005.
The aggregate assets of these associates are approximately £9 billion. Aggregate liabilities, excluding liabilities to unit holders and shareholders
for unit trusts and OEICs, are approximately £3 billion. Fund revenues, with revenue arising in unit trusts and OEICs deemed to constitute
the investment return for these vehicles, was approximately £2 billion and net profit in the year, excluding unit trusts or OEICs where all
investment returns accrue to unit holders or shareholders respectively, was approximately £0.1 billion.
Investments in joint ventures
Joint ventures represent activities over which the Group exercises joint control through contractual agreement with one or more parties.
The Group’s significant joint ventures, which are accounted for using proportionate consolidation, comprise various joint ventures relating
to property investments where the Group has a 50 per cent interest as well as the following interests:
Investment % held Principal activity Country
ICICI Prudential Life Insurance Company Limited 26 Life assurance India
BOCI – Prudential Asset Management Limited 36 Pensions China
Marlborough Stirling Mortgage Services Limited 50 Mortgage processing services UK
PruHealth 50 Private medical insurance UK
CITIC Prudential Fund Management Company Limited 33 Fund Management China
Prudential ICICI Asset Management Company Limited 49 Fund Management India

158 Prudential plc Annual Report 2005
H8: Investments in participating interests continuedCITIC Prudential Fund Management Company Limited and Prudential ICICI Asset Management Company Limited are new joint ventures
in 2005. Prudential ICICI Asset Management Company Limited was previously a subsidiary with an ownership interest of 55 per cent.
However, in 2005 the Group sold a 6 per cent holding resulting in a new interest of 49 per cent. Hence, the Group now accounts for this
investment as a joint venture, as there is a contractual agreement to share control.
The investments noted in the table above have the same accounting year end as the Group, except for Marlborough Stirling Mortgage
Services Limited and Prudential ICICI Asset Management Company Limited. Although these two investments have a reporting period of
31 March, 12 months of financial information up to 31 December is recorded. Accordingly, the information is deemed to cover the same
period as that of the Group.
The summarised financial data for the Group’s share of investments in joint ventures is as follows:
2005 2004£m £m
Financial position
Current assets 233 39
Non-current assets 281 288
Total assets 514 327
Current liabilities (30) (17)
Non-current liabilities (272) (179)
Total liabilities (302) (196)
Net equity 212 131
Results of operations
Revenues 156 74
Expenses (161) (85)
Net loss (5) (11)
The joint ventures have no significant contingent liabilities to which the Group is exposed nor does the Group have any significant
contingent liabilities in relation to its interest in the joint ventures.
H9: Assets and liabilities held for saleAssets and liabilities held for sale comprise investment property and consolidated venture subsidiaries of the PAC with-profits fund.
Investment properties are classified as held for sale when contracts have been exchanged but the sale has not been completed at the
period end.
As at 31 December 2005, there were two venture subsidiaries classified as held for sale, Upperpoint Distribution Limited and Taverner
Hotel Group Pty Ltd. The disposals of these subsidiaries were completed on 31 January 2006 and 6 February 2006, respectively. There
were no venture subsidiaries classified as held for sale at 31 December 2004.
Major classes of assets and liabilities held for sale are as follows:
2005 2004£m £m
Assets
Goodwill 16 –
Property, plant and equipment 21 –
Other assets 139 –
Investment properties 552 100
Non-current assets held for sale 728 100
Liabilities
Other liabilities 42 –
Borrowings 104 –
Non-current liabilities held for sale 146 –
Notes on the Group financial statements continued

Prudential plc Annual Report 2005 159
H10: Cash and cash equivalentsCash and cash equivalents consist of cash in hand, balances with banks, and certain short-term deposits and debt instruments. Cash and
cash equivalents included in the cash flow statement comprise the following balance sheet amounts:
2005 2004£m £m
Cash 2,380 2,799
Cash equivalents 1,206 1,542
Total cash and cash equivalents 3,586 4,341
Cash and cash equivalents held in the parent company and finance subsidiaries are considered to be available for use by the Group. These
funds amount to £263 million and £325 million in 2005 and 2004, respectively. The remaining amounts, generally not available for use by
the Group, predominantly consist of cash and cash equivalents held for the benefit of policyholders and loans and advances to banks held
by Egg.
H11: Shareholders’ equity: share capital, share premium and reservesThe authorised share capital of the Company is £170 million (divided into 3,000,000,000 ordinary shares of 5 pence each and 2,000,000,000
sterling preference shares of 1 pence each) and US$20 million (divided into 2,000,000,000 US dollar preference shares of 1 cent each)
and Euros 20 million (divided into 2,000,000,000 Euro preference shares of 1 cent each). None of the preference shares has been issued.
A summary of the ordinary shares in issue is set out below:
2005 2004£m £m
Share capital and share premium
Ordinary share capital: 2,387m (2004: 2,375m)
Shares issued 119 119
Share premium 1,564 1,558
Reserves
Retained earnings 3,236 2,972
Translation reserve 173 (160)
Available-for-sale and hedging reserves 102 0
Total shareholders’ equity 5,194 4,489
Share capital and share premiumShare Share
Number of capital premiumordinary shares £m £m
2004
Issued shares of 5p each fully paid:
At the beginning of the year 2,009,176,830 100 553
Shares issued under Rights Issue, net of expenses 339,011,347 17 1,004
Shares issued under share option schemes 567,121 – 1
Shares issued in lieu of cash dividends 26,637,722 2 116
Transfer to retained earnings in respect of shares issued in lieu of cash dividends (116)
At end of the year 2,375,393,020 119 1,558
2005
Issued shares of 5p each fully paid:
At the beginning of the year 2,375,393,020 119 1,558
Transition adjustment on adoption of IAS 32, IAS 39 and IFRS 4 2
2,375,393,020 119 1,560
Shares issued under share option schemes 745,478 – 4
Shares issued in lieu of cash dividends 10,645,768 – 51
Transfer to retained earnings in respect of shares issued in lieu of cash dividends (51)
At end of the year 2,386,784,266 119 1,564

160 Prudential plc Annual Report 2005
H11: Shareholders’ equity: share capital, share premium and reserves continuedAmounts recorded in share capital represent the nominal value of the shares issued. The difference between the proceeds received on
issue of shares, net of issue costs and the nominal value of shares issued is credited to the share premium account.
In October 2004, the Company announced a one for six Rights Issue at 308 pence per new share. The Rights Issue raised £1,044 million
and issue expenses were £23 million.
At 31 December 2005, there were options subsisting under Save As You Earn schemes to subscribe for 12,503,956 (2004: 13,254,966) shares
at prices ranging from 266 pence to 715 pence (2004: 266 pence to 723 pence) and exercisable by the year 2012 (2011). In addition, there
are 4,668,534 (2004: 5,153,308) conditional options outstanding under the RSP exercisable at nil cost in the balance of a 10-year period.
The cost of own shares of £97 million as at 31 December 2005 is deducted from retained earnings.
The Company has established trusts to facilitate the delivery of shares under employee incentive plans and savings-related share option
schemes. In 2005, the Company purchased 1.4 million (2004: 1.0 million) shares in respect of employee incentive plans at a cost of
£6 million (2004: £4 million). At 31 December 2005, 10.7 million (2004: 10.6 million) Prudential plc shares with a market value of
£59 million (2004: £48 million) were held in such trusts. This was also the maximum number held at any time during the year. Of this
total, 5.7 million (2004: 5.4 million) shares were held in trusts under employee incentive plans.
Of the total shares held in trust, 5 million (2004: 5.2 million) shares were held by a qualifying employee share ownership trust. These shares
are expected to be fully distributed in the future on maturity of savings-related share option schemes at a weighted average exercise price
of 286 pence (2004: 277 pence).
The Group has consolidated a number of authorised investment funds where it is deemed to control these funds under IFRS. Certain of these
funds hold shares in Prudential plc. The total number of shares held by these funds at 31 December 2005 was 5 million (2004: 5.9 million)
and the cost of acquiring these shares of £26 million (2004: £29 million) is included in cost of own shares. The market value of these shares
as at 31 December 2005 was £28 million (2004: £27 million).
Reserves
The translation reserve represents cumulative foreign exchange translation differences taken directly to equity in accordance with IFRS,
net of related tax. In accordance with IFRS 1, cumulative translation differences are deemed to be zero at 1 January 2004, the date of
transition to IFRS.
The hedging reserve at 31 December 2005 consists of the portion of the cash flow hedge that is determined to be an effective hedge,
net of related tax. The available-for-sale reserve includes gains or losses arising from changes in fair value of available-for-sale securities,
net of related tax. These reserves arise as a result of the application of IAS 39 which the Group has chosen to adopt at 1 January 2005 as
permitted by IFRS 1.
H12: Insurance contract liabilities and unallocated surplus of with-profits fundsMovement in year
Insurance Unallocatedcontract surplus of with-liabilities profits funds
£m £m
Policyholder liabilities at 31 December 2004 as reported under UK GAAP
Technical provisions in respect of non-linked business (note i) 104,964
Technical provisions for linked liabilities 24,137
Unallocated surplus of with-profits funds reflecting previous UK GAAP basis provisioning 16,686
Total at 31 December 2004 as reported under UK GAAP 129,101 16,686
Effect of changes on implementation of IFRS (note A5) (39) (537)
Total at 31 December 2004 under IFRS (excluding IAS 32, IAS 39 and IFRS 4) 129,062 16,149
Transition adjustments on application of IAS 32, IAS 39 and IFRS 4 (note ii and note A6) (25,480) (7,807)
At 1 January 2005 103,582 8,342
Income and expense included in the income statement 12,193 3,003
Liabilities acquired on purchase of insurance business (note I6) 837 0
Foreign exchange translation differences 3,824 12
At 31 December 2005 120,436 11,357
Notes(i) 2004 technical provisions in respect of non-linked business as reported under UK GAAP include £826 million of claims outstanding.
(ii) Transitional adjustments include adoption of FRS 27 and reallocation of £22.7 billion and £9.8 billion to investment contracts with and without discretionary participationfeatures, respectively.
Notes on the Group financial statements continued

Prudential plc Annual Report 2005 161
H13: BorrowingsCore structural borrowings of shareholder-financed operations
2005 2004£m £m
Subordinated debt (excluding Egg)
UK operations:
€500m 5.75% Subordinated Notes 2021 341 351
£435m 6.125% Subordinated Notes 2031 426 426
US$1,000m 6.5% Perpetual Subordinated Capital Securities 554 512
US$250m 6.75% Perpetual Subordinated Capital Securities (note i) 142 126
US$300m 6.5% Perpetual Subordinated Capital Securities (note ii) 169 –
€20m Medium Term Subordinated Notes 2023 14 14
1,646 1,429
Other core structural borrowings of shareholder-financed operations, other than Egg
UK operations:
US$250m 7.125% Bonds 2005 – 130
£150m 9.375% Guaranteed Bonds 2007 150 150
£250m 5.5% Bonds 2009 249 250
£250m 5.875% Bonds 2029 249 250
£300m 6.875% Bonds 2023 300 300
Commercial paper – 171
Currency translation net asset on swap transactions – (13)
US operations:
US$250m 8.15% Surplus Notes 2027 (note iii) 145 130
1,093 1,368
Egg
£200m 6.875% Subordinated Notes 2021 202 202
£250m 7.5% Subordinated Notes 2013 250 249
452 451
Total 3,191 3,248
Notes(i) This balance represents convertible debt issued in 2004. The debt is exchangeable into preference shares. The proceeds of the issue have been used to pre-finance US$250 million debt maturing in 2005. Conversion of these securities into preference shares is at Prudential’s option.
(ii) This debt is exchangeable into preference shares at Prudential’s option.
(iii) These Surplus Notes are unsecured and subordinated to all present and future indebtedness, policy claims and other creditor claims of the US operations.
(iv) Maturity analysisThe following table sets out the maturity analysis of the Group’s core structural borrowings:
2005 2004£m £m
Less than 1 year – 3011 to 2 years 150 –2 to 3 years – 1503 to 4 years 249 –4 to 5 years – 250Over 5 years 2,792 2,547
Total 3,191 3,248

162 Prudential plc Annual Report 2005
H13: Borrowings continuedOperational borrowings attributable to shareholder-financed operations
2005 2004£m £m
Borrowings in respect of short-term fixed income securities programmes
Commercial paper 2006 1,461 1,057
Medium-term notes 2010 11 9
Currency translation net liability on swap transactions – 13
1,472 1,079
Non-recourse borrowings of investment subsidiaries managed by PPM America
Non-recourse borrowings of investment subsidiaries (notes i and iii) 133 183
Non-recourse borrowings of Piedmont and CDO funds (notes ii and iii) 952 972
1,085 1,155
Borrowings in respect of banking operations (note iv) 3,856 4,159
Other borrowings
Bank loans and overdrafts 11 17
Obligations under finance leases 8 11
19 28
Total 6,432 6,421
Notes(i) These borrowings include senior and subordinated debt. The senior debt is secured on the investments held by the relevant subsidiaries. The weighted average interest rateson the senior debt are variable based on a market rate and were 4.48 per cent and 2.38 per cent at 31 December 2005 and 31 December 2004 respectively. The interests of theholders of the subordinated debt issued by these subsidiaries are subordinate to the entitlements of the holders of the senior debt.
(ii) Piedmont is an investment trust investing in certain asset-backed and mortgage-backed securities in the US. These borrowings pertain to debt instruments issued to externalparties.
(iii) In all instances the holders of the debt instruments issued by these subsidiaries and other companies and funds do not have recourse beyond the assets of those subsidiariesand funds.
(iv) The borrowings in respect of banking operations comprise deposits by banks of £2,452 million (2004: £2,352 million) and unsubordinated debt securities issued by Egg of£1,404 million (2004: £1,807 million). The deposits by banks mainly relate to securitisation of credit card receivables. See also note G4.
(v) Maturity analysisThe following table sets out the maturity analysis of the Group’s operational borrowings attributable to shareholder-financed operations:
2005 2004£m £m
Less than 1 year 2,440 1,8961 to 2 years 1,055 7922 to 3 years 523 1,0563 to 4 years 1,013 5004 to 5 years 449 1,022Over 5 years 952 1,155
Total 6,432 6,421
Borrowings attributable to with-profits funds2005 2004
£m £m
Non-recourse borrowings of venture fund investment subsidiaries of the PAC with-profits fund 988 1,167
£100m 8.5% Undated Subordinated Guaranteed Bonds of Scottish Amicable Finance plc (note i) 100 100
Other borrowings (predominantly external funding of consolidated investment vehicles) 810 870
1,898 2,137
Notes(i) The interests of the holders of the bonds issued by Scottish Amicable Finance plc, a subsidiary of the Scottish Amicable Insurance Fund, are subordinate to the entitlements ofthe policyholders of that fund.
(ii) Maturity analysisThe following table sets out the maturity analysis of the Group’s borrowings attributable to with-profits funds:
2005 2004£m £m
Less than 1 year 39 3591 to 2 years 74 522 to 3 years 40 2043 to 4 years 62 214 to 5 years 133 118Over 5 years 1,550 1,383
Total 1,898 2,137
Notes on the Group financial statements continued

Prudential plc Annual Report 2005 163
H14: Provisions and contingenciesProvisions
2005 2004£m £m
Provision in respect of defined benefit pension schemes (note I1):
Deficits, gross of deferred tax, based on scheme assets held, including investments in Prudential insurance policies:
Attributable to PAC with-profits fund (ie absorbed by the liability for unallocated surplus) 329 525
Attributable to shareholder-financed operations (ie to shareholders’ equity) 214 175
543 700
Add back: investments in Prudential insurance policies 253 125
Provision after elimination of investments in Prudential insurance policies and matching
policyholder liability from Group balance sheet 796 825
Other provisions (see below) 176 181
Total provisions 972 1,006
Analysis of other provisions:2005 2004
£m £m
At 1 January 181 173
Charged to income statement:
Additional provisions 85 163
Unused amounts reversed (25) (21)
Used during the year (63) (137)
Exchange differences (2) 3
At 31 December 176 181
Comprising:
Legal provisions 11 13
Restructuring provisions 41 66
Other provisions 124 102
176 181
Of the other provisions balance, £74 million (2004: £53 million) is expected to be settled within one year. Employer contributions
expected to be paid into Group defined benefit pension schemes within one year are shown in note I1.
Legal provisions
The legal provisions of £11 million (2004: £13 million) relate predominantly to JNL. JNL has been named in civil proceedings, which
appear to be substantially similar to other class action litigation brought against many life insurers in the US, alleging misconduct in the
sale of insurance products. During 2005, an additional provision of £4 million was made, £1 million was reversed, £3 million was paid and
there was a £2 million exchange gain. As at 1 January 2004, the provision amounted to £10 million. During 2004, an additional provision
of £8 million was made, £1 million was reversed, £3 million was paid and there was a £1 million exchange gain.
Restructuring provisions
Restructuring provisions of £41 million (2004: £66 million) comprise £30 million (2004: £49 million) relating to restructuring activity of
UK insurance operations, £10 million (2004: £nil) relating to closure costs in Japan and £1 million (2004: £17 million) relating to Egg.
In February 2001, Prudential announced the restructuring of the direct sales force and customer service channels of its UK insurance
operations. In November 2001, Prudential announced further details of changes to the structure of those operations, in particular the
intention to pursue a single brand strategy for life and pensions business including the integration of its Scottish Amicable operations
under the Prudential brand. The changes also included a simplification of the organisational structure and plans for a significant reduction
in operating costs. In September 2002, Prudential announced plans to establish an offshore service centre in India to improve customer
contact service levels for its UK insurance operations customers and to achieve further cost savings to those announced in November 2001.
The new processing centre opened in May 2003 and was fully operational during 2004. As part of this restructuring, Prudential had planned
to make 4,300 employees redundant, of which approximately 4,194 affected had been notified and 4,117 redundancies completed by
31 December 2005. The restructuring is expected to be completed in 2006.
As at 1 January 2004, the provision for these restructurings was £80 million. During 2004, £20 million costs were paid, £12 million was
released to the profit and loss account and an additional provision of £1 million was made. During 2005, costs of £9 million were paid,
£11 million of costs were released and an additional £1 million was provided. At 31 December 2005, the remaining £30 million all relates
to property charges.
In 2004, Egg announced its withdrawal from the French market. £113 million was charged in 2004 to cover the costs of the exit of which
£25 million related to redundancy costs and £88 million related to other associated costs up to the completion of the closure. During 2004,
£96 million of the provision had been utilised with a further £12 million utilised in 2005 and a £4 million release to the income statement.

164 Prudential plc Annual Report 2005
H14: Provisions and contingencies continuedIn 2005, Japan closed its Financial Advisor distribution channel. A £10 million provision has been set up relating to closure and
redundancy costs.
Other provisions
Other provisions of £124 million (2004: £102 million) include provisions of £94 million (2004: £77 million) relating to staff benefit schemes.
During 2005, another £27 million was provided and £10 million was paid. In 2004, a provision of £51 million was brought forward, an
additional £36 million was provided, £2 million of unused provision was released and £8 million was paid. Other provisions also include
£19 million (2004: £17 million) relating to various onerous contracts where, in 2005, an additional £6 million was provided and £4 million
was used. In 2004, £5 million was released and £4 million was paid. The remaining provisions of £11 million (2004: £8 million) include
VAT provisions.
Contingencies and related obligations
Litigation
In addition to the legal proceedings relating to JNL mentioned above, the Group is involved in other litigation and regulatory issues arising
in the ordinary course of business. Whilst the outcome of such matters cannot be predicted with certainty, the directors believe that the
ultimate outcome of such litigation will not have a material adverse effect on the Group’s financial condition, results of operations or cash flows.
Pension mis-selling review
In 1988, the UK government introduced new pensions legislation intended to encourage more individuals to make their own arrangements
for their pensions. During the period from April 1988 to June 1994, many individuals were advised by insurance companies, Independent
Financial Advisers and other intermediaries to not join, to transfer from or to opt out of their occupational pension schemes in favour of
private pension products introduced under the UK Income and Corporation Taxes Act 1988. The UK insurance regulator (previously the
Personal Investment Authority, now the FSA), subsequently determined that many individuals were incorrectly advised and would have
been better off not purchasing the private pension products sold to them. Industry participants are responsible for compensating the
persons to whom private pensions were mis-sold. As a result, the FSA required that all UK life insurance companies review their potential
cases of pension mis-selling and pay compensation to policyholders where necessary and, as a consequence, record a provision for the
estimated costs. The Group met the requirement of the FSA to issue offers to all cases by 30 June 2002.
The table below summarises the change in the pension mis-selling provision for the years ended 31 December 2005 and 2004. The change
in the provision is included in benefits and claims in the income statement and the movement in unallocated surplus of with-profits funds
has been determined accordingly.
2005 2004£m £m
Balance at beginning of year 487 530
Change arising from adoption of FRS 27 (109) –
Changes to actuarial assumptions and method of calculation (28) (32)
Discount unwind 14 22
Redress to policyholders (21) (26)
Payment of administrative costs (12) (7)
Balance at end of year 331 487
The change arising from the adoption of FRS 27 is due to two factors, namely:
(i) Under the FRS 27 basis, which follows the FSA realistic Peak 2 approach, best estimate assumptions apply. Previously a margin for
adverse deviation was incorporated; and
(ii) The pension mis-selling provision is the additional amount needed i.e. between the value of the guarantees given to policyholders and
the values of the personal pension policies. The latter item is calculated differently under the previous Peak 1 and Peak 2 bases. The Peak
1 calculation is deterministic and excludes provision for terminal bonus. The Peak 2 calculation is stochastic and includes provision for
terminal bonus.
The FSA regularly updates the actuarial assumptions to be used in calculating the provision, including interest rates and mortality assumptions.
The pension mis-selling provision represents the discounted value of future expected payments, including benefit payments and all
internal and external legal and administrative costs of adjudicating, processing and settling those claims. To the extent that amounts have
not been paid, the provision increases each year reflecting the shorter period of discount.
The directors believe that, based on current information, the provision, together with future investment return on the assets backing the
provision, will be adequate to cover the costs of pension mis-selling as well as the costs and expenses of the Group’s pension review unit
established to identify and settle such cases. Such provision represents the best estimate of probable costs and expenses. However, there
can be no assurance that the current provision level will not need to be increased.
The costs associated with the pension mis-selling review have been met from the inherited estate. Accordingly, these costs have not
been charged to the asset shares used in the determination of policyholder bonus rates. Hence policyholders’ pay-out values have been
unaffected by pension mis-selling.
Notes on the Group financial statements continued

Prudential plc Annual Report 2005 165
H14: Provisions and contingencies continuedIn 1998, Prudential stated that deducting mis-selling costs from the inherited estate would not impact its bonus or investment policy and it
gave an assurance that if this unlikely event were to occur, it would make available support to the fund from shareholder resources for as
long as the situation continued, so as to ensure that policyholders were not disadvantaged. The assurance was designed to protect both
existing policyholders at the date it was announced, and policyholders who subsequently purchased policies while the pension mis-selling
review was continuing.
This review was completed on 30 June 2002. The assurance will continue to apply to any policy in force at 31 December 2003, both for
premiums paid before 1 January 2004, and for subsequent regular premiums (including future fixed, RPI or salary related increases and
Department of Work and Pensions rebate business). The assurance has not applied to new business since 1 January 2004. New business
in this context consists of new policies, new members to existing pension schemes plus regular and single premium top-ups, transfers and
switches to existing arrangements. The maximum amount of capital support available under the terms of the assurance will reduce over
time as claims are paid on the policies covered by it.
The bonus and investment policy for each type of with-profits policy is the same irrespective of whether or not the assurance applies.
Hence removal of the assurance for new business has had no impact on policyholder returns and this is expected to continue for the
foreseeable future.
Mortgage endowment products review
In common with several other UK insurance companies, the Group used to sell low-cost endowment products related to repayment
of residential mortgages. At sale, the initial sum assured is set at a level such that the projected benefits, including an estimate of the
annual bonus receivable over the life of the policy, will equal or exceed the mortgage debt. Because of a decrease in expected future
investment returns since these products were sold, the FSA is concerned that the maturity value of some of these products will be less
than the mortgage debt. The FSA has worked with insurance companies to devise a program whereby the companies write to customers
indicating whether they may have a possible shortfall and outline the actions that the customers can take to prevent this possibility.
The Group is exposed to mortgage endowment products in respect of policies issued by Scottish Amicable Life plc (SAL) and policies
issued by Scottish Amicable Life Assurance Society (SALAS) and transferred into SAIF. At 31 December 2005, provisions of £6 million
(2004: £7 million) in SAL and £50 million (2004: £47 million) in SAIF were held to cover potential compensation in respect of mortgage
endowment product mis-selling claims. As SAIF is a separate sub-fund of the Prudential Assurance long-term business fund, this provision
has no impact on shareholders.
In addition, in the year ended 31 December 2005 Prudential Assurance’s main with-profits fund paid compensation of £24 million
(2004: £16 million) in respect of mortgage endowment products mis-selling claims and at 31 December 2005 held a provision of £63 million
(2004: £61 million) in respect of further compensation. The movement in this provision has no impact on the Group’s profit before tax.
Guaranteed annuities
Prudential Assurance used to sell guaranteed annuity products in the UK and at 31 December 2005 held a provision of £52 million
(2004: £49 million) within the main with-profits fund to honour guarantees on these products. The Group’s main exposure to guaranteed
annuities in the UK is through SAIF and at 31 December 2005 a provision of £619 million (2004: £648 million) was held in SAIF to honour
the guarantees. As SAIF is a separate sub-fund of the Prudential Assurance long-term business fund. The movement in this provision has
no impact on shareholders.
Other matters
Prudential assurance’s inherited estate
The assets of the main with-profits fund within the long-term fund of Prudential Assurance comprise the amounts that the Company
expects to pay out to meet its obligations to existing policyholders and an additional amount used as working capital. The amount payable
over time to policyholders from the with-profits fund is equal to the policyholders’ accumulated asset shares plus any additional payments
that may be required by way of smoothing or to meet guarantees. The balance of the assets of the with-profits fund is called the ‘inherited
estate’ and has accumulated over many years from various sources.
The inherited estate represents the major part of the working capital of Prudential Assurance’s long-term fund. This enables the Company
to support with-profits business by providing the benefits associated with smoothing and guarantees, by providing investment flexibility
for the fund’s assets, by meeting the regulatory capital requirements that demonstrate solvency and by absorbing the costs of significant
events or fundamental changes in its long-term business without affecting the bonus and investment policies. The size of the inherited
estate fluctuates from year to year depending on the investment return and the extent to which it has been required to meet smoothing
costs, guarantees and other events.
The Company believes that it would be beneficial if there were greater clarity as to the status of the inherited estate. In due course, and
only after discussion with the FSA, the Company may therefore take steps to achieve that clarity, whether through guidance from the
Court or otherwise. In any event the Company expects that the entire inherited estate will need to be retained within the long-term fund
for the foreseeable future to provide working capital and so it has not considered any distribution of the inherited estate to policyholders
and shareholders.

166 Prudential plc Annual Report 2005
H14: Provisions and contingencies continuedSupport for long-term business funds by shareholders’ funds
As a proprietary insurance company, the Group is liable to meet its obligations to policyholders even if the assets of the long-term funds
are insufficient to do so. The assets, represented by the ‘unallocated surplus of with-profits funds’, in excess of amounts expected to be
paid for future terminal bonuses and related shareholder transfers (the excess assets) in the long-term funds could be materially depleted
over time by, for example, a significant or sustained equity market downturn, costs of significant fundamental strategic change or a material
increase in the pension mis-selling provision. In the unlikely circumstance that the depletion of the excess assets within the long-term fund
was such that the Group’s ability to satisfy policyholders’ reasonable expectations was adversely affected, it might become necessary to
restrict the annual distribution to shareholders or to contribute shareholders’ funds to the long-term funds to provide financial support.
In 1997, the business of SALAS, a mutual society, was transferred to Prudential Assurance. In effecting the transfer, a separate sub-fund,
SAIF, was established within Prudential Assurance’s long-term business fund. This sub-fund contains all the with-profits business and all
other pension business that was transferred. No new business has been or will be written in the sub-fund and the sub-fund is managed
to ensure that all the invested assets are distributed to SAIF policyholders over the lifetime of SAIF policies. With the exception of certain
amounts in respect of the unitised with-profits life business, all future earnings arising in SAIF are retained for SAIF policyholders. Any
excess (deficiency) of revenue over expense within SAIF during a period is offset by a transfer to (from) the SAIF unallocated surplus.
Shareholders have no interest in the profits of SAIF but are entitled to the investment management fees paid on this business. With
the exception of certain guaranteed annuity products mentioned earlier in this note, and certain products which include a minimum
guaranteed rate of accumulation, the majority of SAIF with-profits policies do not guarantee minimum rates of return to policyholders.
Should the assets of SAIF be inadequate to meet the guaranteed benefit obligations to the policyholders of SAIF, the Prudential Assurance
long-term fund would be liable to cover any such deficiency. Due to the quality and diversity of the assets in SAIF and the ability of SAIF
to revise guaranteed benefits in the event of an asset shortfall, the directors believe that the probability of either the Prudential Assurance
long-term fund or the Group’s shareholders’ funds having to contribute to SAIF is remote.
Guarantees and commitments
Guarantee funds in both the UK and the US provide for payments to be made to policyholders on behalf of insolvent life insurance
companies. These guarantee funds are financed by payments assessed on solvent insurance companies based on location, volume, and
types of business. The Group estimated its reserve for future guarantee fund assessments for JNL to be £11 million at 31 December 2005
(2004: £10 million). Similar assessments for the UK businesses were not significant. The directors believe that the reserve is adequate for
all anticipated payments for known insolvencies.
JNL has commitments for future payments related to equity index call options totalling £3 million at 31 December 2005 (2004: £8 million).
The commitments were entered into in the normal course of business to hedge obligations associated with the issuance of equity index-
linked immediate and deferred annuities and fall due for payment over the next two years.
At 31 December 2005, JNL has unfunded commitments of £227 million (2004: £157 million) related to its investments in limited partnerships
and of £104 million (2004: £101 million) related to commercial mortgage loans. These commitments were entered into in the normal course
of business and the directors do not expect a material adverse impact on the operations to arise from them.
The Group has provided, from time to time, other guarantees and commitments to third parties entered into in the normal course of
business but the directors do not consider that the amounts involved are significant.
H15: Other liabilities2005 2004
£m £m
Creditors arising from direct insurance and reinsurance operations 474 401
Interest payable 61 67
Derivative liabilities 851 73
Other items 383 634
Total 1,769 1,175
Notes on the Group financial statements continued

Prudential plc Annual Report 2005 167
I: Other notes
I1: Staff and pension plansStaff and employment costs
The average number of staff employed by the Group during the year were:
2005 2004
Business operations:
UK operations 10,708 10,849
US operations 2,588 2,589
Asian operations 9,652 8,277
Venture investment subsidiaries of the PAC with-profits fund 8,713 18,735
Total 31,661 40,450
The costs of employment were:2005 2004
£m £m
Business operations:
Wages and salaries 799 762
Social security costs 64 62
Other pension costs (see below) 77 63
Pension actuarial (gains) losses (credited) charged to income statement (as shown on page 172) (155) 46
(78) 109
Venture investment subsidiaries of the PAC with-profits fund (see below) 206 253
Total 991 1,186
Other pension costs comprises £54 million (2004: £45 million) relating to defined benefit schemes and £23 million (2004: £18 million)
relating to defined contribution schemes. Of the defined contribution scheme costs £13 million (2004: £12 million) related to overseas
defined contribution schemes.
Of the £206 million (2004: £253 million) costs of employment for venture investment subsidiaries, £169 million (2004: £219 million) relates
to wages and salaries, £31 million (2004: £25 million) relates to social security costs and £6 million (2004: £9 million) relates to pension costs.
Pension plans
Defined benefit plans
Background and corporate governance
The Group business operations operate a number of pension schemes. The specific features of these plans vary in accordance with the
regulations of the country in which the employees are located, although they are, in general, funded wholly by the Group and based
either on a cash balance formula or on years of service and salary earned in the last year or years of employment. The largest defined
benefit scheme is the principal UK scheme, namely the Prudential Staff Pension Scheme (PSPS). 90 per cent (2004: 90 per cent) of the
liabilities of the Group defined benefit schemes are accounted for within PSPS.
Defined benefit schemes in the UK are generally required to be subject to a full actuarial valuation every three years to assess the appropriate
level of funding for schemes having regard to their commitments. These valuations include assessments of the likely rate of return on the
assets held within the separate trustee administered funds. PSPS was last actuarially valued on 5 April 2002 and this valuation demonstrated
the scheme to be 110 per cent funded with an excess of actuarially determined assets over liabilities of 10 per cent representing a fund surplus
of £376 million. As a result, no change in employers’ contributions from the current 12.5 per cent of salaries has been required until now.
The PSPS valuation as at 5 April 2005 is currently being finalised and it is expected to show a small deficit, by comparison with scheme
liabilities on the actuarial basis. Following discussions with the Trustee, the Company expects that for 2006 and future years the employers’
contributions for ongoing service of current employees will approximately double to some £35 million to £40 million per annum based on
current levels of active members of the scheme. In addition, deficit funding amounts designed to eliminate the actuarial deficit over a 10-year
period will be made of some £35 million per annum. These amounts compare to current total contributions in 2005 of £19 million.
The discussions with the Scheme Trustee have also led to an altered expectation as to future discretionary increases. Previously, it had
been the custom to award discretionary increases by reference to inflation levels. It is now intended that discretionary increase will in
most circumstances not exceed 2.5 per cent.
Finally, a revised allocation of the deficit between the PAC with-profits fund and shareholder-backed operations has been applied in
2005. Previously the deficit of the PSPS had been attributed between the PAC with-profits fund and shareholders in the ratio of 80/20.
Following extensive analysis of the source of contributions paid into the scheme over the last 10 years the allocation has been revised to
70/30, thus increasing the shareholders’ proportion. The effects of these changes and other movements on the financial positions of the
Group’s defined benefits schemes are explained below.

168 Prudential plc Annual Report 2005
I1: Staff and pension plans continuedThe Group also operates two smaller defined benefit schemes for UK employees in respect of Scottish Amicable and M&G activities. For
all three schemes the projected unit method was used for the most recent full actuarial valuations. There is also a small defined benefit
scheme in Taiwan.
The rules of the Group’s largest pension arrangement, the defined benefit section of PSPS, a final salary scheme, specify that, in exercising
its investment powers, the Trustee’s objective is to achieve the best overall investment return consistent with the security of the assets of
the scheme. In doing this, regard is had to the nature and duration of the scheme’s liabilities. The Trustee sets the benchmark for the asset
mix, following analysis of the liabilities by the Scheme’s Actuary and, having taken advice from the Investment Managers, then selects
benchmark indices for each asset type in order to measure investment performance against a benchmark return.
The Trustee reviews strategy, the asset mix benchmark and the Investment Managers’ objectives every three years, to coincide with the
Actuarial Valuation, or earlier if the Scheme Actuary recommends. Interim reviews are conducted annually based on changing economic
circumstances and financial market levels.
The Trustee sets the general investment policy and specifies any restrictions on types of investment and the degrees of divergence
permitted from the benchmark, but delegates the responsibility for selection and realisation of specific investments to the Investment
Managers. In carrying out this responsibility, the Investment Managers are required by the Pensions Act 1995 to have regard to the need
for diversification and suitability of investments. Subject to a number of restrictions contained within the relevant investment management
agreements, the Investment Managers are authorised to invest in any class of investment asset. However, the Investment Managers will
not invest in any new class of investment asset without prior consultation with the Trustee.
The Trustee consults the Principal Employer, the Prudential Assurance Company, on these investment principles, but the ultimate
responsibility for the investment of the assets of the scheme lies with the Trustee.
The investment policies and strategies for the other two UK defined benefit schemes, the M&G Group Pension Scheme and the Scottish
Amicable Staff Pension Scheme, which are both final salary schemes, follow similar principles, but have different target allocations,
reflecting the particular requirements of the schemes.
Assumptions
The calculations are based on current actuarially calculated mortality estimates with a specific allowance made for future improvements in
mortality, which is broadly in line with that adopted for the 92 series of mortality tables prepared by the Continuous Mortality Investigation
Bureau of the Institute and Faculty of Actuaries.
The actuarial assumptions used in determining benefit obligations and the net periodic benefit costs for the years ended 31 December
were as follows:2005 2004
% %
Discount rate 4.8 5.3
Rate of increase in salaries 4.8 4.8
Rate of increase of pensions in payment for inflation:
Guaranteed (maximum 5%) 2.8 2.8
Guaranteed (maximum 2.5%)* 2.5 2.8
Discretionary* 2.5 2.8
Expected returns on plan assets 6.1 6.8
*The rates of 2.5 per cent shown are those for PSPS. Assumed rates of increase of pensions in payment for inflation for all other schemes remains at 2.8 per cent in 2005.
The change of assumption for discretionary increases follows discussion with the PSPS trustee. For the purpose of future discretionary
awards, it is assumed that a cap of a 2.5 per cent rate of increase will apply rather than, as previously applied, the assumed long-term
inflation rate.
Using external actuarial advice provided by Watson Wyatt Partners for the valuation of PSPS and by Aon Limited for the M&G scheme,
and internal advice for the Scottish Amicable scheme, the most recent full valuations have been updated to 31 December 2005, applying
the principles prescribed by IAS 19.
Notes on the Group financial statements continued

Prudential plc Annual Report 2005 169
I1: Staff and pension plans continuedSummary financial position
The Group liability in respect of defined benefit pension schemes is as follows:2005 2004
£m £m
Economic position:
Deficits, gross of deferred tax, based on scheme assets held, including investments in Prudential insurance policies:
Attributable to the PAC with-profits fund (ie absorbed by the liability for unallocated surplus) (329) (525)
Attributable to shareholder-financed operations (ie to shareholders’ equity) (214) (175)
Economic deficit (543) (700)
Add back: investments in Prudential insurance policies (eliminated on consolidation against insurance liabilities) (253) (125)
Provision included in balance sheet under IAS 19 (796) (825)
The following disclosures explain the economic position and IAS 19 basis of accounting after eliminating investment in Prudential
insurance policies on consolidation.
Group economic financial position
In assessing the underlying economic position of the Group in respect of the defined benefit pension schemes, two factors need to
be taken into account. These are:
(i) The deficits on the PSPS and Scottish Amicable schemes are partially attributable to the PAC with-profits fund; and
(ii) The IAS 19 basis assets of the PSPS and M&G schemes, as consolidated into the Group balance sheet, exclude investments in
Prudential insurance policies.
The M&G pension scheme has invested £147 million at 31 December 2005 (2004: £125 million) in Prudential insurance policies. Additionally,
the PSPS scheme has invested £106 million at 31 December 2005 (2004: £nil) in Prudential insurance policies. As required by IFRS, this
amount of pension asset is eliminated against the policyholder liability and hence, for the purposes of preparing the consolidated balance
sheet, the net pension liability is £253 million (2004: £125 million) greater than the ‘economic basis’ deficit of £543 million (2004: £700 million).
On the ‘economic basis’, after including investments in Prudential insurance policies as scheme assets, the assets of the schemes at
31 December were:2005 2004
£m £m
Equities 2,543 2,566
Bonds 1,663 1,055
Properties 590 533
Other 79 63
Total value of assets 4,875 4,217
The present value of the liabilities of the four schemes at 31 December 2005 was £5,418 million (2004: £4,917 million). The resulting
scheme deficits arising from the excess of liabilities over assets at 31 December 2005 comprised £329 million (2004: £525 million)
attributable to the PAC with-profits fund and £214 million (2004: £175 million) attributable to shareholder operations.
The movements in the deficit on the ‘economic basis’ between scheme assets and liabilities were:2005 2004
£m £m
Current service cost (65) (69)
Contributions 29 30
Other finance income 22 32
Actuarial gains (losses) 171 (43)
Net decrease (increase) 157 (50)

170 Prudential plc Annual Report 2005
I1: Staff and pension plans continuedEstimated pension scheme liability attributable to shareholder operations
Movements on the pension scheme deficits (determined on the ‘economic basis’), to the extent attributable to shareholder operations are
as follows:Actuarial and other
Charge to gains and lossesoperating
results Actuarial Charge for(based on gains (losses) revised
longer-term attributable estimate of Contributionsinvestment to PSPS deficit paid by
At beginning returns) shareholders allocation shareholder At endof year (note i) (note ii) (note ii) operations of year
2005 £m £m £m £m £m £m
Gross of tax deficit (175) (21) 32 (63) 13 (214)
Related deferred tax 49 6 (9) 19 (4) 61
Net of tax deficit (126) (15) 23 (44) 9 (153)
2004
Gross of tax deficit (163) (16) (7) – 11 (175)
Related deferred tax 45 4 3 – (3) 49
Net of tax deficit (118) (12) (4) – 8 (126
Notes(i) Charge to operating results (based on longer-term investment returns)This comprises:
2005 2004£m £m
Current service cost (65) (69)Finance income (expense):
Interest on pension scheme liabilities (257) (245)Expected return on pension scheme assets 279 277
22 32
Total charge net of finance income (43) (37)Less: amount attributable to PAC with-profits fund 22 21
Charge to operating results, based on longer-term investment returns, attributable to shareholders (21) (16)
(ii) Actuarial and other gains and lossesThis comprises:
2005 2004£m £m
Actual less expected return on pension scheme assets 544 115Experience gains (losses) on scheme liabilities 1 (17)Changes in assumptions underlying the present value of scheme liabilities (374) (141)
Total actuarial and other gains (losses) 171 (43)Less: amount attributable to PAC with-profits fund (139) 36
Actuarial gains (losses) attributable to shareholders 32 (7)Add: additional loss on change of estimate of allocation of opening deficit between shareholder operations and the PAC with-profits fund (63) –
Charge for actuarial and other gains and losses attributable to shareholders, excluded from operating results based on longer-term
investment returns, but included in profit before tax attributable to shareholders (31) (7)
Since shareholder profits in respect of the PAC with-profits funds are a function of the actuarially determined surplus for distribution, the
overall income statement result is not directly affected by the level of pension cost or other expenses attributable to the fund.
Amounts attributed to the PAC with-profits funds for 2005 reflect the current estimate of 70 per cent for the PSPS scheme and 50 per cent
for the Scottish Amicable scheme. For 2004, the amounts attributed reflect the then current estimates of 80 per cent and 50 per cent,
respectively. The additional pre-tax loss to shareholder operations of £63 million reflects the changed estimate of the life fund share for
the PSPS scheme.
Included within the charge for 2005 of £374 million for changes in assumptions is a credit for past service costs of £115 million for a
reduction in the assumed level of discretionary increase for future pensions in payment for PSPS.
Notes on the Group financial statements continued

Prudential plc Annual Report 2005 171
I1: Staff and pension plans continuedEstimated pension scheme deficits attributable to PAC with-profits fund
Movements on the pension scheme deficits (determined on the ‘economic basis’ under which PSPS scheme assets include investments in
Prudential insurance policies) are as follows:Actuarial and other
gains and losses
Credit forService revised
cost less Actuarial estimate ofnet finance gains PSPS deficit Contributions
income (losses) allocation paid by PACAt beginning (note i (note ii (note ii with-profits At end
of year above) above) above) fund of year2005 £m £m £m £m £m £m
Gross of tax deficit (525) (22) 139 63 16 (329)
Related deferred tax 53 2 (14) (6) (2) 33
Net of tax deficit (472) (20) 125 57 14 (296)
2004
Gross of tax deficit (487) (21) (36) – 19 (525)
Related deferred tax 49 2 4 – (2) 53
Net of tax deficit (438) (19) (32) – 17 (472)
The charges and credits for service cost, net finance income, and actuarial and other gains and losses are included within the income
statement but taken account of in determining the charge in the income statement for the transfer to the liability for unallocated surplus
of with-profits funds.
Reconciliation to IAS 19 basis financial position
The change in the present value of the benefit obligation and the change in fair value of the assets for the total of the PSPS, Scottish
Amicable, M&G and Taiwan schemes over the period were as follows:IAS 19 basis:
change inIAS 19 basis: Investments present Economic
change in in Prudential Economic value basis:fair value of insurance basis: of benefit netplan assets policies total assets obligation obligation
2005 £m £m £m £m £m
Fair value of plan assets, beginning of year 4,092 125 4,217 4,217
Present value of benefit obligation, beginning of year (4,917) (4,917)
4,092 125 4,217 (4,917) (700)
Less: PSPS scheme plan assets used to acquire Prudential insurance policy (99) 99 0 0
Service cost – current charge only (65) (65)
Interest cost (257) (257)
Expected return on plan assets 268 11 279 279
Employee contributions 0 1 1 (1) 0
Employer contributions 25 4 29 29
Actuarial and other gains* 528 16 544 (373) 171
Benefit payments (192) (3) (195) 195 0
Fair value of plan assets, end of year 4,622 253 4,875
Present value of benefit obligation, end of year (5,418)
Economic basis deficit (543)
*Including £115 million credit for past service costs as described above.

172 Prudential plc Annual Report 2005
I1: Staff and pension plans continuedIAS 19 basis:
change inIAS 19 basis: Investments present Economic
change in in Prudential Economic value basis:fair value of insurance basis: of benefit netplan assets policies total assets obligation obligation
2004 £m £m £m £m £m
Fair value of plan assets, beginning of year 3,986 3,986 3,986
Present value of benefit obligation, beginning of year (4,636) (4,636)
3,986 0 3,986 (4,636) (650)
Less: M&G scheme plan assets used to acquire Prudential insurance policy* (112) 112 0 0
Service cost (69) (69)
Interest cost (245) (245)
Expected return on plan assets 269 8 277 277
Employee contributions 0 1 1 (1) 0
Employer contributions 26 4 30 30
Actuarial gains (losses) 112 3 115 (158) (43)
Benefit payments (189) (3) (192) 192 0
Fair value of plan assets, end of year 4,092 125 4,217
Present value of benefit obligation, end of year (4,917)
Economic basis deficit (700)
*The M&G pension scheme assets are wholly invested in Prudential insurance policies. For IFRS accounting purposes, the M&G scheme is in effect unfunded.
Group IAS 19 basis financial position
The IAS 19 basis net pensions deficit can be summarised as follows:
2005 2004£m £m
Fair value of plan assets, end of year 4,622 4,092
Present value of funded benefit obligation (5,228) (4,777)
Funded status (606) (685)
Present value of unfunded obligations (M&G scheme)* (190) (140)
Provision recognised in the balance sheet (796) (825)
*The M&G pension scheme assets are invested in Prudential insurance policies. For IFRS accounting purposes, the M&G scheme is in effect unfunded. Please see above for more details.
2005 2004£m £m
Components of net periodic pension cost
Current service cost (65) (69)
Interest cost (257) (245)
Expected return on assets – economic basis 279 277
Less: expected return on investments of scheme assets in Prudential insurance policies (11) (8)
Expected return on assets – IAS 19 basis 268 269
Actuarial gains (losses) – economic basis 171 (43)
Less: actuarial gains on investments of scheme assets in Prudential insurance policies (16) (3)
Actuarial gains (losses) – IAS 19 basis 155 (46)
Net periodic pension credit (cost) (included within acquisition and other
operating expenditure in the income statement) 101 (91)
Notes on the Group financial statements continued

Prudential plc Annual Report 2005 173
I1: Staff and pension plans continuedThe long-term expected rate of return has been taken to be the weighted average (by market value) of the long-term expected rates of
return on each major asset class shown below:2005 2005 2004 2004
£m % £m %
Plan assets (IAS 19 basis)
Equity 2,376 51 2,516 61
Bonds 1,593 35 993 24
Real estate 575 12 520 13
Cash 78 2 63 2
Total 4,622 100 4,092 100
2005 2004% %
Long-term expected rate of return
Equity 7.1 7.5
Bonds 4.5 5.0
Real estate 6.4 6.8
Cash 4.5 4.75
Weighted average long-term expected rate of return 6.1 6.75
The actual return on plan assets was £796 million (2004: £381 million) on an IAS 19 basis.
None of the scheme assets included shares in Prudential plc or property occupied by the Prudential Group.2005 2004
£m £m
Fair value of plan assets, end of year (IAS 19 basis) 4,622 4,092
Present value of the benefit obligation, end of year (5,418) (4,917)
Plan assets in deficit of benefit obligation (796) (825)
Experience adjustments on plan liabilities 1 (17)
Percentage of plan liabilities at 31 December (0.02)% 0.35%
Experience adjustments on plan assets (IAS 19 basis) 528 112
Percentage of plan assets at 31 December 11.42% 2.74%
Total employer contributions expected to be paid into the Group defined benefit schemes for the year ending 31 December 2006
amounts to £85 million (2004: £31 million).
Other pension plans
The Group operates various defined contribution pension schemes including schemes in JNL, Egg and Asia. As noted earlier, the cost
of the Group’s contributions to these schemes in 2005 was £23 million (2004: £18 million).
I2: Share-based payments(a) Relating to Prudential plc shares
The Group maintains eight main share award and share option plans relating to Prudential plc shares, which are described below.
The Restricted Share Plan (RSP) is the Group’s long-term incentive plan for executive directors and other senior executives designed to
provide rewards linked to the returns to shareholders. Each year participants are granted a conditional option to receive a number of shares.
There is a deferment period, currently three years, at the end of which the award vests to an extent that depends on the performance of
the Group’s shares including notional reinvested dividends and on the Group’s underlying financial performance. After vesting, the award
may then be exercised at zero cost at any time, subject to closed period rules, in the balance of a 10-year period. Shares are purchased
in the open market by a trust for the benefit of qualifying employees. Currently, the trust holds at least the maximum number of shares
conditionally awarded and not yet forfeited or exercised. The RSP replaced the Executive Share Option Scheme in 1995 and all options
under this prior plan had been exercised at 31 December 2005.

174 Prudential plc Annual Report 2005
I2: Share-based payments continuedNo rights are granted if the Company’s total shareholder return (TSR) performance as ranked against the comparator group is below
50th percentile. For performance at 50th percentile, an award of 25 per cent of the maximum award is made. The maximum grant is made
only if the TSR ranking of the Company is 20th percentile or above. Between these points, the size of the grant made is calculated on a
straight-line sliding scale. This performance measure was chosen when the RSP was introduced as it reflected a combination of market
practice, an assessment of Prudential’s main competitors and the focus of UK investors at that time. In normal circumstances, directors
may take up their right to receive shares at any time during the following seven years.
The Savings-Related Share Option Scheme is designed to foster share ownership among UK and certain non-UK employees. Permanent
employees are eligible for this plan if they have been employed by the Group for the previous six months. At the outset, participants
choose an option period (three, five or seven years, or a combination of these periods) and the amount of monthly contributions to be
made from their earnings during the option period, which determines the number of options granted. The option price is fixed at the
start and is based on a discount of 20 per cent to the market price. Participants may exercise their options within six months of the end
of the option period. If options are not exercised, participants are entitled to receive a refund of their cash contributions plus interest.
The Prudential International Savings-Related Share Option Scheme operates on a similar basis to the UK Savings-Related Share Option
Scheme, for employees in Hong Kong, Malaysia, Singapore, Taiwan, India and Korea.
The International Savings-Related Share Option Scheme for Non-Employees also operates on a similar basis to the UK Savings-Related
Share Option Scheme, for agents in Hong Kong.
No options may be granted under the three savings-related schemes described above if such grant would cause the number of shares
which have been issued, or which remain issuable pursuant to options granted in the preceding 10 years under the scheme and other
share option schemes operated by the Company, or which have been issued under any other share incentive scheme of the Company,
to exceed 10 per cent of the Company’s issued ordinary share capital at the proposed date of grant.
The Prudential UK Share Incentive Plan (SIP) is also designed to foster share ownership amongst staff in designated UK businesses.
It enables employees to buy shares on a tax efficient basis. For every four partnership shares bought, an additional matching share is
granted, purchased in the open market. Participants have voting rights and are entitled to dividend payments which are reinvested in
the SIP. Partnership shares may be withdrawn from the scheme at any time while matching shares may only be withdrawn five years after
their award date.
JNL operates a performance-related share award which, subject to the prior approval of the Jackson National Life Remuneration Committee,
may grant share awards to eligible employees in the form of a contingent right to receive shares or a conditional allocation of shares.
These share awards have vesting periods of four years and are at nil cost to the employee. The employee does not have any beneficial
ownership of the shares and, accordingly, does not have any right to dividends or voting rights attaching to the shares. Only issued shares
purchased from the open market are used for the performance share award and there is no limit on the value of shares which may be
granted to a participant in any year or over the life of the plan, which is usually no longer than 10 years.
The Annual Incentive Plan is designed so that a portion of any overall award may be made in the form of a deferred share award. A
deferred share award is awarded to board members in respect of any overall annual incentive award above 50 per cent of salary, and will
represent the element of the bonus above 50 per cent of salary. The award is restricted for three years before it can be released, subject to
close periods, to the participant who must not be under a period of notice at the time and must still be in employment of Prudential. The
shares are held in the employee share trust and, shares equivalent to dividends otherwise payable will accumulate up to the release date.
The Share Participation Plan was designed to encourage share ownership amongst senior executives and to provide rewards based upon
various performance factors of the Group. Each year, participants were offered the choice of a cash award, a matching share award if
cash or shares to the value of the cash award were lodged, or a combination of 50 per cent of each. Share awards vested after five years
for executive directors of Prudential plc and three years (formerly five years) for all other eligible employees and were transferred to the
participants at no additional cost. Ordinary shares for share awards were purchased in the open market by a trust, which held them during
the vesting period for the benefit of qualifying employees. At 31 December 2005, all outstanding shares in this plan have been paid for by
employees and are registered in the names of the participants. No new shares have been granted in this scheme since 1999.
In addition, there are other share awards which include the 1,000 Day Long Term Incentive Plan (LTIP) and other arrangements.
The 1,000 Day LTIP plan is a UK insurance operations performance-based plan in which the UK Remuneration Committee may, at any
time up to 5 October 2005, select employees at its absolute discretion, for participation in the plan. The performance period was 1,000
days and, based on the final performance level being at, or above, the threshold level, the committee shall grant participants 10 per cent
of the allocated award in 2005, 20 per cent in 2006 and the remaining 70 per cent in 2007. There are no beneficial interests, or any rights
to dividends until such time as the awards are released, at nil cost, to participants.
The other arrangements relate to various awards that have been made without performance conditions to individual employees, typically
in order to secure their appointment or ensure retention.
Notes on the Group financial statements continued

Prudential plc Annual Report 2005 175
I2: Share-based payments continuedMovements in share options outstanding under the Group’s share-based compensation plans relating to Prudential plc shares during 2005
and 2004 were as follows:2005 2004
Weighted Weightedaverage average
Number of exercise Number of exerciseoptions price options price
Options outstanding (including conditional options) (millions) £ (millions) £
Beginning of year: 18.4 2.21 18.4 2.76
Granted 3.7 1.83 4.1 1.37
Exercised (1.1) 2.78 (0.9) 3.19
Forfeited (1.9) 0.81 (1.9) 3.52
Expired (1.9) 2.21 (2.6) 3.37
Adjustment in respect of Rights Issue – – 1.3 2.93
End of year 17.2 2.23 18.4 2.21
Options immediately exercisable, end of year 0.4 3.30 0.5 3.19
The weighted average share price of Prudential plc for the year ended 31 December 2005 was £5.01 compared to £4.51 for the year
ended 31 December 2004.
Movements in share awards outstanding under the Group’s share-based compensation plans relating to Prudential plc shares at
31 December 2005 and 2004 were as follows:2005 2004
Number of Number ofawards awards
Awards outstanding (millions) (millions)
Beginning of year: 2.4 1.4
Granted 2.8 1.2
Exercised (0.1) (0.1)
Forfeited (0.1) (0.2)
Expired (0.1) –
Adjustment in respect of Rights Issue – 0.1
End of year 4.9 2.4
The following table provides a summary of the range of exercise prices for Prudential plc options (including conditional options)
outstanding at 31 December 2005.Outstanding Exercisable
Weightedaverage Weighted Weighted
remaining average averageNumber contractual exercise Number exercise
outstanding life prices exercisable pricesRange of exercise prices (millions) (years) £ (millions) £
Between £0 and £1 4.7 8.3 – – –
Between £1 and £2 – – – – –
Between £2 and £3 8.0 1.3 2.66 – –
Between £3 and £4 3.5 2.1 3.53 0.4 3.29
Between £4 and £5 0.8 3.0 4.07 – –
Between £5 and £6 0.2 0.7 5.63 0.0 5.39
Between £6 and £7 0.0 0.4 6.56 0.0 6.66
Between £7 and £8 0.0 1.1 7.15 0.0 7.15
17.2 3.5 2.23 0.4 3.30

176 Prudential plc Annual Report 2005
I2: Share-based payments continuedThe following table provides a summary of the range of exercise prices for Prudential plc options (including conditional options)
outstanding at 31 December 2004.Outstanding Exercisable
Weightedaverage Weighted Weighted
remaining average averageNumber contractual exercise Number exercise
outstanding life prices exercisable pricesRange of exercise prices (millions) (years) £ (millions) £
Between £0 and £1 5.1 8.4 0.00 0.2 0.00
Between £1 and £2 – – – – –
Between £2 and £3 8.5 2.3 2.66 0.0 3.00
Between £3 and £4 3.9 2.4 3.41 – –
Between £4 and £5 0.2 0.0 4.19 0.2 4.19
Between £5 and £6 0.5 1.3 5.51 0.0 5.87
Between £6 and £7 0.1 0.6 6.66 0.1 6.58
Between £7 and £8 0.1 0.9 7.23 0.0 7.68
Between £8 and £9 – – – – –
Between £9 and £10 0.0 3.7 9.46 0.0 9.46
18.4 4.0 2.21 0.5 3.19
The weighted average fair values of Prudential plc options and awards granted during the period are as follows:
2005 2004Weighted average fair value Weighted average fair value
Other Other RSP options Awards RSP options Awards
£ £ £ £ £ £
2.96 1.82 4.59 3.86 1.57 3.37
The fair value amounts relating to RSP options and other options above were determined using the Black-Scholes and the Monte Carlo
option-pricing models using the following assumptions:
2005 2004
Other OtherRSP options RSP options
Dividend yield (%) 3.19 3.19 3.82 3.82
Expected volatility (%) 42.93 40.38 47.23 43.74
Risk-free interest rate (%) 4.65 4.41 4.68 4.73
Expected option life (years) 3.00 3.62 3.00 3.78
Weighted average exercise price (£) – 3.97 – 3.62
Weighted average share price (£) 5.01 5.12 4.53 4.48
Under IFRS, compensation costs for all share-based compensation plans are determined using the Black-Scholes model and the Monte
Carlo model. Share options and awards are valued using the share price at the date of grant. The compensation costs for all awards and
options are recognised in net income over the plans’ respective vesting periods. The Group uses the Black-Scholes model to value all
options other than the RSP. For the RSP (nil cost option), the Group uses a Monte Carlo model in order to allow for the impact of the
TSR performance conditions. These models are used to calculate fair values for share options and awards at the grant date based on the
quoted market price of the stock at the measurement date, the amount, if any, that the employees are required to pay, the dividend yield,
expected volatility, risk-free interest rates and exercise prices.
The expected volatility is measured at the standard deviation of expected share price returns based on statistical analysis of daily share
prices over a period up to the grant date equal to the expected life of options. Risk-free interest rates are UK gilt rates with projections
for three, five and seven year terms to match corresponding vesting periods. Dividend yield is determined as the average yield over the
year of grant and expected dividends are not incorporated into the measurement of fair value. Additionally, for the RSP, volatility and
correlation of the comparator group with the Group are required. These assumptions are based on the TSR of the comparators over a
period up to the grant date equal to the performance period. For grants in 2005, an average comparator volatility of 31 per cent and an
average correllation of comparators of 33 per cent were used.
When options are granted or awards made to employees, an estimate is made of what percentage is more than likely to vest, be forfeited,
lapse or cancelled based on historical information. Based on these estimates, compensation expense to be accrued at that date is calculated
and amortised over the vesting period. For early exercises of options or release of awards due to redundancy, death or resignation, the
compensation expense is immediately recognised and for forfeitures due to employees leaving the Group, any previously recognised
expense is reversed. However, if an employee loses their award because of the Group’s failure to meet the performance criteria, previously
recognised expense is not reversed.
Notes on the Group financial statements continued

Prudential plc Annual Report 2005 177
I2: Share-based payments continuedDuring the year, the Group granted share options to certain non-employee independent financial advisors. Those options were measured
using the Black-Scholes option pricing model with assumptions consistent with those of other share options. These transactions were
measured using an option model because the Group does not receive a separate and measurable benefit from those non-employees in
exchange for the options granted. As such, the fair value of the options themselves is more readily determinable than the services received
in return.
(b) Relating to Egg plc shares
In 2005 and 2004, the Group maintained three main share award and share option plans relating to Egg plc shares, which are described
below. As a result of the offer by Prudential to acquire the minority shareholding in Egg (note I8), executive share options are exercisable
for six months from 19 December 2005, although this period may be shortened should Prudential become entitled to make a compulsory
acquisition of the remaining Egg shares. Also as a result of the offer, awards under the RSP were assessed against the performance
conditions. None of the awards met the performance conditions and they have therefore lapsed in February 2006 following consideration
of the performance measurement results by the Remuneration Committee.
Egg made awards of shares at no cost to eligible employees selected by the Remuneration Committee under the plan. All Egg’s directors
and employees, including employees of its subsidiaries, were eligible to participate, subject to the discretion of the Remuneration
Committee. It was, however, intended that participation would, in practice, be restricted to selected individuals in key positions.
Employees within two years of their anticipated retirement date were not eligible to participate, except in circumstances which the
Remuneration Committee considered to be exceptional.
Egg established a discretionary employee benefit trust, the Egg Employee Trust, by a trust deed dated 26 April 2000 between Egg and
Mourant & Co. Trustees Limited. At 31 December 2005, the trust held 3.4 million ordinary shares (2004: 3.4 million), with a market value
of £4.2 million (2004: £3.4 million) which are intended to be used principally for delivery of shares under the employee incentive plans
and a nominal value of £1.7 million (2004: £1.7 million). All of the remaining 3.4 million shares held by the trust were purchased on the
open market at a cost of £4.5 million.
Egg made the vesting of awards subject to the satisfaction of performance conditions from January 2004 onwards. Previously the
awards have been conditional on service completed. The arrangements for the distribution to employees of shares held in trust and for
entitlement to dividend depend on the particulars of each award. Shares held in trust are conditionally gifted to employees. The costs
of share awards are charged to the income statement evenly over the period of service for which awards are made for schemes granted
after 7 November 2002.
Egg also operated a sharesave scheme, which was an Inland Revenue approved all-employee Save as You Earn scheme. Under this
scheme, employees entered into either three or five year contracts, at the end of which time they will be entitled to exercise their options
and purchase shares at an exercise price fixed at a 20 per cent discount to the share price at the date of grant. Employees have six months
after the contract matures in which to exercise the options. These options will continue in force until their normal maturity dates.
Prior to the implementation of the RSP schemes, Egg granted options to employees under Inland Revenue approved and unapproved
share option schemes.
Analysis of the movements in the number of shares and weighted average exercise price (with the exception of the Egg RSP where the
exercise price is £nil) of options are set out below:
Egg RSP awards made prior to 7 November 2002.Number(millions)
2005 2004
Outstanding at beginning of year 0.8 3.9
Forfeited (0.7) (0.1)
Exercised (0.1) (3.0)
Outstanding and exercisable at the end of year 0.0 0.8
Egg RSP awards made after 7 November 2002.Number(millions)
2005 2004
Outstanding at beginning of year 6.2 3.7
Granted 1.7 3.1
Forfeited (1.5) –
Exercised (0.3) –
Expired – (0.6)
Outstanding and exercisable at the end of year 6.1 6.2

178 Prudential plc Annual Report 2005
I2: Share-based payments continuedEgg sharesave scheme awards made prior to 7 November 2002.
3 Year Employee Sharesave Scheme 5 Year Employee Sharesave Scheme
Number Weighted average Number Weighted average(millions) exercise price £ (millions) exercise price £
2005 2004 2005 2004 2005 2004 2005 2004
Outstanding at beginning of year 0.7 1.5 1.16 1.19 0.4 0.7 1.20 1.19
Forfeited (0.2) (0.7) 1.20 1.22 (0.1) (0.3) 1.19 1.18
Exercised (0.0) (0.1) 1.15 1.21 – (0.0) – 1.23
Outstanding and exercisable at the end of year 0.5 0.7 1.15 1.16 0.3 0.4 1.20 1.20
Egg sharesave scheme awards made after 7 November 2002.
3 Year Employee Sharesave Scheme 5 Year Employee Sharesave Scheme
Number Weighted average Number Weighted average(millions) exercise price £ (millions) exercise price £
2005 2004 2005 2004 2005 2004 2005 2004
Outstanding at beginning of year 3.0 0.8 0.85 1.17 1.0 0.2 0.84 1.17
Granted 0.9 2.6 0.86 0.80 0.1 0.9 0.86 0.80
Forfeited (0.7) (0.4) 0.87 1.10 (0.2) (0.1) 0.88 1.11
Exercised (0.0) (0.0) 0.80 1.17 – – – –
Outstanding and exercisable at the end of year 3.2 3.0 0.86 0.85 0.9 1.0 0.83 0.84
Egg share option scheme awards made prior to 7 November 2002.Number Weighted average(millions) exercise price £
2005 2004 2005 2004
Outstanding at beginning of year 11.5 16.7 1.42 1.42
Forfeited (2.2) (1.4) 1.43 1.46
Exercised – (3.8) – 1.40
Outstanding and exercisable at the end of year 9.3 11.5 1.42 1.42
The weighted average share price of Egg plc during the year ended 31 December 2005 was 106 pence compared to 134 pence for the
year ended 31 December 2004.
Notes on the Group financial statements continued

Prudential plc Annual Report 2005 179
I2: Share-based payments continuedThe exercise prices and the weighted average remaining contractual life of the number of options outstanding at the year end are
as follows:2005 2004
Weighted Weightedaverage average
Number remaining Number remainingExercise of options contractual Exercise of options contractual
price £ (millions) life (years) price £ (millions) life (years)
Restricted share plan
Pre 2003 grant – – – – 0.8 0.3
2003 grant – 2.8 0.2 – 3.1 1.2
2004 grant – 2.0 1.6 – 3.1 2.5
2005 grant – 1.2 2.2 – – –
3 Year Sharesave Scheme
2001 grant 1.30 – – 1.30 0.1 –
2002 grant 1.15 0.4 – 1.15 0.6 0.9
2003 grant 1.17 0.3 0.9 1.17 0.5 1.9
2004 grant 0.80 1.9 1.9 0.80 2.5 2.9
2005 grant 0.86 0.9 2.9 – – –
5 Year Sharesave Scheme
2001 grant 1.30 0.1 0.9 1.30 0.1 1.9
2002 grant 1.15 0.2 1.9 1.15 0.2 2.9
2003 grant 1.17 0.1 2.9 1.17 0.1 3.9
2004 grant 0.80 0.7 3.9 0.80 0.9 4.9
2005 grant 0.86 0.2 4.9 – – –
Share option schemes
Pre 2003 grant 1.42 9.3 – 1.42 11.5 0.4
The fair value of the Egg RSP scheme at the date of grant was calculated using a Present Economic Value (binomial) model. The fair values
of the sharesave schemes at the date of grant were determined using a Black-Scholes model.
The significant assumptions and inputs used to estimate the fair value of the options granted in 2005 are as follows:
2005 2004
3 Year 5 Year 3 Year 5 YearRSP Sharesave Sharesave RSP Sharesave Sharesave
Share price (£) 1.09 1.03 1.03 1.01 0.94 0.94
Exercise price (£) – 0.86 0.86 – 0.80 0.80
Risk-free interest rate (%) (note i) – 4.14 4.15 – 4.70 4.76
Expected life (years) 3 3 5 3 3 5
Expected volatility (%) (note ii) 40 40 40 40 40 40
Dividend yield (%) – – – – – –
Share price volatility of comparator group (%) (note iii) 20 – – 20 – –
Fair value of option (£) 1.91 0.41 0.50 1.90 0.37 0.45
Notes(i) The risk-free interest rate reflects yields available on government bonds of similar terms at the date of grant.
(ii) The expected volatility input is estimated based on Egg’s own historical volatility and the historical volatility of businesses in the banking sector.
(iii) Analysis of the share price volatility of the FTSE 100 has been used as a reasonable proxy for the share price volatility of the comparator group of the RSP, this comparatorgroup being the constituents of the FTSE 350 index.
(c) Total share-based payment expense
Total expense recognised in the year in the consolidated financial statements related to share-based compensation is as follows:
2005 2004£m £m
Share-based compensation expense 19 13
Amount accounted for as equity-settled 15 10
Carrying value at 31 December of liabilities arising from share-based payment transactions 10 3
Intrinsic value of above liabilities for which rights had vested at 31 December 1 –

180 Prudential plc Annual Report 2005
I3: Key management remunerationKey management constitutes the directors of Prudential plc as they have authority and responsibility for planning, directing and controlling
the activities of the Group.
Total key management remuneration amounts to £13,688,000 (2004: £11,274,000). This comprises salaries and short-term benefits
of £8,087,000 (2004: £7,639,000), post-employment benefits of £1,032,000 (2004: £1,058,000), termination benefits of £1,600,000
(2004: £nil) and share-based payments of £2,969,000 (2004: £2,577,000).
Post-employment benefits comprise the change in the transfer value of the accrued benefit relating to directors’ defined benefit pension
schemes in the year and the total contributions made to directors’ other pension arrangements.
The share-based payments charge is the sum of £1,842,000 (2004: £1,815,000), which is determined in accordance with IFRS 2,
‘Share-Based Payments’ (see note I2) and £1,127,000 (2004: £762,000) of deferred share awards.
Total key management remuneration includes total directors’ emoluments of £9,214,000 as shown in the remuneration report on pages
46 to 57, and additional amounts in respect of pensions, share-based payments and termination benefits. Further information on directors’
remuneration is given in the remuneration report.
I4: Fees payable to auditors2005 2004
£m £m
Audit services:
Statutory audit fees 4.2 4.0
Interim financial statements 0.7 0.4
US GAAP reporting 0.8 0.8
Regulatory reporting 0.7 0.5
EEV and achieved profits basis audit 0.4 0.1
Total audit services 6.8 5.8
Further assurance services associated with:
Implementation of Sarbanes-Oxley requirements 2.2 1.8
Implementation of accounting and regulatory requirements 1.4 0.4
Prospectuses for equity and debt issues 0.6 0.5
Comfort and attestation letters 0.6 0.2
Tax compliance 0.5 0.2
5.3 3.1
Other services:
Acquisitions and disposals due diligence 0.0 0.5
Other services 0.3 0.5
Total 12.4 9.9
Fees, excluding statutory audit fees, payable to KPMG Audit Plc and its associates include £6.7 million (2004: £4.6 million) for work
performed in the UK. Audit fees include fees paid to KPMG where they are the auditors of PPM Capital consolidated entities.
The Audit Committee regularly monitors the non-audit services provided to the Group by its auditors and has developed a formal Auditor
Independence Policy which sets out the types of services that the auditors may provide, consistent with the guidance in Sir Robert Smith’s
report ‘Audit Committees – Combined Code Guidance’ and with the provisions of the US Sarbanes-Oxley Act. The Audit Committee
annually reviews the auditors’ objectivity and independence. More information on these issues is given in the corporate governance
report on page 40.
Notes on the Group financial statements continued

Prudential plc Annual Report 2005 181
I5: Related party transactionsTransactions between the Company and its subsidiaries are eliminated on consolidation.
In addition, the Company has transactions and outstanding balances with certain unit trusts, OEICs, collateralised debt obligations and
similar entities, which are not consolidated and where a Group company acts as manager. These entities are regarded as related parties
for the purposes of IAS 24. The balances are included in the Group’s balance sheet at fair value or amortised cost in accordance with their
IAS 39 classifications. The transactions are included in the income statement and include amounts paid on issue of shares or units, amounts
received on cancellation of shares or units and paid in respect of the periodic charge and administration fee. Further details of the aggregate
assets, liabilities, revenues, profits or losses and reporting dates of entities considered to be associates under IFRS are disclosed in note H8.
Various executive officers and directors of Prudential may from time to time purchase insurance, investment management or annuity
products, or be granted mortgages or credit card facilities marketed by Prudential group companies in the ordinary course of business on
substantially the same terms, including interest rates and security requirements, as those prevailing at the time for comparable transactions
with other persons.
Apart from the transactions with directors referred to below, no director had an interest in shares, transactions or arrangements that
requires disclosure, other than those given in the remuneration report. Key management remuneration is disclosed in note I3.
In 2005 (2004), three (four) directors had mortgages and other borrowings with Egg plc of £125,000 (2004: £171,000). One director had
a life policy with a sum assured of £4.0 million (2004: £3.5 million). In 2005 and 2004, other transactions with directors were de-minimis
both by virtue of their size and in the context of the directors’ financial positions. As indicated above, all of the above noted transactions
are on terms equivalent to those that prevail in arm’s length transactions.
I6: Subsidiary undertakings(i) Principal subsidiaries
The principal subsidiary undertakings of the Company at 31 December 2005, all wholly owned except Egg Banking plc and PCA Life
Assurance Company Limited were:
Country ofMain Activity Incorporation
The Prudential Assurance Company Limited Insurance England and Wales
Prudential Annuities Limited* Insurance England and Wales
Prudential Retirement Income Limited (PRIL)* Insurance Scotland
M&G Investment Management Limited* Investment management England and Wales
Egg Banking plc* Banking England and Wales
Jackson National Life Insurance Company* Insurance US
Prudential Assurance Company Singapore (Pte) Limited* Insurance Singapore
PCA Life Assurance Company Limited* Insurance Taiwan
*Owned by a subsidiary undertaking of the Company.
Each subsidiary has one class of ordinary shares and operates mainly in its country of incorporation, except for PRIL which operates
mainly in England and Wales. In February 2005, the proportion of ordinary shares of PCA Life Assurance Company Limited owned by
the Company was increased from 97 per cent to 99 per cent.
Egg Banking plc is a subsidiary of Egg plc. At 31 December 2005, the ordinary shares of Egg plc were listed and there was only one class of
shares which were 78 per cent owned by the Company, 1 per cent owned by other companies within the Prudential Group and 21 per cent
owned by shareholders external to the Prudential Group. In December 2005, the Company announced its intention to acquire the whole
of the issued and to be issued shares of Egg not already owned by the Prudential Group as set out in note I8.
(ii) Dividend restrictions and minimum capital requirements
Certain Group subsidiaries are subject to restrictions on the amount of funds they may transfer in the form of cash dividends or otherwise
to the parent company. UK insurance companies are required to maintain solvency margins which must be supported by capital reserves
and other resources, including unrealised gains on investments. JNL can pay dividends on its capital stock only out of earned surplus
unless prior regulatory approval is obtained. Furthermore, without the prior regulatory approval, dividends cannot be distributed if all
dividends made within the preceding 12 months exceed the greater of JNL’s statutory net gain from operations or 10 per cent of JNL
statutory surplus for the prior year. As JNL paid dividends in 2005, in order to fund the purchase of the Life Insurance Company of
Georgia (see section (iii) below), at 31 December 2005, the maximum amount of dividends that could be paid by JNL without prior
regulatory approval was nil (2004: US$221 million (£115 million)). The Group’s Asian subsidiaries, mainly the Singapore and Malaysia
businesses, may remit dividends to the Group, in general, provided the statutory insurance fund meets the capital adequacy standard
required under local statutory regulations.
PAC and JNL are the two principal insurance subsidiaries of the Group, which together comprise approximately 77 per cent (2004: 77 per cent)
of total Group assets. At 31 December 2005, the PAC long-term fund’s excess of assets over its required minimum solvency margin (as per
line 42 of Form 2 of the PAC FSA regulatory returns) was estimated to be £11,783 million (2004: £4,665 million) and the statutory capital
and surplus of JNL was US$3,434 million (£2,000 million) (2004: US$3,141 million (£1,636 million)). The Group capital position statement
for life assurance businesses is set out in note D5.

182 Prudential plc Annual Report 2005
I6: Subsidiary undertakings continued(iii) Acquisition of subsidiaries
A. Acquisition of subsidiaries in 2005
On 18 May 2005, the Group purchased, in exchange for £142 million in cash, 100 per cent of the share capital of Life Insurance Company
of Georgia, a life insurance company domiciled in the US, from ING Groep N.V. (ING). The results of Life Insurance Company of Georgia’s
operations have been included in the consolidated financial statements commencing 18 May 2005, and contributed £4 million to the
consolidated net profit. The preliminary purchase price is subject to post-closing adjustments and has been allocated to the assets acquired
and liabilities assumed using management’s best estimate of fair value as of the acquisition date. JNL is in negotiations with ING over certain
post-closing purchase price adjustments. During 2006, any unresolved differences will be submitted to an arbitrator for resolution. If the
final purchase price is reduced as a result of the arbitrator’s review, the opening balance sheet will be reassessed accordingly, with any
excess adjustment over the amounts presented in the balance sheet recognised as a gain.
The carrying value immediately prior to acquisition of the assets and liabilities of Life Insurance Company of Georgia was as follows:
2005£m
Assets
Financial investments 920
Reinsurer’s share of policyholder liability provision 12
Tax recoverable 4
Other assets 6
Cash and cash equivalents 47
Total assets 989
Equity and liabilities
Equity 141
Liabilities
Insurance contract liabilities 837
Other non-insurance liabilities 11
Total liabilities 848
Total equity and liabilities 989
A fair value adjustment of £1 million was made, representing the value of in-force business on acquisition. As indicated above, this
amount may be adjusted depending upon the outcome of arbitration proceedings. There is currently no goodwill recorded on acquisition.
Group revenue and consolidated net profit for the year ended 31 December 2005 are shown on a pro forma basis below as if the
Life Insurance Company of Georgia acquisition took place on 1 January 2005. These pro forma amounts have been derived by adding
pre-acquisition revenue and other components of net profit to these items included in the Group’s consolidated income statement.
Pro forma2005
£m
Earned premiums, net of reinsurance 15,050
Investment and other income 26,119
Total revenue 41,169
Profit after tax for the year 768
In addition to the acquisition of Life Insurance Company of Georgia, the PAC with-profits fund acquired a number of venture capital
holdings through PPM Capital in which the Group is deemed to have a controlling interest, in aggregate with, if applicable, other holdings
held by, for example, the PSPS. There were three such acquisitions during 2005:
■ Acquired 40 per cent of the voting equity interests of Aperio Group Pty Ltd (AeP), a flexible packaging manufacturing company, in May 2005;
■ acquired 75 per cent of the voting equity interests of Jost Luxembourg S.a.r.l. (JOST), a manufacturer of components of the truck and
trailer industry, in August 2005; and
■ acquired 75 per cent of the voting equity interests of BST Safety Textiles Luxembourg S.a.r.l. (BST), an airbag production company,
in August 2005.
These acquisitions are considered individually immaterial and therefore all 2005 information relating to ventures acquisitions has been
presented in aggregate throughout the note. Due to the nature of venture investments, it is not practicable to provide certain information
for acquisitions occurring in 2005 and 2004, including the pro forma Group revenue and consolidated net profit information as if the
acquisitions had occurred at the beginning of the year, and the carrying amounts, in accordance with IFRS, of each class of the acquirees
assets, liabilities, and contingent liabilities immediately before acquisition.
The results of the aggregated ventures acquisitions in 2005 have been included in the consolidated financial statements of the Group
commencing on the respective dates of acquisition and contributed £0.1 million to earnings within the income statement, which is also
reflected as part of the change in unallocated surplus of the with-profits fund.
Notes on the Group financial statements continued

Prudential plc Annual Report 2005 183
I6: Subsidiary undertakings continuedThe table below identifies the net assets acquired and reconciles this amount to the consideration paid for the aggregated ventures
acquisitions in 2005:Fair value
on acquisition£m
Cash and cash equivalents 29
Other current assets 144
Property, plant and equipment 82
Other non-current assets 5
Less liabilities, including current liabilities and borrowings (408)
(148)
Less minority interests 1
Net assets acquired (149)
Goodwill 151
Cash consideration 2
Aggregate goodwill of £151 million has been recognised for the excess of the cost over the Group’s interest in the net fair value of the
entities’ assets, liabilities, and contingent liabilities acquired in 2005.
There are no intangible assets that were not recognised separately from goodwill for these companies because the fair value of the
intangible asset could not be reliably measured.
B. Acquisition of subsidiaries in 2004
Acquisitions in 2004 relate to the PAC with-profits fund venture capital holdings. There were five such acquisitions during 2004:
■ Acquired 39 per cent of the voting equity interests of Pharmacia Diagnostics (Pharmacia), a Swedish healthcare company, in April 2004;
■ acquired 45 per cent of the voting equity interests of TMF Group (TMF), a Dutch business administration company, in September 2004;
■ acquired 75 per cent of the voting equity interests of Muller & Weygandt GmbH (M&W), a German healthcare company, in October 2004;
■ acquired 73 per cent of the voting equity interests of Sterigenics International, Inc. (Sterigenic), a US based healthcare company, in June
2004; and
■ acquired 100 per cent of the voting equity interests of Edotech (Edotech), a UK business services company, in March 2004.
These acquisitions are considered individually immaterial and therefore all 2004 information has been presented in aggregate throughout
the note. As noted above, it is not practicable to provide certain information due to the nature of venture investments and hence these
disclosures are not included in this note.
The results of the aggregated acquisitions in 2004 have been included in the consolidated financial statements of the Group commencing
on the respective dates of acquisition and contributed £16 million to earnings within the income statement which is also reflected as part of
the change in the liability for unallocated surplus ie profit before tax attributable to shareholders is not affected. This aggregate amount of
£16 million does not include earnings from Edotech for the period since the date of acquisition. Disclosure of this amount is impracticable
as Edotech is an acquisition by a consolidated PPM Capital venture subsidiary.
The table below identifies the net assets acquired and reconciles this amount to the consideration paid for the aggregated acquisitions
in 2004:Fair value
on acquisition£m
Cash and cash equivalents 44
Other current assets 205
Property, plant and equipment 212
Other non-current assets 43
Less liabilities, including current liabilities and borrowings (905)
(401)
Less minority interests 0
Net assets acquired (401)
Goodwill 537
Cash consideration 136
Aggregate goodwill of £537 million has been recognised for the excess of the cost over the Group’s interest in the net fair value of the
entities’ assets, liabilities, and contingent liabilities acquired in 2004.
There are no intangible assets that were not recognised separately from goodwill for these companies because the fair value of the
intangible asset could not be reliably measured.

184 Prudential plc Annual Report 2005
I6: Subsidiary undertakings continued(iv) Disposals of subsidiaries
A. Disposals of subsidiaries in 2005
In 2005, the Astron Group Ltd, Barracuda Group Ltd, Saint Clair Luxembourg S.a.r.l., RAL Holdings Ltd, Roventa-Henex Holdings SA
and Global Brands Co. Inc., all venture subsidiaries of the PAC with-profits fund, were disposed of for cash consideration of £284 million.
Goodwill of £312 million and cash and cash equivalents of £32 million were disposed of. Note that, in addition, two venture subsidiaries
were classified as held for sale at 31 December 2005 (see note H9).
B. Disposals of subsidiaries in 2004
The Group disposed of its interest in Jackson Federal Bank on 27 October 2004 to Union Bank of California (see note F6).
The net assets of Jackson Federal Bank at the date of disposal and at 31 December 2003 were as follows:At date of
disposal 31 Dec 2003£m £m
Intangible assets 38 38
Financial investments:
Debt securities 45 270
Equity securities and portfolio holdings in unit trusts 13 13
Loans and receivables 683 659
Other investments – 3
741 945
Accrued investment income 10 9
Cash and cash equivalents 21 14
Total liabilities (predominantly customer accounts) (682) (894)
Net identifiable assets and liabilities 128 112
Gain on disposal, before tax 38
Total consideration, satisfied by cash 166
Net cash inflow arising on disposal
Cash consideration 166
Cash and cash equivalents disposed of (21)
145
In addition, Oxoid a venture subsidiary of the PAC with-profits fund was disposed of on 1 March 2004 for cash consideration of £73 million.
Goodwill of £62 million was the primary asset that was disposed of. Cash and cash equivalents disposed of were insignificant.
I7: Commitments(i) Operating leases
The Group leases various offices to conduct its business. Leases in which a significant portion of the risks and rewards of ownership are
retained by the lessor are classified as operating leases. Payments made under operating leases (net of any incentives received from the
lessor) are charged to the income statement on a straight-line basis over the period of the lease.
2005 2004£m £m
Future minimum lease payments for non-cancellable operating leases are due for the following periods:
Not later than 1 year 61 58
Later than 1 year and not later than 5 years 186 167
Later than 5 years 204 201
The total minimum future sublease rentals to be received on non-cancellable operating leases for land and buildings for the year ended
31 December 2005 was £2 million (2004: £2 million).
Minimum lease rental payments for the year ended 31 December 2005 of £55 million (2004: £50 million) are included in the consolidated
income statement.
(ii) Capital commitments
The Group has provided, from time to time, certain guarantees and commitments to third parties including funding the purchase or
development of land and buildings and other related matters. At 31 December 2005, the aggregate amount of contractual obligations to
purchase and develop investment properties amounted to £199 million (2004: £42 million). The vast majority of these commitments have
been made by the PAC with-profits fund.
Notes on the Group financial statements continued

Prudential plc Annual Report 2005 185
I8: Post-balance sheet eventsIn December 2005, the Company announced its intention to acquire the minority interests in Egg representing approximately 21.7 per cent
of the existing issued share capital of Egg. Under the terms of the offer, Egg shareholders would receive 0.2237 new ordinary shares in the
Company for each Egg share. In January 2006, the Company announced that it had received acceptances in respect of 80.3 per cent of the
shares that it did not already own and that it would extend the offer until further notice. In February 2006, the Board of Egg announced the
delisting of Egg shares. Full acceptance of the offer would result in the issue of 41 million new ordinary shares in the Company representing
1.7 per cent of its issued ordinary share capital as enlarged by this acquisition.
I9: Foreign exchange translationForeign currency profit and losses have been translated at average exchange rates for the year. Foreign currency assets and liabilities have
been translated at year end rates of exchange.
The principal exchange rates applied are:
Closing Closing Openingrate at Average rate at Average rate at
Local currency: £ 31 Dec 2005 for 2005 31 Dec 2004 for 2004 1 Jan 2004
Hong Kong 13.31 14.15 14.92 14.27 13.90
Japan 202.63 200.13 196.73 198.08 191.85
Malaysia 6.49 6.89 7.30 6.96 6.80
Singapore 2.85 3.03 3.13 3.10 3.04
Taiwan 56.38 58.47 60.84 61.10 60.78
US 1.72 1.82 1.92 1.83 1.79
I10: Cash flowsStructural borrowings of shareholder-financed operations comprise core debt of the parent company and related finance subsidiaries,
JNL surplus notes and Egg debenture loans. Core debt excludes borrowings to support short-term fixed income securities reinvestment
programmes and non-recourse borrowings of investment subsidiaries of shareholder-financed operations. Cash flows in respect of these
borrowings are included within operating cash flows.
Structural borrowings of with-profits operations relate solely to the £100 million 8.5 per cent undated subordinated guaranteed bonds
which contribute to the solvency base of SAIF. Cash flows on other borrowings of with-profits funds, which principally relate to venture
investment subsidiaries, are categorised as operating.
Cash flows relating to discontinued operations, as detailed in note F6, are outflows of £5 million and inflows of £174 million for 2005 and
2004 respectively. All of these relate to cash flows from operating activities.

186 Prudential plc Annual Report 2005
Restated2005 2004
Note £m £m
Fixed assets
Investments:
Shares in subsidiary undertakings 4 5,175 5,629
Loans to subsidiary undertakings 4 2,697 2,129
7,872 7,758
Current assets
Debtors:
Amounts owed by subsidiary undertakings 1,511 1,085
Other debtors 56 38
Cash at bank and in hand 121 325
1,688 1,448
Less liabilities: amounts falling due within one year
Debenture loans 6 – (130)
Commercial paper 6 (1,461) (1,228)
Other borrowings 6 – (3)
Derivative liability 7 (37) –
Amounts owed to subsidiary undertakings (805) (621)
Tax payable (171) (170)
Sundry creditors (37) (36)
Accruals and deferred income (41) (44)
(2,552) (2,232)
Net current liabilities* (864) (784)
Total assets less current liabilities* 7,008 6,974
Less liabilities: amounts falling due after more than one year
Subordinated liabilities 6 (1,646) (1,429)
Debenture loans 6 (798) (800)
Other borrowings 6 (11) (9)
Amounts owed to subsidiary undertakings (2,016) (1,959)
(4,471) (4,197)
Total net assets (excluding pension liabilities)* 2,537 2,777
Pension liabilities (net of related deferred tax)* 8 (80) (83)
Total net assets (including pension liabilities)* 2,457 2,694
Capital and reserves
Share capital 9 119 119
Share premium 9 1,564 1,558
Profit and loss account* 10 774 1,017
Shareholders’ funds* 2,457 2,694
*The 2004 figures for these lines have been restated for the implementation of FRS 17, ‘Retirement Benefits’ and FRS 21, ‘Events after the Balance Sheet Date’ (see note 3).
The financial statements of the parent company on pages 186 to 195 were approved by the Board of Directors on 15 March 2006.
Sir David Clementi Mark Tucker
Chairman Group Chief Executive
Philip Broadley
Group Finance Director
Balance sheet of the parent company31 December 2005

Prudential plc Annual Report 2005 187
1. Nature of operationsPrudential plc (the Company) is a parent holding company. The Company together with its subsidiaries (collectively, the Group) is an
international financial services group with its principal operations in the UK, US and Asia. The Group operates in the UK through its
subsidiaries, primarily The Prudential Assurance Company Limited, Prudential Annuities Limited, Prudential Retirement Income Limited,
M&G Group Limited and Egg plc. In the US, the Group’s principal subsidiary is Jackson National Life Insurance Company. In Asia, the
Group’s main operations are in Hong Kong, Malaysia, Singapore and Taiwan.
The Company arranges the financing of each of its subsidiaries (except Egg, which is responsible for its own financing) primarily by raising
external finance either at the Company level (including through finance subsidiaries whose obligations the Company guarantees) or at the
operating company level.
2. Basis of preparationThe financial statements of the Company, which comprise the balance sheet and related notes, are prepared in accordance with Section 226
of, and Schedule 4 to, the Companies Act 1985, which apply to companies generally. The Company has taken advantage of the exemption
under Section 230 of the Companies Act 1985 from presenting its own profit and loss account.
The financial statements are prepared in accordance with applicable accounting standards under UK Generally Accepted Accounting
Practice (UK GAAP), including Financial Reporting Standards (FRS) and Statements of Standard Accounting Practice (SSAP).
The Company has not prepared a cash flow statement on the basis that its cash flow is included within the cash flow statement in the
consolidated financial statements. The Company is also exempt under the terms of FRS 8 from disclosing related party transactions with
entities that are part of the Group or investees of the Group.
In addition, the Company has taken advantage of the exemption within FRS 25, ‘Financial Instruments: Disclosure and Presentation’ from
the disclosure requirements of this standard on the basis that the Company is included in the publicly available consolidated financial
statements of the Group which include disclosures that comply with IAS 32, ‘Financial Instruments: Disclosure and Presentation’, which
is equivalent to FRS 25.
3. Significant accounting policiesChanges in accounting policies
The Company has implemented the following UK GAAP accounting standards in preparing its results for the year ended 31 December
2005. All of these standards closely reflect the requirements of International Financial Reporting Standards (IFRS) and form part of the
implementation of IFRS in the UK.
FRS 17, ‘Retirement Benefits’
The main effect of the adoption of FRS 17 in 2005 is the recognition of a surplus or deficit in respect of the defined benefit pension
schemes on the balance sheet. The Company is assuming a portion of the pension deficit of the Group’s largest pension scheme, the
Prudential Staff Pension Scheme (PSPS). Please refer to note 8 for further details. The effect of this change in policy and attribution of the
PSPS deficit to the Company is to decrease shareholders’ funds at 1 January 2004 from the previously published amount by £77 million.
This has resulted in an increase in the profit before tax of £35 million (2004: increase of £1 million) and an increase in the tax charge
of £11 million (2004: nil impact). Including the impact of actuarial gains and losses charged to the statement of total recognised gains
and losses, FRS 17 has the effect of increasing the total recognised gains and losses after tax of the Company for the year by £3 million
(2004: decrease of £6 million).
FRS 21, ‘Events after the Balance Sheet Date’
The main effect of FRS 21 on the Company is that dividends declared after the balance sheet date in respect of the previous reporting
period are no longer to be considered as ‘adjusting events’. Accordingly, an accrual is no longer made in the profit and loss account.
Instead, appropriate disclosure is made in the notes to the financial statements. The effect of the change in policy is to increase
shareholders’ funds at 1 January 2005 from the previously published 31 December 2004 level by £252 million.
FRS 23, ‘The Effects of Changes in Foreign Exchange Rates’, FRS 24, ‘Financial Reporting in Hyperinflationary Economies’,
FRS 25, ‘Financial Instruments: Disclosures and Presentation’ and FRS 26, ‘Financial Instruments: Measurement’
The Accounting Standards Board (ASB) published FRS 23, FRS 24, FRS 25 and FRS 26 in December 2004. These accounting standards
are, in effect, part of a package of UK standards comprising FRS 23, FRS 24, the disclosure requirements of FRS 25 and FRS 26.
Listed entities, such as the Company, preparing their financial statements in accordance with UK requirements, are required to comply
with the entire package of standards for accounting periods beginning on or after 1 January 2005.
The main impacts of the adoption of these standards are described below:
FRS 23, ‘The Effects of Changes in Foreign Exchange Rates’
The main requirements of this standard relate to fair value adjustments on acquisitions treated as assets of acquired foreign operations and
the recycling of cumulative translation adjustment from 1 January 2004 on disposal of foreign operations. This standard applies prospectively
to acquisitions and disposals occurring after the effective date of 1 January 2005. There is no impact on the balance sheet and profit and
loss account in the year upon the adoption of this standard.
FRS 24, ‘Financial Reporting in Hyperinflationary Economies’
The adoption of this standard has no impact on the results of the Company.
Notes on the parent company financial statements

188 Prudential plc Annual Report 2005
3. Significant accounting policies continuedFRS 25, ‘Financial Instruments: Disclosures and Presentation’
FRS 25 is based on the text of IAS 32, ‘Financial Instruments: Disclosures and Presentation’ as at 31 March 2004, incorporating the revised
version of IAS 32 issued by the International Accounting Standards Board (IASB) in December 2003 and includes amendments made by
IFRS 4, ‘Insurance Contracts’.
The presentation requirements of FRS 25 are applicable to the Company as at 1 January 2005. The Company has taken advantage of the
provisions within FRS 25 that waive the requirement to restate comparatives. The main presentation adjustment resulting from FRS 25
relates to the Company’s derivatives. Previously, under UK GAAP, the Company’s carrying value of derivatives has been recorded on a
basis that nets asset and liability amounts of individual derivatives. Under FRS 25, there is a requirement that assets and liabilities should
not be netted in the balance sheet unless counterparty offset applies. Accordingly, under FRS 25, derivative assets and liabilities have
been included gross in the balance sheet.
The Company has taken advantage of the exemption within FRS 25 from the disclosure requirements of this standard on the basis that
the Company is included in the publicly available consolidated financial statements of the Group which include disclosures that comply
with IAS 32, which is equivalent to FRS 25.
FRS 26, ‘Financial Instruments: Measurement’
FRS 26 is based on the text of IAS 39, ‘Financial Instruments: Recognition and Measurement’ as at 31 March 2004, incorporating the
revised version of IAS 39 issued by the IASB in December 2003 together with the amendments to IAS 39 on ‘Fair Value Hedge Accounting
for a Portfolio Hedge of Interest Rate Risk’ and those made by IFRS 4.
The significant adjustments for the Company resulting from FRS 26 arise primarily in respect of the valuation of derivative financial
instruments and borrowings. Previously, derivative financial instruments held by the Company, depending on their nature and purpose,
were either accounted for at fair value or treated as a hedge and accounted for on an accrual or deferral basis. Under FRS 26, derivative
financial instruments are carried at fair value with value movements being recorded in the profit and loss account. Hedge accounting,
whereby value movements on derivatives and hedged items are recorded together in the profit and loss account, is permissible only if
certain criteria are met regarding the establishment of documentation and continued measurement of hedge effectiveness. In addition to
the valuation of derivative financial instruments, FRS 26 has also resulted in a change in terms of the application of the effective interest
rate method to amortise borrowings.
The adoption of FRS 26 has the impact of reducing the profit before tax for the year ended 31 December 2005 by £34 million and the
shareholders’ funds at 31 December 2005 by £35 million. This FRS is to be applied retrospectively. However, the Company has taken
advantage of the provisions within FRS 26 that allows comparative information not to be restated to comply with this standard.
The effects of the changes in accounting policies on opening shareholders’ funds and profit and loss account are as follows:
Profit and Shareholders’loss account funds
£m £m
31 December 2004 as previously published 848 2,525
Effect of adoption of FRS 17 on pension liabilities (83) (83)
Effect of adoption of FRS 21 on dividends 252 252
31 December 2004 as restated 1,017 2,694
Effect of adoption of FRS 26:
Fair valuation of derivatives (12) (12)
Use of effective interest rate method on borrowings (1) 1
1 January 2005 (including adjustments for FRS 26) 1,004 2,683
Significant accounting policies
Tax
Current tax expense is charged or credited to operations based upon amounts estimated to be payable or recoverable as a result of
taxable operations for the current year. To the extent that losses of an individual UK company are not offset in any one year, they can
be carried back for one year or carried forward indefinitely to be offset against profits arising from the same company.
Deferred tax assets and liabilities are recognised in accordance with the provisions of FRS 19. The Company has chosen not to apply
the option available of recognising such assets and liabilities on a discounted basis to reflect the time value of money. Except as set out
in FRS 19, deferred tax is recognised in respect of all timing differences that have originated but not reversed by the balance sheet date.
Deferred tax assets are recognised to the extent that it is regarded as more likely than not that they will be recovered.
The Group’s UK subsidiaries each file separate tax returns. In accordance with UK tax legislation, where one domestic UK company is a
75 per cent owned subsidiary of another UK company or both are 75 per cent owned subsidiaries of a common parent, the companies are
considered to be within the same UK tax group. For companies within the same tax group, trading profits and losses arising in the same
accounting period may be offset for the purposes of determining current and deferred taxes.
Shares in subsidiary undertakings
Shares in subsidiary undertakings in the balance sheet of the Company are shown at the lower of cost and estimated realisable value.
Notes on the parent company financial statements continued

Prudential plc Annual Report 2005 189
3. Significant accounting policies continuedLoans to subsidiary undertakings
Loans to subsidiary undertakings in the balance sheet of the Company are shown at cost, less provisions.
Derivatives
Derivative financial instruments are used to reduce or manage interest rate and currency exposures. The Company’s policy is that
amounts at risk through derivative transactions are covered by cash or by corresponding assets. For 2005, these instruments are carried
at fair value with changes in fair value included in the profit and loss account. Prior to this, derivative financial instruments held by the
Company, depending on their nature and purpose, were either accounted for at fair value or treated as a hedge and accounted for on
an accrual or deferral basis.
Under FRS 26, hedge accounting is permissible only if certain criteria are met regarding the establishment of documentation and continued
measurement of hedge effectiveness. For derivative financial instruments designated as fair value hedges the movements in the fair value
are recorded in the profit and loss account with the accompanying change in fair value of the hedged item attributable to the hedged risk.
Borrowings
Under FRS 26, borrowings are initially recognised at fair value, net of transaction costs, and subsequently accounted for on an amortised
cost basis using the effective interest method. Under the effective interest method, the difference between the redemption value of the
borrowing and the initial proceeds (net of related issue costs) is amortised through the profit and loss account to the date of maturity.
Prior to the adoption of FRS 26, borrowings were recognised at fair value, net of transaction costs. Any premium or discount from the
nominal value was shown net. Transaction costs and premiums or discounts were amortised on a straight-line basis.
Shareholders’ dividends
Prior to the adoption of FRS 21, shareholders’ dividends were accrued in the period to which they related regardless of when they were
declared. Under FRS 21, dividends declared after the balance sheet date in respect of the prior reporting period are treated as a non-
adjusting event. Dividends are now recognised in the period in which they are declared.
Where scrip dividends are issued, the value of such shares, measured as the amount of the cash dividend alternative, is credited to reserves
and the amount in excess of the nominal value of the shares issued is transferred from the share premium account to retained profit.
Share premium
The difference between the proceeds received on issue of shares, net of issue costs, and the nominal value of the shares issued is
credited to the share premium account.
Foreign currency translation
Foreign currency borrowings that have been used to finance or provide a hedge against Group equity investments in overseas
subsidiaries, are translated at year end exchange rates. The impact of these currency translations is recorded within the profit and loss
account for the year.
Other assets and liabilities denominated in foreign currencies are also converted at year end exchange rates with the related foreign
currency exchange gains or losses reflected in the profit and loss account for the year.
4. Investments of the CompanyShares in Loans to
subsidiary subsidiaryundertakings undertakings
2005 2005£m £m
At beginning of year 5,629 2,129
Transfer to a subsidiary undertaking (606) –
Cancellation of investment in subsidiary undertaking (1) –
Additional investment in subsidiary undertaking 153 –
Exchange rate movements – 18
Net advance of loans – 591
Provision against loans – (41)
At end of year 5,175 2,697

190 Prudential plc Annual Report 2005
5. Subsidiary undertakingsThe principal subsidiary undertakings of the Company at 31 December 2005, all wholly owned except Egg Banking plc and PCA Life
Assurance Company Limited, were:
Main activity Country of incorporation
The Prudential Assurance Company Limited Insurance England and Wales
Prudential Annuities Limited* Insurance England and Wales
Prudential Retirement Income Limited (PRIL)* Insurance Scotland
M&G Investment Management Limited* Investment management England and Wales
Egg Banking plc* Banking England and Wales
Jackson National Life Insurance Company* Insurance US
Prudential Assurance Company Singapore (Pte) Limited* Insurance Singapore
PCA Life Assurance Company Limited* Insurance Taiwan
*Owned by a subsidiary undertaking of the Company.
Each subsidiary has one class of ordinary shares and operates mainly in its country of incorporation, except for Prudential Retirement
Income Limited which operates mainly in England and Wales. In February 2005, the proportion of ordinary shares of PCA Life Assurance
Company Limited owned by the Company was increased from 97 per cent to 99 per cent.
Egg Banking plc is a subsidiary of Egg plc. At 31 December 2005, the ordinary shares of Egg plc, were listed and there was only one
class of shares which were 78 per cent owned by the Company, 1 per cent owned by other companies within the Prudential Group and
21 per cent owned by shareholders external to the Prudential Group. In December 2005, the Company announced its intention to acquire
the whole of the issued and to be issued shares of Egg not already owned by the Prudential Group as set out in note 14.
6. BorrowingsLong-term loans Other borrowings Total
2005 2004 2005 2004 2005 2004£m £m £m £m £m £m
Core structural borrowings:
US$250m 7.125% Bonds 2005 (note i) – 130 – 130
£250m 5.5% Bonds 2009 249 250 249 250
€500m 5.75% Subordinated Notes 2021 (note ii) 341 351 341 351
£300m 6.875% Bonds 2023 300 300 300 300
£250m 5.875% Bonds 2029 249 250 249 250
£435m 6.125% Subordinated Notes 2031 426 426 426 426
US$1,000m 6.5% Perpetual Subordinated Capital Securities (note iii) 554 512 554 512
US$250m 6.75% Perpetual Subordinated Capital Securities 142 126 142 126
US$300m 6.5% Perpetual Subordinated Capital Securities 169 – 169 –
€20m Medium Term Subordinated Notes 2023 (note iv) 14 14 14 14
Commercial paper – 171 – 171
Total core structural borrowings 2,444 2,359 – 171 2,444 2,530
Other borrowings:
Commercial paper 2006 (note v) 1,461 1,057 1,461 1,057
Medium Term Notes 2010 (note v) 11 9 11 9
Currency translation net liability on swap transactions – 3 – 3
Total borrowings 2,444 2,359 1,472 1,240 3,916 3,599
Notes on the parent company financial statements continued

Prudential plc Annual Report 2005 191
6. Borrowings continuedLong-term loans Other borrowings Total
2005 2004 2005 2004 2005 2004£m £m £m £m £m £m
Borrowings are repayable as follows:
Within 1 year or on demand – 130 1,461 1,231 1,461 1,361
Between 2 and 5 years 249 250 11 – 260 250
After 5 years 2,195 1,979 – 9 2,195 1,988
Total borrowings 2,444 2,359 1,472 1,240 3,916 3,599
Recorded in the balance sheet as:
Subordinated liabilities 1,646 1,429
Debenture loans 798 930
2,444 2,359
Notes(i) On 16 August 2005, the Company redeemed the US$250 million borrowings on maturity.
(ii) The ¤500 million borrowings have been swapped into borrowings of £333 million with interest payable at six month £Libor plus 0.962 per cent.
(iii) Interest on the US$1,000 million borrowings has been swapped into floating rate payments at three month US$ Libor plus 0.80 per cent. This derivative instrument has beenhedge accounted for as a fair value hedge upon the adoption of FRS 26, ‘Financial Instruments: Measurement’ in 2005.
(iv) The ¤20 million Medium Term Subordinated Notes were issued at 20-year Euro Constant Maturity Swap (capped at 6.5 per cent). At 31 December 2005, these had beenswapped into borrowings of £14 million with interest payable at three month £Libor plus 1.2 per cent.
(v) These borrowings support a short-term fixed income securities reinvestment programme.
(vi) Under the terms of the Group’s arrangements with its main UK banker, the bank has a right of set off between credit balances (other than those of long-term funds) and alloverdrawn balances of those Group undertakings with similar arrangements.
(vii) The interests of the holders of the Subordinated Notes and the Subordinated Capital Securities are subordinate to the entitlements of other creditors of the holding company.
7. Derivative financial instrumentsThe table below analyses the fair value of derivatives of the Company at 31 December 2005:
Fair value Fair valueassets liabilities
£m £m
Derivative financial instruments held to manage interest rate and currency profile:
Interest rate swaps 29 22
Cross-currency swaps 12 2
Inflation-linked swap – 82
Forward foreign currency contracts – 38
Total at 31 December 2005 41 144
The change in fair value of the derivative financial instruments of the Company was a loss before tax of £85 million.
The fair value of the derivative financial instruments, except for £37 million of the £38 million fair value liabilities of forward foreign
currency contracts, were included within amounts owed by or to subsidiary undertakings on the balance sheet as they were transactions
with Prudential Finance (UK) plc, a subsidiary undertaking, which in turn transacted with external counterparties.
As permitted by the standard, the 2004 comparatives have not been restated to include certain derivative financial instruments at fair
value in accordance with FRS 26. The nature and extent of the derivative financial instruments used by the Company in 2004 are similar to
those used in 2005. The corresponding 2004 fair values for the derivative financial instruments of the Company would have been £27 million
and the change in fair value which would have been included in the profit and loss account was a loss before tax of £9 million.
The Company has a US$1,000 million fair value hedge in place which hedges the interest exposure on the US$1,000 million, 6.5 per cent
perpetual subordinated capital securities.
The derivative financial instruments were valued internally using standard market practices. In accordance with the Company’s risk
management framework, all internally generated valuations are subject to independent assessment against external counterparties’ valuations.
Changing any one of the underlying assumptions used in determining the fair value would not have a significant impact on the value of
the derivative financial instruments.

192 Prudential plc Annual Report 2005
8. Pension liabilitiesThe majority of UK Prudential staff are members of the Group’s pension schemes. The largest scheme is the Prudential Staff Pension
Scheme (PSPS). This scheme is primarily a defined benefit scheme but no employees with employment offers after 31 July 2003 are
eligible for membership of the defined benefit section of the scheme. At 31 December 2005, on the FRS 17, ‘Retirement Benefits’
basis of valuation, PSPS accounts for 89 per cent of the liabilities of the Group’s defined benefit schemes.
For the purposes of preparing consolidated financial statements, the Group has adopted IFRS basis accounting including IAS 19,
‘Employee Benefits’. However, individual company accounts of the Company continue to apply UK GAAP. For 2005, this includes the
application of FRS 17 in the Company’s primary statements. During 2005, the allocation of pension schemes’ deficits within the Group
attaching to PSPS has been clarified and the Company is assuming a portion of the deficit of PSPS on behalf of the Group.
The deficit of PSPS has been apportioned between the Company and the unallocated surplus of the Prudential Assurance Company’s
(PAC) with-profits fund based on the weighted cumulative activity attaching to the contributions paid into the scheme in the past. For
2004 and prior, 20 per cent of the deficit has been attributed to the Company and 80 per cent to the PAC with-profits fund. For 2005,
following further detailed consideration of the sourcing of previous contributions, the ratio for PSPS has been altered to 30/70 for the
allocation of the deficit between the Company and the PAC with-profits fund.
Using external actuarial advice provided by the professionally qualified actuaries, Watson Wyatt Partners, for the valuation of PSPS,
the most recent full valuations have been updated to 31 December 2005 applying the principles prescribed by FRS 17. The scheme has
assets held in a separate trustee administered fund. PSPS was last subject to a full actuarial valuation as at 5 April 2005 by Watson Wyatt
Partners, which is currently being finalised.
The key assumptions adopted for FRS 17 basis valuations in PSPS were:2005 2004 2003
% % %
Price inflation 2.80 2.80 2.70
Rate of increase in salaries 4.80 4.80 4.70
Rate of increase in pension payments for inflation:
Guaranteed (maximum 5%) 2.80 2.80 2.70
Guaranteed (maximum 2.5%) 2.50 N/A N/A
Discretionary 2.50 2.80 2.70
Rate used to discount scheme liabilities 4.80 5.30 5.40
The assets and liabilities of PSPS were:31 Dec 2005 31 Dec 2004 31 Dec 2003
Long-term Long-term Long-termexpected rate expected rate expected rate
Value of return Value of return Value of return£m % £m % £m %
Equities 2,293 7.10 2,366 7.50 2,433 7.75
Bonds 1,490 4.50 898 5.00 535 5.00
Properties 539 6.40 490 6.80 542 7.00
Other assets 75 4.50 56 4.75 106 4.00
Total value of assets 4,397 6.09 3,810 6.76 3,616 7.10
Present value of scheme liabilities 4,776 4,399 4,161
Deficit in the scheme (379) (589) (545)
Allocated as:
Attributable to the PAC with-profits fund (265) (470) (435)
Attributable to the Company (114) (119) (110)
(379) (589) (545)
After deduction of deferred tax attaching to the amounts attributable to
the Company, the amounts reflected in the balance sheet are: (80) (83) (77)
The long-term expected rates of return have been determined after applying due consideration to the requirements of paragraph 54 of
FRS 17, in particular, taking account of the values of the assets and equity market levels at the balance sheet dates.
Notes on the parent company financial statements continued

Prudential plc Annual Report 2005 193
8. Pension liabilities continuedMovements on the PSPS liability attributable to the Company that is recognised in the Company’s financial statements as a result of the
implementation of FRS 17 are as follows:Gross of Related Net of
tax liability deferred tax tax liability£m £m £m
Net pension liability at 1 January 2004 (110) 33 (77)
Credit (charge) to profit and loss account:
Pension charge (3) 1 (2)
Contribution paid 4 (1) 3
Credit (charge) to statement of total recognised gains and losses:
Actuarial losses (10) 3 (7)
Net pension liability at 31 December 2004 (119) 36 (83)
Credit to profit and loss account:
Pension credit 29 (9) 20
Contribution paid 6 (2) 4
Credit (charge) to statement of total recognised gains and losses:
Actuarial gains 29 (9) 20
Additional losses on change of estimate of allocation of opening deficit
between the Company and the PAC with-profits fund (59) 18 (41)
Net pension liability at 31 December 2005 (114) 34 (80)
Pension charge and actuarial gains (losses) of PSPS2005 2004
£m £m
Pension charge
Operating charge:
Current service cost (44) (47)
Past service cost 115 –
Finance income (expense):
Interest on pension scheme liabilities (228) (220)
Expected return on pension scheme assets 253 251
25 31
Total pension credit (charge) 96 (16)
Less: amount attributable to the PAC with-profits fund (67) 13
Pension credit (charge) attributable to the Company 29 (3)
2005 2004£m £m
Actuarial gains (losses)
Actual less expected return on pension scheme assets (11% (2004: 3%) of pension scheme assets) 500 104
Experience losses on scheme liabilities (0% (2004: 1%) of present value of scheme liabilities) – (25)
Changes in assumptions underlying the present value of scheme liabilities (405) (128)
Total actuarial gains (losses) ((2)% (2004: 1%) of the present value of the scheme liabilities) 95 (49)
Less: amounts attributable to PAC with-profits fund (66) 39
29 (10)
Less: additional losses on change of estimate of allocation of opening PSPS deficit between
the Company and the PAC with-profits fund (59) –
Actuarial losses attributable to the Company (30) (10)

194 Prudential plc Annual Report 2005
9. Share capital and share premiumThe authorised share capital of the Company is £170 million (divided into 3,000,000,000 ordinary shares of 5 pence each and 2,000,000,000
sterling preference shares of 1 pence each) and US$20 million (divided into 2,000,000,000 US dollar preference shares of 1 cent each)
and ¤20 million (divided into 2,000,000,000 Euro preference shares of 1 cent each). None of the preference shares has been issued.
A summary of the ordinary shares in issue is set out below:Share Share
capital premiumNumber of 2005 2005
Issued shares of 5 pence each fully paid shares £m £m
At beginning of year 2,375,393,020 119 1,558
Transitional adjustment on adoption of FRS 26 – 2
2,375,393,020 119 1,560
Shares issued under share option schemes 745,478 – 4
Shares issued in lieu of cash dividends 10,645,768 – 51
Transfer to retained profit in respect of shares issued in lieu of cash dividends – (51)
At end of year 2,386,784,266 119 1,564
At 31 December 2005, there were options subsisting under share option schemes to subscribe for 12,503,956 (2004: 13,254,966) shares
at prices ranging from 266 pence to 715 pence (2004: 266 pence to 723 pence) and exercisable by the year 2012 (2004: 2011). In addition,
there were 4,668,534 (2004: 5,153,308) conditional options outstanding under the Restricted Share Plan exercisable at nil cost in the
balance of a 10-year period. Further information on the Group’s employee share options is given in note I2 ‘Share-based payments’ of
the notes on the financial statements of the Group.
10. Profit of the Company and reconciliation of movement in shareholders’ fundsThe profit of the Company for the year was £118 million (2004: £125 million as restated). After dividends of £378 million (2004: £323 million
as restated), actuarial losses on pension scheme of £21 million (2004: £7 million) and a transfer from the share premium account of £51 million
(2004: £116 million) in respect of shares issued in lieu of cash dividends and an FRS 26 adjustment in respect of prior years of negative
£13 million, retained profit at 31 December 2005 amounted to £774 million (2004: £1,017 million as restated). The Company employs
no staff.
Statutory audit fees in respect of the Company were £0.1 million (2004: £0.1 million). Fees payable to the auditors in respect of other
work were £0.6 million (2004: £0.5 million).
A reconciliation of movement in the shareholders’ funds of the Company for the years ended 31 December 2005 and 2004 is given below:
Restated2005 2004
£m £m
Profit for the year 118 125
Dividends (378) (323)
(260) (198)
Actuarial losses recognised on pension scheme (net of related tax) (21) (7)
New share capital subscribed (note 9) 55 1,140
Net movement in shareholders’ funds (226) 935
Shareholders’ funds at beginning of year as originally reported 2,525 1,622
Prior year adjustments on adoption of FRS 17 and FRS 21 (note 3) 169 137
Shareholders’ funds at beginning of year as restated 2,694 1,759
Transitional adjustment from adoption of FRS 26 (note 3) (11)
Shareholders’ funds at beginning of year as restated including FRS 26 adjustments 2,683
Shareholders’ funds at end of year 2004 as originally reported – 2,525
Prior year adjustment on adoption of FRS 17 and FRS 21 (note 3) – 169
Shareholders’ funds at end of year (2004 as restated) 2,457 2,694
11. Directors’ remunerationInformation on directors’ remuneration is given in the remuneration report section within this Annual Report. Further information on the
transactions of the directors with the Company and the Group is given in notes I3 ‘Key management remuneration’ and I5 ‘Related party
transactions’ of the notes on the financial statements of the Group.
Notes on the parent company financial statements continued

Prudential plc Annual Report 2005 195
12. DividendsA final dividend of 11.02 pence per share was proposed on 15 March 2006. The dividend will be paid on 26 May 2006 to shareholders on
the register at the close of business on 24 March 2006. The dividend will absorb an estimated £267 million of shareholders’ funds. A scrip
dividend alternative will be offered to shareholders.
13. GuaranteesThe Company provides a guarantee for the £150 million principal amount of the 9.375 per cent bonds due 2007, which have been issued
by one of its finance subsidiaries. In certain instances the Company has also guaranteed that other subsidiaries will meet their obligations
when they fall due for payment.
14. Post-balance sheet eventsIn December 2005, the Company announced its intention to acquire the minority interest in Egg representing approximately 21.7 per cent
of the existing issued share capital of Egg. Under the terms of the offer, Egg shareholders would receive 0.2237 new ordinary shares in the
Company for each Egg share. In January 2006, the Company announced that it had received acceptances in respect of 80.3 per cent of the
shares that it did not already own and that it would extend the offer until further notice. In February 2006, the Board of Egg announced the
delisting of Egg shares. Full acceptance of the offer would result in the issue of 41 million new ordinary shares in the Company representing
1.7 per cent of its issued ordinary share capital as enlarged by this acquisition.

196 Prudential plc Annual Report 2005
The directors are responsible for preparing the Annual Report and
the Group and parent company financial statements in accordance
with applicable law and regulations.
Company law requires the directors to prepare Group and parent
company financial statements for each financial year. Under that
law the directors are required to prepare the Group financial
statements in accordance with International Financial Reporting
Standards (IFRS) as adopted by the European Union (EU) and
have elected to prepare the parent company financial statements
in accordance with UK Accounting Standards.
The Group financial statements are required by law and IFRS
as adopted by the EU to present fairly the financial position and
performance of the Group; the Companies Act 1985 provides in
relation to such financial statements that references in the relevant
part of that Act to financial statements giving a true and fair view
are references to their achieving a fair presentation.
The parent company financial statements are required by law to
give a true and fair view of the state of affairs of the parent company.
In preparing the Group and parent company financial statements,
the directors are required to:
■ Select suitable accounting policies and then apply them
consistently;
■ make judgements and estimates that are reasonable and prudent;
■ for the Group financial statements, state whether they have been
prepared in accordance with IFRS as adopted by the EU;
■ for the parent company financial statements, state whether
applicable UK Accounting Standards have been followed,
subject to any material departures disclosed and explained
in the parent company financial statements; and
■ prepare the financial statements on the going concern basis
unless it is inappropriate to presume that the Group and the
parent company will continue in business.
The directors are responsible for keeping proper accounting
records that disclose with reasonable accuracy at any time the
financial position of the parent company and enable them to
ensure that its financial statements comply with the Companies
Act 1985. They have general responsibility for taking such steps
as are reasonably open to them to safeguard the assets of the
Group and to prevent and detect fraud and other irregularities.
Under applicable law and regulations, the directors are
also responsible for preparing a directors’ report, directors’
remuneration report and corporate governance statement that
comply with that law and those regulations.
The directors are responsible for the maintenance and integrity of
the corporate and financial information included on the Company’s
website. Legislation in the UK governing the preparation and
dissemination of financial statements may differ from legislation
in other jurisdictions.
Statement of directors’ responsibilities in respect of the Annual Reportand the financial statements

Prudential plc Annual Report 2005 197
We have audited the consolidated and parent company financial
statements (the ‘financial statements’) of Prudential plc for the
year ended 31 December 2005 which comprise the consolidated
income statement, the consolidated and parent company balance
sheets, the consolidated cash flow statement, the statement of
change in shareholders’ equity and the related notes on pages
62 to 195. These financial statements have been prepared under
the accounting policies set out therein. We have also audited the
information in the directors’ remuneration report on pages 52 to 57
that is described as having been audited.
This report is made solely to the Company’s members, as a body,
in accordance with Section 235 of the Companies Act 1985. Our
audit work has been undertaken so that we might state to the
Company’s members those matters we are required to state to
them in an auditor’s report and for no other purpose. To the fullest
extent permitted by law, we do not accept or assume responsibility
to anyone other than the Company and the Company’s members
as a body, for our audit work, for this report, or for the opinions
we have formed.
Respective responsibilities of directors and auditors
The directors’ responsibilities for preparing the Annual Report and
the Group financial statements in accordance with applicable law
and International Financial Reporting Standards (IFRS) as adopted
by the European Union (EU), and for preparing the parent
company financial statements and the directors’ remuneration
report in accordance with applicable law and UK Accounting
Standards (UK Generally Accepted Accounting Practice) are set
out in the statement of directors’ responsibilities on page 196.
Our responsibility is to audit the financial statements and the part
of the directors’ remuneration report to be audited in accordance
with relevant legal and regulatory requirements and International
Standards on Auditing (UK and Ireland).
We report to you our opinion as to whether the financial
statements give a true and fair view and whether the financial
statements and the part of the directors’ remuneration report to
be audited have been properly prepared in accordance with the
Companies Act 1985 and whether, in addition, the Group financial
statements have been properly prepared in accordance with
Article 4 of the International Accounting Standards Regulation.
We also report to you if, in our opinion, the directors’ report is
not consistent with the financial statements, if the Company has
not kept proper accounting records, if we have not received all
the information and explanations we require for our audit, or if
information specified by law regarding directors’ remuneration
and other transactions is not disclosed.
We review whether the corporate governance statement reflects
the Company’s compliance with the nine provisions of the 2003
FRC Combined Code specified for our review by the Listing Rules
of the FSA, and we report if it does not. We are not required to
consider whether the Board’s statements on internal control cover
all risks and controls, or form an opinion on the effectiveness of
the Group’s corporate governance procedures or its risk and
control procedures.
We read other information contained in the Annual Report
and consider whether it is consistent with the audited financial
statements. We consider the implications for our report if
we become aware of any apparent misstatements or material
inconsistencies with the financial statements. Our responsibilities
do not extend to any other information.
Basis of audit opinion
We conducted our audit in accordance with International
Standards on Auditing (UK and Ireland) issued by the Auditing
Practices Board. An audit includes examination, on a test basis, of
evidence relevant to the amounts and disclosures in the financial
statements and the part of the directors’ remuneration report to be
audited. It also includes an assessment of the significant estimates
and judgments made by the directors in the preparation of the
financial statements, and of whether the accounting policies are
appropriate to the Group’s and Company’s circumstances,
consistently applied and adequately disclosed.
We planned and performed our audit so as to obtain all the
information and explanations which we considered necessary in
order to provide us with sufficient evidence to give reasonable
assurance that the financial statements and the part of the
directors’ remuneration report to be audited are free from material
misstatement, whether caused by fraud or other irregularity or
error. In forming our opinion we also evaluated the overall adequacy
of the presentation of information in the financial statements and
the part of the directors’ remuneration report to be audited.
Opinion
In our opinion:
■ The Group financial statements give a true and fair view, in
accordance with IFRS as adopted by the EU, of the state of the
Group’s affairs as at 31 December 2005 and of its profit for the
year then ended;
■ the Group financial statements have been properly prepared in
accordance with the Companies Act 1985 and Article 4 of the
IAS Regulation;
■ the parent company financial statements give a true and fair view,
in accordance with UK Generally Accepted Accounting Practice,
of the state of the parent company’s affairs as at 31 December
2005; and
■ the parent company financial statements and the part of the
directors’ remuneration report to be audited have been properly
prepared in accordance with the Companies Act 1985.
KPMG Audit Plc
Chartered Accountants
Registered Auditor
London
15 March 2006
Independent auditor’s report to the members of Prudential plc

198 Prudential plc Annual Report 2005
Additional IFRS basis information to enable consistent comparison of results for Prudential’s insurance operations
This information does not form part of the Group’s financial statements.
The statutory basis results included on pages 62 to 195 are for the years 2005 and 2004. These results reflect significant changes of
accounting policies from those previously applied under UK Generally Accepted Accounting Principles (GAAP). For all except three
IFRS standards these changes have been applied consistently in preparing the results for both years. However, as permitted by the
IFRS transition rules, and consistent with the approach of groups with significant banking operations, where retrospective application
is complex and onerous, the 2005 results include the effects of adoption of the standards IAS 32, IAS 39 and IFRS 4 for the Group’s
insurance and other operations from 1 January 2005 rather than 1 January 2004. The 2004 comparative results in those statements are
therefore prepared on an inconsistent basis.
The ‘pro forma IFRS basis’ comparative results shown below for 2004, reflect the estimated effect on the Group’s 2004 results if IAS 32,
IAS 39 and IFRS 4 had been applied from 1 January 2004 to the Group’s insurance operations.
The main purpose of providing this pro forma information is to present the operating results for the UK insurance business and short-term
fluctuations in investment returns for Jackson National Life (JNL) on a consistent basis. Under IAS 39 and IFRS 4, the assets and liabilities of
certain unit-linked and similar contracts of the UK insurance business are subject to remeasurement. For JNL derivatives held for economic
hedging purposes are fair valued under IAS 39 with value movements recorded in the income statement giving rise to significant levels of
volatility. In addition, debt securities of JNL are fair valued with value movements taken directly to shareholders’ reserves through the
statement of changes in equity.Based on
statutory IFRS Pro forma IFRSbasis results basis results
2005 2004 Summary results Note £m £m
Operating profit from continuing operations based on longer-term investment returns 1 957 699
Goodwill impairment charge (120) –
Short-term fluctuations in investment returns 2 211 293
Shareholders’ share of actuarial and other gains and losses on defined benefit pension schemes (50) (7)
Profit from continuing operations before tax attributable to shareholders (including actual investment returns) 998 985
Tax attributable to shareholders’ profits (241) (290)
Profit from continuing operations after tax 757 695
Discontinued operations (net of tax) 3 (94)
Profit for the year 760 601
Attributable to:
Equity holders of the Company 748 602
Minority interests 12 (1)
Profit for the year 760 601
Earnings per share
Continuing operations
From operating profit, based on longer-term investment returns after related tax and minority interests
of £761m (2004: £481m) 32.2p 22.7p
Adjustment for goodwill impairment charge (5.1)p –
Adjustment from post-tax longer-term investment returns to post-tax actual investment returns
(after related minority interests) 5.9p 9.0p
Adjustment for post-tax shareholders’ share of actuarial and other gains and losses on defined
benefit pension schemes (1.5)p (0.2)p
Based on profit from continuing operations after related tax and minority interests of £745m (2004: £669m) 31.5p 31.5p
Discontinued operations
Based on post-tax profit (loss) from discontinued operations (after minority interests) 0.1p (3.1)p
Based on profit for the year after minority interests of £748m (2004: £602m) 31.6p 28.4p
Supplementary International Financial Reporting Standards (IFRS) basis results

Prudential plc Annual Report 2005 199
Additional IFRS basis information to enable consistent comparison of results for Prudential’s insurance operations
This information does not form part of the Group’s financial statements.Based on
statutory IFRS Pro forma IFRSbasis results basis results
2005 2004 Changes in equity (net of minority interest) £m £m
Reserves
Profit for the year 748 602
Items recognised directly in equity:
Exchange movements 268 (191)
Movement on cash flow hedges (4) –
Unrealised valuation movements on securities classified as available-for-sale
Unrealised investment losses, net (751) (106)
Related change in amortisation of deferred income and acquisition costs 307 74
Related tax 218 23
Total items recognised directly in equity 38 (200)
Total income and expense for the year 786 402
Cumulative effect of changes in accounting principles on adoption of IAS 32, IAS 39 and IFRS 4,
net of applicable taxes, at 1 January 2005:
Statutory IFRS basis 226 –
Less: pro forma adjustment reflected in adjusted shareholders’ equity at 1 January 2005
(as reflected in statement of changes in equity – see below) for impact of adoption of
IAS 32, IAS 39 and IFRS 4 for insurance operations (251) –
Pro forma IFRS basis (i.e. transition adjustment in respect of banking and other non-insurance operations) (25) –
Dividends (380) (323)
Reserve movements in respect of share-based payments 15 10
Share capital and share premium
Proceeds from Rights Issue, net of expenses – 1,021
Other new share capital subscribed 55 119
Treasury shares
Movement on own shares purchased in respect of share-based payment plans 0 (2)
Movement on Prudential plc shares purchased by unit trusts consolidated under IFRS 3 14
Net increase in shareholders’ equity 454 1,241
Shareholders’ equity at beginning of year
As previously reported under UK GAAP 4,281 3,240
Changes arising from adoption of statutory IFRS 208 53
Statutory IFRS basis 4,489 3,293
Pro forma basis adjustments for estimated impact if IAS 32, IAS 39, and IFRS 4 had been adopted
from 1 January 2004 for insurance operations 251 206
Pro forma IFRS basis 4,740 3,499
Shareholders’ equity at end of year 5,194 4,740

200 Prudential plc Annual Report 2005
Additional IFRS basis information to enable consistent comparison of results for Prudential’s insurance operations. This information does
not form part of the Group’s financial statements.
1. Operating profit from continuing operations based on longer-term investment returns*
Based onstatutory IFRS Pro forma IFRS
basis results basis results2005 2004
Results analysis by business area £m £m
UK operations
UK insurance operations 400 296
M&G 163 136
Egg 44 61
Total 607 493
US operations
Jackson National Life 348 296
Broker-dealer and fund management (including Curian losses of £10m and £29m) 14 (14)
Total 362 282
Asian operations
Long-term business 195 117
Fund management 12 19
Development expenses (20) (15)
Total 187 121
Other income and expenditure
Investment return and other income 87 44
Interest payable on core structural borrowings (175) (154)
Corporate expenditure:
Group Head Office (70) (51)
Asia Regional Head Office (30) (29)
Charge for share-based payments for Prudential schemes (11) (7)
Total (199) (197)
Operating profit from continuing operations based on longer-term investment
returns before exceptional items 957 699
*IFRS basis operating profit from continuing operations based on longer-term investment returns excludes goodwill impairment charges, short-term fluctuations in investmentreturns and the shareholders’ share of actuarial and other gains and losses on defined benefit pension schemes. The amounts for these items are included in total IFRS profit asshown elsewhere in this Annual Report.
2. Short-term fluctuations in investment returns
Based onstatutory IFRS Pro forma IFRS
basis results basis results2005 2004
£m £m
US operations:
Movement in market value of derivatives used for economic hedging purposes 122 144
Actual less longer-term investment returns for other items 56 61
Asian operations 32 37
Other operations 1 51
211 293
Notes on the supplementary IFRS basis results

Prudential plc Annual Report 2005 201
The International Organisation of Securities Commissions (IOSCO)
has recommended that annual reports of publicly held companies
include a section on risk factors which discusses inherent risks
in the business and trading environment. The US Securities and
Exchange Commission (SEC) requires listed companies to disclose
prominently risk factors that are specific to the companies or
their industries in their annual reports on Form 20-F filed with
the SEC. The Accounting Standards Board’s Reporting Statement:
Operating and Financial Review (OFR), recommends as best
practice, that the OFR has a description of the principal risks and
uncertainties facing the business. The European Union (EU)
Prospectus Directive also requires disclosure of risk factors.
A number of factors (risk factors) affect Prudential’s operating results,
financial condition and trading price. The risk factors mentioned
below should not be regarded as a complete and comprehensive
statement of all potential risks and uncertainties. The information
given is as of the date of this report, is not updated, and any
forward-looking statements are made subject to the reservations
specified on the inside back cover of the Annual Report.
Prudential’s businesses are inherently subject to market
fluctuations and general economic conditions.
Prudential’s businesses are inherently subject to market
fluctuations and general economic conditions. In the UK, this is
because a significant part of Prudential’s shareholders’ profit is
related to bonuses for policyholders declared on its with-profits
products, which are broadly based on historic and current rates
of return on equity, real estate and fixed income securities, as well
as Prudential’s expectations of future investment returns.
In the US, fluctuations in prevailing interest rates can affect results
from Jackson National Life (JNL) which is predominantly a spread-
based business with the majority of its assets invested in fixed
income securities. In particular, fixed annuities and stable value
products in JNL expose the Group to the risk that changes in
interest rates which are not fully reflected in the interest rates
credited to customers will reduce spread. The spread is the
difference between the amounts that JNL is required to pay
under the contracts and the rate of return it is able to earn on its
general account investments to support the obligations under the
contracts. Declines in spread from these products or other spread
businesses that JNL conducts could have a material impact on its
businesses or results of operations.
For some non unit-linked investment products, in particular those
written in some of the Group’s Asian operations, it may not be
possible to hold assets which will provide cash flows to exactly
match those relating to policyholder liabilities. This is particularly
true in those countries where bond markets are not developed
and in certain markets such as Taiwan where regulated surrender
values are set with reference to the interest rate environment
prevailing at time of policy issue. This is due to the duration and
uncertainty of the liability cash flows and the lack of sufficient
assets of a suitable duration. This results in a residual asset/liability
mismatch risk which can be managed but not eliminated. Where
interest rates in these markets remain lower than surrender values
over a sustained period this could have an adverse impact on the
Group’s reported profit.
In all markets in which Prudential operates, its businesses
are susceptible to general economic conditions and changes
in investment returns which can change the level of demand
for Prudential’s products. Past uncertain trends in international
economic and investment climates which have adversely affected
Prudential’s business and profitability could be repeated. This
adverse effect would be felt principally through reduced
investment returns and credit defaults. In addition, falling
investment returns could impair Prudential’s operational capability,
including its ability to write significant volumes of new business.
Prudential in the normal course of business enters into a variety of
transactions, including derivative transactions with counterparties.
Failure of any of these counterparties, particularly in conditions of
major market disruption, to discharge their obligations, or where
adequate collateral is not in place, could have an adverse impact
on Prudential’s results.
Prudential is subject to the risk of exchange rate
fluctuations owing to the geographical diversity of
its businesses.
Due to the geographical diversity of Prudential’s businesses, it
is subject to the risk of exchange rate fluctuations. Prudential’s
international operations in the US and Asia, which represent a
significant proportion of operating profit and shareholders’ funds,
generally write policies and invest in assets denominated in local
currency. Although this practice limits the effect of exchange rate
fluctuations on local operating results, it can lead to significant
fluctuations in Prudential’s consolidated financial statements upon
translation of results into pounds sterling. The currency exposure
relating to the translation of reported earnings is not separately
managed. Consequently, this could impact on the Group’s gearing
ratios (defined as debt over debt plus shareholders’ funds). The
impact of gains or losses on currency translations is recorded as
a component of shareholders’ funds within the statement of
changes in equity.
Prudential conducts its businesses subject to regulation and
associated regulatory risks, including the effects of changes
in the laws, regulations, policies and interpretations and
any accounting standards in the markets in which it operates.
Changes in government policy, legislation or regulatory
interpretation applying to companies in the financial services
and insurance industries in any of the markets in which
Prudential operates, which in some circumstances may be applied
retrospectively, may adversely affect Prudential’s product range,
distribution channels, capital requirements and, consequently,
reported results and financing requirements. For instance,
regulators in jurisdictions in which Prudential operates may change
the level of capital required to be held by individual businesses. Also
these changes could include possible changes in the regulatory
framework for pension arrangements and policies, the regulation
of selling practices and solvency requirements. In the UK, the
Financial Services Authority’s (FSA) depolarisation reforms and
the rules relating to stakeholder products could have a significant
effect on types of products sold by Prudential, how its products
are priced, distributed and sold and on shareholders’ return
on with-profits business. Similar changes in regulation in other
jurisdictions could also have an impact elsewhere in the Group.
Risk factors

202 Prudential plc Annual Report 2005
The EU Financial Conglomerates Directive (FCD) requires
European financial services groups to demonstrate net aggregate
surplus capital in excess of solvency requirements at the Group
level in respect of shareholder-owned entities. The test is a
continuous requirement so that Prudential needs to maintain a
somewhat higher amount of regulatory capital at the Group level
than otherwise necessary in respect of some of its individual
businesses to accommodate, for example, short-term movements
in global foreign exchange rates, interest rates, deterioration
in credit quality and equity markets. In addition, changes in the
local regulatory regimes of designated territories could affect the
calculation of the Group’s solvency position under FCD. The EU is
also currently reviewing future solvency requirements (Solvency II)
with a directive expected during 2007 for implementation by member
states. Inconsistent application of these directives by regulators in
different EU member states may place Prudential at a competitive
disadvantage to other European financial services groups.
Various jurisdictions in which Prudential operates have created
investor compensation schemes that require mandatory
contributions from market participants in some instances in the
event of a failure of a market participant. As a major participant
in the majority of its chosen markets, circumstances could arise
where Prudential, along with other companies, may be required
to make such contributions.
Any further changes or modification of the recently introduced
International Financial Reporting Standards (IFRS) accounting
policies and European Embedded Value (EEV) guidance may
require a change in the reporting basis of future results or a
restatement of reported results.
The resolution of several issues affecting the financial
services industry could have a negative impact on
Prudential’s reported results or on its relations with
current and potential customers.
Prudential is, and in the future may be, subject to legal and
regulatory actions in the ordinary course of its business, both in
the UK and internationally. This could be a review of business
sold in the past under previously acceptable market practices at
the time. Pending legal and regulatory actions include proceedings
relating to aspects of Prudential’s business and operations which
are typical of the business it operates in such as the requirement
in the UK to provide redress to certain past purchasers of pension
and mortgage endowment policies and regulatory reviews on
products sold and industry practices, including in the latter case
businesses it has closed.
In the US, federal and state regulators have focused on, and
continue to devote substantial attention to, the mutual fund,
variable annuity and insurance product industries including new
federal regulations in respect of broker-dealers. As a result of
publicity relating to widespread perceptions of industry abuses,
there have been numerous regulatory inquiries and proposals
for legislative and regulatory reforms.
Although Prudential believes it has adequately reserved in all
material aspects for the costs of litigation and regulatory matters,
no assurance can be provided that such reserves are sufficient.
It is possible that Prudential’s future performance could be affected
by an unfavourable outcome in these matters.
Prudential’s businesses are conducted in highly
competitive environments with developing demographic
trends and Prudential’s continued profitability depends
on its management’s ability to respond to these pressures
and trends.
The markets for the UK, US and Asian financial services are highly
competitive, with several factors affecting Prudential’s ability to sell
its products and continued profitability, including price and yields
offered, financial strength and ratings, range of product lines and
product quality, brand strength and name recognition, investment
management performance, historical bonus levels, developing
demographic trends and customer appetite for certain savings
products. In some of its markets Prudential faces competitors that
are larger, have greater financial resources or a greater market
share, offer a broader range of products or have higher bonus
rates or claims-paying ratios. Further, heightened competition for
talented and skilled employees with local experience, particularly
in Asia, may limit the Group’s potential to grow its business as
quickly as planned.
Within the UK, Prudential’s principal competitors in the life market
include many of the major stock and mutual retail financial services
companies including, in particular, Aviva, Legal & General, HBOS
and Standard Life.
JNL’s competitors in the US include major stock and mutual
insurance companies, mutual fund organisations, banks and
other financial services companies. JNL’s principal life insurance
company competitors in the US include AIG, Allstate Financial,
Allianz Life of North America, AXA Financial Inc, Hartford Life Inc.,
ING, John Hancock, Lincoln Financial Group, Met Life and
Prudential Financial.
Within Asia, the Group’s main regional competitors are
international financial companies, including AIG, Allianz, ING
and Manulife.
Prudential believes competition will intensify across all regions
in response to consumer demand, technological advances, the
impact of consolidation, regulatory actions and other factors.
Prudential’s ability to generate an appropriate return depends
significantly upon its capacity to anticipate and respond
appropriately to these competitive pressures.
Downgrades in Prudential’s financial strength and credit
ratings could significantly impact its competitive position
and hurt its relationships with creditors or trading
counterparties.
Prudential’s financial strength and credit ratings, which are
intended to measure its ability to meet policyholder obligations,
are an important factor affecting public confidence in most
of Prudential’s products, and as a result its competitiveness.
Downgrades in Prudential’s ratings could have an adverse effect
on its ability to market products and retain current policyholders.
In addition, the interest rates Prudential pays on its borrowings are
affected by its debt credit ratings, which are in place to measure
Prudential’s ability to meet its contractual obligations. Prudential
believes the credit rating downgrades it experienced in 2002
and 2003, together with the rest of the UK insurance industry,
have not to date had a discernible impact on the performance
of its business.
Risk factors continued

Prudential plc Annual Report 2005 203
Prudential’s long-term senior debt is rated as A2 (stable outlook)
by Moody’s, AA– (negative outlook) by Standard & Poor’s and
AA– (stable outlook) by Fitch.
Prudential’s short-term debt is rated as P-1 by Moody’s, A1+ by
Standard & Poor’s and F1+ by Fitch.
The PAC long-term fund is rated Aa1 (stable outlook) by Moody’s,
AA+ (stable outlook) by Standard & Poor’s and AA+ by Fitch.
Adverse experience in the operational risks inherent
in Prudential’s business could have a negative impact
on its results of operations.
Operational risks are present in all of Prudential’s businesses,
including the risk of direct or indirect loss resulting from
inadequate or failed internal and external processes, systems
and human error or from external events. Prudential’s business is
dependent on processing a large number of complex transactions
across numerous and diverse products, and is subject to a number
of different legal and regulatory regimes. In addition, Prudential
outsources several operations, including certain UK processing
and IT functions. In turn, Prudential is reliant upon the operational
processing performance of its outsourcing partners.
Further, because of the long-term nature of much of Prudential’s
business, accurate records have to be maintained for significant
periods. Prudential’s systems and processes are designed to
ensure that the operational risks associated with its activities are
appropriately controlled but, for example, any weakness in the
administration systems or actuarial reserving processes could have
an impact on its results of operations during the effective period.
Prudential has not experienced or identified any operational
risks in its systems or processes during 2005, or which have
subsequently caused, or are expected to cause, a significant
negative impact on its results of operations.
Adverse experience against the assumptions used in pricing
products and reporting business results could significantly
affect Prudential’s results of operations.
Prudential needs to make assumptions about a number of factors
in determining the pricing of its products and for reporting the
results of its long-term business operations.
For example, the assumption that Prudential makes about
future expected levels of mortality is particularly relevant for its
UK annuity business. In exchange for a premium equal to the
capital value of their accumulated pension fund, pension annuity
policyholders receive a guaranteed payment, usually monthly, for
as long as they are alive. As part of its pension annuity pricing and
reserving policy, Prudential assumes that current rates of mortality
continuously improve over time. During the year, Prudential
carried out a review of its mortality experience across all of its non-
profit annuity business. As a result of this review, it strengthened
the realistic and statutory male assumptions and weakened the
realistic female assumptions to align the realistic assumptions
with recent experience. Prudential continues to assume future
improvements in mortality for males and females at levels
projected on the Continuous Mortality Investigations (CMI)
medium cohort table as published by the Institute and Faculty
of Actuaries. If mortality improvement rates significantly exceed
the improvement assumed, Prudential’s results of operations
could be adversely affected.
A further example is the assumption that Prudential makes about
future expected levels of the rates of early termination of products
by its customers (persistency). This is particularly relevant to its
lines of business other than its UK annuity business. Prudential’s
persistency assumptions reflect recent past experience for each
relevant line of business. Any expected deterioration in future
persistency is also reflected in the assumption. If actual levels of
future persistency are significantly lower than assumed (that is,
policy termination rates are significantly higher than assumed),
Prudential’s results of operations could be adversely affected.
In common with other industry participants, the profitability of
the Group’s businesses depends on a mix of factors including
mortality and morbidity trends, policy surrender rates, investment
performance, unit cost of administration and new business
acquisition expense.
As a holding company, Prudential is dependent
upon its subsidiaries to cover operating expenses
and dividend payments.
Prudential’s insurance and investment management operations
are generally conducted through direct and indirect subsidiaries.
As a holding company, Prudential’s principal sources of funds
are dividends from subsidiaries, shareholder-backed funds, the
shareholder transfer from Prudential’s long-term funds and any
amounts that may be raised through the issuance of equity, debt
and commercial paper.
Certain of the subsidiaries have regulatory restrictions that can limit
the payment of dividends, which in some circumstances could limit
the Group’s ability to pay dividends to shareholders.
Prudential operates in a number of markets through joint
ventures and other arrangements with third parties. These
arrangements involve certain risks that Prudential does not
face with respect to its consolidated subsidiaries.
Prudential operates, and in certain markets is required by local
regulation to operate, through joint ventures. Prudential’s ability to
exercise management control over its joint venture operations and
its investment in them depends on the terms of the joint venture
agreements, in particular, the allocation of control among, and
continued co-operation between, the joint venture participants.
Prudential may also face financial or other exposure in the event
that any of its joint venture partners fails to meet its obligations
under the joint venture or encounters financial difficulty. In addition,
a significant proportion of the Group’s product distribution is
carried out through arrangements with third parties not controlled
by Prudential and is dependent upon continuation of these
relationships. A temporary or permanent disruption to these
distribution arrangements could affect Prudential’s results
of operations.

204 Prudential plc Annual Report 2005
Operating profit from continuing operations based on longer-term investment returns*Results analysis by business area
2005 2004Note £m £m
UK operations
New business 5, 17 243 241
Business in force 6 183 245
Long-term business 426 486
M&G 163 136
Egg 44 61
Total 633 683
US operations
New business 5, 17 211 145
Business in force 6 530 237
Long-term business 741 382
Broker-dealer and fund management 24 15
Curian (10) (29)
Total 755 368
Asian operations
New business 5, 17 413 355
Business in force 6 163 105
Long-term business 576 460
Fund management 12 19
Development expenses (20) (15)
Total 568 464
Other income and expenditure
Investment return and other income 7 42 0
Interest payable on core structural borrowings (175) (154)
Corporate expenditure:
Group Head Office (70) (51)
Asia Regional Head Office (30) (29)
Charge for share-based payments for Prudential schemes (11) (7)
Total (244) (241)
Operating profit from continuing operations based on longer-term investment returns 1,712 1,274
Analysed as profits (losses) from:
New business 5, 17 867 741
Business in force 6 876 587
Long-term business 1,743 1,328
Asia development expenses (20) (15)
Other operating results (11) (39)
Total 1,712 1,274
*EEV basis operating profit from continuing operations based on longer-term investment returns excludes goodwill impairment charges, short-term fluctuations in investmentreturns, the shareholders’ share of actuarial and other gains and losses on defined benefit pension schemes, the effect of changes in economic assumptions and changes in thetime value of cost of options and guarantees caused by economic factors. The amounts for these items are included in total EEV profit. The directors believe that operating profit,as adjusted for these items, better reflects underlying performance. Profit on ordinary activities and basic earnings per share include these items together with actual investmentreturns. This basis of presentation has been adopted consistently throughout this supplementary information.
European Embedded Value (EEV) basis supplementary informationYear ended 31 December 2005

Prudential plc Annual Report 2005 205
Summarised consolidated income statement – EEV basisYear ended 31 December 2005
2005 2004Note £m £m
Operating profit from continuing operations based on longer-term investment returns
UK insurance operations 426 486
M&G 163 136
Egg 44 61
UK operations 633 683
US operations 755 368
Asian operations 568 464
Other income and expenditure (244) (241)
Operating profit from continuing operations based on longer-term investment returns 1,712 1,274
Goodwill impairment charge (120) –
Short-term fluctuations in investment returns 8 1,001 570
Shareholders’ share of actuarial and other gains and losses on defined benefit pension schemes 9 (47) (12)
Effect of changes in economic assumptions and time value of cost of options and guarantees 10 (302) (48)
Profit from continuing operations before tax (including actual investment returns) 2,244 1,784
Tax 11 (653) (553)
Profit from continuing operations for the financial year after tax before minority interests 1,591 1,231
Discontinued operations (net of tax) 3 (94)
Profit for the year 1,594 1,137
Attributable to:
Equity holders of the Company 1,582 1,138
Minority interests 12 (1)
Profit for the year 1,594 1,137
Earnings per share – EEV basisYear ended 31 December 2005
2005 2004Note £m £m
Continuing operations
From operating profit, based on longer-term investment returns, after related tax and minority interests
of £1,339m (2004: £916 million) 12 56.6p 43.2p
Based on profit from continuing operations after minority interests of £1,579m (2004: £1,205m) 12 66.8p 56.8p
Discontinued operations
Based on profit (loss) from discontinued operations after minority interests of £3m (2004: £(67)m) 0.1p (3.1)p
Total – based on total profit for the financial year after minority interests of £1,582m (2004: £1,138m) 66.9p 53.7p
Average number of shares (million) 2,365 2,121
Dividends per shareYear ended 31 December 2005
2005 2004
Dividends relating to the reporting period:
Interim dividend 5.30p 5.19p
Final dividend 11.02p 10.65p
Total 16.32p 15.84p
Dividends declared and paid in the reporting period:
Current year interim dividend 5.30p 5.19p
Final dividend for prior year 10.65p 10.29p
Total 15.95p 15.48p

206 Prudential plc Annual Report 2005
Movement in shareholders’ capital and reserves (excluding minority interests) – EEV basisYear ended 31 December 2005
2005 2004Note £m £m
Profit for the year attributable to equity holders of the Company 1,582 1,138
Items taken directly to equity:
Cumulative effect of IAS 32, IAS 39 and IFRS 4, net of applicable taxes, at 1 January 2005 (25) –
Unrealised valuation movement on securities classified as available-for-sale at 1 January 2005 (1) –
Movement on cash flow hedges (4) –
Exchange movements 377 (239)
Related tax 65 (1)
Proceeds from Rights Issue, net of expenses – 1,021
Other new share capital subscribed 55 119
Dividends (380) (323)
Reserve movements in respect of share-based payments 15 10
Treasury shares:
Movement in own shares in respect of share-based payment plans 0 (2)
Movement on Prudential plc shares purchased by unit trusts consolidated under IFRS 3 14
Net increase in shareholders’ capital and reserves 14 1,687 1,737
Shareholders’ capital and reserves, at beginning of year (excluding minority interests):
As previously reported on the achieved profits basis 8,596 7,005
Adjustments on implementation of statutory IFRS (excluding IAS 32, IAS 39 and IFRS 4) 17 165 15
Adjustments on implementation of EEV methodology 17 (147) (143)
As restated on EEV basis 14 8,614 6,877
Shareholders’ capital and reserves at end of year (excluding minority interests) 13, 14, 17 10,301 8,614
Comprising:
UK operations:
Long-term business 5,132 4,228
M&G:
Net assets 245 297
Acquired goodwill 1,153 1,153
Egg 303 273
6,833 5,951
US operations 3,418 2,570
Asian operations:
Net assets 2,070 1,631
Acquired goodwill 172 292
Other operations:
Holding company net borrowings (1,724) (1,299)
Other net liabilities (468) (531)
13, 14, 17 10,301 8,614
Net asset value per share
Based on EEV basis shareholders’ capital and reserves of £10,301m (2004: £8,614m) 432p 363p
Number of shares at year end (millions) 2,387 2,375
European Embedded Value (EEV) basis supplementary informationcontinued

Prudential plc Annual Report 2005 207
Summarised consolidated balance sheet – EEV basis31 December 2005
2005 2004Note £m £m
Total assets less liabilities, excluding insurance funds 174,258 148,682
Less insurance funds:*
Policyholder liabilities (net of reinsurers’ share) and unallocated surplus of with-profits funds (169,064) (144,193)
Less shareholders’ accrued interest in the long-term business 5,107 4,125
(163,957) (140,068)
Total net assets 14, 17 10,301 8,614
Share capital 119 119
Share premium 1,564 1,558
Statutory basis shareholders’ reserves (following adoption of IFRS) 3,511 2,812
Additional EEV basis retained profit 5,107 4,125
Shareholders’ capital and reserves (excluding minority interests) 14, 17 10,301 8,614
*Including liabilities in respect of insurance products classified as investment contracts under IFRS 4.
The supplementary information on pages 204 to 229 was approved by the Board of Directors on 15 March 2006.
Sir David Clementi Mark Tucker
Chairman Group Chief Executive
Philip Broadley
Group Finance Director

208 Prudential plc Annual Report 2005
1. Basis of preparationThe EEV basis results have been prepared in accordance with the EEV principles issued by the CFO Forum of European Insurance
Companies in May 2004 and expanded by the Additional Guidance on EEV Disclosures published in October 2005. Where appropriate
the EEV basis results include the effects of adoption of International Financial Reporting Standards (IFRS).
The EEV results for the Group include the results for the covered business on the EEV basis. These results are then combined with the
IFRS basis results of the Group’s other operations.
With two exceptions, covered business comprises the Group’s long-term business operations. The definition of long-term business
operations is consistent with previous practice under modified statutory basis (MSB) and achieved profits basis reporting and comprises
those contracts falling under the definition of long-term insurance business for regulatory purposes together with, for US operations,
contracts that are in substance the same as guaranteed investment contracts (GICs) but do not fall within the technical definition. Under
the EEV principles, the results for covered business now incorporate the projected margins of attaching internal fund management.
The exceptions are for the closed Scottish Amicable Insurance Fund (SAIF) and in respect of the Group’s defined benefit pension
schemes. SAIF is closed to new business and the assets and liabilities of the fund are wholly attributable to the policyholders of the
fund. As regards the Group’s defined benefit pension schemes, the deficits attaching to the Prudential Staff Pension Scheme (PSPS)
and Scottish Amicable scheme are excluded. These deficits are partially attributable to the Prudential Assurance Company (PAC)
with-profits fund and shareholder-backed long-term business. Further details are explained in note 2f.
The directors are responsible for the preparation of the supplementary information in accordance with the EEV Principles.
Previously, the Group has reported supplementary information on the achieved profits basis for its interim and full year financial reporting.
The adoption of the EEV basis reporting in place of achieved profits basis reporting reflects developments through the CFO Forum to
achieve a better level of consistency and an improved embedded value methodology, and is applied by the major European insurance
companies in their financial reporting.
2. Methodologya) Embedded value
Overview
The embedded value is the present value of the shareholders’ interest in the earnings distributable from assets allocated to covered
business after sufficient allowance has been made for the aggregate risks in that business. The shareholders’ interest in the Group’s
long-term business comprises:
■ Present value of future shareholder cash flows from in-force covered business (value of in-force business), less a deduction for the
cost of locked-in (encumbered) capital;
■ locked-in (encumbered) capital; and
■ shareholders’ net worth in excess of encumbered capital.
The value of future new business is excluded from the embedded value.
Notwithstanding the basis of presentation of results (as explained in notes 4 and 6) no smoothing of market or account balance values,
unrealised gains or investment return is applied in determining the embedded value or the profit before tax.
Value of in-force business
The embedded value results are prepared incorporating best estimate assumptions about all relevant factors including levels of future
investment return, expenses, surrender levels and mortality. These assumptions are used to project future cash flows. The present value
of the future cash flows is then calculated using a discount rate which reflects both the time value of money and the risks associated with
the cash flows that are not otherwise allowed for.
The total profit that emerges over the lifetime of an individual contract as calculated using the embedded value basis is the same as that
calculated under the IFRS basis and, prior to IFRS adoption, the MSB under UK Generally Accepted Accounting Principles (GAAP).
However, since the embedded value basis reflects discounted future cash flows under this methodology the profit emergence is advanced,
thus more closely aligning the timing of the recognition of profits with the efforts and risks of current management actions, particularly
with regard to business sold during the year.
Cost of capital
A charge is deducted from the embedded value for the cost of capital supporting the Group’s long-term business. This capital is referred
to as encumbered capital. The cost is the difference between the nominal value of the capital and the discounted present value of the
projected releases of this capital allowing for investment earnings (net of tax) on the capital.
The annual result is impacted by the movement in this cost from year to year which comprises a charge against new business profit and
a release in respect of the reduction in capital requirements for business in force as this runs off.
Where the capital is held within a with-profits long-term fund, the value placed on surplus assets in the fund is already discounted to
reflect its release over time and no further adjustment is necessary in respect of solvency capital. However, where business is funded
directly by shareholders, the capital requires adjustment to reflect the cost of that capital to shareholders.
Notes on the EEV basis supplementary information

Prudential plc Annual Report 2005 209
2. Methodology continuedFinancial options and guarantees
Nature of options and guarantees in Prudential’s long-term business
UK insurance operations
The only significant financial options and guarantees in the UK insurance operations arise in the with-profits sub-fund and SAIF.
With-profits products provide returns to policyholders through bonuses that are smoothed. There are two types of bonuses: annual and
final. Annual bonuses are declared once a year, and once credited, are guaranteed in accordance with the terms of the particular product.
Unlike annual bonuses, final bonuses are guaranteed only until the next bonus declaration. The with-profits sub-fund held a provision on
the Pillar 1 Peak 2 basis of £52 million (2004: £49 million) at 31 December 2005 to honour guarantees on a small amount of guaranteed
annuity products.
Beyond the generic features described above, and the provisions held in respect of guaranteed annuities, there are very few explicit
options or guarantees of the with-profits sub-fund such as minimum investment returns, surrender values, or annuity at retirement and
any granted have generally been at very low levels.
The Group’s main exposure to guaranteed annuities in the UK is through SAIF and a provision on the Pillar 1 Peak 2 basis of £619 million
(2004: £648 million) was held in SAIF at 31 December 2005 to honour the guarantees.
Jackson National Life
The principal options and guarantees valued under EEV for Jackson National Life (JNL) are associated with the fixed annuity and variable
annuity lines of business.
Fixed annuities provide that at JNL’s discretion it may reset the interest rate credited to policyholders’ accounts, subject to a guaranteed
minimum. The guaranteed minimum return varies from 1.5 per cent to 5.5 per cent (2004: 1.5 per cent to 5.5 per cent), depending on the
particular product, jurisdiction where issued, and date of issue. At 31 December 2005, 73 per cent (2004: 73 per cent) of the fund relates
to policies with guarantees of 3 per cent or less. The average guarantee rate is 3.3 per cent (2004: 3.3 per cent).
Fixed annuities also present a risk that policyholders will exercise their option to surrender their contracts in periods of rapidly rising
interest rates, possibly requiring JNL to liquidate assets at an inopportune time.
Variable annuity contracts may contain guarantees of certain minimum payments in the event of death, withdrawal or annuitisation.
These guarantees may be related to (a) the amount of total deposits made to the contract adjusted for any partial withdrawals, (b) the
total deposits made to the contract adjusted for any partial withdrawals, plus a minimum annual return, or (c) the highest contract value
on a specified anniversary date adjusted for any withdrawals following the contract anniversary.
These guarantees generally protect the policyholder’s value in the event of poor equity market performance.
JNL also issues fixed index annuities that enable policyholders to obtain a portion of an equity-linked return while providing a guaranteed
minimum return. The guaranteed minimum returns would be of a similar nature as those described above for fixed annuities. In the case
of the potential equity participation, JNL hedges this risk by purchasing futures and options on the relevant index.
Asian operations
Subject to local market circumstances and regulatory requirements, the guarantee features described above in respect of UK business
broadly apply to similar types of participating contracts written in the PAC Hong Kong branch, Singapore and Malaysia. Participating
products have both guaranteed and non-guaranteed elements.
Non-participating long-term products are the only ones where the insurer is contractually obliged to provide guarantees on all benefits.
The most significant book of non-participating business in the Group’s Asian operations is Taiwan’s whole of life contracts. For these
contracts there are floor levels of policyholder benefits that accrue at rates set at inception which are set by reference to minimum
returns established by local regulation at the time of inception. These rates do not vary subsequently with market conditions. Under
these contracts the cost of premiums are also fixed at inception based on a number of assumptions at that time, including long-term
interest rates, mortality assumptions and expenses. The guaranteed maturity and surrender values reflect the pricing basis.
Time value
The value of financial options and guarantees comprises two parts. One is given by a deterministic valuation on best estimate assumptions
(the intrinsic value). The other part arises from the variability of economic outcomes in the future (the time value).
Where appropriate, a full stochastic valuation has been undertaken to determine the value of the in-force business including the cost of
capital. A deterministic valuation of the in-force business is also derived using consistent assumptions and the time value of the financial
options and guarantees is derived as the difference between the two.
The economic assumptions used for the stochastic calculations are consistent with those used for the deterministic calculations.
Assumptions specific to the stochastic calculations such as equity volatility and credit losses reflect local market conditions and are based
on a combination of actual market data, historic market data and an assessment of long-term economic conditions. Common principles
have been adopted across the Group for the stochastic asset models, for example, separate modelling of individual asset classes but with
allowance for correlation between the various asset classes. Details of the key characteristics of each model are given in note 3.

210 Prudential plc Annual Report 2005
2. Methodology continuedb) Level of encumbered capital
In adopting the EEV principles, Prudential has based encumbered capital on its internal targets for economic capital subject to it being
at least the local statutory minimum requirements. Economic capital is assessed using internal models, but when applying EEV Prudential
does not take credit for the significant diversification benefits that exist within the Group. For with-profits business written in a segregated
life fund, as is the case in the UK and Asia, the capital available in the fund is sufficient to meet the encumbered capital requirements.
■ UK: economic capital requirements for annuity business are fully met by Pillar I requirements being 4 per cent of mathematical reserves
(as used for achieved profits reporting), which are also sufficient to meet Pillar II requirements;
■ US: level of capital that has previously been locked in for achieved profits reporting, namely 235 per cent of the risk-based capital
required by the National Association of Insurance Commissioners at the Company Action Level (CAL), is sufficient to meet the economic
capital requirement;
■ Asia: economic capital target is substantially higher than local statutory requirements in total. Economic capital requirements vary by
territory, but in aggregate, the encumbered capital is equivalent to the amount required under the Financial Conglomerates Directive (FCD).
The table below summarises the levels of encumbered capital as a percentage of the relevant statutory requirement:
Capital as a percentage of relevant statutory requirement
UK business (excluding annuities) 100% of EU minimum
UK annuity business 100% of EU minimum
Jackson National Life 235% of CAL
Asian operations 100% of FCD
c) Risk discount rates
Overview
Under the CFO Forum Principles, discount rates used to determine the present value of future cash flows are set equal to risk-free rates
plus a risk margin. The risk margin should reflect any risk associated with the emergence of distributable earnings that is not allowed for
elsewhere in the valuation. Prudential has selected a granular approach to better reflect changes in risk inherent in each product group.
The risk discount rate so derived does not reflect a market beta but instead reflects the risk of volatility associated with the cash flows in
the embedded value model.
Since financial options and guarantees are explicitly valued under the EEV methodology, discount rates under EEV are set excluding the
effect of these product features.
For Prudential’s UK annuity business, which is well matched, the predominant risks are credit risk and longevity risk. For this line of
business the achieved profits methodology for embedded values has been carried over and the risk discount rate has been derived by
comparison to a market consistent valuation.
Allowance for risk
The risk allowance in the risk discount rate is determined as follows:
Market risk
Under Capital Asset Pricing Methodology (CAPM) the discount rate is determined as:
Discount rate = risk-free rate + (beta x equity risk premium)
Under CAPM, the beta of a portfolio or product measures its relative market risk.
The risk discount rates reflect the market risk inherent in each product group and hence the volatility of product cash flows. They are
determined by considering how the profits from each product are impacted by changes in expected returns on various asset classes,
and by converting this into a relative rate of return it is possible to derive a product specific beta.
CAPM does not include any allowance for non-market risks since these are assumed to be fully diversifiable. For EEV purposes, however,
a risk margin is added for non-diversifiable non-market risks and to cover Group level risks.
Product-level betas are calculated each year. They are combined with the most recent product mix to produce appropriate betas and risk
discount rates for each major product grouping.
Notes on the EEV basis supplementary information continued

Prudential plc Annual Report 2005 211
2. Methodology continuedDiversifiable non-market risks
No allowance is required for non-market risks where these are assumed to be fully diversifiable. The majority of non-market risks are
considered to be diversifiable.
Non-diversifiable, non-market risks
Finance theory cannot be used to determine the appropriate component of beta for non-diversifiable non-market risks since there is no
observable risk premium associated with it that is akin to the equity risk premium. Recognising this, a pragmatic approach has been used.
A constant margin of 50 basis points has been added to the risk margin derived for market risk to cover the non-diversifiable non-market
risks associated with the business.
d) Management actions
In deriving the time value of financial options and guarantees, management actions in response to emerging investment and fund solvency
conditions have been modelled. Management actions encompass, but are not confined to, the following areas:
■ Investment allocation decisions;
■ levels of reversionary bonuses and credited rates; and
■ total claim values.
Bonus rates are projected from current levels and varied in accordance with assumed management actions applying in the emerging
investment and fund solvency conditions.
In all instances the modelled actions are in accordance with approved local practice and therefore reflect the options actually available to
management. For the PAC with-profits sub-fund, the actions assumed are consistent with those set out in the Principles and Practices of
Financial Management.
e) With-profits business and the treatment of the estate
For the PAC with-profits sub-fund, the shareholders’ interest in the estate is derived by increasing terminal bonus rates so as to exhaust
the estate over the lifetime of the in-force with-profits business. In those few extreme scenarios where the total assets of the life fund are
insufficient to meet policyholder claims in full, the excess cost is fully attributed to shareholders.
f) Pension costs
The Group operates three defined benefit schemes in the UK. The principal scheme is the Prudential Staff Pension Scheme (PSPS).
The other two much smaller schemes are the Scottish Amicable and M&G schemes. There is also a small scheme in Taiwan.
Under IFRS the deficits attaching to these schemes are accounted for in accordance with the provisions of IAS 19. The deficits represent
the difference between the market value of the schemes’ assets and the discounted value of projected future benefit payments to retired
members and deferred pensioners and, to the extent of service to date, current employed members.
For PSPS the deficit is allocated between the PAC with-profits sub-fund and shareholder-backed operations by reference to the activities
of the members of the scheme during their period of service. For the 2004 year end the deficit was allocated in the ratio 80/20. For the
2005 year end, following further detailed consideration of the sourcing of previous contributions by Group companies and funds, this
ratio has been altered to 70/30 for the allocation of the deficit between the with-profits sub-fund and shareholder-backed operations.
Additional details on the effect of the movement on the deficits of the Group’s defined benefit pension schemes is set out in note 9.
Under the EEV basis the IAS 19 basis deficit is initially allocated in the same manner. The shareholders’ 10 per cent interest in the PAC
with-profits sub-fund estate is determined after deduction of the portion of the IAS 19 basis deficits attributable to the fund. Adjustments
under EEV in respect of accounting for deficits on deferred benefit schemes are reflected as part of other operations, as shown in note 13.
Separately, the projected cash flows of in-force covered business include contributions to the defined benefit schemes for future service
based on the contribution basis to the schemes applying at the time of preparation of results.
g) Debt capital
Core structural debt liabilities are carried at market value.

212 Prudential plc Annual Report 2005
3. Assumptionsa) Best estimate assumptions
Best estimate assumptions are used for the projections, where best estimate is defined as the mean of the distribution of all possible
outcomes. The assumptions are reviewed actively and changes are made when evidence exists that changes in future experience are
reasonably certain.
Assumptions required in the calculation of the value of options and guarantees, for example relating to volatilities and correlations, or
dynamic algorithms linking liabilities to assets, have been set equal to the best estimates and, wherever material and practical, reflect
any dynamic relationships between the assumption and the stochastic variables.
b) Principal economic assumptions
Deterministic
In most countries, the long-term expected rates of return on investments and risk discount rates are set by reference to period end rates
of return on fixed interest securities. This ‘active’ basis of assumption setting has been applied in preparing the results of all the Group’s
UK and US long-term business operations. For the Group’s Asian operations, the active basis is appropriate for business written in Japan,
Korea and US dollar denominated business written in Hong Kong.
An exception to this general rule is that for countries where long-term fixed interest markets are underdeveloped, investment return
assumptions and risk discount rates are based on an assessment of longer-term economic conditions. Except for the countries listed
above, this basis is appropriate for the Group’s Asian operations.
Expected returns on equity and property asset classes are derived by adding a risk premium, also based on the long-term view of Prudential’s
economists in respect of each territory, to the risk-free rate. In the UK the equity risk premium is 4.0 per cent (2004: 3.0 per cent) above
risk-free rates. The equity risk premium in the US is also 4.0 per cent (2004: 3.0 per cent). In Asia, equity risk premiums range from
3.0 per cent to 5.75 per cent. Assumptions for other asset classes, such as corporate bond spreads, are set consistently as best estimate
assumptions.
The investment return assumptions as derived above are applied to the actual assets held at the valuation date to derive the overall
fund-earned rate.
The table below summarises the principal financial assumptions:31 Dec 2005 31 Dec 2004
% %
UK insurance operations
Risk discount rate:
New business 7.55 7.1
In force 7.7 7.1
Pre-tax expected long-term nominal rates of investment return:
UK equities 8.1 7.6
Overseas equities 8.1 to 8.75 7.3 to 8.3
Property 6.4 6.3
Gilts 4.1 4.6
Corporate bonds 4.9 5.5
Expected long-term rate of inflation 2.9 2.9
Post-tax expected long-term nominal rate of return:
Pension business (where no tax applies) 7.1 6.8
Life business 6.3 5.9
US operations (Jackson National Life)
Risk discount rate:
New business 6.9 6.1
In force 6.1 5.8
Expected long-term spread between earned rate and rate credited to
policyholders for single premium deferred annuity business 1.75 1.75
US 10-year treasury bond rate at end of period 4.4 4.3
Pre-tax expected long-term nominal rate of return for US equities 8.4 7.3
Expected long-term rate of inflation 2.4 2.6
Notes on the EEV basis supplementary information continued

Prudential plc Annual Report 2005 213
3. Assumptions continuedAsian operations
Hong Kong Hong KongChina (note iii) India Indonesia Japan Korea China (note iii) India Indonesia Japan Korea
31 Dec 31 Dec 31 Dec 31 Dec 31 Dec 31 Dec 31 Dec 31 Dec 31 Dec 31 Dec 31 Dec 31 Dec 2005 2005 2005 2005 2005 2005 2004 2004 2004 2004 2004 2004
% % % % % % % % % % % %
Risk discount rate:
New business 12.0 5.9 16.5 17.5 5.0 10.3 10.0 4.7 16.0 18.75 5.0 7.1
In force 12.0 6.15 16.5 17.5 5.0 10.3 10.0 5.0 16.0 18.75 5.0 7.1
Expected long-term rate
of inflation 4.0 2.25 5.5 6.5 0.0 2.75 3.0 2.25 5.25 7.75 0.0 2.75
Government bond yield 9.0 4.8 10.5 11.5 1.8 5.8 7.25 4.9 10.25 13.0 1.9 3.9
Taiwan TaiwanMalaysia Philippines Singapore (note ii) Thailand Vietnam Malaysia Philippines Singapore (note ii) Thailand Vietnam
31 Dec 31 Dec 31 Dec 31 Dec 31 Dec 31 Dec 31 Dec 31 Dec 31 Dec 31 Dec 31 Dec 31 Dec 2005 2005 2005 2005 2005 2005 2004 2004 2004 2004 2004 2004
% % % % % % % % % % % %
Risk discount rate:
New business 9.4 16.5 6.7 9.0 13.75 16.5 9.0 16.25 6.3 7.1 13.5 15.5
In force 9.0 16.5 6.8 9.4 13.75 16.5 8.7 16.25 6.4 8.2 13.5 15.5
Expected long-term rate
of inflation 3.0 5.5 1.75 2.25 3.75 5.5 3.0 5.25 2.25 2.25 3.75 4.5
Government bond yield 7.5 10.5 4.5 5.5 7.75 10.5 7.0 10.5 5.0 5.5 7.75 9.75
Asia total Asia total31 Dec 31 Dec
2005 2004% %
Weighted risk discount rate (note i)
New business 9.8 8.0
In force 8.4 7.9
Notes(i) The weighted discount rates for the Asian operations shown above have been determined by weighting each country’s discount rates by reference to the EEV basis operatingresult for new business and the closing value of in-force business.
(ii) For traditional business in Taiwan, the economic scenarios used to calculate 2005 EEV basis results reflect the assumption of a phased progression of the bond yields from the current rates to the long-term expected rates. The projections assume that, in the average scenario, the current bond yields of around 2 per cent trend towards 5.5 per cent at 31 December 2012. Allowance is made for the mix of assets in the fund, our future investment strategy and the market value depreciation of the bonds as a result of theassumed yield increases. This gives rise to an average assumed Fund Earned Rate that trends from 2.3 per cent to 5.4 per cent in 2013 and falls below 2.3 per cent for seven yearsdue to the depreciation of bond values as yields rise. Thereafter, the Fund Earned Rate fluctuates around a target of 5.9 per cent. This compares to a grading of 3.4 per cent at31 December 2004 to 5.9 per cent by 31 December 2012 for the 2004 results. Consistent with our EEV methodology, a constant discount rate has been applied to the projectedcash flows.
(iii) Assumptions for US dollar denominated business which comprises the larger proportion of the in-force Hong Kong business.
(iv) Assumed equity yieldsThe most significant equity holdings in the Asian operations are in Hong Kong, Singapore and Malaysia. The mean equity return assumptions for those territories at 31 December2005 (2004) were 8.6 per cent (7.3 per cent), 9.3 per cent (9.75 per cent) and 12.8 per cent (12.25 per cent). To obtain the mean, an average over all simulations of the accumulatedreturn at the end of the projection period is calculated. The annual average return is then calculated by taking the root of the average accumulated return minus 1.
Stochastic
The economic assumptions used for the stochastic calculations are consistent with those used for the deterministic calculations described
above. Assumptions specific to the stochastic calculations such as the volatilities of asset returns reflect local market conditions and are
based on a combination of actual market data, historic market data and an assessment of longer-term economic conditions. Common
principles have been adopted across the Group for the stochastic asset models, for example, separate modelling of individual asset classes
but with allowance for correlation between the various asset classes.
Details are given below of the key characteristics and calibrations of each model.
UK insurance operations■ Interest rates are projected using a two-factor model calibrated to actual market data;
■ the risk premium on equity assets is assumed to follow a log-normal distribution;
■ the corporate bond return is calculated as the return on a zero-coupon bond plus a spread. The spread process is a mean reverting
stochastic process; and
■ property returns are modelled in a similar fashion to corporate bonds, namely as the return on a riskless bond, plus a risk premium,
plus a process representative of the change in residual values and the change in value of the call option on rents.

214 Prudential plc Annual Report 2005
3. Assumptions continuedThe rates to which the model has been calibrated are set out below:
Mean returns have been derived as the annualised arithmetic average return across all simulations and durations.
Standard deviations have been calculated by taking the annualised variance of the returns over all the simulations, taking the square root
and averaging over all durations in the projection. For bonds the standard deviations relate to the yields on bonds of the average portfolio
duration. For equity and property, they relate to the total return on these assets. The standard deviations applied are as follows:
Standard deviation%
Government bond yield 2.0
Corporate bond yield 5.5
Equities:
UK 18.0
Overseas 16.0
Property 15.0
Jackson National Life■ Interest rates are projected using a log-normal generator calibrated to actual market data;
■ corporate bond returns are based on Treasury securities plus a spread that has been calibrated to current market conditions and varies
by credit quality; and
■ variable annuity equity and bond returns have been stochastically generated using a regime-switching log-normal model with parameters
determined by reference to historical data. The volatility of equity fund returns ranges from 18.6 per cent to 28.1 per cent, depending
on risk class, and the volatility of bond funds ranges from 1.4 per cent to 1.8 per cent.
Asian operations
The same asset return model, as used in the UK, appropriately calibrated, has been used for the Asian operations. The principal asset classes
are government and corporate bonds. Equity holdings are much lower than in the UK whilst property is not held as an investment asset.
The stochastic cost of guarantees are only of significance for the Hong Kong, Singapore, Malaysia and Taiwan operations.
The mean stochastic returns are consistent with the mean deterministic returns for each country. The volatility of equity returns ranges
from 18 per cent to 26 per cent, and the volatility of government bond returns ranges from 1.6 per cent to 8.9 per cent.
c) Demographic assumptions
Persistency, mortality and morbidity assumptions are based on an analysis of recent experience but also reflect expected future
experience. Where relevant, when calculating the time value of in-force business, policyholder withdrawal rates vary in line with the
emerging investment conditions according to management’s expectations.
d) Expense assumptions
Expense levels, including those of service companies that support the Group’s long-term business operations, are based on internal
expense analysis investigations and are appropriately allocated to acquisition of new business and renewal of in-force business.
Exceptional expenses are identified separately and reported separately. No productivity gains have been assumed.
Asia development and Regional Head Office expenses are charged to EEV basis results as incurred. No adjustment is made to the
embedded value of covered business as the amounts of expenditure that relate to operating expenses are not material. Similarly corporate
expenditure for Group Head Office, to the extent not allocated to the PAC with-profits fund, is charged to the EEV basis result as incurred.
e) Inter-company arrangements
There are no inter-company arrangements such as reinsurance or loans associated with covered business for which adjustment has been
required in preparing the EEV basis results.
f) Taxation and other legislation
Current taxation and other legislation has been assumed to continue unaltered except where changes have been announced and the
relevant legislation passed.
g) Fund management and service companies
The value of future profits or losses from fund management and service companies that support the Group’s covered businesses are
included in the profits for new business and the in-force value of the Group’s long-term business.
Notes on the EEV basis supplementary information continued

Prudential plc Annual Report 2005 215
4. Accounting presentationa) Analysis of profit before tax
To the extent applicable, presentation of the EEV profit for the year is consistent with the basis the Group applies for analysis of IFRS
basis profits before shareholder taxes between operating and non-operating results. Operating results reflect the underlying results of
the Group’s continuing operations including longer-term investment returns. Operating results include the impact of routine changes of
estimates and non-economic assumptions. Non-operating results include certain recurrent and exceptional items that primarily do not
reflect the performance in the year of the Group’s continuing operations.
b) Investment return
Profit before tax
With the exception of debt securities held by JNL, investment gains and losses during the year (to the extent that changes in capital
values do not directly match changes in liabilities) are included directly in the profit for the year and shareholders’ funds as they arise.
In the case of JNL, market value movements on debt securities are initially recorded as movements in shareholder reserves, reflecting
the available-for-sale categorisation under IFRS. Similarly the value movements on derivatives are recorded in the income statement.
However, it is assumed that fixed income investments will normally be held until maturity. Therefore, unrealised gains and losses on these
securities are not reflected in either the EEV or statutory basis results and, except on realisation or impairment of investments, only income
received and the amortisation of the difference between cost and maturity values are recognised to the extent attributable to shareholders.
This is consistent with the basis of valuation of future cash flows of in-force business, which inter alia, reflects spread basis earnings which
are not directly affected by short-term value movements in fixed income securities. Similar principles apply to value movements on JNL’s
derivatives that are fair valued for IFRS reporting with value movements booked in the IFRS income statement.
Investment returns reflect those earned on a market basis over the period without smoothing, but after appropriate adjustments for
movements in the additional shareholders’ interest recognised on the EEV basis.
Operating profit
Investment returns, including investment gains, in respect of long-term insurance business are recognised in operating results at the
expected long-term rate of return. For the purposes of calculating longer-term investment return to be included in operating results
of UK operations, where equity holdings are a significant proportion of investment portfolios, values of assets at the beginning of the
reporting period are adjusted to remove the effects of short-term market volatility.
For the purposes of determining the long-term returns for debt securities of shareholder-backed operations, a risk margin charge is
included which reflects the expected long-term rate of default based on the credit quality of the portfolio. Interest-related realised
gains and losses are amortised to the operating results over the maturity period of the sold bonds. For equity-related investments of
JNL, a long-term rate of return is assumed, which reflects the aggregation of risk-free rates and equity risk premium.
c) Pension costs
Profit before tax
Movements on the shareholders’ share of deficits of the Group’s defined benefit pension schemes adjusted for contributions paid in
the year are recorded within the income statement. Consistent with the basis of distribution of bonuses and the treatment of the estate
described in notes 2d) and 2e), the shareholders’ share incorporates 10 per cent of the proportion of the deficits attributable to the PAC
with-profits sub-fund. The deficits are determined by applying the requirements of IAS 19.
Actuarial gains and losses
Actuarial gains and losses comprise:
■ The difference between actual and expected return on the scheme assets;
■ experience gains and losses on scheme liabilities; and
■ the impact of altered economic and other assumptions on the discount value of scheme liabilities.
These items are recorded in the income statement but, consistent with the IFRS basis of presentation, are excluded from operating results.
For 2005 additional non-recurrent gains and losses in respect of the Group’s defined benefit pension schemes have been recorded. These
are explained in note 9.
d) Effect of changes in economic assumptions and time value of cost of options and guarantees
Movements in the value of in-force business caused by changes to economic assumptions and the time value of cost of options and
guarantees, (which is primarily due to economic experience over the year and changes in economic assumptions) are recorded in
non-operating results.
e) Results for fund management operations
The results of the Group’s fund management operations include the profits from management of internal and external funds. For EEV
basis reporting, Group shareholders’ other income is adjusted to deduct the expected margin for the year on management of covered
business. The deduction is on a basis consistent with that used for projecting the results for covered business. Group operating profit
accordingly includes the variance between actual and expected profit in respect of covered business.

216 Prudential plc Annual Report 2005
4. Accounting presentationf) Capital held centrally for Asian operations
In adopting the EEV principles Prudential has decided to set encumbered capital at its internal targets for economic capital. In Asia,
the economic capital target is substantially higher than the local statutory requirements in total. Accordingly, capital is held centrally for
Asian operations. For the purposes of the presentation of the Group’s operating results, it is assumed that the centrally held capital is lent
interest free to the Asian operations. In turn the results of the Asian operations include the return on that capital and Group shareholders’
other income for EEV basis reporting is consequently reduced.
g) Taxation
The EEV profit for the year for covered business is calculated initially at the post-tax level. The post-tax profit is then grossed up for
presentation purposes at the effective rate of tax. In general, the effective rate corresponds to the corporation tax rate on shareholder
profits of the business concerned. Under achieved profits, except for JNL, this basis also applied. For JNL, under achieved profits pre-tax
results were determined by applying the risk discount rate to pre-tax cash flows adjusted for the impact of capital charges.
h) Foreign currency translation
Foreign currency profit and losses have been translated at average exchange rates for the year. Foreign currency assets and liabilities have
been translated at year end rates of exchange. The purpose of translating the profit and losses at average exchange rates, notwithstanding
the fact that EEV profit represents the incremental value added on a discounted cash flow basis, is to maintain consistency with the
methodology applied for IFRS basis reporting.
The principal exchange rates applied are:
Closing rate at Average Closing rate at Average Opening rate atLocal currency: £ 31 Dec 2005 for 2005 31 Dec 2004 for 2004 1 Jan 2004
Hong Kong 13.31 14.15 14.92 14.27 13.90
Japan 202.63 200.13 196.73 198.08 191.85
Malaysia 6.49 6.89 7.30 6.96 6.80
Singapore 2.85 3.03 3.13 3.10 3.04
Taiwan 56.38 58.47 60.84 61.10 60.78
US 1.72 1.82 1.92 1.83 1.79
5. Operating profit and margins from new businessa) Profit
2005 2004
Pre-tax Tax Post-tax Pre-tax Tax Post-tax£m £m £m £m £m £m
UK insurance operations 243 (73) 170 241 (72) 169
Jackson National Life (note i) 211 (74) 137 145 (51) 94
Asian operations 413 (124) 289 355 (105) 250
Total 867 (271) 596 741 (228) 513
(i) Jackson National Life net of tax profitBefore capital charge 150 106Capital charge (13) (12)
After capital charge 137 94
In determining the EEV basis value of new business written in the year the policies incept, premiums are included in projected cash flows
on the same basis of distinguishing annual and single premium business as set out for statutory basis reporting.
Included within pre-tax new business profits shown in the table above are profits arising from fund management business falling within
the scope of covered business of:
2005 2004£m £m
UK insurance operations 7 10
Jackson National Life 2 4
Asian operations 10 3
19 17
Notes on the EEV basis supplementary information continued

Prudential plc Annual Report 2005 217
5. Operating profit and margins from new business continuedb) Margins
Presentvalue
Annual of newNew business premiums premium business Pre-tax new New business margin
equivalent premiums businessSingle Regular (APE) (PVNBP) contribution (APE) (PVNBP)
2005 £m £m £m £m £m % %
UK insurance operations 7,085 191 900 7,593 243 27 3.2
Jackson National Life 5,009 14 515 5,135 211 41 4.1
Asian operations 837 648 731 4,039 413 56 10.2
Total 12,931 853 2,146 16,767 867 41 5.2
Presentvalue
Annual of newNew business premiums premium business Pre-tax new New business margin
equivalent premiums businessSingle Regular (APE) (PVNBP) contribution (APE) (PVNBP)
2004 £m £m £m £m £m % %
UK insurance operations 6,357 181 817 7,012 241 30 3.4
Jackson National Life 4,408 12 453 4,506 145 32 3.2
Asian operations 662 510 576 3,404 355 62 10.4
Total 11,427 703 1,846 14,922 741 40 5.0
New business margin(APE)
2005 2004% %
Asian operations:
Hong Kong 60 64
Korea 37 36
Taiwan 51 62
India 29 27
Other 74 73
Total Asian operations 56 62
New business premiums reflect those premiums attaching to covered business including premiums for contracts classified as investment
products for IFRS basis reporting. New business premiums for regular premium products are shown on an annualised basis. Department
of Work and Pensions rebate business is classified as single recurrent premium business. Internal vesting annuity business is classified as
new business where the contracts include an open market option.
New business margins are shown on two bases, namely the margins by reference to Annual Premium Equivalents (APE) and the Present
Value of New Business Premiums (PVNBP). APEs are calculated as the aggregate of regular new business premiums and one tenth of
single new business premiums. PVNBPs are calculated as equalling single premiums plus the present value of expected new business
premiums of regular premium business, allowing for lapses and other assumptions made in determining the EEV new business contribution.
The table above excludes margins for SAIF new business.
New business contributions are determined by applying the economic and non-economic assumptions applying at the end of the year.
The contributions represent profits at the end of the year.

218 Prudential plc Annual Report 2005
6. Operating profit from business in force2005 2004
£m £m
UK insurance operations
Unwind of discount and other expected returns (note i) 424 351
Cost of strengthened persistency assumption (note ii) (148) (73)
Mortality related cost of capital charge (note iii) (47) –
Other items (note iv) (46) (33)
183 245
Jackson National Life
Unwind of discount and other expected returns: (note i)
On value of in-force and required capital 160 123
On surplus assets (over target surplus) 52 36
Spread experience variance 89 41
Amortisation of interest-related realised gains and losses 53 54
Profit on repricing Term contracts 140 –
Profit (loss) from changes to other operating assumptions 10 (4)
Other 26 (13)
530 237
Asian operations
Unwind of discount and other expected returns (note i) 162 120
Change in operating assumptions (9) (24)
Experience variances and other items 10 9
163 105
Total 876 587
Notes(i) For UK insurance and Asian operations, unwind of discount and other expected returns is determined by reference to the value of in-force business, required capital andsurplus assets at the start of the year as adjusted for the effect of changes in economic and operating assumptions reflected in the current year. For the unwind of discount for UKinsurance operations included in operating results based on longer-term returns a further adjustment is made. For UK insurance operations the amount represents the unwind ofdiscount on the value of in-force business at the beginning of the year (adjusted for the effect of current year assumption changes), the expected return on smoothed surplusassets retained within the main with-profits fund and the expected return on shareholders’ assets held in other UK long-term business operations. Surplus assets retained withinthe main with-profits fund are smoothed for this purpose to remove the effects of short-term investment volatility from operating results. In the balance sheet and for total profitreporting, asset values and investment returns are not smoothed. For JNL the return on surplus assets is shown separately. Also for JNL the 2004 unwind of discount and ‘other’profits have been adjusted by £26 million and £(26) million respectively for refinement to the basis of calculation.
(ii) The £148 million cost of strengthened persistency assumption relates to a number of products, primarily in respect of with-profits bonds. The £73 million cost of strengthenedpersistency assumption for 2004 relates to the closed book of personal pension policies sold by the now discontinued direct sales force.
(iii) The £47 million charge primarily relates to the cost of capital attaching to liability strengthening on the regulatory basis for annuity business.
(iv) Other charges of £46 million include £45 million of costs associated with complying with regulatory requirements including Sarbanes-Oxley, product and distributiondevelopment, £19 million of negative experience variances and other net positive items of £18 million. In determining the appropriate expense assumptions for 2005 account hasbeen taken of the cost synergies that are expected to arise with some certainty from the initiative announced on 1 December 2005 from UK insurance operations working moreclosely with Egg and M&G. Without this factor there would have been a charge for altered expense assumptions of approximately £55 million. The £33 million charge for otheritems for 2004 includes £21 million of costs associated with complying with new regulatory requirements and restructuring and £12 million of negative experience variances.
7. Investment return and other income2005 2004
£m £m
IFRS basis 87 44
Less: allocation of investment return on centrally held capital in respect of Asian business to
operating result of Asian operations (21) (22)
Less: projected fund management result in respect of covered business incorporated in opening EEV value (24) (22)
EEV basis 42 0
Notes on the EEV basis supplementary information continued

Prudential plc Annual Report 2005 219
8. Short-term fluctuations in investment returns2005 2004
£m £m
Long-term business:
UK insurance operations (note i) 994 408
Jackson National Life (including mark to market value of core structural borrowings) (note ii) 65 103
Asian operations 41 91
Share of investment return of funds managed by PPM America that are consolidated into
Group results but attributable to external investors 0 9
Share of profits of venture investment companies and property partnerships of the PAC
with-profits fund that are consolidated into Group results but are attributable to external investors 1 9
Movement in mark to market value of core structural borrowings held centrally (65) (63)
Other operations (35) 13
Total 1,001 570
Notes(i) Short-term fluctuations in investment returns represent for UK insurance operations the difference between actual investment returns in the year attributable to shareholdersand the expected returns as described in note 3.
(ii) Short-term fluctuations for JNL comprise:2005 2004
£m £m
Actual investment return on investments less long-term returns included within operating profit:Actual realised gains less default assumption and amortisation of interest-related realised gains and losses for fixed maturity securities 5 51Actual less long-term return on equity-based investments and other items 58 22
Investment return related gain due primarily to changed expectation of profits on in-force variable annuity business in future periods based on current period equity returns* 4 36
Mark to market value of core structural borrowings (2) (6)
65 103
*This adjustment arises due to market returns being higher than the assumed long-term rate of return. This gives rise to higher than expected year end values of variable annuityassets under management with a resulting effect on the projected value of future account values, and hence future profitability.
9. Actuarial and other gains and losses on defined benefit pension schemesThe charge of £47 million (2004: £12 million) included in total profit reflects the shareholders’ share of actuarial and other gains and losses
on the Group’s defined benefit pension schemes. On the EEV basis, this includes a 10 per cent share of the actuarial gains and losses on
the share of the deficit attributable to the PAC with-profits fund for the Prudential Staff and Scottish Amicable Pension Schemes. The 2005
charge of £47 million includes a charge of £43 million for altered renewal expense assumptions arising from the prospective increase in
employer contributions for the Prudential Staff Pension Scheme for future service of active members (as distinct from deficit funding).
10. Effect of changes in economic assumptions and time value of cost of options and guaranteesThe profits (losses) on changes in economic assumptions and time value of cost of options and guarantees resulting from changes in
economic factors for in-force business included within the profit on ordinary activities before tax arise as follows:
2005 2004
Change in Change intime value time value
Change in of cost of Change in of cost ofeconomic options and economic options and
assumptions guarantees Total assumptions guarantees Total£m £m £m £m £m £m
UK insurance operations (81) 31 (50) 40 46 86
Jackson National Life (3) 11 8 (53) 6 (47)
Asian operations (note i) (265) 5 (260) (113) 26 (87)
Total (349) 47 (302) (126) 78 (48)
Note(i) Consistent with prior periods for the Taiwan operation, the projections include an assumption of phased progression of the bond yields of around 2 per cent towards 5.5 per centat 31 December 2012 as described in note 3b(ii). This takes into account the effect on bond values of interest rate movements. The principal cause of the £265 million charge for theeffect of changed economic assumptions is the reduction in short-term earned rates in Taiwan. This reduction has the effect of delaying the emergence of the expected long-term rate.

220 Prudential plc Annual Report 2005
11. Taxation chargeThe tax charge comprises:
2005 2004£m £m
Tax on operating profit from continuing operations
Long-term business:
UK insurance operations 127 142
Jackson National Life 204 116
Asian operations* 162 119
493 377
Other operations (130) (27)
Total tax charge on operating profit from continuing operations 363 350
Tax on items not included in operating profit
Tax charge on short-term fluctuations in investment returns 343 189
Tax credit on actuarial and other gains and losses of defined benefit pension schemes (14) (5)
Tax (credit) charge on effect of changes in economic assumptions and time value of cost of options and guarantees (39) 19
Total tax charge on items not included in operating profit from continuing operations 290 203
Tax charge on profit on ordinary activities from continuing operations (including tax on actual investment returns) 653 553
*Including tax relief on development expenses.
The profit for the year for covered business is in most cases calculated initially at the post-tax level. The post-tax profit for covered business
is then grossed up for presentation purposes at the effective rates of tax applicable to the countries and years concerned. In the UK this
is the UK corporation tax rate of 30 per cent. For JNL the federal rate of 35 per cent is applied to gross up movements on the value of
in-force business. Effects on statutory tax for the period affect the overall tax rate. For Asia, similar principles apply subject to the availability
of taxable profits.
12. Earnings per share (EPS)2005 2004
£m £m
Operating EPS from continuing operations:
Operating profit before tax 1,712 1,274
Tax (363) (350)
Minority interests (10) (8)
Operating profit after tax and minority interests from continuing operations 1,339 916
Operating EPS from continuing operations 56.6p 43.2p
Total EPS from continuing operations:
Total profit before tax 2,244 1,784
Tax (653) (553)
Minority interests (12) (26)
Total profit after tax and minority interests from continuing operations 1,579 1,205
Total EPS from continuing operations 66.8p 56.8p
Average number of shares (millions) 2,365 2,121
Notes on the EEV basis supplementary information continued

Prudential plc Annual Report 2005 221
13. Shareholders’ funds – segmental analysis2005 2004
£m £m
UK operations
Long-term business operations (notes ii and iii):
Smoothed shareholders’ funds (note i) 4,558 4,067
Actual shareholders’ funds less smoothed shareholders’ funds 574 161
EEV basis shareholders’ funds 5,132 4,228
M&G (note vii):
Net assets of operations 245 297
Acquired goodwill (note v) 1,153 1,153
Egg (note vii) 303 273
6,833 5,951
US operations
Jackson National Life (net of surplus note borrowings of £183m (2004: £162m) note vi):
Before capital charge:
Excluding assets in excess of target surplus 2,566 1,817
Assets in excess of target surplus 899 769
3,465 2,586
Capital charge (note iv) (117) (80)
After capital charge 3,348 2,506
Broker-dealer, fund management and Curian operations (note vii) 70 64
3,418 2,570
Asian operations
Long-term business (note ii):
Net assets of operations – EEV basis shareholders’ funds 1,988 1,565
Acquired goodwill (note v) 111 231
Fund management (note vii):
Net assets of operations 82 66
Acquired goodwill (note v) 61 61
2,242 1,923
Other operations
Holding company net borrowings (note vi) (1,724) (1,299)
Pension scheme deficits (net of tax) attributable to shareholders (note vii) (142) (152)
Other net liabilities (note vii) (326) (379)
(2,192) (1,830)
Total 10,301 8,614
Notes(i) UK long-term business smoothed shareholders’ funds reflect an adjustment to the assets of the PAC with-profits sub-fund, for the purposes of determining the unwind of discountincluded in operating profits, to remove the short-term volatility in market values of assets. Shareholders’ funds in the balance sheet are determined on an unsmoothed basis.
(ii) A charge is deducted from the annual result and balance sheet value for the cost of capital for the Group’s long-term business operations. The cost is the difference betweenthe nominal value of solvency capital and the present value, at risk discount rates, of the projected releases of this capital and the investment earnings on the capital. Wheresolvency capital is held within a with-profits long-term fund, the value placed on surplus assets in the fund is already discounted to reflect its release over time and no furtheradjustment is necessary in respect of solvency capital.
(iii) The proportion of surplus allocated to shareholders from the UK with-profits business has been based on the present level of 10 per cent. Future bonus rates have been set at levels which would fully utilise the assets of the with-profits fund over the lifetime of the business in force.
(iv) In determining the cost of capital of JNL, it has been assumed that an amount equal to 235 per cent of the risk-based capital required by the National Association of InsuranceCommissioners (NAIC) at the Company Action Level must be retained. The impact of the related capital charge is to reduce JNL’s shareholders’ funds by £117 million (2004: £80 million).
(v) Under IFRS, subject to impairment testing, goodwill is no longer amortised from the date of adoption i.e. 1 January 2004. Acquired goodwill of the Japan life business hasbeen subject to an impairment charge included in the 2005 results of £120 million.
Goodwill attaching to venture fund investment subsidiaries of the PAC with-profits fund that are consolidated under IFRS are not included in the table above as the goodwillattaching to these companies is not relevant to the analysis of shareholders’ funds.

222 Prudential plc Annual Report 2005
13. Shareholders’ funds – segmental analysis continuedNotes continued(vi) Net core structural borrowings of shareholder-financed operations comprise:
2005 2004£m £m
Holding company cash and short-term investments 1,128 1,561Core structural borrowings – central funds (2,852) (2,860)
Holding company net borrowings (1,724) (1,299)Core structural borrowings – Jackson National Life (183) (162)
(1,907) (1,461)
The altered carrying value of core structural borrowings under EEV reflects the application of market values rather than IFRS basis values.
(vii) With the exception of the share of pension scheme deficits attributable to the PAC with-profits fund, the amounts shown for the items in the table above that are referencedto this note have been determined on the statutory IFRS basis. The deficit for the defined benefit pension scheme reflects the statutory net of tax IFRS provision of £113 million(2004: £105 million), augmented by £29 million (2004: £47 million) for the shareholders’ share of the net of tax deficit attributable to the PAC with-profits fund.
Notes on the EEV basis supplementary information continued

Prudential plc Annual Report 2005 223
14. Reconciliation of movement in shareholders’ fundsLong-term business operations
TotalUK long-term
insurance Asian business Other Groupoperations JNL operations operations operations total
£m £m £m £m £m £m
Operating profit (including investment return based on
long-term rates of returns)
Long-term business:
New business (note 5) 243 211 413 867 867
Business in force (note 6) 183 530 163 876 876
426 741 576 1,743 1,743
Asia development expenses (20) (20) (20)
M&G 163 163
Egg 44 44
Asian fund management operations 12 12
US broker-dealer and fund management 24 24
Curian (10) (10)
Other income and expenditure (244) (244)
Operating profit (loss) from continuing operations 426 741 556 1,723 (11) 1,712
Goodwill impairment charge (120) (120)
Short-term fluctuations in investment returns (note 8) 995 65 41 1,101 (100) 1,001
Actuarial and other gains and losses on defined benefit
pension schemes (note 9) (43) 3 (40) (7) (47)
Effect of changes in economic assumptions and time value
of cost of options and guarantees (note 10) (50) 8 (260) (302) (302)
Profit (loss) on ordinary activities before tax (including
actual investment returns) 1,328 814 340 2,482 (238) 2,244
Tax on profits (losses) from continuing operations (note 11):
Tax on operating profit (127) (204) (162) (493) 130 (363)
Tax on short-term fluctuations in investment returns (299) (23) (12) (334) (9) (343)
Tax on actuarial and other gains and losses on defined
benefit pension schemes 13 0 13 1 14
Tax on effect of changes in economic assumptions and time
value of cost of options and guarantees 15 (3) 27 39 39
Total tax (charge) credit (398) (230) (147) (775) 122 (653)
Discontinued operations (net of tax) 3 3
Minority interests (2) (2) (10) (12)
Profit (loss) for the financial year 928 584 193 1,705 (123) 1,582
Transition adjustment, net of tax, on adoption of IAS 32, IAS 39 and IFRS 4
at 1 January 2005 (25) (25)
Unrealised valuation movements on securities classified as available-for-sale (1) (1)
Movement in cash flow hedges (4) (4)
Exchange movements 318 190 508 (131) 377
Related tax 65 65
Development costs included above (net of tax) borne centrally 2 2 (2)
Intra group dividends (including statutory transfer) (234) (226) (53) (513) 513
External dividends (380) (380)
Reserve movements in respect of share-based payments 15 15
Investment in operations (note i) 224 170 107 501 (501)
Adjustment for net of tax losses of Curian subsidiary owned by JNL (2) (2) 2
Adjustment for economic capital for Asian operations held centrally (15) (15) 15
Adjustment for net of tax fund management projected profits
of covered business (14) (2) (1) (17) 17
Movement in Prudential plc shares purchased by unit trusts
consolidated under IFRS 3 3
Proceeds from issues of share capital by parent company 55 55
Net increase in shareholders’ capital and reserves 904 842 423 2,169 (482) 1,687
Shareholders’ capital and reserves at 1 January 2005 4,228 2,506 1,565 8,299 315 8,614
Shareholders’ capital and reserves at 31 December 2005 (note 13) 5,132 3,348 1,988 10,468 (167) 10,301
Notes(i) Investment in operations reflects increases in share capital. This includes certain non-cash items as a result of timing differences.

224 Prudential plc Annual Report 2005
14. Reconciliation of movement in shareholders’ funds continuedLong-term business operations
TotalUK long-term
insurance Asian business Other Groupoperations JNL operations operations operations total
EEV basis shareholders’ funds at 31 December 2005 £m £m £m £m £m £m
Analysed as:
Statutory IFRS basis shareholders’ funds 1,141 2,899 1,034 5,074 120 5,194
Additional retained profit on an EEV basis 3,991 449 954 5,394 (287) 5,107
EEV basis shareholders’ funds at 31 December 2005 5,132 3,348 1,988 10,468 (167) 10,301
Comprising:
Free surplus 148 899 (212) 835
Required capital 710 1,198 974 2,882
Value of in-force business before deduction of cost of capital
and of guarantees 4,529 1,511 1,771 7,811
Cost of capital (192) (117) (539) (848)
Cost of time value of guarantees (63) (143) (6) (212)
5,132 3,348 1,988 10,468
Long-term business operationsTotal
UK long-terminsurance Asian business Other Group
operations JNL operations operations operations totalEEV basis shareholders’ funds at 1 January 2005 £m £m £m £m £m £m
Analysed as:
Statutory IFRS basis shareholders’ funds* 877 2,568 750 4,195 520 4,715
Additional retained profit on an EEV basis 3,351 (62) 815 4,104 (205) 3,899
EEV basis shareholders’ funds at 1 January 2005 4,228 2,506 1,565 8,299 315 8,614
Comprising:
Free surplus 142 769 (275) 636
Required capital 495 955 814 2,264
Value of in-force business before deduction of cost of capital
and of guarantees 3,798 963 1,432 6,193
Cost of capital (123) (80) (382) (585)
Cost of time value of guarantees (84) (101) (24) (209)
4,228 2,506 1,565 8,299
*Statutory basis shareholders’ funds at 1 January 2005 reflect the adoption of IAS 32, IAS 39 and IFRS 4.
Notes on the EEV basis supplementary information continued

Prudential plc Annual Report 2005 225
15. Reconciliation of net worth and value of in-force businessValue of
Total net in-force TotalFree Required worth business long-term
surplus capital (note i) (note ii) businessReconciliation of net worth and value of in-force business for 2005 £m £m £m £m £m
Shareholders’ capital and reserves at 1 January 2005 636 2,264 2,900 5,399 8,299
New business contribution (note iii) (562) 409 (153) 749 596
Expected return on existing business 5 5 566 571
Existing business – transfer to net worth 850 (146) 704 (704) –
Changes of operating assumptions and experience variances 46 10 56 7 63
Changes of non-operating assumptions and experience variances (161) 143 (18) 493 475
Profit after tax from continuing operations 178 416 594 1,111 1,705
Exchange rate movements 69 191 260 248 508
Discontinued operations, net of tax
Amounts injected, released and transferred to (from) life and related businesses (48) 11 (37) (7) (44)
Shareholders’ capital and reserves at 31 December 2005 835 2,882 3,717 6,751 10,468
Notes(i) Net worth consists of statutory solvency capital (or economic capital where higher) and unencumbered capital.
(ii) Value of in-force business includes the value of future margins from current in-force business less the cost of holding encumbered capital.
(iii) The movements arising from new business contribution are as follows:2005 2004
£m £m
Free surplus (562) (502)Required capital 409 390
Total net worth (153) (112)Value of in-force 749 625
Total long-term business 596 513
(iv) Included in the EEV basis shareholders’ funds of long-term business operations of £10,468 million (2004: £8,299 million) is £174 million (2004: £200 million) in respect of fundmanagement business falling within the scope of covered business as follows:
2005 2004£m £m
UK insurance operations 120 123Jackson National Life 12 20Asian operations 42 57
174 200

226 Prudential plc Annual Report 2005
16. Sensitivity of results to alternative assumptionsa) Sensitivity analysis – economic assumptions
The tables below show the sensitivity of the embedded value as at 31 December 2005 (2004) and the new business contribution after the
effect of required capital for 2005 and 2004 to:
■ 1 per cent increase in the discount rates;
■ 1 per cent increase and decrease in interest rates, including all consequential changes (assumed investment returns for all asset classes,
market values of fixed interest assets, risk discount rates);
■ 1 per cent rise in equity and property yields;
■ 10 per cent fall in market value of equity and property assets (not applicable for new business contribution); and
■ holding company statutory minimum capital (by contrast to economic capital).
In each sensitivity calculation, all other assumptions remain unchanged except where they are directly affected by the revised economic
conditions.
UKinsurance Asian Total
operations JNL operations long-term2005 £m £m £m £m
New business profit for 2005
As reported (note 5) 243 211 413 867
Discount rates – 1% increase (49) (27) (46) (122)
Interest rates – 1% increase (4) 2 (6) (8)
Interest rates – 1% decrease (5) (26) 3 (28)
Equity/property yields – 1% rise 13 24 20 57
Embedded value of long-term operations at 31 December 2005
As reported (note 14) 5,132 3,348 1,988 10,468
Discount rates – 1% increase (432) (133) (236) (801)
Interest rates – 1% increase (note i) 108 (144) 49 13
Interest rates – 1% decrease (note i) (142) 55 (126) (213)
Equity/property yields – 1% rise 297 42 136 475
Equity/property market values – 10% fall (480) (85) (75) (640)
Statutory minimum capital 0 79 431 510
Note(i) 2005
Embeddedvalue of Interest rates % of embedded value
long-termoperations 1% increase 1% decrease 1% increase 1% decrease
£m £m £m % %
Asian operationsEstablished markets 1,844 (57) 49 (3) 3Taiwan* (311) 106 (174) 34 (56)Korea 136 (3) 3 (2) 2Vietnam 127 3 (2) 2 (2)Other 192 0 (2) 0 (1)
1,988 49 (126) 2 (6)
*Taiwan sensitivity to starting bond rates (i.e. the starting bond rate for the progression to the assumed long-term rate):1% increase 1% decrease
Embedded in the in the value at starting starting
31 Dec 2005 bond rates bond rates£m £m £m
Taiwan (311) 104 (108)
Notes on the EEV basis supplementary information continued

Prudential plc Annual Report 2005 227
16. Sensitivity of results to alternative assumptions continuedUK
insurance Asian Totaloperations JNL operations long-term
2004 £m £m £m £m
New business profit for 2004
As reported (note 5) 241 145 355 741
Discount rates – 1% increase (40) (22) (42) (104)
Interest rates – 1% increase (4) (1) (5) (10)
Interest rates – 1% decrease (1) (33) 3 (31)
Equity/property yields – 1% rise 13 16 13 42
Embedded value of long-term operations at 31 December 2004
As reported (note 14) 4,228 2,506 1,565 8,299
Discount rates – 1% increase (366) (83) (218) (667)
Interest rates – 1% increase 144 (109) (14) 21
Interest rates – 1% decrease (179) 30 (32) (181)
Equity/property yields – 1% rise 264 24 98 386
Equity/property market values – 10% fall (416) (54) (44) (514)
Statutory minimum capital 0 43 326 369
b) Sensitivity analysis – non-economic assumptions
The tables below show the sensitivity of the embedded value as at 31 December 2005 (2004) and the new business contribution after the
effect of required capital for 2005 and 2004 to:
■ 10 per cent proportionate decrease in maintenance expenses (a 10 per cent sensitivity on a base expense assumption of £10 per annum
would represent an expense assumption of £9 per annum);
■ 10 per cent proportionate decrease in lapse rates (a 10 per cent sensitivity on a base assumption of 5 per cent would represent a lapse
rate of 4.5 per cent per annum);
■ 5 per cent proportionate decrease in base mortality and morbidity rates (i.e. increased longevity).UK
insurance Asian Totaloperations JNL operations long-term
2005 £m £m £m £m
New business profit for 2005
As reported (note 5) 243 211 413 867
Maintenance expenses – 10% decrease 8 5 10 23
Lapse rates – 10% decrease 7 18 39 64
Mortality and morbidity – 5% decrease (39) 5 13 (21)
Change representing effect on:
Life business 1 2 13 16
Annuity business* (40) 3 0 (37)
Embedded value of long-term operations for 2005
As reported (note 14) 5,132 3,348 1,988 10,468
Maintenance expenses – 10% decrease 33 36 45 114
Lapse rates – 10% decrease 68 90 87 245
Mortality and morbidity – 5% decrease (62) 90 69 97
Change representing effect on:
Life business 9 83 69 161
Annuity business* (71) 7 0 (64)
*The JNL annuity sensitivity for mortality and morbidity relates to variable annuity business.
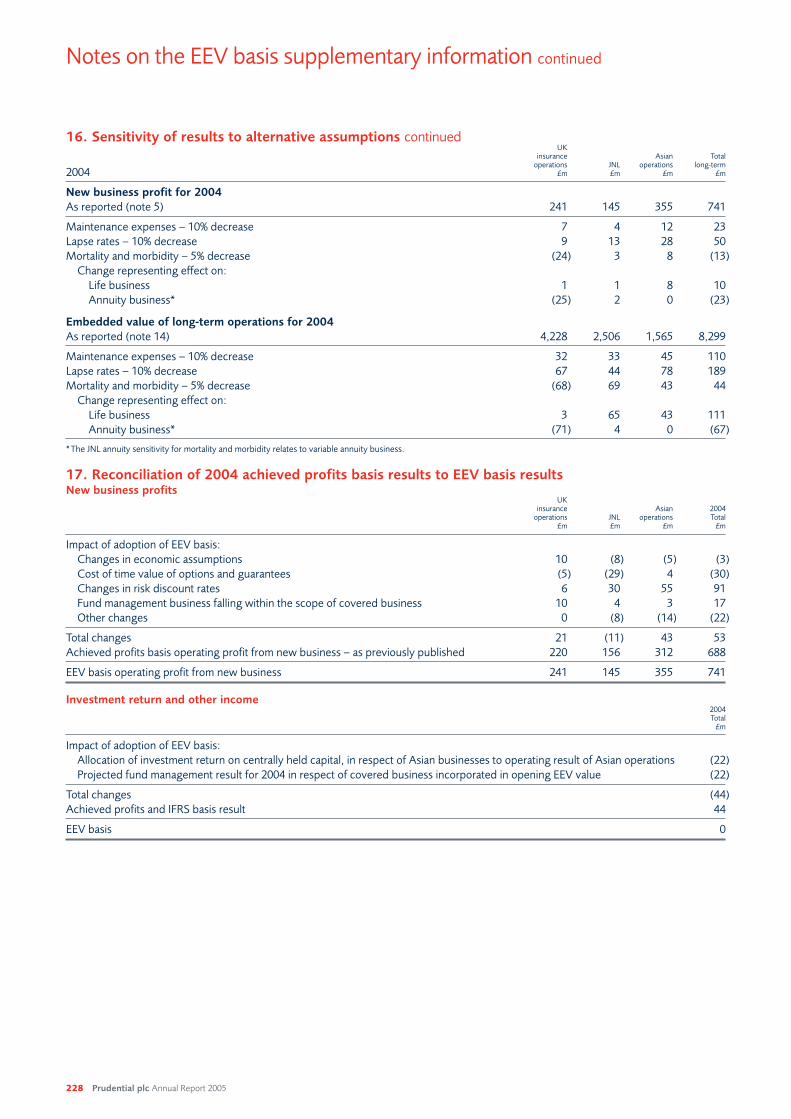
228 Prudential plc Annual Report 2005
16. Sensitivity of results to alternative assumptions continuedUK
insurance Asian Totaloperations JNL operations long-term
2004 £m £m £m £m
New business profit for 2004
As reported (note 5) 241 145 355 741
Maintenance expenses – 10% decrease 7 4 12 23
Lapse rates – 10% decrease 9 13 28 50
Mortality and morbidity – 5% decrease (24) 3 8 (13)
Change representing effect on:
Life business 1 1 8 10
Annuity business* (25) 2 0 (23)
Embedded value of long-term operations for 2004
As reported (note 14) 4,228 2,506 1,565 8,299
Maintenance expenses – 10% decrease 32 33 45 110
Lapse rates – 10% decrease 67 44 78 189
Mortality and morbidity – 5% decrease (68) 69 43 44
Change representing effect on:
Life business 3 65 43 111
Annuity business* (71) 4 0 (67)
*The JNL annuity sensitivity for mortality and morbidity relates to variable annuity business.
17. Reconciliation of 2004 achieved profits basis results to EEV basis resultsNew business profits
UKinsurance Asian 2004
operations JNL operations Total£m £m £m £m
Impact of adoption of EEV basis:
Changes in economic assumptions 10 (8) (5) (3)
Cost of time value of options and guarantees (5) (29) 4 (30)
Changes in risk discount rates 6 30 55 91
Fund management business falling within the scope of covered business 10 4 3 17
Other changes 0 (8) (14) (22)
Total changes 21 (11) 43 53
Achieved profits basis operating profit from new business – as previously published 220 156 312 688
EEV basis operating profit from new business 241 145 355 741
Investment return and other income2004Total
£m
Impact of adoption of EEV basis:
Allocation of investment return on centrally held capital, in respect of Asian businesses to operating result of Asian operations (22)
Projected fund management result for 2004 in respect of covered business incorporated in opening EEV value (22)
Total changes (44)
Achieved profits and IFRS basis result 44
EEV basis 0
Notes on the EEV basis supplementary information continued

Prudential plc Annual Report 2005 229
17. Reconciliation of 2004 achieved profits basis results to EEV basis results continuedShareholders’ funds (excluding minority interests) at 31 December 2004
2004Total
£m
Changes consequent on adoption of IFRS:
Timing difference on recognition of dividend declared after balance sheet date 253
Shareholders’ share of deficit of UK defined benefit pension schemes (net of deferred tax):
Statutory IFRS basis (115)
Additional charge for shareholders’ 10% interest on the achieved profits basis in the deficit
attributable to the PAC with-profits fund (47)
Goodwill 94
Other items (net of related tax) (20)
Total changes 165
Achieved profits basis shareholders’ funds, net of minority interests – as previously published 8,596
Achieved profits basis shareholders’ funds, net of minority interests – as restated for the adoption of IFRS 8,761
Impact of adoption of EEV basis:
Changes in economic assumptions 32
Changes in the cost of required capital (269)
Cost of time value of options and guarantees (209)
Changes in risk discount rates 427
Fund management business falling within the scope of covered business 200
Marking core structural borrowings to market value (225)
Other changes (103)
Total changes (147)
EEV basis shareholders’ funds, net of minority interests 8,614

230 Prudential plc Annual Report 2005
The directors have chosen to prepare supplementary information
in accordance with the EEV Principles issued in May 2004 by the
CFO Forum of European Insurance Companies and expanded
by the Additional Guidance on European Embedded Value
Disclosures issued in October 2005.
When compliance with the EEV Principles is stated, those principles
require the directors to prepare supplementary information in
accordance with the Embedded Value Methodology (EVM) contained
in the EEV Principles and to disclose and explain any non-compliance
with the EEV guidance included in the EEV Principles.
In preparing the EEV supplementary information, the directors have:
■ Prepared the supplementary information in accordance with the
EEV Principles;
■ identified and described the business covered by the EVM;
■ applied the EVM consistently to the covered business;
■ determined assumptions on a realistic basis, having regard
to past, current and expected future experience and to any
relevant external data, and then applied them consistently;
■ made estimates that are reasonable and consistent; and
■ described the basis on which business that is not covered
business has been included in the supplementary information,
including any material departures from the accounting framework
applicable to the Group’s financial statements.
Statement of directors’ responsibilities in respect of the EuropeanEmbedded Value (EEV) basis supplementary information
We have audited the EEV basis supplementary information (the
supplementary information) on pages 204 to 229 in respect of the
year ended 31 December 2005. The supplementary information
has been prepared in accordance with the EEV Principles issued in
May 2004 by the CFO Forum as supplemented by the Additional
Guidance on European Embedded Value Disclosures issued
in October 2005 (together ‘the EEV Principles’) using the
methodology and assumptions set out on pages 208 to 214. The
EEV supplementary information should be read in conjunction with
the Group’s financial statements which are on pages 62 to 195.
This report is made solely to the Company in accordance with the
terms of our engagement. Our audit work has been undertaken so
that we might state to the Company those matters we have been
engaged to state in this report and for no other purpose. To the
fullest extent permitted by law, we do not accept or assume
responsibility to anyone other than the Company for our audit
work, for this report, or for the opinions we have formed.
Respective responsibilities of directors and auditor
As described in the statement of directors’ responsibilities on
this page, the directors’ responsibilities include preparing the
supplementary information on the EEV basis in accordance with
the EEV Principles. Our responsibilities, as independent auditor,
in relation to the supplementary information are established in the
UK by the Auditing Practices Board, by our profession’s ethical
guidance and the terms of our engagement.
Under the terms of engagement we are required to report
to the Company our opinion as to whether the supplementary
information has been properly prepared in accordance with the
EEV Principles using the methodology and assumptions set out
on pages 208 to 214. We also report if we have not received all
the information and explanations we require for this audit.
Basis of audit opinion
We conducted our audit having regard to International Standards
on Auditing (UK and Ireland) issued by the Auditing Practices
Board. An audit includes examination, on a test basis, of evidence
relevant to the amounts and disclosures in the supplementary
information. It also includes an assessment of the significant
estimates and judgements made by the directors in the preparation
of the supplementary information, and of whether the accounting
policies applied in the preparation of the supplementary information
are appropriate to the Group’s circumstances, consistently applied
and adequately disclosed.
We planned and performed our audit so as to obtain all the
information and explanations which we considered necessary
in order to provide us with sufficient evidence to give reasonable
assurance that the supplementary information is free from material
misstatement, whether caused by fraud or other irregularity or
error. In forming our opinion, we also evaluated the overall
adequacy of the presentation of the supplementary information.
Opinion
In our opinion, the EEV basis supplementary information for the
year ended 31 December 2005 has been properly prepared in
accordance with the EEV Principles using the methodology and
assumptions set out on pages 208 to 214.
KPMG Audit Plc
Chartered Accountants
London
15 March 2006
Independent auditor’s report to Prudential plc on the EuropeanEmbedded Value (EEV) basis supplementary information

Prudential plc Annual Report 2005 231
Financial calendar
Annual General Meeting 18 May 2006
Payment of 2005 final dividend 26 May 2006
Announcement of 2006 interim results 28 July 2006
Ex dividend date 16 August 2006
Record date 18 August 2006
Payment of 2006 interim dividend 27 October 2006
Shareholder enquiries
Lloyds TSB Registrars, The Causeway, Worthing,
West Sussex BN99 6DA
Tel: 0870 600 0190
Fax: 0870 600 3980
Textel: 0870 600 3950 (for hard of hearing)
Dividend mandates
Shareholders may find it convenient to have their dividends
paid directly to their bank or building society account. If you
wish to take advantage of this facility, please call Lloyds TSB
Registrars on 0870 600 0190 and request a ‘Dividend Mandate’
form. Alternatively, you may download a form from
www.prudential.co.uk/prudential-plc/investors/
shareholder_services/forms
Scrip dividend alternative
The Company will be offering a scrip dividend alternative in
respect of the final dividend of 11.02 pence per ordinary share
for the year ended 31 December 2005. The number of new shares
each shareholder who elects to take scrip will be entitled to receive
is calculated by dividing the total cash dividend due on each
holding of shares as at the record date (24 March 2006) by the
reference price for each new ordinary share.
The reference price is calculated as the average of the middle
market quotations for the Company’s shares as derived from
the Daily Official List of the London Stock Exchange for the five
business days which commenced on 22 March 2006. Further
details of the scrip dividend alternative will be mailed to
shareholders in early April 2006.
Annual Review and Summary Financial Statement
Any shareholder wishing to receive copies of the Group’s
Annual Review and Summary Financial Statement in place of an
Annual Report for all future years may do so by contacting Lloyds
TSB Registrars in writing at the address above or by calling
0870 600 0190.
Electronic communications
Shareholders are encouraged to elect to receive shareholder
documents electronically by registering with Shareview at
www.shareview.co.uk This would save on printing and distribution
costs, helping to conserve natural resources. If you do this, you will
be sent an email notification to say when shareholder documents
are available on our website and you will be provided with a link to
that information. You will need your shareholder reference number
which can be found on your share certificate or proxy form.
Share dealing services
The Company’s Registrars, Lloyds TSB Registrars, offer a postal
dealing facility for buying and selling Prudential plc ordinary
shares, telephone 0870 242 4244. They also offer a telephone
and internet dealing service, Shareview, which provides a simple
and convenient way of selling Prudential plc shares. For telephone
sales call 0870 850 0852 between 8.30am and 4.30pm, Monday to
Friday, and for internet sales log on to www.shareview.co.uk/dealing
ShareGift
Shareholders who only have a small number of shares whose
value makes it uneconomic to sell them may wish to consider
donating them to ShareGift (Registered Charity 1052686). The
relevant share transfer form may be obtained from Lloyds TSB
Registrars. Further information about ShareGift may be obtained
on 020 7337 0501 or from www.ShareGift.org There are no
implications for capital gains tax purposes (no gain or loss) on gifts
of shares to charity and it is also possible to obtain income tax relief.
American Depositary Receipts (ADRs)
The Company’s ordinary shares are listed on the New York Stock
Exchange in the form of American Depositary Shares, evidenced
by ADRs and traded under the symbol PUK. Each American
Depositary Share represents two ordinary shares. All enquiries
regarding ADR holder accounts should be directed to JP Morgan,
the authorised depositary bank, at JP Morgan Service Center,
P O Box 3408, South Hackensack, New Jersey 07606-3408, US,
telephone 001 201 680 6630 or log on to www.adr.com
Form 20-F
The Company is subject to the reporting requirements of the
Securities and Exchange Commission (SEC) in the US as such
requirements apply to foreign companies and files its Form 20-F
with the SEC. Copies of Form 20-F can be found on the Company’s
website at www.prudential.co.uk or on the SEC’s website at
www.sec.gov
Irish branch register
The Company operates a branch register for Irish shareholders.
All enquiries regarding Irish branch register accounts should be
directed to Capita Corporate Registrars Plc, Unit 5, Manor Street
Business Park, Manor Street, Dublin 7. Telephone: 00 353 1 810 2400.
Shareholder information
Analysis of registered shareholder accounts
31 December 2005Number of % of total number of % of total
Size of shareholding shareholder accounts shareholder accounts Number of shares number of shares
Over 10,000,000 38 0.06 1,092,974,292 45.79
1,000,001 – 10,000,000 298 0.49 880,631,705 36.91
500,001 – 1,000,000 168 0.28 122,477,919 5.13
100,001 – 500,000 558 0.92 126,994,111 5.32
10,001 – 100,000 2,748 4.51 68,857,844 2.88
5,001 – 10,000 3,917 6.43 27,277,710 1.14
1,001 – 5,000 24,431 40.08 54,419,578 2.28
1 – 1,000 28,784 47.23 13,151,107 0.55
Total 60,942 100 2,386,784,266 100

232 Prudential plc Annual Report 2005
Prudential plc
Laurence Pountney Hill
London EC4R 0HH
Tel: +44 (0)20 7220 7588
www.prudential.co.uk
Sir David Clementi
Chairman
Mark Tucker
Group Chief Executive
Philip Broadley
Group Finance Director
Rebecca Burrows
Group Communications Director
Andrew Crossley
Group Chief Risk Officer
Peter Maynard
Group Legal Services Director & Company Secretary
Priscilla Vacassin
Group Human Resources Director
Prudential UK & Europe
3 Sheldon Square
London W2 6PR
Tel: +44 (0)20 7334 9000
www.pru.co.uk
Nick Prettejohn
Chief Executive
M&G
Laurence Pountney Hill
London EC4R 0HH
Tel: +44 (0)20 7626 4588
www.mandg.co.uk
Michael McLintock
Chief Executive
Egg
1 Waterhouse Square
138-142 Holborn
London EC1N 2NA
Tel: +44 (0)20 7526 2500
Fax: +44 (0)20 7526 2665
www.egg.com
Mark Nancarrow
Group Chief Executive
Jackson National Life
1 Corporate Way
Lansing
Michigan 48951
United States
Tel: +1 517 381 5500
www.jnl.com
Clark Manning
President & Chief Executive Officer
Prudential Corporation Asia
13th Floor
One International Finance Centre
1 Harbour View Street
Central
Hong Kong
Tel: +852 2918 6300
Fax: +852 2525 7522
www.prudentialcorporation-asia.com
Mark Norbom
Chief Executive
Analyst and investor enquiries
Tel: +44 (0)20 7548 3511
E-mail: [email protected]
Media enquiries
Tel: +44 (0)20 7548 2007
E-mail: [email protected]
How to contact us

Prudential at a glance
Prudential is a leading life and pensions provider in the United Kingdom.
M&G is Prudential’s UK and European fundmanager with £149 billion of funds undermanagement as at 31 December 2005.
Egg plc is an innovative financial services company,providing a range of banking and financial servicesproducts through its internet site, www.egg.com
Jackson National Life (JNL) is one of the largest lifeinsurance companies in the United States with overthree million policies and contracts in force.
Prudential has life insurance operations in 12 countriesand in 2005 was awarded six new life licences forcities in China, making a total of 10 operational in 2005. Prudential also has fund managementoperations in nine Asian countries following theaddition of China and Vietnam in 2005.
Products■ Annuities■ Corporate pensions■ With-profits and unit-linked bonds■ Savings and investments■ Protection■ Equity release■ Health insurance
Product distribution channels■ Business to business (consulting actuaries and
benefit advisers)■ Partnerships (affinities and banks)■ Independent financial advisers■ Multi-tie panels■ Direct to customers (telephone, internet
and mail)
CustomersMore than seven million
Staff6,700
LocationsBelfastDublinLondonMumbaiReadingStirling
M&G independently manages assets on behalf of awide range of retail and institutional investors. M&Galso acts as fund manager on many of the life andpensions products sold by Prudential in the UK andEurope, as well as managing Prudential’s balancesheet for profit.
Retail business■ Open Ended Investment Companies (OEICs)
and Unit Trusts (UTs)■ Investment Trusts (ITs)■ Individual Savings Accounts (ISAs) and Personal
Equity Plans (PEPs)
M&G and Prudential branded mutual funds aredistributed to retail investors in the UK, Europe and South Africa. M&G manages £14.6 billion of retail assets, invested in equities, fixed incomeand property.
In the UK, M&G is the fourth largest retail fundmanager, with over one million unit holder accounts.
Institutional business■ Segregated fixed interest, pooled pension funds,
structured and private finance■ Segregated and pooled global macro strategy
mandates■ Institutional customers include pension funds,
insurance companies and other financial institutions
M&G manages £21.6 billion of institutional assets,invested in equities, fixed income, property andprivate equity.
Internal business■ M&G manages assets on behalf of Prudential’s
long-term business funds, including with-profitsand unit-linked funds, annuities and corporatepension products.
M&G manages £113 billion of assets for Prudential customers, invested in equities, fixed income, property and private equity.
Staff1,400
LocationsUK: London, ChelmsfordEurope: Germany, Austria, Italy, Spain, FranceOther: Australia, South Africa
Also part of M&GPrudential Property Investment Managers (PruPIM)PPM CapitalPPM South Africa
■ Banking – unsecured personal loans, credit cards,mortgages and savings accounts
■ Insurance – distribution of general insuranceproducts
Egg has over five per cent share of the UK creditcard market.
CustomersOver three million.
Staff2,200
LocationsDerbyDudleyLondon
JNL offers fixed, fixed index, and variable annuities, term and permanent life insurance and institutional products. Through its affiliates and subsidiaries, JNL also provides assetmanagement and retail brokerage services.
JNL markets products in 50 states and the District of Columbia (in the State of New Yorkthrough Jackson National Life Insurance Company of New York) through independentbroker-dealers, independent agents, banks,regional broker-dealers and the registeredinvestment adviser channel.
JNL’s investment portfolio manager, PPM AmericaInc., manages around US$71 billion of assets.
CustomersMore than three million policies and contracts in force.
Staff2,600
LocationHeadquartered in Lansing, Michigan
Prudential is Europe’s leading life insurer in Asia in terms of market coverage and number of top fivemarket positions and one of the region’s largestforeign owned fund managers.
Prudential Corporation Asia provides acomprehensive range of savings, protection and investment products tailored to the needs of each local market.
It pioneered unit-linked products in Singapore,Malaysia, Indonesia, the Philippines and Taiwan.
Currently, Prudential Corporation Asia has anetwork of over 170,000 agents serving more thanseven million customers around the region.
Major strategic partnerships■ Bank of China International for Mandatory
Provident Fund business in Hong Kong■ CITIC Group for life and fund management
business in China ■ ICICI Bank for life and mutual funds business
in India■ In addition, Prudential Corporation Asia has a
number of distribution partnerships that include a number of leading banks.
Staff9,900
LocationsChinaHong KongIndiaIndonesiaJapanKoreaMalaysiaThe PhilippinesSingaporeTaiwanThailandVietnam
APE sales grew 10 per cent in 2005 to £900 million.
IFRS operating profit increased 35 per cent to £400 million in 2005.
Further informationwww.pru.co.uk
Telephone: 0800 000 000
In 2005, operating profit grew 20 per cent to £163 million and underlying profits grew 25 per cent to £138 million.
Gross fund inflows increased by 35 per cent to £7.9 billion. Net fund inflows nearly doubledto £3.9 billion.
Further informationwww.mandg.co.ukwww.mandg-investments.dewww.mandg-investments.atwww.prupim.comwww.ppmcapital.comwww.ppm-sa.com
Customer helpline: 0800 390 390
Independent financial adviser (IFA) helpline:0800 328 3191
2005 overall group operating income was £527 million, up from £496 million in 2004.
The UK banking business made an operatingprofit of £60 million, compared to £72 million in 2004.
Following Prudential’s offer for the minorityshareholding, Egg shares were delisted on 20 February 2006.
Further informationwww.egg.com
Telephone: 020 7526 2500
Record APE sales of £515 million were up 13 per cent on prior year. New business profitmargin (% of APE) of 41 per cent up from 32 per cent in the prior year.
EEV operating profit on continuing operations of £755 million, up 104 per cent on prior year.
IFRS operating profit on continuing operations of £362 million, up 27 per cent on prior year.
Further informationwww.jnl.com
Telephone: 00 1 517 381 5500
Sales on an APE basis grew 23 per cent.
Represents 48 per cent of total Group newbusiness profit.
Third party funds under management of £10.1 billion, up 29 per cent over 2004 oncomparable basis.
IFRS operating profit of £157 million, up 67 per cent on 2004.
Further informationwww.prudentialcorporation-asia.com
Telephone: 00 852 2918 6300
Our brands
Operations and products
Financial highlightsComparisons are quoted at constant
exchange rates
This report may contain certain ‘forward-looking statements’ with respect to certain of Prudential’s plans and its current goals and expectations relating toits future financial condition, performance, results, strategy and objectives. Statements containing the words ‘believes’, ‘intends’, ‘expects’, ‘plans’, ‘seeks’and ‘anticipates’, and words of similar meaning, are forward-looking. By their nature, all forward-looking statements involve risk and uncertainty becausethey relate to future events and circumstances which are beyond Prudential’s control including among other things, UK domestic and global economic andbusiness conditions, market related risks such as fluctuations in interest rates and exchange rates, and the performance of financial markets generally; thepolicies and actions of regulatory authorities, the impact of competition, inflation, and deflation; experience in particular with regard to mortality andmorbidity trends, lapse rates and policy renewal rates; the timing, impact and other uncertainties of future acquisitions or combinations within relevantindustries; and the impact of changes in capital, solvency or accounting standards, and tax and other legislation and regulations in the jurisdictions in whichPrudential and its affiliates operate. This may for example result in changes to assumptions used for determining results of operations or re-estimations ofreserves for future policy benefits. As a result, Prudential’s actual future financial condition, performance and results may differ materially from the plans,goals, and expectations set forth in Prudential’s forward-looking statements. Prudential undertakes no obligation to update the forward-looking statementscontained in this report or any other forward-looking statements it may make.
Prudential public limited companyIncorporated and registered in England and Wales
Registered office:Laurence Pountney HillLondon EC4R 0HHRegistered number: 1397169
Prudential plc is a holding company, subsidiaries of which areauthorised and regulated by the Financial Services Authority.
www.prudential.co.uk
Front cover photograph by Philip Ip (Hong Kong).
PR2178_Report_covers_tp.qxd 11/4/06 10:41 Page 3

Annual Report 2005
A growth businesswith strong momentum
Prudential plc is an international retail financial services group that aims to help people secure andenhance their own and their dependants’ financial well-being by providing savings, protection and other products and services suited to their needs.
We have strong franchises in three of the largest and most attractive markets in the world, where rising wealth and changing demographics are fuelling demand for life insurance and other long-term savings andprotection products.
Our strategy is to build successful and increasinglyprofitable businesses in each of these markets, andthereby maximise returns to our shareholders over time.
Contents1 Group financial highlights2 Chairman’s statement4 Group Chief Executive’s review8 Business review
16 Financial review34 Corporate responsibility review36 Board of directors38 Corporate governance report 46 Remuneration report58 Directors’ report60 Summary of statutory and supplementary IFRS and EEV basis results61 Index to the Group financial statements62 Consolidated income statement63 Statement of changes in equity65 Consolidated balance sheet67 Consolidated cash flow statement68 Notes on the Group financial statements
186 Balance sheet of the parent company187 Notes on the parent company financial statements196 Statement of directors’ responsibilities in respect of the Annual
Report and the financial statements197 Independent auditor’s report to the members of Prudential plc198 Supplementary International Financial Reporting Standards (IFRS)
basis results200 Notes on the supplementary IFRS basis results201 Risk factors204 European Embedded Value (EEV) basis supplementary information208 Notes on the EEV basis supplementary information230 Statement of directors’ responsibilities in respect of the European
Embedded Value (EEV) basis supplementary information230 Independent auditor’s report to Prudential plc on the European
Embedded Value (EEV) basis supplementary information231 Shareholder information232 How to contact us
Pru
de
ntial p
lcA
nn
ual R
ep
ort 2
00
5
Prudential public limited companyIncorporated and registered in England and Wales
Registered office:Laurence Pountney HillLondon EC4R 0HH
Registered number: 1397169
Prudential plc is a holding company, subsidiaries of which are authorised and regulated by the Financial Services Authority (FSA).
www.prudential.co.uk
PR2178_Report_covers_tp.qxd 11/4/06 10:41 Page 2