prudential plc/media/files/p/prudential-v2/results-archive/... · 2017 half year results 1 10...
TRANSCRIPT

2017 HALF YEAR RESULTS 1
10 August 2017
Prudential plc
2017 Half Year Results

2017 HALF YEAR RESULTS2
This document may contain ‘forward-looking statements’ with respect to certain of Prudential's plans and its goals and expectations relating to its future financial condition, performance, results, strategy and objectives. Statements that are not historical facts, including statements about Prudential’s beliefs and expectations and including, without limitation, statements containing the words ‘may’, ‘will’, ‘should’, ‘continue’, ‘aims’, ‘estimates’, ‘projects’, ‘believes’, ‘intends’, ‘expects’, ‘plans’, ‘seeks’ and ‘anticipates’, and words of similar meaning, are forward-looking statements. These statements are based on plans, estimates and projections as at the time they are made, and therefore undue reliance should not be placed on them. By their nature, all forward-looking statements involve risk and uncertainty. A number of important factors could cause Prudential's actual future financial condition or performance or other indicated results to differ materially from those indicated in any forward-looking statement. Such factors include, but are not limited to, future market conditions, including fluctuations in interest rates and exchange rates, the potential for a sustained low-interest rate environment, and the performance of financial markets generally; the policies and actions of regulatory authorities, including, for example, new government initiatives; the political, legal and economic effects of the UK’s decision to leave the European Union; the impact of continuing designation as a Global Systemically Important Insurer or ‘G-SII’; the impact of competition, economic uncertainty, inflation and deflation; the effect on Prudential’s business and results from, in particular, mortality and morbidity trends, lapse rates and policy renewal rates; the timing, impact and other uncertainties of future acquisitions or combinations within relevant industries; the impact of internal projects and other strategic actions failing to meet their objectives; the impact of changes in capital, solvency standards, accounting standards or relevant regulatory frameworks, and tax and other legislation and regulations in the jurisdictions in which Prudential and its affiliates operate; and the impact of legal and regulatory actions, investigations and disputes. These and other important factors may, for example, result in changes to assumptions used for determining results of operations or re-estimations of reserves for future policy benefits. Further discussion of these and other important factors that could cause Prudential's actual future financial condition or performance or other indicated results to differ, possibly materially, from those anticipated in Prudential's forward-looking statements can be found under the 'Risk factors' heading in Prudential’s 2017 half year report and the ‘Risk factors’ heading of Prudential’s 2017 half year report filed on Form 6-K filed with the US Securities and Exchange Commission and which are available on its website at www.prudential.co.uk
Any forward-looking statements contained in this document speak only as of the date on which they are made. Prudential expressly disclaims any obligation to update any of the forward-looking statements contained in this document or any other forward-looking statements it may make, whether as a result of future events, new information or otherwise except as required pursuant to the UK Prospectus Rules, the UK Listing Rules, the UK Disclosure and Transparency Rules, the Hong Kong Listing Rules, the SGX-ST listing rules or other applicable laws and regulations.

2017 HALF YEAR RESULTS
Mike Wells
Group Chief Executive
3

2017 HALF YEAR RESULTS4
1. Following its sale in May 2017, the operating results exclude the contribution of the Korea life business.
2. New business profit on business sold in the period, calculated in accordance with EEV principles
3. External net inflows Ex MMF
4. Before allowing for first interim dividend
5. The Group shareholder position includes management’s estimate of transitional measures reflecting operating and market conditions at the valuation date. The estimated Group shareholder surplus would increase from £12.9 billion to £13.6
billion at 30 June 2017 if the approved regulatory transitional amount was applied instead
GroupHeadline results
IFRS
operating profit1 £2.4bn
Free surplus
generation1 £1.8bn
£9.5bn
(Eastspring & M&G)
New
business profit1,2 £1.7bn
External
Net inflows3
Solvency II
Surplus4,5 £12.9bn
P Broad based performance with double digit growth in Asia
2017 Asia objectives on track, Group objective achievedP
Strong capital positionP
Intention to create M&G Prudential, a leading savings
and investment providerP
202%
Earnings
Cash
Growth
Capital

2017 HALF YEAR RESULTS
Growing earnings and scale
Aligning position to
market opportunity
5
GroupGeographic footprint aligned to significant demand
$16tr
Insurance penetration1 Mutual fund penetration2
Pe
ne
trati
on
Pe
ne
trati
on
2.4%
UK 7.5%
12%
75%Europe
VA assets
$2tr
WirehouseNational &
Regional BDRIA IBD
RIA
Hybrid
US retirement advisor assets4
UK Assets Under Management6
GrowthUK 2nd
Largest asset management
industry5
AS
IAU
SU
K
£7tr £10tr
Leading pan
regional life
franchise
#1 Retail Asian
asset manager3
Premier
retirement
income player
Well recognised
brands with
strong track
records2015 2023
Oth
er
✓
Outperforming the sector
✓
1 Insurance penetration source Swiss Re Sigma 2015. Insurance penetration calculated as premiums as % of GDP. Asia penetration calculated on a weighted population basis
2 Mutual fund penetration: FUM as % of GDP. Source: Investment Company Institute, industry associations and Lipper as of 1Q'16. Datastream as of June 2016
3 Source: Asia Asset Management – Fund Manager Surveys. Based on assets sourced in Asia ex-Japan, Australia and New Zealand. Ranked according to participating firms only.
4 Source: Cerulli Associates – advisor metrics 2015
5 Source: The CityUK 6 Source: The Investment Association. PWC Asset Management 2020. Prudential calculations. Growth rate based off Europe forecast CAGR of 4.4%

2017 HALF YEAR RESULTS
1 The objectives assume exchange rates at December 2013 and economic assumptions made by Prudential in calculating the EEV basis supplementary information for the half year ended 30 June 2013, and are based on regulatory and solvency regimes applicable across the Group at the time the objectives were set. The objectives assume the existing EEV, IFRS
and Free Surplus methodology at December 2013 will be applicable over the period
2 Underlying free surplus generated comprises underlying free surplus generated from long-term business (net of investment in new business) and that generated from asset management operations. The 2012 comparative is based on the retrospective application of new and amended accounting standards and excludes the one-off gain on sale of our stake in China
Life of Taiwan of £51 million and sale of Korea life.
3 Following its sale in May 2017, the operating results exclude the contribution of the Korea life business. All comparative results and the relevant 2017 objective (Asia IFRS operating profit) have been similarly adjusted.
6
Group2017 Asia objectives on track, Group objective achieved
17%
At least £10bn£1.1bn
to
£0.9bn
At least
15% CAGR
CAGR
Asia Group
2016 2017
11.1
2012 2016 2017
Underlying free surplus1,2,3, £m IFRS operating profit2,3, £m Underlying free surplus1,3, £bn
872 1,641
884
859 909 1,644
Expressed at Dec 2013 FX ratesXXComparatives stated at reported currency basis XX
2014 - 2017 Objective
✓
953553

2017 HALF YEAR RESULTS
Performance underlines value creation levers
Scale and diversification of portfolio driving
value across the cycle
Compounding effect of strong persistency &
new business growth underpins earnings
7
AsiaDouble digit growth in key metrics
6.4
7.5
HY16 HY17
Life weighted premium income1,2,
£bn
Eastspring FUM3,
£bn
Leveraging mix to drive quality growth
118 131
FY16 HY17
+17%
+11%
+16%
£953m
IFRS operating profit2,
£m
1 Weighted premium income comprises gross earned premiums at 100% of renewal premiums, 100% of first year premiums and 10% of single premiums
2 Comparatives have been stated on an constant exchange rate basis. Historic figures have been restated to exclude Korea life.
3 Comparatives have been stated on a reported exchange rate basis
+18%
£1,092m
New business profit2,
£m
+15%
£553m
Free surplus generation2,
£m

2017 HALF YEAR RESULTS8
AsiaHigh quality growth
Premium Mix
Regular premium% APE
Health & Protection% NBP
94%
>60%
IFRS
operating profit1 +16%
Free surplus
generation1 +15%
New
business profit1 +18%
Qu
ality
Mo
men
tum
Countries with at least
double digit growth1 8
+24% +54% Agency1 Banca1
NBP Growth
Country
Hong Kong1+15%
Agency +31% & Banca +22% (2Q17 vs 2Q16: 13% & 21%)
Rest of Asia1+22%
1 Growth rates based on comparatives using a constant exchange rate basis
Distribution

2017 HALF YEAR RESULTS
2x
109 89 111237 285 350 427 504 508
613728
953
199 226 266
476 579
757
959 1,058
1,108
1,286
1,644
2006 2007 2008 2009 2010 2011 2012 2013 2014 2015 2016 2017
2x
2017
objective2
2x3
2H
1H
9
AsiaLong-term performance track record
IFRS operating profit1,
£m
1. Comparatives have been stated on an actual exchange rate. Comparatives have also been restated to exclude the contribution from Korea life business sold in May 2017. 2012 includes the one-off gain on sale of stake in China Life of Taiwan of
£51m.
2. 2017 objective is defined as at least 15% CAGR from 2012-17 based on an Asia 2012 IFRS operating profit of £909m (excluding one off of £51m) assuming exchange rates at December 2013.
3. 2009 objective based on doubling 2005 Asia NBP, 2013 objective based on doubling 2009 Asia IFRS profit ‘Growth and Cash’. 2x based on implied multiple using 2012 IFRS operating profit of £909m increasing at a 15% CAGR to 2017
2009 NBP
objective3
2013
objective3
2017
objective2

2017 HALF YEAR RESULTS
134.2
162.0
3.32.7
2.6
19.2
FY15 1H16 2H16 1H17 Markets &Other
HY17
10
USRelative outperformance
Net inflows: $8.6bn
Separate account assets, $bn
Industry VA net flows1, $bn:
Rapidly adapting to changing environment
Fee business driving earnings growth
Launched fee based VA products
Outperforming the sector
(15) (20) (18)
1. Source: MARC industry data
+17%
VA fee
business
1H16 2H16 1Q17
IFRS operating profit
Fee based
sales
New advisors to Jackson
>25%

2017 HALF YEAR RESULTS
UKMarket context
11
Market trends
Convergent insurance and asset
management business models
Self-reliance for savings, investment and retirement
Strategic imperatives
Customer demand for
one stop shop
solutions from
trusted, scale
players
Scale, brand, product/distribution capability and
financial strength
Demonstrated breadth & depth of investment
expertise
Service-led customer proposition with direct and
intermediated access points
Capital-light and cost efficient model to drive
customer & shareholder value

2017 HALF YEAR RESULTS
UKIntention to combine best of breed businesses
12
Fin
an
cia
lly
co
mp
ellin
g
Un
lock
ing
op
po
rtu
nit
y
Str
ate
gic
ally
att
racti
ve
Combination leverages strengths to align to market opportunities
Complementary expertise: scale, brands, product, distribution and financial strength
Leading savings and investment provider
M&G Prudential
Revenue upside from combining active investment and solutions expertise
Accelerate transition to capital light model
Investing to create a cost efficient business
New digital service and distribution to meet fast changing customer needs
Transformation into an efficient, service-led, digitally enabled business
Combined business able to develop and fund joint product propositions

2017 HALF YEAR RESULTS
Other4
Private Equity4
Commercial
property4
13
UKAttractive market dynamics
€14tn 2015-16
Europe AUM2
ex UK
£7tn
UK AUM1
2015-16
Retail
Institutional
Addressable
1. Source: The Investment Association – Asset management in the UK 2015-2016.
2. Source: EFAMA Asset Management report, data as at 2015
3. Growth rates source: PWC Asset Management 2020, BCG and Prudential calculations. Retail growth rate sourced from BCG, Europe and remaining UK using PWC Europe forecast CAGR of 4.4%
4. UK AUM consists of Commercial Property, Private Equity and Other of £1.3tn growing by £0.5tn by 2023. European AUM consists of Discretionary of Eur5.2tn growing by Eur2.0tn.
5. Discretionary includes mandates and could be included within M&G Institutional addressable market.
£1.2tn
£4.6tn
Addressable
Discretionary4,5
by 2023+£0.9tn
Investment
funds €8.5tn
by 2023+£1.6tn
by 2023+€3.5tn
6 Source: HMRC – Individual Savings Account (ISA) Statistics April 2017. HMRC, BoE, ONS, ABI
7 Cash ISA transfers is derived from total amount subscribed in a year minus the mew subscription and
reinvestment of return. Reporting period for the year is April to March
27.8 28.633.0
40.6
46.8
2011-12 2012-13 2013-14 2014-15 2015-16
Cash ISA transfers6,7
(£bn)
£518bn
CashStocks &
shares
ISA market value6
International
AUM
Opportunity1,2,3

2017 HALF YEAR RESULTS
HY17
14
M&G PrudentialStrong operating platform
Investment performance
28
73 77 19
64 73
1
25 30
48
162
180
2008 2016 HY17
CAGR
‘08-17
Retail
Institutional
PruFund
FUM1, £bn
+51%
+17%
+17%
+13%
4x
PruFund
3yr return3 +23%
(+7ppt vs ABI mixed investment 20%-60%: return of +16%)
Retail
Performance4 +56%
Institutional
Performance4 +100%
(3 year, net of fees – based on fund size)
(3 year, gross of fees – based on number of funds
- FI segregated & public debt mandates)
Internal
External
External FUM2, £bn
Operating performance
above Median
above benchmark
332
1. FUM includes M&G external FUM of £149.1bn plus the UK internal FUM of £193.8bn less £11.3bn that are classified within Prudential Group’s funds.
2. External FUM includes £72.5bn Retail, £76.6bn Institutional and £30bn of UK PruFund FUM
3. Outperformance based on 30 June 2014 to 30 June 2017
4. Investment performance stated in this statement is calculated by M&G, using published benchmarks for products. Retail quartile rankings are compared against funds’ respective peer groups and are sourced from Morningstar Inc. based on returns that are net of fees. Institutional performance is gross of fees and is stated based on the 34 actively managed fixed income
segregated and public debt mandates that have a 3-year performance track record. All performance returns are reported in base fund currency. Returns are not aggregated. Terminated funds have not been included. Data as at end June 2017.
1
PruFund
+4.3Retail
+5.5Institutional
+1.7Net inflows,
HY17 £bn
(+16%)
2017 HALF YEAR RESULTS15
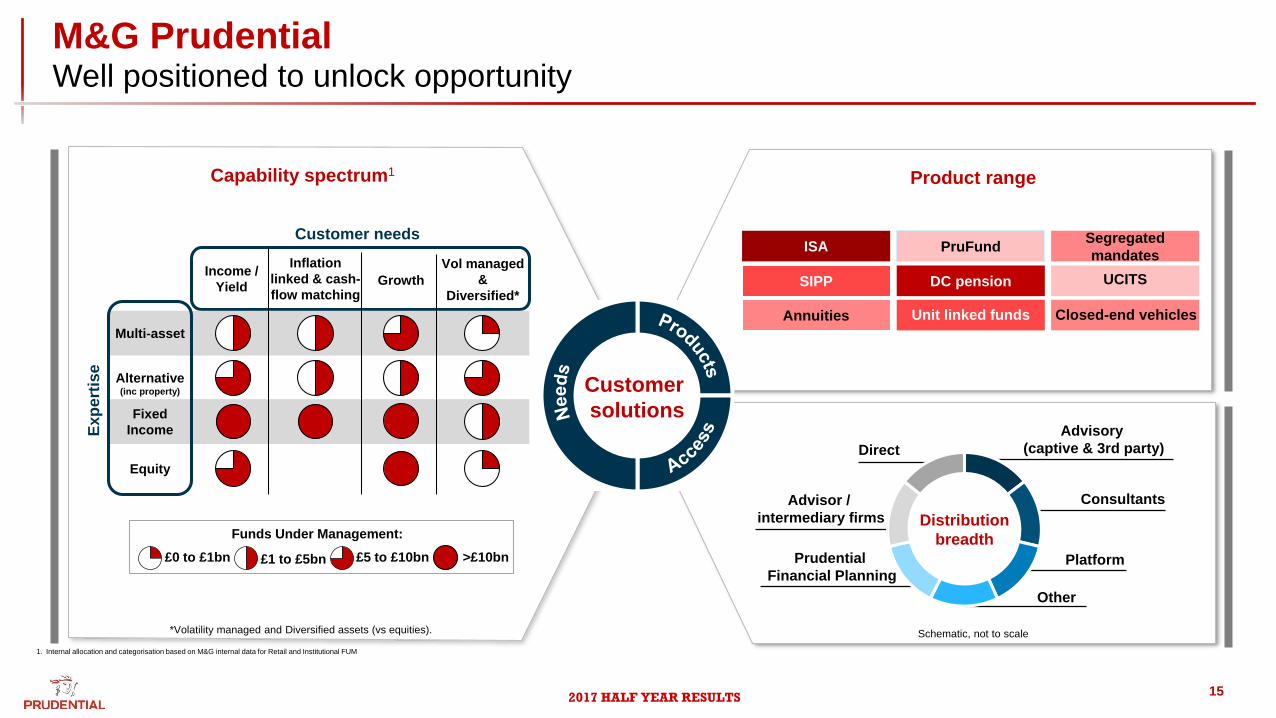
M&G PrudentialWell positioned to unlock opportunity
SIPP
Segregated
mandates
Annuities
PruFund
DC pension
Unit linked funds
UCITS
Closed-end vehicles
ISA
Product range
Customer needs
Exp
ert
ise
Income /
Yield
Inflation
linked & cash-
flow matchingGrowth
Vol managed
&
Diversified*
Multi-asset
Alternative (inc property)
Fixed
Income
Equity
£0 to £1bn £1 to £5bn £5 to £10bn >£10bn
Funds Under Management:Distribution
breadthPrudential
Financial Planning
Direct
Advisory
(captive & 3rd party)
ConsultantsAdvisor /
intermediary firms
Platform
Other
Capability spectrum1
1. Internal allocation and categorisation based on M&G internal data for Retail and Institutional FUM
*Volatility managed and Diversified assets (vs equities). Schematic, not to scale
Customer
solutions

2017 HALF YEAR RESULTS16
M&G PrudentialLeading savings and investment provider
P
P
Strong performance track record provides a platform to lead the industry in creating customer
and shareholder valueP
Savings and investment powerhouse with strong brands, scale and investment expertise
Leverage strengths to create comprehensive financial solutions for customers
Well positioned to succeed over the long-term in a rapidly consolidating and changing
market place. P
Size and scale provide headroom to amplify our current strengths across multiple dimensionsP

2017 HALF YEAR RESULTS
Mark FitzPatrick
Chief Financial Officer
17

2017 HALF YEAR RESULTS18
Group HY17 resultsKey financial highlights
+27%EEV operating profit
AER1HY17
1,845
2,358
HY16
1,615
2,044
£m
IFRS operating profit
1,230 1,118
14.50 12.93
12.9 12.5
1,567 1,510
Remittances
Free surplus generation
Ordinary dividend per share (pence)
Solvency II surplus2,3 (£bn)
EEV per share (pence)4
New business profit 1,689 1,257
2,870 2,257
Growth
Cash
Capital
CER1
n/a
n/a
n/a
n/a
+20%
+5%
+6%
+15%
+14%
+8%
+12%
+15%
+34%
+10%
HY17 FY16
+0.4
HY17 vs HY16
HY17 vs FY16
1 AER: Actual exchange rates. CER: Constant exchange rates
2 Before allowing for the 2017 first interim ordinary dividend (FY16: before allowing for the 2016 second interim ordinary dividend)
3 The Group Shareholder position excludes the contribution to the Group Own Funds and the Solvency Capital Requirement of ring fenced With-Profit Funds and staff
pension schemes in surplus. The Group Shareholder position includes management’s estimate of transitional measures reflecting operating and market conditions at
the valuation date. The estimated Group shareholder surplus would increase from £12.9 billion to £13.6 billion at 30 June 2017 if the approved regulatory transitional
amount was applied instead (31 December 2016: The estimated Group shareholder surplus would increase from £12.5 billion to £12.9 billion)
4 Percentage movement on an annualised basis

2017 HALF YEAR RESULTS19
1 Fee business represents profits from variable annuity products. As well as fee income, revenue for this product line includes spread income from investments directed to the general account and other variable annuity fees included in insurance margin
2 Includes US spread business, US life and other business, Prudential Capital, Africa, central and restructuring costs
3 Represents M&G and Eastspring operating fee income before performance-related fees
Group IFRS operating profitGrowth driven by Asia and US fee business
IFRS operating profit, HY17 vs HY16 (CER), £m
132
122
28
(79)
2,358
(43)
(51)
2,249
Asia life IFRS +16%
Growth led by Asia
Eastspring +20%
Insurance income +14%
High quality sources of income
Life fee income +14%
Asset management fee income3 +14%
Spread income (5)%
HY16 (CER)
Asia
HY17
Other2
HY16 HMRC receipt
Interest costs
M&G / UK
US fee business1
Continued strong contribution from US

2017 HALF YEAR RESULTS20
Business unit IFRS operating profitPositive momentum in underlying drivers of earnings
Asia IFRS operating profit, £m US IFRS operating profit, £m UK IFRS operating profit, £m
69 83
HY 16 HY 17
953
870
821
752
Eastspring
Life
Asia Life
Eastspring5
• Average AUM up +21%2 to £124.9bn
• Revenue +16%; revenue margin 33bp (-1bp)
• Cost / income ratio 55% (HY16 56%)
• In-force earnings up +18%
• Insurance income up +24%; growing in 10 countries1
UK Life
M&G5
• Average AUM up +10%2 to £267.2bn
• Revenue +13%; revenue margin 37bp (+1bp)
• Cost / income ratio 53% (HY16 52%)
Core in-force
Annuities new business
Management actions4
492 497
225 248
HY 16 HY 17
745717
M&G
Life and GI
HY16 HY17
306
27
140
288
4
188
473 480
(13) (6)
HY 16 HY 17
1,073
1,079
997
1,010Life
Other US
US Life
• Fee business earnings3 +17%
➢ Positive net flows of $2.6bn
➢ Separate account average AUM +16%2
• Spread margin down 15bp to 202bp
+20%
+16%
+16%
+7%
+8%
+1%
+4%
+10%
(CER) (CER)
1 Does not include Laos where amounts are immaterial
2 Increase in average assets represents HY17 average compared to HY16 average on a CER basis
3 Fee business represents profits from variable annuity products. As well as fee income, revenue for this product line includes spread income from investments directed to the
general account and other variable annuity fees included in insurance margin
4 Management actions represents longevity reinsurance transactions of £31m (HY16: £66m) and specific asset and liability management actions of
£157m (HY16: £74m) taken to improve the solvency position of our UK life business and further mitigate market risk
5 Excludes performance-related fees. Growth rates based on comparatives using a constant exchange rate basis

2017 HALF YEAR RESULTS21
Group new business profitStrong new business growth in both life and asset management
New business profit by business unit, £m
928 1,092
354436125
161
HY 16 HY 17
1,689
1,407
UK
US
Asia
Group
• Life NBP up 20%1 and asset management inflows of £9.5bn
• Overall 9% beneficial impact from interest rates on NBP
Asia
• Continued focus on H&P: H&P NBP +19%1
• Broad diversification: 8 countries with at least double digit growth in NBP1,2
• Regular premium business 94% of total APE
• Eastspring
US
• Variable annuity net inflows of $2.6bn, outperforming market
• Variable annuity new business profit +30%1
• Positive interest rate impact, contributing 14ppts of growth
UK
• Growth driven by retirement segment products5, with NBP +135%
• PruFund related APE sales +29%; PruFund AUM £30.0bn (+22% YTD)
• M&G
+29%
+23%
+20%
+18%
Asset management external net flows, £bn
(0.4)2.3
(7.0)
7.2
9.5
(7.4)
M&G
Eastspring3
(CER)
1 Growth rates based on comparatives using a constant exchange rate basis.
2 Does not include Laos where amounts are immaterial
3 Excludes Money Market Fund flows of £499m (HY2016: £656m)
4 Growth rates based on comparatives using an actual exchange rate basis
- Net external inflows of £2.3bn3, driven by Retail business
- Total AUM of £130.5bn, up 11%4 year-to-date
- Record H1 Retail net inflows of £5.5bn; Institutional net inflows of £1.7bn
- Total AUM of £281.5bn, up 6% year-to-date
HY16(AER)
HY17
5 Includes income drawdown and individual pensions

2017 HALF YEAR RESULTS
Asia US UK
22
1 HY16 restated on a constant exchange rate basis, increasing Asia life expected return from in-force by £69m and increasing US life expected return from in-force by £76m
2 Includes amounts relating to specific asset and liability management actions taken in 2017 to improve the solvency position of our UK life businesses and further mitigate market risk. These actions generated an overall positive effect of £193m (HY2016: £190m).
3 HY16 restated on a constant exchange rate basis, increasing Asia new business strain by £29m and increasing US new business strain by £29m
Group free surplus generationGrowing contribution from life in-force and asset management
Life and asset management free surplus generation, £m
Expected return from in-force
Experience result2
Investment return on free surplus
Asset management and Other
Net free surplus generation
HY16
CER
Life in-force result
Gross free surplus generation
Less: new business strain3
1,568
1,738
2,289
2,031
52
411
258
551
Change
10%
6%
6%
5%
27%
(17)%
12%
4%
1,719
HY17
1,845
2,416
2,127
66
342
289
571
HY 16 HY 17 HY 16 HY 17 HY 16 HY 17
614 673 631 715
323 331
HY 16 HY 17 HY 16 HY 17 HY 16 HY 17
257 283238 246 56 42
Asia US UK
New business strain3, £m
+10% +3% (25)%
+10% +13% +2%
Expected return from in-force1, £m

2017 HALF YEAR RESULTS23
1 Contribution from M&G of £175m and from UK Life of £215m
Group cash Growing cash flows to Group
Movement in life and asset management free surplus, £m
6,575
30 Jun
2017
1,845 (1,230)(317)
Cash
remitted to
Group
1 Jan
2017
Net free
surplus
generated
Market
effects /
other
Currency
effects
6,979
106Opening (1 Jan 2017)
Cash remitted to Group
Asia
M&G / UK1
US
2,626
15
475
350
1,230
Other
Central costs / corporate activities / other
Closing (30 Jun 2017)
390
(413)
2,657
2016 second interim dividend paid (786)
+10%
Movement in central cash, £m
2017 HALF YEAR RESULTS24
Note: numbers may not sum due to rounding and differences in shares in issue between 31 December 2016 and 30 June 2017
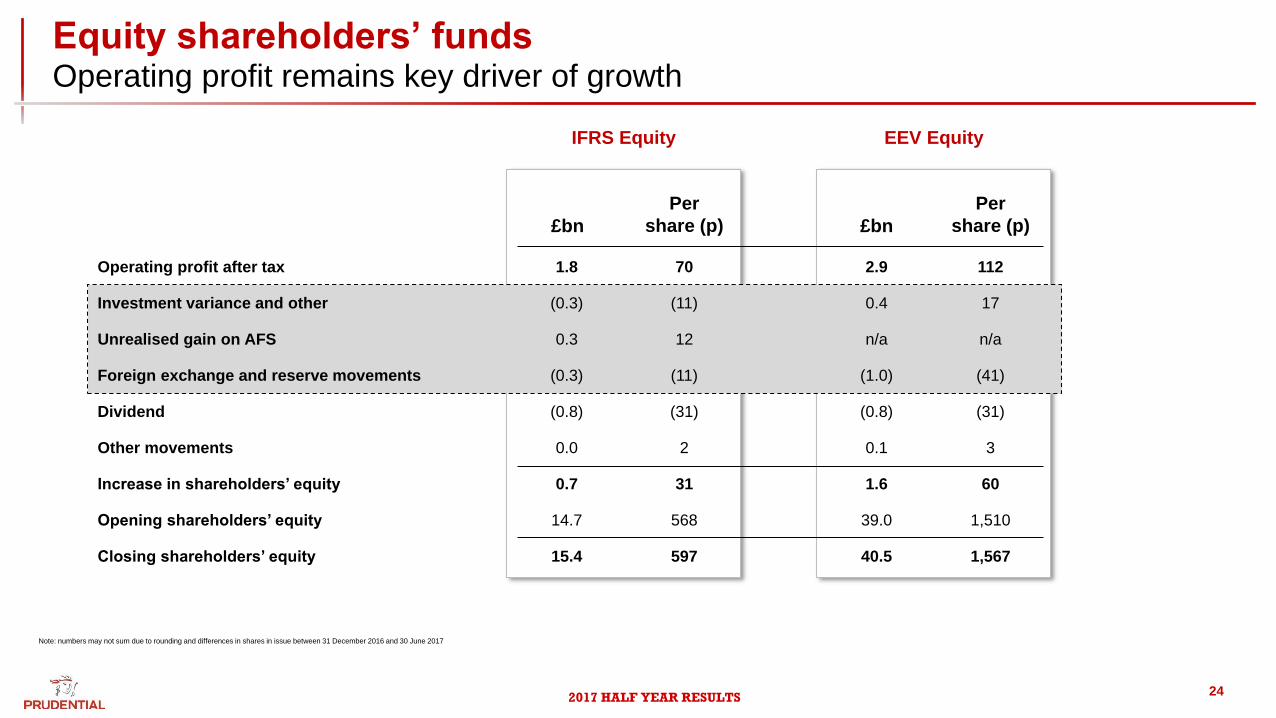
Equity shareholders’ fundsOperating profit remains key driver of growth
Operating profit after tax
Investment variance and other
Unrealised gain on AFS
Foreign exchange and reserve movements
Dividend
Increase in shareholders’ equity
Opening shareholders’ equity
Other movements
£bn
Per
share (p) £bn
Per
share (p)
112
n/a
(31)
60
1,510
1,567
2.9
n/a
(0.8)
1.6
39.0
40.5
1.8
(0.8)
0.7
14.7
15.4
70
(31)
31
568
30.10.0 2
(0.3)
(0.3)
17(11)
(41)(11)
0.4
(1.0)
0.3 12
Closing shareholders’ equity 597
EEV EquityIFRS Equity

2017 HALF YEAR RESULTS25
Solvency IIStrong solvency capital position
24.8
12.3
Group Shareholder Solvency II capital position1, £bn
25.6
12.7
Surplus
Solvency II
cover202%
Own
Funds
SCR
30 Jun 20172,3
£12.9bn
201%
£12.5bn
Own
Funds
SCR
31 Dec 20162,3
HY17 movement in Solvency II capital1, £bn
12.5
12.9
31 December 20162,3
Operating experience
Currency movements
Dividends paid
Non-operating experience,
including market effects
30 June 20172,3
1.5
(0.5)
(0.8)
0.0
Management actions 0.2
Impact on SII
coverage ratio
~12pts
~(5)pts
~(6)pts
1 The Group Shareholder position excludes the contribution to the Group SCR and Own Funds of ring fenced With-Profit Funds and staff pension schemes in surplus.
2 Before allowing for the 2017 first interim ordinary dividend (FY16: before allowing for the 2016 second interim ordinary dividend)
3 The Group Shareholder position includes management’s estimate of transitional measures reflecting operating and market conditions at the valuation date. The estimated Group shareholder surplus would increase from £12.9
billion to £13.6 billion at 30 June 2017 if the approved regulatory transitional amount was applied instead (31 December 2016: The estimated Group shareholder surplus would increase from £12.5 billion to £12.9 billion)

2017 HALF YEAR RESULTS26
Balance sheetWell capitalised and defensively positioned
Capital strength
Liquidity• Central cash of £2.7bn
• Access to revolving credit facilities of £2.6bn, untapped
• Well capitalised at Group and local levels
• Strong operating capital generation in the period
• Continued active management to optimise position
Conservative
management
• High quality credit portfolio with 97% sovereign debt or
investment grade
• Zero credit default losses and minimal impairments
• Continuing pivot towards more capital-light product portfolio
Credit portfolio
98% of US / UK
credit portfolio is
investment grade
AA
AAA
A
BBB
<BBB
• US shareholder debt exposure of £38bn
• 97% investment grade
• Corporate debt portfolio across c.1,000
issuers with average holding of £28m
• UK shareholder debt exposure of £35bn
• 98% investment grade
• Corporate debt portfolio across c.500 issuers
with average holding of £48m
US and UK combined credit portfolio, £73bn
2017 HALF YEAR RESULTS27
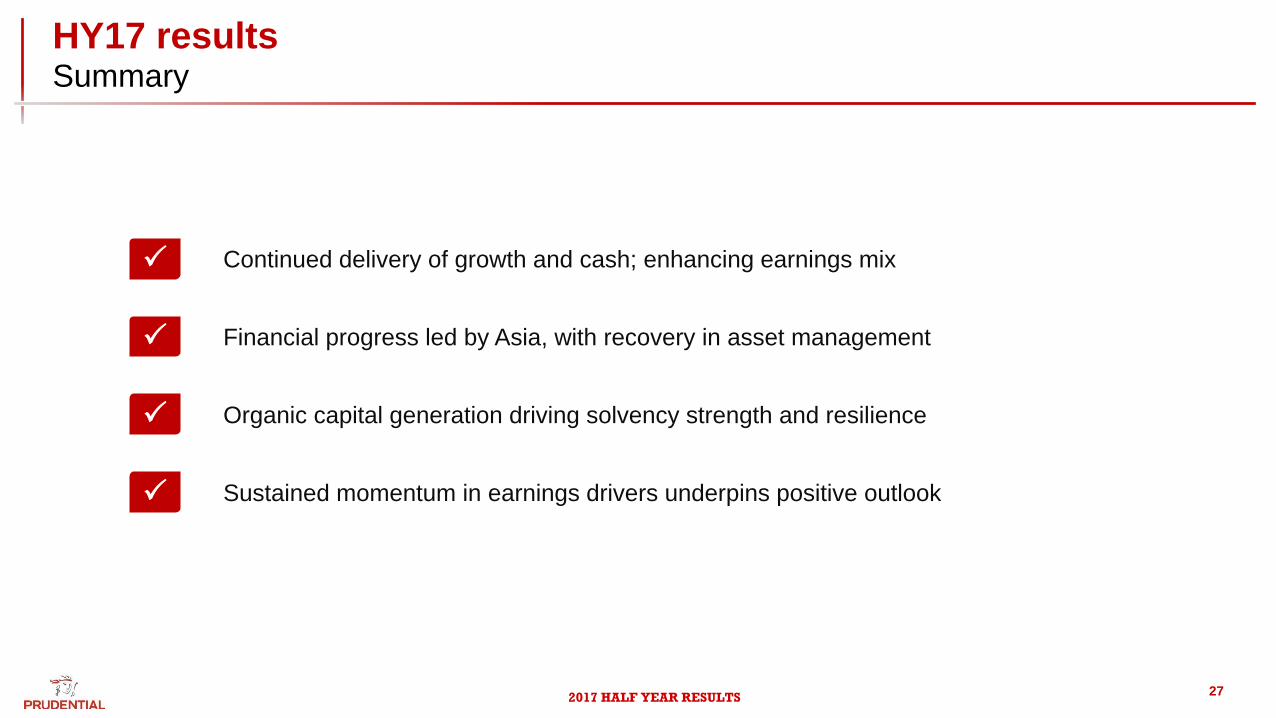
HY17 resultsSummary
Continued delivery of growth and cash; enhancing earnings mix
Financial progress led by Asia, with recovery in asset management
Organic capital generation driving solvency strength and resilience
Sustained momentum in earnings drivers underpins positive outlook
P
P
P
P

2017 HALF YEAR RESULTS
Assets under
management£635billion
EEV shareholders’ funds
£40.5billion
Asia recurring
premium base1>£9billion
Solvency II surplus
£12.9billion
28
Financial profileScale, growth and resilience
Scale
Growth
Resilience
IFRS2.1x in 5 years
2.1x in 5 years
NBP
FSG
Assets under
management
doubled since 30 June
2010
✓ Strong customer outcomes
✓ Active in-force management
✓ Recurring income streams✓ Products aligned to customer needs
✓ High quality, diversified distribution
✓ Capital efficient new business✓ Disciplined capital allocation
✓ Strong risk management
✓ Conservatively managed balance sheet
Balance sheet strength
asset mix
solvency
funding
liquidity
Diversification
Earnings quality
geography
channel
product
currency
fee income
H&P
capital-light
recurring1.8x in 5 years
Note: Assets under management, EEV shareholders’ funds and Solvency II surplus figures are as at 30 June 2017. Full year 2016 numbers used for IFRS, NBP, FSG and Asia recurring premium base.
1 Represents FY16 renewal premiums. Total weighted premium income, including new business of £3.5bn, was £12.6bn.

2017 HALF YEAR RESULTS29
M&G PrudentialFinancial profile
1 Includes general insurance commission of £17 million (2016: £19 million), shareholder-backed annuity new business profit of £4 million (2016: £27 million) and £188 million
from management actions (2016: £140 million).
2 Relates to performance related fees and share of associate’s results
HY16 HY17
External AUM
HY16 HY17
97%
HY16 HY17
HY16 HY17
45%
10%
45%
Fee
income
+49%+15%
AnnuitiesWith-
profits
Fee income
• Shareholder investment of circa £250m
Transformation to efficient, services-led, digitally-enabled
business
• Shareholder cost savings of circa £145m pa4 by 2022
Accelerating shift in mix to fee income and with-profits
Leverage scale and capabilities to enhance growth prospects
AU
M G
row
th
(£b
n)
IFR
S o
p.
inc
om
e
Rem
itta
nces
3
(£m
)
130 149
PruFund AUM
2030
Other2
150 175215 215
M&G Prudential UK&E
M&G Prudential
IFR
S o
p.
pro
fit
(£m
)
HY16 HY17 HY16 HY17
225 248
492 497
186 209
306 288
Other1
Core
3 HY16 UK remittances exclude non-recurring UK remittances of £131 million
4 Pre-tax

2017 HALF YEAR RESULTS
Mike Wells
Group Chief Executive
30

2017 HALF YEAR RESULTS
IFRS operating profit1,2,5, £m New business profit1,2,3,4, £m Free surplus generation1,2,3,4, £m
GroupLong-term track record
31
546619
699811
1,013
1,149
1,4071,504
1,862
2,044
2,358
HY2007
HY2008
HY2009
HY2010
HY2011
HY2012
HY2013
HY2014
HY2015
HY2016
HY2017
314375
474
616
740806
899
1,001
1,1861,257
1,689
HY2007
HY2008
HY2009
HY2010
HY2011
HY2012
HY2013
HY2014
HY2015
HY2016
HY2017
473 510
614
917
1,1011,024
1,1501,220
1,406
1,615
1,845
HY2007
HY2008
HY2009
HY2010
HY2011
HY2012
HY2013
HY2014
HY2015
HY2016
HY2017
5.4x
+18%
1 Comparatives have been stated on an actual exchange rate basis
2 Excludes Korea life, Japan life and Taiwan agency. HY2014 comparatives have been restated to exclude the contribution from the sold PruHealth and PruProtect businesses.
HY2008 to HY2013 comparatives include the results of PruHealth and PruProtect
CAGR
4.3x
+16%
CAGR
3.9x
+15%
CAGR
3 On a post tax basis
4 Results for UK insurance operations have been prepared on a basis that reflects the Solvency II regime effective from 1 January 2016. HY15 results and prior reflect the Solvency I
basis being the regime applicable for those periods
5 Adjusted for new and amended accounting standards.

2017 HALF YEAR RESULTS
GroupKey take-aways
32
Asia continues to underpin growth
Strong balance sheet, defensive positioning
High quality, broad based performance
M&G Prudential leverages complementary strengths to unlock further value
Well positioned to deliver long-term, profitable growth
P
P
P
P
P

2017 HALF YEAR RESULTS
16th November 2017
Investor Conference, London

2017 HALF YEAR RESULTS
Appendix
2017 Half Year Results
34

2017 HALF YEAR RESULTS
GroupClear strategy
35

2017 HALF YEAR RESULTS
GroupPremium franchises
1 Source: Based on formal (competitors results release, local regulators and insurance associations) and informal (industry exchange) market share data. Ranking based on new business (APE or weighted FYP depending on availability of data)
2 Based on assets sourced from the region. Excluding Japan, Australia and New Zealand as at September 2016. Source Asia Asset Management September 2016 (Ranked according to participating regional players only)
3 Source: LIMRA 1Q 2017
4 As at 30 June 2017
Leading pan regional franchise
In Asia since 1923
£131bn funds under management4
15m life customers with Top 3 position
in 9 out of 12 life markets1
Leading2 Asian asset manager with +20
years operating history
Founded in 1961
4m life customers
18% market share Variable Annuities3
$228bn of statutory admitted
assets4
Premier retirement income player
6m life customers
169 years of providing financial security
£332bn funds under management4
Over £30bn PruFund funds under
management4
Well recognised brands with strong
track record
36
Asia US UK
2017 HALF YEAR RESULTS
194 198284 334 402
488 486
660821
1,092
89190
235298
288
311 376
371
311
436
92
86
97
108116
100139
155
125
161
375
474
616
740806
899
1,001
1,1861,257
1,689
HY08 HY09 HY10 HY11 HY12 HY13 HY14 HY15 HY16 HY17
73 89 117 122 153 155 161 200 228283157
168179 135
180 211 173164
209
246
93 4535
33
2220
3657
56
42
323 302331
290
355386 370
421
493
571
HY08 HY09 HY10 HY11 HY12 HY13 HY14 HY15 HY16 HY17
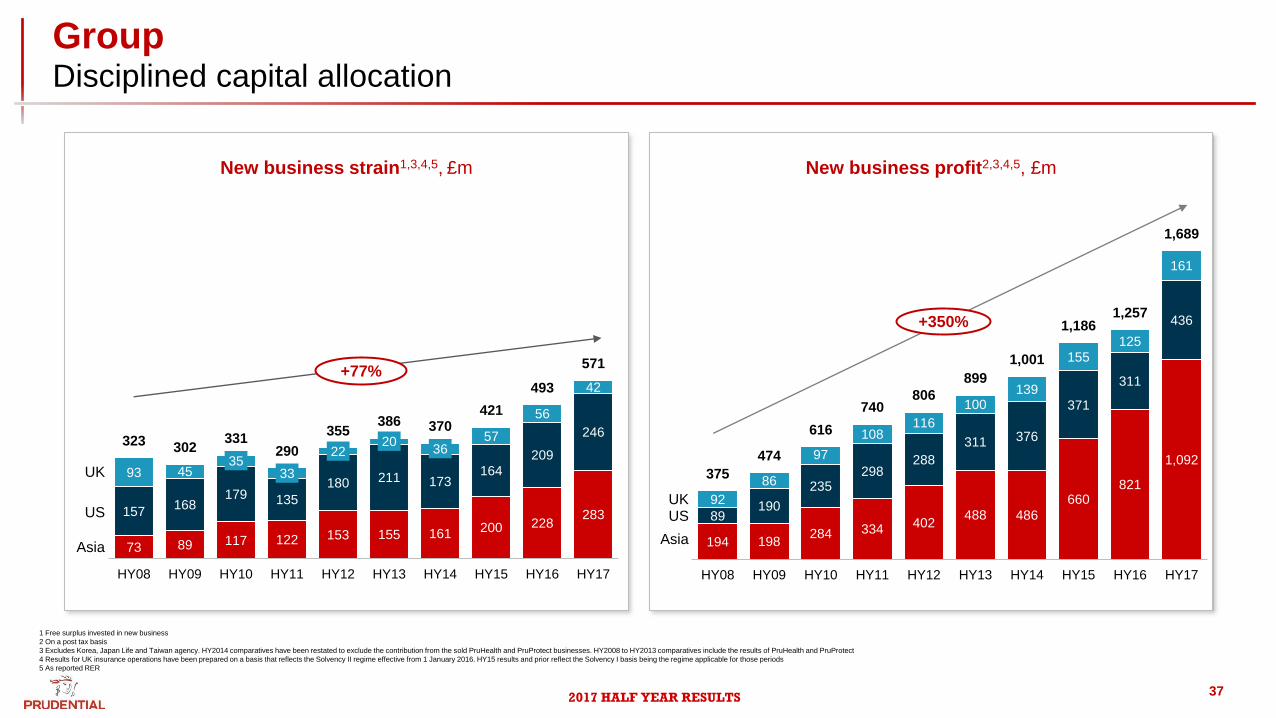
GroupDisciplined capital allocation
1 Free surplus invested in new business
2 On a post tax basis
3 Excludes Korea, Japan Life and Taiwan agency. HY2014 comparatives have been restated to exclude the contribution from the sold PruHealth and PruProtect businesses. HY2008 to HY2013 comparatives include the results of PruHealth and PruProtect
4 Results for UK insurance operations have been prepared on a basis that reflects the Solvency II regime effective from 1 January 2016. HY15 results and prior reflect the Solvency I basis being the regime applicable for those periods
5 As reported RER
Asia
US
UK
+77%
+350%
New business strain1,3,4,5, £m
Asia
USUK
New business profit2,3,4,5, £m
37

2017 HALF YEAR RESULTS
1H17
Brexit
developments
Trump
inauguration
UK election
French
election
2006 2007 2008 2009 2010 2011 2012 2013 2014 2015 2016
Rising oil and
commodity
prices
Military coup in
Thailand
Powerful
earthquake kills
thousands in
Java, Indonesia
Sub-prime
mortgage credit
crises begins
China and Europe
growth concerns
Savers begin
withdrawing
savings from
Northern Rock
BNP Paribas first
major bank to
acknowledge the
risk of exposure
to sub-prime
mortgage
markets
Liquidity crisis
Sub-prime
market concerns
Lehman
Brothers
collapse
Asset risk
concerns
Start of global
recession
European
sovereign debt
crisis begins
All time low
interest rates
Focus on
Solvency II
implications
US industry VA
losses emerge
Greece and
Ireland bailouts
Regulatory
change in India
Concern over
China hard-
landing
Focus on
exposure to
deepening
Eurozone debt
crisis
US debt ceiling
Europe re-enters
recession
FAIR review in
Singapore
Regulatory
change in the
UK accelerates
Concern over
China & EM
growth
QE tapering
RDR goes live in
the UK
Designation of
GSIIs announced
Asia FX
depreciation
Expectation of a
rise in US interest
rates
UK annuity
changes
Indonesia
elections
Military coup in
Thailand
Solvency II
finalisation
Asia / China
slowdown fears
US$
strengthening &
commodity price
decline
UK elections /
pensions
freedoms
Greece
negotiations
Europe QE
US rate rise
Brexit
US Elections
US Department
of Labor
NAIC proposals
China SAFE
controls
GroupEffective response to challenges
1 Adjusted for new and amended accounting standards
2 Comparatives have been stated on an actual exchange rate basis and exclude the contribution from Korea life and Japan life
3 Based on Total Funds Under Management at FY2006 - HY2017
IFRS operating profit1,2, £m
1,077 1,181 1,232 1,438 1,811 2,000
2,504 2,937
3,154
3,969
4,256
2,358
150
200
250
300
350
400
450
500
550
600
-
500
1,000
1,500
2,000
2,500
3,000
3,500
4,000
4,500
2006 2007 2008 2009 2010 2011 2012 2013 2014 2015 2016 HY17
599
251
635
Total AUM3, £bn
38
2,044+15%

2017 HALF YEAR RESULTS
400 455 683 864 1,0721,384 1,610 1,888 2,175
989 1,279932 914
1,1401,252
1,362
1,5871,635
1,6821,629
765880
294 431
574722
1,000
1,3291,393
1,671
1,991
898
1,152
537750
998
1,049
1,061
1,0711,129
1,153
1,171
556
583
FY 2008 FY 2009 FY 2010 FY 2011 FY 2012 FY 2013 FY 2014 FY 2015 FY 2016 HY 2016 HY 2017
GroupGrowth in high quality earnings
58%
Asset Mgt Fee income Spread incomeInsurance margin Life Fee income Other
6,278
5,883
5,011
4,418
3,979
3,1082,801
1 Comparatives adjusted for new and amended accounting standards
2 As reported RER
3 Excludes Korea, Japan Life and Taiwan agency. FY2014 comparatives have been restated to exclude the contribution from the sold PruHealth and PruProtect businesses. FY2008 to FY2013 comparatives include the results of PruHealth and PruProtect
4 Excludes UK specific management actions taken to position the balance sheet more efficiently under the new Solvency II regime
76%
6,932
Sources of IFRS operating income1,2,3,4, £m
79%
3,481
4,169
7,504
39

2017 HALF YEAR RESULTS
83
3 91
6
1,2
48
1,3
91
1,3
79
1,5
36
1,5
90 1
,82
7
2,1
08
2,4
16
32
3 30
2
33
1 29
0
35
5 38
6
37
0
42
1
49
3
57
1
51
0 61
4
91
7 1,1
01
1,0
24
1,1
50
1,2
20 1,4
06 1,6
15
67
9
1,8
45
78
6
169226 3
18 43
9
44
0 53
2 61
0
65
9
25
6
104175
144
18
9
20
1 19
7 20
8
22
1
25
3
32
0
GroupFree surplus generation
1 Excludes Korea, Japan Life and Taiwan agency. HY2014 comparatives have been restated to exclude the contribution from the sold PruHealth and PruProtect businesses. HY2008 to HY2013 comparatives include the results of PruHealth and PruProtect
2 Central outgoings includes RHO costs
3 Results for UK insurance operations have been prepared on a basis that reflects the Solvency II regime effective from 1 January 2016. HY15 results and prior reflect the Solvency I basis being the regime applicable for those periods
Surplus generation1 Net free surplus Dividend net of scrip Central outgoings2Investment in new business1
Free surplus3 and dividend, £m
Special dividend
3.6x
Net free surplus
HY 2008 HY 2009 HY 2010 HY 2012HY 2011 HY 2013 HY 2014 HY 2015 HY 2016 HY 2017
40
X% Reinvestment rate
39%33%
27%
21% 26%
25% 23%
23%
23%
24%

2017 HALF YEAR RESULTS
5.42 5.70 5.99 6.29 6.61 7.95 8.40 9.73 11.19 12.31 12.93 14.50
11.72 12.30 12.91 13.5617.24
17.2420.79
23.8425.74
26.4730.57
10.00
17.14 18.00 18.90 19.85
23.8525.19
29.19
33.57
36.93
48.78
43.50
2006 2007 2008 2009 2010 2011 2012 2013 2014 2015 2016 H1 2017
First interim dividend
Second interim dividend
Total dividend
Dividend, pence per share
38.78
Special dividend
+5.0% +5.0% +5.0% +20.2% +15.9% +15.0% +10.0% +5.0% +12.2%+5.6%
GroupDelivering cash
41
£7.6bnTotal dividends1 to
shareholders 2006-HY17
1 Amounts paid between 2006 and 2010 are net of scrip dividends

2017 HALF YEAR RESULTS
GroupInterim dividend
12.93 14.50
30.57
43.50
14.50
2016 H1 2017
First interim Second interim
+12%
First interim dividend increased by 12 per cent to 14.50 pence per share
Ex-dividend date:
24 August 2017 (UK, Ireland and Hong Kong)
23 August 2017 (Singapore)
Record date: 25 August 2017
Payment of dividend:
28 September 2017 (UK, Ireland and Hong Kong)
On or about 5 October 2017 (Singapore)
On or about 5 October 2017 (ADR holders)
Dividend, pence per share
42

2017 HALF YEAR RESULTS
IFRS income by revenue source,
HY17 %
IFRS earnings split by currency1,2,3,6,
%
HY 2017
GBP
USD
USD linked
Other
1 USD linked includes Hong Kong and Vietnam where currencies are pegged to the USD, and Malaysia and Singapore where currencies are managed against a basket of currencies including the USD
2 Includes long-term, asset management business and other businesses
3 For operating profit UK sterling includes amounts in respect of central operations as well as UK insurance operations and M&G
4 Operating profit comprises the following: Asia life as disclosed in note 1(b) of the ‘additional financial information’, after deducting development expenses. Jackson IFRS operating profit after adding back acquisition costs expensed (and not deferred) in the period of £110m. HY17 UK operating profit excluded the £188m (HY16: £140m) contribution from
longevity reinsurance and other management actions taken to improve solvency. Asset management operating profit for M&G, PruCap, Eastspring and US broker-dealer and asset management
5 As reported (RER)
6 UK sterling includes amounts in respect of UK insurance operations, M&G and central operations. Operating profit for central operations includes amounts for corporate expenditure for Group Head Office as well as Asia Regional Head Office which is incurred in HK dollars. Sterling operating profits also include all interest payable as sterling denominated,
reflecting interest rate currency swaps in place
79%
Insurance
margin
Life Fee
income
Asset Mgt
Fee income
Spread
income
Other
14%
46%
22%
18%
HY 2017
Life
Asset
management
In-force IFRS operating profit4,5, £bn
2.0
0.3
2.3
HY16-HY17
Growth
16%
15%
17%
GroupWell positioned to deliver across cycles
43

2017 HALF YEAR RESULTS
GroupCash remittances to Group
1 Includes £42 million of proceeds from the sale of Japan
2 As reported RER
Business unit net remittances2, £m
2014201320122011201020092008 2015 2016
Asia US UK M&G & PruCap Other
HY 2016
44
5 40
233 206341 400 400 4671 516
258350
144 39
80
322
249294
415
470 420
339
475
199434
420
297313
355
325
301 300
215
215
30147
131
167
175
202
280297
292
342
357
335
175
190
515
688
935
1,1051,200
1,341
1,482
1,6251,718
1,118
1,230
HY 2017

2017 HALF YEAR RESULTS
14.6 15.0 15.318.2
19.622.4
24.9
29.2
32.4
39.040.5
2007 2008 2009 2010 2011 2012 2013 2014 2015 2016 HY 2017
Shareholders’ equity (EEV), £bn
1 Return on embedded value is based on EEV post-tax operating profit, as a percentage of opening EEV basis shareholders’ equity
Full Year Return on
Embedded Value1,
%
15% 14% 15% 18% 16% 16% 19% 16% 17% 17%
GroupGrowing value at consistent returns
45

2017 HALF YEAR RESULTS
AsiaLong term opportunity
1 Geary-Khamis dollar, based on purchasing power parities with 1990 as benchmark year - one 1990 dollar has the same purchasing power as the US dollar in 1990. Prudential estimates
2 Source: Based on formal (competitors’ results release, local regulators and insurance associations) and informal (industry exchange) market share data. Ranking based on new business (APE or weighted FYP depending on availability of data)
3 Total JV / foreign players only
4 Ranking among private players, share among all players on fiscal year basis
GDP per capita in 2010, against the US GDP per capita,1990 US$1 Top 3 in 9 /12 Asian countries2
0
5,000
10,000
15,000
20,000
25,000
30,000
35,000
1820 1840 1860 1880 1900 1920 1940 1960 1980 2000
Indonesia
Malaysia
Singapore
Philippines
Thailand
Hong Kong
VietnamChina
Taiwan
India
US GDP per capita
46
Singapore (1931) 3rd
India (2000)4 1st
Indonesia (1995) 1st
Taiwan (1999) 12th
Vietnam (1999) 2nd
Hong Kong (1964) 2nd
Philippines (1996) 3rd
Malaysia (1924) 1stCambodia (2013) 1st
Thailand (1995) 10th
Laos (2015) 3rd
China (2000)3 4th
(YYYY) Operations start date

2017 HALF YEAR RESULTS
AsiaFavorable dynamics
1 Source: IMF data, April 2017
2 Source: Swiss Re. Market penetration based on life insurance premiums as a percentage of GDP in 2015 (estimated)
2017F GDP
growth1
2017F GDP
($bn)1
2017F
Population1 (m)
Market
penetration2 (%)
1,021 5.1%Indonesia (1995) 262 1.3%
330 6.8%Philippines (1996) 106 1.4%
332 2.4%Hong Kong (1964) 7 13.3%
3.0%433Thailand (1995) 69 3.7%
2,454 7.2%India (2000) 1,327 2.7%
11,795 6.6%China (2000) 1,391 2.0%
567 1.7%Taiwan (1999) 24 15.7%
21 6.9%Cambodia (2013) 16 -
216 6.5%Vietnam (1999) 94 0.8%
310 4.5%Malaysia (1924) 32 3.4%
292 2.3%Singapore (1931) 6 5.6%
Laos (2015) 7 - 15 6.8%
47(YYYY) Operations start date

2017 HALF YEAR RESULTS
Asia Products meet customer needs and create shareholder value
1 Expenses for a male aged 50 for heart diseases and heart surgery treatment
100
81
27
19
73
Withoutinsurance
Basic governmentinsurance
Prudentialprotectionproduct
Saving
Spend
100
114117
123
143
Prudential Co. A Co. B Co. C Co. D
Health and Protection – Out of pocket medical expenses1 Annual premium for a customer aged 50 (indexed)
48

2017 HALF YEAR RESULTS
5.0%
12%
11% 11%
10%
PrudentialExample
US France Germany UK
AsiaAffordable products underpin consumer demand
1 Average Prudential customer spend on insurance products
2 Source: OECD, UN population stats, Prudential estimates. Premium spend includes healthcare expenditure by private and public sources except for the US. Healthcare spend data adjusted for working age population and unemployment rates
Healthcare spend as % of average annual income2
46
54
Premiums as a proportion of average annual
income
Linked
premium
Premiums paid = 9%of average annual income
100% = average annual income
H&P
premium
% of premium used
to purchase benefit
Prudential product premium1 Developed markets health insurance spend2
49

2017 HALF YEAR RESULTS
AsiaGrowing demand for healthcare
Household consumption by category1, %
1990 2010
100% = $0.5tn
100% = $1.3tn
1 Euromonitor, McKinsey, Prudential estimates
Food
Housing
Household products
Healthcare
Clothing
Communications
Transportation
Education
Recreation
Personal items
Semi-Necessities
Necessities
Discretionary
34
13
910
14
31
15
5
7
5
3
12
3
14
6
2
2
5
66
50

2017 HALF YEAR RESULTS
AsiaWealth and financial assets ownership
70%
38%
16%
9%
20%
21%
9%
18%
24%
12%
24%
39%
Per capita income level
Bank Deposits
Asset Mgt
Non-Life
Life
Up to
$2,000
$2,000 to
$15,000
$15,000+
Source: Oliver Wyman analysis; Prudential analysis
Breakdown of personal financial assets
51
2017 HALF YEAR RESULTS
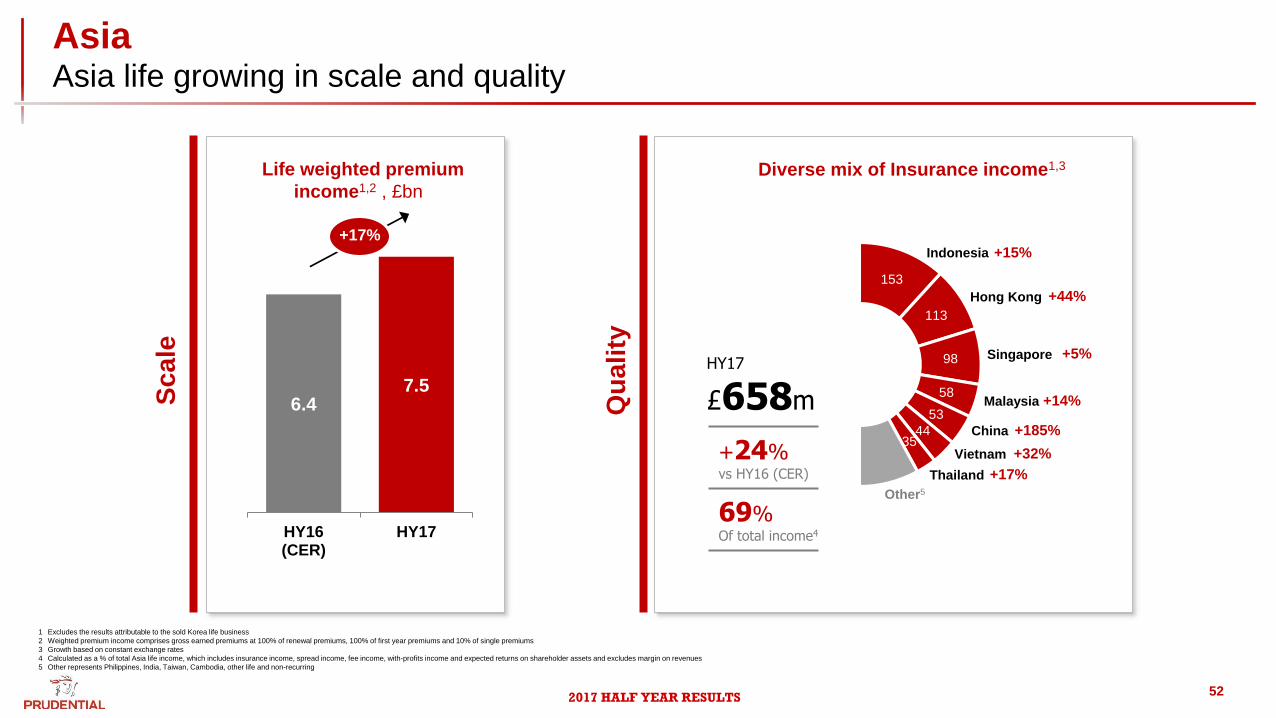
AsiaAsia life growing in scale and quality
52
1 Excludes the results attributable to the sold Korea life business
2 Weighted premium income comprises gross earned premiums at 100% of renewal premiums, 100% of first year premiums and 10% of single premiums
3 Growth based on constant exchange rates
4 Calculated as a % of total Asia life income, which includes insurance income, spread income, fee income, with-profits income and expected returns on shareholder assets and excludes margin on revenues
5 Other represents Philippines, India, Taiwan, Cambodia, other life and non-recurring
6.47.5
HY16(CER)
HY17
+17%
Life weighted premium
income1,2 , £bn
153
113
98
58
53
4435
£658m
Singapore
Hong Kong
Malaysia
Vietnam
+15%
+44%
+14%
+32%
China
Other5
+5%
+185%
Indonesia
HY17
Thailand +17%
Diverse mix of Insurance income1,3
+24%vs HY16 (CER)
69%Of total income4
Qu
ality
Scale

2017 HALF YEAR RESULTS
AsiaLife APE by market
1 Source: Based on formal (competitors’ results release, local regulators and insurance associations) and informal (industry exchange) market share data. Ranking based on new business (APE or weighted FYP depending on availability of data)
2 Total JV / foreign players only
3 Ranking among private players, share among all players on fiscal year basis
Asia APE by market, £m (Constant Exchange Rate)
53
159
118143
116
8468
50 5132
6
195 187
144128 122
105
6242 36
8
-7%
+58%+23%
+1%
+45%
+13%
+10%
+24%+54%
-18%
3rd2nd 4th 1st 2nd 3rd1st 12th
Indonesia
HY 2016 HY 2017Ranking
Hong Kong Singapore Malaysia TaiwanIndia 26%China 50% Vietnam PhilippinesThailand
1st 10th
X% HY 2017 v HY 20161
XX
914
987
2 3
+33%
Cambodia
1st
612 706
316386
1H 2016 1H 2017
1,092928
+18%
987 914
827
1H 2016 1H 2017
1,9431,814
Asia NBP (CER) Asia APE (CER)
Ex-broker
HKAsia ex-HK
1,029
+7%+12%

2017 HALF YEAR RESULTS
6 9 23
11
77
27
63
46
45
56
68
81
13
7
11
4
75
10
3
13
9
14
8
18
3
20
6
19
4
24
0
10
0
11
3
91
10
3
12
0
79 10
6
15
1
20
6
28
1
34
0
36
0
49
4
51
5
64
8 84
1
1,0
13
1,3
02
1,4
20
1,6
54
1,8
29
1,9
18 2
,51
8
3,3
59
1,5
05
1,8
30
1995 1996 1997 1998 1999 2000 2001 2002 2003 2004 2005 2006 2007 2008 2009 2010 2011 2012 2013 2014 2015 2016 HY2016
HY2017
Single Premium APE Regular Premium
MSCI Asia ex Japan2
1 Comparatives have been stated on a reported exchange rate. Comparatives from 2006-2016 exclude the contribution from Korea life
2 Source: Datastream
Regular and Single Premium APE1, £m
Regular premium
c90%
AsiaHigh quality, defensive growth
54

2017 HALF YEAR RESULTS
Asia Life APE sales by product - percent
71% 69%
56%
44%37% 41% 39% 36%
28% 29%25% 26% 26%
21% 22% 24%19% 16% 13% 15% 15%
7% 10%
22%
29%
29%28%
27% 30%
32% 31%33% 33% 31%
31% 30% 28%
27%26%
25% 24% 27%
20% 18% 20% 26%31% 29% 32% 31%
36% 35% 37% 35% 36%39% 40% 40%
46% 52% 59% 56% 53%
2% 3% 2% 1% 3% 2% 2% 3% 4% 5% 5% 6% 7% 9% 8% 8% 8% 6% 3% 5% 5%
1H'07 2H'07 1H'08 2H'08 1H'09 2H'09 1H'10 2H'10 1H'11 2H'11 1H'12 2H'12 1H'13 2H'13 1H'14 2H'14 1H'15 2H'15 1H'16 2H'16 1H'17
Linked Health Par Other
Asia APE by product,1 %
55
1 All comparatives restated to exclude Korea Life

2017 HALF YEAR RESULTS
Asia Life flows and persistency
Surrenders/withdrawals as % of opening liabilities
1 Defined as movements in shareholder-backed policyholder liabilities arising from premiums (after deducting insurance & other margins)
2 Excludes Korea, Japan and Taiwan agency
3 The rate of surrenders for shareholder-backed business (expressed as a percentage of opening liabilities) was 4.1 per cent in the first half of 2017 (half year 2016: 3.3 per cent). The increase compared to half year 2016 primarily relates to unit-linked business following equity market appreciation
Asia Life gross flows1,2, £bn Asia Life gross flows (ex-India)1,2, £bn
56
2.9
3.43.7
4.1 4.2 4.2
4.7
2.8
13.8%
9.0%9.9% 9.4% 9.2%
7.6% 7.7%
4.1%3
FY10 FY11 FY12 FY13 FY14 FY15 FY16 HY17
2.3
2.9
3.4
3.8 3.9 3.8
4.2
2.4
12.6%
8.6% 8.9% 8.5% 8.5%7.1% 7.2%
3.8%
FY10 FY11 FY12 FY13 FY14 FY15 FY16 HY17

2017 HALF YEAR RESULTS
AsiaEastspring
22 2230 36
4653
31 33
3942
58
61
5 5
8
11
14
17
58 60
77
89
118
131
2012 2013 2014 2015 2016 HY2017
Third party Asia life UK life/ Jackson
2.4x
2.0x
3.4x
2.3x
2012 – H1 2017
Growth
Funds under management2, £bn
#1 Retail Fund Manager
£131bnFunds under management
September 20161
1 Based on assets sourced from the region. Excluding Japan, Australia and New Zealand as at Sept 2016. Source Asia Asset Management Sept 2016 (Ranked according to participating regional players only)
2 As reported (RER)
57

2017 HALF YEAR RESULTS
USBaby boomer retirement wave
Over 40 million people will reach retirement age in the next decade
Private defined benefit plans are disappearing and government plans
are underfunded
Social security was never intended to be the primary retirement plan
and its long-term status is in question
Life expectancy at age 65 has increased significantly
Due to low interest rates, investors are forced to seek out equity
markets in order to earn adequate returns
Individual investors struggle to capture market returns and are
exposed to volatile equity markets
Source: U.S. Census Bureau, Population Division. 2014 estimate of population
Generations as defined by Pew Research Center, 2014
58

2017 HALF YEAR RESULTS
USAdvisor distributed assets
$0 $1,000 $2,000 $3,000 $4,000 $5,000 $6,000
Insurance B/D
Retail bank B/D
Independent / RIA Hybrid
Independent B/D
RIA
National and regional B/D
Wirehouses
Total Assets Variable Annuity Assets
(in $billions)
5.1%
Source: Cerulli Associates, The State of US Retail and Institutional Asset Management 2016
Bubbles represent 5-year growth CAGR as of December 31, 2015
5.0%
10.5%
6.6%
11.7%
8.5%
4.3%
59
More than $16 trillion in assets across existing channels

2017 HALF YEAR RESULTS
USJackson retail sales and deposits
HY 2017 = $9,507
Variable Annuities – with living benefitsFixed Annuities
Elite Access Fixed Index Annuities Separately managed accounts
Variable Annuities – w/o living benefits, non EA
Retail sales and deposits, $m
$310
$6,455
$1,156
$1,387
$199
HY 2016 = $9,389m
$408
$6,200
$958
$1,418
$397 $8
60

2017 HALF YEAR RESULTS
US Jackson variable annuity volumes
0.20.4
0.7 0.8
1.1
1.01.1
1.11.4
1.3
1.3
1.1
1.4
1.3
1.0
0.7 0.7 0.7 0.70.7 0.7
2.12.4 2.4 2.3
1.8 1.81.5 1.4 1.5
2.3
2.9
3.33.1
3.7 3.7
4.24.6
5.0
4.2
3.8
4.4
5.3
5.7
4.4 4.6
5.7
5.25.5
6.4 6.4
5.7
4.7
5.2
6.6
6.0
5.3
4.3 4.3 4.3 4.34.5 4.5
Q1
Q2
Q3
Q4
Q1
Q2
Q3
Q4
Q1
Q2
Q3
Q4
Q1
Q2
Q3
Q4
Q1
Q2
Q3
Q4
Q1
Q2
Q3
Q4
Q1
Q2
Q3
Q4
Q1
Q2
Q3
Q4
Q1
Q2
Q3
Q4
Q1
Q2
Q3
Q4
Q1
Q2
1 Estimated
2 Morningstar Annuity Research Center
Ranking2 Elite Access
‘Features War’
1
2013 2014 2015 2016201220112010
2008
2009
2007
VA volumes by quarter, sales US$bn
2017
12th 11th 12th 12th 12th 12th 12th 12th 8th 5th 4th 4th 4th 4th 3rd 3rd 3rd 3rd 3rd3rd 3rd3rd 2nd2nd 1st1st 1st 1st 1st 1st 1st 1st 1st 1st 1st 1st 1st 1st 1st 1st 1st 1st
61
XX
2017 HALF YEAR RESULTS
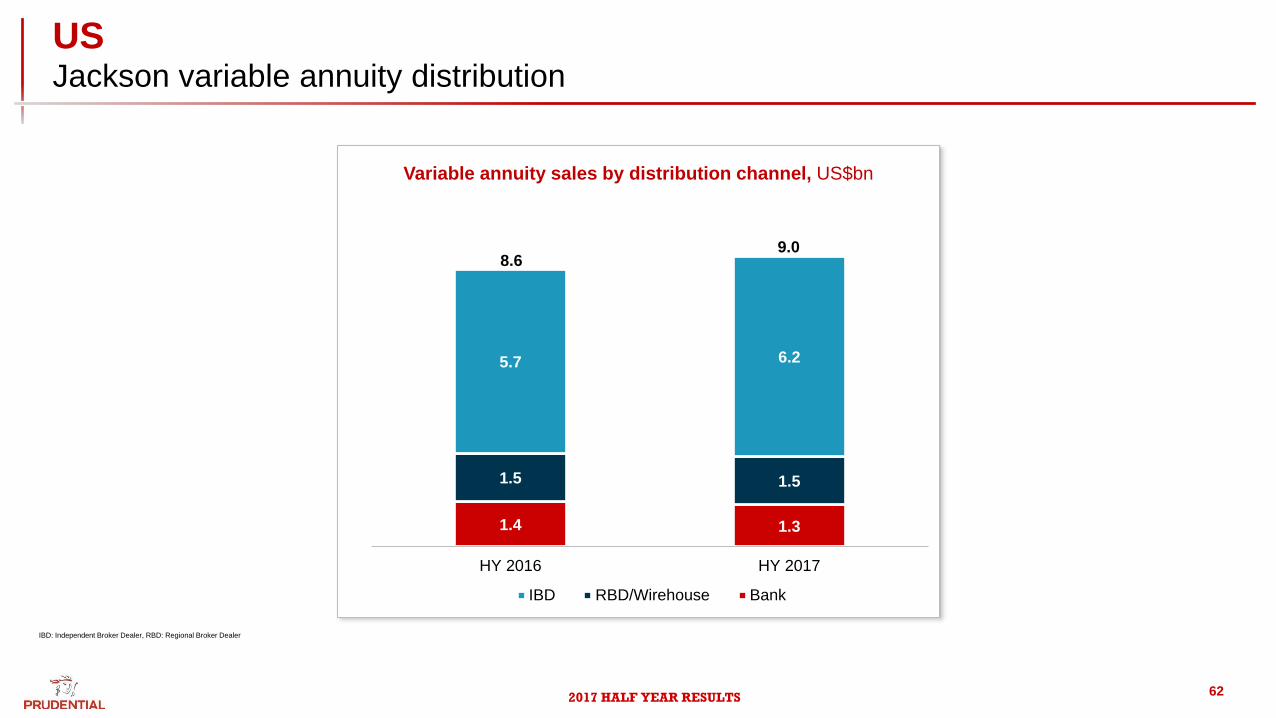
US Jackson variable annuity distribution
IBD: Independent Broker Dealer, RBD: Regional Broker Dealer
Variable annuity sales by distribution channel, US$bn
1.4 1.3
1.5 1.5
5.7 6.2
HY 2016 HY 2017
IBD RBD/Wirehouse Bank
9.08.6
62

2017 HALF YEAR RESULTS
USCash remittances
1 Net remittances from Jackson include $197m in 2011 representing release of excess surplus to the Group
280
63125
530
400470
680 710
550600
$4,408m
Cash remittances, $m
438% 417% 483% 429% 423% 450% 456%Year End RBC Ratio
2008 2009 2010 20111 2012 2013 2014 2015
481% 485%
2016 HY17
63
2017 HALF YEAR RESULTS
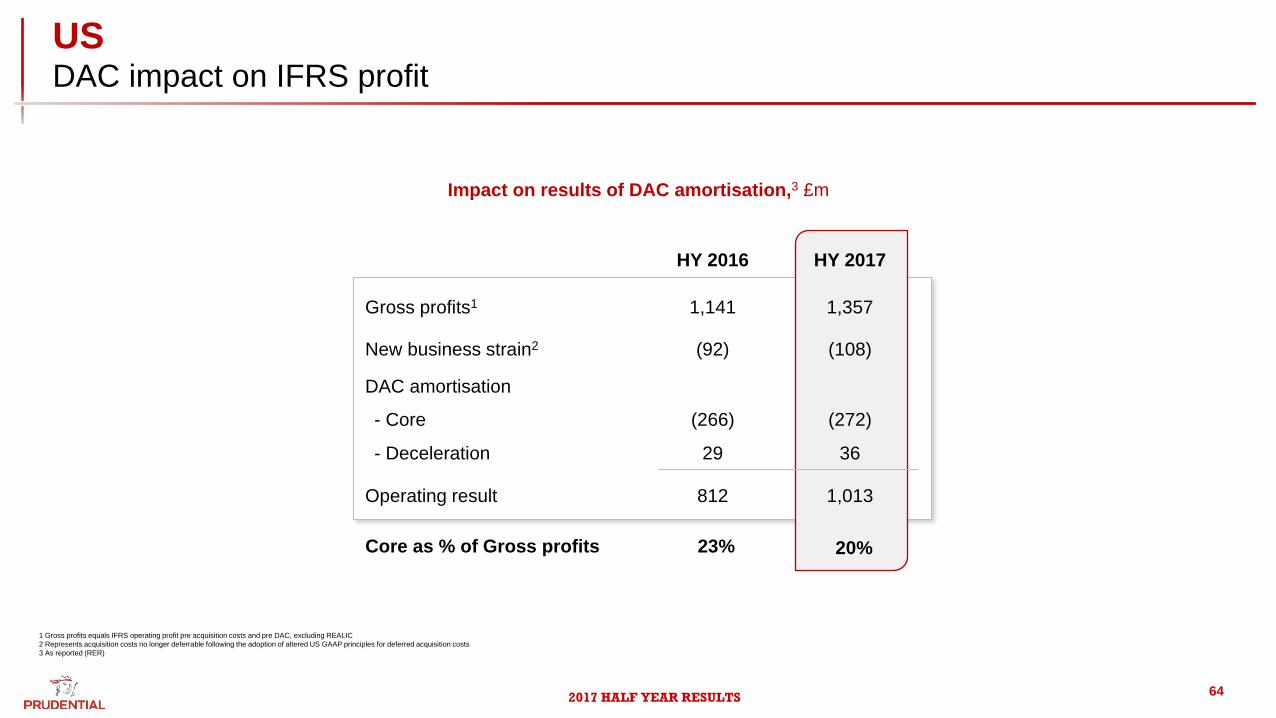
USDAC impact on IFRS profit
1 Gross profits equals IFRS operating profit pre acquisition costs and pre DAC, excluding REALIC
2 Represents acquisition costs no longer deferrable following the adoption of altered US GAAP principles for deferred acquisition costs
3 As reported (RER)
Core as % of Gross profits
Impact on results of DAC amortisation,3 £m
23% 20%
HY 2016 HY 2017
Gross profits1 1,141 1,357
New business strain2 (92) (108)
DAC amortisation
- Core (266) (272)
- Deceleration 29 36
Operating result 812 1,013
64

2017 HALF YEAR RESULTS
US Jackson Asset growth
34.6 37.9 42.2 43.8 45.2 48.1 47.1 46.7 50.0 47.7 48.6 48.862.7 62.1 61.9 64.9 66.4 65.6
5.6 5.1 4.4 7.1 10.414.7 22.3 30.0 20.9 33.3
48.958.8
80.1
108.8127.5
134.2148.8
162.0
40.2 43.0 46.650.9
55.662.8
69.376.7
70.981.0
97.5107.6
142.8
170.9
189.4199.1
215.2
227.6
2000 2001 2002 2003 2004 2005 2006 2007 2008 2009 2010 2011 2012 2013 2014 2015 2016 HY17
General account Separate account
Growth in statutory admitted assets, US$bn
65

2017 HALF YEAR RESULTS
US Reserves return assumptions
Max
75th Percentile
25th Percentile
Min
0
0.5
1
1.5
2
2.5
3
3.5
4
4.5
S&P Historical EEV Stat IFRS
Chart Title
S&P Historical
EEV
Stat
IFRSIFRS
0
0.5
1
1.5
2
2.5
3
3.5
4
4.5
S&P Historical EEV Stat IFRS
Chart Title
S&P Historical
EEV
Stat
IFRS
S&P (mean)
Statutory (CTE 90)
EEV (mean)
0
0.5
1
1.5
2
2.5
3
3.5
4
4.5
S&P Historical EEV Stat IFRS
Chart Title
S&P Historical
EEV
Stat
IFRS
0
0.5
1
1.5
2
2.5
3
3.5
4
4.5
S&P Historical EEV Stat IFRS
Chart Title
S&P Historical
EEV
Stat
IFRS
All accounting bases assume 20-year equity market returns well
below the mean returns posted by the S&P 500
IFRS return assumptions are especially punitive. There has
never been a 20-year period for the S&P with as weak a return
profile as what is used in the mean IFRS scenario
IFRS Mean Return vs S&P Historical1
1 As shown at the Group’s November 2016 Investor Day, except IFRS and EEV, which has been updated to be as at 30 June 2017
66

2017 HALF YEAR RESULTS
-600
-100
400
900
1,400
1,900
2,400
USMoving reserves to ‘fair value’
Guarantee Benefit Liability Supplemental Disclosure1, net of DAC, £m
As recorded2 Change in
rates3
Hypothetical fair
value with full fees
Adjustment to full
fees4
Volatility
adjustment5
1,129
716
(2,292)
50
(397)
1 A positive number indicates a liability while a negative number indicates an asset
2 GMWB and GMDB IFRS basis
3 For GMDB and GMWD liabilities only. Excludes adjustment for volatility, which is shown separately. Includes application of market based (30.06.17) earned rates based on the greater of the SWAP and treasury curves (2.3% representative 10 year rate) and AA corporate bond discount rates (3.4% representative 10 year rate) in
place of long-term rate of 7.4% for IFRS (8.4% discount rates used for pre-2013 issues)
4 Value of fees over and above those in reserve calculations
5 Application of market based (30.06.17) volatility curve (19.5% representative 5 year rate) instead of long-term 15% level for IFRS
67
(447)
Revised liability,
excluding volatility
adjustment
(Assets)
Liabilities

2017 HALF YEAR RESULTS
GMWB policyholder behaviour sensitivities
30 June 2017 US$bn
0
1
2
3
4
5
6
7
8
Total Adjusted Capital IFRS SH equity
Total Lapse sensitivity impact
Utilisation sensitivity impact
Policyholder behaviour experience is continuously monitored and a comprehensive study is
conducted on an annual basis.
For IFRS and statutory accounting purposes, assumptions are set at the conservative end of
the plausible range (i.e. best estimate with an explicit margin for conservatism). For example:
Lapse - Lifetime GMWB ultimate lapse assumptions at significantly ITM levels are
assumed to be 35% of the base lapse assumption
Utilisation - For-Life GMWB utilisation assumptions at attained ages 65+ are 50-85%
(with special provisions for benefits with incentives to delay withdrawals)
To measure the sensitivity to these assumptions, IFRS Equity and Statutory Total Adjusted
Capital (TAC) were computed under severe shocks to these already conservative
assumptions. The shocks were as follows:
Lapse - Lapse rates for ITM policies were reduced to half the assumed levels. For
example, ultimate lapse rates on significantly ITM Lifetime GMWB policies were
reduced from 35% to 17.5% of the base lapse level, resulting in ultimate lapse rates of
less than 1.5% for utilising policyholders
Utilisation - Utilisation rates beyond the bonus period, if applicable, were increased by
10% (i.e. 110% of the best estimate assumption).
USGMWB policyholder behavior sensitivities
68

2017 HALF YEAR RESULTS
USCapital, hedging and policyholder behavior
Hedging programme continues to effectively mitigate risks
Earned guarantee fees of 127 bps per annum (c$1.0bn in HY
2017). Expected guarantee fees of $2.0bn for 2017
Equity allocations remain below our 84% pricing assumption
Total adjusted capital excludes:
Gains on interest rate swaps: $486m net of tax at 30 June
2017 (31 Dec 2016: gain of $413m)
Total adjusted capital
US$bn
31 December 2016 5.3
Operating profit 0.4
Dividend (0.6)
Reserves net of hedging and other effects (0.4)
30 June 2017 4.7
69

2017 HALF YEAR RESULTS
USGMWB unhedged cash flow
Unhedged GMWB cash flow exposure, 30 June 2017
70
0
200
400
600
800
1,000
1,200
1,400
1,600
1,800
2,000
1 6 11 16 21 26 31 36 41 46
0
200
400
600
800
1,000
1,200
1,400
1,600
1,800
2,000
1 6 11 16 21 26 31 36 41 46
0
200
400
600
800
1,000
1,200
1,400
1,600
1,800
2,000
1 6 11 16 21 26 31 36 41 46
$millions
Year
Base, 5% Gross Return
PV Future Guarantee Fees 10,290
PV Benefits (1,784)
PV Fees Less Benefits 8,506
Guarantee Fees
Benefits
$millions
Year
-100 bps Rate Shock
Base, 5% Gross Return
PV Future Guarantee Fees 10,951
PV Benefits (2,340)
PV Fees Less Benefits 8,611
Guarantee Fees
Benefits
$millions
Year
Down 40% S&P Shock (S&P = 1,454)
Base, 5% Gross Return
PV Future Guarantee Fees 11,984
PV Benefits (12,606)
PV Fees Less Benefits (622)
Guarantee Fees
Benefits
▪ Includes guarantee fees only
▪ Uses prudent best estimate assumptions (AG43, C3P2)
▪ 5% gross return is well below historical average market return
▪ Ignores guarantee fees collected to date as well as reserves
▪ PV of future GMWB fees exceeds PV of benefits over a wide range of market shocks
▪ Negative cash flow is far into future even in bad scenarios
▪ No material strain on liquidity in any given year
S&P @ 6/30 = 2,423

2017 HALF YEAR RESULTS
USGMWB unhedged cash flow
71
Unhedged GMWB cash flow exposure, 31 December 2016
0
200
400
600
800
1,000
1,200
1,400
1,600
1,800
2,000
1 6 11 16 21 26 31 36 41 46
0
200
400
600
800
1,000
1,200
1,400
1,600
1,800
2,000
1 6 11 16 21 26 31 36 41 46
0
200
400
600
800
1,000
1,200
1,400
1,600
1,800
2,000
1 6 11 16 21 26 31 36 41 46
$millions
Year
Base, 5% Gross Return
PV Future Guarantee Fees 10,286
PV Benefits (2,358)
PV Fees Less Benefits 7,928
Guarantee Fees
Benefits
$millions
Year
-100 bps Rate Shock
Base, 5% Gross Return
PV Future Guarantee Fees 10,969
PV Benefits (3,094)
PV Fees Less Benefits 7,875
Guarantee Fees
Benefits
$millions
Year
Down 40% S&P Shock (S&P = 1,343)
Base, 5% Gross Return
PV Future Guarantee Fees 11,485
PV Benefits (13,563)
PV Fees Less Benefits (2,078)
Guarantee Fees
Benefits
▪ Includes guarantee fees only
▪ Uses prudent best estimate assumptions (AG43, C3P2)
▪ 5% gross return is well below historical average market return
▪ Ignores guarantee fees collected to date as well as reserves
▪ PV of future GMWB fees exceeds PV of benefits over a wide range of market shocks
▪ Negative cash flow is far into future even in bad scenarios
▪ No material strain on liquidity in any given year
S&P @ 12/31 = 2,239

2017 HALF YEAR RESULTS
2762
134
279
H1 2014 H1 2015 H1 2016 H1 2017
UK LifeRetail growth
130156
196174
H1 2014 H1 2015 H1 2016 H1 2017
12
39
81
106
H1 2014 H1 2015 H1 2016 1H 2017
28
70 69
H1 2014 H1 2015 H1 2016 H1 2017
169285
481
628
H1 2014 H1 2015 H1 2016 H1 2017
Bonds, (APE, £m) Individual Pensions, (APE, £m)
Drawdown, (APE, £m) PruFund ISA, (APE, £m)
Retail Growth, (APE, £m)
34%
933%
783%
146%
+
272%
=
Legacy, (APE, £m)
146108 112 93
104117
H1 2014 H1 2015 H1 2016 H1 2017
Bulks Other legacy
(63)%250
225
112
72
93

2017 HALF YEAR RESULTS
UK LifeLife asset flows
With-profits £126bninvested assets30 June 2017
Shareholder
backed£64bn
invested assets30 June 2017
2013 2014 2015 2016
Cla
ims
Pre
miu
ms
+11%
YoY
Change
Retail Growth products1 Legacy products2 Annuities3
UK life flows, £bn
1 Includes investment bonds, individual pensions, drawdown and PruFund ISA
2 Includes corporate pensions and other
3 Includes retail and bulk annuities
+2%
73
2.31.5 2.2
3.7
1.22.7
6.1
1.22.0
9.0
1.0 0.5
6.0
0.40.1
(0.8)
(7.2)
(3.0)
(0.9)
(6.1)
(3.1)
(1.2)
(6.6)
(3.2)(1.9)
(6.5)
(3.3)
(1.4)
(3.2)(1.6)
HY2017

2017 HALF YEAR RESULTS
UK LifePruFund
0.1 0.30.9
2.54.1 5.4
7.59.1
11.6
16.5
24.7
30.0
2006 2007 2008 2009 2010 2011 2012 2013 2014 2015 2016 HY2017
Growth in PruFund AuM (£bn)
AuM
+42%
+62%
1 ABI Mixed Investment 20%-60% Shares TR; performance from 29 June 2007 to 30 June 2017
ABI fund
comparator
PruFund
Growth
PruFund investment performance1
74
-30%
-20%
-10%
0%
10%
20%
30%
40%
50%
60%
70%
2007 2009 2011 2013 20162015 HY17

2017 HALF YEAR RESULTS
28%
55%
13%
4%
Equities Fixed income Real estate Multi-asset
Infrastructure Real estate mortgages / debt Private equity Other debt / private finance lending
Structures products Other alternative investments Cash
5%
73%
3%
2%
1% 4%
9%3%
M&GPrincipal asset classes
M&G Group assets under management by client type and asset class (%), 30 June 20171
22%
57%
12%
1%6%
Internal AUM
£132.4bn
Retail AUM
£72.5bn
Institutional AUM
£76.6bn
1 Asset class splits exclude assets from Prudential Investment Managers South Africa business
2%
75

2017 HALF YEAR RESULTS
M&GRetail & FUM
Retail funds under management, £bn
X% Europe FUM as % of Retail FUM
16.0
26.1
33.5 36.0
40.4 43.5 42.5
37.3 37.3 37.3
3.1 5.0
9.0 8.2
14.5
23.7
31.8
23.5 26.9
35.2
2008 2009 2010 2011 2012 2013 2014 2015 2016 H1 2017
UK / Other Europe
16% 21% 19% 26% 35% 43%16% 39% 42% 49%
76
1 Other relates to South Africa
1

2017 HALF YEAR RESULTS
M&GOperating profit
75
122
172 175204
227251
225248
HY 2009 HY 2010 HY 2011 HY 2012 HY 2013 HY 2014 HY 2015 HY 2016 HY 2017
M&G IFRS operating profit1, £m
1 Excludes PruCap
3.3x
77

2017 HALF YEAR RESULTS
IFRSIFRS operating profit
1 General insurance commission represents the commission receivable net of expenses for Prudential-branded general insurance products in connection with the arrangement to transfer the UK general insurance business to Churchill in 2002.
2 Corporate expenditure as shown above is for Group Head Office and Asia Regional Head Office.
3 Restructuring costs are incurred in the UK and Asia and represent one-off business development expenses.
78
2017 H1 2016 H1 (AER) 2016 H1 (CER)% Movement
(AER)
% Movement
(CER)Asia operations
Asia insurance operations 870 667 752 30% 16%
Eastspring Investments 83 61 69 36% 20%
Total Asia operations 953 728 821 31% 16%
US operations
Jackson (US insurance operations) 1,079 888 1,010 22% 7%
Broker-dealer and asset management (6) (12) (13) 50% 54%
Total US operations 1,073 876 997 22% 8%
UK operations
Long-term business 480 473 473 1% 1%
General insurance commission1 17 19 19 (11)% (11)%
Total UK insurance operations 497 492 492 1% 1%
M&G 248 225 225 10% 10%
Prudential Capital 6 13 13 (54)% (54)%
Total UK operations 751 730 730 3% 3%
Total segment profit 2,777 2,334 2,548 19% 9%
Other income and expenditure
Investment return and other income - 6 6 (100)% (100)%
Interest payable on core structural borrowings (216) (165) (165) (31)% (31)%
Corporate expenditure2 (172) (156) (165) (10)% (4)%
Total (388) (315) (324) (23)% (20)%
Solvency II implementation costs - (11) (11) n/a n/a
Restructuring costs3 (31) (7) (7) (343)% (343)%
Operating profit based on longer-term investment returns before
interest received from tax settlement 2,358 2,001 2,206 18% 7%
Interest received from tax settlement - 43 43 n/a n/a
Operating profit based on longer-term investment returns 2,358 2,044 2,249 15% 5%

2017 HALF YEAR RESULTS
IFRS operating profit – sources of earningsGroup long-term business
Total operating profit
2,429 2,235 9%
=
1,138 1,051Margin on revenues
8%
1,152 1,013Insurance
margin14%
Technical and other margin
2,290 2,064 11%
Spreadincome
583 613 (5)%
131 143Spread(bps)
(12)
89.3 85.7Average reserves
4%
Fee income
1,279 1,118 14%
156 156AMF (bps) -
164.2 143.5Average reserves
14%
With-profits
172 165 4%
Expected returns
103 124 (17)%
- +/-Total Life expenses
(2,372) (2,138) (11)%
DAC adjustments
186 149 25%
Total Life income
4,615 4,224 9%
£m except reserves £bn
Source
HY 2017HY 20161
(CER)+/-
79
Management actions
188 140 34%
1 2016 comparatives restated to exclude Korea Life

2017 HALF YEAR RESULTS
IFRS operating profit – sources of earningsLife insurance - Asia
Total operating profit
870 752 16%
=
1,056 965Margin on revenues
9%
658 532Insurance
margin24%
Technical and other margin
1,714 1,497 14%
Spreadincome
108 91 19%
136 131Spread(bps)
5
15.8 13.9Average reserves
14%
Fee income
103 92 12%
113 112AMF (bps) 1
18.2 16.2Average reserves
12%
With-profits
30 27 11%
Expected returns
56 45 24%
- +/-Total Life expenses
(1,207) (1,056) (14)%
DAC adjustments
66 56 18%
Total Life income
2,011 1,752 15%
£m except reserves £bn
Source
HY 2017HY 20161
(CER)+/-
80
1 2016 comparatives restated to exclude Korea Life

2017 HALF YEAR RESULTS
IFRS operating profit – sources of earningsLife insurance - US
DAC amortisation
117 95 23%
+/-
Fee income
1,145 997 15%
186 188AMF (bps) (2)
123.5 105.8Average reserves
17%
202 217Spread(bps)
(15)
39.7 39.2Average reserves
1%
401 426 (6)%
Spreadincome
Expected returns
0 18 (100)%
Total operating profit
1,079 1,010 7%
Technical and other margin
472 456 4%
Total Life income
2,018 1,897 6%
Total Life expenses
(1,056) (982) (8)%
=
-
£m except reserves £bn
Source
HY 2017HY 2016
(CER)+/-
81

2017 HALF YEAR RESULTS
IFRS operating profit - sources of earningsLife insurance - UK
Fee income
31 29 7%
27 27AMF (bps) -
22.5 21.5Average reserves
5%
Expected returns
47 61 (23)%
Spreadincome
74 96 (23)%
44 59Spread(bps)
(15)
33.8 32.6Average reserves
4%
With-profits
142 138 3%
Total operating profit
480 473 1%
=
Total Life income
586 575 2%
Total Life expenses
(109) (100) (9)%
DAC adjustments
3 (2) -
+/--
82 86Margin on revenues
(5)%
22 25Insurance
margin(12)%
Technical and other margin
104 111 (6)%
£m except reserves £bn
Source
HY 2017 HY 2016 +/-
Management actions
188 140 34%
82

2017 HALF YEAR RESULTS
IFRS operating profit – sources of earningsAsset management
M&G
248 225 10%
Underlying income
495 440 13%
Total expenses
(261) (229) (14)%
Cost / income ratio3
53% 52% 1ppt
37 36Average fees4
(bps)1
267.2 243.2Average assets (£bn) 10%
Eastspring Investments
83 69 20%
Total income2
208 176 18%
Total expenses
(125) (107) (17)%
Cost / income ratio3
55% 56% (1)ppt
33 34Average fees4
(bps)(1)
124.9 103.6Average assets (£bn) 21%
Asset Management Operating profit1
331 294 13%
1 Excludes PruCap and US asset management business
2 Includes performance related fees for M&G, carried interest and its share of operating profit from PPMSA and for Eastspring performance related fees
3 Cost/income ratio excludes performance-related fees, carried interest and profit from associate, and for Eastspring, taxes on JV operating profit
4 Average fees exclude performance-related fees and M&G’s share pf operating profit from PPMSA
Other income2
14 14 0%
£m except average assets £bn
Source
HY2017HY2016
(CER)+/-
83

2017 HALF YEAR RESULTS
IFRS operating profit sources of incomeLife insurance - Asia
Asia IFRS operating income1,2, £m
1 Excludes margin on revenues, acquisition and administration expenses and DAC adjustments
2 2016 comparatives restated to exclude Korea life
HY 2016 CER HY 2017
Growth %
HY 2017 vs. HY 2016 (CER)
+19%
+12%
+11%
+24%
+24%
11%
12%
68%
3%
787
Insurance margin Fee income
Expected return on shareholder assetsWith-profits
Spread income
69%
11%
11%3%
955
6%
6%
84

2017 HALF YEAR RESULTS
IFRS operating profit sources of incomeLife insurance - US
US IFRS operating income1, £m
HY 2016 CER HY 2017
1%
1 Excludes acquisition, administration expenses and DAC amortisation
22%
24%
53%
1,897
Insurance margin Fee income
Expected return on shareholder assets Spread income
57%
23%
20%
0%
2,018 (100)%
(6)%
+15%
+4%
Growth %
HY 2017 vs. HY 2016 (CER)
85

2017 HALF YEAR RESULTS
IFRS operating profit sources of incomeLife insurance - UK
UK IFRS operating income1,2, £m
1 Excludes margin on revenues, acquisition and administration expenses and DAC amortisation
2 Excludes earnings from longevity reinsurance and other management actions of £188m (HY2016: £140m)
HY 2016 HY 2017
28%
8%
7%
40%
17%
349
Insurance margin Fee income
Expected return on shareholder assetsWith-profits
Spread income
45%
7%
10%
23%
15%
316
Growth %
HY 2017 vs. HY 2016
(23)%
+3%
(23)%
7%
(12)%
86

2017 HALF YEAR RESULTS
EEV operating profitLife operating variances - Group
Experience variances and assumption changes % opening EEV3
1 Excludes Korea, Japan Life and Taiwan agency. HY2014 comparatives have been restated to exclude the contribution from the sold PruHealth and PruProtect businesses. HY2006 to HY2013 comparatives include the results of PruHealth and PruProtect
2 Experience variances and assumption changes are shown post development costs from HY14 to HY17 and pre development costs from HY06 to HY13
3 Opening EEV of Life operations, excluding goodwill and restated to exclude Korea life
4 Calculated net of £(128)m opening adjustment to Long-term business shareholders’ funds arising from the impact of Solvency II for the UK operations at 1 January 2016
5 As reported RER
Note: Unwind & experience variances / assumption changes are on a post tax basis
Unwind Experience variances and assumption changes
Group Life operating variances1,2,5, £m
0.0% 1.0% 0.4% (0.2)% 0.7% 1.0% 1.3% 1.2% 1.0% 0.8%
356425
481 489
567617
552
692736
880
787
1,043
(2)
10051
(23)
96
167237 245 243 216 243 262
HY 2006 HY 2007 HY 2008 HY 2009 HY 2010 HY 2011 HY 2012 HY 2013 HY 2014 HY 2015 HY 2016 HY 2017
0.7%4 0.7%
87

2017 HALF YEAR RESULTS
EEV operating profitIn-force performance
(14)
291436
Asia in-force1,2, £549m US in-force2, £452m UK in-force, £304m
Persistency &
withdrawals
Mortality / morbidity
and Other items
Spread Other itemsTotal variances /
other
60
114
42
98
5472
HY16 HY17
1 Asia In-force shown post development costs
2 As reported RER
88

2017 HALF YEAR RESULTS
EEV operating profitLife operating variances - Asia
1 Experience variances and assumption changes are shown post development costs from HY14 to HY17 and pre development costs from HY06 to HY13
2 Opening EEV of Life operations, excluding goodwill and restated to exclude Korea life
3 As reported RER
Note: Unwind & Experience variances / assumption changes are on a post tax basis and excludes Japan and Korea life
Asia Life operating variances1,3, £m
Unwind Experience variances and assumption changes
(0.4)% 0.8% (0.2)% (1.6)% (0.3)% (0.3)% 0.2% 0.4% 0.2%
Experience variances and assumption changes % opening EEV2
0.0%
89
106 139
186
237271
236
301 315
399373
499
(7)
18
(5)
(61)
(15) (21)
1836 22
(0)
1550
HY 2006 HY 2007 HY 2008 HY 2009 HY 2010 HY 2011 HY 2012 HY 2013 HY 2014 HY 2015 HY 2016 HY 2017
0.1% 0.3%
89

2017 HALF YEAR RESULTS
Policyholder liabilitiesShareholder-backed business - Group
Liabilities
1 Jan 2017
CER opening
liabilities
Investment
related
and other
Foreign
exchangeLiabilities
30 June 2017
266.6
Asia
net inflows
US
net inflows
UK
net outflows
(9.7)
256.9
10.6 269.3
1.02.0 (1.2)
1 Shareholder-backed business.
2 Including net flows of the Group’s insurance joint ventures.
Policyholder liabilities1,2 roll-forward, £bn
90

2017 HALF YEAR RESULTS
Policyholder liabilitiesShareholder-backed business - Asia
Maturities,
deaths and
surrenders
CER opening
liabilities
Investment
related and
other
Foreign
exchange
32,851
(1,785)
1,912
Premiums
2,801
Liabilities
1 Jan 2017
Liabilities
30 June 2017
32,112
(739)
35,040
Policyholder liabilities roll-forward1, £m
1 Including net flows of the groups insurance joint ventures
91

2017 HALF YEAR RESULTS
Policyholder liabilitiesShareholder-backed business - US
177,626 (8,929)
168,697
8,148 (6,190) 177,7797,124
Maturities,
deaths and
surrenders
CER opening
liabilities
Investment
related and
other
Foreign
exchange
PremiumsLiabilities
1 Jan 2017
Liabilities
30 June 2017
Policyholder liabilities roll-forward, £m
92

2017 HALF YEAR RESULTS
Policyholder liabilitiesShareholder-backed business - UK
Liabilities
1 Jan 2017
Maturities, deaths
and surrenders
Investment
related and
other
56,1581,658 (2,825)
Premiums Liabilities
30 June 2017
1,500 56,491
Policyholder liabilities roll-forward, £m
93

2017 HALF YEAR RESULTS
94
Solvency IIGroup capital position and sensitivities
HY17 movement in Solvency II capital1,2,3, £bn
12.5
12.9
31 December 20162,3
Operating experience
Currency movements
Dividends paid
Non-operating experience,
including market effects
30 June 20172,3
1.5
(0.5)
(0.8)
0.0
Management actions 0.2
Impact on
coverage ratio
~12pts
~(5)pts
~(6)pts
Solvency II surplus estimated sensitivities1,2,3, £bn
12.9
12.4
30 June 20172,3
100bp interest rate rise6
100bp credit spread
widening7
50bp interest rate fall5,6
13.8
11.8
12.5
40% equity fall4 11.7
Impact on
coverage ratio
(9)pts
(3)pts
(3)pts
+18pts
(5)pts15% ratings downgrade
for UK annuities
1 The Group shareholder position excludes the contribution to the Group SCR and Own Funds of ring fenced With-Profit Funds and staff pension schemes in surplus
2 Before allowing for the 2017 first interim ordinary dividend (FY16: before allowing for the 2016 second interim ordinary dividend)
3 The Group shareholder position includes management’s estimate of transitional measures reflecting operating and market conditions at the valuation date. The estimated Group shareholder surplus would increase from £12.9 billion to £13.6 billion at 30 June
2017 if the approved regulatory transitional amount was applied instead (31 December 2016: The estimated Group shareholder surplus would increase from £12.5 billion to £12.9 billion)
4 Where hedges are dynamic, rebalancing is allowed for by assuming an instantaneous 20 per cent fall followed by a further 20 per cent fall over a four-week period
5 Subject to a floor of zero
6 Allowing for further transitional recalculation after the interest rate stress
7 US Risk Based Capital solvency position included using a stress of 10 times expected credit defaults
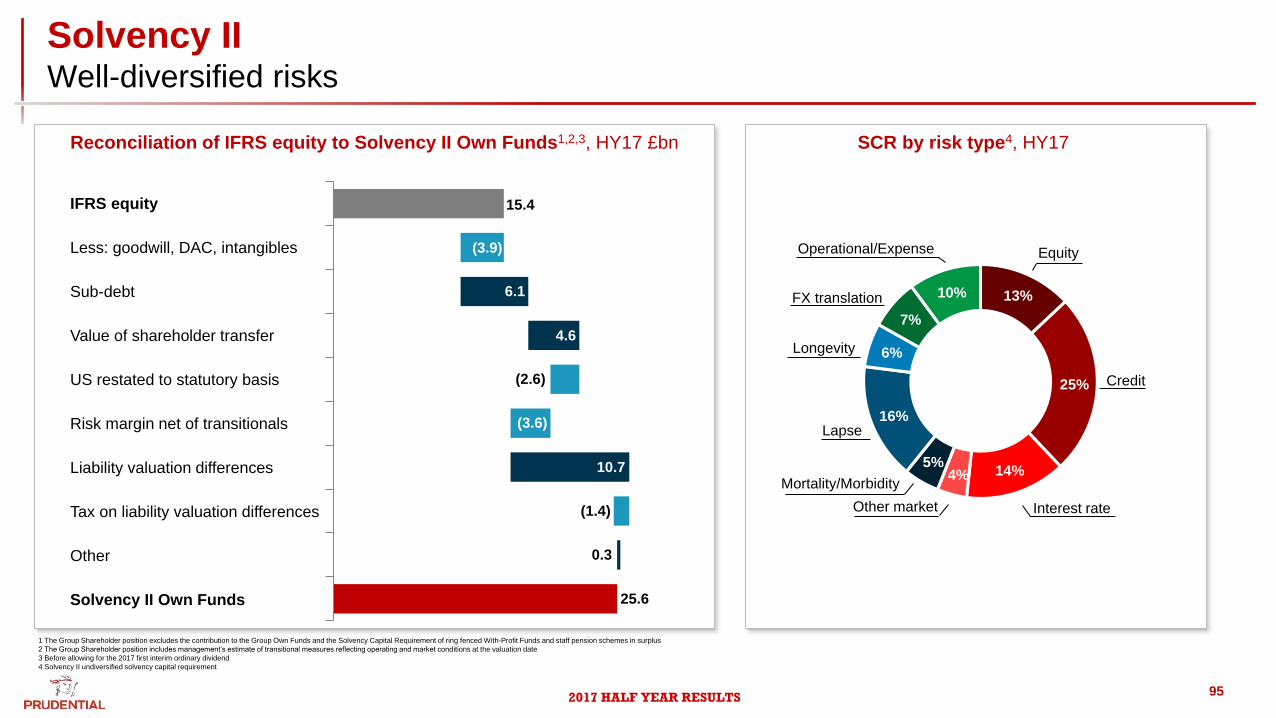
2017 HALF YEAR RESULTS
Solvency IIWell-diversified risks
15.4
0.3
Reconciliation of IFRS equity to Solvency II Own Funds1,2,3, HY17 £bn SCR by risk type4, HY17
13%
25%
14%4%5%
16%
6%
7%
10%
Credit
Interest rateOther market
Lapse
Operational/Expense
Mortality/Morbidity
Equity
Longevity
IFRS equity
Less: goodwill, DAC, intangibles
Sub-debt
Value of shareholder transfer
US restated to statutory basis
Risk margin net of transitionals
Liability valuation differences
Other
Solvency II Own Funds
(3.9)
6.1
4.6
(2.6)
(3.6)
10.7
25.6
1 The Group Shareholder position excludes the contribution to the Group Own Funds and the Solvency Capital Requirement of ring fenced With-Profit Funds and staff pension schemes in surplus
2 The Group Shareholder position includes management’s estimate of transitional measures reflecting operating and market conditions at the valuation date
3 Before allowing for the 2017 first interim ordinary dividend
4 Solvency II undiversified solvency capital requirement
FX translation
Tax on liability valuation differences (1.4)
95

2017 HALF YEAR RESULTS
Solvency IIHigh quality capital
Solvency II Own Funds by capital tier1,2
0.9
5.5
0.4
Solvency II
Own Funds
HY17
Tier 1 – core capital
(unrestricted)
Tier 1 – hybrid capital
Tier 2 – sub debt
Tier 3 – deferred tax
18.8
25.6
74%
3%
21%
2%
Core Tier 1
(unrestricted)
Other Tier 1
Tier 2
Tier 3
Tier 1 = 77% of
Own Funds
Tier 1 =
155% of
SCR
Share of Solvency II Own Funds by capital tier1,2
HY17, 100% = £25.6bn
1 The Group shareholder position excludes the contribution to the Group Own Funds and the Solvency Capital Requirement of ring fenced With-Profit Funds and staff pension schemes in surplus
2 The Group shareholder position includes management’s estimate of transitional measures reflecting operating and market conditions at the valuation date
3 Before allowing for the 2017 first interim ordinary dividend
96

2017 HALF YEAR RESULTS
Solvency IICapital dynamics and dividend philosophy
Buffer over local
required capital
after 1/25 stress
Fast payback of
invested capital
from attractive
earnings profile
Capital-light
growth in unit-
linked and
protection
Capital
generation
Capital
hurdle
Economic risks
hedged well into
tail
Minimum RBC
ratio and target
AA credit rating
Reliable capital
generation from
high-return fast
payback
business
Stable
generation from
seasoned
annuity and with-
profits portfolios
SII target
range
Capital efficient
growth through
with-profits
Minimum CRD
III cover
Minimal capital
requirement
Cash-like
earnings
Asia US UK M&G
Opening
central cash
Corporate
actions
Central costs
Dividends to
shareholders
Closing
central cash
>£1bn
Remittances
Remittances to Group
97

2017 HALF YEAR RESULTS
Solvency IISII treatment of hybrid capital classification
Issue Date Amount Coupon Maturity Date 1st Call Date SII Classification
19-Dec-01 GBP 435m 6.125% 19-Dec-31 None Tier 2*
23-Jun-03 USD 1,000m 6.50% Perp 23-Dec-08 Tier 2*
10-Jul-03 EUR 20m 20 yr CMS rate 10-Jul-23 None Tier 2*
30-Jul-04 USD 250m 6.75% Perp 23-Sep-09 Tier 1*
12-Jul-05 USD 300m 6.50% Perp 23-Sep-10 Tier 1*
29-May-09 GBP 400m 11.375% 29-May-39 29-May-19 Tier 2*
21-Jan-11 USD 550m 7.75% Perp 23-Jun-16 Tier 1*
15-Jan-13 USD 700m 5.25% Perp 23-Mar-18 Tier 2
16-Dec-13 GBP 700m 5.70% 19-Dec-63 19-Dec-43 Tier 2*
09-Jun-15 GBP 600m 5.00% 20-Jul-55 20-Jul-35 Tier 2
07-Jun-16 USD 1,000m 5.25% Perp 20-Jul-21 Tier 2
13-Sept-16 USD 725m 4.375% Perp 20-Oct-21 Tier 2
*Grandfathered under Solvency II transitional provisions.
Hybrid capital outstanding, 30 June 2017
98

2017 HALF YEAR RESULTS
GroupDividend policy
grow the ordinary
dividend by 5 per cent
per annum
potential for additional
distributions
Assessment of dividend affordability unchanged
• IFRS earnings
• Free surplus generation
• Holding company cash
• Free surplus ‘stock’
• Solvency II surplus
• Local solvency surplus
• Financial strength ratings
• 1/25 year stress on
financial KPIs1
• Country level cash
• Group liquidity
• Buffer for regulatory
change and ‘shocks’
• Investment in growth
• Funding corporate
activity
Range of financial
metricsStress tested
Competing use of
capital
1 1/25 year stress is equivalent to a Group-wide scenario with movements in all risks including a 29% to 50% fall in equity levels, a 0.4% to 2.8% fall in long-term interest rates and spreads widening by 150bps in A-rated credit and 230bps in BBB-rated credit.
The Board will maintain its focus on delivering a growing ordinary dividend. In line with this policy, Prudential aims to grow the ordinary dividend by 5 per cent per
annum. The potential for additional distributions will continue to be determined after taking into account the Group’s financial flexibility across a broad range of
financial metrics and our assessment of opportunities to generate attractive returns by investing in specific areas of the business
99

2017 HALF YEAR RESULTS
Invested assetsAsset portfolio is high quality and well diversified
1 Excludes £1.3 billion of investments in joint ventures and associates accounted for using the equity method.
Breakdown of invested assets1, HY17, £bn
Asia
Life
US
Life
UK
Life Other Total
Total
Group
PAR
funds
Unit
linked
Debt
Equity
Property
Mortgage
Other loans
Deposits
Other
Total
170.8
210.4
15.2
10.5
13.3
6.6
9.3
436.1
72.6
55.8
13.0
2.6
9.8
2.2
6.8
162.8
10.2
152.5
0.6
0.0
1.4
0.0
0.0
164.7
12.2
1.5
0.0
0.2
0.5
0.4
0.0
14.8
38.0
0.3
0.0
6.0
0.0
3.5
1.8
49.6
35.4
0.0
1.6
1.7
1.3
0.0
0.5
40.5
2.4
0.3
0.0
0.0
0.3
0.5
0.2
3.7
88.0
2.1
1.6
7.9
2.1
4.4
2.5
108.6
Shareholders
Shareholder debt portfolio, HY17, £bn
• Total Group assets of £436.1bn; shareholder exposure of £108.6bn
• Conservative asset mix: ~97% credit portfolio is rated investment grade or sovereign
• No default losses in the US and UK, and minimal impairments across all credit portfolios
• Additional cash and equivalents of £9.9bn, of which shareholder exposure is £4.9bn
Portfolio
£bn
Investment grade
High yield
Oil and gas
Mining
No.
issuers
Holding by issuer
Max
£m
HY %
debt
portfolio
70.4
2.7
3.4
0.7
5.8
1,788 39 467
10 128263
141
36
195
24
21
30
226
104
365
n/a
3.1%
0.5%
0.1%
0.2%
Sovereign debt 14.9 42 355 3,518 1.6%
Corporate debt
73.1 36 4672,051 n/a
Banks
Av.
£m
100

2017 HALF YEAR RESULTS
Invested assetsConservative approach to balance sheet risk
Group shareholder credit portfolio
30 June 2017, £88bn
UK shareholder credit portfolio2
30 June 2017, £35bn
Jackson shareholder portfolio1
30 June 2017, $58bn
AAA 13%
A 36%
AA 34%
BBB 15%
<BBB 2%
98% Investment
Grade
Public IG
corporate 50%
Private IG
corporate 10%
Cash/treasury/
agency 13%
97% Investment Grade
HY corporates and loans 3%Agency RMBS 1%Other RMBS 1%
IG ABS/CDO 2%
CMBS 4%
Loans 13%
Private
equity 2%
1 Based on Statutory accounting book value
2 Based on IFRS accounting market value
3 For UK shareholder-backed business
~97% Sovereign or Investment
Grade
• Conservative asset mix
• No default losses in the US or UK credit portfolios
• Additional cash and equivalents of £4.9bn
• No defaults of shareholder-backed debt securities
• Allowance for credit risk as at 30 June 2017 of 43
bps (IFRS) in line with prior year3
Corporate Debt Portfolio
• 529 issuers
• Average holding £47.8m
Strength of the £1.7bn credit reserve
Common/ preferred
stock 1%
Corporate Debt Portfolio2
• 1,064 issuers
• Average holding £27.7m
101

2017 HALF YEAR RESULTS
Invested assetsGroup shareholder exposures – sovereign debt
SH sovereign exposures by region & rating1, £m
Sovereign
debt 17%
1 includes Credit Default Swaps
Europe by key country, £m
Portugal Italy Ireland Greece Spain Total
PIIGS - 57 - - 33 90
US UK Europe Asia Other Total
AAA - - 649 148 8 805
AA-BBB 4,959 4,904 195 2,500 70 12,628
Below BBB - - - 1,448 - 1,448
Total 4,959 4,904 844 4,096 78 14,881
Europe
Germany France “PIIGS” Other Total
649 23 90 82 844
Shareholder credit portfolio
30 June 2017, £88bn
Breakdown of the shareholder credit portfolio, £m
102
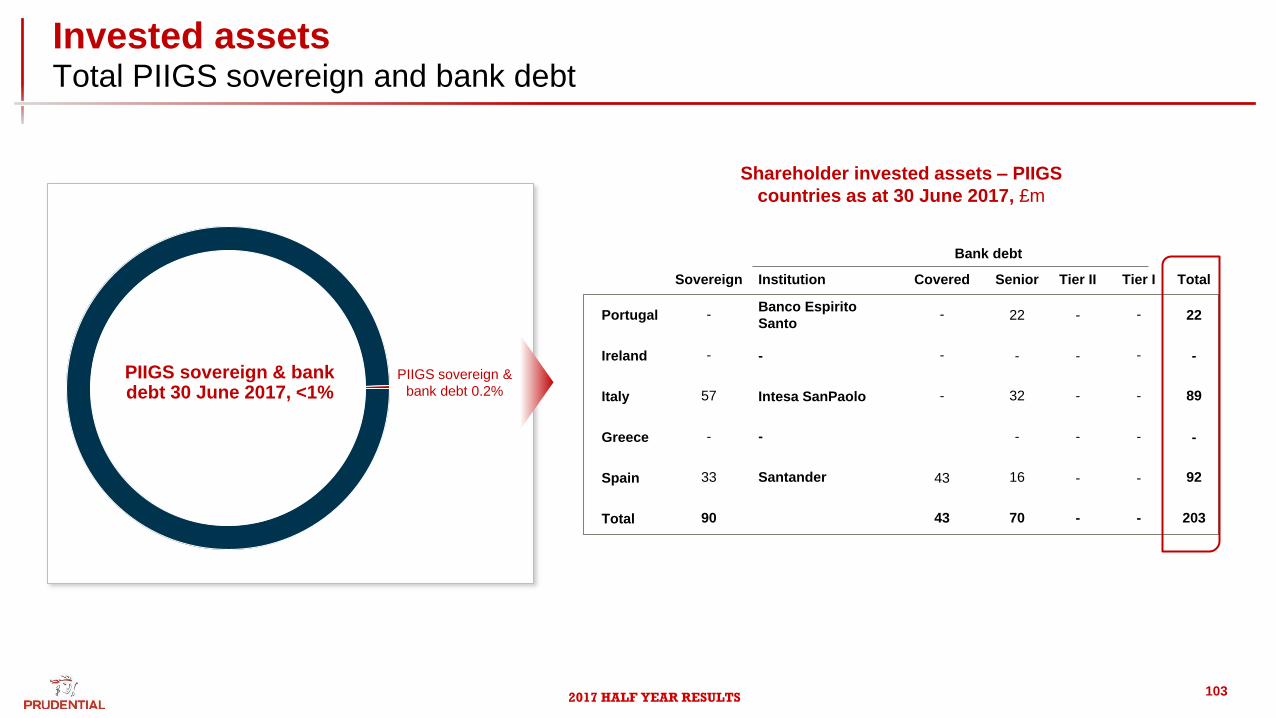
2017 HALF YEAR RESULTS
Invested assetsTotal PIIGS sovereign and bank debt
PIIGS sovereign &
bank debt 0.2%
Bank debt
Sovereign Institution Covered Senior Tier II Tier I Total
Portugal -Banco Espirito
Santo- 22 - - 22
Ireland - - - - - - -
Italy 57 Intesa SanPaolo - 32 - - 89
Greece - - - - - -
Spain 33 Santander 43 16 - - 92
Total 90 43 70 - - 203
Shareholder invested assets – PIIGS
countries as at 30 June 2017, £m
PIIGS sovereign & bank debt 30 June 2017, <1%
103

2017 HALF YEAR RESULTS
Invested assetsGroup shareholder exposures – oil and gas sector
Exploration
&
Production
Integrated
Oils
Refining
&
Marketing
Oil &
gas
Services
Pipeline
/ Mid-
stream
Total
(£m)
Investment grade 563 921 278 434 802 2,998
High yield 146 4 4 15 254 423
Total 709 925 282 449 1,056 3,421
Total shareholder
credit portfolio £88bn
Investment grade 3.4%
High yield 0.5%
Shareholder Oil and Gas credit portfolio £m, 30 June 2017, 3.9%
104

2017 HALF YEAR RESULTS
0.1
0.1
0.3
0.4
0.4
0.2
1.7
0.7
0.4
0.9
Invested assetsUS asset quality – energy exposure
$3.9 $1.3
Total energy exposure at 30 June, $3.9bn
Energy exposure is 8% of the fixed maturity portfolio
Average market price was 104.8
Unrealized gain was $134m
The E&P and Oil Field Equipment and Services sub-sectors are
the most sensitive to oil prices
Average market price was 104.1
Unrealized gain was $39m
Higher
sensitivity to oil
prices
Energy Portfolio by Sub-Sector – Total IFRS Book Value, in
billions 30 June 2017
Energy, Exploration &
Production
Oil Field Equipment &
Services
Integrated Energy
Gas Distribution
Oil Refining & Marketing
A- or Higher
BBB+
BBB
BBB-BB+ or Below
105
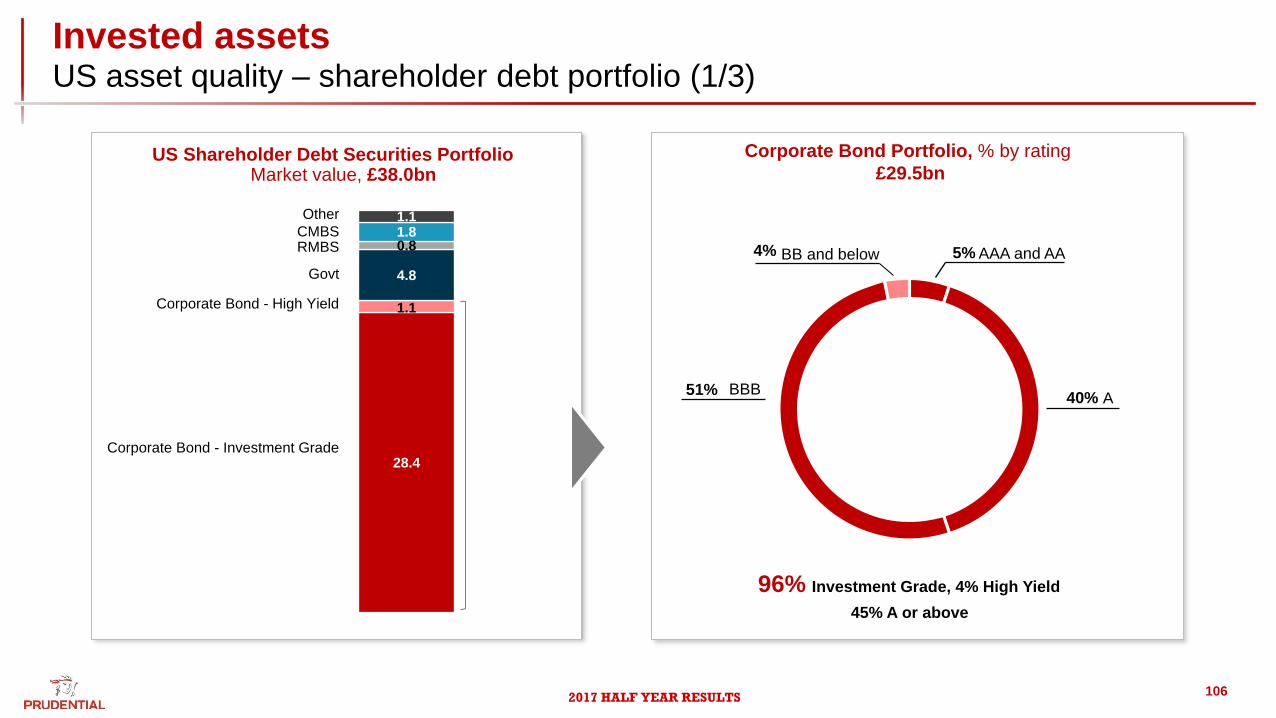
2017 HALF YEAR RESULTS
Invested assetsUS asset quality – shareholder debt portfolio (1/3)
5%
40%51%
4%
28.4
1.1
4.8
0.81.81.1
AAA and AA
BBB
BB and below
96% Investment Grade, 4% High Yield
A
45% A or above
US Shareholder Debt Securities Portfolio Market value, £38.0bn
Corporate Bond Portfolio, % by rating
£29.5bn
106
Other
RMBSCMBS
Corporate Bond - High Yield
Corporate Bond - Investment Grade
Govt

2017 HALF YEAR RESULTS
Invested assetsUS asset quality – shareholder debt portfolio (2/3)
3%9%
6%
6%
7%
1%
4%
3%
11%10%
3%
5%
4%
6%
2%
4%
3%
13%
Investment Grade Corporate Bond Portfolio, % by sector £28.4bn
107
28.4
1.1
4.8
0.81.81.1Other
RMBSCMBS
Corporate Bond - High Yield
Corporate Bond - Investment Grade
Govt
US Shareholder Debt Securities Portfolio Market value, £38.0bn
Basic industry
Capital Goods
Consumer Goods
Leisure
Transportation
Energy
Retail
Healthcare
Services
Technology
Telecoms
Utility
Auto
Banking
Real Estate
Media
Insurance
Financial Services

2017 HALF YEAR RESULTS
Invested assetsUS asset quality – shareholder debt portfolio (3/3)
15%
4%
3%
7%
14%
2%3%17%
5%
4%
4%
10%
4%3%
5%
High Yield Corporate Bond Portfolio, % by sector, £1.1bn
108
28.4
1.1
4.8
0.81.81.1
US Shareholder Debt Securities Portfolio Market value, £38.0bn
Other
RMBSCMBS
Corporate Bond - High Yield
Corporate Bond - Investment Grade
Govt
Basic industry
Capital Goods
Consumer Goods
Leisure
Energy
Financial ServicesRetail
Media
Healthcare
Services
Technology
Telecoms
Utility
Auto
Banking

2017 HALF YEAR RESULTS
Currency mixCurrency translation sensitivities
14
46
22
18
UK sterling2,3
US dollar
Asia –
US
dollar
linked1
Other Asia
IFRS operating profit, %
HY2017 as
reported
40
30
11
19
UK
sterling
US dollar
Asia –
US
dollar
linked1
Other Asia
Underlying free surplus
generation, %
HY2017 at 30 June
2017 spot rates2,307
2,358
(32)
(19)
Impact of translating
results at 30 June
2017 spot rate
HY2017 as
reported
HY2017 at 30 June
2017 spot rates 1,819
1,845
(16)
(10)
Impact of translating
results at 30 June
2017 spot rate
IFRS operating profit, £m
Underlying free surplus generation, £m
Asia
US
Asia
US
109
1 USD linked includes Hong Kong and Vietnam where currencies are pegged to the USD, and Malaysia and Singapore where currencies are managed against a basket of currencies including the USD
2 UK sterling includes amounts in respect of UK insurance operations, M&G and central operations. Operating profit for central operations includes amounts for corporate expenditure for Group Head Office as well as Asia Regional Head Office which is incurred in HK dollars
3 Sterling operating profits include all interest payable as sterling denominated, reflecting interest rate currency swaps in place

2017 HALF YEAR RESULTS
Currency mixCurrency translation sensitivities
10
26
52
12
UK sterling
US
dollar
Asia –
US
dollar
linked1
Other Asia
New business profit, %
HY2017 as
reported
9
31
44
16
UK sterling 2,3
US dollar
Asia –
US
dollar
linked1
Other Asia
EEV operating profit, %
HY2017 at 30 June
2017 spot rates1,644
1,689
(13)
(32)
Impact of translating
results at 30 June
2017 spot rate
HY2017 as
reported
HY2017 at 30 June
2017 spot rates2,799
2,870
(27)
(44)
Impact of translating
results at 30 June
2017 spot rate
New business profit, £m
EEV operating profit, £m
Asia
US
Asia
US
110
1 USD linked includes Hong Kong and Vietnam where currencies are pegged to the USD, and Malaysia and Singapore where currencies are managed against a basket of currencies including the USD
2 UK sterling includes amounts in respect of UK insurance operations, M&G and central operations. Operating profit for central operations includes amounts for corporate expenditure for Group Head Office as well as Asia Regional Head Office which is incurred in HK dollars
3 Sterling operating profits include all interest payable as sterling denominated, reflecting interest rate currency swaps in place

2017 HALF YEAR RESULTS
Future free surplus emergenceGroup
0.0
0.5
1.0
1.5
2.0
2.5
3.0
3.5
4.0
4.5
Expected undiscounted free surplus from life in-force1, £bn
Actual From 2015 life in-force
2016 2017 2018 2019 2020 2021 2022 2023 2024
From 2015 life in-force including market effects
2025
12.0 15.8 10.5 13.3
From 2016 new business
1 For life business, represents the undiscounted expected transfer of value of in-force business and required capital to free surplus as at FY16
(1.0)
(0.6)
(0.2)
0.2
0.6
Expected undiscounted cash flows from 2016 life new business1, £bn
0.8
2016 2017 2018 2019 2020 2021 2022 2023 2024 2025
2026
2026
111

2017 HALF YEAR RESULTS
Future free surplus emergenceAsia
0.0
0.2
0.4
0.6
0.8
1.0
1.2
1.4
(600)
(500)
(400)
(300)
(200)
(100)
0
100
200
300
2016 2017 2018 2019 2020 2021 2022 2023 2024 2025
4.6 6.1 4.2 5.5
2016 2017 2018 2019 2020 2021 2022 2023 2024 2025
Expected undiscounted cash flows from 2016 new business, £m
Expected undiscounted free surplus from life in-force1, £bn
From 2016 new business2015 life in-force including market effectsFrom 2015 Life in-forceActual
2026
2026
1 For life business, represents the undiscounted expected transfer of value of in-force business and required capital to free surplus as at FY16
112

2017 HALF YEAR RESULTS
0.0
0.2
0.4
0.6
0.8
1.0
1.2
1.4
1.6
1.8
2.0
Expected undiscounted free surplus from life in-force1, £bn
(400)
(300)
(200)
(100)
0
100
200
300
2016 2017 2018 2019 2020 2021 2022 2023 2024 2025
4.9 6.6 3.9 5.1
2016 2017 2018 2019 2020 2021 2022 2023 2024 2025
Expected undiscounted cash flows from 2016 new business, £m
From 2016 new business2015 life in-force including market effectsFrom 2015 life in-forceActual
2026
2026
1 For life business, represents the undiscounted expected transfer of value of in-force business and required capital to free surplus as at FY16
Future free surplus emergenceUS
113

2017 HALF YEAR RESULTS
Future free surplus emergenceUK
0.0
0.1
0.2
0.3
0.4
0.5
0.6
0.7
0.8
0.9
1.0
Expected undiscounted free surplus from life in-force1, £bn
(140)
(120)
(100)
(80)
(60)
(40)
(20)
0
20
40
60
2016 2017 2018 2019 2020 2021 2022 2023 2024 2025 2026
2.5 3.2 2.4 2.8
2016 2017 2018 2019 2020 2021 2022 2023 2024 2025
Expected undiscounted cash flows from 2016 new business, £m
From 2016 new business2015 life in-force including market effectsFrom 2015 life in-forceActual
2026
1 For life business, represents the undiscounted expected transfer of value of in-force business and required capital to free surplus as at FY16
114

2017 HALF YEAR RESULTS
PrudentialOur History
Successive generations
have looked to
Prudential to safeguard
their financial security –
from industrial workers
and their families in
Victorian Britain to
around 25 million
insurance customers
worldwide today.
Our financial strength,
heritage, prudence and
relentless focus on our
customers’ long-term
needs ensure that
people continue to turn
to our trusted
brands to help them
plan for today and
tomorrow.
1848
Prudential Mutual Assurance Investment and Loan Association
is established in London, offering loans and life assurance.
1997
Prudential acquires Scottish Amicable Life, founded in 1826.
1923
Prudential’s first overseas life branch is established in India.
1997
Prudential enters long-term bancassurance alliance with
Standard Chartered Bank in Asia.
1924
Prudential shares are floated on the London Stock Exchange.
1999
Prudential acquires M&G, founded in 1901.
1931
Singapore life insurance business is established.
2000
Prudential becomes the first UK life insurer to enter the China
market.
1964
Prudential establishes a Hong Kong office.
2010
Prudential enters into a long-term bancassurance partnership
with United Overseas Bank Limited (UOB).
1986
Prudential acquires Jackson, established in 1961, in the United
States.
2014
Prudential agrees a new 15-year agreement with Standard
Chartered Bank covering 11 markets. Prudential enters the life
insurance markets in Kenya and Ghana.
1994
Prudential Corporation Asia is formed in Hong Kong as a
regional head office to expand operations throughout Asia.
2015
Prudential entered its third African insurance market, with the
acquisition of Ugandan company Goldstar Life Assurance
1995
Prudential enters Indonesia’s life insurance market.
2016
Prudential begins operations in Laos and Zambia, its fifteenth
market in Asia and fourth new market in Africa respectively.
2017
Prudential enters Nigeria.
115

2017 HALF YEAR RESULTS
We meet the long-term savings and protection needs of an increasingly
self-reliant population. We focus on three markets – Asia, the US and the
UK – where the need for our products is strong and growing and we use
our capabilities, footprint and scale to meet that need.
We aim to capture three long-term opportunities across our key
geographical markets:
• serving the protection and investment needs of the growing
middle class in Asia;
• providing asset accumulation and retirement income products
to US baby boomers; and
• meeting the savings and retirement needs of an ageing British
population
Together with capturing the scale and diversification benefits of our
global presence, we aim to generate attractive returns, enabling us to
provide financial security to our customers, invest in growth opportunities
and meet our customers’ high expectations.
PrudentialOur strategy at a glance
116

2017 HALF YEAR RESULTS
PrudentialStrategy
1 ABI mixed investment 20 per cent -60% per cent TR; performance from June 2007 to 30 June 2017
2 Represents financial assets and investment properties in with-profits funds117
Prudential Corporation Asia
Prudential Corporation Asia has leading insurance and asset management
operations across 14 Asian markets and serves the families of the region’s
high potential economies. We have been operating in Asia for over 90 years
and have built high-performing businesses with multichannel distribution, a
product portfolio centred on regular savings and protection, award-winning customer services and a widely recognised brand.
Eastspring Investments is a leading asset manager in Asia and provides investment solutions across a broad range of asset classes.
Leading pan-regional franchise 94%+ of APE sales are regular
premium
Total funds under management £131bn
Prudential UK & Europe
Prudential is a leading provider of savings and retirement income
products in the UK. Our particular strength lies in investments that help
customers meet their long-term goals, while also protecting them against
short-term market fluctuations. We provide long-term savings solutions for
UK customers, meeting people’s needs through our core strengths in with-
profits and retirement, underpinned by our expertise in areas such as longevity, risk management and multi-asset investment.
Well recognised brand with strong track record
£126bn invested assets in with-profits funds2
PruFund investment performance growth +62% since 2007 (vs +42%
in ABI sector comparative)1
M&G
M&G Investments is an international asset manager with more than 85
years’ experience of investing on behalf of individuals and institutions.
Our goal is to help our customers prosper by securing long-term returns
from their savings. For individual investors, we offer funds across diverse
geographies, asset classes and investment strategies aimed at growing
their long-term savings or producing regular income. For institutional
investors, we offer investment strategies to meet their clients’ long-term
needs for capital growth or income.
Long-term and conviction-led approach
15 locations across Europe and Asia
External funds under management £149bn
Jackson
Jackson provides retirement savings and income strategies aimed at the large
number of people approaching retirement in the United States. Jackson’s pursuit
of excellence in product innovation and distinctive distribution capabilities has
helped us forge a solid reputation for meeting the needs of customers. Jackson’s
variable annuities offer a distinctive retirement solution designed to provide a
variety of investment choices to help customers pursue their financial goals.
Premier retirement income player
premium growth since 1995 8x
$162bn of separate account assets, 3x since 2010.
We entered into Africa in 2014 to offer products to new customers in one of the fastest growing
region in the world. We aim to provide products that meet their needs towards saving future
expenses such as education for their children and de-risk their financial lives.
Africa

2017 HALF YEAR RESULTS
GroupCorporate responsibility
£20 million1
total community investment
83,284 hours1
volunteered by employees across the Prudential
Group
£460,1671
donated by employees through payroll giving across the
Group
Our approachWe create social value through our day-to-day operations, by providing savings, income,
investment and protection products and services, to help customers manage uncertainty and
build a more secure future. Furthermore we provide the long-term capital that finance
businesses, builds infrastructure and fosters economic and social development.
Serving our customersWe aim to provide fair and transparent products that meet our
customers’ needs.
Supporting local communitiesWe seek to make a positive contribution to our communities through
long-term partnerships with charitable organisations that make a real
difference.
Valuing our peopleWe aspire to retain and develop highly engaged employees.
Protecting the environmentWe take responsibility for the environment in which we operate.
118
1 Data as disclosed at Full Year 2016

2017 HALF YEAR RESULTS
PrudentialShare information and contact details
Country Code GB
Country of Register Great Britain (UK)
ISIN GB0007099541
SEDOL 0709954
Segment SET1
Normal market size 150000
Sub-sector Life Assurance
Shareholder enquiries
For enquiries about shareholdings,
including dividends and lost share
certificates, please contact the
Company Registrars:
By post
Equiniti Limited, Aspect House
Spencer Road, Lancing
West Sussex BN99 6DA
By telephone
Tel 0871 384 2035
Fax 0871 384 2100
Textel 0871 384 2255
(for hard of hearing)
Prudential plc
Laurence Pountney Hill
London EC4R 0HH
Tel +44 (0)20 7220 7588
Institutional Analyst and Investor enquiries
Tel +44 (0)20 7548 3300
E-mail [email protected]
Media enquiries
Tel +44 (0)20 7548 3559
E-mail [email protected]
UK Register Private Shareholder enquiries
Tel 0871 384 2035
International shareholders
Tel +44 (0) 121 415 7026
Irish Branch Register Private Shareholder enquiries
Tel +353 1 553 0050
Hong Kong Branch Register Private Shareholder enquiries
Tel +852 2862 8555
US American Depositary Receipts Holder enquiries
Tel +1 651 453 2128
The Central Depository (Pte) Limited Shareholder enquiries
Tel +65 6535 7511
Contact informationShare information
Trading information
119
London Stock Exchange: PRU.L
Hong Kong Stock Exchange: 2378
New York Stock Exchange –
American Depositary Receipt (ADR)
PUK.N
Singapore Stock Exchange: K65
Number of issued ordinary shares of five
pence each fully paid-up at 30 June 2017
2,585,853,418

2017 HALF YEAR RESULTS
GlossaryA to I
Term Description
Actual Exchange Rate (AER) Actual Exchange Rates are actual historical exchange rates for the specific accounting period. Period average rate is used for the income statement and the closing rates for
the balance sheet.
Annual Premium Equivalent (APE) A common measure of new business sales in the life insurance industry. It is calculated as annualised new recurring premiums plus 10% of single premiums. It gives a
broadly comparable measure across companies to allow for differences between regular and single-premium business.
Back book of business The insurance policies sold in past periods that are still in force, and hence are still recorded on the insurer’s balance sheet.
Bonuses Bonuses refer to the non-guaranteed benefit added to participating life insurance policies and are the way in which policyholders receive their share of the profits of the
policies. There are normally two types of bonus;
1) Regular bonus – expected to be added every year during the term of the policy. It is not guaranteed that a regular bonus will be added each year, but once it is added, it
cannot be reversed, also known as annual or reversionary bonus; and
2) Final bonus – an additional bonus expected to be paid when policyholders take money from the policies. If investment return has been low over the lifetime of the policy, a
final bonus may not be paid. Final bonuses may vary and are not guaranteed.
Constant Exchange Rate (CER) Prior period Actual Exchange Rate figures restated to remove foreign exchange fluctuation.
Deferred annuities Annuities or pensions due to be paid from a future date or when the policyholder reaches a specified age.
Deferred Acquisition Costs (DAC) Expenses of an insurance company which are incurred in connection with the acquisition of new insurance policies or the renewal of existing policies. These typically include
commissions paid and the cost of processing proposals.
Free surplus The market value of assets in the covered business less statutory liabilities less required capital. Effectively these are the free assets available having provided for
policyholder liabilities and the required capital to support them
General Account (US) Excludes separate accounts, i.e. it excludes unit-linked business where investment risk is transferred to policyholders.
Guaranteed Minimum Death Benefit
(GMDB)
The basis death benefit offered under VA contracts, which specifies that if the owner dies before annuity income payment begins, the beneficiary will receive a payment
equal to the greater of the contract value or purchase payments less withdrawals.
Guaranteed Minimum Withdrawal
Benefit (GMWB)
A guarantee in a VA that promises that the owner may make annual withdrawals of a defined amount for the life of the owner or until the total guaranteed amount is
recovered, regardless of market performance or the actual account balance.
Guaranteed Investment Contracts (GIC) Investment contracts between an insurance company and an institutional investor, which provide a stated rate of return on deposits over a specified period of time. They
typically provide for partial or total withdrawals at book value if needed for certain liquidity needs of the plan.
In-force An insurance policy or contract reflected on records that has not expired, matured or otherwise been surrendered or terminated.
Inherited estate For life insurance proprietary companies, surplus capital available on top of what is necessary to cover policyholders’ reasonable expectations. An inherited (orphan) estate is
effectively surplus capital on a realistic basis built over time, and not allocated to policyholders or shareholders.
120
2017 HALF YEAR RESULTS
GlossaryJ to Z
Term Description
New business margin The value of new business on an EEV basis expressed as a percentage of the present value of new business premiums expected to be received from the new business.
New business profit (NBP) The profits, calculated in accordance with European Embedded Value Principles, from business sold in the financial reporting period under consideration.
New business strain (NBS) Arises when the early years’ premiums under a contract, less the initial expenses, are not sufficient to cover the provision and the required solvency margin that the company
needs to set up.
Non – Participating (Non – Par) A policy where the policyholder is not entitled to a share of the company’s profits and surplus. No bonus is paid to the policyholders. Examples of non-participating products
include pure risk policies like term insurance or health insurance and unit-linked insurance contracts.
Net worth Net assets for EEV reporting purposes that reflect the regulatory basis position, sometimes with adjustments to achieve consistency with the IFRS treatment of certain items.
Participating (Par) / With-profits A life insurance policy where the policyholder participates in the profits of the company which is paid out as bonus to the policyholder. These policies hence have a higher
premium compared to non-participating policies. In a particular period if the company does not perform well, the vested bonuses to the policyholders get directly affected.
Reported Exchange Rate (RER) Actual historical exchange rates for the specific accounting period, being the average rates over the period for the income statement and the closing rates for the balance
sheet at the balance sheet date.
Required Capital (RC) The value of assets attributed to the covered business over and above that required to back liabilities, determined as higher of local solvency, capital requirement from
internal risk capital and additional capital required by market standards.
Risk Based Capital (RBC) An amount of capital based on assessment of risks that the company should hold to protect customers against adverse developments. RBC is usually expressed as a risk –
based capital ratio.
Separate Account (US) Segregated accounting and reporting account held by an insurance company not in or "separate" from its general account. A separate account allows an investor to choose
an investment category according to his individual risk tolerance, and desire for performance.
Short – Term Fluctuations (STF) Reflects the deviation between actual investment returns and expected investment returns over the period. Even though STF are conceptually similar to the operating
experience variance, they are reported separately as they are caused by changes in economic conditions which are outside the control of management.
Sources of Earnings (SOE) Exhibit is an alternative presentation of an income statement with a focus on identifying and quantifying the various sources of IFRS income of a life insurance company.
Takaful products Insurance products that are compliant with Islamic principles.
Variable Annuity (VA) Annuity contract whose value fluctuates based on performance of an underlying investment portfolio of funds; benefit payouts will vary based on account value of the
contract.
Unallocated surplus Recorded wholly as a liability and represents the excess of assets over policyholder liabilities for Prudential’s with-profit funds. The balance retained in the unallocated
surplus represents cumulative income arising on the with-profits business that has not been allocated to policyholders or shareholders.
121