pt indosat tbk 9m 2013 results · 2015-11-12 · indosat ir - new template v23 1220.pptx 26 indosat...
TRANSCRIPT

1 Indosat IR - New Template v23 1220.pptx
1
PT Indosat Tbk 9M 2013 Results
2 Indosat IR - New Template v23 1220.pptx 2 Indosat IR - New Template v23 1220.pptx
2 Indosat Presentation 9M 2013
2
Agenda
Financial and Operational Results
Management Focus
Supplemental Information

3 Indosat IR - New Template v23 1220.pptx
3
Financial and Operational Highlights
4 Indosat IR - New Template v23 1220.pptx 4 Indosat IR - New Template v23 1220.pptx
4 Indosat Presentation 9M 2013
4
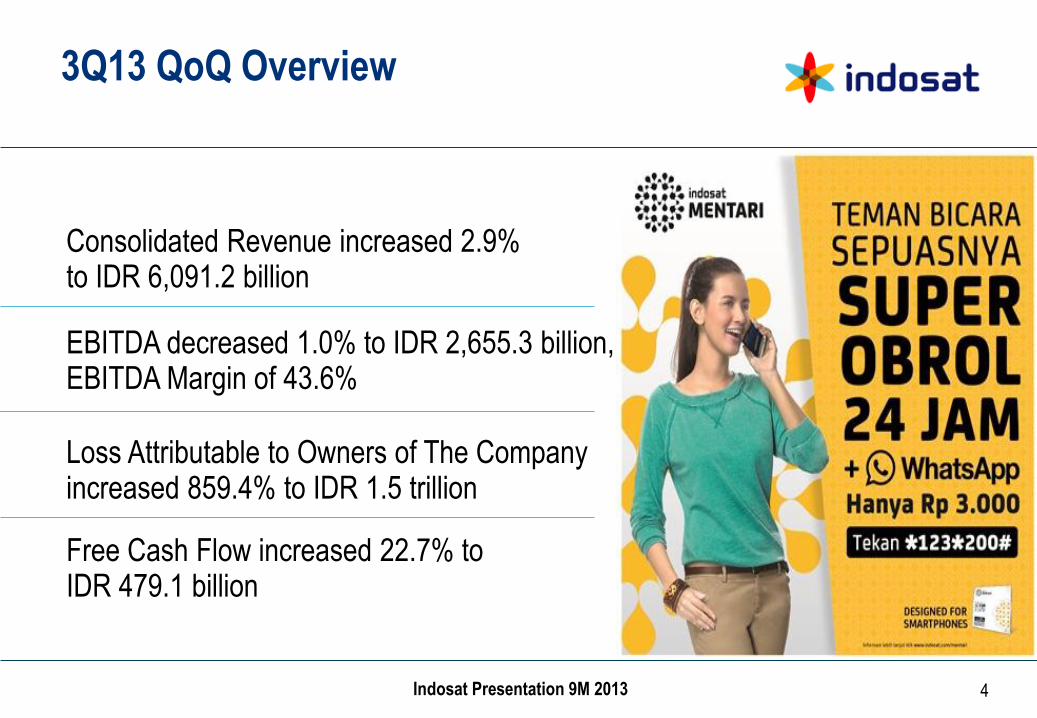
3Q13 QoQ Overview
Consolidated Revenue increased 2.9% to IDR 6,091.2 billion
EBITDA decreased 1.0% to IDR 2,655.3 billion, EBITDA Margin of 43.6%
Loss Attributable to Owners of The Company increased 859.4% to IDR 1.5 trillion
Free Cash Flow increased 22.7% to IDR 479.1 billion
5 Indosat IR - New Template v23 1220.pptx 5 Indosat IR - New Template v23 1220.pptx
5 Indosat Presentation 9M 2013
5
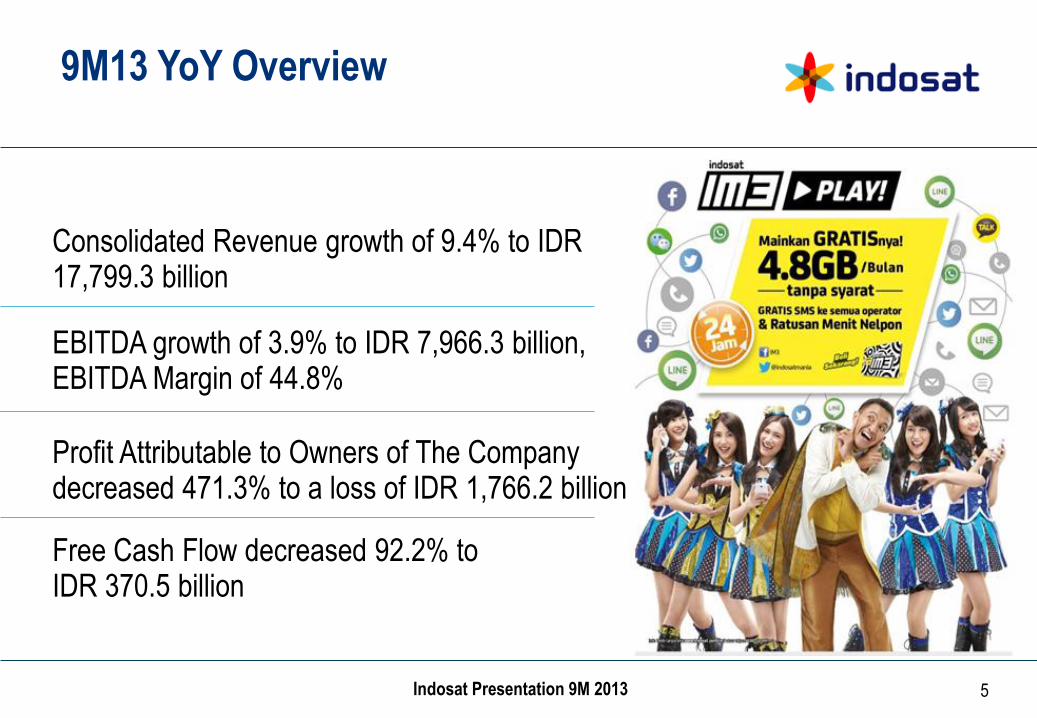
9M13 YoY Overview
Consolidated Revenue growth of 9.4% to IDR 17,799.3 billion
EBITDA growth of 3.9% to IDR 7,966.3 billion, EBITDA Margin of 44.8%
Profit Attributable to Owners of The Company decreased 471.3% to a loss of IDR 1,766.2 billion
Free Cash Flow decreased 92.2% to IDR 370.5 billion
6 Indosat IR - New Template v23 1220.pptx 6 Indosat IR - New Template v23 1220.pptx
6 Indosat Presentation 9M 2013
6
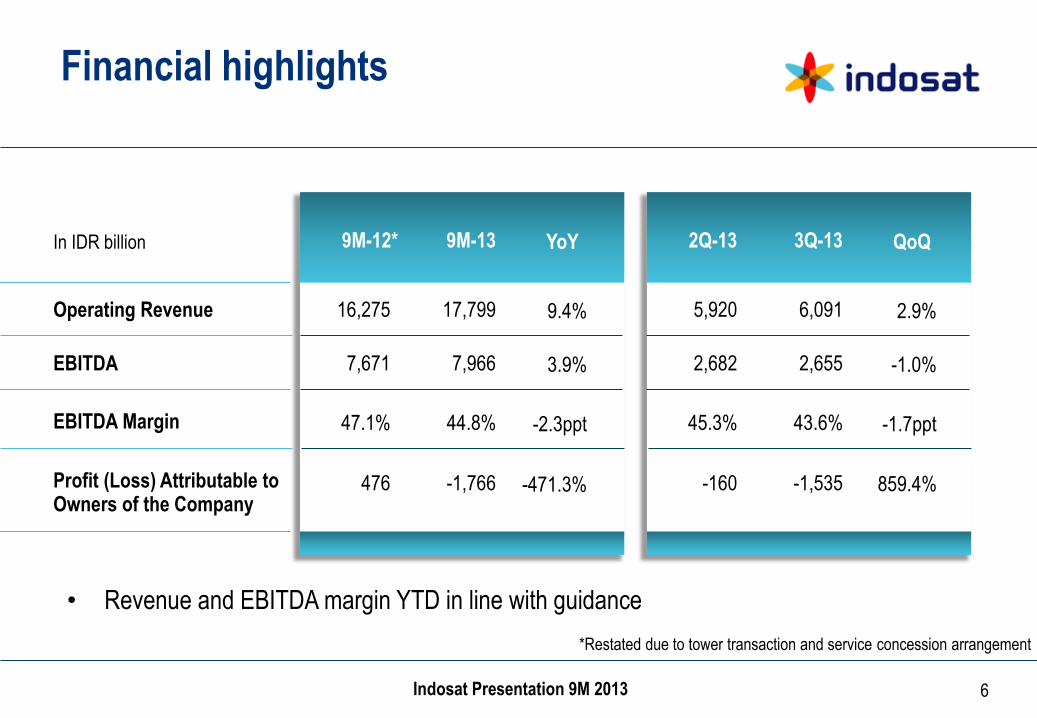
Financial highlights
16,275 Operating Revenue
EBITDA
EBITDA Margin
Profit (Loss) Attributable to Owners of the Company
17,799
9M-12* 9M-13 YoY
9.4%
7,671 7,966 3.9%
47.1% 44.8% -2.3ppt
476 -1,766 -471.3%
5,920 6,091
2Q-13 3Q-13 QoQ
2.9%
2,682 2,655 -1.0%
45.3% 43.6% -1.7ppt
-160 -1,535 859.4%
In IDR billion
• Revenue and EBITDA margin YTD in line with guidance
*Restated due to tower transaction and service concession arrangement
7 Indosat IR - New Template v23 1220.pptx 7 Indosat IR - New Template v23 1220.pptx
7 Indosat Presentation 9M 2013
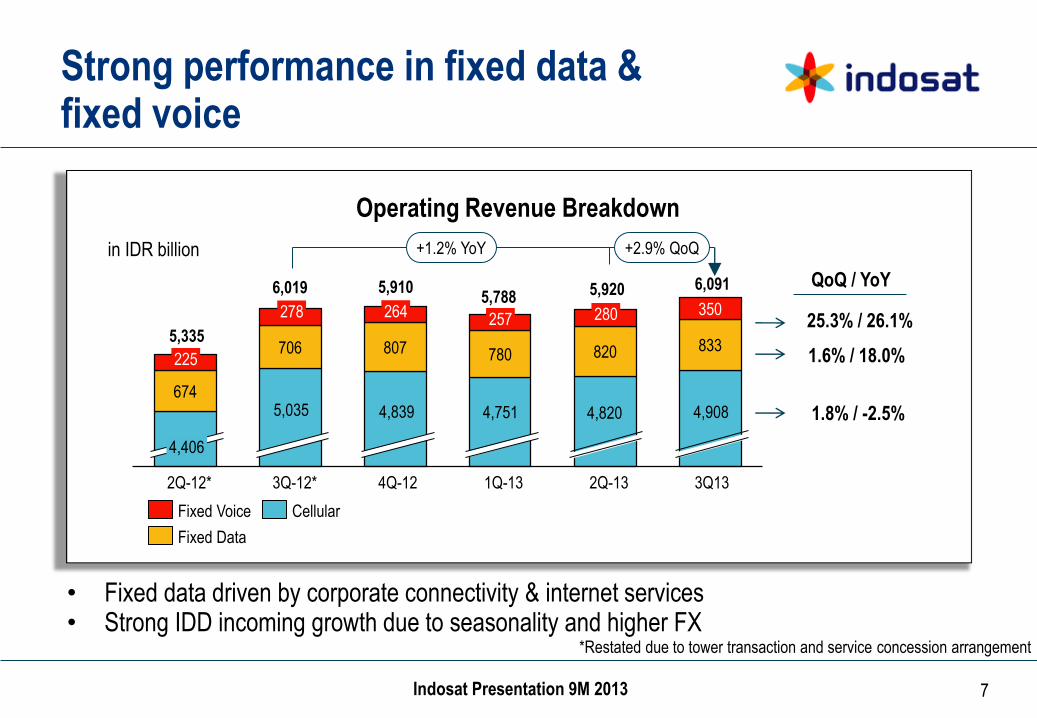
674
706 807 780 820 833
350
7
Strong performance in fixed data & fixed voice
Operating Revenue Breakdown
in IDR billion
2Q-13
+2.9% QoQ +1.2% YoY
3Q13
6,091 5,920
1Q-13 4Q-12 3Q-12* 2Q-12*
Cellular
Fixed Data
Fixed Voice
25.3% / 26.1%
1.6% / 18.0%
1.8% / -2.5%
• Fixed data driven by corporate connectivity & internet services • Strong IDD incoming growth due to seasonality and higher FX
QoQ / YoY
5,335
6,019 5,910 5,788
280 257 264
4,751 4,839
4,406
5,035 4,908 4,820
225
278
*Restated due to tower transaction and service concession arrangement
8 Indosat IR - New Template v23 1220.pptx 8 Indosat IR - New Template v23 1220.pptx
8 Indosat Presentation 9M 2013
8
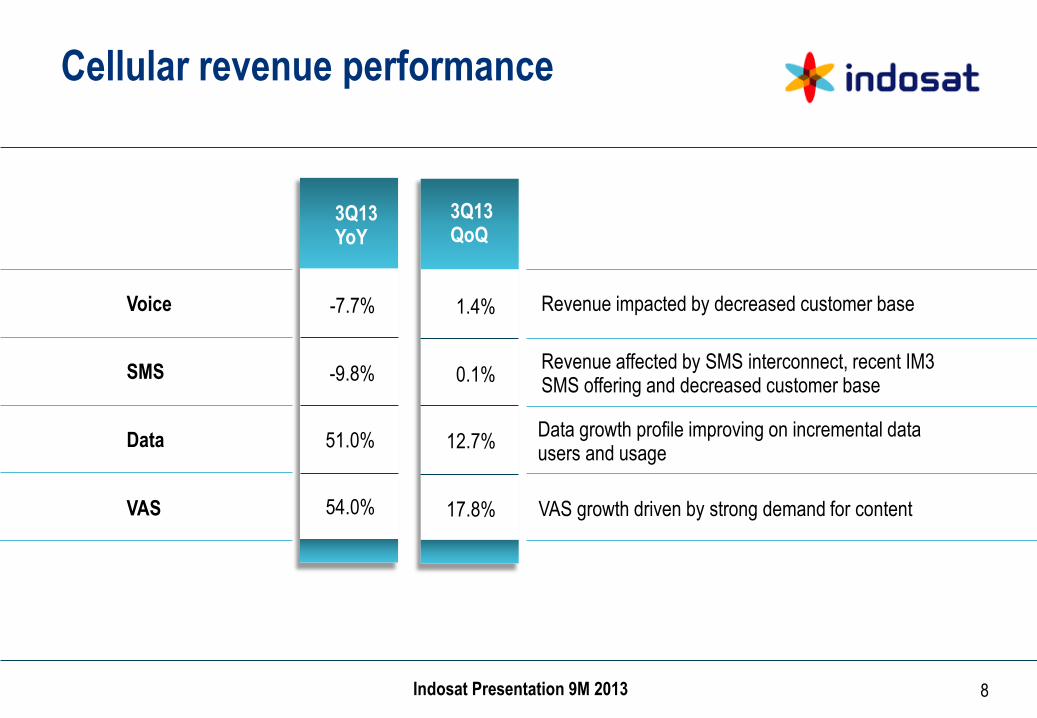
Cellular revenue performance
Voice
SMS
Data
VAS
-7.7%
3Q13 YoY
-9.8%
51.0%
54.0%
1.4%
3Q13 QoQ
0.1%
12.7%
17.8%
Revenue impacted by decreased customer base
Revenue affected by SMS interconnect, recent IM3 SMS offering and decreased customer base
Data growth profile improving on incremental data users and usage
VAS growth driven by strong demand for content
9 Indosat IR - New Template v23 1220.pptx 9 Indosat IR - New Template v23 1220.pptx
9 Indosat Presentation 9M 2013
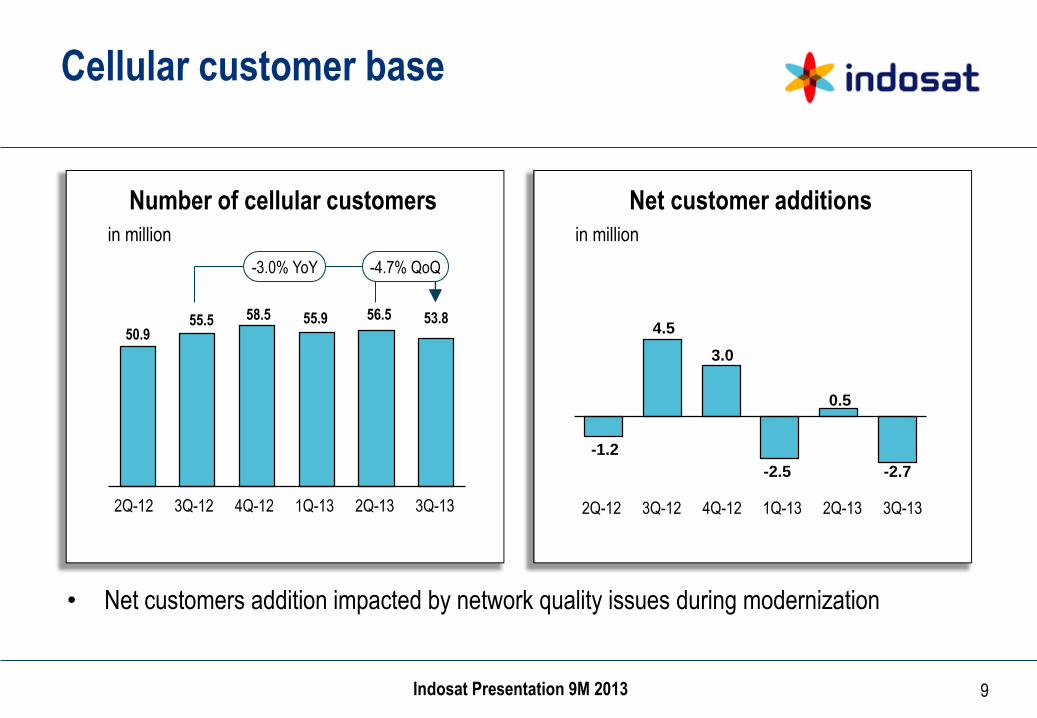
50.9 55.5 58.5 55.9 56.5 53.8
9
Cellular customer base
3Q-13
-3.0% YoY -4.7% QoQ
2Q-13 1Q-13 4Q-12 3Q-12 2Q-12
Number of cellular customers
in million
3Q-13 2Q-12 2Q-13 1Q-13 4Q-12 3Q-12
Net customer additions
in million
• Net customers addition impacted by network quality issues during modernization
-1.2
4.5
3.0
-2.5
0.5
-2.7
10 Indosat IR - New Template v23 1220.pptx 10 Indosat IR - New Template v23 1220.pptx
10 Indosat Presentation 9M 2013
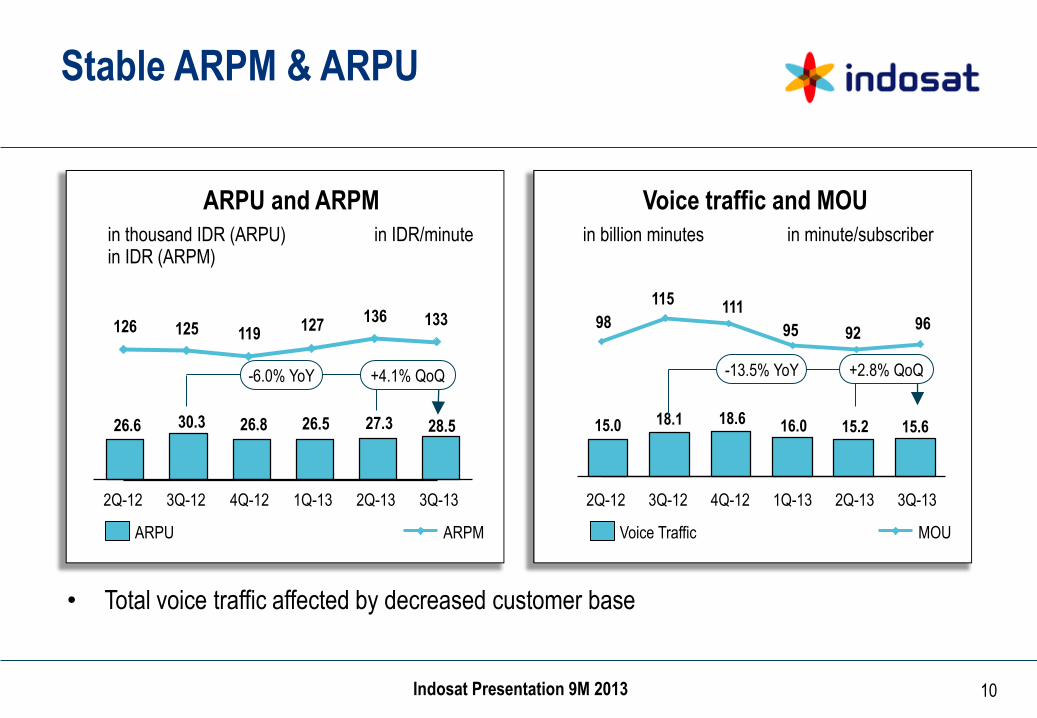
98
115 111
95 92 96 126 125 119
127 136 133
15.0 18.1 18.6 16.0 15.2 15.6
10
Stable ARPM & ARPU
Voice traffic and MOU
-13.5% YoY
3Q-13
+2.8% QoQ
2Q-13 1Q-13 4Q-12 3Q-12 2Q-12
Voice Traffic
in billion minutes in minute/subscriber
MOU
• Total voice traffic affected by decreased customer base
ARPU and ARPM
26.6 30.3 26.8 26.5 27.3 28.5
2Q-13 1Q-13 4Q-12 3Q-12 2Q-12
+4.1% QoQ -6.0% YoY
3Q-13
ARPU
in thousand IDR (ARPU) in IDR (ARPM)
ARPM
in IDR/minute
11 Indosat IR - New Template v23 1220.pptx 11 Indosat IR - New Template v23 1220.pptx
11 Indosat Presentation 9M 2013
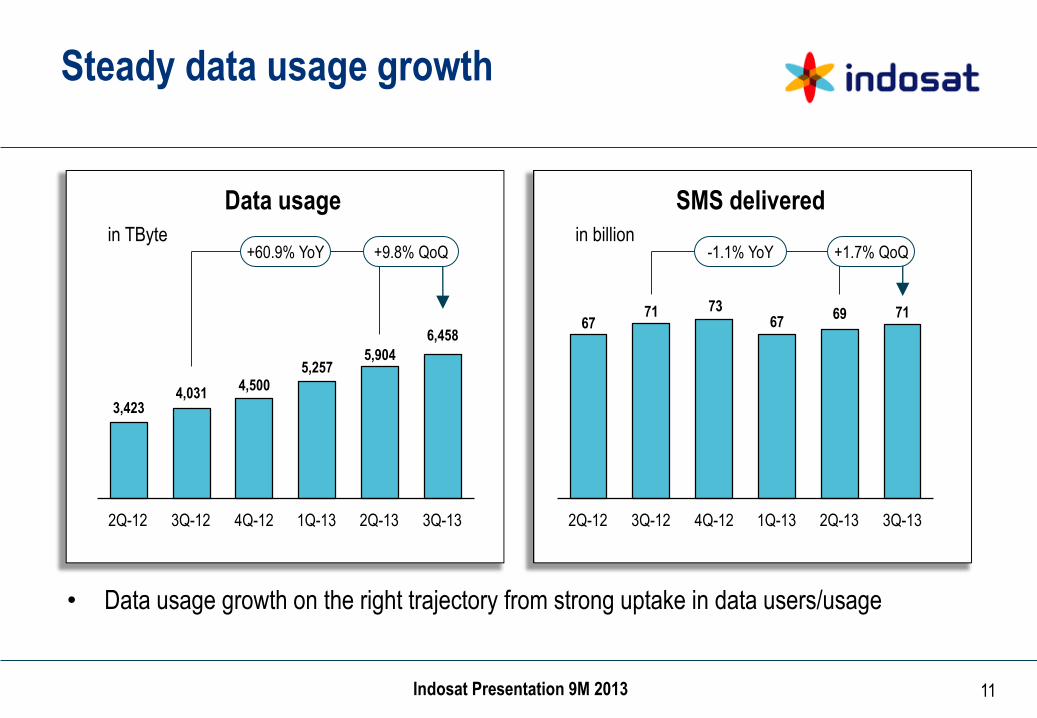
67 71 73
67 69 71
3,423 4,031
4,500 5,257
5,904
6,458
11
Steady data usage growth
Data usage
in TByte +9.8% QoQ +60.9% YoY
3Q-13 2Q-13 1Q-13 4Q-12 3Q-12 2Q-12
SMS delivered
in billion -1.1% YoY
3Q-13 2Q-13
+1.7% QoQ
1Q-13 4Q-12 3Q-12 2Q-12
• Data usage growth on the right trajectory from strong uptake in data users/usage
12 Indosat IR - New Template v23 1220.pptx 12 Indosat IR - New Template v23 1220.pptx
12 Indosat Presentation 9M 2013
12
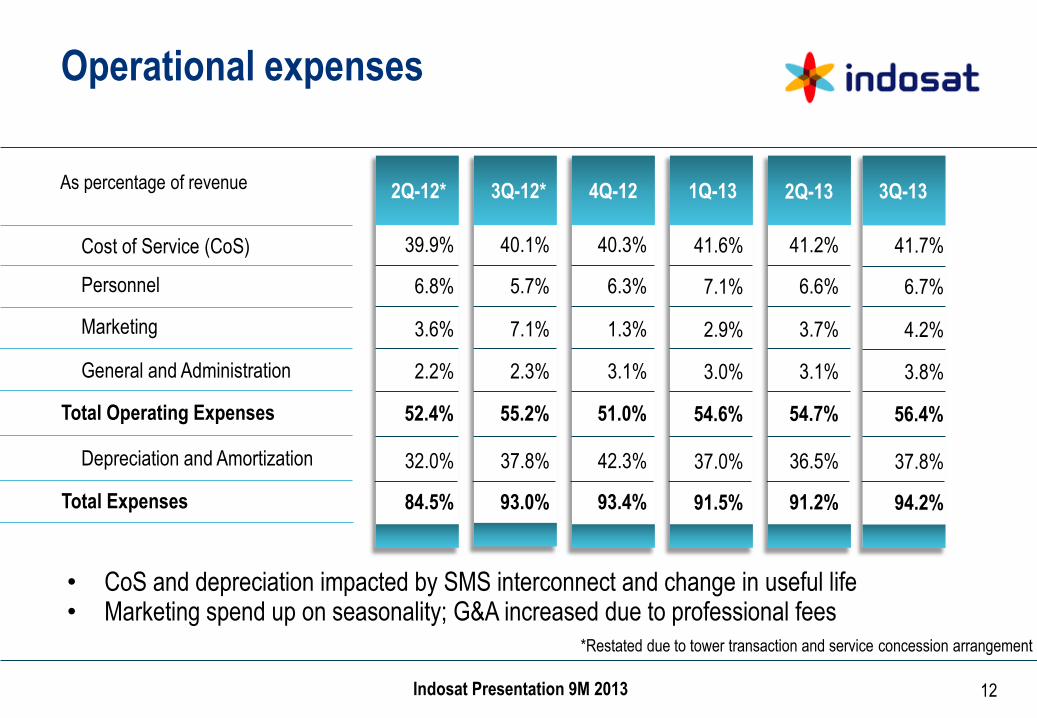
Operational expenses
Cost of Service (CoS)
Depreciation and Amortization
Personnel
Marketing
As percentage of revenue
General and Administration
Total Expenses
2Q-12* 3Q-12*
39.9%
4Q-12
32.0%
6.8%
3.6%
2.2%
84.5%
40.1%
1Q-13
37.8%
5.7%
7.1%
2.3%
93.0%
• CoS and depreciation impacted by SMS interconnect and change in useful life • Marketing spend up on seasonality; G&A increased due to professional fees
40.3%
42.3%
6.3%
1.3%
3.1%
93.4%
Total Operating Expenses 52.4% 55.2% 51.0%
3Q-13
41.2%
36.5%
6.6%
3.7%
3.1%
91.2%
54.7%
*Restated due to tower transaction and service concession arrangement
2Q-13
41.6%
37.0%
7.1%
2.9%
3.0%
91.5%
54.6%
41.7%
37.8%
6.7%
4.2%
3.8%
94.2%
56.4%

13 Indosat IR - New Template v23 1220.pptx 13 Indosat IR - New Template v23 1220.pptx
13 Indosat Presentation 9M 2013
2,537 2,824 2,893
2,629 2,682 2,655
13
EBITDA performance
EBITDA and EBITDA margin
-1.0% QoQ -6.0% YoY
3Q-13 2Q-13 1Q-13 4Q-12 3Q-12* 2Q-12*
EBITDA
in IDR billion
45.4% 49.0%
46.9% 47.6%
EBITDA Margin
• 3Q EBITDA (YoY) impacted by softer revenue growth
• YTD EBITDA margin in line with guidance
45.3% 43.6%
*Restated due to tower transaction and service concession arrangement

14 Indosat IR - New Template v23 1220.pptx 14 Indosat IR - New Template v23 1220.pptx
14 Indosat Presentation 9M 2013
Normalized net profit bridge
1,047
476
-1,766
-1,766
674
1,608
832
14
Normalized net profit*
Net profit
-471.3% YoY -54.6% YoY
9M-13 9M-12** 9M-11**
in IDR billion in IDR billion 9M13
• Net profit affected by substantial FX loss and change in network equipment useful life
Normalized Net– FX Loss Change in
Useful Life
Reported
* Net profit is Profit Attribution to Owners of the Company ** Restated due to tower transaction and service concession arrangement
15 Indosat IR - New Template v23 1220.pptx 15 Indosat IR - New Template v23 1220.pptx
15 Indosat Presentation 9M 2013
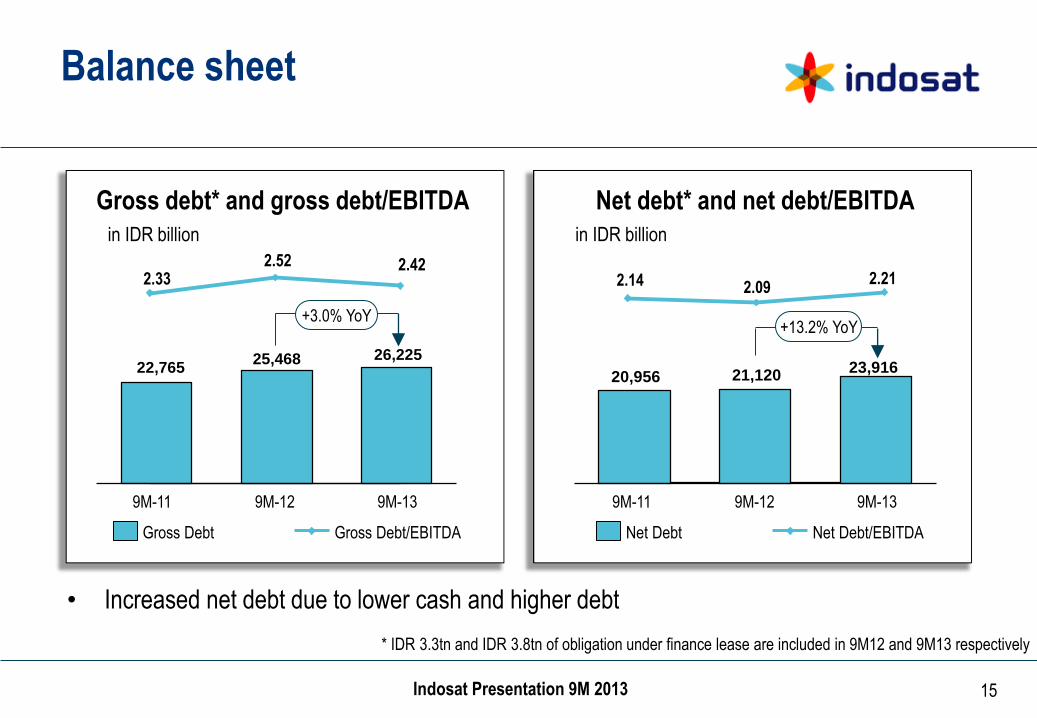
2.33 2.52 2.42
22,765 25,468 26,225
2.14 2.09 2.21
20,956 21,120 23,916
15
Balance sheet
Gross debt* and gross debt/EBITDA Net debt* and net debt/EBITDA
9M-12 9M-11 9M-13
+3.0% YoY
Gross Debt
in IDR billion
Gross Debt/EBITDA
9M-13 9M-11 9M-12
+13.2% YoY
Net Debt Net Debt/EBITDA
in IDR billion
• Increased net debt due to lower cash and higher debt
* IDR 3.3tn and IDR 3.8tn of obligation under finance lease are included in 9M12 and 9M13 respectively

16 Indosat IR - New Template v23 1220.pptx 16 Indosat IR - New Template v23 1220.pptx
16 Indosat Presentation 9M 2013
1,731 1,334 1,332
2,612 2,750 2,516
32.5
22.2 22.4
45.1 46.5 41.3
16
Free Cash Flow
Free cash flow
in IDR billion
1,137
3,528
-447 -499
390 479
3Q-13 2Q-13 1Q-13 4Q-12 3Q-12* 2Q-12*
Capex and Capex/Revenue
3Q-13 2Q-13 1Q-12 4Q-12 3Q-12 2Q-12
Capex
in IDR billion
Capex/Revenue
• Network modernization driving higher cash capex
*Restated due to tower transaction and service concession arrangement

17 Indosat IR - New Template v23 1220.pptx 17 Indosat IR - New Template v23 1220.pptx
17 Indosat Presentation 9M 2013
774
661 622 624
404 346
17
Network roll-out
Number of BTS
16,898 17,211 17,334 17,452 17,668 18,214
4,141 4,431 4,596 4,645 4,781 4,993
+3.4% QoQ +7.2% YoY
3Q-13
21,930
2Q-13
21,642
1Q-13
21,039
4Q-12 3Q-12 2Q-12
2G 3G
Cellular Revenue per BTS
In IDR million
9M 2013 9M 2012
XL
Indosat
Telkomsel
• Network modernization program mainly focusing on existing footprint in key market areas • Successfully launched 3G 900/2100 HSDPA+ in South Bali
22,097 22,449 23,207
18 Indosat IR - New Template v23 1220.pptx 18 Indosat IR - New Template v23 1220.pptx
18 Indosat Presentation 9M 2013
18
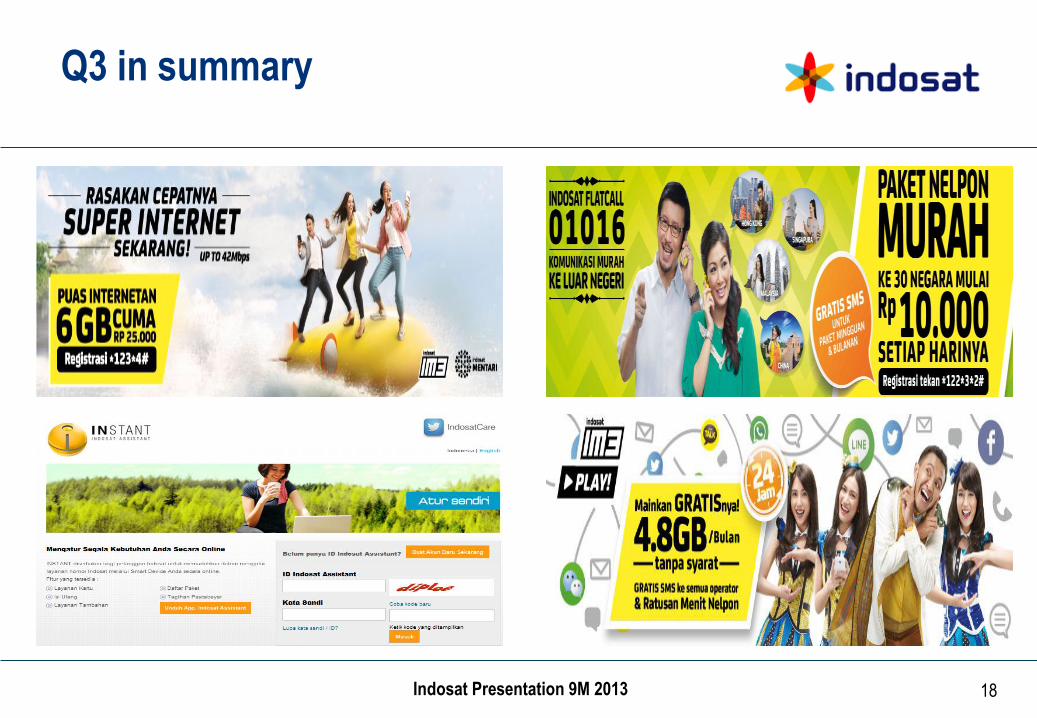
Q3 in summary

19 Indosat IR - New Template v23 1220.pptx
19
Management Focus and Key updates

20 Indosat IR - New Template v23 1220.pptx 20 Indosat IR - New Template v23 1220.pptx
20 Indosat Presentation 9M 2013
20
Near term management focus
Execute well on network modernization and improve network quality
Drive strong uptake and usage of our data services
Improve cost efficiencies to enable investments in growth
Transform culture with focus on quick wins
21 Indosat IR - New Template v23 1220.pptx 21 Indosat IR - New Template v23 1220.pptx
21 Indosat Presentation 9M 2013
21
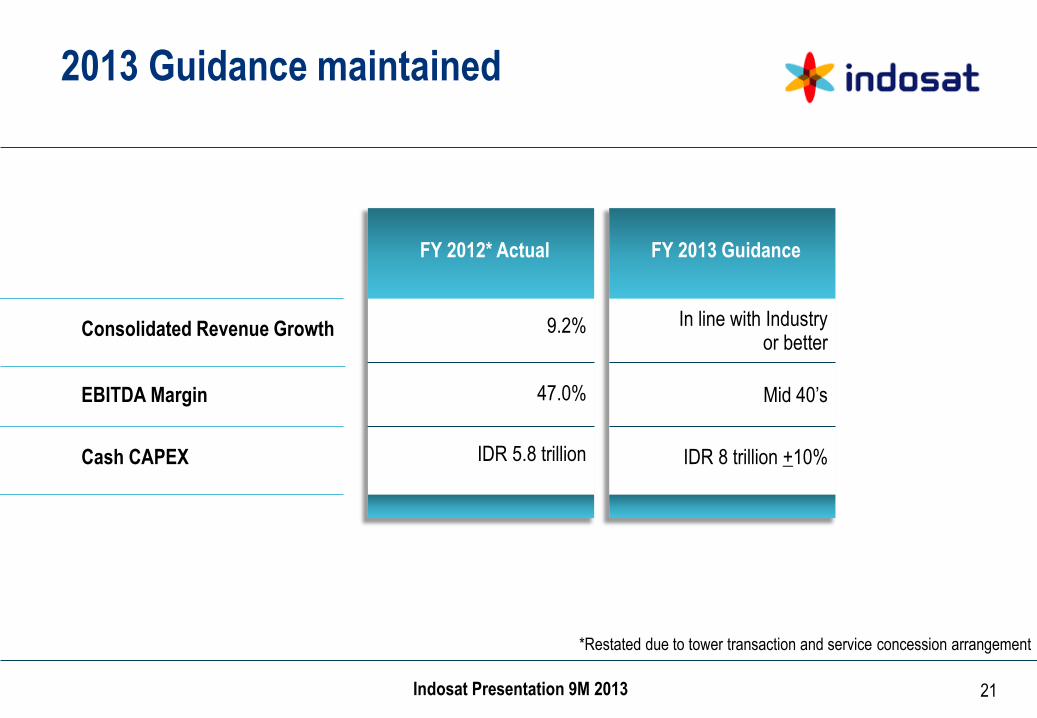
2013 Guidance maintained
FY 2012* Actual FY 2013 Guidance
Consolidated Revenue Growth 9.2% In line with Industry or better
EBITDA Margin 47.0% Mid 40’s
Cash CAPEX IDR 5.8 trillion IDR 8 trillion +10%
*Restated due to tower transaction and service concession arrangement
22 Indosat IR - New Template v23 1220.pptx 22 Indosat IR - New Template v23 1220.pptx
22 Indosat Presentation 9M 2013
22
Thank You
Any further questions?
Upcoming events FY 2013 Results
Indosat Investor Relations Jl. Medan Merdeka Barat No. 21 Jakarta - 10110 Tel: +62 21 30442615 [email protected]

23 Indosat IR - New Template v23 1220.pptx 23 Indosat IR - New Template v23 1220.pptx
23 Indosat Presentation 9M 2013
23
Disclaimer
• PT Indosat Tbk cautions investors that certain statements contained in this document state management's intentions, hopes, beliefs, expectations, or predictions of the future are forward-looking statements
• Management wishes to caution the reader that forward-looking statements are not historical facts and are only estimates or predictions. Actual results may differ materially from those projected as a result of risks and uncertainties including, but not limited to:
• Our ability to manage domestic and international growth and maintain a high level of customer service
• Future sales growth
• Market acceptance of our product and service offerings
• Our ability to secure adequate financing or equity capital to fund our operations
• Network expansion
• Performance of our network and equipment
• Our ability to enter into strategic alliances or transactions
• Cooperation of incumbent local exchange carriers in provisioning lines and interconnecting our equipment
• Regulatory approval processes
• Changes in technology
• Price competition
• Other market conditions and associated risks
• The company undertakes no obligation to update publicly any forward-looking statements, whether as a result of future events, new information, or otherwise

24 Indosat IR - New Template v23 1220.pptx
24

25 Indosat IR - New Template v23 1220.pptx
25
Supplemental Information
26 Indosat IR - New Template v23 1220.pptx 26 Indosat IR - New Template v23 1220.pptx
26 Indosat Presentation 9M 2013
26
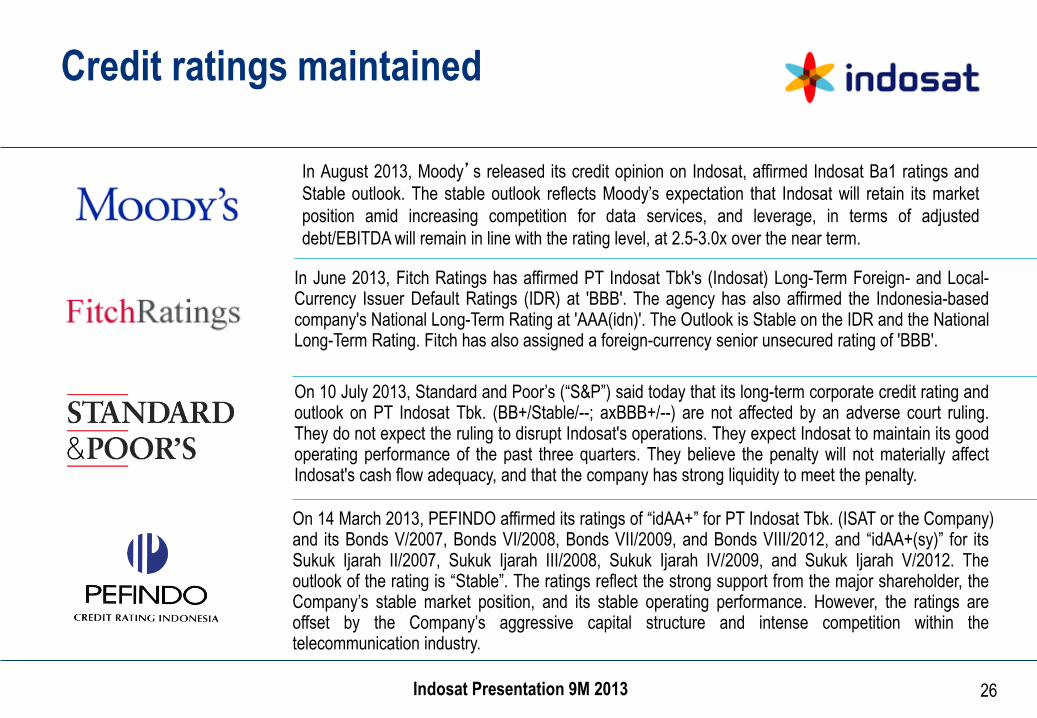
Credit ratings maintained
In June 2013, Fitch Ratings has affirmed PT Indosat Tbk's (Indosat) Long-Term Foreign- and Local-Currency Issuer Default Ratings (IDR) at 'BBB'. The agency has also affirmed the Indonesia-based company's National Long-Term Rating at 'AAA(idn)'. The Outlook is Stable on the IDR and the National Long-Term Rating. Fitch has also assigned a foreign-currency senior unsecured rating of 'BBB'.
On 10 July 2013, Standard and Poor’s (“S&P”) said today that its long-term corporate credit rating and outlook on PT Indosat Tbk. (BB+/Stable/--; axBBB+/--) are not affected by an adverse court ruling. They do not expect the ruling to disrupt Indosat's operations. They expect Indosat to maintain its good operating performance of the past three quarters. They believe the penalty will not materially affect Indosat's cash flow adequacy, and that the company has strong liquidity to meet the penalty.
On 14 March 2013, PEFINDO affirmed its ratings of “idAA+” for PT Indosat Tbk. (ISAT or the Company) and its Bonds V/2007, Bonds VI/2008, Bonds VII/2009, and Bonds VIII/2012, and “idAA+(sy)” for its Sukuk Ijarah II/2007, Sukuk Ijarah III/2008, Sukuk Ijarah IV/2009, and Sukuk Ijarah V/2012. The outlook of the rating is “Stable”. The ratings reflect the strong support from the major shareholder, the Company’s stable market position, and its stable operating performance. However, the ratings are offset by the Company’s aggressive capital structure and intense competition within the telecommunication industry.
In August 2013, Moody’s released its credit opinion on Indosat, affirmed Indosat Ba1 ratings and
Stable outlook. The stable outlook reflects Moody’s expectation that Indosat will retain its market
position amid increasing competition for data services, and leverage, in terms of adjusted
debt/EBITDA will remain in line with the rating level, at 2.5-3.0x over the near term.
27 Indosat IR - New Template v23 1220.pptx 27 Indosat IR - New Template v23 1220.pptx
27 Indosat Presentation 9M 2013
27
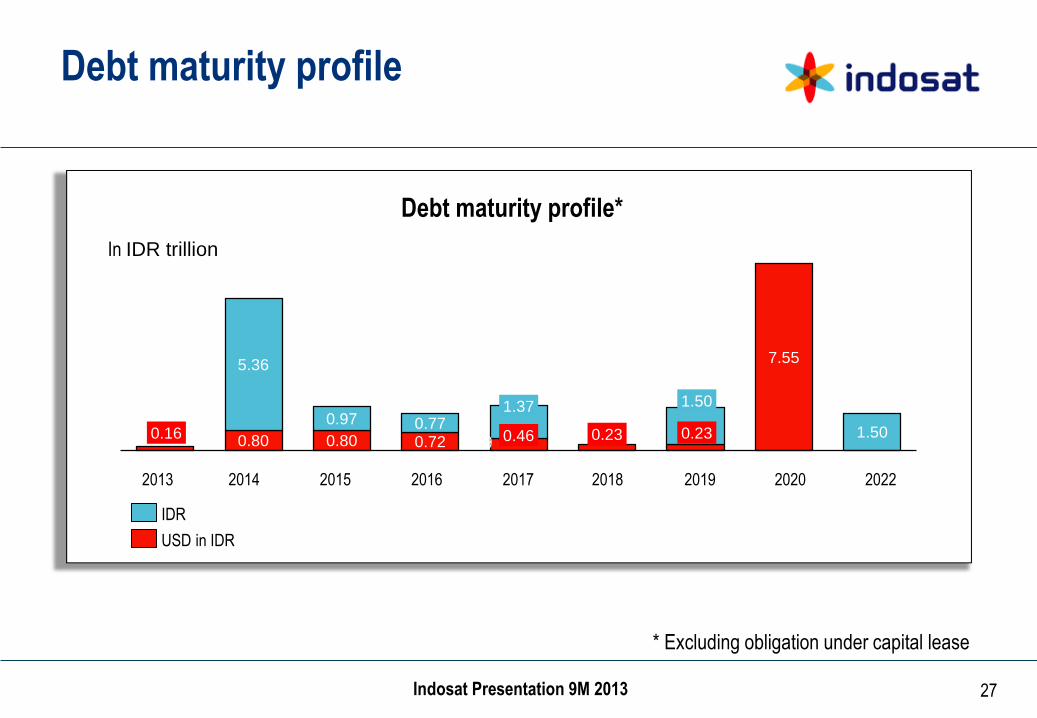
Debt maturity profile
Debt maturity profile*
In IDR trillion
0.16 0.80 0.80 0.72 0.46 0.23 0.23
7.55 5.36
0.97 0.77 1.37 1.50
1.50
2019 2018 2017 2013 2020 2022 2016
0.59
2015 2014
IDR
USD in IDR
* Excluding obligation under capital lease
28 Indosat IR - New Template v23 1220.pptx 28 Indosat IR - New Template v23 1220.pptx
28 Indosat Presentation 9M 2013
28
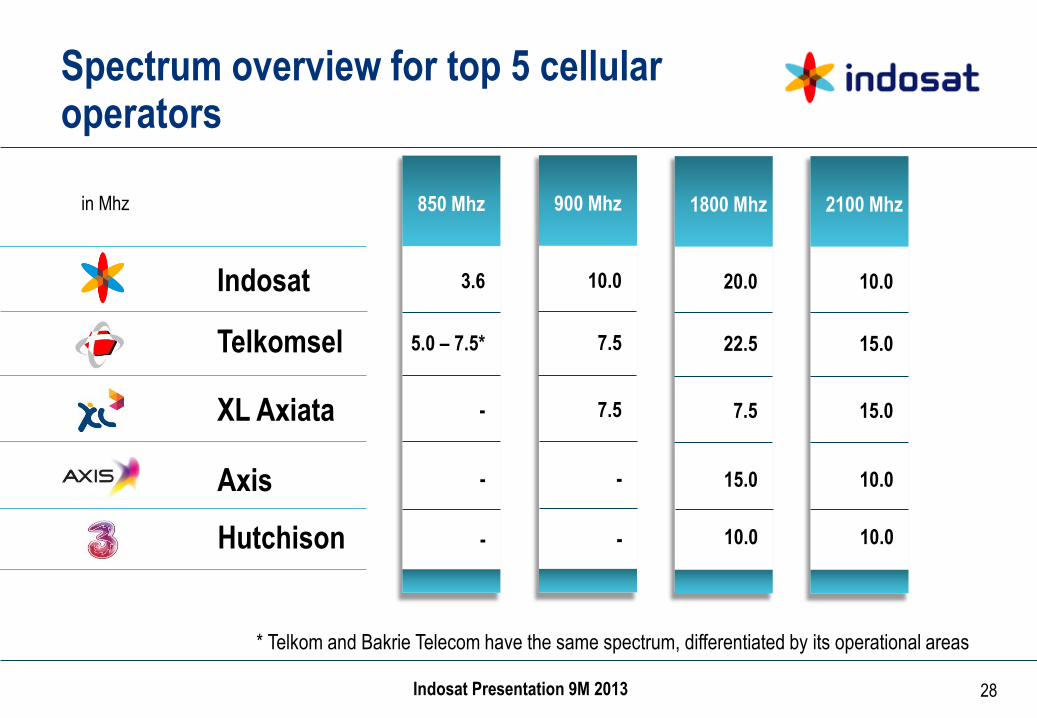
Spectrum overview for top 5 cellular operators
10.0
900 Mhz
7.5
7.5
Indosat
Telkomsel
XL Axiata
20.0
1800 Mhz
22.5
7.5
10.0
2100 Mhz
15.0
15.0
in Mhz
- 15.0 10.0 Axis
Hutchison - 10.0 10.0
3.6
850 Mhz
5.0 – 7.5*
-
-
-
* Telkom and Bakrie Telecom have the same spectrum, differentiated by its operational areas