1h 2018 results - assets.indosatooredoo.com · smartfren 2 x 11.0 - 30.0 . pt indosat tbk. –1h...
TRANSCRIPT

1H 2018 Results

| |PT Indosat Tbk. – 1H 2018 Results 3
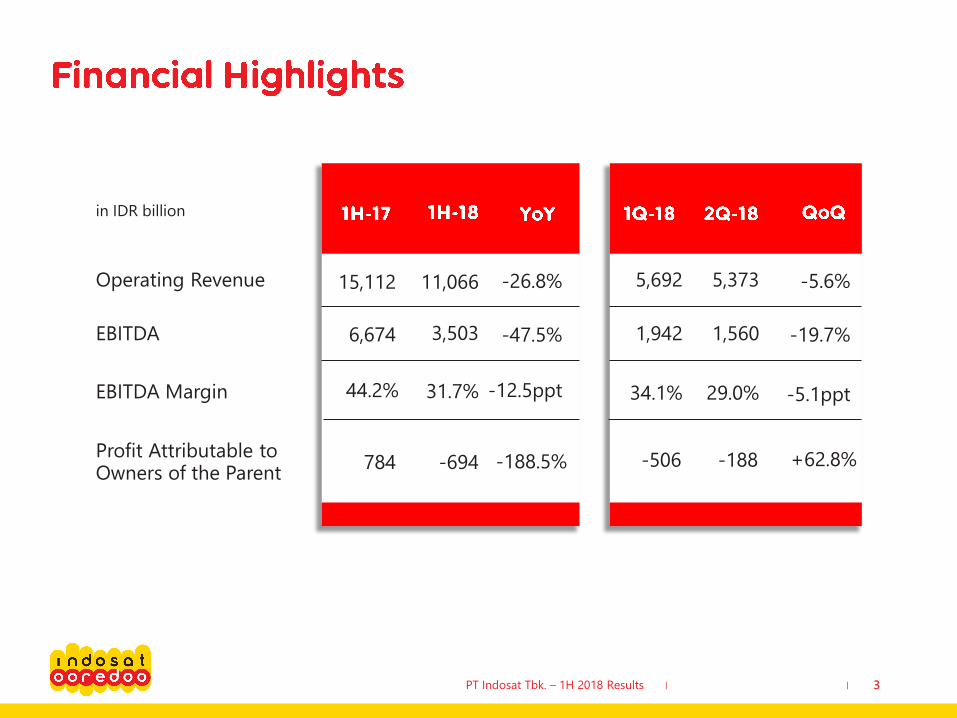
Operating Revenue
EBITDA
EBITDA Margin
Profit Attributable to Owners of the Parent
11,066 -26.8%
3,503 -47.5%
44.2% -12.5ppt
-694 -188.5%
5,373 -5.6%
1,560 -19.7%
29.0% -5.1ppt
-188 +62.8%
in IDR billion
15,112
6,674
31.7%
784
5,692
1,942
34.1%
-506

| |PT Indosat Tbk. – 1H 2018 Results 4
1,060
1,0851,375
1,043 967
234
217 220
232 178
in IDR billion
-5.6% QoQ-31.3% YoY
CellularFixed DataFixed Voice
-23.3% | -23.8%
-7.3% | -8.8%
-4.3% | -35.2%
QoQ | YoY
2Q-17 3Q-17 4Q-17 1Q-18
6,529
7,823
7,453
6,1514,228
7,360
5,692
2Q-18
5,765
5,373
4,417

| |PT Indosat Tbk. – 1H 2018 Results 5
Voice
SMS
Data
VAS
-33.4%
-57.1%
-12.6%
-3.7%
-7.9%
-20.4%
-5.0%
-2.3%
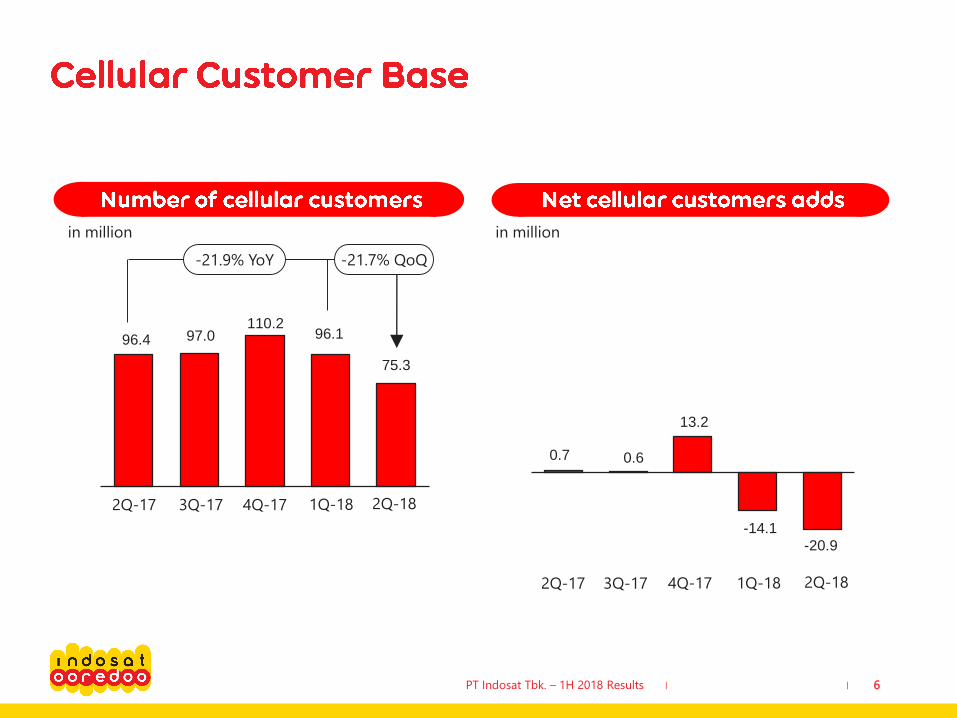
Shifting business model from push marketingstrategy to customer’s demand driven Go-To-Market Strategy
| |PT Indosat Tbk. – 1H 2018 Results 6
96.4 97.0110.2
96.1
75.3
-21.9% YoY -21.7% QoQ
in million in million
0.7 0.6
13.2
-14.1-20.9
2Q-17
2Q-17
3Q-17
3Q-17
4Q-17
4Q-17
1Q-18
1Q-18
2Q-18
2Q-18

| |
5347
3729
35
PT Indosat Tbk. – 1H 2018 Results 7
131144 149 150 155
-45.8% YoY -9.7% QoQ
Voice Traffic
in billion minutes (Voice Traffic)
in minute/subscriber (MOU)
MOU
22.5 20.6 17.612.4 15.9
+28.0% QoQ-29.3% YoY
ARPU
in thousand IDR (ARPU)
ARPM
in IDR (ARPM)
2Q-17 2Q-173Q-17 3Q-174Q-17 4Q-171Q-18 1Q-182Q-18
15.6 12.4 11.6 9.4 8.5
2Q-18

| |PT Indosat Tbk. – 1H 2018 Results 8
246,862
293,225333,263
368,232
449,105
in TByte
+22.0% QoQ+81.9% YoY
2Q-17 3Q-17 4Q-17 1Q-18 4Q-17
59%63% 66%
70% 72%
+2.0% QoQ+13.0% YoY
2Q-17 3Q-17 1Q-182Q-18 2Q-18

| |PT Indosat Tbk. – 1H 2018 Results 9
Cost of Service (CoS)
Depreciation and Amortization
Personnel
Marketing
as percentage of revenue
General and Administration
Total Expenses
Total Operating Expenses
45.8%
29.9%
4.0%
4.6%
6.7%
91.1%
61.2%
53.1%
37.6%
10.7%
5.5%
1.7%
108.5%
71.0%
7.2%
4.2%
3.2%
39.6%
28.2%
82.5%
54.3%
7.6%
4.7%
3.2%
41.2%
29.8%
86.4%
56.6%
50.2%
36.5%
10.3%
3.1%
2.2%
102.4%
65.9%

| |PT Indosat Tbk. – 1H 2018 Results 10
3,574 3,2322,856
1,9421,560
-19.7% QoQ-56.3% YoY
EBITDA
in IDR billion
EBITDA Margin
4Q-17
43.4%
2Q-17
38.8%
3Q-17
45.7%
428
784
-694
-188.5% YoY+83.2% YoY
1H-181H-171H-16
in IDR billion
34.1%
1Q-18
29.0%
2Q-18

| |PT Indosat Tbk. – 1H 2018 Results 11
1.74
1.42
2.01
21,083 19,226 19,290
1.55
1.25
1.87
18,83016,821 17,971
1H-171H-16 1H-18
+0.3% YoY
Gross Debt
in IDR billion
Gross Debt/EBITDA
1H-181H-16 1H-17
Net Debt Net Debt/EBITDA
in IDR billion
+6.8% YoY
| |
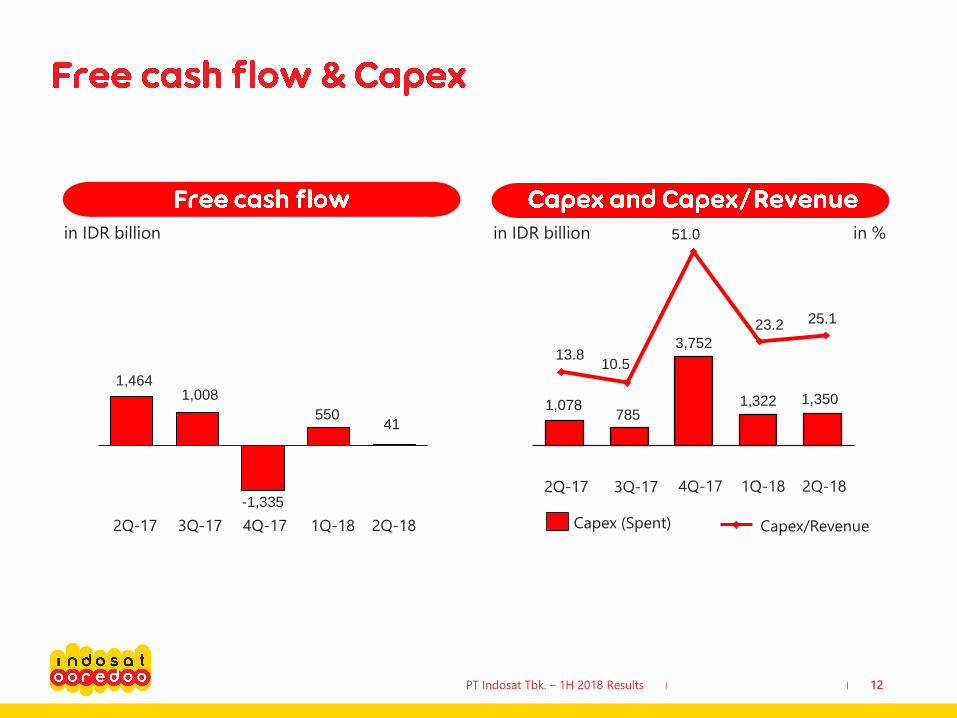
13.8 10.5
51.0
23.2 25.1
PT Indosat Tbk. – 1H 2018 Results 12
in IDR billion
1,4641,008
-1,335
55041
Capex (Spent)
in IDR billion
Capex/Revenue
4Q-17
2Q-17
in %
3Q-17
2Q-17
4Q-17
3Q-17 1Q-18
1Q-18 2Q-18
1,078785
3,752
1,322 1,350
2Q-18

| |PT Indosat Tbk. – 1H 2018 Results 13
• 4G coverage has reached 239 cities in Indonesia, 34 cities addition during 1H 2018.
24,235 24,225 23,999 24,294 24,427
29,255 29,912 30,179 31,062 31,880
5,533 6,110 7,179 9,019 10,066
+3.1% QoQ+12.5% YoY
2G3G
59,023
4Q-17
4G
2Q-17 3Q-17
60,247 61,357
1Q-18
64,375More than 80% of total sites have
been modernized since 2013 and
READY for 4.5G and beyond
technology deployment
2Q-18
66,373


| |PT Indosat Tbk. – 1H 2018 Results 15
Consolidated Revenue Growth Below market
EBITDA Margin High 30’s
CAPEX ~ IDR 8 trillion(Spent)
-26.8%
31.7%
IDR 2.7 trillion(Spent)


| |PT Indosat Tbk. – 1H 2018 Results 18
On September 16, 2014, the South Jakarta Attorney Office (“Kejaksaan
Negeri Jakarta Selatan”), without preliminary notification, executed the
Supreme Court’s Decision on Mr. Indar Atmanto. The execution was
done based on a quotation of the Supreme Court’s Decision, which
states, among others, that (i) Mr. Indar Atmanto is found guilty and
sentenced to eight years imprisonment and charged with penalty of
Rp300,000,000,- (if the penalty is not paid, Mr. Indar Atmanto would
serve an additional six months imprisonment), and (ii) IM2 pay the
losses sustained by the State amounting to Rp1,358,343,346,674,-.
Subsequently, on January 16, 2015, Mr.Indar Atmanto and/or his lawyer
or IM2 received the document on the Supreme Court’s decision
regarding the litigation case. As of the issuance date of the
consolidated financial statements, Mr. Indar Atmanto and IM2 plan to
conduct further legal act by submitting a reconsideration request
peninjauan kembali (”PK”).
On March 16, 2015, Mr. Indar Atmanto’s submission of Judicial Review
[Peninjauan Kembali (”PK”)] was officially registered at the Corruption
Court under No. 08/AKTA.PID.SUS/PK/TPK/2015/PN.Jkt.Pst.
On November 4, 2015, the Supreme Court’s official website announced
that the Judicial Review filed by Mr. Indar Atmanto was rejected based
on Supreme Court’s decision dated October 20, 2015. However, no
detailed information regarding the exact content of such Supreme
Court’s decision was available. As of the issuance date of the interim
consolidated financial statements, the official copy of such Supreme
Court’s decision hasn’t been received.

| |PT Indosat Tbk. – 1H 2018 Results 19
On December 8, 2017, S&P Global Ratings raised its long-term corporate credit rating on
Indonesia-based telecommunications operator PT Indosat Tbk. (Indosat) to 'BBB-' from
'BB+'. The outlook is stable. The upgrade reflects their expectation that Indosat will
maintain its solid cash flow adequacy and reduce debt over the next 12-24 months. The
company's steady cash flows, moderate capital spending, and prudent financial policies
should support the improvement. We anticipate that Indosat's ratio of funds from
operations (FFO) to debt will remain above 40% until 2019.
On 13 March 2018, PEFINDO has affirmed its “idAAA” ratings for PT Indosat Tbk (ISAT) and
its Shelf Registration Bond II Year 2017-2019, Shelf Registration Bond I Year 2014-2016, and
Bond VIII Year 2012. PEFINDO has also affirmed its “idAAA(sy)” ratings for ISAT’s Shelf
Registration Sukuk Ijarah II Year 2017-2019, Shelf Registration Sukuk Ijarah I Year 2014-
2016, and Sukuk Ijarah V Year 2012. The outlook for the corporate rating is “stable”.
On 12 May 2017, Moody's Investors Service has has upgraded to Baa3 from Ba1 the
issuer rating of Indosat Tbk. (P.T.) (Indosat Ooredoo). The outlook for the rating is stable.
At the same time, Moody's has withdrawn the company's Ba1 Corporate Family Rating.
The rating upgrade reflects the continued strengthening of Indosat Ooredoo's operational
metrics as well as the ongoing stabilization of its financial profile, including lower leverage
levels.
On 25 February 2018, Fitch Ratings has affirmed Indonesian telecom operator
PT Indosat Tbk's (Indosat Ooredoo) Long-Term Foreign-and Local-
Currency Issuer Default Rating (IDR) at ‘BBB+’ simultaneously affirmed the foreign-
currency senior unsecured rating at 'BBB+‘. Fitch Ratings has also affirmed Indosat
Ooredoo’s National LongTerm Rating at 'AAA(idn)'. The Outlook is Stable.
| |PT Indosat Tbk. – 1H 2018 Results 20
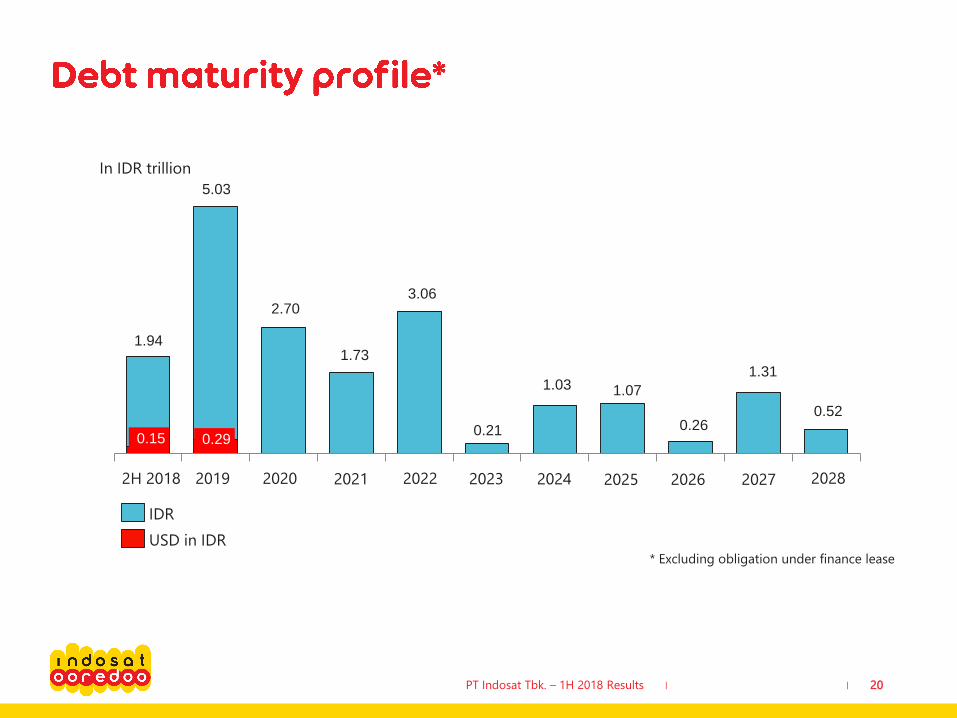
0.15 0.29
1.94
5.03
2.70
1.73
3.06
0.21
1.03 1.07
0.26
1.31
0.52
In IDR trillion
20202019 20222H 2018
IDR
USD in IDR
2021 20242023 2025 2026
* Excluding obligation under finance lease
2027 2028

| |PT Indosat Tbk. – 1H 2018 Results 21
Number of BTS
2 x 12.5
2 x 15
2 x 7.5
Indosat
Telkomsel
XL Axiata
2 x 20.0
2 x 22.5
2 x 22.5
2 x 15.0
2 x 15.0
2 x 15.0
in Mhz
Hutchison - 2 x 10.0 2 x 15.0
15.0*
45.0
-
-
* Indosat/IM2: West Java exclude Bogor, Depok & Bekasi
2020 2020 2019, 2026,2028
2019Valid until
Smartfren 2 x 11.0 30.0 - -

| |PT Indosat Tbk. – 1H 2018 Results 22
• PT Indosat Tbk ( “Indosat” or “Company” ) cautions investors that certain statements contained in this document state its management's intentions, hopes, beliefs, expectations, or predictions of the future are forward-looking statements
• The Company wishes to caution the reader that forward-looking statements are not historical facts and are only estimates or predictions. Actual results may differ materially from those projected as a result of risks and uncertainties including, but not limited to:
• The Company’s ability to manage domestic and international growth and maintain a high level of customer service
• Future sales growth
• Market acceptance of the Company’s product and service offerings
• The Company’s ability to secure adequate financing or equity capital to fund our operations
• Network expansion
• Performance of the Company’s network and equipment
• The Company’s ability to enter into strategic alliances or transactions
• Cooperation of incumbent local exchange carriers in provisioning lines and interconnecting our equipment
• Regulatory approval processes
• Changes in technology
• Price competition
• Other market conditions and associated risks
• The company undertakes no obligation to update publicly any forward-looking statements, whether as a result of future events, new information, or otherwise