public bicycle sharing scheme presentations/city specific pb… · public bicycle sharing ......
TRANSCRIPT
Stakeholder Workshop on
Public Bicycle Sharing Scheme
23rd February | Vadodara

WORKSHOP AGENDA

A product of WRI Ross Center for Sustainable Cities
SARIKA PANDA BHATT , IBI, GURGAON
PUBLIC BICYCLE
SHARING
23rd Feb 2016
MoUD – SUTP Workshop on PBS
Organized by VMC, SUTP and IBI Group
BEST PRACTICES IN
PUBLIC BICYCLE SHARING
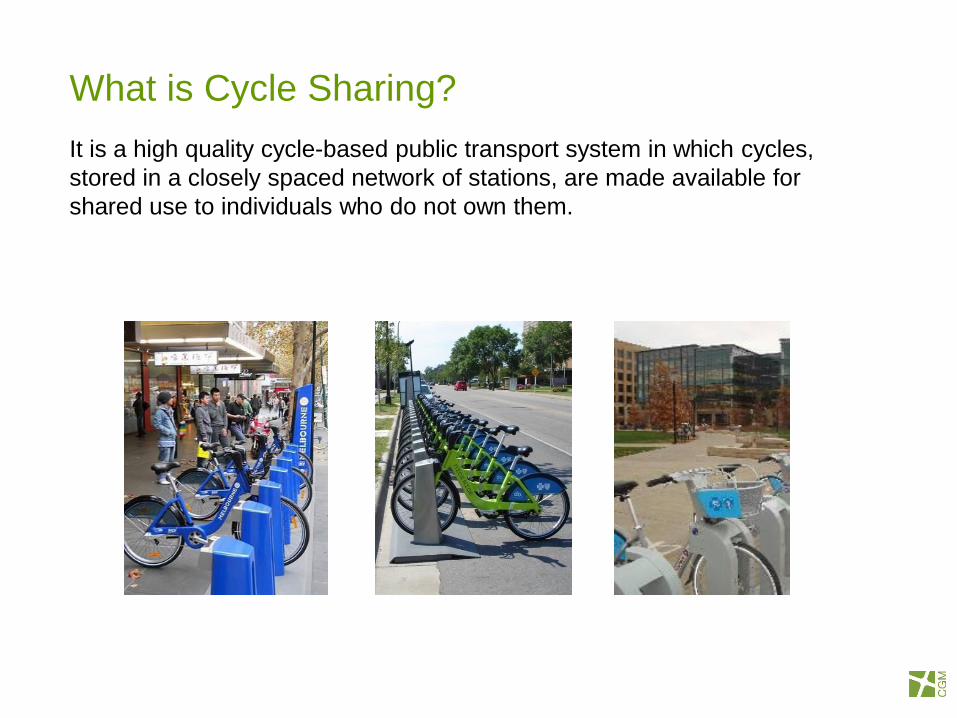
What is Cycle Sharing?
It is a high quality cycle-based public transport system in which cycles,
stored in a closely spaced network of stations, are made available for
shared use to individuals who do not own them.

Cycle Sharing | Cycle Renting

Public Bicycle Sharing (PBS) systems are a flexible
public transport service that involves the creation of
a dense network of cycle rental stations. Users can
take a cycle from any station and return it to any
other station in the system

Photo : William Murphy/ Flickr1II. Smart Payment
1I. Automated Stations1. Custom Designed Bicycles
1V. Smart Communications
SYSTEM COMPONENTS

KEY FEATURES• Dense network of
stations
• Strong Identity of cyclesto discourage theft
• Radio frequencyidentification devices(RFIDs) to track Cycles
• Real-time monitoring ofstations throughGeneral Packet RadioService (GPRS)
• Real-time userinformation through web,mobile phones/ apps,and/or on-site terminals
• Fare structure whichencourages short trips
Photo : Ames Lai / Flickr

ADVANTAGES OF PBS
Photo : EMBARQ / Flickr
Increases
mode share
of cycling in
the city
Improves
cycling
image
Improves
local
economy
Increases
catchment
area of
public
transport
Improves air
quality and
reduces
congestion
on roads

Bicycle Sharing - World
1st Gen. - 1965
FREE BIKE
SYSTEMS
Components:
Bicycles
Characteristics:
• Distinct Bicycles
• Unlocked Bikes
• Free of Charge
• No Stations
2nd Gen - 1995
COIN
SYSTEMS
Components:
Bicycles
Docking Stations
Characteristics:
• Distinct Bicycles
• Locked Bikes
• Coin Access
• Specific Stations
3rd Gen. - 1998
SMART CARD
SYSTEMS
Components:
Bicycles
Docking Stations
Characteristics:
• Distinct Bicycles
• Locked Bikes
• Smart Card
Access
• Specific Stations
• Access Kiosk
4th Gen. - 2005
SMART CARD
SYSTEMS
Components:
Bicycles
Docking Stations
Electric Bicycles
Characteristics:
• Distinct Bicycles
• Locked Bikes
• Smart Card
Access
• Free (30mins)
• Specific Stations
• Access Kiosk
• Real Time
Availability
• GPS Tracking
Amsterdam Copenhagen Rennes Lyon

Bicycle Sharing – WorldOperating & Financing Structures
Advantages Disadvantages Example
PPP – Design,
Build, Operate,
Maintain, Finance
• All logistics handled by private sector
partner
• Partial control of government during
some phases of the project
• Relieved of operating detail and
performance risk
• Loss of revenues from
advertising
• Risk of public backlash due to
increased levels of outdoor
advertising
• Difficult to enforce performance
standards
Paris
PPP - Design,
Build, Operate,
Maintain
• Partial control by government during
some phases of the project
• Retain control of public spaces
• Relieved of operating detail
• Competition for public funds
• Difficult to assure performance
standards
Barcelona
Design, Build • Complete control through all phases of
the project
• Retain control of public spaces
• Complete control over network
configurations, performance, pricing and
marketing details
• Competition for public funds
• Assume all operating risk
Munich,
Berlin,
Frankfurt

Case Studies – World

TRENDS IN PUBLIC BICYCLE SHARING
SYSTEMS GROWTH
Photo : EMBARQ / Flickr

GLOBAL GROWTH OF BICYCLE SHARING
(2007-2013)
UNDECA, 2011
175
2 4 10
43
386
7 1734
108
469
0
50
100
150
200
250
300
350
400
450
500
Middle East Latin America North America Asia and Pacific Europe
Bik
e S
ha
rin
g S
ys
tem
s
2007
2010
2013
635175
WORLDWIDE445
Exponential growth in number of Bicycle Sharing Systems across the world

EMBARQ & Peter Midgely
PBS SYSTEMS ACROSS THE WORLD(2013)
• Europe has maximum number of systems
• China has the biggest systems in the world

POPULAR PBS SYSTEMS AROUND THE WORLD
New York: Citibike PBS London: Barclays PBS
Hangzhou: Hangzhou PBS Paris: Velib PBS

Photo : www.gloholiday.com
• Launched in :2013
• Cycles :6000 bikes
• Stations :332 stations
• Operated By :NYC Bike Share,
• Business Model :Public – Private Partnership (PPP)
• Sponsor :Citi Bank
New York: Citibike PBS

Photo : http://road.cc/content/news/
London: Barclays PBS (2010 – 2015)
• Launched in :2010
• Cycles :10,000 cycles
• Stations :720 stations
• Operated By : Serco
• System owner :Transport for London (TfL)
• Business Model :Public – Private Partnership (PPP)
• Sponsor : Barclays Bank
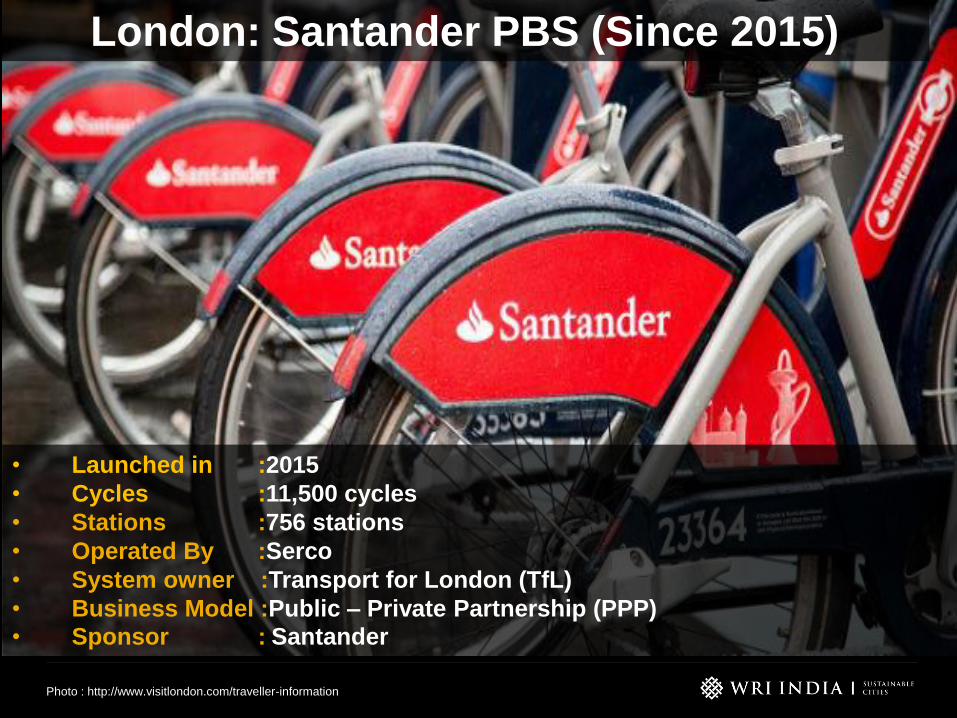
Photo : http://www.visitlondon.com/traveller-information
London: Santander PBS (Since 2015)
• Launched in :2015
• Cycles :11,500 cycles
• Stations :756 stations
• Operated By :Serco
• System owner :Transport for London (TfL)
• Business Model :Public – Private Partnership (PPP)
• Sponsor : Santander

Photo : thecityfix.com/
Hangzhou: Hangzhou PBS
• Launched in :2008
• Cycles :65,000 cycles
• Stations :2700 stations
• Operated By : Public Transport Corporation
• Business Model :Public Sector
• Sponsor : Public Transport Corporation

Photo : https://commons.wikimedia.org/
Paris: Velib PBS
• Launched in :2007
• Cycles :More than 20,000 cycles
• Stations :1800 stations
• Operated By : JC Decaux
• Business Model : Public – Private Partnership (PPP)
• Sponsor : JC Decaux

INDIAN SCENARIO
Photo : David Brossard / Flickr

CONDITION OF EXISTING INDIAN SYSTEMS
Photo : www.wricities.org & https://en.wikipedia.org/wiki/Indore
Poor Quality
Infrastructure
Manually
Operated
Stations
Small PilotsOff the rack
cycles

INDIAN CASE STUDIES
Source : http://www.cyclesharing.in/case-studies/
Photo : Baba / Flickr
• No successful city wide systems
• Very low average ridership; not even 1 ride/cycle/day
New Delhi – Planet Green Bikes
No: of
Stations
No: of
Cycles
Coverage Avg rides/
cycle/ day
8 80 Only along the
BRT corridor
-
Mumbai – Cycle Chalao
No: of
Stations
No: of
Cycles
Coverage Avg rides/
cycle/ day
2 30 Connectivity only
between two points
0.14
Bangalore - ATCAG
No: of
Stations
No: of
Cycles
Coverage Avg rides/
cycle/ day
9 45 Sparse, spread
across the city
0.15

PLANNING PRINCIPLES: A SUCCESSFUL PBS
Photo : EMBARQ / Flickr

1. SIZE OF THE SYSTEM
Photo : commons.wikimedia.org & EMBARQ / Flickr
• No. of bicycles are determined
by the population of the city
• For cities with floating
population, additional bikes
should be considered
1.5 –2 docks/ bike10-30 bikes for every 1,000
residents
• To accommodate for peak hour
demands, extra docks/bike to
be considered.

2. SYSTEM COVERAGE
Photo : Bike Share Toronto , http://www.bikesharetoronto.com/
• The system should be able to provide connectivity between a reasonable
number of locations
• The coverage area should ideally cover mixed and varied land uses
• Reasonable / Average System Coverage Area - 10 square km
Adequate no. of both trip origins and destinations should fall in
the coverage area

3. STATION PLACEMENT
Photo : commons.wikimedia.org
Important factors to consider
• High Visibility
• Availability of space
• Minimum inference with
pedestrian traffic
Ideal Station placement locations
• Commercial areas
• Business Districts
• Popular cultural or tourist points
• Transit stops
• Residential Localities

4. STATION DENSITY
Photo commons.wikimedia.org
• 10–16 stations per square km
• Average of one station/250 meters
• Since cycles are predominantly used for short trips- the access and egress trip to
PBS stations should be small to encourage use of the system.
• Densely placed stations in the area chosen
• At walkable distance from any point of the city

5. SUPPORT INFRASTRUCTURE
Photo : EMBARQ/ Flickr
Providing bicycle
infrastructure, particularly
lanes and paths, can increase
bicycle use
Safe bike infrastructure
encourages and increases
bicycle use
Bike boulevards & well-
connected neighbourhood
street network may be
particularly effective at
encouraging new cyclists

CASE STUDY –WASHINGTON’S CAPITAL BIKE
SHARE
Photo : commons.wikimedia.org
• First Launched in 2008 as
Smart Bike
• 10 stations and 100 bikes
• Failed initially being too small
to work well as a transit
system

CASE STUDY –WASHINGTON’S CAPITAL BIKE
SHARE
Source: http://www.govtech.com/
• Re-launched in 2010 as
Capital Bike Share
• 400 bikes and 49 stations
• Today has more than 350
stations
• Spanning D.C., Maryland, and
Virginia,
• Second-largest bike share in
the United States by number
of stations
PBS SYSTEM COSTS
Photo : https://commons.wikimedia.org

PBS SYSTEMS COST
Source: http://www.govtech.com/
• Capital Cost: INR 1,00,000 – 1,50,000/ cycle
• Operating Cost: INR 16,000 – 25,000/cycle/year
Cost for a system of 350 cycles and 25 stations
• Capital Costs: 2.8 crores
• Operating Costs: 63 lakhs/ year

RECOMMENDED BUSINESS MODEL-
GOVERNMENT OWNED, PRIVATE OPERATED SYSTEM
Source: http://www.govtech.com/
• Municipal Authority pays the capital cost and owns the system
• Private agency is reimbursed the capital cost involved in installation
and also paid a monthly/ quarterly fee for operations.
• The revenue risk is on the government. Operational efficiency risk is
on the operator.
Pros: Government has control over location of stations and operations
are handled by another agency with expertise. Profits to government.
Cons: Financial risk on the government.

RECOMMENDED BUSINESS MODEL
Source: http://www.govtech.com/
1. Separate operations from advertisements contracts- To ensure efficiency
in operations. Avoiding the Delhi case study
2. Well defined service level benchmarks on operational efficiency- The
monthly payments to the operator should be based on compliance with
service level benchmarks
3. Same contract for both installation and operation of system- Having two
different contracts and vendors may lead to inefficiency in operations
